
Long Island’s Premier Community Bank
www.astoriafederal.com
Lehman Brothers
Financial Services Conference
Hilton New York
New York City
September 11, 2007

This presentation may contain forward-looking statements that are based on various
assumptions and analyses made by us in light of our management’s experience and its
perception of historical trends, current conditions and expected future developments, as well as
other factors we believe are appropriate under the circumstances. These statements are not
guarantees of future performance and are subject to risks, uncertainties and other factors (many
of which are beyond our control) that could cause actual results to differ materially from future
results expressed or implied by such forward-looking statements. These factors include, without
limitation, the following: the timing and occurrence or non-occurrence of events may be subject to
circumstances beyond our control; there may be increases in competitive pressure among
financial institutions or from non-financial institutions; changes in the interest rate environment
may reduce interest margins or affect the value of our investments; changes in deposit flows,
loan demand or real estate values may adversely affect our business; changes in accounting
principles, policies or guidelines may cause our financial condition to be perceived differently;
general economic conditions, either nationally or locally in some or all areas in which we do
business, or conditions in the real estate or securities markets or the banking industry may be
less favorable than we currently anticipate; legislative or regulatory changes may adversely affect
our business; applicable technological changes may be more difficult or expensive than we
anticipate; success or consummation of new business initiatives may be more difficult or
expensive than we anticipate; or litigation or matters before regulatory agencies, whether
currently existing or commencing in the future, may be determined adverse to us or may delay
occurrence or non-occurrence of events longer than we anticipate. We assume no obligation to
update any forward-looking statements to reflect events or circumstances after the d
ate of this document.
2

Corporate Profile
$21.6 billion in assets
• $15.6 billion in loans
$13.4 billion in deposits
8.3% deposit market share in Long Island market
– Largest thrift depository
Insider & ESOP stock ownership: 21%
Corporate Governance: AF outperformed 97% of all banks in the S&P
Banks industry group *
Solid and seasoned management team
13+ years as a public company – enhancing shareholder value
All figures in this presentation are as of June 30, 2007 and all stock market data is as of July 25, 2007, except as noted.
* Source: Institutional Shareholder Services (ISS) as of July 1, 2007
NYSE: AF
3
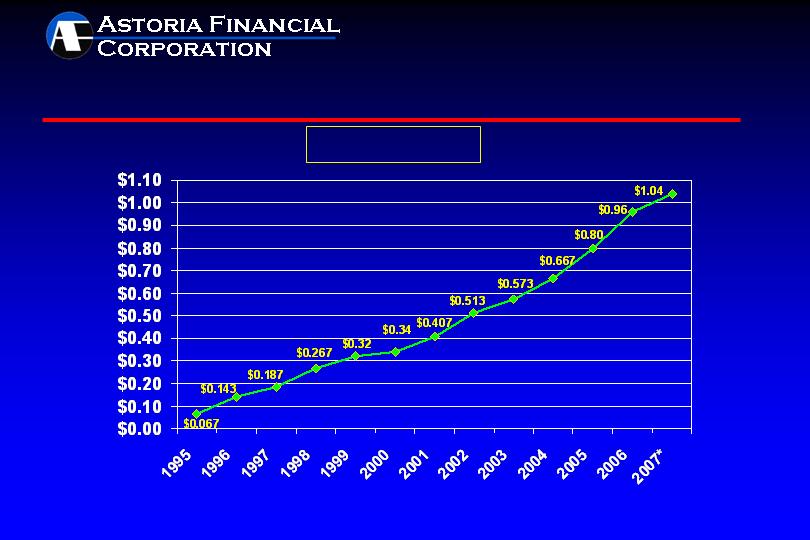
Dividend Growth
CAGR = 26%
* 3Q07 annualized; yielding 4.34%, as of July 25, 2007
4
5
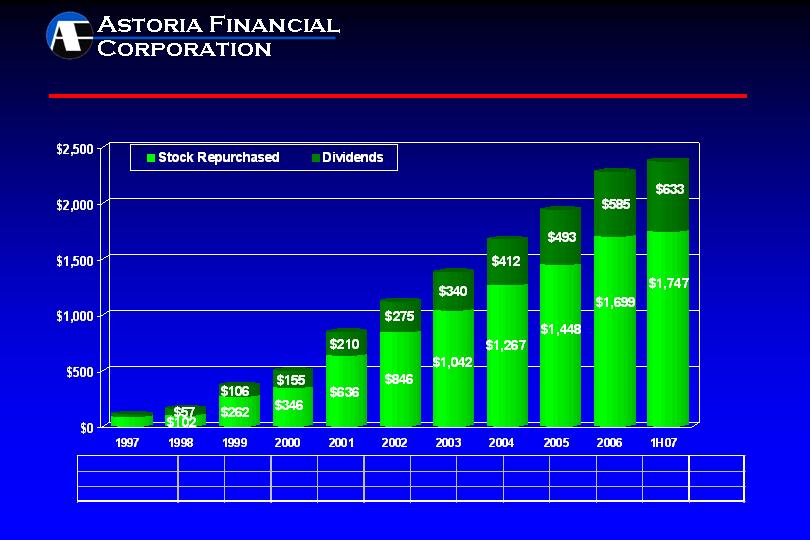
* Amount does not cross foot due to rounding
$2,380
$2,284
$1,941
$1,679
$1,382
$2.4 billion returned to shareholders in the past 10+ years
$501
$1,121
$846
$368
$159
$110
(In Millions)
Cumulative Cash Returned to Shareholders
Shares
Total
Repurchased:
6.7M
1.0M
12.8M
7.8M
15.5M
10.9M
10.6M
9.1M
6.6M
8.4M
1.8M
91.1M*
Average Price:
$12.85
$16.31
$12.48
$10.81
$18.70
$19.32
$18.42
$24.82
$27.49
$29.92
$27.62
$19.19

First Half 2007 Financial Highlights
Loan portfolio increased $611 million, or 8% annualized
- - One-to-four family loan portfolio increased $695 million,
or 14% annualized
Deposits increased $224 million, or 3% annualized
Securities portfolio decreased $552 million, or 21%
annualized
Borrowings decreased $138 million, or 4% annualized
Repurchased 1.8 million shares
6
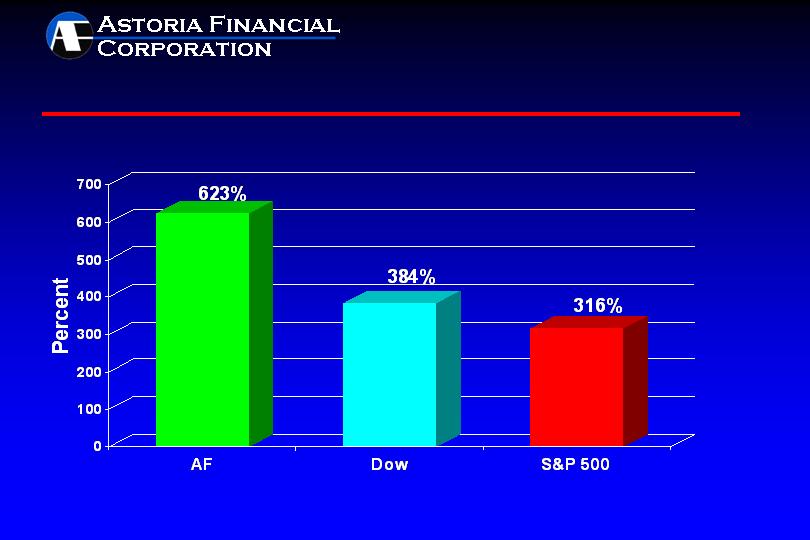
AF CAGR = 16%
Comparative returns from November 30, 1993 – June 30, 2007 (IPO 11/18/93)
Stock Performance - Comparative Total Return
7
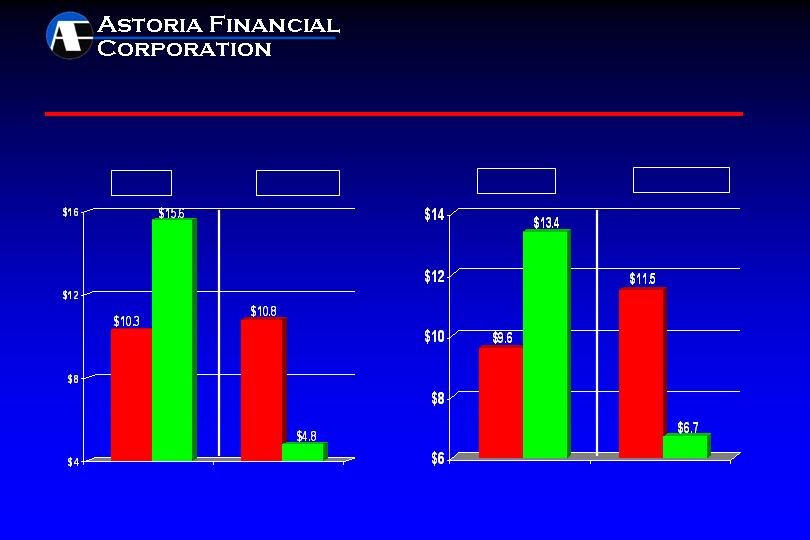
Focus on Core Business
(In Billions)
12/31/99 06/30/07
Loans
Securities
12/31/99 06/30/07
Deposits
Borrowings
vs.
Assets
Liabilities
12/31/99 06/30/07
12/31/99 06/30/07
vs.
8
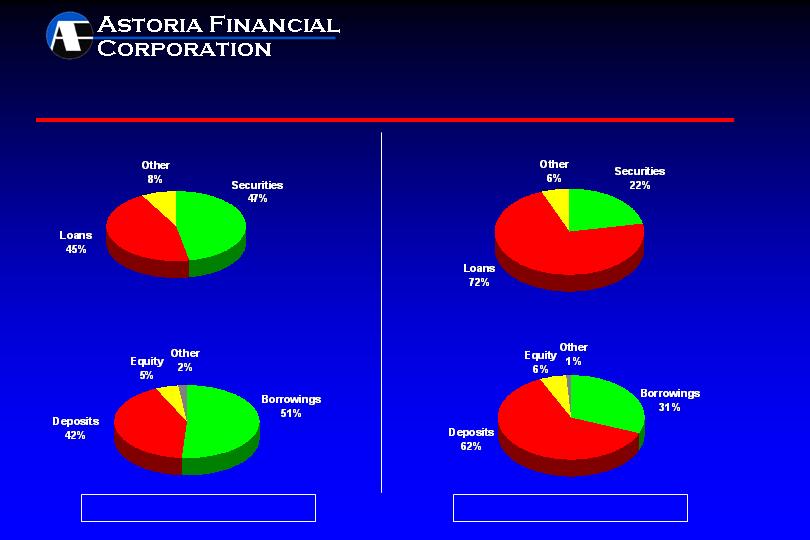
Improving Balance Sheet Quality
Total Assets: 21,649,871
Total Assets: $22,696,536
At December 31, 1999
At June 30, 2007
Assets
Assets
Liabilities & Shareholders’ Equity
Liabilities & Shareholders’ Equity
9
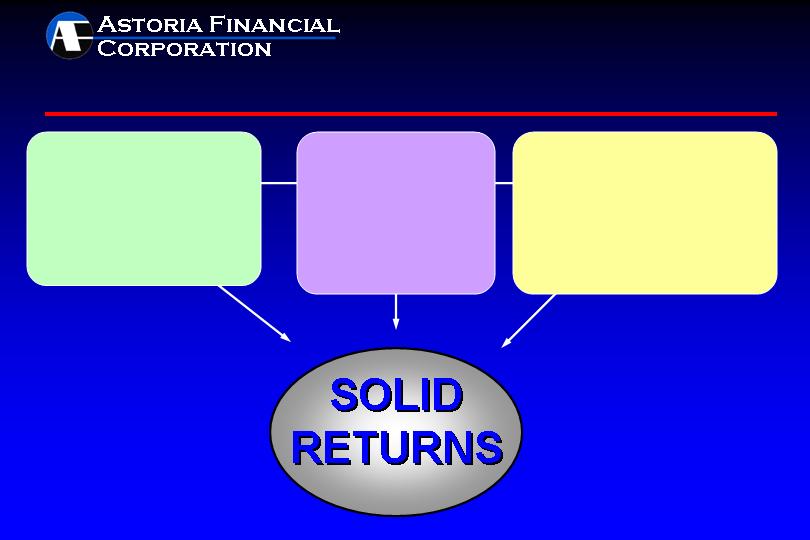
MORTGAGE LENDING
• Portfolio lender, not a mtge.
Banker
• 1-4 Family, Multi-Family and
Commercial R.E. expertise
• Superior asset quality
RETAIL BANKING
• Premier community bank on
Long Island
• Dominant deposit market share
• #1 thrift depository in core market
A Simple Formula for Enhancing Shareholder Value
EFFICIENCY
10

Primarily short-term, 5/1 hybrid ARMs for portfolio
Minimizes interest rate risk
Multiple delivery channels provide flexibility & efficiency
Retail*
Commissioned brokers covering 26 states*
Third party originators – correspondents covering 43 states*
Secondary marketing capability
Sale of 15 year and 30 year fixed rate loans reduces interest rate risk
Geographically diversified portfolio
Reduces lending concentrations
1-4 Family Mortgage Lending
* All loans underwritten to Astoria’s stringent standards. Broker and correspondent networks also include D.C.
11
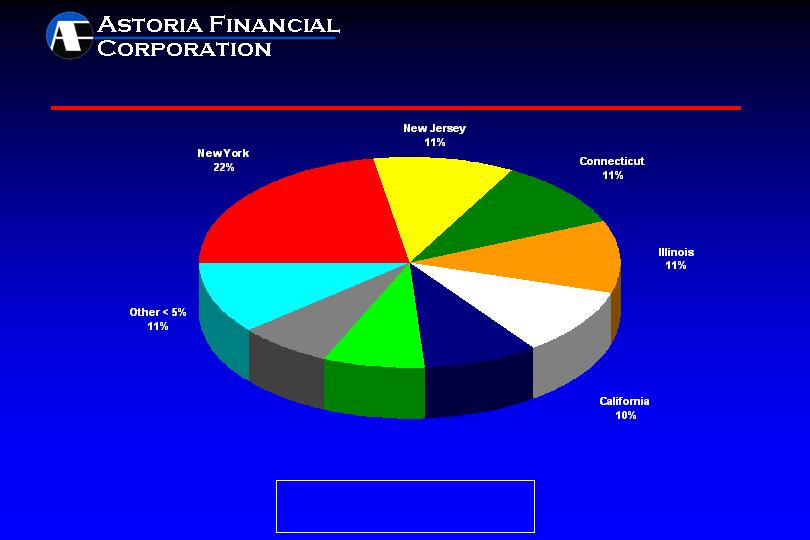
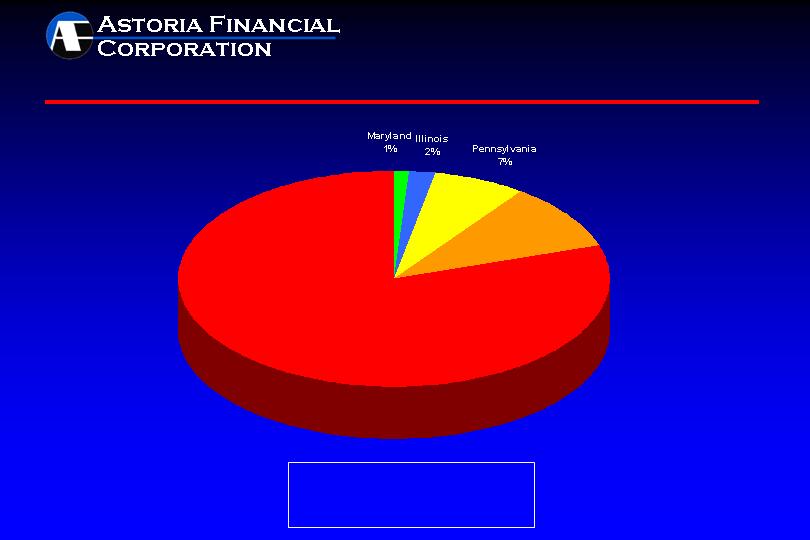
Geographic Composition of 1-4 Family Loan Portfolio
At June 30, 2007
Total 1-4 Family Loan Portfolio
$10.9 Billion
Virginia
9%
Massachusetts
7%
Maryland
8%
12
13
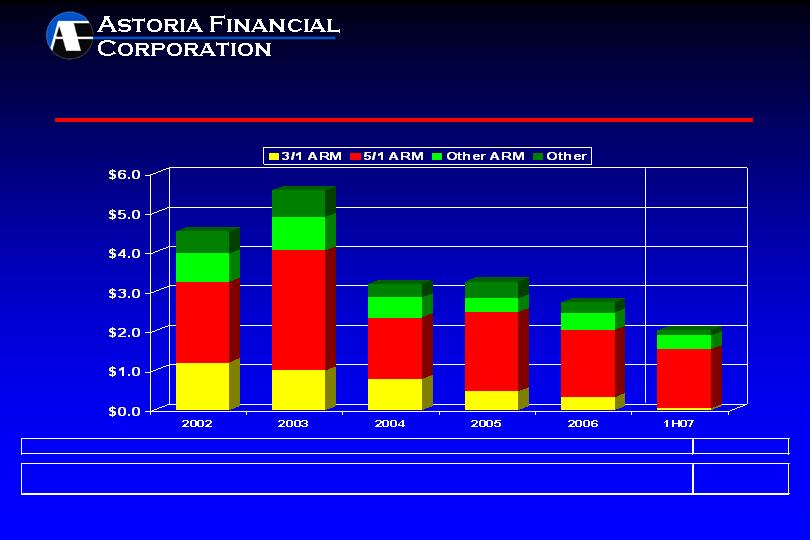
$2.0B
$2.7B
$3.3B
$3.2B
$5.6B
(In Billions)
$4.5B
By Product Type
1-4 Family Mortgage Loan Originations
Net portfolio growth:
($895.7) M
($238.3) M
+$83.7 M
+$703.2 M
+$456.2 M
+$695.4 M
Weighted Avg. Portfolio Coupon
at Period End
6.33%
5.26%
5.05%
5.19%
5.48%
5.58%

Mortgage Banking Dislocation:
Positive Implications for Jumbo Mtge. Portfolio Lenders
Fewer participants
Lending standards further tightened
Spreads widening
Volumes increasing
14

Committed to the American Dream
Astoria Federal is ready to help make your American Dream come true.
For more than 118 years, we’ve been helping our friends and neighbors
buy or refinance their homes. You can depend of Astoria Federal.
We’re part of your community, and we’re here to help when you need us.
To speak to one of our mortgage specialists, call 1-800-537-4888.
Equal Housing Lender Astoria Federal Savings
Member FDIC Putting people first
www.astoriafederal.com
15

Multifamily/Commercial Real Estate Lending
Solid Multifamily/CRE portfolio
$4.1 billion in portfolio
Weighted Average Coupon at June 30, 2007: 5.85%
Conservative underwriting
– Weighted average LTV of portfolio < 65%
Average loan in portfolio < $1 million
Approximately 85% of multifamily portfolio is subject
to rent control or rent stabilization
Note: LTV is based on current principal balances and original appraised values.
16

Asset Quality Focus
• Limited credit risk
Conservative underwriting, top quality loans, low LTVs
No sub-prime or payment option ARM lending
• Strong reserves
Non-performing assets: 0.30% of total assets
Allowance for loan losses/non-performing loans: 124%
• Top quality MBS portfolio
Primarily GSE, agency or ‘AAA’ rated
17

• One year gap: -21.5%
• Key balance sheet components
Short-term hybrid adjustable-rate mortgage loan portfolio
Short weighted average life MBS portfolio
Offset by:
Large, low-cost checking, savings and money market
deposit base – provides natural hedge against rising rates
Longer-term CDs
Over the past twelve months, $1.5 billion of non-callable CDs with
original maturities of 18 months or greater were issued or repriced with a
weighted average rate of 5.09% and a weighted average original maturity of
24 months
Borrowings – as needed
Interest Rate Risk Management
18

Leading Retail Banking Franchise
$13.4 billion in deposits, 86 banking office network
Serving the Long Island market since 1888
• Low cost/stable source of funds – average cost: 3.42%*
• $12.5 billion, or 93%, of total deposits emanate from within 5 miles of a
branch
• Banking offices with high average deposits contribute to
efficiency
Long Island Offices (83) – Nassau (29), Queens (17), Suffolk (25),
Brooklyn (12) – Average Deposits of $155 Million
Westchester Offices (3) – Average Deposits of $181 Million
• Alternative delivery channels
ATM’s, telephone and Internet banking
* Average cost for the quarter ended June 30, 2007.
19
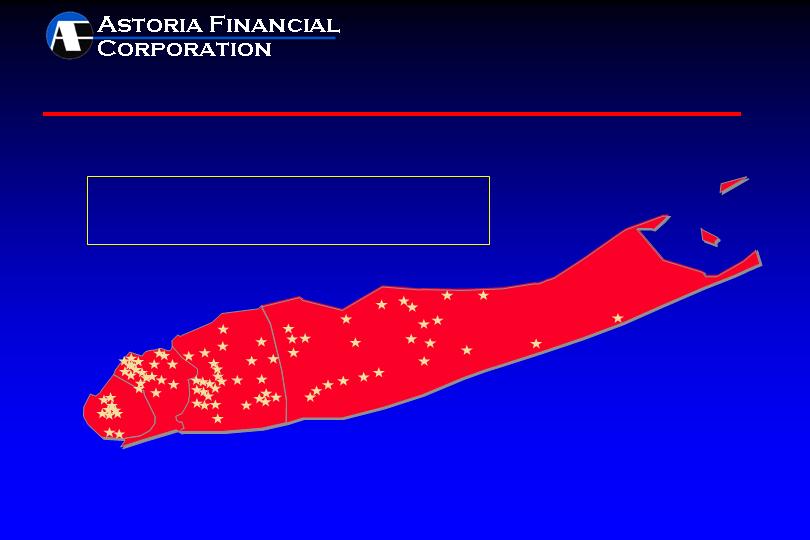
Long Island Powerhouse
Nassau
Queens
Brooklyn
Suffolk
Banking Offices and Deposit Share Ranking on Long Island
Overall Deposit Share Ranking:
#1- all thrifts, #4- all financial institutions
20

21
U.S. Median HHI: $51,546 / NY State Median HHI: $54,403
Deposits
Source: FDIC Summary of Deposits, SNL Financial. Data as of June 30, 2006.
* Astoria’s deposits highlighted above are comprised of retail community deposits. Astoria does not solicit broker or municipal deposits.
Well Positioned in Each of Our Key Markets
($ in millions)
($ in millions)
Institution
Total
Share
Branches
Institution
Total
Share
Branches
1
Chase
$8,217
17%
82
1
Chase
$7,200
19%
65
2
Capital One/North Fork
6,479
13
59
2
Capital One/North Fork
4,723
13
51
3
Citigroup
6,045
12
54
3
Citigroup
4,609
12
29
4
NY Community
5,506
11
38
4
Astoria
3,158
8
17
5
Astoria
4,942
10
29
5
NY Community
2,882
8
39
Total
$49,243
468
Total
$37,527
396
($ in millions)
($ in millions)
Institution
Total
Share
Branches
Institution
Total
Share
Branches
1
Capital One/North Fork
$8,796
26%
63
1
Chase
$6,736
21%
44
2
Chase
6,474
19
80
2
Citigroup
3,793
12
25
3
Astoria
3,070
9
25
3
Sovereign
3,659
11
21
4
WaMu
2,643
8
36
4
WaMu
3,531
11
29
5
Citigroup
2,446
7
28
5
HSBC
3,512
11
27
Total
$33,690
418
Astoria (#7)
1,616
5
12
Total
$32,800
292
Median household income: $40,311
Median household income: $90,227
Median household income: $53,531
Median household income: $81,248
Queens
Nassau
Suffolk
Brooklyn

Strong Position in Core Market
Brooklyn, Queens, Nassau and Suffolk
* Astoria’s deposits highlighted above are comprised of retail community deposits. Astoria does not solicit broker or municipal deposits.
Source: FDIC Summary of Deposits. Data as of June 30, 2006.
The combined population of these four counties (7.6 million) exceeds the population of 38 individual U.S. states
$ 97
$104
103
45
136
106
88
86
154
124
113
$106
Deposits
Average
1,574
1,230
48
112
38
93
121
127
83
136
201
271
Branches
11.0
527
16,894
Citibank
3.
8.3
453
12,786
ASTORIA*
4.
3.4
476
5,178
Sovereign
8.
3.3
(436)
5,037
Bank of America
9.
83.4%
$3,449
$127,744
Total – Top 10
3.2
1,923
4,957
Commerce
10.
7.0
326
10,665
NY Community
6.
6.4
476
9,865
HSBC
7.
7.2
257
10,970
Washington Mutual
5.
14.9
(1,723)
22,766
Capital One/North Fork
2.
100.0%
$5,214
$153,259
Total – Core Market
18.7%
$1,170
$ 28,626
Chase
1.
Share
Growth
Deposits
Institution
Market
June 06/05
($ in millions)
22

Market Share Trend – 1999 - 2006
Brooklyn, Queens, Nassau and Suffolk
* Astoria’s deposits highlighted above are comprised of retail community deposits. Astoria does not solicit broker or municipal deposits.
Source: FDIC Summary of Deposits. Data as of June 30, 2006.
+190
+ 83
(12)
(7)
+ 49
+ 9
+ 21
(21)
(1)
+ 48
+ 6
( 9)
June 99-06
Change in #
Of Branches
37.6%
32.8%
(3.1)%
3.3
100.0%
$41,916
$153,259
Total – Core Market
10.
9.
8.
7.
6.
5.
4.
3.
2.
1.
83.4%
$31,526
$127,744
Total – Top 10
(3.8)
(36.5)
(2,901)
5,037
Bank of America
(1.3)
6.4
15.6
1,334
9,865
HSBC
(1.1)
7.2
19.4
1,780
10,970
Washington Mutual
0.5
3.4
63.1
2,003
5,178
Sovereign
(0.2)
7.0
32.6
2,623
10,665
NY Community
(1.4)
11.0
22.1
3,053
16,894
Citibank
0.0
8.3
39.1
3,592
12,786
ASTORIA*
4,957
5,389
$ 9,696
June 99-06
$ Growth %
4,957
22,766
$ 28,626
June 2006
Deposits
3.2
3.2
Commerce
(0.7)
14.9
31.0
Capital One/North Fork
1.7%
18.7%
51.2%
Chase
June 99-06
Market Share
Gain/Loss
June 06
Market
Share
Institution
23

Retail Banking
Acquisition with organic growth vs. de-novo branching
Differentiation from competition
– Maintain pricing discipline
– Pro-active sales culture
– Focus on customer service
– Strong support of local community-based organizations
and activities
24

Sales – PEAK Process
Performance based on Enthusiasm, A ctions and Knowledge
“Sales Oriented and Service Obsessed”
A “needs” based approach to sales rather than “product”
based approach
Highly interactive program – daily and weekly meetings
create a focus that is shared throughout the branch network
Incentives for strong performance, both individual and team
25

Key Findings : Favorably Positioned Against Competitors
71% of Astoria customers are highly satisfied
71% of Astoria customers are highly likely to recommend
Astoria to friend/family member
• Astoria customers are 22% more likely to net increase their
deposit relationship than are competitor customers
Satisfaction with the branch is by far the strongest driver of
overall satisfaction – 86% of Astoria customers are highly
satisfied with quality of branch service
Customer Satisfaction
26

Community Involvement
Key Initiatives
• Education First
Supports lifelong learning, promotes savings and provides meaningful
financial solutions to improve the way our customers live
• Neighborhood Outreach
Supports local organizations that enrich the communities within our market
area
Nearly 1000 community-based organizations supported annually
• Results/Recognition
Six consecutive “Outstanding” Community Reinvestment Act ratings by OTS
Astoria Federal: An integral part of the fabric of the communities we serve
27
Total - $13.4 Billion
At June 30, 2007
*Retail CDs: $7.8B
Rate: 4.76%
Money Market: $0.4B
Rate: 1.00%
Savings: $2.0B
Rate: 0.40%
*Liquid CDs: $1.7B
Rate: 4.83%
Now/Demand: $1.5B
Rate: 0.06%
Core Community Deposits
* Note: 58% of the households that have a retail CD or Liquid CD account also have a low
cost checking, savings or money market account relationship.
28
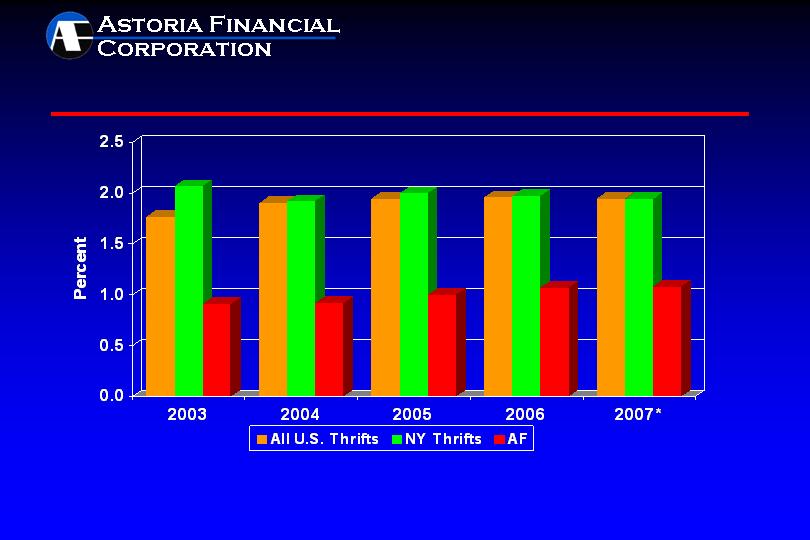
G&A Expense Ratio(1)
* Most recent data available for All US Thrifts and NY Thrifts is for the quarter ended March 31, 2007. AF is annualized for the six
months ended June 30, 2007.
Source: SNL Financial – Median Ratios
(1) G&A expense ratio represents general and administrative expense divided by average assets.
29

U.S. Court of Appeals for the Federal Circuit reversed AF
award of $436 million on February 1, 2007 in the LISB case
– AF filed a petition for rehearing or rehearing en banc on
April 2, 2007 with the U.S. Court of Appeals for the Federal
Circuit
Remaining goodwill litigation claim
– $160 million of original supervisory goodwill created by
Fidelity NY
– Trial commenced on April 19, 2007 before the U.S. Court of
Federal Claims
– Evidentiary phase has been concluded. Post trial motions and closing
arguments are expected to be concluded in the fourth quarter of 2007
Goodwill Claims - Update
30

Strategies
Remain focused
Grow loans and deposits
Capitalize on mortgage banking dislocation
Lending standards further tightened
Maintain pricing discipline
Reduce securities
Maintain superior operating efficiency
Continue buying back AF stock, maintaining tangible capital levels
between 4.50% and 4.75%
Objective: Produce solid returns
Outlook for remainder of 2007
31

Investment Merits
Strong balance sheet – superior asset quality
Attractive banking franchise
Dominant deposit market share in core market
Superior operating efficiency
Well capitalized
Proactive Capital Management
Stock repurchase program in place
26% compounded annual growth in dividend*
$2.4 billion returned to shareholders in the past 10+ years
* CAGR from 1995, commencement of quarterly dividend, to 3Q07 annualized
32

AF: A Record of Enhancing Shareholder Value
Addendum

Solid and Seasoned Management Team
35
67
Support Services
Arnold K. Greenberg
Executive Vice President
26
54
Legal
Alan P. Eggleston
EVP, Secretary & General Counsel
31
54
Mortgage Lending
Gary T. McCann
Executive Vice President
37
61
Retail Banking
Gerard C. Keegan
Vice Chairman & CAO
18
44
Chief Financial Officer
Frank E. Fusco
Executive Vice President & CFO
33
56
Chief Operating Officer
Monte N. Redman
President & COO
36
68
Chief Executive Officer
George L. Engelke, Jr.
Chairman & CEO
Yrs. In
Banking
Age
Responsibility
34
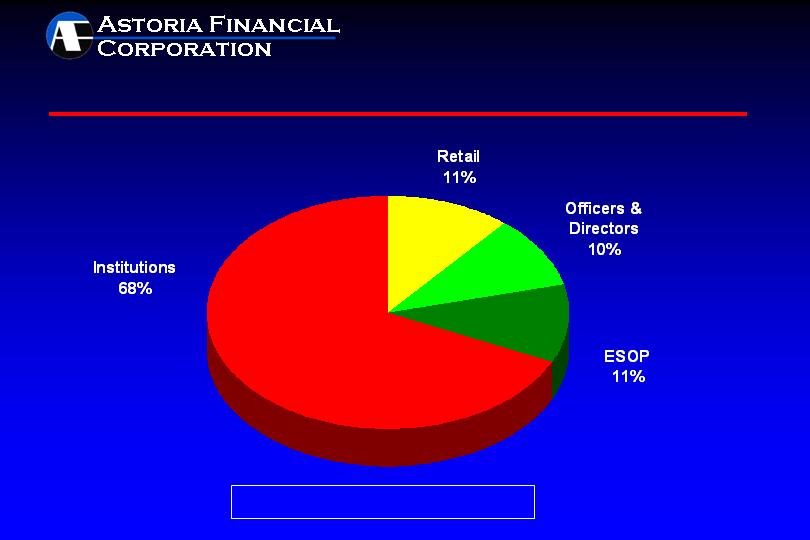
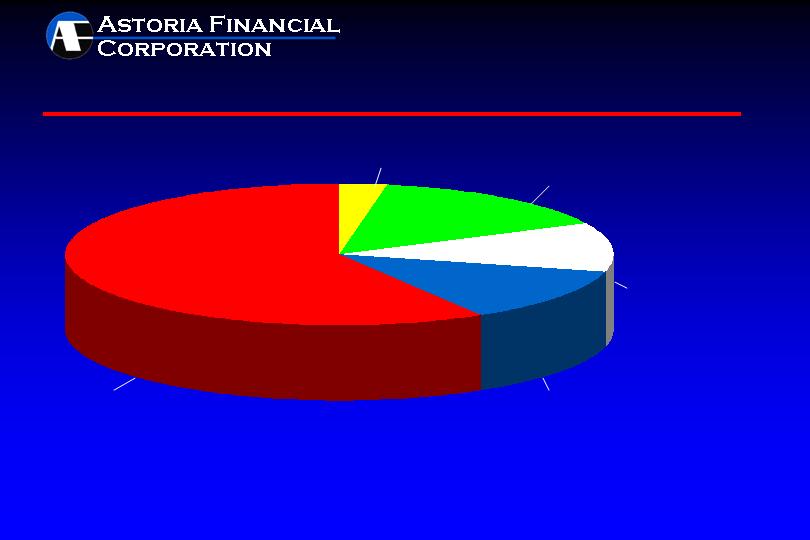
Ownership Profile
June 30, 2007
Shares Outstanding: 96,851,570
35

Acquisition History
(1) Branches sold in 1999
(2) One satellite office closed in 1997
$11,590
86
TOTAL
6,600
35
Long Island Bancorp, Inc.
1998
2,400
14
The Greater NY Savings Bank
1997
1,800
18
Fidelity New York (2)
1995
280
4
Whitestone Savings (RTC)
1990
205
4
Oneonta Federal (1)
1987
25
1
Chenango Federal (1)
1984
100
3
Hastings-on-Hudson Federal
1982
130
5
Citizens Savings (FSLIC)
1979
$ 50
2
Metropolitan Federal
1973
Assets
# Branches
Thrift
Year
(in millions)
36
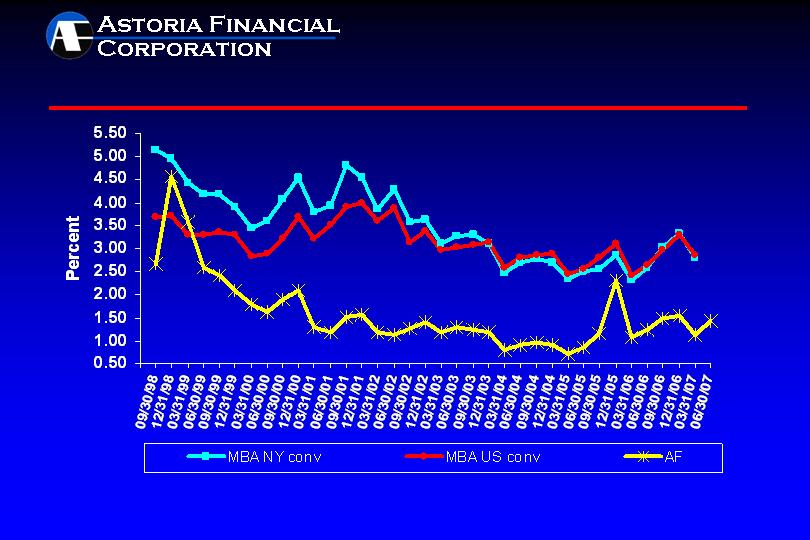
1-4 Family Delinquency Ratios: AF vs. MBA
Source: MBA National Delinquency Survey. Beginning with 3Q02, MBA statistics for conventional loans excludes sub-prime loans.
37
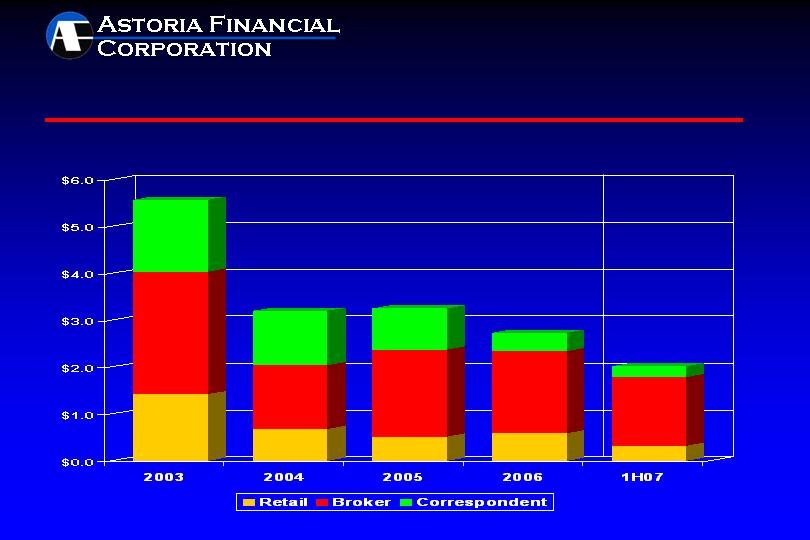
1- 4 Family Mortgage Loan Originations
By Delivery Channel
(In Billions)
$5.6B
$3.2B
$3.3B
$2.7B
$2.0B
38
For the six months ended June 30, 2007
Total Multifamily/CRE
Originations
$254 Million
New York,
New Jersey,
Connecticut
80%
Geographic Composition of Multifamily/CRE Loan Originations
Florida
10%
39

Interest Rate Risk Management
* Non-callable CDs issued or repriced during the period with an original maturity of 18 months or greater
22 months
5.01%
$546.6 Million
2Q07
24 months
5.09%
$1.5 Billion
TOTAL
22 months
5.09%
$492.8 Million
1Q07
20 months
5.08%
$211.6 Million
4Q06
34 months
5.27%
$268.9 Million
3Q06
Weighted Average
Original Term
Weighted Average
Rate
CDs Issued
Or Repriced*
40

Glossary
Office of Thrift Supervision
-
OTS
Mortgage-Backed Securities
-
MBS
Loan-To-Value Ratio
-
LTV
Institutional Shareholder Services
-
ISS
Compounded Annual Growth Rate
-
CAGR
Government Sponsored Enterprise
-
GSE
Employee Stock Ownership Plan
-
ESOP
Commercial Real Estate
-
CRE
Adjustable Rate Mortgage
-
ARM
41

Long Island’s Premier Community Bank
www.astoriafederal.com