
Long Island’s Premier Community Bank
www.astoriafederal.com
Investor Presentation
Third Quarter Ended
September 30, 2008
1

Forward Looking Statement
This presentation may contain a number of forward-looking statements within the meaning of Section 27A of
the Securities Act of 1933, as amended, and Section 21E of the Securities Exchange Act of 1934, as
amended. Forward-looking statements are based on various assumptions and analyses made by us in light
of our management’s experience and perception of historical trends, current conditions and expected future
developments, as well as other factors we believe are appropriate under the circumstances. These
statements are not guarantees of future performance and are subject to risks, uncertainties and other factors
(many of which are beyond our control) that could cause actual results to differ materially from future results
expressed or implied by such forward-looking statements. These factors include, without limitation, the
following: the timing and occurrence or non-occurrence of events may be subject to circumstances beyond
our control; there may be increases in competitive pressure among financial institutions or from non-financial
institutions; changes in the interest rate environment may reduce interest margins or affect the value of our
investments; changes in deposit flows, loan demand or real estate values may adversely affect our business;
changes in accounting principles, policies or guidelines may cause our financial condition to be perceived
differently; general economic conditions, either nationally or locally in some or all areas in which we do
business, or conditions in the real estate or securities markets or the banking industry may be less favorable
than we currently anticipate; legislative or regulatory changes may adversely affect our business; applicable
technological changes may be more difficult or expensive than we anticipate; success or consummation of
new business initiatives may be more difficult or expensive than we anticipate; or litigation or matters before
regulatory agencies, whether currently existing or commencing in the future, may be determined adverse to us
or may delay occurrence or non-occurrence of events longer than we anticipate. We assume no obligation to
update any forward-looking statements to reflect events or circumstances after the date of this document.
2

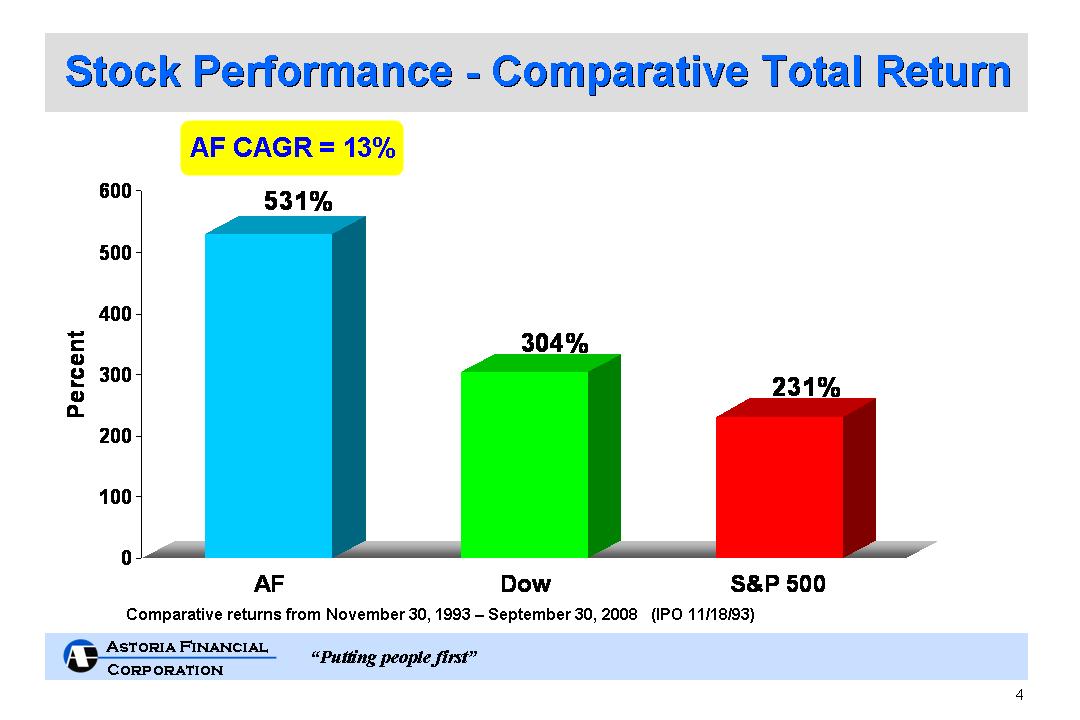
NYSE: AF
Corporate Profile
$22.2 billion in assets
• $16.7 billion in loans
$13.1 billion in deposits
8.2% deposit market share in Long Island market
– Largest thrift depository
Insider & ESOP stock ownership: 22%
Corporate Governance: AF outperformed 95% of all banks in
the S&P Banks industry group *
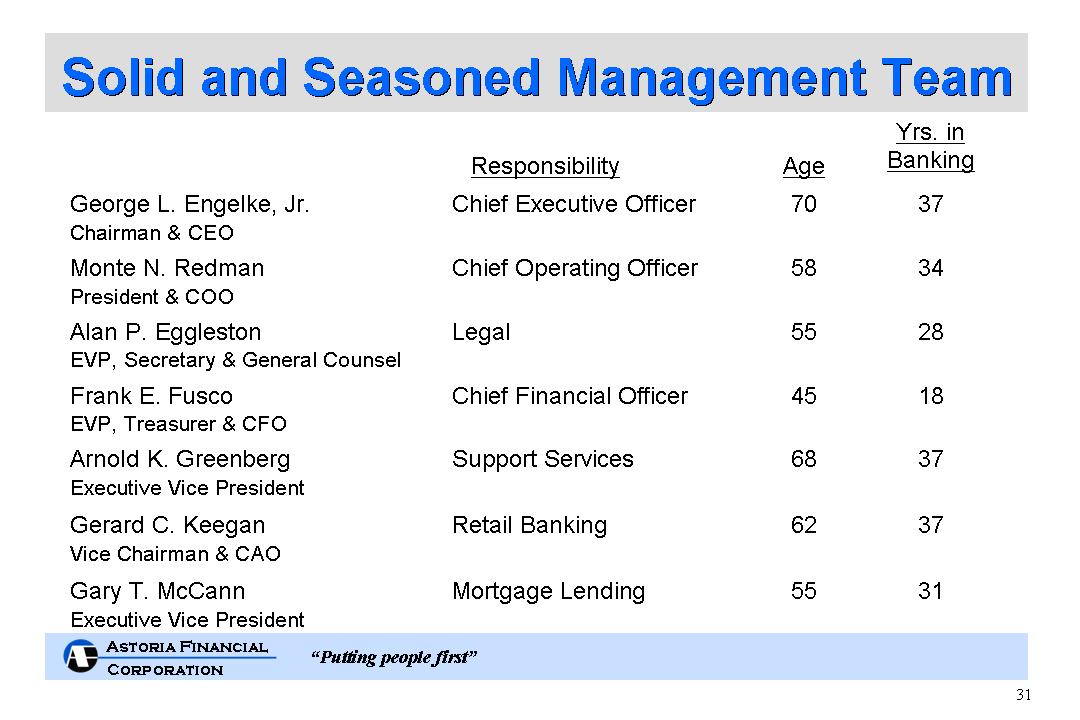
Solid and seasoned management team
15 years as a public company – enhancing shareholder value
All figures in this presentation are as of September 30, 2008, except as noted.
* Source: ISS as of September 1, 2008
3

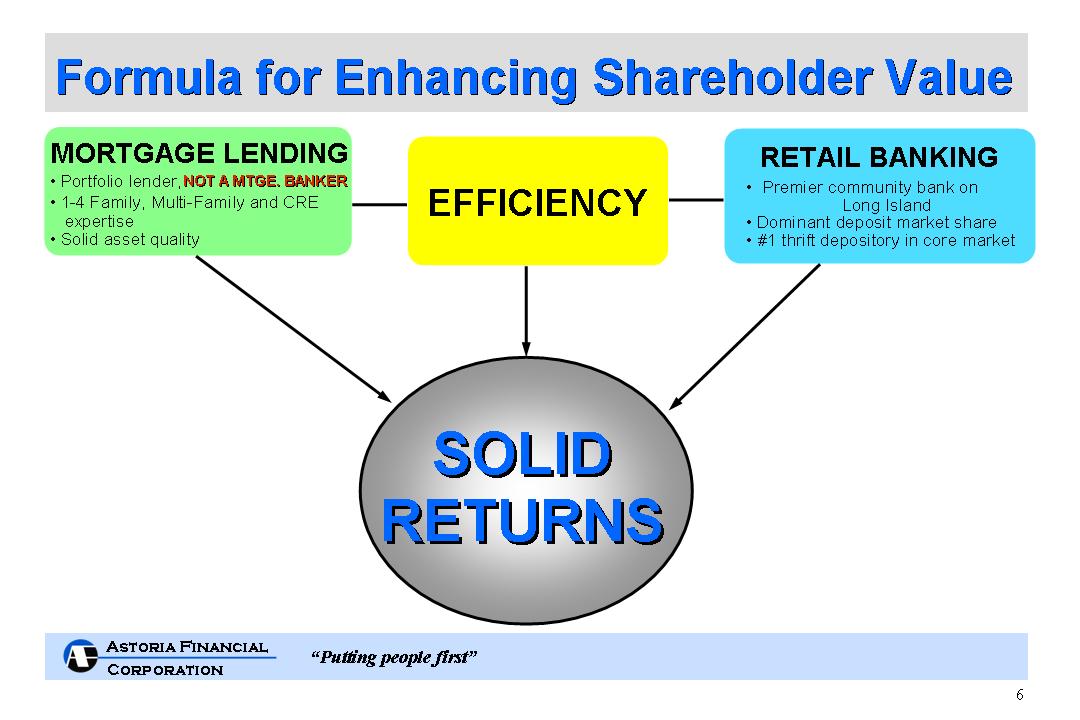
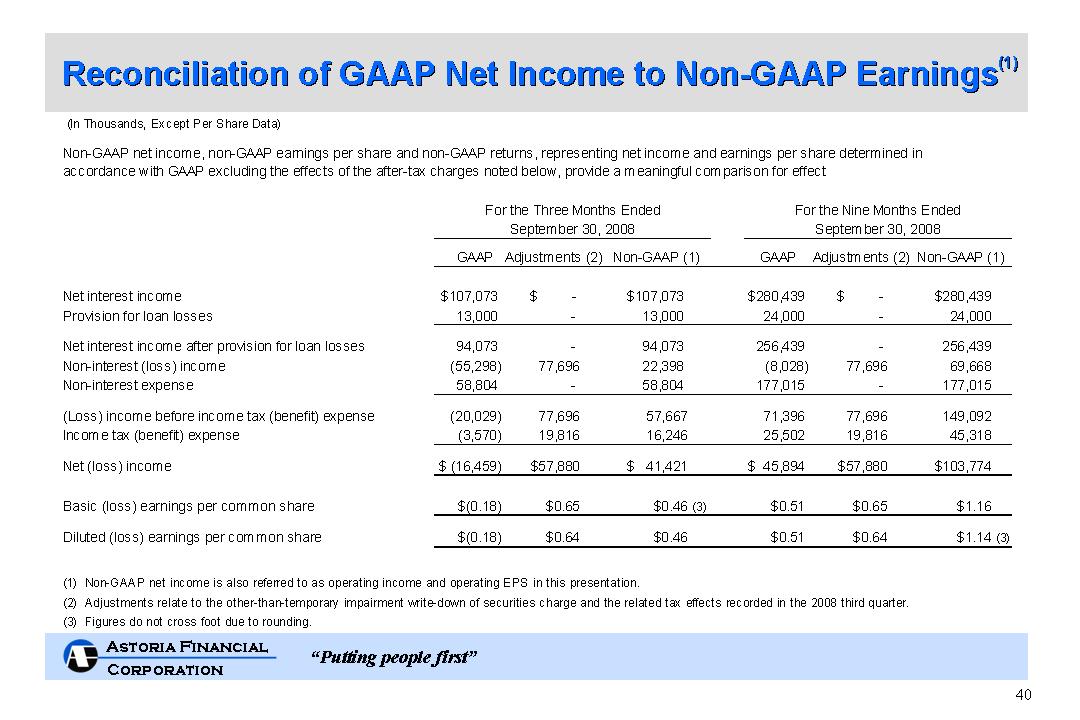
• Operating income of $41.4 million, or $0.46 per share, up 24%
from 2Q08, 17% from 3Q07*
• Margin increased 25 basis points from 2Q08, 48 basis points
from 3Q07, to 2.06%
• Earning assets increased 7%, annualized
• Loan portfolio increased 13%, annualized
• 1-4 Family loan portfolio increased 18%, annualized
3Q08 Highlights
* Operating income and operating EPS, representing net income and EPS determined in accordance with generally accepted accounting principles (“GAAP”)
excluding the effects of the after-tax, non-cash OTTI charge, provide a more meaningful comparison for effectively evaluating Astoria’s operating results. For a
reconciliation of operating income and operating EPS to GAAP net income and EPS, please refer to the table on page 40.
5
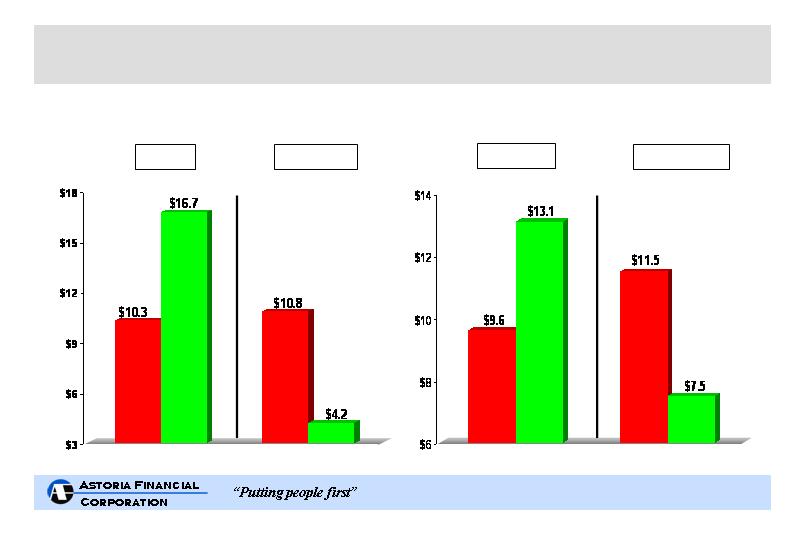
(In Billions)
12/31/99 09/30/08
Loans
Securities
12/31/99 09/30/08
Deposits
Borrowings
vs.
Assets
Liabilities
12/31/99 09/30/08
12/31/99 09/30/08
vs.
Focus on Deposit & Loan Growth
(In Billions)
(In Billions)
7
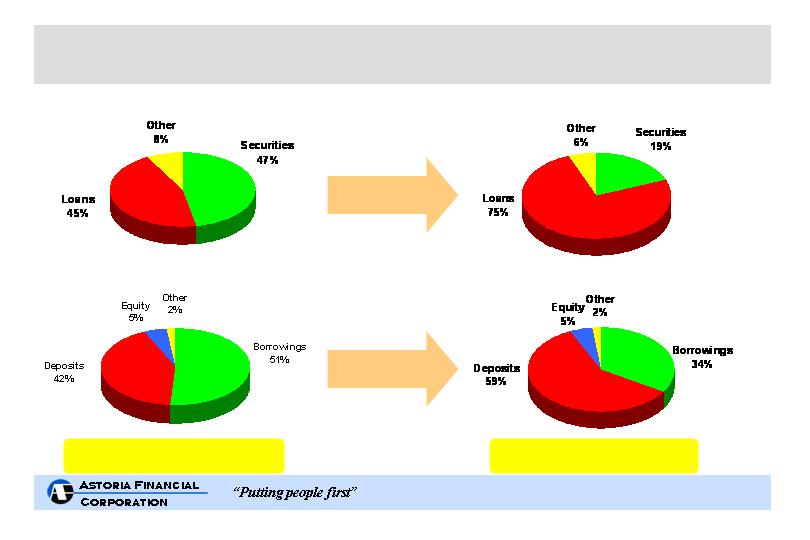
Total Assets: $22,696,536
At December 31, 1999
Assets
Assets
Liabilities & Shareholders’ Equity
Liabilities & Shareholders’ Equity
Total Assets: $22,173,450
At September 30, 2008
Improving Balance Sheet Quality
($ in thousands)
($ in thousands)
8

Primarily short-term, 5/1 jumbo prime hybrid ARMs for portfolio
No sub-prime, negative amortization or payment option ARM lending
Average loan amount for first nine months of 2008 production = $680,000
Average LTV on YTD 09/30/08 production = 58%
Average LTV on total 1-4 family loan portfolio = <64%*
Multiple delivery channels provide flexibility & efficiency
Retail**
Commissioned brokers covering 19 states**
Third party originators – correspondents covering 20 states**
Secondary marketing capability
Sale of 15 year and 30 year fixed rate loans reduces interest rate risk
Geographically diversified portfolio
Reduces lending concentrations
1-4 Family Mortgage Lending
* Based on current principal balances and original appraised values.
** All loans underwritten to Astoria’s stringent standards. Includes Washington, D.C.
9
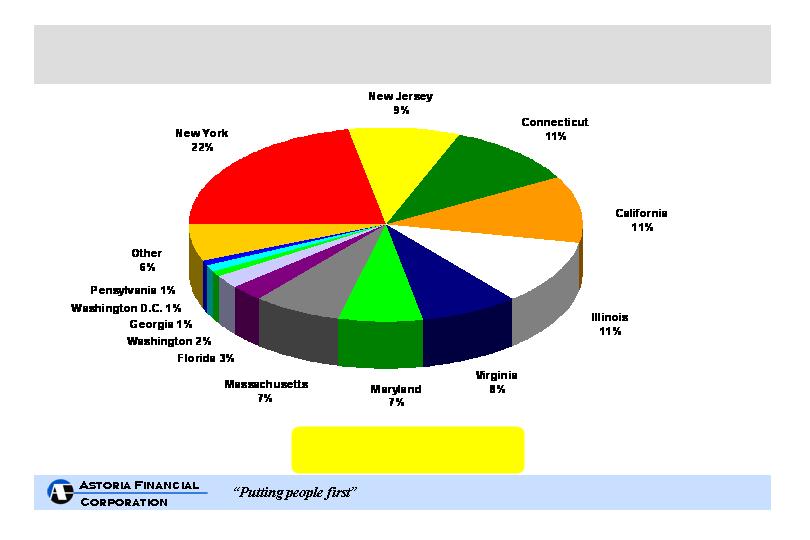
Geographic Composition of 1-4 Family Loan Portfolio
At September 30, 2008
Total 1-4 Family Loan Portfolio
$12.4 Billion
10

By Product Type
(In Billions)
$5.6B
$3.2B
$3.3B
$2.7B
$3.8B
1-4 Family Mortgage Loan Originations
11
$3.3B
Net portfolio growth:
($238.3) M
+$83.7 M
+$703.2 M
+$456.2 M
+$1.4 B
+$731.0 M
Weighted Avg. Portfolio
Coupon at Period End
5.26%
5.05%
5.19%
5.48%
5.70%
5.65%

Fewer participants
Tighter underwriting standards
Wider spreads
More volume
1-4 Family Mortgage Lending:
Positive Environment for Quality Portfolio Growth
12

• Limited credit risk
Conservative underwriting, top quality loans, low LTVs
No sub-prime, negative amortization or payment option ARM
lending
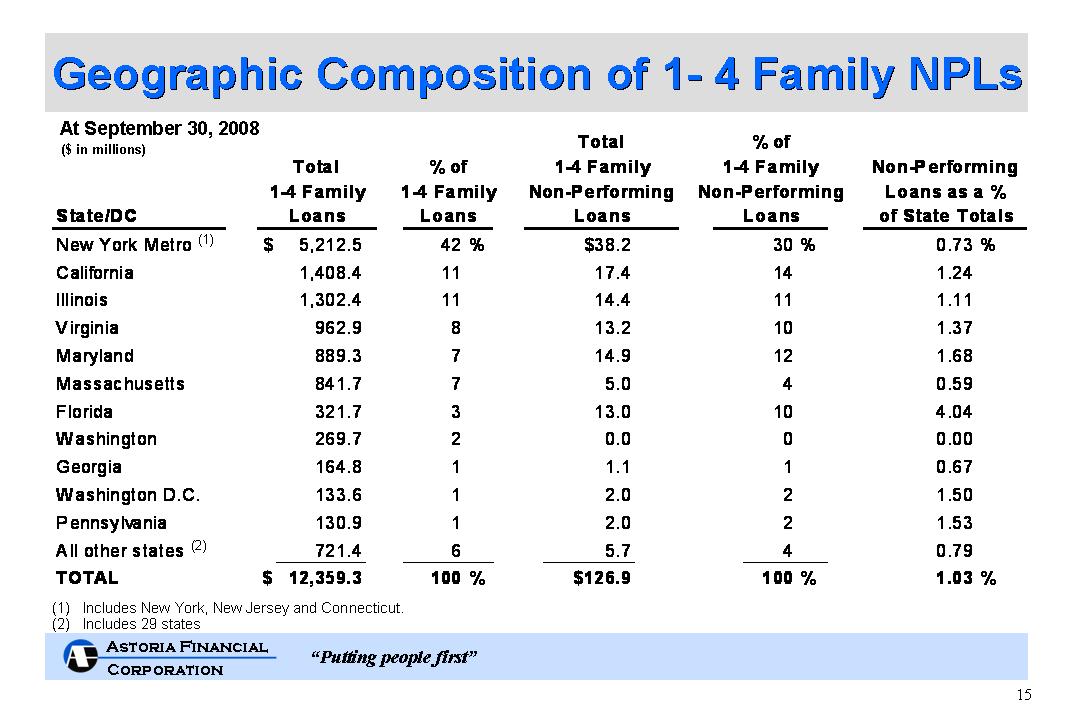
Non-performing assets: $187 million or 0.84% of total assets
No geographic concentration of NPLs
Net charge-offs of $8.5 million in 3Q08, $16.6 million for nine-months 2008
• Top quality MBS portfolio
Primarily GSE, agency or ‘AAA’ rated
Asset Quality Focus
14
I

• One year gap: -22.43%
$1.7 billion of CDs* scheduled to mature over the next three
months with a weighted average rate of 4.11%. CDs were issued or
repriced during the third quarter 2008 with a weighted average rate of
3.64%
• Key balance sheet components
Short-term hybrid adjustable-rate mortgage loan portfolio
Short weighted average life MBS portfolio
Offset by:
Large, low-cost checking, savings and money market deposit base –
provides natural hedge against rising rates
Medium- to long-term CDs
Borrowings – as needed
Interest Rate Risk Management
* Excludes Liquid CDs
17


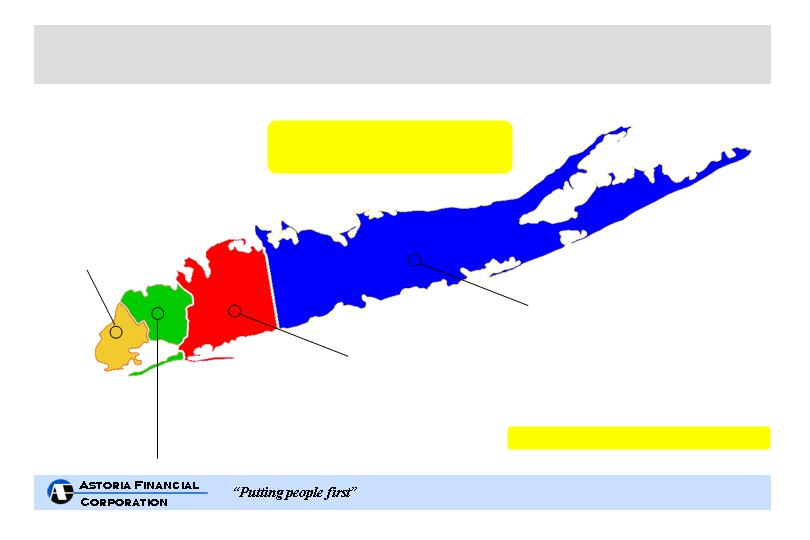
• $13.1 billion in deposits, 85 banking office network
Serving the Long Island market since 1888
• Low cost/stable source of funds – average cost: 2.84%*
• $12.2 billion, or 93%, of total deposits emanate from within
5 miles of a branch
• Banking offices with high average deposits contribute to
efficiency
Long Island Offices (82) – Nassau (28), Queens (17), Suffolk (25),
Brooklyn (12) – Average Deposits of $153 Million
Westchester Offices (3) – Average Deposits of $180 Million
• Alternative delivery channels
ATM’s, telephone and Internet banking
* For the quarter ended September 30, 2008
Leading Retail Banking Franchise
19
TOTAL 4 COUNTY POPULATION: 7,661,593
Source: SNL Financial LC (as of June 30, 2008)
Kings County (Brooklyn)
Population: 2,548,982
Median household income: $43,514
Deposits: $1.6 billion
Branches: 12
Market share: 5%
Rank: #2 thrift, #6 all banks
Queens County
Population: 2,279,742
Median household income: $57,409
Deposits: $3.1 billion
Branches: 17
Market share: 8%
Rank: #1 thrift, #4 all banks
Nassau County
Population: 1,334,459
Median household income: $100,150
Deposits: $5.1 billion
Branches: 28
Market share: 10%
Rank: #1 thrift, #4 all banks
Suffolk County
Population: 1,498,410
Median household income: $86,495
Deposits: $3.1 billion
Branches: 25
Market share: 9%
Rank: #1 thrift, #3 all banks
Long Island Powerhouse
Well Positioned in Key Markets
Overall LI Deposit Share Ranking :
#1- all thrifts, #4- all banks
20

Brooklyn, Queens, Nassau and Suffolk
* Astoria’s deposits highlighted above are comprised of retail community deposits. Astoria does not solicit broker or municipal deposits. Reflects one branch closed in 3Q08
Source: FDIC Summary of Deposits. Data as of June 30, 2008. Top 8 represents institutions with deposits exceeding $5 Billion.
The combined population of these four counties (7.7 million) exceeds the population of 38 individual U.S. states
Strong Position in Core Market
(1)
2007 & 2008 deposits have been adjusted to include the effect of merger and acquisition activity and pending transactions.
(2) An increase of 51 branches to the Total Core Market during the 12 months ended June 30, 2008.
21
($ in millions)
June 08/07
Market
Deposits
Institution
Growth
(1)
Share
Per Branch
1
Chase
$
38,034
$
(1,892)
24.3
%
404
$94
2
Citibank
19,818
1,451
12.7
139
143
3
Capital One
18,875
(2,545)
12.1
202
93
4
ASTORIA*
12,802
(296)
8.2
82
156
5
HSBC
10,461
505
6.7
94
111
6
NY Community
10,069
(351)
6.4
129
78
7
TD Bank
7,233
1,197
4.6
60
121
8
Bank of America
5,360
110
3.4
122
44
Total - Top 8
$
122,652
$
(1,821)
78.5
%
1,232
$100
Total - Core Market
$
156,300
$
(11)
100.0
%
1,690
(2)
$92
Deposits
(1)
Branches
# of

Brooklyn, Queens, Nassau and Suffolk
Market Share Trend 1999 - 2008
Note: Data adjusted to include the effect of merger and acquisition activity.
22
* Astoria’s deposits highlighted above are comprised of retail community deposits. Astoria does not solicit broker or municipal deposits. Reflects one branch closed in 3Q08
Source: FDIC Summary of Deposits. Data as of June 30, 2008. Top 8 represents institutions with deposits exceeding $5 Billion.
($ in millions)
June 2008
June 99-08
Market
Market Share
Change in #
Institution
Deposits
$
Growth
%
Share
Gain/(Loss)
of Branches
1
TD Bank
$
7,233
$
7,233
100.0
%
4.6
%
4.6
%
60
2
Citibank
19,818
5,977
43.2
12.7
0.2
(18)
3
ASTORIA*
12,802
3,608
39.2
8.2
(0.1)
(2)
4
NY Community
10,069
2,026
25.2
6.4
(0.8)
29
5
Chase
38,034
9,914
35.3
24.3
(0.9)
46
6
HSBC
10,461
1,930
22.6
6.7
(1.0)
(6)
7
Capital One
18,875
1,498
8.6
12.1
(3.5)
7
8
Bank of America
5,360
(2,578)
(32.5)
3.4
(3.7)
(2)
Total - Top 8
$
122,652
$
29,608
31.8
%
78.5
%
(5.1)
%
+ 114
Total - Core Market
$
156,300
$
44,957
40.4
%
100.0
%
+ 306

* Note: 59% of the households that have a retail CD or Liquid CD account also have a low
cost checking, savings or money market account relationship.
At September 30, 2008
Total - $13.1 Billion
*Retail CDs: $8.5B
Rate: 3.92%
Money Market: $0.3B
Rate: 1.06%
Savings: $1.8B
Rate: 0.40%
*Liquid CDs: $1.1B
Rate: 2.47%
Now/Demand: $1.4B
Rate: 0.06%
Core Community Deposits
23
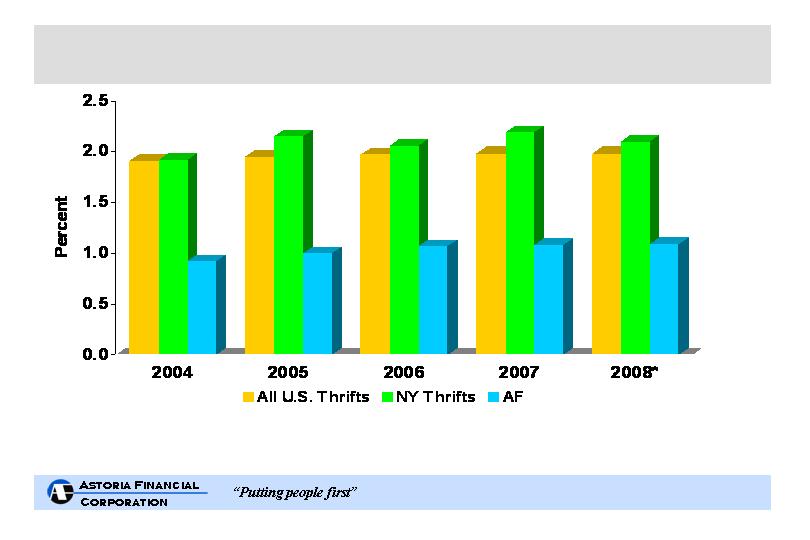
* Most recent data available for All US Thrifts and NY Thrifts is for the quarter ended June 30, 2008. AF is annualized for the nine months
ended September 30, 2008.
Source: SNL Financial – Median Ratios
(1) G&A expense ratio represents general and administrative expense divided by average assets.
Low Expense Ratio(1)
24

We expect the net interest margin will continue to increase in the fourth quarter
along with modest earning asset growth. We expect our non-performing assets
and loan delinquencies will increase somewhat in the 2008 fourth quarter, but
should remain at manageable levels.
Strategies
• Remain focused
Grow loans, deposits and earning assets
Capitalize on mortgage banking dislocation
Maintain conservative underwriting standards
Maintain pricing discipline
Use low-cost long-term borrowings opportunistically
• Maintain superior operating efficiency
• Tangible capital level target: between 4.50% and 4.75%
Objective: Produce solid returns
Outlook for Remainder of 2008
25

www.astoriafederal.com
Addendum
Long Island’s Premier Community Bank
27
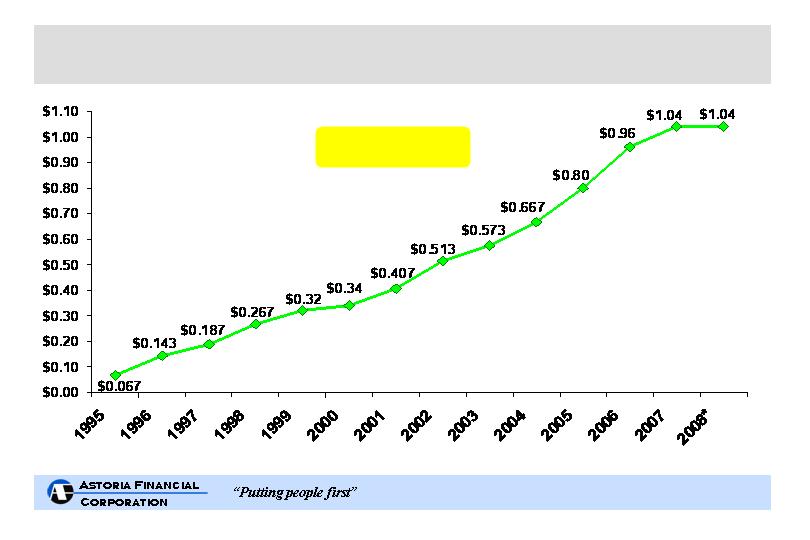
Dividend Growth
CAGR = 23%
* 4Q08 annualized; 5.66% yield, as of November 5, 2008
28
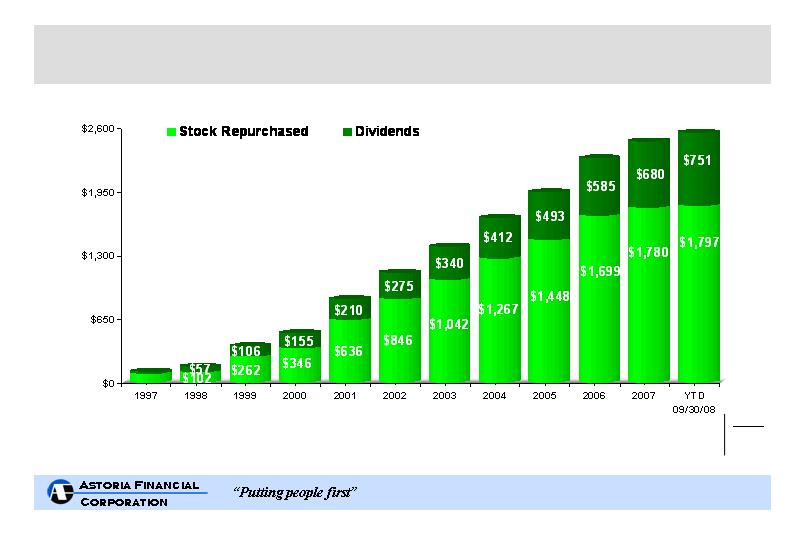
Cumulative Cash Returned to Shareholders
(In Millions)
$110
$159
$368
$846
$1,121
$501
Over $2.5 billion returned to shareholders in the past 11+ years
$1,382
$1,679
$1,941
$2,284
$2,460
* Amount does not cross foot due to rounding
29
$2,548
Shares
TOTAL
Repurchased:
6.7M
1.0M
12.8M
7.8M
15.5M
10.9M
10.6M
9.1M
6.6M
8.4M
3.0M
0.8M
93.1M*
Average Price:
$12.85
$16.31
$12.48
$10.81
$18.70
$19.32
$18.42
$24.82
$27.49
$29.92
$26.64
$23.96
$19.31
At September 30, 2008
Shares Outstanding: 95,829,245
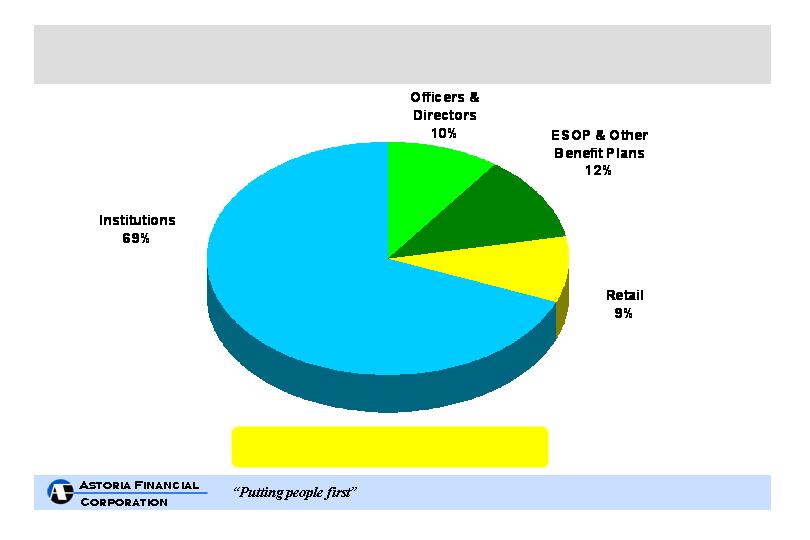
Ownership Profile
30

(1) Branches sold in 1999
(2) One satellite office closed in 1997
$11,590
86
TOTAL
6,600
35
Long Island Bancorp, Inc.
1998
2,400
14
The Greater NY Savings Bank
1997
1,800
18
Fidelity New York (2)
1995
280
4
Whitestone Savings (RTC)
1990
205
4
Oneonta Federal (1)
1987
25
1
Chenango Federal (1)
1984
100
3
Hastings-on-Hudson Federal
1982
130
5
Citizens Savings (FSLIC)
1979
$ 50
2
Metropolitan Federal
1973
Assets
# Branches
Thrift
Year
(in millions)
Acquisition History
32

Performance based on Enthusiasm, A ctions and Knowledge
“Sales Oriented and Service Obsessed”
A “needs” based approach to sales rather than “product”
based approach
Highly interactive program – daily and weekly meetings
create a focus that is shared throughout the branch network
Incentives for strong performance, both individual and team
Sales – PEAK Process
33

Key Findings : Favorably Positioned Against Competitors
• 71% of Astoria customers are highly satisfied
• 71% of Astoria customers are highly likely to recommend
Astoria to friend/family member
• Astoria customers are 22% more likely to net increase their
deposit relationship than are competitor customers
• Satisfaction with the branch is by far the strongest driver of
overall satisfaction – 86% of Astoria customers are highly
satisfied with quality of branch service
Customer Satisfaction
34

• Education First
Supports lifelong learning, promotes savings and provides meaningful
financial solutions to improve the way our customers live
• Neighborhood Outreach
Supports local organizations that enrich the communities within our market
area
Over 600 community-based organizations and not-for-profit agencies
supported in our markets
• Results/Recognition
Six consecutive “Outstanding” Community Reinvestment Act ratings by OTS
Astoria Federal is an integral part of the fabric of the communities we serve
Community Involvement
Key Initiatives
35
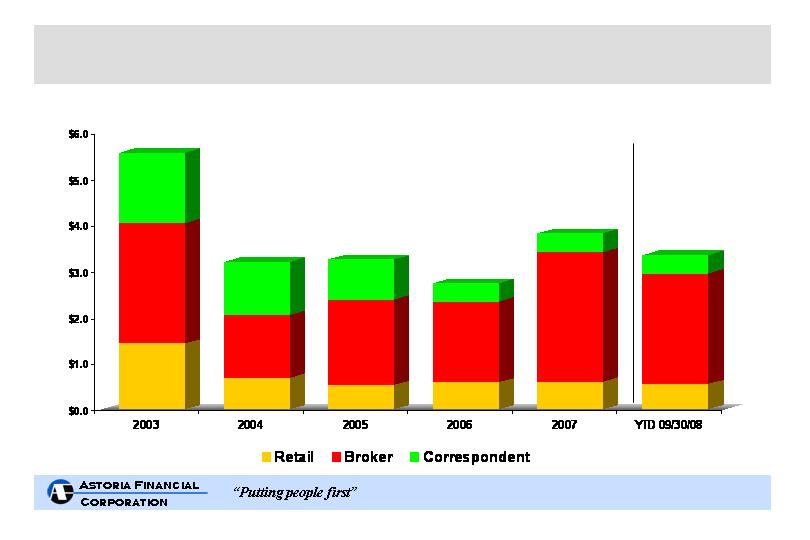
By Delivery Channel
(In Billions)
$5.6B
$3.2B
$3.3B
$2.7B
$3.8B
1-4 Family Mortgage Loan Originations
$3.3B
36

Geographic Composition of 1-4 Family Originations
Total 1-4 Family Loan Originations
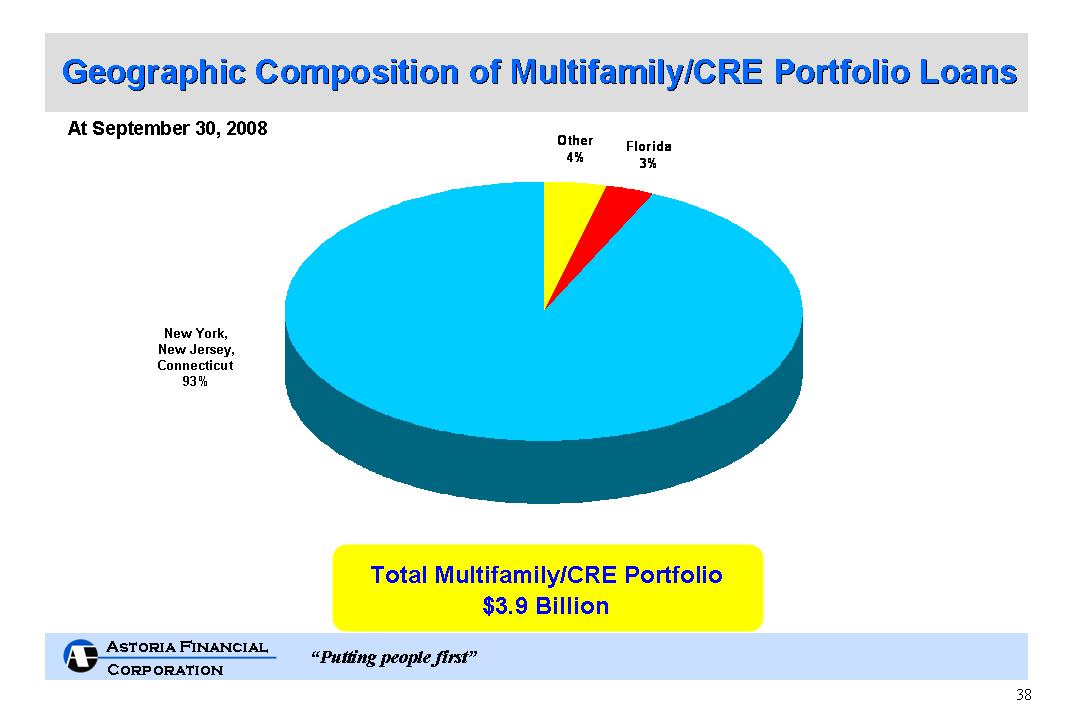
$3.3 Billion
For the nine months ended September 30, 2008
37

Long Island Savings Bank Claim
– On October 6, 2008, the U.S. Supreme Court declined to
consider reinstating a $436 million award to Astoria Financial
Corporation stemming from Government assisted acquisitions
in the early 1980’s. No portion of the $436 million award was
recognized in our consolidated financial statements.
Fidelity NY Claim
– On January 8, 2008, the U.S. Court of Federal Claims awarded
Astoria $16.0 million in damages. The U.S. government has
appealed such action.
Goodwill Claims - Update
39
(1)
-
-
-
-
-

Initial Public Offering
-
IPO
Non-Performing Loan
-
NPL
Mortgage Bankers Association
-
MBA
Office of Thrift Supervision
-
OTS
Mortgage-Backed Securities
Net Interest Margin
-
-
MBS
NIM
Loan-To-Value Ratio
-
LTV
Institutional Shareholder Services
-
ISS
Compounded Annual Growth Rate
-
CAGR
Government Sponsored Enterprise
-
GSE
Employee Stock Ownership Plan
-
ESOP
Commercial Real Estate
-
CRE
Adjustable Rate Mortgage
-
ARM
Glossary
41

Long Island’s Premier Community Bank
www.astoriafederal.com
42