
Investor Presentation
First Quarter Ended
March 31, 2009
www.astoriafederal.com
LONG ISLAND’S PREMIER COMMUNITY BANK

Forward Looking Statement
This presentation may contain a number of forward-looking statements within the meaning of Section 27A of
the Securities Act of 1933, as amended, and Section 21E of the Securities Exchange Act of 1934, as
amended. Forward-looking statements are based on various assumptions and analyses made by us in light
of our management’s experience and perception of historical trends, current conditions and expected future
developments, as well as other factors we believe are appropriate under the circumstances. These
statements are not guarantees of future performance and are subject to risks, uncertainties and other factors
(many of which are beyond our control) that could cause actual results to differ materially from future results
expressed or implied by such forward-looking statements. These factors include, without limitation, the
following: the timing and occurrence or non-occurrence of events may be subject to circumstances beyond
our control; there may be increases in competitive pressure among financial institutions or from non-financial
institutions; changes in the interest rate environment may reduce interest margins or affect the value of our
investments; changes in deposit flows, loan demand or real estate values may adversely affect our business;
changes in accounting principles, policies or guidelines may cause our financial condition to be perceived
differently; general economic conditions, either nationally or locally in some or all areas in which we do
business, or conditions in the real estate or securities markets or the banking industry may be less favorable
than we currently anticipate; legislative or regulatory changes may adversely affect our business; applicable
technological changes may be more difficult or expensive than we anticipate; success or consummation of
new business initiatives may be more difficult or expensive than we anticipate; or litigation or matters before
regulatory agencies, whether currently existing or commencing in the future, may be determined adverse to us
or may delay occurrence or non-occurrence of events longer than we anticipate. We assume no obligation to
update any forward-looking statements to reflect events or circumstances after the date of this document.
2

NYSE: AF
Corporate Profile
$21.4 billion in assets
$16.4 billion in loans
$13.6 billion in deposits
8.0% deposit market share in Long Island market
– Largest thrift depository
Insider & ESOP stock ownership: 23%
Well capitalized
– Bank regulatory capital: target > 6%
Core and tangible capital: 6.55%
Risk-based capital: 12.45%
Tier 1 risk-based capital: 11.24%
All figures in this presentation are as of March 31, 2009, except as noted.
3

• 1-4 Family loan portfolio increased $881.8 million, or 7.8%, from March 31, 2008,
to $12.2 billion with a weighted average rate of 5.61% at March 31, 2009
• Deposits increased $625.6 million, or 4.8%, from March 31, 2008, to $13.6 billion
at March 31, 2009; weighted average rate of deposits declined 67 bp from
March 31, 2008, to 2.57% at March 31, 2009
• Net interest income increased $30.9 million, or 38.2% from 1Q08, to $111.7
million for 1Q09
• Net interest margin increased 59 basis points from 1Q08, or 37.6%, to 2.16% for
1Q09
• Pre-tax, pre-provision operating income, 1Q09 $69.0 million; $276 million,
annualized*
• Tangible book value at March 31, 2009: $11.02 per share
Financial Highlights
For the twelve months ended March 31, 2009
* Excludes $5.3 million 1Q09 OTTI charge. For a reconciliation of operating income and operating EPS to GAAP net income and EPS, please
refer to table on page 35.
4

EFFICIENCY
MORTGAGE LENDING
• Portfolio lender,
• 1-4 Family, Multi-Family and CRE
expertise
• Solid asset quality
RETAIL BANKING
• Premier community bank on
Long Island
• Dominant deposit market share
• #1 thrift depository in core market
Same Simple Business Model
NOT A MTGE. BANKER
5

6%
Other
17%
Securities
77%
Loans
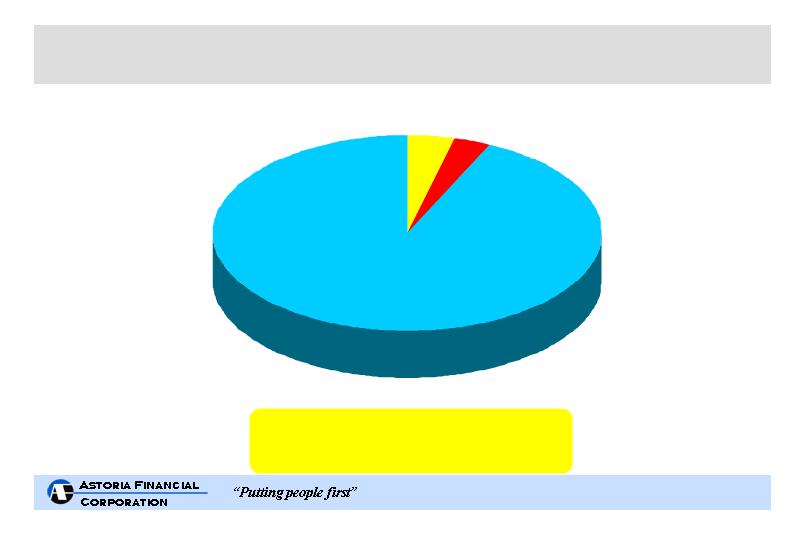
Other
8%
Loans
45%
Securities
47%
2%
Other
5%
Equity
42%
Deposits
51%
Borrowings
Total Assets: $22,696,536
($ in thousands)
($ in thousands)
Improving Balance Sheet Quality
At March 31, 2009
Total Assets: $21,404,781
Liabilities & Shareholders’ Equity
Liabilities & Shareholders’ Equity
Assets
Assets
At December 31, 1999
Equity
6%
Borrowings
29%
Deposits
64%
Other
1%
6

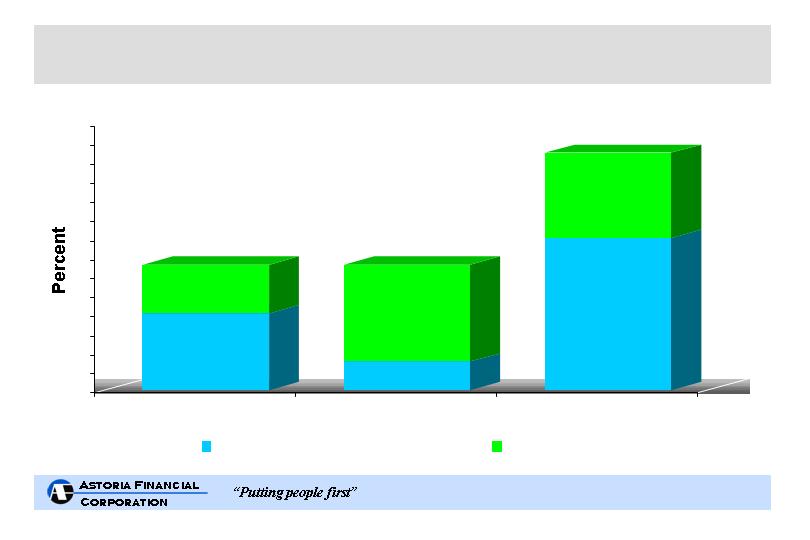
Low Expense Ratio(1)
* Data for All US Thrifts and NY Thrifts is not available for the quarter ended March 31, 2009. AF data is for the quarter ended March 31, 2009.
Source: SNL Financial – Median Ratios
(1) G&A expense ratio represents general and administrative expense divided by average assets.
0.0
0.5
1.0
1.5
2.0
2.5
2004
2005
2006
2007
2008
1Q09*
All U.S. Thrifts
NY Thrifts
AF
7

Primarily short-term, 5/1 jumbo prime hybrid ARMs for portfolio
Retain jumbo 15 year fixed-rate loans for portfolio
No sub-prime, negative amortization or payment option ARM lending
Average loan amount for first quarter 2009 production = $730,000
Average LTV on first quarter 2009 production = 55% at origination
Average LTV on total 1-4 family loan portfolio < 63%*
Multiple delivery channels provide flexibility & efficiency
Retail
Commissioned brokers covering 19 states**
Third party originators – correspondents covering 20 states**
Secondary marketing capability
Sale of 15 year and 30 year fixed rate conforming loans
Geographically diversified portfolio
Reduces lending concentrations
1-4 Family Mortgage Lending
* Based on current principal balances and original appraised values.
** All loans underwritten to Astoria’s stringent standards. Includes Washington, D.C.
8

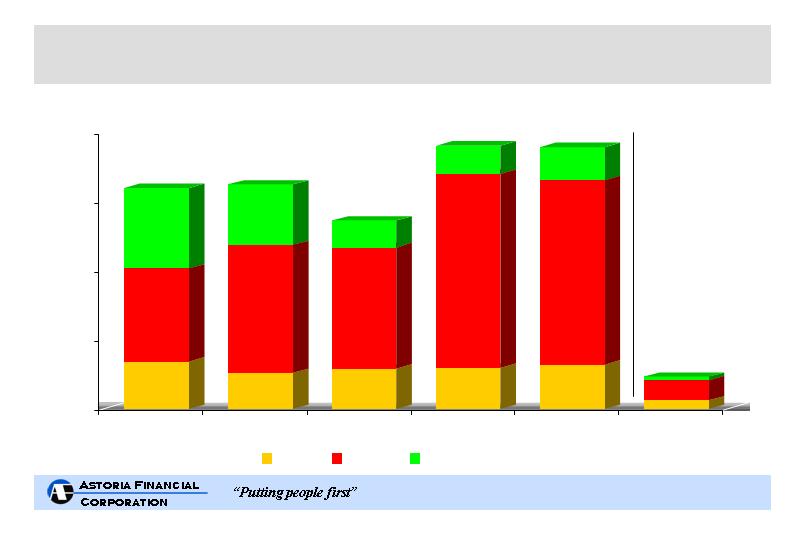
By Product Type
$5.6 B
$0.46 B
$3.8 B
Other
Other ARM
5/1 ARM
3/1 ARM
1Q09
2008
2007
2006
2005
2004
2003
$6.0
$5.0
$4.0
$3.0
$2.0
$1.0
$0.0
$3.2 B
$3.3 B
$2.7 B
$3.8 B
1-4 Family Mortgage Loan Originations
Net portfolio growth:
($238.3 ) M
+$83.7 M
+$703.2 M
+$456.2 M
+$1.4 B
+$721.3 M
($192.3) M
Weighted Avg. Portfolio
Coupon at Period End
5.26%
5.05%
5.19%
5.48%
5.70%
5.65%
5.61%
9

Solid Multi-family/CRE portfolio
$3.8 billion in portfolio
Weighted Average Coupon at March 31, 2009: 5.96%
Weighted average LTV < 61%*
Average loan < $1 million
Approximately 70% of multi-family portfolio is
subject to rent control or rent stabilization
Limit originations in current economic environment
Multi-family/Commercial Real Estate Lending
* Based on current principal balances and original appraised values.
10

• Limited credit risk
Conservative underwriting, top quality loans, low LTVs
No sub-prime, negative amortization or payment option ARM lending
Non-performing assets: $367 million or 1.71% of total assets
No geographic concentration of NPLs
Net charge-offs to average loans outstanding:
48 basis points, 1Q09 annualized
• Top quality MBS portfolio
95% GSE/agency, balance ‘AAA’ rated
CMOs, seasoned collateral, well structured with minimal extension
risk
Average life 1.7 years
Asset Quality Focus
11

LI Savings Bank
Acquisition
09/30/98
Outsourced
Mtge. Servicing
12/31/05
1-4 Family Delinquency Ratios: AF vs. MBA
Source: MBA National Delinquency Survey.
0
1
2
3
4
5
6
7
8
9
10
11
12
MBA - NY
MBA - US
AF
12

Geographic Composition of 1- 4 Family NPLs
(1)
Based on current principal balances and original appraised values.
(2)
Includes 30 states and Washington, D.C.
(3)
Does not foot due to rounding.
At March 31, 2009
($ in millions)
Total
% of
% of
1-4 Family
1-4 Family
Non-Performing
Average
1-4 Family
Non-Performing
Non-Performing
Loans as a %
State
LTV
(1)
Loans
Loans
Loans
of State Totals
New York
$
2,875.8
55
%
24
%
$21.9
9
%
0.76
%
Illinois
1,309.5
66
11
29.0
12
2.21
California
1,304.9
65
11
38.4
16
2.94
Connecticut
1,276.8
56
11
16.8
7
1.32
New Jersey
996.6
67
8
27.7
11
2.78
Virginia
905.4
70
7
24.6
10
2.72
Maryland
854.5
67
7
30.0
12
3.51
Massachusetts
838.9
62
7
12.4
5
1.48
Washington
322.7
62
3
0.0
0
0.00
Florida
305.3
66
3
22.6
9
7.40
All other states
(2)
1,166.9
66
10
22.1
9
1.89
TOTAL
$
12,157.3
62
%
100
%
(3)
$245.5
100
%
2.02
%
Total
1-4 Family
Loans
13

Note: LTVs are based on current principal balances and original appraised values.
At March 31, 2009
($ in millions)
1- 4 Family Loan Portfolio Stratification
Non-Performing
Non-Performing
Loans as a %
Loans
of Total Loans
Full income portfolio
$
9,782.4
$
98.9
1.01
%
Alt A < 70% LTV
1,333.1
48.7
3.65
%
Alt A between 70% - 80% LTV
1,041.8
97.9
9.40
%
Total 1-4 family loans
$
12,157.3
$
245.5
2.02
%
Total
Loans
14

Asset Quality
(1)
Includes construction loans of $57.6 million and consumer and other loans of $333.9 million.
(2)
Includes $115.0 million of net unamortized premiums and deferred loan costs.
(3)
Includes construction loans of $7.2 million and consumer and other loans of $2.4 million.
($ in millions)
For the Three Months Ended March 31, 2009
Multi-family
Loan portfolio balance
$
12,157.3
$
2,837.4
$
920.7
$
391.5
(1)
$
16,421.9
(2)
Non-performing loans
$
245.5
$
66.2
$
15.3
$
9.6
(3)
$
336.6
% of total loans
1.49
%
0.41
%
0.09
%
0.06
%
2.05
%
Net charge-offs
$
11.2
$
7.9
$
0
$
0.7
$
19.8
Net charge-offs to avg. loans
27
bp
19
bp
0
bp
2
bp
48
bp
(annualized)
Other
1-4
Family
Total
CRE
15

Organic growth vs. de-novo branching
Differentiation from competition
– Maintain pricing discipline
– Pro-active sales culture – PEAK Process
– Focus on customer service – High customer satisfaction
– Community involvement – Support over 575 local
organizations and not-for-profit agencies in our markets
Astoria Federal is an integral part of the fabric of the communities we serve
Retail Banking Philosophy
16

• $13.6 billion in deposits, 85 banking office network
Serving the Long Island market since 1888
• Low cost/stable source of funds – weighted average rate: 2.57%*
• $12.7 billion, or 93%, of total deposits emanate from within
5 miles of a branch – no broker or municipal deposits
• Banking offices with high average deposits contribute to
efficiency
Long Island Offices (82) – Nassau (28), Queens (17), Suffolk (25),
Brooklyn (12) – Average Deposits of $159 Million
Westchester Offices (3) – Average Deposits of $202 Million
• Alternative delivery channels
ATM’s, telephone and Internet banking
* At March 31, 2009
Leading Retail Banking Franchise
17
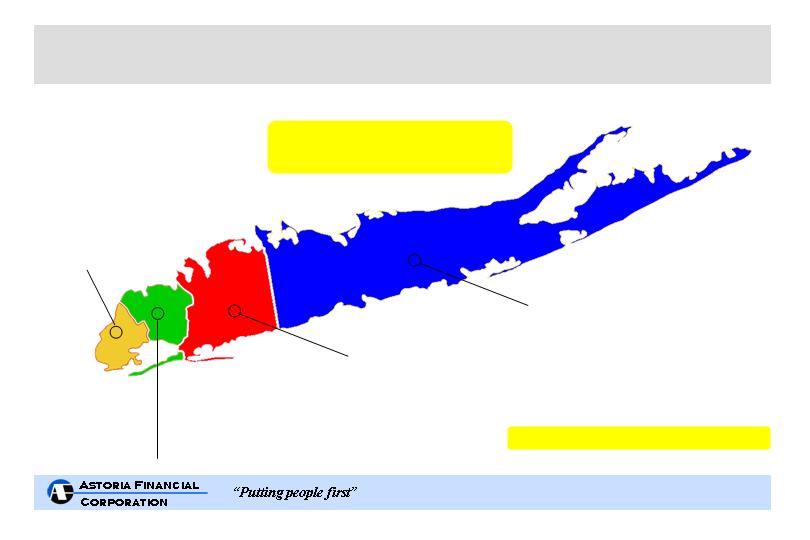
TOTAL 4 COUNTY POPULATION: 7,661,593
Source: FDIC Summary of Deposits (as of June 30, 2008)
Kings County (Brooklyn)
Population: 2,548,982
Median household income: $43,514
Deposits: $1.6 billion
Branches: 12
Market share: 5%
Rank: #2 thrift, #6 all banks
Queens County
Population: 2,279,742
Median household income: $57,409
Deposits: $3.1 billion
Branches: 17
Market share: 8%
Rank: #1 thrift, #4 all banks
Nassau County
Population: 1,334,459
Median household income: $100,150
Deposits: $5.1 billion
Branches: 28
Market share: 10%
Rank: #1 thrift, #4 all banks
Suffolk County
Population: 1,498,410
Median household income: $86,495
Deposits: $3.1 billion
Branches: 25
Market share: 8%
Rank: #1 thrift, #3 all banks
Long Island Powerhouse
Well Positioned in Key Markets
Overall LI Deposit Share Ranking:
#1- all thrifts, #4- all banks
18

Brooklyn, Queens, Nassau and Suffolk
Market Share Trend 1999 - 2008
Note: Data adjusted to include the effect of merger and acquisition activity.
19
* Astoria’s deposits highlighted above are comprised of retail community deposits. Astoria does not solicit broker or municipal deposits.
Reflects one branch closed in 3Q08
Source: FDIC Summary of Deposits. Data as of June 30, 2008. Top 8 represents institutions with deposits exceeding $5 Billion.
($ in millions)
June 08
June 99-08
June 99-08
June 2008
June 99-08
Market
Market Share
Change in #
Institution
Deposits
$
Growth
%
Share
Gain/(Loss)
of Branches
1
TD Bank
$
7,233
$
7,233
100.0
%
4.5
%
4.5
%
60
2
Citibank
19,818
5,977
43.2
12.4
(0.1)
(18)
3
ASTORIA*
12,802
3,608
39.2
8.0
(0.3)
(2)
4
NY Community
10,069
2,026
25.2
6.3
(0.9)
29
5
HSBC
10,461
1,930
22.6
6.5
(1.1)
(6)
6
Capital One
22,800
5,423
31.2
14.2
(1.4)
7
7
Chase
38,034
9,914
35.3
23.7
(1.5)
46
8
Bank of America
5,360
(2,578)
(32.5)
3.3
(3.8)
(2)
Total - Top 8
$
126,577
$
33,533
36.0
%
79.0
%
(4.6)
%
+ 114
Total - Core Market
$
160,225
$
48,882
43.9
%
100.0
%
+ 306
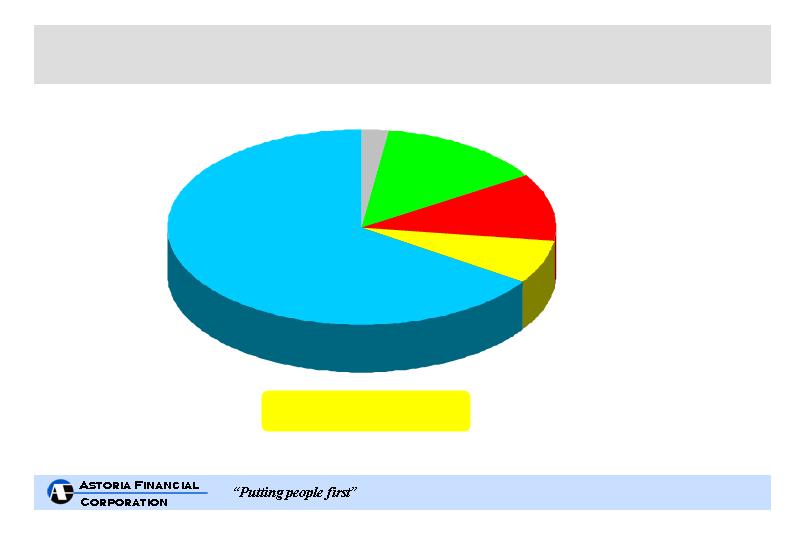
* Note: 59% of the households that have a retail CD or Liquid CD account also have a low
cost checking, savings or money market account relationship.
At March 31, 2009
Core Community Deposits
Now/Demand: $1.5B
Rate: 0.06%
*Liquid CDs: $1.0B
Rate: 1.69%
Savings: $1.9B
Rate: 0.40%
Money Market: $0.3B
Rate: 0.82%
*Retail CDs: $8.9B
Rate: 3.61%
Total - $13.6 Billion
Retail CD's
47%
20

We expect, beginning in the 2Q09, to realize the benefit from the repricing
of maturing CDs that have interest rates considerably above recently
issued or repriced CDs.
CDs were either issued or repriced during March 2009 with a weighted
average rate of 1.88%.
CDs scheduled to mature during the remainder of 2009:
2Q09: $1.8 billion with a weighted rate of 3.49%
2H09: $2.9 billion with a weighted average rate of 3.59%
Margin Expansion Opportunities
* CDs referenced herein exclude Liquid CDs
21

• Loan and deposit growth
• Modest margin expansion
• Internal tangible capital generation
• Maintain bank core and tangible regulatory capital > 6%
° At March 31, 2009:
Core and tangible capital: 6.55%
Risk-based capital: 12.45%
Tier 1 risk-based capital: 11.24%
Outlook for the remainder of 2009
22

www.astoriafederal.com
LONG ISLAND’S PREMIER COMMUNITY BANK
Addendum
23

Ownership Profile
Shares Outstanding: 97,058,454
At March 31, 2009
ESOP & Other
Benefit Plans
12%
Officers &
Directors
11%
Retail
14%
Institutions
63%
24

37
68
Support Services
Arnold K. Greenberg
Executive Vice President
29
55
Legal
Alan P. Eggleston
EVP, Secretary & General Counsel
32
56
Mortgage Lending
Gary T. McCann
Executive Vice President
38
62
Retail Banking
Gerard C. Keegan
Vice Chairman & CAO
19
46
Chief Financial Officer
Frank E. Fusco
EVP, Treasurer & CFO
35
58
Chief Operating Officer
Monte N. Redman
President & COO
38
70
Chief Executive Officer
George L. Engelke, Jr.
Chairman & CEO
Yrs. in
Banking
Age
Responsibility
Solid and Seasoned Management Team
25
$0.46 B
$3.8 B
$3.8 B
1-4 Family Mortgage Loan Originations
$2.7 B
$3.3 B
$3.2 B
By Delivery Channel
$0.0
$1.0
$2.0
$3.0
$4.0
2004
2005
2006
2007
2008
1Q09
Retail
Broker
Correspondent
26
For the quarter ended March 31, 2009
Total 1-4 Family Loan Originations
$463.3 Million
Geographic Composition of 1-4 Family Originations
Maryland
5%
New Jersey
5%
Connecticut
8%
Other < 5%
15%
Illinois
15%
New York
34%
Washington
8%
Massachusetts
10%
27

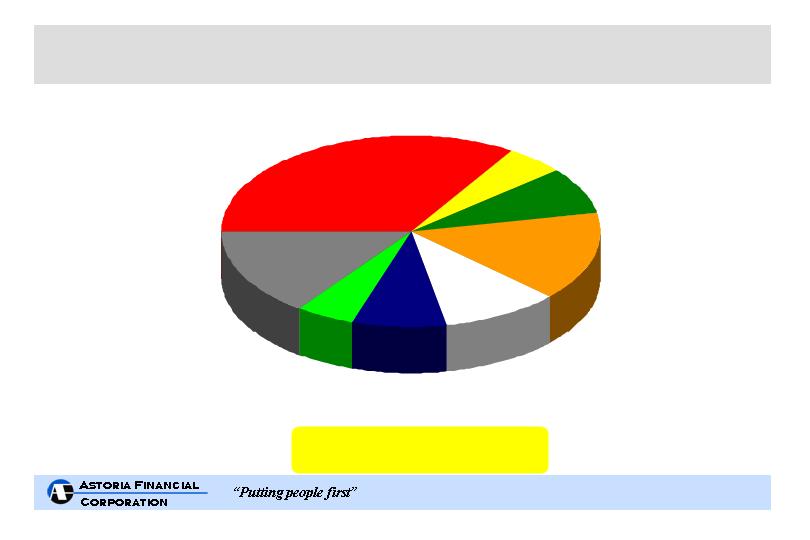
Percentages do not foot to 100% due to rounding
Total 1-4 Family Loan Portfolio
$12.2 Billion
At March 31, 2009
Geographic Composition of 1-4 Family Loan Portfolio
California
11%
Virginia
7%
New York
24%
Connecticut
11%
Massachusetts
7%
Illinois
11%
New Jersey
8%
Maryland
7%
Other < 5%
16%
28
Geographic Composition of Multi-family/CRE Portfolio Loans
New York,
New Jersey,
Connecticut
93%
Total Multifamily/CRE Portfolio
$3.8 Billion
At March 31, 2009
Florida
3%
Other
4%
29
At March 31, 2009
* Astoria Federal Savings
12.45%
Bank Regulatory Capital*
6.55%
6.55%
0
1
2
3
4
5
6
7
8
9
10
11
12
13
14
Core
Tangible
Risk-Based
Regulatory Requirement
Excess Capital
30

(1) Branches sold in 1999
(2) One satellite office closed in 1997
$11,590
86
TOTAL
6,600
35
Long Island Bancorp, Inc.
1998
2,400
14
The Greater NY Savings Bank
1997
1,800
18
Fidelity New York (2)
1995
280
4
Whitestone Savings (RTC)
1990
205
4
Oneonta Federal (1)
1987
25
1
Chenango Federal (1)
1984
100
3
Hastings-on-Hudson Federal
1982
130
5
Citizens Savings (FSLIC)
1979
$ 50
2
Metropolitan Federal
1973
Assets
# Branches
Thrift
Year
(in millions)
Acquisition History
31

Performance based on Enthusiasm, A ctions and Knowledge
“Sales Oriented and Service Obsessed”
A “needs” based approach to sales rather than “product”
based approach
Highly interactive program – daily and weekly meetings
create a focus that is shared throughout the branch network
Incentives for strong performance, both individual and team
Sales – PEAK Process
32

Key Findings : Favorably Positioned Against Competitors
• 74% of Astoria customers are highly satisfied
• 72% of Astoria customers are highly likely to recommend
Astoria to friend/family member
• Astoria customers are 25% more likely to net increase their
deposit relationship than are competitor customers
• Satisfaction with the branch is by far the strongest driver of
overall satisfaction – 83% of Astoria customers are highly
satisfied with quality of branch service
Customer Satisfaction
33

• Education First
Supports lifelong learning, promotes savings and provides meaningful
financial solutions to improve the way our customers live
• Neighborhood Outreach
Supports local organizations that enrich the communities within our market
area
Over 575 community-based organizations and not-for-profit agencies
supported in our markets
• Results/Recognition
Six consecutive “Outstanding” Community Reinvestment Act ratings by OTS
Astoria Federal is an integral part of the fabric of the communities we serve
Community Involvement
Key Initiatives
34

Reconciliation of GAAP Net Income to Non-GAAP Net Income(1)
(In Thousands, Except Per Share Data)
GAAP
Adjustments (2)
Non-GAAP
Net interest income
$111,677
$ -
$111,677
Provision for loan losses
50,000
-
50,000
Net interest income after provision for loan losses
61,677
-
61,677
Non-interest income
15,942
5,300
21,242
Non-interest expense
63,961
-
63,961
Income before income tax expense
13,658
5,300
18,958
Income tax expense
4,862
1,855
6,717
Net income
$ 8,796
$ 3,445
$ 12,241
Basic earnings per common share
$0.10
$0.04
$0.14
Diluted earnings per common share
$0.10
$0.04
$0.14
(1) Non-GAAP net income is also referred to as operating income and operating EPS in this presentation.
(2) Adjustments relate to the other-than-temporary impairment write-down of securities charge and the related tax effects.
Non-GAAP net income, non-GAAP earnings per share and non-GAAP returns, representing net income and earnings per share determined in
accordance with GAAP excluding the effects of the after-tax charges noted below, provide a meaningful comparison for effectively evaluating
Astoria's operating results.
March 31, 2009
For the Three Months Ended
35

Other Than Temporary Impairment
-
OTTI
Mortgage Bankers Association
-
MBA
Mortgage-Backed Securities
-
MBS
Office of Thrift Supervision
-
OTS
Earnings Per Share
-
EPS
Non-Performing Loan
-
NPL
Loan-To-Value Ratio
-
LTV
Government Sponsored Enterprise
-
GSE
Generally Accepted Accounting Principles
-
GAAP
Collateralized Mortgage Obligation
-
CMO
Employee Stock Ownership Plan
-
ESOP
Commercial Real Estate
-
CRE
Adjustable Rate Mortgage
-
ARM
Glossary
36

Contact Information
Astoria Financial Corporation
Attn: Investor Relations
One Astoria Federal Plaza
Lake Success, NY 11042
Address:
ir@astoriafederal.com
Email:
(516) 327-7869
Telephone:
www.astoriafederal.com
Web site:
37