Exhibit 99.1
|
|
|
|
|
|
|
|
|
|
|
|
|
|
|
|
|
|
|
|
|
|
|
|
|
|
|
|
|
|
|
|
|
|
|
|
|
|
|
|
|
|
|
|
|
|
|
|
|
|
|
|
|
|
|
|
|
|
|
|
|
|
|
|
|

|
|
|
|
|
|
|
|
|
|
|
|
|
|
|
|
|
|
|
|
|
|
|
|
|
|
|
|
|
|
|
|
|
|
|
|
|
|
|
|
|
|
|
|
|
|
|
|
|
|
|
|
|
|
|
|
|
|
|
|
|
|
|
|
|
|
|
|
|
|
|
|
|
|
|
|
|
|
|
|

|
|
|
|
|
|
|
|
|
|
|
|
|
|
|
|
|
|
|
|
|
|
|
|
|
|
|
|
|
|
|
|
|
|
|
|
|
|
|
|
|
|
|
|
|
|
|
|
|
|
|
|
|
|
|
|
|
|
|
|

|
|
|
|
|
|
|
|
|
|
|
|
|
|
|
|
|
|
|
|

[LOGO OF ASTORIA FINANCIAL CORPORATION]
LONG ISLAND’S PREMIER COMMUNITY BANK
www.astoriafederal.com
INVESTOR PRESENTATION
THIRD QUARTER ENDED
SEPTEMBER 30, 2005
[LOGO OF ASTORIA FINANCIAL CORPORATION]
This presentation may contain forward-looking statements that are based on various assumptions and analyses made by us in light of our management’s experience and its perception of historical trends, current conditions and expected future developments, as well as other factors it believes are appropriate under the circumstances. These statements are not guarantees of future performance and are subject to risks, uncertainties and other factors (many of which are beyond our control) that could cause actual results to differ materially from future results expressed or implied by such forward-looking statements. These factors include, without limitation, the following: the timing and occurrence or non-occurrence of events may be subject to circumstances beyond our control; there may be increases in competitive pressure among financial institutions or from non-financial institutions; changes in the interest rate environment may reduce interest margins or affect the value of our investments; changes in deposit flows, loan demand or real estate values may adversely affect our business; changes in accounting principles, policies or guidelines may cause our financial condition to be perceived differently; general economic conditions, either nationally or locally in some or all areas in which we do business, or conditions in the securities markets or the banking industry may be less favorable than we currently anticipate; legislation or regulatory changes may adversely affect our business; technological changes may be more difficult or expensive than we anticipate; success or consummation of new business initiatives may be more difficult or expensive than we anticipate; or litigation or other matters before regulatory agencies, whether currently existing or commencing in the future, may delay occurrence or non-occurrence of events longer than we anticipate. We assume no obligation to update any forward-looking statements to reflect events or circumstances after the date of this document.
2
[LOGO OF ASTORIA FINANCIAL CORPORATION]
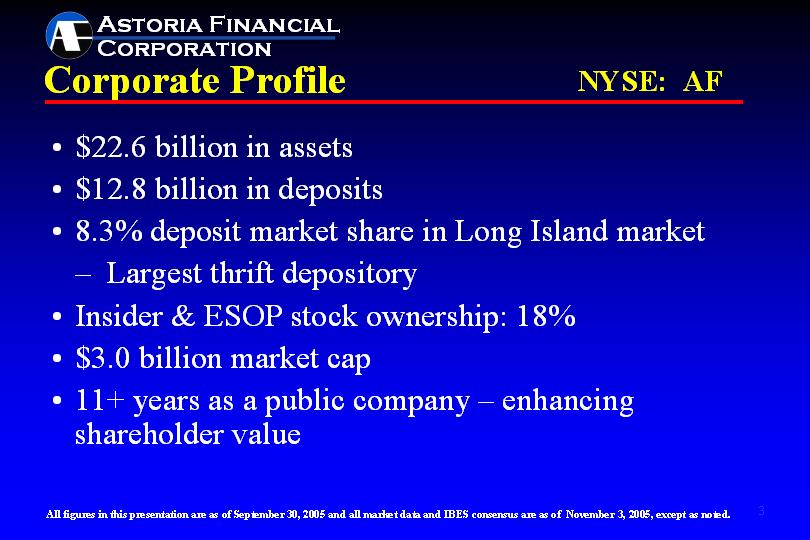
Corporate Profile | NYSE: AF |
• | $22.6 billion in assets |
|
|
• | $12.8 billion in deposits |
|
|
• | 8.3% deposit market share in Long Island market – Largest thrift depository |
|
|
• | Insider & ESOP stock ownership: 18% |
|
|
• | $3.0 billion market cap |
|
|
• | 11+ years as a public company – enhancing shareholder value |
All figures in this presentation are as of September 30, 2005 and all market data and IBES consensus are as of November 3, 2005, except as noted.
3
[LOGO OF ASTORIA FINANCIAL CORPORATION]
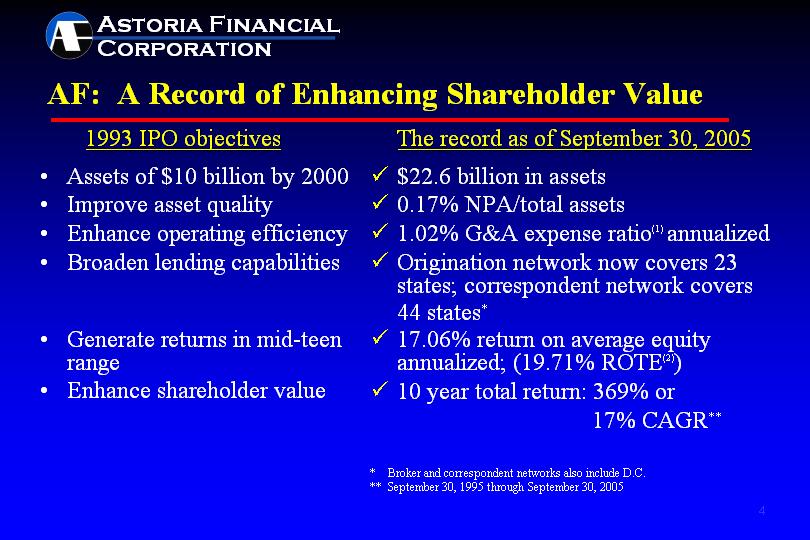
AF: A Record of Enhancing Shareholder Value |
| 1993 IPO objectives |
|
| The record as of September 30, 2005 |
|
|
| ||
• | Assets of $10 billion by 2000 |
| • | $22.6 billion in assets |
|
|
|
|
|
• | Improve asset quality |
| • | 0.17% NPA/total assets |
|
|
|
|
|
• | Enhance operating efficiency |
| • | 1.02% G&A expense ratio(1) annualized |
|
|
|
|
|
• | Broaden lending capabilities |
| • | Origination network now covers 23 states; correspondent network covers 44 states* |
|
|
|
|
|
• | Generate returns in mid-teen range |
| • | 17.06% return on average equity annualized; (19.71% ROTE(2)) |
|
|
|
|
|
• | Enhance shareholder value |
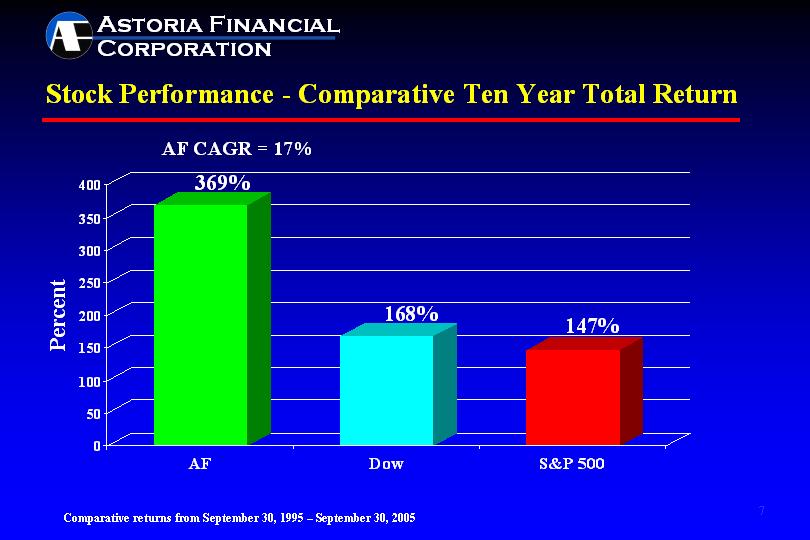
| • | 10 year total return: 369% or 17% CAGR** |
|
|
|
|
|
|
|
|
|
|
|
|
| ||
|
|
| * | Broker and correspondent networks also include D.C. |
|
|
| ** | September 30, 1995 through September 30, 2005 |
4
[LOGO OF ASTORIA FINANCIAL CORPORATION]
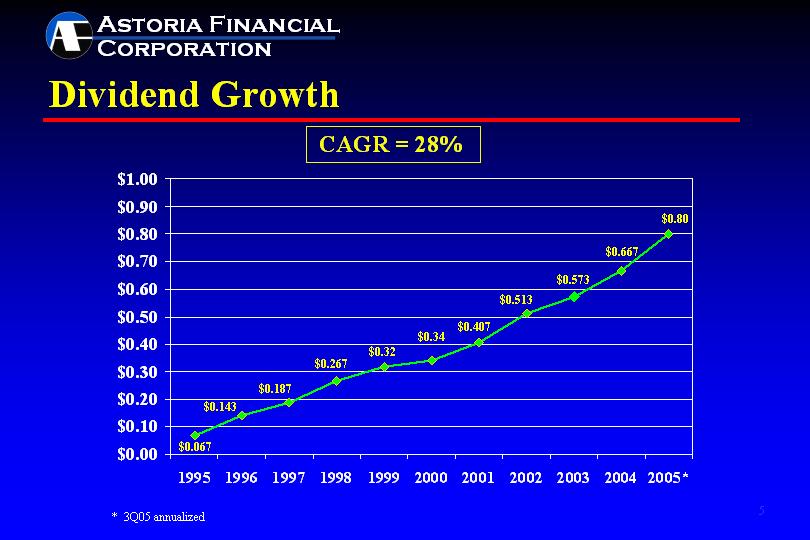
Dividend Growth |
[CHART APPEARS HERE]
5
[LOGO OF ASTORIA FINANCIAL CORPORATION]
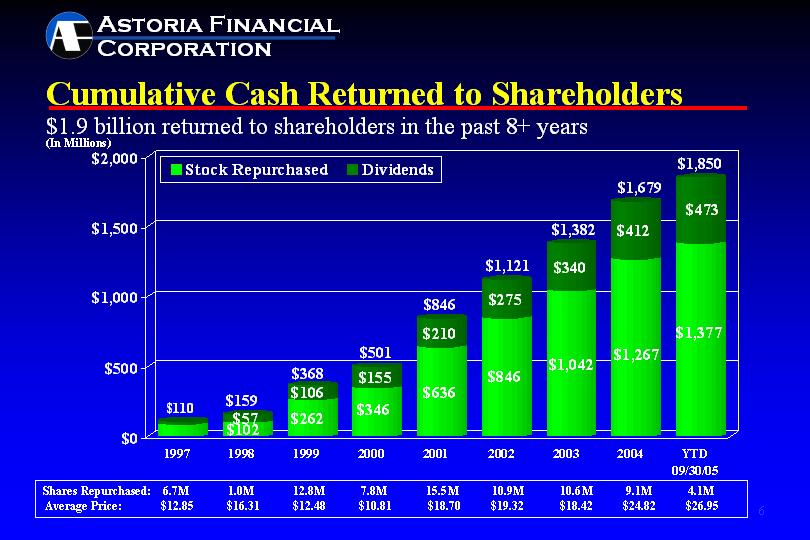
Cumulative Cash Returned to Shareholders |
$1.9 billion returned to shareholders in the past 8+ years
[CHART APPEARS HERE]
Shares Repurchased: | 6.7M | 1.0M | 12.8M | 7.8M | 15.5M | 10.9M | 10.6M | 9.1M | 4.1M |
Average Price: | $12.85 | $16.31 | $12.48 | $10.81 | $18.70 | $19.32 | $18.42 | $24.82 | $26.95 |
6
[LOGO OF ASTORIA FINANCIAL CORPORATION]
Stock Performance - Comparative Ten Year Total Return |
[CHART APPEARS HERE]
7
[LOGO OF ASTORIA FINANCIAL CORPORATION]
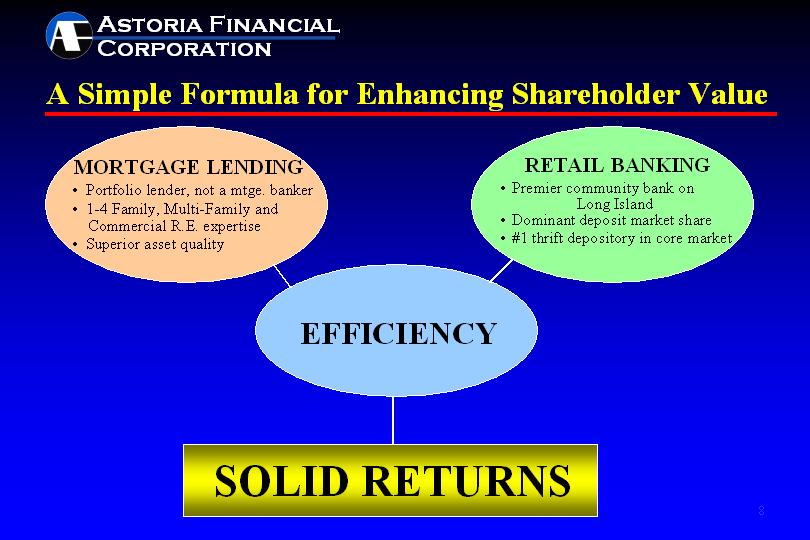
A Simple Formula for Enhancing Shareholder Value |
MORTGAGE LENDING |
| RETAIL BANKING | ||
| ||||
• | Portfolio lender, not a mtge. banker |
| • | Premier community bank on Long Island |
|
|
|
|
|
• | 1-4 Family, Multi-Family and Commercial R.E. expertise |
| • | Dominant deposit market share |
|
|
|
|
|
• | Superior asset quality |
| • | #1 thrift depository in core market |
|
|
|
|
|
EFFICIENCY | ||||
| ||||
SOLID RETURNS | ||||
8
[LOGO OF ASTORIA FINANCIAL CORPORATION]
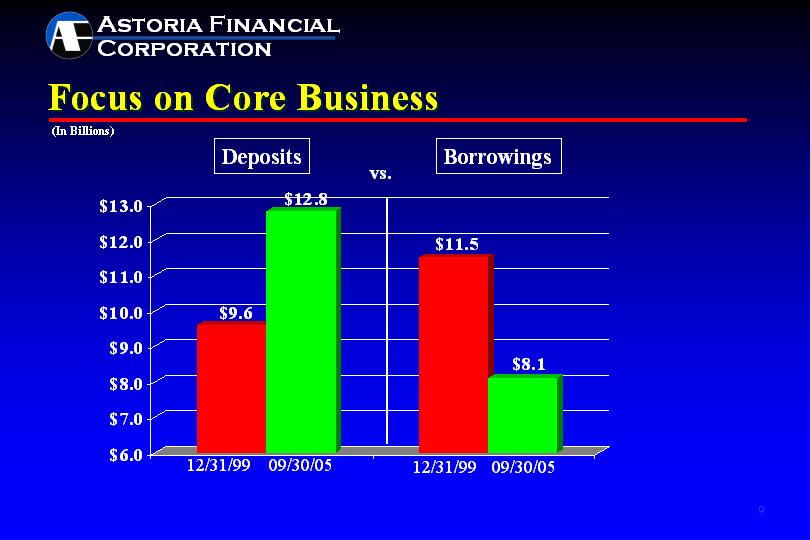
Focus on Core Business |
[CHART APPEARS HERE]
9
[LOGO OF ASTORIA FINANCIAL CORPORATION]
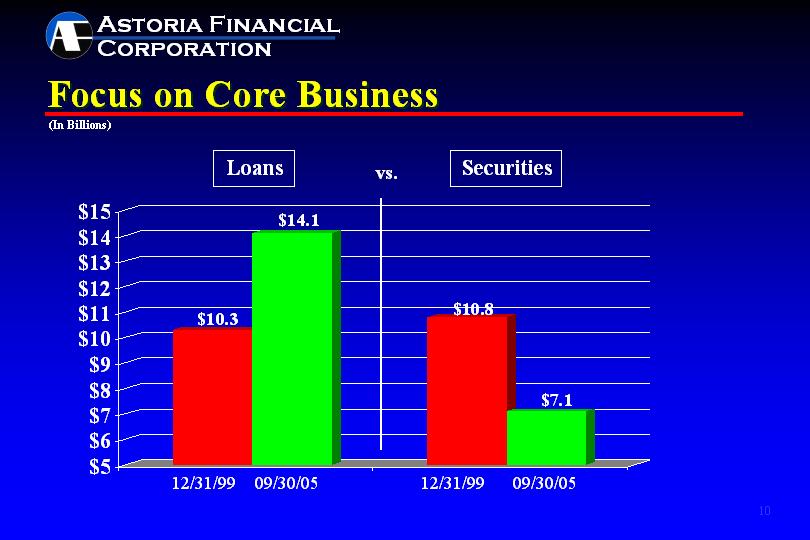
Focus on Core Business |
[CHART APPEARS HERE]
10
[LOGO OF ASTORIA FINANCIAL CORPORATION]
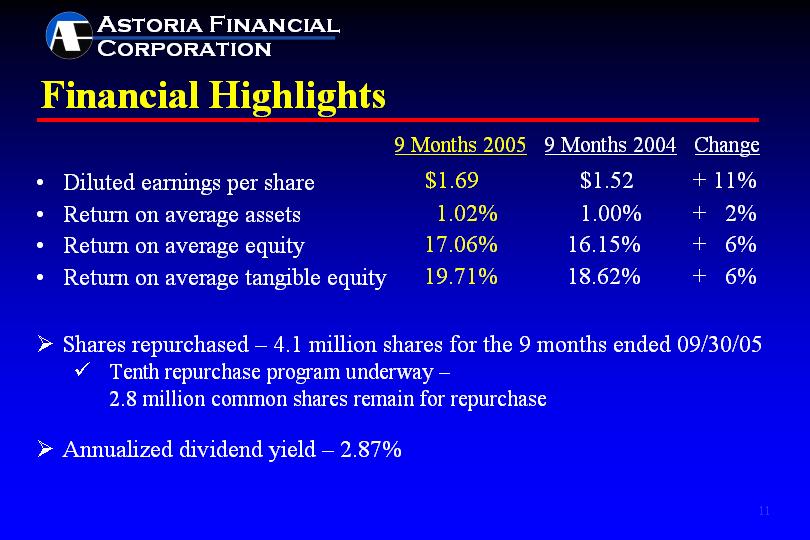
Financial Highlights |
|
|
| 9 Months 2005 |
| 9 Months 2004 |
| Change |
| |||
|
|
|
|
|
| ||||||
• | Diluted earnings per share |
| $ | 1.69 |
| $ | 1.52 |
|
| + 11 | % |
• | Return on average assets |
|
| 1.02 | % |
| 1.00 | % |
| + 2 | % |
• | Return on average equity |
|
| 17.06 | % |
| 16.15 | % |
| + 6 | % |
• | Return on average tangible equity |
|
| 19.71 | % |
| 18.62 | % |
| + 6 | % |
• | Shares repurchased – 4.1 million shares for the 9 months ended 09/30/05 | |
|
| |
| • | Tenth repurchase program underway – 2.8 million common shares remain for repurchase |
|
|
|
• | Annualized dividend yield – 2.87% | |
11
[LOGO OF ASTORIA FINANCIAL CORPORATION]
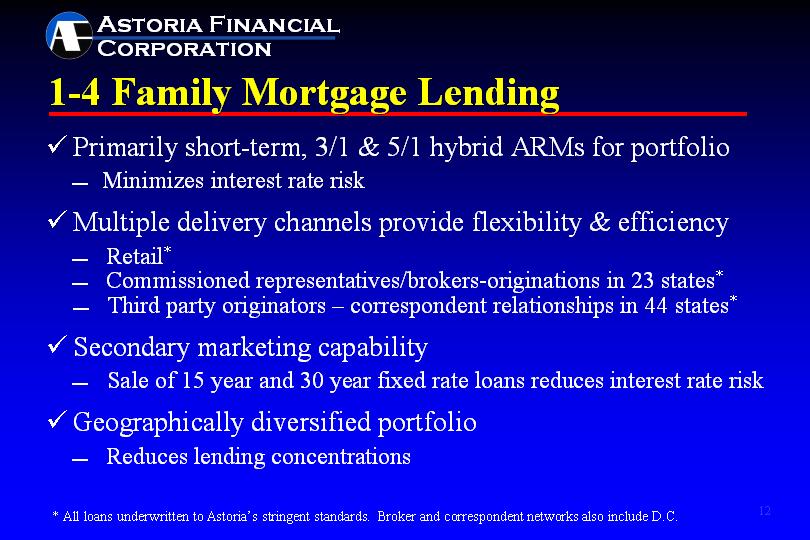
1-4 Family Mortgage Lending |
• | Primarily short-term, 3/1 & 5/1 hybrid ARMs for portfolio | |
|
| |
| – | Minimizes interest rate risk |
|
|
|
• | Multiple delivery channels provide flexibility & efficiency | |
|
| |
| – | Retail* |
| – | Commissioned representatives/brokers-originations in 23 states* |
| – | Third party originators – correspondent relationships in 44 states* |
|
|
|
• | Secondary marketing capability | |
|
| |
| – | Sale of 15 year and 30 year fixed rate loans reduces interest rate risk |
|
|
|
• | Geographically diversified portfolio | |
|
| |
| – | Reduces lending concentrations |
|
|
|
|
|
|
* All loans underwritten to Astoria’s stringent standards. Broker and correspondent networks also include D.C. | ||
12
[LOGO OF ASTORIA FINANCIAL CORPORATION]
Geographic Composition of 1-4 Family Loan Portfolio |
[CHART APPEARS HERE]
Total 1-4 Family Loan Portfolio
$9.5 Billion
13
[LOGO OF ASTORIA FINANCIAL CORPORATION]
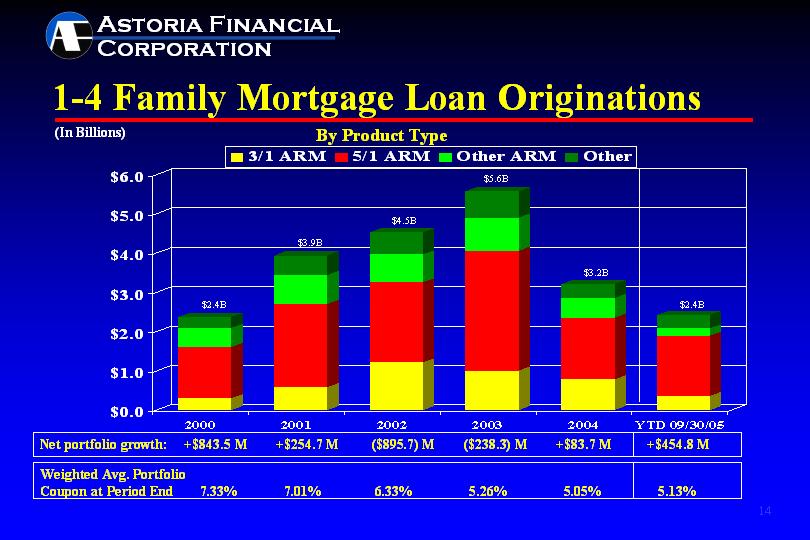
1-4 Family Mortgage Loan Originations |
[CHART APPEARS HERE]
Net portfolio growth: |
| $ | +843.5 | M | $ | +254.7 | M | $ | (895.7 | )M | $ | (238.3 | )M | $ | +83.7 | M | $ | +454.8 | M |
Weighted Avg. Portfolio Coupon at Period End |
|
| 7.33 | % |
| 7.01 | % |
| 6.33 | % |
| 5.26 | % |
| 5.05 | % |
| 5.13 | % |
14
[LOGO OF ASTORIA FINANCIAL CORPORATION]
Multifamily/Commercial Real Estate Lending |
• | Solid and growing Multifamily/CRE portfolio | |
|
|
|
| • | $3.9 billion in portfolio |
|
|
|
| • | Conservative underwriting – Average LTV < 65% |
|
|
|
| • | Average loan in portfolio < $1 million |
|
|
|
| • | Approximately 90% of multifamily portfolio is subject to rent control or rent stabilization |
|
|
|
| • | 12% annualized growth in 3Q05 |
Note: LTV is based on current principal balances and original appraised values.
15
[LOGO OF ASTORIA FINANCIAL CORPORATION]
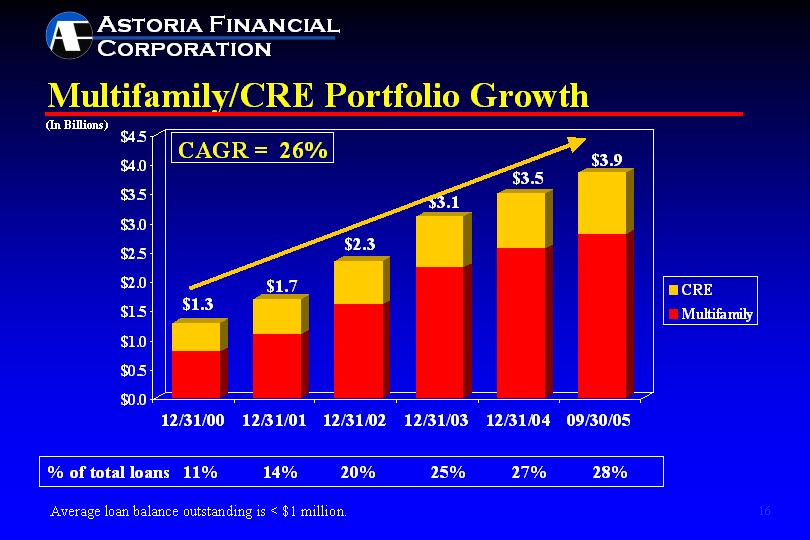
Multifamily/CRE Portfolio Growth |
[CHART APPEARS HERE]
% of total loans | 11% | 14% | 20% | 25% | 27% | 28% |
Average loan balance outstanding is < $1 million.
16
[LOGO OF ASTORIA FINANCIAL CORPORATION]
Asset Quality Focus |
• | Minimal credit risk | ||
|
|
| |
| • | Conservative underwriting, top quality loans, low LTVs | |
|
|
| |
|
| — | Net charge-offs of less than one basis point for each of the last 3 years and for nine months ended September 30, 2005 |
|
|
|
|
| • | No sub-prime or option ARM lending | |
|
|
| |
| • | 99+% of all loans secured by real estate | |
|
|
| |
• | Strong reserves | ||
|
|
| |
| • | Non-performing assets: 0.17% of total assets | |
|
|
| |
| • | Allowance for loan losses/non-performing loans: 216% | |
|
|
| |
• | Low delinquency levels | ||
|
| ||
• | Top quality MBS portfolio | ||
|
| ||
| • | Primarily GSE, agency or ‘AAA’ rated | |
17
[LOGO OF ASTORIA FINANCIAL CORPORATION]
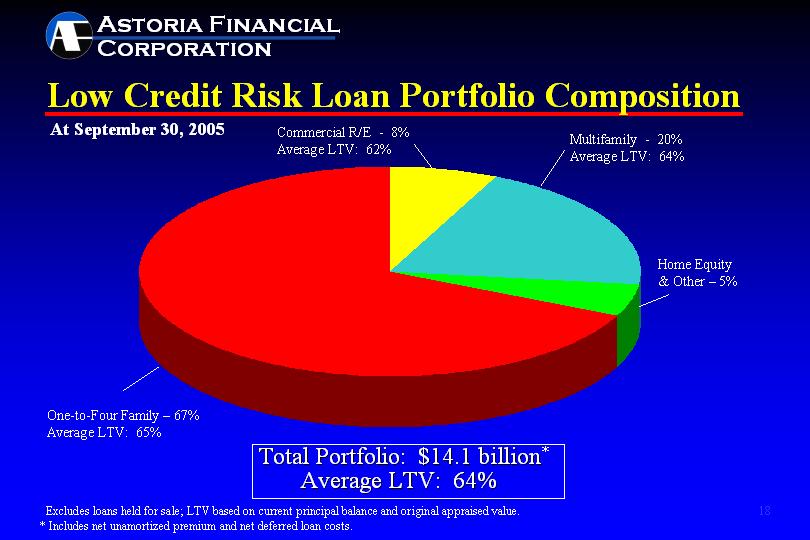
Low Credit Risk Loan Portfolio Composition |
[CHART APPEARS HERE]
Total Portfolio: $14.1 billion*
Average LTV: 64%
Excludes loans held for sale; LTV based on current principal balance and original appraised value.
* Includes net unamortized premium and net deferred loan costs. |
18
[LOGO OF ASTORIA FINANCIAL CORPORATION]
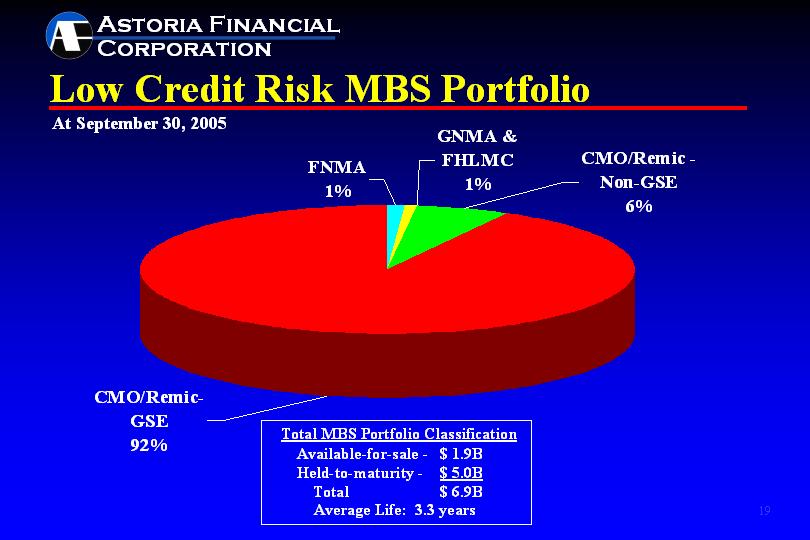
Low Credit Risk MBS Portfolio |
[CHART APPEARS HERE]
Total MBS Portfolio Classification | ||||
| ||||
Available-for-sale - |
|
| $1.9B |
|
Held-to-maturity - |
|
| $5.0B |
|
|
|
| ||
Total |
|
| $6.9B |
|
Average Life: 3.3 years |
| |||
19
[LOGO OF ASTORIA FINANCIAL CORPORATION]
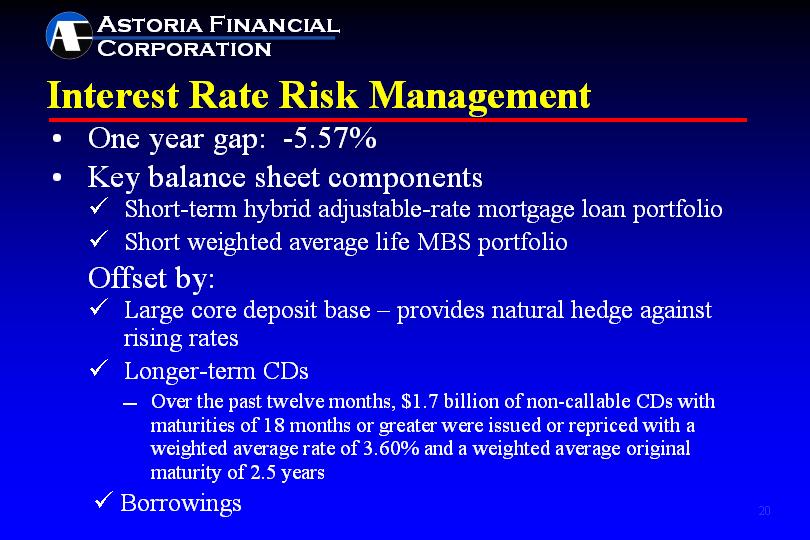
Interest Rate Risk Management | |||
|
|
|
|
• | One year gap: -5.57% | ||
|
|
|
|
• | Key balance sheet components | ||
|
|
|
|
| • | Short-term hybrid adjustable-rate mortgage loan portfolio | |
|
|
|
|
| • | Short weighted average life MBS portfolio | |
|
|
|
|
| Offset by: | ||
|
|
|
|
| • | Large core deposit base – provides natural hedge against rising rates | |
|
|
|
|
| • | Longer-term CDs | |
|
|
|
|
|
| — | Over the past twelve months, $1.7 billion of non-callable CDs with maturities of 18 months or greater were issued or repriced with a weighted average rate of 3.60% and a weighted average original maturity of 2.5 years |
|
|
|
|
| • | Borrowings | |
20
[LOGO OF ASTORIA FINANCIAL CORPORATION]
Retail Banking | ||
|
|
|
• | Acquisition vs. de-novo branching | |
|
| |
• | Differentiating from competition | |
|
|
|
| – | Maintain pricing discipline |
|
|
|
| – | Pro-active sales culture |
|
|
|
| – | Focus on customer service |
|
|
|
• | Importance of deposits in interest rate risk management (CDs vs. core) | |
21
[LOGO OF ASTORIA FINANCIAL CORPORATION]
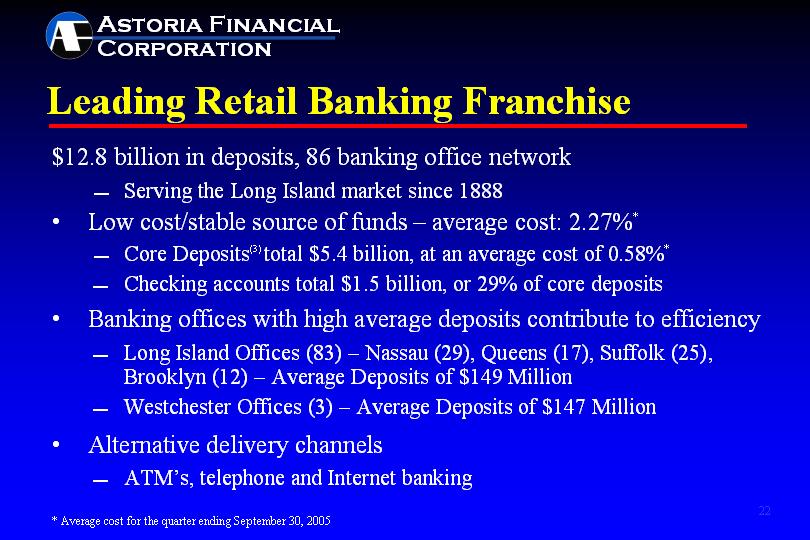
Leading Retail Banking Franchise | ||
$12.8 billion in deposits, 86 banking office network | ||
|
|
|
| — | Serving the Long Island market since 1888 |
|
|
|
• | Low cost/stable source of funds – average cost: 2.27%* | |
|
|
|
| — | Core Deposits(3) total $5.4 billion, at an average cost of 0.58%* |
|
|
|
| — | Checking accounts total $1.5 billion, or 29% of core deposits |
|
|
|
• | Banking offices with high average deposits contribute to efficiency | |
|
|
|
| — | Long Island Offices (83) – Nassau (29), Queens (17), Suffolk (25), Brooklyn (12) – Average Deposits of $149 Million |
|
|
|
| — | Westchester Offices (3) – Average Deposits of $147 Million |
|
|
|
• | Alternative delivery channels | |
|
|
|
| — | ATM’s, telephone and Internet banking |
|
|
|
* Average cost for the quarter ending September 30, 2005 | ||
22
[LOGO OF ASTORIA FINANCIAL CORPORATION]
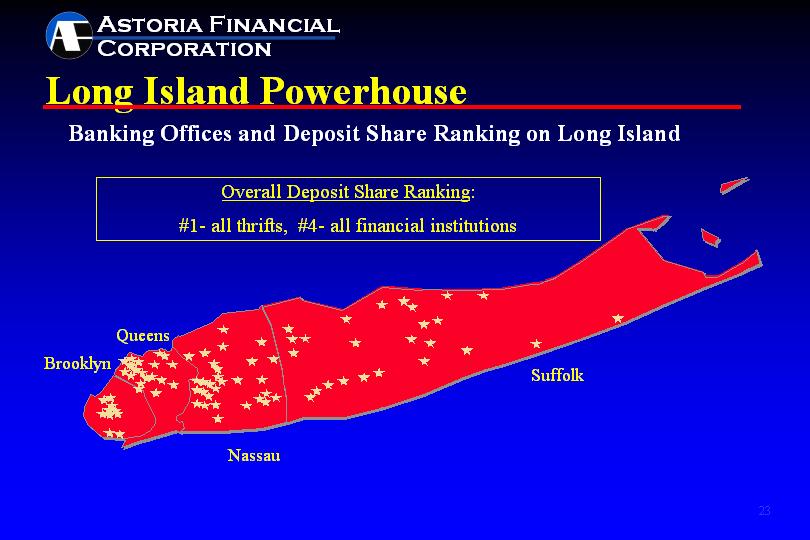
Long Island Powerhouse |
|
Banking Offices and Deposit Share Ranking on Long Island |
|
Overall Deposit Share Ranking: |
#1- all thrifts, #4- all financial institutions |
[CHART APPEARS HERE]
23
[LOGO OF ASTORIA FINANCIAL CORPORATION]
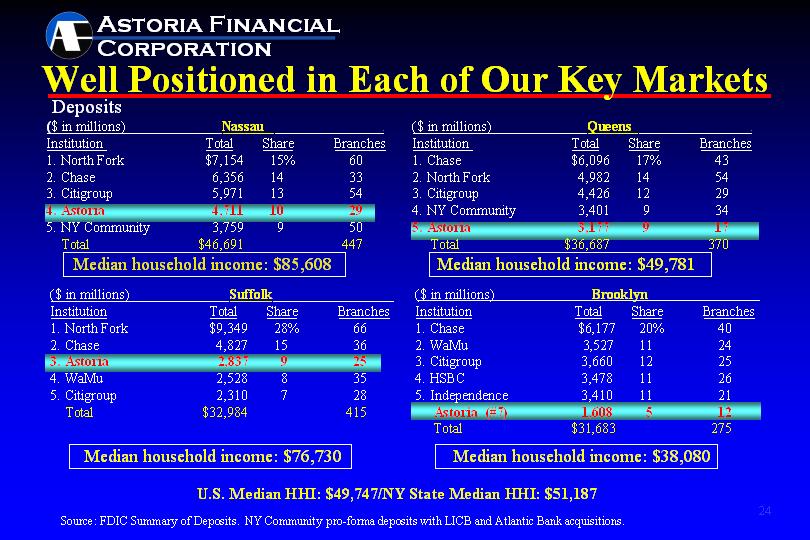
Well Positioned in Each of Our Key Markets |
Deposits |
($ in millions) |
| Nassau |
|
|
|
| ||||
| ||||||||||
Institution |
| Total |
| Share |
| Branches |
| |||
|
|
|
| |||||||
1. North Fork |
| $ | 7,154 |
|
| 15 | % |
| 60 |
|
2. Chase |
|
| 6,356 |
|
| 14 |
|
| 33 |
|
3. Citigroup |
|
| 5,971 |
|
| 13 |
|
| 54 |
|
4. Astoria |
|
| 4,711 |
|
| 10 |
|
| 29 |
|
5. NY Community |
|
| 3,759 |
|
| 9 |
|
| 50 |
|
Total |
| $ | 46,691 |
|
|
|
|
| 447 |
|
Median household income: $85,608
($ in millions) |
| Suffolk |
|
|
|
| ||||
| ||||||||||
Institution |
| Total |
| Share |
| Branches |
| |||
|
|
|
| |||||||
1. North Fork |
| $ | 9,349 |
|
| 28 | % |
| 66 |
|
2. Chase |
|
| 4,827 |
|
| 15 |
|
| 36 |
|
3. Astoria |
|
| 2,837 |
|
| 9 |
|
| 25 |
|
4. WaMu |
|
| 2,528 |
|
| 8 |
|
| 35 |
|
5. Citigroup |
|
| 2,310 |
|
| 7 |
|
| 28 |
|
Total |
| $ | 32,984 |
|
|
|
|
| 415 |
|
Median household income: $76,730
($ in millions) |
| Queens |
|
|
|
| ||||
| ||||||||||
Institution |
| Total |
| Share |
| Branches |
| |||
|
|
|
| |||||||
1. Chase |
| $ | 6,096 |
|
| 17 | % |
| 43 |
|
2. North Fork |
|
| 4,982 |
|
| 14 |
|
| 54 |
|
3. Citigroup |
|
| 4,426 |
|
| 12 |
|
| 29 |
|
4. NY Community |
|
| 3,401 |
|
| 9 |
|
| 34 |
|
5. Astoria |
|
| 3,177 |
|
| 9 |
|
| 17 |
|
Total |
| $ | 36,687 |
|
|
|
|
| 370 |
|
Median household income: $49,781
($ in millions) |
| Brooklyn |
|
|
|
| ||||
| ||||||||||
Institution |
| Total |
| Share |
| Branches |
| |||
|
|
|
| |||||||
1. Chase |
| $ | 6,177 |
|
| 20 | % |
| 40 |
|
2. WaMu |
|
| 3,527 |
|
| 11 |
|
| 24 |
|
3. Citigroup |
|
| 3,660 |
|
| 12 |
|
| 25 |
|
4. HSBC |
|
| 3,478 |
|
| 11 |
|
| 26 |
|
5. Independence |
|
| 3,410 |
|
| 11 |
|
| 21 |
|
Astoria (#7) |
|
| 1,608 |
|
| 5 |
|
| 12 |
|
Total |
| $ | 31,683 |
|
|
|
|
| 275 |
|
Median household income: $38,080
U.S. Median HHI: $49,747/NY State Median HHI: $51,187
Source: FDIC Summary of Deposits. NY Community pro-forma deposits with LICB and Atlantic Bank acquisitions.
24
[LOGO OF ASTORIA FINANCIAL CORPORATION]
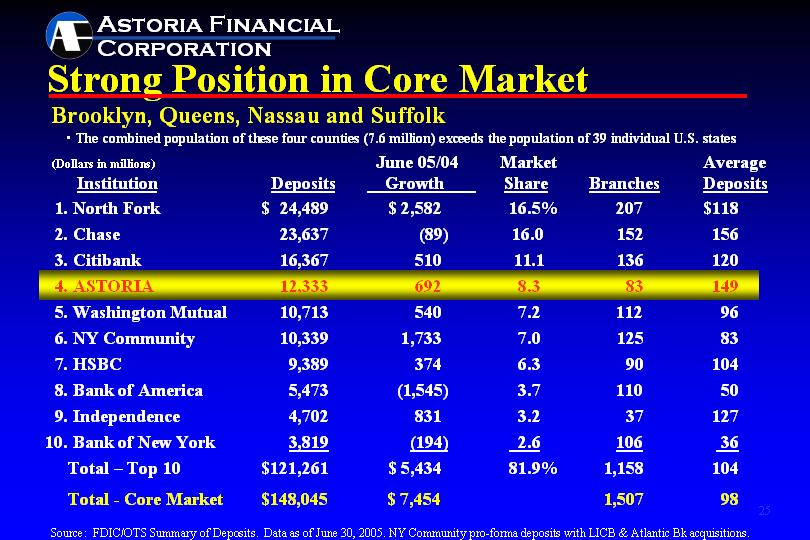
Strong Position in Core Market | ||
Brooklyn, Queens, Nassau and Suffolk | ||
|
|
|
| • | The combined population of these four counties (7.6 million) exceeds the population of 39 individual U.S. states |
(Dollars in millions) |
| Deposits |
| June 05/04 |
| Market |
| Branches |
| Average |
| |||||
|
|
|
|
|
| |||||||||||
1. North Fork |
| $ | 24,489 |
| $ | 2,582 |
|
| 16.5 | % |
| 207 |
| $ | 118 |
|
2. Chase |
|
| 23,637 |
|
| (89 | ) |
| 16.0 |
|
| 152 |
|
| 156 |
|
3. Citibank |
|
| 16,367 |
|
| 510 |
|
| 11.1 |
|
| 136 |
|
| 120 |
|
4. ASTORIA |
|
| 12,333 |
|
| 692 |
|
| 8.3 |
|
| 83 |
|
| 149 |
|
5. Washington Mutual |
|
| 10,713 |
|
| 540 |
|
| 7.2 |
|
| 112 |
|
| 96 |
|
6. NY Community |
|
| 10,339 |
|
| 1,733 |
|
| 7.0 |
|
| 125 |
|
| 83 |
|
7. HSBC |
|
| 9,389 |
|
| 374 |
|
| 6.3 |
|
| 90 |
|
| 104 |
|
8. Bank of America |
|
| 5,473 |
|
| (1,545 | ) |
| 3.7 |
|
| 110 |
|
| 50 |
|
9. Independence |
|
| 4,702 |
|
| 831 |
|
| 3.2 |
|
| 37 |
|
| 127 |
|
10. Bank of New York |
|
| 3,819 |
|
| (194 | ) |
| 2.6 |
|
| 106 |
|
| 36 |
|
|
|
|
|
|
|
| ||||||||||
Total – Top 10 |
| $ | 121,261 |
| $ | 5,434 |
|
| 81.9 | % |
| 1,158 |
|
| 104 |
|
Total - Core Market |
| $ | 148,045 |
| $ | 7,454 |
|
|
|
|
| 1,507 |
|
| 98 |
|
Source: FDIC/OTS Summary of Deposits. Data as of June 30, 2005. NY Community pro-forma deposits with LICB & Atlantic Bk acquisitions.
25
[LOGO OF ASTORIA FINANCIAL CORPORATION]
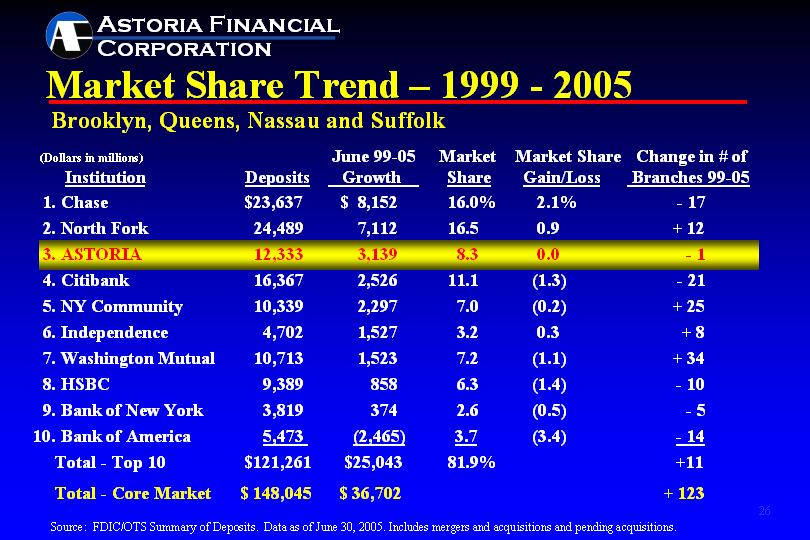
Market Share Trend – 1999 - 2005 |
Brooklyn, Queens, Nassau and Suffolk |
(Dollars in millions) |
| Deposits |
| June 99-05 |
| Market |
| Market Share |
| Change in # of |
| |||||
|
|
|
|
|
| |||||||||||
1. Chase |
| $ | 23,637 |
| $ | 8,152 |
|
| 16.0 | % |
| 2.1 | % |
| - 17 |
|
2. North Fork |
|
| 24,489 |
|
| 7,112 |
|
| 16.5 |
|
| 0.9 |
|
| + 12 |
|
3. ASTORIA |
|
| 12,333 |
|
| 3,139 |
|
| 8.3 |
|
| 0.0 |
|
| - 1 |
|
4. Citibank |
|
| 16,367 |
|
| 2,526 |
|
| 11.1 |
|
| (1.3 | ) |
| - 21 |
|
5. NY Community |
|
| 10,339 |
|
| 2,297 |
|
| 7.0 |
|
| (0.2 | ) |
| + 25 |
|
6. Independence |
|
| 4,702 |
|
| 1,527 |
|
| 3.2 |
|
| 0.3 |
|
| + 8 |
|
7. Washington Mutual |
|
| 10,713 |
|
| 1,523 |
|
| 7.2 |
|
| (1.1 | ) |
| + 34 |
|
8. HSBC |
|
| 9,389 |
|
| 858 |
|
| 6.3 |
|
| (1.4 | ) |
| - 10 |
|
9. Bank of New York |
|
| 3,819 |
|
| 374 |
|
| 2.6 |
|
| (0.5 | ) |
| - 5 |
|
10. Bank of America |
|
| 5,473 |
|
| (2,465 | ) |
| 3.7 |
|
| (3.4 | ) |
| - 14 |
|
|
|
|
|
|
|
|
|
| ||||||||
Total - Top 10 |
| $ | 121,261 |
| $ | 25,043 |
|
| 81.9 | % |
|
|
|
| +11 |
|
Total - Core Market |
| $ | 148,045 |
| $ | 36,702 |
|
|
|
|
|
|
|
| + 123 |
|
Source: FDIC/OTS Summary of Deposits. Data as of June 30, 2005. Includes mergers and acquisitions and pending acquisitions.
26
[LOGO OF ASTORIA FINANCIAL CORPORATION]
Sales Initiatives – PEAK Process |
Performance based on Enthusiasm, Actions and Knowledge |
| • | A “needs” based approach to sales rather than “product” based approach |
|
|
|
| • | Highly interactive program – daily and weekly meetings create a focus that is shared throughout the branch network |
|
|
|
| • | Incentives for strong performance, both individual and team |
27
[LOGO OF ASTORIA FINANCIAL CORPORATION]
Customer Satisfaction Survey |
Key Findings: Favorably Positioned Against Competitors |
• | 71% of Astoria customers are highly satisfied | |
|
|
|
• | 71% of Astoria customers are highly likely to recommend Astoria to friend/family member | |
|
|
|
• | Satisfaction with the branch is by far the strongest driver of overall satisfaction | |
|
| |
| – | 86% of Astoria customers are highly satisfied with quality of branch service |
28
[LOGO OF ASTORIA FINANCIAL CORPORATION]
Deposit Growth - Core |
[CHART APPEARS HERE]
29
[LOGO OF ASTORIA FINANCIAL CORPORATION]
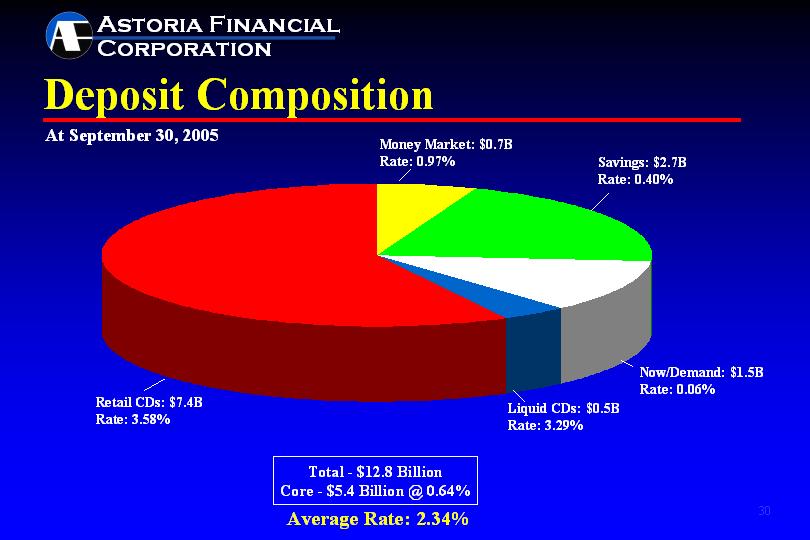
Deposit Composition |
At September 30, 2005 |
|
[CHART APPEARS HERE] |
|
Total - $12.8 Billion |
Core - $5.4 Billion @ 0.64% |
|
Average Rate: 2.34% |
30
[LOGO OF ASTORIA FINANCIAL CORPORATION]
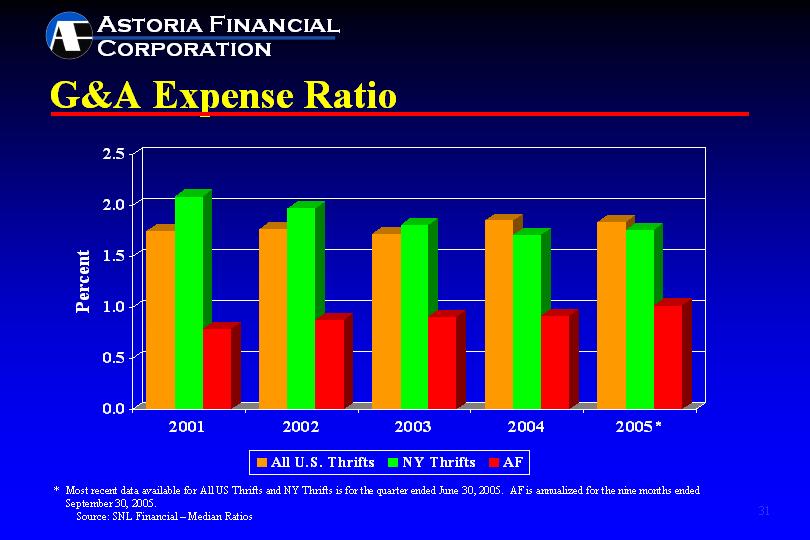
G&A Expense Ratio |
[CHART APPEARS HERE]
31
[LOGO OF ASTORIA FINANCIAL CORPORATION]
Goodwill Claim Update |
• | One of the industry’s largest goodwill litigation claims | |
|
|
|
| – | $785 million of original supervisory goodwill created |
|
| (LISB = $625 million, Fidelity NY = $160 million) |
|
|
|
| – | $635 million of supervisory goodwill written off |
|
| (LISB = $500 million, Fidelity NY = $135 million) |
|
|
|
• | U.S. Court of Federal Claims awarded AF damages of $436 million on September 15, 2005 in the LISB case | |
|
|
|
| – | Award likely to be appealed by government |
32
[LOGO OF ASTORIA FINANCIAL CORPORATION]
Why Invest in Astoria Financial? | ||
|
|
|
• | Strong balance sheet – superior asset quality | |
|
|
|
• | Attractive banking franchise | |
|
|
|
| • | Dominant deposit market share in core market |
|
|
|
• | Superior operating efficiency | |
|
|
|
• | Well capitalized | |
|
|
|
• | Proactive Capital Management | |
|
|
|
| • | Stock repurchase program in place |
|
|
|
| • | 28% compounded annual growth in dividend* |
|
|
|
| • | $1.9 billion returned to shareholders in the past 8+ years |
|
|
|
| ||
| * | CAGR from 1995, commencement of quarterly dividend, to 3Q05 annualized. |
33
[LOGO OF ASTORIA FINANCIAL CORPORATION]
AF: A Record of Enhancing Shareholder Value |
Addendum
34
[LOGO OF ASTORIA FINANCIAL CORPORATION]
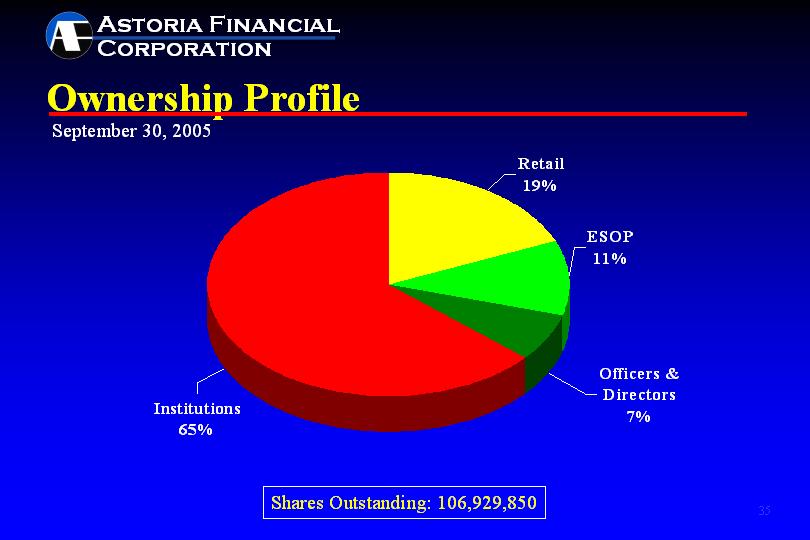
Ownership Profile |
September 30, 2005 |
|
[CHART APPEARS HERE] |
|
Shares Outstanding: 106,929,850 |
35
[LOGO OF ASTORIA FINANCIAL CORPORATION]
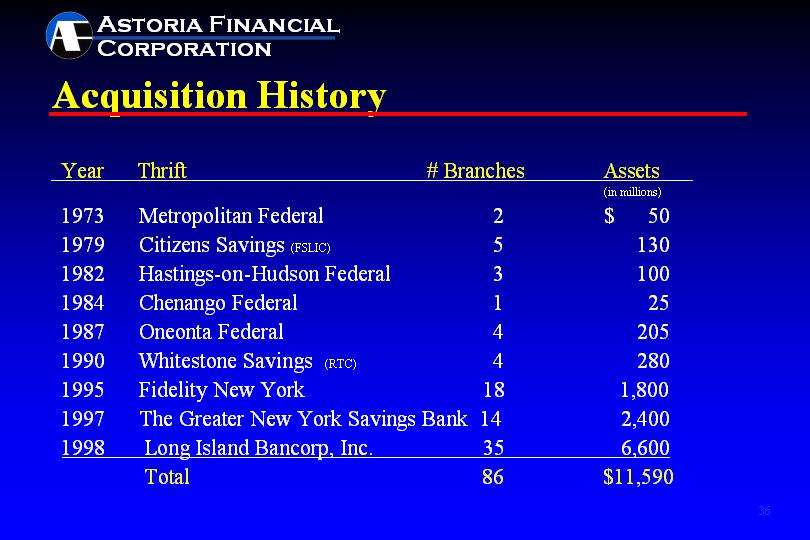
Acquisition History |
Year | Thrift | # Branches | Assets |
| ||||||
| ||||||||||
|
|
|
|
|
|
|
| (in millions) |
| |
1973 |
|
| Metropolitan Federal |
|
| 2 |
| $ | 50 |
|
1979 |
|
| Citizens Savings (FSLIC) |
|
| 5 |
|
| 130 |
|
1982 |
|
| Hastings-on-Hudson Federal |
|
| 3 |
|
| 100 |
|
1984 |
|
| Chenango Federal |
|
| 1 |
|
| 25 |
|
1987 |
|
| Oneonta Federal |
|
| 4 |
|
| 205 |
|
1990 |
|
| Whitestone Savings (RTC) |
|
| 4 |
|
| 280 |
|
1995 |
|
| Fidelity New York |
|
| 18 |
|
| 1,800 |
|
1997 |
|
| The Greater New York Savings Bank |
|
| 14 |
|
| 2,400 |
|
1998 |
|
| Long Island Bancorp, Inc. |
|
| 35 |
|
| 6,600 |
|
| ||||||||||
|
|
| Total |
|
| 86 |
| $ | 11,590 |
|
36
[LOGO OF ASTORIA FINANCIAL CORPORATION]
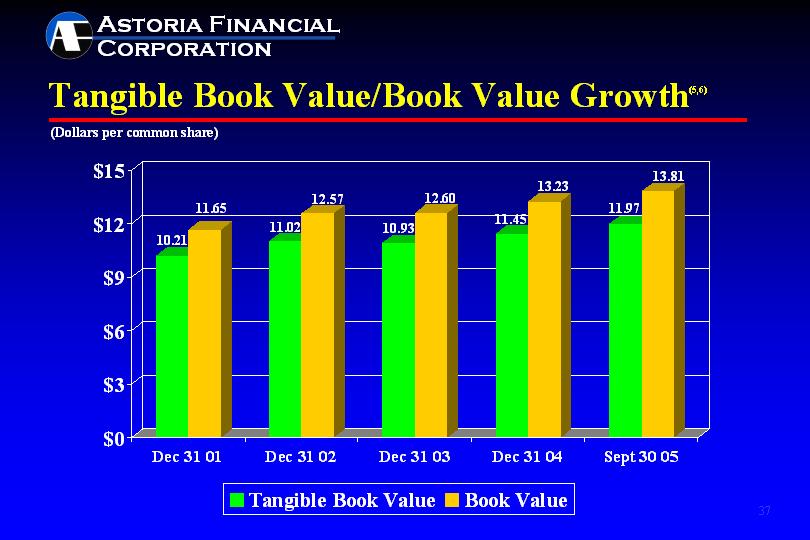
Tangible Book Value/Book Value Growth(5,6) |
[CHART APPEARS HERE]
37
[LOGO OF ASTORIA FINANCIAL CORPORATION]
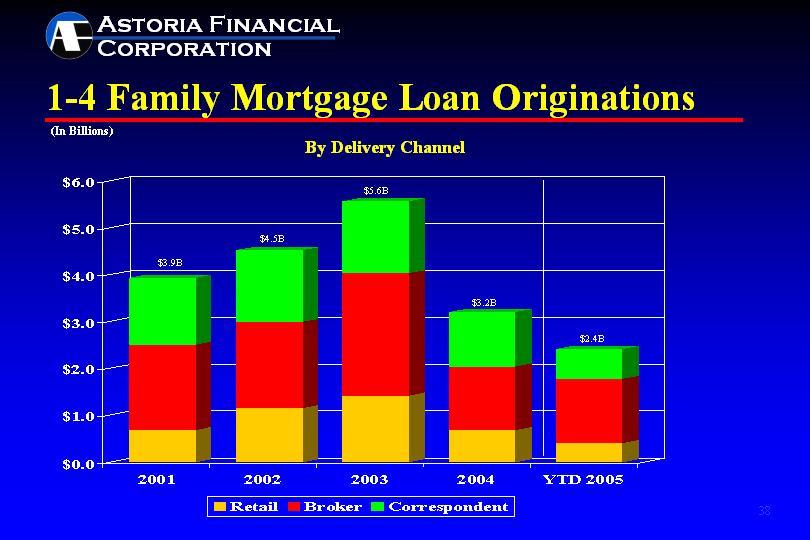
1-4 Family Mortgage Loan Originations |
[CHART APPEARS HERE]
38
[LOGO OF ASTORIA FINANCIAL CORPORATION]
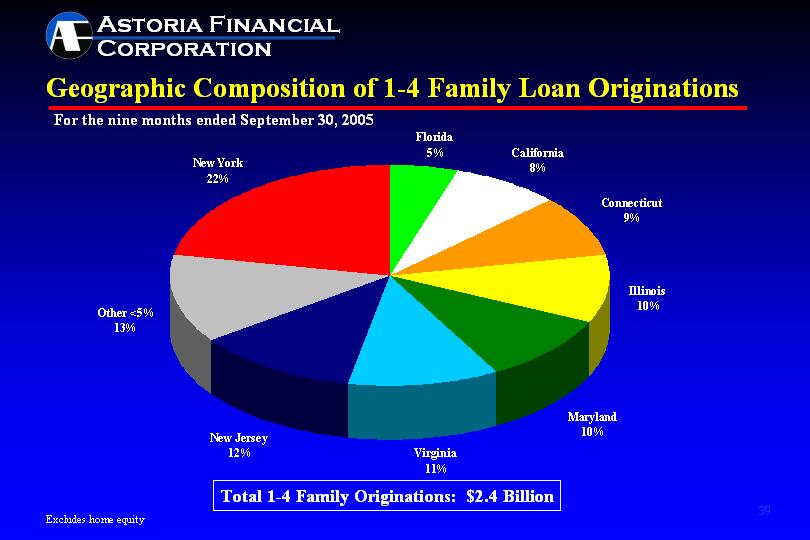
Geographic Composition of 1-4 Family Loan Originations |
[CHART APPEARS HERE]
Total 1-4 Family Originations: $2.4 Billion
39
[LOGO OF ASTORIA FINANCIAL CORPORATION]
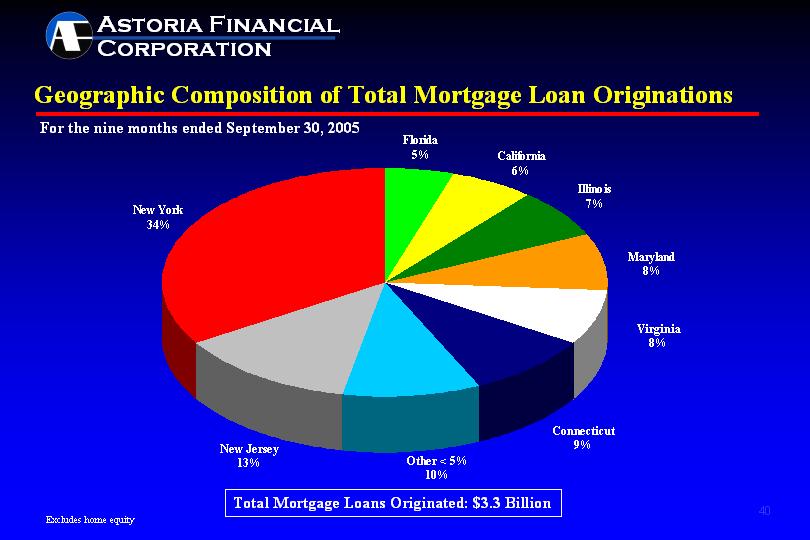
Geographic Composition of Total Mortgage Loan Originations |
[CHART APPEARS HERE]
Total Mortgage Loans Originated: $3.3 Billion
40
[LOGO OF ASTORIA FINANCIAL CORPORATION]
1-4 Family Delinquency Ratios: AF vs. MBA |
[CHART APPEARS HERE]
Source: MBA National Deliquency Survey. Beginning with 3Q02, MBA statistics for conventional loans excludes sub-prime loans.
41
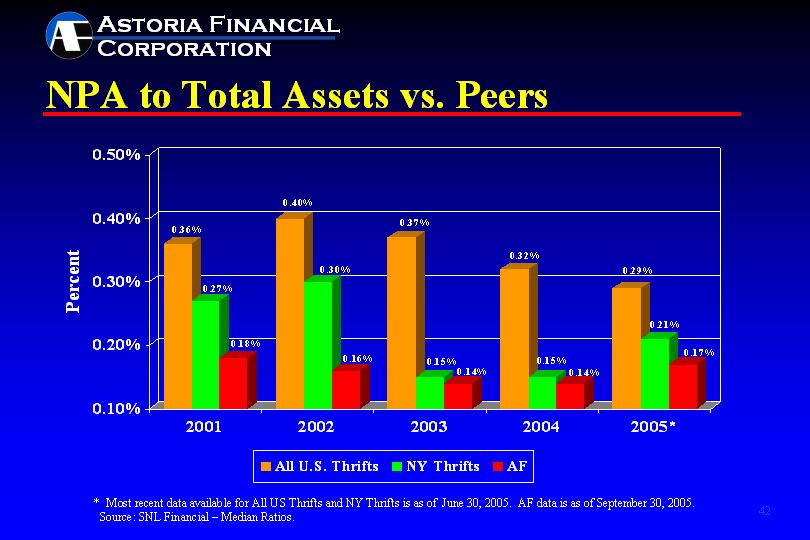
[LOGO OF ASTORIA FINANCIAL CORPORATION]
NPA to Total Assets vs. Peers |
[CHART APPEARS HERE]
42
[LOGO OF ASTORIA FINANCIAL CORPORATION]
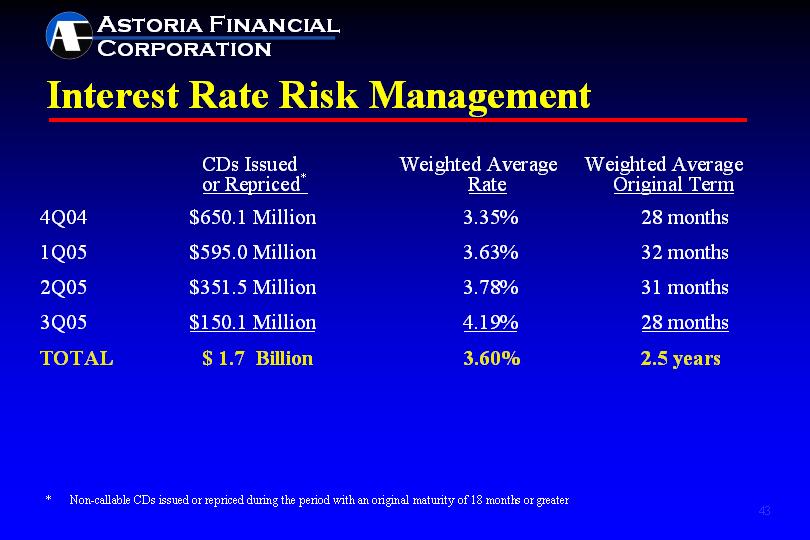
Interest Rate Risk Management |
|
| CDs Issued |
| Weighted Average |
| Weighted Average |
| |||
|
|
|
|
| ||||||
4Q04 |
| $ | 650.1 Million |
|
| 3.35% |
|
| 28 months |
|
1Q05 |
| $ | 595.0 Million |
|
| 3.63% |
|
| 32 months |
|
2Q05 |
| $ | 351.5 Million |
|
| 3.78% |
|
| 31 months |
|
3Q05 |
| $ | 150.1 Million |
|
| 4.19% |
|
| 28 months |
|
|
|
|
|
| ||||||
TOTAL |
| $ | 1.7 Billion |
|
| 3.60% |
|
| 2.5 years |
|
* | Non-callable CDs issued or repriced during the period with an original maturity of 18 months or greater |
43
[LOGO OF ASTORIA FINANCIAL CORPORATION]
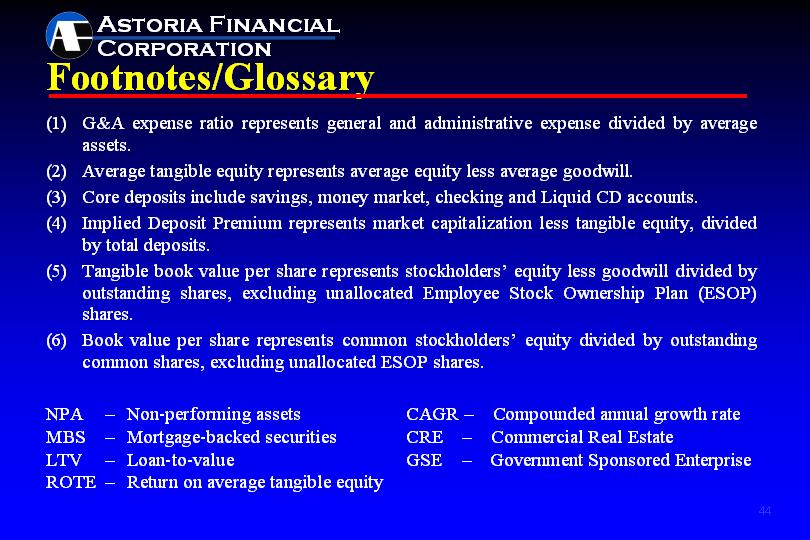
Footnotes/Glossary | |
|
|
(1) | G&A expense ratio represents general and administrative expense divided by average assets. |
|
|
(2) | Average tangible equity represents average equity less average goodwill. |
|
|
(3) | Core deposits include savings, money market, checking and Liquid CD accounts. |
|
|
(4) | Implied Deposit Premium represents market capitalization less tangible equity, divided by total deposits. |
|
|
(5) | Tangible book value per share represents stockholders’ equity less goodwill divided by outstanding shares, excluding unallocated Employee Stock Ownership Plan (ESOP) shares. |
|
|
(6) | Book value per share represents common stockholders’ equity divided by outstanding common shares, excluding unallocated ESOP shares. |
NPA | – | Non-performing assets |
| CAGR | – | Compounded annual growth rate |
MBS | – | Mortgage-backed securities |
| CRE | – | Commercial Real Estate |
LTV | – | Loan-to-value |
| GSE | – | Government Sponsored Enterprise |
ROTE | – | Return on average tangible equity |
|
|
|
|
44
[LOGO OF ASTORIA FINANCIAL CORPORATION]
|
LONG ISLAND’S PREMIER COMMUNITY BANK |
|
www.astoriafederal.com |