| 2017 Annual Meeting of Stockholders May 23, 2017 Filed by Sterling Bancorp Pursuant to Rule 425 under the Securities Act of 1933 and deemed filed pursuant to Rule 14a-12 under the Securities Exchange Act of 1934 Subject Company: Astoria Financial Corporation (Commission File No. 001-11967) STERLING BANCORP |
| PAGE 2 Forward-Looking Statements and Associated Risk FactorsWe make statements in this presentation regarding our outlook or expectations for earnings, revenues, expenses and/or other matters regarding or affecting us that are forward-looking statements within the meaning of the Private Securities Litigation Reform Act of 1995. Forward-looking statements are typically identified by words such as “believe,” “expect,” “anticipate,” “intend,” “outlook,” “target,” “estimate,” “forecast,” “project,” “continue,” “positions,” “prospects,” by future conditional verbs such as “will,” “would,” “should,” “could,” or “may,” or by variations of such words or by similar expressions. These forward-looking statements are subject to numerous assumptions, risks and uncertainties which change over time. In addition to factors previously disclosed in reports filed with the Securities and Exchange Commission, the following factors, among others, could cause our actual results to differ materially from those contemplated by such forward-looking statements: the ability to obtain regulatory approvals and meet other closing conditions to the merger with Astoria Financial Corporation (“Astoria”) merger, including approval by Sterling Bancorp and Astoria stockholders, on the expected terms and schedule; delay in closing the Astoria merger, difficulties and delays in integrating Astoria’s business or fully realizing cost savings and other benefits; business disruption following the proposed transaction; to grow revenues faster than we grow expenses; a deterioration in general economic conditions; either nationally, internationally, or in our market areas, including extended declines in the real estate market and constrained financial markets; inflation; the effects of, and changes in, trade; changes in asset quality and credit risk; introduction, withdrawal, success and timing of business initiatives; capital management activities; including our ability to effectively deploy recently raised capital; customer disintermediation; and the success of Sterling Bancorp in managing those risks. Other factors that could cause Sterling Bancorp’s actual results to differ from those indicated in forward-looking statements are included in the “Risk Factors” section of Sterling Bancorp’s filings with the Securities and Exchange Commission. The forward-looking statements speak only as of the date they are made and we undertake no obligation to update these forward-looking statements to reflect events or circumstances that occur after the date on which such statements were made. Additional information, including Sterling Bancorp's filings with the Securities and Exchange Commission, can be accessed through the Company's investor relations website at www.sterlingbancorp.com. |

| PAGE 3 Sterling Bancorp Today • Leading regional bank providing services and solutions to business owners, their families and consumers in the Greater New York metropolitan region • Successful track record of merger activity ▪ Gotham Bank of New York (2012) ▪ Legacy Sterling Bancorp (2013) ▪ Hudson Valley Holding Corp (2015) ▪ Astoria Financial Corporation (pending) • Positioned among top 10 regional banks in our market ▪ Total assets $14.7 billion ▪ Total loans $9.8 billion ▪ Total deposits $10.3 billion • Established infrastructure for profitable growth ▪ Diversified businesses with differentiated distribution strategy ▪ 29 commercial relationship teams ▪ 42 financial centers |
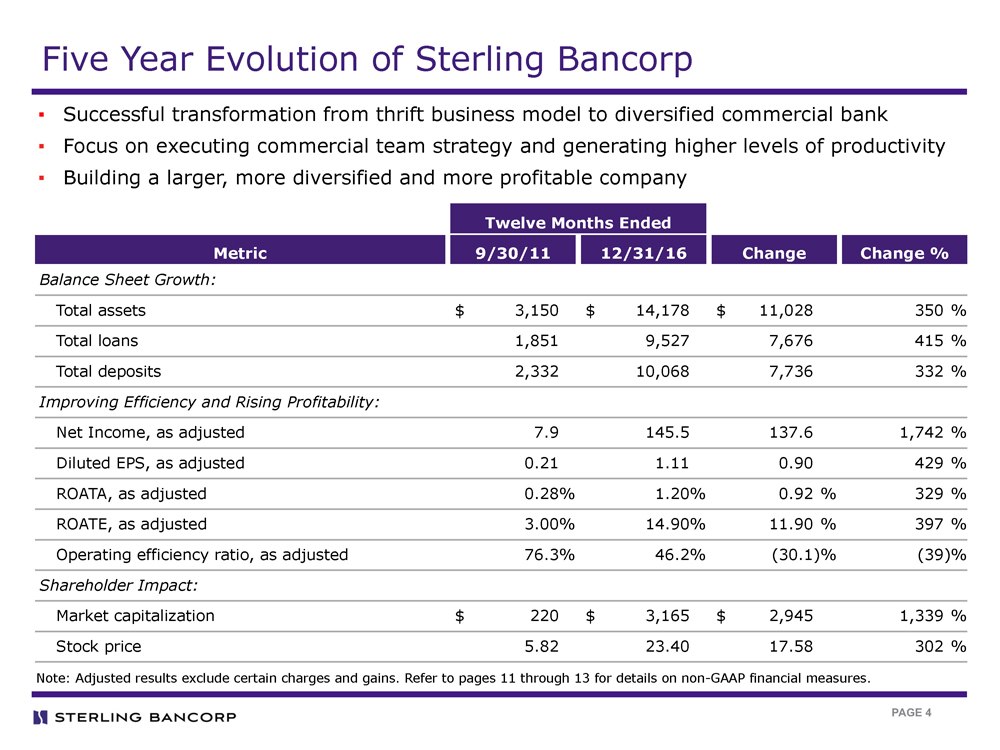
| PAGE 4 Five Year Evolution of Sterling Bancorp ▪ Successful transformation from thrift business model to diversified commercial bank ▪ Focus on executing commercial team strategy and generating higher levels of productivity ▪ Building a larger, more diversified and more profitable company Twelve Months Ended Metric 9/30/11 12/31/16 Change Change %Balance Sheet Growth:Total assets $ 3,150 $ 14,178 $ 11,028 350 % Total loans 1,851 9,527 7,676 415 % Total deposits 2,332 10,068 7,736 332 %Improving Efficiency and Rising Profitability:Net Income, as adjusted 7.9 145.5 137.6 1,742 % Diluted EPS, as adjusted 0.21 1.11 0.90 429 % ROATA, as adjusted 0.28% 1.20% 0.92 % 329 % ROATE, as adjusted 3.00% 14.90% 11.90 % 397 % Operating efficiency ratio, as adjusted 76.3% 46.2% (30.1)% (39)%Shareholder Impact:Market capitalization $ 220 $ 3,165 $ 2,945 1,339 % Stock price 5.82 23.40 17.58 302 % Note: Adjusted results exclude certain charges and gains. Refer to pages 11 through 13 for details on non-GAAP financial measures. |
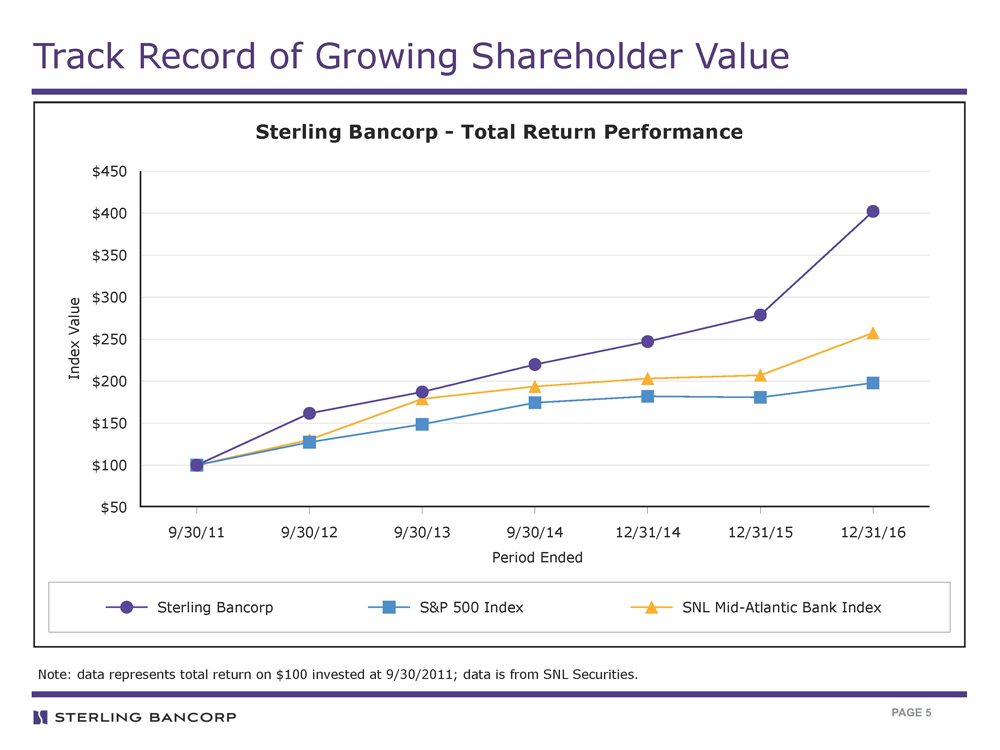
| PAGE 5 Track Record of Growing Shareholder Value Note: data represents total return on $100 invested at 9/30/2011; data is from SNL Securities. Sterling Bancorp S&P 500 Index SNL Mid-Atlantic Bank Index Sterling Bancorp - Total Return Performance $450 $400 $350 $300 $250 $200 $150 $100 $50 Index Value 9/30/11 9/30/12 9/30/13 9/30/14 12/31/14 12/31/15 12/31/16 Period Ended |

| PAGE 6 ▪ Annualized growth rate of 15.6%(1) in total portfolio loans ▪ Diversified loan portfolio with 89.7% consisting of commercial asset classes(2) ▪ Total commercial loans Y-o-Y growth rate of 24.8% Traditional C&I: 14.7% Commercial Finance: 29.1% Multi-Family: 10.3% CRE: 33.2% ADC: 2.4% Consumer: 3.0% Resi Mtg: 7.3% Strong Loan Growth in 2016 Total Portfolio Loans: $9.5 B Yield on Loans: 4.57%(4) Loan Composition Portfolio Loan Balances (1) Represents annualized growth rates for the period beginning September 30, 2016 through December 31, 2016. (2) Commercial loans include traditional C&I, commercial finance, CRE, multifamily and ADC. (3) Includes asset-based lending, payroll finance, warehouse lending, factored receivables, equipment financing and public sector finance loans. (4) Represents loan portfolio yield for the three months ended December 31, 2016. $10,000 $9,000 $8,000 $7,000 $6,000 $5,000 12/31/15 9/30/16 12/31/16 $7,659 $8,745 $9,267 ($ in millions) (3) Average balance |
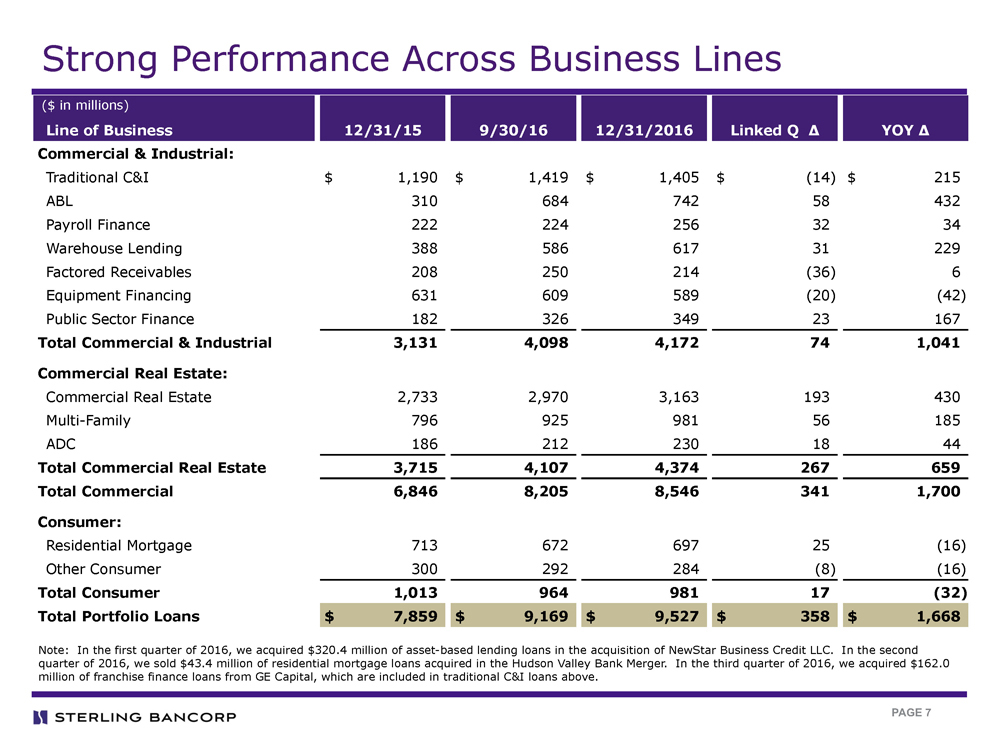
| PAGE 7 Strong Performance Across Business Lines Line of Business 12/31/15 9/30/16 12/31/2016 Linked Q Δ YOY Δ Commercial & Industrial: Traditional C&I $ 1,190 $ 1,419 $ 1,405 $ (14) $ 215 ABL 310 684 742 58 432 Payroll Finance 222 224 256 32 34 Warehouse Lending 388 586 617 31 229 Factored Receivables 208 250 214 (36) 6 Equipment Financing 631 609 589 (20) (42) Public Sector Finance 182 326 349 23 167 Total Commercial & Industrial 3,131 4,098 4,172 74 1,041 Commercial Real Estate: Commercial Real Estate 2,733 2,970 3,163 193 430 Multi-Family 796 925 981 56 185 ADC 186 212 230 18 44 Total Commercial Real Estate 3,715 4,107 4,374 267 659 Total Commercial 6,846 8,205 8,546 341 1,700 Consumer: Residential Mortgage 713 672 697 25 (16) Other Consumer 300 292 284 (8) (16) Total Consumer 1,013 964 981 17 (32) Total Portfolio Loans $ 7,859 $ 9,169 $ 9,527 $ 358 $ 1,668 ($ in millions) Note: In the first quarter of 2016, we acquired $320.4 million of asset-based lending loans in the acquisition of NewStar Business Credit LLC. In the second quarter of 2016, we sold $43.4 million of residential mortgage loans acquired in the Hudson Valley Bank Merger. In the third quarter of 2016, we acquired $162.0 million of franchise finance loans from GE Capital, which are included in traditional C&I loans above. |
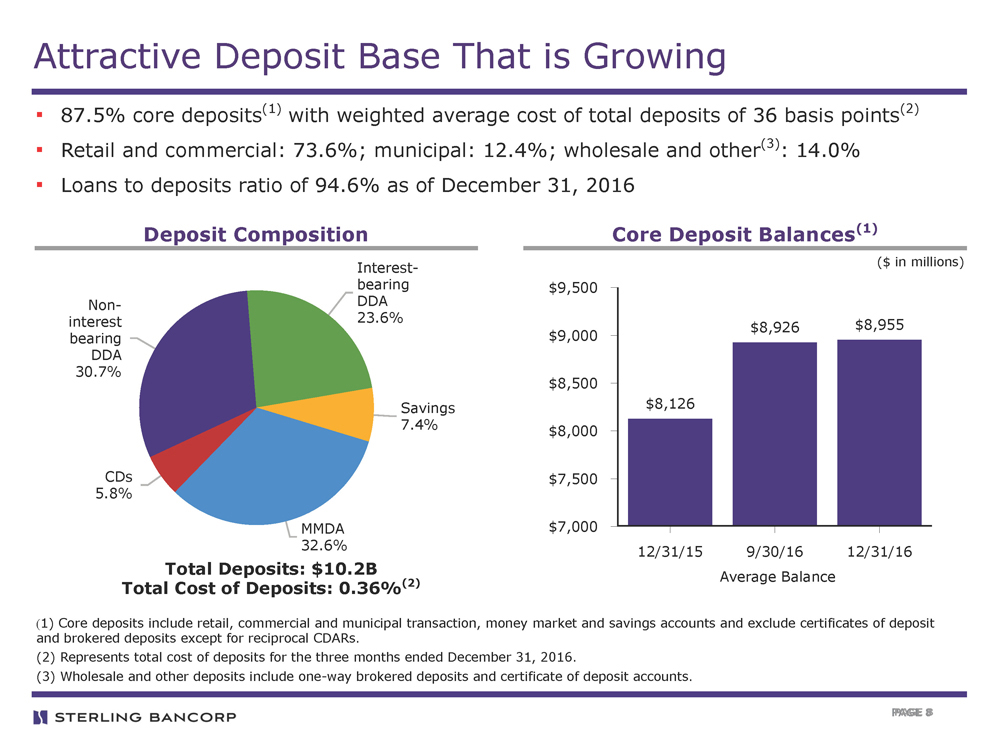
| PAGE 8 ▪ 87.5% core deposits(1) with weighted average cost of total deposits of 36 basis points(2) ▪ Retail and commercial: 73.6%; municipal: 12.4%; wholesale and other(3): 14.0% ▪ Loans to deposits ratio of 94.6% as of December 31, 2016 Attractive Deposit Base That is Growing Total Deposits: $10.2B Total Cost of Deposits: 0.36%(2) PAGE 8 Deposit Composition Core Deposit Balances(1) (1) Core deposits include retail, commercial and municipal transaction, money market and savings accounts and exclude certificates of deposit and brokered deposits except for reciprocal CDARs. (2) Represents total cost of deposits for the three months ended December 31, 2016. (3) Wholesale and other deposits include one-way brokered deposits and certificate of deposit accounts. Noninterest bearing DDA 30.7% Interestbearing DDA 23.6% Savings 7.4% MMDA 32.6% CDs 5.8% $9,500 $9,000 $8,500 $8,000 $7,500 $7,000 12/31/15 9/30/16 12/31/16 Average Balance $8,126 $8,926 $8,955 ($ in millions) |
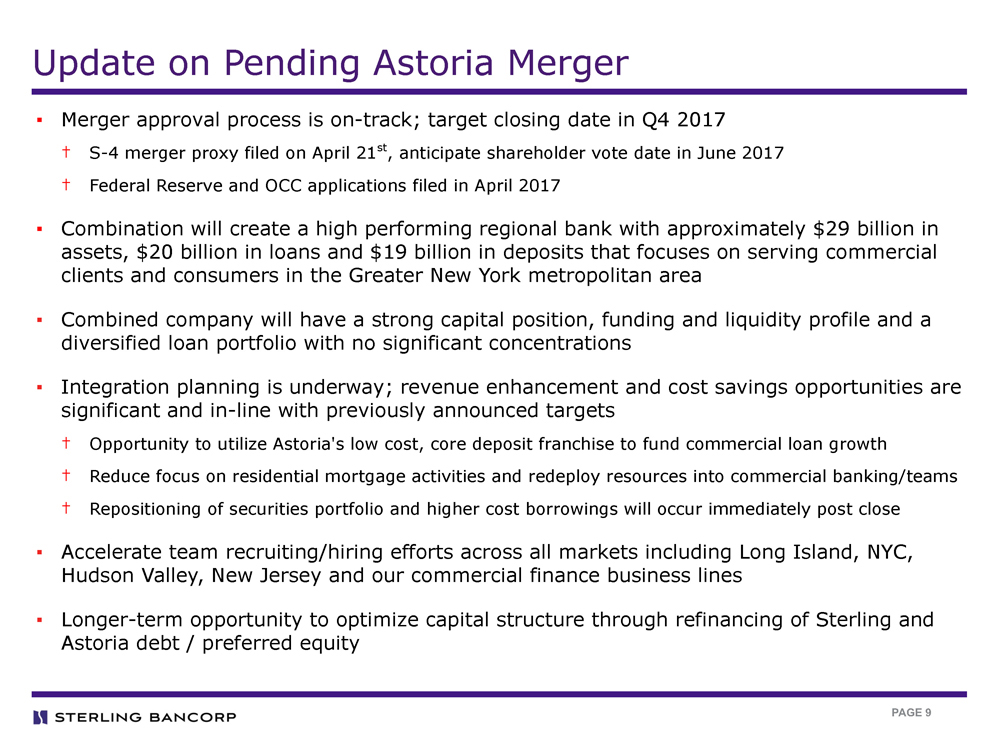
| PAGE 9 Update on Pending Astoria Merger ▪ Merger approval process is on-track; target closing date in Q4 2017 † S-4 merger proxy filed on April 21st, anticipate shareholder vote date in June 2017 † Federal Reserve and OCC applications filed in April 2017 ▪ Combination will create a high performing regional bank with approximately $29 billion in assets, $20 billion in loans and $19 billion in deposits that focuses on serving commercial clients and consumers in the Greater New York metropolitan area ▪ Combined company will have a strong capital position, funding and liquidity profile and a diversified loan portfolio with no significant concentrations ▪ Integration planning is underway; revenue enhancement and cost savings opportunities are significant and in-line with previously announced targets † Opportunity to utilize Astoria's low cost, core deposit franchise to fund commercial loan growth † Reduce focus on residential mortgage activities and redeploy resources into commercial banking/teams † Repositioning of securities portfolio and higher cost borrowings will occur immediately post close ▪ Accelerate team recruiting/hiring efforts across all markets including Long Island, NYC, Hudson Valley, New Jersey and our commercial finance business lines ▪ Longer-term opportunity to optimize capital structure through refinancing of Sterling and Astoria debt / preferred equity |
| PAGE 10 Key Themes for 2017 and Beyond ▪ Strong momentum in GAAP and adjusted earnings and profitability metrics ▪ Operating efficiencies continue to be realized through multiple strategies ▪ Revenue growth opportunities are significant ▪ Continued investment in commercial banking, commercial finance, and fee-based businesses ▪ Focus on deposit growth opportunities to allow continued consolidation of financial centers ▪ Maintain strong credit quality ▪ Strategic actions including pending Astoria merger position us for continued high performance, earnings growth and higher profitability ▪ Astoria integration planning is underway and on-track for anticipated Q4 2017 closing ▪Execution is the key |
| PAGE 11 Adjusted Information (non-GAAP financial information) ▪ In this presentation, we have referred to non-GAAP/adjusted results to help illustrate the impact of certain types of items, such as the following: † The impact of the securities gains and losses, the net gain on the sale of the trust division, merger-related expenses and charge for asset write-downs, retention and severance, pension plan settlement, extinguishment of borrowings and amortization of non-compete agreements to our net income. † Our tangible equity (common stockholders’ equity, less intangible assets, other than servicing rights). † The impact of securities gains and losses, the net gain on the sale of the trust division, non-taxable income, merger expenses, charges for asset write-downs, banking systems conversions, retention and severance and changes in intangible asset amortization on our efficiency ratio (which is non-interest expense divided by total net revenue). These measures are used by management and the Board of Directors on a regular basis, in addition to our GAAP results, to facilitate the assessment of our financial performance and to assess our performance compared to our budgets and strategic plans. These non-GAAP financial measures complement our GAAP reporting and are presented below to provide investors, analysts, regulators and others information and reconciliations that we use to manage and evaluate our business each period. This information supplements our results as reported in accordance with GAAP, and should not be viewed in isolation from, or as a substitute for, our GAAP results. |
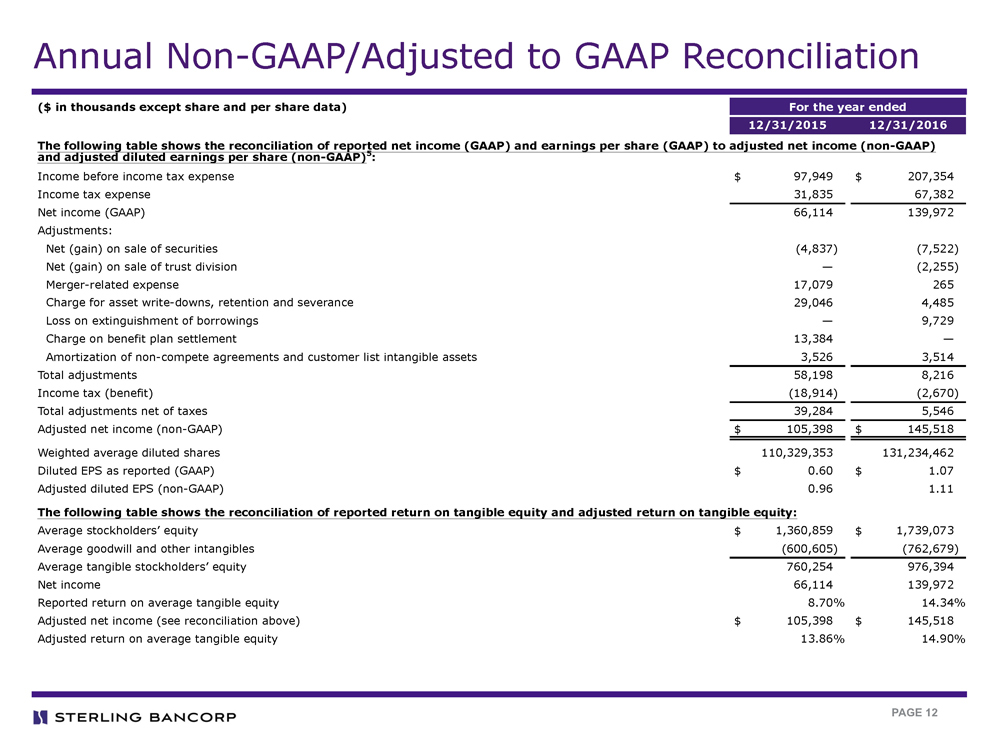
| PAGE 12 Annual Non-GAAP/Adjusted to GAAP Reconciliation ($ in thousands except share and per share data) For the year ended 12/31/2015 12/31/2016 The following table shows the reconciliation of reported net income (GAAP) and earnings per share (GAAP) to adjusted net income (non-GAAP) and adjusted diluted earnings per share (non-GAAP)5: Income before income tax expense $ 97,949 $ 207,354 Income tax expense 31,835 67,382 Net income (GAAP) 66,114 139,972 Adjustments: Net (gain) on sale of securities (4,837) (7,522) Net (gain) on sale of trust division — (2,255) Merger-related expense 17,079 265 Charge for asset write-downs, retention and severance 29,046 4,485 Loss on extinguishment of borrowings — 9,729 Charge on benefit plan settlement 13,384 — Amortization of non-compete agreements and customer list intangible assets 3,526 3,514 Total adjustments 58,198 8,216 Income tax (benefit) (18,914) (2,670) Total adjustments net of taxes 39,284 5,546 Adjusted net income (non-GAAP) $ 105,398 $ 145,518 Weighted average diluted shares 110,329,353 131,234,462 Diluted EPS as reported (GAAP) $ 0.60 $ 1.07 Adjusted diluted EPS (non-GAAP) 0.96 1.11 The following table shows the reconciliation of reported return on tangible equity and adjusted return on tangible equity: Average stockholders’ equity $ 1,360,859 $ 1,739,073 Average goodwill and other intangibles (600,605) (762,679) Average tangible stockholders’ equity 760,254 976,394 Net income 66,114 139,972 Reported return on average tangible equity 8.70% 14.34% Adjusted net income (see reconciliation above) $ 105,398 $ 145,518 Adjusted return on average tangible equity 13.86% 14.90% |
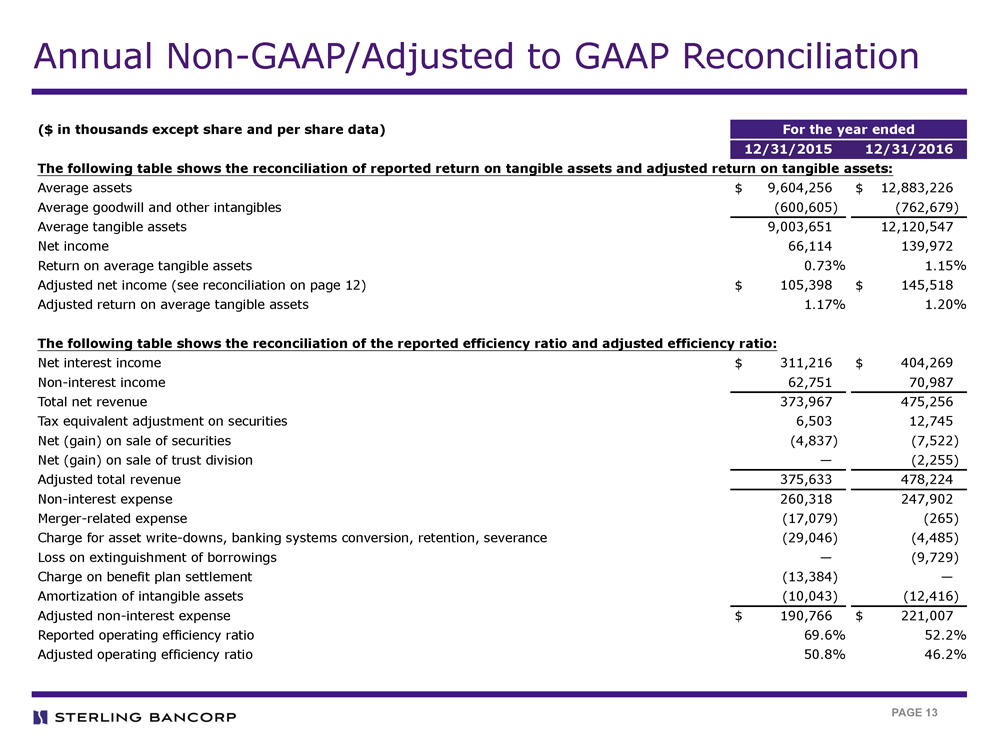
| PAGE 13 Annual Non-GAAP/Adjusted to GAAP Reconciliation ($ in thousands except share and per share data) For the year ended 12/31/2015 12/31/2016 The following table shows the reconciliation of reported return on tangible assets and adjusted return on tangible assets: Average assets $ 9,604,256 $ 12,883,226 Average goodwill and other intangibles (600,605) (762,679) Average tangible assets 9,003,651 12,120,547 Net income 66,114 139,972 Return on average tangible assets 0.73% 1.15% Adjusted net income (see reconciliation on page 12) $ 105,398 $ 145,518 Adjusted return on average tangible assets 1.17% 1.20% The following table shows the reconciliation of the reported efficiency ratio and adjusted efficiency ratio: Net interest income $ 311,216 $ 404,269 Non-interest income 62,751 70,987 Total net revenue 373,967 475,256 Tax equivalent adjustment on securities 6,503 12,745 Net (gain) on sale of securities (4,837) (7,522) Net (gain) on sale of trust division — (2,255) Adjusted total revenue 375,633 478,224 Non-interest expense 260,318 247,902 Merger-related expense (17,079) (265) Charge for asset write-downs, banking systems conversion, retention, severance (29,046) (4,485) Loss on extinguishment of borrowings — (9,729) Charge on benefit plan settlement (13,384) — Amortization of intangible assets (10,043) (12,416) Adjusted non-interest expense $ 190,766 $ 221,007 Reported operating efficiency ratio 69.6% 52.2% Adjusted operating efficiency ratio 50.8% 46.2% |
| PAGE 14 STERLING BANCORP |