
Fourth Quarter and Fiscal Year 2019 Earnings Call August 29, 2019 Exhibit 99.2
Safe Harbor Statement Safe Harbor Statement Certain statements in this presentation constitute forward-looking statements within the meaning of the Private Securities Litigation Reform Act of 1995, relating to our business and financial outlook, which are based on our current beliefs, assumptions, expectations, estimates, forecasts and projections about future events only as of the date of this presentation, and are not statements of historical fact. We make such forward-looking statements pursuant to the “safe harbor” provisions of the Private Securities Litigation Reform Act of 1995. You can identify forward-looking statements by terminology such as the use of “may,” “will,” “should,” “expects,” “plans,” “anticipates,” “believes,” “estimates,” “projects,” “intends,” “predicts,” “potential,” or “continue” and similar expressions, or the negative of those expressions. In particular, statements reflecting our guidance for fiscal year 2020 are forward-looking statements. These forward-looking statements are not guarantees of our future performance and involve risks, uncertainties, estimates and assumptions that are difficult to predict. Therefore, our actual outcomes and results may differ materially from those expressed in these forward-looking statements. You should not place undue reliance on any of these forward-looking statements. We undertake no obligation to further update any forward-looking statement to reflect new information, the occurrence of future events or circumstances or otherwise. These forward-looking statements involve risks and uncertainties including, among others, the impact of competitive products and changes to the competitive environment, changes to consumer preferences, political uncertainty in the United Kingdom and the negotiation of its exit from the European Union, consolidation of customers or the loss of a significant customer, reliance on independent distributors, general economic and financial market conditions, risks associated with our international sales and operations, our ability to manage our supply chain effectively, volatility in the cost of commodities, ingredients, freight and fuel, our ability to execute and realize cost savings initiatives, including SKU rationalization plans, the impact of our debt and our credit agreements on our financial condition and our business, our ability to manage our financial reporting and internal control system processes, potential liabilities due to legal claims, government investigations and other regulatory enforcement actions, costs incurred due to pending and future litigation, potential liability, including in connection with indemnification obligations to our current and former officers and members of our Board of Directors that may not be covered by insurance, potential liability if our products cause illness or physical harm, impairments in the carrying value of goodwill or other intangible assets, our ability to consummate divestitures, our ability to integrate past acquisitions, the availability of organic ingredients, disruption of operations at our manufacturing facilities, loss of one or more independent co-packers, disruption of our transportation systems, risks relating to the protection of intellectual property, the risk of liabilities and claims with respect to environmental matters, the reputation of our brands, our reliance on independent certification for a number of our products, and other risks detailed from time-to-time in our reports filed with the United States Securities and Exchange Commission, including our most recent Annual Report on Form 10-K and our subsequent reports on Forms 10-Q and 8-K. Non-GAAP Financial Measures This presentation and the accompanying appendix include non-GAAP financial measures, including adjusted operating income, adjusted gross margin, adjusted net income, adjusted earnings per diluted share, EBITDA, and Adjusted EBITDA. The reconciliations of these non-GAAP financial measures to the comparable GAAP financial measures are included in the appendix to this presentation. Management believes that the non-GAAP financial measures presented provide useful additional information to investors about current trends in the Company’s operations and are useful for period-over-period comparisons of operations. These non-GAAP financial measures should not be considered in isolation or as a substitute for the comparable GAAP measures. In addition, these non-GAAP measures may not be the same as similar measures provided by other companies due to potential differences in methods of calculation and items being excluded. They should be read only in connection with our financial results that are presented in accordance with GAAP.
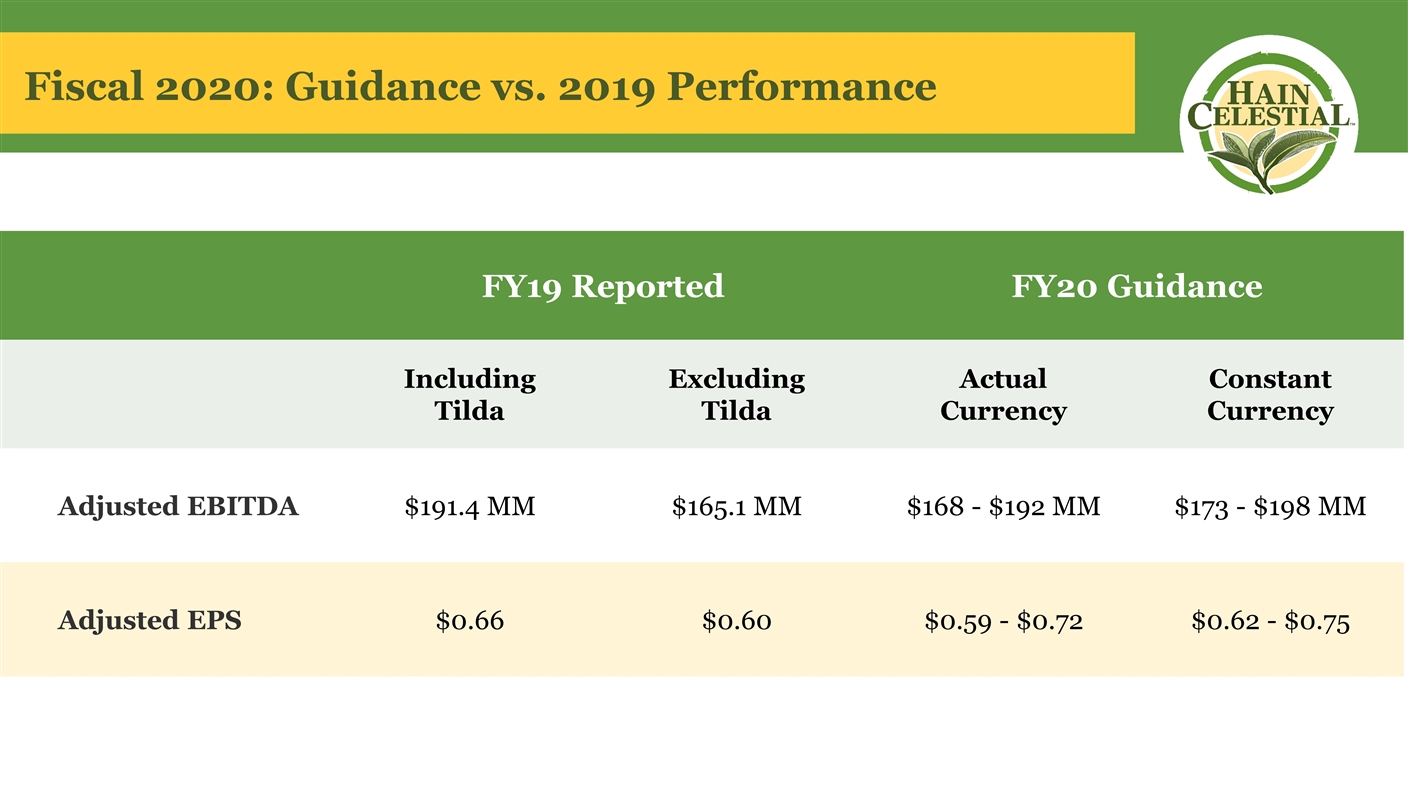
Fiscal 2020: Guidance vs. 2019 Performance FY19 Reported FY20 Guidance Including Tilda Excluding Tilda Actual Currency Constant Currency Adjusted EBITDA $191.4 MM $165.1 MM $168 - $192 MM $173 - $198 MM Adjusted EPS $0.66 $0.60 $0.59 - $0.72 $0.62 - $0.75
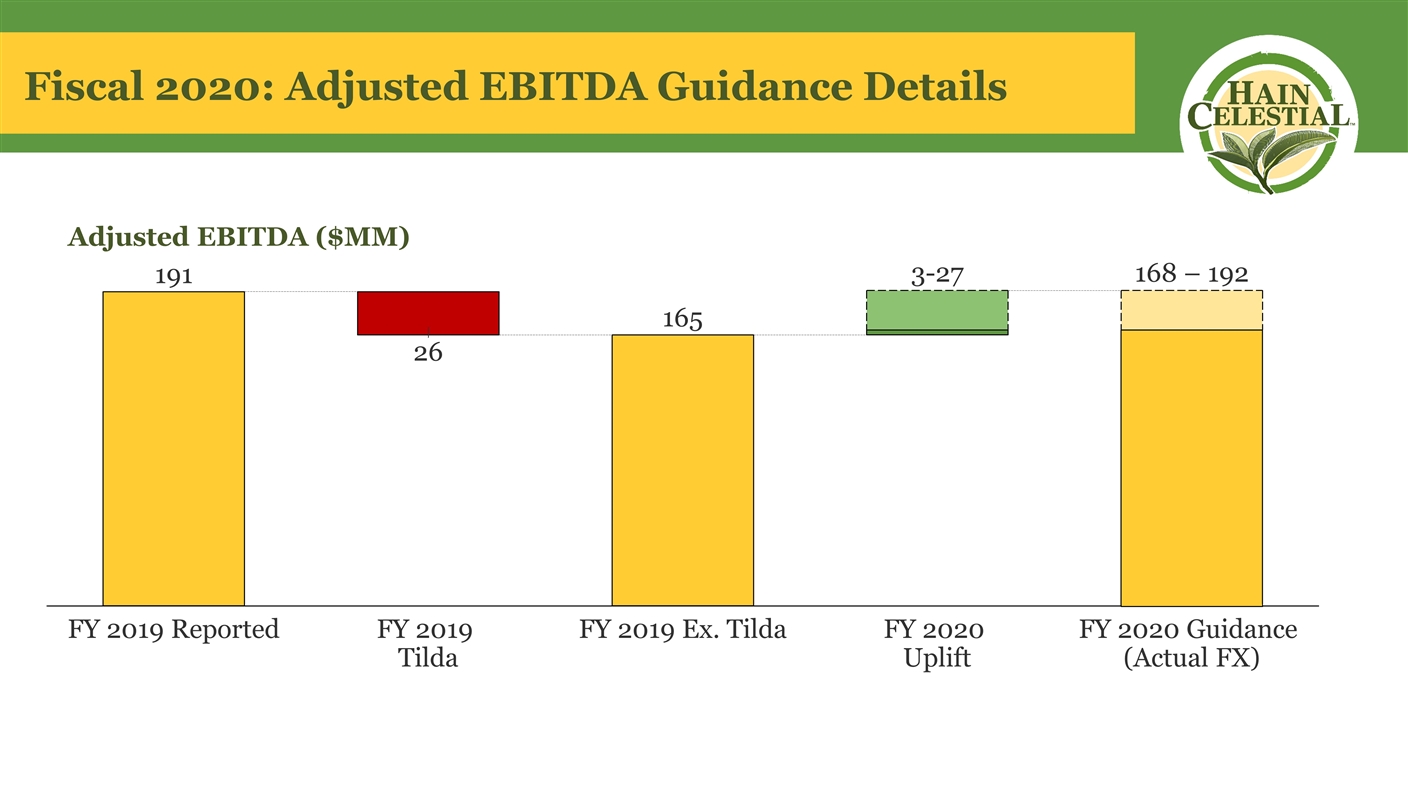
Fiscal 2020: Adjusted EBITDA Guidance Details 3- 168 – 192 Adjusted EBITDA ($MM)
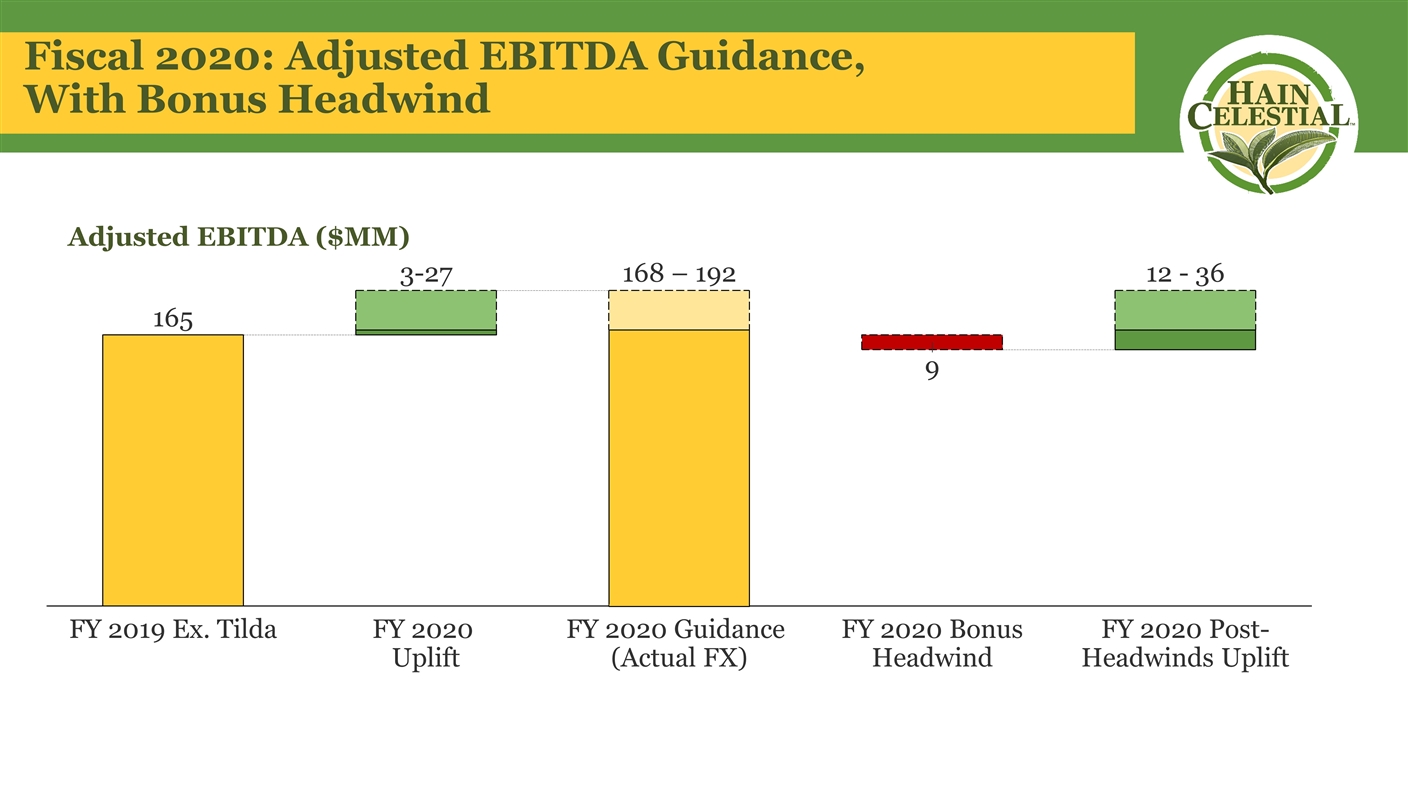
Fiscal 2020: Adjusted EBITDA Guidance, With Bonus Headwind 168 – 192 3- 12 - Adjusted EBITDA ($MM)
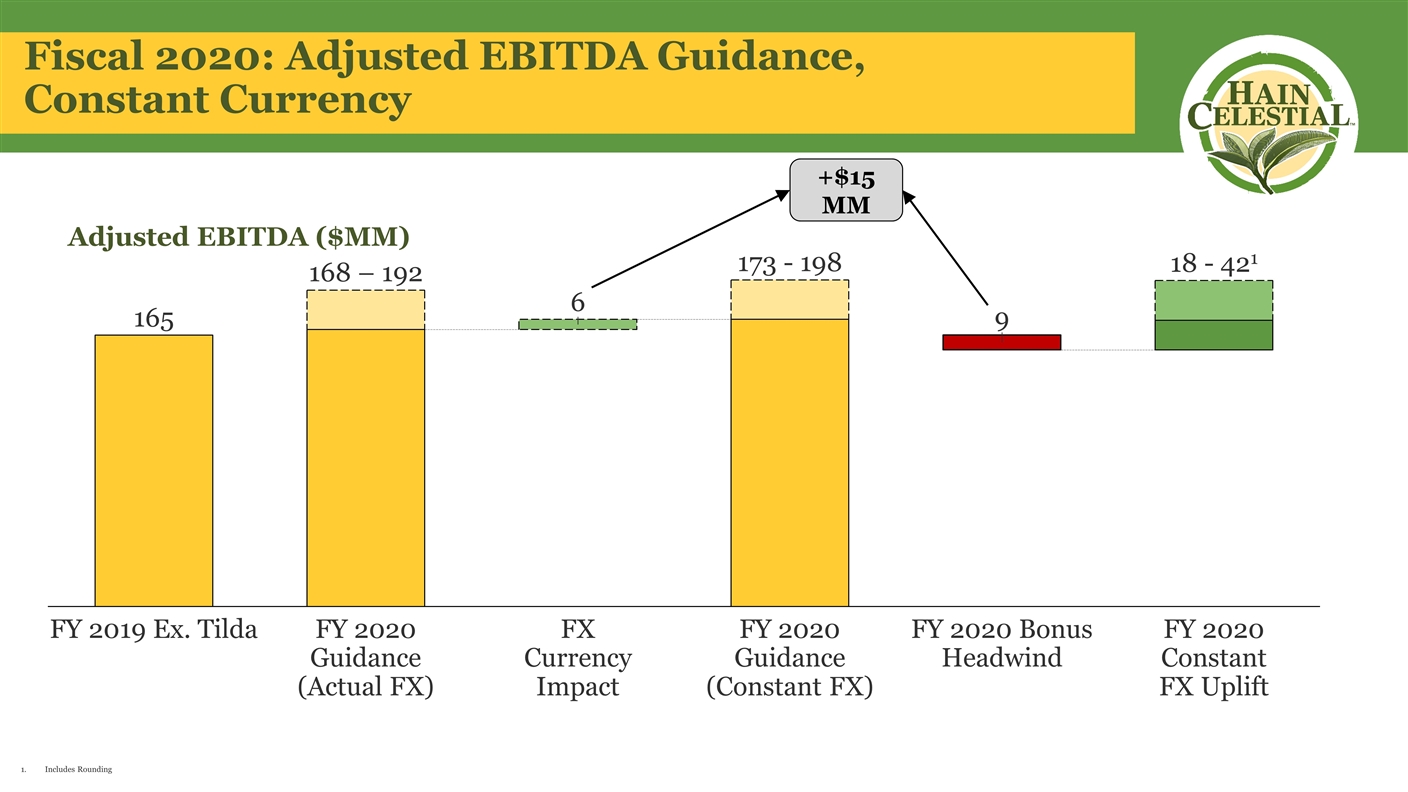
Fiscal 2020: Adjusted EBITDA Guidance, Constant Currency 168 – 192 18 - 1 173 - Adjusted EBITDA ($MM) Includes Rounding +$15 MM
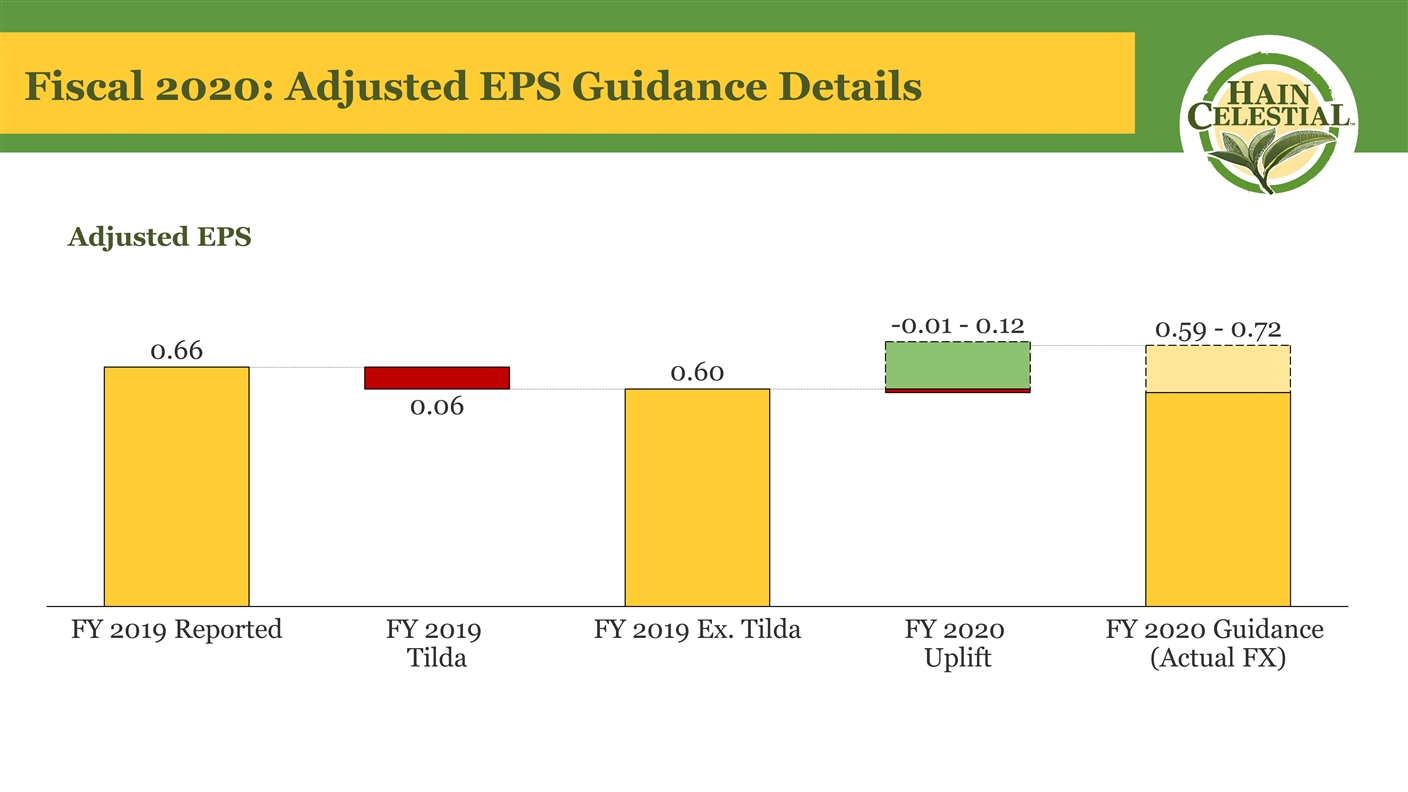
Fiscal 2020: Adjusted EPS Guidance Details 0.06 -0.01 - 0.12 0.59 - Adjusted EPS

Fiscal 2020: Adjusted EPS Guidance, With Bonus and LTIP Headwind 0.10 - 0.59 - -0.01 - 0.12 Adjusted EPS
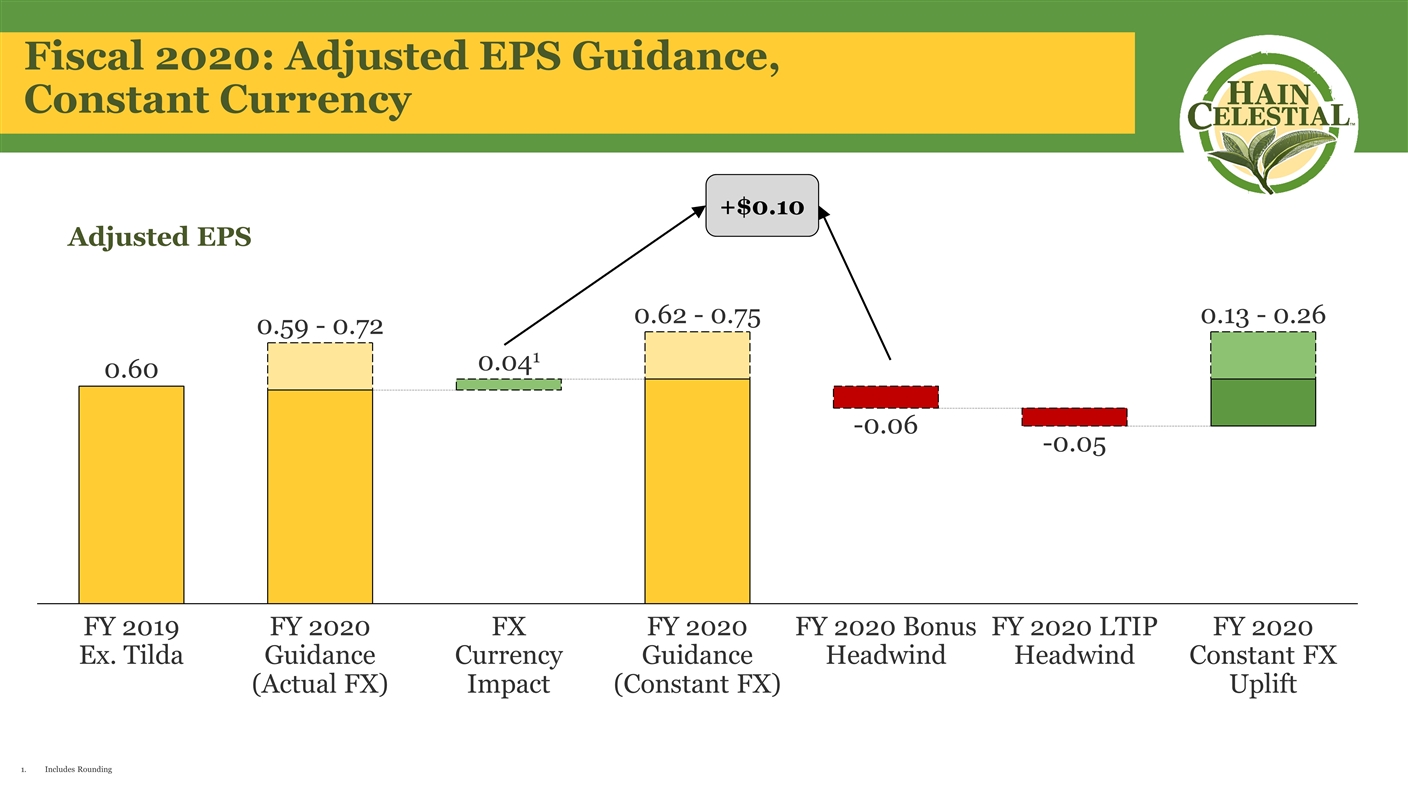
Fiscal 2020: Adjusted EPS Guidance, Constant Currency 0.59 - 0.041 0.62 - 0.13 - Adjusted EPS +$0.10 Includes Rounding

APPENDIX
Basis of Presentation Basis of Presentation This appendix includes unaudited financial information that (1) recasts historical results for fiscal years 2019 and 2018 to reflect two reporting segments that will be in effect beginning with fiscal year 2020 – North America and International, and (2) excludes the historical results of the Tilda business and assumes that cash proceeds received from the sale would have been used to pay down debt. The unaudited financial information is based on our historical consolidated financial statements and information derived from our accounting records regarding Tilda for the periods presented. The unaudited financial information reflects adjustments that are based upon available information and certain assumptions that we believe are reasonable. The unaudited financial information is presented for illustrative purposes only and does not purport to represent the results of operations or financial position that would have been achieved had the Tilda disposition and related debt payment been completed as of the dates indicated, and is not necessarily indicative of the results that may be obtained in the future.
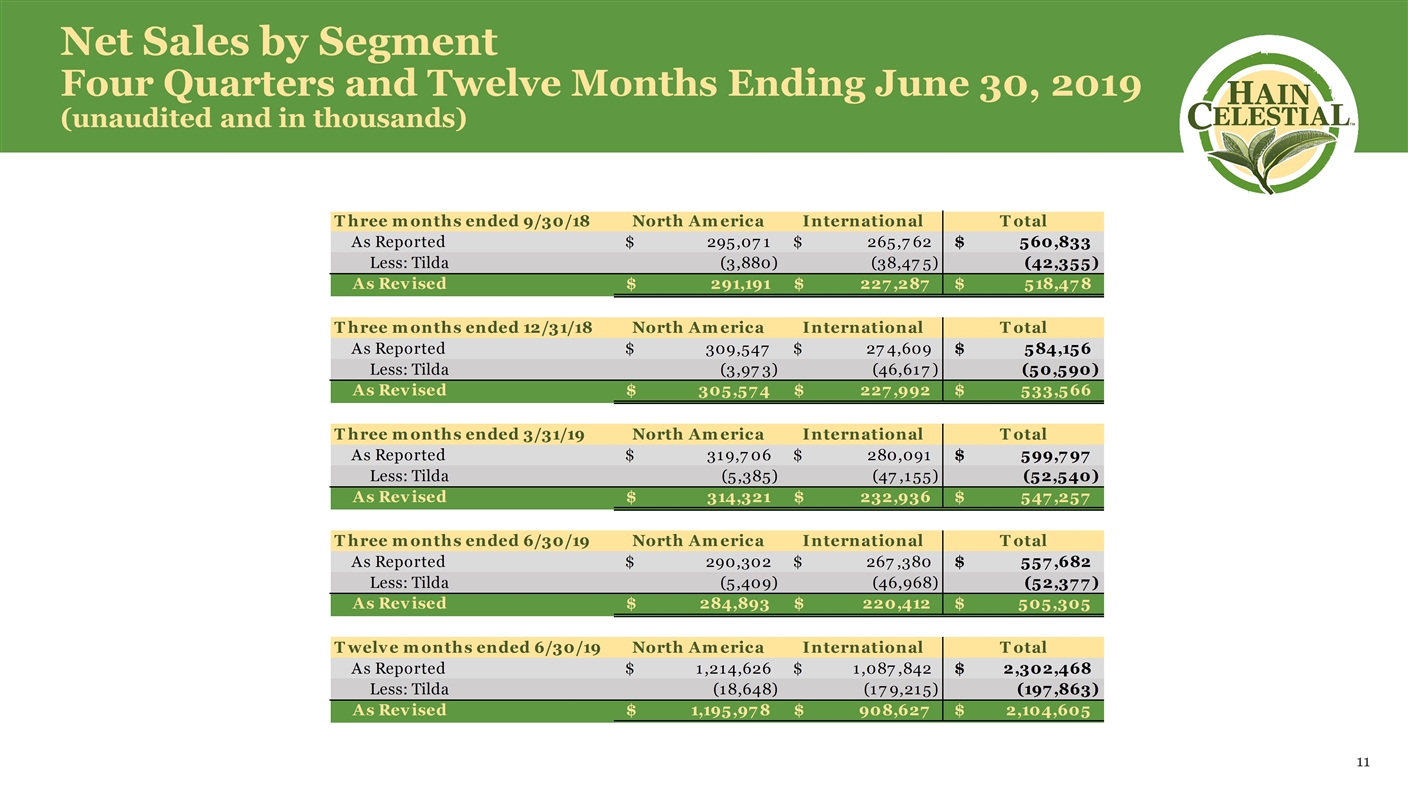
Net Sales by Segment Four Quarters and Twelve Months Ending June 30, 2019 (unaudited and in thousands)
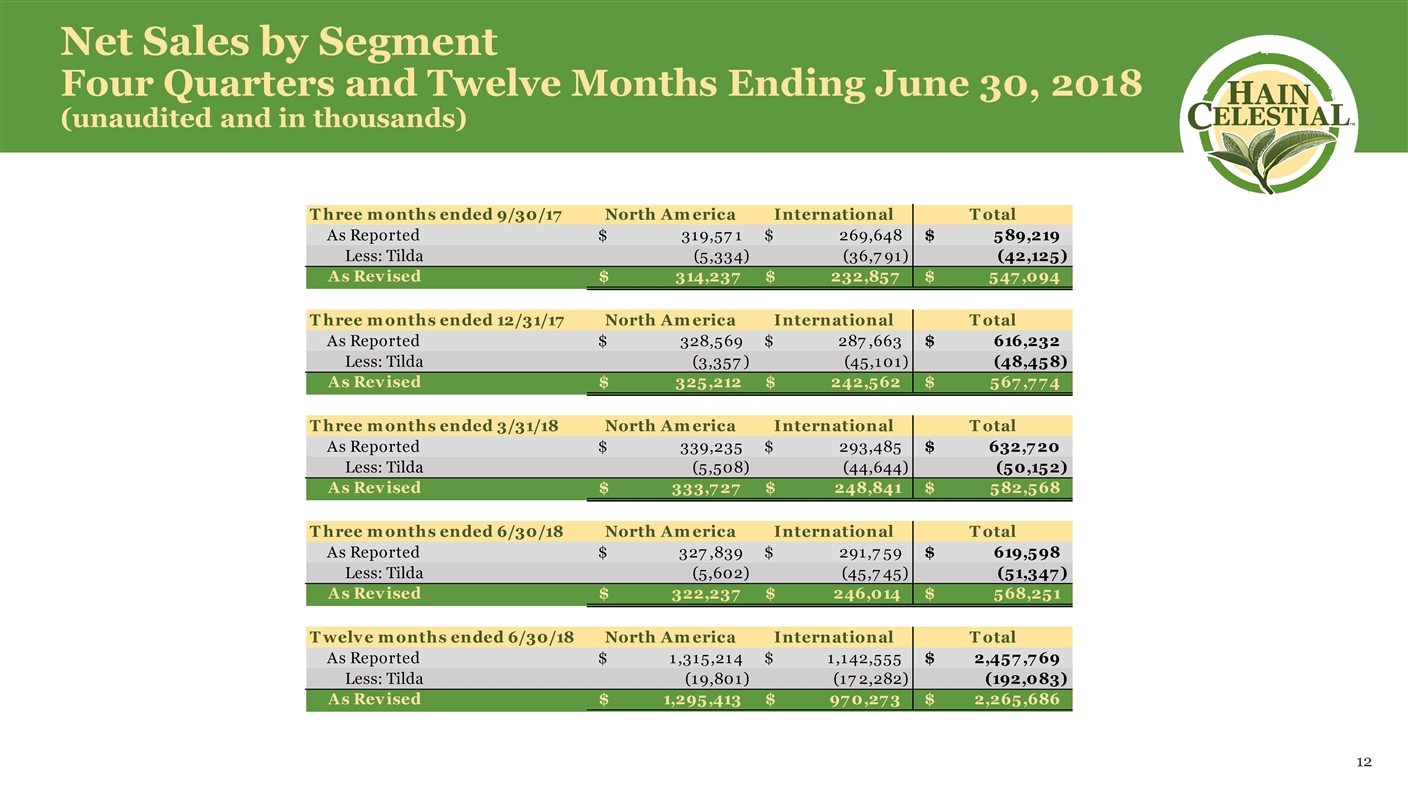
Net Sales by Segment Four Quarters and Twelve Months Ending June 30, 2018 (unaudited and in thousands)

Operating Income by Segment Four Quarters and Twelve Months Ending June 30, 2019 (unaudited and in thousands) (1) See accompanying table of "Reconciliation of GAAP Results to Non-GAAP Measures"
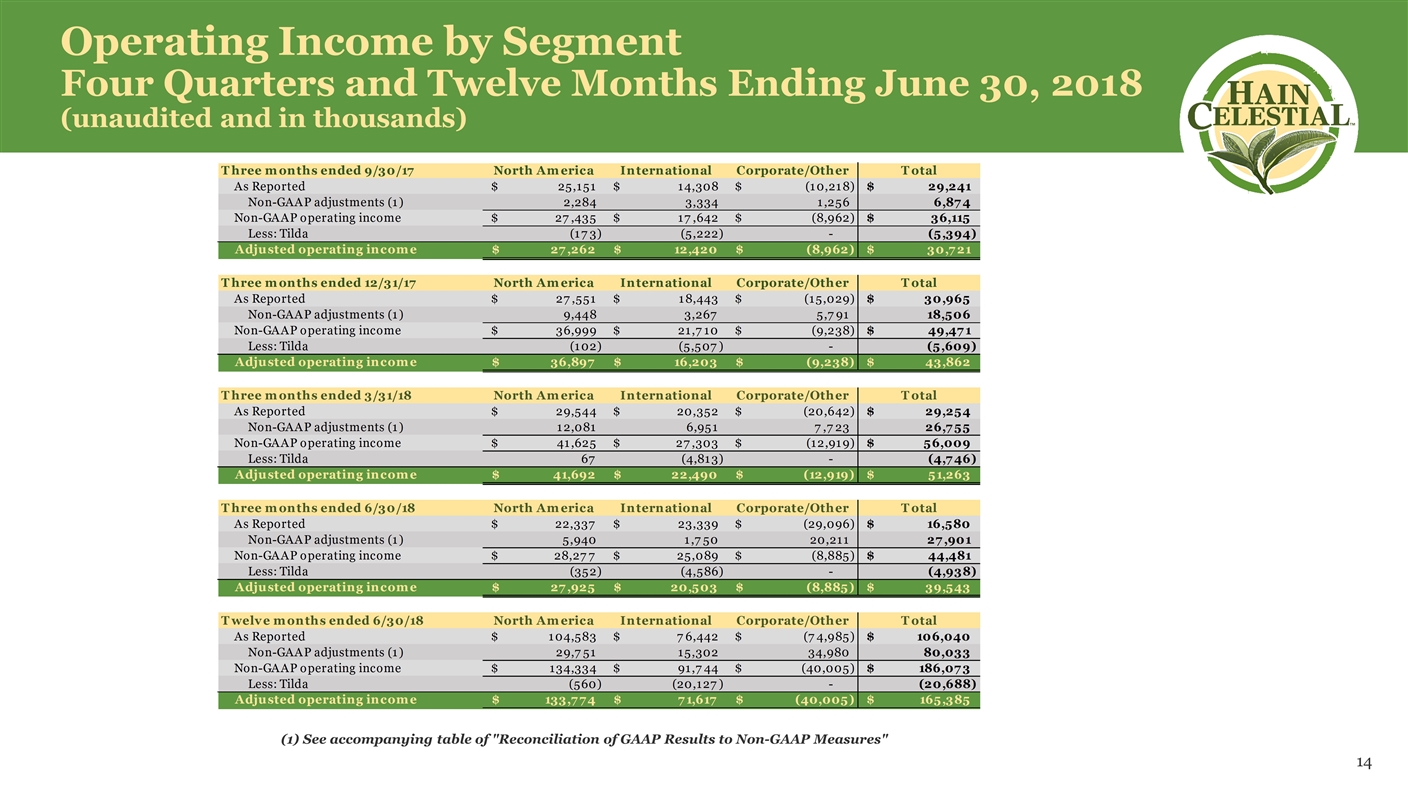
Operating Income by Segment Four Quarters and Twelve Months Ending June 30, 2018 (unaudited and in thousands) (1) See accompanying table of "Reconciliation of GAAP Results to Non-GAAP Measures"
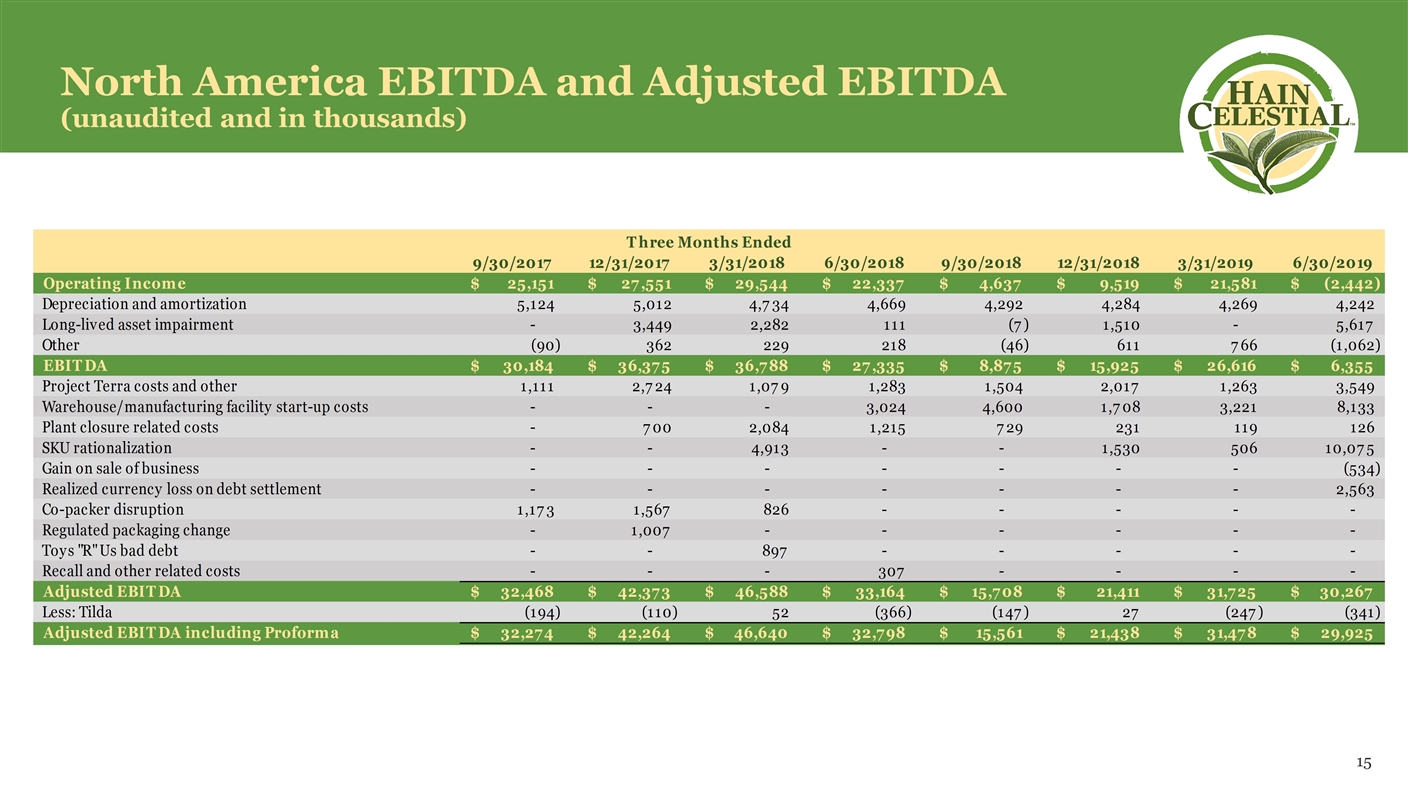
North America EBITDA and Adjusted EBITDA (unaudited and in thousands)
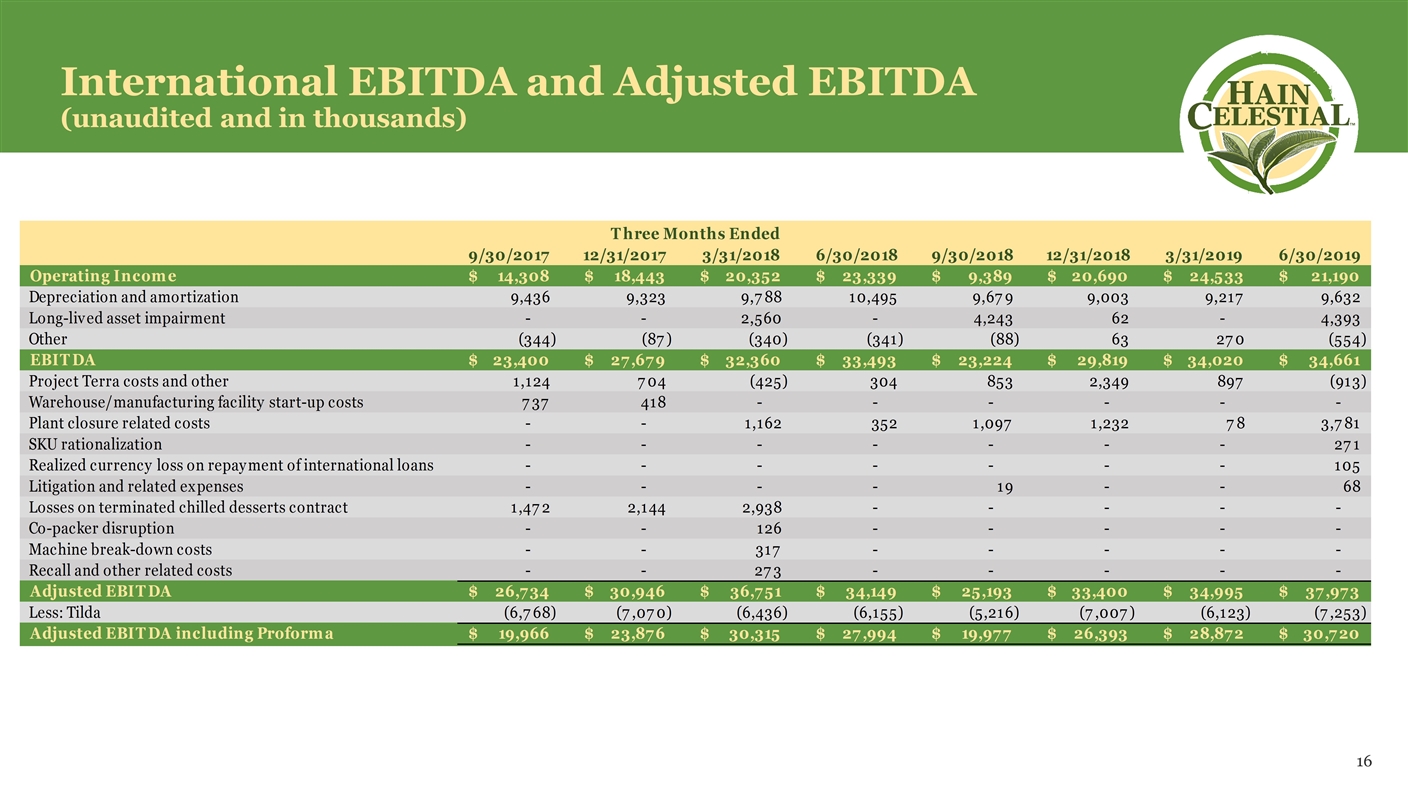
International EBITDA and Adjusted EBITDA (unaudited and in thousands)

Consolidated EBITDA and Adjusted EBITDA (unaudited and in thousands)
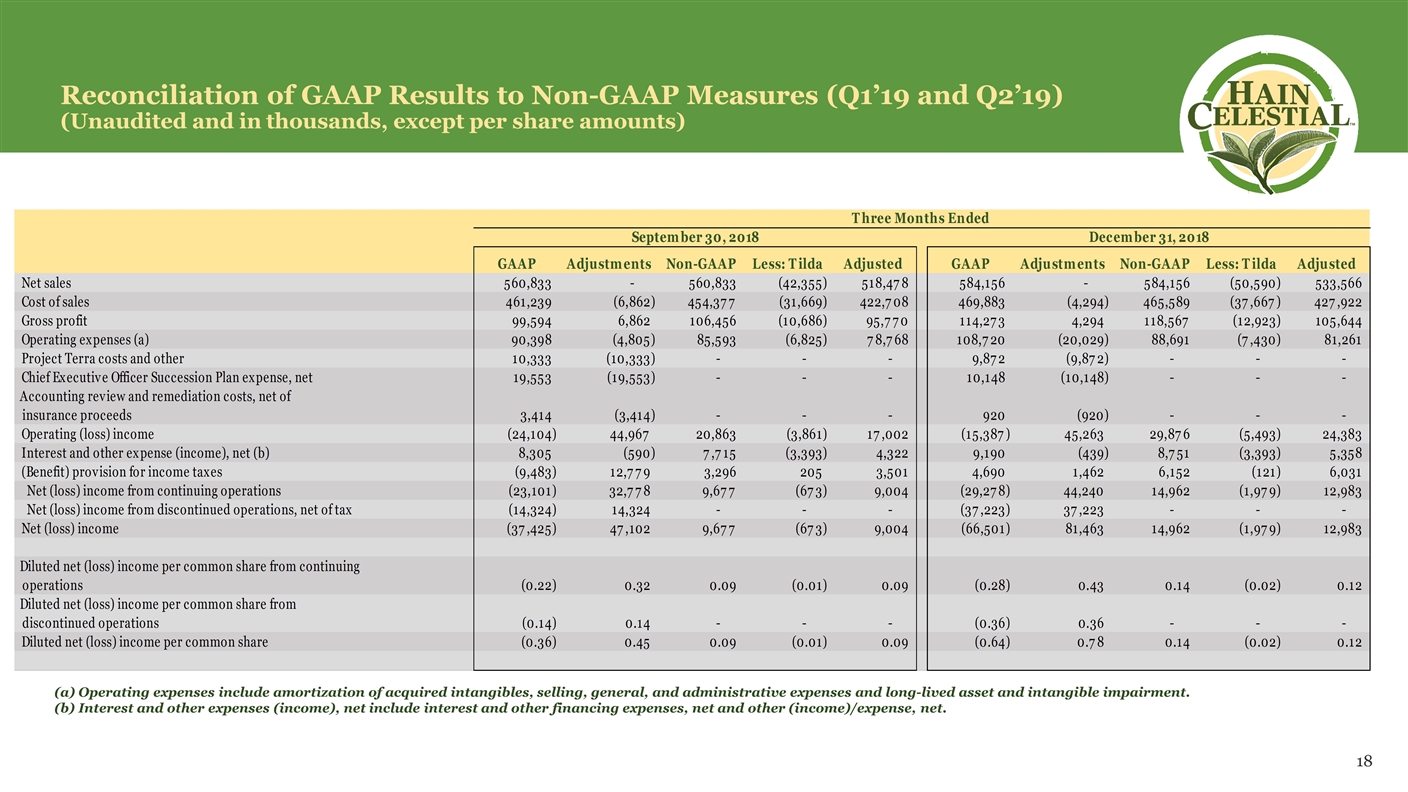
Reconciliation of GAAP Results to Non-GAAP Measures (Q1’19 and Q2’19) (Unaudited and in thousands, except per share amounts) Operating expenses include amortization of acquired intangibles, selling, general, and administrative expenses and long-lived asset and intangible impairment. Interest and other expenses (income), net include interest and other financing expenses, net and other (income)/expense, net.
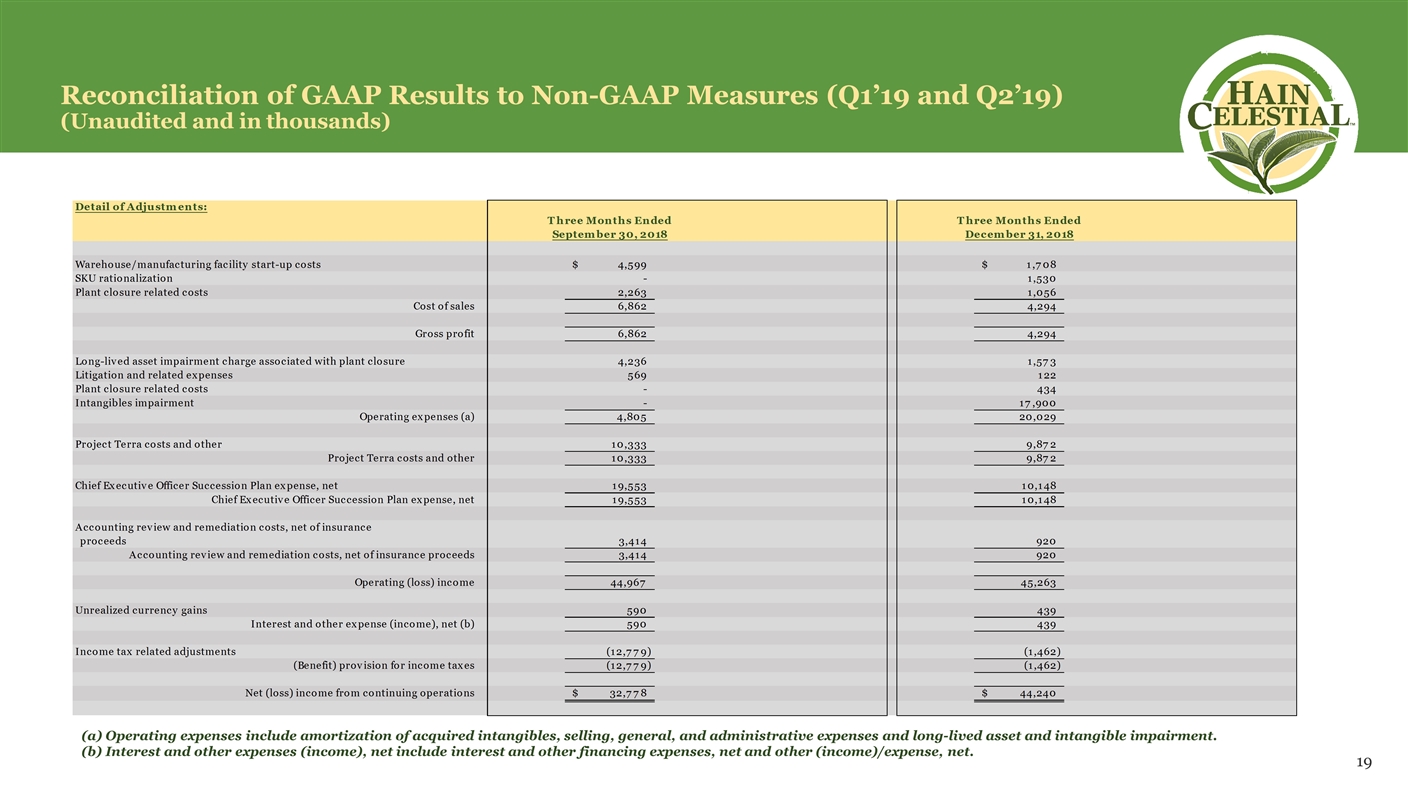
Reconciliation of GAAP Results to Non-GAAP Measures (Q1’19 and Q2’19) (Unaudited and in thousands) Operating expenses include amortization of acquired intangibles, selling, general, and administrative expenses and long-lived asset and intangible impairment. Interest and other expenses (income), net include interest and other financing expenses, net and other (income)/expense, net.
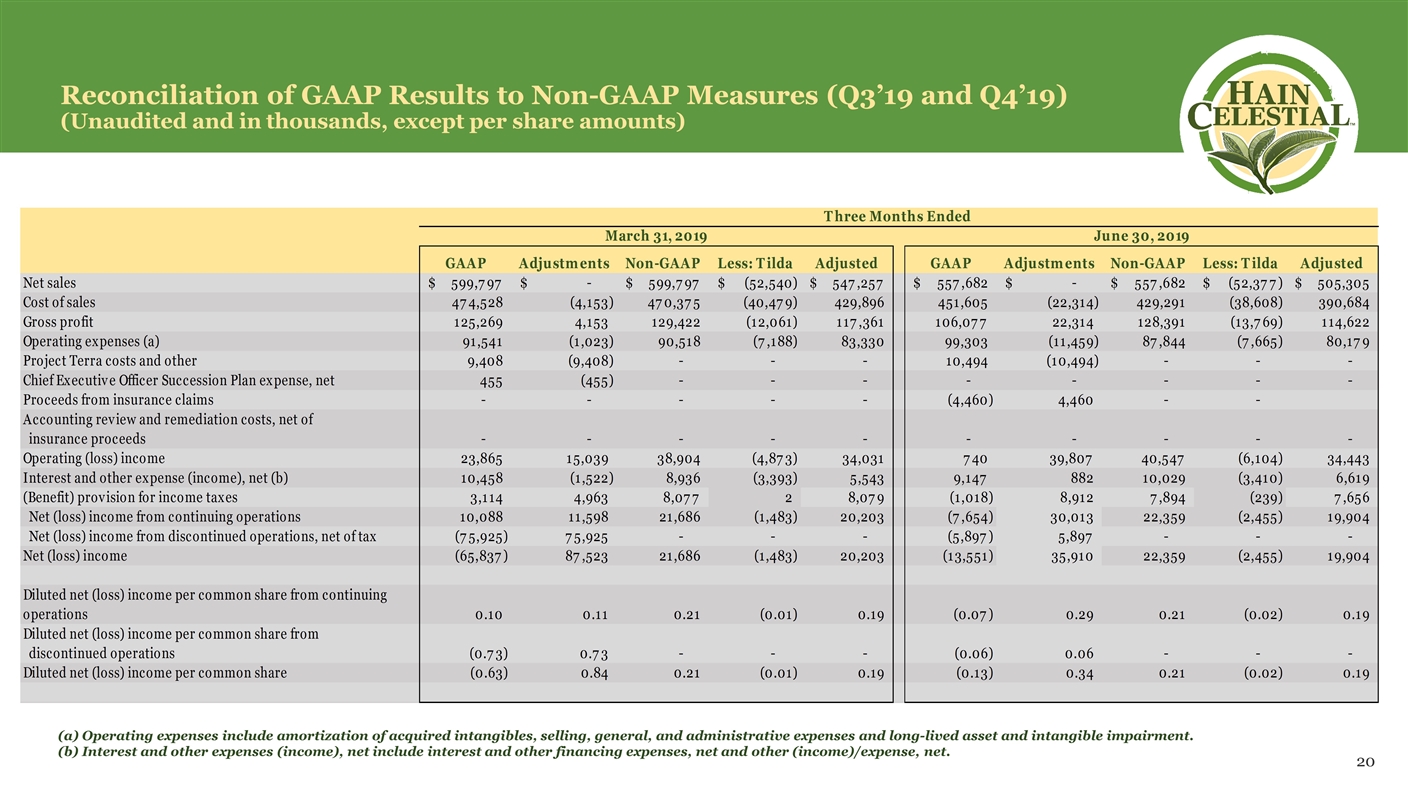
Reconciliation of GAAP Results to Non-GAAP Measures (Q3’19 and Q4’19) (Unaudited and in thousands, except per share amounts) Operating expenses include amortization of acquired intangibles, selling, general, and administrative expenses and long-lived asset and intangible impairment. Interest and other expenses (income), net include interest and other financing expenses, net and other (income)/expense, net.
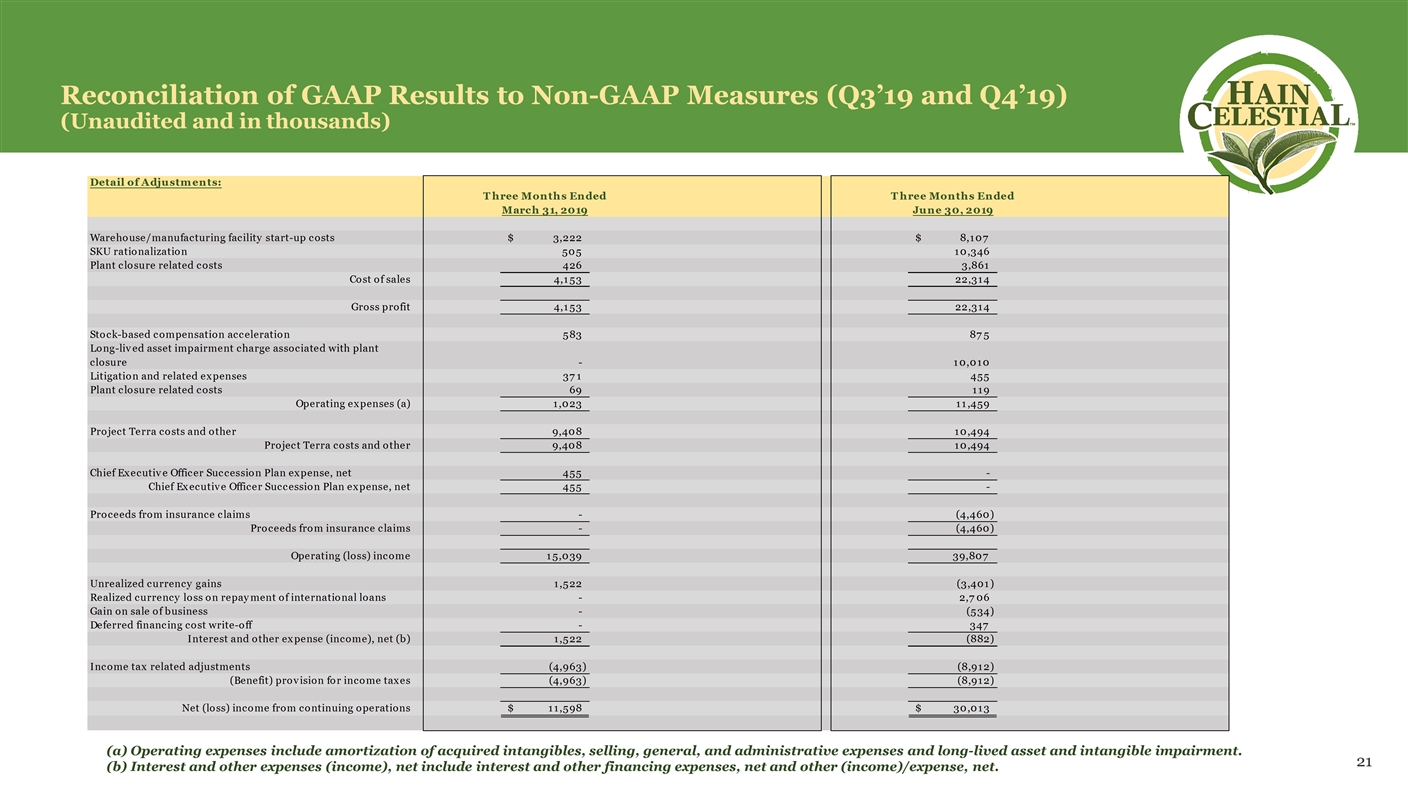
Reconciliation of GAAP Results to Non-GAAP Measures (Q3’19 and Q4’19) (Unaudited and in thousands) Operating expenses include amortization of acquired intangibles, selling, general, and administrative expenses and long-lived asset and intangible impairment. Interest and other expenses (income), net include interest and other financing expenses, net and other (income)/expense, net.
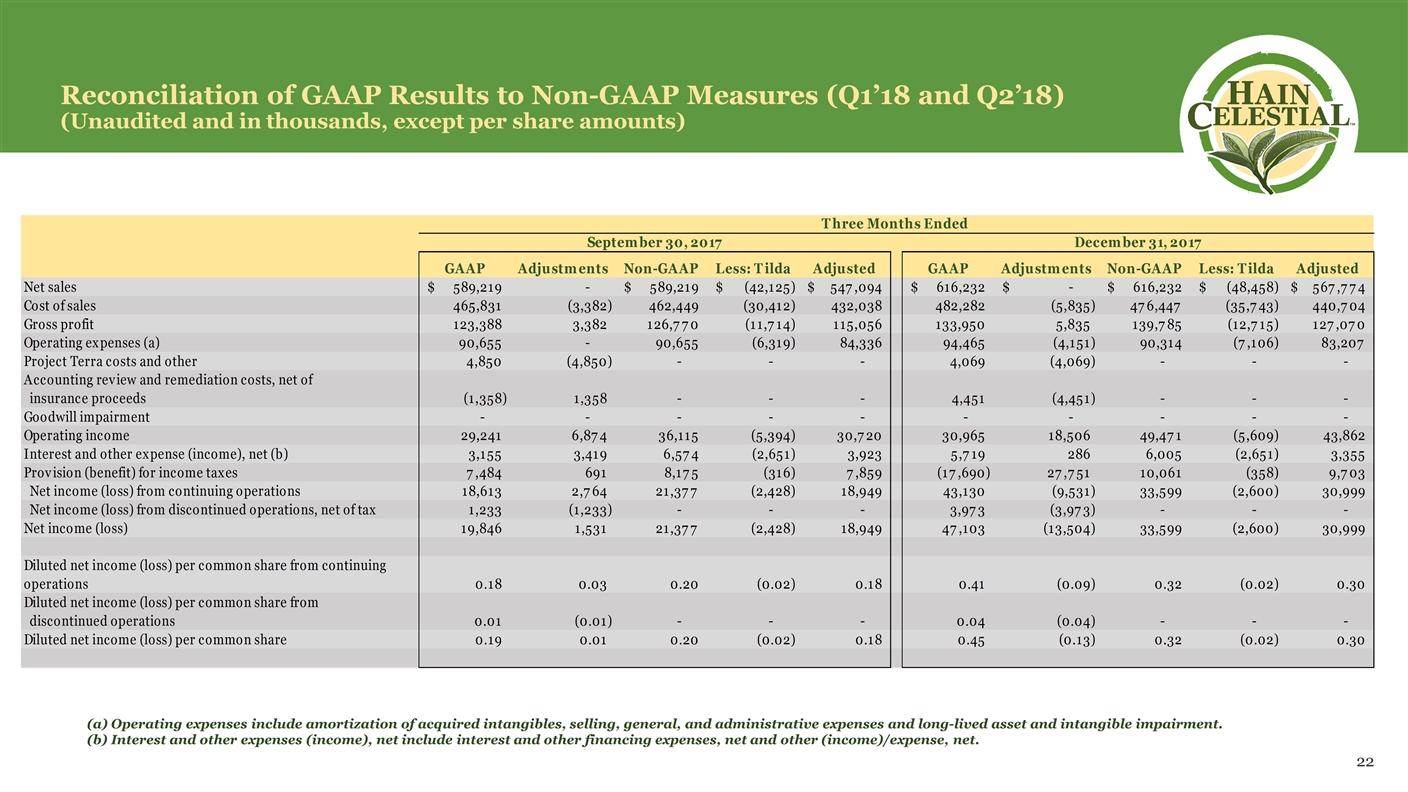
Reconciliation of GAAP Results to Non-GAAP Measures (Q1’18 and Q2’18) (Unaudited and in thousands, except per share amounts) Operating expenses include amortization of acquired intangibles, selling, general, and administrative expenses and long-lived asset and intangible impairment. Interest and other expenses (income), net include interest and other financing expenses, net and other (income)/expense, net.
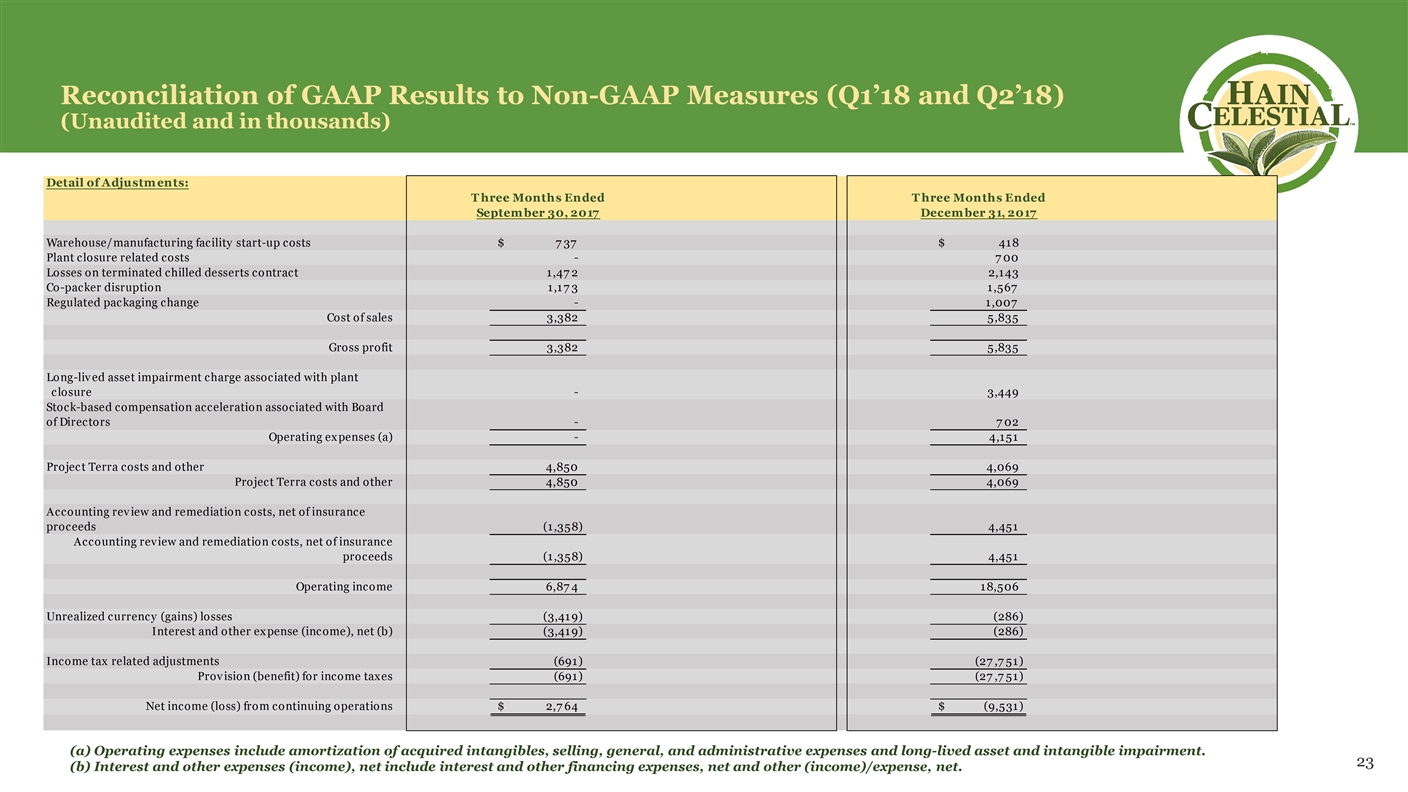
Reconciliation of GAAP Results to Non-GAAP Measures (Q1’18 and Q2’18) (Unaudited and in thousands) Operating expenses include amortization of acquired intangibles, selling, general, and administrative expenses and long-lived asset and intangible impairment. Interest and other expenses (income), net include interest and other financing expenses, net and other (income)/expense, net.
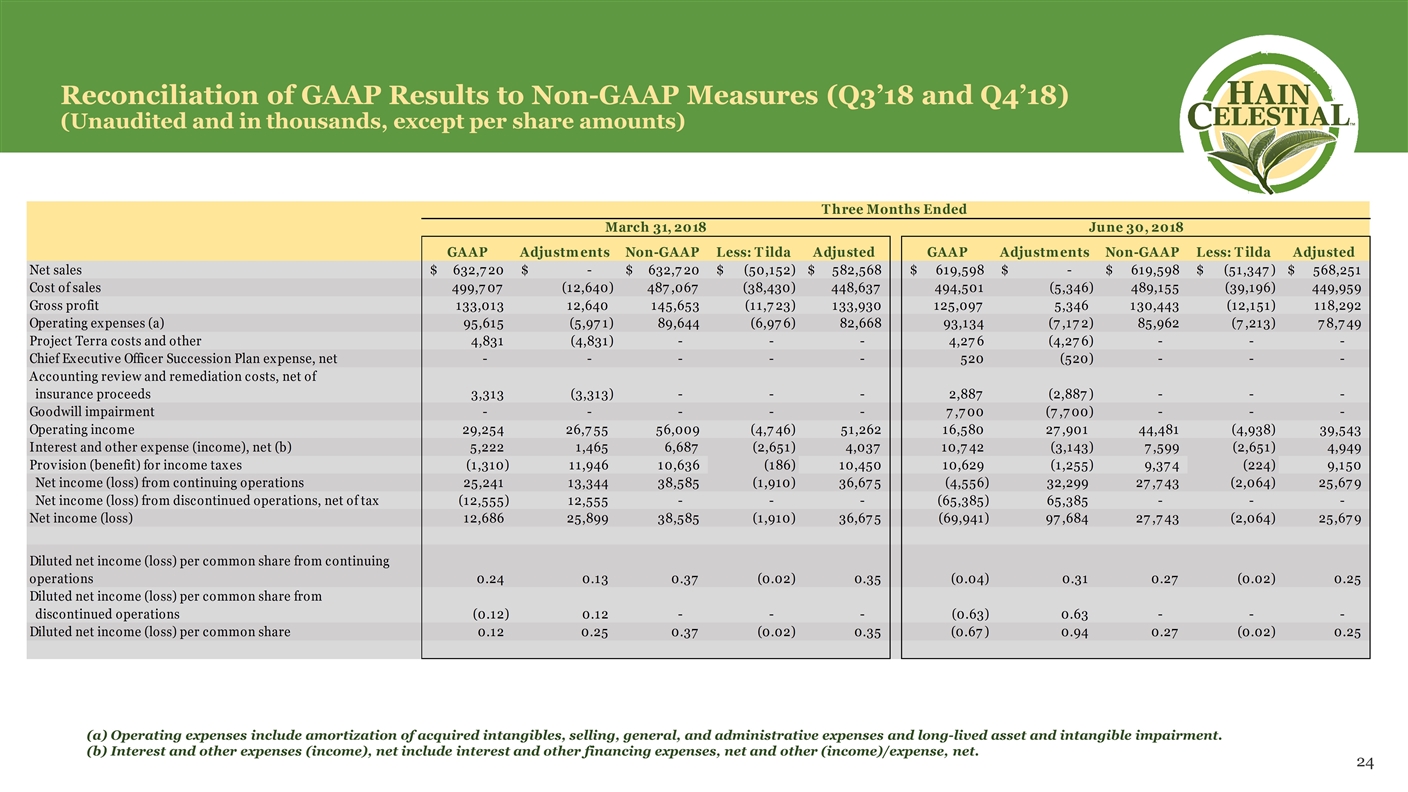
Reconciliation of GAAP Results to Non-GAAP Measures (Q3’18 and Q4’18) (Unaudited and in thousands, except per share amounts) Operating expenses include amortization of acquired intangibles, selling, general, and administrative expenses and long-lived asset and intangible impairment. Interest and other expenses (income), net include interest and other financing expenses, net and other (income)/expense, net.
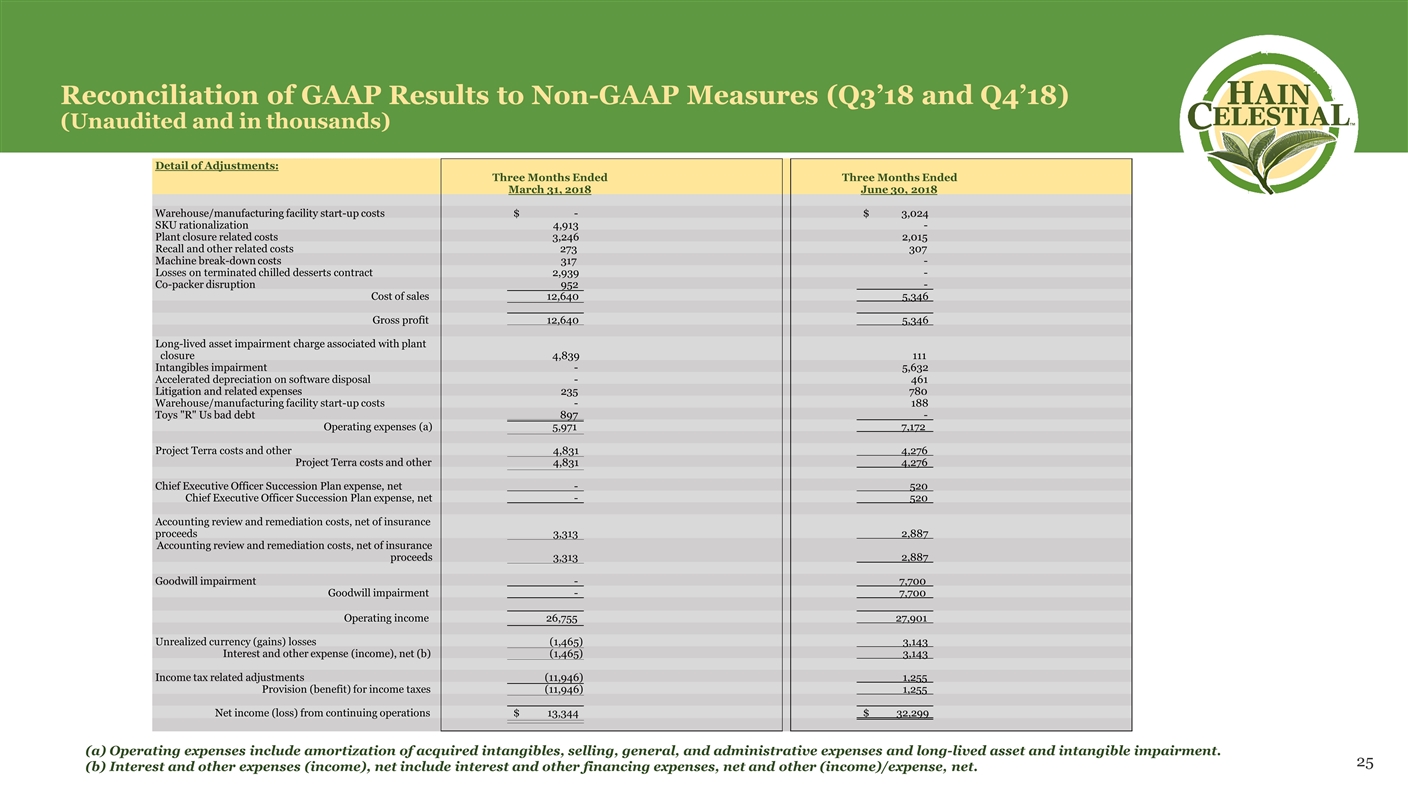
Reconciliation of GAAP Results to Non-GAAP Measures (Q3’18 and Q4’18) (Unaudited and in thousands) Operating expenses include amortization of acquired intangibles, selling, general, and administrative expenses and long-lived asset and intangible impairment. Interest and other expenses (income), net include interest and other financing expenses, net and other (income)/expense, net. Detail of Adjustments: Warehouse/manufacturing facility start-up costs - $ 3,024 $ SKU rationalization 4,913 - Plant closure related costs 3,246 2,015 Recall and other related costs 273 307 Machine break-down costs 317 - Losses on terminated chilled desserts contract 2,939 - Co-packer disruption 952 - Cost of sales 12,640 5,346 Gross profit 12,640 5,346 Long-lived asset impairment charge associated with plant closure 4,839 111 Intangibles impairment - 5,632 Accelerated depreciation on software disposal - 461 Litigation and related expenses 235 780 Warehouse/manufacturing facility start-up costs - 188 Toys "R" Us bad debt 897 - Operating expenses (a) 5,971 7,172 Project Terra costs and other 4,831 4,276 Project Terra costs and other 4,831 4,276 Chief Executive Officer Succession Plan expense, net - 520 Chief Executive Officer Succession Plan expense, net - 520 Accounting review and remediation costs, net of insurance proceeds 3,313 2,887 Accounting review and remediation costs, net of insurance proceeds 3,313 2,887 Goodwill impairment - 7,700 Goodwill impairment - 7,700 Operating income 26,755 27,901 Unrealized currency (gains) losses (1,465) 3,143 Interest and other expense (income), net (b) (1,465) 3,143 Income tax related adjustments (11,946) 1,255 Provision (benefit) for income taxes (11,946) 1,255 Net income (loss) from continuing operations 13,344 $ 32,299 $ Three Months Ended Three Months Ended March 31, 2018 June 30, 2018
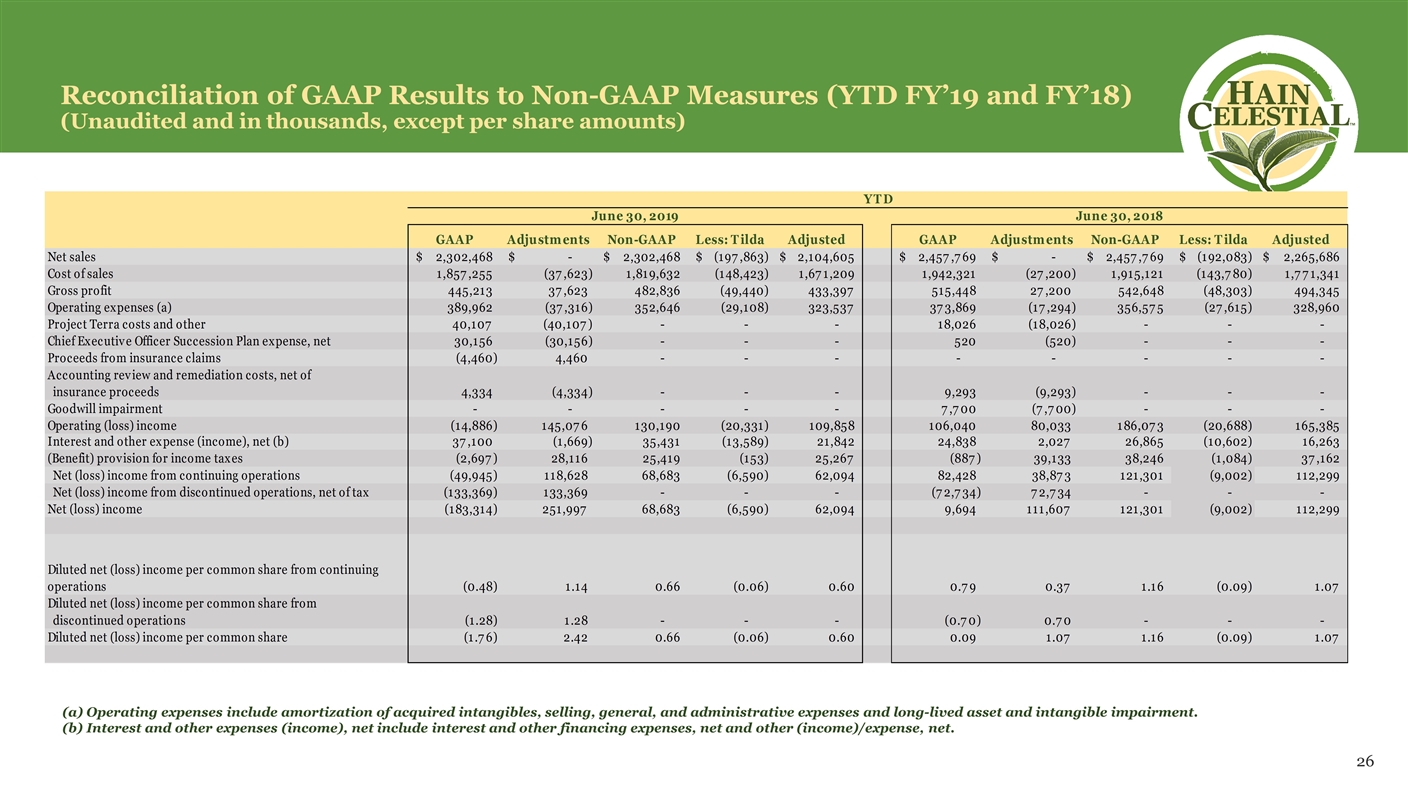
Reconciliation of GAAP Results to Non-GAAP Measures (YTD FY’19 and FY’18) (Unaudited and in thousands, except per share amounts) Operating expenses include amortization of acquired intangibles, selling, general, and administrative expenses and long-lived asset and intangible impairment. Interest and other expenses (income), net include interest and other financing expenses, net and other (income)/expense, net.
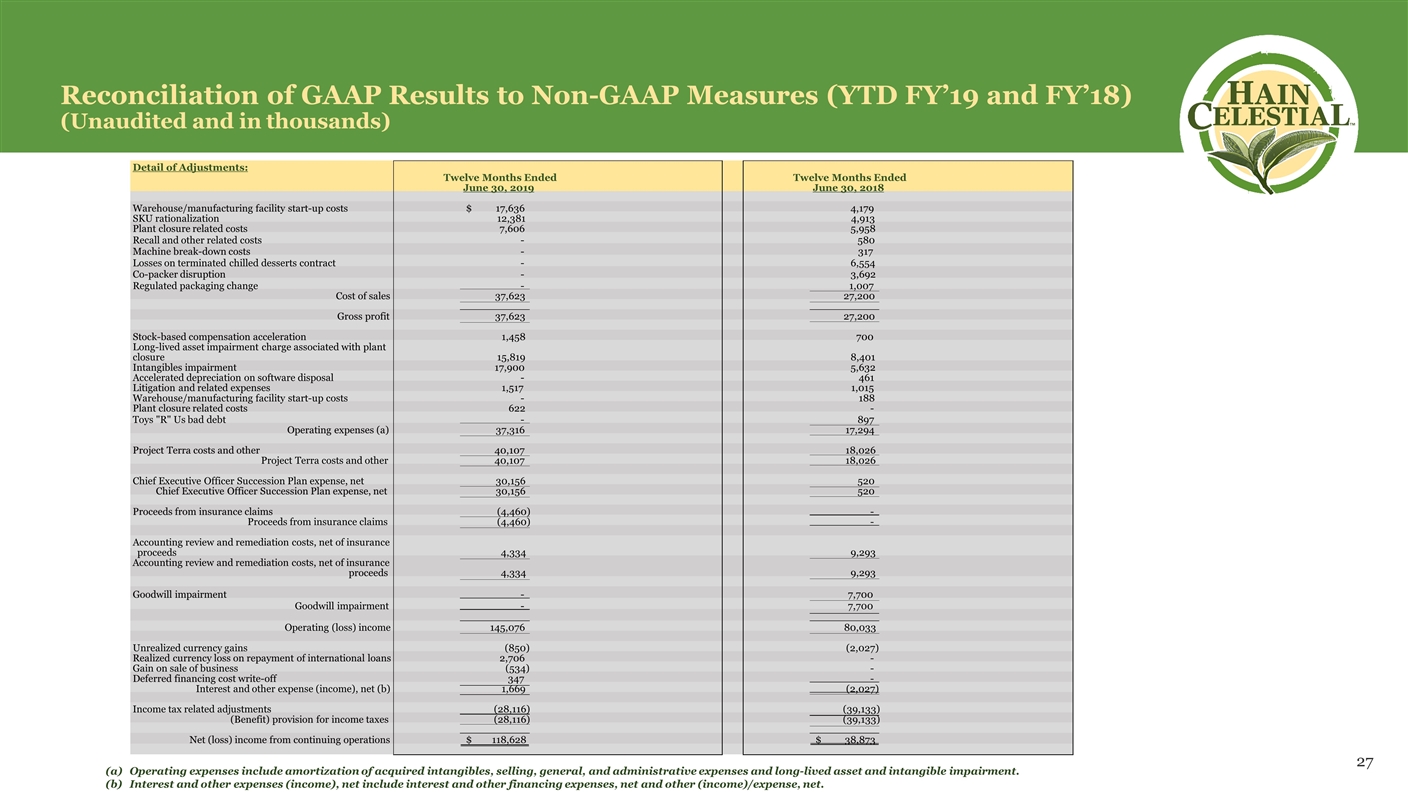
Reconciliation of GAAP Results to Non-GAAP Measures (YTD FY’19 and FY’18) (Unaudited and in thousands) Operating expenses include amortization of acquired intangibles, selling, general, and administrative expenses and long-lived asset and intangible impairment. Interest and other expenses (income), net include interest and other financing expenses, net and other (income)/expense, net. Detail of Adjustments: Warehouse/manufacturing facility start-up costs 17,636 $ 4,179 SKU rationalization 12,381 4,913 Plant closure related costs 7,606 5,958 Recall and other related costs - 580 Machine break-down costs - 317 Losses on terminated chilled desserts contract - 6,554 Co-packer disruption - 3,692 Regulated packaging change - 1,007 Cost of sales 37,623 27,200 Gross profit 37,623 27,200 Stock-based compensation acceleration 1,458 700 Long-lived asset impairment charge associated with plant closure 15,819 8,401 Intangibles impairment 17,900 5,632 Accelerated depreciation on software disposal - 461 Litigation and related expenses 1,517 1,015 Warehouse/manufacturing facility start-up costs - 188 Plant closure related costs 622 - Toys "R" Us bad debt - 897 Operating expenses (a) 37,316 17,294 Project Terra costs and other 40,107 18,026 Project Terra costs and other 40,107 18,026 Chief Executive Officer Succession Plan expense, net 30,156 520 Chief Executive Officer Succession Plan expense, net 30,156 520 Proceeds from insurance claims (4,460) - Proceeds from insurance claims (4,460) - Accounting review and remediation costs, net of insurance proceeds 4,334 9,293 Accounting review and remediation costs, net of insurance proceeds 4,334 9,293 Goodwill impairment - 7,700 Goodwill impairment - 7,700 Operating (loss) income 145,076 80,033 Unrealized currency gains (850) (2,027) Realized currency loss on repayment of international loans 2,706 - Gain on sale of business (534) - Deferred financing cost write-off 347 - Interest and other expense (income), net (b) 1,669 (2,027) Income tax related adjustments (28,116) (39,133) (Benefit) provision for income taxes (28,116) (39,133) Net (loss) income from continuing operations 118,628 $ 38,873 $ Twelve Months Ended June 30, 2019 Twelve Months Ended June 30, 2018


