As Filed with the Securities and Exchange Commission on February 2, 2006
Registration No. 333-119259
UNITED STATES
SECURITIES AND EXCHANGE COMMISSION
WASHINGTON, D.C. 20549
POST-EFFECTIVE
AMENDMENT
NUMBER 2
TO
Form S-1
REGISTRATION STATEMENT
UNDER THE
SECURITIES ACT OF 1933
Campbell Strategic Allocation Fund, L.P.
(Exact name of registrant as specified in its charter)
| Delaware | 6799 | 52-1823554 | ||
| (State of Organization) | (Primary Standard Industrial Classification Number) | (I.R.S. Employer Identification Number) |
c/o Campbell & Company, Inc.
Court Towers Building
210 West Pennsylvania Avenue
Towson, Maryland 21204
(410) 296-3301
(Address, including zip code, and telephone number, including area code, of registrant’s principal executive offices)
Theresa D. Becks
Campbell & Company, Inc.
Court Towers Building
210 West Pennsylvania Avenue
Towson, Maryland 21204
(410) 296-3301
(Name, address, including zip code, and telephone number, including area code, of agent for service)
Copy to:
Michael J. Schmidtberger
Sidley Austin LLP
787 Seventh Avenue
New York, New York 10019
(212) 839-5458
Approximate date of commencement of proposed sale to the public:From time to time after the effective date of this Post-Effective Amendment to the Registration Statement.
If any of the securities being registered on this Form are to be offered on a delayed or continuous basis pursuant to Rule 415 under the Securities Act of 1933 (the “Securities Act”) check the following box.x
If this Form is filed to register additional securities for an offering pursuant to Rule 462(b) under the Securities Act, please check the following box and list the Securities Act registration statement number of the earlier effective registration statement for the same offering.o
If this Form is a post-effective amendment filed pursuant to Rule 462(c) under the Securities Act, check the following box and list the Securities Act registration statement number of the earlier effective registration statement for the same offering.o
If this Form is a post-effective amendment filed pursuant to Rule 462(d) under the Securities Act, check the following box and list the Securities Act registration statement number of the earlier effective registration statement for the same offering.o
The Registrant hereby amends this registration statement on such date or dates as may be necessary to delay its effective date until the registrant shall file a further amendment which specifically states that this registration statement shall thereafter become effective in accordance with Section 8(a) of the Securities Act of 1933 or until this registration statement shall become effective on such date as the Commission, acting pursuant to said Section 8(a), may determine.
Pursuant to the provisions of Rule 429 of the Rules and Regulations of the Securities and Exchange Commission under the Securities Act of 1933, the form of prospectus set forth herein also relates to the Registration Statement on Form S-1 (Registration Statement Number 333-113972 declared effective April 30, 2004) and constitutes Post-Effective Amendment Number 3 with respect to such Registration Statement.
PART ONE — DISCLOSURE DOCUMENT
CAMPBELL STRATEGIC ALLOCATION FUND, L.P.
$1,305,000,000
UNITS OF LIMITED PARTNERSHIP INTEREST
The Offering
The Fund trades speculatively in the U.S. and international futures, forward, option and swap markets. Specifically, the Fund trades in a portfolio primarily focused on financial futures and forwards, which are instruments designed to hedge or speculate on changes in interest rates, currency exchange rates or stock index values. A secondary emphasis is on metals and energy products. Campbell & Company, Inc., a futures fund manager, allocates the Fund’s assets across a broad spectrum of markets.
As of December 31, 2005, the Fund’s net asset value per unit was $3,007.42. The selling agents will use their best efforts to sell the units offered. There is no fixed termination date for the offering of the units. The Fund offers the units during the continuing offering at the net asset value per unit as of each month-end closing date on which subscriptions are accepted. Campbell & Company may suspend, limit or terminate the continuing offering period at any time.
The Risks
These are speculative securities.Before you decide whether to invest, read this entire prospectus carefully and consider “The Risks You Face” and “Conflicts of Interest.”
| • | The Fund is speculative and leveraged. The Fund’s assets are leveraged at a ratio which can range from 5:1 to 20:1. |
| • | Past results of Campbell & Company are not necessarily indicative of future performance of the Fund, and the Fund’s performance can be volatile. The net asset value per unit has fluctuated in a single month as much as 12%. |
| • | You could lose all or a substantial amount of your investment in the Fund. |
| • | Campbell & Company has total trading authority over the Fund and the Fund is dependent upon the services of Campbell & Company. The use of a single advisor applying generally similar trading programs could mean lack of diversification and, consequently, higher risk. |
| • | There is no secondary market for the units and none is expected to develop. While the units have redemption rights, there are restrictions and possible fees assessed. For example, redemptions can occur only at the end of a month. |
| • | Transfers of interest in the units are subject to limitations, such as 30 days’ advance written notice of any intent to transfer. Also, Campbell & Company may deny a request to transfer if it determines that the transfer may result in adverse legal or tax consequences for the Fund. |
| • | Substantial expenses must be offset by trading profits and interest income. The Fund must generate trading profits of 3.90% per annum to break-even. |
| • | A substantial portion of the trades executed for the Fund takes place on foreign exchanges. No U.S. regulatory authority or exchange has the power to compel the enforcement of the rules of a foreign board of trade or any applicable foreign laws. |
| • | The Fund is subject to conflicts of interest. There are no independent experts representing investors. |
| Minimum Initial Investment | Minimum Additional Investment | |
| $100,000 | $10,000 from IRAs and other tax-exempt accounts $25,000 from all other investors |
Investors are required to make representations and warranties relating to their suitability in connection with this investment. Each investor is encouraged to discuss the investment with his/her individual financial, legal and tax adviser.
These securities have not been approved or disapproved by the Securities and Exchange Commission or any state securities commission nor has the Securities and Exchange Commission or any state securities commission passed upon the accuracy or adequacy of this prospectus. Any representation to the contrary is a criminal offense.
This prospectus is in two parts: a disclosure document and a statement of additional information. These parts are bound together, and both contain important information.
THE COMMODITY FUTURES TRADING COMMISSION HAS NOT PASSED UPON THE MERITS OF PARTICIPATING IN THIS POOL NOR HAS THE COMMISSION PASSED UPON THE ADEQUACY OR ACCURACY OF THIS DISCLOSURE DOCUMENT.
CAMPBELL & COMPANY, INC.
General Partner
March 24, 2006
(This page has been left blank intentionally.)
COMMODITY FUTURES TRADING COMMISSION
RISK DISCLOSURE STATEMENT
YOU SHOULD CAREFULLY CONSIDER WHETHER YOUR FINANCIAL CONDITION PERMITS YOU TO PARTICIPATE IN A COMMODITY POOL. IN SO DOING, YOU SHOULD BE AWARE THAT FUTURES AND OPTIONS TRADING CAN QUICKLY LEAD TO LARGE LOSSES AS WELL AS GAINS. SUCH TRADING LOSSES CAN SHARPLY REDUCE THE NET ASSET VALUE OF THE POOL AND CONSEQUENTLY THE VALUE OF YOUR INTEREST IN THE POOL. IN ADDITION, RESTRICTIONS ON REDEMPTIONS MAY AFFECT YOUR ABILITY TO WITHDRAW YOUR PARTICIPATION IN THE POOL.
FURTHER, COMMODITY POOLS MAY BE SUBJECT TO SUBSTANTIAL CHARGES FOR MANAGEMENT, AND ADVISORY AND BROKERAGE FEES. IT MAY BE NECESSARY FOR THOSE POOLS THAT ARE SUBJECT TO THESE CHARGES TO MAKE SUBSTANTIAL TRADING PROFITS TO AVOID DEPLETION OR EXHAUSTION OF THEIR ASSETS. THIS DISCLOSURE DOCUMENT CONTAINS A COMPLETE DESCRIPTION OF EACH EXPENSE TO BE CHARGED THIS POOL BEGINNING AT PAGE 34 AND A STATEMENT OF THE PERCENTAGE RETURN NECESSARY TO BREAK-EVEN, THAT IS, TO RECOVER THE AMOUNT OF YOUR INITIAL INVESTMENT, AT PAGE 4.
THIS BRIEF STATEMENT CANNOT DISCLOSE ALL THE RISKS AND OTHER FACTORS NECESSARY TO EVALUATE YOUR PARTICIPATION IN THIS COMMODITY POOL. THEREFORE, BEFORE YOU DECIDE TO PARTICIPATE IN THIS COMMODITY POOL, YOU SHOULD CAREFULLY STUDY THIS DISCLOSURE DOCUMENT, INCLUDING A DESCRIPTION OF THE PRINCIPAL RISK FACTORS OF THIS INVESTMENT, BEGINNING AT PAGE 7.
YOU SHOULD ALSO BE AWARE THAT THIS COMMODITY POOL MAY TRADE FOREIGN FUTURES OR OPTIONS CONTRACTS. TRANSACTIONS ON MARKETS LOCATED OUTSIDE THE UNITED STATES, INCLUDING MARKETS FORMALLY LINKED TO A UNITED STATES MARKET, MAY BE SUBJECT TO REGULATIONS WHICH OFFER DIFFERENT OR DIMINISHED PROTECTION TO THE POOL AND ITS PARTICIPANTS. FURTHER, UNITED STATES REGULATORY AUTHORITIES MAY BE UNABLE TO COMPEL THE ENFORCEMENT OF THE RULES OF REGULATORY AUTHORITIES OR MARKETS IN NON-UNITED STATES JURISDICTIONS WHERE TRANSACTIONS FOR THE POOL MAY BE EFFECTED.
This prospectus does not include all of the information or exhibits in the Fund’s registration statement. You can read and copy the entire registration statement at the public reference facilities maintained by the Securities and Exchange Commission in Washington, D.C.
The Fund files monthly, quarterly and annual reports with the SEC. You can read and copy these reports at the SEC public reference facilities in Washington, D.C. Please call the SEC at 1-800-SEC-0330 for further information.
The Fund’s filings are posted at the SEC website at http://www.sec.gov.
CAMPBELL & COMPANY, INC.
General Partner
210 West Pennsylvania Avenue
Towson, Maryland 21204
(410) 296-3301
i
PART ONE — DISCLOSURE DOCUMENT
TABLE OF CONTENTS
| Page | ||||||
| SUMMARY | 1 | |||||
| General | 1 | |||||
| Plan of Distribution | 1 | |||||
| A Summary of Risk Factors You Should Consider Before Investing in the Fund | 2 | |||||
| Investment Factors You Should Consider Before Investing in the Fund | 3 | |||||
| Campbell & Company, Inc. | 3 | |||||
| Charges to the Fund | 4 | |||||
| Estimate of Break-Even Level | 4 | |||||
| Distributions and Redemptions | 5 | |||||
| Federal Income Tax Aspects | 5 | |||||
| CAMPBELL STRATEGIC ALLOCATION FUND, L.P. ORGANIZATIONAL CHART | 6 | |||||
| THE RISKS YOU FACE | 7 | |||||
| Market Risks | 7 | |||||
You Could Possibly Lose Your Total Investment in the Fund | 7 | |||||
The Fund is Highly Leveraged | 7 | |||||
Your Investment Could be Illiquid | 7 | |||||
Forward, Option and Swap Transactions are Over-the-Counter, are Not Regulated and are Subject to Credit Risk | 7 | |||||
Options on Futures and Over-the-Counter Contracts are Speculative and Highly Leveraged | 8 | |||||
An Investment in the Fund May Not Diversify an Overall Portfolio | 8 | |||||
| Trading Risks | 8 | |||||
Campbell & Company Analyzes Primarily Technical Market Data | 8 | |||||
Increased Competition from Other Trend-Following Traders Could Reduce Campbell & Company’s Profitability | 8 | |||||
Speculative Position Limits May Alter Trading Decisions for the Fund | 9 | |||||
Increase in Assets Under Management May Make Profitable Trading More Difficult | 9 | |||||
Investors Will Not be Able to View the Fund’s Holdings on a Daily Basis | 9 | |||||
| Tax Risks | 9 | |||||
Investors are Taxed Based on Their Share of Fund Profits | 9 | |||||
Tax Could be Due from Investors on Their Share of the Fund’s Ordinary Income Despite Overall Losses | 9 | |||||
There Could be a Limit on the Deductibility of Brokerage and Performance Fees | 10 | |||||
| Other Risks | 10 | |||||
Fees and Commissions are Charged Regardless of Profitability and are Subject to Change | 10 | |||||
The Futures Brokers Could Fail and Have Been Subject to Disciplinary Action | 10 | |||||
Investors Must Not Rely on the Past Performance of Either Campbell & Company or the Fund in Deciding Whether to Buy Units | 10 | |||||
Parties to the Fund Have Conflicts of Interest | 10 | |||||
There Are No Independent Experts Representing Investors | 11 | |||||
The Fund Places Significant Reliance on Campbell & Company | 11 | |||||
The Fund Could Terminate Before Expiration of its Stated Term | 11 | |||||
The Fund is Not a Regulated Investment Company | 11 | |||||
Proposed Regulatory Change is Impossible to Predict | 11 | |||||
ii
| Page | ||||||
Forwards, Options, Swaps, Hybrids and Other Derivatives are Not Subject to CFTC Regulation | 11 | |||||
The Fund is Subject to Foreign Market Credit and Regulatory Risk | 12 | |||||
The Fund is Subject to Foreign Exchange Risk | 12 | |||||
Transfers Could be Restricted | 12 | |||||
A Single-Advisor Fund May Be More Volatile Than a Multi-Advisor Fund | 12 | |||||
The Performance Fee Could be an Incentive to Make Riskier Investments | 12 | |||||
The Fund May Distribute Profits to Limited Partners at Inopportune Times | 12 | |||||
Potential Inability to Trade or Report Due to Systems Failure | 12 | |||||
Potential Disruption or Inability to Trade Due to a Failure to Receive Timely and Accurate Market Data from Third Party Vendors | 13 | |||||
| SELECTED FINANCIAL DATA | 14 | |||||
| SUPPLEMENTARY FINANCIAL INFORMATION | 14 | |||||
| CAMPBELL & COMPANY, INC. | 15 | |||||
| Description | 15 | |||||
| The Advisory Agreement | 17 | |||||
| Trading Systems | 17 | |||||
| Trading Capacity | 19 | |||||
| MANAGEMENT’S ANALYSIS OF OPERATIONS | 19 | |||||
| Introduction | 19 | |||||
| Critical Accounting Policies | 19 | |||||
| Capital Resources | 19 | |||||
| Liquidity | 19 | |||||
| Results of Operations | 20 | |||||
| Off-Balance Sheet Risk | 26 | |||||
| Disclosures About Certain Trading Activities that Include Non-Exchange Traded Contracts Accounted for at Fair Value | 26 | |||||
| Quantitative and Qualitative Disclosures About Market Risk | 27 | |||||
| General | 30 | |||||
| PAST PERFORMANCE OF THE CAMPBELL STRATEGIC ALLOCATION FUND, L.P. | 31 | |||||
| CONFLICTS OF INTEREST | 31 | |||||
| Campbell & Company, Inc. | 31 | |||||
| The Futures Brokers and the Over-the-Counter Counterparties | 32 | |||||
| The Selling Agents | 32 | |||||
| Fiduciary Duty and Remedies | 33 | |||||
| Indemnification and Standard of Liability | 33 | |||||
| CHARGES TO THE FUND | 34 | |||||
| Brokerage Fee | 34 | |||||
| Other Fund Expenses | 34 | |||||
| Campbell & Company, Inc. | 35 | |||||
| The Futures Brokers | 36 | |||||
| The Selling Agents | 36 | |||||
| The Over-the-Counter Counterparties | 36 | |||||
| Offering Expenses | 37 | |||||
| Other Expenses | 37 | |||||
| USE OF PROCEEDS | 37 | |||||
| THE FUTURES BROKERS | 38 | |||||
| THE OVER-THE-COUNTER COUNTERPARTIES | 40 | |||||
| CAPITALIZATION | 40 | |||||
| DISTRIBUTIONS AND REDEMPTIONS | 40 | |||||
| Distributions | 40 | |||||
| Redemptions | 41 | |||||
| Redemption Fees | 41 | |||||
| Net Asset Value | 41 | |||||
iii
| Page | |||||
| AGREEMENT OF LIMITED PARTNERSHIP | 42 | ||||
| Organization and Limited Liability | 42 | ||||
| Management of Partnership Affairs | 42 | ||||
| Sharing of Profits and Losses | 42 | ||||
| Dispositions | 42 | ||||
| Dissolution and Termination of the Fund | 42 | ||||
| Amendments and Meetings | 42 | ||||
| Indemnification | 43 | ||||
| Reports to Limited Partners | 43 | ||||
| FEDERAL INCOME TAX ASPECTS | 43 | ||||
| The Fund’s Partnership Tax Status | 43 | ||||
| Taxation of Limited Partners on Profits and Losses of the Fund | 44 | ||||
| Fund Losses by Limited Partners | 44 | ||||
| “Passive-Activity Loss Rules” and Their Effect on the Treatment of Income and Loss | 44 | ||||
| Cash Distributions and Unit Redemptions | 44 | ||||
| Gain or Loss on Section 1256 Contracts and Non-Section 1256 Contracts | 44 | ||||
| Tax on Capital Gains and Losses | 44 | ||||
| Limited Deduction for Certain Expenses | 44 | ||||
| Interest Income | 45 | ||||
| Syndication Fees | 45 | ||||
| Investment Interest Deductibility Limitations | 45 | ||||
| Unrelated Business Taxable Income | 45 | ||||
| IRS Audits of the Fund and its Limited Partners | 45 | ||||
| State and Other Taxes | 45 | ||||
| Taxation of Foreign Limited Partners | 45 | ||||
| INVESTMENT BY ERISA ACCOUNTS | 46 | ||||
| General | 46 | ||||
| Special Investment Consideration | 46 | ||||
| The Fund Should Not Be Deemed to Hold “Plan Assets” | 46 | ||||
| Ineligible Purchasers | 47 | ||||
| PLAN OF DISTRIBUTION | 47 | ||||
| Subscription Procedure | 47 | ||||
| Representations and Warranties of Investors in the Subscription Agreement | 48 | ||||
| Minimum Investment | 48 | ||||
| Investor Suitability | 48 | ||||
| The Selling Agents | 49 | ||||
| LIMITED PARTNER PRIVACY POLICY | 50 | ||||
| LEGAL MATTERS | 50 | ||||
| EXPERTS | 50 | ||||
| MONTHLY REPORTS | 51 | ||||
| INDEX TO FINANCIAL STATEMENTS | 54 | ||||
| PART TWO — STATEMENT OF ADDITIONAL INFORMATION TABLE OF CONTENTS | |||||
| The Futures, Forward, Option and Swap Markets | 99 | ||||
| Historical Perspective of Managed Futures | 102 | ||||
| Investment Factors | 103 | ||||
| Value of Diversification — Managed Futures Industry | 105 | ||||
| Value of Diversification — Campbell Strategic Allocation Fund | 109 | ||||
| Supplemental Performance | 118 | ||||
| Glossary of Terms | 120 | ||||
| APPENDIX | |||||
| Appendix 1 — Blue Sky Glossary | APP-1 | ||||
| EXHIBITS | |||||
| EXHIBIT A — Amended Agreement of Limited Partnership | A-1 | ||||
| EXHIBIT B — Request for Redemption | B-1 | ||||
| EXHIBIT C — Subscription Requirements | C-1 | ||||
| EXHIBIT D — Subscription Agreement and Power of Attorney | D-1 | ||||
iv
SUMMARY
General
The Campbell Strategic Allocation Fund, L.P. allows you to participate in alternative or non-traditional investments, namely the U.S. and international futures, forward, option and swap markets. Specifically, the Fund trades in a portfolio primarily focused on financial futures and forwards, which are instruments designed to hedge or speculate on changes in interest rates, currency exchange rates or stock index values. A secondary emphasis is on metals and energy products. Campbell & Company, the Fund’s general partner, uses its trend-following, technical trading and risk control methods to seek substantial medium- and long-term capital appreciation while, at the same time, seeking to manage risk and volatility. Campbell & Company provides advisory services to numerous other funds and individually managed accounts similar to the services Campbell & Company provides to the Fund. Campbell & Company has been using its technical approach since 1972 — one of the longest performance records of any currently active futures fund manager and has developed and refined its approach over the past 34 years. See “Past Performance of the Campbell Strategic Allocation Fund, L.P.” for the performance data required to be disclosed for the most recent five calendar years.
Futures are standardized contracts traded on commodity exchanges that call for the future delivery of commodities at a specified time and place. While futures contracts are traded on a wide variety of commodities, the Fund will concentrate its futures trading in financial instruments such as interest rates, foreign exchange and stock index contracts, and metal and energy contracts. The U.S. futures markets are regulated under the Commodity Exchange Act, which is administered by the CFTC. The Fund will trade futures positions on margin, meaning that the Fund will utilize leverage in its trading.
Currencies and other commodities may be purchased or sold by the Fund for future delivery or cash settlement through banks or dealers pursuant to forward, option or swap contracts. Unlike futures contracts, forward, option and swap contracts are not standardized and these markets are largely unregulated. The Fund periodically enters into swap transactions, which are individually negotiated, non-standardized agreements between two parties to exchange cash flows measured by different interest rates, exchange rates or prices, with payments calculated by reference to a principal amount or quantity.
The following summary provides a review in outline form of important aspects of an investment in the Fund.
Plan of Distribution
How to Subscribe for Units
| • | During the continuing offering period, units will be offered at a price of net asset value per unit. The net assets of the Fund are its assets less its liabilities determined in accordance with the Limited Partnership Agreement. The net asset value per unit equals the net assets of the Fund divided by the number of units outstanding as of the date of the determination. Investors must submit subscriptions at least five business days prior to the applicable month-end closing date. Approved subscriptions will be accepted once payments are received and cleared. | |
| • | The Fund will accept subscriptions throughout the continuing offering period, which can be terminated by Campbell & Company at any time. | |
| • | Interest earned while subscriptions are being processed will either be paid to subscribers in the form of additional units or will be returned in cash to those whose applications are rejected. | |
| • | The selling agents will use their best efforts to sell the units offered, without any firm underwriting commitment.Investors are required to make representations and warranties relating to their suitability to purchase the units in the Subscription Agreement and Power of Attorney. Read the Subscription Agreement and Power of Attorney as well as this prospectus carefully before you decide whether to invest. |
Who May Invest in the Fund
The minimum investment is $100,000. Limited partners who are trustees or custodians of eligible employee benefit plans and individual
-1-
retirement accounts may increase their investment in the Fund with a minimum additional investment of $10,000; all other limited partners may increase their investment with a minimum additional investment of $25,000.
Is the Campbell Strategic Allocation Fund a Suitable Investment for You?
An investment in the Fund is speculative and involves a high degree of risk. The Fund is not a complete investment program. Campbell & Company offers the Fund as a diversification opportunity for an investor’s entire investment portfolio, and therefore an investment in the Fund should only be a limited portion of the investor’s portfolio. You must, at a minimum, have:
| 1) | a net worth of at least $150,000, exclusive of home, furnishings and automobiles; or | |
| 2) | a net worth, similarly calculated, of at least $45,000 and an annual gross income of at least $45,000. |
A number of jurisdictions in which the units are offered impose higher minimum suitability standards on prospective investors. These suitability standards are, in each case, regulatory minimums only, and merely because you meet such standards does not mean that an investment in the units is suitable for you.You may not invest more than 10% of your net worth, exclusive of home, furnishings and automobiles, in the Fund.
A Summary of Risk Factors You Should Consider Before Investing in the Fund
| • | The Fund is a highly volatile and speculative investment. There can be no assurance that the Fund will achieve its objectives or avoid substantial losses. You must be prepared to lose all or a substantial amount of your investment. Campbell & Company has from time to time in the past incurred substantial losses in trading on behalf of its clients. | |
| • | Futures, forward, option and swap trading is a “zero-sum” economic activity in which for every gain there is an equal and offsetting loss (disregarding transaction costs), as opposed to a typical securities investment, in which there is an expectation of constant yields (in the case of debt) or participation over time in general economic growth (in the case of equity). It is possible that the Fund could incur major losses while stock and bond prices rise substantially in a prospering economy. | |
| • | The Fund trades in futures, forward, option and swap contracts. Therefore, the Fund is a party to financial instruments with elements of off-balance sheet market risk, including market volatility and possible illiquidity. There is also a credit risk that a counterparty will not be able to meet its obligations to the Fund. | |
| • | Campbell & Company’s current equity under management is at or near its all-time high. Notwithstanding Campbell & Company’s research, risk and portfolio management efforts, there may come a time when the combination of available markets and new strategies may not be sufficient for Campbell & Company to add new assets without detriment to diversification. Reduced diversification and more concentrated portfolios may have a detrimental effect on your investment. | |
| • | The Fund is subject to numerous conflicts of interest including the following: |
| 1) | Campbell & Company is both the general partner and trading advisor of the Fund and its fees were not negotiated at arm’s length. For these reasons, Campbell & Company has a disincentive to add or replace advisors, even if doing so may be in the best interests of the Fund; | |
| 2) | Campbell & Company may have incentives to favor other accounts over the Fund; | |
| 3) | Campbell & Company, the Fund’s futures brokers and over-the-counter counterparties and their respective principals and affiliates may trade in the futures, forward, option and swap markets for their own accounts and may take positions opposite or ahead of those taken for the Fund; | |
| 4) | Selling agents will be entitled to ongoing compensation as a result of their clients remaining in the Fund, so a conflict exists between the agents’ inter- |
-2-
| est in maximizing compensation and in advising their clients to make investment decisions in the clients’ best interests; and | ||
| 5) | Campbell & Company operates other commodity pool offerings which may have materially different terms and operate at a lower overall cost structure. |
| • | Limited partners take no part in the management of the Fund and although Campbell & Company is an experienced professional manager, past performance is not necessarily indicative of future results. | |
| • | Campbell & Company will be paid a brokerage fee of up to 8% annually, irrespective of profitability. Campbell & Company will also be paid quarterly performance fees equal to 20% of aggregate cumulative appreciation, excluding interest income, in net asset value, if any. Currently, the Fund’s actual brokerage fee is approximately 7.40% per annum. | |
| • | The Fund is a single-advisor fund which may be inherently more volatile than multi-advisor managed futures products. | |
| • | Although the Fund is liquid compared to other alternative investments such as real estate or venture capital, liquidity is restricted, as the units may only be redeemed on a monthly basis, upon ten business days’ advance written notice to Campbell & Company. Redemption fees apply to units redeemed on or prior to the twelfth month-end following purchase. You may transfer or assign your units after 30 days’ advance written notice, and only with the consent of Campbell & Company. | |
| • | Investors are taxed each year on their share of the Fund’s profits, irrespective of whether they redeem any units or receive any cash distributions from the Fund. |
Investment Factors You Should Consider Before Investing in the Fund
| • | The Fund is a leveraged investment fund managed by an experienced, professional trading advisor and it trades in a wide range of futures, forward, option and swap markets. | |
| • | Campbell & Company utilizes several independent and different proprietary trading systems for the Fund. | |
| • | The Fund has the potential to help diversify traditional securities portfolios. A diverse portfolio consisting of assets that perform in an unrelated manner, or non-correlated assets, has the potential to increase overall return and reduce the volatility (a primary measure of risk) of a portfolio. As a risk transfer activity, futures, forward, option and swap trading has no inherent correlation with any other investment. However, non-correlation will not provide any diversification advantages unless the non-correlated assets are outperforming other portfolio assets, and there is no guarantee that the Fund will outperform other sectors of an investor’s portfolio or not produce losses. The Fund’s profitability also depends on the success of Campbell & Company’s trading techniques. If the Fund is unprofitable, then it will not increase the return on an investor’s portfolio or achieve its diversification objectives. | |
| • | Investors in the Fund get the advantage of limited liability in highly leveraged trading. |
Campbell & Company, Inc.
Campbell & Company, the general partner and trading advisor for the Fund, administers the Fund and directs its trading. Campbell & Company has over 34 years of experience trading in the futures and forward markets. As of December 31, 2005, Campbell & Company was managing approximately $11.4 billion in the futures, forward, option and swap markets, including approximately $10.0 billion in its Financial, Metal & Energy Large Portfolio. The Financial, Metal & Energy Large Portfolio, to which all of the Fund’s assets are currently allocated, is concentrated in the financial markets, such as interest rates, foreign exchange and stock indices, as well as metals and energy products. Campbell & Company has sole authority and responsibility for directing investment and reinvestment of the Fund’s assets.
Campbell & Company uses a systematic trading approach combined with quantitative portfolio management analysis and seeks to identify and profit from price movements in the futures,
-3-
forward, option and swap markets. Multiple trading models are utilized in most markets traded. Each model analyzes market movements and internal market and price configurations. Campbell & Company utilizes a proprietary, volatility-based system for allocating capital to a portfolio’s constituent markets. Each market is assigned a dollar risk value based on contract size and volatility, which forms the basis for structuring a risk-balanced portfolio.
Charges to the Fund
The Fund’s charges are substantial and must be offset by trading gains and interest income in order to avoid depletion of the Fund’s assets.
Campbell & Company
| • | Brokerage fee of up to 8% of net assets per annum, of which up to 1% is paid to the futures brokers, 4% is paid to the selling agents and Campbell & Company retains the remaining 3%. | |
| • | 20% of quarterly appreciation in the Fund’s net assets, excluding interest income and as adjusted for subscriptions and redemptions. | |
| • | Reimbursement of offering expenses incurred in the continuing offering over a 30-month period following incurrence of each such expense, estimated at, and not to exceed, 2.5% of the aggregate subscriptions accepted by Campbell & Company. | |
| • | Redemption fees apply to units redeemed through the first twelve month-ends following purchase. |
Dealers and Others
| • | “Bid-ask” spreads for off-exchange contracts. | |
| • | Operating expenses such as legal, auditing, administration, printing and postage, up to a maximum of 0.50% of net assets per year. |
Estimate of Break-Even Level
In order for an investor to “break-even” on his investment in the first year of trading, assuming an initial investment of $100,000, the Fund must earn $3,900, or 3.90%, provided that no redemption charge is applicable.
Redemption fees apply through the first twelve month-ends following purchase as follows: 4% of net asset value per unit redeemed through the third month-end, 3% of net asset value per unit redeemed through the sixth month-end, 2% of net asset value per unit redeemed through the ninth month-end, and 1% of net asset value per unit redeemed through the twelfth month-end. The month-end as of which the unit is purchased is counted as the first month-end. After the twelfth month-end following purchase of a unit, no redemption fees apply. Because the purchase date counts as the first month-end in determining whether a redemption fee applies, no redemption fee would be due in respect of a unit redeemed on the first anniversary of the purchase. Accordingly, redemption fees are not included in the “break-even” estimate set forth below.
| Assumed Initial Investment | $ | 100,000.00 | ||
| Brokerage Fee (7.40%) | $ | 7,400.00 | ||
| Organization & Offering Expense Reimbursement (0.40%) | 400.00 | |||
| Operating Expenses (0.10%) | 100.00 | |||
| Less: Interest Income (4.00%)* | (4,000.00 | ) | ||
| Amount of Trading Income Required to Break-Even on an Investor’s Initial Investment in the First Year of Trading | $ | 3,900.00 | ||
| Percentage of Initial Investment Required to Break-Even | 3.90 | % | ||
| The maximum offering expense reimbursement is 2.5% of the total subscription amount over 30 months. This amount represents, over the last two years, an actual charge equal to 0.40% of average month-end net assets. Operating expenses are subject to a maximum limit of 0.50% of net assets per annum. The estimates also do not account for the bid-ask spreads in connection with the Fund’s forward, option and swap contract trading. No performance fee is included in the calculation of the “break-even” level since all operating expenses of the Fund must be offset before a performance fee is accrued. | ||||
| * Variable based on current interest rates. | ||||
-4-
Distributions and Redemptions
The Fund is intended to be a medium- to long-term,i.e., 3- to 5-year, investment. Units are transferable, but no market exists for their sale and none will develop. Monthly redemptions are permitted upon ten business days’ advance written notice to Campbell & Company. Redemption fees, as described above, apply through the first twelve month-ends following purchase. After the twelfth month-end following purchase of a unit, no redemption fees apply. Campbell & Company reserves the right to make distributions of profits at any time in its sole discretion.
Federal Income Tax Aspects
In the opinion of Sidley Austin LLP, counsel to Campbell & Company, the Fund is classified as a partnership and will not be considered a publicly traded partnership taxable as a corporation for federal income tax purposes based on the type of income it is expected to earn. As such, whether or not the Fund has distributed any cash to the limited partners, each limited partner must report his allocable share of items of income, gain, loss and deduction of the Fund and is individually liable for income tax on such share. The Fund invests in futures and other commodity contracts, gain or loss on which will, depending on the contracts traded, constitute a mixture of:
1) ordinary income or loss; and/or
2) capital gain or loss.
Trading losses of the Fund, which will generally constitute capital losses, may only be available to offset a limited amount of interest income allocated to the limited partners. Although the Fund treats the brokerage fees and performance fees paid to Campbell & Company as ordinary expenses, such expenses may be subject to restrictions on deductibility for federal income tax purposes or be treated as non-deductible, syndication costs by the Internal Revenue Service.
[REMAINDER OF THIS PAGE LEFT BLANK INTENTIONALLY.]
-5-
CAMPBELL STRATEGIC ALLOCATION FUND, L.P.
ORGANIZATIONAL CHART
The organizational chart below illustrates the relationships among the various service providers of this offering. Campbell & Company is both the general partner and trading advisor for the Fund. The selling agents (other than Campbell Financial Services, Inc.), futures brokers and over-the-counter counterparties are not affiliated with Campbell & Company or the Fund.
| * | Campbell & Company presently serves as general partner or sponsor for five other commodity pools. |
-6-
THE RISKS YOU FACE
Market Risks
You Could Possibly Lose Your Total Investment in the Fund
Futures, forward, option and swap contracts have a high degree of price variability and are subject to occasional rapid and substantial changes. Consequently, you could lose all or a substantial amount of your investment in the Fund.
The Fund is Highly Leveraged
Because the amount of margin funds necessary to be deposited in order to enter into a futures, forward, option or swap contract position is typically about 2% to 10% of the total value of the contract, Campbell & Company is able to hold positions in the Fund’s account with face values equal to several times the Fund’s net assets. The ratio of margin to equity is typically 10% to 20%, but can range from 5% to 30%. As a result of this leveraging, even a small movement in the price of a contract can cause major losses.
Your Investment Could be Illiquid
Futures, forward, option and swap positions cannot always be liquidated at the desired price. The prices at which a sale or purchase occur may differ from the prices expected because there may be a delay between receiving a quote and executing a trade, particularly in circumstances where a market has limited trading volume and prices are often quoted for relatively limited quantities. A market disruption, such as when foreign governments may take or be subject to political actions which disrupt the markets in their currency or major exports, can also make it difficult to liquidate a position. In addition, most U.S. futures exchanges have established “daily price fluctuation limits” which preclude the execution of trades at prices outside of the limit, and, from time to time, the CFTC or the exchanges may suspend trading in market disruption circumstances. In these cases, it is possible that Campbell & Company, as trading advisor, could be required to maintain a losing position that it otherwise would exit and incur significant losses or be unable to establish a position and miss a profit opportunity.
Unexpected market illiquidity has caused major losses in recent years in such sectors as emerging markets and mortgage-backed securities. There can be no assurance that the same will not happen to the Fund at any time or from time to time. The large size of the positions which Campbell & Company acquires for the Fund increases the risk of illiquidity by both making its positions more difficult to liquidate and increasing the losses incurred while trying to do so.
Also, there is no secondary market for the units and none is expected to develop. While the units have redemption rights, there are restrictions, and possible fees assessed. For example, redemptions can occur only at the end of a month. If a large number of redemption requests were to be received at one time, the Fund might have to liquidate positions to satisfy the requests. Such a forced liquidation could adversely affect the Fund and consequently your investment.
Transfers of interest in the units are subject to limitations, such as 30 days’ advance notice of any intent to transfer. Also, Campbell & Company may deny a request to transfer if it determines that the transfer may result in adverse legal or tax consequences for the Fund. See “Agreement of Limited Partnership — Dispositions.”
Forward, Option and Swap Transactions are Over-the-Counter, are Not Regulated and are Subject to Credit Risk
The Fund trades forward, option and swap contracts in foreign currencies, metals and energy. Such contracts are typically traded over-the-counter through a dealer market, which is dominated by major money center and investment banks, and is not regulated by the Commodity Futures Trading Commission. Thus, you do not receive the protection of CFTC regulation or the statutory scheme of the Commodity Exchange Act in connection with this trading activity by the Fund. The market for forward, option and swap contracts relies upon the integrity of market participants in lieu of the additional regulation imposed by the CFTC on participants in the futures markets. This regulation includes, for example, trading practices and other customer protection requirements, and minimum financial and trade reporting requirements. The absence of regulation could expose the Fund to significant losses in the event of trading abuses or financial failure by participants in the forward, option and swap markets which it might otherwise have avoided. Also, the Fund faces the risk of non-
-7-
performance by its counterparties to forward, option and swap contracts and such non-performance may cause some or all of its gains to remain unrealized.
The Fund has a substantial portion of its assets on deposit with financial institutions. In the event of a financial institution’s insolvency, recovery of Fund assets on deposit may be limited to account insurance or other protection afforded such deposits, if any. Campbell & Company seeks to minimize credit risk primarily by depositing and maintaining the Fund’s assets at financial institutions and brokers that Campbell & Company believes to be creditworthy.
Options on Futures and Over-the-Counter Contracts are Speculative and Highly Leveraged
Options on futures and over-the-counter contracts may be used by the Fund to generate premium income or capital gains. The buyer of an option risks losing the entire purchase price (the premium) of the option. The writer (seller) of an option risks losing the difference between the premium received for the option and the price of the commodity, futures or forward contract underlying the option which the writer must purchase or deliver upon exercise of the option (which losses can be unlimited). Specific market movements of the commodity, futures or forward contracts underlying an option cannot accurately be predicted. Successful options trading requires an accurate assessment of near-term volatility in the underlying instruments, as that volatility is immediately reflected in the price of the option. Correct assessment of market volatility can therefore be of much greater significance in trading options than it is in trading futures and forwards, where volatility may not have as great an effect on price.
An Investment in the Fund May Not Diversify an Overall Portfolio
Historically, alternative investments such as managed futures funds have been generally non-correlated to the performance of other asset classes such as stocks and bonds. Non-correlation means that there is no statistically valid relationship between the past performance of futures, forward, option and swap contracts on the one hand and stocks or bonds on the other hand. Non-correlation should not be confused with negative correlation, where the performance of two asset classes would be exactly opposite. Because of this non-correlation, the Fund cannot be expected to be automatically profitable during unfavorable periods for the stock market or vice versa. The futures, forward, option and swap markets are fundamentally different from the securities markets in that for every gain made in a futures, forward, option or swap transaction, the opposing side of that transaction will have an equal and off-setting loss. If the Fund does not perform in a manner non-correlated with the general financial markets or does not perform successfully, you will obtain no diversification benefits by investing in the units and the Fund may have no gains to offset your losses from other investments.
Trading Risks
Campbell & Company Analyzes Primarily
Technical Market Data
The trading systems used by Campbell & Company for the Fund are primarily technical. The profitability of trading under these systems depends on, among other things, the occurrence of significant price movements, up or down, in futures, forward, option or swap prices. Such price movements may not develop; there have been periods in the past without such price movements.
The likelihood of the units being profitable could be materially diminished during periods when events external to the markets themselves have an important impact on prices. During such periods, Campbell & Company’s historic price analysis could establish positions on the wrong side of the price movements caused by such events.
Increased Competition from Other Trend- Following Traders Could Reduce Campbell & Company’s Profitability
There has been a dramatic increase over the past 10 to 15 years in the amount of assets managed by trend-following trading systems like some of the Campbell & Company programs. In 1980, the assets in the managed futures industry were estimated at approximately $300 million; by the end of 2005, this estimate had risen to approximately $131 billion. Increased trading competition from other trend-following traders could operate to the detriment of the Fund. It may become more difficult for the Fund to implement its trading strategy if these other trading advisors using technical systems are, at the
-8-
same time, also attempting to initiate or liquidate futures, forward, option or swap positions, or otherwise alter trading patterns.
Speculative Position Limits May Alter Trading Decisions for the Fund
The CFTC has established limits on the maximum net long or net short positions which any person may hold or control in certain futures contracts. Some exchanges also have established such limits. All accounts controlled by Campbell & Company, including the account of the Fund, are combined for speculative position limit purposes. If positions in those accounts were to approach the level of the particular speculative position limit, such limits could cause a modification of Campbell & Company’s trading decisions for the Fund or force liquidation of certain futures positions. Either of these actions may not be in the best interest of the investors.
Increase in Assets Under Management May Make Profitable Trading More Difficult
Campbell & Company’s current equity under management is at or near its all-time high. Campbell & Company has not agreed to limit the amount of additional equity which it may manage, and is actively engaged in raising assets for existing and new accounts including the Fund. The more equity Campbell & Company manages, the more difficult it may be for Campbell & Company to trade profitably because of the difficulty of trading larger positions without adversely affecting prices and performance. Accordingly, such increases in equity under management may require Campbell & Company to modify its trading decisions for the Fund which could have a detrimental effect on your investment. Such considerations may also cause Campbell & Company to eliminate smaller markets from consideration for inclusion in its Financial, Metal & Energy Large Portfolio, reducing the range of markets in which trading opportunities may be pursued. Campbell & Company reserves the right to make distributions of profits to limited partners in an effort to control asset growth. In addition, Campbell & Company may have an incentive to favor other accounts because the compensation received from some other accounts does exceed the compensation it receives from managing the Fund’s account. Because records with respect to other accounts are not accessible to limited partners in the Fund, the limited partners will not be able to determine if Campbell & Company is favoring other accounts. See “Campbell & Company, Inc. — Trading Capacity.”
Investors Will Not be Able to View the Fund’s Holdings on a Daily Basis
Campbell & Company makes the Fund’s trading decisions. While Campbell & Company receives daily trade confirmations from the futures brokers and over-the-counter counterparties, the Fund’s trading results are reported to limited partners monthly. Accordingly, an investment in the Fund does not offer limited partners the same transparency,i.e., an ability to review all investment positions daily, that a personal trading account offers.
Tax Risks
Investors are Taxed Based on Their Share of Fund Profits
Investors are taxed each year on their share of the Fund’s profits, if any, irrespective of whether they redeem any units or receive any cash distributions from the Fund. Campbell & Company has the authority to make such distributions at any time in its sole discretion.
All performance information included in this prospectus is presented on a pre-tax basis; the investors who experienced such performance had to pay the related taxes from other sources.
Tax Could be Due from Investors on Their Share of the Fund’s Ordinary Income Despite Overall Losses
Investors may be required to pay tax on their allocable share of the Fund’s ordinary income, which in the case of the Fund is the Fund’s interest income, gain on some foreign futures contracts, and certain other investment assets, even though the Fund incurs overall losses. Capital losses can be used only to offset capital gains and $3,000 of ordinary income each year. Consequently, if an investor were allocated $5,000 of ordinary income and $10,000 of capital losses, the investor would owe tax on $2,000 of ordinary income even though the investor would have a $5,000 loss for the year. The $7,000 capital loss could be used in subsequent years to offset capital gain and ordinary income, but subject to the same annual limitation on its deductibility against ordinary income.
-9-
There Could be a Limit on the Deductibility of Brokerage and Performance Fees
Although the Fund treats the brokerage fees and performance fees paid to Campbell & Company and other expenses of the Fund as ordinary and necessary business expenses, upon audit the Fund may be required to treat such fees as “investment advisory fees” if the Fund’s trading activities did not constitute a trade or business for tax purposes. If the expenses were investment advisory expenses, a limited partner’s tax liability would likely increase. In addition, upon audit, a portion of the brokerage fees might be treated as a non-deductible syndication cost or might be treated as a reduction in the Fund’s capital gain or as an increase in the Fund’s capital loss. If the brokerage fees were so treated, a limited partner’s tax liability would likely increase.
Other Risks
Fees and Commissions are Charged Regardless of Profitability and are Subject to Change
The Fund is subject to substantial charges payable irrespective of profitability, in addition to performance fees which are payable based on the Fund’s profitability. Included in these charges are brokerage fees and operating expenses. On the Fund’s forward, option and swap trading, “bid-ask” spreads and prime brokerage fees are incorporated into the pricing of the Fund’s forward and option contracts by the counterparties in addition to the brokerage fees paid by the Fund. It is not possible to quantify the “bid-ask” spreads paid by the Fund because the Fund cannot determine the profit its counterparty is making on the forward, option and swap transactions. Such spreads can at times be significant. In addition, while currently not contemplated, the limited partnership agreement allows for changes to be made to the brokerage fee and performance fee upon sixty days’ notice to the limited partners.
The Futures Brokers Could Fail and Have Been Subject to Disciplinary Action
The current futures brokers for the Fund are UBS Financial Services Inc. and Goldman, Sachs & Co. The Commodity Exchange Act generally requires futures brokers to segregate all funds received from customers from such brokers’ proprietary assets. If the futures brokers fail to do so, the assets of the Fund might not be fully protected in the event of the bankruptcy of the futures brokers. Furthermore, in the event of the futures brokers’ bankruptcy, the Fund could lose the entire amount, or be limited to recovering only a pro rata share of all available funds segregated on behalf of the futures brokers’ combined customer accounts, even though certain property specifically traceable to the Fund (for example, Treasury bills deposited by the Fund with the futures brokers as margin) was held by the futures brokers. The futures brokers have been the subject of regulatory and private causes of action, as described under “The Futures Brokers.”
Furthermore, dealers in forward, option and swap contracts are not regulated by the Commodity Exchange Act and are not obligated to segregate customer assets. As a result, you do not have such basic protection in forward, option and swap contracts.
Investors Must Not Rely on the Past Performance of Either Campbell & Company or the Fund in Deciding Whether to Buy Units
The future performance of the Fund is not predictable, and no assurance can be given that the Fund will perform successfully in the future. Past performance is not necessarily indicative of future results.
Parties to the Fund Have Conflicts of Interest
Campbell & Company has not established any formal procedures to resolve the following conflicts of interest. Consequently, there is no independent control over how Campbell & Company resolves these conflicts which can be relied upon by investors as ensuring that the Fund is treated equitably with other Campbell & Company clients.
Campbell & Company has a conflict of interest because it acts as the general partner and sole trading advisor for the Fund.
Since Campbell & Company acts as both trading advisor and general partner for the Fund, it is very unlikely that its advisory contract will be terminated by the Fund. The fees payable to Campbell & Company were established by it and were not the subject of arm’s-length negotiation. These fees consist of up to an 8% brokerage fee (of which 3% is retained) and a 20% performance fee. Campbell & Company, as general partner, determines whether or not distributions are made and it receives increased fees to the extent distributions are not made. Campbell & Company
-10-
has the authority to make such distributions at any time in its sole discretion.
Selling agents will be entitled to ongoing compensation as a result of their clients remaining in the Fund, so a conflict exists between the selling agent’s interest in maximizing compensation and in advising its clients to make investment decisions in the client’s best interests.
Other conflicts are also present in the operation of the Fund. See “Conflicts of Interest.”
There Are No Independent Experts Representing Investors
Campbell & Company has consulted with counsel, accountants and other experts regarding the formation and operation of the Fund. No counsel has been appointed to represent the limited partners in connection with the offering of the units. Accordingly, each prospective investor should consult his own legal, tax and financial advisers regarding the desirability of an investment in the Fund.
The Fund Places Significant Reliance on Campbell & Company
The incapacity of Campbell & Company’s principals could have a material and adverse effect on Campbell & Company’s ability to discharge its obligations under the advisory agreement. However, there are no individual principals at Campbell & Company whose absence would result in a material and adverse effect on Campbell & Company’s ability to adequately carry out its advisory responsibilities.
The Fund Could Terminate Before Expiration of its Stated Term
As general partner, Campbell & Company may withdraw from the Fund upon 120 days’ notice, which would cause the Fund to terminate unless a substitute general partner were obtained. Other events, such as a long-term substantial loss suffered by the Fund, could also cause the Fund to terminate before the expiration of its stated term. This could cause you to liquidate your investments and upset the overall maturity and timing of your investment portfolio. If the registrations with the CFTC or memberships in the National Futures Association of Campbell & Company or the futures broker were revoked or suspended, such entity would no longer be able to provide services to the Fund.
The Fund is Not a Regulated Investment Company
Although the Fund and Campbell & Company are subject to regulation by the CFTC, the Fund is not an investment company subject to the Investment Company Act of 1940 and Campbell & Company is not registered as an investment adviser under the Investment Advisers Act of 1940. Accordingly, you do not have the protections afforded by those statutes which, for example, requires investment companies to have a majority of disinterested directors and regulates the relationship between the adviser and the investment company.
Proposed Regulatory Change is Impossible to Predict
The futures markets are subject to comprehensive statutes, regulations and margin requirements. In addition, the CFTC and the exchanges are authorized to take extraordinary actions in the event of a market emergency, including, for example, the retroactive implementation of speculative position limits or higher margin requirements, the establishment of daily price limits and the suspension of trading. The regulation of futures, forward, option and swap transactions in the United States is a rapidly changing area of law and is subject to modification by government and judicial action. In addition, various national governments have expressed concern regarding the disruptive effects of speculative trading in the currency markets and the need to regulate the “derivatives” markets in general. The effect of any future regulatory change on the Fund is impossible to predict, but could be substantial and adverse.
Forwards, Options, Swaps, Hybrids and Other Derivatives are Not Subject to CFTC Regulation
The Fund trades foreign exchange contracts and options in the interbank market. In addition to swaps, in the future, the Fund may also trade hybrid instruments and other off-exchange contracts. Swap agreements involve trading income streams such as fixed rate for floating rate interest. Hybrids are instruments which combine features of a security with those of a futures contract. The dealer market for off-exchange instruments is becoming more liquid. There is no exchange or clearinghouse for these contracts and they are not regulated by the CFTC. The Fund will not receive
-11-
the protections which are provided by the CFTC’s regulatory scheme for these transactions.
The Fund is Subject to Foreign Market Credit and Regulatory Risk
A substantial portion of Campbell & Company’s trades takes place on markets or exchanges outside the United States. From time to time, as much as 20% to 50% of the Fund’s overall market exposure could involve positions taken on foreign markets. The risk of loss in trading foreign futures contracts and foreign options can be substantial. Participation in foreign futures contracts and foreign options transactions involves the execution and clearing of trades on, or subject to the rules of, a foreign board of trade. Non-U.S. markets may not be subject to the same degree of regulation as their U.S. counterparts. None of the CFTC, NFA or any domestic exchange regulates activities of any foreign boards of trade, including the execution, delivery and clearing of transactions, nor do they have the power to compel enforcement of the rules of a foreign board of trade or any applicable foreign laws. Trading on foreign exchanges also presents the risks of exchange controls, expropriation, taxation and government disruptions.
The Fund is Subject to Foreign Exchange Risk
The price of any foreign futures or foreign options contract and, therefore, the potential profit and loss thereon, may be affected by any variance in the foreign exchange rate between the time a position is established and the time it is liquidated, offset or exercised. Certain foreign exchanges may also be in a more or less developmental stage so that prior price histories may not be indicative of current price dynamics. In addition, the Fund may not have the same access to certain positions on foreign exchanges as do local traders, and the historical market data on which Campbell & Company bases its strategies may not be as reliable or accessible as it is in the United States. The rights of clients (such as the Fund) in the event of the insolvency or bankruptcy of a non-U.S. market or broker are also likely to be more limited than in the case of U.S. markets or brokers.
Transfers Could be Restricted
You may transfer or assign your units only upon 30 days’ prior written notice to Campbell & Company and only if Campbell & Company is satisfied that the transfer complies with applicable laws and would not result in adverse legal or tax consequences for the Fund.
A Single-Advisor Fund May Be More Volatile Than a Multi-Advisor Fund
The Fund is a single-advisor managed futures fund. You should understand that many managed futures funds are structured as multi-advisor funds in order to attempt to control risk and reduce volatility through combining advisors whose historical performance records have exhibited a significant degree of non-correlation with each other. As a single-advisor managed futures fund, the Fund may have increased performance volatility and a higher risk of loss than investment vehicles employing multiple advisors.
The Performance Fee Could be an Incentive to Make Riskier Investments
Campbell & Company employs a speculative strategy for the Fund, and receives performance fees based on the trading profits earned by it for the Fund. Campbell & Company would not agree to manage the Fund’s account in the absence of such a performance fee arrangement. Accordingly, Campbell & Company may make investments that are riskier than might be made if the Fund’s assets were managed by a trading advisor that did not require performance-based compensation.
The Fund May Distribute Profits to Limited Partners at Inopportune Times
Campbell & Company reserves the right to make distributions of profits of the Fund to the limited partners at any time in its sole discretion in order to control the growth of the assets under Campbell & Company’s management. Limited partners will have no choice in receiving these distributions as income, and may receive little notice that these distributions are being made. Distributions may be made at an inopportune time for the limited partners.
Potential Inability to Trade or Report Due to Systems Failure
Campbell & Company’s strategies are dependent to a significant degree on the proper functioning of its internal computer systems. Accordingly, systems failures, whether due to third
-12-
party failures upon which such systems are dependent or the failure of Campbell & Company’s hardware or software, could disrupt trading or make trading impossible until such failure is remedied. Any such failure, and consequential inability to trade (even for a short time), could, in certain market conditions, cause the Fund to experience significant trading losses or to miss opportunities for profitable trading. Additionally, any such failures could cause a temporary delay in reports to investors.
Potential Disruption or Inability to Trade Due to a Failure to Receive Timely and Accurate Market Data from Third Party Vendors
Campbell & Company’s strategies are dependent to a significant degree on the receipt of timely and accurate market data from third party vendors. Accordingly, the failure to receive such data in a timely manner or the receipt of inaccurate data, whether due to the acts or omissions of such third party vendors or otherwise, could disrupt trading to the detriment of the Fund or make trading impossible until such failure or inaccuracy is remedied. Any such failure or inaccuracy could, in certain market conditions, cause the Fund to experience significant trading losses, effect trades in a manner which it otherwise would not have done, or miss opportunities for profitable trading. For example, the receipt of inaccurate market data may cause the Fund to establish (or exit) a position which it otherwise would not have established (or exited), or fail to establish (or exit) a position which it otherwise would have established (or exited), and any subsequent correction of such inaccurate data may cause the Fund to reverse such action or inaction, all of which may ultimately be to the detriment of the Fund.
[REMAINDER OF THIS PAGE LEFT BLANK INTENTIONALLY.]
-13-
SELECTED FINANCIAL DATA
Dollars in thousands, except per unit amounts
| Year Ended | ||||||||||||||||||||
| 2005 | 2004 | 2003 | 2002 | 2001 | ||||||||||||||||
| Total Assets | $ | 5,233,064 | $ | 4,099,736 | $ | 2,877,967 | $ | 1,654,430 | $ | 954,185 | ||||||||||
| Total Partners’ Capital | 5,175,699 | 4,048,146 | 2,828,101 | 1,617,949 | 943,219 | |||||||||||||||
| Total Trading Gain (includes brokerage commissions) | 611,580 | 443,116 | 543,537 | 250,527 | 64,466 | |||||||||||||||
| Net Income | 424,794 | 130,292 | 342,701 | 155,979 | 29,936 | |||||||||||||||
| Net Income Per General and Limited Partner Unit* | 272.37 | 100.20 | 385.55 | 282.19 | 76.29 | |||||||||||||||
| Increase in Net Asset Value per General and Limited Partner Unit | 261.69 | 114.36 | 395.32 | 259.32 | 55.92 | |||||||||||||||
* Based on weighted average number of units outstanding during the period.
SUPPLEMENTARY FINANCIAL INFORMATION
Dollars in thousands, except per unit amounts
The following summarized quarterly financial information presents the results of operations for the three month periods ended March 31, June 30, September 30 and December 31, 2005 and 2004.
| 1st Qtr. | 2nd Qtr. | 3rd Qtr. | 4th Qtr. | |||||||||||||
| 2005 | 2005 | 2005 | 2005 | |||||||||||||
| Total Trading Gain (Loss) (includes brokerage commissions) | $ | (95,831 | ) | $ | 546,406 | $ | (14,383 | ) | $ | 175,388 | ||||||
| Net Income (Loss) | (143,189 | ) | 498,040 | (59,548 | ) | 129,491 | ||||||||||
| Net Income (Loss) per General and Limited Partner Unit* | (95.53 | ) | 323.87 | (38.20 | ) | 78.82 | ||||||||||
| Increase (Decrease) in Net Asset Value per General and Limited Partner Unit | (98.24 | ) | 322.16 | (42.00 | ) | 79.77 | ||||||||||
| Net Asset Value per General and Limited Partner Unit at the End of the Period | 2,647.49 | 2,969.65 | 2,927.65 | 3,007.42 | ||||||||||||
| 1st Qtr. | 2nd Qtr. | 3rd Qtr. | 4th Qtr. | |||||||||||||
| 2004 | 2004 | 2004 | 2004 | |||||||||||||
| Total Trading Gain (Loss) (includes brokerage commissions) | $ | 556,936 | $ | (334,861 | ) | $ | (82,946 | ) | $ | 303,987 | ||||||
| Net Income (Loss) | 402,652 | (388,753 | ) | (135,081 | ) | 251,474 | ||||||||||
| Net Income (Loss) per General and Limited Partner Unit* | 360.96 | (303.89 | ) | (98.46 | ) | 175.31 | ||||||||||
| Increase (Decrease) in Net Asset Value per General and Limited Partner Unit | 358.82 | (313.09 | ) | (102.60 | ) | 171.23 | ||||||||||
| Net Asset Value per General and Limited Partner Unit at the End of the Period | 2,990.19 | 2,667.10 | 2,574.50 | 2,745.73 | ||||||||||||
* Based on weighted average number of units outstanding during the period.
-14-
CAMPBELL & COMPANY, INC.
Description
Campbell & Company is the general partner and trading advisor of the Fund. It is a Maryland corporation organized in April 1978 as a successor to a partnership originally organized in January 1974. Its offices are located at 210 West Pennsylvania Avenue, Towson, Maryland 21204, and its telephone number is (410) 296-3301. Its primary business is the trading and management of discretionary futures and forward accounts, including commodity pools. As of December 31, 2005 Campbell & Company had approximately $11.4 billion under management in the futures, forward, option and swap markets (including approximately $10.0 billion traded pursuant to the same Financial, Metal & Energy Large Portfolio as traded by the Fund). Please refer to “Campbell & Company, Inc. — Trading Systems” for a discussion of all of the portfolios offered by Campbell & Company, which includes the Financial, Metal & Energy Large Portfolio. Please refer to “Past Performance of the Campbell Strategic Allocation Fund, L.P.” on page 31 for the performance data required to be disclosed for the most recent five calendar years and year-to-date.
Campbell & Company is a member of the NFA and has been registered as a commodity pool operator since September 10, 1982 and as a commodity trading advisor since May 6, 1978. Pools currently operated by Campbell & Company include: Campbell Financial Futures Fund Limited Partnership; Campbell Fund Trust; Campbell Global Assets Fund Limited; Campbell Alternative Asset Trust; and Campbell Institutional Multi-Strategy Master Fund Limited. Campbell & Company’s compensation is discussed in “Charges to the Fund.”
The principals of Campbell & Company have not purchased, and do not intend to purchase, units.
Campbell & Company has agreed that its capital account as general partner at all times will equal at least 1% of the net aggregate capital contributions of all partners.
There has never been any material administrative, civil or criminal proceedings brought against Campbell & Company or its principals, whether pending, on appeal or concluded.
Campbell & Company’s principals are Theresa D. Becks, D. Keith Campbell, William C. Clarke, III, Bruce L. Cleland, Kevin M. Heerdt, James M. Little and Thomas P. Lloyd. The majority voting stockholder of Campbell & Company is D. Keith Campbell.
Theresa D. Becks, born in 1963, joined Campbell & Company in June 1991 and has served as the Chief Financial Officer and Treasurer since 1992, and Secretary and a Director since 1994. In addition to her role as CFO, Ms. Becks also oversees administration and trade operations. Ms. Becks is also the Chief Financial Officer, Treasurer and Assistant Secretary of both Campbell & Company Investment Adviser LLC, a wholly-owned subsidiary of Campbell & Company, and The Campbell Multi-Strategy Trust, a registered investment company. Ms. Becks is currently a member of the Board of Directors of the Managed Funds Association. From 1987 to 1991, she was employed by Bank Maryland Corp, a publicly held company, as a Vice President and Chief Financial Officer. Prior to that time, she worked with Ernst & Young. Ms. Becks is a C.P.A. and has a B.S. in Accounting from the University of Delaware. Ms. Becks is an Associated Person of Campbell & Company.
D. Keith Campbell, born in 1942, has served as the Chairman of the Board of Directors of Campbell & Company since it began operations, was President until 1994, and was Chief Executive Officer until 1997. Mr. Campbell is the majority voting stockholder of Campbell & Company. From 1971 to 1978, he was a registered representative of a futures commission merchant. Mr. Campbell has acted as a commodity trading advisor since 1972 when, as general partner of the Campbell Fund, a limited partnership engaged in commodity futures trading, he assumed sole responsibility for trading decisions made on behalf of the Fund. Since then, he has applied various technical trading models to numerous discretionary futures trading accounts. Mr. Campbell is registered with the CFTC and NFA as a commodity pool operator. Mr. Campbell is an Associated Person of Campbell & Company.
William C. Clarke, III, born in 1951, joined Campbell & Company in June 1977 and has served as an Executive Vice President since 1991 and a Director since 1984. Mr. Clarke holds a B.S. in Finance from Lehigh University where he
-15-
graduated in 1973. Mr. Clarke currently oversees all aspects of research, which involves the development of proprietary trading models and portfolio management methods. Mr. Clarke is an Associated Person of Campbell & Company.
Bruce L. Cleland, born in 1947, joined Campbell & Company in January 1993 and has served as President and a Director since 1994, and Chief Executive Officer since 1997. Mr. Cleland is also the President and Chief Executive Officer of Campbell & Company Investment Adviser LLC, a wholly-owned subsidiary of Campbell & Company, and Trustee, Chief Executive Officer and President of The Campbell Multi-Strategy Trust, a registered investment company. Mr. Cleland has worked in the international derivatives industry since 1973, and has owned and managed firms engaged in global clearing, floor brokerage, trading and portfolio management. Mr. Cleland is currently a member of the Board of Directors of the National Futures Association, and previously served as a member of the Board of Directors of the Managed Funds Association and as a member of the Board of Governors of the COMEX, in New York. Mr. Cleland is a graduate of Victoria University in Wellington, New Zealand where he earned a Bachelor of Commerce and Administration degree. Mr. Cleland is an Associated Person of Campbell & Company.
Kevin M. Heerdt, born in 1958, joined Campbell & Company in March 2003 and has served as Chief Operating Officer since June 2005. Prior to June 2005, Mr. Heerdt served as an Executive Vice President-Research. His duties also include risk management, research, and the development of quantitatively based hedge fund and options strategies. Mr. Heerdt is also the Vice President and Chief Operating Officer of both Campbell & Company Investment Adviser LLC, a wholly-owned subsidiary of Campbell & Company, and The Campbell Multi-Strategy Trust, a registered investment company. From February 2002 to March 2003, he was self-employed through Integrity Consulting. Previously, Mr. Heerdt worked for twelve years at Moore Capital Management, Inc., where he was a Director until 1999, and a Managing Director from 2000 to 2002. Mr. Heerdt holds a B.A. in Economics and in International Relations from the University of Southern California. Mr. Heerdt is an Associated Person of Campbell & Company.
James M. Little, born in 1946, joined Campbell & Company in April 1990 and has served as Executive Vice President-Business Development and a Director since 1992. Mr. Little is also the Vice President of both Campbell & Company Investment Adviser LLC, a wholly-owned subsidiary of Campbell & Company, and The Campbell Multi-Strategy Trust, a registered investment company. Mr. Little holds a B.S. in Economics and Psychology from Purdue University. From 1989 to 1990, Mr. Little was a registered representative of A.G. Edwards & Sons, Inc. From 1984 to 1989, he was the Chief Executive Officer of James Little & Associates, Inc., a commodity pool operator and broker-dealer. Mr. Little is the co-author ofThe Handbook of Financial Futures, and is a frequent contributor to investment industry publications. Mr. Little is an Associated Person of Campbell & Company.
Thomas P. Lloyd, born in 1959, joined Campbell & Company in September 2005 as General Counsel and Executive Vice President-Legal and Compliance. In this capacity, he is involved in all aspects of legal affairs, compliance and regulatory oversight. Mr. Lloyd is also the Secretary, Chief Compliance Officer and Assistant Treasurer of both Campbell & Company Investment Adviser LLC, a wholly-owned subsidiary of Campbell & Company, and The Campbell Multi-Strategy Trust, a registered investment company. From 1999 to 2005, Mr. Lloyd was employed by Deutsche Bank Securities Inc. (“DBSI”) in several positions, including Managing Director and head of the legal group for Deutsche Bank Alex. Brown, the Private Client Division of DBSI. From 1997 to 1999, Mr. Lloyd was an attorney in the Enforcement Department of NASD Regulation, Inc., and, from 1995 to 1997, he served as a senior counsel in the Division of Enforcement of the United States Securities and Exchange Commission. From 1989 to 1995, he was engaged in the private practice of law. Mr. Lloyd holds a B.A. in Economics from the University of Maryland, and a J.D. from the University of Baltimore School of Law. Mr. Lloyd is a member of the Bars of the State of Maryland and the United States Supreme Court.
[REMAINDER OF THIS PAGE LEFT BLANK INTENTIONALLY.]
-16-
The Advisory Agreement
Campbell & Company has the sole authority and responsibility for directing the investment and reinvestment of the Fund’s assets. The Fund’s advisory agreement with Campbell & Company is valid for successive periods of one year, subject to each party’s right to terminate on 60 days’ prior written notice. It is unlikely that the advisory agreement would be terminated other than as a direct result of the dissolution of the Fund.
The advisory agreement does not alter any fiduciary duties that may otherwise be imposed by state law on Campbell & Company.
Trading Systems
Campbell & Company makes the Fund’s trading decisions using proprietary computerized trading models which analyze market statistics. There can be no assurance that the trading models will produce results similar to those produced in the past. In addition, limited partners will not have any vote or consent with respect to the trading approaches utilized by Campbell & Company. Existing limited partners will be notified in advance via their monthly statements with regard to any changes deemed to be a material change from the trading approach as currently described.
Campbell & Company currently offers the following portfolios:
| 1) | The Financial, Metal & Energy Large Portfolio, and | |
| 2) | The Global Diversified Large Portfolio. | |
All of the Fund’s assets are currently allocated to the Financial, Metal & Energy Large Portfolio, which trades futures, forward, option and swap contracts on precious and base metals, energy products, stock market indices, interest rate instruments and foreign currencies.
Campbell & Company currently allocates the Fund’s assets as follows: 91% to financial contracts, 8% to energy products and 1% to metals. Sector component risk and the specific markets traded, may frequently fluctuate in response to changes in market volatility. See the following pie chart for a current listing of contracts, by sector.
Financial, Metal & Energy Large Portfolio
Absolute Value of Portfolio Component Risk
Quarter Ended December 31, 2005
| * | Traded as forward and/or option contracts, not futures |
| ** | Traded as futures and/or swap contracts |
-17-
Because the risk of a whole portfolio is generally less than the sum of the risks of the individual sectors making up that portfolio, “component risk” is used to describe the contribution of each sector’s risk to the overall portfolio risk. In some cases, a sector may “hedge” the portfolio, and thus reduce risk, in which case the component risk for that sector would be negative. By definition, the component risk will always add to 100% of total portfolio risk.
Campbell & Company’s trading models are designed to detect and exploit medium- to long-term price changes, while also applying proven risk management and portfolio management principles. No one market exceeds 15% of a total portfolio allocation. Portfolio composition, including contracts traded and percentage allocations to each sector, may change at any time if Campbell & Company determines such change to be in the best interests of the Fund. Each sector traded by the Fund appears as a caption in the preceding “component risk” diagram. As an example, natural gas is a market that is traded within the energy sector.
Campbell & Company believes that utilizing multiple trading models for the same client account provides an important level of diversification, and is most beneficial when multiple contracts in each market are traded. Every trading model may not trade every market. It is possible that one trading model may signal a long position while another trading model signals a short position in the same market. It is Campbell & Company’s intention to offset those signals to reduce unnecessary trading, but if the signals are not simultaneous, both trades will be taken and, since it is unlikely that both positions would prove profitable, in retrospect one or both trades will appear to have been unnecessary. It is Campbell & Company’s policy to follow trades signaled by each trading model independently of the other models.
Over the course of a medium- to long-term price change, there are times when the risk of the market does not appear to be justified by the potential reward. In such circumstances some of Campbell & Company’s trading models may exit a winning position prior to the end of a price move. While there is some risk to this method (for example, being out of the market during a significant portion of a price move), Campbell & Company’s research indicates that this is well compensated for by the decreased volatility of performance that may result.
Campbell & Company’s trading models may include trend-following trading models, counter-trend trading models, and trading models that do not seek to identify or follow price trends at all. Campbell & Company expects to develop additional trading models and to modify models currently in use and may or may not employ all such models for all clients’ accounts. The trading models currently used by Campbell & Company may be eliminated from use if Campbell & Company ever believes such action is warranted.
While Campbell & Company normally follows a disciplined, systematic approach to trading, on occasion it may override the signals generated by the trading models, such as when market conditions dictate otherwise. While such action may be taken for any reason at any time at Campbell & Company’s discretion, it will normally only be taken to reduce risk in the portfolio, and may or may not enhance the results that would otherwise be achieved.
Campbell & Company applies risk management and portfolio management strategies to measure and manage overall portfolio risk. These strategies include portfolio structure, risk balance, capital allocation, and risk limitation. One objective of risk and portfolio management is to determine periods of relatively high and low portfolio risk, and when such points are reached, Campbell & Company may reduce or increase position size accordingly. It is possible, however, that this reduction or increase in position size may not enhance the results achieved over time.
From time to time Campbell & Company may increase or decrease the total number of contracts held based on increases or decreases in the Fund’s assets, changes in market conditions, perceived changes in portfolio-wide risk factors, or other factors which may be deemed relevant.
Campbell & Company estimates that, based on the margin required to maintain positions in the markets currently traded, aggregate margin for all positions will range between 5% and 30% of the Fund’s net assets. From time to time, margin commitments may be above or below this range.
The number of contracts that Campbell & Company believes can be bought or sold in a
-18-
particular market without unduly influencing price adversely may at times be limited. In such cases, a client’s portfolio would be influenced by liquidity factors because the positions taken in such markets might be substantially smaller than the positions that would otherwise be taken.
Trading Capacity
Campbell & Company believes that it is not possible to define or quantify capacity with any degree of certainty. As assets under management have increased, Campbell & Company has continued to introduce new strategies designed to deliver returns which have low correlation to returns from existing strategies. In addition, Campbell & Company has continued to develop new ways to manage assets, such as the application of dynamic portfolio and capital management tools and innovative execution methods. At the same time, a significant increase in assets has led to portfolio compromises, as increasingly large positions can only be established and maintained in those markets that have sufficient depth and liquidity.
Notwithstanding Campbell & Company’s research, risk and portfolio management efforts, there may come a time when the combination of available markets and new strategies may not be sufficient for Campbell & Company to add new assets without detriment to diversification. If this were to occur, Campbell & Company would expect risk-adjusted returns to begin to degrade — a more concentrated portfolio may result in lower risk-adjusted returns and may have a detrimental affect on your investment. See “The Risks You Face — Trading Risks — Increase in Assets Under Management May Make Profitable Trading More Difficult.”
MANAGEMENT’S ANALYSIS OF OPERATIONS
Introduction
The offering of the Fund’s units of limited partnership interest commenced on January 12, 1994, and the initial offering period terminated, with the receipt of the required minimum aggregate subscription amount, on April 15, 1994 with proceeds of $9,692,439. The continuing offering period commenced immediately after the termination of the initial offering period; additional subscriptions totaling $5,094,364,208 have been accepted during the continuing offering period as of December 31, 2005. Redemptions over the same time period totaled $1,110,864,809. The Fund commenced operations on April 18, 1994.
Critical Accounting Policies
The preparation of financial statements in conformity with accounting principles generally accepted in the United States requires management to make estimates and assumptions that affect the reported amounts of assets and liabilities and disclosures of contingent assets and liabilities at the date of the financial statements and the reported amounts of income and expense during the reporting period. Management believes that the estimates utilized in preparing the financial statements are reasonable and prudent; however, actual results could differ from those estimates. The Fund’s significant accounting policies are described in detail in Note 1 of its Financial Statements.
The Fund records all investments at fair value in its financial statements, with changes in fair value reported as components of realized and change in unrealized trading gain (loss) in the Statements of Operations. Generally, fair values are based on market prices; however, in certain circumstances, estimates are involved in determining fair value in the absence of an active market closing price (e.g. option, swap and forward contracts which are traded in the inter-bank market).
Capital Resources
The Fund will raise additional capital only through the sale of units offered pursuant to the continuing offering, and does not intend to raise any capital through borrowing. Due to the nature of the Fund’s business, it will make no capital expenditures and will have no capital assets which are not operating capital or assets.
Liquidity
Most United States futures exchanges limit fluctuations in futures contract prices during a single day by regulations referred to as “daily price fluctuation limits” or “daily limits.” During a single trading day, no trades may be executed at prices beyond the daily limit. Once the price of a futures contract has reached the daily limit for that day, positions in that contract can neither be taken nor liquidated. Futures prices have occasionally moved the daily limit for several consecutive
-19-
days with little or no trading. Similar occurrences could prevent the Fund from promptly liquidating unfavorable positions and subject the Fund to substantial losses which could exceed the margin initially committed to such trades. In addition, even if futures prices do not move the daily limit, the Fund may not be able to execute futures trades at favorable prices if little trading in such contracts is taking place. Other than these limitations on liquidity, which are inherent in the Fund’s futures trading operations, the Fund’s assets are expected to be highly liquid.
Results of Operations
The returns for the nine months ended September 30, 2005 and for the three years ended December 31, 2004, 2003 and 2002 were 6.63%, 4.35%, 17.68% and 13.12%, respectively.
Nine months ended September 30, 2005
For the 2005 year-to-date increase of 6.63%, approximately 10.35% was due to trading gains (before commissions) and approximately 2.04% was due to interest income, offset by approximately 5.76% due to brokerage fees, and operating and offering costs borne by the Fund. An analysis of the 10.35% trading gains by sector is as follows:
| Sector | % Gain | |||
| Energy | 4.49 | % | ||
| Interest Rates | 3.19 | |||
| Currencies | 1.72 | |||
| Metals | 0.55 | |||
| Stock Indices | 0.40 | |||
| 10.35 | % | |||
The late December 2004 reversal of the major trends in currencies and equities persisted into January 2005 leaving the Fund with negative performance for the month. The U.S. Dollar rallied sharply in the first week of the month and held its new levels, which produced losses in the currency sector. The post-election rally in equities gave way to selling in January, which also produced losses for the Fund. The energy sector was positive as crude oil approached $50 per barrel. The interest rate sector was also positive.
The rally in the U.S. Dollar failed early in February and the Dollar ended the month lower. However, the small gains on the Fund’s U.S. Dollar short positions were offset by losses in its non-Dollar currency pairs, resulting in losses in the currency sector overall. This was a difficult interest rate environment with different pressures observable at different points along the yield curve. Consequently, the Fund’s short-term interest rate positions were positive, but not profitable enough to offset the losses in long-term interest rates. The stock index sector was the best performing sector for the month as the equity markets reversed again and traded higher reclaiming a portion of the losses in January. Crude oil’s continued rally also contributed profits for the month.
The Fund had a small trading profit in the month of March. The gains for the month were in the interest rate sector, as both short-term and long-term positions were profitable, and in the energy sector where crude oil made a new high. The U.S. Dollar closed higher for the month, reversing a long downtrend, which caused losses for the Fund. In addition, the Fund incurred losses in its non-Dollar currency positions in March making the currency sector the worst performing sector for the first quarter. The equity index markets also reversed and ended the month lower which caused losses for the Fund.
Gains in the interest rate and currency sectors led to a positive return for April. Interest rate instruments continued the rally which began in late March. The energy sector was the worst performing sector for the month. Crude oil prices fell by almost $8 a barrel, which, combined with the related sell-off in other energy products, resulted in losses for the month. Equity indices were also negative with stock prices ending lower following sharp declines mid-month.
The Fund had a positive return in May which turned the Fund’s year-to-date return positive. The interest rate and currency sectors continued their profitability in April and May. The apparent breakdown of the EU constitutional ratification process was a key development late in the month causing investors to readjust their expectations for the Euro. The shift in favor of the U.S. Dollar topped off a six week rally that led to its highest level since before the 2004 U.S. elections which benefited the Fund’s currency positions. The Fund’s interest rate positions benefited from the U.S. 10-year Treasury yield being pushed once again below 4%.
-20-
In June, global uncertainties continued to provide profitable trends for the Fund. The U.S. Dollar was up sharply in June to new six month highs, as the Euro and Yen continued a steep six-week slide. A further flattening of the yield curve provided a profitable opportunity for the Fund’s models and the fixed income sector. Several energy markets made new all-time highs in June contributing to the Fund’s profits for the month.
The Fund reported its fourth consecutive monthly gain in July. Markets were rattled following the Chinese currency revaluation, but much of the initial decline in the U.S. Dollar was recovered the following day. The equity markets ended the month broadly higher and were the Fund’s most profitable sector, while the interest rates sector traded lower and generated the Fund’s largest losses. Energy markets traded lower early in the month, but ended near all-time highs and at a profit for the Fund’s long positions.
August saw sharp trend reversals occur in each of the major financial sectors, resulting in losses for the Fund. The currency sector was the Fund’s worst performing sector. The U.S. Dollar peaked at the end of July, then reversed sharply and traded close to its recent lows at the end of August. A similar reversal occurred in the interest rates sector, resulting in losses at both ends of the yield curve. Equities trended higher in July, but record energy prices caused a sharp sell-off in August and resulted in a loss in this sector. The energy and metal sectors were the only profitable sectors in the Fund this month, but the size of positions was not sufficient to offset the losses incurred in the financial sectors.
In September, the Fund saw many of the trends in the major financial sectors resume their course. The same sectors that reversed so sharply in August were the most profitable in September, while the energy sector was the only sector that had losses. The U.S. Dollar rallied strongly from the start of the month following the late-August sell-off, and again approached the highs for the year. The Fund lost money on some non-U.S. Dollar trades, however the currency sector was profitable overall. The equities sector also finished higher. Fixed income instruments ended lower after the sharp reversals in August and provided solid gains for the Fund’s short positions.
2004
For the 2004 increase of 4.35%, approximately 13.99% was due to trading gains (before commissions) and approximately 1.23% was due to interest income, offset by approximately 10.87% due to brokerage fees, performance fees, and operating and offering costs borne by the Fund. An analysis of the 13.99% trading gain by sector is as follows:
| Sector | % Gain (Loss) | |||
| Interest Rates | 12.60 | % | ||
| Currencies | 2.20 | |||
| Energy | 1.78 | |||
| Metals | (0.61 | ) | ||
| Stock Indices | (1.98 | ) | ||
| 13.99 | % | |||
The year began with the Fund posting a positive return in January despite significant volatility throughout the month. The weak U.S. Dollar continued to drive most global markets, including many that had no apparent or direct connection to the U.S. Dollar, and in circumstances such as this, subtle shifts in perception can have a disproportionate impact on prices. The U.S. Dollar traded lower throughout the month, which was profitable for the Fund’s currency positions. Much of the gain reversed late in the month when markets reacted violently when the Federal Open Market Committee (FOMC) slightly restated its short-term interest rate bias. The interest rate sector was slightly positive despite also having suffered a reversal of earlier gains following the FOMC announcement. The stock index and metals sectors had small losses for the month.
The Fund had a strong positive return in February as the trends that were in place at the end of January persisted. The continued concern over the record U.S. budget deficit and current account imbalance kept downward pressure on the U.S. Dollar and resulted in strong gains in the currency sector. The weak U.S. Dollar in return reinforced several related trends, including the continued rise in energy prices, resulting in positive returns in the energy sector. The interest rates sector was also profitable for the month as European interest rate instruments traded higher.
All of the gain for the month of March came from the interest rate sector as U.S. Treasuries
-21-
continued to trade higher, while a weakening U.S. Dollar also contributed solid returns. The energy sector was moderately positive, while the equity index sector was moderately negative.
In April, interest rates moved higher in response to a perceived change in stance by the U.S. Federal Reserve. In the days that followed, most major market trends also reversed. Fixed income instruments sold off hard and the U.S. Dollar rallied, while precious and base metals and many other physical commodities traded sharply lower. The equities markets also fell. Only the continued rise in energy prices provided modest gains for the Fund in April.
May was a difficult month for systematic trend following strategies and the Fund finished the month with slightly negative performance. Crude oil set record high prices during the month, which led to gains for the Fund in the energy sector. Most fixed income and currency contracts experienced a classic whipsaw. They began the month with the continuation of April’s reversals, but ended the month with a strong rally. Equity prices continued to weaken in the face of higher energy prices and global political uncertainty, which led to losses in the stock indices sector.
June was another month of choppy, range-bound trading, which resulted in negative performance for the Fund in all sectors. The market impact of unfolding events in Iraq had diminished greatly, and many traders were reluctant to take positions ahead of the Federal Reserve Bank’s June 30 interest rate announcement. Absent any other significant news, the markets remained trendless and did not provide the opportunities needed to produce positive returns.
July was a slightly negative month as most markets the Fund traded continued to oscillate in relatively narrow ranges. Interest rate instruments traded lower and then rallied on weaker than expected economic statistics, while equity indices rallied and then declined amid broad earnings disappointments. The U.S. Dollar traded in a narrow range. In the energy sector, a classic whipsaw caused the Fund to exit most of its long positions just before crude oil prices rallied to all-time highs.
August performance was negative as most financial markets continued to be bound by the ranges which had been in place previously. Fixed income instruments rallied profitably during the month, but these gains were quickly offset by losses in the currency sector as the U.S. Dollar strengthened. Small losses resulted from stock index trading as a six-week downtrend reversed sharply, mirroring the rise and fall of crude oil prices. The Fund’s exposure to the highly volatile energy sector was minor as a result of trading filters that kept the Fund out of that sector.
The losses for the Fund continued in September as listless market conditions persisted. While U.S. Dollar and interest rate instruments traded in narrow ranges, the Fund managed small profits in these sectors. These gains were largely offset by losses in the Fund’s small positions in the volatile energy sector. The largest losses for the month came from the equity index positions as positive economic reports late in the month caused stocks to rally towards 90-day highs.
The Fund bounced back with a respectable gain in October. This was primarily as a result of positive performance in the foreign exchange and interest rate sectors, as the long-awaited downward movement in the U.S. Dollar began to unfold. Traders reacted to key economic data, including a report of the second highest trade-gap in U.S. history. Following the report, the U.S. Dollar trended broadly lower against other leading currencies. The Fund was on the sidelines in the energy sector during the month as crude oil hit new highs and natural gas traded at the highest prices since the levels reached in February 2003.
The Fund had a strong profitable month in November as the growing momentum in the slide of the U.S. Dollar resulted in a new low against the Euro and multi-year lows against other major currencies. Structural problems of record budget deficits, trade deficits, and current account deficits, and the prospect of four more years of unchanged fiscal and monetary policy had the attention of the foreign exchange markets. Consequently, while the U.S. Dollar has been weak for several years, the recent decline has been very sharp. The foreign exchange and interest rate sectors were profitable in November and were the most profitable sectors for the year.
The Fund finished the year with a positive performance in December and for the year, closing out a year that was confounding for many traders. The big stories for the year were the slide in the U.S. Dollar and the rise and fall of crude
-22-
oil prices, but high volatility made these markets difficult to trade. Fixed income was the most profitable sector for the Fund in 2004. Long-term interest rates were sharply higher in the first quarter, but reversed in the second quarter despite a Federal Reserve Bank bias toward higher rates. The rally continued through the second half of the year and produced strong returns for the year in the fixed income sector. Equity markets were range-bound for most of the year awaiting the outcome of the election, which was followed by a dramatic rally and delivered some useful gains from the otherwise worst performing sector in 2004.
2003
For the 2003 increase of 17.68%, approximately 27.46% was due to trading gains (before commissions) and approximately 0.98% was due to interest income, offset by approximately 10.76% due to brokerage fees, performance fees, and operating and offering costs borne by the Fund. An analysis of the 27.46% trading gain by sector is as follows:
| Sector | % Gain (Loss) | |||
| Currencies | 26.22 | % | ||
| Stock Indices | 5.70 | |||
| Metals | (0.34 | ) | ||
| Energy | (0.80 | ) | ||
| Interest Rates | (3.32 | ) | ||
| 27.46 | % | |||
The long-term trends that created opportunity for the Fund in 2002 continued in January 2003, in which profits were earned in every sector. However, the environment was one where a single event, the prospect of war with Iraq, was driving the Fund’s whole portfolio. While the Fund’s systematic and disciplined trading strategies continued to keep it engaged, leverage was subsequently decreased to protect against significant losses which could result from potential sharp and extended reversals in core positions.
The Fund was positive again in February with metals being the only negative sector. Strong momentum in energy, fixed income, currencies and stock indices continued, largely as a result of the troubled global geopolitical outlook. In order to mitigate the risk of potential sharp reversals in trends, the Fund maintained a lower-than-normal level of leverage during the month.
The long awaited market reversal occurred in March. Initially, energy, precious metals and fixed income markets all sold off sharply, while equities and the U.S. Dollar rallied. Several days into this correction, these markets all sold off suddenly, as hopes of a quick victory in Iraq subsided. With significantly reduced leverage, the losses the Fund sustained were relatively modest, giving the Fund a positive first quarter.
In April, the Fund’s leverage was returned to a more normal level, but the portfolio was not fully engaged in many markets due to the lack of strong trends. Many markets had calmed significantly at this time, but uncertainty was still prevalent in global markets due to the many unresolved geopolitical issues. A strong performance in the currencies sector was partially offset by negative performances in the metals and stock index sectors.
In May, the uncertainty that remained in April dominated the markets the Fund trades and led to another positive month. While corporate earnings looked stronger, unemployment, overcapacity and the ongoing threat of terrorism still loomed large over the global financial markets. The U.S. Dollar weakened further against the other major currencies, despite the concern expressed by the United States’ trade partners over the impact this would have on global trade. Interest rates were the best performing sector for the Fund particularly at the long end of the yield curve, where higher prices reflected lower rates. Currency contracts were also strongly positive, while losses in the energy and stock index sectors offset some of those gains.
Even with a negative result for June, the Fund finished the first half of 2003 with a double-digit return. Long-term interest rates lost value as yield curves steepened, particularly the Japanese government bond. Short-term interest rates and stock index sectors contributed very modest gains for the month, while all other sectors contributed losses. While the global economy was looking better than it had for several years, many substantive uncertainties remained.
The Fund’s performance for July was negative due to significant price reversals in the Fund’s largest positions. The U.S. Dollar’s strong rally
-23-
caused losses in the Fund’s currency and cross rate sectors. In addition, the sudden sharp sell-off in long-term bonds resulted in losses in the Fund’s long positions. These losses were partially offset by gains in the Fund’s long equity index positions as investor confidence grew in the economic recovery and the potential for improved growth.
The stock indices sector was the best performing sector for the month of August as the U.S. equity markets posted their sixth straight month of gains. Much of this was attributed to improving consumer confidence, federal tax cuts and increased defense spending. The energy sector contributed positive returns as crude oil remained above the $30 level on continuing supply concerns. Also, the Fund’s short positions in the Japanese Government Bond provided a significant portion of the month’s gains.
In September, the currency sector was the only significantly positive sector as short U.S. Dollar positions benefited from continued weakness in the U.S. Dollar. After showing positive returns for most of the month, sudden reversals in the fixed income, equity and energy markets washed out the gains in the currency sector and put the Fund’s portfolio into negative territory late in the month. The Fund finished the third quarter with a negative return, but was positive year-to-date through September.
The Fund began the fourth quarter on a positive note with a majority of the gain coming from the currencies and stock indices sectors. The continued orderly decline of the U.S. Dollar against the other major currencies provided good trending opportunities during October, but an unexpectedly sharp decline in the Yen at the end of the month took away some of the profits earned earlier. The performance of the currency cross rates, interest rates and energies sectors all resulted in losses for the month. The energy markets were particularly volatile, with natural gas prices whipsawing on shifting weather predictions, while crude oil declined sharply from the high end of its recent trading range.
November was a positive month for the Fund. The currencies and stock indices sectors provided good profits, which were partially offset by losses in the cross currency, energy and interest rate sectors. As global equity prices continued to strengthen, the U.S. dollar weakened, reaching 10 and 5 year lows against the Canadian Dollar and Sterling, respectively, while the Euro made an all time high late in the month. Paradoxically strong U.S. economic indicators encouraged a positive outlook, with strong retail sales and a 20-year high in manufacturing. Global economic data was also encouraging, particularly coming out of Asia.
The trends of the falling U.S. Dollar and the rise in global equity indices prevalent in the second half of 2003 continued in December and left the Fund with a gain for the month. These trends were also responsible for most of the gains for the year.
2002
For the 2002 increase of 13.12%, approximately 22.30% was due to trading gains (before commissions) and approximately 1.62% was due to interest income, offset by approximately 10.80% due to brokerage fees, performance fees, and operating and offering costs borne by the Fund. An analysis of the 22.30% trading gain by sector is as follows:
| Sector | % Gain (Loss) | |||
| Interest Rates | 14.98 | % | ||
| Currencies | 6.20 | |||
| Stock Indices | 3.42 | |||
| Metals | (0.34 | ) | ||
| Energy | (1.96 | ) | ||
| 22.30 | % | |||
During January, the Enron and Global Crossing bankruptcies took a toll on the U.S. equities markets that were already under pressure and resulted in a stumbling start to the New Year, as layoffs, earnings restatements and revenue declines continued to dominate the business news. Internationally, the Japanese economy continued to deteriorate, while the full extent of any Argentinean contagion was yet to be acknowledged in Brazil or other parts of South America. On the positive side, U.S. consumer spending continued to be robust. The Fund posted a small loss for January, largely as a result of volatility in the global currency markets. Energy and short stock index positions contributed small gains.
The high market volatility in January continued into February. Further Enron revelations radiated concern about the accounting practices of other large companies and caused the equity
-24-
markets to decline early in the month. Sentiment reversed abruptly on positive economic news on home sales, manufacturing and consumer spending. The Fund’s performance was negative in February with losses in energy, stock indices and long-term interest rates partially offset by gains in short-term interest rates.
March was a mixed month in which positive performance in the energy and interest rate sectors was more than offset by losses in stock indices and currencies, which made up a substantial part of the Fund’s portfolio. The Japanese Yen produced the largest loss when it rallied in reaction to Bank of Japan intervention in preparation for Japan’s March 31st fiscal year-end as the Fund maintained a short position. Energy was the strongest performing sector profiting from long positions in crude oil and unleaded gas. The loss in the stock indices sector came from short positions in the Nikkei and Hang Seng indices as Asian equities rallied. The overall loss for the month occurred independently of the equity and bond markets, demonstrating the volatility reducing effect of blending assets whose returns are largely uncorrelated.
April was one of the most difficult trading months since the Fund began trading. The Fund ended the month down over 4.5%. The fixed income sector was whip-lashed as hopes of imminent economic recovery sputtered causing the majority of the trading losses for the month. Broad-based selling of the three leading U.S. equity indices put them at their lowest levels since October 2001 and contributed to the Fund’s losses for the month. The energy sector was battered by reports of unfolding events in both Venezuela and the Middle East. Many areas of concern remained including continued instability in the Middle East, weak corporate earnings, continued revelations of corporate accounting issues, fear of a collapse in the residential real estate market, high energy costs and a growing federal budget deficit due to lower tax receipts.
The month of May provided some trending opportunities that the Fund was able to profit from. The currencies and interest rates sectors provided the gains for the month, but these were offset by losses in the energy and stock indices sectors. While the equities markets remained nervous, many alternative investment strategies, including managed futures, were able to provide positive returns.
Strong performance in the month of June contributed to a positive second quarter and more than made up for losses during the beginning of the year. All major U.S. equity indices made new cycle lows as domestic and international investor confidence was battered by reports of scandalous corporate leadership conduct. The long awaited U.S. economic recovery looked sluggish at best. In this troubled environment, the U.S. Dollar lost ground against most major trading partners, while interest rate futures rose and stock indices declined. These three sectors contributed significantly to the profits in June, while small losses were recorded in the metals and energy sectors.
The Fund’s positive performance continued in July. This was the third consecutive month of positive performance and was mainly attributable to profits in short stock indices and long interest rate positions. These gains were reduced by small negative performances in metals, currencies and cross rates as the dollar strengthened against other major currencies, again rising above parity with the Euro.
In August, the Fund recorded another month of positive performance with profits in the interest rates, currencies, stock indices and energy sectors. Global markets continued to respond to weak U.S. economic data and concerns over geopolitical developments. The much-anticipated U.S. economic recovery continued to be elusive, while economies in Europe and Japan appeared to be stagnant. The quickened pace of U.S. plans to invade Iraq aroused much international criticism and concern, which impacted energy prices and investor confidence.
September was the fifth consecutive month of positive returns for the Fund, as traditional investment strategies continued to struggle. Profits were earned in the stock indices, interest rates and energy sectors, offset by losses in the currencies sector. Further reports of corporate governance and accounting failures, the possibility of an unpopular war in the Middle East, rising jobless claims, disappointing earnings and a gloomy retail outlook were compounded by high energy prices and systemic instability in Japan and Brazil. In this time of global economic weakness and uncertainty, the Fund’s ability to trade both the long
-25-
and short side of a diverse portfolio of international markets proved to be beneficial.
Many of the trends that had been so profitable for the Fund over the preceding five months reversed during October, resulting in losses in interest rates, equity indices and precious metals. The U.S. Dollar weakened on unfavorable Gross Domestic Product news and caused losses in the currencies sector. U.S. equities surprised the market by turning their second best month since 1997. As the U.S. struggled with the United Nations over Iraq, energy prices sold off sharply, making this the Fund’s worst performing sector in October.
In October and November, U.S. equity prices rose at a faster pace than any time since 1997. Over this same period, the Fund was defensively positioned against a reversal of the major trends that were profitable for the year, leaving year-to-date gains in the double digits. Performance for November was marginally negative, with gains in currencies offset by losses in interest rates, stock indices and energy.
The Fund recorded a strong positive performance for December and for the year. The Fund’s core strategy of systematic, diversified trend-following again demonstrated the ability to outperform most other strategies in times of economic weakness and uncertainty. The ability to short markets enabled the Fund to profit as global markets suffered their third consecutive negative year. Profits were generated in interest rates, currencies and equities, while losses occurred in energy and industrial metals.
Off-Balance Sheet Risk
The term “off-balance sheet risk” refers to an unrecorded potential liability that, even though it does not appear on the balance sheet, may result in future obligation or loss. The Fund trades in futures, forward, option and swap contracts and is therefore a party to financial instruments with elements of off-balance sheet market and credit risk. In entering into these contracts there exists a risk to the Fund, market risk, that such contracts may be significantly influenced by market conditions, such as interest rate volatility, resulting in such contracts being less valuable. If the markets should move against all of the futures interest positions of the Fund at the same time, and if Campbell & Company were unable to offset positions, the Fund could lose all of its assets and the limited partners would realize a 100% loss. Campbell & Company minimizes market risk through real-time monitoring of open positions, diversification of the portfolio and maintenance of a margin-to-equity ratio that rarely exceeds 30%.
In addition to market risk, in entering into futures, forward, option and swap contracts there is a credit risk that a counterparty will not be able to meet its obligations to the Fund. The counterparty for futures contracts traded in the United States and on most foreign futures exchanges is the clearinghouse associated with such exchange. In general, clearinghouses are backed by the corporate members of the clearinghouse who are required to share any financial burden resulting from the non-performance by one of their members and, as such, should significantly reduce this credit risk. In cases where the clearinghouse is not backed by the clearing members, like some foreign exchanges, it is normally backed by a consortium of banks or other financial institutions.
In the case of forward, option and swap contracts, which are traded on the interbank market rather than on exchanges, the counterparty is generally a single bank or other financial institution, rather than a group of financial institutions; thus there may be greater counterparty credit risk. Campbell & Company trades for the Fund only with those counterparties which it believes to be creditworthy. All positions of the Fund are valued each day on a mark-to-market basis. There can be no assurance that any clearing member, clearinghouse or other counterparty will be able to meet its obligations to the Fund.
Disclosures About Certain Trading Activities that Include Non-Exchange Traded Contracts Accounted for at Fair Value
The Fund invests in futures, option, swap and forward currency contracts. The market value of futures (exchange-traded) contracts is determined by the various futures exchanges, and reflects the settlement price for each contract as of the close of the last business day of the reporting period. The market value of swap and forward (non-exchange traded) contracts is extrapolated on a forward basis from the spot prices quoted as of 5:00 P.M. (E.T.) of the last business day of the reporting period or based on the market value of
-26-
its exchange-traded equivalent. The market value of option (non-exchange traded) contracts is calculated by applying an industry-standard adaptation of the Black-Scholes options valuation model to foreign currency options, using as input, the spot prices, interest rates and option implied volatilities quoted as of 3:00 P.M. (E.T.) on the last business day of the reporting period.
Quantitative and Qualitative Disclosures About Market Risk
Introduction
Past Results Not Necessarily Indicative of Future Performance
The Fund is a speculative commodity pool. The market sensitive instruments held by it are acquired for speculative trading purposes, and all or a substantial amount of the Fund’s assets are subject to the risk of trading loss. Unlike an operating company, the risk of market sensitive instruments is integral, not incidental, to the Fund’s main line of business.
Market movements result in frequent changes in the fair market value of the Fund’s open positions and, consequently, in its earnings and cash flow. The Fund’s market risk is influenced by a wide variety of factors, including the level and volatility of exchange rates, interest rates, equity price levels, the market value of financial instruments and contracts, the diversification effects among the Fund’s open positions and the liquidity of the markets in which it trades.
The Fund rapidly acquires and liquidates both long and short positions in a wide range of different markets. Consequently, it is not possible to predict how a particular future market scenario will affect performance, and the Fund’s past performance is not necessarily indicative of its future results.
Standard of Materiality
Materiality as used in this section, “Quantitative and Qualitative Disclosures About Market Risk,” is based on an assessment of reasonably possible market movements and the potential losses caused by such movements, taking into account the leverage and multiplier features of the Fund’s market sensitive instruments.
Quantifying the Fund’s Trading Value at Risk
Quantitative Forward-Looking Statements
The following quantitative disclosures regarding the Fund’s market risk exposures contain “forward-looking statements” within the meaning of the safe harbor from civil liability provided for such statements by the Private Securities Litigation Reform Act of 1995 (set forth in Section 27A of the Securities Act of 1933 and Section 21E of the Securities Exchange Act of 1934). All quantitative disclosures in this section are deemed to be forward-looking statements for purposes of the safe harbor, except for statements of historical fact.
The Fund’s risk exposure in the various market sectors traded is estimated in terms of Value at Risk (VaR). The Fund estimates VaR using a model based upon historical simulation (with a confidence level of 97.5%) which involves constructing a distribution of hypothetical daily changes in the value of a trading portfolio. The VaR model takes into account linear exposures to risks, including equity and commodity prices, interest rates, foreign exchange rates, and correlation among these variables. The hypothetical changes in portfolio value are based on daily percentage changes observed in key market indices or other market factors to which the portfolio is sensitive. The one day 97.5% confidence level of the Fund’s VaR corresponds to the negative change in portfolio value that, based on observed market risk factors, would have been exceeded once in 40 trading days or one day in 40. VaR typically does not represent the worst case outcome.
The Fund uses approximately one year of daily market data and revalues its portfolio for each of the historical market moves that occurred over this time period. This generates a probability distribution of daily “simulated profit and loss” outcomes. The VaR is the 2.5 percentile of this distribution.
The VaR for a sector represents the one day downside risk for the aggregate exposures associated with this sector. The aggregate VaR represents the VaR of the Fund’s open positions across all market sectors, and is less than the sum of the VaRs for all such market sectors due to the diversification benefit across asset classes.
-27-
The Fund’s VaR computations are based on the risk representation of the underlying benchmark for each instrument or contract and does not distinguish between exchange and non-exchange dealer-based instruments. It is also not based on exchange and/or dealer-based maintenance margin requirements.
VaR models, including the Fund’s, are continually evolving as trading portfolios become more diverse and modeling techniques and systems capabilities improve. Please note that the VaR model is used to numerically quantify market risk for historic reporting purposes only and is not utilized by the Fund in its daily risk management activities. Please further note that VaR as described above may not be comparable to similarly titled measures used by other entities.
Because the business of the Fund is the speculative trading of futures, forwards and options, the composition of the Fund’s trading portfolio can change significantly over any given time period, or even within a single trading day, which could positively or negatively materially impact market risk as measured by VaR.
The Fund’s Trading Value at Risk in Different Market Sectors
The following tables indicate the trading Value at Risk associated with the Fund’s open positions by market category as of September 30, 2005 and December 31, 2004 and the trading gains/losses by market category for the nine months ended September 30, 2005 and the year ended December 31, 2004.
September 30, 2005
| Trading | ||||||||
| Market Sector | Value at Risk* | Gain** | ||||||
| Currencies | 1.45 | % | 1.72 | % | ||||
| Energy | 0.58 | % | 4.49 | % | ||||
| Stock Indices | 0.56 | % | 0.40 | % | ||||
| Long Interest Rates | 0.36 | % | 1.31 | % | ||||
| Short Interest Rates | 0.27 | % | 1.88 | % | ||||
| Metals | 0.05 | % | 0.55 | % | ||||
| Aggregate/ Total | 1.65 | % | 10.35 | % | ||||
| * | The VaR for a sector represents the one day downside risk for the aggregate exposures associated with this sector. The aggregate VaR represents the VaR of the Fund’s open positions across all market sectors, and is less than the sum of the VaRs for all such market sectors due to the diversification benefit across asset classes. |
| ** | Of the return for the nine months ended September 30, 2005, approximately 10.35% was due to trading gains (before commissions) and approximately 2.04% due to interest income, offset by approximately 5.76% due to brokerage fees, performance fees and operating and offering costs borne by the Fund giving a net return of 6.63%. |
December 31, 2004
| Trading | ||||||||
| Market Sector | Value at Risk* | Gain/(Loss)** | ||||||
| Currencies | 1.15 | % | 2.20 | % | ||||
| Long Interest Rates | 0.83 | % | 10.03 | % | ||||
| Short Interest Rates | 0.26 | % | 2.57 | % | ||||
| Stock Indices | 0.60 | % | (1.98 | )% | ||||
| Energy | 0.18 | % | 1.78 | % | ||||
| Metals | 0.11 | % | (0.61 | )% | ||||
| Aggregate/ Total | 1.84 | % | 13.99 | % | ||||
| * | The VaR for a sector represents the one day downside risk for the aggregate exposures associated with this sector. The aggregate VaR represents the VaR of the Fund’s open positions across all market sectors, and is less than the sum of the VaRs for all such market sectors due to the diversification benefit across asset classes. |
| ** | For the year ended December 31, 2004, approximately 13.99% was due to trading gains (before commissions) and approximately 1.23% was due to interest income, offset by approximately 10.87% due to brokerage fees, performance fees and operating and offering costs borne by the Fund giving a net return of 4.35%. |
Material Limitations on Value at Risk as an Assessment of Market Risk
The following limitations of VaR as an assessment of market risk should be noted:
| 1) | Past changes in market risk factors will not always result in accurate predictions of the distributions and correlations of future market movements; | |
| 2) | Change in portfolio value caused by market movements may differ from those of the VaR model; | |
| 3) | VaR results reflect past trading positions while future risk depends on future positions; | |
| 4) | VaR using a one day time horizon does not fully capture the market risk of positions that cannot be liquidated or hedged within one day; and |
-28-
| 5) | The historical market risk factor data for VaR estimation may provide only limited insight into losses that could be incurred under certain unusual market movements. |
VaR is not necessarily representative of historic risk nor should it be used to predict the Fund’s future financial performance or its ability to manage and monitor risk. There can be no assurance that the Fund’s actual losses on a particular day will not exceed the VaR amounts indicated or that such losses will not occur more than once in 40 trading days.
Non-Trading Risk
The Fund has non-trading market risk on its foreign cash balances not needed for margin. However, these balances (as well as the market risk they represent) are immaterial. The Fund also has non-trading market risk as a result of investing a substantial portion of its available assets in U.S. Treasury Bills. The market risk represented by these investments is immaterial.
Qualitative Disclosures Regarding Primary Trading Risk Exposures
The following qualitative disclosures regarding the Fund’s market risk exposures — except for (i) those disclosures that are statements of historical fact and (ii) the descriptions of how the Fund manages its primary market risk exposures — constitute forward-looking statements within the meaning of Section 27A of the Securities Act and Section 21E of the Securities Exchange Act. The Fund’s primary market risk exposures as well as the strategies used and to be used by Campbell & Company for managing such exposures are subject to numerous uncertainties, contingencies and risks, any one of which could cause the actual results of the Fund’s risk controls to differ materially from the objectives of such strategies. Government interventions, defaults and expropriations, illiquid markets, the emergence of dominant fundamental factors, political upheavals, changes in historical price relationships, an influx of new market participants, increased regulation and many other factors could result in material losses as well as in material changes to the risk exposures and the risk management strategies of the Fund. There can be no assurance that the Fund’s current market exposure and/or risk management strategies will not change materially or that any such strategies will be effective in either the short-or long-term. Investors must be prepared to lose all or substantially all of their investment in the Fund.
The following were the primary trading risk exposures of the Fund as of September 30, 2005, by market sector.
Currencies
Exchange rate risk is the principal market exposure of the Fund. The Fund’s currency exposure is to exchange rate fluctuations, primarily fluctuations which disrupt the historical pricing relationships between different currencies and currency pairs. These fluctuations are influenced by interest rate changes as well as political and general economic conditions. The Fund trades in a large number of currencies, including cross-rates —i.e.,positions between two currencies other than the U.S. Dollar. Campbell & Company does not anticipate that the risk profile of the Fund’s currency sector will change significantly in the future.
Interest Rates
Interest rate risk is a significant market exposure of the Fund. Interest rate movements directly affect the price of the sovereign bond positions held by the Fund and indirectly the value of its stock index and currency positions. Interest rate movements in one country as well as relative interest rate movements between countries materially impact the Fund’s profitability. The Fund’s primary interest rate exposure is to interest rate fluctuations in the United States and the other G-7 countries. Additionally, the Fund takes positions in the government debt of Switzerland. Campbell & Company anticipates that G-7 interest rates will remain the primary market exposure of the Fund for the foreseeable future. The changes in interest rates that have the most effect on the Fund are changes in long-term, as opposed to short-term, rates. Most of the speculative positions held by the Fund are in medium- to long-term instruments.
Stock Indices
The Fund’s primary equity exposure is to equity price risk in the G-7 countries and several other countries (Hong Kong, Spain and Taiwan). The stock index futures traded by the Fund are by
-29-
law limited to futures on broadly based indices. The Fund is primarily exposed to the risk of adverse price trends or static markets in the major U.S., European and Japanese indices. (Static markets would not cause major market changes, but would make it difficult for the Fund to avoid being whipsawed into numerous small losses.)
Energy
The Fund’s primary energy market exposure is to gas and oil price movements, often resulting from political developments and ongoing conflicts in the Middle East. Oil and gas prices can be volatile and substantial profits and losses have been and are expected to continue to be experienced in this market.
Metals
The Fund’s metals market exposure is to fluctuations in the price of copper, nickel and zinc.
Qualitative Disclosures Regarding Non-Trading Risk Exposure
The following were the only non-trading risk exposures of the Fund as of September 30, 2005.
Foreign Currency Balances
The Fund’s primary foreign currency balances are in Japanese Yen, British Pounds and Euros. The Fund controls the non-trading risk of these balances by regularly converting these balances back into Dollars (no less frequently than twice a month, and more frequently if a particular foreign currency balance becomes unusually large).
Treasury Bill Positions
The Fund’s only market exposure in instruments held other than for trading is in its Treasury Bill portfolio. The Fund holds Treasury Bills (interest bearing and credit risk-free) with durations no longer than six months. Violent fluctuations in prevailing interest rates could cause immaterial mark-to-market losses on the Fund’s Treasury Bills, although substantially all of these short-term investments are held to maturity.
Qualitative Disclosures Regarding Means of Managing Risk Exposure
The means by which Campbell & Company attempts to manage the risk of the Fund’s open positions is essentially the same in all market categories traded. Campbell & Company applies risk management policies to its trading which generally limit the total exposure that may be taken per “risk unit” of assets under management. In addition, Campbell & Company follows diversification guidelines (often formulated in terms of the balanced volatility between markets and correlated groups), as well as imposing “stop-loss” points at which open positions must be closed out.
Campbell & Company controls the risk of the Fund’s non-trading instruments (Treasury Bills held for cash management purposes) by limiting the duration of such instruments to no more than six months.
General
The Fund is unaware of any (i) anticipated known demands, commitments or capital expenditures; (ii) material trends, favorable or unfavorable, in its capital resources; or (iii) trends or uncertainties that will have a material effect on operations. From time to time, certain regulatory agencies have proposed increased margin requirements on futures contracts. Because the Fund generally will use a small percentage of assets as margin, the Fund does not believe that any increase in margin requirements, as proposed, will have a material effect on the Fund’s operations.
[REMAINDER OF THIS PAGE LEFT BLANK INTENTIONALLY.]
-30-
PAST PERFORMANCE OF THE CAMPBELL STRATEGIC ALLOCATION FUND, L.P.
January 2001 — December 2005
Type of Pool:Publicly offered
Inception of Trading:April 18, 1994
Aggregate Gross Capital Subscriptions to the Fund:$5,104,056,647
Current Net Asset Value of the Fund:$5,175,698,659
Worst Monthly Percentage Draw-down(1): November 2001/10.14%
Worst Peak-to-Valley Draw-down(1): October 2001 – April 2002/15.68%
PAST PERFORMANCE IS NOT NECESSARILY INDICATIVE OF FUTURE RESULTS.
| Rate of Return(2) | ||||||||||||||||||||
| (Computed on a compounded monthly basis) | ||||||||||||||||||||
| Month | 2005 | 2004 | 2003 | 2002 | 2001 | |||||||||||||||
| January | -2.22% | 1.85% | 7.74% | -0.98% | -1.30% | |||||||||||||||
| February | -1.32% | 10.65% | 7.46% | -2.27% | 0.11% | |||||||||||||||
| March | -0.07% | 0.83% | -4.52% | -1.81% | 7.02% | |||||||||||||||
| April | 0.40% | -6.84% | 2.51% | -4.57% | -8.42% | |||||||||||||||
| May | 4.86% | -0.61% | 1.89% | 3.88% | 0.95% | |||||||||||||||
| June | 6.54% | -3.30% | -0.94% | 7.74% | -1.98% | |||||||||||||||
| July | 0.90% | -0.73% | -4.85% | 7.78% | 1.15% | |||||||||||||||
| August | -5.68% | -1.37% | 2.23% | 3.33% | 1.94% | |||||||||||||||
| September | 3.59% | -1.78% | -1.72% | 3.62% | 6.66% | |||||||||||||||
| October | 3.97% | 2.16% | 2.63% | -4.98% | 5.01% | |||||||||||||||
| November | 2.02% | 3.78% | 0.71% | -1.61% | -10.14% | |||||||||||||||
| December | -3.16% | 0.59% | 4.14% | 3.31% | 3.49% | |||||||||||||||
| Total | 9.53% | 4.35% | 17.68% | 13.12% | 2.91% | |||||||||||||||
| (1) | “Draw-down” means losses experienced by the Fund over a specified period. |
| (2) | The “Rate of Return” for a period is calculated by dividing the net profit or loss by the assets at the beginning of such period. Additions and withdrawals occurring during the period are included as an addition to or deduction from beginning net assets in the calculations of “Rates of Return.” |
Please refer to Part Two, the Statement of Additional Information, for additional performance information and graphic presentations of the Fund.
CONFLICTS OF INTEREST
Campbell & Company, Inc.
Conflicts exist between Campbell & Company’s interests in and its responsibilities to the Fund. The conflicts are inherent in Campbell & Company acting as general partner and as trading advisor to the Fund. The conflicts and the potential detriments to the limited partners are described below.
Campbell & Company’s selection of itself as trading advisor was not objective, since it is also the general partner of the Fund. In addition, it has a disincentive to replace itself as the trading advisor. The Advisory Agreement between the Fund and Campbell & Company, including the fee arrangement, was not negotiated at arm’s length. Investors should note, however, that Campbell & Company believes that the fee arrangements are fair to the Fund and competitive with compensation arrangements in pools involving independent general partners and advisors. Campbell & Company will review its compensation terms annually to determine whether such terms continue to be competitive with other pools for similar services and will lower such fees if it concludes, in good faith, that its fees are no longer competitive. Neither Campbell & Company nor any trading advisor may receive per-trade compensation directly or indirectly from the Fund. Investors should note that Campbell & Company operates other commodity pool offerings which may have materially different terms and may operate at a lower overall cost structure.
Neither Campbell & Company nor its principals devote their time exclusively to the Fund. Campbell & Company (or its principals) acts as general partner to other commodity pools and trading advisor to other accounts, which may
-31-
compete with the Fund for Campbell & Company’s services. Thus, Campbell & Company could have a conflict between its responsibilities to the Fund and to those other pools and accounts. Campbell & Company believes that it has sufficient resources to discharge its responsibilities in this regard in a fair manner.
Campbell & Company receives higher advisory fees from some of those other accounts than it receives from the Fund. Campbell & Company, however, trades all accounts of the Financial, Metal & Energy Large Portfolio (including the Fund’s) in a substantially similar manner, given the differences in size and timing of the capital additions and withdrawals. In addition, Campbell & Company may find that futures positions established for the benefit of the Fund, when aggregated with positions in other accounts traded by Campbell & Company, approach the speculative position limits in a particular commodity. Campbell & Company may decide to address this situation either by liquidating the Fund’s positions in that futures contract and reapportioning the portfolio in other contracts or by trading contracts in other markets which do not have restrictive limits. In the event that Campbell & Company were required to liquidate positions as the result of speculative position limits, such liquidation would be done on a pro rata basis across all accounts under management.
Any principal of Campbell & Company may trade futures and related contracts for its own account. In addition, Campbell & Company manages proprietary accounts for its deferred compensation plan and certain principals and employees. There are written procedures that govern proprietary trading by principals and employees. Trading records for all proprietary trading are available for review by clients and investors upon reasonable notice. A conflict of interest exists if proprietary trades are in the same markets and at the same time, using the futures brokers to be used by the Fund.
When Campbell & Company executes an order in the market, the order is typically placed on an aggregate basis for all accounts for which Campbell & Company trades, and then is subsequently broken up and allocated among the various accounts. To the extent executions are grouped together and then allocated among accounts held at the futures brokers and the over-the-counter counterparties, the Fund may receive less favorable executions than such other accounts. It is Campbell & Company’s policy to objectively allocate trade executions that afford each account the same likelihood of receiving favorable or unfavorable executions over time. A potential conflict also may occur when Campbell & Company or its principals trade their proprietary accounts more aggressively or take positions in proprietary accounts which are opposite, or ahead of, the positions taken by the Fund.
The Futures Brokers and the Over-the-Counter Counterparties
The futures brokers, currently UBS Financial Services Inc. and Goldman, Sachs & Co., and the over-the-counter counterparties, currently ABN AMRO Bank N.V., Chicago Branch, Deutsche Bank AG London, The Royal Bank of Scotland PLC, Morgan Stanley Capital Group, Inc. and one or more companies that are wholly owned by The Goldman Sachs Group, Inc. (including J. Aron & Company), and the affiliates and personnel of such entities, may trade futures, forward, option and swap contracts for their own accounts. This trading could give rise to conflicts of interest with the Fund.
UBS Financial Services Inc. is one of the futures brokers and also a selling agent of the Fund, which could give rise to conflicts of interest because its compensation in each role is based on the net asset value of units outstanding. Further, in making recommendations to redeem or purchase additional units, UBS Financial Services Inc. employees may have a conflict of interest between acting in the best interest of their clients and assuring continued compensation to their employer and themselves. Finally, UBS Financial Services Inc. may offer additional pools managed by Campbell & Company in which brokerage and selling fees paid to UBS Financial Services Inc. are lower than the Fund’s fees.
The Selling Agents
A current list of the selling agents for the Fund includes, but is not limited to: A.G. Edwards & Sons, Inc.; Campbell Financial Services, Inc.; Ferris, Baker Watts Incorporated; Linsco/Private Ledger Corp.; Merrill Lynch, Pierce, Fenner & Smith Incorporated; Securities America, Inc.; UBS Financial Services Inc.; and
-32-
Wachovia Securities, LLC. The selling agents (or their assignees) which are registered futures commission merchants or introducing brokers will receive, beginning in the thirteenth month after the sale of the units, ongoing compensation based on the net asset value of the units which remain outstanding. Consequently, in advising clients whether they should redeem their units or purchase additional units, such selling agents will have a conflict of interest between the selling agents’ interest in maximizing the ongoing compensation which they will receive and their interest in giving their client the financial advice which is in such clients’ best interests.
Campbell & Company acts as a commodity pool operator and a commodity trading advisor in respect of various managed futures investment products. The selling agents may or may not be authorized to offer certain of such products to their clients, which may have materially different terms, including investment portfolios and objectives, fees, risks, conflicts of interest and suitability requirements, from those of the Fund.
Fiduciary Duty and Remedies
In evaluating the foregoing conflicts of interest, a prospective investor should be aware that Campbell & Company, as general partner, has a responsibility to limited partners to exercise good faith and fairness in all dealings affecting the Fund. The fiduciary responsibility of a general partner to the limited partners is a rapidly developing and changing area of the law and limited partners who have questions concerning the duties of Campbell & Company as general partner should consult with their own counsel. In the event that a limited partner believes that Campbell & Company has violated its fiduciary duty to the limited partners, he may seek legal relief individually or on behalf of the Fund under applicable laws, including partnership and commodities laws, to recover damages from or require an accounting by Campbell & Company. The Limited Partnership Agreement is governed by Delaware law and any breach of Campbell & Company’s fiduciary duty under the Limited Partnership Agreement will generally be governed by Delaware law. The Limited Partnership Agreement does not limit Campbell & Company’s fiduciary obligations under Delaware or common law; however, Campbell & Company may assert as a defense to claims of breach of fiduciary duty that the conflicts of interest and fees payable to Campbell & Company have been disclosed in the prospectus. Limited partners may also have the right, subject to applicable procedural and jurisdictional requirements, to bring partnership class actions in federal court to enforce their rights under the federal securities laws and the rules and regulations promulgated thereunder by the U.S. Securities and Exchange Commission (“SEC”). Limited partners who have suffered losses in connection with the purchase or sale of the units may be able to recover such losses from Campbell & Company where the losses result from a violation by Campbell & Company of the federal securities laws. State securities laws may also provide remedies, such as the ability to bring civil liability lawsuits, to limited partners. Limited partners should be aware that performance by Campbell & Company of its fiduciary duty to the Fund is measured by the terms of the Limited Partnership Agreement as well as applicable law.
Limited partners are afforded rights to institute reparations proceedings under the Commodity Exchange Act for violations of the Commodity Exchange Act or of any rule, regulation or order of the CFTC by Campbell & Company.
Indemnification and Standard of Liability
Campbell & Company and its controlling persons may not be liable to the Fund or any limited partner for errors in judgment or other acts or omissions not amounting to misconduct or negligence, as a consequence of the indemnification and exculpatory provisions described in the following paragraph. Purchasers of units may have more limited rights of action than they would absent such provisions.
Campbell & Company and its controlling persons shall not have any liability to the Fund or to any limited partner for any loss suffered by the Fund which arises out of any action or inaction if Campbell & Company, in good faith, determined that such course of conduct was in the best interests of the Fund and such course of conduct did not constitute negligence or misconduct of Campbell & Company. The Fund has agreed to indemnify Campbell & Company and its controlling persons against claims, losses or liabilities based on their conduct relating to the Fund, provided that the conduct resulting in the claims, losses or liabilities for which indemnity is sought
-33-
did not constitute negligence or misconduct or breach of any fiduciary obligation to the Fund and was done in good faith and in a manner which Campbell & Company, in good faith, determined to be in the best interests of the Fund. Controlling persons of Campbell & Company are entitled to indemnity only for losses resulting from claims against such controlling persons due solely to their relationship with Campbell & Company or for losses incurred in performing the duties of Campbell & Company. See Article 15 of the Limited Partnership Agreement, included as Exhibit A to this prospectus.
The Fund will not indemnify Campbell & Company or its controlling persons for any liability arising from securities law violations in connection with the offering of the units, unless Campbell & Company or its controlling persons prevails on the merits or obtains a court approved settlement (in accordance with Section 15.2 of the Limited Partnership Agreement). The position of the SEC is that any such indemnification is contrary to the federal securities laws and therefore unenforceable.
CHARGES TO THE FUND
The following list of expenses includes all compensation, fees, profits and other benefits (including reimbursement of out-of-pocket expenses) which Campbell & Company, the selling agents, the futures brokers, the over-the-counter counterparties and the affiliates of those parties may earn or receive in connection with the offering and operation of the Fund. Prospective investors should refer to the Summary for an estimate of the trading profit and interest income that must be earned for an investor to break-even in the first year of trading.
Brokerage Fee
The Fund pays a single asset-based fee for all brokerage and management services. The fee is equal to up to 8% per annum of month-end net assets of the Fund, prior to accruals for such brokerage fee or performance fees. This fee is paid to Campbell & Company which, in turn, remits a portion of such brokerage fee to third parties as set forth below.
From such 8% brokerage fee, Campbell & Company remits up to 1% to the futures brokers and the over-the-counter counterparties for execution and clearing costs and 4% to the selling agents for ongoing services provided to the limited partners. Campbell & Company will retain the remaining 3% as management fees (2% for providing advisory services and 1% for acting as general partner). The amount of the fee to be paid to the futures broker is evaluated from time to time based on an ongoing analysis of competitive market clearing costs, but at no time will the amount exceed the 1%.
Other Fund Expenses
The Fund also will be subject to the following fees and expenses.
| Recipient | Nature of Payment | Amount of Payment | ||
| Campbell & Company | Quarterly Performance Fee | 20% of cumulative appreciation in net asset value per unit, excluding interest income, after deduction for brokerage and all other fees. | ||
| Reimbursement of offering expenses | As incurred; to be reimbursed, up to 2.5% of aggregate subscriptions, in 30-month payment periods. | |||
| Dealers | “Bid-ask” spreads | Indeterminable because embedded in price of forward, option and swap contracts. | ||
| Others | Legal, accounting, printing, postage and administrative costs | As incurred, up to a maximum of 0.5% of average month-end net assets per annum. |
-34-
The above fees, together with the brokerage fee, are the complete compensation that will be received by Campbell & Company or its affiliates from the Fund. This excludes redemption fees, which will be charged to some limited partners if they redeem prior to one year of ownership.
Campbell & Company, Inc.
Brokerage Fee
Campbell & Company receives a brokerage fee of up to 8% per annum, as described earlier.
The futures brokers are paid approximately $6 per round-turn trade per contract, which equates to approximately 0.36% annually. In addition, the over-the-counter counterparties charge approximately $8 per $1 million, plus any additional electronic platform charges, for forward and option contracts facilitated on behalf of the Fund with third party banks. These fees, combined with the futures brokers’ charges, equal approximately 0.40% of the Fund’s net assets, but will not exceed 1%. The approximate 0.40% actual brokerage fee, compared to the 1% allowable, lowers the Fund’s total brokerage fee to approximately 7.40%. If trading velocity and/or portfolio allocation change again in the future, the fee may be further reduced, or it may be raised. However, the Fund’s brokerage fee will not exceed 8%.
Redemption Fee
Redemption fees apply through the first twelve month-ends following purchase (the month-end as of which the unit is purchased is counted as the first month-end) as follows: 4% of net asset value per unit redeemed through the third month-end, 3% of net asset value per unit redeemed through the sixth month-end, 2% of net asset value per unit redeemed through the ninth month-end, and 1% of net asset value per unit redeemed through the twelfth month-end. After the twelfth month-end following purchase of a unit, no redemption fees apply. Because the purchase date counts as the first month-end in determining whether a redemption fee applies, no redemption fee would be due in respect of a unit redeemed on the first anniversary of the purchase.
Performance Fee
The performance fee equals 20% of the aggregate cumulative appreciation (if any) in the net asset value of the units calculated pursuant to the terms of the advisory agreement between the Fund and Campbell & Company and paid quarterly. “Aggregate cumulative appreciation” means the total increase in unit value from the commencement of trading, minus the total increase in unit value for all prior quarters, multiplied by the number of units outstanding. The performance fee is paid only on profits attributable to units outstanding, and no fee is paid with respect to interest income. Because the performance fee is accrued monthly, units that are redeemed other than at the end of the quarter will effectively pay a performance fee, if accrued, as of the end of the month in which the redemption occurs.
If any payment is made by the Fund in respect of a performance fee, and the Fund thereafter incurs a net loss, Campbell & Company will retain the amount previously paid. Thus, Campbell & Company may be paid a performance fee during a year in which the Fund overall incurred net losses. Trading losses shall be carried forward and no further performance fees may be paid until the prior losses have been recovered.
Below is a sample calculation of how the performance fee is determined:
Assume the Fund paid a performance fee at the end of the fourth quarter of 2006 and assume that the Fund recognized trading profits (net of all brokerage fees and operating and offering expenses) of $200,000 during the first quarter of 2007. The aggregate cumulative appreciation for the quarter (before interest earned) would be $200,000 and Campbell & Company’s performance fee would be $40,000 (0.2 x $200,000). Now assume that the Fund paid a performance fee at the end of the third quarter of 2006 but did not pay a performance fee at the end of the fourth quarter of 2006 because it had trading losses of $100,000. If the Fund recognized trading profits of $200,000 at the end of the first quarter of 2007, the aggregate cumulative appreciation (before interest earned) for the quarter would be $100,000 ($200,000 — $100,000 loss carryforward) and Campbell & Company’s performance fee would be $20,000 (0.2 x $100,000). Please note that this simplified example assumes that no limited partners have added or redeemed units during this sample time frame. Such capital changes require that the calculation be determined on a “per unit” basis.
-35-
If the net asset value per unit at the time when a particular investor acquires units is lower than the net asset value per unit as of the end of the most recent prior calendar quarter for which a performance fee was payable (due to losses incurred between such quarter-end and the subscription date), such units might experience a substantial increase in value after the subscription date yet pay no performance fee as of the next calendar quarter-end because the Fund as a whole has not experienced aggregate cumulative appreciation.
If a performance fee accrual is in effect at the time when particular units are purchased (due to gains achieved prior to the applicable subscription day), the net asset value per unit reflects such accrual. In the event the net asset value of the Fund declines after the subscription date, the incentive fee accrual is “reversed” and such reversal is credited to all units equally, including the units which were purchased at a net asset value per unit which fully reflected such accrual.
Performance fees are not reduced by redemption charges.
The brokerage fee and performance fee may be increased upon sixty days’ notice to the limited partners, as long as the notice explains their redemption and voting rights. Existing limited partners who redeem within twelve months after any increase in fees would not be required to pay any redemption fees.
The Futures Brokers
As described earlier, the futures brokers receive from Campbell & Company up to 1% per annum of the net assets of the Fund (which includes payments to the over-the-counter counterparties as referenced below), which is a portion of the maximum 8% brokerage fee. The futures brokers are responsible for all trading transactional costs, such as pit brokerage, exchange and NFA fees, “give-up” and transfer fees. The compensation to the futures brokers are competitive with rates paid by other trading funds having assets and structure similar to the Fund. The compensation to the futures brokers of approximately $6 per round-turn contract is equivalent to approximately 0.36% of net assets per annum. The compensation paid to the futures brokers will not exceed the guidelines established by the North American Securities Administrators Association, Inc. (“NASAA”).
The Selling Agents
The selling agents receive from Campbell & Company (and not the Fund) selling commissions of up to 4% of the subscription amount of each subscription for units. In addition, commencing thirteen months after the sale of units and in return for providing ongoing services to the limited partners, Campbell & Company will pay those selling agents (or their assignees) which are registered at such time with the NFA as futures commission merchants or introducing brokers a portion of the 8% brokerage fee of up to 4% per annum of average month-end net assets of all units which remain outstanding.
Selling agents and registered representatives who are not registered with the NFA as described above may receive additional selling commissions from Campbell & Company. These additional selling commissions are paid on the same basis as the ongoing payments, provided that the total of additional commissions, plus:
| (1) | the initial 4% selling commission; | |
| (2) | salaries, expenses and bonuses of employees of Campbell & Company engaged in wholesaling activities; and | |
| (3) | per-unit organization and offering costs properly deemed to constitute costs allocable to the selling agents, such as a selling brochure, seminar costs and travel expenses, |
do not exceed 10% of such units’ initial sale price. Such compensation may be deemed to create a conflict of interest in that the selling agents have a disincentive in advising investors to redeem their units. See “Conflicts of Interest.”
The Over-the-Counter Counterparties
The Fund trades forward, option and swap contracts among dealers which act as “principals” or counterparties to each trade. The execution costs are included in the price of the forward, option or swap contract purchased or sold, and, accordingly, such costs cannot be determined. Campbell & Company believes the bid-ask spreads for forward, option and swap contract trades, which incorporate these execution costs, are at the prevailing market prices. In addition,
-36-
the over-the-counter counterparties charge approximately $8 per $1 million, plus any additional electronic platform charges, in prime brokerage fees for forward and option contracts they facilitate on behalf of the Fund with third party banks. These prime brokerage fees, combined with the futures brokers’ charges, will not exceed the 1% per annum of the net assets of the Fund, as referenced under “The Futures Brokers” above.
Offering Expenses
The offering expenses during the continuing offering period through December 31, 2005 totaled $71,370,632 and are estimated at $9,000,000 for the nine months following the date of this prospectus, all of which will be advanced by Campbell & Company. Such expenses include all fees and expenses in connection with the distribution of the units, including legal, accounting, printing, mailing, filing fees, escrow fees, salaries and bonuses of employees while engaged in sales activities, and marketing expenses of Campbell & Company and the selling agents which are paid by the Fund. Subject to the limit described below, Campbell & Company will be reimbursed, without interest, by the Fund in 30-month payment periods throughout the continuing offering. In no event shall the reimbursement exceed 2.5% of the total subscriptions accepted by Campbell & Company, which, based on the 30-month amortization period, represents a maximum of 1% of gross additions per annum. Organization and offering expenses equal to $240,961 were incurred during the initial offering period and were advanced by Campbell & Company. Such expenses were reimbursed in the same manner and were subject to the same 2.5% limit.
The Fund is required to disclose that the “organization and offering expenses” of the Fund, as defined by the NASAA Guidelines, will not exceed 15% of the total subscriptions accepted. Campbell & Company, and not the Fund, shall be responsible for any expenses in excess of such limitation. Since Campbell & Company has agreed to limit its reimbursement of such expenses to 2.5% of total subscriptions, the NASAA Guidelines limit of 15% of total subscriptions (even when added to the selling commissions) will not be reached.
Other Expenses
The Fund bears its operating expenses, including, but not limited to, administrative, legal and accounting fees, and any taxes or extraordinary expenses payable by the Fund. Such expenses are estimated to be 0.10% (and will not exceed 0.50%) of the Fund’s net assets per annum; 0.7 basis points (0.00007) of the 10 estimated basis points will be paid to Campbell & Company directly to cover administrative expenses incurred on behalf of the Fund. Campbell & Company shall be responsible for any such expenses during any year of operations which exceed such percentage estimate. For the years ended December 31, 2005, 2004 and 2003, operating expenses were 0.05%, 0.08% and 0.11%, respectively, of the Fund’s average net assets. Indirect expenses in connection with the administration of the Fund, such as indirect salaries, rent, travel and other overhead of Campbell & Company, may not be charged to the Fund. Actual expenses charged to the Fund are reflected on a dollar basis in the financial statements for the Fund; see “Index to Financial Statements.”
USE OF PROCEEDS
The entire offering proceeds, without deductions, will be credited to the Fund’s bank and brokerage accounts to engage in trading activities and as reserves for that trading. The Fund meets its margin requirements by depositing U.S. government securities with the futures brokers and the over-the-counter counterparties. In this way, substantially all (i.e., 95% or more) of the Fund’s assets, whether used as margin for trading purposes or as reserves for such trading, can be invested in U.S. government securities and time deposits with U.S. banks. Investors should note that maintenance of the Fund’s assets in U.S. government securities and banks does not reduce the risk of loss from trading futures, forwards, options and swaps. The Fund receives all interest earned on its assets. No other person shall receive any interest or other economic benefits from the deposit of Fund assets.
Approximately 10% to 30% of the Fund’s assets normally are committed as required margin for futures contracts and held by the futures brokers, although the amount committed may vary significantly. Such assets are maintained in the form of cash or U.S. Treasury bills in segregated accounts with the futures brokers pursuant to the
-37-
Commodity Exchange Act and regulations thereunder. Approximately 10% to 30% of the Fund’s assets are deposited with over-the-counter counterparties in order to initiate and maintain forward, option and swap contracts. Such assets are not held in segregation or otherwise regulated under the Commodity Exchange Act, unless such over-the-counter counterparty is registered as a futures commission merchant. These assets are held either in U.S. government securities or short-term time deposits with U.S.-regulated bank affiliates of the over-the-counter counterparties. The remaining 40% to 80% of the Fund’s assets will normally be invested in cash equivalents such as U.S. Treasury bills and held by the futures brokers or the over-the-counter counterparties.
The Fund’s assets are not and will not be, directly or indirectly, commingled with the property of any other person in violation of law or invested with or loaned to Campbell & Company or any affiliated entities.
THE FUTURES BROKERS
UBS Financial Services Inc. (“UBS”), a Delaware corporation, is one of the Fund’s futures brokers and one of the selling agents. Additional or replacement futures brokers may be appointed in respect of the Fund’s account in the future solely at the discretion of Campbell & Company.
The futures broker’s principal office is located at 800 Harbor Boulevard, Weehawken, New Jersey 07086, telephone: (201) 352-3000. The futures broker is registered with the CFTC as a futures commission merchant and is a member of the NFA in such capacity. UBS is a wholly-owned indirect subsidiary of UBS AG.
Futures trades made on behalf of the Fund are carried by UBS. UBS will cause all futures trades made on behalf of the Fund to be cleared through its parent, UBS AG. UBS is not affiliated with Campbell & Company. UBS did not sponsor the Fund and is not responsible for the activities of Campbell & Company. It will act only as one of the futures brokers and one of the selling agents.
Except as set forth below, neither UBS nor any of its principals have been involved in any administrative, civil or criminal proceeding — whether pending, on appeal or concluded — within the past five years that is material to a decision whether to invest in the Fund in light of all the circumstances. Prior to June 9, 2003, UBS was known as UBS PaineWebber Inc. Prior to March 5, 2001, UBS PaineWebber Inc. was known as PaineWebber Inc. (“PaineWebber”). Like most securities firms, UBS is and has been a defendant in numerous legal actions relating to its securities and commodities business that allege various violations of federal and state securities laws. Prior to November 3, 2000, UBS was a wholly owned subsidiary of PaineWebber Group Inc., a public company listed on the New York Stock Exchange (“NYSE”) which regularly reported on Forms 10-K and 10-Q to the SEC and the NYSE regarding pending material litigation, including administrative proceedings. These reports are publicly available and include information about UBS matters.
Effective November 3, 2000, UBS became a wholly owned subsidiary of UBS Americas Inc. and an indirect subsidiary of UBS AG. UBS AG, a Swiss banking corporation, is publicly owned, and its shares are listed on the Zurich, New York and Tokyo stock exchanges. UBS AG files annual reports on Form 20-F with the SEC, and also files quarterly reports and certain other material information with the SEC under cover of Form 6-K. These reports are publicly available. Starting with the Form 20-F for the year ended December 31, 2000, these reports include material information about UBS matters, including information about any material litigation or administrative proceedings.
On May 6, 2005, UBS, without admitting or denying the findings, signed a Letter of Acceptance, Waiver and Consent with the National Association of Securities Dealers Inc. (“NASD”) relating to the firm’s marketing and sale of a non-proprietary managed futures fund to certain customers. The NASD reviewed the period January 2002 to December 2003, during which time more than 4,000 UBS customers purchased the fund. The NASD found that 14 customers made investments in the fund that exceeded 10% of their net worth, which was not permitted by the prospectus. The NASD also found that UBS did not maintain certain records disclosing the basis upon which suitability determinations were made when the fund was recommended to customers, did not establish and maintain a supervisory system related to maintaining these records and did not adequately describe certain of the risks of investing in managed futures on UBS’ public website.
-38-
To resolve this matter, UBS agreed to a censure, a fine of $175,000, and agreed to offer restitution to the 14 affected customers. UBS also agreed to determine whether another group of customers’ purchases of the fund exceeded the net worth limitation set forth in the fund’s prospectus and, if so, to offer them restitution.
On July 7, 2004, UBS, without admitting or denying the findings, settled with the NASD an action relating to the firm’s sales literature for privately placed registered investment companies. The NASD found that, between July 2002 and May 2003, UBS distributed a number of pieces of sales literature to its customers that did not comply with NASD conduct Rules 2210(d)(1)(A) and 2110. These included one sales presentation which stated that the fund was seeking a targeted rate of return without providing a substantiated basis for the target, and 22 fund updates which did not contain adequate risk disclosure. To resolve these charges, the firm agreed to a censure, a fine of $85,000 and to submit certain sales literature relating to privately placed registered investment companies to the NASD for review within 30 days of July 7, 2004.
On June 28, 2004, UBS, along with seven other firms, without admitting or denying the findings, settled with the NASD, an action alleging violations of MSRB Rules G-17 and G-30 concerning UBS’s sole reliance on broker’s brokers to determine the fair market value of certain of its customers’ bonds. Under the terms of the settlement, UBS was censured, paid a $100,000 fine and made restitution to affected customers in the amount of $100,666.05.
On February 12, 2004 UBS and six other firms settled with both the SEC and NASD actions relating to UBS’s failure to uniformly provide breakpoint (volume) discounts to clients during 2001 and 2002, in violation of various federal requirements and the NASD’s just and equitable principles of trade rule. UBS was fined a total of $4,621,768, to be paid in equal amounts to the SEC and NASD.
On November 24, 2003, UBS, without admitting or denying the charges, settled an administrative action with the Commonwealth of Massachusetts in which it was alleged that UBS violated Massachusetts law for failing to supervise a former broker. UBS was ordered to pay a fine of $200,000.
UBS and UBS Securities Inc. (formerly known as UBS Warburg LLC) (together “the UBS defendants”) are included among the ten firms participating in the global settlement that was approved by the United States District Court for the Southern District of New York on October 31, 2003 and resolved charges brought by the SEC, NYSE, NASD and the various states relating to the conflicts of interest between equity research and investment banking. Under the terms of the settlement, the UBS defendants will pay a $25 million penalty, $25 million in disgorgement of commissions and fees, and an additional $25 million to purchase independent research for client use for a period of five years and an additional $5 million for investor education.
On August 20, 2003, UBS, without admitting or denying the findings, settled with the SEC in connection with its investigation of the conduct of a former broker of UBS. UBS consented to the entry of an administrative order that UBS failed to reasonably supervise the broker, censuring UBS and imposing a fine of $500,000.
On July 11, 2003, a stipulation and consent to penalty entered into between UBS and the NYSE became final, in which UBS consented to findings that the firm engaged in conduct inconsistent with just and equitable principles of trade and other NYSE rule violations by recommending and selling callable certificates of deposit (CDs) which were unsuitable for certain customers, and for failing to establish and maintain appropriate marketing and sales supervision and procedures in connection with such sales. UBS was censured and fined $175,000.
On April 6, 2000, seventeen broker/dealer firms, including UBS, entered into a global settlement resolving the allegations involving the pricing and sale of government securities in municipal bond advance refunding transactions during the period 1990 through 1994. As a result, UBS along with nine other firms entered into settlement agreements with the United States Department of Justice, the SEC, and the United States Internal Revenue Service. Other firms settled similar charges with NASD Regulation, Inc. Without admitting liability, these firms agreed among other things to the entry of a cease and desist order and to make payments (in the amount of approximately $21 million) to the United States Treasury and ($4 million) to certain municipal issuers.
-39-
Goldman, Sachs & Co. (“GOLDMAN”) is one of the Fund’s futures brokers. Additional or replacement futures brokers may be appointed in respect of the Fund’s account in the future solely at the discretion of Campbell & Company.
GOLDMAN’s principal address is 85 Broad Street, New York, NY 10004, telephone (212) 904 -1000.
Futures trades made on behalf of the Fund are carried by GOLDMAN. GOLDMAN is not affiliated with Campbell & Company. GOLDMAN did not sponsor the Fund and is not responsible for the activities of Campbell & Company. It will act only as one of the futures brokers.
GOLDMAN, in addition to being a registered futures commission merchant, is a registered broker-dealer. From time to time, GOLDMAN and its affiliates are involved in judicial, regulatory and arbitration concerning matters arising in connection with the conduct of its business. GOLDMAN’s management believes, based on currently available information, that the results of such proceedings, in the aggregate, will not have a material adverse effect on the firm’s financial condition, but may be material to the firm’s operating results for any particular period, depending, in part, upon the results for such period. For further information, please refer to the periodic public filings by The Goldman Sachs Group, Inc. and to GOLDMAN’s Form BD as periodically filed with the Securities and Exchange Commission. These filings are posted in the EDGAR database at the SEC website at http://www.sec.gov.
THE OVER-THE-COUNTER COUNTERPARTIES
The Fund trades foreign exchange and other forward, option and swap contracts through “dealers” in such contracts. The dealers that maintain the forward and option positions, or act as the counterparties, for the Fund are ABN AMRO Bank N.V., Chicago Branch, Deutsche Bank AG London and The Royal Bank of Scotland PLC. Unlike futures contracts which are traded through brokers such as the futures brokers, foreign exchange or currency forward, option and swap contracts are executed through a network of dealers. Campbell & Company then instructs the executing dealer to “give up” the trade to ABN AMRO Bank N.V., Chicago Branch, Deutsche Bank AG London or The Royal Bank of Scotland PLC. The dealers used for swap contracts are Morgan Stanley Capital Group, Inc. and one or more companies that are wholly owned by The Goldman Sachs Group, Inc. (including J. Aron & Company).
Campbell & Company is not obligated to continue to use the over-the-counter counterparties identified above and may select others or additional ones in the future, provided Campbell & Company believes that their service and pricing are competitive and present minimal counterparty credit risk.
CAPITALIZATION
The Fund was formed on May 11, 1993. The following table shows the capitalization of the Fund as of December 31, 2005 and as adjusted for the sale of the maximum amount of units registered.
| As Adjusted | ||||||||
| for Sale of | ||||||||
| Outstanding | Maximum | |||||||
| as of | Amount | |||||||
| Title of Class | December 31, 2005 | (1)(2) | ||||||
| Units of General Partnership Interest | 17,240.171 | 21,552.145 | ||||||
| Units of Limited Partnership Interest | 1,703,733.918 | 2,133,662.374 | ||||||
| Total Partners’ Capital | $ | 5,175,698,659 | $ | 6,481,642,012 | ||||
(See accompanying notes)
| (1) | This calculation assumes that the sale of all units is made during the continuing offering at the December 31, 2005 net asset value per unit of $3,007.42. The maximum amount will vary depending on the unit value and number of units sold during the continuing offering. |
| (2) | To organize the Fund, the initial limited partner purchased one unit for $1,000 and Campbell & Company purchased one general partnership unit for $1,000. Campbell & Company has agreed to make capital contributions to the Fund equal to at least 1% of the net aggregate capital contributions of all partners. As of December 31, 2005, Campbell & Company owned 17,240.171 units of general partnership interest. |
DISTRIBUTIONS AND REDEMPTIONS
Distributions
Campbell & Company is not required to make any distributions to limited partners. However, Campbell & Company does have the authority to make such distributions, and reserves the right to do so at any time in its sole discretion. Campbell & Company is not under any obligation to make pro rata distributions to its other accounts under management if it makes distributions to the Fund. The amount and timing of future distributions is uncertain. Because of the potential volatility of futures, forward, option and swap markets,
-40-
especially in the short-term, the Fund is recommended for those seeking a medium- to long-term investment (i.e., 3-5 years).
If the Fund realizes profits for any fiscal year, such profits will constitute taxable income to the limited partners in accordance with their respective investments in the Fund whether or not cash or other property has been distributed to limited partners. Any distributions, if made, may be inadequate to cover such taxes payable by the limited partners.
Redemptions
A limited partner, with the payment of charges below, may request any or all of his units be redeemed by the Fund at the net asset value of a unit as of the end of the month. Limited partners must transmit a written request of such withdrawal to Campbell & Company not less than ten (10) business days prior to the end of the month (or such shorter period as permitted by Campbell & Company). See Exhibit B to this prospectus for the form of Request for Redemption.
Redemption Fees
Redemption fees apply through the first twelve month-ends following purchase (the month-end as of which the unit is purchased is counted as the first month-end) as follows: 4% of net asset value per unit redeemed through the third month-end, 3% of net asset value per unit redeemed through the sixth month-end, 2% of net asset value per unit redeemed through the ninth month-end, and 1% of net asset value per unit redeemed through the twelfth month-end. After the twelfth month-end following purchase of a unit, no redemption fees apply. Because the purchase date counts as the first month-end in determining whether a redemption fee applies, no redemption fee would be due in respect of a unit redeemed on the first anniversary of the purchase. Accordingly, redemption fees are not included in the “break-even” estimate set forth below. For example, if a unit were purchased on June 30, 2006 (the Closing Date for such unit), a redemption fee of 4% would apply if the unit were redeemed on July 31, or August 31, 2006, a redemption fee of 3% would apply if the unit were redeemed on September 30, October 31, or November 30, 2006, a redemption fee of 2% would apply if the unit were redeemed on December 31, 2006, January 31, or February 28, 2007, a redemption fee of 1% would apply if the unit were redeemed on March 31, April 30, or May 31, 2007 and no redemption fee would apply if the unit were redeemed on or after June 30, 2007.
In determining whether redemption fees apply to a particular limited partner’s units, units shall be deemed to be redeemed on a “first-in, first-out” basis.
The Request for Redemption must specify the number of units for which redemption is sought. Redemptions will be paid within 20 business days after the date of redemption, contingent upon the Fund having assets sufficient to discharge all of its liabilities on the requested date of redemption. In the event that redemptions are requested with respect to more units than Campbell & Company is able to honor, Campbell & Company will honor requests for redemption in the order actually received and will hold requests for redemption in such order. Limited partners will be notified in the event a request for redemption cannot be honored, and their requests will be honored thereafter at the first available opportunity.
The federal income tax aspects of redemptions are described under “Federal Income Tax Aspects.”
Net Asset Value
The net asset value of a unit as of any date is the limited partner’s share of the sum of all cash, plus Treasury bills valued at cost plus accrued interest, and other securities valued at market, plus the market value of all open futures, forward, option and swap positions maintained by the Fund, less all liabilities of the Fund and accrued performance fees, determined in accordance with the principles specified in the Limited Partnership Agreement. Where no principle is specified in the Limited Partnership Agreement, the net asset value is calculated in accordance with accounting principles generally accepted in the United States of America under the accrual basis of accounting, divided by the number of units then outstanding. Thus, if the net asset value of a unit for purposes of redemption is determined as of a month-end which is not the end of a quarter, any performance fees payable to Campbell & Company will be determined and charged to such unit as though such month-end were the end of the quarter and such performance fees will be paid to Campbell & Company.
-41-
AGREEMENT OF LIMITED PARTNERSHIP
The following is a summary of the Limited Partnership Agreement, a form of which is attached as Exhibit A and incorporated by reference.
Organization and Limited Liability
The Fund is organized under the Delaware Revised Uniform Limited Partnership Act (“RULPA”). In general, a limited partner’s liability under RULPA is limited to the amount of his capital contribution and his share of any undistributed profits.
Management of Partnership Affairs
The Limited Partnership Agreement effectively gives Campbell & Company, as general partner, full control over the management of the Fund and gives no management role to the limited partners. To facilitate matters for Campbell & Company, the limited partners must execute the attached Subscription Agreement and Power of Attorney (Exhibit D).
Sharing of Profits and Losses
Profit Potential; Fund Accounting
Each limited partner has a capital account. Initially, the limited partner’s balance equals the amount paid for the units. The limited partner’s balance is then proportionally adjusted monthly to reflect his portion of the Fund’s gains or losses for the month.
Federal Tax Allocations
At year-end, the Fund will determine the total taxable income or loss for the year. Subject to the special allocation of net capital gain or loss to redeeming limited partners, the taxable gain or loss is allocated to each limited partner in proportion to his capital account and each limited partner is responsible for his share of the taxes. See Article 7 of the Limited Partnership Agreement, and “Federal Income Tax Aspects.”
For net capital gain and loss, the gains and losses are first allocated to each limited partner who redeemed units during the year. The remaining net capital gain or loss is then allocated to each limited partner in proportion to his capital account.
Each limited partner’s tax basis in his units is increased by the taxable income allocated to him and reduced by any distributions received and losses allocated to him.
Upon the Fund’s liquidation, each limited partner will receive his proportionate share of the assets of the Fund.
Dispositions
A limited partner may transfer or assign his units in the Fund upon 30 days’ prior written notice to Campbell & Company and subject to approval of the assignee. Campbell & Company will provide consent when it is satisfied that the transfer complies with applicable laws, and further would not result in the termination of the Fund for federal income tax purposes. An assignee not admitted to the Fund as a limited partner will have only limited rights to share the profits and capital of the Fund and a limited redemption right.
Assignees receive “carry-over” tax basis accounts and capital accounts from their assignors, irrespective of the amount paid for the assigned units.
Campbell & Company does not intend to permit purchase transfers.
Dissolution and Termination of the Fund
The Fund will be terminated and dissolved upon the happening of the earlier of:
| 1) | expiration of the Fund’s stated term on December 31, 2023; | |
| 2) | limited partners owning more than 50% of the outstanding units vote to dissolve the Fund; | |
| 3) | Campbell & Company withdraws as general partner and no new general partner is appointed; | |
| 4) | Campbell & Company determines that the purpose of the Fund cannot be fulfilled; or | |
| 5) | the continued existence of the Fund becomes unlawful or the Fund is dissolved by operation of law. |
Amendments and Meetings
The Limited Partnership Agreement may be amended by Campbell & Company if the limited partners owning more than 50% of the outstanding units concur. Campbell & Company may make minor changes to the Limited Partnership Agree-
-42-
ment without the approval of the limited partners. These minor changes can be for clarifications of inaccuracies or ambiguities, modifications in response to changes in tax code or regulations, or any other changes the general partner deems advisable so long as they do not change the basic investment policy or structure.
Limited partners owning at least 10% of the outstanding units can call a meeting of the Fund. At that meeting, the limited partners, provided that limited partners owning a majority of the outstanding units concur, can vote to:
| 1) | amend the Limited Partnership Agreement without the consent of Campbell & Company; | |
| 2) | dissolve the Fund; | |
| 3) | terminate contracts with Campbell & Company; | |
| 4) | remove and replace Campbell & Company as general partner; and | |
| 5) | approve the sale of Fund assets. |
Indemnification
The Fund agrees to indemnify Campbell & Company, as general partner, for actions taken on behalf of the Fund, provided that Campbell & Company’s conduct was in the best interests of the Fund and the conduct was not the result of negligence or misconduct. Indemnification by the Fund for alleged violation of securities laws is only available if the following conditions are satisfied:
| 1) | a successful adjudication on the merits of each count alleged has been obtained, or | |
| 2) | such claims have been dismissed with prejudice on the merits by a court of competent jurisdiction; or | |
| 3) | a court of competent jurisdiction approves a settlement of the claims and finds indemnification of the settlement and related costs should be made; and | |
| 4) | in the case of 3), the court has been advised of the position of the SEC and the states in which the units were offered and sold as to indemnification for the violations. |
Reports to Limited Partners
The limited partners shall have access to and the right to copy the Fund’s books and records. A limited partner may obtain a list of all limited partners together with the number of units owned by each limited partner, provided such request is not for commercial purposes.
Campbell & Company will provide various reports and statements to the limited partners including:
| 1) | monthly, Campbell & Company will provide an unaudited income statement of the prior month’s activities; | |
| 2) | annually, Campbell & Company will provide audited financial statements accompanied by a fiscal year-end summary of the monthly reports described above; | |
| 3) | annually, Campbell & Company will provide tax information necessary for the preparation of the limited partners’ annual federal income tax returns; and | |
| 4) | if the net asset value per unit as of the end of any business day declines by 50% or more from either the prior year-end or the prior month-end unit value, Campbell & Company will suspend trading activities, notify all limited partners of the relevant facts within seven business days and declare a special redemption period. |
FEDERAL INCOME TAX ASPECTS
The following constitutes the opinion of Sidley Austin LLP and summarizes the material federal income tax consequences to individual investors in the Fund. Sidley Austin LLP’s opinion is filed as an exhibit to the registration statement related to the units offered hereby.
Any discussion of U.S. federal tax issues set forth in this prospectus was written in connection with the promotion and marketing by the general partner and the Fund of the units. Such discussion was not intended or written to be legal or tax advice to any person and was not intended or written to be used, and it cannot be used, by any person for the purpose of avoiding any U.S. federal tax penalties that may be imposed on such person. Each investor should seek advice based on its particular circumstances from an independent tax adviser.
The Fund’s Partnership Tax Status
The Fund is a partnership for federal income tax purposes and based on its expected income, it will not be treated as a publicly traded partnership
-43-
taxable as a corporation. Therefore, the Fund will not pay any federal income tax.
Taxation of Limited Partners on Profits and Losses of the Fund
Each limited partner will be subject to tax on his share of the Fund’s annual income and gains, if any, even if the limited partner does not receive any cash distributions from the Fund.
The Fund generally allocates the Fund’s gains and losses equally to each unit. However, a limited partner who redeems any units will be allocated gains and losses in order that the amount of cash a limited partner receives for a redeemed unit equals the limited partner’s adjusted tax basis in the redeemed unit. A limited partner’s adjusted tax basis in a redeemed unit equals the amount originally paid for the unit, increased by income or gains allocated to the unit and decreased (but not below zero) by distributions, deductions or losses allocated to the unit.
Fund Losses by Limited Partners
A limited partner may deduct Fund losses only to the extent of his tax basis in his units. Generally, a limited partner’s tax basis is the amount paid for the units reduced (but not below zero) by his share of any Fund distributions, deductions or losses and increased by his share of the Fund’s income and gains. However, a limited partner subject to “at-risk” limitations (generally, non-corporate taxpayers and closely-held corporations) can only deduct losses to the extent he is “at-risk.” The “at-risk” amount is similar to tax basis, except that it does not include any amount borrowed on a non-recourse basis or from someone with an interest in the Fund.
“Passive-Activity Loss Rules” and Their Effect on the Treatment of Income and Loss
The trading activities of the Fund are not a “passive activity.” Accordingly, a limited partner can deduct Fund losses from taxable income. However, a limited partner cannot offset losses from “passive activities” against Fund gains.
Cash Distributions and Unit Redemptions
A limited partner who receives cash from the Fund, either through a distribution or a partial redemption, will not pay tax on that cash until his tax basis in the units is zero.
Gain or Loss on Section 1256 Contracts and Non-Section 1256 Contracts
Section 1256 Contracts are futures and most options traded on U.S. exchanges and certain foreign currency contracts. For tax purposes, Section 1256 Contracts that remain open at year-end are treated as if the position were closed at year-end. The gain or loss on Section 1256 Contracts is characterized as 60% long-term capital gain or loss and 40% short-term capital gain or loss, regardless of how long the position was open.
Non-Section 1256 Contracts are, among other things, certain foreign currency transactions, including Section 988 transactions — transactions when the amount paid or received is in a foreign currency. Gain and loss from these non-Section 1256 Contracts is generally short-term capital gain or loss or ordinary income or loss.
Tax on Capital Gains and Losses
Long-term capital gains — net gain on capital assets held more than one year, “qualified dividend income,” and 60% of the gain on Section 1256 Contracts — are taxed at a maximum rate of 15% for most gains recognized in taxable years beginning on or before December 31, 2008. Short-term capital gains — net gain on capital assets held less than one year and 40% of the gain on Section 1256 Contracts — are subject to tax at the same rates as ordinary income.
Individual taxpayers can deduct capital losses only to the extent of their capital gains plus $3,000. Accordingly, the Fund could suffer significant losses and a limited partner could still be required to pay taxes on his share of the Fund’s interest income.
An individual taxpayer can carry back net capital losses on Section 1256 Contracts three years to offset earlier gains on Section 1256 Contracts. To the extent the taxpayer cannot offset past Section 1256 Contract gains, he can carry forward such losses indefinitely as losses on Section 1256 Contracts.
Limited Deduction for Certain Expenses
Campbell & Company does not consider the brokerage and performance fees, as well as other ordinary expenses of the Fund, to be investment advisory expenses. Accordingly, the Fund treats these expenses as ordinary business deductions not subject to the material deductibility limitations
-44-
which apply to investment advisory expenses. The IRS could contend otherwise and to the extent the IRS recharacterizes these expenses a limited partner would have the amount of the ordinary expenses allocated to him reduced accordingly.
Interest Income
Interest received by the Fund is taxed as ordinary income. Net capital losses can offset ordinary income only to the extent of $3,000 per year. See “— Tax on Capital Gains and Losses.”
Syndication Fees
Neither the Fund nor any limited partner is entitled to any deduction for syndication expenses, nor can these expenses be amortized by the Fund or any limited partner even though the payment of such expenses reduces net asset value.
The IRS could take the position that a portion of the brokerage fees paid by the Fund to Campbell & Company or part or all of any redemption fees paid by a limited partner constitutes non-deductible syndication expenses.
Investment Interest Deductibility Limitations
Individual taxpayers can deduct “investment interest” — interest on indebtedness allocable to property held for investment — only to the extent that it does not exceed net investment income. Net investment income does not include capital gain and “qualified dividend income” taxed at the lower 15% rate, unless an election is made.
Unrelated Business Taxable Income
Tax-exempt limited partners will not be required to pay tax on their share of income or gains of the Fund, provided that such limited partners do not purchase units with borrowed funds.
IRS Audits of the Fund and its Limited Partners
If the Fund is audited, the IRS audits Fund-related items at the Fund level rather than at the limited partner level. Campbell & Company acts as “tax matters partner” with the authority to determine the Fund’s responses to an audit. If an audit results in an adjustment, all limited partners may be required to pay additional taxes, interest and penalties.
State and Other Taxes
In addition to the federal income tax consequences described above, the Fund and the limited partners may be subject to various state and other taxes.
Taxation of Foreign Limited Partners
Subject to the discussion below regarding derivative transactions, a non-resident alien individual not otherwise engaged in a United States trade or business should not be deemed to be engaged in a United States trade or business solely by virtue of an investment as a limited partner in the Fund. Capital gains earned by the Fund and allocated to such a foreign limited partner will, as a general matter, not be subject to United States federal income tax or withholding, but may be subject to tax in the jurisdiction in which the foreign limited partner is resident. Interest income earned by the Fund will, as a general rule, likewise not be subject to United States federal income tax or withholding, but may be subject to tax in other jurisdictions to which the foreign limited partner is a resident.
With respect to derivative transactions such as options, energy or interest rate swaps or forwards, based on current law it is uncertain whether entering into derivative transactions may cause the Fund, and therefore any foreign limited partners, to be treated as engaged in a trade or business within the United States. However, the Treasury has issued proposed regulations which, if finalized in their current form, would provide that foreign limited partners should not be deemed to be engaged in a United States trade or business solely by virtue of an investment as a limited partner in the Fund even if the Fund enters into derivative transactions. These regulations are proposed to be effective for taxable years beginning 30 days after the date final regulations are published in the Federal Register but also allow the Fund to elect to apply the final regulations retroactively once they are finalized.
PROSPECTIVE INVESTORS ARE URGED TO CONSULT THEIR OWN TAX ADVISERS BEFORE DECIDING WHETHER TO INVEST.
-45-
INVESTMENT BY ERISA ACCOUNTS
General
This section sets forth certain consequences under the Employee Retirement Income Security Act of 1974, as amended (“ERISA”), and the Internal Revenue Code of 1986, as amended (the “Code”), which a fiduciary of an “employee benefit plan,” as defined in and subject to ERISA, or of a “plan,” as defined in and subject to Section 4975 of the Code, who has investment discretion should consider before deciding to invest the plan’s assets in the Fund (such “employee benefit plans” and “plans” being referred to herein as “Plans,” and such fiduciaries with investment discretion being referred to herein as “Plan Fiduciaries”). The following summary is not intended to be complete, but only to address certain questions under ERISA and the Code which are likely to be raised by the Plan Fiduciary’s own counsel.
In general, the terms “employee benefit plan” as defined in ERISA and “plan” as defined in Section 4975 of the Code together refer to any plan or account of various types which provides retirement benefits or welfare benefits to an individual or to an employer’s employees and their beneficiaries. Such plans and accounts include, but are not limited to, corporate pension and profit-sharing plans, “simplified employee pension plans,” KEOGH plans for self-employed individuals (including partners), individual retirement accounts described in Section 408 of the Code and medical benefit plans.
Special Investment Consideration
Each Plan Fiduciary must give appropriate consideration to the facts and circumstances that are relevant to an investment in the Fund, including the role that an investment in the Fund plays or would play in the Plan’s overall investment portfolio. Each Plan Fiduciary, before deciding to invest in the Fund, must be satisfied that such investment is prudent for the Plan, that the investments of the Plan, including in the Fund, are diversified so as to minimize the risk of large losses and that an investment in the Fund complies with the terms of the Plan and related trust.
EACH PLAN FIDUCIARY CONSIDERING ACQUIRING UNITS MUST CONSULT ITS OWN LEGAL AND TAX ADVISERS BEFORE DOING SO.
The Fund Should Not Be Deemed to Hold “Plan Assets”
A regulation issued under ERISA (the “ERISA Regulation”) contains rules for determining when an investment by a Plan in an equity interest of a limited partnership will result in the underlying assets of the partnership being assets of the Plan for purposes of ERISA and Section 4975 of the Code (i.e., “plan assets”). Those rules provide in pertinent part that assets of a limited partnership will not be plan assets of a Plan which purchases an equity interest in the partnership if the equity interest purchased is a “publicly-offered security” (the “Publicly-Offered Security Exception”). If the underlying assets of a partnership are considered to be assets of any Plan for purposes of ERISA or Section 4975 of the Code, the operations of such partnership would be subject to and, in some cases, limited by, the provisions of ERISA and Section 4975 of the Code.
The Publicly-Offered Security Exception applies if the equity is a security that is:
| 1) | “freely transferable” (determined based on the applicable facts and circumstances); | |
| 2) | part of a class of securities that is “widely held” (meaning that the class of securities is owned by 100 or more investors independent of the issuer and of each other); and | |
| 3) | either (a) part of a class of securities registered under Section 12(b) or 12(g) of the Securities Exchange Act of 1934, or (b) sold to the Plan as part of a public offering pursuant to an effective registration statement under the Securities Act of 1933 and the class of which such security is a part is registered under the Securities Exchange Act of 1934 within 120 days (or such later time as may be allowed by the SEC) after the end of the fiscal year of the issuer in which the offering of such security occurred. |
It appears that all of the conditions described above are satisfied with respect to the units and, therefore, the units should constitute “publicly-offered securities” and the underlying assets of the
-46-
Fund should not be considered to constitute assets of any Plan which purchases units.
Ineligible Purchasers
In general, units may not be purchased with the assets of a Plan if Campbell & Company, the futures brokers, any over-the-counter counterparties, any of the selling agents, any of their respective affiliates or any of their respective employees either:
| 1) | has investment discretion with respect to the investment of such plan assets; or | |
| 2) | has authority or responsibility to give or regularly gives investment advice with respect to such plan assets, for a fee, and pursuant to an agreement or understanding that such advice will serve as a primary basis for investment decisions with respect to such plan assets and that such advice will be based on the particular investment needs of the Plan; or | |
| 3) | is an employer maintaining or contributing to such Plan. |
Except as otherwise set forth, the foregoing statements regarding the consequences under ERISA and the Code of an investment in the Fund based on the provisions of the Code and ERISA as currently in effect, and the existing administrative and judicial interpretations thereunder. No assurance can be given that administrative, judicial, or legislative changes will not occur that may make the foregoing statements incorrect or incomplete.
None of Campbell & Company, the futures brokers, the over-the-counter counterparties, the selling agents or any other party related to the Fund make any representation that this investment meets the relevant legal requirements with respect to investments by any particular plan or that this investment is appropriate for any particular plan. The person with investment discretion should consult with his or her attorney and financial advisers as to the propriety of an investment in the Fund in light of the circumstances of the particular plan.
PLAN OF DISTRIBUTION
Subscription Procedure
The Fund offers the units to the public during the continuing offering at the net asset value per unit as of each Closing Date on which subscriptions are accepted. Investors must submit subscriptions at least five (5) business days prior to the applicable month-end Closing Date and they will be accepted once payments are received and cleared. Investors may rescind their subscription agreement within five (5) business days of receipt of the Fund’s prospectus. Campbell & Company may suspend, limit or terminate the continuing offering period at any time. Escrow balances will be credited with interest at prevailing money market rates.
The units are offered on a “best efforts” basis without any firm underwriting commitment through selling agents including, but not limited to, A.G. Edwards & Sons, Inc.; Campbell Financial Services, Inc.; Ferris, Baker Watts Incorporated; Linsco/ Private Ledger Corp.; Merrill Lynch, Pierce, Fenner & Smith Incorporated; Securities America, Inc.; UBS Financial Services Inc.; and Wachovia Securities, LLC, which are registered broker-dealers and members of the National Association of Securities Dealers, Inc. Units are offered until such time as Campbell & Company suspends, limits or terminates the continuing offering. Subscriptions received during the continuing offering period can be accepted on a monthly basis. Subscribers whose subscriptions are canceled or rejected will be notified of when their subscriptions, plus interest, will be returned, which shall be promptly after rejection. Subscribers whose subscriptions are accepted will be issued fractional units, calculated to three decimal places, in an amount equal to the interest earned on their subscriptions. Campbell & Company may suspend, limit or terminate the offering of units at any time.
The Fund’s escrow account is currently maintained at Mercantile Safe Deposit & Trust Company, Baltimore, Maryland (the “escrow agent”). A replacement escrow agent may be appointed in respect of the Fund in the future solely at the discretion of Campbell & Company. All subscription funds are required to be promptly transmitted to the escrow agent. Subscriptions must be accepted or rejected by Campbell & Company within five business days of receipt, and the settlement date for the deposit of subscription funds in escrow must be within five business days of acceptance. No fees or costs will be assessed on any subscription while held in escrow, irrespective of whether the subscription is accepted or subscription funds returned. The escrow agent will
-47-
invest the subscription funds in a money market account or in other authorized instruments while held in escrow.
Subscriptions from customers of any of the selling agents may also be made by authorizing such selling agent to debit the subscriber’s customer securities account at the selling agent on the settlement date. Promptly after debiting the customer’s securities account, the selling agent shall send payment to the escrow agent as described above, in the amount of the subscription so debited.
Campbell & Company will purchase units for investment purposes only and not with a view towards resale.
An investor who meets the suitability standards given below must complete, execute and deliver to the relevant selling agent a copy of the Subscription Agreement and Power of Attorney attached as Exhibit D. A subscriber can pay either by a check made payable to “Campbell Strategic Allocation Fund, L.P.” or by authorizing his selling agent to debit his customer securities account. Campbell & Company will then accept or reject the subscription within five business days of receipt of the subscription. All subscriptions are irrevocable once subscription payments are deposited in escrow.
Representations and Warranties of Investors in the Subscription Agreement
Investors are required to make representations and warranties in the Subscription Agreement. The Fund’s primary intention in requiring investors to make representations and warranties is to ensure that only persons for whom an investment is suitable invest in the Fund. The Fund is most likely to assert representations and warranties if it has reason to believe that the related investor may not be qualified to invest or remain invested in the Fund. The representations and warranties made by investors in the Subscription Agreement may be summarized as relating to:
| 1) | eligibility of investors to invest in the Fund, including legal age, net worth and annual income; | |
| 2) | representative capacity of investors; | |
| 3) | information provided by investors; | |
| 4) | information received by investors; and | |
| 5) | investments made on behalf of employee benefit plans. |
See the Subscription Agreement and Power of Attorney attached as Exhibit D for further detail.
Minimum Investment
The minimum investment is $100,000. Limited partners who are trustees or custodians of eligible employee benefit plans and individual retirement accounts may increase their investment in the Fund with a minimum additional investment of $10,000; all other limited partners may increase their investment with a minimum additional investment of $25,000. Prospective investors must be aware that the price per unit during the continuing offering period will vary depending upon the month-end net asset value per unit. Under the federal securities laws and those of certain states, investors may be subject to special minimum purchase and/or investor suitability requirements.
Investor Suitability
There can be no assurance that the Fund will achieve its objectives or avoid substantial losses. An investment in the Fund is suitable only for a limited segment of the risk portion of an investor’s portfolio and no one should invest more in the Fund than he can afford to lose. The selling agent is responsible for determining if the units are a suitable investment for the investor. Campbell & Company acts as a commodity pool operator and a commodity trading advisor in respect of various managed futures investment products. The selling agent may or may not be authorized to offer certain of such products, which may have materially different terms, including investment portfolios and objectives, fees, risks, conflicts of interest and suitability requirements, from those of the Fund.
At an absolute minimum, investors must have (i) a net worth of at least $150,000 (exclusive of home, furnishings and automobiles) or (ii) an annual gross income of at least $45,000 and a net worth (as calculated above) of at least $45,000. No one may invest more than 10% of his net worth (as calculated above) in the Fund.
These standards (and the additional standards applicable to residents of certain states as set forth under “Exhibit C — Subscription Requirements” herein) are regulatory minimums only. Qualification under such standards does not necessarily imply that an investment in the Fund is suitable for a particular investor. Prospective subscribers should review Exhibit C and consider the highly
-48-
speculative and illiquid nature of an investment in the Fund, as well as the high risk and highly leveraged nature of the financial instrument markets, in determining whether an investment in the Fund is consistent with their overall portfolio objectives.
The Selling Agents
The selling agents — the broker-dealers who offer the units — offer the units on a best efforts basis without any firm underwriting commitment. The selling agents, including the foreign dealers who may elect to participate in the offering, are bound by their respective Selling Agreements with the Fund.
Selling agents receive no commission from the proceeds of the offering. Instead, they receive from Campbell & Company’s brokerage fee an amount up to 4% of the subscription amount for the units sold.
Selling commissions will not be paid from the proceeds of this offering. Rather, the selling agents will receive from Campbell & Company, as general partner, an amount up to 4% of the subscription amount as to any units sold. Campbell & Company also will pay ongoing payments to the selling agents (or their assignees) which are registered as “futures commission merchants” or “introducing brokers” (or obtain such registration prior to commencement of such ongoing payments) in return for providing continuing services to the limited partners of up to 4% per annum of the month-end net asset value of units which remain outstanding beginning at the end of the thirteenth full month after the units were sold. Such selling agents may pay all or a portion of such ongoing payments to account executives who are also registered with the CFTC and have passed all applicable proficiency requirements.
Selling agents and registered representatives who are not registered with the CFTC as described above may receive additional selling commissions from Campbell & Company, paid on the same basis as the ongoing payments, provided that the maximum compensation to be paid to underwriters and related persons regardless of the source of payment, including, but not limited to, wholesaling salaries, bonus or sales incentives, sales commissions, expense reimbursements, and continuing compensation to non-duly registered selling agents, will not exceed 10% of the initial gross proceeds of such units’ initial sales price, plus an additional 0.5% for bona fide due diligence fees. Such ongoing payments, salaries and bonuses, and additional selling commissions may be deemed to constitute underwriting compensation.
Steben & Company, Inc., a registered broker-dealer, solicits other broker-dealers to become selling agents of the Fund,i.e., it acts as a wholesaler. As such, Steben & Company, Inc. does not act as an “underwriter” or “promoter” as defined in the Securities Act of 1933 and the regulations thereunder. The selling agents, and not Steben & Company, Inc., have responsibility with respect to the solicitation of prospective investors, including determination of suitability of such investors. As compensation for its activities, Steben & Company, Inc. receives up to one-fourth of the selling commissions otherwise payable to the selling agents. In the future, other broker-dealers may be engaged by the Fund to conduct wholesaling activities. Certain employees of Campbell & Company will provide wholesaling services as well and will receive compensation therefor. The maximum aggregate amount of such compensation with respect to the maximum offering proceeds, including any expense reimbursements, is estimated at $35,950,000, or 2.75% of the proceeds.
Certain of the offering expenses paid by Campbell & Company might be deemed to constitute costs properly allocated to the accounts of the selling agents. Such costs will, for example, cover the expenses of producing a selling brochure, organizing seminars to promote the Fund and related travel expenses. Such costs are estimated at approximately $550,000, and in no event shall the aggregate amount of (i) such costs and (ii) the selling commission exceed, over the life of the Fund, 10% of the gross proceeds of the offering of the units, plus an additional 0.5% of such proceeds in respect of reimbursement ofbona fidedue diligence expenses.
Other than as described above, Campbell & Company will pay no person any commissions or other fees from the Fund in connection with the solicitation of purchases for units.
Campbell & Company will pay the Fund’s offering expenses related to the continuing offering and the Fund will reimburse Campbell & Company in 30-month installment periods throughout the continuing offering period. Such reimburse-
-49-
ment, however, will not exceed 2.5% of the aggregate subscriptions accepted by Campbell & Company as general partner. Organization and offering expenses related to the initial offering were reimbursed in the same manner. See “Charges to the Fund — Offering Expenses.”
In the Selling Agreement with each selling agent, Campbell & Company has agreed to indemnify the selling agents against certain liabilities that the selling agents may incur in connection with the offering and sale of the units, including liabilities under the Securities Act of 1933. The Selling Agreement also requires the selling agents to comply fully with NASD Rule 2810 which includes, among other things, that there will be no sales of units to discretionary accounts without the prior specific written approval of the investor.
LIMITED PARTNER PRIVACY POLICY
The Fund and Campbell & Company obtain nonpublic personal information about limited partners from their Subscription Agreements, as well as in the course of processing redemption requests. None of such information is disclosed, except as necessary in the course of processing subscriptions and redemptions and otherwise administering the Fund — and then only subject to customary undertakings of confidentiality. Access to such information is restricted to the fullest extent permitted by law, and the Fund and Campbell & Company each maintain physical, electronic and procedural controls in keeping with federal government standards to safeguard such information. These standards are reasonably designed to (i) ensure the security and confidentiality of limited partners’ records and information; (ii) protect against any anticipated threats or hazards to the security or integrity of limited partners’ records and information; and (iii) protect against unauthorized access to or use of limited partners’ records or information that could result in substantial harm or inconvenience to any limited partner.
LEGAL MATTERS
Sidley Austin LLP, New York, New York will advise Campbell & Company on all legal matters in connection with the units. In the future, Sidley Austin LLP may advise Campbell & Company (and its affiliates) with respect to its responsibilities as general partner and trading advisor of, and with respect to, matters relating to the Fund. The statements under “Federal Income Tax Aspects” have been reviewed by Sidley Austin LLP. Sidley Austin LLP has not represented, nor will it represent, either the Fund or the limited partners in matters relating to the Fund.
EXPERTS
The financial statements of the Fund as of December 31, 2004 and 2003, and for the years ended December 31, 2004, 2003 and 2002, included in this prospectus, have been audited by Arthur F. Bell, Jr. & Associates, L.L.C., an independent registered public accounting firm, as stated in their report appearing herein. Such audited statements have been included in reliance upon such report, given upon the authority of that firm as experts in auditing and accounting.
The consolidated balance sheet of Campbell & Company as of December 31, 2004, included in this prospectus, has been audited by Arthur F. Bell, Jr. & Associates, L.L.C., independent auditors, as stated in their report appearing herein, and has been included in reliance upon such report, given upon the authority of that firm as experts in auditing and accounting.
On September 23, 2005, Deloitte & Touche LLP was named as the Fund’s independent registered public accounting firm. The financial statements of the Fund as of September 30, 2005 and for the three month and nine month periods ended September 30, 2005 and 2004 are unaudited. In the opinion of Campbell & Company, such unaudited statements reflect all adjustments which were of a normal and recurring nature, necessary for a fair presentation of the Fund’s financial position as of September 30, 2005.
The balance sheet of Campbell & Company as of September 30, 2005 is unaudited. In the opinion of Campbell & Company, such unaudited statement reflects all adjustments which were of a normal and recurring nature, necessary for a fair presentation of Campbell & Company’s financial position as of September 30, 2005.
-50-
MONTHLY REPORT — OCTOBER 2005 FOR PARTNER #XXXX
CAMPBELL STRATEGIC ALLOCATION FUND, L.P.
| NAV per unit on October 31, 2005 | $ | 3,043.86 | ||||
| NAV per unit on September 30, 2005 | $ | 2,927.65 | ||||
| Unit Value Monthly Gain (Loss) | 3.97 | % | ||||
| Fund 2005 YTD Gain (Loss) | 10.86 | % | ||||
| Number of units you own | XXXX | |||||
| Total value of units you own | $ | XXXXX | ||||
| STATEMENT OF CHANGES IN NET ASSET VALUE | ||||||
| Net Asset Value (1,619,259.730 units) at September 30, 2005 | $ | 4,740,633,382 | ||||
| Additions of 28,645.175 units on October 31, 2005 | 87,192,295 | |||||
| Redemptions of (7,335.349) units on October 31, 2005 | (22,327,752 | ) | ||||
| Offering Cost | (1,325,324 | ) | ||||
| Net Income (Loss) — October 2005 | 189,485,985 | |||||
| Net Asset Value (1,640,569.556 units) at October 31, 2005 | $ | 4,993,658,586 | ||||
| Net Asset Value per Unit at October 31, 2005 | $ | 3,043.86 | ||||
| STATEMENT OF INCOME (LOSS) | ||||||
| Income: | ||||||
| Gains (losses) on futures contracts: | ||||||
| Realized | $ | (64,668,595 | ) | |||
| Change in unrealized | 124,186,678 | |||||
| Gains (losses) on forward and swap contracts: | ||||||
| Realized | 0 | |||||
| Change in unrealized | 147,446,725 | |||||
| Interest income | 13,406,764 | |||||
| 220,371,572 | ||||||
| Expenses: | ||||||
| Brokerage fee | 30,648,414 | |||||
| Performance fee | 0 | |||||
| Operating expenses | 237,173 | |||||
| 30,885,587 | ||||||
| Net Income (Loss) — October 2005 | $ | 189,485,985 | ||||
| To the best of my knowledge and belief, the information contained herein is accurate and complete. | |
| /s/ THERESA D. BECKS | |
| Theresa D. Becks, Chief Financial Officer | |
| Campbell & Company, Inc. | |
| General Partner | |
| Campbell Strategic Allocation Fund, L.P. | |
Prepared without audit
-51-
MONTHLY REPORT — NOVEMBER 2005 FOR PARTNER #XXXX
CAMPBELL STRATEGIC ALLOCATION FUND, L.P.
| NAV per unit on November 30, 2005 | $ | 3,105.46 | |||||
| NAV per unit on October 31, 2005 | $ | 3,043.86 | |||||
| Unit Value Monthly Gain (Loss) | 2.02 | % | |||||
| Fund 2005 YTD Gain (Loss) | 13.10 | % | |||||
| Number of units you own | XXXX | ||||||
| Total value of units you own | $ | XXXXX | |||||
| STATEMENT OF CHANGES IN NET ASSET VALUE | |||||||
| Net Asset Value (1,640,569.556 units) at October 31, 2005 | $ | 4,993,658,586 | |||||
| Additions of 40,728.112 units on November 30, 2005 | 126,479,790 | ||||||
| Redemptions of (12,327.125) units on November 30, 2005 | (38,281,415 | ) | |||||
| Offering Cost | (1,096,986 | ) | |||||
| Net Income (Loss) — November 2005 | 102,154,915 | ||||||
| Net Asset Value (1,668,970.543 units) at November 30, 2005 | $ | 5,182,914,890 | |||||
| Net Asset Value per Unit at November 30, 2005 | $ | 3,105.46 | |||||
| STATEMENT OF INCOME (LOSS) | |||||||
| Income: | |||||||
| Gains (losses) on futures contracts: | |||||||
| Realized | $ | 1,957,184 | |||||
| Change in unrealized | (67,179,053 | ) | |||||
| Gains (losses) on forward and swap contracts: | |||||||
| Realized | 0 | ||||||
| Change in unrealized | 190,898,668 | ||||||
| Interest income | 14,031,863 | ||||||
| 139,708,662 | |||||||
| Expenses: | |||||||
| Brokerage fee | 31,228,104 | ||||||
| Performance fee | 6,043,858 | ||||||
| Operating expenses | 281,785 | ||||||
| 37,553,747 | |||||||
| Net Income (Loss) — November 2005 | $ | 102,154,915 | |||||
| To the best of my knowledge and belief, the information contained herein is accurate and complete. | |
| /s/ THERESA D. BECKS | |
| Theresa D. Becks, Chief Financial Officer | |
| Campbell & Company, Inc. | |
| General Partner | |
| Campbell Strategic Allocation Fund, L.P. | |
Prepared without audit
-52-
MONTHLY REPORT — DECEMBER 2005 FOR PARTNER #XXXX
CAMPBELL STRATEGIC ALLOCATION FUND, L.P.
| NAV per unit on December 31, 2005 | $ | 3,007.42 | ||||
| NAV per unit on November 30, 2005 | $ | 3,105.46 | ||||
| Unit Value Monthly Gain (Loss) | (3.16 | )% | ||||
| Fund 2005 YTD Gain (Loss) | 9.53 | % | ||||
| Number of units you own | XXXX | |||||
| Total value of units you own | $ | XXXXX | ||||
| STATEMENT OF CHANGES IN NET ASSET VALUE | ||||||
| Net Asset Value (1,668,970.543 units) at November 30, 2005 | $ | 5,182,914,890 | ||||
| Additions of 60,140.071 units on December 31, 2005 | 180,866,647 | |||||
| Redemptions of (8,136.525) units on December 31, 2005 | (24,469,942 | ) | ||||
| Offering Cost | (1,464,278 | ) | ||||
| Net Income (Loss) — December 2005 | (162,148,658 | ) | ||||
| Net Asset Value (1,720,974.089 units) at December 31, 2005 | $ | 5,175,698,659 | ||||
| Net Asset Value per Unit at December 31, 2005 | $ | 3,007.42 | ||||
| STATEMENT OF INCOME (LOSS) | ||||||
| Income: | ||||||
| Gains (losses) on futures contracts: | ||||||
| Realized | $ | 139,099,586 | ||||
| Change in unrealized | (149,486,734 | ) | ||||
| Gains (losses) on forward and swap contracts: | ||||||
| Realized | 463,261,691 | |||||
| Change in unrealized | (605,485,431 | ) | ||||
| Interest income | 15,742,319 | |||||
| (136,868,569 | ) | |||||
| Expenses: | ||||||
| Brokerage fee | 31,065,650 | |||||
| Performance fee | (5,998,494 | ) | ||||
| Operating expenses | 212,933 | |||||
| 25,280,089 | ||||||
| Net Income (Loss) — December 2005 | $ | (162,148,658 | ) | |||
| To the best of my knowledge and belief, the information contained herein is accurate and complete. | |
| /s/ THERESA D. BECKS | |
| Theresa D. Becks, Chief Financial Officer | |
| Campbell & Company, Inc. | |
| General Partner | |
| Campbell Strategic Allocation Fund, L.P. | |
Prepared without audit
-53-
INDEX TO FINANCIAL STATEMENTS
| Page | ||||
CAMPBELL STRATEGIC ALLOCATION FUND, L.P. | ||||
| STATEMENTS OF FINANCIAL CONDITION September 30, 2005 (Unaudited) and December 31, 2004 (Audited) | 55 | |||
| CONDENSED SCHEDULES OF INVESTMENTS September 30, 2005 (Unaudited) and December 31, 2004 (Audited) | 56 | |||
| STATEMENTS OF OPERATIONS (UNAUDITED) For the Three Months and Nine Months Ended September 30, 2005 and 2004 | 58 | |||
| STATEMENTS OF CASH FLOWS (UNAUDITED) For the Nine Months Ended September 30, 2005 and 2004 | 59 | |||
| STATEMENTS OF CHANGES IN PARTNERS’ CAPITAL (NET ASSET VALUE) (UNAUDITED) For the Nine Months Ended September 30, 2005 and 2004 | 60 | |||
| NOTES TO FINANCIAL STATEMENTS (UNAUDITED) | 61 | |||
| REPORT OF INDEPENDENT REGISTERED PUBLIC ACCOUNTING FIRM | 67 | |||
| STATEMENTS OF FINANCIAL CONDITION December 31, 2004 and 2003 | 68 | |||
| CONDENSED SCHEDULES OF INVESTMENTS December 31, 2004 and 2003 | 69 | |||
| STATEMENTS OF OPERATIONS For the Years Ended December 31, 2004, 2003 and 2002 | 71 | |||
| STATEMENTS OF CASH FLOWS For the Years Ended December 31, 2004, 2003 and 2002 | 72 | |||
| STATEMENTS OF CHANGES IN PARTNERS’ CAPITAL (NET ASSET VALUE) For the Years Ended December 31, 2004, 2003 and 2002 | 73 | |||
| NOTES TO FINANCIAL STATEMENTS | 74 | |||
CAMPBELL & COMPANY, INC. | ||||
| CONSOLIDATED BALANCE SHEET September 30, 2005 (Unaudited) | 79 | |||
| NOTES TO CONSOLIDATED BALANCE SHEET (UNAUDITED) | 80 | |||
| INDEPENDENT AUDITOR’S REPORT | 87 | |||
| CONSOLIDATED BALANCE SHEET December 31, 2004 | 88 | |||
| NOTES TO CONSOLIDATED BALANCE SHEET | 89 | |||
Schedules are omitted for the reason that they are not required or are not applicable or that equivalent information has been included in the financial statements or notes thereto.
-54-
CAMPBELL STRATEGIC ALLOCATION FUND, L.P.
STATEMENTS OF FINANCIAL CONDITION
September 30, 2005 (Unaudited) and December 31, 2004 (Audited)
| September 30, | December 31, | ||||||||||
| 2005 | 2004 | ||||||||||
| ASSETS | |||||||||||
| Equity in broker trading accounts | |||||||||||
| Cash | $ | 322,395,910 | $ | 201,083,246 | |||||||
| United States government securities | 2,196,791,111 | 1,871,364,160 | |||||||||
| Net unrealized gain on open futures contracts | 93,565,840 | 59,986,708 | |||||||||
| Total equity in broker trading accounts | 2,612,752,861 | 2,132,434,114 | |||||||||
| Cash and cash equivalents | 535,185,852 | 738,065,681 | |||||||||
| United States government securities | 1,546,091,825 | 1,299,373,618 | |||||||||
| Net unrealized gain (loss) on open forward currency contracts | 98,308,547 | (70,137,402 | ) | ||||||||
| Total assets | $ | 4,792,339,085 | $ | 4,099,736,011 | |||||||
| LIABILITIES | |||||||||||
| Accounts payable | $ | 622,508 | $ | 855,905 | |||||||
| Brokerage fee | 27,250,751 | 23,425,887 | |||||||||
| Commissions and other trading fees on open contracts | 734,667 | 914,080 | |||||||||
| Offering costs payable | 1,367,188 | 2,230,619 | |||||||||
| Redemptions payable | 21,720,589 | 24,163,399 | |||||||||
| Subscription deposits | 10,000 | 0 | |||||||||
| Total liabilities | 51,705,703 | 51,589,890 | |||||||||
PARTNERS’ CAPITAL (Net Asset Value) | |||||||||||
| General Partner — 16,220.970 and 15,051.729 units outstanding at September 30, 2005 and December 31, 2004 | 47,489,323 | 41,327,984 | |||||||||
| Limited Partners — 1,603,038.760 and 1,459,291.150 units outstanding at September 30, 2005 and December 31, 2004 | 4,693,144,059 | 4,006,818,137 | |||||||||
| Total partners’ capital (Net Asset Value) | 4,740,633,382 | 4,048,146,121 | |||||||||
| Total liabilities and partners’ capital | $ | 4,792,339,085 | $ | 4,099,736,011 | |||||||
See accompanying notes.
-55-
CAMPBELL STRATEGIC ALLOCATION FUND, L.P.
CONDENSED SCHEDULE OF INVESTMENTS
September 30, 2005
(Unaudited)
| UNITED STATES GOVERNMENT SECURITIES | % of Net | |||||||||||||
| Face Value | Maturity Date | Description | Value | Asset Value | ||||||||||
| $1,090,000,000 | 11/03/2005 | U.S. Treasury Bills | $ | 1,086,652,792 | 22.92 | % | ||||||||
| $1,069,000,000 | 10/06/2005 | U.S. Treasury Bills | 1,068,547,160 | 22.54 | % | |||||||||
| $800,000,000 | 12/15/2005 | U.S. Treasury Bills | 794,500,000 | 16.76 | % | |||||||||
| $400,000,000 | 10/13/2005 | U.S. Treasury Bills | 399,583,333 | 8.43 | % | |||||||||
| $395,000,000 | Various | U.S. Treasury Bills | 393,599,651 | 8.30 | % | |||||||||
| Total United States government securities (cost, including accrued interest, — $3,742,882,936) | $ | 3,742,882,936 | 78.95 | % | ||||||||||
| LONG FUTURES CONTRACTS | % of Net | |||||||||||||
| Description | Value | Asset Value | ||||||||||||
| Energy | $ | (1,586,470 | ) | (0.03 | )% | |||||||||
| Metals | 6,915,536 | 0.15 | % | |||||||||||
| Stock index | 51,413,721 | 1.08 | % | |||||||||||
| Short-term interest rates | (86,382 | ) | 0.00 | % | ||||||||||
| Long-term interest rates | (8,493,738 | ) | (0.18 | )% | ||||||||||
| Total long futures contracts | $ | 48,162,667 | 1.02 | % | ||||||||||
| SHORT FUTURES CONTRACTS | % of Net | |||||||||||||
| Description | Value | Asset Value | ||||||||||||
| Energy | $ | (6,083,914 | ) | (0.13 | )% | |||||||||
| Metals | (19,413 | ) | 0.00 | % | ||||||||||
| Short-term interest rates | 23,092,449 | 0.48 | % | |||||||||||
| Long-term interest rates | 28,414,051 | 0.60 | % | |||||||||||
| Total short futures contracts | $ | 45,403,173 | 0.95 | % | ||||||||||
| Total futures contracts | $ | 93,565,840 | 1.97 | % | ||||||||||
| FORWARD CURRENCY CONTRACTS | % of Net | |||||||||||||
| Description | Value | Asset Value | ||||||||||||
| Various long forward currency contracts | $ | (266,964,818 | ) | (5.63 | )% | |||||||||
| Various short forward currency contracts | 365,273,365 | 7.70 | % | |||||||||||
| Total forward currency contracts | $ | 98,308,547 | 2.07 | % | ||||||||||
See accompanying notes.
-56-
CAMPBELL STRATEGIC ALLOCATION FUND, L.P.
CONDENSED SCHEDULE OF INVESTMENTS
December 31, 2004
| UNITED STATES GOVERNMENT SECURITIES | % of Net | |||||||||||||
| Face Value | Maturity Date | Description | Value | Asset Value | ||||||||||
| $1,675,000,000 | 01/06/05 | U.S. Treasury Bills | $ | 1,674,618,108 | 41.37 | % | ||||||||
| $575,000,000 | 03/17/05 | U.S. Treasury Bills | 572,424,479 | 14.14 | % | |||||||||
| $350,000,000 | 01/13/05 | U.S. Treasury Bills | 349,808,667 | 8.64 | % | |||||||||
| $200,000,000 | 01/27/05 | �� | U.S. Treasury Bills | 199,734,222 | 4.93 | % | ||||||||
| $200,000,000 | 02/17/05 | U.S. Treasury Bills | 199,459,500 | 4.93 | % | |||||||||
| $175,000,000 | 02/03/05 | U.S. Treasury Bills | 174,692,802 | 4.32 | % | |||||||||
| Total United States government securities (cost, including accrued interest, — $3,170,737,778) | $ | 3,170,737,778 | 78.33 | % | ||||||||||
| LONG FUTURES CONTRACTS | % of Net | |||||||||||||
| Description | Value | Asset Value | ||||||||||||
| Energy | $ | (7,304,068 | ) | (0.18 | )% | |||||||||
| Metals | 2,572,720 | 0.06 | % | |||||||||||
| Stock index | 35,075,316 | 0.87 | % | |||||||||||
| Short-term interest rates | (3,149,439 | ) | (0.08 | )% | ||||||||||
| Long-term interest rates | 31,917,409 | 0.79 | % | |||||||||||
| Total long futures contracts | $ | 59,111,938 | 1.46 | % | ||||||||||
| SHORT FUTURES CONTRACTS | % of Net | |||||||||||||
| Description | Value | Asset Value | ||||||||||||
| Metals | $ | (4,000,591 | ) | (0.10 | )% | |||||||||
| Short-term interest rates | 4,890,991 | 0.12 | % | |||||||||||
| Long-term interest rates | (15,630 | ) | 0.00 | % | ||||||||||
| Total short futures contracts | $ | 874,770 | 0.02 | % | ||||||||||
| Total futures contracts | $ | 59,986,708 | 1.48 | % | ||||||||||
| FORWARD CURRENCY CONTRACTS | % of Net | |||||||||||||
| Description | Value | Asset Value | ||||||||||||
| Various long forward currency contracts | $ | 121,005,028 | 2.99 | % | ||||||||||
| Various short forward currency contracts | (191,142,430 | ) | (4.72 | )% | ||||||||||
| Total forward currency contracts | $ | (70,137,402 | ) | (1.73 | )% | |||||||||
See accompanying notes.
-57-
CAMPBELL STRATEGIC ALLOCATION FUND, L.P.
STATEMENTS OF OPERATIONS
For the Three Months and Nine Months Ended September 30, 2005 and 2004
(Unaudited)
| Three Months Ended | Nine Months Ended | ||||||||||||||||||
| September 30, | September 30, | ||||||||||||||||||
| 2005 | 2004 | 2005 | 2004 | ||||||||||||||||
TRADING GAINS (LOSSES) | |||||||||||||||||||
| Futures trading gains (losses) | |||||||||||||||||||
| Realized | $ | 128,973,892 | $ | (67,286,260 | ) | $ | 344,045,110 | $ | 183,216,522 | ||||||||||
| Change in unrealized | (44,737,691 | ) | 38,667,830 | 33,579,132 | (29,366,721 | ) | |||||||||||||
| Brokerage commissions | (3,316,162 | ) | (1,643,945 | ) | (9,045,864 | ) | (4,928,906 | ) | |||||||||||
| Net gain (loss) from futures trading | 80,920,039 | (30,262,375 | ) | 368,578,378 | 148,920,895 | ||||||||||||||
| Forward and swap trading gains (losses) | |||||||||||||||||||
| Realized | (42,624,855 | ) | (164,500,572 | ) | (99,835,143 | ) | 25,221,010 | ||||||||||||
| Change in unrealized | (52,295,326 | ) | 112,072,767 | 168,445,949 | (34,375,588 | ) | |||||||||||||
| Brokerage commissions | (383,025 | ) | (255,640 | ) | (997,324 | ) | (637,894 | ) | |||||||||||
| Net gain (loss) from forward and swap trading | (95,303,206 | ) | (52,683,445 | ) | 67,613,482 | (9,792,472 | ) | ||||||||||||
| Total net trading gains (losses) | (14,383,167 | ) | (82,945,820 | ) | 436,191,860 | 139,128,423 | |||||||||||||
EXPENSES NET OF INTEREST INCOME | |||||||||||||||||||
| Income | |||||||||||||||||||
| Interest income | 35,563,671 | 11,803,463 | 87,452,934 | 27,313,159 | |||||||||||||||
| Expenses | |||||||||||||||||||
| Brokerage fee | 80,030,707 | 63,202,092 | 226,146,963 | 182,773,907 | |||||||||||||||
| Performance fee | 0 | 0 | 0 | 102,769,447 | |||||||||||||||
| Operating expenses | 698,084 | 736,120 | 2,195,587 | 2,079,829 | |||||||||||||||
| Total expenses | 80,728,791 | 63,938,212 | 228,342,550 | 287,623,183 | |||||||||||||||
| Expenses net of interest income | (45,165,120 | ) | (52,134,749 | ) | (140,889,616 | ) | (260,310,024 | ) | |||||||||||
NET INCOME (LOSS) | $ | (59,548,287 | ) | $ | (135,080,569 | ) | $ | 295,302,244 | $ | (121,181,601 | ) | ||||||||
NET INCOME (LOSS) PER GENERAL AND LIMITED PARTNER UNIT | |||||||||||||||||||
| (based on weighted average number of units outstanding during the period) | $ | (38.20 | ) | $ | (98.46 | ) | $ | 192.78 | $ | (96.52 | ) | ||||||||
INCREASE (DECREASE) IN NET ASSET VALUE PER GENERAL AND LIMITED PARTNER UNIT | $ | (42.00 | ) | $ | (102.60 | ) | $ | 181.92 | $ | (56.87 | ) | ||||||||
See accompanying notes.
-58-
CAMPBELL STRATEGIC ALLOCATION FUND, L.P.
STATEMENTS OF CASH FLOWS
For the Nine Months Ended September 30, 2005 and 2004
(Unaudited)
| 2005 | 2004 | |||||||||||
Cash flows from (for) operating activities | ||||||||||||
| Net income (loss) | $ | 295,302,244 | $ | (121,181,601 | ) | |||||||
| Adjustments to reconcile net income (loss) to net cash (for) operating activities | ||||||||||||
| Net change in unrealized | (202,025,081 | ) | 63,742,309 | |||||||||
| Increase (decrease) in accounts payable and accrued expenses | 3,412,054 | (11,499,251 | ) | |||||||||
| Net (purchases) of investments in United States government securities | (572,145,158 | ) | (1,223,579,115 | ) | ||||||||
| Net cash (for) operating activities | (475,455,941 | ) | (1,292,517,658 | ) | ||||||||
Cash flows from (for) financing activities | ||||||||||||
| Addition of units | 729,058,890 | 1,120,275,862 | ||||||||||
| Increase in subscription deposits | 10,000 | 450,010 | ||||||||||
| Redemption of units | (325,752,336 | ) | (159,714,378 | ) | ||||||||
| Offering costs | (9,427,778 | ) | (15,939,454 | ) | ||||||||
| Net cash from financing activities | 393,888,776 | 945,072,040 | ||||||||||
| Net (decrease) in cash and cash equivalents | (81,567,165 | ) | (347,445,618 | ) | ||||||||
Cash and cash equivalents | ||||||||||||
| Beginning of period | 939,148,927 | 816,650,904 | ||||||||||
| End of period | $ | 857,581,762 | $ | 469,205,286 | ||||||||
| End of period cash and cash equivalents consists of: | ||||||||||||
| Cash in broker trading accounts | $ | 322,395,910 | $ | 105,298,251 | ||||||||
| Cash and cash equivalents | 535,185,852 | 363,907,035 | ||||||||||
| Total end of period cash and cash equivalents | $ | 857,581,762 | $ | 469,205,286 | ||||||||
See accompanying notes.
-59-
CAMPBELL STRATEGIC ALLOCATION FUND, L.P.
STATEMENTS OF CHANGES IN PARTNERS’ CAPITAL (NET ASSET VALUE)
For the Nine Months Ended September 30, 2005 and 2004
(Unaudited)
| Partners’ Capital | ||||||||||||||||||||||||
| General | Limited | Total | ||||||||||||||||||||||
| Units | Amount | Units | Amount | Units | Amount | |||||||||||||||||||
Nine Months Ended September 30, 2005 | ||||||||||||||||||||||||
| Balances at December 31, 2004 | 15,051.729 | $ | 41,327,984 | 1,459,291.150 | $ | 4,006,818,137 | 1,474,342.879 | $ | 4,048,146,121 | |||||||||||||||
| Net income for the nine months ended September 30, 2005 | — | 2,967,720 | — | 292,334,524 | — | 295,302,244 | ||||||||||||||||||
| Additions | 1,169.241 | 3,280,000 | 259,535.812 | 725,778,890 | 260,705.053 | 729,058,890 | ||||||||||||||||||
| Redemptions | 0.000 | 0 | (115,788.202 | ) | (323,309,526 | ) | (115,788.202 | ) | (323,309,526 | ) | ||||||||||||||
| Offering costs | — | (86,381 | ) | — | (8,477,966 | ) | — | (8,564,347 | ) | |||||||||||||||
| Balances at September 30, 2005 | 16,220.970 | $ | 47,489,323 | 1,603,038.760 | $ | 4,693,144,059 | 1,619,259.730 | $ | 4,740,633,382 | |||||||||||||||
Nine Months Ended September 30, 2004 | ||||||||||||||||||||||||
| Balances at December 31, 2003 | 10,815.994 | $ | 28,460,882 | 1,063,947.539 | $ | 2,799,639,743 | 1,074,763.533 | $ | 2,828,100,625 | |||||||||||||||
| Net (loss) for the nine months ended September 30, 2004 | — | (1,258,890 | ) | — | (119,922,711 | ) | — | (121,181,601 | ) | |||||||||||||||
| Additions | 3,612.750 | 10,114,000 | 397,719.441 | 1,110,161,862 | 401,332.191 | 1,120,275,862 | ||||||||||||||||||
| Redemptions | 0.000 | 0 | (59,461.849 | ) | (163,405,101 | ) | (59,461.849 | ) | (163,405,101 | ) | ||||||||||||||
| Offering costs | — | (169,191 | ) | — | (16,500,996 | ) | — | (16,670,187 | ) | |||||||||||||||
| Balances at September 30, 2004 | 14,428.744 | $ | 37,146,801 | 1,402,205.131 | $ | 3,609,972,797 | 1,416,633.875 | $ | 3,647,119,598 | |||||||||||||||
| Net Asset Value per General and Limited Partner Unit | ||||||||||||||
| September 30, | December 31, | September 30, | December 31, | |||||||||||
| 2005 | 2004 | 2004 | 2003 | |||||||||||
| $ | 2,927.65 | $ | 2,745.73 | $ | 2,574.50 | $ | 2,631.37 | |||||||
See accompanying notes.
-60-
CAMPBELL STRATEGIC ALLOCATION FUND, L.P.
NOTES TO FINANCIAL STATEMENTS
(Unaudited)
| Note 1. | ORGANIZATION AND SUMMARY OF SIGNIFICANT ACCOUNTING POLICIES |
| A. | General Description of the Fund |
Campbell Strategic Allocation Fund, L.P. (the Fund) is a Delaware limited partnership which operates as a commodity investment pool. The Fund engages in the speculative trading of futures contracts, forward currency contracts and swap contracts.
| B. | Regulation |
As a registrant with the Securities and Exchange Commission, the Fund is subject to the regulatory requirements under the Securities Act of 1933 and the Securities Exchange Act of 1934. As a commodity investment pool, the Fund is subject to the regulations of the Commodity Futures Trading Commission, an agency of the United States (U.S.) government which regulates most aspects of the commodity futures industry; rules of the National Futures Association, an industry self-regulatory organization; and the requirements of the various commodity exchanges where the Fund executes transactions. Additionally, the Fund is subject to the requirements of futures commission merchants (brokers) and interbank and other market makers through which the Fund trades.
| C. | Method of Reporting |
The Fund’s financial statements are presented in accordance with U.S. generally accepted accounting principles, which require the use of certain estimates made by the Fund’s management. Investment transactions are accounted for on the trade date. Gains or losses are realized when contracts are liquidated. Unrealized gains and losses on open contracts (the difference between contract trade price and market price) are reported in the statement of financial condition as a net gain or loss, as there exists a right of offset of unrealized gains or losses in accordance with Financial Accounting Standards Board Interpretation No. 39 — “Offsetting of Amounts Related to Certain Contracts.” The market value of futures (exchange-traded) contracts is determined by the various futures exchanges, and reflects the settlement price for each contract as of the close of the last business day of the reporting period. The market value of swap and forward currency (non-exchange traded) contracts is extrapolated on a forward basis from the spot prices quoted as of 5:00 P.M. (E.T.) on the last business day of the reporting period or based on the market value of its exchange-traded equivalent. Any change in net unrealized gain or loss from the preceding period is reported in the statement of operations. Brokerage commissions include other trading fees and are charged to expense when contracts are opened. United States government securities are stated at cost plus accrued interest, which approximates market value.
For purposes of both financial reporting and calculation of redemption value, Net Asset Value per unit is calculated by dividing Net Asset Value by the number of outstanding units.
| D. | Cash and Cash Equivalents |
Cash and cash equivalents includes cash and short-term time deposits held at financial institutions.
| E. | Income Taxes |
The Fund prepares calendar year U.S. and applicable state information tax returns and reports to the partners their allocable shares of the Fund’s income, expenses and trading gains or losses.
-61-
CAMPBELL STRATEGIC ALLOCATION FUND, L.P.
NOTES TO FINANCIAL STATEMENTS — (Continued)
(Unaudited)
| Note 1. | ORGANIZATION AND SUMMARY OF SIGNIFICANT ACCOUNTING POLICIES — (Continued) |
Income taxes have not been provided, as each partner is individually liable for the taxes, if any, on their share of the Fund’s income and expenses.
| F. | Offering Costs |
Campbell & Company, Inc. (Campbell & Company, the general partner) has incurred all costs in connection with the initial and continuous offering of units of the Fund (offering costs). The Fund’s liability for offering costs is limited to the maximum of total offering costs incurred by Campbell & Company or 2.5% of the aggregate subscriptions accepted during the initial and continuous offerings; this maximum is further limited by 30 month pay-out schedules. The Fund is only liable for payment of offering costs on a monthly basis as calculated based on the limitations stated above. At September 30, 2005, the Fund reflects a liability in the statement of financial condition for offering costs payable to Campbell & Company of $1,367,188. The amount of monthly reimbursement due to Campbell & Company is charged directly to partners’ capital.
If the Fund terminates prior to completion of payment of the calculated amounts to Campbell & Company, Campbell & Company will not be entitled to any additional payments, and the Fund will have no further obligation to Campbell & Company. At September 30, 2005, the amount of unreimbursed offering costs incurred by Campbell & Company is $1,367,188.
| G. | Foreign Currency Transactions |
The Fund’s functional currency is the U.S. dollar; however, it transacts business in currencies other than the U.S. dollar. Assets and liabilities denominated in currencies other than the U.S. dollar are translated into U.S. dollars at the rates in effect at the date of the statement of financial condition. Income and expense items denominated in currencies other than the U.S. dollar are translated into U.S. dollars at the rates in effect during the period. Gains and losses resulting from the translation to U.S. dollars are reported in income.
| H. | Reclassification |
Certain amounts in the 2004 financial statements were reclassified to conform with the 2005 presentation.
| Note 2. | GENERAL PARTNER AND COMMODITY TRADING ADVISOR |
The general partner of the Fund is Campbell & Company, which conducts and manages the business of the Fund. Campbell & Company is also the commodity trading advisor of the Fund. The Amended Agreement of Limited Partnership provides that Campbell & Company may make withdrawals of its units, provided that such withdrawals do not reduce Campbell & Company’s aggregate percentage interest in the Fund to less than 1% of the net aggregate contributions.
Campbell & Company is required by the Amended Agreement of Limited Partnership to maintain a net worth equal to at least 5% of the capital contributed by all the limited partnerships for which it acts as general partner, including the Fund. The minimum net worth shall in no case be less than $50,000 nor shall a net worth in excess of $1,000,000 be required.
The Fund pays a monthly brokerage fee equal to 1/12 of 7% (7% annualized) of month-end net assets to Campbell & Company and approximately $6 per round turn to the broker for execution and
-62-
CAMPBELL STRATEGIC ALLOCATION FUND, L.P.
NOTES TO FINANCIAL STATEMENTS — (Continued)
(Unaudited)
| Note 2. | GENERAL PARTNER AND COMMODITY TRADING ADVISOR — (Continued) |
clearing costs. From the 7% fee, a portion (4%) is used to compensate selling agents for ongoing services rendered and a portion (3%) is retained by Campbell & Company for trading and management services rendered. The amount paid to the broker and interbank market makers for execution and clearing costs is limited to 1/12 of 1% (1% annualized) of month-end net assets.
Campbell & Company is also paid a quarterly performance fee of 20% of the Fund’s aggregate cumulative appreciation in the Net Asset Value per unit, exclusive of appreciation attributable to interest income.
| Note 3. | DEPOSITS WITH BROKER |
The Fund deposits assets with a broker subject to Commodity Futures Trading Commission regulations and various exchange and broker requirements. Margin requirements are satisfied by the deposit of U.S. Treasury bills and cash with such broker. The Fund earns interest income on its assets deposited with the broker.
| Note 4. | OPERATING EXPENSES |
Operating expenses of the Fund are limited by the Amended Agreement of Limited Partnership to 0.5% per year of the average month-end Net Asset Value of the Fund. Actual operating expenses were less than 0.5% of average month-end Net Asset Value for the three months and nine months ended September 30, 2005 and 2004.
| Note 5. | SUBSCRIPTIONS, DISTRIBUTIONS AND REDEMPTIONS |
Investments in the Fund are made by subscription agreement, subject to acceptance by Campbell & Company.
The Fund is not required to make distributions, but may do so at the sole discretion of Campbell & Company. A limited partner may request and receive redemption of units owned, subject to restrictions in the Amended Agreement of Limited Partnership. Redemption fees apply through the first twelve month-ends following purchase as follows: 4% of Net Asset Value per unit redeemed through the third month-end, 3% of Net Asset Value per unit redeemed through the sixth month-end, 2% of Net Asset Value per unit redeemed through the ninth month-end and 1% of Net Asset Value per unit redeemed through the twelfth month-end. After the twelfth month-end following purchase of a unit, no redemption fees apply.
| Note 6. | TRADING ACTIVITIES AND RELATED RISKS |
The Fund engages in the speculative trading of U.S. and foreign futures contracts, forward currency contracts and swap contracts (collectively, “derivatives”). The Fund is exposed to both market risk, the risk arising from changes in the market value of the contracts, and credit risk, the risk of failure by another party to perform according to the terms of a contract.
Purchases and sales of futures contracts require margin deposits with the broker. Additional deposits may be necessary for any loss on contract value. The Commodity Exchange Act requires a broker to segregate all customer transactions and assets from such broker’s proprietary activities. A customer’s cash and other property (for example, U.S. Treasury bills) deposited with a broker are considered commingled with all other customer funds subject to the broker’s segregation requirements. In the event of a broker’s insolvency, recovery may be limited to a pro rata share of segregated funds available. It is possible that the recovered amount could be less than total cash and other property deposited.
-63-
CAMPBELL STRATEGIC ALLOCATION FUND, L.P.
NOTES TO FINANCIAL STATEMENTS — (Continued)
(Unaudited)
| Note 6. | TRADING ACTIVITIES AND RELATED RISKS — (Continued) |
The amount of required margin and good faith deposits with the broker and interbank and other market makers usually range from 10% to 30% of Net Asset Value. The market value of securities held to satisfy such requirements at September 30, 2005 and December 31, 2004 was $3,742,882,936 and $3,170,737,778, respectively, which equals 79% and 78% of Net Asset Value, respectively. The cash deposited with interbank and other market makers at September 30, 2005 and December 31, 2004 was $415,178,424 and $656,506,665, respectively, which equals 9% and 16% of Net Asset Value, respectively. These amounts are included in cash and cash equivalents.
The Fund trades forward currency and swap contracts in unregulated markets between principals and assumes the risk of loss from counterparty nonperformance. Accordingly, the risks associated with forward currency and swap contracts are generally greater than those associated with exchange traded contracts because of the greater risk of counterparty default. Additionally, the trading of forward currency and swap contracts typically involves delayed cash settlement.
The Fund has a substantial portion of its assets on deposit with financial institutions. In the event of a financial institution’s insolvency, recovery of Fund assets on deposit may be limited to account insurance or other protection afforded such deposits.
For derivatives, risks arise from changes in the market value of the contracts. Theoretically, the Fund is exposed to a market risk equal to the notional contract value of futures, forward currency and swap contracts purchased and unlimited liability on such contracts sold short.
The unrealized gain (loss) on open futures, forward currency and swap contracts is comprised of the following:
| Futures Contracts | Forward Currency and Swap Contracts | |||||||||||||||
| (exchange traded) | (non-exchange traded) | |||||||||||||||
| September 30, | December 31, | September 30, | December 31, | |||||||||||||
| 2005 | 2004 | 2005 | 2004 | |||||||||||||
| (Unaudited) | (Audited) | (Unaudited) | (Audited) | |||||||||||||
| Gross unrealized gains | $ | 114,420,217 | $ | 80,577,521 | $ | 407,533,103 | $ | 160,643,120 | ||||||||
| Gross unrealized losses | (20,854,377 | ) | (20,590,813 | ) | (309,224,556 | ) | (230,780,522 | ) | ||||||||
| Net unrealized gain (loss) | $ | 93,565,840 | $ | 59,986,708 | $ | 98,308,547 | $ | (70,137,402 | ) | |||||||
Open contracts generally mature within three months; as of September 30, 2005, the latest maturity date for open futures contracts is June 2006, and the latest maturity date for open forward currency contracts is December 2005. However, the Fund intends to close all contracts prior to maturity.
Campbell & Company has established procedures to actively monitor market risk and minimize credit risk, although there can be no assurance that it will, in fact, succeed in doing so. Campbell & Company’s basic market risk control procedures consist of continuously monitoring open positions, diversification of the portfolio and maintenance of a margin-to-equity ratio that rarely exceeds 30%. Campbell & Company seeks to minimize credit risk primarily by depositing and maintaining the Fund’s assets at financial institutions and brokers which Campbell & Company believes to be creditworthy. The limited partners bear the risk of loss only to the extent of the market value of their respective investments and, in certain specific circumstances, distributions and redemptions received.
-64-
CAMPBELL STRATEGIC ALLOCATION FUND, L.P.
NOTES TO FINANCIAL STATEMENTS — (Continued)
(Unaudited)
| Note 7. | GUARANTEES |
In the normal course of business, the Fund enters into contracts and agreements that contain a variety of representations and warranties and which provide general indemnifications. The Fund’s maximum exposure under these arrangements is unknown, as this would involve future claims that may be made against the Fund that have not yet occurred. The Fund expects the risk of any future obligation under these indemnifications to be remote.
| Note 8. | INTERIM FINANCIAL STATEMENTS |
The statement of financial condition, including the condensed schedule of investments, as of September 30, 2005, the statements of operations for the three months and nine months ended September 30, 2005 and 2004, and the statements of cash flows and changes in partners’ capital (Net Asset Value) for the nine months ended September 30, 2005 and 2004 are unaudited. In the opinion of management, such financial statements reflect all adjustments, which were of a normal and recurring nature, necessary for a fair presentation of financial position as of September 30, 2005, and the results of operations for the three months and nine months ended September 30, 2005 and 2004, and cash flows for the nine months ended September 30, 2005 and 2004.
| Note 9. | FINANCIAL HIGHLIGHTS |
The following information presents per unit operating performance data and other supplemental financial data for the three months and nine months ended September 30, 2005 and 2004. This information has been derived from information presented in the financial statements.
| Three months ended | Nine months ended | |||||||||||||||||
| September 30, | September 30, | |||||||||||||||||
| 2005 | 2004 | 2005 | 2004 | |||||||||||||||
| (Unaudited) | (Unaudited) | (Unaudited) | (Unaudited) | |||||||||||||||
Per Unit Performance | ||||||||||||||||||
(for a unit outstanding throughout the entire period) | ||||||||||||||||||
| Net asset value per unit at beginning of period | $ | 2,969.65 | $ | 2,677.10 | $ | 2,745.73 | $ | 2,631.37 | ||||||||||
Income (loss) from operations: | ||||||||||||||||||
| Total trading gains (losses)(1) | (10.88 | ) | (59.97 | ) | 279.48 | 163.74 | ||||||||||||
| Expenses net of interest income(1) | (28.97 | ) | (38.00 | ) | (91.97 | ) | (207.33 | ) | ||||||||||
| Total income (loss) from operations | (39.85 | ) | (97.97 | ) | 187.51 | (43.59 | ) | |||||||||||
| Offering costs(1) | (2.15 | ) | (4.63 | ) | (5.59 | ) | (13.28 | ) | ||||||||||
| Net asset value per unit at end of period | $ | 2,927.65 | $ | 2,574.50 | $ | 2,927.65 | $ | 2,574.50 | ||||||||||
Total Return(3) | (1.41 | )% | (3.83 | )% | 6.63 | % | (2.16 | )% | ||||||||||
Supplemental Data | ||||||||||||||||||
Ratios to average net assets: | ||||||||||||||||||
| Expenses prior to performance fee(4) | 7.04 | % | 7.05 | % | 7.10 | % | 7.11 | % | ||||||||||
| Performance fee(3) | 0.00 | % | 0.00 | % | 0.00 | % | 2.96 | % | ||||||||||
| Total expenses | 7.04 | % | 7.05 | % | 7.10 | % | 10.07 | % | ||||||||||
| Expenses net of interest income(2),(4) | 3.94 | % | 5.75 | % | 4.38 | % | 6.06 | % | ||||||||||
-65-
CAMPBELL STRATEGIC ALLOCATION FUND, L.P.
NOTES TO FINANCIAL STATEMENTS — (Continued)
(Unaudited)
Note 9. FINANCIAL HIGHLIGHTS — (Continued)
Total returns are calculated based on the change in value of a unit during the period. An individual partner’s total returns and ratios may vary from the above total returns and ratios based on the timing of additions and redemptions.
| (1) | Expenses net of interest income per unit and offering costs per unit are calculated by dividing the expenses net of interest income and offering costs by the average number of units outstanding during the period. Total trading gains (losses) is a balancing amount necessary to reconcile the change in net asset value per unit with the other per unit information. |
| (2) | Excludes performance fee. |
| (3) | Not annualized. |
| (4) | Annualized. |
-66-
REPORT OF INDEPENDENT REGISTERED PUBLIC ACCOUNTING FIRM
To the Partners
Campbell Strategic Allocation Fund, L.P.
We have audited the accompanying statements of financial condition of Campbell Strategic Allocation Fund, L.P., including the condensed schedules of investments, as of December 31, 2004 and 2003, and the related statements of operations, cash flows and changes in partners’ capital (net asset value) for the years ended December 31, 2004, 2003 and 2002. These financial statements are the responsibility of the Fund’s management. Our responsibility is to express an opinion on these financial statements based on our audits.
We conducted our audits in accordance with the standards of the Public Company Accounting Oversight Board (United States). Those standards require that we plan and perform the audit to obtain reasonable assurance about whether the financial statements are free of material misstatement. The Fund is not required to have, nor were we engaged to perform, an audit of its internal control over financial reporting. Our audit included consideration of internal control over financial reporting as a basis for designing audit procedures that are appropriate in the circumstances, but not for the purpose of expressing an opinion on the effectiveness of the Fund’s internal control over financial reporting. Accordingly, we express no such opinion. An audit also includes examining, on a test basis, evidence supporting the amounts and disclosures in the financial statements. An audit also includes assessing the accounting principles used and significant estimates made by management, as well as evaluating the overall financial statement presentation. We believe that our audits provide a reasonable basis for our opinion.
In our opinion, the financial statements referred to above present fairly, in all material respects, the financial position of Campbell Strategic Allocation Fund, L.P. as of December 31, 2004 and 2003, and the results of its operations, cash flows and the changes in its net asset values for the years ended December 31, 2004, 2003 and 2002, in conformity with U.S. generally accepted accounting principles.
| /s/ARTHUR F. BELL JR. & ASSOCIATES, L.L.C. | |
Hunt Valley, Maryland
March 22, 2005
-67-
CAMPBELL STRATEGIC ALLOCATION FUND, L.P.
STATEMENTS OF FINANCIAL CONDITION
December 31, 2004 and 2003
| 2004 | 2003 | ||||||||||
ASSETS | |||||||||||
| Equity in broker trading accounts | |||||||||||
| Cash | $ | 201,083,246 | $ | 189,245,425 | |||||||
| United States government securities | 1,871,364,160 | 1,024,483,288 | |||||||||
| Unrealized gain on open futures contracts | 59,986,708 | 43,858,230 | |||||||||
| Deposits with broker | 2,132,434,114 | 1,257,586,943 | |||||||||
| Cash and cash equivalents | 738,065,681 | 627,405,479 | |||||||||
| United States government securities | 1,299,373,618 | 899,206,764 | |||||||||
| Unrealized gain (loss) on open forward currency contracts | (70,137,402 | ) | 93,767,551 | ||||||||
| Total assets | $ | 4,099,736,011 | $ | 2,877,966,737 | |||||||
LIABILITIES | |||||||||||
| Accounts payable | $ | 855,905 | $ | 773,818 | |||||||
| Brokerage fee | 23,425,887 | 16,243,599 | |||||||||
| Commissions and other trading fees on open contracts | 914,080 | 373,638 | |||||||||
| Performance fee | 0 | 16,492,232 | |||||||||
| Offering costs payable | 2,230,619 | 1,387,938 | |||||||||
| Redemptions payable | 24,163,399 | 14,594,887 | |||||||||
| Total liabilities | 51,589,890 | 49,866,112 | |||||||||
| PARTNERS’ CAPITAL (Net Asset Value) | |||||||||||
| General Partner — 15,051.729 and 10,815.994 units outstanding at December 31, 2004 and 2003 | 41,327,984 | 28,460,882 | |||||||||
| Limited Partners — 1,459,291.150 and 1,063,947.539 units outstanding at December 31, 2004 and 2003 | 4,006,818,137 | 2,799,639,743 | |||||||||
| Total partners’ capital (Net Asset Value) | 4,048,146,121 | 2,828,100,625 | |||||||||
| $ | 4,099,736,011 | $ | 2,877,966,737 | ||||||||
See accompanying notes.
-68-
CAMPBELL STRATEGIC ALLOCATION FUND, L.P.
CONDENSED SCHEDULE OF INVESTMENTS
December 31, 2004
| UNITED STATES GOVERNMENT SECURITIES | % of Net | |||||||||||||||
| Face Value | Maturity Date | Description | Value | Asset Value | ||||||||||||
| $1,675,000,000 | 1/06/05 | U.S. Treasury Bills | $ | 1,674,618,108 | 41.37 | % | ||||||||||
| $575,000,000 | 3/17/05 | U.S. Treasury Bills | 572,424,479 | 14.14 | % | |||||||||||
| $350,000,000 | 1/13/05 | U.S. Treasury Bills | 349,808,667 | 8.64 | % | |||||||||||
| $200,000,000 | 1/27/05 | U.S. Treasury Bills | 199,734,222 | 4.93 | % | |||||||||||
| $200,000,000 | 2/17/05 | U.S. Treasury Bills | 199,459,500 | 4.93 | % | |||||||||||
| $175,000,000 | 2/03/05 | U.S. Treasury Bills | 174,692,802 | 4.32 | % | |||||||||||
| Total United States government securities (cost, including accrued interest, — $3,170,737,778) | $ | 3,170,737,778 | 78.33 | % | ||||||||||||
| LONG FUTURES CONTRACTS | ||||||||||||||||
| % of Net | ||||||||||||||||
| Description | Value | Asset Value | ||||||||||||||
| Energy | $ | (7,304,068 | ) | (0.18 | )% | |||||||||||
| Metals | 2,572,720 | 0.06 | % | |||||||||||||
| Stock index | 35,075,316 | 0.87 | % | |||||||||||||
| Short-term interest rates | (3,149,439 | ) | (0.08 | )% | ||||||||||||
| Long-term interest rates | 31,917,409 | 0.79 | % | |||||||||||||
| Total long futures contracts | $ | 59,111,938 | 1.46 | % | ||||||||||||
| SHORT FUTURES CONTRACTS | ||||||||||||||||
| % of Net | ||||||||||||||||
| Description | Value | Asset Value | ||||||||||||||
| Metals | $ | (4,000,591 | ) | (0.10 | )% | |||||||||||
| Short-term interest rates | 4,890,991 | 0.12 | % | |||||||||||||
| Long-term interest rates | (15,630 | ) | 0.00 | % | ||||||||||||
| Total short futures contracts | $ | 874,770 | 0.02 | % | ||||||||||||
| Total futures contracts | $ | 59,986,708 | 1.48 | % | ||||||||||||
| FORWARD CURRENCY CONTRACTS | ||||||||||||||||
| % of Net | ||||||||||||||||
| Description | Value | Asset Value | ||||||||||||||
| Various long forward currency contracts | $ | 121,005,028 | 2.99 | % | ||||||||||||
| Various short forward currency contracts | (191,142,430 | ) | (4.72 | )% | ||||||||||||
| Total forward currency contracts | $ | (70,137,402 | ) | (1.73 | )% | |||||||||||
See accompanying notes.
-69-
CAMPBELL STRATEGIC ALLOCATION FUND, L.P.
CONDENSED SCHEDULE OF INVESTMENTS
December 31, 2003
| UNITED STATES GOVERNMENT SECURITIES | % of Net | |||||||||||||||
| Face Value | Maturity Date | Description | Value | Asset Value | ||||||||||||
| $1,050,000,000 | 1/08/04 | U.S. Treasury Bills | $ | 1,049,820,260 | 37.12 | % | ||||||||||
| $350,000,000 | 3/18/04 | U.S. Treasury Bills | 349,378,653 | 12.35 | % | |||||||||||
| $200,000,000 | 1/29/04 | U.S. Treasury Bills | 199,860,000 | 7.07 | % | |||||||||||
| $175,000,000 | 2/05/04 | U.S. Treasury Bills | 174,843,472 | 6.18 | % | |||||||||||
| $150,000,000 | 2/26/04 | U.S. Treasury Bills | 149,787,667 | 5.30 | % | |||||||||||
| Total United States government securities (cost, including accrued interest, — $1,923,690,052) | $ | 1,923,690,052 | 68.02 | % | ||||||||||||
| LONG FUTURES CONTRACTS | ||||||||||||||||
| % of Net | ||||||||||||||||
| Description | Value | Asset Value | ||||||||||||||
| Energy | $ | 12,526,378 | 0.44 | % | ||||||||||||
| Metals | 4,106,216 | 0.15 | % | |||||||||||||
| Stock index | 34,144,656 | 1.21 | % | |||||||||||||
| Short-term interest rates | 5,097,901 | 0.18 | % | |||||||||||||
| Long-term interest rates | (8,943,827 | ) | (0.32 | )% | ||||||||||||
| Total long futures contracts | $ | 46,931,324 | 1.66 | % | ||||||||||||
| SHORT FUTURES CONTRACTS | ||||||||||||||||
| % of Net | ||||||||||||||||
| Description | Value | Asset Value | ||||||||||||||
| Metals | $ | (354,021 | ) | (0.01 | )% | |||||||||||
| Short-term interest rates | 183,300 | 0.00 | % | |||||||||||||
| Long-term interest rates | (2,902,373 | ) | (0.10 | )% | ||||||||||||
| Total short futures contracts | $ | (3,073,094 | ) | (0.11 | )% | |||||||||||
| Total futures contracts | $ | 43,858,230 | 1.55 | % | ||||||||||||
| FORWARD CURRENCY CONTRACTS | ||||||||||||||||
| % of Net | ||||||||||||||||
| Description | Value | Asset Value | ||||||||||||||
| Various long forward currency contracts | $ | 187,420,185 | 6.63 | % | ||||||||||||
| Various short forward currency contracts | (93,652,634 | ) | (3.31 | )% | ||||||||||||
| Total forward currency contracts | $ | 93,767,551 | 3.32 | % | ||||||||||||
See accompanying notes.
-70-
CAMPBELL STRATEGIC ALLOCATION FUND, L.P.
STATEMENTS OF OPERATIONS
For the Years Ended December 31, 2004, 2003 and 2002
| 2004 | 2003 | 2002 | |||||||||||||
TRADING GAINS | |||||||||||||||
| Futures trading gains (losses) | |||||||||||||||
| Realized | $ | 396,317,020 | $ | (53,295,006 | ) | $ | 166,999,777 | ||||||||
| Change in unrealized | 16,128,478 | 27,050,964 | 16,316,663 | ||||||||||||
| Brokerage commissions | (7,550,124 | ) | (4,574,976 | ) | (4,799,612 | ) | |||||||||
| Gain (loss) from futures trading | 404,895,374 | (30,819,018 | ) | 178,516,828 | |||||||||||
| Forward currency and swap trading gains (losses) | |||||||||||||||
| Realized | 203,232,232 | 510,354,521 | 86,515,089 | ||||||||||||
| Change in unrealized | (163,904,953 | ) | 65,019,392 | (13,885,796 | ) | ||||||||||
| Brokerage commissions | (1,106,990 | ) | (1,017,503 | ) | (619,018 | ) | |||||||||
| Gain from forward currency and swap trading | 38,220,289 | 574,356,410 | 72,010,275 | ||||||||||||
| Total trading gains | 443,115,663 | 543,537,392 | 250,527,103 | ||||||||||||
EXPENSES NET OF INTEREST INCOME | |||||||||||||||
| Income | |||||||||||||||
| Interest income | 43,794,851 | 21,955,515 | 18,774,658 | ||||||||||||
| Expenses | |||||||||||||||
| Brokerage fee | 251,008,338 | 158,423,875 | 81,002,406 | ||||||||||||
| Performance fee | 102,769,447 | 61,928,585 | 30,713,834 | ||||||||||||
| Operating expenses | 2,840,344 | 2,439,006 | 1,606,269 | ||||||||||||
| Total expenses | 356,618,129 | 222,791,466 | 113,322,509 | ||||||||||||
| Expenses net of interest income | (312,823,278 | ) | (200,835,951 | ) | (94,547,851 | ) | |||||||||
| NET INCOME | $ | 130,292,385 | $ | 342,701,441 | $ | 155,979,252 | |||||||||
NET INCOME PER GENERAL AND LIMITED PARTNER UNIT | |||||||||||||||
| (based on weighted average number of units outstanding during the year) | $ | 100.20 | $ | 385.55 | $ | 282.19 | |||||||||
INCREASE IN NET ASSET VALUE PER GENERAL AND LIMITED PARTNER UNIT | $ | 114.36 | $ | 395.32 | $ | 259.32 | |||||||||
See accompanying notes.
-71-
CAMPBELL STRATEGIC ALLOCATION FUND, L.P.
STATEMENTS OF CASH FLOWS
For the Years Ended December 31, 2004, 2003 and 2002
| 2004 | 2003 | 2002 | ||||||||||||||
Cash flows from (for) operating activities | ||||||||||||||||
| Net income | $ | 130,292,385 | $ | 342,701,441 | $ | 155,979,252 | ||||||||||
| Adjustments to reconcile net income to net cash (for) operating activities | ||||||||||||||||
| Net change in unrealized | 147,776,475 | (92,070,356 | ) | (2,430,867 | ) | |||||||||||
| Increase (decrease) in accounts payable and accrued expenses | (8,687,415 | ) | 24,241,652 | 3,737,680 | ||||||||||||
| Net (purchases) of investments in United States government securities | (1,247,047,726 | ) | (670,929,818 | ) | (537,688,561 | ) | ||||||||||
| Net cash (for) operating activities | (977,666,281 | ) | (396,057,081 | ) | (380,402,496 | ) | ||||||||||
Cash flows from (for) financing activities | ||||||||||||||||
| Addition of units | 1,341,837,619 | 1,028,600,448 | 624,223,999 | |||||||||||||
| Increase (decrease) in subscription deposits | 0 | (17,206,853 | ) | 16,949,122 | ||||||||||||
| Redemption of units | (228,722,464 | ) | (147,291,398 | ) | (98,699,321 | ) | ||||||||||
| Increase in redemptions payable | 9,568,512 | 5,629,379 | 4,575,613 | |||||||||||||
| Offering costs charged | (23,362,044 | ) | (13,859,058 | ) | (6,773,610 | ) | ||||||||||
| Increase in offering costs payable | 842,681 | 720,984 | 252,491 | |||||||||||||
| Net cash from financing activities | 1,100,164,304 | 856,593,502 | 540,528,294 | |||||||||||||
| Net increase in cash and cash equivalents | 122,498,023 | 460,536,421 | 160,125,798 | |||||||||||||
Cash and cash equivalents | ||||||||||||||||
| Beginning of year | 816,650,904 | 356,114,483 | 195,988,685 | |||||||||||||
| End of year | $ | 939,148,927 | $ | 816,650,904 | $ | 356,114,483 | ||||||||||
| End of year cash and cash equivalents consists of: | ||||||||||||||||
| Cash in broker trading accounts | $ | 201,083,246 | $ | 189,245,425 | $ | 41,776,698 | ||||||||||
| Cash and cash equivalents | 738,065,681 | 627,405,479 | 314,337,785 | |||||||||||||
| Total end of year cash and cash equivalents | $ | 939,148,927 | $ | 816,650,904 | $ | 356,114,483 | ||||||||||
See accompanying notes.
-72-
CAMPBELL STRATEGIC ALLOCATION FUND, L.P.
STATEMENTS OF CHANGES IN PARTNERS’ CAPITAL (NET ASSET VALUE)
For the Years Ended December 31, 2004, 2003 and 2002
| Partners’ Capital | ||||||||||||||||||||||||
| General | Limited | Total | ||||||||||||||||||||||
| Units | Amount | Units | Amount | Units | Amount | |||||||||||||||||||
| Balances at December 31, 2001 | 4,881.720 | $ | 9,649,832 | 472,279.945 | $ | 933,569,040 | 477,161.665 | $ | 943,218,872 | |||||||||||||||
| Net income for the year ended December 31, 2002 | 1,570,353 | 154,408,899 | 155,979,252 | |||||||||||||||||||||
| Additions | 2,440.185 | 5,216,038 | 291,759.495 | 619,007,961 | 294,199.680 | 624,223,999 | ||||||||||||||||||
| Redemptions | (59.001 | ) | (127,571 | ) | (47,726.355 | ) | (98,571,750 | ) | (47,785.356 | ) | (98,699,321 | ) | ||||||||||||
| Offering costs | (68,436 | ) | (6,705,174 | ) | (6,773,610 | ) | ||||||||||||||||||
| Balances at December 31, 2002 | 7,262.904 | 16,240,216 | 716,313.085 | 1,601,708,976 | 723,575.989 | 1,617,949,192 | ||||||||||||||||||
| Net income for the year ended December 31, 2003 | 3,446,561 | 339,254,880 | 342,701,441 | |||||||||||||||||||||
| Additions | 3,553.090 | 8,913,502 | 406,079.954 | 1,019,686,946 | 409,633.044 | 1,028,600,448 | ||||||||||||||||||
| Redemptions | 0.000 | 0 | (58,445.500 | ) | (147,291,398 | ) | (58,445.500 | ) | (147,291,398 | ) | ||||||||||||||
| Offering costs | (139,397 | ) | (13,719,661 | ) | (13,859,058 | ) | ||||||||||||||||||
| Balances at December 31, 2003 | 10,815.994 | 28,460,882 | 1,063,947.539 | 2,799,639,743 | 1,074,763.533 | 2,828,100,625 | ||||||||||||||||||
| Net income for the year ended December 31, 2004 | 1,300,362 | 128,992,023 | 130,292,385 | |||||||||||||||||||||
| Additions | 4,235.735 | 11,804,000 | 478,957.592 | 1,330,033,619 | 483,193.327 | 1,341,837,619 | ||||||||||||||||||
| Redemptions | 0.000 | 0 | (83,613.981 | ) | (228,722,464 | ) | (83,613.981 | ) | (228,722,464 | ) | ||||||||||||||
| Offering costs | (237,260 | ) | (23,124,784 | ) | (23,362,044 | ) | ||||||||||||||||||
| Balances at December 31, 2004 | 15,051.729 | $ | 41,327,984 | 1,459,291.150 | $ | 4,006,818,137 | 1,474,342.879 | $ | 4,048,146,121 | |||||||||||||||
| Net Asset Value Per General and Limited Partner Unit | ||||||||||
| December 31, | ||||||||||
| 2004 | 2003 | 2002 | ||||||||
| $ | 2,745.73 | $ | 2,631.37 | $ | 2,236.05 | |||||
See accompanying notes.
-73-
CAMPBELL STRATEGIC ALLOCATION FUND, L.P.
NOTES TO FINANCIAL STATEMENTS
| Note 1. | ORGANIZATION AND SUMMARY OF SIGNIFICANT ACCOUNTING POLICIES |
A. General Description of the Fund
| Campbell Strategic Allocation Fund, L.P. (the Fund) is a Delaware limited partnership which operates as a commodity investment pool. The Fund engages in the speculative trading of futures contracts, forward currency contracts and swap contracts. |
B. Regulation
| As a registrant with the Securities and Exchange Commission, the Fund is subject to the regulatory requirements under the Securities Act of 1933 and the Securities Exchange Act of 1934. As a commodity investment pool, the Fund is subject to the regulations of the Commodity Futures Trading Commission, an agency of the United States (U.S.) government which regulates most aspects of the commodity futures industry; rules of the National Futures Association, an industry self-regulatory organization; and the requirements of the various commodity exchanges where the Fund executes transactions. Additionally, the Fund is subject to the requirements of futures commission merchants (brokers) and interbank and other market makers through which the Fund trades. |
C. Method of Reporting
| The Fund’s financial statements are presented in accordance with U.S. generally accepted accounting principles, which require the use of certain estimates made by the Fund’s management. Investment transactions are accounted for on the trade date. Gains or losses are realized when contracts are liquidated. Unrealized gains and losses on open contracts (the difference between contract trade price and market price) are reported in the statement of financial condition as a net gain or loss, as there exists a right of offset of unrealized gains or losses in accordance with Financial Accounting Standards Board Interpretation No. 39 — “Offsetting of Amounts Related to Certain Contracts.” The market value of futures (exchange-traded) contracts is determined by the various futures exchanges, and reflects the settlement price for each contract as of the close of the last business day of the reporting period. The market value of swap and forward currency (non-exchange traded) contracts is extrapolated on a forward basis from the spot prices quoted as of 5:00 P.M. (E.T.) on the last business day of the reporting period or based on the market value of its exchange-traded equivalent. Any change in net unrealized gain or loss from the preceding period is reported in the statement of operations. Brokerage commissions include other trading fees and are charged to expense when contracts are opened. United States government securities are stated at cost plus accrued interest, which approximates market value. | |
| For purposes of both financial reporting and calculation of redemption value, Net Asset Value per unit is calculated by dividing Net Asset Value by the number of outstanding units. |
D. Cash and Cash Equivalents
| Cash and cash equivalents includes cash and short-term time deposits held at financial institutions. |
E. Income Taxes
| The Fund prepares calendar year U.S. and applicable state information tax returns and reports to the partners their allocable shares of the Fund’s income, expenses and trading gains or losses. |
-74-
CAMPBELL STRATEGIC ALLOCATION FUND, L.P.
NOTES TO FINANCIAL STATEMENTS — (Continued)
| Note 1. | ORGANIZATION AND SUMMARY OF SIGNIFICANT ACCOUNTING POLICIES — (Continued) |
F. Offering Costs
| Campbell & Company, Inc. (Campbell & Company) has incurred all costs in connection with the initial and continuous offering of units of the Fund (offering costs). The Fund’s liability for offering costs is limited to the maximum of total offering costs incurred by Campbell & Company or 2.5% of the aggregate subscriptions accepted during the initial and continuous offerings; this maximum is further limited by 30 month pay-out schedules. The Fund is only liable for payment of offering costs on a monthly basis as calculated based on the limitations stated above. At December 31, 2004, the Fund reflects a liability in the statement of financial condition for offering costs payable to Campbell & Company of $2,230,619. The amount of monthly reimbursement due to Campbell & Company is charged directly to partners’ capital. | |
| If the Fund terminates prior to completion of payment of the calculated amounts to Campbell & Company, Campbell & Company will not be entitled to any additional payments, and the Fund will have no further obligation to Campbell & Company. At December 31, 2004, the amount of unreimbursed offering costs incurred by Campbell & Company is $2,654,427. |
G. Foreign Currency Transactions
| The Fund’s functional currency is the U.S. dollar; however, it transacts business in currencies other than the U.S. dollar. Assets and liabilities denominated in currencies other than the U.S. dollar are translated into U.S. dollars at the rates in effect at the date of the statement of financial condition. Income and expense items denominated in currencies other than the U.S. dollar are translated into U.S. dollars at the rates in effect during the period. Gains and losses resulting from the translation to U.S. dollars are reported in income currently. |
| Note 2. | GENERAL PARTNER AND COMMODITY TRADING ADVISOR |
The general partner of the Fund is Campbell & Company, which conducts and manages the business of the Fund. Campbell & Company is also the commodity trading advisor of the Fund. The Amended Agreement of Limited Partnership provides that Campbell & Company may make withdrawals of its units, provided that such withdrawals do not reduce Campbell & Company’s aggregate percentage interest in the Fund to less than 1% of the net aggregate contributions.
Campbell & Company is required by the Amended Agreement of Limited Partnership to maintain a net worth equal to at least 5% of the capital contributed by all the limited partnerships for which it acts as general partner, including the Fund. The minimum net worth shall in no case be less than $50,000 nor shall net worth in excess of $1,000,000 be required.
The Fund pays a monthly brokerage fee equal to 1/12 of 7% (7% annualized) of month-end net assets to Campbell & Company and approximately $6 per round turn ($10 prior to January 1, 2003) to the broker for execution and clearing costs. From the 7% fee, a portion (4%) is used to compensate selling agents for ongoing services rendered and a portion (3%) is retained by Campbell & Company for trading and management services rendered. The amount paid to the broker and interbank market makers for execution and clearing costs is limited to 1/12 of 1% (1% annualized) of month-end net assets.
Campbell & Company is also paid a quarterly performance fee of 20% of the Fund’s aggregate cumulative appreciation in the Net Asset Value per unit, exclusive of appreciation attributable to interest income.
-75-
CAMPBELL STRATEGIC ALLOCATION FUND, L.P.
NOTES TO FINANCIAL STATEMENTS — (Continued)
| Note 3. | DEPOSITS WITH BROKER |
The Fund deposits assets with a broker subject to Commodity Futures Trading Commission regulations and various exchange and broker requirements. Margin requirements are satisfied by the deposit of U.S. Treasury bills and cash with such broker. The Fund earns interest income on its assets deposited with the broker.
| Note 4. | OPERATING EXPENSES |
Operating expenses of the Fund are limited by the Amended Agreement of Limited Partnership to 0.5% per year of the average month-end Net Asset Value of the Fund. Actual operating expenses were less than 0.5% of average month-end Net Asset Value for the years ended December 31, 2004, 2003 and 2002.
| Note 5. | SUBSCRIPTIONS, DISTRIBUTIONS AND REDEMPTIONS |
Investments in the Fund are made by subscription agreement, subject to acceptance by Campbell & Company.
The Fund is not required to make distributions, but may do so at the sole discretion of Campbell & Company. A limited partner may request and receive redemption of units owned, subject to restrictions in the Amended Agreement of Limited Partnership. Redemption fees apply through the first twelve month-ends following purchase as follows: 4% of Net Asset Value per unit redeemed through the third month-end, 3% of Net Asset Value per unit redeemed through the sixth month-end, 2% of Net Asset Value per unit redeemed through the ninth month-end and 1% of Net Asset Value per unit redeemed through the twelfth month-end. After the twelfth month-end following purchase of a unit, no redemption fees apply.
| Note 6. | TRADING ACTIVITIES AND RELATED RISKS |
The Fund engages in the speculative trading of U.S. and foreign futures contracts, forward currency contracts and swap contracts (collectively, “derivatives”). The Fund is exposed to both market risk, the risk arising from changes in the market value of the contracts, and credit risk, the risk of failure by another party to perform according to the terms of a contract.
Purchase and sale of futures contracts requires margin deposits with the broker. Additional deposits may be necessary for any loss on contract value. The Commodity Exchange Act requires a broker to segregate all customer transactions and assets from such broker’s proprietary activities. A customer’s cash and other property (for example, U.S. Treasury bills) deposited with a broker are considered commingled with all other customer funds subject to the broker’s segregation requirements. In the event of a broker’s insolvency, recovery may be limited to a pro rata share of segregated funds available. It is possible that the recovered amount could be less than total cash and other property deposited.
The amount of required margin and good faith deposits with the broker and interbank and other market makers usually range from 10% to 30% of Net Asset Value. The market value of securities held to satisfy such requirements at December 31, 2004 and 2003 was $3,170,737,778 and $1,923,690,052, respectively, which equals 78% and 68% of Net Asset Value, respectively. The cash deposited with interbank and other market makers at December 31, 2004 and 2003 was $656,506,665 and $535,480,647, respectively, which equals 16% and 19% of Net Asset Value, respectively. These amounts are included in cash and cash equivalents.
The Fund trades forward currency and swap contracts in unregulated markets between principals and assumes the risk of loss from counterparty nonperformance. Accordingly, the risks associated with forward currency and swap contracts are generally greater than those associated with exchange traded contracts
-76-
CAMPBELL STRATEGIC ALLOCATION FUND, L.P.
NOTES TO FINANCIAL STATEMENTS — (Continued)
| Note 6. | TRADING ACTIVITIES AND RELATED RISKS — (Continued) |
because of the greater risk of counterparty default. Additionally, the trading of forward currency and swap contracts typically involves delayed cash settlement.
The Fund has a substantial portion of its assets on deposit with financial institutions. In the event of a financial institution’s insolvency, recovery of Fund assets on deposit may be limited to account insurance or other protection afforded such deposits.
For derivatives, risks arise from changes in the market value of the contracts. Theoretically, the Fund is exposed to a market risk equal to the notional contract value of futures, forward currency and swap contracts purchased and unlimited liability on such contracts sold short.
The unrealized gain (loss) on open futures, forward currency and swap contracts is comprised of the following:
| Futures Contracts | Forward Currency and Swap Contracts | |||||||||||||||
| (exchange traded) | (non-exchange traded) | |||||||||||||||
| December 31, | December 31, | |||||||||||||||
| 2004 | 2003 | 2004 | 2003 | |||||||||||||
| Gross unrealized gains | $ | 80,577,521 | $ | 59,494,849 | $ | 160,643,120 | $ | 200,933,202 | ||||||||
| Gross unrealized losses | (20,590,813 | ) | (15,636,619 | ) | (230,780,522 | ) | (107,165,651 | ) | ||||||||
| Net unrealized gain | $ | 59,986,708 | $ | 43,858,230 | $ | (70,137,402 | ) | $ | 93,767,551 | |||||||
Open contracts generally mature within three months; as of December 31, 2004, the latest maturity date for open futures contracts is September 2005, and the latest maturity date for open forward currency contracts is March 2005. However, the Fund intends to close all contracts prior to maturity.
Campbell & Company has established procedures to actively monitor market risk and minimize credit risk, although there can be no assurance that it will, in fact, succeed in doing so. Campbell & Company’s basic market risk control procedures consist of continuously monitoring open positions, diversification of the portfolio and maintenance of a margin-to-equity ratio that rarely exceeds 30%. Campbell & Company seeks to minimize credit risk primarily by depositing and maintaining the Fund’s assets at financial institutions and brokers which Campbell & Company believes to be creditworthy. The limited partners bear the risk of loss only to the extent of the market value of their respective investments and, in certain specific circumstances, distributions and redemptions received.
| Note 7. | GUARANTEES |
In the normal course of business, the Fund enters into contracts and agreements that contain a variety of representations and warranties and which provide general indemnifications. The Fund’s maximum exposure under these arrangements is unknown, as this would involve future claims that may be made against the Fund that have not yet occurred. The Fund expects the risk of any future obligation under these indemnifications to be remote.
-77-
CAMPBELL STRATEGIC ALLOCATION FUND, L.P.
NOTES TO FINANCIAL STATEMENTS — (Continued)
| Note 8. | FINANCIAL HIGHLIGHTS |
The following information presents per unit operating performance data and other supplemental financial data for the years ended December 31, 2004, 2003 and 2002. This information has been derived from information presented in the financial statements.
| 2004 | 2003 | 2002 | ||||||||||||
Per Unit Performance | ||||||||||||||
| (for a unit outstanding throughout the entire year) | ||||||||||||||
| Net asset value per unit at beginning of year | $ | 2,631.37 | $ | 2,236.05 | $ | 1,976.73 | ||||||||
Income (loss) from operations: | ||||||||||||||
| Total trading gains (1) | 372.91 | 636.86 | 442.62 | |||||||||||
| Expenses net of interest income (1) | (240.58 | ) | (225.95 | ) | (171.05 | ) | ||||||||
| Total income from operations | 132.33 | 410.91 | 271.57 | |||||||||||
| Offering costs (1) | (17.97 | ) | (15.59 | ) | (12.25 | ) | ||||||||
| Net asset value per unit at end of year | $ | 2,745.73 | $ | 2,631.37 | $ | 2,236.05 | ||||||||
| Total Return | 4.35 | % | 17.68 | % | 13.12 | % | ||||||||
Supplemental Data | ||||||||||||||
Ratios to average net asset value: | ||||||||||||||
| Expenses prior to performance fee | (7.10 | )% | (7.15 | )% | (7.11 | )% | ||||||||
| Performance fee | (2.88 | )% | (2.75 | )% | (2.64 | )% | ||||||||
| Total expenses | (9.98 | )% | (9.90 | )% | (9.75 | )% | ||||||||
| Expenses net of interest income (2) | (5.88 | )% | (6.17 | )% | (5.49 | )% | ||||||||
Total returns are calculated based on the change in value of a unit during the year. An individual partner’s total returns and ratios may vary from the above total returns and ratios based on the timing of additions and redemptions.
| (1) | Expenses net of interest income per unit and offering costs per unit are calculated by dividing the expenses net of interest income and offering costs by the average number of units outstanding during the year. Total trading gains is a balancing amount necessary to reconcile the change in net asset value per unit with the other per unit information. |
| (2) | Excludes performance fee. |
-78-
CAMPBELL & COMPANY, INC.
CONSOLIDATED BALANCE SHEET
September 30, 2005
(Unaudited)
ASSETS | ||||||||
| Current assets | ||||||||
| Cash and cash equivalents | $ | 140,796,582 | ||||||
| Unrealized gain on open futures contracts | 386,280 | |||||||
| Unrealized gain on open forwards contracts | 433,969 | |||||||
| Investments in equity securities, at fair value (cost $16,416,579) | 16,261,971 | |||||||
| Accounts receivable | ||||||||
| Advisory and performance fees | 24,758,203 | |||||||
| Receivable from Campbell Strategic Allocation Fund, L.P. | 18,173,046 | |||||||
| Other receivables | 306,295 | |||||||
| Total current assets | 201,116,346 | |||||||
| Property and equipment | ||||||||
| Furniture and office equipment | 8,832,201 | |||||||
| Leasehold improvements | 1,538,080 | |||||||
| 10,370,281 | ||||||||
| Less accumulated depreciation and amortization | (5,503,504 | ) | ||||||
| Total property and equipment | 4,866,777 | |||||||
| Other assets | ||||||||
| Cash surrender value of life insurance, net of policy loans of $277,388 | 375,865 | |||||||
| Investments in sponsored funds | 64,544,807 | |||||||
| Other | 17,530,495 | |||||||
| Total assets | $ | 288,434,290 | ||||||
LIABILITIES | ||||||||
| Current liabilities | ||||||||
| Accounts payable and accrued expenses | $ | 108,877,526 | ||||||
| Equity securities sold short, at fair value (proceeds $15,696,077) | 16,238,939 | |||||||
| Total current liabilities | 125,116,465 | |||||||
| Subordinated debt | 145,000,000 | |||||||
| Capital stock subject to repurchase, at current redemption value | 2,034,020 | |||||||
| Total liabilities | 272,150,485 | |||||||
STOCKHOLDERS’ EQUITY | ||||||||
| Retained earnings | 16,283,805 | |||||||
| Total liabilities and stockholders’ equity | $ | 288,434,290 | ||||||
THE INVESTOR WILL NOT RECEIVE ANY INTEREST IN THIS COMPANY.
See accompanying notes.
-79-
CAMPBELL & COMPANY, INC.
NOTES TO CONSOLIDATED BALANCE SHEET
(Unaudited)
| Note 1. | ORGANIZATION AND SUMMARY OF SIGNIFICANT ACCOUNTING POLICIES |
| A. | General |
Campbell and Company, Inc. is incorporated in Maryland and earns fees as a commodity trading advisor. Campbell Multi-Strategy Trust (CMST) is a Delaware statutory trust which is registered under the Investment Company Act of 1940, as amended, as a closed-end, non-diversified management investment company (CMST is the successor to the Campbell Multi-Strategy Fund L.L.C.). Campbell & Company Investment Adviser LLC (CCIA) is a Delaware limited liability company which is registered under the Investment Advisers Act of 1940, as amended, as an investment advisor. Campbell & Company, Inc. is the sole investor in CMST as of September 30, 2005 and is also the parent of CCIA, which is the trading adviser for CMST. Campbell & Company, Inc. intends to solicit additional outside investment in CMST and will re-assess the need to consolidate CMST in future periods.
Both Campbell & Company, Inc. and CMST are subject to the regulations of the Commodity Futures Trading Commission, an agency of the United States (U.S.) government, which regulates most aspects of the commodity futures industry. They are also subject to the rules of the National Futures Association, an industry self-regulatory organization, the requirements of Commodity Exchanges, Futures Commission Merchants (brokers), and interbank market makers through which they trade. In addition, CMST is subject to the regulations of the Securities and Exchange Commission under the Investment Company Act of 1940. CCIA is subject to the regulations of the Securities and Exchange Commission under the Investment Advisers Act of 1940.
The consolidated balance sheet includes the accounts of Campbell & Company, Inc., CMST and CCIA (collectively, the “Company”). Significant intercompany accounts and transactions have been eliminated in consolidation.
The Company’s consolidated balance sheet is presented in accordance with accounting principles generally accepted in the United States of America. The preparation of the consolidated balance sheet in conformity with accounting principles generally accepted in the United States of America requires management to make estimates and assumptions that affect the reported amounts of assets and liabilities and disclosures of contingent assets and liabilities at the date of the consolidated balance sheet. Actual results could differ from those estimates, and such differences may be material to the consolidated balance sheet.
| B. | Cash and Cash Equivalents |
Cash and cash equivalents consist of cash, commercial paper, certificates of deposit, U.S. Treasury Bills and money market mutual funds readily convertible into cash.
| C. | Revenue Recognition |
Advisory and management fees accrue monthly based on a percentage of assets under management. Performance fees may be earned by achieving defined performance objectives. Performance fees are accrued when the conditions of the applicable performance fee agreements are satisfied.
-80-
CAMPBELL & COMPANY, INC.
NOTES TO CONSOLIDATED BALANCE SHEET — (Continued)
(Unaudited)
| Note 1. | ORGANIZATION AND SUMMARY OF SIGNIFICANT ACCOUNTING POLICIES — (Continued) |
| D. | Property and Equipment |
Property and equipment are stated at cost. Depreciation and amortization is provided for over the estimated useful lives of the assets using straight-line and accelerated methods. Such lives range from 3 to 39 years.
| E. | Investments in Sponsored Funds |
Investments in sponsored funds are marked to market at their reported net asset values at the balance sheet date, in accordance with the equity method.
| F. | Deposits with Futures Broker and Foreign Exchange Dealer |
The Company deposits cash and U.S. Treasury bills with a futures broker and with a foreign exchange dealer in connection with its trading of futures and forward contracts. Gains or losses are realized when contracts are liquidated. Unrealized gains or losses on open contracts (the difference between contract purchase price and market price) are reflected in the balance sheet as a net gain or loss, as there exists a right of offset of unrealized gains or losses in accordance with Financial Accounting Standards Board Interpretation No. 39 —“Offsetting of Amounts Related to Certain Contracts”. Brokerage commissions on futures or forward contracts include other trading fees and are charged to expense when contracts are opened.
The amount of required margin and good faith deposits with the futures broker and the foreign exchange dealer usually range from 10% to 30% of net assets traded. The market value of cash and cash equivalents deposited to satisfy such requirements at September 30, 2005 was $17,642,788. This amount is included in cash and cash equivalents.
| G. | Investments in Equity Securities |
The Company deposits cash and securities with a prime broker in connection with its trading of securities.
All securities are listed on an exchange and are valued at the last reported sales price on the valuation date. Security transactions are accounted for on the trade date. Realized gains and losses from security transactions are determined using the identified cost method. Brokerage commissions and other trading fees on securities transactions are reflected as an adjustment to cost or proceeds at the time of the transaction. Dividends are recorded on the ex-dividend date.
At September 30, 2005, $6,913,029 of cash was on deposit with the prime broker. This balance is included in cash and cash equivalents.
| H. | Income Taxes |
The Company has elected S corporation status under the Internal Revenue Code, pursuant to which the Company does not pay U.S. or Maryland income taxes. The Company is subject to state income taxes in certain states in which it conducts business and adequate provision for such is provided for in the consolidated balance sheet. The Company’s taxable income is taxable to the stockholders on an individual basis.
-81-
CAMPBELL & COMPANY, INC.
NOTES TO CONSOLIDATED BALANCE SHEET — (Continued)
(Unaudited)
| Note 2. | INVESTMENTS IN SPONSORED FUNDS |
Investments in sponsored funds consist of the following as of September 30, 2005:
| Campbell Strategic Allocation Fund, L.P. | $ | 47,489,323 | |||
| Rampant Investments, L.P. | 6,381,696 | ||||
| Campbell Institutional Multi-Strategy Fund L.L.C. | 6,190,288 | ||||
| Campbell Alternative Asset Trust | 2,311,147 | ||||
| Campbell Financial Futures Fund Limited Partnership | 2,119,085 | ||||
| The Campbell Fund Trust | 53,268 | ||||
| Total | $ | 64,544,807 | |||
In addition to its investments in these sponsored funds, the Company has General Partner, Managing Owner, Managing Member, or Managing Operator responsibilities with regards to the following:
| Campbell Strategic Allocation Fund, L.P. |
The Company is the General Partner and trading manager of Campbell Strategic Allocation Fund, L.P. (Strategic). As General Partner, the Company receives from Strategic a monthly brokerage fee and quarterly performance fee. Such fees represented approximately 45% of the Company’s revenues for the nine months ended September 30, 2005. Included in advisory and performance fees receivable at September 30, 2005 is approximately $11,706,547 due from Strategic for such fees.
Summarized financial information with respect to Strategic as of September 30, 2005 is as follows:
| Balance Sheet Data | ||||||
| Assets | $ | 4,792,339,085 | ||||
| Liabilities | (51,705,703 | ) | ||||
| Net Asset Value | $ | 4,740,633,382 | ||||
The Company has committed to maintaining an investment in Strategic equal to at least 1% off the net aggregate capital contributions of all partners. The Company, as General Partner, had contributed capital of $37,000,062 as of September 30, 2005 to Strategic. The Company is further bound by Strategic’s Amended Agreement of Limited Partnership to maintain net worth equal to at least 5% of the capital contributed by all the limited partnerships for which the Company acts as General Partner. The minimum net worth shall in no case be less than $50,000 nor shall net worth in excess of $1,000,000 be required.
In accordance with Strategic’s Amended Agreement of Limited Partnership, as General Partner, the Company advances the incurred costs in connection with Strategic’s continuous offerings. The Company is reimbursed such advanced amounts by Strategic in approximately 30 equal installments monthly during the continuous offering. In no event shall the Company be entitled to receive reimbursement in an amount greater than 2.5% of the aggregate subscriptions accepted during the initial and continuous offerings combined. The Company reflects a receivable of $2,601,188 as of September 30, 2005 from Strategic for offering costs due to be reimbursed. Such amounts are included in Receivable from Campbell Strategic Allocation Fund, L.P. in the consolidated balance sheet.
The Company also pays, up-front, a 4% commission to selling agents for Strategic. The Company is then reimbursed by Strategic for this cost, over twelve months, through a brokerage fee which is based on the monthly net asset value of Strategic. As of September 30, 2005, $32,389,015 in selling agent commissions is subject to future reimbursement, of which $15,571,858 is included in Receivable from
-82-
CAMPBELL & COMPANY, INC.
NOTES TO CONSOLIDATED BALANCE SHEET — (Continued)
(Unaudited)
Note 2. INVESTMENTS IN SPONSORED FUNDS — (Continued)
Campbell Strategic Allocation Fund, L.P. — (Continued)
Campbell Strategic Allocation Fund, L.P. and $16,817,157 is included in Other assets in the consolidated balance sheet.
In the event Strategic terminates prior to the completion of any reimbursement of the aforementioned costs, the Company will not be entitled to any additional reimbursement from Strategic.
| Campbell Alternative Asset Trust |
The Company is the Managing Owner and trading manager of Campbell Alternative Asset Trust (“CAAT”). The Trustee of CAAT has delegated to the Managing Owner all of the power and authority to manage the business affairs of CAAT. The Net Asset Value of CAAT as of September 30, 2005 totaled $38,131,004.
The Company has committed to maintaining an investment in CAAT equal to at least 1% of the total capital accounts of CAAT. The Company’s capital account balance as of September 30, 2005 was $2,311,147. The Company is further bound by CAAT’s Third Amended and Restated Declaration of Trust and Trust Agreement to maintain net worth equal to at least $1,000,000.
As Managing Owner, the Company has agreed to advance funds to CAAT necessary to pay organization and offering costs related to CAAT’s initial and continuous offerings. The Company is reimbursed such amounts by CAAT at the rate of 0.9% per annum of CAAT’s net assets. The Company reflects a receivable of $15,624 as of September 30, 2005 from CAAT for offering costs due to be reimbursed. This amount is included in Other receivables in the consolidated balance sheet. The remaining unreimbursed offering costs of $225,707 as of September 30, 2005 is included in Other assets in the consolidated balance sheet. This amount is carried on the Company’s books as an asset because of the probable future economic benefit to be obtained from the eventual receipt from CAAT of these reimbursements, even though CAAT is not liable for this amount at the current time. In the event CAAT terminates prior to the completion of any reimbursement of the offering costs, the Company will not be entitled to any additional reimbursement from CAAT. The Company analyzes the value of the unreimbursed organization and offering costs on its consolidated balance sheet on a quarterly basis to ensure that the carrying value is an accurate estimate of what the Company can expect to receive over time, and expenses any excess value on its books.
| Rampant Investments, L.P. |
The Company acts as General Partner of Rampant Investments, L.P. (Rampant). The Net Asset Value of Rampant as of September 30, 2005 totaled $16,120,578.
| Campbell Institutional Multi-Strategy Fund L.L.C. (formerly Campbell Long/Short Equity Investment Fund, L.L.C.) |
The Company acts as Managing Member of Campbell Institutional Multi-Strategy Fund L.L.C. (“CIMSF”). The Net Asset Value of CIMSF as of September 30, 2005 totaled $31,021,320.
| Campbell Financial Futures Fund Limited Partnership |
The Company acts as General Partner of Campbell Financial Futures Fund Limited Partnership (Financial Futures). The Net Asset Value of Financial Futures as of September 30, 2005 totaled $164,817,346.
-83-
CAMPBELL & COMPANY, INC.
NOTES TO CONSOLIDATED BALANCE SHEET — (Continued)
(Unaudited)
Note 2. INVESTMENTS IN SPONSORED FUNDS — (Continued)
| The Campbell Fund Trust |
The Company is the Managing Operator of The Campbell Fund Trust (the Trust). The Trustee of the Trust has delegated to the Managing Operator all of the power and authority to manage the business affairs of the Trust. The Net Asset Value of the Trust as of September 30, 2005 totaled $847,101,500.
Note 3. TRADING ACTIVITIES AND RELATED RISKS
The Company and the sponsored funds for which the Company is either the sole General Partner, Managing Owner, Managing Member, or Managing Operator engage in the speculative trading of U.S. and foreign futures contracts, forward contracts and other derivative contracts (collectively, “derivatives”). The Company and the sponsored funds are exposed to both market risk, the risk arising from changes in the market value of the contracts, and credit risk, the risk of failure by another party to perform according to the terms of a contract. The Company and the sponsored funds also trade forward contracts in unregulated markets between principals and assume the risk of loss from counterparty nonperformance.
The Company and certain sponsored funds engage in the trading of securities which are typically traded on an exchange or in the over-the-counter market. The Company and such sponsored funds also sell securities not owned at the time of sale (a “short sale”). Risks arise from short sales due to the possible illiquidity of the securities markets and from potential adverse movements in security values. Theoretically, short sales expose such sponsored funds and the Company to potentially unlimited liability as the ultimate obligation to purchase a security sold short may exceed the amount recorded in its consolidated balance sheet.
The Company maintains a large portion of its cash and cash equivalents with financial institutions in connection with its trading and cash management activities. In the event of a financial institution’s insolvency, recovery of Company assets on deposit may be limited to account insurance or other protection afforded such deposits.
For derivatives, risks arise from changes in the market value of the contracts. Theoretically, the sponsored funds and the Company, as General Partner, Managing Owner, Managing Member, or Managing Operator of the sponsored funds, and as a direct investor in derivative contracts, are exposed to a market risk equal to the notional contract value of derivatives purchased and unlimited liability on derivatives sold short.
The Company has established procedures to actively monitor the market risk and minimize the credit risk of such sponsored funds, although there can be no assurance that it will, in fact, succeed in doing so.
| Note 4. | INDEMNIFICATIONS |
In the normal course of business, the Company enters into contracts and agreements that contain a variety of representations and warranties and which provide general indemnifications. The Company’s maximum exposure under these arrangements is unknown, as this would involve future claims that may be made against the Company that have not yet occurred. The Company expects the risk of any future obligation under these indemnifications to be remote.
| Note 5. | CAPITAL STOCK SUBJECT TO REPURCHASE |
The Company has entered into agreements with its stockholders which stipulate that upon the death or disability of a stockholder or upon the retirement or termination of a stockholder’s employment with the Company, the Company will purchase the stockholders’ capital stock at an amount equal to that
-84-
CAMPBELL & COMPANY, INC.
NOTES TO CONSOLIDATED BALANCE SHEET — (Continued)
(Unaudited)
| Note 5. | CAPITAL STOCK SUBJECT TO REPURCHASE — (Continued) |
shareholder’s proportionate share of ownership of the net book asset value of the Company, excluding the retained earnings of the Company accumulated over the past twelve (12) months. Such redemption value shall be determined as of the last day of the calendar quarter immediately preceding the calendar month in which the terminating event occurred. In accordance with Statement of Financial Accounting Standards No. 150,“Accounting for Certain Financial Instruments with Characteristics of both Liabilities and Equity”, the redemption value of all capital stock has been reclassified from retained earnings to liabilities (“Capital stock subject to repurchase, at current redemption value”) within the balance sheet.
Capital stock subject to repurchase at September 30, 2005 consists of:
| Capital stock | |||||
| Class A voting, no par, $100 stated value; 2,500 shares authorized; 103.425 shares issued and outstanding | $ | 10,342 | |||
| Additional paid-in capital, attributable to those shares | 45,968 | ||||
| Retained earnings, attributable to those shares | 1,977,710 | ||||
| $ | 2,034,020 | ||||
| Note 6. | SUBORDINATED DEBT |
The Company entered into a working capital agreement with its stockholders. This agreement provides for the issuance of unsecured notes to the Company which are subordinated to any future borrowings of the Company. Interest on any notes issued in accordance with this agreement is payable annually at a rate of 12.0%. Any unpaid principal balance is due on the sixth anniversary date of the commencement date of each note, or if sooner, five years after a stockholder (a noteholder) ceases to be in the employ of the Company. At September 30, 2005, $145,000,000 was outstanding under this agreement. Under the terms of the notes, maturities by year are as follows.
| 2007 | $ | 7,393,800 | ||
| 2008 | 39,380,000 | |||
| 2009 | 32,490,000 | |||
| 2010 | 60,736,200 | |||
| 2011 | 5,000,000 | |||
| $ | 145,000,000 | |||
-85-
CAMPBELL & COMPANY, INC.
NOTES TO CONSOLIDATED BALANCE SHEET — (Continued)
(Unaudited)
| Note 7. | LEASE OBLIGATION |
The Company leases office facilities under agreements which provide for minimum base annual rentals plus a proportionate share of operating expenses. The leases expire on September 30, 2010 and October 31, 2012. The Company has the option to renew the leases for an additional 60 months. Minimum base annual rentals through the original lease term are as follows:
| Year ending September 30 | ||||
| 2006 | $ | 712,755 | ||
| 2007 | 727,032 | |||
| 2008 | 741,622 | |||
| 2009 | 756,524 | |||
| 2010 | 771,705 | |||
| Thereafter | 66,632 | |||
| Total base annual rentals | $ | 3,776,270 | ||
| Note 8. | PROFIT SHARING PLAN |
The Company has established a qualified 401(k) savings and profit sharing plan (the Plan) for the benefit of its employees. The Company is the plan administrator and certain Company employees are trustees of the Plan. Under terms of the Plan, employees may elect to defer a portion of their compensation. The Company matches employee contributions up to a maximum of 8.75% of the employees’ compensation. The Company may also make optional additional contributions to the Plan.
| Note 9. | INTERIM BALANCE SHEET |
The balance sheet as of September 30, 2005 is unaudited. In the opinion of management, it reflects all adjustments, which were of a normal and recurring nature, necessary for a fair presentation of financial position as of September 30, 2005.
-86-
INDEPENDENT AUDITOR’S REPORT
To the Stockholders and Board of Directors
Campbell & Company, Inc.
We have audited the accompanying consolidated balance sheet of Campbell & Company, Inc. and Campbell Multi-Strategy Fund L.L.C. (collectively, the “Company”) as of December 31, 2004. This financial statement is the responsibility of the Company’s management. Our responsibility is to express an opinion on this financial statement based on our audit.
We conducted our audit in accordance with auditing standards generally accepted in the United States of America. Those standards require that we plan and perform the audit to obtain reasonable assurance about whether the consolidated balance sheet is free of material misstatement. An audit includes examining, on a test basis, evidence supporting the amounts and disclosures in the consolidated balance sheet. An audit also includes assessing the accounting principles used and significant estimates made by management, as well as evaluating the overall consolidated balance sheet presentation. We believe that our audit provides a reasonable basis for our opinion.
In our opinion, the consolidated balance sheet referred to above presents fairly, in all material respects, the financial position of Campbell & Company, Inc. and Campbell Multi-Strategy Fund, LLC as of December 31, 2004, in conformity with accounting principles generally accepted in the United States of America.
| /s/ ARTHUR F. BELL, JR. & ASSOCIATES, L.L.C. | |
Hunt Valley, Maryland
March 30, 2005
-87-
CAMPBELL & COMPANY, INC.
CONSOLIDATED BALANCE SHEET
December 31, 2004
ASSETS | ||||||||
| Current assets | ||||||||
| Cash and cash equivalents | $ | 107,848,218 | ||||||
| Unrealized gain on open futures contracts | 49,902 | |||||||
| Unrealized loss on open forwards contracts | (409,482 | ) | ||||||
| Investments in equity securities, at fair value (cost $17,128,769) | 17,160,169 | |||||||
| Accounts receivable | ||||||||
| Advisory and performance fees | 25,763,410 | |||||||
| Receivable from Campbell Strategic Allocation Fund, L.P. | 15,616,840 | |||||||
| Other receivables | 602,031 | |||||||
| Total current assets | 166,631,088 | |||||||
| Property and equipment | ||||||||
| Furniture and office equipment | 6,841,366 | |||||||
| Leasehold improvements | 638,583 | |||||||
| 7,479,949 | ||||||||
| Less accumulated depreciation and amortization | (4,448,254 | ) | ||||||
| Total property and equipment | 3,031,695 | |||||||
| Other assets | ||||||||
| Cash surrender value of life insurance, net of policy loans of $277,388 | 375,865 | |||||||
| Investments in sponsored funds | 65,213,401 | |||||||
| Other | 23,407,618 | |||||||
| Total assets | $ | 258,659,667 | ||||||
LIABILITIES | ||||||||
| Current liabilities | ||||||||
| Accounts payable and accrued expenses | $ | 68,236,886 | ||||||
| Equity securities sold short, at fair value (proceeds $16,451,898) | 17,123,153 | |||||||
| Total current liabilities | 85,360,039 | |||||||
| Subordinated debt | 140,000,000 | |||||||
| Capital stock subject to repurchase, at current redemption value | 2,034,020 | |||||||
| Total liabilities | 227,394,059 | |||||||
| Minority interest | 7,861,741 | |||||||
STOCKHOLDERS’ EQUITY | ||||||||
| Retained earnings | 23,403,867 | |||||||
| Total liabilities, minority interest and stockholders’ equity | $ | 258,659,667 | ||||||
THE INVESTOR WILL NOT RECEIVE ANY INTEREST IN THIS COMPANY.
See accompanying notes.
-88-
CAMPBELL & COMPANY, INC.
NOTES TO CONSOLIDATED BALANCE SHEET
| Note 1. | ORGANIZATION AND SUMMARY OF SIGNIFICANT ACCOUNTING POLICIES |
| A. | General |
Campbell and Company, Inc. is incorporated in Maryland and earns fees as a commodity trading advisor. Campbell Multi-Strategy Fund L.L.C. (CMSF) is a Delaware limited liability company which operates as a commodity investment pool. Campbell & Company, Inc. serves as the General Partner and trading advisor for CMSF and was the sole investor in CMSF during the period November 6, 2003 (commencement of operations) to August 31, 2004, at which time an affiliate of Campbell & Company, Inc. invested in CMSF. Campbell & Company, Inc. intends to solicit additional outside investment in CMSF and will re-assess the need to consolidate CMSF in future periods.
Both Campbell & Company, Inc. and CMSF are subject to the regulations of the Commodity Futures Trading Commission, an agency of the United States (U.S.) government, which regulates most aspects of the commodity futures industry. They are also subject to the rules of the National Futures Association, an industry self-regulatory organization, the requirements of Commodity Exchanges, Futures Commission Merchants (brokers), and interbank market makers through which they trade.
The consolidated balance sheet includes the accounts of Campbell & Company, Inc. and CMSF (collectively, the “Company”). Significant intercompany accounts and transactions have been eliminated in consolidation.
The Company’s consolidated balance sheet is presented in accordance with accounting principles generally accepted in the United States of America. The preparation of the consolidated balance sheet in conformity with accounting principles generally accepted in the United States of America requires management to make estimates and assumptions that affect the reported amounts of assets and liabilities and disclosures of contingent assets and liabilities at the date of the consolidated balance sheet. Actual results could differ from those estimates, and such differences may be material to the consolidated balance sheet.
| B. | Cash and Cash Equivalents |
Cash and cash equivalents consist of cash, commercial paper, certificates of deposit, U.S. Treasury Bills and money market mutual funds readily convertible into cash.
| C. | Revenue Recognition |
Advisory and management fees accrue monthly based on a percentage of assets under management. Performance fees may be earned by achieving defined performance objectives. Performance fees are accrued when the conditions of the applicable performance fee agreements are satisfied.
| D. | Property and Equipment |
Property and equipment are stated at cost. Depreciation and amortization is provided for over the estimated useful lives of the assets using straight-line and accelerated methods. Such lives range from 3 to 39 years.
| E. | Investments in Sponsored Funds |
Investments in sponsored funds are marked to market at their reported net asset values at the consolidated balance sheet date, in accordance with the equity method.
-89-
CAMPBELL & COMPANY, INC.
NOTES TO CONSOLIDATED BALANCE SHEET — (Continued)
| Note 1. | ORGANIZATION AND SUMMARY OF SIGNIFICANT ACCOUNTING POLICIES — (Continued) |
| F. | Deposits with Futures Broker and Foreign Exchange Dealer |
The Company deposits cash and U.S. Treasury bills with a futures broker and with a foreign exchange dealer in connection with its trading of futures and forward contracts. Gains or losses are realized when contracts are liquidated. Unrealized gains or losses on open contracts (the difference between contract purchase price and market price) are reflected in the consolidated balance sheet as a net gain or loss, as there exists a right of offset of unrealized gains or losses in accordance with Financial Accounting Standards Board Interpretation No. 39 —“Offsetting of Amounts Related to Certain Contracts”. Brokerage commissions on futures or forward contracts include other trading fees and are charged to expense when contracts are opened.
The amount of required margin and good faith deposits with the futures broker and the foreign exchange dealer usually range from 10% to 30% of net assets traded. The market value of cash and cash equivalents deposited to satisfy such requirements at December 31, 2004 was $13,468,751. This amount is included in cash and cash equivalents.
| G. | Investments in Equity Securities |
The Company deposits cash and securities with a prime broker in connection with its trading of securities
All securities are listed on an exchange and are valued at the last reported sales price on the valuation date. Security transactions are accounted for on the trade date. Realized gains and losses from security transactions are determined using the identified cost method. Brokerage commissions and other trading fees on securities transactions are reflected as an adjustment to cost or proceeds at the time of the transaction. Dividends are recorded on the ex-dividend date.
At December 31, 2004, $6,531,813 of cash was on deposit with the prime broker. This balance is included in cash and cash equivalents.
| H. | Income Taxes |
The Company has elected S corporation status under the Internal Revenue Code, pursuant to which the Company does not pay U.S. or Maryland income taxes. The Company is subject to state income taxes in certain states in which it conducts business and adequate provision for such is provided for in the consolidated balance sheet. The Company’s taxable income is taxable to the stockholders on an individual basis.
| I. | Minority Interest |
Prior to August 2004, Campbell & Company, Inc. was the sole investor in CMSF. In August 2004, an affiliate of Campbell & Company, Inc. acquired a limited partner interest in CMSF. This limited partner interest, and its proportionate share of the income from CMSF, is presented as Minority Interest in the consolidated balance sheet.
-90-
CAMPBELL & COMPANY, INC.
NOTES TO CONSOLIDATED BALANCE SHEET — (Continued)
Note 2. INVESTMENTS IN SPONSORED FUNDS
Investments in sponsored funds consist of the following as of December 31, 2004:
| Campbell Strategic Allocation Fund, L.P. | $ | 41,327,984 | |||
| Campbell Global Assets Fund Limited — Class B | 10,087,463 | ||||
| Rampant Investments, L.P. | 5,392,908 | ||||
| Campbell Long/ Short Equity Investment Fund LLC | 5,072,401 | ||||
| Campbell Alternative Asset Trust | 2,122,335 | ||||
| Campbell Financial Futures Fund Limited Partnership | 1,161,246 | ||||
| The Campbell Fund Trust | 49,064 | ||||
| Total | $ | 65,213,401 | |||
In addition to its investments in these sponsored funds, the Company has General Partner, Managing Owner, Managing Member, or Managing Operator responsibilities with regards to the following:
| Campbell Strategic Allocation Fund, L.P. |
The Company is the General Partner and trading manager of Campbell Strategic Allocation Fund, L.P. (Strategic). As General Partner, the Company receives from Strategic a monthly brokerage fee and quarterly performance fee. Such fees represented approximately 49% of the company’s revenues for the year ended December 31, 2004. Included in advisory and performance fees receivable at December 31, 2004 is approximately $10,140,870 due from Strategic for such fees.
Summarized financial information with respect to Strategic as of December 31, 2004 is as follows:
| Balance Sheet Data | ||||||
| Assets | $ | 4,099,736,011 | ||||
| Liabilities | (51,589,890 | ) | ||||
| Net Asset Value | $ | 4,048,146,121 | ||||
The Company has committed to maintaining an investment in Strategic equal to at least 1% of the net aggregate capital contributions of all partners. The Company, as General Partner, had contributed capital of $33,720,061 as of December 31, 2004 to Strategic. The Company is further bound by Strategic’s Amended Agreement of Limited Partnership to maintain net worth equal to at least 5% of the capital contributed by all the limited partnerships for which the Company acts as General Partner. The minimum net worth shall in no case be less than $50,000 nor shall net worth in excess of $1,000,000 be required.
As General Partner, the Company incurs costs in connection with Strategic’s initial and continuous offerings. The Company reflects a receivable of $2,230,619 as of December 31, 2004 from Strategic for offering costs due to be reimbursed. Such amounts are included in Receivable from Campbell Strategic Allocation Fund, L.P. in the consolidated balance sheet. The remaining unreimbursed offering costs of $423,808 as of December 31, 2004 are included in Other assets in the consolidated balance sheet. They are carried on the Company’s books as an asset because of the probable future economic benefit to be obtained from the eventual receipt from Strategic of these reimbursements, even though Strategic is not liable for this amount at the current time. The Company recognizes the newly recalculated amount due from Strategic each month as a receivable, which reduces the balance remaining as an Other asset. The Company analyzes the value of the remaining Other asset on its balance sheet on a quarterly basis to ensure that the carrying value is an accurate estimate of what the Company can expect to receive over time, and expenses any excess value on its books.
-91-
CAMPBELL & COMPANY, INC.
NOTES TO CONSOLIDATED BALANCE SHEET — (Continued)
Note 2. INVESTMENTS IN SPONSORED FUNDS — (Continued)
| Campbell Strategic Allocation Fund, L.P. — (Continued) |
The Company also pays, up-front, a 4% commission to selling agents for Strategic. The Company is then reimbursed by Strategic for this cost, over twelve months, through a brokerage fee which is based on the monthly net asset value of Strategic. As of December 31, 2004, $35,402,799 in selling agent commissions are subject to future reimbursement, of which $13,386,221 is included in Receivable from Campbell Strategic Allocation Fund, L.P. and $22,016,578 is included in Other assets in the consolidated balance sheet.
In the event Strategic terminates prior to the completion of any reimbursement of the aforementioned costs, the Company will not be entitled to any additional reimbursement from Strategic.
| Campbell Global Assets Fund Limited — Class B |
The Company is the Trading Advisor of Campbell Global Assets Fund Limited (“CGAF”), an international business company incorporated in The Bahamas. The Net Asset Value of CGAF as of December 31, 2004 totaled $885,556,930.
| Campbell Alternative Asset Trust |
The Company is the Managing Owner and trading manager of Campbell Alternative Asset Trust (“CAAT”). The Trustee of CAAT has delegated to the Managing Owner all of the power and authority to manage the business affairs of CAAT. The Net Asset Value of CAAT as of December 31, 2004 totaled $34,955,385.
The Company has committed to maintaining an investment in CAAT equal to at least 1% of the total capital accounts of CAAT. The Company’s capital account balance as of December 31, 2004 was $2,122,335. The Company is further bound by CAAT’s Third Amended and Restated Declaration of Trust and Trust Agreement to maintain net worth equal to at least $1,000,000.
As Managing Owner, the Company has agreed to advance funds to CAAT necessary to pay organization and offering costs related to CAAT’s initial and continuous offerings. The Company is reimbursed such amounts by CAAT at the rate of 0.9% per annum of CAAT’s net assets. The Company reflects a receivable of $15,483 as of December 31, 2004 from CAAT for offering costs due to be reimbursed. Such amounts is included in Other receivables in the consolidated balance sheet. The remaining unreimbursed offering costs of $364,181 as of December 31, 2004 is included in Other assets in the consolidated balance sheet. They are carried on the Company’s books as an asset because of the probable future economic benefit to be obtained from the eventual receipt from CAAT of these reimbursements, even though CAAT is not liable for this amount at the current time. In the event CAAT terminates prior to the completion of any reimbursement of the offering costs, the Company will not be entitled to any additional reimbursement from CAAT. The Company analyzes the value of the unreimbursed organization and offering costs on its consolidated balance sheet on a quarterly basis to ensure that the carrying value is an accurate estimate of what the Company can expect to receive over time, and expenses any excess value on its books.
| Rampant Investments, L.P. |
The Company acts as General Partner of Rampant Investments, L.P. (Rampant). The Net Asset Value of Rampant as of December 31, 2004 totaled $14,301,732.
-92-
CAMPBELL & COMPANY, INC.
NOTES TO CONSOLIDATED BALANCE SHEET — (Continued)
Note 2. INVESTMENTS IN SPONSORED FUNDS — (Continued)
| Campbell Long/ Short Equity Investment Fund LLC |
The Company acts as Managing Member of Campbell Long/ Short Equity Investment Fund LLC (“LSE”). The Net Asset Value of LSE as of December 31, 2004 totaled $16,201,993.
As Managing Member, the Company has agreed to advance funds to LSE necessary to pay organization and offering costs related to LSE’s initial offerings. The Company is reimbursed such amounts by LSE at the rate of .5% per annum of LSE’s month-end net assets. As of December 31, 2004, the Company had been reimbursed in full.
| Campbell Financial Futures Fund Limited Partnership |
The Company acts as General Partner of Campbell Financial Futures Fund Limited Partnership (Financial Futures). The Net Asset Value of Financial Futures as of December 31, 2004 totaled $107,619,422.
| The Campbell Fund Trust |
The Company is the Managing Operator of The Campbell Fund Trust (the Trust). The Trustee of the Trust has delegated to the Managing Operator all of the power and authority to manage the business affairs of the Trust. The Net Asset Value of the Trust as of December 31, 2004 totaled $648,451,354.
Note 3. TRADING ACTIVITIES AND RELATED RISKS
The Company and the sponsored funds for which the Company is either the sole General Partner, Co-General Partner, Managing Owner, Managing Member, or Managing Operator engage in the speculative trading of U.S. and foreign futures contracts, forward contracts and other derivative contracts (collectively, “derivatives”). The Company and the sponsored funds are exposed to both market risk, the risk arising from changes in the market value of the contracts, and credit risk, the risk of failure by another party to perform according to the terms of a contract. The Company and the sponsored funds also trade forward contracts in unregulated markets between principals and assume the risk of loss from counterparty nonperformance.
The Company and certain sponsored funds engage in the trading of securities which are typically traded on an exchange or in the over-the-counter market. The Company and such sponsored funds also sell securities not owned at the time of sale (a “short sale”). Risks arise from short sales due to the possible illiquidity of the securities markets and from potential adverse movements in security values. Theoretically, short sales expose such sponsored funds and the Company to potentially unlimited liability as the ultimate obligation to purchase a security sold short may exceed the amount recorded in its consolidated balance sheet.
The Company maintains a large portion of its cash and cash equivalents with financial institutions in connection with its trading and cash management activities. In the event of a financial institution’s insolvency, recovery of Company assets on deposit may be limited to account insurance or other protection afforded such deposits.
For derivatives, risks arise from changes in the market value of the contracts. Theoretically, the sponsored funds and the Company, as General Partner, Managing Owner, Managing Member, or Managing Operator of the sponsored funds, and as a direct investor in derivative contracts, are exposed to a market risk equal to the notional contract value of derivatives purchased and unlimited liability on derivatives sold short.
-93-
CAMPBELL & COMPANY, INC.
NOTES TO CONSOLIDATED BALANCE SHEET — (Continued)
Note 3. TRADING ACTIVITIES AND RELATED RISKS — (Continued)
The Company has established procedures to actively monitor the market risk and minimize the credit risk of such sponsored funds, although there can be no assurance that it will, in fact, succeed in doing so.
| Note 4. | GUARANTEES |
In the normal course of business, the Company enters into contracts and agreements that contain a variety of representations and warranties and which provide general indemnifications. The Company’s maximum exposure under these arrangements is unknown, as this would involve future claims that may be made against the Company that have not yet occurred. The Company expects the risk of any future obligation under these indemnifications to be remote.
| Note 5. | CAPITAL STOCK SUBJECT TO REPURCHASE |
The Company has entered into agreements with its stockholders which stipulate that upon the death or disability of a stockholder or upon the retirement or termination of a stockholder’s employment with the Company, the Company will purchase the stockholders’ capital stock at an amount equal to that shareholder’s proportionate share of ownership of the net book asset value of the Company, excluding the retained earnings of the Company accumulated over the past twelve (12) months. Such redemption value shall be determined as of the last day of the calendar quarter immediately preceding the calendar month in which the terminating event occurred. In accordance with Statement of Financial Accounting Standards No. 150,“Accounting for Certain Financial Instruments with Characteristics of both Liabilities and Equity”, the redemption value of all capital stock has been reclassified from retained earnings to liabilities (“Capital stock subject to repurchase, at current redemption value”) within the consolidated balance sheet.
Capital stock subject to repurchase at December 31, 2004 consists of:
| Capital stock | |||||
| Class A voting, no par, $100 stated value; 2,500 shares authorized; 103.425 shares issued and outstanding | $ | 10,342 | |||
| Additional paid-in capital, attributable to those shares | 45,968 | ||||
| Retained earnings, attributable to those shares | 1,977,710 | ||||
| $ | 2,034,020 | ||||
-94-
CAMPBELL & COMPANY, INC.
NOTES TO CONSOLIDATED BALANCE SHEET — (Continued)
| Note 6. | SUBORDINATED DEBT |
The Company entered into a working capital agreement with its stockholders. This agreement provides for the issuance of unsecured notes to the Company which are subordinated to any future borrowings of the Company. Interest on any notes issued in accordance with this agreement is payable annually at a rate of 12.0%. Any unpaid principal balance is due on the sixth anniversary date of the commencement date of each note, or if sooner, five years after a stockholder (a noteholder) ceases to be in the employ of the Company. At December 31, 2004, $140,000,000 was outstanding under this agreement. Under the terms of the notes, maturities by year are as follows:
| 2007 | $ | 7,393,800 | ||
| 2008 | 39,380,000 | |||
| 2009 | 32,490,000 | |||
| 2010 | 60,736,200 | |||
| $ | 140,000,000 | |||
Note 7. LEASE OBLIGATION
The Company leases office facilities under agreements which provide for minimum base annual rentals plus a proportionate share of operating expenses. The leases expire on September 30, 2010 and October 31, 2012. The Company has the option to renew the leases for an additional 60 months. Minimum base annual rentals through the original lease term are as follows:
| Year ending December 31 | ||||
| 2005 | $ | 657,142 | ||
| 2006 | 716,323 | |||
| 2007 | 730,879 | |||
| 2008 | 745,347 | |||
| 2009 | 760,318 | |||
| Thereafter | 645,448 | |||
| Total base annual rentals | $ | 4,255,457 | ||
Note 8. PROFIT SHARING PLAN
The Company has established a qualified 401(k) savings and profit sharing plan (the Plan) for the benefit of its employees. The Company is the plan administrator and certain Company employees are trustees of the Plan. Under terms of the Plan, employees may elect to defer a portion of their compensation. The Company matches employee contributions up to a maximum of 8.75% of the employees’ compensation. The Company may also make optional additional contributions to the Plan.
Note 9. SUBSEQUENT EVENT
In January 2005, the Company approved distributions to its stockholders aggregating approximately $23,400,000. Additionally, during January 2005, the stockholders agreed to make advances to the Company in accordance with the amended and restated working capital agreement aggregating up to approximately $5,000,000, to provide for additional working capital.
-95-
(This page has been left blank intentionally.)
PART TWO
STATEMENT OF ADDITIONAL INFORMATION
CAMPBELL STRATEGIC ALLOCATION FUND, L.P.
$1,305,000,000
Units of Limited Partnership Interest
This is a speculative, leveraged investment which involves the risk of loss.
Past performance is not necessarily indicative of future results.
See “The Risks You Face” and “Conflicts of Interest” in Part One.
THIS PROSPECTUS IS IN TWO PARTS: A DISCLOSURE DOCUMENT AND A STATEMENT OF ADDITIONAL INFORMATION. THESE PARTS ARE BOUND TOGETHER, AND BOTH CONTAIN IMPORTANT INFORMATION.
CAMPBELL & COMPANY, INC.
General Partner
March 24, 2006
(This page has been left blank intentionally.)
THE FUTURES, FORWARD, OPTION AND SWAP MARKETS
Futures Contracts
Futures contracts are standardized agreements traded on commodity exchanges that call for the future delivery of the commodity or financial instrument at a specified time and place. A futures trader that enters into a contract to take delivery of the underlying commodity is “long” the contract, or has “bought” the contract. A trader that is obligated to make delivery is “short” the contract or has “sold” the contract. Actual delivery on the contract rarely occurs. Futures traders usually offset (liquidate) their contract obligations by entering into equal but offsetting futures positions. For example, a trader who is long one September Treasury bond contract on the Chicago Board of Trade can offset the obligation by entering into a short position in a September Treasury bond contract on that exchange. Futures positions that have not yet been liquidated are known as “open” contracts or positions.
Futures contracts are traded on a wide variety of commodities, including agricultural products, metals, energies, livestock products, government securities, currencies and stock market indices. Options on futures contracts are also traded on U.S. and foreign commodity exchanges. The Fund concentrates its futures trading in financial instruments, such as interest rate, foreign exchange and stock index contracts, and metal and energy contracts.
Forward Contracts
Currencies and other commodities may be purchased or sold for future delivery or cash settlement through banks or dealers pursuant to forward, option or swap contracts. Currencies also can be traded pursuant to futures contracts on organized futures exchanges; however, Campbell & Company will use the dealer market in foreign exchange contracts for most of the Fund’s trading in currencies. Such dealers will act as “principals” in these transactions and will include their profit in the price quoted on the contracts. Unlike futures contracts, foreign exchange contracts are not standardized. In addition, the forward market is largely unregulated. Forward contracts are not “cleared” or guaranteed by a third party. Thus, the Fund is subject to the creditworthiness of ABN AMRO Bank N.V., Chicago Branch, Deutsche Bank AG London and The Royal Bank of Scotland PLC, the over-the-counter counterparties with whom it maintains all assets and positions relating to the Fund’s forward and option contract investments. There also is no daily settlement of unrealized gains or losses on open foreign exchange contracts as there is with futures contracts on U.S. exchanges.
Option Contracts
An option on a futures contract or on a physical commodity or currency gives the buyer of the option the right to take a position of a specified amount at a specified price in a specific underlying instrument (the “striking,” “strike” or “exercise price”). The buyer of a “call” option acquires the right to take a long position (i.e., the obligation to take delivery of a specified amount at a specified price in a specific underlying instrument). The buyer of a “put” option acquires the right to take a short position (i.e., the obligation to make delivery of a specified amount at a specified price in a specific underlying instrument).
The purchase price of an option is referred to as its “premium.” The seller (or “writer”) of an option is obligated to take a position at a specified price opposite to the option buyer if the option is exercised. Thus, the seller of a call option must stand ready to sell (take a short position in) the underlying instrument at the striking price if the buyer should exercise the option. The seller of a put option, on the other hand, must stand ready to buy (take a long position in) the underlying instrument at the striking price if the buyer should exercise the option.
A call option is said to be “in the money” if the striking price is below current market levels, and “out of the money” if the striking price is above current market levels. Conversely, a put option is said to be “in the money” if the striking price is above current market levels, and “out of the money” if the striking price is below current market levels.
Options have limited lifespans. An option that is out of the money and not offset by the time it expires becomes worthless. Options usually trade at a premium above their intrinsic value (i.e., the difference between the market price for the underlying instrument and the striking price),
-99-
because the option trader is speculating on (or hedging against) future movements in the price of the underlying instrument. As an option nears its expiration date, the market value and intrinsic value typically move into parity. The difference between an option’s intrinsic value and market value is referred to as the “time value” of the option.
Swap Transactions
The Fund periodically enters into transactions in the forward or other markets which could be characterized as swap transactions and which may involve interest rates, currencies, securities interests, commodities and other items. A swap transaction is an individually negotiated, non-standardized agreement between two parties to exchange cash flows measured by different interest rates, exchange rates, or prices, with payments calculated by reference to a principal (“notional”) amount or quantity. Transactions in these markets present risks similar to those in the futures, forward and options markets:
| (1) | the swap markets are generally not regulated by any United States or foreign governmental authorities; | |
| (2) | there are generally no limitations on daily price moves in swap transactions; | |
| (3) | speculative position limits are not applicable to swap transactions, although the counterparties with which the Fund may deal may limit the size or duration of positions available as a consequence of credit considerations; | |
| (4) | participants in the swap markets are not required to make continuous markets in swaps contracts; and | |
| (5) | the swap markets are “principal markets,” in which performance with respect to a swap contract is the responsibility only of the counterparty with which the trader has entered into a contract (or its guarantor, if any), and not of any exchange or clearinghouse. As a result, the Fund will be subject to the risk of the inability of or refusal to perform with respect to such contracts on the part of the counterparties with which the Fund trades. |
The CFTC has adopted Part 35 to its Rules which provides non-exclusive safe harbor treatment from regulations under the Commodity Exchange Act as amended for swap transactions which meet specified criteria, over which the CFTC will not exercise its jurisdiction and regulate as futures or commodity option transactions. In addition, on December 21, 2000, the Commodity Futures Modernization Act of 2000 amended the Commodity Exchange Act so that it does not apply to any agreement, contract, or transaction in a commodity, other than an agricultural commodity (including swap transactions), if the agreement, contract, or transaction is entered into only between eligible contract participants (which includes commodity pools meeting certain capitalization requirements), is subject to individual negotiation by the parties, and is not executed or traded on a trading facility. It is expected that the Fund will engage only in swap transactions for which exemptive/safe harbor relief is available to it under the CFTC policy statements or regulations, or which are otherwise excluded from the CFTC’s jurisdiction. If the Fund were restricted in its ability to trade in the swap markets, the activities of Campbell & Company, to the extent that it trades in such markets on behalf of the Fund, might be materially affected.
Regulation
The U.S. futures markets are regulated under the Commodity Exchange Act, which is administered by the CFTC, a federal agency created in 1974. The CFTC licenses and regulates commodity exchanges, commodity pool operators, commodity trading advisors and clearing firms which are referred to in the futures industry as “futures commission merchants.” Campbell & Company is licensed by the CFTC as a commodity pool operator and commodity trading advisor. Futures professionals are also regulated by the NFA, a self-regulatory organization for the futures industry that supervises the dealings between futures professionals and their customers. If its pertinent CFTC licenses or NFA memberships were to lapse, be suspended or be revoked, Campbell & Company would be unable to act as the Fund’s commodity pool operator and commodity trading advisor.
The CFTC has adopted disclosure, reporting and recordkeeping requirements for commodity pool operators and disclosure and recordkeeping
-100-
requirements for commodity trading advisors. The reporting rules require pool operators to furnish to the participants in their pools a monthly statement of account, showing the pool’s income or loss and change in net asset value, and an annual financial report, audited by an independent certified public accountant.
The CFTC and the exchanges have pervasive powers over the futures markets, including the emergency power to suspend trading and order trading for liquidation of existing positions only. The exercise of such powers could adversely affect the Fund’s trading.
The CFTC does not regulate forward contracts. Federal and state banking authorities also do not regulate forward trading or forward dealers. Trading in foreign currency forward contracts may be less liquid and the Fund’s trading results may be adversely affected.
Margin
The Fund will use margin in its trading. In order to establish and maintain a futures position, a trader must make a type of good-faith deposit with its broker, known as “margin,” of approximately 2%-10% of contract value. Minimum margins are established for each futures contract by the exchange on which the contract is traded. The exchanges alter their margin requirements from time to time, sometimes significantly. For their protection, futures brokers may require higher margins from their customers than the exchange minimums. Margin also is deposited in connection with forward contracts, but is not required by any applicable regulation.
There are two types of margin. “Initial” margin is the amount a trader is required to deposit with its broker to open a futures position. The other type of margin is “maintenance” margin. When the contract value of a trader’s futures position falls below a certain percentage, typically about 75%, of its value when the trader established the position, the trader is required to deposit additional margin in an amount equal to the loss in value.
[REMAINDER OF THIS PAGE LEFT BLANK INTENTIONALLY.]
-101-
HISTORICAL PERSPECTIVE OF MANAGED FUTURES
Managed Futures Industry Volume by Market Sector
[Amounts in Percents]
The managed futures industry market sector distributions presented above include both speculative and hedging transactions. The charts were prepared by Campbell & Company using data obtained from the Futures Industry Association. The charts show the change in market concentration from 1980 to 2005. In 1980, the agricultural sector dominated most managed futures allocations. However, by 2005, the agricultural sector made up only a small portion of the total trading volume, with financial instruments such as interest rates, stock indices and currencies representing the dominant portion of trading. A significant portion of currency trading is done in the forward rather than in the futures markets, and, accordingly, is not reflected in the foregoing chart.
Please note that the pie charts above and the bar chart below reflect the trading volume for the managed futures industry as a whole, and are not indicative of the Fund in particular.
Growth in the Managed Futures Industry
January 1980 — December 2005 (estimate)
This chart was prepared by Campbell & Company and shows the industry growth since 1980 using data obtained from Barclay Trading Group, Ltd.
-102-
INVESTMENT FACTORS
The Advantages of Non-Correlation and Diversification of Your Portfolio
The Nobel Prize for Economics in 1990 was awarded to Dr. Harry Markowitz for demonstrating that the total return can increase, and/or risk can be reduced, when portfolios have positively performing asset categories that are essentially non-correlated. Even many seemingly diverse portfolios may actually be quite correlated. For instance, over time, alternative investment classes such as real estate and international stocks and bonds may correlate closely with domestic equities as the global economy expands and contracts.
Historically, alternative investments such as managed futures funds have had very little correlation to the stock and bond markets. Campbell & Company believes that the performance of the Fund should also exhibit a substantial degree of non-correlation (not, however, necessarily negative correlation) with the performance of traditional equity and debt portfolio components, in part because of the ease of selling futures short. This feature of futures — being able to be long or short a futures position with similar ease — means that profit and loss from futures trading is not dependent upon economic or geopolitical prosperity or stability.
However, non-correlation will not provide any diversification advantages unless the non-correlated assets are outperforming other portfolio assets, and there is no guarantee that the Fund will outperform other sectors of an investor’s portfolio (or not produce losses). Additionally, although adding managed futures funds to a portfolio may provide diversification, managed futures funds are not a hedging mechanism and there is no guarantee that managed futures funds will appreciate during periods of inflation or stock and bond market declines.
Non-correlated performance should not be confused with negatively correlated performance. Non-correlation means only that the Fund’s performance will likely have no relation to the performance of equity and debt instruments, reflecting Campbell & Company’s belief that factors that affect equity and debt prices may affect the Fund differently and that certain factors which affect the former may not affect the latter. The net asset value per unit may decline or increase more or less than equity and debt instruments during both rising and falling markets. Campbell & Company has no expectation that the Fund’s performance will be negatively correlated to the general debt and equity markets,i.e., likely to be profitable when the latter are unprofitable or vice versa.
Advantages of Managed Futures Fund Investments
Both the futures, forward, option and swap markets and funds investing in those markets offer many structural advantages that make managed futures an efficient way to participate in global markets.
Profit or Loss Potential
Futures and related contracts can easily be leveraged, which magnifies the potential profit or loss.
100% Interest Credit
Unlike some other alternative investment funds, the Fund does not borrow money in order to obtain leverage, so the Fund does not incur any interest expense. Rather, the Fund’s margin deposits are maintained in cash and cash equivalents, such as U.S. Treasury bills, and the Fund earns interest on 100% of the Fund’s available assets, which include unrealized profits credited to the Fund’s accounts held at the futures brokers.
Global Diversification Within a Single Investment
Futures and related contracts can be traded in many countries, which makes it possible to diversify risk around the world. This diversification is available both geographically and across market sectors. For example, an investor can trade interest rates, stock indices and currencies in several countries around the world, as well as energy and metals. While the Fund itself trades across a diverse selection of global markets, an investment in the Fund is not a substitute for overall portfolio diversification.
Ability to Profit or Lose in a Rising or Falling Market Environment
The Fund can establish short positions and thereby profit from declining markets as easily as it can establish long positions. This potential to
-103-
make or lose money, whether markets are rising or falling around the world, makes managed futures particularly attractive to sophisticated investors. Of course, if markets go higher while the Fund has a short position, the Fund will lose money until the short position is exited and vice versa.
Professional Trading
Campbell & Company is one of the world’s largest and most experienced futures trading advisors. Campbell & Company’s approach includes the following elements:
| • | Disciplined Money Management.Campbell & Company generally allocates between 1% and 5% of portfolio equity to any single market position. However, no guarantee is provided that losses will be limited to these percentages. | |
| • | Balanced Risk.Campbell & Company allocates the Fund’s capital to approximately 50 markets around the world 24 hours a day. Among the factors considered for determining the portfolio mix are market volatility, liquidity and trending characteristics. | |
| • | Capital Management.When proprietary risk/ reward indicators reach predetermined levels, Campbell & Company may increase or decrease commitments in certain markets in an attempt to reduce performance volatility. | |
| • | Multiple Systems.Campbell & Company utilizes a multi-system trading strategy on behalf of the Fund that divides capital among different trading systems in an attempt to reduce performance volatility and manage risk. |
Campbell & Company receives up to an 8% brokerage fee (of which 3% is retained) and a 20% performance fee in exchange for these services.
Convenience
Through the Fund, investors can participate in global markets and opportunities without needing to master complex trading strategies and monitor multiple international markets.
Liquidity
In most cases, the underlying markets have sufficient liquidity. Some markets trade 24 hours a day when global markets are open. While there can be cases where there may be no buyer or seller for a particular contract, the Fund tries to select markets for investment based upon, among other things, their perceived liquidity. However, unexpected market illiquidity has caused major losses in recent years in such sectors as emerging markets and mortgage-backed securities. There can be no assurance that the same will not happen to the Fund at any time or from time to time. Some exchanges impose limits on the amount that a futures price can move in one day. Situations in which markets have moved the price limit for several days in a row have not been common, but do occur. See “The Risks You Face — Market Risks — Your Investment Could be Illiquid.”
Generally, investors may redeem all or a portion of their units on a monthly basis, subject to a declining redemption fee during the first year. See “Distributions and Redemptions.”
Limited Liability
Investors’ liability is limited to the value of their investment in the Fund and no investor will be required to contribute additional capital to the Fund. The Fund will cease trading and Campbell & Company will declare a special redemption period if the net asset value per unit as of the end of any business day declines by 50% or more from either the prior year-end or prior month-end unit value.
[REMAINDER OF THIS PAGE LEFT BLANK INTENTIONALLY.]
-104-
VALUE OF DIVERSIFICATION — MANAGED FUTURES INDUSTRY
PAST PERFORMANCE IS NOT NECESSARILY INDICATIVE OF FUTURE RESULTS.
Historical Correlation
The chart below shows the historical correlation of the monthly returns of the NASDAQ Composite Index, Europe, Australasia, Far East (EAFE) Index, Lehman Brothers Government Bond Index and CISDM CPO Asset Weighted Index with that of the S&P 500 Index. Note that stocks associated with the NASDAQ and EAFE indices, as well as bonds, have historically had a higher correlation with the S&P 500 Index than managed futures investments, as represented by the CISDM CPO Asset Weighted Index. This low correlation shows that managed futures have a tendency to behave somewhat independently from stocks.
Historical Correlation of Monthly Returns
with the S&P 500 Index
January 1980* — December 2005
| * | CISDM data was not available prior to 1980. |
This chart was prepared by Campbell & Company. See the glossary following this section for information integral to this chart.
-105-
VALUE OF DIVERSIFICATION — MANAGED FUTURES INDUSTRY — (Continued)
PAST PERFORMANCE IS NOT NECESSARILY INDICATIVE OF FUTURE RESULTS.
Volatility (Risk) Comparison
A common measure of risk is standard deviation, which measures the variability of returns around the average return for that particular investment. Generally, the higher the standard deviation, the higher the volatility. Shown below are three comparisons of volatility: overall, upside and downside.
Overall volatility is the most common measure of volatility or risk. Upside volatility measures the volatility of only the profitable months. Downside volatility measures the volatility of only the unprofitable months. Investors are typically more concerned with downside volatility, which is perhaps a better historical indication of the risk of actually losing money. As can be seen from the chart, managed futures investments, as represented by the CISDM CPO Asset Weighted Index, have shown comparable upside volatility and less downside volatility than the other benchmarks with the exception of bonds. There is no guarantee that historical volatility levels will persist into the future, nor is this representative of future returns through an investment in the Fund.
Standard Deviation of Monthly Returns
January 1980* — December 2005
| * | CISDM data was not available prior to 1980. |
This chart was prepared by Campbell & Company. See the glossary following this section for information integral to this chart.
-106-
VALUE OF DIVERSIFICATION — MANAGED FUTURES INDUSTRY — (Continued)
PAST PERFORMANCE IS NOT NECESSARILY INDICATIVE OF FUTURE RESULTS.
Risk Perspective
The proper evaluation of any investment must include an assessment of the risk which must be taken to achieve the prospective return. Another measure of risk, in addition to standard deviation, is historical worst decline, or largest draw-down. In other words, if you had purchased an investment at a month-end peak in performance and then subsequently sold at the lowest month-end price thereafter, the worst decline would be the largest percentage loss experienced. The chart below shows the worst cumulative monthly decline in the Lehman Brothers Government Bond Index, CISDM CPO Asset Weighted Index, S&P 500 Index, EAFE Index and NASDAQ Composite Index since 1980. The CISDM CPO Asset Weighted Index experienced a smaller peak to valley decline than three of the other indices. This does not imply that managed futures are necessarily safer than the benchmarks compared; it is merely intended to put risk in a historical perspective.
Worst Declines
January 1980* — December 2005
| * | CISDM data was not available prior to 1980. |
This chart was prepared by Campbell & Company. See the glossary following this section for information integral to this chart.
-107-
VALUE OF DIVERSIFICATION — MANAGED FUTURES INDUSTRY — (Continued)
PAST PERFORMANCE IS NOT NECESSARILY INDICATIVE OF FUTURE RESULTS.
Managed Futures vs. Stocks During Draw-downs
The following charts show the comparison between the performance of managed futures and stocks during the five worst declines for each since 1980. These charts demonstrate the historical non-correlation between these two asset classes over the stated time periods. The managed futures portion is represented by the CISDM CPO Asset Weighted Index and the stocks portion is represented by the S&P 500 Index.
Managed Futures vs. Stocks During Managed Futures Draw-downs
January 1980* — December 2005
Managed Futures vs. Stocks During Stock Draw-downs
January 1980* — December 2005
| * | CISDM data was not available prior to 1980. |
These charts were prepared by Campbell & Company. See the glossary following this section for information integral to these charts.
-108-
VALUE OF DIVERSIFICATION — CAMPBELL STRATEGIC ALLOCATION FUND
PAST PERFORMANCE IS NOT NECESSARILY INDICATIVE OF FUTURE RESULTS.
The Effect of Adding Campbell Strategic Allocation Fund
The chart below demonstrates the potential benefit of incorporating Campbell Strategic Allocation Fund into a balanced investment portfolio of stocks and bonds. As the chart shows, a portfolio consisting of 10% Campbell Strategic Allocation Fund, 55% stocks and 35% bonds would have produced marginally higher returns with a slightly lower standard deviation, one measure of risk, than a 60% stock and 40% bond portfolio.
Prospective investors must be aware that this hypothetical analysis is dependent on periods in which the Fund outperforms other asset classes in the portfolio. There can be no assurance that the Fund will outperform the other asset classes during any particular time period. This chart does not constitute a recommendation that anyone invest more than 10% of his or her net worth, which is the maximum investment permitted in the Fund.
The Effect of Adding Campbell Strategic Allocation Fund
to a Hypothetical Portfolio Consisting of Stocks and Bonds
April 1994 — December 2005
This chart, prepared by Campbell & Company, contains historical trading results hypothetically blended. The stocks are represented by the S&P 500 Index and the bonds are represented by the Lehman Brothers Government Bond Index.
See the glossary following this section for information integral to this chart.
HYPOTHETICAL PERFORMANCE RESULTS HAVE MANY INHERENT LIMITATIONS, SOME OF WHICH ARE DESCRIBED BELOW. NO REPRESENTATION IS BEING MADE THAT ANY ACCOUNT WILL OR IS LIKELY TO ACHIEVE PROFITS OR LOSSES SIMILAR TO THOSE SHOWN. IN FACT, THERE ARE FREQUENTLY SHARP DIFFERENCES BETWEEN HYPOTHETICAL PERFORMANCE RESULTS AND THE ACTUAL RESULTS SUBSEQUENTLY ACHIEVED BY ANY PARTICULAR TRADING PROGRAM.
ONE OF THE LIMITATIONS OF HYPOTHETICAL PERFORMANCE RESULTS IS THAT THEY ARE GENERALLY PREPARED WITH THE BENEFIT OF HINDSIGHT. IN ADDITION, HYPOTHETICAL TRADING DOES NOT INVOLVE FINANCIAL RISK, AND NO HYPOTHETICAL TRADING RECORD CAN COMPLETELY ACCOUNT FOR THE IMPACT OF FINANCIAL RISK IN ACTUAL TRADING. FOR EXAMPLE, THE ABILITY TO WITHSTAND LOSSES OR TO ADHERE TO A PARTICULAR TRADING PROGRAM IN SPITE OF TRADING LOSSES ARE MATERIAL POINTS WHICH CAN ALSO ADVERSELY AFFECT ACTUAL TRADING RESULTS. THERE ARE NUMEROUS OTHER FACTORS RELATED TO THE MARKETS IN GENERAL OR TO THE IMPLEMENTATION OF ANY SPECIFIC TRADING PROGRAM WHICH CANNOT BE FULLY ACCOUNTED FOR IN THE PREPARATION OF HYPOTHETICAL PERFORMANCE RESULTS AND ALL OF WHICH CAN ADVERSELY AFFECT ACTUAL TRADING RESULTS.
-109-
VALUE OF DIVERSIFICATION — CAMPBELL STRATEGIC ALLOCATION FUND — (Continued)
PAST PERFORMANCE IS NOT NECESSARILY INDICATIVE OF FUTURE RESULTS.
Correlation of Monthly Returns
The more similarly two markets behave, the higher their correlation. Generally, asset allocation models attempt to reduce overall portfolio volatility by combining instruments that behave differently from one another. The first chart shows the correlation between the Fund and various stock, bond and managed futures indices. The second chart shows the correlation between the S&P 500 Index and the same indices. The first chart uses the Fund as the benchmark for comparison, while the second chart uses the S&P 500 Index as the benchmark against which the others are correlated.
Historical Correlation of Monthly Returns with Campbell Strategic Allocation Fund
April 1994 — December 2005
Historical Correlation of Monthly Returns with the S&P 500 Index
April 1994 — December 2005
These charts were prepared by Campbell & Company. See the glossary following this section for information integral to these charts.
-110-
VALUE OF DIVERSIFICATION — CAMPBELL STRATEGIC ALLOCATION FUND — (Continued)
PAST PERFORMANCE IS NOT NECESSARILY INDICATIVE OF FUTURE RESULTS.
Correlation Analysis
These charts show that, historically, the Fund’s returns are not negatively correlated with stocks and bonds, but rather non-correlated, and therefore perform independently from stocks and bonds. As displayed below, in a small percentage of time, the Fund and stocks and bonds have experienced losses simultaneously. In a larger percentage of time, the Fund has had positive returns during periods when stocks and bonds were also experiencing positive performance. However, in 39% or more of the 141 months represented in these charts, the performance of the Fund and stocks and bonds have moved in opposite directions.
Correlation Analysis Between Campbell Strategic Allocation Fund
and S&P 500 Index
April 1994 — December 2005

Correlation Analysis Between Campbell Strategic Allocation Fund
and Lehman Brothers Government Bond Index
April 1994 — December 2005
[Amounts in Percents]
These charts were prepared by Campbell & Company. See the glossary following this section for information integral to these charts.
-111-
VALUE OF DIVERSIFICATION — CAMPBELL STRATEGIC ALLOCATION FUND — (Continued)
PAST PERFORMANCE IS NOT NECESSARILY INDICATIVE OF FUTURE RESULTS.
Volatility (Risk) Comparison (April 1994 — December 2005)
A common measure of risk is standard deviation, which measures the variability of returns around the average return for that specific investment. Generally, the higher the standard deviation, the higher the volatility or risk. A comparison of overall volatility (measured by standard deviation) of monthly returns for the Lehman Brothers Government Bond Index, the Fund, EAFE Index, S&P 500 Index and NASDAQ Composite Index is shown in the first chart below. Past performance is not necessarily indicative of future results, and there is no guarantee that historical volatility levels will persist into the future. Upside volatility measures the volatility of only the profitable months. Downside volatility measures the volatility of only the unprofitable months. Investors are typically more concerned with downside volatility, which is perhaps a better historical indicator of the risk of actually losing money. The second chart compares the upside volatility for the Lehman Brothers Government Bond Index, the Fund, the EAFE Index, the S&P 500 Index and the NASDAQ Composite Index. The third chart compares the downside volatility for the Fund and the same indices. Once again, there is no guarantee that historical volatility levels will persist into the future.
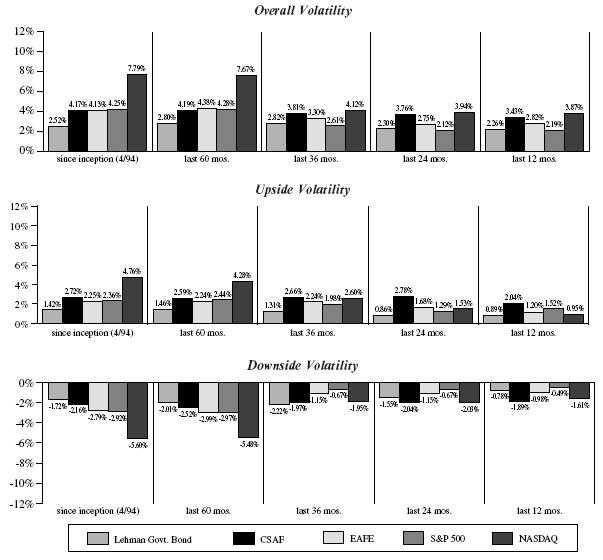
These charts were prepared by Campbell & Company. See the glossary following this section for information integral to these charts.
-112-
VALUE OF DIVERSIFICATION — CAMPBELL STRATEGIC ALLOCATION FUND — (Continued)
PAST PERFORMANCE IS NOT NECESSARILY INDICATIVE OF FUTURE RESULTS.
Risk Perspective
The proper evaluation of any investment must include an assessment of the risk which must be taken to achieve the prospective return. Another measure of risk, in addition to standard deviation, is historical worst decline, or largest draw-down. In other words, if you had purchased an investment at a month-end peak in performance and then subsequently sold at the lowest month-end price thereafter, the worst decline would be the largest percentage loss experienced. The chart below shows the worst cumulative monthly decline in the Lehman Brothers Government Bond Index, the EAFE Index, S&P 500 Index, the NASDAQ Composite Index and the Fund since the Fund’s inception in 1994.
Worst Declines
April 1994 — December 2005
This chart was prepared by Campbell & Company. See the glossary following this section for information integral to this chart.
-113-
VALUE OF DIVERSIFICATION — CAMPBELL STRATEGIC ALLOCATION FUND — (Continued)
PAST PERFORMANCE IS NOT NECESSARILY INDICATIVE OF FUTURE RESULTS.
The Periodic Table of Index Returns
The table below charts the annual rates of returns for various indices or asset categories and illustrates that all sectors behave differently from year to year. An index or asset category that is ranked at the top one year may be ranked toward the bottom in subsequent years. The Fund is intended to be a medium- to long-term investment. No one can predict which sectors are likely to outperform the others during any specific period in the future.
| 1994* | 1995 | 1996 | 1997 | 1998 | 1999 | 2000 | 2001 | 2002 | 2003 | 2004 | 2005 | |||||||||||
| DJIA | NAS | CSAF | S&P | NAS | NAS | LBBI | CISDM | LBBI | NAS | EAFE | EAFE | |||||||||||
| 5.47% | 39.92% | 30.46% | 33.38% | 39.62% | 84.55% | 20.11% | 7.52% | 16.31% | 50.01% | 17.60% | 10.85% | |||||||||||
| S&P | S&P | DJIA | DJIA | S&P | EAFE | CSAF | LBBI | CSAF | EAFE | S&P | CSAF | |||||||||||
| 5.31% | 37.59% | 26.01% | 22.65% | 28.58% | 25.26% | 10.70% | 5.34% | 13.12% | 35.27% | 10.87% | 9.53% | |||||||||||
| EAFE | DJIA | S&P | NAS | EAFE | DJIA | CISDM | CSAF | CISDM | S&P | NAS | LBBI | |||||||||||
| 3.00% | 33.44% | 22.96% | 21.64% | 18.24% | 25.19% | 9.37% | 2.91% | 11.99% | 28.69% | 8.60% | 6.80% | |||||||||||
| NAS | LBBI | NAS | LBBI | DJIA | S&P | DJIA | DJIA | DJIA | DJIA | LBBI | S&P | |||||||||||
| 1.15% | 30.73% | 22.70% | 14.91% | 16.10% | 21.04% | -6.15% | -7.77% | -16.14% | 25.34% | 7.97% | 4.89% | |||||||||||
| CISDM | CSAF | CISDM | CSAF | CSAF | CSAF | S&P | S&P | EAFE | CSAF | CASF | CISDM | |||||||||||
| 0.97% | 9.99% | 11.89% | 14.31% | 14.60% | 4.45% | -9.09% | -11.87% | -17.52% | 17.68% | 4.35% | 3.96% | |||||||||||
| LBBI | CISDM | EAFE | CISDM | LBBI | CISDM | EAFE | NAS | S&P | CISDM | CISDM | NAS | |||||||||||
| -1.14% | 9.66% | 4.38% | 9.49% | 13.48% | 1.48% | -15.20% | -21.04% | -22.10% | 12.17% | 3.22% | 1.38% | |||||||||||
| CSAF | EAFE | LBBI | EAFE | CISDM | LBBI | NAS | EAFE | NAS | LBBI | DJIA | DJIA | |||||||||||
| -11.62% | 9.42% | -0.76% | 0.24% | 6.81% | -8.71% | -39.28% | -22.61% | -31.52% | 2.06% | 3.14% | -0.63% | |||||||||||
CISDM = CISDM CPO Asset Weighted Index
CSAF = Campbell Strategic Allocation Fund, L.P.
DJIA = Dow Jones Industrial Average
EAFE = Europe, Australasia, Far East Index
LBBI = Lehman Brothers Government Bond Index
NAS = NASDAQ Composite Index
S&P = S&P 500 Index
* April - December 1994
This table was prepared by Campbell & Company. See the glossary following this section for information integral to this table.
-114-
VALUE OF DIVERSIFICATION — CAMPBELL STRATEGIC ALLOCATION FUND — (Continued)
PAST PERFORMANCE IS NOT NECESSARILY INDICATIVE OF FUTURE RESULTS.
Past Consistency of the Campbell Strategic Allocation Fund
Campbell & Company believes that this investment should be considered as a medium- to long-term investment and should not be purchased with the intent to redeem the investment within the first three years. The benefits of this philosophy are illustrated by the table shown below.
On a monthly basis, 58.87% of all months have been profitable with an average rate of return of 3.66% and 41.13% were unprofitable with an average rate of return of -3.12%.
Consider the investment time horizon when compared to the profitability of the Fund’s performance over time. This clearly demonstrates that an investment held for any two, three or five year rolling window would have been profitable every period, or 100% of the time, whereas a shorter time horizon, such as twelve month windows, produced profitability in 88.46% of the time periods.
On a historical basis this demonstrates that for the Campbell Strategic Allocation Fund, the longer the investment time horizon, the greater the probability of positive returns. Performance can be volatile. The net asset value per unit has fluctuated in a single month by as much as 12%. This table should in no way be considered an assurance of profitability if the investment is held for at least two, three or five years.
Campbell Strategic Allocation Fund
April 1994 — December 2005
| April 1994 – December | Number of | Number | Number | Percentage | ||||||||||||
| 2005 | Time Periods | Profitable | Unprofitable | Profitable | ||||||||||||
Total Months | 141 | 83 | 58 | 58.87 | % | |||||||||||
Total Years* | 12 | 11 | 1 | 91.67 | % | |||||||||||
12-Month Rolling Windows | 130 | 115 | 15 | 88.46 | % | |||||||||||
24-Month Rolling Windows | 118 | 118 | 0 | 100.00 | % | |||||||||||
36-Month Rolling Windows | 106 | 106 | 0 | 100.00 | % | |||||||||||
60-Month Rolling Windows | 82 | 82 | 0 | 100.00 | % | |||||||||||
* For the period April 1994 – December 2005. April 1994 to December 1994 is considered one year.
This table was prepared by Campbell & Company. See the glossary following this section for information integral to this table.
-115-
VALUE OF DIVERSIFICATION — CAMPBELL STRATEGIC ALLOCATION FUND — (Continued)
PAST PERFORMANCE IS NOT NECESSARILY INDICATIVE OF FUTURE RESULTS.
Performance History (ending December 2005)
The charts below illustrate how the Campbell Strategic Allocation Fund has performed relative to various stock and bond indices over the past one, five and ten year time periods.
These charts were prepared by Campbell & Company. See the glossary following this section for information integral to these charts.
-116-
VALUE OF DIVERSIFICATION — CAMPBELL STRATEGIC ALLOCATION FUND — (Continued)
PAST PERFORMANCE IS NOT NECESSARILY INDICATIVE OF FUTURE RESULTS.
Performance Statistics
This table compares various performance statistics for the Campbell Strategic Allocation Fund, the S&P 500 Index, the EAFE Index, the NASDAQ Composite Index and the Lehman Brothers Government Bond Index through December 2005.
Performance Statistics
Through December 2005
| Lehman Bros. | ||||||||||||||||||||||
| Campbell | S&P 500 | EAFE | NASDAQ | Govt. Bond | ||||||||||||||||||
| Performance Statistics Through December 2005 | Strategic | Index | Index | Index | Index | |||||||||||||||||
Rate-of-Return: | December 2005 | -3.16% | 0.03% | 4.61% | -1.23% | 2.42% | ||||||||||||||||
| Year-To-Date | 9.53% | 4.89% | 10.85% | 1.38% | 6.80% | |||||||||||||||||
Compounded Annual Rate-of-Return: | 12-Month | 9.53% | 4.89% | 10.85% | 1.38% | 6.80% | ||||||||||||||||
(Average Annual Rate-of-Return) | 36-Month | 10.38% | 14.39% | 20.81% | 18.21% | 5.58% | ||||||||||||||||
| 60-Month | 9.38% | 0.54% | 2.39% | -2.24% | 7.59% | |||||||||||||||||
| Since Inception (4/94) | 9.82% | 11.13% | 4.45% | 9.65% | 8.63% | |||||||||||||||||
Cumulative Return: | 12-Month | 9.53% | 4.89% | 10.85% | 1.38% | 6.80% | ||||||||||||||||
(Total Return) | 36-Month | 34.50% | 49.66% | 76.34% | 65.16% | 17.69% | ||||||||||||||||
| 60-Month | 56.57% | 2.75% | 12.56% | -10.69% | 44.19% | |||||||||||||||||
| Since Inception (4/94) | 200.74% | 245.45% | 66.70% | 195.16% | 164.38% | |||||||||||||||||
Annualized Standard Deviation of Monthly | 12-Month | 11.87% | 7.58% | 9.78% | 13.41% | 7.81% | ||||||||||||||||
Returns (measures the dispersion of returns around the mean or average return): | 36-Month | 13.21% | 9.04% | 11.44% | 14.28% | 9.78% | ||||||||||||||||
| 60-Month | 14.52% | 14.82% | 15.19% | 26.58% | 9.68% | |||||||||||||||||
| Since Inception (4/94) | 14.45% | 14.74% | 14.32% | 26.97% | 8.74% | |||||||||||||||||
Worst Decline: | Last 60 Months | -15.68% | -44.73% | -50.65% | -75.03% | -10.20% | ||||||||||||||||
| Duration of Decline | 10/01 - 4/02 | 8/00 - 9/02 | 12/99 - 3/03 | 2/00 - 9/02 | 5/03 - 7/03 | |||||||||||||||||
| Last 120 Months | -15.68% | -44.73% | -50.65% | -75.03% | -10.20% | |||||||||||||||||
| Duration of Decline | 10/01 -4/02 | 8/00 - 9/02 | 12/99 - 3/03 | 2/00 - 9/02 | 5/03 - 7/03 | |||||||||||||||||
| Since Inception (4/94) | -18.02% | -44.73% | -50.65% | -75.03% | -10.20% | |||||||||||||||||
| Duration of Decline | 6/94 - 1/95 | 8/00 - 9/02 | 12/99 - 3/03 | 2/00 - 9/02 | 5/03 - 7/03 | |||||||||||||||||
Correlation With S&P 500: | Last 60 Months | -0.33 | 1.00 | 0.86 | 0.91 | -0.39 | ||||||||||||||||
Correlation During S&P 500 Positive Months: | Last 60 Months | -0.38 | 1.00 | 0.71 | 0.80 | -0.28 | ||||||||||||||||
Correlation During S&P 500 Negative Months: | Last 60 Months | -0.43 | 1.00 | 0.77 | 0.80 | -0.22 | ||||||||||||||||
This table was prepared by Campbell & Company. See the glossary following this section for information integral to this table.
-117-
SUPPLEMENTAL PERFORMANCE
PAST PERFORMANCE IS NOT NECESSARILY INDICATIVE OF FUTURE RESULTS.
Campbell Strategic Allocation Fund
This chart shows the value of an initial $100,000 investment in the Fund from inception through December 2005.
Worst Monthly Percentage Draw-down(1): November 2001/10.14%
Worst Peak-to-Valley Draw-down(1): June 1994 — January 1995/18.02%
Campbell Strategic Allocation Fund
Value of Initial $100,000 Investment
April 1994 — December 2005

| Rate of Return(2) | ||||||||||||||||||||||||||||||||||||||||||||||||
| (Computed on a compounded monthly basis) | ||||||||||||||||||||||||||||||||||||||||||||||||
| Month | 2005 | 2004 | 2003 | 2002 | 2001 | 2000 | 1999 | 1998 | 1997 | 1996 | 1995 | 1994 | ||||||||||||||||||||||||||||||||||||
| January | -2.22% | 1.85% | 7.74% | -0.98% | -1.30% | 3.53% | -5.02% | 2.74% | 4.52% | 5.79% | -4.67% | |||||||||||||||||||||||||||||||||||||
| February | -1.32% | 10.65% | 7.46% | -2.27% | 0.11% | -0.60% | 1.67% | -2.81% | 2.03% | -5.97% | 4.21% | |||||||||||||||||||||||||||||||||||||
| March | -0.07% | 0.83% | -4.52% | -1.81% | 7.02% | -2.67% | 0.46% | 4.68% | -2.47% | 4.72% | 8.77% | |||||||||||||||||||||||||||||||||||||
| April | 0.40% | -6.84% | 2.51% | -4.57% | -8.42% | -1.80% | 5.33% | -6.69% | -3.60% | 3.59% | 1.13% | 0.16% | ||||||||||||||||||||||||||||||||||||
| May | 4.86% | -0.61% | 1.89% | 3.88% | 0.95% | 2.15% | -3.69% | 4.07% | -2.92% | -2.18% | -0.84% | -2.42% | ||||||||||||||||||||||||||||||||||||
| June | 6.54% | -3.30% | -0.94% | 7.74% | -1.98% | 1.87% | 4.81% | 1.29% | 2.48% | 0.75% | -1.77% | 5.15% | ||||||||||||||||||||||||||||||||||||
| July | 0.90% | -0.73% | -4.85% | 7.78% | 1.15% | -2.07% | -0.32% | -4.00% | 9.12% | -0.78% | -3.82% | -3.94% | ||||||||||||||||||||||||||||||||||||
| August | -5.68% | -1.37% | 2.23% | 3.33% | 1.94% | 2.82% | 0.82% | 9.48% | -5.69% | 1.84% | 5.47% | -3.89% | ||||||||||||||||||||||||||||||||||||
| September | 3.59% | -1.78% | -1.72% | 3.62% | 6.66% | -3.71% | 1.36% | 2.47% | 4.51% | 1.77% | -3.93% | 5.20% | ||||||||||||||||||||||||||||||||||||
| October | 3.97% | 2.16% | 2.63% | -4.98% | 5.01% | 2.88% | -4.31% | 3.97% | 1.83% | 12.44% | 0.79% | -0.14% | ||||||||||||||||||||||||||||||||||||
| November | 2.02% | 3.78% | 0.71% | -1.61% | -10.14% | 6.25% | 0.58% | -0.75% | 0.17% | 11.00% | -0.15% | -6.67% | ||||||||||||||||||||||||||||||||||||
| December | -3.16% | 0.59% | 4.14% | 3.31% | 3.49% | 2.05% | 3.29% | 0.30% | 4.46% | -4.41% | 5.35% | -4.98% | ||||||||||||||||||||||||||||||||||||
| Total | 9.53% | 4.35% | 17.68% | 13.12% | 2.91% | 10.70% | 4.45% | 14.60% | 14.31% | 30.46% | 9.99% | -11.62% | ||||||||||||||||||||||||||||||||||||
| (1) | “Draw-down” means losses experienced by the Fund over a specified period. |
| (2) | The “Rate of Return” for a period is calculated by dividing the net profit or loss by the assets at the beginning of such period. Additions and withdrawals occurring during the period are included as an addition to or deduction from beginning net assets in the calculations of “Rates of Return.” |
These charts were prepared by Campbell & Company. The performance of the Fund does not reflect the performance of all investors in the Fund. See the glossary following this section for information integral to these charts.
-118-
SUPPLEMENTAL PERFORMANCE — (Continued)
PAST PERFORMANCE IS NOT NECESSARILY INDICATIVE OF FUTURE RESULTS.
Campbell Strategic Allocation Fund — (Continued)
| Compounded Annual Rates of Return | ||||
| April 1994 — December 2005 | ||||
| 12-month | 9.53 | % | ||
| 24-month | 6.91 | % | ||
| 36-month | 10.38 | % | ||
| Since Inception | 9.82 | % | ||
| Statistics | ||||
| 4/94 – 12/05 | ||||
| Compounded Monthly Annual Rate of Return | 9.82 | % | ||
| Average Monthly Rate of Return | 0.87 | % | ||
| Standard Deviation of Monthly Returns | 4.17 | % | ||
| Annualized Standard Deviation | 14.45 | % | ||
| Sharpe Ratio | 0.41 | |||
| Average Monthly Gain | 3.66 | % | ||
| Average Monthly Loss | -3.12 | % | ||
| Number of Profitable Months | 83 | |||
| Number of Unprofitable Months | 58 | |||
| Average Duration of Decline (Months) | 2.21 | |||
| Average Recovery Period (Months) | 3.00 | |||
This table shows the magnitude of the five largest declines for the Campbell Strategic Allocation Fund since inception. The table also shows the duration of the declines, the subsequent recovery period and the Fund’s return over the following 12-month period.
| Recovery | Return for Following | |||||||||||||||
| Period | Decline | Length | Period | 12-Month Period | ||||||||||||
| 6/94 – 1/95 | 18.02 | % | 7 mos. | 12 mos. | 22.05 | % | ||||||||||
| 10/01 – 4/02 | 15.68 | % | 6 mos. | 3 mos. | 41.36 | % | ||||||||||
| 3/04 – 9/04 | 13.90 | % | 6 mos. | 10 mos. | 13.72 | % | ||||||||||
| 3/01 – 6/01 | 9.38 | % | 3 mos. | 4 mos. | 9.00 | % | ||||||||||
| 2/97 – 5/97 | 8.73 | % | 3 mos. | 2 mos. | 19.21 | % | ||||||||||
These tables were prepared by Campbell & Company. The performance of the Fund does not reflect the performance of all investors in the Fund. See the glossary following this section for information integral to these tables.
-119-
SUPPLEMENTAL PERFORMANCE — (Continued)
PAST PERFORMANCE IS NOT NECESSARILY INDICATIVE OF FUTURE RESULTS.
GLOSSARY OF TERMS
Bonds
Lehman Brothers Government Bond Index*
Composed of bonds that are investment grade (as rated by Moody’s or Standard & Poor’s). Issues must have at least one year to maturity. Total return comprises price appreciation/depreciation and income as a percentage of the original investment. This index is rebalanced monthly by market capitalization.
Managed Futures
Campbell Strategic Allocation Fund, L.P.
The Fund, which began trading in April 1994, is an actively managed account with speculative trading profits as its objective. Performance information for the Fund is net of all fees and commissions.
Center for International Securities and Derivatives Markets CPO Asset Weighted Index (CISDM)
The CISDM Index is a dollar weighted index that includes the performance of current as well as retired public futures funds, private pools and offshore funds that have the objective of speculative trading profits. The CISDM Index is utilized as a broad measure of overall managed futures returns, as compared to other indices that measure the overall returns of stocks and bonds as separate asset classes. The CISDM Index is not the same as an investment in the Fund, and the Fund may perform quite differently than the Index, just as an individual stock may perform quite differently from the S&P 500 Index. Investors cannot invest in this index.
Stocks
Dow Jones Industrial Average*
A price weighted average of 30 stocks selected by Dow Jones & Company. Because it is price weighted (as opposed to capitalization weighted) the stocks in the Index with the highest prices have the biggest effect on the performance of the Index.
Morgan Stanley Capital International Europe, Australasia, Far East Index (EAFE)*
A cap weighted index that is designed to measure the investment returns of developed economies outside of North America. The Index includes publicly traded stocks from 21 countries that are divided into industry groups and then representative stocks are selected from each industry group. In addition, cross-ownership is tracked to ensure that the market weight given each company is accurate.
NASDAQ Composite Index*
Measures all NASDAQ domestic and non-U.S. based common stocks listed on the NASDAQ Stock Market (currently over 5,000 companies). The Index is market-value weighted. This means that each company’s security affects the Index in proportion to its market value. The market value, the last sale price multiplied by total shares outstanding, is calculated throughout the trading day, and is related to the total value of the Index.
Standard & Poor’s 500 Composite Stock Index (S&P 500)*
The 500 stocks in the S&P 500 are chosen by Standard and Poor’s based on industry representation, liquidity and stability. The stocks in the S&P 500 are not the 500 largest companies, rather the Index is designed to capture the returns of many different sectors of the U.S. economy. This is the only index that includes dividends reinvested.
| * | Passive, unmanaged indices of equity and debt securities generally purchased by investors with an investment objective of capital preservation, growth or income. Investors cannot invest in an index; performance of any of these indices (which, by definition, are averages of many individual investments) may not be representative of any specific investment within that index’s asset class. |
Performance information for the stock and bond indices was obtained through Per Trac 2000. CISDM CPO Asset Weighted Index information was obtained through CISDM.org. Some information contained herein may not have been
audited.
-120-
APPENDIX I
BLUE SKY GLOSSARY
The following definitions are included in this Appendix I in compliance with the requirements of various state securities administrators who review public futures fund offerings for compliance with the “Guidelines for the Registration of Commodity Pool Programs” Statement of Policy promulgated by the North American Securities Administrators Association, Inc. The following definitions are reprinted verbatim from such Guidelines and may, accordingly, not in all cases be relevant to an investment in the Fund.
Definitions — As used in the Guidelines, the following terms have the following meanings:
Administrator — The official or agency administering the security laws of a state.
Advisor — Any person who for any consideration engages in the business of advising others, either directly or indirectly, as to the value, purchase, or sale of commodity contracts or commodity options.
Affiliate — An Affiliate of a Person means: (a) any Person directly or indirectly owning, controlling or holding with power to vote 10% or more of the outstanding voting securities of such Person; (b) any Person 10% or more of whose outstanding voting securities are directly or indirectly owned, controlled or held with power to vote, by such Person; (c) any Person, directly or indirectly, controlling, controlled by, or under common control of such Person; (d) any officer, director or partner of such Person; or (e) if such Person is an officer, director or partner, any Person for which such Person acts in any such capacity.
Capital Contributions — The total investment in a Program by a Participant or by all Participants, as the case may be.
Commodity Broker — Any Person who engages in the business of effecting transactions in commodity contracts for the account of others or for his own account.
Commodity Contract — A contract or option thereon providing for the delivery or receipt at a future date of a specified amount and grade of a traded commodity at a specified price and delivery point.
Cross Reference Sheet — A compilation of the Guideline sections, referenced to the page of the prospectus, Program agreement, or other exhibits, and justification of any deviation from the Guidelines.
Net Assets — The total assets, less total liabilities, of the Program determined on the basis of generally accepted accounting principles. Net Assets shall include any unrealized profits or losses on open positions, and any fee or expense including Net Asset fees accruing to the Program.
Net Asset Value Per Program Interest — The Net Assets divided by the number of Program Interests outstanding.
Net Worth — The excess of total assets over total liabilities are determined by generally accepted accounting principles. Net Worth shall be determined exclusive of home, home furnishings and automobiles.
New Trading Profits — The excess, if any, of Net Assets at the end of the period over Net Assets at the end of the highest previous period or Net Assets at the date trading commences, whichever is higher, and as further adjusted to eliminate the effect on Net Assets resulting from new Capital Contributions, redemptions, or capital distributions, if any, made during the period decreased by interest or other income, not directly related to trading activity, earned on Program assets during the period, whether the assets are held separately or in a margin account.
Organizational and Offering Expenses — All expenses incurred by the Program in connection with and in preparing a Program for registration and subsequently offering and distributing it to the public, including, but not limited to, total underwriting and brokerage discounts and commissions (including fees of the underwriter’s attorneys), expenses for printing, engraving, mailing, salaries of employees while engaged in sales activity, charges of transfer agents, registrars, trustees, escrow holders, depositories, experts, expenses of qualification of the sale of its Program Interest under federal and state law, including taxes and fees, accountants’ and attorneys’ fees.
APP-1
Participant — The holder of a Program Interest.
Person — Any natural Person, partnership, corporation, association or other legal entity.
Pit Brokerage Fee — Pit Brokerage Fee shall include floor brokerage, clearing fees, National Futures Association fees, and exchange fees.
Program — A limited partnership, joint venture, corporation, trust or other entity formed and operated for the purpose of investing in Commodity Contracts.
Program Broker — A Commodity Broker that effects trades in Commodity Contracts for the account of a Program.
Program Interest — A limited partnership interest or other security representing ownership in a program.
Pyramiding — A method of using all or a part of an unrealized profit in a Commodity Contract position to provide margin for any additional Commodity Contracts of the same or related commodities.
Sponsor — Any Person directly or indirectly instrumental in organizing a Program or any Person who will manage or participate in the management of a Program, including a Commodity Broker who pays any portion of the Organizational Expenses of the Program, and the general partner(s) and any other Person who regularly performs or selects the Persons who perform services for the Program. Sponsor does not include wholly independent third parties such as attorneys, accountants, and underwriters whose only compensation is for professional services rendered in connection with the offering of the Units. The term “Sponsor” shall be deemed to include its Affiliates.
Valuation Date — The date as of which the Net Assets of the Program are determined.
Valuation Period — A regular period of time between Valuation.
APP-2
EXHIBIT A
CAMPBELL STRATEGIC ALLOCATION FUND, L.P.
AMENDED AGREEMENT OF LIMITED PARTNERSHIP
ARTICLE 1.
FORMATION AND NAME
The parties to this Amended Agreement of Limited Partnership (the “Agreement”) dated as of August 1, 1997 have formed Campbell Strategic Allocation Fund, L.P. (the “Partnership”) under the Delaware Revised Uniform Limited Partnership Act in effect on the date thereof (the “Act”) and do hereby continue the Partnership pursuant to the terms herein as of September 23, 1993. Each Limited Partner hereby undertakes to furnish to the General Partner a power of attorney which may be filed with this Agreement and any amendment hereto and such additional information as is required from him to complete such documents and to execute and cooperate in the filing, recording or publishing of such documents at the request of the General Partner.
ARTICLE 2.
PRINCIPAL OFFICE AND REGISTERED AGENT
The principal office of the Partnership shall be 210 West Pennsylvania Avenue, Baltimore, Maryland 21204, or such other place as the General Partner may designate from time to time. The Registered Agent for the Limited Partnership is D. Keith Campbell, 210 West Pennsylvania Avenue, Baltimore, Maryland 21204. The Tax Matters Partner for the Limited Partnership is Campbell & Company, Inc.
ARTICLE 3.
BUSINESS AND PURPOSE OF THE PARTNERSHIP
The Partnership’s business and purpose is to trade, buy, sell or otherwise acquire, hold or dispose of futures and other related investment interests and any activities incidental or related thereto. The objective of the Partnership business is appreciation of its assets through speculative trading.
ARTICLE 4.
TERM, DISSOLUTION AND FISCAL YEAR
�� 4.1 Term. The term of the Partnership commenced upon the execution and filing of the Certificate of Limited Partnership, as amended, and shall end upon the first to occur of the following: (i) December 31, 2023; (ii) an election to dissolve the Partnership in accordance with the provisions of Article 4.2 by Limited Partners owning more than 50% of the Units then outstanding; (iii) the withdrawal of the General Partner, as defined in, and subject to the limitations of Article 13; (iv) a determination by the General Partner that the purpose of the Partnership cannot be fulfilled; or (v) any event which constitutes a dissolution of a limited partnership under the Act or otherwise makes it unlawful for the existence of the Partnership to be continued.
4.2 Dissolution. Upon the occurrence of an event causing the dissolution of the Partnership, the Partnership shall be wound up and terminated. Upon dissolution and termination of the Partnership, the General Partner shall contribute to the Partnership an amount equal in the aggregate to the lesser of (a) the deficit balance in their capital accounts, or (b) the excess of 1.01% of the total capital contributions paid in by the Limited Partners over any capital previously contributed by the General Partner. Payment of creditors, and distribution of the Partnership’s assets shall be effected as soon as practicable in accordance with the Act, and the General Partner and each Limited Partner (and any assignee) shall share in the assets of the Partnershippro ratain accordance with such Partner’s respective capital account, less any amount owing by such Partner (or assignee) to the Partnership.
4.3 Fiscal Year. The fiscal year of the Partnership shall end on December 31, unless the General Partner elects, with the approval of the Internal Revenue Service and the CFTC, a different fiscal year.
A-1
ARTICLE 5.
GENERAL PARTNER
The General Partner is Campbell & Company, Inc., a Maryland corporation, 210 West Pennsylvania Avenue, Baltimore, Maryland 21204.
ARTICLE 6.
CAPITAL CONTRIBUTIONS AND
UNITS OF LIMITED PARTNERSHIP INTEREST
6.1 Units and Capital Contributions of Limited Partners. Interests in the Partnership other than the General Partner’s interests, shall be evidenced by Units (individually a “Unit”).
6.2 Capital Contributions by General Partner; Net Worth. The General Partner has contributed cash to the capital of the Partnership in an amount equal to at least 1% of the net aggregate contributions of all Partners including the General Partner. The General Partner’s contribution shall be evidenced by Units of General Partnership Interest. The General Partner may make withdrawals of its Units provided that such withdrawals do not reduce the General Partner’s aggregate percentage interest in the Partnership to less than 1% of the net aggregate contributions. If additional Limited Partners are admitted during any Continuing Offering pursuant to the provisions of Article 11 herein, the General Partner shall make such additional capital contributions as may be required to maintain its interest at the required level in the Partnership at all times during the term of the Partnership. The General Partner shall maintain a net worth so long as it acts as general partner equal to at least 5% of the capital contributed by all the limited partnerships for which it acts as general partner, including the Partnership. The minimum required net worth shall in no case be less than $50,000 nor shall net worth in excess of $1,000,000 be required.
6.3 Availability of Contributions. The aggregate of all Partnership contributions shall be available to the Partnership to carry on its business and purpose, and no interest shall be paid to any Partner on any such contributions.
ARTICLE 7.
ALLOCATION OF PROFITS AND LOSSES
7.1 Capital Accounts. A capital account shall be established for each Partner, including the General Partner. The initial balance of each Partner’s capital account shall be the amount of his initial capital contribution to the Partnership.
7.2 Monthly Allocations. As of the close of business (as determined by the General Partner) of the last day of each month, the following determinations and allocations shall be made:
(1) The Net Assets of the Partnership (as defined in Article 7.4) before the General Partner’s Brokerage Fee, the direct administrative expenses and the General Partner’s performance fees payable shall be determined.
(2) Brokerage Fees payable by the Partnership and the direct administrative expenses shall then be charged against the Net Assets.
(3) Accrued performance fees, if any, shall then be charged against the Net Assets.
(4) Any increase or decrease in the Net Assets as of the end of the month (after the adjustments in subparagraphs (2) and (3)) shall then be credited or charged to the capital accounts of each Partner in the ratio that the balance of each account bears to the balance of all accounts.
(5) The amount of any distribution to a Partner, any amount paid to a Limited Partner on redemption of Units, and any amount paid to the General Partner by way of distribution or redemption of Units of General Partnership Interest, shall be charged to such Partner’s capital account.
A-2
7.3 Allocation of Profit and Loss for Federal Income Tax Purposes. At the end of each taxable year, each item of Partnership taxable income, gain, loss, deduction, or credit will be allocated among the Partners in accordance with the following provisions:
(1) Capital gain shall be allocated first to each Partner who has redeemed Units (Units of General Partnership Interest in the case of the General Partner) during the year to the extent that the amount the Partner received on redemption exceeds the amount paid for the redeemed Units (as set forth in subparagraph (5));
(2) Capital gain remaining after the allocation in subparagraph (1) shall be allocated among all Partners in the ratio that each Partner’s capital account bears to all Partner’s capital accounts;
(3) Capital losses shall be allocated first to each Partner who has redeemed Units (Units of General Partnership Interest in the case of the General Partner) during the year to the extent that the amount the Partner paid for the redeemed Units (as set forth in subparagraph (5)) exceeds the amount the Partner received on redemption;
(4) Capital losses remaining after the allocation in subparagraph (3) shall be allocated among all Partners in the ratio that each Partner’s capital account bears to all Partners’ capital accounts;
(5) For the purpose of the allocations of capital gain and loss in subparagraphs (1) and (3), the amount each Partner paid for each of his Units shall be deemed to have increased by the amount of capital gain allocated to him with respect to such Unit pursuant to subparagraph (2) or ordinary income pursuant to subparagraph 6; decreased by the amount of any capital loss allocated to him with respect to such Unit pursuant to subparagraph (4) or ordinary expense pursuant to subparagraph 6; and decreased by the amount of any distributions to him with respect to such Unit pursuant to Article 7.8;
(6) Items of ordinary income and expense will be allocatedpro rataamong the Partners based upon their respective capital accounts as of the end of each month in which the items of ordinary income or expense accrue; provided that any performance fee paid to the General Partner shall be allocated among the Units outstanding at any time during the fiscal year based upon the ratio that each such Unit’s net performance fee (the excess, if any, of the aggregate of all performance fees allocated to the capital account relating to such Unit over the aggregate of all reversals of performance fees allocated to such Unit) bears to the net performance fee of all Units;
(7) Notwithstanding subparagraphs (4) and (6), if the allocation of such loss would cause a Limited Partner to have a capital account deficit, then such loss shall be allocated to the General Partner, according to its capital account, to the extent of such losses;
(8) For purposes of this Paragraph 7.3, “capital gain” and “capital loss” shall mean gain or loss characterized as gain or loss from the sale or exchange of a capital asset by the Internal Revenue Code of 1986, as amended (the “Code”), including but not limited to gain or loss required to be taken into account pursuant to Section 1256 thereof and any income, gain or loss determined under Section 988 of the Code; and
(9) Allocations of capital gain or loss will be madepro ratafrom each category of capital gain or loss determined under Section 1(h) of the Code and income or loss determined under Section 988 of the Code.
7.4 Definitions; Accounting.
(1) Net Assets. “Net Assets” of the Partnership shall mean the total assets of the Partnership, including all cash and cash equivalents (valued at cost), plus accrued interest thereon, and the market value of all open commodity positions and other assets of the Partnership, less all liabilities of the Partnership, including accrued performance fees determined in accordance with the principles specified in this subparagraph and, where no principle is specified, in accordance with generally accepted accounting principles consistently applied under the accrual basis of accounting. The market value of a commodity or commodity futures contract traded on an exchange, or through a clearing firm or through a bank, shall
A-3
mean the most recent available settlement price or closing quotation, as appropriate on the exchange, or of the clearing firm or bank on or through which the commodity or contract is traded by the Partnership on the day with respect to which Net Assets are being determined. If such contract cannot be liquidated, due to the operation of daily limits or otherwise, on a day as of which Net Assets are determined, the liquidating value on the first subsequent day on which the contract would be liquidated may be used or such other value as the General Partner may deem fair and reasonable. The market value of a commodity forward contract or a commodity futures contract traded on a foreign exchange shall mean its market value as determined by the General Partner on a basis consistently applied.
(2) Net Asset Value. The “Net Asset Value” of the Partnership shall mean the total capital accounts of all Partners. The “Net Asset Value” of a Unit shall be the total capital accounts of all Partners, divided by the number of Units owned by all Partners.
(3) Blue Sky Glossary. The definitions in the Blue Sky Glossary in Appendix I to the Partnership’s Prospectus are hereby incorporated herein by reference.
7.5 Expenses.
(1) The General Partner shall advance the organization and offering expenses of the initial and continuous offerings of the Units, and no such expenses shall be deducted from the proceeds of the offerings. Subject to the limitation described below, the General Partner shall be reimbursed such advanced amounts by the Partnership in approximately 30 equal installments commencing after the closing of the initial offering and monthly during the continuous offering. The General Partner shall have discretion to adopt reasonable procedures to implement the amortization of such expenses, including grouping expenses related to the same offering period and expensing de minimis amounts as they are incurred. In no event shall the General Partner be entitled to receive reimbursement in an amount greater than 2.5% of the aggregate subscriptions accepted during the initial and continuous offerings, as the case may be. In the event the Partnership terminates prior to completion of the reimbursement, the General Partner will not be entitled to receive additional reimbursement and the Partnership will have no obligation to make further reimbursement payments to the General Partner. For purposes of this Agreement, organization and offering expenses shall mean all costs paid or incurred by the General Partner or the Partnership in organizing the Partnership and offering the Units, including legal and accounting fees incurred, bank account charges, all blue sky filing fees, filing fees payable upon formation and activation of the Partnership, and expenses of preparing, printing and distributing the prospectus and registration statement, but in no event shall exceed limits set forth in Article 8 herein or guidelines imposed by appropriate regulatory bodies.
(2) The Partnership shall be obligated to pay all liabilities incurred by it, including without limitation, (i) Brokerage Fees; (ii) operating expenses and performance fees; (iii) legal and accounting fees; and (iv) taxes and other extraordinary expenses incurred by the Partnership. During any year of operations, the General Partner shall be responsible for payment of operating expenses in excess of 0.5% of the Partnership’s month-end Net Asset Value during that year. Indirect expenses of the General Partner, such as indirect salaries, rent and other overhead expenses, shall not be liabilities of the Partnership. The Partnership shall receive all interest earned on its assets.
(3) Compensation to any party, including the General Partner (or any advisor which may be retained in the future), shall not exceed the limitations imposed as of the date hereof by the North American Securities Administrators Association (“NASAA”). In the event the compensation exceeds such limitations, the General Partner shall promptly reimburse the Partnership for such excess. NASAA limitations on fees are as follows: Management fees, advisory fees and all other fees, except for incentive fees and commodity brokerage commissions, when added to the customary and routine administrative expenses, shall not exceed 6% annually of net asset value. The aggregate incentive fees shall not exceed 15% of new trading profits. The sponsor or advisor will be entitled to an additional 2% incentive fee for each 1% by which the net asset value fee is reduced below 6%. Commodity brokerage rates will be presumptively reasonable if they satisfy either 80% of the published retail rate plus pit brokerage fees or
A-4
14% annually of average net assets, including pit brokerage fees. The Partnership will pay an 8% per annum Brokerage Fee, of which 3% will be for management services, allowing the incentive fee to be 20%, as discussed above. The remaining 5% from the Brokerage Fee will be paid for brokerage services (including the initial distribution of the Units, execution of commodity transactions, and ongoing services to the Limited Partners), which is less than the 14% limit imposed by NASAA.
(4) The Partnership shall also be obligated to pay any costs of indemnification to the extent permitted under Article 15 of this Agreement.
7.6 Limited Liability of Limited Partners. Each Unit purchased by a Limited Partner is fully paid and non-assessable. A Limited Partner shall be liable for the Partnership’s obligations to the extent of the capital contributed by him plus his share of profits remaining in the Partnership, if any.
In addition, if a Limited Partner receives a return of any part of his capital contribution, he shall be liable to the Partnership for a period of one year thereafter for the amount of the returned contribution, but only to the extent necessary to discharge the Partnership’s liabilities to creditors who extended credit to the Partnership during the period the contribution was held by the Partnership.
A Limited Partner shall also be liable to the Partnership for return of any part of his capital contribution returned to him, for a period of six years, if such return was in violation of this Agreement or the Act.
7.7 Return of Limited Partner’s Capital Contribution. Except to the extent that a Limited Partner shall have the right to redeem Units, no Limited Partner shall have any right to demand the return of his capital contribution or any profits added thereto, except upon dissolution and termination of the Partnership. In no event shall a Limited Partner be entitled to demand or receive property other than cash.
7.8 Distributions. The General Partner shall have sole discretion in determining what distributions (other than on redemption of Units or dissolution), if any, the Partnership will make to its Partners (or any assignee thereof). Distributions shall be madepro ratain accordance with the respective capital accounts of the Partners.
ARTICLE 8.
MANAGEMENT
8.1 General.
(1) The General Partner, to the exclusion of the Limited Partners, shall conduct and manage the business of the Partnership including, without limitation, all functions necessary for administration of the Partnership. The General Partner shall have the fiduciary responsibility for the safekeeping and use of all assets of the Partnership, whether or not in its immediate possession or control, shall not contract away such duty and shall not employ or permit another to employ such assets in any manner except for the exclusive benefit of the Partnership. The General Partner, on behalf of the Partnership, shall make all investment decisions regarding the Partnership and shall have complete trading discretion. The General Partner shall seek the best price and services available in its futures brokerage transactions, and all brokerage transactions for the Partnership’s futures trades will be effected at competitive rates.
(2) The General Partner shall receive from the Partnership: (i) Brokerage Fees of 8% per annum of the month-end Net Assets; and (ii) a quarterly “performance fee” of 20% of the Partnership’s aggregate cumulative appreciation in the Net Asset Value per Unit, exclusive of interest income. The performance fee is paid on the cumulative increase, if any, in the Net Asset Value per Unit over the highest previous cumulative Unit value or Unit value as of the commencement of trading, whichever is higher. In determining the fees in this paragraph, adjustments shall be made for capital additions and withdrawals and Net Assets shall not be reduced by the fees being calculated for such current period. Such fees may be changed upon sixty days’ notice to the Limited Partners, provided that prior to the imposition of the revised fees, Limited Partners have an opportunity to redeem (and there are no delays in receiving payment therefor) and the notice explains their redemption and voting rights. Further, any new contract
A-5
with any advisor, including the General Partner, shall carryforward all losses attributable to such advisor or General Partner, as the case may be.
(3) The General Partner may take such other actions as it deems necessary or desirable to manage the business of the Partnership including, but not limited to, the following: entering into commercially reasonable contracts, opening bank accounts, paying or authorizing the payment of distributions to the Partners and expenses of the Partnership including fees to the General Partner, taxes and other fees of governmental agencies.
(4) The General Partner shall keep and retain for at least six years, at the principal office of the Partnership, such books and records relating to the business of the Partnership as it deems necessary to substantiate that Units were sold only to purchasers for whom such securities were suitable and which are required by the Commodity Exchange Act, and the rules and regulations thereunder. Such books and records shall be available to any Limited Partner or his authorized attorney or agent for inspection and copying during normal business hours of the Partnership.
(5) The General Partner may engage in other business activities and shall not refrain from any other activity nor disgorge any profits from any such activity, whether as general partner of additional partnerships for investment in commodity futures or forward contracts or otherwise. Subject to the terms and conditions set forth in this Agreement, the General Partner may engage and compensate on behalf of the Partnership, from funds of the Partnership, such persons, firms or corporations, as the General Partner in its sole judgment shall deem advisable for the conduct and operation of the business of the Partnership. The General Partner may develop and implement a cash management facility. In such event, the General Partner may cause the Partnership to participate in such facility if doing so would be in the best interests of the Partnership. Competitive management fees may be paid to the General Partner or an affiliate thereof.
(6) No person dealing with the General Partner shall be required to determine its authority to make any undertaking on behalf of the Partnership, nor to determine any fact or circumstance bearing upon the existence of such authority.
(7) Except as provided by Article 13, the General Partner may not sell, assign, or otherwise dispose of all or substantially all of its General Partnership Interest in the Partnership except for a sale or transfer of all Partnership interests of all Partners or a sale of all or substantially all of its interest to a corporation controlled by such General Partner. The foregoing restriction shall not be applicable to the General Partner mortgaging, pledging, hypothecating or granting a security interest in its General Partnership Interest as collateral for a loan or loans and any such assignment of all or any portion of the General Partner’s Interest shall not cause an event of withdrawal with respect to the General Partner pursuant to Article 13 of this Agreement.
(8) The maximum period covered by any contract entered into by the Partnership, except for certain provisions which survive the stated term, shall be one year. Agreements between the Partnership and the General Partner or any affiliate shall be terminable by the Partnership without penalty on 60 days’ written notice. All sales of Units in the United States shall be made by registered brokers. No sales will be made by the General Partner or an affiliate.
8.2 Prohibitions. The Partnership shall not: (i) engage in pyramiding; (ii) commingle its assets with the assets of any other person, except as permitted by law; (iii) make loans to the General Partner or any affiliate thereof or to any person; (iv) pay per-trade compensation to the General Partner or any advisor or any affiliate thereof or to any person who receives any other form of compensation from the Partnership; or (v) permit rebates or give-ups to be received by the General Partner or affiliates thereof nor shall the General Partner participate in any reciprocal business arrangements which would circumvent the foregoing or any other provision of this Agreement; or (vi) borrow cash or other assets from the General Partner.
A-6
ARTICLE 9.
REPORTS TO LIMITED PARTNERS
The books and records of the Partnership shall be audited annually by an independent certified public accountant. Net Assets and Net Asset Value per Unit shall be determined daily and will be supplied in writing to any Limited Partner who requests such information. The General Partner will cause each Partner to receive (i) within ninety (90) days after the close of each fiscal year an annual report with audited financial statements (including a balance sheet and income statement) for the fiscal year then ended, and (ii) within seventy-five (75) days after the close of each fiscal year such tax information as is necessary for the Partner to complete his federal income tax return. In addition, the General Partner will report within 30 days after the end of each month to the Limited Partners the information required by the CFTC to be reported, which information currently includes the following: the total amount of realized net gain or loss on commodity interest positions liquidated during the month; the change in unrealized net gain or loss on commodity interest positions during the month; the total amount of net gain or loss from all other transactions engaged in by the Partnership during the month, including interest earned; the total amount of all Brokerage Fees and performance fees, and all other expenses incurred or accrued by the Partnership during the month; the Net Asset Value of a Unit as of the end of the month and as of the end of the previous month; the total amount of additions to the Net Assets of the Partnership made during the month; the total amount of withdrawals from and redemptions of Units for the month; and the total net income or loss of the Partnership during the month. In the event either Net Asset Value per Unit as of the end of any business day declines by more than 50% of the previous year-end or month-end Net Asset Value per Unit, or there is a material change in the advisory agreement with the General Partner or otherwise affecting the compensation to any party, including the General Partner, the General Partner will notify each Limited Partner of such information, their redemption and voting rights and any material effect on the Units within seven business days. In the event of the 50% decline in Net Asset Value per Unit referred to in the previous sentence, the General Partner will declare a special redemption period and temporarily suspend the Partnership’s trading during such period.
ARTICLE 10.
DISPOSITIONS AND REDEMPTIONS OF PARTNERSHIP UNITS
10.1 Permissible Dispositions. A Limited Partner may transfer, assign, pledge, or encumber his Units only as provided in this Article 10.1. No such transferee, pledgee, assignee, or secured creditor shall become a substituted Limited Partner unless the General Partner consents in writing to such substitution. The General Partner has complete discretion to withhold consent but only intends to do so in order to prevent or minimize potential adverse legal or tax consequences to the Partnership. Any transfer or assignment of Units which is permitted hereunder shall be effective as of the beginning of the month following the month in which such transfer or assignment is made; provided, however, that the Partnership need not recognize any transfer, assignment, or pledge until it has received at least 30 days’ prior written notice thereof from the transferor, assignor, or pledgor, which notice shall include (i) the name, signature, address and social security or taxpayer identification number of the transferee, assignee, or pledgee, (ii) the number of Units transferred, assigned or pledged, and (iii) the signature of the transferor, assignor, or pledgor. The General Partner may, in its discretion, waive receipt of the above described written notice or waive any defect therein. No transfer or assignment shall be permitted unless the General Partner is satisfied that (i) such transfer or assignment would not be in violation of the Act, (ii) the amount of the transfer is at least the minimum subscription amount except for transfers by gift, inheritance, or to affiliates, including family members of the person transferring the Units, and (iii) notwithstanding such transfer or assignment, the Partnership shall continue to be classified as a partnership rather than as a corporation or an association under the Internal Revenue Code, as amended. No transfer or assignment of Units shall be effective or recognized by the Partnership if following such transfer or assignment there would result a termination of the Partnership for federal income tax purposes as provided in Code 708(b) and any attempted transfer or assignment in violation hereof shall be ineffective to transfer or assign any such Units. Any transferee or assignee of Units who has not been admitted to the Partnership as a substituted Limited Partner shall not have any of the rights of a Limited
A-7
Partner, except that the assignee shall receive that share of capital and profits and shall have that right of redemption to which his assignor would otherwise have been entitled and shall remain subject to the other terms of this Agreement binding upon Limited Partners. The transfer or assignment of Units shall be subject to all applicable securities laws. The transferor or assignor shall bear all costs (including any attorneys’ fees) related to such transfer or assignment.
10.2 Redemptions.
(1) A Limited Partner (or any assignee thereof) may withdraw all or part of his capital contribution and undistributed profits, if any, by requiring the Partnership to redeem all or part of his Units at the Net Asset Value per Unit, reduced as hereinafter described (such withdrawal being herein referred to as a “Redemption”).
(2) Redemptions shall be effective as of the end of any month ending after a Request for Redemption in proper form has been timely received by the General Partner (the “Redemption Date”). Redemption fees apply through the first twelve month-ends following purchase (from and including the Closing Date on which the Unit is purchased) as follows: 4% of Net Asset Value per Unit redeemed through the third month-end, 3% of Net Asset Value per Unit redeemed through the sixth month-end, 2% of Net Asset Value per Unit redeemed through the ninth month-end, and 1% of Net Asset Value per Unit redeemed through the twelfth month-end. After the twelfth month-end following purchase of a Unit, no redemption fees apply. As used herein, “Request for Redemption” shall mean a written request of such withdrawal transmitted by the Limited Partner (or any assignee thereof) to the General Partner not less than ten business days prior to the end of the month or such shorter period as established by the General Partner. Upon Redemption, a Limited Partner (or any assignee thereof) shall receive, per Unit redeemed, an amount equal to the Net Asset Value per Unit as of the Redemption Date, less any amount owing by such Limited Partner (and his assignee, if any) to the Partnership pursuant to Article 15.3, and less any applicable redemption fees due to the General Partner. If redemption is requested by an assignee, all amounts owed to the Partnership under Article 15.3 by the Partner to whom such Unit was sold, as well as all amounts owed by the assignees of such Unit, shall be deducted from the amount payable upon Redemption by any assignee. All Requests for Redemption in proper form shall be honored and payment will be made within twenty (20) business days following the Redemption Date, except that under special circumstances, including, but not limited to, the inability on the part of the Partnership to liquidate commodity positions or the default or delay in payments due the Partnership from commodity brokers, banks, or other persons, the Partnership may delay payment to Partners requesting Redemption of Units. In the event that Redemptions are requested for more Units than the General Partner is able to honor due to the foregoing contingencies, the General Partner will honor Requests for Redemption in the order actually received and will hold Requests for Redemption in such order. Limited Partners will be notified within 10 days after month-end if any Redemption cannot be honored under the terms hereof and their Requests thereafter will be honored at the first available opportunity. The Partnership shall not be obligated to redeem Units that are subject to a pledge or otherwise encumbered in any fashion.
(3) Subparagraph (2) notwithstanding, if the Net Asset Value per Unit is determined for purposes of Redemption as of a month-end which is not the end of a quarter, any performance fees payable and applicable to such Unit, will be determined and charged to such Unit as though such month-end were the end of a quarter and such performance fees were payable and such performance fees will be paid.
ARTICLE 11.
OFFERING OF UNITS; ADMISSION OF ADDITIONAL LIMITED PARTNERS
The General Partner shall, from time to time, (i) cause the Partnership to file a Registration Statement and such amendments as the General Partner deems advisable, with the Securities and Exchange Commission for the registration and public offering of the Units; (ii) seek to qualify the Units for sale in various jurisdictions as the General Partner deems advisable; and (iii) take such other actions as the General Partner deems advisable.
A-8
The General Partner, at its option, may admit additional Limited Partners to the Partnership without the consent of the Limited Partners at any time. Such additional Limited Partners shall contribute capital to the Partnership, and shall be admitted as Limited Partners as of the first business day of the month immediately following the month-end as of which their subscriptions were accepted by the General Partner at no less than the Net Asset Value per Unit as of such month-end.
ARTICLE 12.
SPECIAL POWER OF ATTORNEY
By execution of this Agreement, each Limited Partner irrevocably constitutes and appoints the General Partner with full power of substitution, as his true and lawful attorney-in-fact, in his name, place and stead, to execute, acknowledge, swear to, file and record in his behalf in the appropriate public offices and publish (i) this Agreement and any amendments thereto; (ii) all instruments which the General Partner deems necessary or appropriate to reflect any amendment, change, or modification of the Limited Partnership Agreement or Certificate of Limited Partnership in accordance with the terms of this Agreement; and (iii) Certificates of Fictitious or Assumed Name. The Power of Attorney granted herein shall be irrevocable and deemed to be a power coupled with an interest and shall survive the incapacity or death of a Limited Partner. Each Limited Partner hereby agrees to be bound by any representation made by the General Partner and by any successor thereto, acting in good faith pursuant to such Power of Attorney.
ARTICLE 13.
WITHDRAWAL OF A PARTNER
The Partnership shall terminate and be dissolved upon the withdrawal, or insolvency of the General Partner (unless in the case of the withdrawal of the General Partner, the actions necessary to continue the Partnership are taken pursuant to Article 16). The General Partner shall cease to be a general partner of the Partnership upon the occurrence of any of the following events of withdrawal: (i) the General Partner’s bankruptcy or insolvency; (ii) any event prescribed in the Act that is not encompassed in this Article 13; or (iii) 120 days’ prior written notice to the Limited Partners of the General Partner’s intent to withdraw as a General Partner. If the General Partner withdraws as general partner, it can redeem its interests in the Partnership at Net Asset Value as of the next month-end in which it is calculated. If the Limited Partners elect to continue the Partnership, the withdrawing General Partner shall pay all Partnership expenses incurred as a result of its withdrawal. The death, incompetency, incapacity, withdrawal, insolvency, or dissolution of a Limited Partner shall not dissolve or terminate the Partnership, and said Limited Partner, his estate, custodian, or personal representative shall have no right to withdraw or value such Limited Partner’s Units except as provided in Article 10 hereof. Each Limited Partner (and any assignee of such Limited Partner) expressly agrees that in the event of his death, he waives on behalf of himself and his estate, and he directs the legal representative of his estate and any person interested therein to waive the furnishing of any inventory, accounting, or appraisal of the assets of the Partnership and any right to a special audit of the books and records of the Partnership, provided that the waiver shall not relieve the General Partner from its reporting obligations set forth in Article 9.
ARTICLE 14.
NO PERSONAL LIABILITY FOR RETURN OF CAPITAL
Subject to the provisions of Article 15 below, the General Partner shall not be personally liable for the return or repayment of all or any portion of the capital or profits of any Partner (or assignee), it being expressly agreed that any such return of capital or profits made pursuant to this Agreement shall be made solely from the assets (which shall not include any right of contribution from the General Partner) of the Partnership.
A-9
ARTICLE 15.
STANDARD OF LIABILITY; INDEMNIFICATION
15.1 Standard of Liability. The General Partner and its controlling persons shall have no liability to the Partnership or any Limited Partner for any loss suffered by the Partnership which arises out of any action of the General Partner if the General Partner, in good faith, determined that such course of conduct was in the best interests of the Partnership and such course of conduct did not constitute negligence or misconduct of the General Partner.
15.2 Indemnification by the Partnership. The Partnership shall indemnify, defend, and hold harmless the General Partner (including controlling persons and a former General Partner who has withdrawn from the Partnership) from and against any loss, liability, damage, cost or expense (including attorneys’ fees, and expenses incurred in defense of any demands, claims or lawsuits) arising from actions or omissions concerning the business or activities undertaken by or on behalf of the Partnership, from any source only if all of the following conditions are satisfied: (i) the General Partner has determined, in good faith, that the course of conduct which caused the loss or liability was in the best interests of the Partnership, (ii) the General Partner was acting on behalf of or performing services for the Partnership, (iii) such liability or loss was not the result of negligence or misconduct by the General Partner, and (iv) such indemnification is recoverable only out of the Partnership’s assets and not from the Limited Partners. In no event shall the General Partner or any of the selling agents receive indemnification from the Partnership arising out of alleged violations of federal or state securities laws unless the following conditions are satisfied; (a) there has been a successful adjudication on the merits of each count involving alleged securities law violations, or (b) such claims have been dismissed with prejudice on the merits by a court of competent jurisdiction, or (c) a court of competent jurisdiction approves a settlement of the claims and finds that indemnification of the settlement and related costs should be made, and (d) in the case of subparagraph (c), the court considering the request has been advised of the position of the Securities and Exchange Commission and the states in which Units were offered and sold as to indemnification for violations of securities laws; provided that the court need only be advised and consider the positions of the securities regulatory authorities in those states in which plaintiffs claim they were offered or sold Units. The Partnership shall not incur the cost of that portion of liability insurance which insures the General Partner for any liability as to which the General Partner is prohibited from being indemnified herein.
15.3 Advance Payment. Expenses incurred in defending a threatened or pending civil, administrative or criminal action, suit or proceeding against the General Partner may be paid by the Partnership in advance of the final disposition of such action, suit or proceeding, if and to the extent that (i) the legal action relates to acts or omissions with respect to the performance of duties or services on behalf of the Partnership, (ii) the legal action is initiated by a party who is not a Limited Partner, or if by a Limited Partner, then a court of competent jurisdiction specifically approves such advancement, and (iii) the General Partner shall agree to reimburse the Partnership, together with the applicable legal rate of interest thereon, in the event indemnification is not permitted under this Article 15 upon final disposition.
ARTICLE 16.
AMENDMENTS; MEETINGS
16.1 Amendments with Consent of the General Partner. If at any time during the term of the Partnership the General Partner shall deem it necessary or desirable to amend this Agreement, such amendment shall be effective only if embodied in an instrument signed by the General Partner and by the holders of more than fifty percent (50%) of the Units then owned by the Limited Partners. Any such supplemental or amendatory agreement shall be adhered to and have the same effect from and after its effective date as if the same had originally been embodied in and formed a part of this Limited Partnership Agreement, provided, however, that no such supplemental or amendatory agreement shall, without the consent of all Limited Partners, change or alter this Section 16, extend the term of the Partnership, reduce the capital account of any Partner or modify the percentage of profits, losses or distributions to which any Partner is entitled. In addition, reduction of the capital account of any assignee
A-10
or modifications of the percentage of profits, losses or distributions to which an assignee is entitled hereunder shall not be effected by any amendment or supplement to this Limited Partnership Agreement without such assignee’s written consent. No meeting procedure or specified notice period is required in the case of amendments made with the consent of the General Partner, mere receipt of an adequate number of unrevoked written consents being sufficient. The General Partner may amend this Limited Partnership Agreement without the consent of the Limited Partners in order (i) to clarify any clerical inaccuracy or ambiguity or reconcile any inconsistency (including any inconsistency between this Agreement and the Prospectus), (ii) to effect the intent of the tax allocations proposed herein (including, without limitation, allocating capital gain and capital loss on a net rather than a gross basis) to the maximum extent possible in the event of a change in the Code or the interpretations thereof affecting such allocations, (iii) to attempt to ensure that the Partnership is not taxed as an association taxable as a corporation for federal income tax purposes, (iv) to delete or add any provision of or to this Limited Partnership Agreement required to be deleted or added by the staff of the Securities and Exchange Commission or any other federal agency or any state “Blue Sky” official or similar official or in order to opt to be governed by any amendment or successor statute to the Act, (v) to change the name of the Partnership and to make any modifications to this Limited Partnership Agreement to reflect the admission of an additional or substitute general partner, (vi) to make any amendment to this Limited Partnership Agreement which the General Partner deems advisable, provided that such amendment is not adverse to the Limited Partners and does not alter the basic investment policies or structure of the Partnership, or that is required by law, or (vii) to make any amendment that is appropriate or necessary, in the opinion of the General Partner, to prevent the Partnership or the General Partner or their respective directors, officers or controlling persons from in any manner being subject to the provisions of the Investment Company Act of 1940, as amended, or “plan asset” regulations adopted under ERISA as a result of their association with the Partnership.
16.2 Meetings. The General Partner will maintain at the office a list of the names and addresses of all Limited Partners and the Units owned by them. Upon request of any Limited Partner or his representative, the General Partner shall make such list available for review by any Limited Partner or his representative, and upon request, either in person or by mail, the General Partner shall furnish a copy of such list by mail to any Limited Partner or his representative, for the cost of duplication and postage. Upon receipt of a written request, signed by Limited Partners owning at least 10% of the Units then owned by Limited Partners, that a meeting of the Partnership be called to vote upon any matter which the Limited Partners may vote upon pursuant to this Agreement, the General Partner shall, by written notice, either in person or by certified mail, to each Limited Partner of record mailed within 15 days after such receipt, call a meeting of the Partnership. Such meeting shall be held at least 30 days but not more than 60 days after the mailing of such notice, and such notice shall specify the date, a reasonable place and time, and the purpose of such meeting.
16.3 Amendments and Actions Without Consent of the General Partner. At any meeting called pursuant to Article 16.2, upon the affirmative vote (which may be in person or by proxy) of Limited Partners owning more than a majority of the Units then owned by the Limited Partners (any Units held by the General Partner or its affiliates shall be disregarded in calculating the percentage of outstanding Units and the General Partner shall be prohibited from voting as a Limited Partner) the following actions may be taken: (i) this Agreement may be amended in accordance with and only to the extent permissible under the Act, provided, however, that consent of all Limited Partners shall be required in the case of amendments requiring the consent of all Limited Partners under the Act; (ii) the Partnership may be dissolved; (iii) the General Partner may be removed and replaced; (iv) a new general partner may be elected if the General Partner withdraws from the Partnership; (v) any contracts with the General Partner may be terminated on 60 days written notice; and (vi) the sale of all the assets of the Partnership may be approved; provided, however, that none of the said actions may be taken unless the action is permitted under the Act. In the event of the occurrence of an event described in (iii) or (iv) above, the interest of the General Partner shall be redeemed and paid to the General Partner on the basis of the Net Assets allocable thereto on the date of such event.
A-11
ARTICLE 17.
GOVERNING LAW
The General Partner and Limited Partners expressly agree that all the terms and provisions hereof shall be construed under the Delaware Revised Uniform Limited Partnership Act as now adopted or as may be hereafter amended and shall govern the partnership aspects of this Agreement absent contrary terms contained in this Agreement.
ARTICLE 18.
MISCELLANEOUS
18.1 Priority Among Limited Partners. No Limited Partner shall be entitled to any priority or preference over any other Limited Partner in regard to the affairs of the Partnership.
18.2 Notices. All notices under this Agreement, other than Requests for Redemption of Units, notices of assignment, transfer or pledge of Units, and reports by the General Partner to the Limited Partners, shall be in writing and shall be effective upon personal delivery, or if sent by first class mail, postage prepaid, addressed to the last known address of the party to whom such notice is to be given, then, upon the deposit of such notice in the United States mails. Reports by the General Partner to the Limited Partners shall be in writing and shall be sent by first class mail to the last known address of each Limited Partner. Requests for Redemption and notices of assignment, transfer or pledge of Units shall be effective upon receipt by the Partnership.
18.3 Binding Effect. This Agreement shall inure to and be binding upon all of the parties, their successors, assigns as permitted herein, custodians, estates, heirs and personal representatives. For purposes of determining the rights of any Partner or assignee hereunder, the Partnership and the General Partner may rely upon the Partnership records as to who are Partners and assignees, and all Partners and assignees agree that their rights shall be determined and that they shall be bound hereby, including all rights which they may have under Article 16 hereof.
18.4 Captions. Captions in no way define, limit, extend or describe the scope of this Agreement nor the effect of any of its provisions.
18.5 Counterparts. This Agreement may be executed in any number of counterparts, each of which shall be deemed to be an original, and all of such counterparts together shall constitute one and the same instrument.
IN WITNESS WHEREOF, the parties hereto have executed this Agreement on the date first appearing above.
| CAMPBELL & COMPANY, INC. |
| By: | /s/Bruce L. Cleland |
| Name: Bruce L. Cleland | |
| Title: President | |
| LIMITED PARTNERS | |
| Bruce L. Cleland as attorney-in-fact for the Limited Partners who have agreed by separate instrument to be a party hereto. | |
| /s/Bruce L. Cleland | |
| Bruce L. Cleland |
A-12
EXHIBIT B
CAMPBELL STRATEGIC ALLOCATION FUND, L.P.
REQUEST FOR REDEMPTION
Please send original to:
Campbell & Company, Inc.
Court Towers Building
210 West Pennsylvania Avenue, Suite 770
Towson, Maryland 21204
ATTN: FUND ADMINISTRATION
| Limited Partner Number |
(must be included)
Social Security Numbers/Taxpayer ID Number
Account Number
Dear Sir/Madam:
The undersigned hereby requests redemption, as defined in and subject to all the terms and conditions of the Limited Partnership Agreement of CAMPBELL STRATEGIC ALLOCATION FUND, L.P. (“Fund”), of the undersigned’s limited partnership units (“units”) in the Fund at the net asset value per unit, as described in the prospectus, as of the close of business at the end of the current month.Redemption shall be effective as of the month-end immediately following receipt by you of this request for redemption, provided that this request for redemption is received ten (10) business days prior to the end of such month.Redemption fees apply through the first twelve month ends following purchase (from and including the closing date on which the unit is purchased) as follows: 4% of net asset value per unit redeemed through the third month-end, 3% of net asset value per unit redeemed through the sixth month-end, 2% of net asset value per unit redeemed through the ninth month-end and 1% of net asset value per unit redeemed through the twelfth month-end. After the twelfth month-end following purchase of a unit, no redemption fees apply.
The undersigned hereby represents and warrants that the undersigned is the true, lawful and beneficial owner of the units to which this request for redemption relates with full power and authority to request redemption of such units. Such units are not subject to any pledge or otherwise encumbered in any fashion.
United States Taxable Limited Partners Only
Under penalty of perjury, the undersigned hereby certifies that the Social Security Number or Taxpayer ID Number indicated on this request for redemption is the undersigned’s true, correct and complete Social Security Number or Taxpayer ID Number and that the undersigned is not subject to backup withholding under the provisions of section 3406(a)(1)(C) of the Internal Revenue Code.
Non-United States Limited Partners Only
Under penalty of perjury, the undersigned hereby certifies that (a) the undersigned is not a citizen or resident of the United States or (b) (in the case of an investor which is not an individual) the investor is not a United States corporation, partnership, estate or trust.
In order for this redemption request to be processed, it is mandatory to complete the following:
Type of Redemption (check one):
| o | Full Redemption |
| o | Partial Redemption (specify number of units or dollar amount$ ) |
Remittance of Redemption Funds (check one):
| o | Forward redemption funds by mail to the undersigned at: |
| Name | Street | City, State and Zip Code |
| o Remit funds directly to brokerage account: |
Brokerage Account Number
SIGNATURE(S) MUST BE IDENTICAL TO NAME(S) IN WHICH UNITS ARE REGISTERED
| Individual Limited Partner(s) | Entity Limited Partner | |||
| Printed Limited Partner Name | Signature of Limited Partner | (Name of Entity) | ||
| By: | ||||
| Printed Limited Partner Name/ Custodian | Signature of Limited Partner/ Custodian | (Authorized Corporate Officer, Partner, Custodian or Trustee) | ||
| Client Mailing Address | ||
| Title | ||
Street City, State and Zip Code | ||
Client Phone Number | ||
Financial Advisor Name Broker/ Dealer Name | ||
Branch Address Branch Phone Number Branch Fax Number |
B-1
(This page has been left blank intentionally.)
EXHIBIT C
CAMPBELL STRATEGIC ALLOCATION FUND, L.P.
SUBSCRIPTION REQUIREMENTS
By executing the Subscription Agreement and Power of Attorney for Campbell Strategic Allocation Fund, L.P. (the “Fund”), each purchaser (“purchaser”) of limited partnership units in the Fund (“units”) irrevocably subscribes for units at a price equal to the net asset value per unit as of the end of the month in which the subscription is accepted provided such subscription is received at least five business days prior to such month end, as described in the Fund’s prospectus dated March 24, 2006 (the “prospectus”). The minimum subscription is $100,000. Limited partners who are trustees or custodians of eligible employee benefit plans and individual retirement accounts may increase their investment in the Fund with a minimum additional investment of $10,000; all other limited partners may increase their investment with a minimum additional investment of $25,000. Subscriptions must be accompanied by a check in the full amount of the subscription and made payable to “Campbell Strategic Allocation Fund, L.P.” Purchaser is also delivering to the selling agent an executed Subscription Agreement and Power of Attorney (Exhibit D to the prospectus). If purchaser’s Subscription Agreement and Power of Attorney is accepted, purchaser agrees to contribute purchaser’s subscription to the Fund and to be bound by the terms of the Fund’s Limited Partnership Agreement, attached as Exhibit A to the prospectus. Purchaser agrees to reimburse the Fund and Campbell & Company, Inc. (the “General Partner”) for any expense or loss incurred as a result of the cancellation of purchaser’s units due to a failure of purchaser to deliver good funds in the amount of the subscription price. By execution of the Subscription Agreement and Power of Attorney, purchaser shall be deemed to have executed the Limited Partnership Agreement.
As an inducement to the General Partner to accept this subscription, purchaser (for the purchaser and, if purchaser is an entity, on behalf of and with respect to each of purchaser’s shareholders, partners or beneficiaries), by executing and delivering purchaser’s Subscription Agreement and Power of Attorney, represents and warrants to the General Partner, the clearing broker and the selling agent who solicited purchaser’s subscription and the Fund, as follows:
(a) Purchaser is of legal age to execute the Subscription Agreement and Power of Attorney and is legally competent to do so. Purchaser acknowledges that purchaser has received a copy of the prospectus, including the Limited Partnership Agreement.
(b) All information that purchaser has furnished to the General Partner or that is set forth in the Subscription Agreement and Power of Attorney submitted by purchaser is correct and complete as of the date of such Subscription Agreement and Power of Attorney, and if there should be any change in such information prior to acceptance of purchaser’s subscription, purchaser will immediately furnish such revised or corrected information to the General Partner.
(c) Unless (d) or (e) below is applicable, purchaser’s subscription is made with purchaser’s funds for purchaser’s own account and not as trustee, custodian or nominee for another.
(d) The subscription, if made as custodian for a minor, is a gift purchaser has made to such minor and is not made with such minor’s funds or, if not a gift, the representations as to net worth and annual income set forth below apply only to such minor.
(e) If purchaser is subscribing in a representative capacity, purchaser has full power and authority to purchase the units and enter into and be bound by the Subscription Agreement and Power of Attorney on behalf of the entity for which he is purchasing the units, and such entity has full right and power to purchase such units and enter into and be bound by the Subscription Agreement and Power of Attorney and become a Limited Partner pursuant to the Limited Partnership Agreement which is attached to the prospectus as Exhibit A.
C-1
(f) Purchaser either is not required to be registered with the Commodity Futures Trading Commission (“CFTC”) or to be a member of the National Futures Association (“NFA”) or if required to be so registered is duly registered with the CFTC and is a member in good standing of the NFA.
(g) If the undersigned is acting on behalf of an “employee benefit plan,” as defined in and subject to the Employee Retirement Income Security Act of 1974, as amended (“ERISA”), or a “plan” as defined in and subject to Section 4975 of the Internal Revenue Code of 1986, as amended (the “Code”) (a “Plan”), the individual signing this Subscription Agreement and Power of Attorney on behalf of the undersigned hereby further represents and warrants as, or on behalf of, the Plan responsible for purchasing units (the “Plan Fiduciary”) that: (a) the Plan Fiduciary has considered an investment in the Fund for such plan in light of the risks relating thereto; (b) the Plan Fiduciary has determined that, in view of such considerations, the investment in the Fund is consistent with the Plan Fiduciary’s responsibilities under ERISA; (c) the Plan’s investment in the Fund does not violate and is not otherwise inconsistent with the terms of any legal document constituting the Plan or any trust agreement thereunder; (d) the Plan’s investment in the Fund has been duly authorized and approved by all necessary parties; (e) none of the General Partner, the Fund’s advisors, the Fund’s cash manager, the Fund’s futures brokers, any selling agent, any of their respective affiliates or any of their respective agents or employees: (i) has investment discretion with respect to the investment of assets of the Plan used to purchase units; (ii) has authority or responsibility to or regularly gives investment advice with respect to the assets of the Plan used to purchase units for a fee and pursuant to an agreement or understanding that such advice will serve as a primary basis for investment decisions with respect to the Plan and that such advice will be based on the particular investment needs of the Plan; or (iii) is an employer maintaining or contributing to the Plan; and (f) the Plan Fiduciary (i) is authorized to make, and is responsible for, the decision to invest in the Fund, including the determination that such investment is consistent with the requirement imposed by Section 404 of ERISA that Plan investments be diversified so as to minimize the risks of large losses, (ii) is independent of the General Partner, the Fund’s advisors, the Fund’s cash manager, the Fund’s futures brokers, any selling agent, each of their respective affiliates, and (iii) is qualified to make such investment decision. The undersigned will, at the request of the General Partner, furnish the General Partner with such information as the General Partner may reasonably require to establish that the purchase of the units by the Plan does not violate any provision of ERISA or the Code, including without limitation, those provisions relating to “prohibited transactions” by “parties in interest” or “disqualified persons” as defined therein.
(h) If the undersigned is acting on behalf of a trust (the “Subscriber Trust”), the individual signing the Subscription Agreement and Power of Attorney on behalf of the Subscriber Trust hereby further represents and warrants that an investment in the Trust is permitted under the trust agreement of the Subscriber Trust, and that the undersigned is authorized to act on behalf of the Subscriber Trust under the trust agreement thereof.
(i) Purchaser represents and warrants that purchaser has (i) a net worth of at least $150,000 (exclusive of home, furnishings and automobiles) or (ii) an annual gross income of at least $45,000 and a net worth (similarly calculated) of at least $45,000. Residents of the following states must meet the requirements set forth below (net worth in all cases is exclusive of home, furnishings and automobiles). In addition, purchaser may not invest more than 10% of his net worth (exclusive of home, furnishings and automobiles) in the Fund.
| 1. | Alaska — Net worth of at least $225,000 or a net worth of at least $60,000 and an annual taxable income of at least $60,000. | |
| 2. | Arizona — Net worth of at least $225,000 or a net worth of at least $60,000 and an annual taxable income of at least $60,000. | |
| 3. | California — Net worth of at least $225,000 or a net worth of at least $60,000 and an annual taxable income of at least $60,000. | |
| 4. | Iowa — Net worth of at least $225,000 or a net worth of at least $60,000 and an annual income of at least $60,000. |
C-2
| 5. | Maine — Net worth of at least $200,000, or net worth of $50,000 and an annual income of $50,000. Net worth is calculated exclusive of home, home furnishings, and automobiles. | |
| 6. | Massachusetts — Net worth of at least $225,000 or a net worth of at least $60,000 and an annual income of at least $60,000. | |
| 7. | Michigan — Net worth of at least $225,000 or a net worth of at least $60,000 and an annual gross income of at least $60,000. | |
| 8. | Minnesota — Net worth of at least $225,000 or a net worth of at least $60,000 and an annual taxable income of $60,000. | |
| 9. | Missouri — Net worth of at least $225,000 or a net worth of at least $60,000 and an annual taxable income of $60,000. | |
| 10. | New Hampshire — Net worth of at least $225,000 or a net worth of at least $60,000 and an annual income of at least $60,000. | |
| 11. | North Carolina — Net worth of at least $225,000 or a net worth of at least $60,000 and an annual taxable income of $60,000. | |
| 12. | Ohio — First-time investors must have (i) a net worth of at least $250,000 (exclusive of home, furnishings and automobiles) or (ii) an annual gross income of at least $70,000 and a net worth of at least $70,000 (exclusive of home, furnishings and automobiles). Existing investors must have (i) a net worth of at least $150,000 (exclusive of home, furnishings and automobiles) or (ii) an annual gross income of at least $45,000 and a net worth of at least $45,000 (exclusive of home, furnishings and automobiles). | |
| 13. | Oklahoma — Net worth of at least $225,000 or a net worth of at least $60,000 and an annual taxable income of $60,000. | |
| 14. | Oregon — Net worth of at least $225,000 or a net worth of at least $60,000 and an annual taxable income of $60,000. | |
| 15. | Pennsylvania — Net worth of at least $175,000 or a net worth of at least $100,000 and an annual taxable income of $50,000. | |
| 16. | Tennessee — Net worth of at least $225,000 or a net worth of at least $60,000 and an annual taxable income during the past two years and anticipated taxable income in the current year of at least $60,000. | |
| 17. | Texas — Net worth of at least $225,000 or a net worth of at least $60,000 and an annual taxable income of at least $60,000. |
C-3
(This page has been left blank intentionally.)
SPECIMEN
EXHIBIT D
CAMPBELL STRATEGIC ALLOCATION FUND, L.P.
UNITS OF LIMITED PARTNERSHIP INTEREST
SUBSCRIPTION AGREEMENT AND POWER OF ATTORNEY
Campbell Strategic Allocation Fund, L.P.
c/o Campbell & Company, Inc.
Court Towers Building
210 West Pennsylvania Avenue
Towson, Maryland 21204
Dear Sir/ Madam:
1. Subscription for Units.I hereby subscribe for the number of Units of Limited Partnership Interest (“units”) in Campbell Strategic Allocation Fund, L.P. (the “Fund”) set forth on the reverse side (minimum $100,000) of this Subscription Agreement and Power of Attorney, at net asset value per unit as set forth in the prospectus of the Fund dated March 24, 2006 (the “prospectus”). The undersigned’s check payable to “Campbell Strategic Allocation Fund, L.P.,” in the full amount of the undersigned’s subscription (additions, in excess of the required minimum investment, may be made with a minimum investment of $25,000; $10,000 in the case of trustees or custodians of eligible employee benefit plans and individual retirement accounts, as described in the prospectus), accompanies the Subscription Agreement and Power of Attorney Signature Page. If this subscription is rejected, or if no units are sold, all funds remitted by the undersigned herewith will be returned, together with any interest actually earned thereon. If this subscription is accepted, subscribers will earn additional units in lieu of interest earned on the undersigned’s subscription while held in escrow. The General Partner, in its sole and absolute discretion, accepts or rejects this subscription in whole or in part. All subscriptions once submitted are irrevocable. All units are offered subject to prior sale.
2. Representations and Warranties of Subscriber.I have received the prospectus. By submitting this Subscription Agreement and Power of Attorney I am making the representations and warranties set forth in “Exhibit C — Subscription Requirements” contained in the prospectus, including, without limitation, those representations and warranties relating to my net worth and annual income set forth therein.
3. Power of Attorney.In connection with my acceptance of an interest in the Fund, I do hereby irrevocably constitute and appoint the General Partner, and its successors and assigns, as my true and lawful Attorney-in-Fact, with full power of substitution, in my name, place and stead, to (i) file, prosecute, defend, settle or compromise litigation, claims or arbitrations on behalf of the Fund and (ii) make, execute, sign, acknowledge, swear to, deliver, record and file any documents or instruments which may be considered necessary or desirable by the General Partner to carry out fully the provisions of the Limited Partnership Agreement of the Fund, which is attached as Exhibit A to the prospectus, including, without limitation, the execution of the said Agreement itself and by effecting all amendments permitted by the terms thereof. The Power of Attorney granted hereby shall be deemed to be coupled with an interest and shall be irrevocable and shall survive, and shall not be affected by, my subsequent death, incapacity, disability, insolvency or dissolution or any delivery by me of an assignment of the whole or any portion of my interest in the Fund.
4. Irrevocability; Governing Law.I hereby acknowledge and agree that I am not entitled to cancel, terminate or revoke this subscription or any of my agreements hereunder after the Subscription Agreement and Power of Attorney has been submitted (and not rejected) and that this subscription and such agreements shall survive my death or disability, but shall terminate with the full redemption of all my units in the Fund. This Subscription Agreement and Power of Attorney shall be governed by and interpreted in accordance with the laws of the State of Delaware.
READ AND COMPLETE REVERSE SIDE
D-1
SPECIMEN
REVISED 3/24/06
EXHIBIT D
Signature Page
CSAF
SUBSCRIPTION AGREEMENT AND POWER OF ATTORNEY
IMPORTANT: READ REVERSE SIDE BEFORE SIGNING
The investor named below, by execution and delivery of this Subscription Agreement and Power of Attorney, by payment of the purchase price for Units of Limited Partnership Interest in Campbell Strategic Allocation Fund, L.P. and by either (i) enclosing a check payable to“Campbell Strategic Allocation Fund, L.P.,”or (ii) authorizing the Selling Agent (or Additional Seller, as the case may be) to debit investor’s customer securities account in the amount set forth below, hereby subscribes for the purchase of units at net asset value per unit.
The named investor further acknowledges receipt of the prospectus of the Fund dated March 24, 2006, including the Fund’s Limited Partnership Agreement, the Subscription Requirements and the Subscription Agreement and Power of Attorney set forth therein, the terms of which govern the investment in the units being subscribed for hereby.
| 1) Total $ Amount | 2) Account # (must be completed) | |||
| (minimum of $100,000; $25,000 for additional investments, $10,000 for additional investments by IRAs and other tax-exempt accounts) | o if payment is made by debit to investor’s securities account, check box | |||
| 3) Social Security | ||||
Taxable Investors (check one):
| o Individual Ownership o Partnership* o Corporation* | o Tenants in Common o Joint Tenants with Right of Survivorship o Tenants in Entirety | o Estate* o Grantor or Other Revocable Trust* o Trust other than a Grantor or Revocable Trust* | o UGMA/UTM (Minor) o Community Property |
Non-Taxable Investors (check one):
| o IRA o IRA Rollover | o Profit Sharing* o Defined Benefit* | o Pension* o SEP | o Other (specify) |
(*Appropriate authorization documents must accompany subscription, i.e., trusts, pension, estate, corporate documents)
4) o Check here if this is an addition to an existing account. Partner #:
5) Limited Partner Name
| 6) | ____________________________________________________________________________ Additional Information(For Estates, Partnerships, Trusts and Corporations) |
| 7) | Resident Address of Limited Partner |
| Street(P.O. Box not acceptable) | City State Zip Code |
| 8) | Mailing Address (if different) |
| Street | City State Zip Code |
| 9) | Custodian Name and Mailing Address |
Name Street City State Zip Code
10)
INVESTOR(S) MUST SIGN
X | X | |
Signature of Investor Date Telephone No. | Signature of Joint Investor (if any) or Custodian Date |
Executing and delivering this Subscription Agreement and Power of Attorney shall in no respect be deemed to constitute a waiver of any rights under the Securities Act of 1933 or under the Securities Exchange Act of 1934.
UNITED STATES INVESTORS ONLY
I have checked the following box if I am subject to backup withholding under the provisions of Section 3406(a)(1)(C) of the Internal Revenue Code: o. Under penalties of perjury, by signature above I hereby certify that the Social Security Number or Taxpayer ID Number next to my name is my true, correct and complete Social Security Number or Taxpayer ID Number and that the information given in the immediately preceding sentence is true, correct and complete.
NON-UNITED STATES INVESTORS ONLY
Under penalties of perjury, by signature above I hereby certify that (a) I am not a citizen or resident of the United States or (b) (in the case of an investor which is not an individual) the investor is not a United States corporation, partnership, estate or trust.
11)
FINANCIAL ADVISOR MUST SIGN
I hereby certify that I have informed the investor of all pertinent facts relating to the risks, tax consequences, liquidity, marketability, management and control of the General Partner with respect to an investment in the units, as set forth in the prospectus dated March 24, 2006. I have also informed the investor of the unlikelihood of a public trading market developing for the units.
I have reasonable grounds to believe, based on information obtained from this investor concerning his/ her investment objectives, other investments, financial situation and needs and any other information known by me, that investment in the Fund is suitable for such investor in light of his/ her financial position, net worth and other suitability characteristics.
The Financial Advisor MUST sign below in order to substantiate compliance with NASD Rule 2810.
X | X | |
Financial Advisor Signature Date | Office Manager Signature Date | |
| (if required by Selling Agent procedures) |
12) | ||||||||||||
| Selling Firm | F.A. Name | F.A. Number | ||||||||||
| (print clearly for proper credit) | ||||||||||||
| F.A. Phone F.A. Fax F.A. Email Address | ||||||||||||
| F.A. Address (for confirmations) | Street(P.O. Box not acceptable) City State Zip Code | |||||||||||
D-2
(This page has been left blank intentionally.)
(This page has been left blank intentionally.)
(This page has been left blank intentionally.)
March 24, 2006
PART II
INFORMATION NOT REQUIRED IN PROSPECTUS
Item 13. Other Expenses of Issuance and Distribution.
Campbell & Company will continue to advance certain of the offering expenses, as described in the Prospectus, for which it shall be reimbursed by the Registrant in monthly installments throughout the offering period up to the lesser of the actual amount of offering expenses advanced by Campbell & Company, Inc. or 2.5% of the aggregate subscriptions accepted by Campbell & Company. Offering expenses related to the initial offering and the continuing offering prior to the date of the Prospectus included in this Registration Statement have been incurred. Such expenses are included in the 2.5% maximum described above but are not reflected in the figures below. The following is an estimate of the expenses for the next nine-month period:
| Approximate | |||||
| Amount | |||||
| Printing Expenses | $ | 400,000 | |||
| Fees of Certified Public Accountants | $ | 25,000 | |||
| Blue Sky Expenses (Excluding Legal Fees) | $ | 500,000 | |||
| Fees of Counsel | $ | 250,000 | |||
| Escrow Fees | $ | 5,000 | |||
| Salaries of Employees Engaged in Sales Activity | $ | 7,800,000 | |||
| Miscellaneous Offering Costs | $ | 20,000 | |||
| Total | $ | 9,000,000 | |||
Item 14. Indemnification of Directors and Officers.
Article 15 of the Amended Agreement of Limited Partnership (attached as Exhibit A to the Prospectus which forms a part of this Registration Statement) provides for the indemnification of the General Partner and certain of its controlling persons by the Registrant in certain circumstances. Such indemnification is limited to claims sustained by such persons in connection with the Registrant; provided that such claims were not the result of negligence or misconduct on the part of Campbell & Company or such controlling persons. The Registrant is prohibited from incurring the cost of any insurance covering any broader indemnification than that provided above. Advances of Registrant funds to cover legal expenses and other costs incurred as a result of any legal action initiated against Campbell & Company by a Limited Partner are prohibited unless specific court approval is obtained.
Item 15. Recent Sales of Unregistered Securities.
On May 11, 1993, one Unit of limited partnership interest was sold to an individual affiliated with Campbell & Company in order to permit the filing of a Certificate of Limited Partnership for the Registrant. The sale of this Unit was exempt from registration under the Securities Act of 1933 pursuant to Section 4(2) thereof. No discounts or commissions were paid in connection with the sale, and no other offeree or purchaser was solicited. There have been no other unregistered sales of Units.
II-1
Item 16. Exhibits and Financial Statement Schedules.
The following documents (unless indicated) are filed herewith and made a part of this Registration Statement.
(a) Exhibits
| Exhibit | ||||
| Number | Description of Document | |||
| 1.01 | Form of Selling Agreement among the Partnership, the General Partner, PaineWebber Incorporated and the Selling Agent.(5) | |||
| 1.02 | Form of Auxiliary Selling Agreement.(4) | |||
| 1.03 | Form of Service Agreement among Steben Asset Management, Inc. the Registrant and the General Partner.(2) | |||
| 1.04 | Form of Correspondent Selling Agreement among the Partnership, the General Partner, PaineWebber Incorporated and Correspondent Selling Agents under PaineWebber Incorporated.(5) | |||
| 1.05 | Agreement to transfer and assign the rights and obligations under the Auxiliary Selling Agreement.(7) | |||
| 3.01 | Agreement of Limited Partnership of the Registrant dated May 11, 1993.(1) | |||
| 3.02 | Certificate of Limited Partnership of the Registrant.(1) | |||
| 3.03 | Amended Agreement of Limited Partnership of the Registrant (included as Exhibit A to the Prospectus). | |||
| 5.01 | Opinion of Sidley Austin LLP relating to the legality of the Units. | |||
| 8.01 | Opinion of Sidley Austin LLP with respect to federal income tax consequences. | |||
| 10.01 | Advisory Agreement between the Partnership and Campbell & Company, Inc.(1) | |||
| 10.02 | Customer Agreement between the Partnership and PaineWebber Incorporated.(1) | |||
| 10.03 | Subscription Agreement and Power of Attorney (included as Exhibit D to Prospectus) | |||
| 10.04 | Escrow Agreement between the Partnership and Mercantile Safe Deposit & Trust Company.(1) | |||
| 10.05 | International Swap Dealers Association, Inc. Master Agreement between The Partnership and ABN AMRO Bank N.V.(6) | |||
| 10.06 | International Swap Dealers Association, Inc. Master Agreement between the Partnership and Deutsche Bank AG.(6) | |||
| 16.01 | Letter regarding change in Certifying Accountant.(8) | |||
| 23.01 | Consent of Sidley Austin LLP. | |||
| 23.02 | Consent of Arthur F. Bell, Jr. & Associates, L.L.C. | |||
| 23.03 | Consent of Deloitte & Touche LLP. | |||
| (1) | This exhibit is included in exhibits filed by the Registrant as part of its Registration Statement on Form S-1 (No. 33-67164) on August 9, 1993 and is hereby incorporated herein by reference. |
| (2) | This exhibit is included in the exhibits filed by the Registrant as part of its Post-Effective Amendment No. 1 to the Registration Statement on Form S-1 (No. 33-84126) on May 22, 1995 and is hereby incorporated herein by reference. |
| (3) | This exhibit is included in exhibits filed by the Registrant as part of its Pre-Effective Amendment No. 1 to the Registration Statement on Form S-1 (No. 333-68431) on December 24, 1998 and is hereby incorporated herein by reference. |
| (4) | This exhibit is included in exhibits filed by the Registrant as part of its Registration Statement on Form S-1 (No. 333-80933) on June 17, 1999 and is hereby incorporated herein by reference. |
| (5) | This exhibit is included in exhibits filed by the Registrant as part of its Registration Statement on Form S-1 (No. 333-43250) on August 8, 2000 and is hereby incorporated herein by reference. |
| (6) | This exhibit is included in exhibits filed by the Registrant as part of its Registration Statement on Form S-1 (No. 333-61274) on May 18, 2001 and is hereby incorporated herein by reference. |
II-2
| (7) | This exhibit is included in exhibits filed by the Registrant as part of its Registration Statement on Form S-1 (No. 333-101011) on November 5, 2002 and is hereby incorporated herein by reference. |
| (8) | This exhibit is included in exhibits filed by the Registrant as part of its Report on Form 8-K (No. 000-22260) on September 27, 2005 and is hereby incorporated by reference. |
(b) Financial Statement Schedules.
No Financial Schedules are required to be filed herewith.
Item 17. Undertakings.
(a) The undersigned registrant hereby undertakes:
| (1) | To file, during any period in which offers or sales are being made, a post-effective amendment to this registration statement: |
| (i) | To include any prospectus required by section 10(a)(3) of the Securities Act of 1933; | |
| (ii) | To reflect in the prospectus any facts or events arising after the effective date of the registration statement (or the most recent post-effective amendment thereof) which, individually or in the aggregate, represent a fundamental change in the information set forth in the registration statement; | |
| (iii) | To include any material information with respect to the plan of distribution not previously disclosed in the registration statement or any material change to such information in the registration statement. |
Provided, however, that:
| (A) Paragraphs (a)(1)(i) and (a)(1)(ii) of this section do not apply if the registration statement is on Form S-8, and the information required to be included in a post-effective amendment by those paragraphs is contained in reports filed with or furnished to the Commission by the registrant pursuant to section 13 or section 15(d) of the Securities Exchange Act of 1934 that are incorporated by reference in the registration statement; and | |
| (B) Paragraphs (a)(1)(i), (a)(1)(ii) and (a)(1)(iii) of this section do not apply if the registration statement is on Form S-3 or Form F-3 and the information required to be included in a post-effective amendment by those paragraphs is contained in reports filed with or furnished to the Commission by the registrant pursuant to section 13 or section 15(d) of the Securities Exchange Act of 1934 that are incorporated by reference in the registration statement, or is contained in a form of prospectus filed pursuant to Rule 424(b) that is part of the registration statement. | |
| (2) | That, for the purpose of determining any liability under the Securities Act of 1933, each such post-effective amendment shall be deemed to be a new registration statement relating to the securities offered therein, and the offering of such securities at that time shall be deemed to be the initial bona fide offering thereof. | |
| (3) | To remove from registration by means of a post-effective amendment any of the securities being registered which remain unsold at the termination of the offering. | |
| (4) | That, for the purpose of determining liability under the Securities Act of 1933 to any purchaser: | |
| If the registrant is subject to Rule 430C, each prospectus filed pursuant to Rule 424(b) as part of a registration statement relating to an offering, other than registration statements relying on Rule 430B or other than prospectuses filed in reliance on Rule 430A, shall be deemed to be part of and included in the registration statement as of the date it is first used after effectiveness. Provided, however, that no statement made in a registration statement or prospectus that is part of the registration statement or made in a document incorporated or deemed incorporated by reference into the registration statement or prospectus that is part of |
II-3
| the registration statement will, as to a purchaser with a time of contract of sale prior to such first use, supersede or modify any statement that was made in the registration statement or prospectus that was part of the registration statement or made in any such document immediately prior to such date of first use. |
| (5) | That, for the purpose of determining liability of the registrant under the Securities Act of 1933 to any purchaser in the initial distribution of the securities: |
The undersigned registrant undertakes that in a primary offering of securities of the undersigned registrant pursuant to this registration statement, regardless of the underwriting method used to sell the securities to the purchaser, if the securities are offered or sold to such purchaser by means of any of the following communications, the undersigned registrant will be a seller to the purchaser and will be considered to offer or sell such securities to such purchaser:
| (i) | Any preliminary prospectus or prospectus of the undersigned registrant relating to the offering required to be filed pursuant to Rule 424; | |
| (ii) | Any free writing prospectus relating to the offering prepared by or on behalf of the undersigned registrant or used or referred to by the undersigned registrant; | |
| (iii) | The portion of any other free writing prospectus relating to the offering containing material information about the undersigned registrant or its securities provided by or on behalf of the undersigned registrant; and | |
| (iv) | Any other communication that is an offer in the offering made by the undersigned registrant to the purchaser. | |
(b) The undersigned registrant hereby undertakes that:
| (1) | For purposes of determining any liability under the Securities Act of 1933, the information omitted from the form of prospectus filed as part of this registration statement in reliance upon Rule 430A and contained in a form of prospectus filed by the registrant pursuant to Rule 424(b)(1) or (4), or 497(h) under the Securities Act shall be deemed to be part of this registration statement as of the time it was declared effective. | |
| (2) | For the purpose of determining any liability under the Securities Act of 1933, each post-effective amendment that contains a form of prospectus shall be deemed to be a new registration statement relating to the securities offered therein, and the offering of such securities at that time shall be deemed to be the initial bona fide offering thereof. |
(c) Insofar as indemnification for liabilities under the Securities Act of 1933 may be permitted to directors, officers and controlling persons of the registrant pursuant to the provisions described in Item 14 above, or otherwise, the registrant has been advised that in the opinion of the Securities and Exchange Commission such indemnification is against public policy as expressed in the Securities Act of 1933 and is, therefore, unenforceable. In the event that a claim for indemnification against such liabilities (other than the payment by the registrant of expenses incurred or paid by a director, officer or controlling person of the registrant in the successful defense of any such action, suit or proceeding) is asserted by such director, officer or controlling person in connection with the securities being registered, the registrant will, unless in the opinion of its counsel the matter has been settled by controlling precedent, submit to a court of appropriate jurisdiction the question whether such indemnification by it is against public policy as expressed in the Act and will be governed by the final adjudication of such issue.
II-4
SIGNATURES
Pursuant to the requirements of the Securities Act of 1933, the General Partner of the Registrant has duly caused this Post-Effective Amendment Number 2 to the Registration Statement to be signed on its behalf by the undersigned, thereunto duly authorized, in the County of Baltimore in the State of Maryland on the 2nd day of February, 2006.
| CAMPBELL STRATEGIC ALLOCATION | |
| FUND, L.P. |
| By: | Campbell & Company, Inc. |
| General Partner |
| By: | /s/BRUCE L. CLELAND |
| Bruce L. Cleland | |
| Chief Executive Officer |
Pursuant to the requirements of the Securities Act of 1933, this Post-Effective Amendment Number 2 to the Registration Statement has been signed below by the following persons on behalf of the General Partner of the Registrant in the capacities and on the date indicated.
| Signatures | Title with Registrant | Date | ||
| /s/ D. KEITH CAMPBELL D. Keith Campbell | Chairman of the Board and Director | February 2, 2006 | ||
| /s/ BRUCE L. CLELAND Bruce L. Cleland | President, Chief Executive Officer and Director (Principal Executive Officer) | February 2, 2006 | ||
| /s/ THERESA D. BECKS Theresa D. Becks | Chief Financial Officer, Secretary, Treasurer and Director (Principal Financial Officer) | February 2, 2006 | ||
| /s/ WILLIAM C. CLARKE, III William C. Clarke, III | Executive Vice President and Director | February 2, 2006 | ||
| /s/ JAMES M. LITTLE James M. Little | Executive Vice President and Director | February 2, 2006 |
(Being the principal executive officer, the principal financial and accounting officer and a majority of the directors of Campbell & Company, Inc.)
| CAMPBELL & COMPANY, INC. | General Partner of Registrant | February 2, 2006 | ||
| By: /s/ BRUCE L. CLELAND Bruce L. Cleland Chief Executive Officer | ||||
II-5
INDEX TO EXHIBITS
| Exhibit | ||||
| Number | Description of Document | |||
| 5.01 | Opinion of Sidley Austin LLP relating to the legality of the units. | |||
| 8.01 | Opinion of Sidley Austin LLP with respect to federal income tax consequences. | |||
| 23.01 | Consent of Sidley Austin LLP. | |||
| 23.02 | Consent of Arthur F. Bell, Jr. & Associates, L.L.C. | |||
| 23.03 | Consent of Deloitte & Touche LLP. | |||