Exhibit 99.1

NI 43-101 TECHNICAL REPORT AND UPDATED MINERAL RESOURCE ESTIMATE ON THE LEMARCHANT DEPOSIT SOUTH TALLY POND PROPERTY, CENTRAL NEWFOUNDLAND, CANADA
Prepared For:
NORZINC LTD
Suite 1710 - 650 West Georgia Street
Vancouver, BC V6B 4N9
Prepared By:
Michael Cullen, P.Geo.
(Independent Qualified Person)
and
Matthew Harrington, P.Geo.
(Independent Qualified Person)
and
Michael J. Vande Guchte, P.Geo.
NorZinc Ltd.
(Non-Independent Qualified Person)
Effective Date: September 20th, 2018
Report Date: October 22nd, 2018
 | NI43-101 Technical Report and Updated Resource Estimate South Tally Pond Property – Lemarchant Deposit |
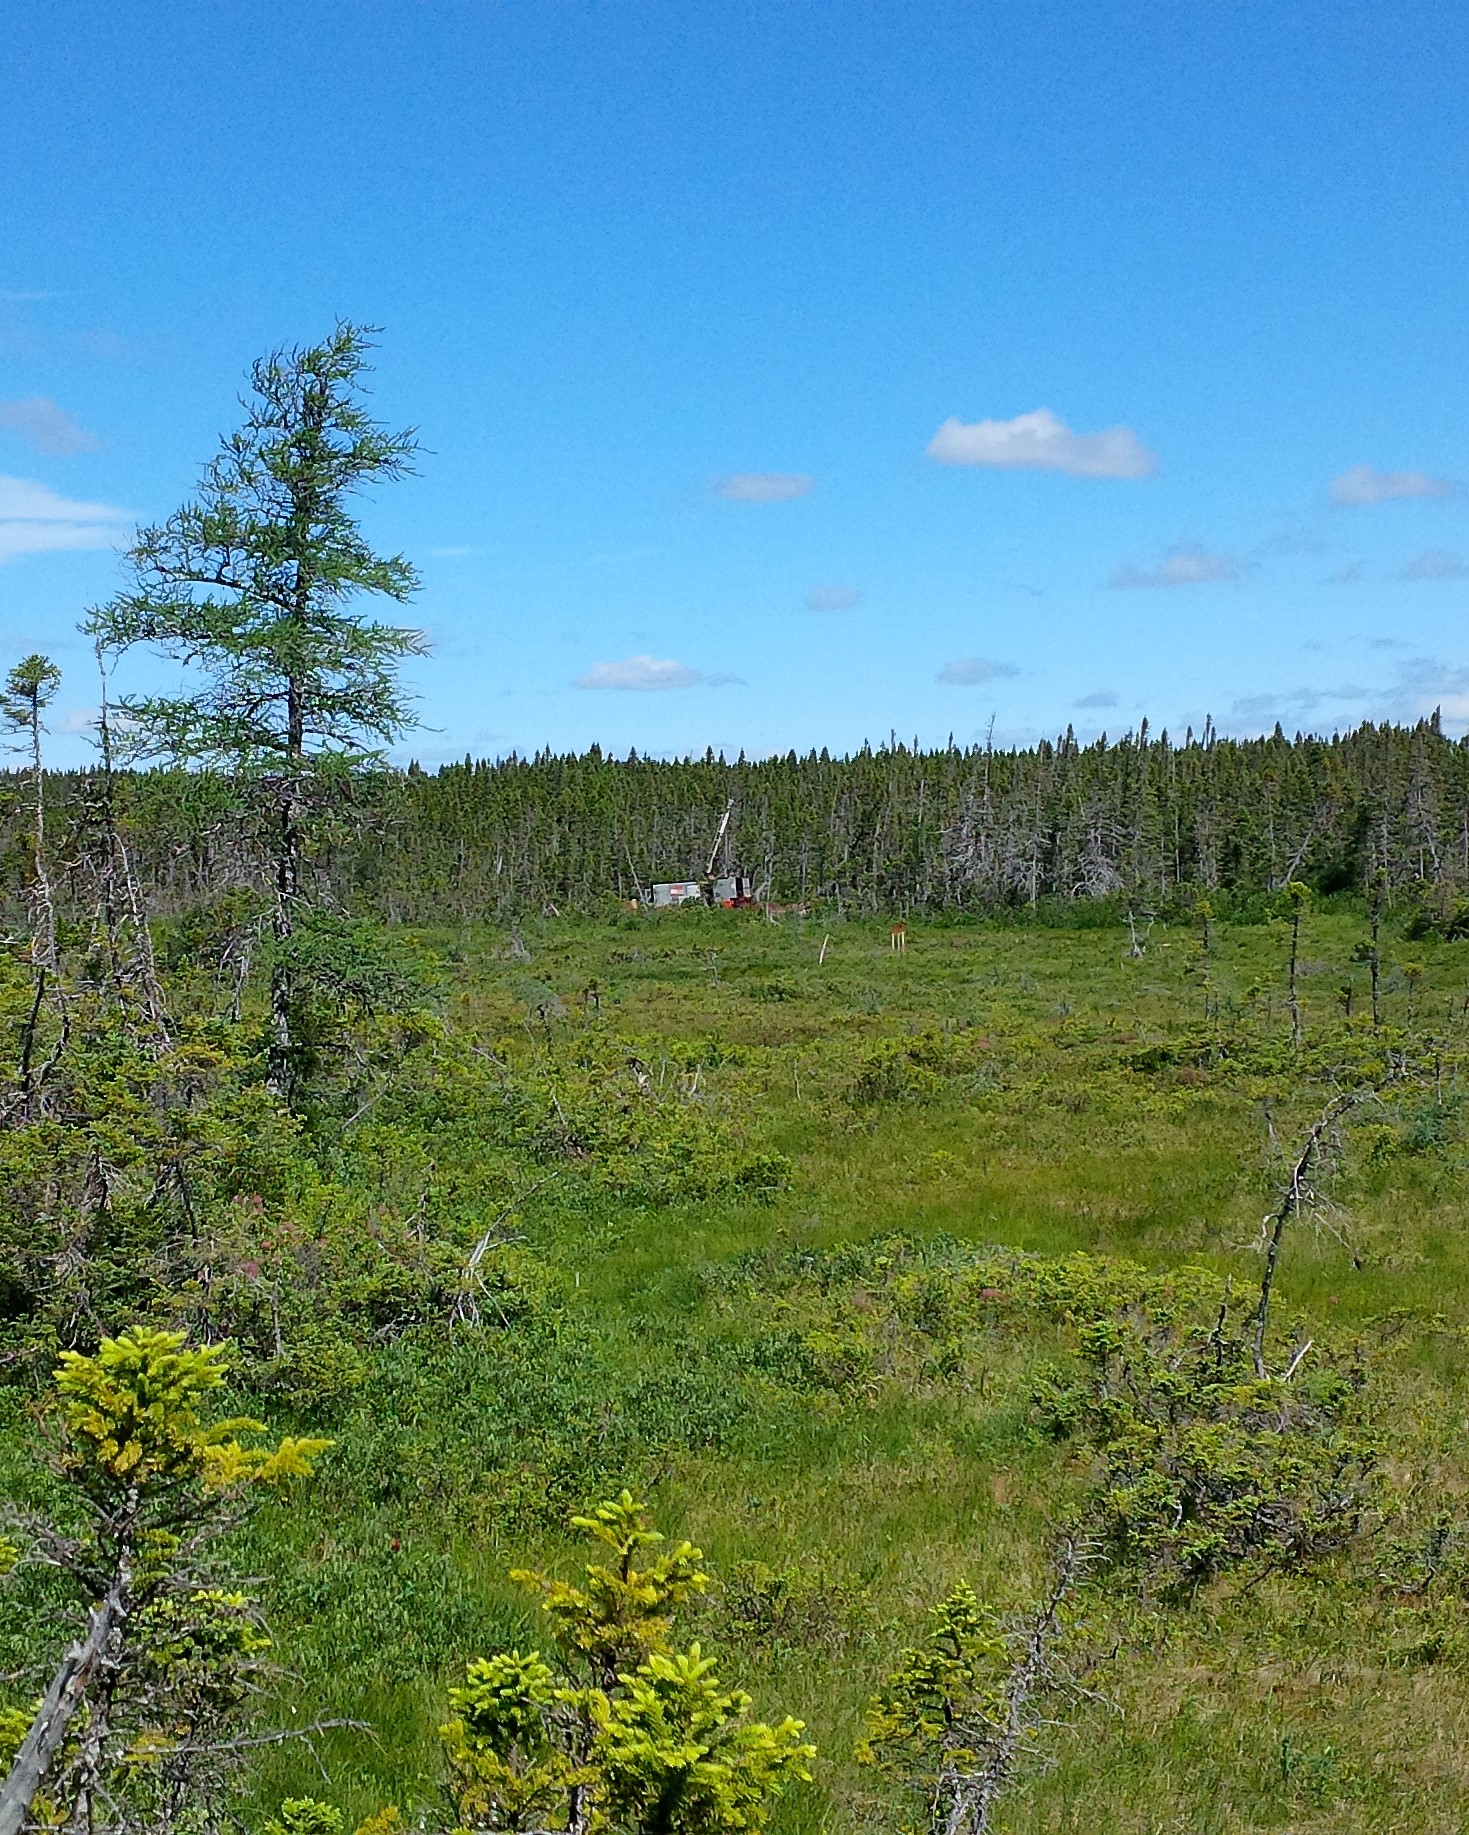
Drilling at Lemarchant Deposit - Main Zone (Summer 2017)
| | NI43-101 Technical Report and Updated Resource Estimate South Tally Pond Property – Lemarchant Deposit |
Date and Signature Page
This report, entitledNI 43-101 Technical Report and Updated Mineral Resource Estimate on the Lemarchant Deposit, South Tally Pond Property, Central Newfoundland, Canada, Effective Date: September 20th, 2018”was prepared and signed by the following authors:
| “Original signed and stamped by” | | |
| | | |
| | | |
| | | October 22, 2018 |
| Michael Cullen, P.Geo. | | Date Signed |
| | | |
| | | |
| | | |
| | | |
| “Original signed and stamped by” | | |
| | | |
| | | |
| | | October 22, 2018 |
| Matthew Harrington, P.Geo. | | Date Signed |
| | | |
| | | |
| | | |
| | | |
| “Original signed and stamped by” | | |
| | | |
| | | |
| | | October 22, 2018 |
| Michael Vande Guchte, P.Geo. | | Date Signed |
| | NI43-101 Technical Report and Updated Resource Estimate South Tally Pond Property – Lemarchant Deposit |
TABLE OF CONTENTS
| 1.0 | SUMMARY | i |
| 2.0 | INTRODUCTION | 1 |
| | 2.1 | Scope of Reporting | 1 |
| | 2.2 | Responsibility of Authors | 1 |
| | 2.3 | Site Visit | 2 |
| | 2.4 | Information Sources | 2 |
| 3.0 | RELIANCE ON OTHER EXPERTS | 3 |
| 4.0 | PROPERTY DESCRIPTION AND LOCATION | 4 |
| 5.0 | ACCESSIBILITY, CLIMATE, LOCAL RESOURCES, INFRASTRUCTURE AND PHYSIOGRAPHY | 7 |
| 6.0 | HISTORY | 8 |
| | 6.1 | Regional Exploration | 8 |
| | 6.2 | South Tally Pond Block Exploration | 10 |
| | | 6.2.1 | Lemarchant Deposit | 10 |
| | | 6.2.2 | Spencer’s Pond Prospect | 12 |
| | | 6.2.3 | Rogerson Lake Prospect | 13 |
| | | 6.2.4 | Bindons Pond Prospect | 13 |
| 7.0 | GEOLOGICAL SETTING AND MINERALIZATION | 14 |
| | 7.1 | Regional Geology | 14 |
| | 7.2 | Property Geology | 17 |
| | | 7.2.1 | Structure and Metamorphism | 20 |
| | | 7.2.2 | Mineralization | 21 |
| | 7.3 | Lemarchant Deposit Geology | 23 |
| 8.0 | DEPOSIT TYPES | 28 |
| 9.0 | EXPLORATION | 29 |
| | 9.1 | Geophysical Surveys | 29 |
| | | 9.1.1 | 2014 Gravity Orientation Survey | 29 |
| | | 9.1.2 | 2016 Surface EM, Borehole EM and Magnetometer surveys | 30 |
| | | 9.1.3 | 2017 Surface EM and Borehole EM surveys | 34 |
| | 9.2 | Structural Study - Lemarchant Deposit | 36 |
| | 9.3 | Academic Studies - Lemarchant Deposit | 37 |
| 10.0 | DRILLING | 39 |
| | 10.1 | Drilling Methodology | 40 |
| | 10.2 | Drilling Programs and Results | 41 |
| | | 10.2.1 | 2013 Winter Drill Program | 41 |
| | | 10.2.2 | 2013 Fall Drill Program | 43 |
| | | 10.2.3 | 2014 Winter Drill Program | 44 |
| | | 10.2.4 | 2014 Fall Drill Program | 44 |
| | | 10.2.5 | 2017 Winter Drill Program | 45 |
| | | 10.2.6 | 2017 Summer Drill Program | 46 |
| | | 10.2.7 | 2017 Fall Drill Program | 48 |
| 11.0 | SAMPLE PREPARATION, ANALYSES AND SECURITY | 53 |
| | 11.1 | Sample Collection, Control Samples and Shipping | 53 |
| | 11.2 | Sample Preparation | 53 |
| | 11.3 | Analytical Methods and Procedures | 53 |
| 12.0 | DATA VERIFICATION | 55 |
| | NI43-101 Technical Report and Updated Resource Estimate South Tally Pond Property – Lemarchant Deposit |
| | 12.1 | Quality Control Data | 55 |
| | | 12.1.1 | Analytical Standards | 55 |
| | | 12.1.2 | Analytical Blanks | 57 |
| | | 12.1.3 | Check Assays and Lab Duplicates | 61 |
| | 12.2 | Density Data | 67 |
| | 12.3 | Independent Data Verification and Site Visit | 67 |
| | 12.4 | Database Checking Program Completed by Mercator | 68 |
| | 12.5 | Data Verification Comments by Independent Qualified Person | 68 |
| 13.0 | MINERAL PROCESSING AND METALLURGICAL TESTING | 72 |
| | 13.1 | Sample Description, Preparation and Scope of Work | 72 |
| | | 13.1.1 | Lemarchant Metallurgical Sample | 73 |
| | | 13.1.2 | Lemarchant Grindability Test Sample | 74 |
| | | 13.1.3 | Lemarchant Dense Media Separation (DMS) Sample | 74 |
| | 13.2 | Flotation Head Sample Analysis | 74 |
| | 13.3 | Mineralogical Study | 76 |
| | | 13.3.1 | Sample Mineralogy | 76 |
| | | 13.3.2 | Copper Sulphide Association | 77 |
| | | 13.3.3 | Liberation of Sulphide Minerals (Cu, Pb, Zn) | 77 |
| | | 13.3.4 | Theoretical Grade-Recovery Curves for Cu, Pb and Zn | 79 |
| | 13.4 | Dense Media Separation (DMS) Testing | 81 |
| | 13.5 | Grindability Testing | 84 |
| | 13.6 | Acid-Base Accounting and Toxicity Characteristic Leaching Procedure Testing | 85 |
| | 13.7 | Flotation Test work | 85 |
| | | 13.7.1 | Flowsheet Selection | 86 |
| | | 13.7.2 | Flowsheet Selection - Rougher Flotation Tests | 88 |
| | | 13.7.3 | Flowsheet Selection - Cleaner Flotation Tests | 90 |
| | | 13.7.4 | Sequential Flowsheet - Grind Selection | 91 |
| | | 13.7.5 | Sequential Flowsheet - Rougher Flotation Tests | 93 |
| | | 13.7.6 | Sequential Flowsheet - Cleaner Flotation Tests | 95 |
| | 13.8 | Overall Flotation Estimated Grades and Recoveries using METSIM | 99 |
| | 13.9 | Barite Metallurgical Study | 99 |
| 14.0 | MINERAL RESOURCE ESTIMATE | 102 |
| | 14.1 | Introduction | 102 |
| | 14.2 | Geological Interpretation Used in Resource Estimation | 102 |
| | 14.3 | Overview of Estimation Procedure | 103 |
| | 14.4 | Data Validation | 104 |
| | 14.5 | Data Domains and Solid Modelling | 104 |
| | | 14.5.1 | Fault Modeling | 104 |
| | | 14.5.2 | Domain Modeling | 105 |
| | 14.6 | Drill Core Assays and High Grade Capping | 111 |
| | 14.7 | Variography and Interpolation Parameters | 115 |
| | 14.8 | Setup of Three Dimensional Block Model | 122 |
| | 14.9 | Mineral Resource Estimation | 123 |
| | 14.10 | Density | 123 |
| | 14.11 | Resource Category Definitions and Parameters Used in Current Estimate | 124 |
| | 14.12 | Zinc Equivalent Equation and Resource Cut-off Grade | 125 |
| | 14.13 | Conversion of Barium to Barite | 125 |
| | NI43-101 Technical Report and Updated Resource Estimate South Tally Pond Property – Lemarchant Deposit |
| | | ........ | ....... | |
| | 14.14 | Statement of Mineral Resource Estimate | 125 |
| | 14.15 | Model Validation | 142 |
| 15.0 | MINERAL RESERVE ESTIMATES | 144 |
| 16.0 | MINING METHODS | 144 |
| 17.0 | RECOVERY METHODS | 144 |
| 18.0 | PROJECT INFRASTRUCTURE | 144 |
| 19.0 | MARKET STUDIES AND CONTRACTS | 144 |
| 20.0 | ENVIRONMENTAL STUDIES, PERMITTING AND SOCIAL OR COMMUNITY IMPACT | 144 |
| 21.0 | CAPITAL AND OPERATING COSTS | 144 |
| 22.0 | ECONOMIC ANALYSIS | 144 |
| 23.0 | ADJACENT PROPERTIES | 145 |
| 24.0 | OTHER RELEVANT DATA AND INFORMATION | 145 |
| 25.0 | INTERPRETATION AND CONCLUSIONS | 146 |
| 26.0 | RECOMMENDATIONS | 149 |
| 27.0 | REFERENCES | 151 |
| 28.0 | AUTHOR CERTIFICATES | 161 |
| LIST OF TABLES | |
| | | |
| Table 1.1: | Qualified Person Report Responsibilities | 2 |
| Table 4.1: | Mineral Licenses - South Tally Pond Property | 4 |
| Table 9-1: | 2016 Geophysical Programs | 30 |
| Table 9-2: | 2017 Geophysical Programs | 34 |
| Table 10-1: | Diamond Drilling at Lemarchant Deposit | 39 |
| Table 10-2: | Summary of Drill Core Samples submitted to Eastern Analytical | 41 |
| Table 10-3: | Significant Assay Results from 2013 Winter Drill Program | 42 |
| Table 10-4: | Significant Assay Results from the 2013 Fall Drill Program | 43 |
| Table 10-5: | Significant Assay Results from the 2014 Winter Drill Program | 44 |
| Table 10-6: | Significant Assay Results from the 2014 Fall Drill Program | 45 |
| Table 10-7: | Significant Assay Results from the 2017 Winter Drill Program | 46 |
| Table 10-8: | Significant Assay Results from the 2017 Summer Drill Program | 47 |
| Table 10-9: | Significant Assay Results from the 2017 Fall Drill Program | 49 |
| Table 12-1: | Summary of Standards and Blanks | 55 |
| Table 12-2: | Overall Summary of Standard Performance | 56 |
| Table 12-3: | Summary of Results for Standard CDN-FCM-6 | 56 |
| Table 12-4: | Summary of Results for Standard CDN-FCM-7 | 56 |
| Table 12-5: | Summary of Results for Standard CDN-STD-1308 | 57 |
| Table 12-6: | Summary of Results for Standard CDN-STD-1405 | 57 |
| Table 13-1: | Assay Results from the 2015 Metallurgical drill program | 73 |
| Table 13-2: | Flotation Head Samples Major Element Assays | 74 |
| Table 13-3: | Flotation Head Samples Trace Element Analysis | 75 |
| Table 13-4: | Mineralogy Abundance Summary in Lemarchant MS Sample | 76 |
| Table 13-5: | Deportment of Cu in Cu-bearing Minerals in Lemarchant MS Sample | 77 |
| Table 13-6: | Liberation of Sulphide Minerals - Lemarchant MS Sample | 77 |
| Table 13-7: | Summary of Combined Sinks and Fines at 70% Overall Weight Recovery | 83 |
| Table 13-8: | Bond Work Index Test Summary | 84 |
| Table 13-9: | Summary of Acid-Base Accounting Results for Test Program Products | 85 |
| | NI43-101 Technical Report and Updated Resource Estimate South Tally Pond Property – Lemarchant Deposit |
| Table 13-10: | Metallurgical Balance for Final Lemarchant MS Rougher Flotation Reagent Scheme Test | 94 |
| Table 13-11: | Metallurgical Balance for Final Lemarchant FW Rougher Flotation Reagent Scheme Test | 95 |
| Table 13-12: | Lemarchant MS (FL-138) Final Open Circuit Third Cleaner Copper Concentrate Grades and Recoveries | 96 |
| Table 13-13: | Lemarchant MS (FL-140) Final Open Circuit Fourth Cleaner Lead Concentrate Grades and Recoveries | 97 |
| Table 13-14: | Lemarchant MS (FL-139) Final Open Circuit Third Cleaner Zinc Concentrate Grades and Recoveries | 97 |
| Table 13-15: | Lemarchant FW (FL-117) Final Open Circuit Third Cleaner Copper Concentrate Grades and Recoveries | 98 |
| Table 13-16: | Lemarchant FW (FL-117) Final Open Circuit Third Cleaner Zinc Concentrate Grades and Recoveries | 98 |
| Table 13-17: | Lemarchant MS and FW Overall Flotation Estimated Grades and Recoveries by METSIM Simulation | 99 |
| Table 13-18: | Lemarchant Barite Concentrate Specification and Analysis Summary | 100 |
| Table 14-1: | Downhole thickness (m) of the Mineral Resource solid models | 106 |
| Table 14-2: | Lemarchant Mineralized zinc, lead, copper, gold, silver, barium and density raw statistics | 112 |
| Table 14-3: | Lemarchant Upper Footwall zinc, lead, copper, gold, silver, and density raw statistics | 112 |
| Table 14-4: | Lemarchant Lower Footwall zinc, lead, copper, gold, silver, and density raw statistics | 113 |
| Table 14-5: | Lemarchant Mudstone zinc, lead, copper, gold, silver, and density raw statistics | 113 |
| Table 14-6: | Lemarchant Mineralized zinc, lead, copper, gold, silver, barium and density capped statistics | 113 |
| Table 14-7: | Lemarchant Upper Footwall zinc, lead, copper, gold, silver, and density capped statistics | 114 |
| Table 14-8: | Lemarchant Lower Footwall zinc, lead, copper, gold, silver, and density capped statistics | 114 |
| Table 14-9: | Lemarchant Mudstone zinc, lead, copper, gold, silver, and density capped statistics | 114 |
| Table 14-10: | Summary Lemarchant experimental variogram results for zinc, lead, copper, gold, silver, and barium | 115 |
| Table 14-11: | Interpolation ellipsoid ranges (m) | 122 |
| Table 14-12: | Resource block model spatial parameters | 122 |
| Table 14-13: | Included composite parameters for each interpolation pass | 123 |
| Table 14-14: | Lemarchant Mineral Resource Estimate | 126 |
| Table 14-15: | Composite zinc, lead, copper, gold, silver, barite and density statistics | 142 |
| Table 14-16: | Block zinc, lead, copper, gold, silver, barite and density statistics | 143 |
| Table 14-17: | Comparison between OK and ID2 methodologies (global estimates) | 143 |
| | | |
| LIST OF FIGURES | |
| | | |
| Figure 4-1: | Location Map - South Tally Pond Property | 5 |
| Figure 4-2: | Mineral License Map - South Tally Pond Property | 6 |
| Figure 7-1: | Tectonostratigraphic Zones of Newfoundland | 15 |
| Figure 7-2: | Regional Geology and Mineral Occurrences of the Victoria Lake Supergroup | 16 |
| Figure 7-3: | Property Geology | 18 |
| Figure 7-4: | Geology Map - Lemarchant-Spencers Pond-Rogerson Lake Area | 22 |
| Figure 7-5: | Geology Map - Lemarchant Deposit | 24 |
| Figure 7-6: | Tally Pond Stratigraphy - Duck Pond/Boundary Deposits | 27 |
| Figure 8-1: | Bimodal Felsic vent complex model with alteration and metal zones | 28 |
| Figure 9-1: | 2014 Orientation Gravity Survey | 30 |
| | NI43-101 Technical Report and Updated Resource Estimate South Tally Pond Property – Lemarchant Deposit |
| Figure 9-2: | 2016 Magnetic Survey Data | 32 |
| Figure 9-3: | 2016 Merged Magnetic Data - Total Field | 32 |
| Figure 9-4: | 2016 Merged Magnetic Data - Calculated Vertical Gradien | 33 |
| Figure 9-5: | 2016 PEM Survey Areas - Targets 2 and 5 | 33 |
| Figure 9-6: | 2016 PEM and 2017 TDEM Survey Areas - Targets 1-5 | 36 |
| Figure 10-1: | Drill hole Location Map - Lemarchant Deposit | 50 |
| Figure 10-2: | Section 102+50N - Lemarchant Deposit (Main Zone) | 51 |
| Figure 10-3: | Section 106+00N - Lemarchant Deposit (Northwest Zone) | 52 |
| Figure 12-5a: | Summary Graph of Blank Samples - Gold | 58 |
| Figure 12-5b: | Summary Graph of Blank Samples - Silver | 59 |
| Figure 12-5c: | Summary Graph of Blank Samples - Copper | 59 |
| Figure 12-5d: | Summary Graph of Blank Samples - Lead | 60 |
| Figure 12-5e: | Summary Graph of Blank Samples - Zinc | 60 |
| Figure 12-6a: | Check Assay Analysis Comparison - Gold | 62 |
| Figure 12-6b: | Check Assay Analysis Comparison - Silver | 62 |
| Figure 12-6c: | Check Assay Analysis Comparison - Copper | 63 |
| Figure 12-6d: | Check Assay Analysis Comparison - Lead | 63 |
| Figure 12-6e: | Check Assay Analysis Comparison - Zinc | 64 |
| Figure 12-7a: | Lab Pulp Duplicate Check Analysis - Gold | 64 |
| Figure 12-7b: | Lab Pulp Duplicate Check Analysis - Silver | 65 |
| Figure 12-7c: | Lab Pulp Duplicate Check Analysis - Copper | 65 |
| Figure 12-7d: | Lab Pulp Duplicate Check Analysis - Lead | 66 |
| Figure 12-7e: | Lab Pulp Duplicate Check Analysis - Zinc | 66 |
| Figure 12-8: | Mercator check sample results for Zn | 69 |
| Figure 12-9: | Mercator check sample results for Pb | 69 |
| Figure 12-10: | Mercator check sample results for Cu | 70 |
| Figure 12-11: | Mercator check sample results for Ag | 70 |
| Figure 12-12: | Mercator check sample results for Au | 71 |
| Figure 12-13: | Mercator specific gravity check sample results | 71 |
| Figure 13-1: | Liberation of Sulphide Minerals | 79 |
| Figure 13-2: | Mineralogical Cu Grade-Recovery Curve | 79 |
| Figure 13-3: | Mineralogical Zn Grade-Recovery Curve | 80 |
| Figure 13-4: | Mineralogical Pb Grade-Recovery Curve | 80 |
| Figure 13-5: | Dense Media Separation Flowchart | 81 |
| Figure 13-6: | Dense Media Separation Sample Preparation | 82 |
| Figure 13-7: | Bond Ball Mill Work Index SGS Database | 84 |
| Figure 13-8: | Bulk Copper/Lead and Zinc Flotation Flowsheet | 86 |
| Figure 13-9: | Sequential Copper, Lead and Zinc Flotation Flowsheet | 87 |
| Figure 13-10: | Bulk Rougher Flotation | 89 |
| Figure 13-11: | Sequential Rougher Flotation | 89 |
| Figure 13-12: | Lemarchant MS Grade-Recovery Relationship for Cu, Pb, Zn Concentrates. | 91 |
| Figure 14-1: | Isometric view to the northwest of the 3D fault surfaces (D1 = Red, D2 = Blue) | 105 |
| Figure 14-2: | Isometric view to the southwest of the Mineral Resource geological solid models (Red = Mineralized, Blue = Upper Footwall, Cyan = Lower Footwall, Yellow = Mudstone) | 107 |
| Figure 14-3: | Isometric view to the northwest of the Mineral Resource Main Zone geological solid models (Red = Mineralized, Blue = Upper Footwall, Cyan = Lower Footwall, Yellow = Mudstone) | 107 |
| | NI43-101 Technical Report and Updated Resource Estimate South Tally Pond Property – Lemarchant Deposit |
| Figure 14-4: | Isometric view to the northwest of the Mineral Resource Main Zone Mineralized solid model | 108 |
| Figure 14-5: | Isometric view to the northwest of the Mineral Resource Main Zone Upper Footwall solid model | 108 |
| Figure 14-6: | Isometric view to the northwest of the Mineral Resource Main Zone Lower Footwall solid model | 109 |
| Figure 14-7: | Isometric view to the northwest of the Mineral Resource Main Zone Mudstone solid model | 109 |
| Figure 14-8: | Isometric view to the southeast of the Mineral Resource Northwest Zone geological solid models (Red = Mineralized, Blue = Upper Footwall) | 110 |
| Figure 14-9: | Isometric view to the southeast of the Mineral Resource Northwest Zone Mineralized solid model | 110 |
| Figure 14-10: | Isometric view to the southeast of the Mineral Resource Northwest Zone Footwall solid model | 111 |
| Figure 14-11: | Downhole experimental variogram of zinc assay composites for Main Zone | 116 |
| Figure 14-12: | Downhole experimental variogram of lead assay composites for Main Zone | 116 |
| Figure 14-13: | Downhole experimental variogram of copper assay composites for Main Zone | 117 |
| Figure 14-14: | Downhole experimental variogram of gold assay composites for Main Zone | 117 |
| Figure 14-15: | Downhole experimental variogram of silver assay composites for Main Zone | 118 |
| Figure 14-16: | Downhole experimental variogram of barium assay composites for Main Zone | 118 |
| Figure 14-17: | Directional experimental variograms of zinc assay composites for Main Zone | 119 |
| Figure 14-18: | Directional experimental variograms of lead assay composites for Main Zone | 119 |
| Figure 14-19: | Directional experimental variograms of copper assay composites for Main Zone | 120 |
| Figure 14-20: | Directional experimental variograms of gold assay composites for Main Zone | 120 |
| Figure 14-21: | Directional experimental variograms of silver assay composites for Main Zone | 121 |
| Figure 14-22: | Directional experimental variograms of barium assay composites for Main Zone | 121 |
| Figure 14-23: | Isometric southwest view of Zn Eq. % block model grade distribution at 4% Zn Eq. cutoff | 127 |
| Figure 14-24: | Isometric southwest view of Zn % block model grade distribution at 4% Zn Eq. cutoff | 127 |
| Figure 14-25: | Isometric southwest view of Pb % block model grade distribution at 4% Zn Eq. cutoff | 128 |
| Figure 14-26: | Isometric southwest view of Cu % block model grade distribution at 4% Zn Eq. cutoff | 128 |
| Figure 14-27: | Isometric southwest view of Au g/t block model grade distribution at 4 % Zn Eq. cutoff | 129 |
| Figure 14-28: | Isometric southwest view of Ag g/t block model grade distribution at 4 % Zn Eq. cutoff | 129 |
| Figure 14-29: | Isometric southwest view of BaSO4 % block model grade distribution at 4 % Zn Eq. cutoff | 130 |
| Figure 14-30: | Isometric northeast view of Zn Eq. % block model grade distribution at 4 % Zn Eq. cutoff | 130 |
| Figure 14-31: | Isometric northeast view of Zn % block model grade distribution at 4 % Zn Eq. cutoff | 131 |
| Figure 14-32: | Isometric northeast view of Pb % block model grade distribution at 4 % Zn Eq. cutoff | 131 |
| Figure 14-33: | Isometric northeast view of Cu % block model grade distribution at 4 % Zn Eq. cutoff | 132 |
| Figure 14-34: | Isometric northeast view of Au g/t block model grade distribution at 4 % Zn Eq. cutoff | 132 |
| Figure 14-35: | Isometric northeast view of Ag g/t block model grade distribution at 4 % Zn Eq. cutoff | 133 |
| Figure 14-36: | Isometric northeast view of BaSO4 % block model grade distribution at 4 % Zn Eq. cutoff | 133 |
| Figure 14-37: | Plan view of block category distribution at 4% Zn Eq. cutoff | 134 |
| Figure 14-38: | Isometric southwest view of block category distribution at 4% Zn Eq. cutoff | 134 |
| Figure 14-39: | Lemarchant Deposit Zn Eq. % grade - tonnage chart | 135 |
| | NI43-101 Technical Report and Updated Resource Estimate South Tally Pond Property – Lemarchant Deposit |
| Figure 14-40: | Lemarchant Main and Northwest Zone Zn Eq.% grade - tonnage chart | 135 |
| Figure 14-41: | Lemarchant Deposit Zn % grade tonnage chart | 136 |
| Figure 14-42: | Lemarchant Main and Northwest Zone Zn % grade tonnage chart | 136 |
| Figure 14-43: | Lemarchant Deposit Pb % grade tonnage chart | 137 |
| Figure 14-44: | Lemarchant Main and Northwest Zone Pb % grade tonnage chart | 137 |
| Figure 14-45: | Lemarchant Deposit Cu % grade tonnage chart | 138 |
| Figure 14-46: | Lemarchant Main and Northwest Zone Cu % grade tonnage chart | 138 |
| Figure 14-47: | Lemarchant Deposit Au g/t grade tonnage chart | 139 |
| Figure 14-48: | Lemarchant Main and Northwest Zone Au g/t grade tonnage chart | 139 |
| Figure 14-49: | Lemarchant Deposit Ag g/t grade tonnage chart | 140 |
| Figure 14-50: | Lemarchant Main and Northwest Zone Ag g/t grade tonnage chart | 140 |
| Figure 14-51: | Lemarchant Deposit BaSO4 % grade tonnage chart | 141 |
| Figure 14-52: | Lemarchant Main and Northwest Zone BaSO4 % grade tonnage chart | 141 |
| | | |
| LIST OF APPENDICES | |
| | | |
| Appendix I: | Drillhole Information | End of Report |
| Appendix II: | Performance of Standard Reference Materials (Figure 12-1 to 12-4) | End of Report |
| | NI43-101 Technical Report and Updated Resource Estimate South Tally Pond Property – Lemarchant Deposit |
This National Instrument 43-101 (NI 43-101) Technical Report documents exploration work completed by NorZinc Ltd. (“NorZinc”; listed as “NZC” on the Toronto Stock Exchange) on its 100% controlled South Tally Pond Property (the “Property”) located in central Newfoundland, Newfoundland and Labrador, Canada. This report updates a previous Technical Report prepared for Paragon Minerals Corporation (“Paragon”) released March 2012 in support of an initial Mineral Resource estimate prepared for the Lemarchant Deposit (Fraser et al., 2012).
The report covers exploration work completed by NorZinc, formerly Canadian Zinc Corporation (“Canadian Zinc”) from September 2012 to June 2018 on the South Tally Pond Block of the South Tally Pond Property. The exploration target is volcanogenic massive sulphide (“VMS”) mineralization similar to other VMS deposits in the area that include the nearby Duck Pond Deposits (mined from 2007-2015 by Teck Resources Limited “Teck”) and the Buchans Deposits (mined from 1926 - 1984 by Asarco Incorporated “Asarco”). Report highlights include an updated Mineral Resource Estimate on the Lemarchant Deposit prepared in accordance with NI 43-101 and the Canadian Institute of Mining, Metallurgy and Petroleum Standards for Definition of Resources and Reserves (the CIM Standards), as amended in 2014, and results of recent metallurgical work completed on the Lemarchant Deposit.
This report was co-authored by Mr. Michael Vande Guchte, P.Geo., from NorZinc (a non-independent Qualified Person) and Mr. Michael Cullen, P.Geo., and Mr. Matthew Harrington, P. Geo., both from Mercator Geological Services Ltd. (“Mercator”). Mr. Cullen and Mr. Harrington are independent Qualified Persons as defined under NI 43-101 and are responsible for the Mineral Resource Estimate supported by this Technical Report.
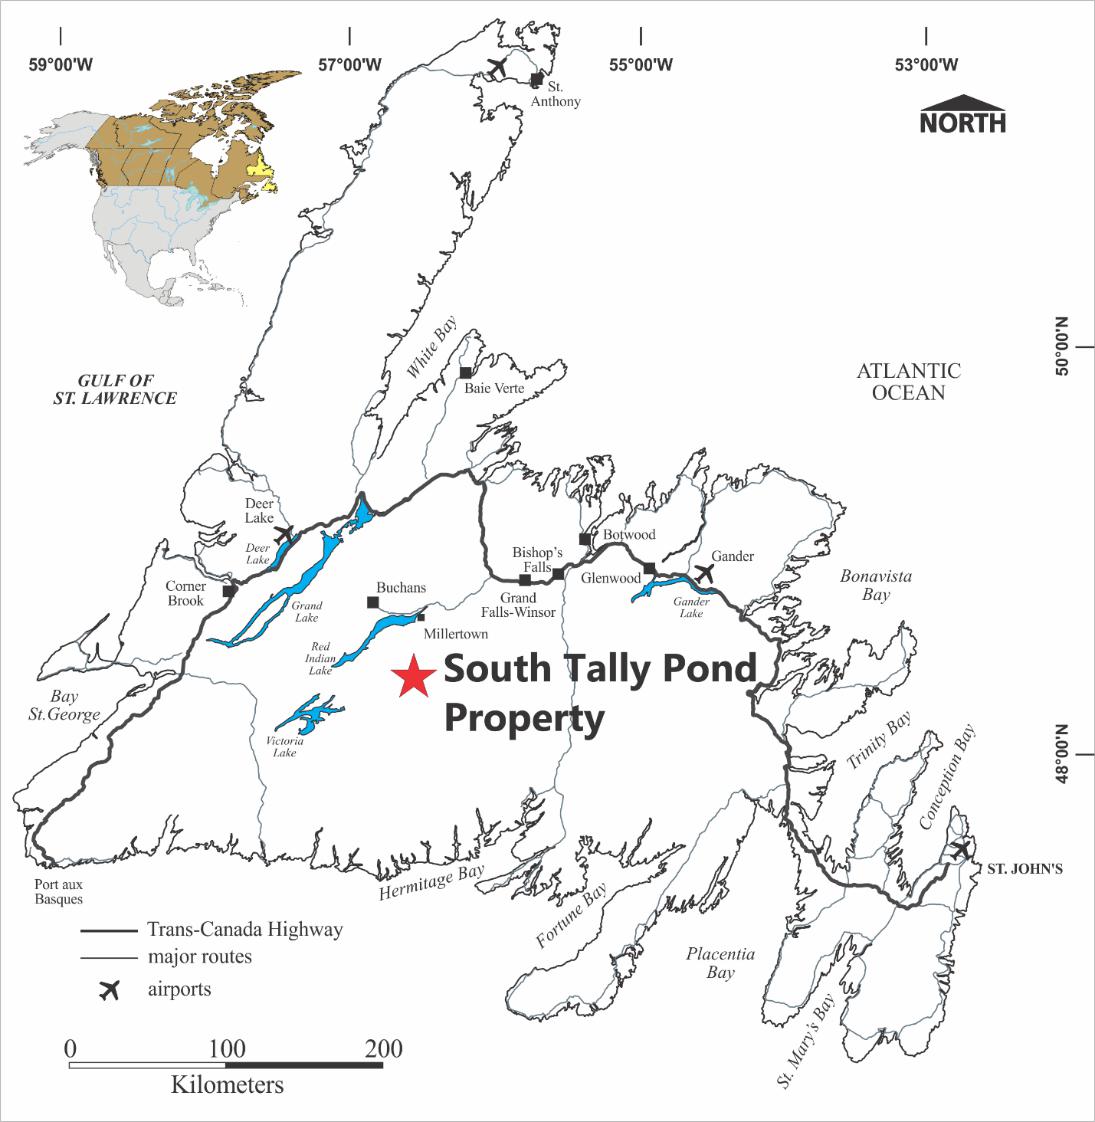
The Property is located 110 kilometres southwest of the town of Grand Falls-Windsor, NL and 35 kilometres south of the community of Millertown, NL. The Property consists of three, contiguous map staked mineral licenses (498 claims) covering 12,450 hectares immediately southwest of the past-producing Duck Pond Mine. The Property is in part subject to underlying agreements to various property vendors.
The Property and surrounding area have been explored intermittently since the late 1960’s for precious metal-rich polymetallic volcanogenic massive sulphide (VMS) deposits. The bulk of the historic exploration work in the area was completed by Noranda Inc. (Noranda) and its various partners between 1973 and 1998. This exploration work resulted in the discovery of the Duck Pond and Boundary VMS Deposits. In addition, Noranda discovered numerous other VMS prospects on the Property area including the Lemarchant, Rogerson Lake, Higher Levels, Spencers Pond and Beaver Lake prospects through geochemical and geophysical surveys. Noranda completed a limited amount of drilling in each of these areas.
| | NI43-101 Technical Report and Updated Resource Estimate South Tally Pond Property – Lemarchant Deposit |
Paragon acquired the Property in 2006 and discovered the Lemarchant massive sulphide mineralization in 2007. Between 2007 and 2011, Paragon completed a total of 21,259 metres of diamond drilling in 60 drill holes at the Lemarchant Deposit. An initial NI 43-101 Mineral Resource Estimate was completed by Paragon in 2012 (Fraser et. al., 2012) with the following results:
| • | Indicated Mineral Resource of 1.24 million tonnes grading 5.38% Zn, 0.58% Cu, 1.19% Pb, 1.01 g/t Au and 59.17 g/t Ag (15.40% ZnEQ) using a 7.5% Zn equivalent grade cut-off. |
| • | Inferred Mineral Resource of 1.34 million tonnes grading 3.70% Zn, 0.41% Cu, 0.86% Pb, 1.00 g/t Au and 50.41 g/t Ag (11.97% ZnEQ) using a 7.5% Zn equivalent grade cut-off. |
This Mineral Resource Estimate has been superseded by the Mineral Resource Estimate supported by this Technical Report and is no longer current. NorZinc is not treating this estimate as a current Mineral Resource estimate.
Canadian Zinc acquired Paragon in September 2012, and following a corporate re-organization on September 11, 2018 changed its name from Canadian Zinc Corporation to NorZinc Ltd. For current report purposes, the name “NorZinc” has been used to identify all work carried out since 2012.
Geology
The Property area is underlain by rocks of the Victoria Lake Supergroup which consists of a structurally complex, composite collage of bimodal Cambrian to Ordovician arc-related magmatic and sedimentary rocks. The Victoria Lake Supergroup is divided in to six lithotectonic volcanic-sedimentary assemblages that host numerous base metal-bearing VMS deposits, showings and extensive alteration zones, and several gold prospects and occurrences. The Tally Pond Group is the most eastern volcanic-sedimentary assemblages in the Victoria Lake Supergroup, and is host to the Duck Pond, Boundary and Lemarchant deposits. The Tally Pond Group consists of Cambrian-aged volcanic, volcaniclastic and sedimentary rocks that extend from Victoria Lake in the southwest to Burnt Pond in the northeast. The volcanic and sedimentary rocks are obscured in most areas by thick surficial deposits, so map patterns are not well constrained.
The Property is located immediately southwest of Teck’s past producing Duck Pond Copper-Zinc Mine with production of 5.1 million tonnes averaging 3.6% Cu, 6.3% Zn, 1.0% Pb, 64 g/t Ag and 0.9 g/t Au for both the Duck Pond and Boundary Deposits as reported in the provincial mineral occurrence database. The Lemarchant Deposit is located 20 km south west of the Duck Pond mine site.
The Lemarchant Deposit area is hosted by a north-striking sequence of bimodal submarine volcanic rocks (basalts and rhyolites) of the Tally Pond Group. The mineralization is hosted within a 4,000 metre long and 700 metre wide sequence of moderate to intensely altered rhyolite breccias, massive rhyolite flows and lesser felsic tuffaceous horizons. The footwall to the semi-massive to massive sulphide mineralization is characterized by a well-developed, barium-enriched base metal stringer system, with moderate to intense quartz-sericite-chlorite to quartz-chlorite alteration. The mineralization is cut-off to the east by the Lemarchant fault, an east-verging thrust fault that potentially repeats the mineralized horizon at depth in a lower felsic horizon. Steeply dipping east-west trending faults further displace the stratigraphy and mineralized zones.
| | NI43-101 Technical Report and Updated Resource Estimate South Tally Pond Property – Lemarchant Deposit |
The Lemarchant Deposit consists of two stratiform massive to semi-massive sulphide zones and underlying stringer zones termed the Main Zone (section 100+50N to 104+50N) and the Northwest Zone (section 105+00N to 107+00N). The Main Zone mineralization is located approximately 120 to 210 metres below surface, dips gently to the east, and is truncated by the Lemarchant fault down dip. The Northwest Zone is located approximately 300 to 350 metres below surface, dips gently to the west, and is truncated by gabbroic intrusion(s) to the east and by faults to the west. The massive sulphides zones vary in thickness from less than 1 metre to 30.4 metres and are generally underlain by a sequence of intensely altered and barium-enriched felsic volcanic rocks.
The Lemarchant mineralization is characterized by high-grade, zinc-lead-copper semi-massive to massive sulphides with significant precious metal (gold, silver) contents, massive mineralized barite intervals, and an underlying footwall stringer sulphide zone.
Academic studies by Gill and Piercey (2015), Lode (2016), and Cloutier (2017) provide valuable insights into the geology and genesis of the Lemarchant Deposit. These studies provide useful exploration tools or vectors to locating additional mineralization and/or new exploration targets.
Exploration and Diamond Drilling
NorZinc focused on further defining the Lemarchant Deposit by completing ground magnetic surveys (53.34 line kilometres on 2 grids), EM geophysical surveys (30.65 line kilometres at 5 target areas), an orientation gravity survey over the Lemarchant Deposit (2 lines; 62 stations) and 28,674.7 metres of diamond drilling in 91 drill holes and eight drill hole extensions. The drilling resulted in the discovery of the Northwest Zone, additional mineralization up-dip of the Main zone, and further definition of the Lemarchant Deposit. A total of 165 drill holes for 52,950 metres have been completed at the Lemarchant Deposit including 14 Noranda drill holes and 60 Paragon drill holes.
Quality Control and Data Verification
NorZinc employed a systematic quality control sampling program throughout its Lemarchant drill programs. This consisted of the insertion of a natural blank and reference standards for Au, Ag, Cu, Pb and Zn for every 20 core samples collected and submitted for analysis at Eastern Analytical Limited (Eastern Analytical) in Springdale, Newfoundland and Labrador. To verify results, NorZinc completed a check assay program for Au, Ag, Cu, Pb and Zn on randomly selected Eastern Analytical pulps from each sample batch. These pulps were submitted for analysis to ALS Canada Ltd. (ALS Canada) in North Vancouver, British Columbia.
Based on review of resulting data it was determined that the analytical dataset that supports the Lemarchant Mineral Resource Estimate described in this report meets current industry quality standards and is suitable for use in estimation of Mineral Resources. Co-author Cullen, one of the independent Qualified Persons from Mercator, completed a site visit, review of diamond drill core and quarter core check sampling program with satisfactory results from September 30-October 1, 2017.
| | NI43-101 Technical Report and Updated Resource Estimate South Tally Pond Property – Lemarchant Deposit |
Metallurgical Flotation Work
NorZinc completed additional metallurgical work on the Lemarchant Deposit as part of a larger central milling metallurgical testing program, results of which were made available in early 2017. The Company was awarded partial funding by the Research & Development Corporation of Newfoundland and Labrador (“RDC”) to undertake a research program to complete physical and metallurgical bench scale studies on five volcanogenic massive sulphide (“VMS”) deposits located in central Newfoundland. The work program was completed as part of a collaboration agreement between NorZinc and Buchans Minerals Corporation (Buchans Minerals - a wholly owned subsidiary of Minco PLC at the time), whereby, both companies agreed to jointly undertake the research program aimed at investigating the technical and economic viability of developing their respective central Newfoundland Zn-Pb-Cu-Ag-Au deposits using a central milling facility.
The metallurgical program was completed by Thibault & Associates Inc. of Fredericton, NB and included mineralogical study, grindability study, dense media separation (DMS) and flotation test work. Two metallurgical samples, one from the massive sulphide-barite zone and one from the footwall zone were utilized for the metallurgical program. Highlights of the test work include:
| • | The Lemarchant massive sulphide sample was found to be very soft (easy to grind) with its high sulphide mineral and barite content. The footwall sample was not tested. |
| • | A high degree of upgrading through DMS was achieved with the Lemarchant footwall sample with an increase in grades of copper, lead, zinc and silver by 35% to 40% with copper, lead, zinc and silver recoveries ranging from 94.6% to 97.7%. |
| • | The Lemarchant massive sulphide sample responded very well to both the bulk Cu/Pb and sequential flowsheets with high-grade rougher concentrates. |
The bench scale flotation tests provided open circuit flotation grades and recoveries at each individual process step, however, no closed circuit (lock cycle) tests were conducted. To estimate closed circuit performance and final recoveries of each metal, a METSIM mass balance simulation of the entire open circuit process was used. The final METSIM simulation parameters used to estimate the closed-circuit grade and recovery performance of the Lemarchant Deposit are as follows:
| • | Copper concentrate grade of 33.49% Cu at 79.5% recovery containing 2041 g/t Ag (44.0%) and 19.55 g/t Au (19.5%); |
| • | Lead concentrate grade of 69.56% Pb at 82.42% recovery containing 282 g/t Ag (7.08%) and 25.80 g/t Au (4.46%); |
| • | Zinc concentrate grade of 61.20% at 91.46% recovery containing 132 g/t Ag (17.09%) and 0.46 g/t Au (4.46%) |
| • | Silver and gold recovery is 68.22% and 84.23%, respectively and reports to the three concentrates |
| | NI43-101 Technical Report and Updated Resource Estimate South Tally Pond Property – Lemarchant Deposit |
Based on the metallurgical work completed, the copper concentrate from the massive sulphide is high in arsenic (2.54%) and antimony (1.18%). The lead concentrate has relatively low levels of silver and high levels of gold. The zinc concentrates were all high grade and very clean. Lock cycle testing will be required to confirm the final METSIM simulations used to estimate the closed-circuit grade and recovery performance of the Lemarchant Deposit.
In 2018, a scoping test program was focused on assessing the ability to produce a high grade barite (BaSO4) concentrate from Lemarchant massive sulphide flotation tailings. The composition of the base metal flotation tailings was assumed to be typical of tailings from the Lemarchant base metals sequential flotation circuit. The initial bench scale tests indicate that a commercially proven flotation reagent scheme can achieve a selective barite flotation based from the Lemarchant base metal tailings. From the test data, a two stage cleaning would provide a grade of 97.75% barite. Additional flotation studies and product analysis are required to further assess the barite quality and marketability of this potential co-product.
Mineral Resource Estimate
The independent Mineral Resource Estimate was prepared by Mercator Geological Services Ltd. and is reported in accordance with NI 43-101 and the CIM Standards (as amended in 2014). The Mineral Resource Estimate is based on all drilling available to date for the project. Seventy-four diamond drill holes were used in generating the geological model with 31 of the drill holes (10,000 metres) included in the resource estimate. Outlier assays were capped and all assays within the mineralized zones were composited to 1 metre lengths. All gaps in the assay record were assigned 5 ppm for Cu, Pb, Zn, 0.001 g/t for Au and 0.01 g/t for Ag.
Metal grades were estimated using ordinary kriging and a three dimensional block model with block dimensions of 5 x 5 x 5 metres (X,Z,Y). Three dimensional geologic solids were constructed and reviewed by NorZinc staff and then provided to Mercator for review and revision prior to use in the updated mineral resource estimate.
In general, the solids were limited to material grading > 1% Zn that could be demonstrated to be correlative with definable stratabound zones. Typically, solids were extended no more than 50 metres up-dip, down-dip and along strike from a controlling drillhole. One mineralized solid was constructed for the mineral resource estimate and extends to a vertical depth of 210 metres. Blocks were classified as Indicated or Inferred based on block centroid proximity to supporting data, the number of assay composites contributing to grade assignment and application of a related classification digital solid designed to eliminate artifacts such as “orphan” block classifications.
The updated Mineral Resource Estimate for the Lemarchant Deposit has an effective date of September 20th, 2018 and reflects application of a zinc equivalent (Zn Eq.) cutoff value of 4.0%.
| | NI43-101 Technical Report and Updated Resource Estimate South Tally Pond Property – Lemarchant Deposit |
Lemarchant Deposit Mineral Resource Estimate at 4.0% Zn Eq. Cutoff Effective September 20, 2018 |
| Category | Tonnes | Zn (%) | Pb (%) | Cu (%) | Au (g/t) | Ag (g/t) | Zn Eq. (%) | BaSO4 (%) |
| Indicated | 2,420,000 | 6.15 | 1.60 | 0.68 | 1.22 | 64.04 | 12.40 | 23.53 |
| Inferred | 560,000 | 4.68 | 1.08 | 0.45 | 1.06 | 44.67 | 9.31 | 13.11 |
| | | | | | | | | |
| Mineral Resource Estimate Contained Metal |
| Category | | Zn (M lbs) | Pb (M lbs) | Cu (M lbs) | Au (K oz) | Ag (M oz) | | Barite (tonnes) |
| Indicated | | 328.1 | 85.3 | 36.3 | 0.95 | 5.0 | | 570,000 |
| Inferred | | 57.8 | 13.3 | 5.6 | 0.19 | 0.8 | | 73,000 |
| 1. | Resource tonnages have been rounded to the nearest 10,000. Totals may vary due to rounding. |
| 2. | Price assumptions used were in USD $1.10/lb Zn, $1.00/lb Pb, $3.21/lb Cu, $1351/oz Au, and $19/oz Ag. |
| 3. | Metal recoveries used were 91.46% Zn, 82.42% Pb, 79.50% Cu, 84.23% Au and 68.22% Ag and are based on the 2017 Central Milling Facility Assessment prepared by Thibault & Associates Ltd. |
| 4. | Zinc Equivalent % = Zn% + ((Pb% * 22.046 * 0.8242*1.00) + (Cu% * 22.046 * 0.795 * 3.21) + (Ag g/t/31.10348 * 0.6822 * 19) + (Au g/t/31.10348 * 0.8423 * 1351))/(1.10 * 22.046 *0.9146) |
| 5. | BaSO4 % (Barite) is not included in the Zn Eq.% calculation |
| 6. | A full block grade cut-off of 4.0 % Zn Eq. was used to estimate Mineral Resources |
| 7. | Assay composites (1 metre) were capped at 36% Zn, 14.5 g/t Au, and 550 g/t Ag in the Mineralized domains, at 2.2% Cu, 4.6 g/t Au and 105 g/t Ag in the Upper Footwall domains, at 4.8% Zn and 8 g/t Ag in the Lower Footwall Domains and at 2% Zn, 5.2 g/t Au, and 48 g/t Ag in the Mudstone domains. |
| 8. | Results of an interpolated Ordinary Kriging bulk density model (g/cm3) have been applied |
| 9. | Mineral Resources are considered to reflect reasonable prospects for economic extraction in the foreseeable future using conventional underground mining methods |
| 10. | Mineral Resources do not have demonstrated economic viability. |
| 11. | This estimate of Mineral Resources may be materially affected by environmental, permitting, legal title, taxation, sociopolitical, marketing, or other relevant issues. |
Conclusions
The South Tally Pond Property that contains the Lemarchant Deposit is located in a known mining district and is underlain by volcanic rocks that are known to host massive sulphide mineralization. The exploration work at the Lemarchant Deposit has outlined a significant massive sulphide body with potential for further expansion at depth and along strike. The deposit is currently defined as two stratiform massive to semi-massive sulphide zones, identified as the Main Zone and Northwest Zone.
The Main Zone massive sulphide mineralization is located approximately 120 to 210 metres below surface, dips gently to the east, and is truncated by the Lemarchant thrust fault down dip. The Northwest Zone is located approximately 300 to 350 metres below surface, dips gently to the west, and is truncated by gabbroic intrusion(s) to the east and by thrust faults(?) to the west. The massive sulphides zones vary in thickness from less than 1 metre to 30.4 metres and are underlain by a sequence of intensely altered and barium-enriched felsic volcanic rocks. The Main Zone mineralization remains open up-dip and to the south, whereas the Northwest Zone mineralization remains open to the north and down-dip. Potential offset of the stratigraphy along east-west structures in both these areas should be considered. The Lower Felsic Block, north of the Main Zone between Section 105 to 108N contains strongly altered felsic volcanic rocks with local massive sulphide mineralization (LM08-24 EXT) and warrants further drill testing.
| | NI43-101 Technical Report and Updated Resource Estimate South Tally Pond Property – Lemarchant Deposit |
Numerous other priority targets within the South Tally Pond Property have been defined by NorZinc, such as the Lemarchant SW, Bindons Pond, Rogerson Lake, and Spencers Pond prospects. These remain underexplored and warrant further exploration.
Recommendations
Based on positive results of work completed to date at the Lemarchant Deposit, additional exploration is warranted to further assess dip and strike extensions of the deposit that remain open at present. The recommended work program for the immediate Lemarchant Deposit area consists of a combination of step-out drilling to further define the extent of the deposit plus local infill drilling to better define the existing Mineral Resource area and to potentially upgrade certain Inferred Mineral Resources to the Indicated Mineral Resource category.
Drill testing of other prospects within the South Tally Pond Property is also warranted on a priority-assessed basis. This should reflect consideration of updated exploration results for the Lemarchant SW, Bindons Pond, Rogerson Lake, and Spencers Pond prospects, in particular.
A two-phase work program and budget is recommended, with commitment to Phase 2 expenditures being contingent on substantively positive results being returned from Phase 1.
The Phase 1 program consists of 10,000 metres of diamond drilling in approximately 40 drill holes to further define the dip and strike extensions of existing Lemarchant Deposit mineralization, upgrade certain Inferred Mineral Resources to Indicated Mineral Resource status and to begin investigation of the nearby SW Lemarchant and Bindons Pond prospects. Time Domain Electromagnetic surveying (TDEM) of the latter prospect is also included to facilitate drill target definition. An estimated budget of $1.76 million (CDN) applies to the Phase 1 program.
The Phase 2 program reflects 10,000 metres of additional core drilling in 20 to 25 holes to expand Mineral Resource category upgrading at the Lemarchant Deposit. In addition, metallurgical studies required to support a Pre-feasibility level study of the Lemarchant Deposit should be completed, with associated assessment of other mineralized zones having potential for contributing to near-term future Mineral Resources. Provision for development of an updated NI 43-101 Mineral Resource Estimate for the Lemarchant Deposit, inclusive of any nearby, newly defined deposit areas is also included, along with a contingency for completion of detailed down-hole or grid geophysical surveying in drilling target areas. An estimated budget of $2.0 million (CDN) applies to the Phase 2 program.
| | NI43-101 Technical Report and Updated Resource Estimate South Tally Pond Property – Lemarchant Deposit |
This National Instrument 43-101 (NI 43-101) Technical Report documents exploration work completed by NorZinc Ltd. (“NorZinc”), formerly Canadian Zinc Corporation (“Canadian Zinc”) on its 100% controlled South Tally Pond Property (the “Property”) located in central Newfoundland, Newfoundland and Labrador, Canada. NorZinc is a Toronto Stock Exchange (TSX) listed issuer trading under the symbol NZC. This report updates a previous Technical Report prepared for Paragon Minerals Corporation (“Paragon”) released March 2012 in support of an initial Mineral Resource estimate prepared for the Lemarchant Deposit (Fraser et al., 2012).
Canadian Zinc acquired Paragon in September 2012, and following a corporate re-organization on September 11, 2018 changed its name from Canadian Zinc to NorZinc Ltd. For current report purposes, the name “NorZinc” has been used to identify all work carried out since 2012.
This report documents preparation of an independent Mineral Resource Estimate for the Lemarchant Deposit copper-lead-zinc-silver-gold (Cu-Pb-Zn-Ag-Au) volcanogenic massive sulphide (VMS) mineralization and makes recommendations regarding continued exploration of both this deposit area and nearby exploration targets. Specifically, it covers work completed by NorZinc between September 2012 and June, 2018 on the South Tally Pond Block of the Property, including highlights of metallurgical test work completed on the Lemarchant Deposit.
This report was prepared in accordance with Canadian Securities Administrators NI 43-101 and associated Form 43-101 F-1. The Mineral Resource estimate component of this report was prepared in accordance with both the Canadian Institute of Mining, Metallurgy and Petroleum (CIM) Definition Standards on Mineral Resources and Reserves - as amended on May 10, 2014 (the “CIM Standards”) and the CIM “Estimation of Mineral Resources and Mineral Reserves Best Practice Guidelines”.
| 2.2 | Responsibility of Authors |
Mr. Michael Cullen, P.Geo. and Mr. Matthew Harrington, P. Geo., both of Mercator Geological Services Limited (Mercator) are responsible for the Mineral Resource Estimate and data validation sections of this report and have reviewed all report content. Mr. Michael Vande Guchte, P.Geo, VP Exploration NL for NorZinc is responsible for compiling all other aspects of this report.
Based on their education and relevant work experience, Mr. Cullen and Mr. Harrington are independent Qualified Persons as defined by NI 43-101. Mr. Vande Guchte is a Qualified Person as defined by NI 43-101, but is not independent. Table 1.1 below outlines Qualified Person responsibilities of each author with respect to this Technical Report
| | NI43-101 Technical Report and Updated Resource Estimate South Tally Pond Property – Lemarchant Deposit |
Table 1.1: Qualified Person Report Responsibilities
| Qualified Person | Affiliated Firm | Report Item (Section) Responsibility |
| Michael P. Cullen, P. Geo. | Mercator | 12 and parts of 1, 25 and 26 |
| Matthew Harrington, P. Geo. | Mercator | 14 and parts of 1, 25 and 26 |
| Michael Vande Guchte, P.Geo. | NorZinc | 2, 3, 4, 5, 6, 7, 8, 9, 10, 11, 13, 15, 16, 17, 18, 19, 20, 21, 22, 23, 24, 27 and parts of 1, 25 and 26 |
Mr. Cullen, accompanied by Mr. Vande Guchte, completed a site visit and core review of the Lemarchant Deposit from September 30 to October 1, 2017. Collar locations for twenty-three drill holes used in the Lemarchant Deposit resource calculation were located and GPS coordinates recorded.
Mr. Cullen also examined 10 drill holes completed by NorZinc and 10 drill holes completed previously by Paragon from the Lemarchant Deposit in order to verify lithology and mineralization as described by NorZinc and Paragon geologists in drill logs and reports. The purpose of the site visit was to inspect the property, and to review drill core and exploration procedures on the project. Ten drill core intervals previously sampled and assayed by NorZinc and/or Paragon were quarter split for check analysis and verification of specific gravity measurements.
Information contained in this report is based on data collected by NorZinc from January 2013 to June 2018 on the South Tally Pond Block, as updated through September, 2018. Other sources of data include NorZinc assessment reports from 2013 to 2017, the prior NI 43-101 Technical Report from 2012 (Fraser et. al., 2012), historical reports by previous operators including assessment reports filed with the Newfoundland and Labrador Department of Mines and Energy, and various government publications.
Gold (Au) and silver (Ag) values for work performed by NorZinc are reported as grams per metric tonne (“g/t”) or parts per billion (ppb). Historic Au and Ag values are presented as originally reported and converted to g/t if required. Base metal (copper (Cu), lead (Pb) and zinc (Zn)) values are presented in parts per million (ppm) or weight percent (%). Currency is reported as Canadian (CDN) dollars unless otherwise noted.
All map coordinates are given as Universal Transverse Mercator (UTM) Projection, North American Datum 1983 (NAD83), Zone 21 coordinates, unless otherwise stated. Distances and dimensions are expressed in metres (m) or kilometres (km), unless otherwise stated.
| | NI43-101 Technical Report and Updated Resource Estimate South Tally Pond Property – Lemarchant Deposit |
| 3.0 | RELIANCE ON OTHER EXPERTS |
The independent authors (hereafter referred to as “Mercator”) have relied on information provided by NorZinc concerning the legal status of claims that form the South Tally Pond Property. Efforts were made by Mercator to review the information provided for obvious errors and omissions; however, Mercator shall not be held liable for any errors or omissions relating to the legal status of claims described in this report.
Mercator has assumed, and relied on the fact, that all the information and existing technical documents listed in the reference section of this report are accurate and complete in all material aspects. While these information sources were carefully reviewed, Mercator cannot guarantee their accuracy and completeness. Mercator reserves the right, but will not be obligated to revise this report and conclusions if additional information becomes known subsequent to the date of this report.
Copies of the tenure documents were reviewed by Mercator and an independent verification of claim title was performed using the Mineral Rights Inquiry form found on the Newfoundland and Labrador Department of Natural Resources’ webpage. Operating licenses, permits, and work contracts were not reviewed. Mercator has not reviewed or verified the legality of any underlying agreement(s) that may exist concerning the licenses or other agreement(s) between third parties but has relied on, and believes it has a reasonable basis to rely upon, Mr. Michael Vande Guchte, P.Geo., VP Exploration NL for NorZinc to have conducted the proper legal due diligence. NorZinc has also relied upon metallurgical testing information and interpretations prepared by Thibault and Associates Inc. and reported in Thibault and McKeen (2017).
Select technical data, as noted in the report, were provided by NorZinc, and Mercator has relied on the integrity of such data. A draft copy of the Technical Report was reviewed for factual errors by Mercator, which has relied on NorZinc’s knowledge of the Property in this regard. All statements and opinions expressed in this document are given in good faith and in the belief that such statements and opinions are not false and misleading at the date of this report.
| | NI43-101 Technical Report and Updated Resource Estimate South Tally Pond Property – Lemarchant Deposit |
| 4.0 | PROPERTY DESCRIPTION AND LOCATION |
The South Tally Pond Property is located in central Newfoundland, approximately 110 road kilometres southwest of the town of Grand Falls-Windsor (Figure 4-1). The Property is located on NTS map sheets 12A/10 (Lake Ambrose) and 12A/07 (Snowshoe Pond) centered at approximately 521000E / 5375000N.
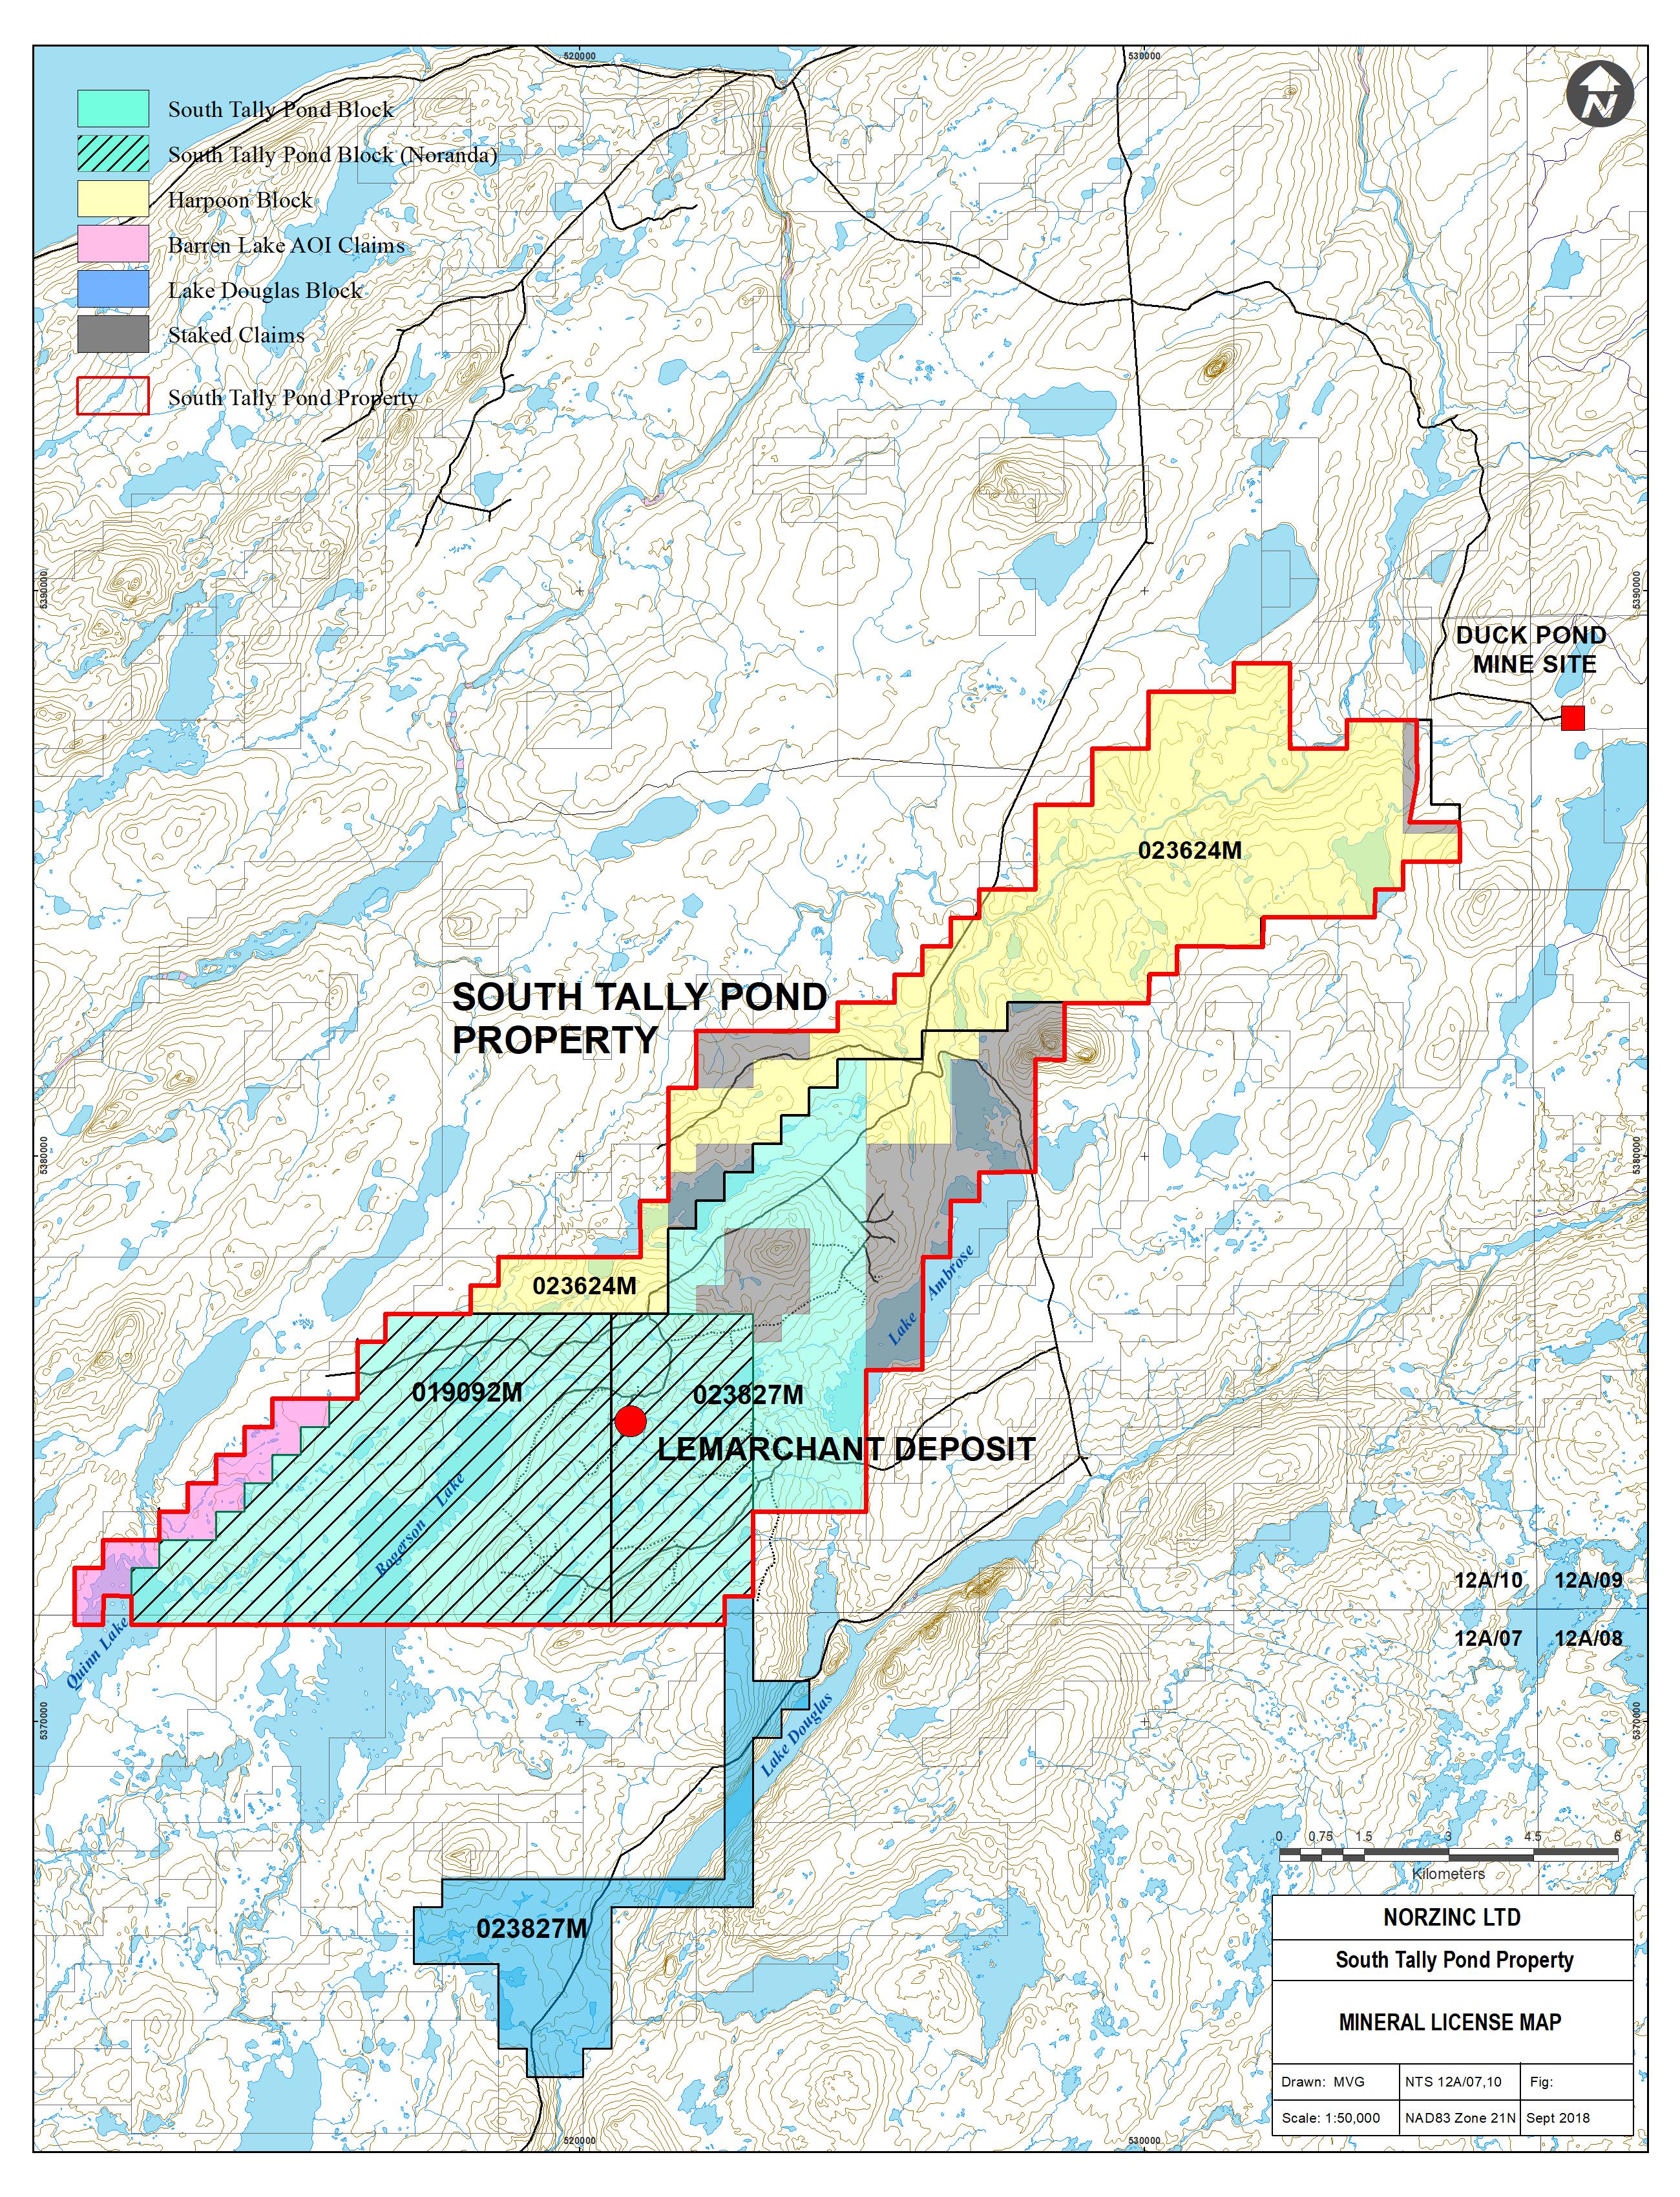
The Property consists of three contiguous map-staked mineral licenses (498 claims) covering 12,450 hectares (Table 4.1, Figure 4-2). The mineral licenses are 100%-owned by Paragon Minerals Corporation, a wholly owned subsidiary of NorZinc Ltd.
Table 4.1: Mineral Licenses - South Tally Pond Property
| Mineral Licence | Registered Holder | NTS | Claims | Area (Ha) | Anniversary Date |
| 019092M | Paragon Minerals Corporation | 012A/07,10 | 151 | 3775 | 29-Jan-19 |
| 023624M | Paragon Minerals Corporation | 012A/10 | 174 | 4350 | 29-Jan-19 |
| 023827M* | Paragon Minerals Corporation | 012A/07,10 | 173 | 4325 | 29-Jan-19 |
* Mineral license 023827M forms part of the South Tally Pond property and part of the Lake Douglas property.
A majority of the South Tally Pond property is subject to underlying agreements including the South Tally Pond Block, Harpoon Block and an Area of Interest (“AOI”) from a previously held neighboring property.
| 1. | The South Tally Pond Block was optioned by Paragon from Altius Resources Inc. (”Altius”) in 2006 of which a portion of the block is subject to an underlying agreement with Noranda Inc. (now Glencore Canada Corporation (“Glencore”)). The option agreement with Altius was successfully completed in 2012, and remains subject to the underlying Noranda Agreement. Under the Noranda Agreement, there is a 2.0% Net Smelter Royalty (”NSR”) payable to Glencore. Upon commencement of commercial production, Glencore is entitled to a cash payment of $2,000,000 and retains the right to purchase the concentrate. |
In 2017, Glencore contributed its underlying South Tally Pond interest to BaseCore Metals LP, a 50:50 joint venture limited partnership with the Ontario Teachers’ Pension Fund (Glencore News Release, December 5, 2017)
| 2. | The Harpoon Block remains subject to the Harpoon Property Agreement wherein a 2.0% NSR is payable to the property vendors of which Paragon can purchase 1.0% for $1.0 million. Paragon has the right of first refusal on the remaining 1.0% NSR. |
| 3. | The Barren Lake AOI remains subject the Barren Lake Property Agreement wherein a 2.5% NSR is payable to the property vendors of which Paragon can purchase 1.5% for $1.5 million. Paragon has the right of first refusal on the remaining 1.0% NSR. |
| | NI43-101 Technical Report and Updated Resource Estimate South Tally Pond Property – Lemarchant Deposit |
The remaining staked claims are not subject to any underlying agreements or Area of Interest.
The Lake Douglas Block (52 claims, 1300 hectares) is not part of the South Tally Pond property, but makes up the south part of mineral license 023827M and is referred to as the Lake Douglas property. The Lake Douglas property remains subject to the Lake Douglas Agreement wherein a 2.0% NSR is payable to the property vendors of which Paragon can purchase 1.0% for $1.0 million. Paragon has the right of first refusal on the remaining 1.0% NSR.
Figure 4-1: Location Map - South Tally Pond Property
| | NI43-101 Technical Report and Updated Resource Estimate South Tally Pond Property – Lemarchant Deposit |
Figure 4-2: Mineral License Map - South Tally Pond Property
| | NI43-101 Technical Report and Updated Resource Estimate South Tally Pond Property – Lemarchant Deposit |
| 5.0 | ACCESSIBILITY, CLIMATE, LOCAL RESOURCES, INFRASTRUCTURE AND PHYSIOGRAPHY |
The Property area is accessible by well-maintained logging/mining roads originating from a paved highway at Millertown, a community of 100 people (2006 census), located 35 kilometres to the north of the Property. Secondary logging roads and logging trails provide good access to various parts of the Property, including truck access to the Lemarchant Deposit.
The climate is characterized by relatively cold winters and warmer summers compared to coastal regions of Newfoundland. Average historic Environment Canada (1971 to 2000) daytime high temperatures for the community of Buchans (the nearest recording station) range from an average winter low of -9.1oC in February to an average summer high of 16.2oC in July. Mean annual precipitation for the area totals 1,204 mm. On average, 27% of the precipitation falls as snow, mostly from December to March. Average maximum snow depth for the month of February is 61 cm with a historic extreme snow depth of 210 cm for March.
Topography is moderate to gentle, with a maximum elevation of 427 metres above sea level, and a total relief of 147 metres. East of Rogerson Lake the terrain consists of two northeast trending ridges separated by a flat, partially bog-covered valley. West of Rogerson Lake the terrain is flat, with extensive bog cover. Bogs collectively cover 20-25% of the property, and small ponds and streams are abundant throughout. The remainder of the property is forested with fir and spruce, which is interspersed with minor larch, alder, birch and aspen. Approximately half of the forest is a mature re-growth after pre-1960s logging; the other half is young re-growth (post-1980s-1990s).
Bedrock exposure is moderate along the hills and ridges east of Rogerson Lake, with very minimal exposure in the lower lying areas, and adjacent to Lake Ambrose along the eastern property margin. Rogerson Lake marks a physiographic change from an area of relatively thin overburden in the east to a flat, glacial boulder strewn area with thick overburden to the west. There is moderate outcrop at the north and northeast end of the lake; outcrop is essentially non-existent west of Rogerson Lake.
The nearest major centre to the property is Grand Falls-Windsor (population 14,171 - 2016 census) from which most major supplies and services can be obtained. The nearest airports are the Gander International Airport, located 160 road kilometres to the east of Millertown and the Deer Lake Regional Airport, located 230 road kilometres to the northwest of Millertown.
The property is located immediately southwest of Teck Resources Limited’s past producing Duck Pond copper-zinc mine which closed in June 2015. The mine was serviced by a well maintained all season gravel road from the community of Millertown and was powered by an overhead transmission line originating from the Starr Lake generating station (Belleau and Pelz, 2005). The Lemarchant Deposit is located 33 road kilometres southwest of the Duck Pond Mine and 10 kilometres west of an all-season gravel road that services the Granite Lake hydroelectric dam located 50 km to the south.
| | NI43-101 Technical Report and Updated Resource Estimate South Tally Pond Property – Lemarchant Deposit |
The following descriptions of historical work are modified after Fraser et al. (2012).
The South Tally Pond Property and surrounding area has been intermittently explored for base metals since the late 1960’s with the majority of the work focussing on the Duck Pond and Boundary deposits. Relatively limited exploration work was undertaken outside of these two areas, other than at the Lemarchant, Rogerson Lake, Spencers Pond and Gills Pond prospects. Limited drilling in each of these areas was generally confined to broad spaced drilling (>100 metre spacing). Outside of these four prospect areas only sporadic drilling has occurred, primarily as initial testing of short strike length airborne electromagnetic (“EM”) conductors.
Most of our historical understanding of historical exploration work in the South Tally Pond property area is based on reports by Collins (1989, 1990, 1991, 1992, 1993 and 1994), Collins and Squires (1991), Coulson (1992), MacKenzie (1985), MacKenzie and Robertson (1986), Podolsky (1988), Rogers and Collins (1989), Rogers and Squires (1988) and Reid (1979, 1980a, 1980b, 1981, 1982, 1983 and 1984) and Noranda (1998). More recent work by Paragon at the Lemarchant Deposit is documented in the initial NI43-101 Technical Report by Fraser et al. (2012).
The following two sub-sections are divided into 1) regional exploration work completed on the South Tally Pond Property outside of the South Tally Pond Block, and 2) exploration work completed within the South Tally Pond Block. A summary of the exploration and development history of the Duck Pond and Boundary deposits owned by Teck Resources Limited (Teck) is included in the Regional Exploration discussion below, but these do not form a part of the current South Tally Pond Property as defined in this Technical report.
The South Tally Pond Property area has been explored since the late 1960’s for base metal mineralization, following initial exploration work (prospecting and geochemistry) by Asarco during the 1960’s and 1970’s that includes completion of a regional airborne EM survey in 1966. Asarco drilled 3 holes testing relatively long strike length EM conductors, intersecting thick sequences of black, graphitic shale, in the Beaver Lake and Rogerson Lake areas.
In 1975, Labrador Mining and Exploration Co. Ltd. completed diamond drilling (6 holes) testing regional airborne conductors in the Harpoon Brook area (Tuffy, 1975). These drill holes intersected relatively thick sequences of graphitic shale and weakly altered felsic volcanic rocks.
The bulk of the exploration work in the area was undertaken by Noranda Inc. (“Noranda”) and its various partners from 1973 to 1998. Exploration, including three systematic airborne surveys in 1974, 1979 and 1988, resulted in the discovery of several base metal VMS deposits and occurrences (i.e. Duck Pond, Boundary, Lemarchant and Moose Pond). In addition, geological, geochemical and geophysical surveys (mainly during 1981 to 1983 and 1989 to 1992) were completed by Noranda throughout the South Tally Pond Property area resulting in the discovery of several base metal prospects (Spencers Pond, Rogerson Lake, Beaver Lake and Higher Levels prospects).
| | NI43-101 Technical Report and Updated Resource Estimate South Tally Pond Property – Lemarchant Deposit |
In 1980, the Boundary Deposit was discovered by drill testing coincident EM, gravity and till geochemistry anomalies. Between 1980 and 1985, 21 short drill holes intersected massive sulphides of variable thickness (1-20 metres) within three separate, near-surface massive sulphide zones; the North, South and Southeast zones (MacKenzie, 1988; Belleau and Pelz, 2005).
From 1985 to 1987, Noranda continued exploration to the southwest of the Boundary Deposit (in an area of coincident massive sulphide float, till anomalies and airborne EM conductors) which resulted in the discovery of the Duck Pond Deposit (Noranda, 1998; Belleau and Pelz, 2005). Early drill results from the Duck Pond Deposit included 2.7% Cu, 6.1% Zn, 0.4% Pb, 28.4 g/t Ag and 0.7 g/t Au over 10.64 metres (DP-86-85) and 2.1% Cu, 10.2% Zn, 1.2% Pb, 46.8 g/t Ag and 0.6 g/t Au over 20.25 metres (DP-87-95) (Noranda, 1998; Belleau and Pelz, 2005). Drilling from 1987 to 1991 led to the definition of the Upper Duck Deposit, the discovery of the stratigraphically lower Sleeper Zone (450 metres depth) and the Lower Duck Deposit (750 metres depth).
In 1986, Esso Minerals Canada Ltd. (“Esso”) staked claims in the Gill’s Pond area following the discovery of base metal massive sulphides at Duck Pond. Esso completed line-cutting, prospecting, geological mapping and ground EM surveys in the Gill’s Pond area (O'Sullivan, 1987). From the work, Esso concluded that the south-east strike extension of the host Duck Pond-equivalent felsic volcanic rocks were present in the Gills Pond area.
In 1987, Esso optioned the property to Rio Algom Exploration Inc. (“Rio Algom”) and between 1988 and 1989, Rio Algom completed line-cutting, ground geophysics surveys (Mag, VLF, EM) and diamond drilling. A total of 29 drill holes, totaling 5,482 metres were completed (Thicke, 1988, 1989, 1990). Most of the drill holes were shallow (<150m) and successfully intersected altered felsic volcanic rocks (sericite, chlorite, carbonate, silica, pyritization, etc.).
In 1998, Noranda completed a pre-feasibility study on the Duck Pond and Boundary Deposits including a non-NI43-101 compliant “diluted mineable ore reserves” of 4.2 million tonnes grading 3.2% Cu, 5.5% Zn, 57g/t Ag and 0.9g/t Au, including approximately 500,000 tonnes at the Boundary Deposit (Noranda, 1998; Belleau and Pelz, 2005).
In 1999, Thundermin Resources Inc. (“Thundermin”) and Queenston Mining Inc. (“Queenston”) acquired a 100% interest in the Duck Pond property from Noranda and carried out infill and definition drilling consisting of 9,300 metres in 26 drill holes at the Duck Pond Deposit and 3,000 metres in 82 drill holes at the Boundary Deposit. Based on the new drill results, Thundermin and Queenston completed a revised reserve estimate and bankable feasibility study for the Duck Pond and Boundary deposits, including a pre- NI 43-101 measured and indicated mineral resources of 5.1 million tonnes averaging 3.6% Cu, 6.3% Zn, 1.0% Pb, 64 g/t Ag and 0.9 g/t Au for both the Duck Pond and Boundary deposits (MRDI, 2001). MRDI also reported an additional inferred resource of 1.1 million tonnes grading 2.6% Cu, 5.6% Zn, 1.2% Pb, 58 g/t Ag, and 0.6 g/t Au. Both referenced Mineral Resources are historic in nature and a qualified Person as defined under NI 43-101 has not classified these in accordance with that instrument and the CIM Standards.
| | NI43-101 Technical Report and Updated Resource Estimate South Tally Pond Property – Lemarchant Deposit |
In 2002, Aur Resources Limited (“Aur”) acquired all Thundermin and Queenston interests in the Duck Pond property. Aur completed a revised feasibility study in 2003 (AMEC, 2003) and made a positive production decision in December 2004 (Belleau and Pelz, 2005). The Duck Pond Deposit achieved commercial production in April 2007. Teck purchased Aur in late 2007 and took over ownership and operatorship of the Duck Pond Mine.
In 2004, Rubicon Minerals Corporation (“Rubicon”) optioned the Harpoon property (Harpoon Block) from local prospectors. Rubicon completed data compilation, prospecting and minor trenching. The trenching by Rubicon exposed pyritic shale/mudstone in contact with mafic volcanic rocks that bear a similar appearance to the immediate hangingwall rocks to massive sulphide mineralization at the nearby Lemarchant Deposit.
In December 2006, Paragon Minerals Corporation acquired the Harpoon property as part of the Rubicon Plan of Arrangement, whereby all the Rubicon Newfoundland assets were transferred to Paragon. The Harpoon property has since been reduced to the current Harpoon Block claims.
From 2007 to 2011, Paragon completed airborne electromagnetic (EM) and magnetic geophysical surveying (2,016.6 line km in 2007 and 1,231.4 line km in 2011), prospecting and reconnaissance till sampling (167 samples) over the Harpoon, Gill’s Pond and South Tally Pond Extension blocks (Copeland, 2007; Copeland, 2008; Copeland and Devine, 2011). Paragon completed diamond drill testing of three regional target areas on the Harpoon Block including the Cookstown prospect (1 drill hole; 209.4 metres), Duck West prospect (1 drill hole; 443.9 metres) and Beaver Lake prospect (3 drill holes; 871.0 metres) (Devine, 2011; Copeland et al., 2011).
| 6.2 | South Tally Pond Block Exploration |
The following is a summary of historical work completed on the South Tally Pond Block which is the specific focus of this Technical Report and host to the Lemarchant Deposit. Three priority prospects including Rogerson Lake, Spencers Pond and Bindons Pond are located in the immediate vicinity of the Lemarchant Deposit and are described separately below.
Between 1981 and 1982 Noranda completed line-cutting of the Lemarchant grid (372-2) to follow up on airborne electromagnetic (EM) conductors. Subsequent soil sampling and ground geophysical programs (Magnetics, VLF-EM, HLEM, and EM-37) were completed by Noranda from 1982 to 1994. Initial drill testing and trenching of the area was completed in 1983 with two BQ drill holes, 372-1 and 372-2 for 171.9 metres (Reid, 1984). Each of the drill holes was successful in explaining the airborne EM conductors with intersections of graphitic argillite, exhalative pyritic mudstone and stringer base-metal mineralized, footwall felsic volcanic rocks.
| | NI43-101 Technical Report and Updated Resource Estimate South Tally Pond Property – Lemarchant Deposit |
Following the discovery of the Duck Pond Deposit in 1987, Noranda recognized that earlier work at Lemarchant had outlined a similar VMS environment to Duck Pond. From 1991 to 1993 Noranda completed 2,846 metres of drilling in 12 drill holes at Lemarchant (LM91-01 to 06, LM92-07 to 08, and LM93-09 to 12). Significant historical drill results from the Lemarchant Deposit reported in Fraser et al. (2012) include:
| • | 7.40% Zn, 0.6% Cu, 6.3% Pb, 1515.0 g/t Ag and 11.4 g/t Au, over 0.6 metres (LM91-01); |
| • | 5.70% Zn, 4.5% Cu, 0.33% Pb, 272.5 g/t Ag and 1.06 g/t Au over 0.3 metres (LM92-07); |
| • | 1.53% Zn, 59.8 g/t Ag and 6.1 g/t Au over 3.8 metres (LM92-08). |
In 2000, Altius Resource Inc. (“Altius”) optioned a portion of the South Tally Pond Block from Noranda (which Noranda called the South Tally Pond Property) and Altius staked an additional 59 claims (Mineral License 09569M). This area forms the current South Tally Pond Block.
Altius completed geological mapping, drill core re-logging, and lithogeochemical sampling from 2001 to 2003 (Smith et al. 2001; Barbour and Churchill, 2002, 2003, 2004, 2005). In 2004, Altius completed 844.9 line km of airborne HTEM survey over the property. The airborne survey confirmed known conductors and outlined new conductors in all three alteration zones outside areas of previous geophysical surveying (Barbour and Churchill, 2005). In addition, Altius completed re-logging and re-sampling of 14 drill holes from the Lemarchant Deposit. Property scale geological mapping at 1:10,000 scale and a lithogeochemical sampling program resulted in better definition of the extents of the Lemarchant and Spencer’s Pond area mineralization.
In December 2006, Altius optioned the South Tally Pond Block to Paragon Minerals Corporation.
From 2007 to 2011, Paragon completed 21,259 metres of diamond drilling in 60 drill holes at the Lemarchant Deposit. The drilling outlined a massive sulphide horizon over a 500 metre strike length from section 101+00N to 106+00N. In addition to drilling, Paragon completed soil sampling (1,554 samples), grid line refurbishment (53.6 km) and new grid line-cutting (19.9 line km), airborne EM-magnetometer geophysics (175 line km), ground Titan 24 geophysical survey (14.4 line km), ground EM geophysical surveying (20.725 line km), and borehole pulse EM geophysics (19 drill holes for 8,855 metres) at the Lemarchant Deposit. This work is defined in NL government assessment reports by Copeland et al., (2008a, 2008b), Copeland et al. (2009); Copeland, (2010), Copeland and Devine (2011) and Devine et al. (2011).
In 2012, Paragon completed metallurgical testing on a composite sample from the Lemarchant mineralization horizon and completed an initial NI43-101 resource estimate on the Lemarchant Deposit (Fraser et al, 2012). The initial NI43-101 resource estimate is as follows:
| | NI43-101 Technical Report and Updated Resource Estimate South Tally Pond Property – Lemarchant Deposit |
| • | Indicated Mineral Resource of1.24 million tonnes grading 5.38% Zn, 0.58% Cu, 1.19% Pb, 1.01 g/t Au and 59.17 g/t Ag (15.40% ZnEQ)using a 7.5% Zn equivalent grade cut-off. |
| • | Inferred Mineral Resource of1.34 million tonnes grading 3.70% Zn, 0.41% Cu, 0.86% Pb, 1.00 g/t Au and 50.41 g/t Ag (11.97% ZnEQ)using a 7.5% Zn equivalent grade cut-off. |
The 2012 Mineral Resource Estimate has been superseded by the Mineral Resource Estimate supported by this Technical Report and is no longer current. NorZinc is not treating this previous estimate as a current Mineral Resource Estimate.
In September 2012, Paragon was acquired by Canadian Zinc Corporation, now NorZinc Ltd. A summary of the work completed by NorZinc from 2012 to 2018 is provided in sections 9.0 and 10.0.
| 6.2.2 | Spencer’s Pond Prospect |
From 1981 to 1982, Noranda completed line-cutting on the Spencer’s Pond grid (372-1) to follow up on airborne EM conductors. Initial drill testing of the area was completed in 1983 with three BQ drill holes, 372-3, 4 and 5 totalling 449.2 metres (Reid, 1984). From 1990 to 1993, Noranda completed 446.6 metres of diamond drilling in 3 drill holes at Spencer’s Pond (SP90-01 to 02 and SP91-03). Other work in the Spencer’s Pond area included line-cutting, soil sampling and ground geophysical surveys including Magnetics, VLF-EM, HLEM, and EM-37 over the Spencers Pond grids (Noranda, 1998).
During winter 2001, Altius completed 787 metres of diamond drilling in 5 drill holes at Spencer’s Pond (SP01-01 to SP01-05). All drill holes were surveyed using borehole Pulse-EM (“PEM”) geophysics (Smith et. al., 2001; Barbour and Churchill, 2002). Altius also completed a geological mapping, drill core re-logging, and lithogeochemical sampling on the Spencer’s Pond prospect, deepening of drillhole SP01-04 and surveying the drillhole with time-domain EM (Barbour and Churchill, 2002 and 2003).
In 2005, Altius compiled the existing geological and geophysical data and created 1:10,000 scale geological base map and completed 25.35 kilometres of line cutting on the Spencer’s Pond grid and a southern extension of the Lemarchant grid. In late 2006, Altius completed one drillhole (SP06-01; 425 metres) that was designed to test a borehole PEM anomaly along the Spencer’s Pond alteration zone (Winter et al., 2006). The drilling intersected zones of disseminated pyrite and base metal sulphides with concentrations from 1-5%. No samples were collected from the drillhole.
Between 2007 and 2012, Paragon completed limited ground exploration work (prospecting and data compilation) in the Spencers Pond area.
| | NI43-101 Technical Report and Updated Resource Estimate South Tally Pond Property – Lemarchant Deposit |
| 6.2.3 | Rogerson Lake Prospect |
In 1981, Noranda completed line cutting on the Prescott and Monkstown grids (372-4 and 372-5, respectively) following up on priority airborne conductors from the 1974 Aerodat survey. Soil sampling and ground geophysical surveys (CEM, VLF-EM, HLEM, magnetics and gravity (partial coverage) were completed from 1981 to 1982. Till sampling was successful in outlining several areas with anomalous Cu, Pb, Zn and Ag, including two sites which returned greater than 5,000 ppm Pb (Noranda, 1998; Reid, 1981). Subsequent trenching and prospecting of the till anomalies located numerous boulders of massive and banded pyrite. A heavy mineral separate of tills at one of the sites assayed 17.2% Pb.
From 1983 to 1994, Noranda completed 28 broadly spaced drill holes (3,514 metres) throughout the Rogerson Lake Prospect targeting a combination of priority airborne conductors and semi-massive to massive pyrite exposed in trenches. Several drill holes intersected stringer sulphide mineralization within strongly altered, coarse felsic pyroclastic rocks. One drillhole (MT90-01) intersected semi-massive pyrite (up to 50%) over widths up to 0.5 metres, whereas drillhole (PG90-01) intersected several banded pyrite/argillite horizons within felsic volcanic rocks that returned assays of 7.54 g/t Ag and 7.88 g/t Ag over 0.8 and 0.4 metres, respectively (Noranda, 1998). Drillhole 372-11 intersected 0.77% Zn from 30.7 to 33.2 metres within felsic volcanic rocks immediately beneath exhalative pyritic mudstone at a mafic-felsic contact.
In 2001, Altius completed a single drillhole (RL01-01) for 160.62 metres at the western end of the Rogerson Lake Prospect (Smith et al., 2001)
Between 2007 and 2012, Paragon completed limited exploration work, mainly prospecting and data compilation in the Spencers Pond area.
| 6.2.4 | Bindons Pond Prospect |
In 2004, Altius identified a new alteration zone along the southeast shoreline of Bindons Pond. The alteration zone coincides with 3 untested airborne EM conductors that are spatially associated with massive banded pyrite float.
In 2008, Paragon completed a B-horizon soil sampling program over the Bindons Pond prospect. A total of 602 soil samples were collected along GPS controlled flag lines at 25-metre sample spacing and 100 metre line spacing oriented at 340 degrees. The soil sampling identified zones of anomalous zinc (up to 1800 ppm), lead (up to 91 ppm), silver (up to 7.53 g/t) and gold (up to 138 ppb). The soil samples were collected over an area of mapped altered felsic volcanic rocks with alteration and mineralization similar to that mapped at the Lemarchant Deposit (Copeland et al., 2008b; Copeland et al., 2009).
| | NI43-101 Technical Report and Updated Resource Estimate South Tally Pond Property – Lemarchant Deposit |
| 7.0 | GEOLOGICAL SETTING AND MINERALIZATION |
The South Tally Pond Property is located within the Dunnage tectonostratigraphic zone of the Canadian Appalachians (Williams, 1979) (Figure 7-1). Rocks within the Dunnage zone include volcanic and sedimentary rocks of back-arc and island-arc affinity, associated intrusions and ophiolitic rocks. Volcanism was active as early as the late Precambrian and continued sporadically until the Devonian.
The Dunnage Zone has been subdivided into the Notre Dame subzone to the west and Exploits subzone to the east. These two subzones are separated by an extensive fault system termed the Red Indian Line, a complex structural zone that separates the terranes developed on the Laurentian (western) margin of the Iapetus Ocean from the terranes developed on the Gondwanan (eastern) margin (Williams et al. 1988).
The Notre Dame sub-zone is host to the base metal bearing Buchans Group which consists of mafic and felsic volcanic rocks and associated volcaniclastic and epiclastic rocks (Swanson and Brown, 1962; Thurlow and Swanson, 1981). The Buchans Group is best known for hosting the world-class, high grade, polymetallic Buchans Mine which produced 16.2 million tonnes of ore containing 14.51% Zn, 1.33% Cu, 7.56% Pb, 126 g/t Ag, and 1.37 g/t Au between 1928 and 1984 (Kirkham, 1987).
The Exploits subzone hosts the base metal-bearing Victoria Lake Supergroup which consists of a structurally complex, composite collage of bimodal Cambrian to Ordovician arc-related magmatic and sedimentary rocks (Evans and Kean, 2002; Rogers and van Staal, 2002). The Victoria Lake Supergroup consists of at least six distinct fault bound volcanic packages or groups, bounded by the Red Indian Line to the northwest and the Rogerson Lake Conglomerate to the southeast (Figure 7-2). The contacts between the different volcanic groups are typically high-strain zones and generally interpreted to be thrust faults.
The Victoria Lake Supergroup volcanic-sedimentary assemblages defines an overall younging sequence to the northwest (Rogers and van Staal, 2002; Valverde-Vaquero and van Staal, 2002; Zagorevski et al., 2003; Hinchey and McNicoll, 2016; Lode 2016). From east to west these include:
| 1. | Tally Pond Group (513 ± 2 Ma, 509 ± 1 Ma, 512 ± 2 Ma, 514 ± 7 Ma) |
| 2. | Long Lake Group (506 ± 3 Ma, 514 ± 0.8 Ma, 511 ± 4 Ma) |
| 3. | Tulks Group (498 +6/-4 Ma; 495 ± 2 Ma) |
| 4. | Pats Pond Group (488 Ma?) |
| 5. | Sutherland Pond Group - dominantly sediments |
| 6. | Wigwam Pond Group - dominantly sediments |
The Victoria Lake Supergroup is host to numerous base metal-bearing VMS deposits, showings and extensive alteration zones, as well as several gold prospects and occurrences (Kean and Evans, 1998a, 1998b; Kean et al., 1981; Moore, 2003). This mineralization is distributed throughout all of the volcanic lithotectonic assemblages that comprise the Victoria Lake Supergroup.
| | NI43-101 Technical Report and Updated Resource Estimate South Tally Pond Property – Lemarchant Deposit |
The Tulks Group contains at least eight known massive sulphide deposits, some of which are currently undergoing evaluation, including the Boomerang Deposit, which has a current Mineral Resource Estimate prepared in accordance with NI 43-101 and the CIM Standards. This includes an Indicated Mineral Resource of 1,364,600 tonnes grading 7.09% Zn, 3.00% Pb, 0.51% Cu, 110.43 g/t Ag, and 1.66 g/t Au, and an Inferred Mineral Resource of 278,100 tonnes grading 6.72% Zn, 2.88% Pb, 0.44% Cu, 96.53 g/t Ag, and 1.29 g/t Au (at a 1% Zn cut-off grade). The adjacent Domino Deposit hosts an additional 411,200 tonnes of Inferred Mineral Resource grading 6.3% Zn, 2.8% Pb, 0.4% Cu, 94 g/t Ag and 0.6 g/t Au, also prepared in accordance with NI 43-101 and the CIM Standards (De Mark, P. and Dearin, C., 2007).
Figure 7-1: Tectonostratigraphic Zones of Newfoundland
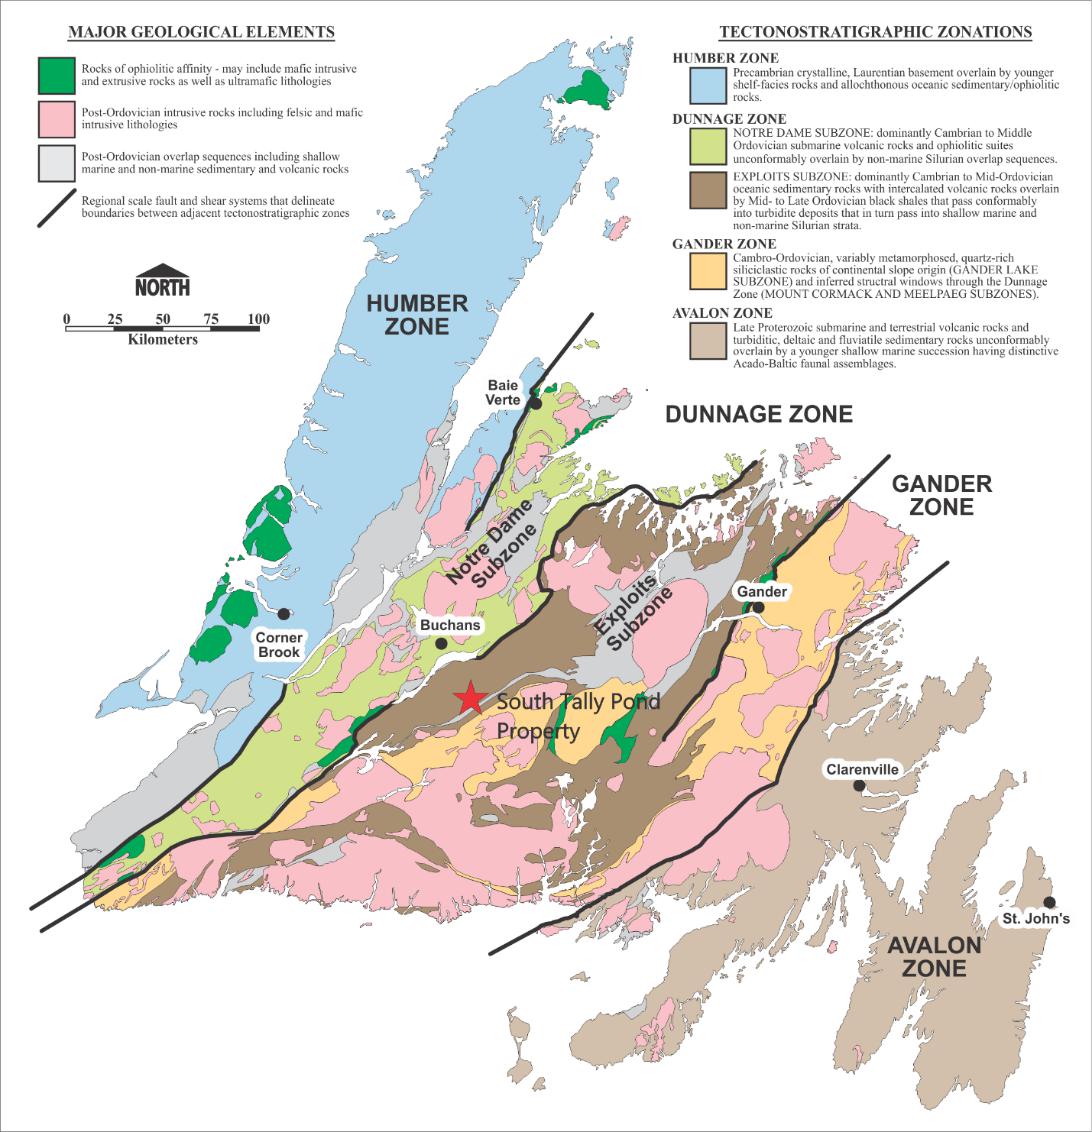
| | NI43-101 Technical Report and Updated Resource Estimate South Tally Pond Property – Lemarchant Deposit |
Figure 7-2: Regional Geology and Mineral Occurrences of the Victoria Lake Supergroup
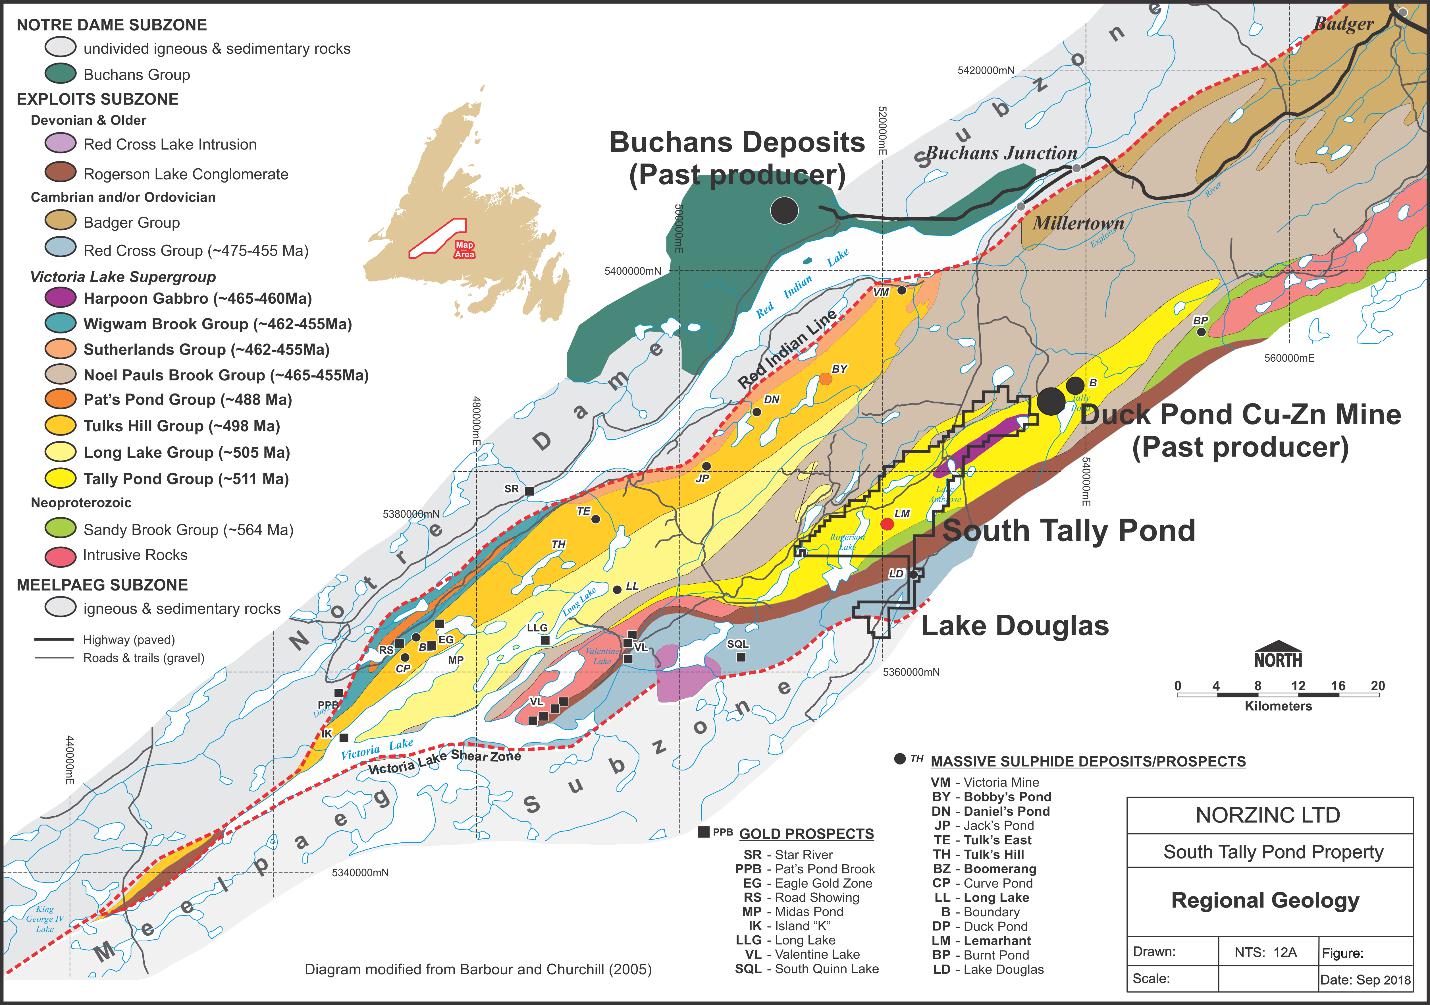
The Long Lake Group hosts four massive sulphide lenses that occur over 5 kilometres of strike length. The massive sulphide is associated with barite and is underlain by intensely altered felsic volcanic rocks containing stringer and disseminated base metal-bearing sulphides (Noranda 1998). In 2013, Messina completed an initial NI43-101 Mineral Resource Estimate for the Long Lake Main Zone Deposit with an Indicated Mineral Resource of 407,000 tonnes grading an average of 7.82 percent zinc, 1.58 percent lead, 0.97 percent copper, 49 g/t Ag and 0.57 g/t Au and an Inferred Mineral Resource of 78,000 tonnes grading an average of 5.77% Zn, 1.24% Pb, 0.70 % Cu, 34 g/t Ag, and 0.48 g/t Au (Keller and Bernier, 2012).
The Tally Pond Group hosts the past producing Duck Pond / Boundary deposits and the precious metal-rich Lemarchant Deposit. The Duck and Boundary deposits were mined from 2007 to 2015 and contained pre-NI 43-101 initial Measured and Indicated Mineral Resources of 5.1 million tonnes averaging 3.6% Cu, 6.3% Zn, 1.0% Pb, 64 g/t Ag and 0.9 g/t Au for the Duck Pond and Boundary deposits (MRDI, 2001). MRDI also reported an additional pre-NI 43-101 Inferred Mineral Resource of 1.1 million tonnes grading 2.6% Cu, 5.6% Zn, 1.2% Pb, 58 g/t Ag, and 0.6 g/t Au. Both referenced Mineral Resources are historic in nature and a qualified Person as defined under NI 43-101 has not classified these in accordance with that instrument and the CIM Standards. NorZinc is not considering these to be current mineral resources for this deposit.
| | NI43-101 Technical Report and Updated Resource Estimate South Tally Pond Property – Lemarchant Deposit |
The Neoproterozoic Sandy Brook Group (~563 Ma, 572 ± 4 Ma) and related intrusions are located along the southern margin of the Tally Pond Group. The Sandy Brook Group hosts extensive underexplored VMS-style alteration zones and a high-grade massive sulphide occurrence at Burnt Pond.
The South Tally Pond Property is largely underlain by the Tally Pond Group (Figure 7-3). The volcanic belt consists of Cambrian-aged volcanic, volcaniclastic and lesser sedimentary rocks that extend from Quinn Lake in the southwest to Burnt Pond in the northeast. The Tally Pond Group is defined as a bimodal volcanic assemblage and is sub-divided into two informal volcanic sequences: the basalt-dominated rocks of the Lake Ambrose Formation and the overlying felsic-dominated rocks of the Bindons Pond Formation (Evans and Kean, 2002; Rogers and Van Staal, 2002; Pollock et al., 2002a; Rogers et al, 2006; Squires and Hinchey, 2006; McNicoll et al. 2008). The volcanic and sedimentary rocks of the Tally Pond Group are obscured in most areas by thick surficial deposits, so map patterns are generally not well constrained.
The Lake Ambrose Formation consists of variably amygdaloidal, locally porphyritic, pillowed to massive mafic flows, with lesser pillow breccia, autoclastic, reworked tuffs and minor sedimentary rocks. Intercalated felsic volcanic rocks are commonly present, but subordinate to the mafic rocks.
The mafic rocks are compositionally sub-alkalic basalt or basaltic andesite with a depleted island-arc tholeiitic signature (Pollock et al., 2002 a, b). The mafic volcanic rocks are variably magnetic producing local magnetic highs. Age dating indicate ~513-514 million years (“Ma”) for the Lake Ambrose Formation (Dunning et al, 1991, McNicoll et al 2008).
The Bindons Pond Formation consists of felsic flows that are variably massive to pseudo-brecciated and locally flow banded, breccia, tuffs and quartz porphyry with rhyolitic to dacitic composition. The felsic rocks have transitional to calc-alkalic geochemical signatures. Age dates indicate ~509 Ma for the Bindons Pond Formation (McNicoll et al, 2008) and is host to the Duck Pond and Boundary VMS deposits.
The contact between the Lake Ambrose Formation and overlying Bindons Pond Formation vary from intricately intermingled suggesting synchronous deposition to contacts marked by a relatively thin (<1 to 20 metre) sequence of argillite, siltstone or pyritic mudstone that marks a hiatus in volcanic activity. At the Lemarchant Deposit, a metalliferous mudstone horizon marks the top of Main Zone mineralization which transitions altered felsic volcanic rocks (footwall) to mafic volcanic rocks (hangingwall). The argillite and mudstone sequences form short (<500 m) to lengthy airborne EM conductor trends within the belt and are targets for base metal exploration.
The Lemarchant microgranite is a large, bimodal felsic/mafic intrusive body located between the Lemarchant Deposit and the Rogerson Lake prospect. The Lemarchant microgranite is described as fine- to medium-grained quartz and feldspar porphyritic felsic intrusive rocks. The Lemarchant microgranite has a similar geochemical signature to the felsic volcanic rocks of the Bindons Pond Formation suggesting that the intrusion is syn-volcanic and related to VMS alteration and mineralization at Lemarchant and Rogerson Lake (Squires and Moore, 2004).
| | NI43-101 Technical Report and Updated Resource Estimate South Tally Pond Property – Lemarchant Deposit |
Figure 7-3: Property Geology

| | NI43-101 Technical Report and Updated Resource Estimate South Tally Pond Property – Lemarchant Deposit |
The volcanic sequences of the Tally Pond group are locally capped by Upper Ordovician (Caradoc) black shale units, commonly located along the wester margin of the Property. The black shale units typically form long strike length conductors through the belt due to high graphite, pyrite and pyrrhotite contents. The black shale units are in turn overlain by Ordovician marine turbidite and epiclastic rocks of the Harpoon Brook Formation. The volcanic rocks of the Bindons Pond and Lake Ambrose formations are often in fault (thrust) contact with these younger overlying sedimentary sequences (Kean and Jayasinghe, 1982).
The Tally Pond Group volcanic and sedimentary stratigraphy is cut by the Ordovician-aged Harpoon Gabbro. The Harpoon Gabbro is well exposed in the northeast portion of the property and is associated sills and dykes that crosscut all lithologies including mineralized rocks at the Duck Pond Mine and the Lemarchant Deposit. The Harpoon Gabbro forms a large magnetic high in the eastern part of the Property.
The Neoproterozoic Sandy Brook group underlies the southeast boundary of the property and consists of an estimated 8 km long belt of bi-modal volcanic and associated sedimentary rocks. The Sandy Brook group has been subdivided into four units including: i) felsic volcanic unit; ii) chloritoid-rich unit; iii) volcaniclastic unit; and iv) mafic volcanic unit. The felsic volcanic rocks consist of strongly foliated, quartz-phyric fragmental and/or pseudo-fragmental rocks, with lesser massive, quartz-phyric to aphyric rhyolite that displays strong sericite, silica, ferroan carbonate and pyrite alteration. The rocks are unconformably overlain by the Rogerson Lake conglomerate to the south and in thrust (?) contact with the younger Tally Pond Group to the west. The VMS alteration indices are very similar to the strong alteration signatures seen at the Lemarchant Deposit and Duck Pond Mine (Barbour and Churchill, 2005).
The Sandy Brook group is interpreted to be Neoproterozoic based on a similar Nd isotopic signature as the Burnt Pond Formation (ca. 572 ± 4 Ma (U-Pb)). These rocks are similar in age to the Valentine Lake trondhjemite (563 ± 2 Ma) and Crippleback Lake quartz monzonite (565 +4/-3 Ma) that occur along strike to the northeast and southwest at a similar structural and stratigraphic location (Pollock et al., 2002b; Rogers et al., 2006; McNicoll et al., 2008).
The Silurian-aged Rogerson Lake conglomerate is located along the southeast margin of the South Tally Pond property. The unit is deep red to grey, hematitic, and comprises pebble to cobble conglomerate with occasional beds of sandstone. The conglomerate is generally thick bedded and weakly to moderately sorted, with clast-supported texture. The conglomerate contact is discordant to the trend of volcanic units within the Sandy Brook Formation, suggesting structural juxtaposition, or that the conglomerate might have been deposited in a graben-like structure. This unit is interpreted as a fault-scarp, molasse-type sequence that is suspected to mask a Silurian or earlier structure (Kean and Evans, 1988).
Recent exploration along the margins of the Rogerson Lake conglomerate in the South Tally Pond Property area has resulted in the discovery of numerous gold occurrences. Gold has been identified within a number of different geological settings including, structurally controlled quartz veins within the Rogerson Lake Conglomerate, structurally-controlled disseminated and stringer pyrite in altered feldspar porphyry, and within the deformed contact zone between the Rogerson Lake Conglomerate and an underlying gabbroic unit.
| | NI43-101 Technical Report and Updated Resource Estimate South Tally Pond Property – Lemarchant Deposit |
| 7.2.1 | Structure and Metamorphism |
Major lithological contacts within the Tally Pond Group (i.e. black shale/felsic volcanic contacts) are defined by early stage thrust faults that mark early (D1) deformation and tectonic amalgamation of the various volcanic arc and sedimentary sequences within the region (Evans and Kean, 2002; Rogers et. al., 2006; Zagorevski and van Staal, 2002). The fault zones are generally marked by localized shearing and fault breccia development. Local thrust induced folds are observed on the property.
The oldest deformation is recorded as a north-south striking, and moderately to steeply east dipping S1 foliation that is present in fine-grained mafic xenoliths/rafts within the plagiogranite sequence. Zones of ductile shearing, largely observed in drill core represent an early stage fabric (S1). This shear fabric is often sub-parallel to lithological contacts and is commonly associated with sulphide-rich, carbonaceous shale units, or zones of locally intense Fe-carbonate and sericite alteration. This penetrative fabric is also observed to transgress lithological contacts and to define the Lemarchant Fault, a relatively early stage thrust fault affecting the stratigraphy at the Lemarchant Deposit (Collins, 1994; Squires and Moore, 2004). A similar relationship has been observed at the Duck Pond Mine where the hangingwall to the Duck Pond Deposit is truncated by the Duck Pond Thrust, an early stage, and possibly reactivated thrust fault. The S1 fabric is tentatively interpreted to be related to early stage, lithology parallel thrust faulting within the Tally Pond Belt (Barbour and Churchill, 2005).
The second deformation event is represented as a regional, east to southeast striking and moderately north dipping S2 foliation that is present in all lithologic units. The foliation is well developed in the fine-grained ductile lithologies, and macroscopically absent in the more competent lithologies such as pillow basalt flows and massive, siliceous rhyolites. The regional pervasive nature of the foliation, and its orientation at a relatively large angle to the trend of lithologic units, suggest that the foliation is an axial planar fabric related to regional folding. The nature of this folding is poorly documented because the volcanic stratigraphy is composed of thick, massive units that were originally far from planar. There is a general lack of bedded or thinly layered units in the stratigraphy, and where present, they are very poorly exposed (Barbour and Churchill, 2005).
All lithologies and mapped D1 thrust faults have been deformed about generally upright, open to tight, east-northeast-striking, southeast-verging folds (F2/D2). This fold system marks progressive deformation and thickening of the volcanic belt and is associated with development of a weak to moderate pervasive easterly striking foliation. The F2 folds are gently shallow to doubly plunging, which causes multiple repetitions of the main lithological contacts within the belt.
The Victoria Lake Supergroup has a lower-greenschist facies metamorphic signature (Evans and Kean, 2002). Rock units of the Tally Pond group are relatively well preserved with intact, primary volcanic textures that are easily discernible in surface outcrops and drill core.
| | NI43-101 Technical Report and Updated Resource Estimate South Tally Pond Property – Lemarchant Deposit |
The South Tally Pond Property is host to multiple zones of hydrothermal alteration and mineralization. Significant alteration zones have been identified at Lemarchant, Rogerson Lake, Bindons Pond and Spencers Pond (Figure 7-4). Volcanogenic massive sulphide-style mineralization is associated with alteration zones and consists of semi-massive to massive sulphides or stringer and disseminated sulphides containing various proportions of pyrite, pyrrhotite, chalcopyrite, sphalerite, galena, bornite and massive barite. The four main alteration areas are described below.
Lemarchant Deposit is hosted within a 4000-metre long and up to 700-metre wide zone of VMS-style hydrothermal alteration. Alteration varies between intense silicification, sericitization, chloritization and barium-enrichment, with anomalous disseminated and stringer pyrite, base metal sulphides and lesser pyrrhotite. Lithogeochemical analyses of the altered rocks returned alteration signatures comparative to those of the alteration surrounding the Duck Pond and Boundary deposits. Massive, semi-massive and stringer sulphide mineralization at the Lemarchant Deposit is further discussed in Section 7.3.
Rogerson Lake Prospect is a zone of alteration within felsic volcanic rocks along the northwest side of Rogerson Lake (Figure 7-4). The alteration has been traced over an area measuring between 200 to 700 metres wide and 2 kilometres in length. Intense chlorite alteration exposed in a trench in the centre of the zone compares favourably to alteration associated with the Lemarchant, Duck Pond and Boundary massive sulphide deposits. Pyrite, pyrrhotite, minor chalcopyrite and traces of sphalerite and galena have been encountered over most of the alteration zone. A diamond drill hole, located in the southwest part of the zone, intersected 20-25% stringer and disseminated pyrite over 5 metres, including semi-massive pyrite (up to 50%) over 0.5 metres. Zones of several metres of 10-15% stringer pyrite have been intersected within other drill holes located in the northeast part of the zone.
Bindons Pond Prospect is a poorly exposed zone of altered felsic volcanic rocks estimated to be 900 metres long by 200 metres wide and located south of a mafic-felsic volcanic contact (Figure 7-4). Alteration is dominated by varying amounts of quartz, sericite, and chlorite, with abundant stringer pyrite and minor base metal sulphides. The presence of short strike length airborne EM conductors and anomalous soil geochemistry provide a favourable target for initial drill testing. The felsic rocks are interpreted to be the folded eastern exposure of the felsic rocks seen at the Lemarchant Deposit.
Spencers Pond Prospectconsists of widespread disseminated and stringer sulphide mineralization, hosted within strongly altered rhyolite, volcaniclastic rocks and mafic volcanic rocks of the Sandy Brook Group (Figure 7-4). The alteration encompasses most of the Sandy Brook volcanic rock within the property and is characterized by locally extensive chloritoid development, in addition to the normal sericite-quartz-chlorite-sulphide alteration. Sulphides within the alteration zone are mainly pyrite and pyrrhotite with minor base metal sulphides. Lithogeochemical signatures of the rocks indicate a Duck Pond alteration signature, although, given the presumed late Neoproterozoic age of the Sandy Brook volcanic rocks, this alteration predates the alteration within the Tally Pond Group volcanic rocks.
| | NI43-101 Technical Report and Updated Resource Estimate South Tally Pond Property – Lemarchant Deposit |
Figure 7-4: Geology Map - Lemarchant-Spencers Pond-Rogerson Lake Area
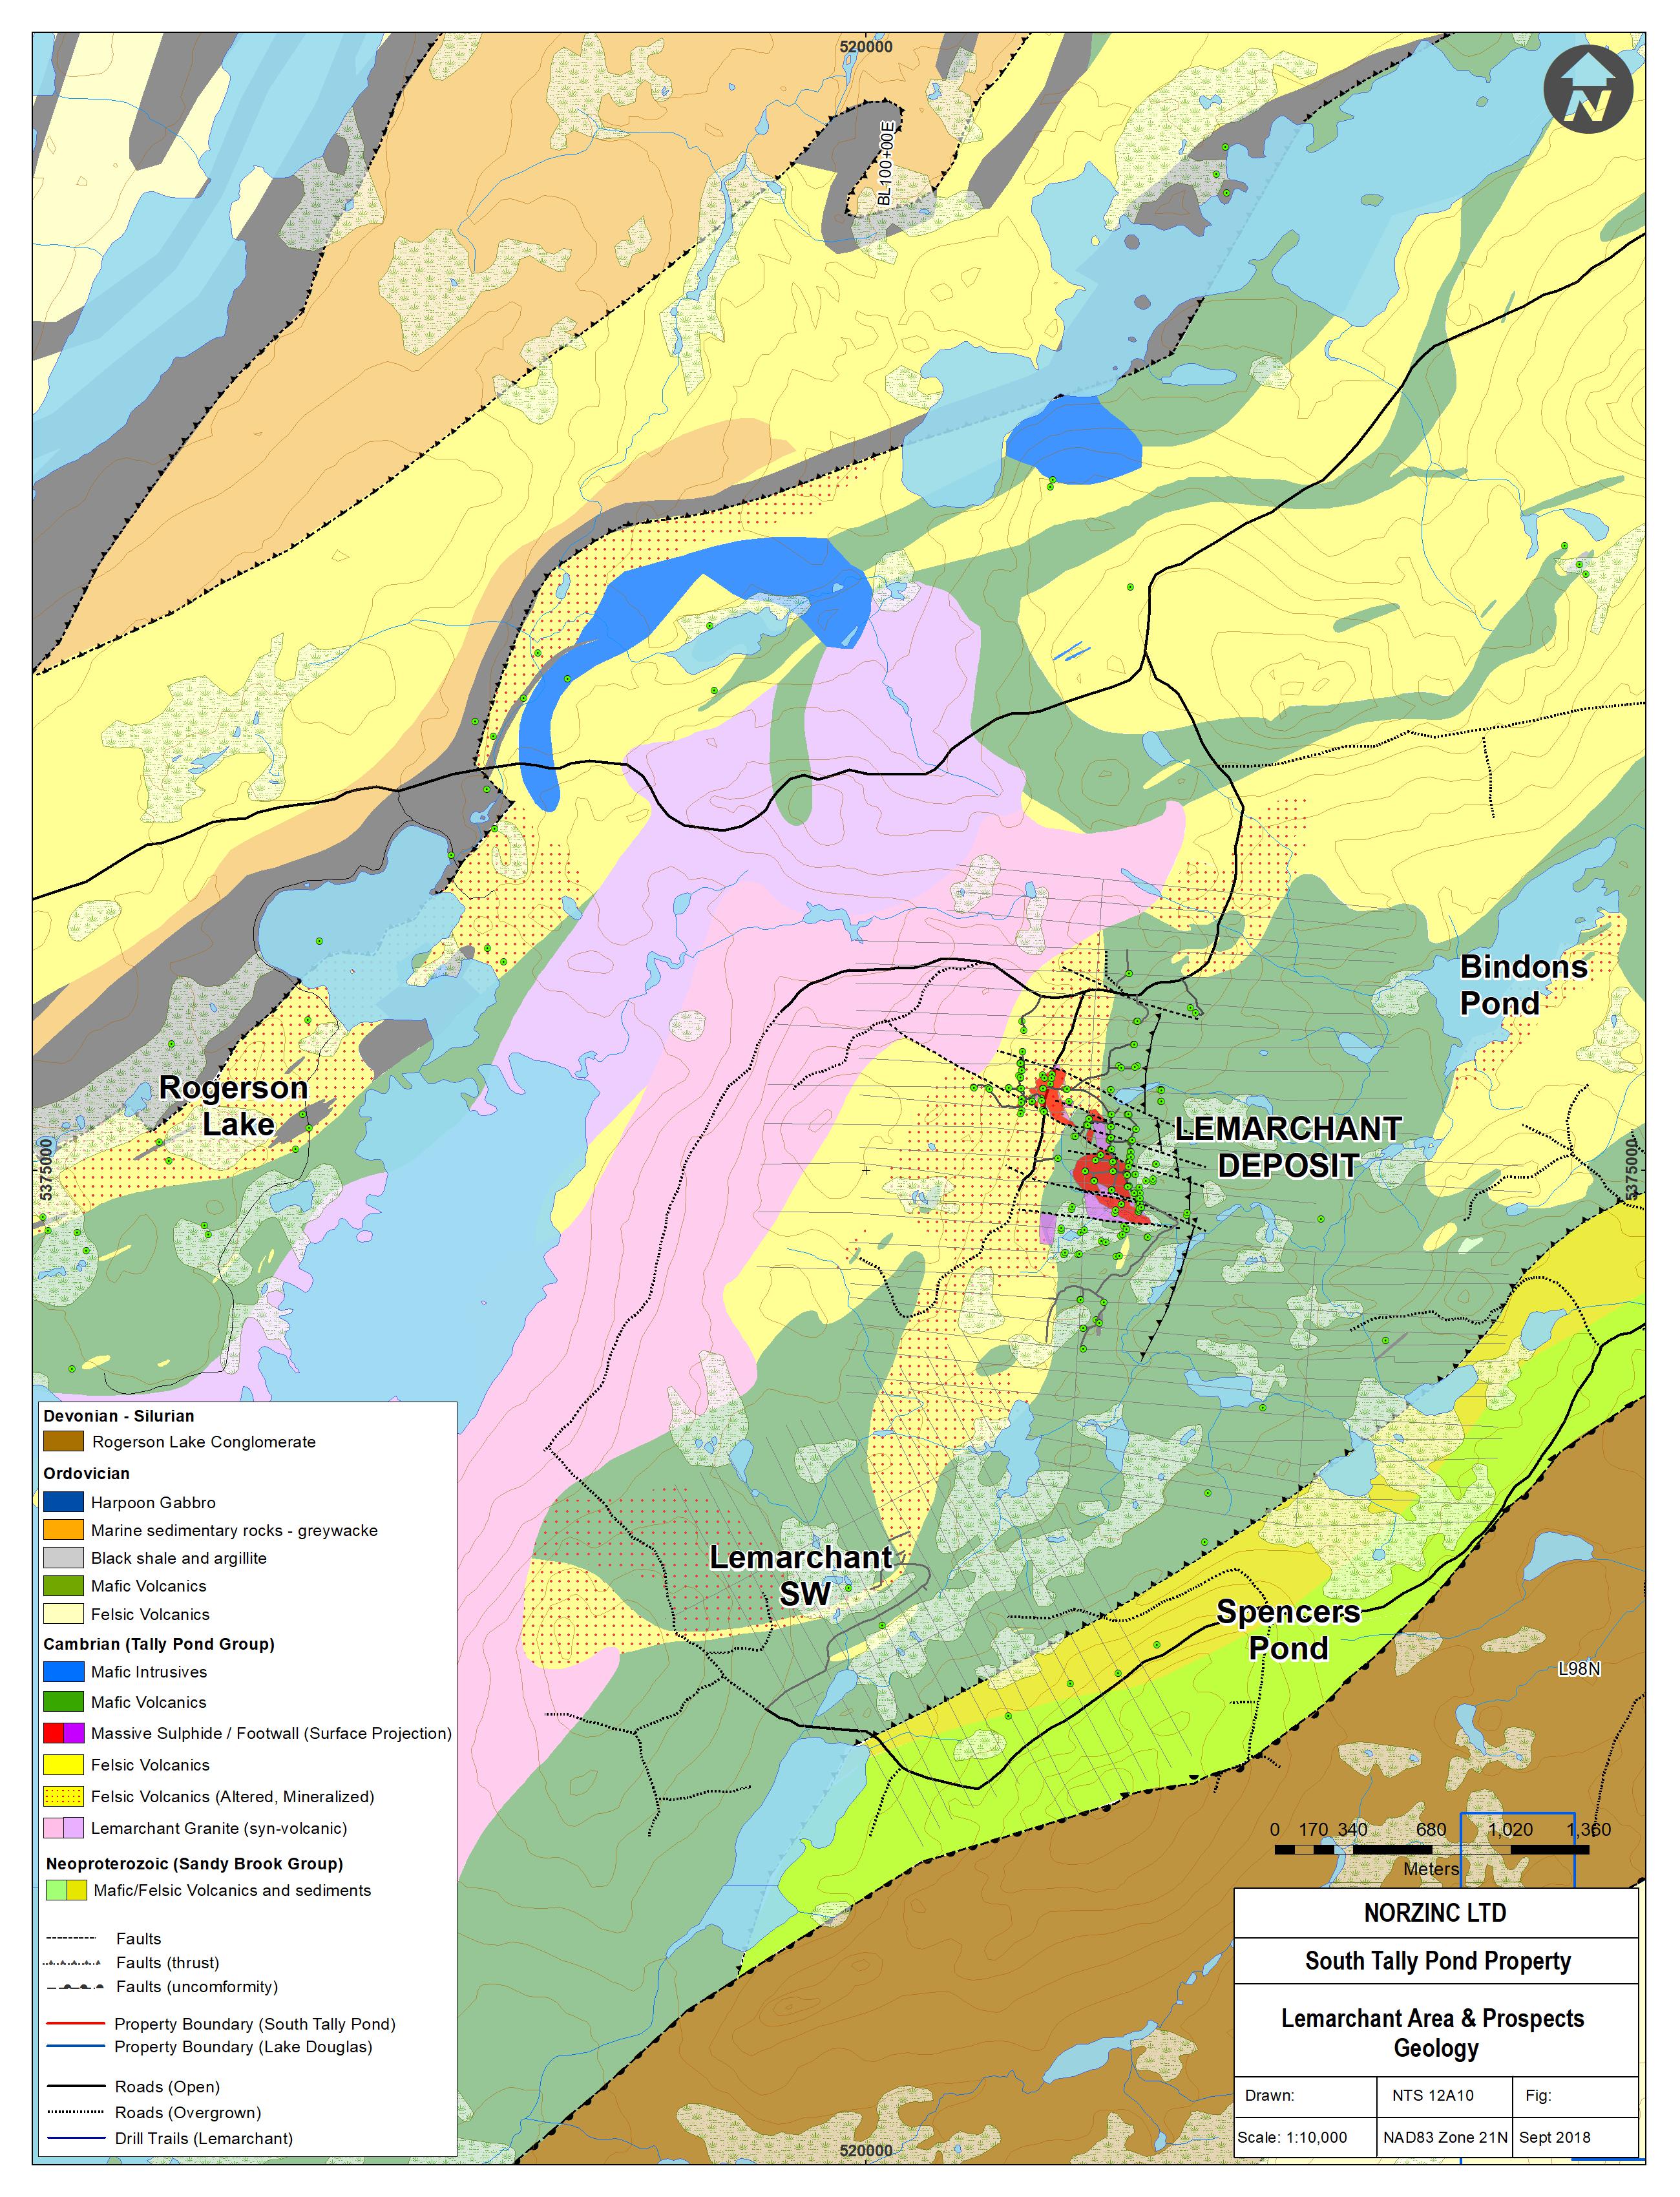
| | NI43-101 Technical Report and Updated Resource Estimate South Tally Pond Property – Lemarchant Deposit |
| 7.3 | Lemarchant Deposit Geology |
The Lemarchant area stratigraphy consists of a north striking, gently east dipping sequence of mafic and felsic volcanic rocks that are locally cut by mafic to felsic intrusive rocks (Figure 7-5). From youngest to oldest, the general stratigraphy consists of an upright sequence (generally 150-200 metres thick) of gently east dipping, aphyric, magnetite-bearing, pillowed, massive or brecciated mafic flows and flow breccias, and associated syn-volcanic mafic dykes and sills. At the base of this mafic “hangingwall” sequence is a conformable fine-grained, generally thin (<1 to 20 metres), conductive, pyrite mineralized mudstone horizon (metalliferous mudstones) that conformably overlies, or is intercalated with, the massive sulphide and barite mineralization. The mineralized zone varies in thickness from less than 1.7 metre up to 30 metres. Below the mineralized zone is a sequence of moderate to strongly altered, and variably mineralized felsic volcanic and volcaniclastic rocks. This felsic “footwall” sequence varies in thickness from <10 to 50 metres before grading into less altered felsic volcanic rocks measuring up to 250 metres thick.
The mafic hanging wall rocks contains some silica-chlorite-epidote alteration, but are generally not significantly altered. Alteration in the felsic footwall generally consists of moderate to intense quartz-sericite±chlorite alteration with local, moderate to intense chlorite altered intervals. The alteration zones typically contain disseminated to stringer Cu-Pb-Zn mineralization.
A gently, west-dipping, east-verging thrust fault (D1), termed the Lemarchant fault cuts the mineralization and underlying footwall sequence (Figure 7-5). The Lemarchant fault is observed in multiple drill holes as a strongly deformed, ductile structure with well-developed fabric up to several metres wide. In these drilled areas, the fault zone typically marks a succession of variably altered felsic volcanic rocks structurally overlying mafic volcanic rocks which resemble the hangingwall mafic volcanic rocks. Several drill holes have been completed through this lower mafic volcanic sequence and successfully intersected a lower sequence of altered and stringer mineralized felsic volcanic rocks. This lower package of felsic volcanic rocks has been termed the Lower Felsic Block (LFB).
Faults are a prominent feature of the deformation history of the Tally Pond Group and are observed to truncate and offset mineralization at Duck Pond (Moore, 2003; Squires and Moore, 2004). At the Lemarchant Deposit, the east-west trending fault structures (D2) have been identified by offsets of the stratigraphy. Outcrop patterns and drilling results outline west to northwest-striking faults, with minor dextral surface displacement, cutting through the Lemarchant Deposit. Surface magnetic patterns and conductor offsets support the presence of a number of east-west to northwest oriented faults. Evidence from drilling indicates these structures are generally parallel to the section orientation, are steeply dipping and recognized by broken, blocky and brecciated sections in the drill core. Multiple drill pierce points suggest extensional displacement along the faults resulting in up to 100 metres of dip-slip movement.
The Lemarchant Deposit consists of two stratiform massive to semi-massive sulphide zones and underlying stringer zones located between section 100+50N to 104+50N (Main Zone) and between section 105+00N to 107+00N (Northwest Zone). The Main Zone mineralization is located approximately 120 to 210 metres below surface, dips gently to the east, and is truncated by the Lemarchant fault down dip.
| | NI43-101 Technical Report and Updated Resource Estimate South Tally Pond Property – Lemarchant Deposit |
Figure 7-5: Geology Map - Lemarchant Deposit
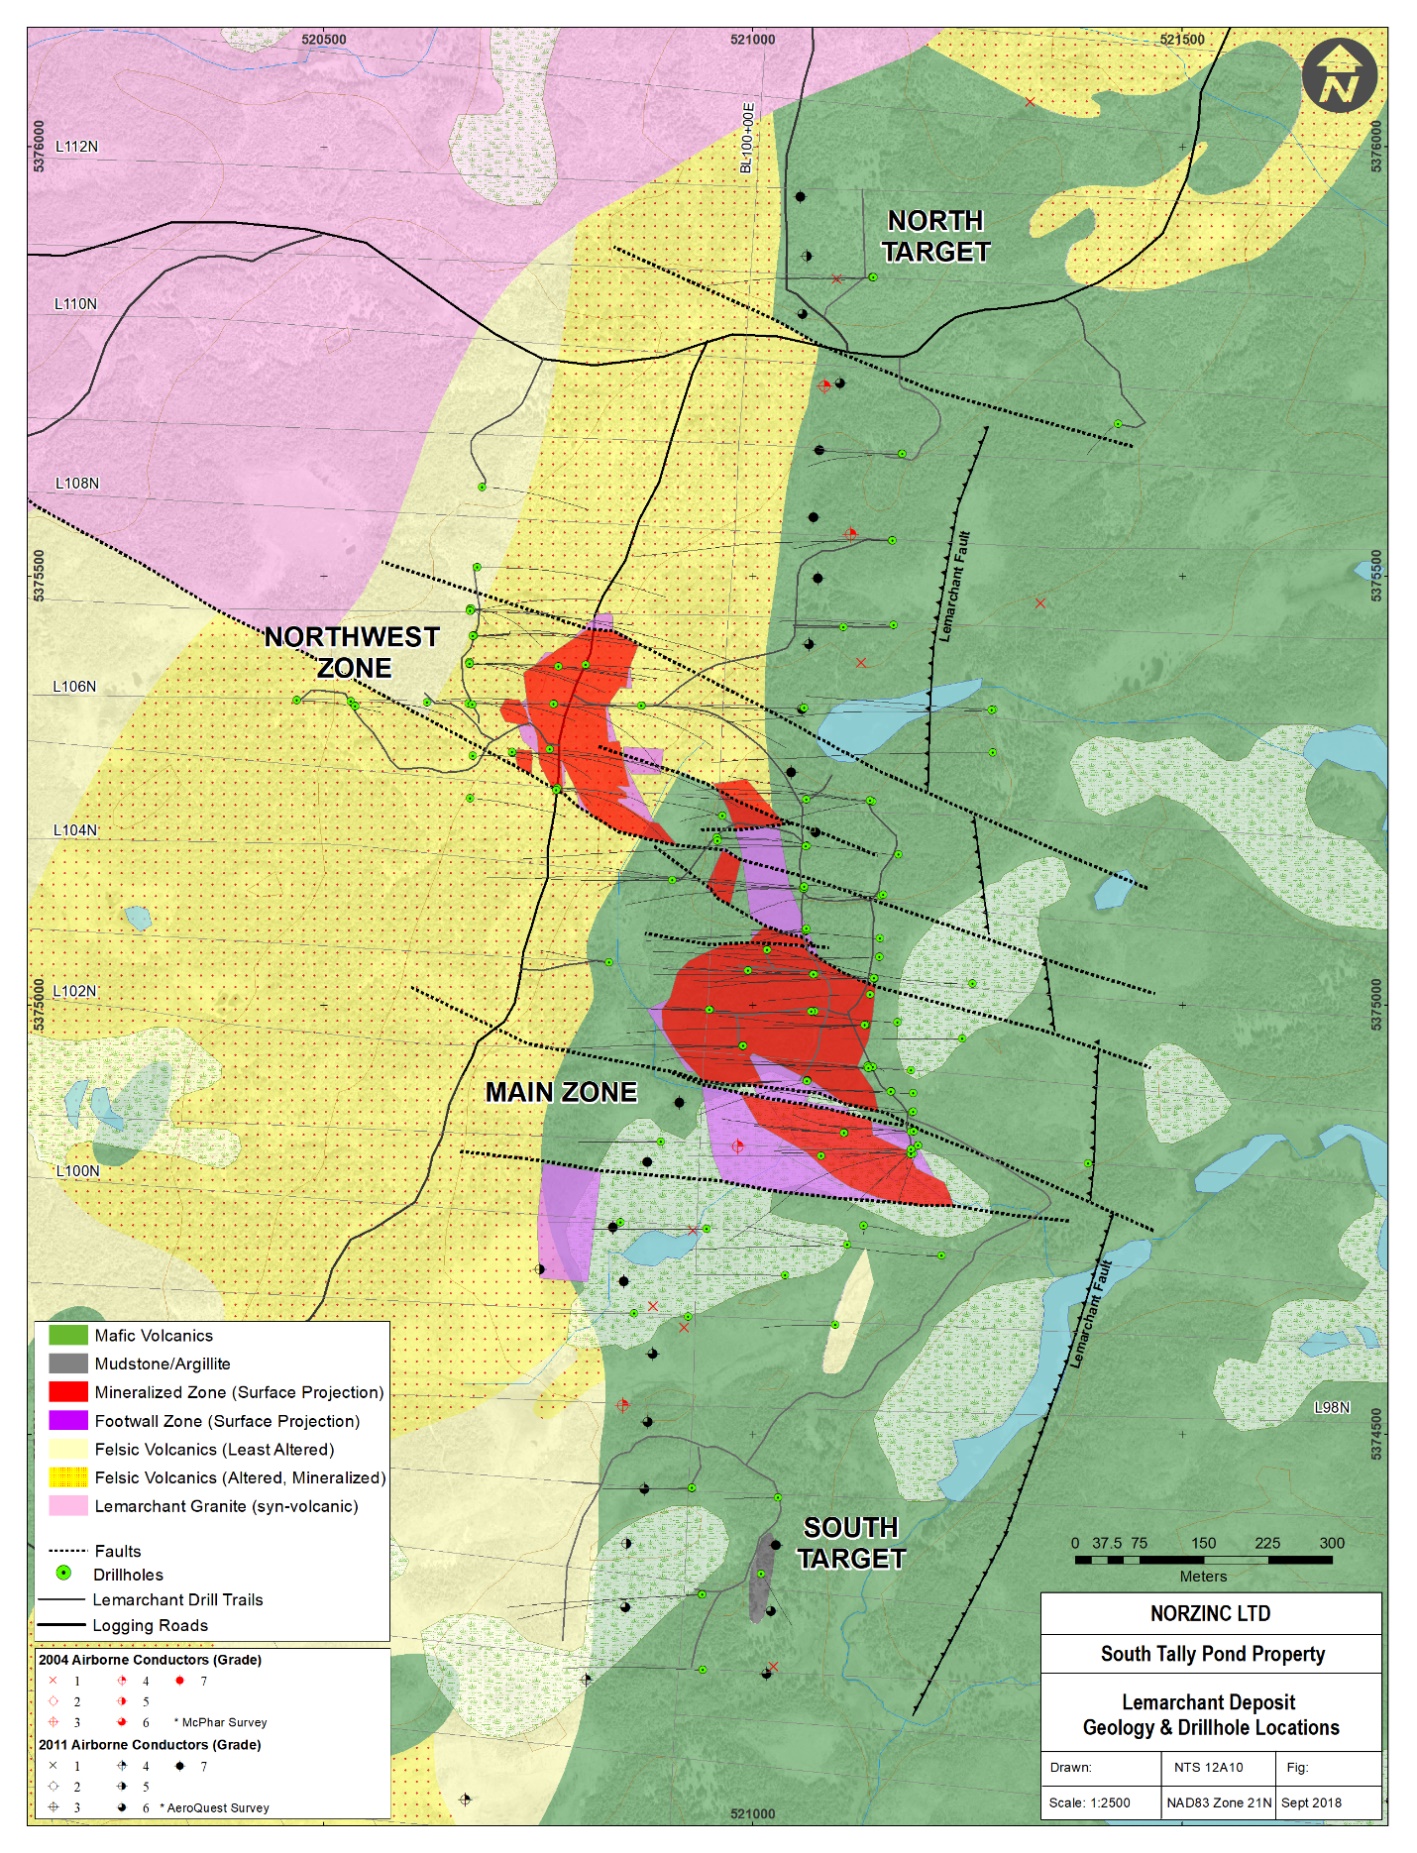
| | NI43-101 Technical Report and Updated Resource Estimate South Tally Pond Property – Lemarchant Deposit |
The Northwest Zone is located approximately 300 to 350 metres below surface, dips gently to the west, and is truncated by gabbroic intrusion(s) to the east and by thrust faults(?) to the west. The massive sulphides zones vary in thickness from less than 1 metre to 30.4 metres and are underlain by a sequence of intensely altered and barium-enriched felsic volcanic rocks.
Mineralization is characterized by high-grade, zinc-lead-copper semi-massive to massive sulphides with significant precious metal (gold, silver) contents, massive mineralized barite intervals, and an underlying copper rich stringer sulphide zone. The mineralization has been characterized by Gill and Piercey (2014) into five distinct mineral assemblages as follows:
| Type 1 Assemblage | Granular barite, white sphalerite, pyrite, galena and trace chalcopyrite and tetrahedrite-tennantite group minerals. |
| Type 2A Assemblage | Bornite, galena and chalcopyrite. |
| Type 2B Assemblage | Bladed barite, tetrahedrite-tennantite group mineral, galena and precious metals (gold). |
| Type 3 Assemblage | Red sphalerite, fine to medium grained pyrite, lesser galena and chalcopyrite and minor barite. |
| Type 4 Assemblage | Chalcopyrite, pyrite and minor orange sphalerite stringers. |
The paragenesis of the sulphide mineralization at Lemarchant is broadly divided into three stages of deposition (Gill and Piercey, 2014; Gill et al., 2015) as follows:
During Stage 1, early fluids were dominated by Type 1 mineral assemblages forming massive mineralized barite at the seafloor upon mixing with oxygenated seawater. The Stage 2 paragenesis resulted in variable replacement of the barite-rich Type 1 mineral assemblage by Type 2A in the central portions of the deposit and Type 2B along the margins of the deposit. The barite is cross-cut by bornite, likely the product of copper transport in highly oxidized fluids. The restriction of the bornite to barite zones suggests that bornite formed prior to Stage 3 mineralization. In the final stage, type 3 and 4 mineral assemblages were deposited to the massive sulphide and stringer zones, respectively. The Type 3 replaced the upper portion of the Type 1 mineral assemblage and the Type 4 stringers were deposited in the stringer sulphide zones below the Type 1, 2, and 3 mineral assemblages.
The paragenesis from barite to lead-zinc sulphides (black ore) to more copper-rich sulphides (yellow ore) is similar to most VMS systems representing initial lower temperature venting (barite), through moderate temperature venting (black ore) to higher temperature (~300oC) venting (yellow ore).
Alteration varies between intense silicification, sericitization, chloritization and barite-enrichment with anomalous disseminated and stringer pyrite, base metal sulphides and lesser pyrrhotite. Ishikawa (Ishikawa, 1976) and ACNK (Al2O3/Total Alkali) are useful alteration indices in assessing the alteration intensity. Ba/Sr (barium/strontium) is a useful ratio in determining the presence of Ba-enrichment in footwall rocks, suggesting proximity to hydrothermal seafloor venting. Typically, rocks at the Lemarchant Deposit with Ishikawa >50, ACNK >1.4, and Ba/Sr >25 are considered altered. Moderate to intense alteration of felsic volcanic rocks are common below the massive sulphide mineralization, but also occurs north and south of the Lemarchant Deposit in the Lower Felsic Block. These areas remain important exploration targets as they have similar felsic volcanic lithology and alteration intensity and may represent the structural repetition of the host stratigraphy to the Lemarchant Main Zone.
| | NI43-101 Technical Report and Updated Resource Estimate South Tally Pond Property – Lemarchant Deposit |
Airborne geophysical surveys have defined several shallow (< 150 metres), short strike length conductive trends of significance. Two airborne EM conductive trends follow the mafic-felsic contact that marks the horizon hosting the Lemarchant massive sulphides at depth (Figure 7-5). The airborne EM conductors are interpreted to represent the near surface pyrite and pyrrhotite-bearing mudstone and argillaceous sediment at the mafic-felsic contact. These mudstones typically overlie the massive sulphides and associated VMS-style alteration zone in the underlying felsic volcanic strata. There is a notable gap in the airborne EM conductors directly over the Main Zone mineralization (i.e. no near surface mudstones) which presumably resulted from structural displacement along the east-west structures.
Historical and more recent geochronology work by McNicoll et al (2008, 2010) indicates the available age dates for the Lemarchant Deposit host rocks are limited (1 sample), but does show that the felsic footwall rocks have a U-Pb age date of ~513 Ma. This suggests the Lemarchant Deposit host stratigraphy is part of the older Lake Ambrose Formation which has yielded similar age dates of ~514-513 Ma. This older stratigraphy coincides with the Upper Block stratigraphy at the Duck Pond Deposit which has age dates from 514-512 Ma, and hosts an abundance of metalliferous mudstones, but no significant mineralization. The Upper Block stratigraphy structurally overlies the younger host rocks to the Duck Pond and Boundary deposits (Mineralized Block) and are dated at ~509 Ma. This coincides with known age dates for the Bindons Pond Formation (Figure 7-6).
Piercey et al. (2017) indicate the metalliferous hydrothermal mudstones in the Upper Block are similar to the mineralization-associated mudstones at the Lemarchant Deposit. The lithogeochemistry of these hydrothermal mudstones provide an excellent opportunity to evaluate vent-distal and vent-proximal sedimentary rocks as a means to exploration vectoring within the Tally Pond belt and similar geological environments.
| | NI43-101 Technical Report and Updated Resource Estimate South Tally Pond Property – Lemarchant Deposit |
Figure 7-6: Tally Pond Stratigraphy - Duck Pond/Boundary Deposits

| | NI43-101 Technical Report and Updated Resource Estimate South Tally Pond Property – Lemarchant Deposit |
The South Tally Pond Property has been explored by NorZinc for volcanogenic massive sulphide (VMS) deposits enriched in zinc, copper, lead, gold and silver. These type of deposits are well known in the central Newfoundland with the past producing Buchans ore deposits (1926-1984) and more recently mined Duck Pond and Boundary deposits (2007-2015).
Volcanogenic massive sulphide (VMS) deposits are formed in a submarine volcanic environment by discharge of metal-bearing fluids onto or just beneath the sea floor following and during active deposition of volcanic lavas (Franklin et al., 1981; Franklin, 1993; Franklin et al., 2005; Gibson, et al., 1999; and Barrie & Hannington, 1999). These deposits are currently classified into five different types, largely based on the nature of the rocks hosting the massive sulphides deposit (Galley et al., 2007; Franklin et al., 2005). The Lemarchant and Duck Pond and Boundary deposits are classified as Bimodal-Felsic VMS deposits as they are predominantly hosted within stratigraphy containing greater than 50% felsic volcanic rocks, less than 15% siliciclastic sediments and mafic volcanic rocks forming the remainder (Figure 8-1).
Figure 8-1: Bimodal Felsic vent complex model with alteration and metal zones
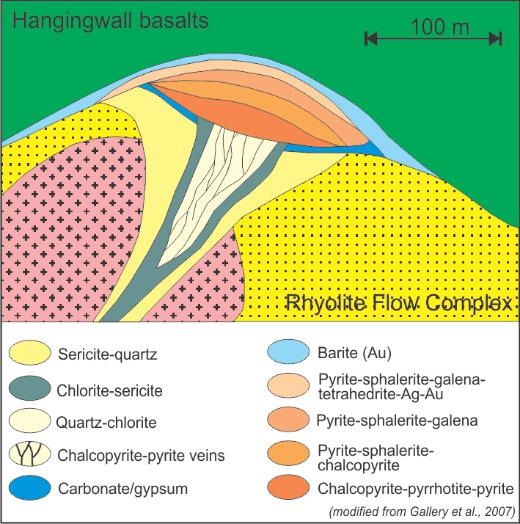
Key characteristics of these deposit types are that they commonly form concordant lenticular to tabular shaped bodies that overlie a footwall stockwork sulphide and hydrothermal alteration zone (chlorite, silica, sericite) that is generally discordant to the contacts of the host rocks (Date et al., 1983; Saeki and Date, 1980; Spitz and Darling, 1978). The massive sulphides and underlying stringer systems are often closely associated with felsic lava domes, volcaniclastic breccia, subvolcanic intrusions and syn-volcanic fault zones. Discharge of hydrothermal fluids is largely controlled by a combination of syn-volcanic fracture/fault zones and host rock permeability and porosity.
VMS deposits commonly form at a favourable stratigraphic horizon within volcanic belts and are found in clusters throughout productive volcanic belts globally. This transition generally records a significant hiatus in volcanism that is marked by a relatively thin sequence of either chemical or clastic sedimentary rocks that, depending upon proximity to the hydrothermal vent system, may be intimately associated with base metal sulphide deposition (hydrothermal exhalite; e.g. modern black and white smokers). Bimodal felsic VMS deposits are commonly found within more compositionally mature volcanic arcs and are usually more silver, zinc and barium-rich than the other VMS deposit types. Examples of these deposit types include: Kuroko, Japan; Tasmanian VMS deposits (Hellyer, Que River) and Buchans, Newfoundland.
| | NI43-101 Technical Report and Updated Resource Estimate South Tally Pond Property – Lemarchant Deposit |
Exploration work completed by NorZinc from 2012 to 2018 on the South Tally Pond Block consists of ground electromagnetic (EM), magnetometer and gravity geophysical surveys, borehole EM geophysics (6 holes; 2,190 metres), metallurgical studies, and diamond drilling (91 drill holes plus 8 drillhole extensions; 28,675 metres). The majority of this work focused on the Lemarchant Deposit. The exploration work, up to May 2017 is documented in company assessment reports filed with the Department of Mines and Energy, Newfoundland and Labrador (Vande Guchte and Marcotte, 2013; Squires and Vande Guchte, 2015; Vande Guchte, 2016; Vande Guchte and Hussey, 2017; and Hussey and Vande Guchte, 2018). The 2017 summer-fall drilling at Lemarchant and 2017 ground geophysics remain to be filed for assessment.
In 2014, 2016 and 2017, ground and borehole geophysical surveys were completed by NorZinc in areas surrounding the Lemarchant Deposit. Mr. Bob Lo, P.Eng. a consulting geophysicist from Oakville, Ontario was retained to provide survey planning, data acquisition quality control, data modeling and interpretation.
| 9.1.1 | 2014 Gravity Orientation Survey |
In 2014, Abitibi Geophysics Ltd. of Val-d’Or, Quebec completed sixty-two (62) gravity readings along two grid line (103+00N and 106+00N) spaced 300 metres apart (Figure 9-1). The goal of this orientation gravity survey was to verify the ability of the gravity method to delineate the known Lemarchant volcanic massive sulphide deposit.
The survey was completed using a Scintrex CG-5u Autograv instrument and was tied to CSGN base station in Buchans and a local base station in Millertown. The expected Bouguer anomaly accuracy is better than 0.05 milligal (mGal) before terrain corrections. GPS data acquisition was completed using Real Time Kinematic (RTK) GPS surveying with an expected accuracy better than 5 cm in elevation and horizontal positioning.
A weak gravity anomaly of 0.20 mGal appears to be associated with the Lemarchant Main Zone mineralization below line 103+00N. The Main Zone is located at 160 to 210 metres vertical depth below a thick sequence of mafic volcanic rocks (HW basalts) with mafic intrusive units. The mafic intrusive units (gabbro) within the HW Basalts may also be the cause for the gravity anomaly. The barite-rich Lemarchant Northwest Zone massive sulphide mineralization located under line 106+00N at approximately 300 metres vertical depth was not detected by the gravity survey. A number of other gravity highs detected in the Lemarchant gravity survey area appear to be associated with mafic intrusive units within the mafic or felsic volcanic stratigraphy.
| | NI43-101 Technical Report and Updated Resource Estimate South Tally Pond Property – Lemarchant Deposit |
Figure 9-1: 2014 Orientation Gravity Survey
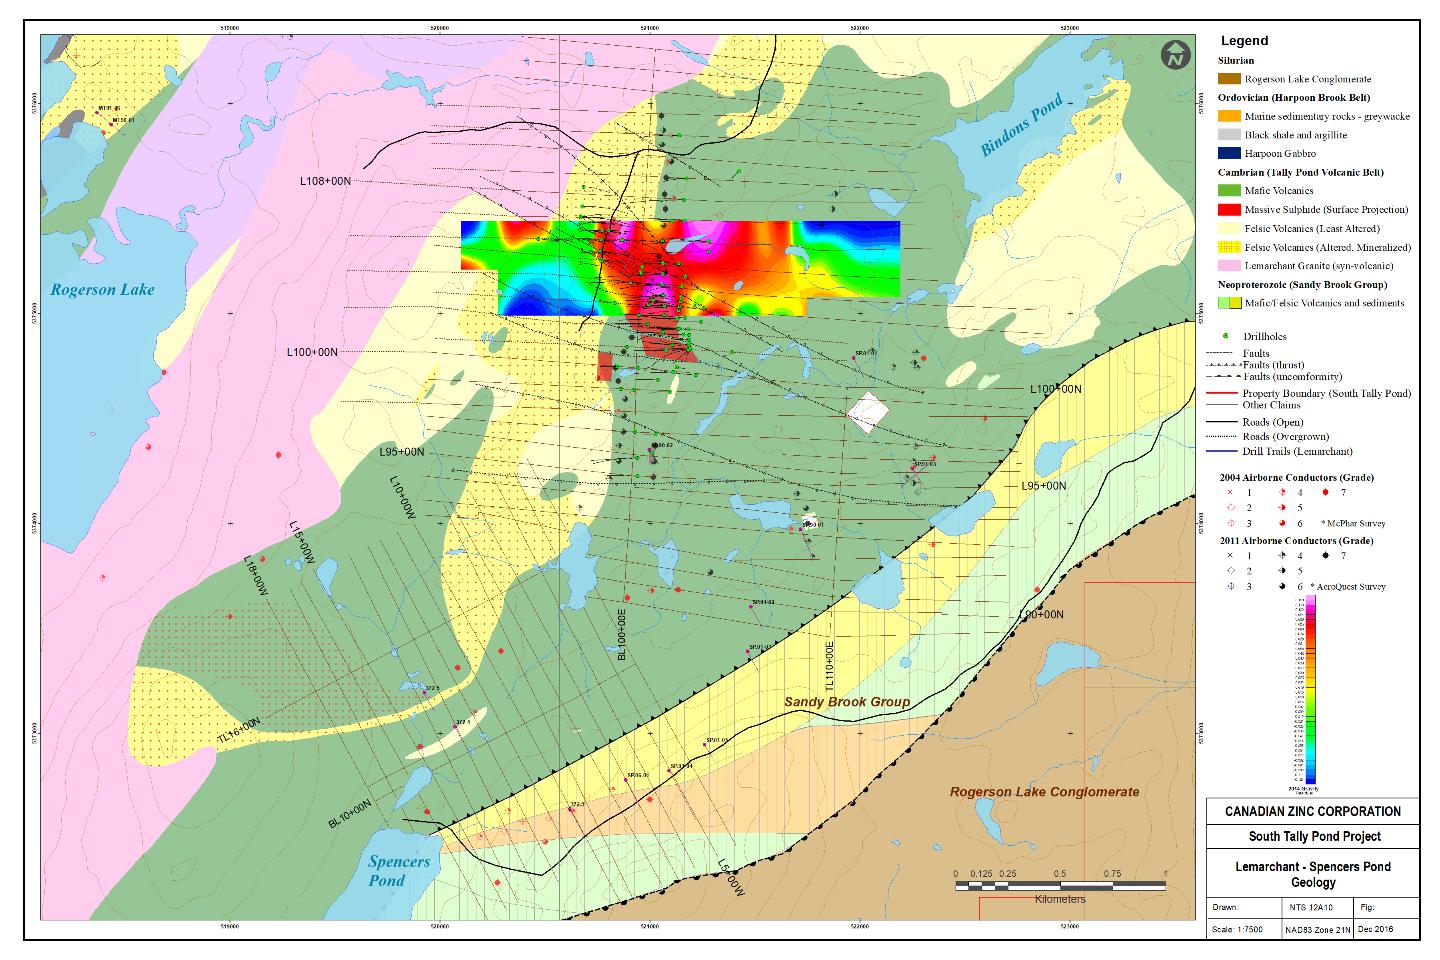
| 9.1.2 | 2016 Surface EM, Borehole EM and Magnetometer surveys |
Between October and December 2016, Eastern Geophysics Ltd. of Corner Brook, Newfoundland completed Pulse Electromagnetic (PEM) geophysical and magnetometer surveys over the Lemarchant North and Lemarchant SW target areas. The exploration work included line cutting and grid re-establishment along old and new ground grids in both areas as outlined on Table 9-1. Ground geophysical surveys including magnetometer, surface PEM and borehole PEM surveys are summarized below.
Table 9-1: 2016 Geophysical Programs
| Lemarchant SW (Target 2) | Lemarchant North (Target 5) | TOTAL |
| Gridding | 31.50 line km | 25.25 line km | 56.75 lime km |
| Surface Magnetics | 30.80 line km | 22.55 line km | 53.35 line km |
| Surface Pulse EM | 8.70 line km | 6.45 line km | 15.15 line km |
| Borehole Pulse EM | | 1 hole (475m) | |
Ground magnetometer surveys in the Lemarchant and Lemarchant SW grid area covered areas that were not previously ground surveyed for magnetics. The magnetic survey was completed on 100 metre spaced lines using a GEM-GSM-19 overhauser magnetic system complete with base station. Readings were continuous at 1 second intervals. The new magnetic data (Figure 9-2) was merged with historical magnetic data completed by Noranda in the 1980’s and 1990’s. The merged total field magnetic data (Figure 9-3) and vertical magnetic gradient (Figure 9-4) provides a more complete coverage over the Spencers Pond-Lemarchant area and should aid with geological interpretations.
| | NI43-101 Technical Report and Updated Resource Estimate South Tally Pond Property – Lemarchant Deposit |
The 2016 Pulse EM Survey was completed using an in-loop configuration, where lines are read inside the loop. This configuration is maximum coupled to flat lying conductors within the loop, but will null couple vertical conductors near the loop center. The known geology suggests that the geology and conductivity distribution are not vertical or steeply dipping. The 100 metres spaced lines were read at 25 metre station intervals. A 50 millisecond time base was used with vertical and in-line horizontal components of the secondary EM field measured. The two target areas, Lemarchant SW (Target 2) and Lemarchant North (Target 5) surveyed with Pulse EM are summarized below and illustrated on Figure 9-5.
Lemarchant SW (Target 2)
At Lemarchant SW, the PEM survey was aimed at further defining the EM-37 survey completed by Noranda in 1991 (Collins, 1992) and to develop drill targets around historic drillhole 372-5 which intersected graphitic mudstone with pyritic massive sulphides at the mafic-felsic volcanic contact. Lithogeochemistry indicates the mudstone horizon has a similar hydrothermal geochemical signature to the mudstones overlying the Lemarchant Deposit. Thin plate modelling of the Lemarchant SW surface Pulse EM survey data indicates that there are two, relatively near surface conductive trends in the surveyed area. The conductive trends are interpreted to be striking to the northeast and dipping gently to the northwest. A magnetic high in the area shows similarities to the magnetic highs observed over the Lemarchant Deposit.
Lemarchant North (Target 5)
At Lemarchant North, the surface PEM survey was aimed at defining new conductors north of the Lemarchant Deposit and to better define a “noisy” conductor defined by an earlier TDEM survey in 2011 (Devine et al, 2011). A single drillhole (LM13-81), was also surveyed with PEM during the surface PEM survey. Four other drill holes in this area were planned for surveying, but re-scheduled to 2017 due to poor accessibility brought on by early winter conditions.
Thin plate modelling of the Lemarchant North surface PEM survey indicates a strong near surface, east dipping conductors that coincide with north-south trending airborne EM anomalies. At least three drill holes along the south portion of this conductive trend have identified variably pyrite-pyrrhotitic-graphitic mudstones as the source of the conductors. Graphitic argillaceous sediments are intimately associated with base-metal-rich, pyritic massive sulphides at the Lemarchant Deposit and these conductive trends warrant further investigation.
| | NI43-101 Technical Report and Updated Resource Estimate South Tally Pond Property – Lemarchant Deposit |
Figure 9-2: 2016 Magnetic Survey Data
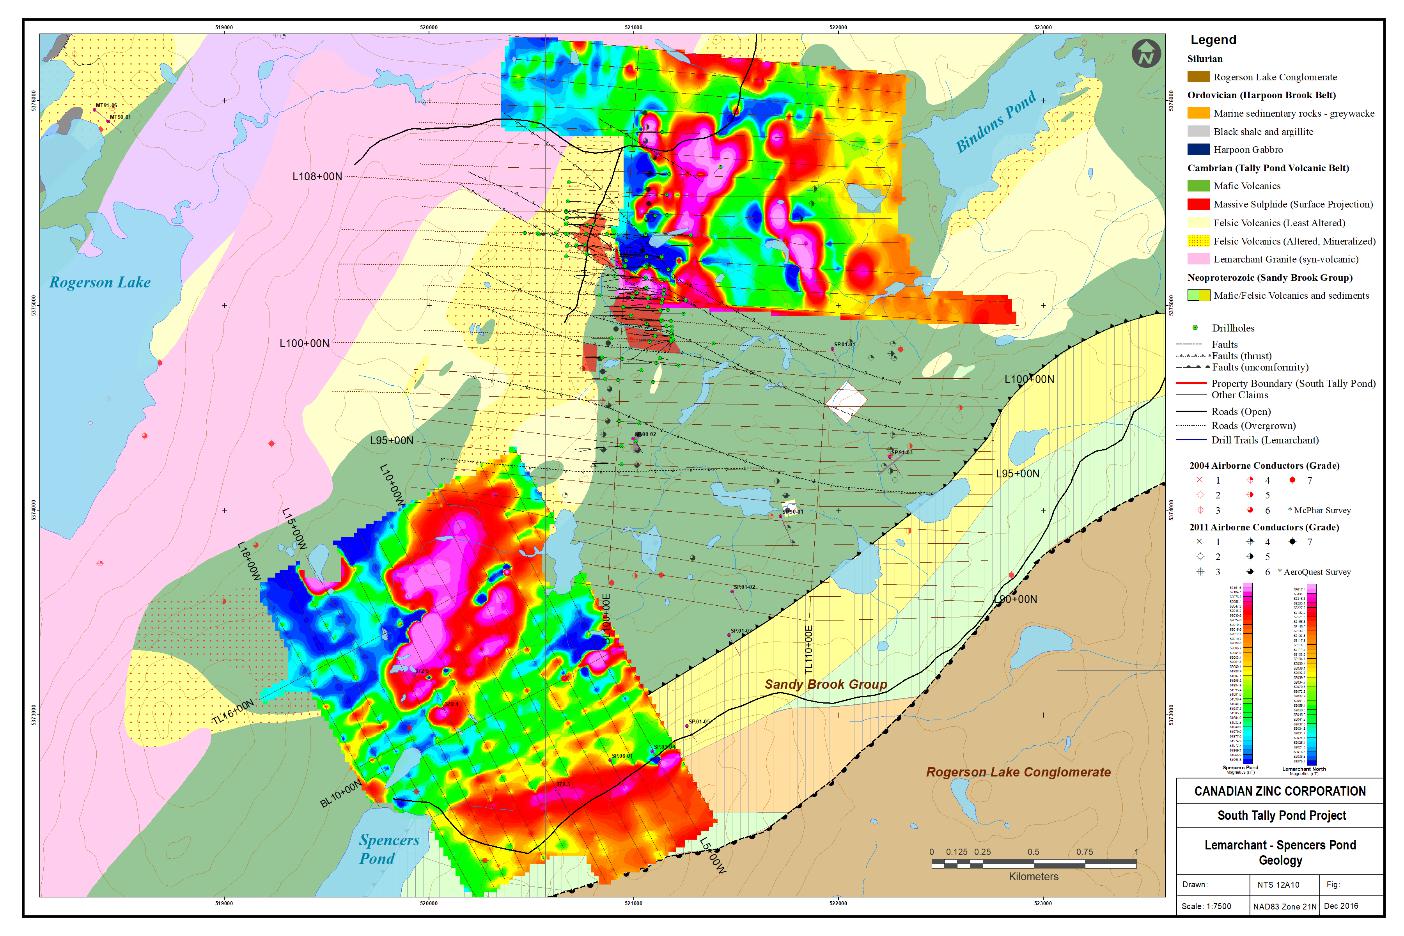
Figure 9-3: 2016 Merged Magnetic Data - Total Field
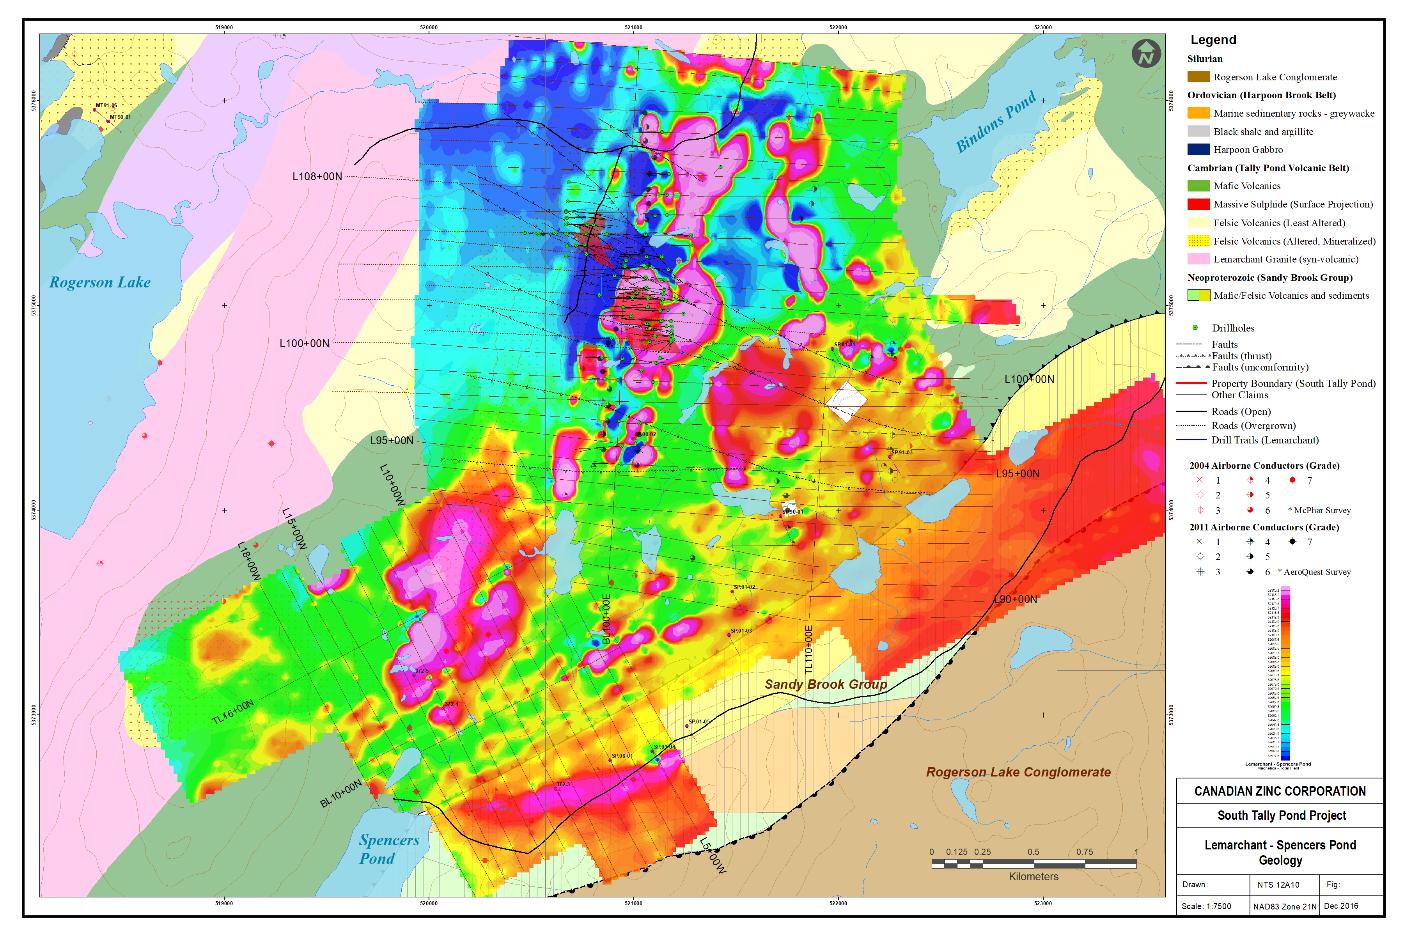
| | NI43-101 Technical Report and Updated Resource Estimate South Tally Pond Property – Lemarchant Deposit |
Figure 9-4: 2016 Merged Magnetic Data - Calculated Vertical Gradien

Figure 9-5: 2016 PEM Survey Areas - Targets 2 and 5
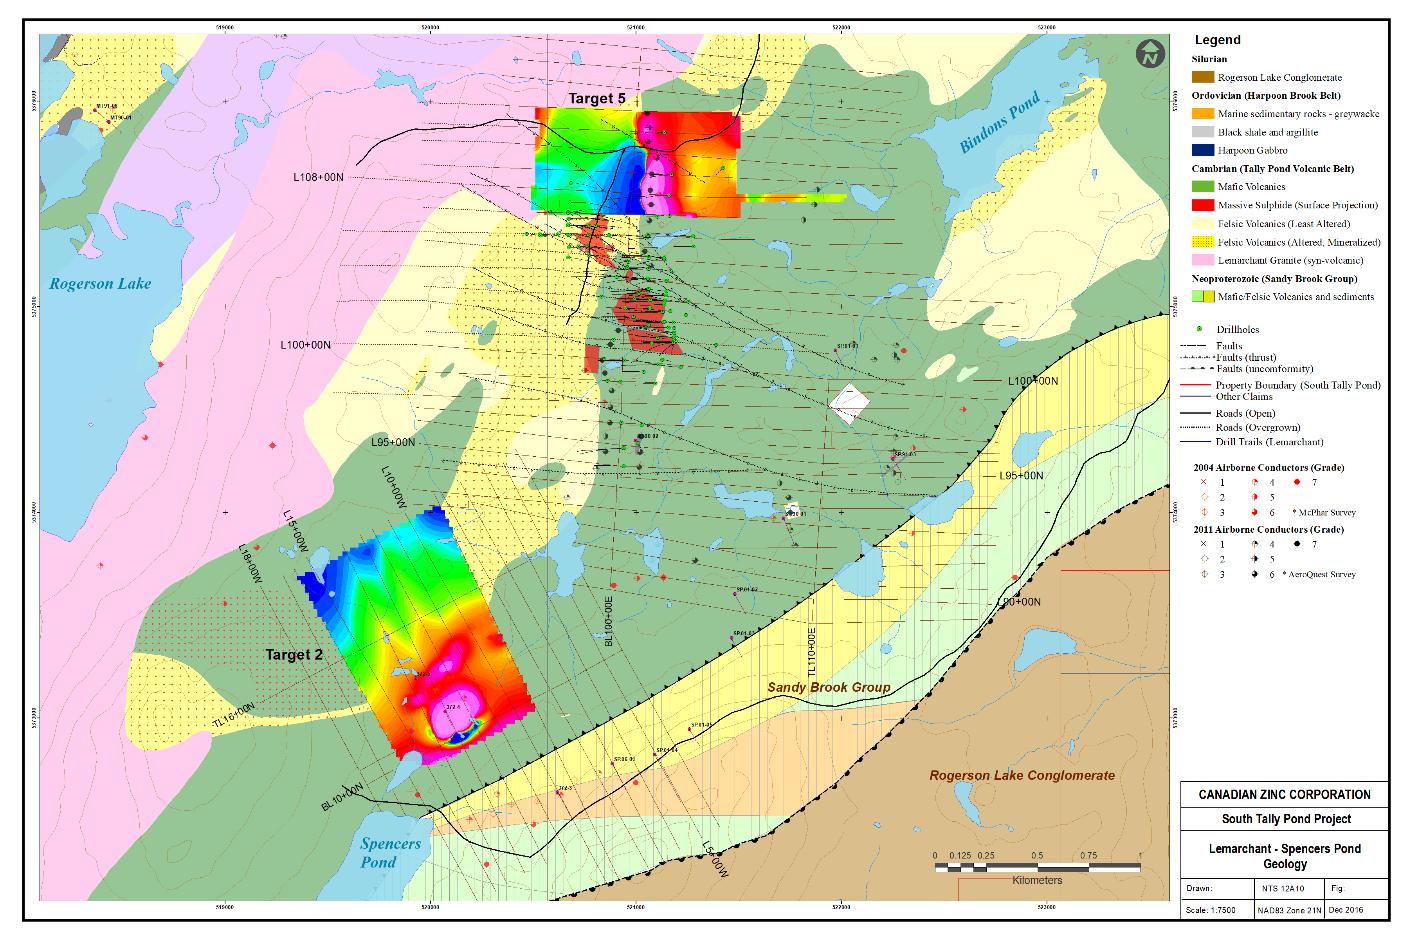
| | NI43-101 Technical Report and Updated Resource Estimate South Tally Pond Property – Lemarchant Deposit |
| 9.1.3 | 2017 Surface EM and Borehole EM surveys |
In June 2017, Abitibi Geophysics Ltd. of Val-d’Or, Quebec completed Time Domain Electromagnetic (TDEM) geophysical surveys over 3 target areas as outlined in Table 9-2 and illustrated on Figure 9-6. Line cutting and grid re-establishment for these three areas was completed in 2016. Borehole TDEM was completed on 5 drill holes (1,715 metres) at the Lemarchant Northwest Zone to test for deeper targets.
Table 9-2: 2017 Geophysical Programs
| Lemarchant South (Target 1) | Lemarchant South East (Target 3) | Lemarchant East (Target 4) | TOTAL |
| Gridding (2016) | 20.0 line km | 16.9 line km | - | 36.9 line km |
| Surface Pulse EM | 5.0 line km | 6.9 line km | 3.55 line km | 15.45 line km |
The TDEM survey parameters included using an out-of-loop configuration for the Lemarchant South and Southeast target areas, where lines are read outside the loop. This configuration is maximum coupled to vertical to steeply dipping conductors within the loop, but will null couple horizontal conductors near the loop center. The interpreted airborne EM suggests that the geology and conductivity distribution are steeper dipping in this area. The 100 metres spaced lines were read at 25 to 50 metre station intervals. A 50 millisecond time base was used with vertical and in-line horizontal components of the secondary EM field measured. At Lemarchant East an in-loop configuration was utilized for the TDEM survey. The three areas surveyed are summarized below.
Lemarchant South (Target 1)
At Lemarchant South, the surface TDEM survey was aimed at defining new conductors south of the Lemarchant Deposit and to better define a small, deep plate conductor detected and modelled at the southernmost line of an earlier Pulse EM survey in 2011 (Devine et al, 2011). To get a better idea of the orientation of the small deep target, an out-of-loop configuration was used to change the EM coupling between the transmitter and target. Seven grid lines spaced 100 metres apart (94N to 100N) were surveyed over the target area.
Thin plate modelling at Lemarchant South defined a steeply dipping conductor located in the vicinity of the 2011 modelled plate, which modelled a flat lying body. The two different orientations of the plates are likely due to the body being 3D in shape and being energized in different orientations by the 2011 and 2017 loops.
The newer 2017 modelling results are more reliable than the 2011 model and remained a valid drill target. Subsequent drilling intersected a steeply dipping pyrite-pyrrhotite mudstone horizon over a 100 metre strike length near a lower mafic-felsic volcanic contact (LM17-139, 140 and 142). The mudstones have a similar hydrothermal geochemical signature to the mudstones overlying the Lemarchant Deposit, although the underlying felsic volcanic units are notably less geochemically altered.
| | NI43-101 Technical Report and Updated Resource Estimate South Tally Pond Property – Lemarchant Deposit |
Lemarchant Southeast (Target 3)
At Lemarchant Southeast, the surface TDEM survey was aimed further defining a cluster of short-strike length, north-south trending airborne EM conductors (2011 airborne survey) interpreted to be bedrock sources. Review of the airborne EM conductors indicated a moderate to steeply dipping conductive body. Eight grid lines spaced 50 and 100 metres apart (92N to 97N) were surveyed over the target area.
Thin plate modelling of the TDEM data over the Southeast target area defined a moderately deep conductor off the northern edge of the survey coverage (additional surveying was recommended if located within favourable geology). Two additional modelled conductors are relatively shallow and coincide with the centre of the short strike length airborne EM anomalies located in the centre of the survey area. Drillhole SP90-01 (150/-45) tested this target in 1990 at a near parallel orientation to the 2011 airborne EM conductor trend. The drillhole intersected mafic volcanic rocks to 188 metres (EOH) with thin pyritic mudstone horizon at 50 metres and thin mudstone horizon at 120 metres. The drill core was not available for review.
A second cluster of short-strike length airborne EM conductors, located in the northeast corner of the grid area revealed no TDEM conductors. The airborne EM conductors were located within the loop and were surveyed using in-loop configuration. Drillhole SP91-03 (150/-45) tested this target in 1991 at a near parallel orientation to the 2011 airborne EM conductor trend. The drillhole intersected mafic volcanic rocks to 158 metres (EOH) with thick mudstone horizon from 57-64 metres and thin mudstone horizon at 140 metres. The drill core was not available for review.
Lemarchant East (Target 4)
At Lemarchant East, the surface TDEM survey (6 lines) was aimed at further defining a set of three airborne EM anomalies spatially associated with a weak gravity anomaly to the south. An in-loop configuration was used over this target due to logistical considerations, namely a pond to the east and known airborne EM conductors to the west. Six grid lines spaced 100 metres apart (105N to 110N) were surveyed over the target area. Thin plate modelling of the TDEM data over the East target area defined two small conductors at shallow (100m) and intermediate (200 m) depths. Their conductance are moderate to high, but due to their small modelled size, do not appear to be high priority targets.
Borehole Survey - Lemarchant Northwest Zone
Five drill holes (1,715 metres) were surveyed with borehole TDEM by Abitibi Geophysics in 2017. Three drill holes, LM13-91, LM14-97, and LM14-98 targeted down-dip and strike extensions to the Northwest Zone mineralization. Several targets were identified up-dip (mudstones) of the drill holes and along strike to the north (untested). Drillhole LM13-93 and LM14-105 targeted the lower felsic block stratigraphy to the north of the Lemarchant Main Zone. No conductive targets were identified in these altered felsic volcanic rocks. LM11-50 EXT (extended in 2017) and a key drill hole in this area could not be surveyed due to a blockage near the top of the drill hole.
| | NI43-101 Technical Report and Updated Resource Estimate South Tally Pond Property – Lemarchant Deposit |
Figure 9-6: 2016 PEM and 2017 TDEM Survey Areas - Targets 1-5
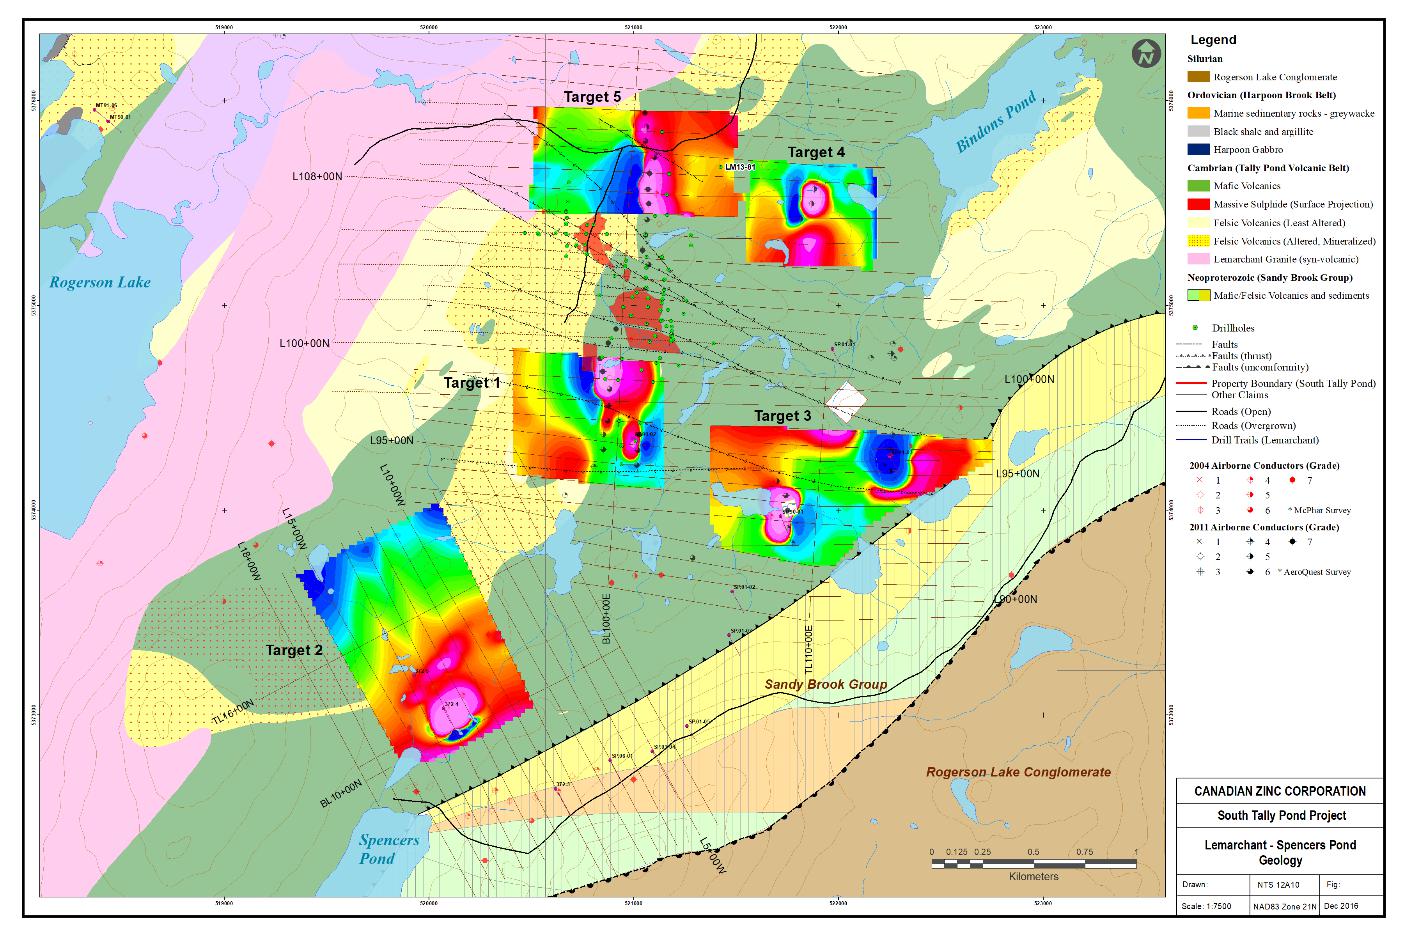
| 9.2 | Structural Study - Lemarchant Deposit |
In September 2017, Terrane Geoscience Inc. (“TGI”) was contracted to complete a structural analysis of the Lemarchant Deposit (Bartsch, 2017). The primary objective of this work was to develop a 3D structural model for incorporation into a mineral resource update of the deposit.
Two principal deformation events are recognized on the property as having significantly affected the geometry of the deposit: 1) a D1 event characterized as east-verging thrust faulting that occurred in response to terrane accretion in the late Paleozoic; and 2) a D2 event represented by steeply-dipping, oblique normal faulting during later extension.
The D1 structures comprise broad ductile shear zones, pervasive S1 foliation and close to tight folds, mainly observed in the mudstone. Extensional tectonics resulted in late-stage D2 brittle faulting with strike-slip faults bisecting the deposit and leading to internal block rotation within the Northwest Zone. Syn- to post-mineralization mafic intrusions intruded along weakened stratigraphic contacts and structurally prepared D1 Lemarchant Fault, resulting in obscured structural contacts and destruction of mineralization along targeted horizons.
| | NI43-101 Technical Report and Updated Resource Estimate South Tally Pond Property – Lemarchant Deposit |
A 3D model of the major structures was constructed by TGI. This model outlines the basic structural framework of the deposit; however, structural complexities, specifically in the Northwest Zone remain unresolved due to limitations on the modelling imposed by the lack of downhole structural data. TGI is of the opinion that the model is suitable for mineral resource estimation purpose as it provides constraints on mineralization that are supported by both the assay and geophysical data; however, in order to increase the resolution to the point where it can provide critical insights from an exploration perspective TGI recommends that additional structural orientation data be collected.
| 9.3 | Academic Studies - Lemarchant Deposit |
In 2015, Shannon Gill completed a Master of Science (M.Sc.) degree at Memorial University with an associated thesis entitled "Mineralogy, metal zoning and genesis of the Zn-Pb-Cu-Ag-Au Lemarchant volcanogenic massive sulphide (VMS) deposit". Results of this research work are summarized in Section 7.3.
In 2016, Stephanie Lode completed a Doctor of Philosophy (Ph.D.) degree at Memorial University which studied the metalliferous mudstones and graphitic shales in the location, genesis and paleoenvironment of volcanogenic massive sulphide deposits of the Cambrian Tally Pond volcanic belt. The following is summarized from Lode (2016) and Lode et. al. (2016).
The Ph.D. study focused on the Lemarchant Deposit, where metalliferous mudstones are genetically and spatially associated with mineralization, whereas elsewhere in the Tally Pond belt the relationship of other mudstones and shales to massive sulphide mineralization is less obvious and remains not fully understood. The metalliferous mudstones represent a hiatus in the volcanic activity where the deposition of hydrothermal products dominated over the abiogenic background sedimentation and/or dilution by volcaniclastic-epiclastic material. Lithogeochemical signatures allow for distinguishing between predominantly hydrothermally or detritally (non-hydrothermal) derived material.
Metalliferous mudstones with a significant hydrothermal component, like those at Lemarchant, have elevated Fe/Al and base-metal contents, compared to detrital shales, and shale-normalized negative Ce and positive Eu anomalies, indicative of deposition from high temperature (>250°C) hydrothermal fluids within an oxygenated water column.
The mudstones and shales sampled from other locations in the Tally Pond volcanic belt have more variable signatures ranging from hydrothermal (signatures as above) to non-hydrothermal (no positive Eu-anomalies, flat REE patterns), with some that have mixed (hydrothermal and detrital) signatures. Both sulphur (S) and Pb isotopic compositions indicate that proximal sulphides hosted in mudstones immediately associated with massive sulphide mineralization within the Lemarchant Deposit contain ahigher proportion of sulphur derived from hydrothermal sources and processes, and have more juvenile lead contributions, when compared to sulphides distal (not associated with massive sulphides) from mineralization. Lead and Nd isotopic compositions of both whole rock and minerals in the Lemarchant mudstones indicate involvement of underlying crustal basement during massive sulphide formation and throughout the evolution of the Tally Pond belt.
| | NI43-101 Technical Report and Updated Resource Estimate South Tally Pond Property – Lemarchant Deposit |
The Ph.D. thesis concluded that using lithogeochemistry, whole rock and in situ stable and radiogenic isotopes makes it possible to distinguish prospective vent proximal (immediately associated with massive sulphide mineralization) from less prospective distal (not associated with massive sulphides) depositional environments and to reconstruct the paleo tectonic setting on a deposit- to regional-scale for the Lemarchant Deposit and other mudstone-associated prospects in the Tally Pond volcanic belt. Accordingly, mudstones from areas with a Lemarchant-like hydrothermal and vent-proximal character are more attractive exploration targets than mudstones and shales with predominantly detrital signatures.
In 2017, Dr. Jonathan Cloutier completed a Post-Doctoral Fellowship at Memorial University which focused on reconstructing the original geometry of mineralization at the Lemarchant Deposit utilizing lithostratigraphy, structure, and lithogeochemistry (Cloutier et al., 2017).
Based on the research, Dr. Cloutier concluded that the Lemarchant Deposit consists of two distinct VMS lenses that formed in massive dacitic flows and related autoclastic volcaniclastic rocks (513- 509 Ma) during the transition between arc dominated and rift dominated environment. The relatively shallow water position (<1500 m) of the deposit promoted boiling at or near the seafloor, ultimately resulting in precious metals enrichment of the Lemarchant Deposit. The high angle LJ and KJ syn-volcanic shear zones are crosscut by the relatively flat-laying Lemarchant shear zone and suggests that the two mineralised zones did not originate from the same lens prior to deformation. The Northwest Zone is hosted in the immediate footwall of the folded LJ syn-volcanic shear zone, whereas the Main Zone occurs in the relatively undeformed hanging wall of the Lemarchant thrust.
| | NI43-101 Technical Report and Updated Resource Estimate South Tally Pond Property – Lemarchant Deposit |
NorZinc completed 91 drill holes for 28,675 metres from 2013 to 2017 at the Lemarchant Deposit and immediately along strike to the north and south. The total meterage includes 1,390 metres of drilling in 8 drillhole extensions and 219 metres in 3 drill holes that were abandoned due to excessive deviation. The drilling has resulted in the discovery of the Northwest zone, addition mineralization up-dip of the Main zone, and further overall definition of the Lemarchant Deposit. All NorZinc drillhole information is provided in Appendix I.
The drill programs were supervised by Christine Devine, P.Geo (2013), Alex Marcotte, P.Geo. (2013/2014); Gerry Squires, P.Geo. (2014-2015), Andrew Hussey, P.Geo. (2014-2017) and Michael Vande Guchte, P.Geo. (2013-2017). Drill core is stored outside in steel core racks at NorZinc’s core logging facility in Buchan’s Junction, NL. All significant drill intercepts are stored inside at the core facility.
A total of 165 drill holes for 52,950 metres have been completed at the Lemarchant Deposit including 14 Noranda drill holes and 60 Paragon drill holes as presented on Table 10-1. A drillhole location map (Figure 10-1) and two cross sections, one through the Main Zone (Figure 10-2) and one through the Northwest Zone (Figure 10-3) are provided at the end of the drilling section.
Table 10-1: Diamond Drilling at Lemarchant Deposit
| Year | Company | Drill holes | Metres | |
| 1983 | Noranda | 2 | 171.9 | 372-1 and 371-2 |
| 1991-1993 | Noranda | 12 | 2,845.4 | LM91-01 to 06, LM92-07 to LM92-08; LM93-09 to LM93-12 |
| 2007-2011 | Paragon Minerals | 60 | 21,258.4 | LM07-13 to LM17-72; 4 extensions (LM93-11E; LM08-24E; LM07-17E; LM08-28E) |
| Total Noranda and Paragon | 72 | 24,275.7 | |
| 2013 - Winter | NorZinc | 9 | 3,371.2 | LM13-73 to LM13-81; 2 extensions (LM08-27Ext; LM11-52Ext) |
| 2013 - Fall | NorZinc | 13 | 4,727.4 | LM13-82 to LM13-94; 1 extensions LM11-61Ext) |
| 2014 - Winter | NorZinc | 6 | 2,355.5 | LM14-95 to LM14-100 |
| 2014 - Fall | NorZinc | 6 | 2,644.0 | LM14-101 to LM14-106; 2 extensions (LM13-84E; LM13-94E) |
| 2015 - Fall | NorZinc | 1 | 239.0 | LM15-107 (metallurgical drillhole) |
| 2017 - Winter | NorZinc | 10 | 3,071.4 | LM17-108 to LM17-117; 3 extensions (LM11-50E; LM11-68E; LM13-90E) |
| 2017 - Summer | NorZinc | 38 | 9,082.0 | LM17-118 to LM17-155 |
| 2017 - Fall | NorZinc | 8 | 3,184.2 | LM17-156 to LM17-163 |
| Total NorZinc | 91 | 28,674.7 | |
| TOTAL DRILLING | 165 | 52,950.4 | |
| | NI43-101 Technical Report and Updated Resource Estimate South Tally Pond Property – Lemarchant Deposit |
| 10.1 | Drilling Methodology |
New Valley Drilling Company Ltd. (2013-2014) and RNR Diamond Drilling Ltd. (2014-2017), both from Springdale, NL were contracted to complete the diamond drilling. The drilling was completed using unitized Boyles 37 and Duralite 500 drill rigs equipped to drill NQ-sized core to depths of 600 metres. Drill pads and trails were typically cut ahead of the drilling and drill moves were made using a wide-pad bulldozer and/or Nodwell (New Valley) or with an excavator (RNR).
Drill collars were marked in the field with 2"x 2" painted wooden posts and labelled with aluminum tags. During the drill programs, the drill collar coordinates were collected using a hand-held GPS unit. A Reflex single-shot downhole survey instrument or equivalent was used to monitor drillhole deviation, with tests taken at the 20 metre depth and then approximately every 60 metres down the drillhole. Drilling utilized an 18 inch reaming shell and a hexagonal core barrel to help keep the drill holes from deviating excessively. Drill core was placed in wooden core trays supplied by local suppliers. Overall, the drill core recovery is considered excellent with only local, broken blocky sections around fault zones.
All drill core was processed at NorZinc’s secure, well-lit core logging facility in Buchans Junction, Newfoundland. NorZinc technicians determined rock quality designation (RQD), confirmed run lengths, and prepared the core for logging. Core boxes were labelled with aluminum tags indicating borehole number, box number, and core from and to data. Drill core was logged by NorZinc geologists who also selected and marked out all sample intervals. The drill core was systematically photographed four boxes at a time prior to sampling.
All sampled drill core intervals were cut in half using a diamond-bladed rock saw. Half of the core sample interval was bagged and sent to Eastern Analytical Ltd. (“Eastern Analytical”) in Springdale, NL, where samples were analysed for Cu, Pb, Zn, Ag and Au. The remaining half of the core sample is stored in the wood core trays with the sampled intervals marked for each sample. Select sample pulps resulting from the preparation for analysis at Eastern Analytical were forwarded to ALS Canada Ltd. (“ALS Canada”) of North Vancouver, BC for 33 trace-element ICP analysis (ME-ICP61) and Au Fire Assay (Au-AA23). The check assay program at ALS Canada ranged from 6 to 14% of the samples submitted to Eastern Analytical. Eastern Analytical is a commercial analytical services firm accredited to the ISO 17025 Standard for Fire Assay Au, as well as for multi-acid ore grade assays in Cu, Pb, Zn, Ag, Fe and Co. ALS Canada is a commercial analytical services firm operating internationally that is also accredited to the ISO 17025 Standard for the metals noted previously.
A total of 2,684 drill core samples were submitted to Eastern Analytical for Cu, Pb, Zn, Ag and/or Au analysis along with 149 blanks and 149 standards as outlined in Table 10-2. All drill core samples were delivered to Eastern Analytical by NorZinc personnel.
A total of 335 check assay samples (pulps) were sent to ALS Canada for Cu, Pb, Zn and Ag analysis of which 148 were also analysed for gold. Selected samples were sent for whole rock geochemical analysis by ME-XRF06 and ME-MS81.
| | NI43-101 Technical Report and Updated Resource Estimate South Tally Pond Property – Lemarchant Deposit |
Table 10-2: Summary of Drill Core Samples submitted to Eastern Analytical
| Samples | Au | Cu | Pb | Zn | Ag | |
| 2544 | x | x | x | x | x | Drill Core - Assay samples |
| 44 | | x | x | x | | Drill Core - Metallurgical Sample (LM15-107) |
| 92 | | x | x | x | x | Drill core - Whole Rock Sample - no gold analysis |
| 4 | x | | | | | Drill Core - Gold analysis only |
| 2684 | 2548 | 2680 | 2680 | 2680 | 2636 | |
Specific gravity determinations were carried out for 1,610 drill core samples via the mass in air/mass in water method for a total of 2,725 specific gravity density measurements. A total of 769 of the specific gravity readings fall within the geological solid used for the resource calculation.
In 2017, RIS Limited (Surveyors and Engineers) of Grand Falls-Windsor were contracted to survey all the Lemarchant drill holes. The drillhole survey was conducted using a GPS Real-time Kinematic (RTK) surveying system that obtains centimeter-level horizontal and vertical (elevation) accuracy. The GPS RTK data was collected in NAD83 MTM Zone 2 coordinates, the “TRX” and “NTv2” geodetic tools (provided on the Natural Resources Canada federal government website) were used to perform the coordinate transformation into NAD83 UTM Zone 21.
GeoticLog Software is utilized for entering and managing all the Lemarchant drillhole data. The data is stored in an MS Access database with hardcopy logs stored at NorZinc’s core logging facility in Buchan’s Junction, NL.
| 10.2 | Drilling Programs and Results |
Seven drill campaigns were completed by NorZinc between 2013 and 2017 at the Lemarchant Deposit and surrounding area. The seven drill programs were completed in 2013 winter and fall, 2014 winter and fall and 2017 winter, summer and fall. Highlights of the drill programs are summarized below.
The Lemarchant Deposit mineralization is defined as two zones or lenses, referred to as the Main zone and the Northwest zone. The latter was discovered during the first drill program by NorZinc in 2013. The drill programs focused on further defining the Northwest mineralization, extending the Main zone mineralization up-dip and along strike to the south, testing for mineralization in the “lower block” felsic stratigraphy through drillhole extensions, and also testing 2 priority target areas to the north and south.
| 10.2.1 | 2013 Winter Drill Program |
The 2013 winter program resulted in the discovery of the Northwest Zone mineralization located 250 metres northwest of the Lemarchant Main Zone mineralization. A total of 9 drill holes (3,371.2 metres), including two drillhole extensions, were completed during the program. Highlights are summarized below with significant assay results provided in Table 10-3.
| | NI43-101 Technical Report and Updated Resource Estimate South Tally Pond Property – Lemarchant Deposit |
| • | Massive sulphide mineralization discovered 250 metres to the northwest of the Lemarchant main zone mineralization in drill holes LM13-73 and LM13-74; |
| • | Three drill holes (LM13-76, 77 and 78) tested for a south extension to the Lemarchant Deposit and intersected favourable felsic volcanic stratigraphy with local anomalous base metal mineralization; |
| • | Massive sulphide mineralization intersected in drillhole LM13-79 which extended the Lemarchant Main Zone mineralization 35 metres up-dip of LM11-72 which intersected 5.02% Zn, 0.48% Pb, 0.47% Cu, and 12.82 g/t Ag over 3.7 metres beginning at a downhole depth of 173.3 metres; |
| • | LM13-80 intersected local zones of anomalous footwall mineralization in the Main zone; and |
| • | LM13-75, LM13-81 and two drillhole extensions were designed to test for down-dip extensions to the Lemarchant Main zone mineralization within the fault displaced lower felsic block stratigraphy. |
Table 10-3: Significant Assay Results from 2013 Winter Drill Program
| Drillhole | Section | From (m) | To (m) | Length (m) | Zn (%) | Pb (%) | Cu (%) | Ag (g/t) | Au (g/t) |
| LM13-73 | 106+00N | 302.8 | 317.4 | 14.6 | 2.54 | 0.81 | 0.27 | 30.27 | 0.65 |
| | | 328.0 | 350.2 | 22.2 | 5.82 | 1.48 | 0.75 | 65.41 | 1.63 |
| | includes | 328.0 | 331.0 | 3.0 | 6.48 | 3.42 | 1.78 | 175.73 | 2.01 |
| | | 331.0 | 347.5 | 16.5 | 2.13 | 1.19 | 0.24 | 41.49 | 1.20 |
| | | 347.5 | 350.2 | 2.7 | 27.60 | 1.12 | 2.71 | 89.01 | 3.80 |
| LM13-74 | 106+00N | 296.25 | 301.8 | 5.55 | 5.33 | 1.01 | 0.75 | 44.72 | 0.26 |
| | | 301.8 | 313.0 | 11.2 | 0.64 | 0.19 | 0.08 | 14.55 | 1.29 |
| | | 321.12 | 325.68 | 4.56 | 1.18 | 0.68 | 0.19 | 70.34 | 0.59 |
| | | 328.51 | 334.08 | 5.57 | 4.11 | 1.33 | 0.23 | 63.40 | 0.64 |
| | | 347.0 | 352.0 | 5.0 | 4.01 | 0.09 | 0.57 | 9.32 | 0.25 |
| LM13-75 | 106+00N | | | | No significant assays |
| LM13-76 | 100+00N | | | | No significant assays |
| LM13-77 | 100+00N | | | | No significant assays |
| LM13-78 | 100+00N | 171.0 | 178.6 | 7.6 | 0.79 | 0.01 | 0.18 | 2.41 | 0.05 |
| LM13-79 | 101+25N | 184.4 | 195.8 | 11.4 | 5.14 | 1.35 | 0.55 | 58.86 | 0.22 |
| | includes | 184.4 | 187.0 | 2.6 | 13.96 | 5.17 | 1.08 | 197.23 | 0.42 |
| LM13-80 | 101+50N | 210.8 | 215.0 | 4.2 | 1.50 | 0.07 | 0.39 | 2.17 | 0.04 |
| | | 228.3 | 229.3 | 1.0 | 0.04 | - | 1.16 | 16.7 | 0.23 |
| | | 233.8 | 260.7 | 26.9 | 0.80 | 0.03 | 0.14 | 1.21 | 0.06 |
| | | 268.7 | 272.0 | 3.3 | 1.54 | 0.24 | 0.06 | 4.37 | 0.11 |
| LM08-52 Ext. | 102+50N | | | | No significant assays |
| LM08-27 Ext. | 106+00N | | | | No significant assays |
| LM13-81 | 109+50N | | | | No significant assays |
* All intervals are core length; true thickness is estimated to be near core length.
| | NI43-101 Technical Report and Updated Resource Estimate South Tally Pond Property – Lemarchant Deposit |
| 10.2.2 | 2013 Fall Drill Program |
The 2013 fall program focused on extending the mineralization of the Northwest Zone and testing for extensions to the Lemarchant Main zone mineralization. Thirteen drill holes and one drillhole extension, totaling 4,727.4 metres were completed. Nine of the drill holes intersected significant sulphide mineralization. Highlights are summarized below with significant assay results provided in Table 10-4.
| • | Additional massive sulphide mineralization intersected at the Northwest Zone, extending the mineralization over a 100 metre strike length and remains open for expansion. |
| • | Significant precious metal values accompany the Northwest Zone base metal mineralization, including samples assaying 463.0 g/t silver over 1.0 metre and 17.5 g/t gold over 0.8 metre in drillhole LM13-94 at 338.5 metres downhole. |
Drilling at the North target (LM13-93) intersected strongly altered felsic volcanic rocks directly below the overlying basalts, which is similar to the stratigraphy associated with the massive sulphide mineralization of the Lemarchant Deposit to the immediate south.
Table 10-4: Significant Assay Results from the 2013 Fall Drill Program
| Drillhole | Section | From (m) | To (m) | Length (m) | Zinc (%) | Lead (%) | Copper (%) | Silver (g/t) | Gold (g/t) |
| LM13-82 | 105+50N | 309.0 | 312.0 | 3.0 | 9.33 | 0.38 | 0.90 | 38.57 | 0.47 |
| LM13-83 | 105+50N | 275.1 | 284.1 | 9.0 | 6.55 | 1.96 | 0.30 | 37.12 | 0.35 |
| | | 301.1 | 310.1 | 9.0 | 5.92 | 1.42 | 0.37 | 34.47 | 0.70 |
| | | 352.1 | 354.1 | 2.0 | 6.85 | 1.60 | 1.43 | 49.40 | 0.95 |
| LM13-84 | 105+50N | 331.7 | 333.0 | 1.3 | 7.01 | 5.17 | 1.35 | 42.77 | 3.50 |
| | | 348.0 | 363.0 | 15.0 | 1.33 | 0.19 | 0.14 | 5.95 | 0.12 |
| LM13-85 | 106+50N | | | | No significant assays |
| LM13-86 | 105+00N | 324.5 | 327.5 | 3.0 | 3.45 | 0.11 | 0.25 | 10.57 | 0.23 |
| LM13-87 | 105+00N | 282.6 | 283.6 | 1.0 | 2.08 | 0.38 | 0.08 | 49.6 | 2.4 |
| LM13-88 | 102+75N | 211.0 | 214.1 | 2.4 | 8.84 | 1.31 | 1.32 | 72.84 | 2.13 |
| | | 214.1 | 238.0 | 23.9 | 3.36 | 0.01 | 0.42 | 6.42 | 0.27 |
| LM13-89 | 103+50N | 163.1 | 166.1 | 3.0 | 1.41 | 0.08 | 0.11 | 3.73 | 0.03 |
| LM11-61 Ext | 103+00N | | | | No significant assays |
| LM13-90 | 104+00N | | | | No significant assays |
| LM13-91 | 108+50N | | | | No significant assays |
| LM13-92 | 104+50N | 155.6 | 157.6 | 2.0 | 1.73 | 0.0 | 1.30 | 18.1 | 0.27 |
| LM13-93 | 106+50N | | | | No significant assays |
| LM13-94 | 106+50N | 331.6 | 361.9 | 30.3 | 3.48 | 1.21 | 0.36 | 87.5 | 1.80 |
| includes | | 331.6 | 340.3 | 8.7 | 8.21 | 3.66 | 0.72 | 150.1 | 3.24 |
| | | 340.3 | 356.5 | 16.2 | 0.59 | 0.16 | 0.21 | 72.05 | 1.30 |
| | | 356.5 | 361.9 | 5.4 | 4.53 | 0.45 | 0.22 | 32.88 | 0.97 |
* All intervals are core length; true thickness is estimated to be near core length.
| | NI43-101 Technical Report and Updated Resource Estimate South Tally Pond Property – Lemarchant Deposit |
| 10.2.3 | 2014 Winter Drill Program |
The 2014 winter program focused on extending the mineralization of the Northwest Zone. Six drill holes, totaling 2,355.5 metres were completed during the program. Highlights are summarized below with significant assay results provided in Table 10-5.
| • | Drillhole LM14-95 (Section 106+50N), located 30 metres up-dip of drillhole LM13-94, intersected two semi-massive sulfide intervals between 315 and 400 metres downhole. |
| • | Drillhole LM14-96 (Section 106+50N), located 30 metres up-dip of drillhole LM14-95, intersected semi-massive to massive sulphides with massive barite (14 metres) between 303 and 321 metres downhole |
| • | Drillhole LM14-97 (Section 105+50N) located 35 metres down-dip of LM13-82, intersected a mineralized massive barite interval between 357 and 361 metres downhole. |
| • | Drillhole LM14-99 (Section 106+50N), located 40 metres up-dip of LM14-96 intersected a thick sequence of iron-rich mudstones and felsic volcanic rocks with anomalous base and precious metals between 224 and 249 metres downhole. |
| • | Drillhole LM14-100 (Section 107+00N), located 50 metres north of LM13-94, intersected disseminated to semi-massive stringer pyrite mineralization between 314 and 364 metres downhole with anomalous base and precious metals over two, 13 metres intervals. |
Table 10-5: Significant Assay Results from the 2014 Winter Drill Program
| Drillhole | Section | From (m) | To (m) | Length (m) | Zn (%) | Pb (%) | Cu (%) | Ag (g/t) | Au (g/t) |
| LM14-95 | 106+50N | 315.6 | 318.1 | 2.5 | 2.7 | 1.0 | 0.3 | 21.2 | 0.25 |
| | | 397.5 | 400.0 | 2.5 | 4.8 | 0.3 | 0.5 | 24.3 | 0.93 |
| LM14-96 | 106+50N | 302.8 | 305.3 | 2.5 | 2.8 | 1.1 | 0.3 | 26.3 | 0.40 |
| | | 305.3 | 319.3 | 14.0 | 0.9 | 0.3 | 0.2 | 55.8 | 0.70 |
| | | 319.3 | 320.8 | 1.5 | 7.0 | 4.3 | 0.4 | 62.1 | 0.70 |
| LM14-97 | 105+50N | 357.1 | 360.6 | 3.5 | 0.8 | 0.1 | 0.2 | 90.5 | 1.41 |
| LM14-98 | 105+50N | | | | No significant assays |
| LM14-99 | 106+50N | 223.2 | 224.1 | 0.9 | 2.4 | 1.2 | 0.09 | 29.1 | 0.25 |
| LM14-100 | 107+00N | 253.9 | 255.9 | 2.0 | 1.2 | 0.3 | 0.2 | 12.8 | 0.6 |
| | | 319.2 | 332.2 | 13.0 | 0.3 | 0.1 | 0.02 | 16.1 | 0.65 |
| | | 344.2 | 356.2 | 13.0 | 0.3 | 0.1 | 0.01 | 7.4 | 0.15 |
* All intervals are core length; true thickness is estimated to be near core length.
| 10.2.4 | 2014 Fall Drill Program |
The 2014 fall program continued testing for mineralized extensions to the Lemarchant Northwest Zone mineralization. Six drill holes and two drillhole extensions, totalling 2,644 metres were completed during the program. Highlights are summarized below with significant assay results provided in Table 10-6.
| | NI43-101 Technical Report and Updated Resource Estimate South Tally Pond Property – Lemarchant Deposit |
| • | Drillhole LM14-102 intersected stringer to semi-massive sulphides (stockwork) grading 3.40% zinc, 0.30% lead, 0.52% copper, 27.30 g/t silver and 0.44 g/t gold over 7.0 metres (core length) beginning at a downhole depth of 341.1 metres. The mineralization is located 30 metres down-dip of LM13-94 which intersected 8.21% zinc, 3.66% lead, 0.72% copper, 150.1 g/t silver and 3.24 g/t gold over 8.7 metres, beginning at a downhole depth of 331.6 metres. |
| • | Drillhole LM14-103 intersected semi-massive to massive sulphides grading 8.50 % zinc, 4.41% lead, 1.06% copper, 34.0 g/t silver and 0.55 g/t gold over 6.1 metres (core length), beginning at a downhole depth of 340.9 metres. The mineralization is located 30 metres down-dip of LM13-83 which intersected 6.55% zinc, 1.96% lead, 0.30% copper, 37.12 g/t silver and 0.35 g/t gold over 9.0 metres, beginning at a downhole depth of 275.1 metres. |
The Northwest Zone consists of precious metal rich semi-massive to massive sulphide mineralization and mineralized barite intervals within altered felsic volcanic rocks. The footwall to the mineralization consists of strongly altered felsic volcanic rocks with disseminated to stringer stockwork base metal mineralization.
Drilling and ongoing section interpretation has demonstrated the existence of numerous east-trending faults that have dissected the Northwest Zone and are interpreted to have detached the Lemarchant Deposit from its roots at the Northwest Zone. These displacements extend several hundred metres, leaving excellent potential to locate additional portions of the original lens in the immediate area.
Table 10-6: Significant Assay Results from the 2014 Fall Drill Program
| Drillhole | Section | From (m) | To (m) | Length (m)* | Zn (%) | Pb (%) | Cu (%) | Ag (g/t) | Au (g/t) |
| LM14-101 | 106+50N | | | | No significant assays |
| LM14-102 | 106+50N | 320.0 | 325.0 | 5.0 | 1.62 | 0.19 | 0.15 | 8.6 | 0.25 |
| LM14-102 | | 341.1 | 348.1 | 7.0 | 3.40 | 0.30 | 0.52 | 27.3 | 0.44 |
| LM14-103 | 105+50N | 340.9 | 347.0 | 6.1 | 8.50 | 4.41 | 1.06 | 34.0 | 0.55 |
| includes | | 343.9 | 345.9 | 2.0 | 12.35 | 7.40 | 1.84 | 47.8 | 0.90 |
| LM14-103 | 105+50N | 349.5 | 355.9 | 6.4 | 1.93 | 0.41 | 0.23 | 9.6 | 0.16 |
| LM14-104 | 105+50N | | | | No significant assays |
| LM14-105 | 107+00N | 372.0 | 377.0 | 5.0 | 0.88 | 0.00 | 0.03 | 1.0 | 0.03 |
| LM14-105 | | 380.1 | 386.6 | 6.5 | 1.78 | 0.00 | 0.08 | 2.4 | 0.05 |
| LM14-106 | 107+00N | 240.5 | 244.7 | 4.2 | 0.56 | 0.23 | 0.05 | 4.8 | 0.08 |
| includes | | 240.5 | 241.3 | 0.8 | 1.18 | 0.58 | 0.12 | 10.3 | 0.11 |
| LM13-83EXT | 105+50N | | | | No significant assays |
| LM13-94EXT | 106+50N | | | | No significant assays |
* All intervals are core length; true thickness is estimated to be near core length.
| 10.2.5 | 2017 Winter Drill Program |
The 2017 winter program focused on testing for mineralized extensions to the Lemarchant Deposit along strike, up-dip and down-dip of the currently defined Lemarchant resource. A total of ten drill holes and three drillhole extensions, totaling 3,071.4 metres were completed during the program. Highlights are summarized below with significant assay results provided in Table 10-7.
| | NI43-101 Technical Report and Updated Resource Estimate South Tally Pond Property – Lemarchant Deposit |
| • | Significant massive to semi-massive sulphide mineralization and mineralized barite was intersected in drill holes LM17-110 and LM17-111 extending the Lemarchant Deposit mineralization 25 and 50 metres up-dip respectively on section 101+25N |
| • | Mineralized massive barite intervals (separated by a mafic intrusive) were intersected in drillhole LM17-113 extending the Lemarchant Deposit mineralization 25 metres on strike to the south on section 100+75N. |
| • | Significant massive sulphide mineralization with mineralized barite was intersected in drill holes LM17-115 and LM17-116 extending the Lemarchant Deposit mineralization 35 and 65 metres up-dip respectively on section 102+50N. |
Table 10-7: Significant Assay Results from the 2017 Winter Drill Program
| Drillhole | Section | From (m) | To (m) | Length (m) | Zn (%) | Pb (%) | Cu (%) | Ag (g/t) | Au (g/t) |
| LM13-90Ext | 104+00N | 304.4 | 311.0 | 6.6 | 1.78 | 0.26 | 0.15 | 11.09 | .08 |
| LM17-108 | 104+00N | 345.6 | 348.7 | 3.1 | 3.32 | 0.53 | 0.16 | 28.52 | 0.06 |
| LM17-109 | 102+00N | | | | No significant assays |
| LM11-68Ext | 102+00N | | | | No significant assays |
| LM17-110 | 101+25N | 150.6 | 157.5 | 6.9 | 11.20 | 0.46 | 0.94 | 46.30 | 1.06 |
| LM17-111 | 101+25N | 151.4 | 155.2 | 3.8 | 2.84 | 1.01 | 0.75 | 73.40 | 0.45 |
| LM17-112 | 101+25N | 157.8 | 190.0 | 33.2 | 0.60 | 0.04 | 0.35 | 7.80 | 0.24 |
| includes | | 159.8 | 162.7 | 2.9 | 2.89 | 0.15 | 0.31 | 9.10 | 0.18 |
| LM17-113 | 100+75N | 157.4 | 158.3 | 0.9 | 7.21 | 2.93 | 0.36 | 53.00 | 0.16 |
| LM17-113 | 100+75N | 161.0 | 162.5 | 1.5 | 10.10 | 4.54 | 2.32 | 147.90 | 0.88 |
| LM17-114 | 102+00N | 214.0 | 217.9 | 3.9 | 3.85 | 0.21 | 0.45 | 7.80 | 0.08 |
| LM17-115 | 102+50N | 202.0 | 209.1 | 7.1 | 10.23 | 2.19 | 0.78 | 148.40 | 2.41 |
| LM17-116 | 102+50N | 212.3 | 218.3 | 6.0 | 14.06 | 6.27 | 1.88 | 382.90 | 2.01 |
| LM17-116 | 102+50N | 225.3 | 229.8 | 4.5 | 2.59 | 0.66 | 0.57 | 21.50 | 0.33 |
| LM11-50Ext | 108+00N | 387.4 | 398.7 | 11.3 | 0.62 | 0.03 | 0.13 | 6.30 | 0.10 |
| LM17-117 | 105+00N | 295.15 | 297.1 | 1.95 | 3.12 | 0.89 | 0.31 | 38.20 | 0.31 |
* All intervals are core length; true thickness is estimated to be near core length.
| 10.2.6 | 2017 Summer Drill Program |
The 2017 summer program, totalling 38 drill holes (9,082 metres) focused on further testing and defining the up-dip mineralization discovered during the 2017 winter drill program and initial testing of the North and South target areas. Highlights are summarized below with significant assay results provided in Table 10-8.
| | NI43-101 Technical Report and Updated Resource Estimate South Tally Pond Property – Lemarchant Deposit |
Twenty-six drill holes, totaling 5,360 metres, were completed on the Lemarchant Main Zone and two drill holes (880 metres) were completed on the Northwest Zone. Nine of the 28 drill holes intersected significant base and precious metal massive sulphide mineralization with numerous drill holes reporting lower grade, stringer base metal mineralization in the underlying footwall zone.
The winter and summer drill program successfully extended the Lemarchant Main Zone massive sulphide mineralization up-dip, by up to 80 metres on sections 101+75N through 103+25N (150 metres strike length). The up-dip mineralization typically has a well-developed footwall alteration zone with local zones of intense hydrothermal alteration and stringer mineralization. The vertical depths of the mineralized drill intercepts range from 120 to 170 metres.
Table 10-8: Significant Assay Results from the 2017 Summer Drill Program
| Drill Hole | Section | From (m) | To (m) | Length (m) | Zone | Zn (%) | Pb (%) | Cu (%) | Ag (g/t) | Au (g/t) |
| LM17-118 | 102+50N | 139.8 | 153.5 | 13.7 | FW | 0.78 | 0.05 | 0.26 | 2.3 | 0.08 |
| LM17-119 | 102+50N | 149.1 | 156.4 | 7.3 | MZ | 6.99 | 2.83 | 0.64 | 79.6 | 1.27 |
| LM17-119 | 102+50N | 156.4 | 167.9 | 11.5 | FW | 2.7 | 0.53 | 0.31 | 18.8 | 0.23 |
| LM17-120 | 102+50N | | | | | No significant assays |
| LM17-121 | 102+00N | 158.3 | 166.1 | 7.8 | MZ | 5.35 | 1.59 | 0.59 | 136.1 | 2.93 |
| LM17-122 | 102+00N | 161.7 | 166.1 | 4.4 | MZ | 9.78 | 3.17 | 1.04 | 91.0 | 2.92 |
| LM17-123 | 102+00N | | | | | No significant assays |
| LM17-124 | 102+00N | 154.65 | 157.45 | 2.8 | MZ | 8.82 | 1.02 | 1.14 | 46.5 | 0.53 |
| LM17-125 | 103+00N | 210.0 | 211.8 | 1.8 | MZ | 9.29 | 2.92 | 2.32 | 155.6 | 0.55 |
| LM17-126 | 103+00N | 210.6 | 218.1 | 7.5 | MZ | 14.41 | 3.41 | 2.40 | 576.9 | 1.06 |
| LM17-127 | 103+00N | 139.3 | 147.8 | 8.5 | FW | 0.71 | 0.04 | 0.11 | 2.22 | 0.06 |
| LM17-128 | 103+25N | 191.2 | 194.1 | 2.9 | MZ | 10.26 | 3.06 | 0.96 | 33.8 | 0.24 |
| LM17-129 | 103+25N | 182.0 | 186.0 | 4.0 | FW | 2.83 | 0.17 | 0.21 | 5.8 | 0.1 |
| LM17-130 | 101+75N | 158.75 | 161.0 | 2.25 | MZ | 29.26 | 2.33 | 1.91 | 168.3 | 7.1 |
| LM17-131 | 101+75N | 163.2 | 165.95 | 2.75 | MZ | 2.25 | 0.21 | 0.14 | 25.4 | 0.4 |
| includes | | 163.2 | 163.55 | 0.35 | MZ | 3.50 | 1.61 | 0.49 | 184.6 | 2.3 |
| includes | | 165.5 | 165.95 | 0.45 | MZ | 11.00 | 0.05 | 0.44 | 11.7 | 0.6 |
| LM17-132 | 101+75N | 161.2 | 163.0 | 2.8 | FW | 2.21 | 0.01 | 2.21 | 4.6 | 0.2 |
| includes | | 161.2 | 161.4 | 0.20 | FW | 26.80 | 0.09 | 4.13 | 35.9 | 0.33 |
| LM17-133 | 101+75N | 171.5 | 186.0 | 14.5 | FW | 0.84 | 0.43 | 0.07 | 24.0 | 0.2 |
| LM17-134 | 101+50N | 144.6 | 162.0 | 17.4 | FW | 1.13 | 0.28 | 0.20 | 16.7 | 0.3 |
| includes | | 144.6 | 147.6 | 3.0 | FW | 1.81 | 0.91 | 0.15 | 46.1 | 0.3 |
| includes | | 155.6 | 162.0 | 6.4 | FW | 1.76 | 0.18 | 0.44 | 18.6 | 0.4 |
| LM17-134 | 101+50N | 172.7 | 177.2 | 4.5 | FW | 2.05 | 0.09 | 0.43 | 3.2 | 0.1 |
| LM17-135 | 101+00N | 168.8 | 170.65 | 1.85 | FW | 2.90 | 0.11 | 0.29 | 10.5 | 0.2 |
| LM17-136 | 101+00N | 191.35 | 197.4 | 6.05 | FW | 5.04 | 1.29 | 0.60 | 29.6 | 0.3 |
| LM17-136 | 101+00N | 204.4 | 208.1 | 3.7 | FW | 5.59 | 0.79 | 0.69 | 7.8 | 0.1 |
| LM17-136 | 101+00N | 223.8 | 225.3 | 1.5 | FW | 2.99 | 0.01 | 1.40 | 8.0 | 0.2 |
| LM17-137 | 101+75N | 197.9 | 198.4 | 0.5 | FW | 2.37 | 0.81 | 0.19 | 32.9 | 2.35 |
| LM17-138 | 101+75N | 203.2 | 205.4 | 1.5 | FW | 1.89 | 0.53 | 0.18 | 30.3 | 0.10 |
| LM17-145 | 102+50N | 183.0 | 200.2 | 17.2 | FW | 2.17 | 0.28 | 0.19 | 10.60 | 0.08 |
| includes | | 197.9 | 200.2 | 2.3 | FW | 3.32 | 0.04 | 0.33 | 3.99 | 0.10 |
| LM17-146 | 102+00N | 201.4 | 204.3 | 2.9 | MZ | 10.97 | 0.27 | 1.31 | 28.09 | 1.73 |
| | | 204.3 | 210.1 | 5.8 | FW | 0.90 | 0.12 | 0.34 | 6.36 | 0.24 |
| LM17-147 | 104+75N | 196.0 | 201.2 | 5.2 | MZ | 3.36 | 0.96 | 0.39 | 113.7 | 1.60 |
| LM17-148 | 104+75N | | | | | No Significant assays |
| LM17-149 | 106+75N | | | | | No Significant assays |
| LM17-150 | 106+75N | 316.8 | 321.9 | 6.1 | FW | 3.22 | 2.00 | 0.26 | 15.7 | 0.4 |
| | 106+75N | 325.5 | 337.5 | 12.0 | FW | 3.18 | 1.86 | 0.44 | 15.5 | 0.3 |
| | | | | | | | | | | | |
* All intervals are core length; true thickness is estimated to be near core length; FW=Footwall, MZ=Mineralized Zone
| | NI43-101 Technical Report and Updated Resource Estimate South Tally Pond Property – Lemarchant Deposit |
Five drill holes, totaling 1,479 metres (LM17-139 to LM17-144) were completed on a priority target area (Target 1) located 500 metres south of the Lemarchant Deposit. The five drill holes targeted conductive zones modelled from the ground electromagnetic (EM) geophysical surveys completed in 2017. The drilling in this area intersected up to 5-metre thick, pyrite and/or pyrrhotite-rich mudstone horizons similar to those seen immediately above the massive sulphide mineralization at the Lemarchant Deposit. The iron-rich mudstones are typically located at the mafic-felsic transition; however, no significant base metal mineralization was intersected.
Five drill holes, totalling 1,363 metres (LM17-151 to LM17-155) were completed on the North target area (Target 5), an undrilled area, located 300 to 500 metres north of the Lemarchant Deposit. The five drill holes targeted near surface, conductive zones modelled from the ground electromagnetic (“EM”) geophysical surveys completed in 2016. The drilling in this area intersected up to 2-metre thick, pyrite and/or pyrrhotite-rich mudstone horizons similar to those seen near surface at the Lemarchant Deposit. The iron-rich mudstones are typically located at the mafic-felsic volcanic transition; however, no significant base mineralization was intersected.
| 10.2.7 | 2017 Fall Drill Program |
The 2017 fall drill program at Lemarchant tested for additional south extensions to the Main Zone and extensions to the Northwest Zone. Three drill holes (618.2 metres) tested for south extensions to the Lemarchant Main Zone. Highlights are summarized below with significant assay results provided in Table 10-9.
| • | Drillhole LM17-160 intersected 3.92% zinc, 0.52% lead, 0.73% copper, 15.4 g/t silver, 0.07 g/t gold over 1.1 metres extending the mineralization 25 metres south of previous drillhole LM17-113, which intersected 10.10% zinc, 4.54% lead, 2.32% copper, 147.9 g/t silver, 0.88 g/t gold over 1.5 metres, beginning at a downhole depth of 161.0 metres. The mineralized horizon remains open along strike to the south. |
| | NI43-101 Technical Report and Updated Resource Estimate South Tally Pond Property – Lemarchant Deposit |
| • | Drillhole LM17-161 extended the mineralization 25 metres up-dip of LM17-113 on section 100+75N with 1.89% zinc, 0.27 lead, 2.36% copper, 23.19 g/t silver, 0.19 g/t gold over 4.25 metres, beginning at a downhole depth of 170.5 metres. The mineralized horizon remains open up-dip. |
| • | Drillhole LM17-163 tested 25 metres south of LM17-161 where the projected mineralized horizon has been replaced by un-mineralized felsic intrusions. |
Five drill holes (2,566 metres) tested for additional extensions to the Lemarchant Northwest Zone. Three of the drillhole intersected footwall stringer and disseminated base metal mineralization over 2 to 7 metres widths.
| • | Drill holes LM17-156 and 157 targeted up-dip and north extensions, respectively, to mineralization intersected in LM17-150 which intersected 3.05% zinc, 1.78% lead, 0.35% copper, 14.6 g/t silver, 0.5 g/t gold over 21.4 metres, beginning at a downhole depth of 316.8 metres. |
| • | Drill holes LM17-158 tested 50 metres up-dip of LM10-24 where previous drilling intersected 6.60% zinc, 0.68% lead, 0.61% copper, 28.28 g/t silver, 0.46 g/t gold over 6.0 metres, beginning at a downhole depth of 432.9 metres. No significant mineralization was intersected. |
| • | Drill holes LM17-159 and 162 targeted down-dip extension to the Northwest Zone mineralization. LM17-162 intersected weak base metal mineralization in a strongly sheared interval. |
Table 10-9: Significant Assay Results from the 2017 Fall Drill Program
| Drill Hole | Section | From (m) | To (m) | Length (m) | Zn (%) | Pb (%) | Cu (%) | Ag (g/t) | Au (g/t) |
| Lemarchant Main Zone |
| LM17-160 | 100+50N | 163.7 | 164.8 | 1.1 | 3.92 | 0.52 | 0.73 | 15.43 | 0.07 |
| LM17-161 | 100+75N | 170.5 | 174.75 | 4.25 | 1.89 | 0.27 | 2.36 | 23.19 | 0.19 |
| including | | 174.15 | 174.75 | 0.60 | 1.18 | 0.02 | 14.50 | 51.2 | 0.77 |
| LM17-163 | 100+50N | | | | No Significant Assays |
| Lemarchant Northwest Zone |
| LM17-156 | 106+75N | 252.0 | 254.0 | 2.0 | 3.02 | 0.65 | 0.30 | 16.05 | 0.02 |
| | | 295.0 | 299.0 | 4.0 | 1.92 | 0.73 | 0.13 | 71.28 | 0.82 |
| LM17-157 | 107+50N | 447.0 | 451.0 | 4.0 | 1.25 | 0.34 | 0.13 | 19.63 | 0.15 |
| LM17-158 | 105+00N | | | | No Significant Assays |
| LM17-159 | 107+00N | | | | No Significant Assays |
| LM17-162 | 106+00N | 448.0 | 455.0 | 7.0 | 2.19 | 0.05 | 0.19 | 3.87 | 0.12 |
* All intervals are core length; true thickness is estimated to be 80-100% of core length
| | NI43-101 Technical Report and Updated Resource Estimate South Tally Pond Property – Lemarchant Deposit |
Figure 10-1: Drill hole Location Map - Lemarchant Deposit
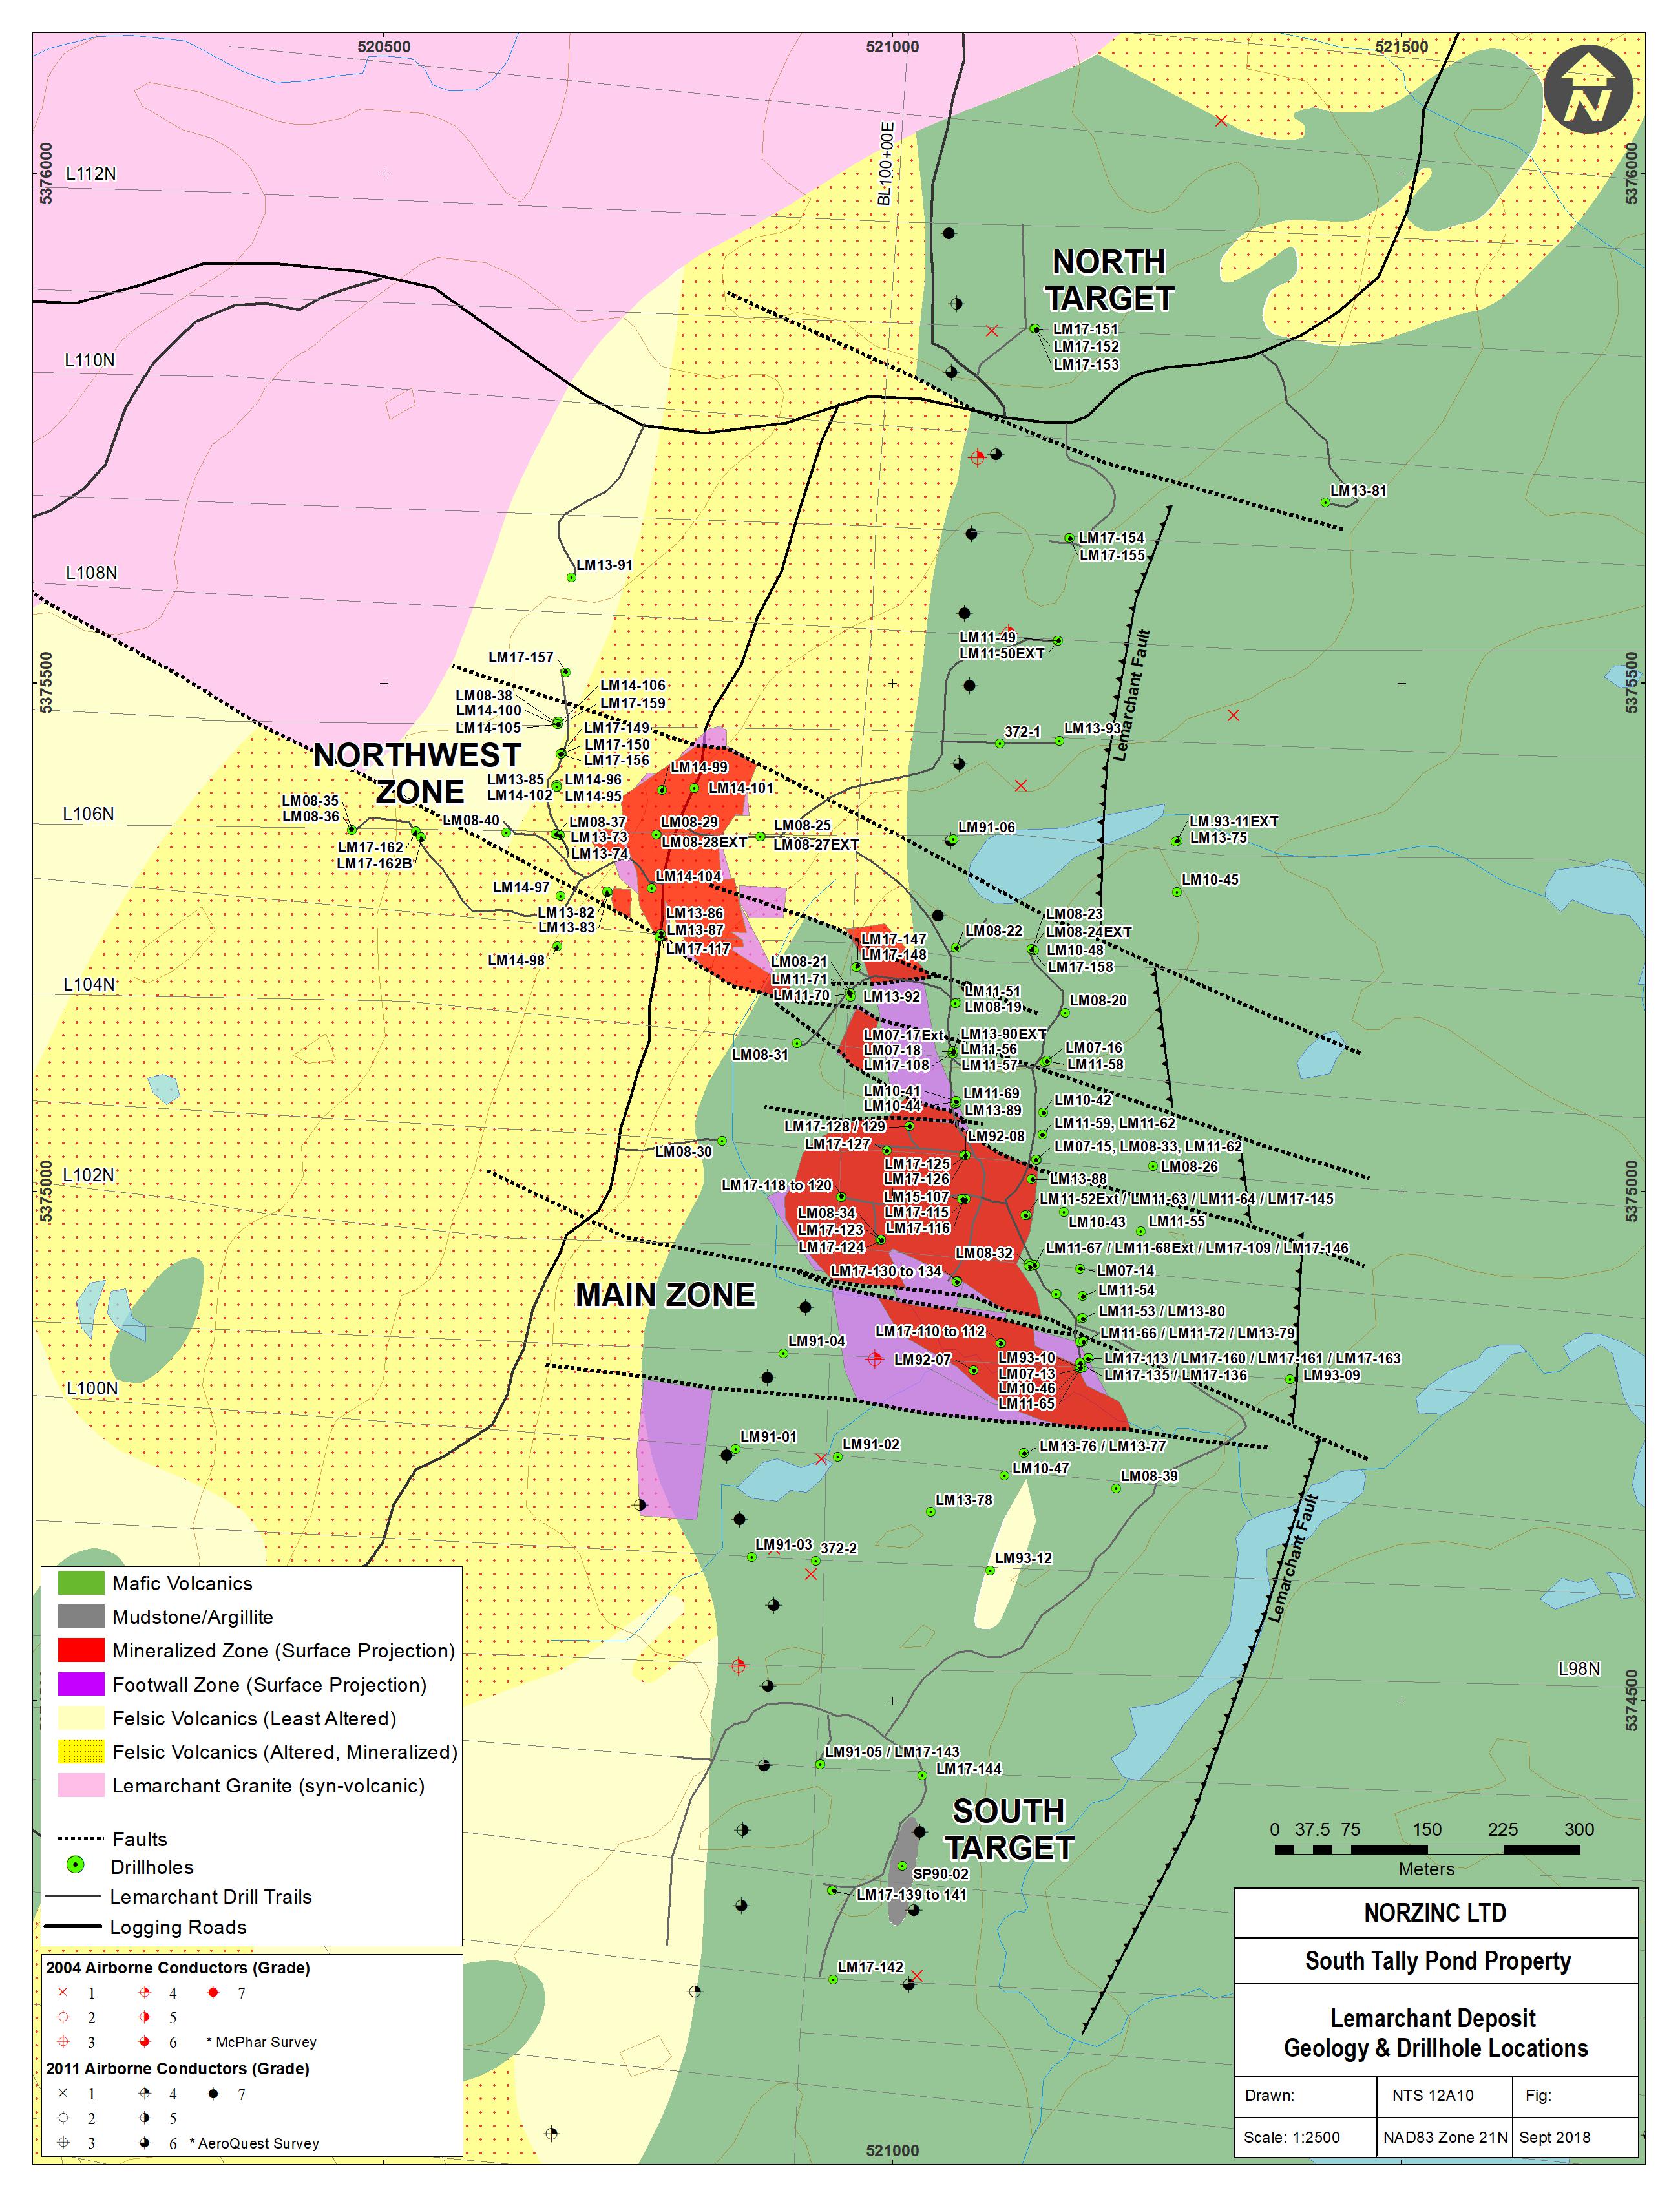
| | NI43-101 Technical Report and Updated Resource Estimate South Tally Pond Property – Lemarchant Deposit |
Figure 10-2: Section 102+50N - Lemarchant Deposit (Main Zone)
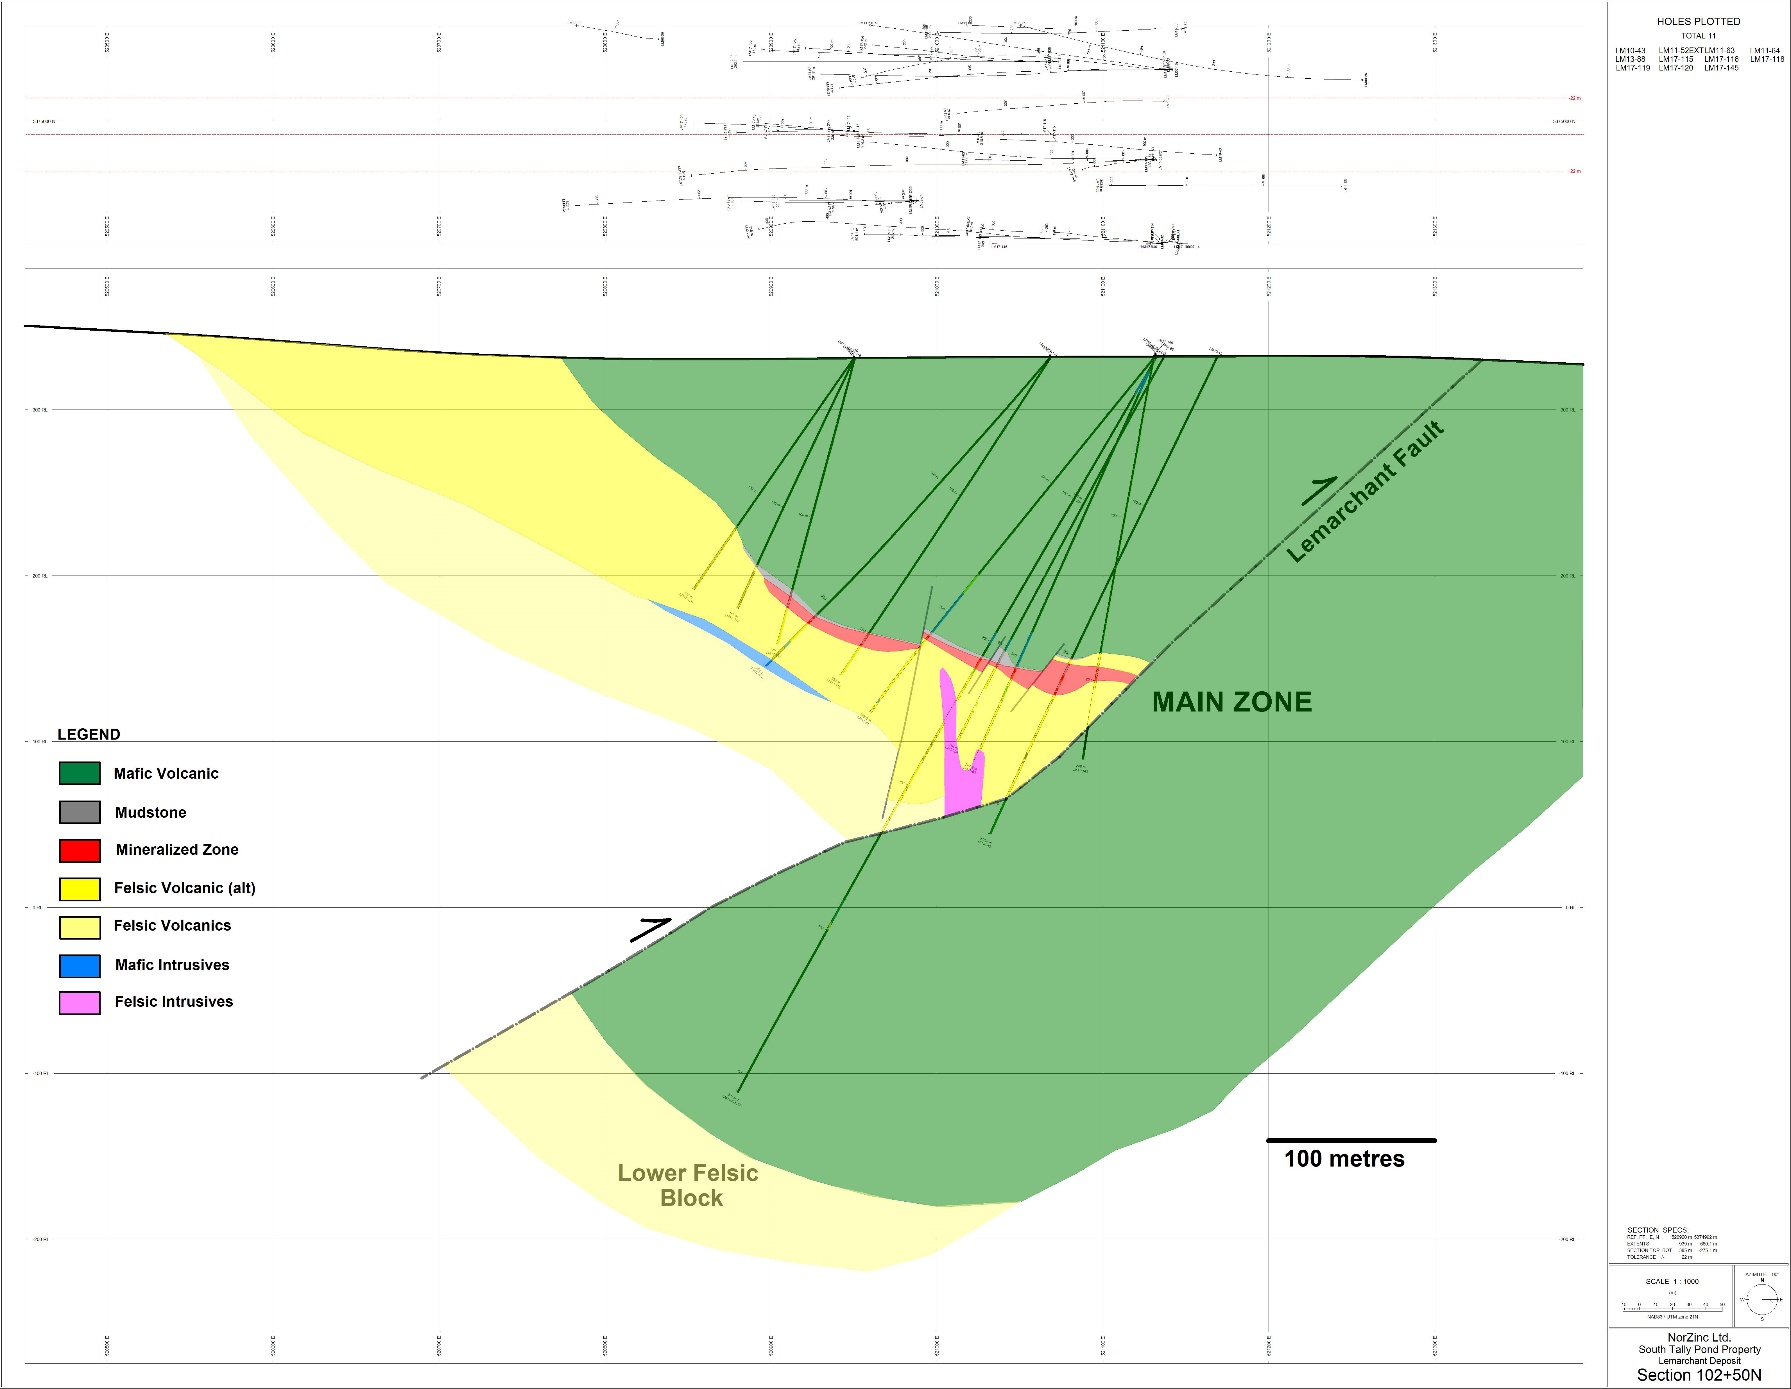
| | NI43-101 Technical Report and Updated Resource Estimate South Tally Pond Property – Lemarchant Deposit |
Figure 10-3: Section 106+00N - Lemarchant Deposit (Northwest Zone).
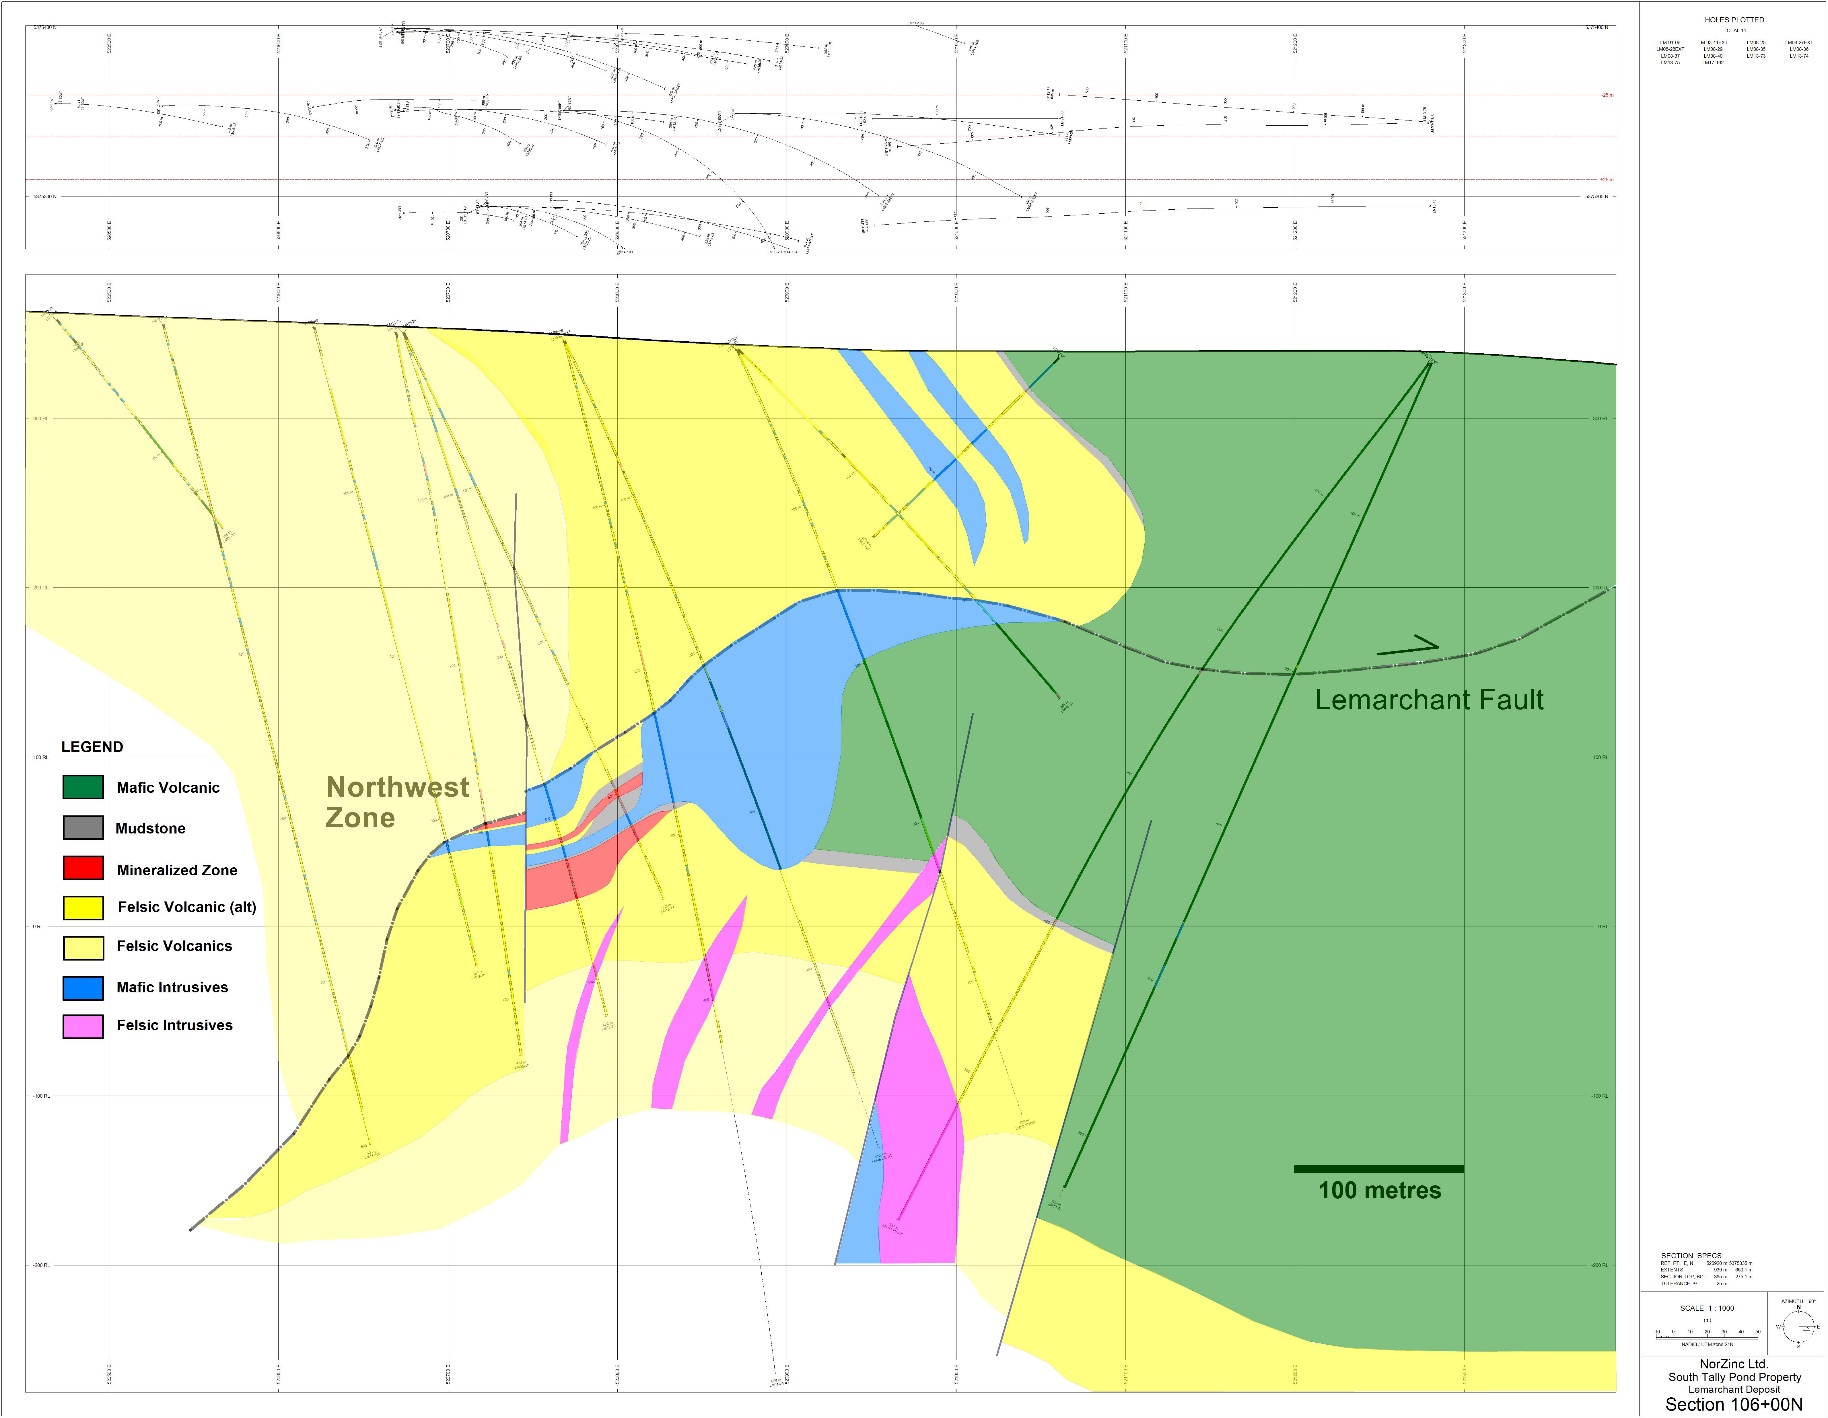
| | NI43-101 Technical Report and Updated Resource Estimate South Tally Pond Property – Lemarchant Deposit |
| 11.0 | SAMPLE PREPARATION, ANALYSES AND SECURITY |
| 11.1 | Sample Collection, Control Samples and Shipping |
NorZinc completed systematic sampling and assaying of drill core from the Lemarchant Deposit by cutting NQ core in half with a diamond bladed rock saw. Drill core samples were marked by the geologist using coloured wax lumber crayon and sample tags with unique sample numbers. The core samples were taken so as to not cross lithological boundaries and were collected to be between 0.3 and 1.0 metres in length. Through zones of semi-massive to massive sulphides, sample length was generally kept to lengths of 0.5 to 1.0 metres.
The marked sample intervals were cut and bagged by the core technician. Half of the sample tag was placed in a plastic bag along with the sample with the other half of the numbered sample tag stapled into the wooden box at the beginning of the core interval. Each bag was closed with plastic zip strap and labelled with permanent marker. Control samples (1 natural blank and 1 control standard) were inserted for every 20 core samples collected for assay quality control purposes. As per standard industry practice, NorZinc preserved half of the core after cutting.
All drill core samples were transported in sealed and numbered poly-woven rice bags to Eastern Analytical by NorZinc personnel. Eastern Analytical confirmed the number of bags on arrival and did not report any irregularities or opened bags for any of the sample shipments. Sample pulps were shipped from Eastern Analytical to ALS Canada in sealed cardboard boxes using a national courier company. Sample coarse rejects and pulps have been returned to NorZinc and are currently stored at the NorZinc’s secure core storage facility in Buchan’s Junction, NL.
Core sample preparation at Eastern Analytical is carried out according to the following specifications. The samples are dried and then crushed in two stages to -10 mesh. The coarse crushed sample is then split using a rifle splitter into two sub-samples; one of approximately 300 grams and a remaining generally larger sample (coarse reject). The 300 gram sub-sample is then ring milled such that 98% of the material is less than 150 mesh, producing the sample pulp to be used for analysis. Ring mills are quartz cleaned between samples. Sample coarse rejects and what remains from the 300 gram sample pulp following analysis are retained for future reference.
| 11.3 | Analytical Methods and Procedures |
Drill core samples collected for assay during each of the drilling programs were analysed at Eastern Analytical for Au by fire assay with atomic absorption spectrometry finish (FA-AAS) and for Cu, Pb, Zn and Ag by AAS after Aqua Regia digestion. Select sample pulps, prepared by Eastern Analytical were forwarded to ALS Canada for 33-element trace analysis by Inductively Coupled Plasma Atomic Emission Spectroscopy (ME-ICP61) as check assay samples. The following analytical procedures were completed.
| | NI43-101 Technical Report and Updated Resource Estimate South Tally Pond Property – Lemarchant Deposit |
Eastern Analytical Au Fire Assay - A 30 g sample is weighed into an earthen crucible and mixed with PbO fluxes. Silver nitrate is then added and the sample is fused in a fire assay oven to obtain a liquid which is poured into a mould and let cool. The lead button is then separated from the slag and cupelled in a fire assay oven. The resulting silver bead also contains any gold that may be present. The silver is removed with 1 ml nitric acid and then 3 ml hydrochloric acid is added to bring the Ag and Au into solution. After cooling, de-ionized water is added to bring the sample up to a desired volume. The sample is then analysed by AAS.
Eastern Analytical Cu, Pb and Zn Analysis - A 0.200 g sample of the pulp is digested in a beaker with 10ml of nitric acid and 5ml of hydrochloric acid for 45 minutes. The sample is then transferred to a 100ml volumetric flask following which it is analysed on the AAS. Eastern states that the lower detection limit for this method is 1 ppm and there is no upper detection limit.
Eastern Analytical Ag Analysis - A 1000 mg sample of the pulp is digested in a 500ml beaker with 10ml of hydrochloric acid and 10ml of nitric acid with the cover left on for 1 hour. The cover is removed and the sample allowed to evaporate to a moist paste. Following this, 25ml of hydrochloric acid and 25ml of de-ionized water are added and the resulting mixture is heated gently and swirled to dissolve solids. The sample is cooled and transferred to a 100ml volumetric flask following which it is analysed on the AAS. Eastern Analytical states that the lower detection limit for this method is 0.2 ppm and there is no upper detection limit.
Eastern Analytical Methodology and Reporting - Samples are analysed one at a time by AAS (in batches of 24) with a value obtained by taking the average of three readings per sample. The AAS unit is checked with a calibration solution after every 12 samples. Sample results are recorded manually and transferred to the manual data entry person where assay data is remerged with NorZinc sample number and tabulated into reports for certificates. Reports and standards are checked by the Chief Assayer before the certificates are released to the client.
ALS Canada ICP Analysis (ME-ICP61) - A prepared sample (0.250 gram) is digested with perchloric, nitric, and hydrofluoric acids to near dryness. The sample is then further digested in a small amount of hydrochloric acid. The solution is made up to a final volume of 12.5 ml with 11% hydrochloric acid, homogenized, and analyzed by inductively coupled plasma-atomic emission spectrometry (ICP-AES). Results are corrected for spectral inter-element interferences.
| | NI43-101 Technical Report and Updated Resource Estimate South Tally Pond Property – Lemarchant Deposit |
| 12.1 | Quality Control Data |
NorZinc employed a systematic quality control sampling program throughout all of its drill programs that consisted of the insertion of a natural blank (Skull Hill Granite) and powdered certified reference standard for Cu, Pb, Zn, Ag and Au for every 20 core samples collected. The number of blanks and standards by drill program are indicated in Table 12-1. In addition to the insertion of these control samples, NorZinc completed check assaying on random samples for Cu, Pb, Zn, Ag and Au by forwarding random sample pulps from Eastern to an independent analytical lab (ALS Canada). The number of check assay samples per sample shipment ranging from 5-14%.
Table 12-1: Summary of Standards and Blanks
| Drill Program | Blank | STD-FCM6 | STD-FCM7 | STD-1308 | STD-1405 |
| 2013 Winter | 33 | 14 | 19 | | |
| 2013 Fall | 26 | 12 | 14 | | |
| 2014 Winter | 17 | 3 | 3 | 11 | |
| 2014 Fall | 16 | 4 | 2 | 10 | |
| 2015 Fall | 2 | 1 | 1 | | |
| 2017 Winter | 9 | 3 | 2 | | 4 |
| 2017 Summer | 36 | 1 | | | 35 |
| 2017 Fall | 10 | | | | 10 |
| TOTAL | 149 | 38 | 41 | 21 | 49 |
| 12.1.1 | Analytical Standards |
Reference material control samples provide a means to monitor the precision and accuracy of the laboratory assay results. Five separate certified reference standards were used during the 2013-2017 drill programs. Standards were obtained by NorZinc from CDN Resources Laboratories Ltd., of Langley, British Columbia and are certified by licensed assayer Duncan Sanderson. The standards used were selected based on similar Au, Ag, Cu, Pb, and Zn contents within the range of Lemarchant Deposit mineralization and include FCM-6, FCM-7, STD-1308 and STD-1405.
The standards were analyzed at Eastern Analytical for Au by fire assay and for Cu, Pb, Zn, and Ag by aqua-regia digestion with atomic absorption finish in the batch sample sequence. Analytical results are plotted by element for each standard and provided in Appendix II as Figures 12-1 (a-e) through 12-4 (a-e). Results are further summarized below on Tables 12-2 through 12-6. Analyses that exceed 2 standard deviation (SD) from the mean are considered a warning, and analyses that exceed the 3 standard deviation (SD) from the mean are considered a failure.
Overall performance of the 2013-2017 control samples is acceptable with most assay results falling within two standard deviations from the mean as summarized on Table 12-2.
| | NI43-101 Technical Report and Updated Resource Estimate South Tally Pond Property – Lemarchant Deposit |
Table 12-2: Overall Summary of Standard Performance
| | Gold | Silver | Copper | Lead | Zinc | TOTAL |
| No. of Assays | 142 | 147 | 149 | 149 | 149 | 736 |
| No. of values within 2SD | 132 | 137 | 136 | 140 | 137 | 683 |
| Percent within 2SD | 92.6 | 93.2 | 91.3 | 94.0 | 91.9 | 92.8 |
| No. of values between 2 to 3 SD | 9 | 8 | 10 | 7 | 10 | 44 |
| Percent between 2 to 3 SD | 6.3 | 5.4 | 6.7 | 4.7 | 6.7 | 6.0 |
| No. of Values outside 3 SD | 1 | 2 | 3 | 2 | 1 | 9 |
| Percent outside 3 SD | 0.7 | 1.4 | 2.0 | 1.3 | 0.7 | 1.22 |
Analytical results fromStandard CDN-FCM-6 (Figures 12-1a to 12-1e in Appendix II) indicate over 92% of the assays plot within the 2-standard deviation range (Table 12-3). Two silver assays (181 ppm and 169 ppm) that are greater than 3 standard deviations above the FCM-6 mean of 159.77 ppm silver. One zinc assay (8600 ppm Zn) is greater than 3 standard deviations below the FCM-6 mean (9270 ppm zinc). The CDN-FCM-6 Standard was primarily utilized in 2013 programs and much less on 2014-2017 drill programs.
Table 12-3: Summary of Results for Standard CDN-FCM-6
| Standard CDN-FCM-6 | Gold | Silver | Copper | Lead | Zinc | TOTAL |
| No. of Assays | 35 | 37 | 38 | 38 | 38 | 186 |
| No. of values within 2SD | 31 | 31 | 37 | 36 | 36 | 171 |
| Percent within 2SD | 88.6 | 83.8 | 97.4 | 94.7 | 94.8 | 91.4 |
| No. of values from 2 to 3 SD | 4 | 4 | 1 | 2 | 1 | 12 |
| Percent between 2 to 3 SD | 11.4 | 10.8 | 2.6 | 5.3 | 2.6 | 6.5 |
| No. of Values outside 3 SD | 0 | 2 | 0 | 0 | 1 | 3 |
| Percent outside 3 SD | 0 | 5.4 | 0 | 0 | 2.6 | 1.6 |
Analytical results fromStandard CDN-FCM-7 (Figures 12-2a to 12-2e in Appendix II) indicate over 91% of the assays plot within the 2-standard deviation range (Table 12-4). One copper assay (5800 ppm Cu) is greater than 3 standard deviations above the FCM-7 mean of 5260 ppm copper. The CDN-FCM-7 Standard was primarily utilized in 2013 drill programs and occasionally on the 2014-2017 drill programs.
Table 12-4: Summary of Results for Standard CDN-FCM-7
| Standard CDN-FCM-7 | Gold | Silver | Copper | Lead | Zinc | TOTAL |
| No. of Assays | 37 | 40 | 41 | 41 | 41 | 200 |
| No. of values within 2SD | 34 | 36 | 37 | 38 | 37 | 182 |
| Percent within 2SD | 91.9 | 90.0 | 90.2 | 92.7 | 90.2 | 91.0 |
| No. of Values from 2 to 3 SD | 3 | 4 | 3 | 3 | 4 | 17 |
| Percent between 2 to 3 SD | 8.1 | 10.0 | 7.3 | 7.3 | 9.8 | 8.5 |
| No. of Values outside 3 SD | 0 | 0 | 1 | 0 | 0 | 1 |
| Percent outside 3 SD | 0 | 0 | 2.4 | 0 | 0 | 0.5 |
| | NI43-101 Technical Report and Updated Resource Estimate South Tally Pond Property – Lemarchant Deposit |
Analytical results fromStandard CDN-STD-1308(Figures 12-3a to 12-3e in Appendix II) indicate over 81% of the assays plot within the 2-standard deviation range (Table 12-5) and shows the most variation above 2 standard deviations. Two copper assays (both 4400 ppm Cu) are greater than 3 standard deviations above the STD-1308 mean (3980 ppm Cu) and six copper assays (all 4200 ppm Cu) are between 2 and 3 standard deviations above the mean.
Four of the zinc assays (4000 to 4040 ppm Zn) are between 2 and 3 standard deviations below the STD-1308 mean (4290 ppm Zn). Two lead assay (5900 and 5840 ppm Pb) are greater than 3 standard deviations above the STD-1308 mean (5410 ppm Zn) and one gold assay (1244 ppb) is greater than 3 standard deviations below the mean (1400 ppb Au). The CDN-STD-1308 Standard was utilized during the 2014 drill programs.
Table 12-5: Summary of Results for Standard CDN-STD-1308
| Standard CDN-STD-1308 | Gold | Silver | Copper | Lead | Zinc | TOTAL |
| No. of Assays | 21 | 18 | 21 | 21 | 21 | 102 |
| No. of values within 2SD | 18 | 18 | 13 | 17 | 17 | 83 |
| Percent within 2SD | 85.7 | 100 | 61.9 | 80.9 | 80.9 | 81.4 |
| No. of Values from 2 to 3 SD | 2 | 0 | 6 | 2 | 4 | 14 |
| Percent between 2 to 3 SD | 9.5 | 0.0 | 28.6 | 9.5 | 19.0 | 13.7 |
| No. of Values outside 3 SD | 1 | 0 | 2 | 2 | 0 | 5 |
| Percent outside 3 SD | 4.7 | 0.0 | 9.5 | 9.5 | 0.0 | 4.9 |
Analytical results fromStandard CDN-STD-1405 (Figures 12-4a to 12-4e in Appendix II) indicate ~100% of the assays plot within the 2-standard deviation range with no assays outside of 3 standard deviations. The CDN-STD-1405 Standard was utilized during the 2017 drill programs.
Table 12-6: Summary of Results for Standard CDN-STD-1405
| Standard CDN-STD-1405 | Gold | Silver | Copper | Lead | Zinc | TOTAL |
| No. of Assays | 49 | 49 | 49 | 49 | 49 | 245 |
| No. of values within 2SD | 49 | 49 | 49 | 49 | 48 | 244 |
| Percent within 2SD | 100 | 100 | 100 | 100 | 98 | 99.6 |
| No. of Values from 2 to 3 SD | 0 | 0 | 0 | 0 | 1 | 1 |
| Percent between 2 to 3 SD | 0.0 | 0.0 | 0.0 | 0.0 | 2.0 | 0.4 |
| No. of Values outside 3 SD | 0 | 0 | 0 | 0 | 0 | 0 |
| Percent outside 3 SD | 0.0 | 0.0 | 0.0 | 0.0 | 0.0 | 0.0 |
A blank sample is important for monitoring potential contamination introduced at labs during sample preparation and analysis. Blanks also monitor accuracy of the lab and help detect sample sequencing errors. True blanks should not have any of the elements of interest much higher than the detection levels of the instrument being used; however, in base metal exploration (unlike precious metal exploration) contamination generally has to be in the 100’s of ppm, an order of magnitude higher than detection limit, before it has any meaningful impact on the integrity of database or mineral resource estimate.
| | NI43-101 Technical Report and Updated Resource Estimate South Tally Pond Property – Lemarchant Deposit |
NorZinc used a blank sample that consisted of a homogeneous granite. This blank consistently returned measurable copper, zinc, and lead higher than 5 times the detection limit, a generally accepted failure threshold for blank samples. The average of the samples was calculated from analyses at Eastern Analytical and the standard deviation was calculated based on this average. A warning level of 2x the standard deviation was established for the 5 elements. One blank sample was removed as only “ore grade” lead and zinc analysis was completed on the sample. Analytical results for the blank samples are plotted by element on Figures 12-5a through 5e.
Overall results for gold and silver analysis are well within acceptable limits as shown on Figures 12-5a and 12-5b, respectively. Gold and silver assays reported below detection limit were set to zero. For copper, lead and zinc (Figure 12-5c, 12-4d and 12-5e), the blank analyses reported Cu values between 2-63 ppm (mean = 12 ppm), Pb values between 3-63 Zn (mean = 14 ppm) and Zn values between 6-121 ppm (mean = 43). The results indicate the material used for the blank has a natural low concentration of copper, lead, zinc and is not necessarily reflecting contamination. A small number of field blanks above 2 standard deviations may indicate the possibility of minor copper, lead, and zinc contamination during sample preparation; however, the levels are low and do not impact the overall integrity of the sample analysis.
Figure 12-5a: Summary Graph of Blank Samples - Gold
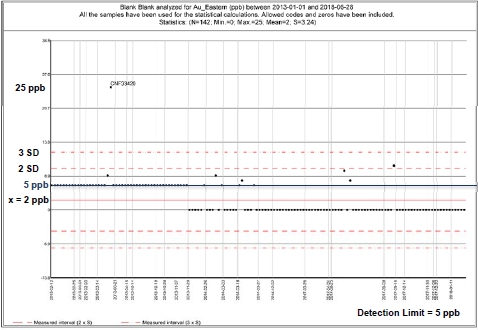
| | NI43-101 Technical Report and Updated Resource Estimate South Tally Pond Property – Lemarchant Deposit |
Figure 12-5b: Summary Graph of Blank Samples - Silver
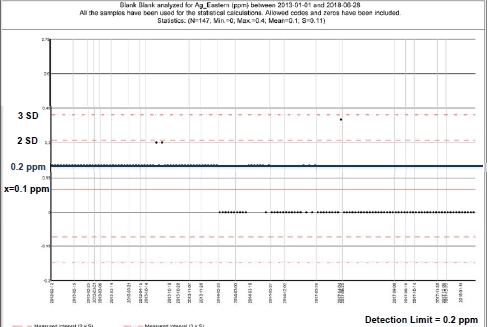
Figure 12-5c: Summary Graph of Blank Samples - Copper
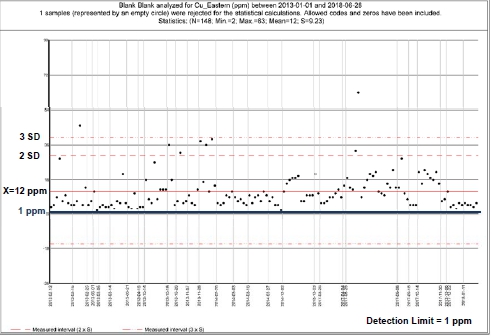
| | NI43-101 Technical Report and Updated Resource Estimate South Tally Pond Property – Lemarchant Deposit |
Figure 12-5d: Summary Graph of Blank Samples - Lead
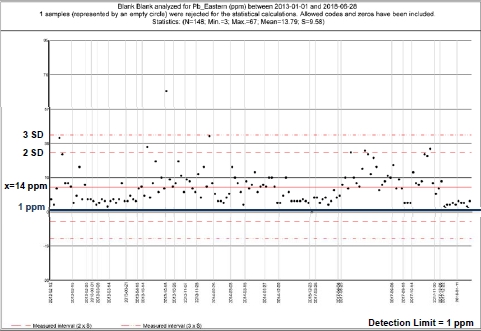
Figure 12-5e: Summary Graph of Blank Samples - Zinc
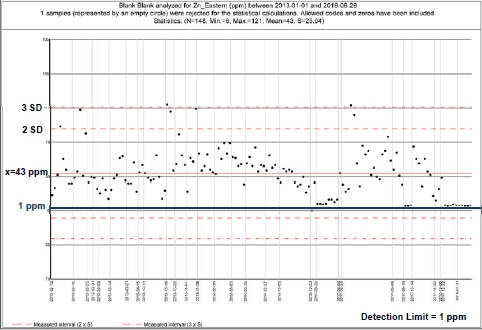
| | NI43-101 Technical Report and Updated Resource Estimate South Tally Pond Property – Lemarchant Deposit |
| 12.1.3 | Check Assays and Lab Duplicates |
Randomly selected samples, approximately 7-8% from each sample batch submitted to Eastern Analytical for assay, were submitted to ALS Canada to be analyzed by 33-element ICP (ME-ICP61). Between 2013 and 2017, a total of 335 sample pulps were analyzed as check assays for Cu, Pb, Zn, and Ag at ALS Canada. Gold assays were completed on 148 of these sample pulps by fire assay fusion and atomic absorption finish (Au-AA23) at ALS Canada. Results of the check assay program are summarized below and shown on Figures 12-6a to 12-6e
Gold - 148 samples for gold analysis were compared between the two labs (Figure 12-6a). Even though there is minor scatter the Au samples reproduced quite well with possible coarse gold in some of the samples resulting in some increased scatter.
Silver - 335 samples for silver analysis were compared between the two labs (Figure 12-6b). Overall, there is good correlation between the two labs with the exception of three samples (CNF32376, CNF34914, and 260155) which had a more significant variation. The first two samples listed report a much higher silver concentrations at ALS Canada, and the remaining sample reports a much lower concentrations at ALS Canada. Values of the other metals from these three samples were consistent between the two labs. A single high grade sample (CNF32392) varied by approximately 15% with 1767.6 ppm Ag (Eastern) and 1535 ppm Ag (ALS).
Copper - 335 samples for copper analysis were compared between the two labs (Figure 12-6c). With the exception of one sample, the copper values produced a near 1:1 correlation and generally produced very well at higher concentrations. CNF33375 reported 4600 ppm Cu (Eastern) and 52 ppm Cu (ALS). The lab data for this sample has been verified.
Lead - 335 samples for lead analysis were compared between the two labs (Figure 12-6d). Overall the lead samples correlate near a 1:1 correlation with a small number of samples plotting slightly away from the main slope of the data. The data from both labs for these samples have been verified.
Zinc - 333 samples for zinc analysis were compared between the two labs (Figure 12-6e). Two over limit sample assays (>30% Zn) were not reported by ALS Canada and these samples were omitted from the comparison. In general, the Zn has very good 1:1 correlation between the two labs with minor scatter along the trend line.
A total of 78 lab duplicates (pulps) were completed by Eastern Analytical on select samples from each sample batch submitted for Au, Ag, Cu, Pb and Zn analysis between 2013 and 2017. Overall, there is a very good correlation between the sample assay and lab duplicate. Results of the lab duplicates analysis are shown on Figures 12-7a to 12-7e.
| | NI43-101 Technical Report and Updated Resource Estimate South Tally Pond Property – Lemarchant Deposit |
Figure 12-6a: Check Assay Analysis Comparison - Gold (1:1 correlation - red line)
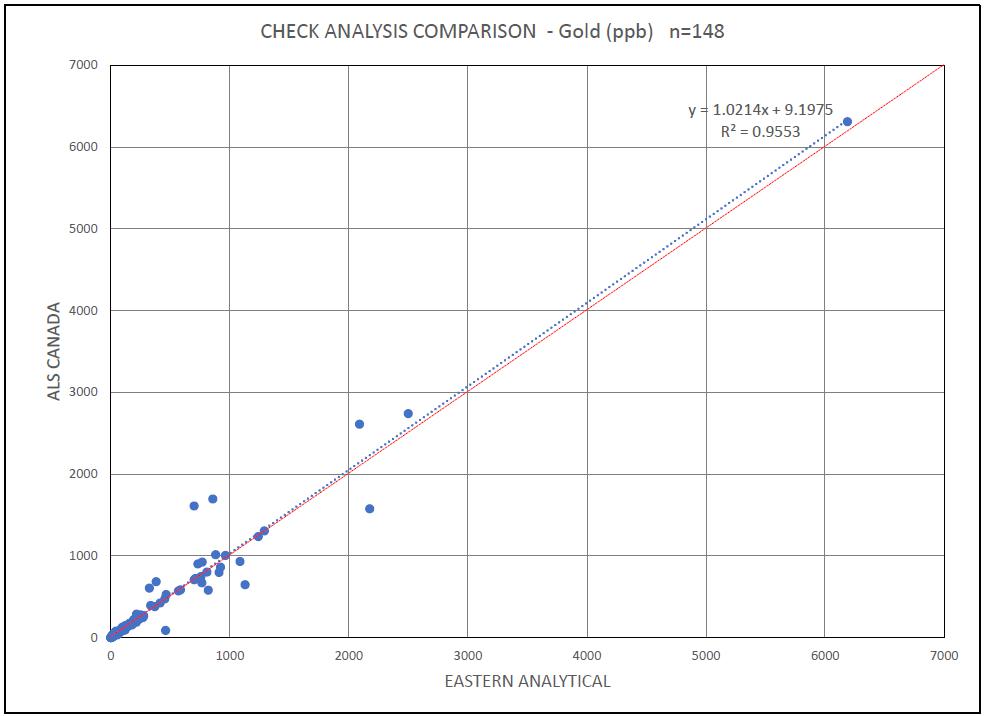
Figure 12-6b: Check Assay Analysis Comparison - Silver (1:1 correlation- red line)
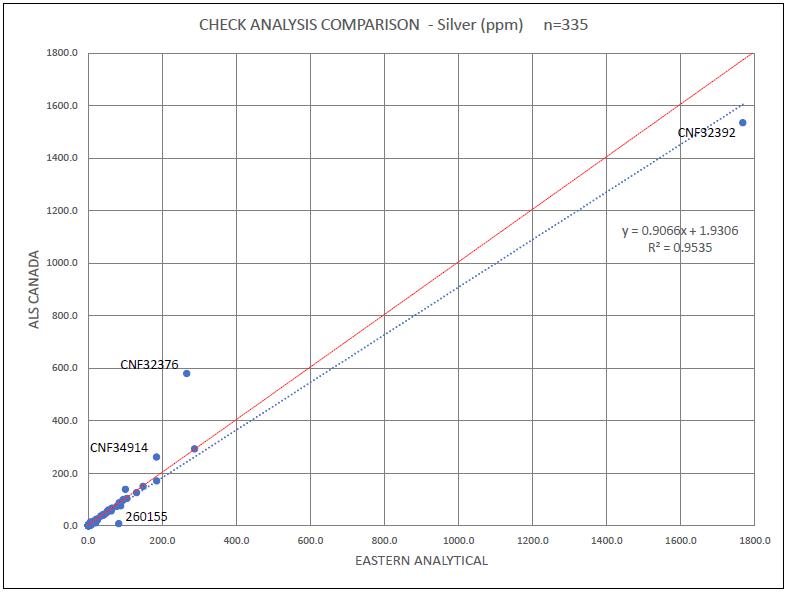
| | NI43-101 Technical Report and Updated Resource Estimate South Tally Pond Property – Lemarchant Deposit |
Figure 12-6c: Check Assay Analysis Comparison - Copper (1:1 correlation - red line)
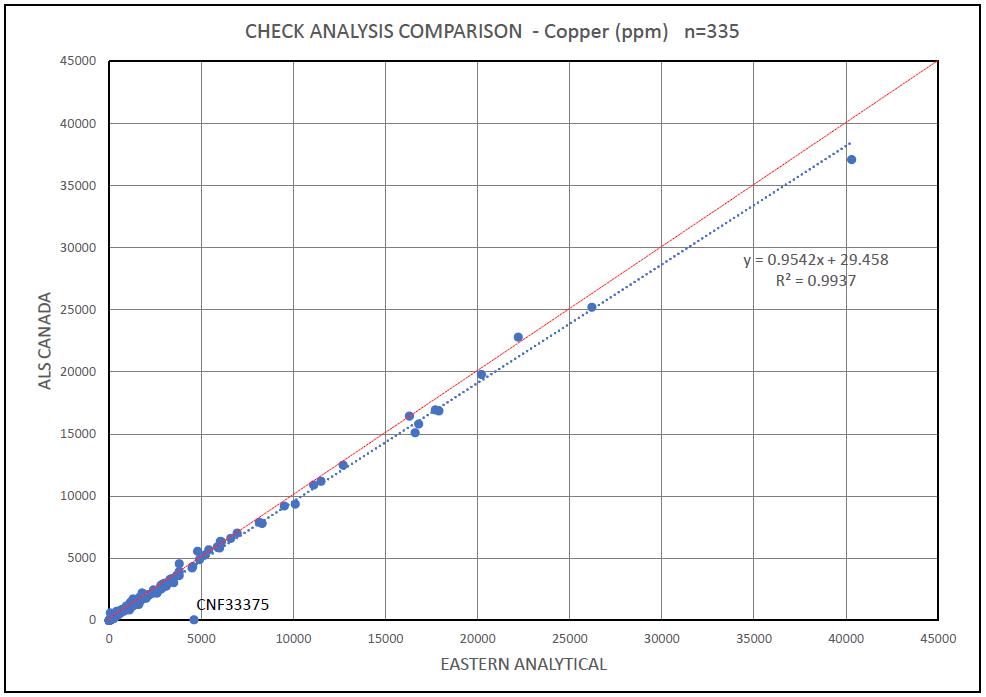
Figure 12-6d: Check Assay Analysis Comparison - Lead (1:1 correlation - red line)
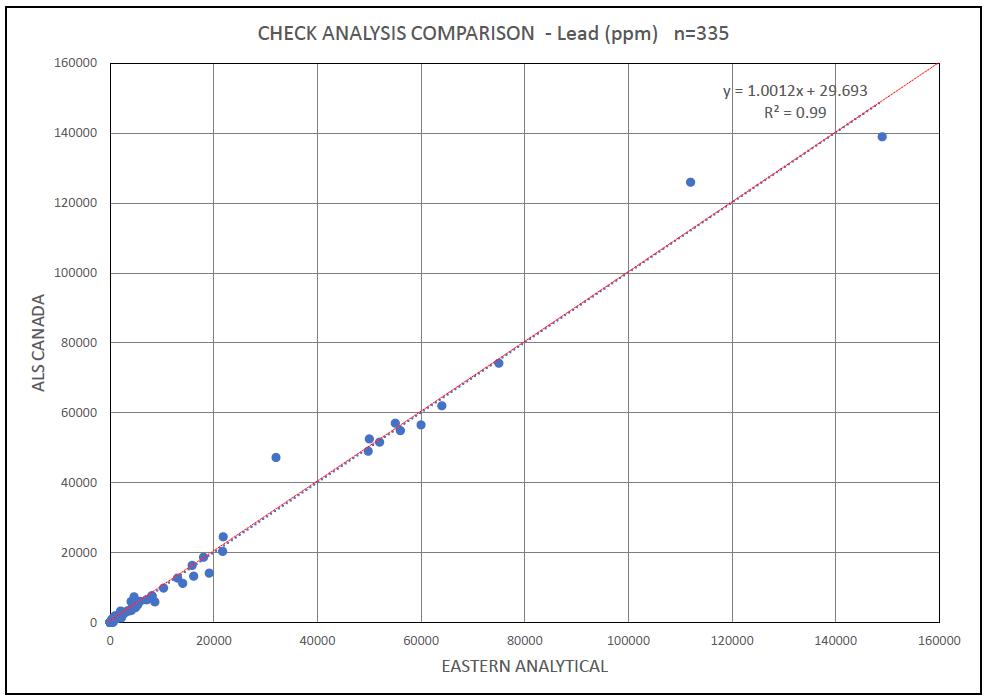
| | NI43-101 Technical Report and Updated Resource Estimate South Tally Pond Property – Lemarchant Deposit |
Figure 12-6e: Check Assay Analysis Comparison - Zinc (1:1 correlation- red line)
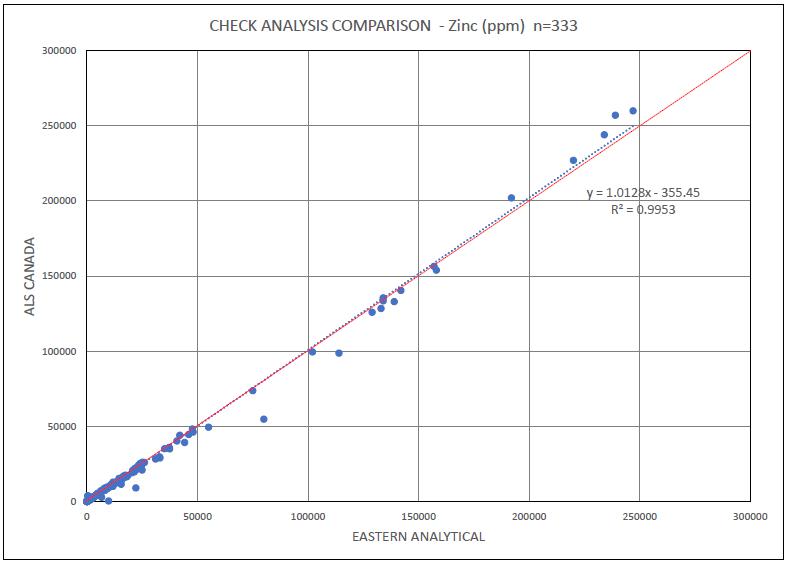
Figure 12-7a: Lab Pulp Duplicate Check Analysis - Gold
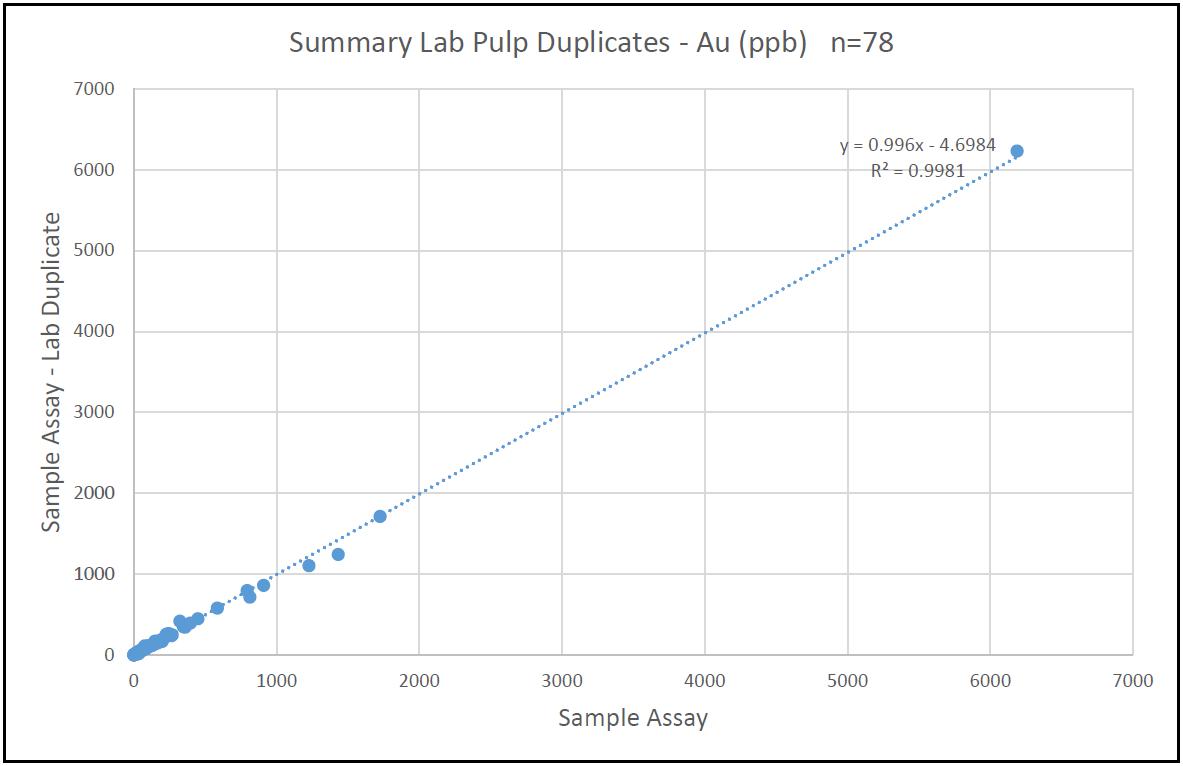
| | NI43-101 Technical Report and Updated Resource Estimate South Tally Pond Property – Lemarchant Deposit |
Figure 12-7b: Lab Pulp Duplicate Check Analysis - Silver
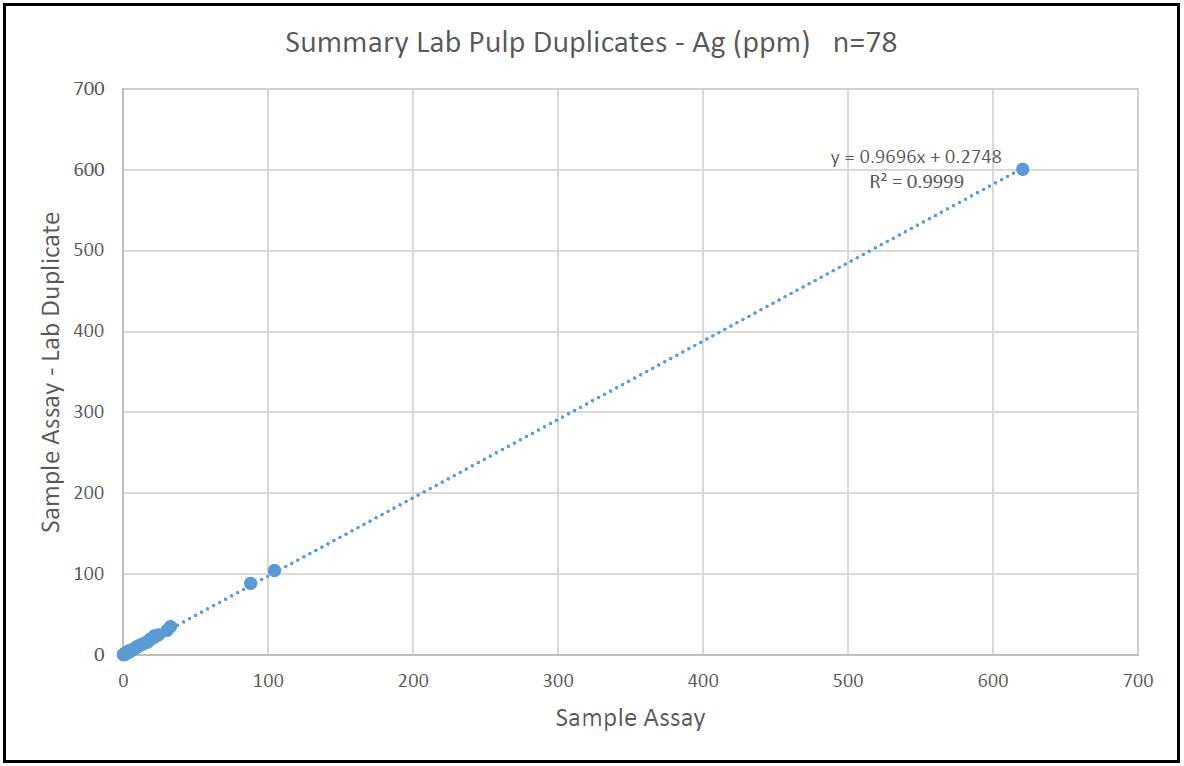
Figure 12-7c: Lab Pulp Duplicate Check Analysis - Copper
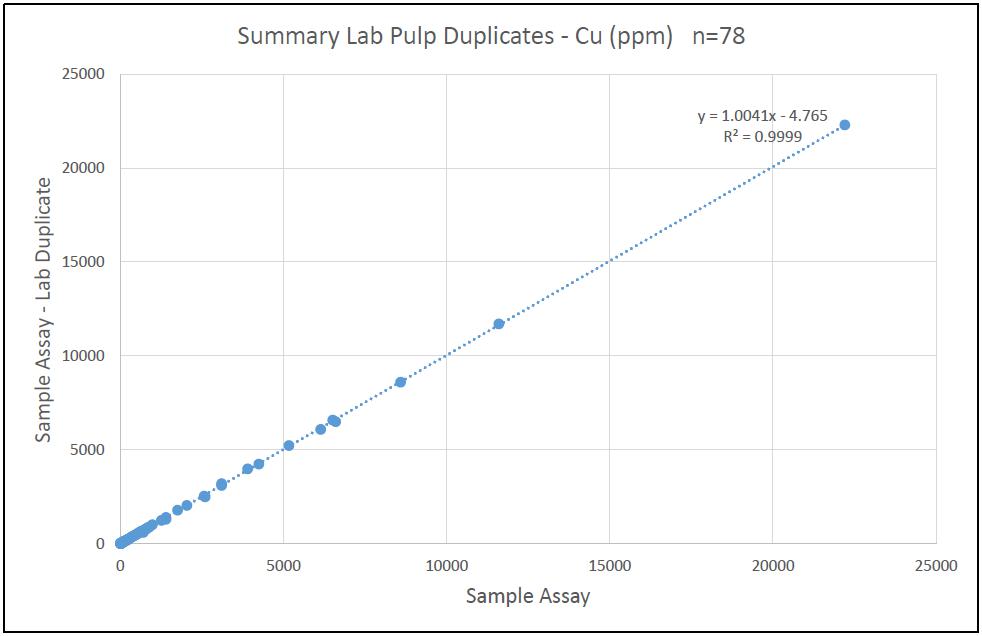
| | NI43-101 Technical Report and Updated Resource Estimate South Tally Pond Property – Lemarchant Deposit |
Figure 12-7d: Lab Pulp Duplicate Check Analysis - Lead
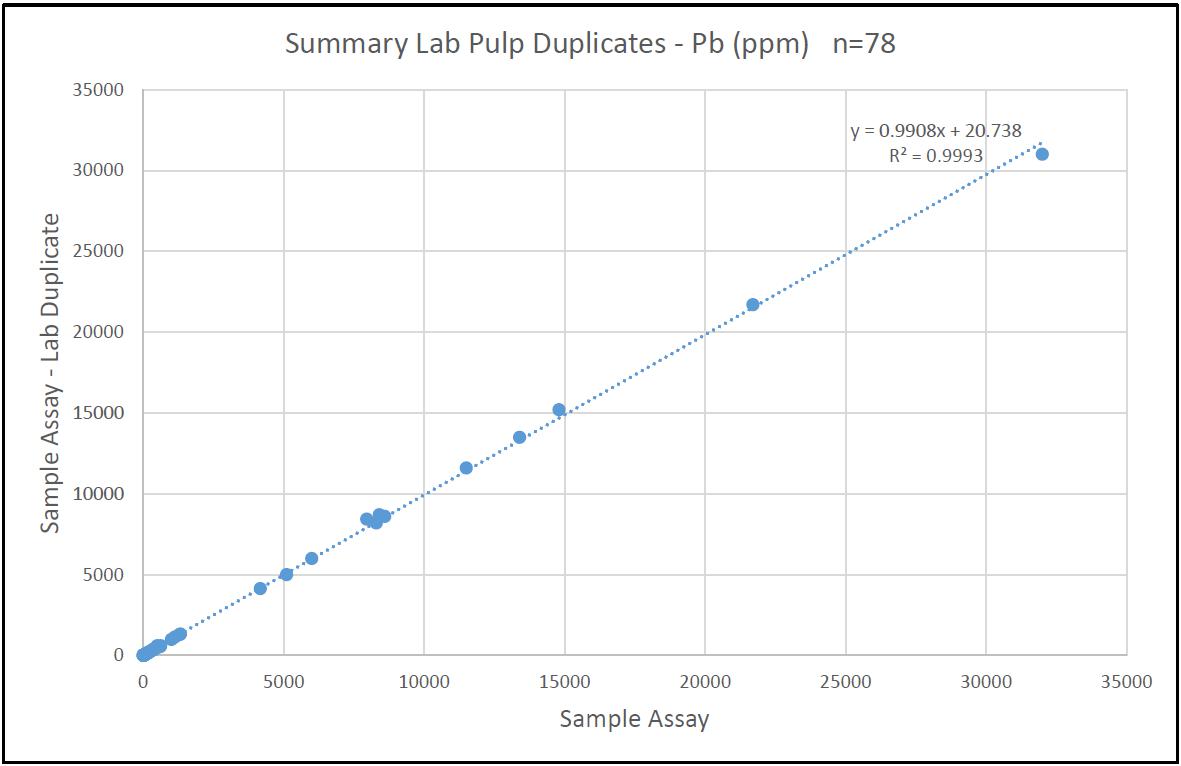
Figure 12-7e: Lab Pulp Duplicate Check Analysis - Zinc
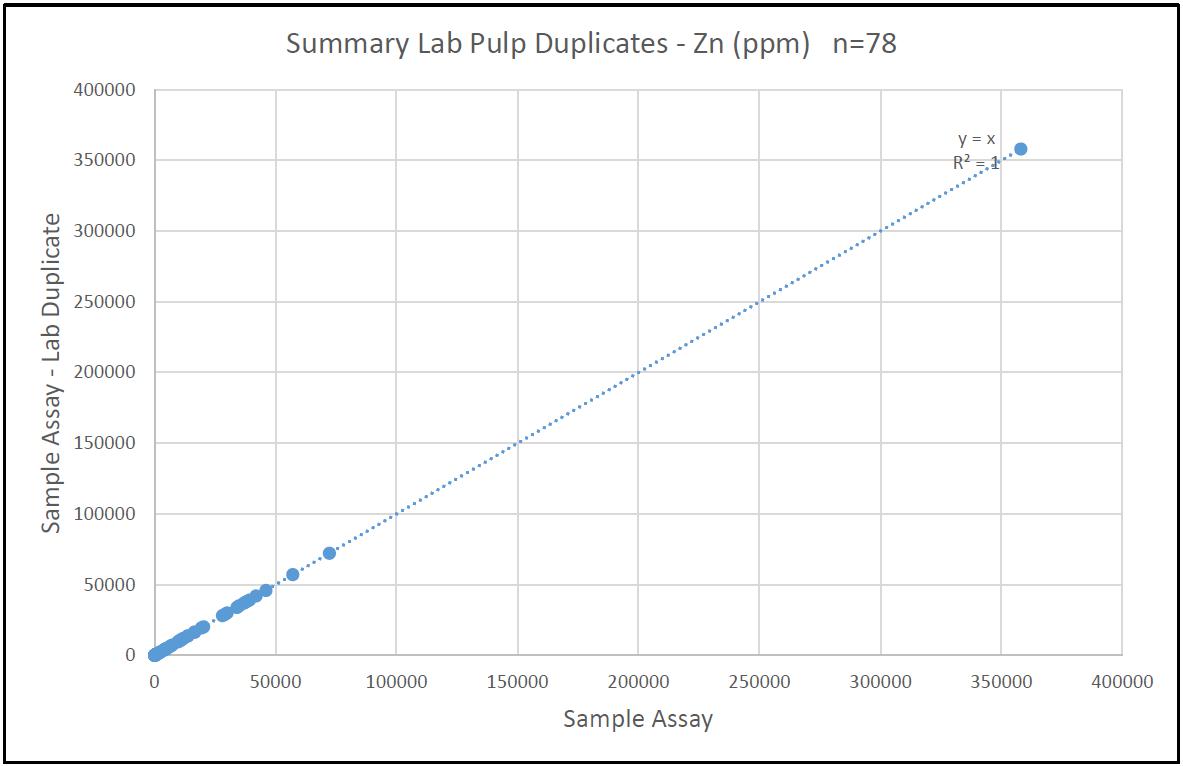
| | NI43-101 Technical Report and Updated Resource Estimate South Tally Pond Property – Lemarchant Deposit |
Systematic density determinations prior to sampling of the mineralized intervals of drill core was completed by NorZinc and by Paragon using the water immersion method. A total of 2,725 samples have been measured for specific gravity from the Lemarchant Deposit. NorZinc collected 1,610 specific gravity samples from 2013-2017 and Paragon collected 1,115 specific gravity measurements from 2007-2011. The specific gravity data generated by NorZinc and previously by Paragon personnel is considered acceptable for use in the resource calculation.
| 12.3 | Independent Data Verification and Site Visit |
On September 30 and October 1, 2018, Independent co-author Cullen of Mercator completed a site visit to NorZinc’s core logging facility in Buchan’s Junction, NL and a site visit to the Lemarchant Deposit. During the site visit Mr. Cullen reviewed 11 drill holes that showed representative sections through the Lemarchant Deposit stratigraphy and mineralization. A review of geological maps, drill sections and project data was completed during the visit. During the site visit Mr. Cullen verified the location of 23 drill casings and collars with a hand held GPS, all of which correlated very well with location data in the NorZinc Lemarchant drillhole database.
During the site visit, 10 quarter core check samples of Lemarchant drill core were collected by Mr. Cullen to verify the reproducibility of Cu, Pb, Zn, Ag, Au and Specific gravity (SG) values. The archived half drill core was quartered using a diamond bladed saw on NorZinc premises, and bagged and labelled by NorZinc personnel under direct supervision of Mr. Cullen. These samples remained under his control until being shipped by commercial courier to the Actlabs Ltd. (Actlabs) preparation facility in Fredericton, NB. Resulting pulps were subsequently analyzed at the Actlabs laboratory in Ancaster, ON.
Actlabs is an independent, commercial analytical services operating internationally that is accredited to the ISO 17025 standard for analysis Cu, Pb, Zn, Ag and Au. Check samples were prepared using the RX-1 code which consists of crushing to 80% passing 2mm after which a 200 gram riffle split analytical subsample is pulverised to 95% passing 105 microns. Au analysis was by Fire Assay - Atomic Absorption methods (FA-AA) and Cu, Pb, Zn and Ag levels were determined using ICP-OES methods after four acid digestion. Assay grade determinations were carried out as required for samples that returned over limit Cu, Pb, Zn and Ag initial analyses.
Check sample results for Au, Cu, Pb, Zn, Ag, Au and SG are presented below in Figures 12-8 through 12-13. Zn and Pb trends closely match 1:1 correlation trend lines and have R2values of 0.98 and 0.94 respectively. Cu results show good correlation at levels below approximately 2.0 % but show greater scatter above that level. This is reflected in the associated R2value of 0.81 and may reflect heterogeneous distribution of chalcopyrite as veinlets or patches in higher grade sections of core. With the exception of one higher grade outlier (579 ppm check value vs 287 ppm original value), Ag data group closely along the 1:1 trend line. Au data define a broadly similar trend along the 1:1 correlation trend to about 3 g/t, with a single outlier above that level. R2 values for Ag and Au 0.79 and 0.80, respectively, reflect outlier influences.
| | NI43-101 Technical Report and Updated Resource Estimate South Tally Pond Property – Lemarchant Deposit |
Specific gravity (SG) determinations were also carried out at Actlabs on six selected Mercator check samples. The pycnometer method of SG determination was applied due to the samples being in pulp form. As shown in Figure 12-13, Mercator results correlate reasonably well with NorZinc’s database values in most instances, and otherwise tend to register slightly higher than NorZinc. A portion of this trend may be attributable to the differing methods of SG determination used. The water immersion method was applied by NorZinc and pycnometer determinations were made at Actlabs on analytical pulps for Mercator samples.
| 12.4 | Database Checking Program Completed by Mercator |
Mercator staff carried out a database record checking program comprised of source checking of assay, collar coordinate, downhole survey and litho-code database table entries to source reports and laboratory files. The largest component of this work comprised checking of 7,229 assay sample records of the available 9,452 entries, against original source data. This represents checking of 76.5% of the assay value records in the resource database. Only 8 discrepancies were detected and these were corrected to match source files. Random checking of collar coordinate and downhole survey and litho-code data entries was also carried out and several minor litho-coding errors were detected. None of these was considered material to database integrity. Corrections were entered in each case. No discrepancies were noted in the collar file, and survey file data sets.
| 12.5 | Data Verification Comments by Independent Qualified Person |
Based on review of NorZinc procedures and practices and the results of the data verification efforts documented above, the Independent Qualified Person is of the opinion that data collection, QAQC and data management practises of NorZinc that pertain to the Mineral Resource Estimate documented in this Technical Report meet current industry standards. The analytical database provided by NorZinc, as minimally updated by Mercator, is considered acceptable for Mineral Resource estimation purposes.
| | NI43-101 Technical Report and Updated Resource Estimate South Tally Pond Property – Lemarchant Deposit |
Figure 12-8: Mercator check sample results for Zn
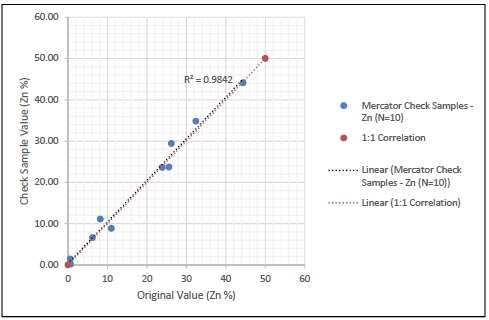
Figure 12-9: Mercator check sample results for Pb
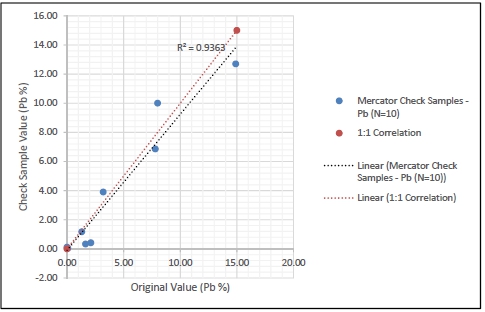
| | NI43-101 Technical Report and Updated Resource Estimate South Tally Pond Property – Lemarchant Deposit |
Figure 12-10: Mercator check sample results for Cu
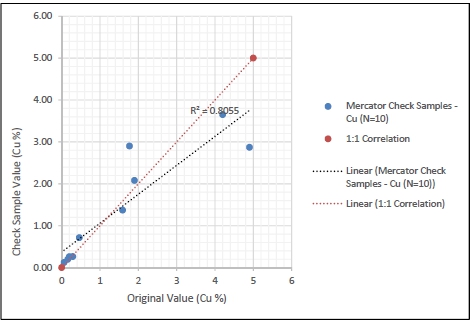
Figure 12-11: Mercator check sample results for Ag
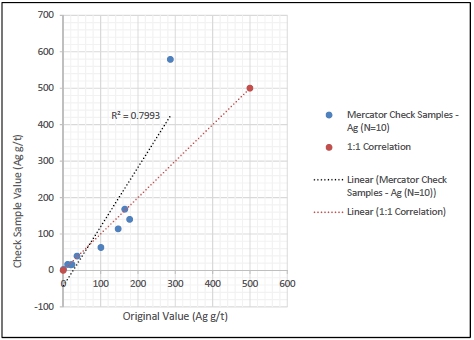
| | NI43-101 Technical Report and Updated Resource Estimate South Tally Pond Property – Lemarchant Deposit |
Figure 12-12: Mercator check sample results for Au
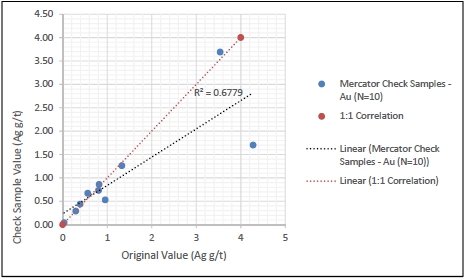
Figure 12-13: Mercator specific gravity check sample results
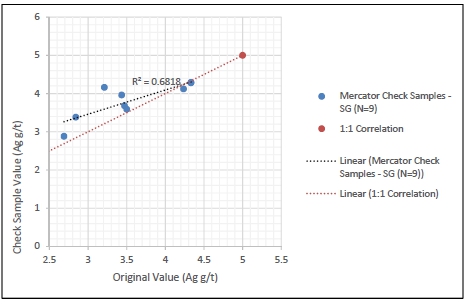
| | NI43-101 Technical Report and Updated Resource Estimate South Tally Pond Property – Lemarchant Deposit |
| 13.0 | MINERAL PROCESSING AND METALLURGICAL TESTING |
In 2011, Paragon completed the initial metallurgical test work on the Lemarchant Deposit using quartered NQ-diameter drill core from drill holes LM11-61 and LM11-62 (Lascelles and Imeson, 2012). A total of 43 individual drill core samples (total mass 51.25 kilograms) were sent to SGS Mineral Services (“SGS”) of Lakefield, Ontario on September 28, 2011. The samples submitted consisted of 6 separate “ore types” that define a vertical lithological zonation through the Lemarchant Deposit and include, from hangingwall to footwall: Pyritic Mudstone, Massive Sulphide, Massive Barite, Semi-Massive Sulphide, Chlorite Schist and Felsic Volcanic Breccia.
Each of these “mineralization types” were analyzed separately using SGS’s Quantitative Evaluation of Minerals by SCANning Electron Microscopy (“QEMSCAN”) to better understand the mineralogy, the nature of mineral locking and liberation, the mineral deportment and association and the estimation of theoretical recoveries and concentrate grades. Concurrent with the QEMSCAN mineralogical work, further studies on a composited sample of all six “ore types” was completed to get a preliminary understanding of the milling and recovery characteristics of the Lemarchant sulphides. A summary of the 2011 metallurgical work completed by Paragon is provided in the Fraser et. Al (2012).
In 2015, NorZinc initiated additional metallurgical work on the Lemarchant Deposit as part of a larger central milling metallurgical testing program (Thibault et al, 2017; Vande Guchte and Hussey, 2017). The Company was awarded partial funding by the Research & Development Corporation of Newfoundland and Labrador (“RDC”) to undertake a research program to complete physical and metallurgical bench scale studies on five volcanogenic massive sulphide (“VMS”) deposits located in central Newfoundland.
The work program was completed as part of a collaboration agreement between NorZinc and Buchans Minerals Corporation (“Buchans Minerals“) a wholly owned subsidiary of Minco PLC, whereby the companies agreed to jointly undertake the research program aimed at investigating the technical and economic viability of developing their respective central Newfoundland Zn-Pb-Cu-Ag-Au deposits using a central milling facility. The program included the evaluation of several scenarios, including establishing new mill facilities or using existing facilities at Teck Resources Limited’s Duck Pond mine (it is understood that the mill has remained intact on the site since mine closure in June, 2015).
| 13.1 | Sample Description, Preparation and Scope of Work |
The 2015-2017 metallurgical program consisted of the completion of bench-scale metallurgical testing, dense media separation studies and characterization studies performed on multiple polymetallic sulphide deposits controlled by NorZinc and Buchans Minerals. The program was initiated in November 10, 2015 and completed March 27, 2017. The principal goal was to assess the technical and economic viability of developing a number of lower-tonnage and/or lower grade base metal deposits located in central Newfoundland through a central milling facility. The two critical components being investigated were:
| i) | The amenability of all the deposits to physical upgrading (pre-concentration) at the mine sites by dense media separation (“DMS”) as a potential means of reducing transportation costs of the mineralized material from the mine site to the milling facility and to maximize head grade for reduction in downstream processing costs. |
| | NI43-101 Technical Report and Updated Resource Estimate South Tally Pond Property – Lemarchant Deposit |
| ii) | The identification of a common flotation flow sheet and reagent scheme for five of the seven deposits that will allow for the production of selective copper, lead and zinc flotation concentrate products of marketable grades and at acceptable metal recoveries from several deposits having varying mineralogy. |
RNR Diamond Drilling Ltd. (“RNR Drilling”) of Springdale, NL was contracted to complete the diamond drilling for fresh (un-oxidized) metallurgical samples at the Lemarchant, Boomerang-Domino, Bobby’s Pond and Daniels Pond deposits.
Thibault & Associates Inc. (“Thibault”) of Fredericton, New Brunswick was contracted to complete the technical study that included bench scale flotation testing, dense media separation (“DMS”) test work, as well as assessment of mineralogy, grindability, and acid generation. The DMS test work was undertaken to evaluate potential to pre-concentrate the mineralized material in order to reduce transportation costs to a central mill.
| 13.1.1 | Lemarchant Metallurgical Sample |
Drillhole LM15-107 was designed to twin historical drillhole LM10-43 which intersected massive to semi-massive sulphide, massive barite and footwall stringer mineralization considered representative of the Lemarchant Deposit. The metallurgical drill hole was completed in early December, 2015 from surface to a final depth of 239.0 metres and intersected very similar mineralization and footwall to that intersected in drill hole LM10-43.
Table 13-1: Assay Results from the 2015 Metallurgical drill program.
| Drillhole | Section | Mineralization | From (m) | To (m) | Length (m)* | Zn (%) | Pb (%) | Cu (%) |
| LM10-43 | 102+50N | Massive sulphide/barite | 205.50 | 226.35 | 20.85 | 12.33 | 3.20 | 1.15 |
| | | Footwall | 226.35 | 232.10 | 5.75 | 3.67 | 0.17 | 0.45 |
| LM15-107 | 102+50N | Massive sulphide/barite | 187.4 | 205.2 | 17.8 | 10.89 | 2.64 | 1.59 |
| | | Footwall | 205.2 | 211.5 | 6.3 | 3.37 | 0.08 | 0.40 |
* All intervals are core lengths; true thickness is estimated to be near core length; historical drillhole in italic
Two metallurgical samples were prepared from the LM15-107 drill core - one from the massive sulphide/barite interval (Lemarchant MS) and one from the mineralized footwall interval (Lemarchant FW). Three-quarters of the core for each sample interval was cut and bagged for the respective metallurgical sample, and ¼ of the core for each sample interval was bagged and submitted to Eastern Analytical Ltd. for Cu, Pb and Zn analysis. The coarse reject material from the ¼ core was then forwarded by Eastern Analytical Ltd to Thibault to be added to the respective metallurgical sample.
| | NI43-101 Technical Report and Updated Resource Estimate South Tally Pond Property – Lemarchant Deposit |
| 13.1.2 | Lemarchant Grindability Test Sample |
A grindability test sample was collected for the Lemarchant Deposit by sampling ¼ core from the existing drillhole LM10-43, which had similar characteristics to the massive sulphide/barite metallurgical sample of the twinned drillhole, LM15-107. The existing drillhole LM10-43 was sampled from 205.5 to 207.6 and 213.3 to 226.35 metres for the grindability sample.
| 13.1.3 | Lemarchant Dense Media Separation (DMS) Sample |
Two samples of quartered core were collected for DMS work. The samples were selected from existing drill core on the basis of being closely representative of the mineralization comprising the resource. One sample of semi-massive sulphides with barite was collected from drillhole LM10-43 (207.6 to 213.3 metres). The second sample consisted of footwall stringer mineralization collected from drillhole LM07-15 (240.7 to 245.6 metres). Each planned sample interval was checked prior to sampling in order to make sure the core was still relatively intact.
| 13.2 | Flotation Head Sample Analysis |
The two metallurgical samples were analysed by Thibault to determine the major and trace element geochemistry of the two samples. The two bulk samples used for the metallurgical test program (representative of the centralized mill feedstock) were based on the following head grade analysis indicated on Table 13-2 and 13-3.
Table 13-2: Flotation Head Samples Major Element Assays
Element | Lemarchant MS | Lemarchant FW |
| Cu% | 1.51 | 0.34 |
| Pb% | 3.29 | 0.07 |
| Zn% | 10.91 | 2.36 |
| Ag g/t | 198 | 3.8 |
| Au g/t | 5.73 | 0.09 |
| Ba % | 12.54 | 0.32 |
| Fe% | 2.26 | 3.33 |
| S-total% | 17.05 | 3.39 |
| Si% | 1.34 | 23.18 |
| | NI43-101 Technical Report and Updated Resource Estimate South Tally Pond Property – Lemarchant Deposit |
Table 13-3: Flotation Head Samples Trace Element Analysis
| Element | | Lemarchant MS | Lemarchant FW |
| Al | mg/kg | 6043 | 71870 |
| Be | mg/kg | 0.1 | 0.6 |
| Bi | mg/kg | <10 | <10 |
| C-total | mg/kg | 10700 | 7400 |
| Ca | mg/kg | 26102 | 15608 |
| Cd | mg/kg | 564 | 113 |
| Ce | mg/kg | <5 | 35 |
| Cl | mg/kg | 80 | 16 |
| Co | mg/kg | <10 | <10 |
| Cr | mg/kg | <10 | 30 |
| Ga | mg/kg | <100 | <100 |
| Ge | mg/kg | <100 | <100 |
| Hg | mg/kg | 11.5 | 1.1 |
| In | mg/kg | <100 | <100 |
| K | mg/kg | 421 | 7214 |
| La | mg/kg | <5 | 13 |
| Li | mg/kg | <10 | 24 |
| Mg | mg/kg | 8575 | 85739 |
| Mn | mg/kg | 350 | 1178 |
| Mo | mg/kg | 366 | 110 |
| Na | mg/kg | 1242 | 8210 |
| Nb | mg/kg | <25 | <25 |
| Ni | mg/kg | 27 | 15 |
| P | mg/kg | 383 | 383 |
| Sb | mg/kg | 456 | <100 |
| Se | mg/kg | <100 | <100 |
| Sn | mg/kg | <100 | <100 |
| Sr | mg/kg | 35 | 75 |
| Ta | mg/kg | <50 | <50 |
| Te | mg/kg | <100 | <100 |
| Ti | mg/kg | 69 | 1573 |
| V | mg/kg | 24 | 49 |
| Zr | mg/kg | <10 | 110 |
| | NI43-101 Technical Report and Updated Resource Estimate South Tally Pond Property – Lemarchant Deposit |
A mineralogical investigation was completed on the Lemarchant MS sample. The purpose of the mineralogy study was to identify the copper, lead and zinc bearing minerals and quantify their degree of liberation and association, which in part controls the ability to achieve a selective flotation. The following is summarized from the mineralogical report (Thibault, 2017).
The Lemarchant MS sample was submitted by Thibault to Process Mineralogical Consulting Ltd of Maple Ridge, BC for size-by-size modal and mineral liberation analysis of the sulphide minerals. The sample was weighed and sized into three size fractions (+53μm, +25μm and -25μm, respectively). From the sample, a representative split was submitted for Powder X-ray Diffraction (XRD) analysis for qualitative identification of the minerals present. From each size fraction, a representative assay portion was riffled and submitted for ICP-AES. Replicate polished block sections were prepared for each size fraction according to the expected grade and submitted for mineral mapping analysis using the Tescan Integrated Mineral Analyser (TIMA) to determine the mineral content, abundance, and overall ore mineral liberation and associations.
The Lemarchant MS sample mineralogy is mainly composed of barite and sphalerite, with moderate amounts of dolomite, galena, pyrite, calcite, and quartz (Table 13-4). Minor to trace amounts of chalcopyrite, feldspars, and tetrahedrite-tennantite are also evident. Copper content is comprised primarily of chalcopyrite, tetrahedrite-tennantite and bornite with up to 30% of the Cu reporting as tennantite-tetrahedrite in this sample and would contain considerable amounts of As and Sb.
Table 13-4: Mineralogy Abundance Summary in Lemarchant MS Sample
| Mineral | (%) | Mineral | (%) |
| Pyrite | 3.19 | Micas | 0.49 |
| Chalcopyrite | 1.97 | Chlorite | 0.09 |
| Bornite | 0.71 | Dolomite | 4.56 |
| Tetrahedrite - Tennantite | 1.18 | Clay Minerals | 0.01 |
| Enargite | 0.00 | Calcite | 2.62 |
| Covellite - Chalcocite | 0.03 | Siderite | 0.03 |
| Other Cu-Sulphides | 0.01 | Ankerite | 0.00 |
| Galena | 4.30 | Cerussite | 0.06 |
| Sphalerite | 22.1 | Other Carbonates | 0.09 |
| Arsenopyrite | 0.03 | Other Silicates | 0.04 |
| Barite | 53.80 | Talc | 0.00 |
| Oxides | 0.15 | Other minerals | 0.26 |
| Quartz | 2.24 | | |
| Feldspar | 1.97 | Total | 100 |
| | NI43-101 Technical Report and Updated Resource Estimate South Tally Pond Property – Lemarchant Deposit |
| 13.3.2 | Copper Sulphide Association |
Copper occurs mainly as chalcopyrite (41.5%) with lesser amounts of tetrahedrite-tennantite (29.7%), bornite (27.1%), and covellite-chalcocite (1.49%) as shown on Table 13-5. Arsenic deportment consists of 17.5% and 80.1% arsenic in the tetrahedrite and tennantite, respectively and 1.99% to arsenopyrite.
Table 13-5: Deportment of Cu in Cu-bearing Minerals in Lemarchant MS Sample
| Sample | Elemental Deportment of Cu | |
| Fraction | +53µm | +25µm | -25µm | Head |
| Chalcopyrite | 44.1 | 34.8 | 44.6 | 41.5 |
| Bornite | 31.0 | 35.4 | 19.6 | 27.1 |
| Tetrahedrite -Tennantite | 23.6 | 27.2 | 34.5 | 29.7 |
| Enargite | 0.0 | 0.0 | 0.0 | 0.0 |
| Covellite-Chalcocite | 0.6 | 2.38 | 1.35 | 1.49 |
| Other Cu-Sulphides | 0.7 | 0.24 | 0.00 | 0.24 |
| Total | 100 | 100 | 100 | 100 |
| 13.3.3 | Liberation of Sulphide Minerals (Cu, Pb, Zn) |
The grind of this sample material has resulted in good liberation of the sulphides for rougher concentration. The sulphide minerals occur as mostly free and liberated grains where ~ 80% (wt. %) of the ore-bearing sulphide minerals will be >80% of the particle constituent. In addition, a strong binary association of these sulphide minerals also exists, such that bulk rougher concentration will yield a high recovery.
Liberation of Cu-sulphide minerals and sphalerite was very good with 87.1% of the Cu-sulphide and 91.4% of the sphalerite being free and liberated. Sphalerite association is varied, where middling and locked sphalerite particles are associated with barite, Cu-sulphides, galena, and carbonates. Galena liberation is slightly lower with 82.1% of the galena free or liberated. The majority of the galena middling or locked particles are associated with sphalerite, cerrusite, barite, Cu-sulphides. Results for the liberation of sulphides and barite are provided in Table 13-6 and illustrated graphically on Figure 13-1.
Table 13-6: Liberation of Sulphide Minerals - Lemarchant MS Sample
| Liberation of Copper Sulphides | +53µm | +25µm | -25µm | Head |
| Free | 55.2 | 71.5 | 81.9 | 72.8 |
| Liberated (≥80% <100%) | 21.7 | 19 | 7.94 | 14.3 |
| Middling (≥50% <80%) | 9.12 | 3.43 | 5.42 | 5.65 |
| Sub-Middling (≥30% <50%) | 5.28 | 2.23 | 2.47 | 3.03 |
| Locked (<30%) | 8.76 | 3.93 | 2.23 | 4.19 |
| | NI43-101 Technical Report and Updated Resource Estimate South Tally Pond Property – Lemarchant Deposit |
| Liberation of Sphalerite | +53µm | +25µm | -25µm | Head |
| Free | 54.4 | 78.2 | 83.1 | 75.4 |
| Liberated (≥80% <100%) | 31.7 | 15.7 | 9.38 | 16 |
| Middling (≥50% <80%) | 8.69 | 3.96 | 3.84 | 4.94 |
| Sub-Middling (≥30% <50%) | 2.35 | 0.67 | 0.98 | 1.19 |
| Locked (<30%) | 2.94 | 1.52 | 2.68 | 2.41 |
| | | | | |
| Liberation of Galena | +53µm | +25µm | -25µm | Head |
| Free | 29.4 | 55.1 | 54.2 | 51 |
| Liberated (≥80% <100%) | 23.5 | 24.2 | 36.2 | 31.1 |
| Middling (≥50% <80%) | 4.93 | 6.98 | 5.24 | 5.69 |
| Sub-Middling (≥30% <50%) | 12.1 | 3.86 | 0.44 | 3.02 |
| Locked (<30%) | 30.1 | 9.86 | 3.88 | 9.19 |
| | | | | |
| Liberation of Arsenopyrite | +53µm | +25µm | -25µm | Head |
| Free | 95.0 | 87.0 | 82.3 | 83.6 |
| Liberated (≥80% <100%) | 0.00 | 0.00 | 0.00 | 0.00 |
| Middling (≥50% <80%) | 0.00 | 0.00 | 17.7 | 14.0 |
| Sub-Middling (≥30% <50%) | 0.00 | 0.00 | 0.00 | 0.00 |
| Locked (<30%) | 5.0 | 13.49 | 0.00 | 2.37 |
| | | | | |
| Liberation of Pyrite | +53µm | +25µm | -25µm | Head |
| Free | 34.9 | 61.1 | 76.2 | 54.1 |
| Liberated (≥80% <100%) | 49.7 | 30.8 | 12.9 | 34.2 |
| Middling (≥50% <80%) | 7.61 | 5.45 | 3.62 | 5.89 |
| Sub-Middling (≥30% <50%) | 3.81 | 1.02 | 2.52 | 2.46 |
| Locked (<30%) | 4.02 | 1.7 | 4.75 | 3.31 |
| | | | | |
| Liberation of Barite | +53µm | +25µm | -25µm | Head |
| Free | 48.9 | 71 | 75.4 | 67.9 |
| Liberated (≥80% <100%) | 48.8 | 28 | 20 | 29.1 |
| Middling (≥50% <80%) | 1.43 | 0.54 | 3.23 | 1.98 |
| Sub-Middling (≥30% <50%) | 0.33 | 0.23 | 0.79 | 0.51 |
| Locked (<30%) | 0.56 | 0.21 | 0.62 | 0.48 |
| | NI43-101 Technical Report and Updated Resource Estimate South Tally Pond Property – Lemarchant Deposit |
Figure 13-1: Liberation of Sulphide Minerals

| 13.3.4 | Theoretical Grade-Recovery Curves for Cu, Pb and Zn |
The Cu grade-recovery curve for the Lemarchant MS sample (Figure 13-2) indicate a Cu concentrate grading above 40% Cu should be achievable at Cu recoveries above 90%.
Figure 13-2: Mineralogical Cu Grade-Recovery Curve
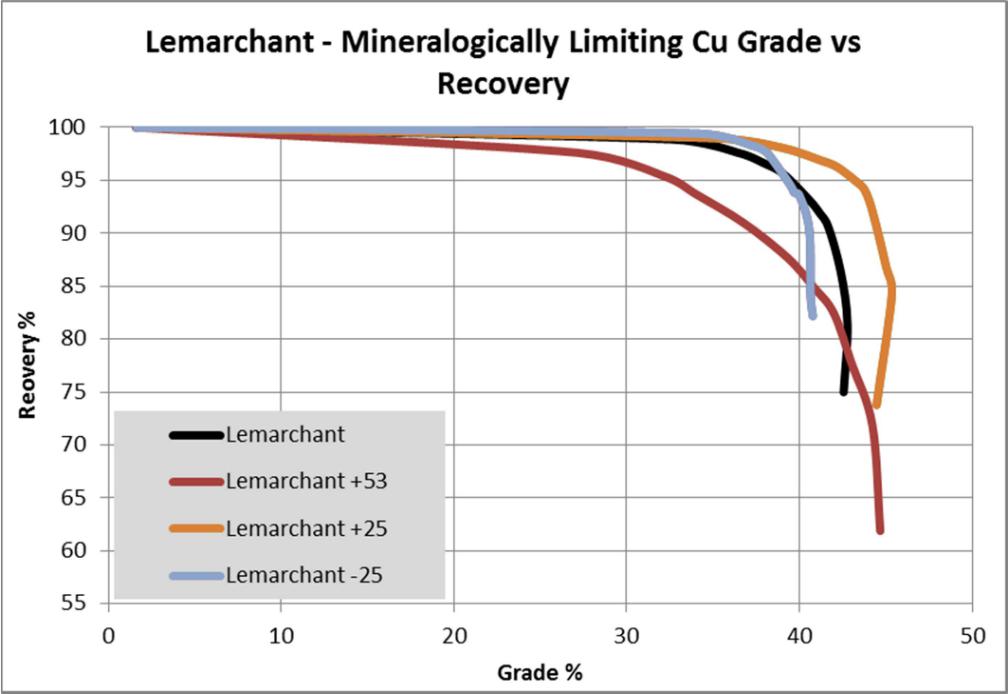
| | NI43-101 Technical Report and Updated Resource Estimate South Tally Pond Property – Lemarchant Deposit |
The Zn grade-recovery curve for the Lemarchant MS sample (Table 13-3) indicate a Zn concentrate grading above 60% Zn should be achievable at Zn recoveries above 90%.
Figure 13-3: Mineralogical Zn Grade-Recovery Curve
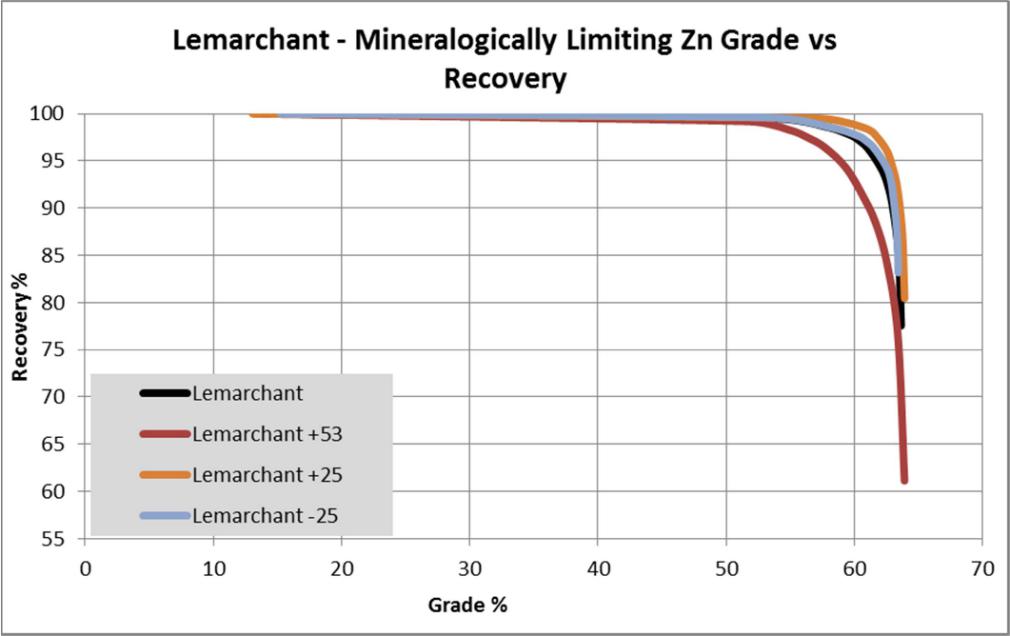
The Pb grade-recovery curve for the Lemarchant MS sample (Figure 13-4) indicate a Pb concentrate grading above 80% Pb should be achievable at Pb recoveries above 90%.
Figure 13-4: Mineralogical Pb Grade-Recovery Curve
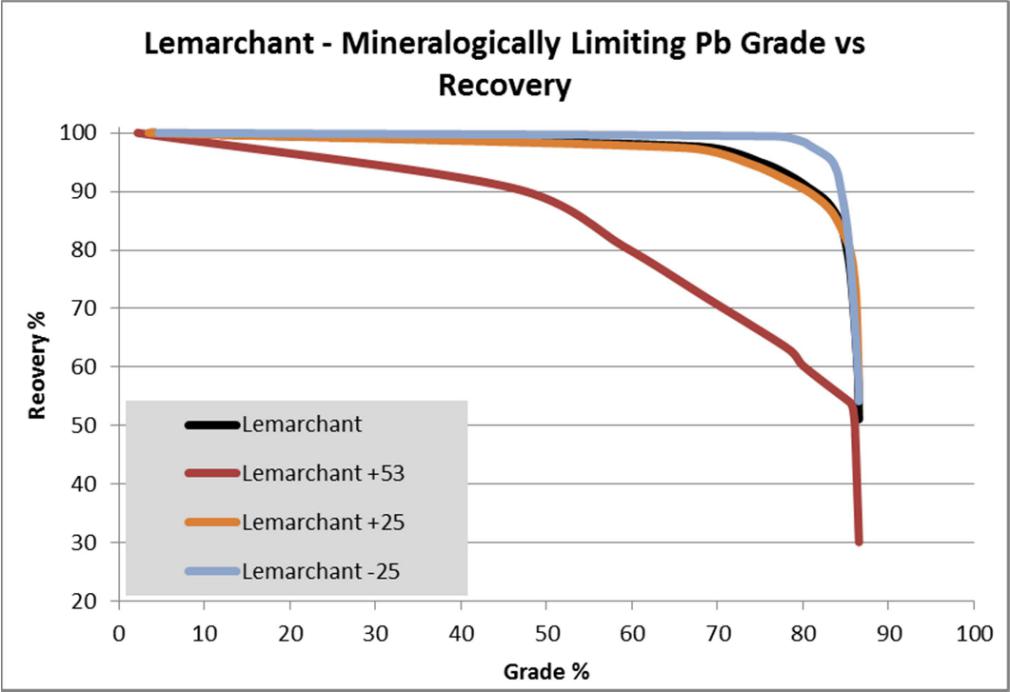
| | NI43-101 Technical Report and Updated Resource Estimate South Tally Pond Property – Lemarchant Deposit |
| 13.4 | Dense Media Separation (DMS) Testing |
The bench scale DMS testing program was designed to assess the amenability of various mineralized samples, from the different deposits, to physical upgrading (pre-concentration) at each site. This study was aimed at assessing the potential to reduce transportation costs from the various mine sites to a centralized milling facility as well as to maximize head grade in order to reduce downstream processing costs. The following is summarized from Thibault (2017).
Successful application of DMS for preconcentration is contingent upon the feedstock being composed of a sufficient proportion of gangue (waste) minerals that are lighter in density (e.g. silicates, chlorites, carbonates, etc.) than the value minerals (mainly chalcopyrite, galena and sphalerite). Higher density waste minerals such as pyrite and barite are not expected to be separated from the value minerals using DMS.
In addition to the difference in specific gravity between value minerals and waste, these two mineral classes must be sufficiently coarse-grained to allow a high enough degree of liberation, or separation from one another when processing crushed ore. DMS works on coarse particles only (greater than 1.0 mm) and if the ore requires finer sizes than this specification to liberate waste and value minerals, DMS will not be a viable pre-concentration option. Figure 13-5 provides an overview of the key steps when applying DMS technology.
Figure 13-5: Dense Media Separation Flowchart
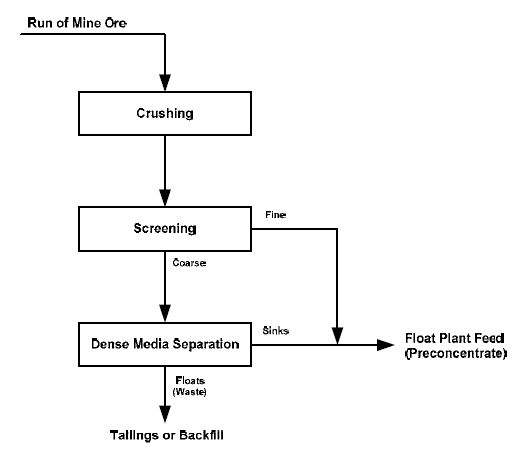
| | NI43-101 Technical Report and Updated Resource Estimate South Tally Pond Property – Lemarchant Deposit |
The initial crushing step at the selected top size provides the required degree of liberation between value and waste minerals. The fines that are too small to be processed by DMS are then removed by screening. The coarse crushed ore is fed to the dense media separator, where the particles are suspended in a fluid media with a carefully controlled specific gravity to achieve the desired separation cut point. For example, with a media specific gravity of 2.80, light waste rock with specific gravity of less than 2.80 (e.g. quartz, most silicates) will float, while the desired heavy particles containing base metal sulphides will sink.
The “floats” become the waste product while the “sinks” are recovered as the pre-concentrate. In some cases, the fines that are screened out before DMS will naturally become concentrated in the metals of interest, providing an additional level of pre-concentration and the fines are recombined with the DMS sinks to produce the overall flotation plant feed. The potential advantages of pre-concentration using DMS must be balanced with the loss in valuable metal that occurs with the DMS float or reject product in order to provide a net benefit to the project.
For the bench scale DMS testing, a crush size of 12.7 mm (0.5 inch) was selected as this is near the practical lower limit to avoid excessive generation of non-treatable fines (<1.0 mm) in full scale operation. A comparatively fine crush is appropriate for initial DMS evaluation in order to provide as high a degree of liberation of the minerals as is practical. With successful initial DMS test performance, future tests would then be conducted to optimize crush size. Figure 13-6 provides an overview of the sample preparation scheme used for the DMS samples.
Figure 13-6: Dense Media Separation Sample Preparation

| | NI43-101 Technical Report and Updated Resource Estimate South Tally Pond Property – Lemarchant Deposit |
DMS bench scale tests were conducted on the Lemarchant MS and Lemarchant FW samples. For each DMS bench test, approximately 2.5 kg of 1.0 mm screen oversize material was split from each sample and tested using a combination of tetrabromoethane (specific gravity 2.96) diluted with acetone (specific gravity 0.79) as the dense media for separations at 2.95 specific gravity and below. For specific gravities 3.10 and 3.30, the dense media was a blend of diiodomethane (specific gravity 3.32) and acetone.
Both samples were initially tested at the 2.95 specific gravity. The floats were then re-treated with staged reductions in specific gravity down to 2.70. Sinks from each separation stage were collected, washed, dried, weighed and assayed. This process of sequentially adjusting the specific gravity and collecting new sinks for assay was carried out for each separation specific gravity, until reaching a specific gravity of 2.70, when both the sinks and floats were washed, dried, weighed and collected for assay. For the high specific gravity test samples that yielded almost 100% sinks at specific gravity 2.95, there was insufficient floats weight for further testing at lower separation specific gravities. All 2.95 sink material from each test was subjected to higher specific gravities of 3.30 and 3.10, with the exception of the higher density samples that had insufficient floats to separate at the 3.10 specific gravity.
Results of the bench scale testing indicate that regardless of specific gravity tested, the Lemarchant MS sample could not be upgraded by DMS because of limited separation with predominantly heavy massive sulphide and/or barite mineralization
The Lemarchant FW sample consists of semi-massive sulphide / silicate type mineralization and contains enough low specific gravity mineralization to allow DMS to provide selective separation with about 20% to 40% weight rejection of gangue material. Results shown on Table 13-7 indicate the Lemarchant FW sample shows good separation characteristics and could achieve a 30% waste rejection by DMS (70% weight recovery to pre-concentrate).
Table 13-7: Summary of Combined Sinks and Fines at 70% Overall Weight Recovery
| Sample | Overall Metal Recovery to Sinks + Fines |
| Cu (%) | Pb (%) | Zn (%) | Au (%) | Ag (%) |
| Lemarchant FW | 94.6 | 97.7 | 95.4 | 97.4 | 96.4 |
| | | | | | |
| Sample | Overall Upgrade Ratio (Sinks + Fines relative to Feed) |
| Cu (%) | Pb (%) | Zn (%) | Au (%) | Ag (%) |
| Lemarchant FW | 1.35 | 1.40 | 1.36 | 1.39 | 1.38 |
A high degree of upgrading was achieved with the Lemarchant FW sample with an increase in grades of copper, lead, zinc and silver by 35% to 40% with copper, lead, zinc and silver recoveries ranging from 94.6% to 97.7%. Economic assessment is required to determine if there is a net benefit in reducing the mass of ore to process compared to the loss of payable metals to the floats (waste) product.
| | NI43-101 Technical Report and Updated Resource Estimate South Tally Pond Property – Lemarchant Deposit |
| 13.5 | Grindability Testing |
The Lemarchant MS sample was submitted to SGS Canada Inc. of Lakefield, Ontario for determination of standard Bond Rod Mill Work Index (RWI) and a Bond Ball Mill Work Index (BWI). The rod mill and ball mill grindability tests were completed to quantify electrical power requirements for grinding operations. The Lemarchant MS was found to be very soft (easy to grind) with its high sulphide mineral and barite content.
The Bond Rod mill grindability test was performed at 14 mesh of grind (1,180 microns) on the Lemarchant MS sample. The test results are summarized in Table 13-8. The sample is classified as very soft and falls within the second percentile of hardness of the SGS database.
The Bond Ball mill grindability test was performed at 200 mesh of grind (75 microns) on the Lemarchant MS Sample. The test results are summarized in Table 13-8 and compared to the SGS database in Figure 13-7. With a Bond Ball Mill Work Index (BWI) of 7.3kWh/t, the Master composite sample can be categorized as very soft.
Table 13-8: Bond Work Index Test Summary
| Work Index Test | Mesh of Grind | F80 (µm) | P80 (µm) | Grams Per Revolution | Work Index (kWh/t) | Hardness Percentile |
| Bond Rod Mill | 14 | 10,257 | 904 | 34.6 | 6.3 | 2 |
| Bond Ball Mill | 200 | 2,423 | 57 | 3.29 | 6.1 | 1 |
Figure 13-7: Bond Ball Mill Work Index SGS Database
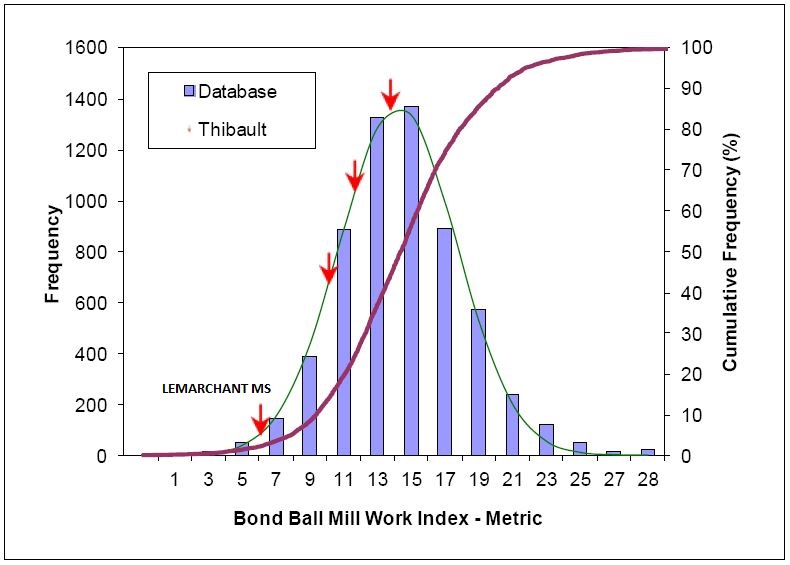
| | NI43-101 Technical Report and Updated Resource Estimate South Tally Pond Property – Lemarchant Deposit |
| 13.6 | Acid-Base Accounting and Toxicity Characteristic Leaching Procedure Testing |
The flotation feed and flotation tailings for Lemarchant MS was characterized by Acid-Base Accounting (ABA) andToxicity Characteristic Leaching Procedure (TCLP) metals leachability tests. Results shown on Table 13-9 indicate that the sample is defined as acid generating (by acid-base accounting tests) due to the concentration of sulphide minerals with very little neutralizing minerals such as carbonates to balance the potential acid generation. Under the TCLP test conditions, tailings from the Lemarchant MS sample had leachable copper, lead and zinc in excess of MMER guidelines and treatment of both process and mine wastewater will be required using conventional based metal processing - wastewater treatment technology. Sub-aqueous disposal of tailings will be required with water cover to minimize sulphide sulphur oxidation.
The initial assessment of metal leachability using the TCLP method showed that for all of the flotation feed and tailings samples, zinc and lead leachate concentrations are in excess of the authorized MMER discharge limits. Copper leachate concentrations in the flotation tailings were above the MMER permitted concentration for the Lemarchant samples.
The standard TCLP test is conducted at pH 4-5 and more, future detailed tailings leachability assessments would be required, including elevated pH levels to reflect tailings neutralization with lime prior to discharge to the tailings impoundment. Further evaluation would also be required to assess the need for treatment of any excess water discharge from the tailings impoundment area for metals removal to produce a final water discharge in compliance with MMER guidelines.
Table 13-9: Summary of Acid-Base Accounting Results for Test Program Products
| | | | | | Acid | | | |
| | | | | | Production | Neutralizing | Net | |
| Sample | Paste pH | Total | Sulphate | Sulphide | Potential | Potential | NP | NP/AP |
| Description | (pH units) | Sulphur | Sulphur | Sulphur | (AP) | pH 8.3 (NP) | pH 8.3 | |
| | | (%) | (%) | (%) | (CaCO3 / tonne) | | |
| Lemarchant MS Head | 7.85 | 17.05 | 2.931 | 14.12 | 441 | 89.5 | -351.6 | 0.20 |
| Lemarchant MS Float Tails | 7.60 | 18.74 | 0.001 | 18.74 | 586 | 117.3 | -468.4 | 0.20 |
The objective of the flotation test program was to develop a common flotation flowsheet and reagent scheme for all five of the deposits tested. The first step in the test program was to assess two alternative flowsheets and determine which one was the best for processing all of the different deposits. The flowsheet was then fixed for the subsequent steps of grind size and reagent scheme evaluation. The following is summarized from the report by Thibault (2017).
| | NI43-101 Technical Report and Updated Resource Estimate South Tally Pond Property – Lemarchant Deposit |
| 13.7.1 | Flowsheet Selection |
Flowsheet and reagent scheme selection for processing of complex copper-lead-zinc deposits vary widely depending on the unique characteristics of each mineralized zone, and often extensive testing is required to define a technically viable flotation flowsheet. In general, however, there are two basic flowsheet configurations used for processing of copper-lead-zinc deposits: i) the bulk copper-lead flotation method followed by zinc flotation from the bulk tailings, and ii) sequential copper-lead-zinc flotation. These two basic flowsheets were considered in the test program, as shown in Figure 13-8 and Figure 13-9.
Figure 13-8: Bulk Copper/Lead and Zinc Flotation Flowsheet
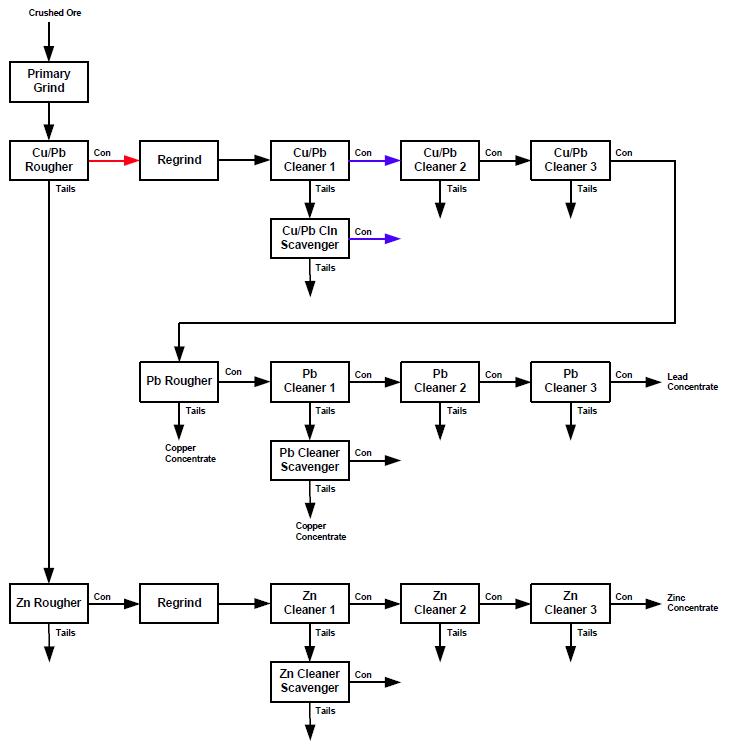
| | NI43-101 Technical Report and Updated Resource Estimate South Tally Pond Property – Lemarchant Deposit |
Figure 13-9: Sequential Copper, Lead and Zinc Flotation Flowsheet

For the test program, three stages of cleaner flotation were included for all cleaner circuits. The ultimate number of cleaner stages may be more or fewer, depending on rougher concentrate contaminants and cleaner flotation selectivity. The flowsheets shown are open circuit, meaning that tailings from intermediate stages are not recycled in the flowsheet. In closed-circuit operation of the plant, or locked cycle testing, all intermediate streams are directed for recycle or recombining to maximize recoveries. For example, the bulk copper/lead cleaner scavenger tailings would contain zinc that was removed from the copper/lead concentrate, which in closed circuit would then be recombined with the main zinc flotation feed so that the metals have a chance for recovery into their appropriate concentrates.
| | NI43-101 Technical Report and Updated Resource Estimate South Tally Pond Property – Lemarchant Deposit |
In general, the bulk Cu-Pb flowsheet is often used where possible, while the sequential flowsheet is used where difficulties with the bulk Cu-Pb flowsheet cannot be overcome. Some of these situations are summarized as follows:
| • | Copper-lead-zinc ores that contain precious metals often respond better to sequential flotation methods than to the bulk copper-lead flotation method, particularly with respect to recovery of precious metals to the copper and lead concentrate products. |
| • | Copper-lead-zinc ores for which the separation of the bulk copper-lead concentrate into marketable concentrate products proves to be challenging often respond better to sequential copper-lead-zinc flotation methods. |
| • | Finely disseminated copper-lead-zinc ores that require fine primary grinding and fine regrinding of the rougher concentrates often respond better to sequential copper-lead-zinc flotation. |
| • | Copper-lead-zinc ores in which sphalerite is pre-activated (i.e. for which depression of zinc in the bulk copper-lead flotation circuit is challenging) often respond better to sequential copper-lead-zinc flotation methods. |
| 13.7.2 | Flowsheet Selection - Rougher Flotation Tests |
The rougher portion of the two alternative flotation flowsheets was first tested following the block diagrams in Figure 13-10 and 13-11. Four tests per flowsheet were included for each sample with varying reagent conditions to identify reasonable starting conditions. The objective of this approach was to perform minimal initial scoping tests on each flowsheet in order to select a single flowsheet which would be used for subsequent detailed testing. All tests were performed at a relatively fine grind size (P80 = 30 micron) to minimize effects of poor mineral liberation, and kinetic samples were collected to provide the recovery over time for each concentrate (and the associated grade/recovery relationship). The grind sizes were selected based on the mineralogy study results to provide a relatively high degree of mineral liberation.
Initial testing conditions selected were based on building what was learned from the previous test programs, the initial test results have generally shown some improvement in flotation performance. The best test conditions identified from these initial rougher flotation tests have been carried forward to the initial cleaner flotation assessment of the two flowsheets. The more detailed grind size and reagent evaluation for rougher and cleaner flotation will be conducted after the final flowsheet selection.
| | NI43-101 Technical Report and Updated Resource Estimate South Tally Pond Property – Lemarchant Deposit |
| Figure 13-10: Bulk Rougher Flotation | | Figure 13-11: Sequential Rougher Flotation |
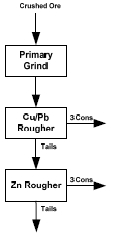 | | 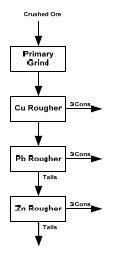 |
Each flotation test was conducted as a kinetic test by collecting three separate rougher concentrates over specific time intervals during each flotation stage. Each test has a flotation kinetic graph which shows the recovery of each metal (relative to feed) over time during each flotation step (Cu/Pb, Zn for bulk and Cu, Pb, Zn for sequential). The flotation is more selective when there is a high recovery of the desired metal (e.g. Cu) and low recovery of the other metals (Pb, Zn). Grade-recovery curves were prepared to compare the different test conditions to one another on the same graph.
Highlights from the rougher flotation testing are summarized below:
| • | The Lemarchant MS sample responded very well to both the bulk Cu/Pb and sequential flowsheets with high-grade rougher concentrates. |
| • | The best bulk Cu/Pb flotation conditions were in Test FL-20, which was selected for further evaluation in the cleaner flotation tests, with a shorter Cu/Pb scavenger flotation time to reduce zinc recovery to the Cu/Pb concentrate. Test FL-20 had rougher flotation recoveries of 92.0% Cu, 94.8% Pb and 78.6% Zn at grades of 12.9% Cu, 27.7% Pb and 58.2% Zn, respectively. |
| • | The best sequential flotation conditions were in Test FL-24, which was selected as the basis for further testing with a reduction in the copper rougher flotation time and collector dosages to reduce zinc and lead recovery to the copper concentrate. Test FL-24 produced rougher flotation recoveries of 90.4% Cu, 81.6% Pb and 75.8% Zn at grades of 20.5% Cu, 46.3% Pb and 55.7% Zn, respectively. |
| | NI43-101 Technical Report and Updated Resource Estimate South Tally Pond Property – Lemarchant Deposit |
| 13.7.3 | Flowsheet Selection - Cleaner Flotation Tests |
Based on the rougher flotation conditions that were selected, a single open circuit cleaner flotation test was performed on the Lemarchant MS sample on each flowsheet (Bulk Cu/Pb and Sequential). The objective of this series of cleaner tests was to evaluate the response the sample to typical cleaner operating conditions with both flowsheet options and subsequently selection of the flotation flowsheet for further evaluation of grind sizes and reagent schemes.
The rougher concentrates were reground prior to 3-stage cleaning for each circuit. The separation of copper and lead in the bulk Cu/Pb flowsheet was accomplished by depressing the copper and floating the lead for all tests. Since these cleaner tests are open circuit, the process streams that would normally be internally recycled in plant operations were simply weighed and assayed. Therefore, the recovery of each final concentrate is low and not representative of continuous or locked cycle conditions. The important results to compare between the tests are the flotation selectivity with the two flowsheets.
No kinetic samples were taken during the cleaner flotation tests. Instead, the rougher and scavenger concentrates were combined for each circuit, reground, and subsequently refloated three times to simulate three cleaning stages. A final cleaner concentrate was collected for assay from each cleaner circuit.
A summary of the results for the two Lemarchant MS cleaner flotation tests are summarized below and grade-recoveries illustrated on Figure 13-12.
| • | There was similar zinc grade/recovery performance for both flowsheets. A concentrate grade of >60% zinc was easily met with both flowsheets after only one stage of cleaning. |
| • | As shown in Figure 13-12, the bulk Cu/Pb flotation flowsheet had very low copper and lead recoveries in the first stage of the Cu/Pb cleaner. This is visible as the drop in copper (or lead) recovery from the topmost data point down to the second copper (or lead) data point from the top. This poor Cu/Pb recovery in the first cleaner impacted the rest of the Cu/Pb performance. Better Cu/Pb Cleaner 1 performance would be beneficial. |
| • | The copper concentrate from the sequential flowsheet contained much less lead as an impurity. |
| • | High copper grades >30% in the copper concentrate are possible with the Lemarchant MS sample due to the high proportion of copper as bornite, which contains more copper relative to chalcopyrite. |
| • | The bulk Cu/Pb flowsheet produced a cleaner final lead concentrate than the sequential flowsheet. |
| • | Based on the test results, either the sequential or bulk Cu/Pb flowsheet would work well with Lemarchant MS after further optimization. |
| | NI43-101 Technical Report and Updated Resource Estimate South Tally Pond Property – Lemarchant Deposit |
Figure 13-12: Lemarchant MS Grade-Recovery Relationship for Cu, Pb, Zn Concentrates.
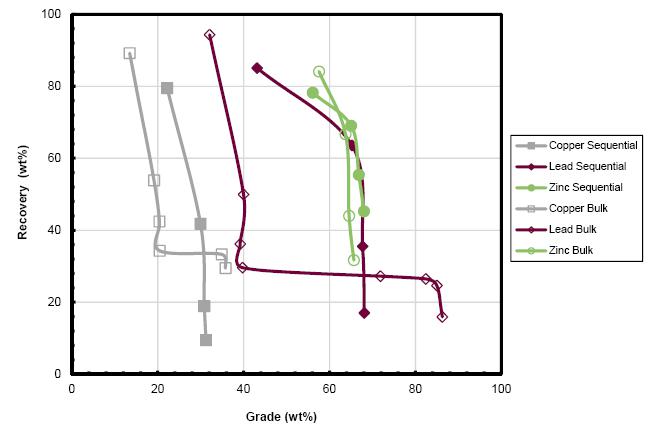
| 13.7.4 | Sequential Flowsheet - Grind Selection |
The sequential flotation flowsheet was selected for the remainder of the test program (better suited for the other 4 deposits) the effect of primary grind size on the selectivity of the rougher flotation of copper, lead and zinc was assessed for the test samples. The four grind sizes selected for the two Lemarchant samples (Lemarchant MS and Lemarchant FW) are 80% Passing 30, 45, 65 and 85 micron.
The four different grind sizes were tested per sample, and the grind sizes were selected based on the liberation results from the mineralogy study for each deposit. There was no mineralogical testing on the Lemarchant FW sample, so testing for Lemarchant FW sample was conducted with the same grind sizes that were used for the Lemarchant MS sample. Key results for the effect of varying grind size on the rougher flotation of the Lemarchant MS sample are summarized below:
| • | The rates of flotation are similar for the copper, lead and zinc concentrates regardless of particle size. Zinc floats especially fast in the zinc concentrate. Increased co-flotation of zinc with the copper and lead concentrates is evident at increasingly coarse grind sizes, leading to losses of zinc from the zinc rougher concentrate. |
| • | The copper flotation is most selective at a P80 of 30 micron. Copper recovery is improved at a coarser grind P80 of 45 micron with a corresponding modest increase in zinc and iron recovery to the copper concentrate. |
| | NI43-101 Technical Report and Updated Resource Estimate South Tally Pond Property – Lemarchant Deposit |
| • | The lead recovery is maximized at P80 = 45 micron. Using a finer grind slightly reduces lead recovery but also increases copper recovery to the lead concentrate (due to lower copper recovery in the preceding copper flotation step). |
| • | The zinc recovery is maximized at the finest grind size, where the least amount of zinc is lost to the copper concentrate. Increasing the grind size from a P80 of 30 micron to 45 micron decreases the zinc recovery by 2.7% which is about equal to the increase in zinc recovery of 2.9% to the copper concentrate that was observed for this same change in grind size. The iron recovery to the zinc concentrate is shown to increase with increasing grind size; however, this still corresponds to relatively low iron grades in all tests due to low iron content in the head sample. |
| • | The grade-recovery curves show that a grind size of P80 = 45 micron has either the best or second-best result for all three concentrates. The lead concentrate grade is much lower at the finer grind size of P80 = 30 micron. High copper and zinc concentrate grades were produced with a grind size of P80 = 45 micron. |
| • | The grind size of P80 = 45 micron has been selected as the best initial value for Lemarchant MS. This grind size offers numerous advantages as the results show with the key disadvantage being a higher loss of zinc to the copper concentrate compared to the next finer grind size. However, it is anticipated that after regrinding the copper rougher concentrate followed by flotation, the zinc misplaced with the copper rougher concentrate will be largely returned via the cleaner tailings to the zinc rougher flotation feed for potential recovery to zinc concentrate. |
Key results for the effect of varying grind size on the rougher flotation of the Lemarchant FW sample are summarized below. No lead concentrate was collected from the Lemarchant FW sample due to insufficient lead content in the head sample.
| • | Both the copper and zinc float faster as the grind size becomes coarser. Most of the lead is recovered to the zinc concentrate. However, it appears that by using a shorter flotation time for the zinc rougher, the recovery of lead to the zinc concentrate could be further reduced because lead continues to float substantially during the last three minutes of flotation whereas zinc recovery is essentially complete. |
| • | Over the range of grind sizes tested, copper recovery increases significantly with increasing grind size from 80% to 93% with only a small drop in zinc recovery from 96% to 94%. |
| • | The best copper and zinc grade-recovery results were achieved with a P80 of either 65 or 85 micron. |
| • | The best overall grind size for Lemarchant FW was determined to be P80 = 85 micron. This is the coarsest grind size selected for any of the deposits in this test program. It is common for stockwork-type mineralization like the Lemarchant FW to liberate for flotation at coarser grind sizes compared to massive sulphide mineralization. |
| | NI43-101 Technical Report and Updated Resource Estimate South Tally Pond Property – Lemarchant Deposit |
| 13.7.5 | Sequential Flowsheet - Rougher Flotation Tests |
With the sequential flotation flowsheet and primary grind size selected, the next step in the flowsheet development was based on varying the rougher flotation reagents used, their dosages, and operating conditions in the rougher flotation. The objective of this series of tests was to further improve the rougher flotation performance prior to moving into further development of the cleaner flotation process.
In addition to monitoring copper, lead, zinc and iron recovery, the deportment of arsenic and antimony to the rougher flotation concentrate was also assessed at the conclusion of the reagent scheme assessment. As a result of the mineralogical investigation, it was expected that some of the concentrates would be elevated in arsenic and antimony.
The primary grind size was maintained constant for the two Lemarchant samples. For the initial tests a single combined rougher/scavenger concentrate was collected for each of the copper, lead and zinc circuits, resulting in three concentrates and one tailings sample per test. The final test for each of the samples was a kinetic test with timed concentrate collection in order to confirm rougher flotation kinetics and the rougher flotation grade-recovery relationships.
Ten rougher flotation tests (FL-76 through FL-85) were conducted on the Lemarchant MS sample. A rougher kinetic flotation test was conducted with the final selected reagent scheme (FL-85) and the results have been compared to the Lemarchant MS flotation performance for the initial test before reagent scheme improvements were made (FL-55). Key results are summarized below and shown on Table 13-10.
| • | Very high grade copper, lead and zinc rougher concentrate grades were produced. |
| • | Most of the arsenic and antimony were recovered to the copper concentrate. This was expected since the mineralogical study found that arsenic was almost exclusively present as tetrahedrite-tennantite and antimony is normally present as a readily floatable copper sulphosalt. |
| • | The arsenic and antimony grades in the copper rougher concentrate were more than an order of magnitude higher than the penalty threshold. Due to the nature of the arsenic and antimony minerals in the Lemarchant MS sample, it is not expected that cleaner flotation will reduce the values, and substantial blending with a clean concentrate may need to be considered for the Lemarchant MS copper concentrate. |
| • | Besides arsenic and antimony, the copper concentrate requires cleaning to reject misplaced lead and zinc. |
| • | Lead rougher concentrate is relatively clean but requires cleaning of misplaced copper and zinc. |
| • | Zinc rougher concentrate is very clean and requires minimal cleaning. |
| | NI43-101 Technical Report and Updated Resource Estimate South Tally Pond Property – Lemarchant Deposit |
| • | Most of the gold reports to the flotation tailings. What appears to be a gold nugget effect seems to have occurred on this and some of the other tests on Lemarchant MS. As the gold balance shows, this particular sample that was tested had about ten times the gold content that the average head assay of this sample showed. |
Table 13-10: Metallurgical Balance for Final Lemarchant MS Rougher Flotation Reagent Scheme Test

Four rougher flotation tests (FL-86 through FL-89) were conducted on the Lemarchant FW sample. The flotation response of the Lemarchant FW sample was very good. The final selected rougher flotation reagent scheme for Lemarchant FW was tested (FL-89) and compared to the initial Lemarchant FW test results (FL-61), as shown in Table 13-11
| • | There is very low arsenic and antimony content in the sample and as a result, the arsenic and antimony grades are below the penalty threshold in the rougher concentrate (Table 6-3) and should stay below the threshold after cleaning since the rougher concentrates are relatively high grade in either copper or zinc. |
| • | Over 93% recovery of copper and zinc to the respective rougher concentrates was achieved. |
| • | The copper and zinc rougher concentrates will not take much cleaning effort to reach final concentrate grades. |
| • | The flotation kinetics show that some of the lead recovered in the zinc concentrate could be further reduced by not using the additional scavenger collector dose at 7.5 minutes, which caused a spike in lead recovery with no change in zinc recovery. |
| | NI43-101 Technical Report and Updated Resource Estimate South Tally Pond Property – Lemarchant Deposit |
| • | Silver is mostly recovered to the copper concentrate but due to low grades there is not going to be a significant silver credit for Lemarchant FW. Arsenic recovery was much lower than the copper recovery, indicating arsenic is predominantly not contained in copper bearing minerals. |
| • | Copper grade-recovery performance after reagent modification did not change significantly from the previous conditions. However, the same results were achieved with less reagent usage. |
| • | Using a lower zinc collector dosage, a higher grade zinc rougher concentrate was produced compared to earlier tests, with no drop in recovery. |
Table 13-11: Metallurgical Balance for Final Lemarchant FW Rougher Flotation Reagent Scheme Test
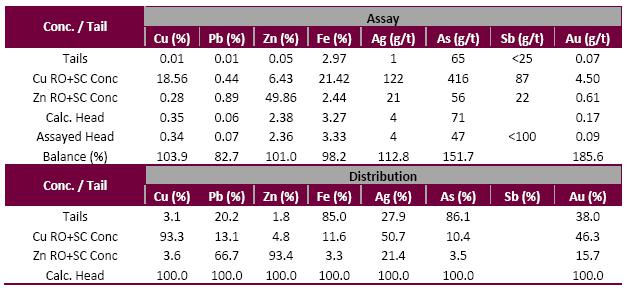
| 13.7.6 | Sequential Flowsheet - Cleaner Flotation Tests |
Following selection of the rougher reagent scheme for each sample, a cleaner flotation, including regrind and reagent scheme assessment, was evaluated. The cleaner flotation assessment was carried out using a series of open circuit batch flotation tests on the two Lemarchant samples. The same general reagent scheme was followed for each deposit, with dosages and addition points tailored to the flotation response of each sample.
The rougher concentrates were reground prior to 3-stage cleaning for each circuit. A few tests were conducted with an optional fourth cleaner stage for lead flotation. Since these cleaner tests are open circuit, the process streams that would normally be internally recycled were weighed and assayed. Therefore, the recovery of each final concentrate is naturally low and not representative of continuous or locked cycle conditions. The important results to compare between the different tests are the grade-recovery relationships and the final concentrate grades which indicate the selectivity of the flotation process.
| | NI43-101 Technical Report and Updated Resource Estimate South Tally Pond Property – Lemarchant Deposit |
The approach taken in the open circuit evaluation of cleaner flotation for each sample was to first evaluate the effect of regrind on the cleaner flotation performance in each circuit using a base case cleaner reagent scheme. After selection of the regrind sizes, evaluation of cleaner flotation reagent scheme effect on flotation selectivity was conducted in order to define the final flotation conditions for this stage of the process development. Eleven open circuit cleaner tests (FL-112, FL-113 and FL-133 to FL-141) were conducted on the Lemarchant MS sample. Five cleaner tests (FL-108, FL-109, and FL-116 to FL-118) were conducted on the Lemarchant FW sample. Each concentrate is summarized below.
Lemarchant MS - Copper Concentrate
The key objective of copper concentrate cleaning was to remove lead and zinc from the rougher concentrate rather than to increase the copper grade. The already high copper grades were attributed to higher bornite content in the Lemarchant MS, which has a higher concentration of copper than chalcopyrite.
Using a regrind, the zinc grade in the final copper concentrate seems to be lower, but this is partially due to the much lower final copper recovery, allowing the flotation to be more selective. The lead grade is also much lower when a regrind is not used. To assess the lead and zinc rejection, the cleaner flotation tests focused on depressant and collector dosages with no regrind. Table 13-12 summarizes the final open circuit copper concentrate grades and recoveries for Lemarchant MS based on test FL-138. The copper grade is very high in part due to the bornite content. Arsenic and antimony are both very high and additional treatment charges may be incurred.
Table 13-12: Lemarchant MS (FL-138) Final Open Circuit Third Cleaner Copper Concentrate Grades and Recoveries
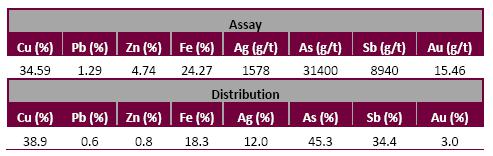
Lemarchant MS - Lead Concentrate
Much higher lead recoveries were achieved without a regrind, whereas the lead recovery dropped to less than 20% with a regrind. It was decided to continue with the reagent scheme tests by excluding a regrind for the Lemarchant MS lead concentrate. The lead flotation reagent scheme tests included an assessment of depressant dosages, collector dosages, and flotation pH.
The final flotation conditions from test FL-140 produced the open circuit lead concentrate grades and recoveries shown in Table 13-13. There is a very high lead grade in the final concentrate, with minimal copper, arsenic and antimony. Minimal silver was recovered to the lead concentrate while 7.6% of the gold was recovered.
| | NI43-101 Technical Report and Updated Resource Estimate South Tally Pond Property – Lemarchant Deposit |
Table 13-13: Lemarchant MS (FL-140) Final Open Circuit Fourth Cleaner Lead Concentrate Grades and Recoveries
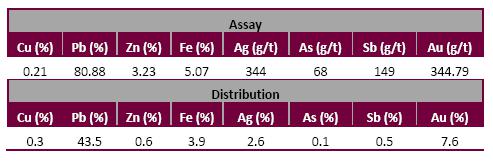
Lemarchant MS - Zinc Concentrate
The regrind tests showed that good zinc grades/recoveries and low copper, lead, and iron grades were achieved without the use of a regrind. The reagent scheme tests all produced similar final concentrate grades. Test FL-139 was selected for the final conditions as it had one of the highest grade-recovery relationships (which would result in lower recirculating loads) and operation at the lowest pH would reduce the consumption of lime. Table 13-14 shows the grades and recoveries for the zinc concentrate produced in final test FL-139. The zinc concentrate was very clean and had a high zinc grade.
Table 13-14: Lemarchant MS (FL-139) Final Open Circuit Third Cleaner Zinc Concentrate Grades and Recoveries
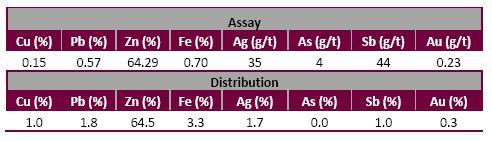
Lemarchant FW - Copper Concentrate
Base case reagent conditions were selected to compare the use of regrind versus no regrind of the copper rougher concentrate before cleaning. Without a regrind (FL-108), a higher copper grade and recovery was achieved, but with much more zinc in the final concentrate compared to when a regrind was used (FL-109). Rather than selecting the regrind size, it was decided that in the reagent scheme tests another test with regrind would be conducted in an attempt to improve copper recoveries, as well as another test without regrind while trying to reject more zinc.
For the test without a regrind (FL-116) there was still a high zinc grade in the final copper concentrate. The test with a regrind and modified reagent conditions (FL-117) produced the best results with high cleaner flotation recoveries and good rejection of zinc in the cleaner. Test FL-117 was selected for the final copper cleaner flotation conditions. The resulting open circuit final copper concentrate grades and recoveries for test FL-117 are shown in Table 13-15.
| | NI43-101 Technical Report and Updated Resource Estimate South Tally Pond Property – Lemarchant Deposit |
Table 13-15: Lemarchant FW (FL-117) Final Open Circuit Third Cleaner Copper Concentrate Grades and Recoveries
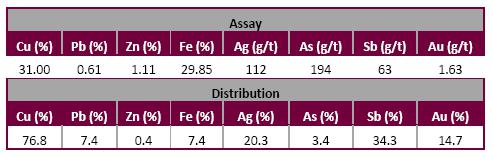
Lemarchant FW - Lead Concentrate
No lead flotation was conducted due to insufficient lead grade in the Lemarchant FW sample.
Lemarchant FW - Zinc Concentrate
The regrind size tests showed that very good zinc grades/recoveries and low copper, lead, and iron grades were achieved without the use of a regrind. The reagent scheme tests showed that eliminating the collector dosage and reducing the flotation pH in test FL-117 did not impact the cleaner flotation performance and therefore FL-117 was selected to represent the final zinc flotation conditions.
The grades and recoveries of the final zinc concentrate produced from Test FL-117 are shown in Table 13-16, and the result is a clean zinc concentrate with high open circuit zinc recovery. The high overall recovery is reflective of the high zinc recoveries of about 97% at each of the cleaner flotation stages. The zinc concentrate was easy to clean and minimal recirculating load would occur with closed circuit operation.
Table 13-16: Lemarchant FW (FL-117) Final Open Circuit Third Cleaner Zinc Concentrate Grades and Recoveries
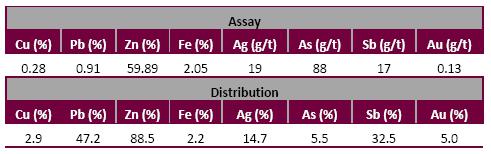
| | NI43-101 Technical Report and Updated Resource Estimate South Tally Pond Property – Lemarchant Deposit |
| 13.8 | Overall Flotation Estimated Grades and Recoveries using METSIM |
The bench scale tests in this program provided open circuit flotation performance and no locked cycle tests were conducted. To estimate closed circuit performance and final recoveries of each metal, a METSIMTM mass balance simulation of the entire process was used. For each Lemarchant sample, the bench scale open circuit flotation grades and recoveries at each individual process step were entered, and METSIMTM was used to converge to a solution considering all internal recycle streams in the flowsheet. The mass balance included solids, water, copper, lead, zinc, iron, silver, gold, arsenic and antimony.
The Lemarchant Deposit samples were simulated in order to provide the grade and recovery information. The simulations were first set up using the grades from each head sample from the bench scale flotation program. Then, the mass balance simulation was performed using the average life of mine mill feed grades from the samples based on the preliminary mine plans. The final concentrate recoveries remained the same between the test sample simulations and the mine plan simulations, but the final concentrate grades varied due to differing amounts and proportions of each value metal and impurity metal in the actual mine plan grades.
The final METSIMTM simulations to estimate the closed-circuit grade and recovery performance of each deposit, based on average life of mine head grades, are summarized in Table 13-17. The overall results indicate copper concentrate grades of 33.49% Cu at 79.5% recovery, lead concentrate grades of 69.56% Pb at 82.42% recovery, and zinc concentrate grades of 61.20% at 91.46% recovery. The overall silver and gold recovery is 68.22% and 84.23%, respectively and reports to the three concentrates.
Table 13-17: Lemarchant MS and FW Overall Flotation Estimated Grades and Recoveries by METSIM Simulation
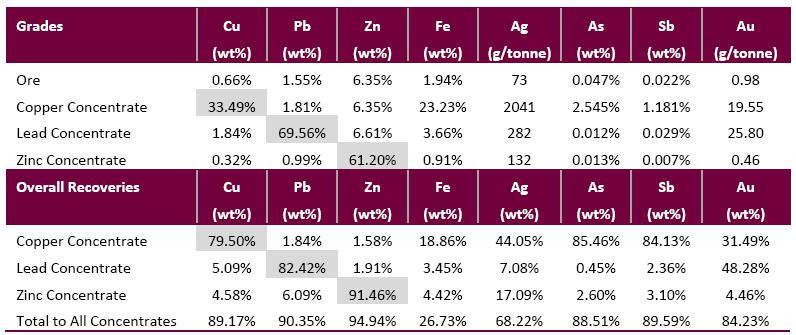
| 13.9 | Barite Metallurgical Study |
In 2018, a scoping test program was focused on assessing the ability to produce a high grade barite (BaSO4) concentrate from Lemarchant MS base metal flotation tailings. The composition of the base metal flotation tailings used to assess the barite flotation and product quality is assumed to be typical of tailings from the Lemarchant base metals sequential flotation circuit. The loading of heavy metals, silicate, carbonates and calcium fluoride, etc. which may have an impact on the grade of barite, is dependent on the ore composition and the performance of the base metal flotation circuit.
| | NI43-101 Technical Report and Updated Resource Estimate South Tally Pond Property – Lemarchant Deposit |
For the program, a conventional reagent scheme for barite flotation was used, based on with and without a regrind on the feed to the barite float. The data suggest that regrind may not be required and would be subject for further review based on definitive assessment of impurities in concentrate. In addition to rougher stage flotation, a Cleaner I stage and Cleaner II stage flotation was completed. From the test data, a two stage cleaning (defined as Cleaner II) would provide a barite grade of 97.75% BaSO4.
Leaching of the cleaner concentrates (using sulfuric acid) does destroy flotation reagents and does improve on the grade by removal of carbonate (reference to LOI reduction) and reducing the concentration of Al, Ca and Mg. The leach tests were completed on Cleaner I concentrate and results show that the second stage cleaner has an equivalent concentrate grade, suggesting the sulfuric acid leach may not be required. To improve on product quality in excess of 98% BaSO4, leaching of Cleaner II concentrate may be considered.
The bench scale test results (Table 13-18) indicate that a commercially proven flotation reagent scheme (using a combination of Aero 845 collector and sodium silicate depressant) can achieve a selective barite flotation based from the Lemarchant MS base metal tailings. Measures to improve on reagent dose and dynamics of the flotation have not been completed and various options are available to improve on selectivity. In summary, barite flotation to achieve a product grade of 95% barium sulfate is considered technically viable.
It was concluded that the economic viability of barite co-production will be dependent on i) resource definition to define grade and tonnage of barite relative to mine plan, ii) market volume acceptance based on a target end user / distributor and iii) logistics of barite concentrate transport to market.
Table 13-18: Lemarchant Barite Concentrate Specification and Analysis Summary
| | | | | Test Results |
| Specification | Limits | Value3 | Units | Cleaner I Concentrate | Cleaner I Concentrate (Leached) | Cleaner II Concentrate |
| Sample Number | | | | 6428-03-009 | 6428-03-011 | 6428-03-006 |
| Barium Sulfate (BaSO4) | min | 95.01,2 | % | 89.87 | 94.17 | 97.75 |
| Silica (SiO2) | max | 1.5 | % | 0.70 | 0.50 | 0.16 |
| Iron Oxide (Fe2O3) | max | 0.5 | % | 0.74 | 0.71 | 0.19 |
| Water soluble alkaline | max | 250 | ppm | - | - | - |
| Extractable carbonates | max | 300 | ppm | - | - | - |
| | NI43-101 Technical Report and Updated Resource Estimate South Tally Pond Property – Lemarchant Deposit |
| | | | | Test Results |
| Specification | Limits | Value3 | Units | Cleaner I Concentrate | Cleaner I Concentrate (Leached) | Cleaner II Concentrate |
| Sample Number | | | | 6428-03-009 | 6428-03-011 | 6428-03-006 |
| Extractable sulfides | max | 250 | ppm | - | - | - |
| | | | | | | |
| METALS4 | | | | | | |
| Arsenic (As) | max | 40 | ppm | <50 | <50 | <50 |
| Cadmium (Cd) | max | 3 | ppm | 9.0 | 7.0 | 5.0 |
| Copper (Cu) | max | ND | ppm | 507.0 | 295.0 | 208.0 |
| Lead (Pb) | max | ND | ppm | 1026.0 | 1084.0 | 759.0 |
| Mercury (Hg) | max | 1 | ppm | - | - | - |
| Selenium (Se) | max | ND | ppm | <100 | <100 | <100 |
| Silver (Ag) | max | ND | ppm | 15 | 8.0 | 6.0 |
| Zinc (Zn) | max | ND | ppm | 2197.0 | 1470.0 | 912.0 |
| | | | | | | |
| Moisture | max | 2.0 | % | - | - | - |
| Density | min | 4.2 | g/cc | - | - | - |
NOTES:
ND: Not defined - based on end user requirements
[1] 2010 API Standard (13A) defined maximum barite (BaSO4) content at 90%.
[2] Pharmaceutical grade based on minimum barite (BaSO4) at 99.5% and total heavy metals less than 10 ppm.
[3] Preliminary standard for chemical, metallurgical and cement industries. Not based on specific end user.
[4] Maximum metal content based on end user specifications.
| | NI43-101 Technical Report and Updated Resource Estimate South Tally Pond Property – Lemarchant Deposit |
| 14.0 | MINERAL RESOURCE ESTIMATE |
The definition of Mineral Resource and associated Mineral Resource categories used in this report are those recognized under NI 43-101 and the CIM Standards (2014). Assumptions, metal threshold parameters and deposit modeling methodologies associated with the current Lemarchant Deposit Mineral Resource Estimate are presented below. The current Mineral Resource Estimate was developed through extensive and ongoing consultation with NorZinc staff and reflects a shared “best information” understanding of mineralized zone geometries and grade trends at the September 20th, 2018 Mineral Resource Estimate effective date.
| 14.2 | Geological Interpretation Used in Resource Estimation |
The Lemarchant Deposit is located in the Tally Pond Volcanic Belt, one of several volcano-sedimentary belts in central Newfoundland that collectively make up the Victoria Lake Supergroup. As described earlier, the Victoria Lake Supergroup consists of a structurally complex, amalgamation of bimodal Cambrian to Ordovician arc-related magmatic and sedimentary rocks and hosts numerous base-metal-bearing volcanogenic-massive-sulphide (VMS) deposits and extensive alteration zones. The Tally Pond Volcanic Belt consists of Cambrian-aged volcanic, volcaniclastic, and sedimentary rocks that extends northeast 50 km long and is up to 10 km wide.
The Lemarchant Deposit is hosted by a north-striking sequence of bimodal submarine felsic volcanic rocks. Zn-Pb-Cu-Au-Ag mineralization of economic interest occurs in association with VMS-style hydrothermal alteration hosted within a 4000 metre by 700 metre sequence of intensely altered rhyolite breccia, flows, and tuffaceous horizons. The semi-massive to massive sulphide mineralization and associated stockwork footwall zones are characterized by a well-developed, barium-enriched, base metal stringer system with moderate to intense quartz-sericite-chlorite to quartz-chlorite alteration. The felsic volcanic rocks are conformably overlain by mafic volcanic rocks to the east, with the contact typically marketed by a pyritic-bearing auriferous mudstone horizon that ranges in thickness from a few centimetres to several metres.
The Lemarchant Deposit has been subject to at least two deformation events. Regional deformation that includes thrusting along the Lemarchant Fault Zone, a ductile shear zone ranging from less than 1 m to 10 m wide, comprises the first deformation phase. This fault strikes south, moderately dips to the west, and has thrust the underlying Lake Ambrose Formation over the Bindons Pond Formation felsic rocks. The second deformation event is characterized by a series of post-mineralization, east-west striking, steeply dipping faults with normal to slight normal-oblique movements, and has been identified as dividing the deposit resulting in the observed offset between the Main Zone and Northwest Zone. Dykes and sills of both mafic and felsic composition post-date VMS mineralization and have intruded the volcanic sequences along with pre-existing structure and lithological contacts.
| | NI43-101 Technical Report and Updated Resource Estimate South Tally Pond Property – Lemarchant Deposit |
| 14.3 | Overview of Estimation Procedure |
The Lemarchant Deposit Mineral Resource Estimate is based on a three-dimensional block model developed using Geovia Surpac ® Version 6.8.1modeling software and is based on 2 areas of volcanogenic massive sulphide style mineralization, the Main Zone and the Northwest Zone, defined by 165 diamond drill holes and 9,452 core samples up to the September 20, 2018 effective date.
Peripheral geological solid model development was a collaborative effort between Mercator and NorZinc staff. The geological solid models reflect nominal minimum included grades of 1 % zinc equivalent of massive to semi-massive sulphide and associated stockwork style mineralization. Drillhole geological assignment of Mineralized, Upper Footwall, Lower Footwall, and Mudstone constrained solid model drillhole intersections and reflect thicknesses ranging 0.20 to 29.30 metres, with an average thickness of 6.17 metres. Strike and dip limits of geological solid models were extended either to modelled 3D fault surfaces, up to 50 metres along strike and down dip from drill hole intercepts, or half the distance to a constraining drill hole if the qualifying grade criterion was not met. A total of 32 geological solid models were developed for the current Mineral Resource Estimate, including 5 for the Main Zone Mineralized, 7 for the Main Zone Upper Footwall, 4 for the Main Zone Lower Footwall, 2 for the Main Zone Mudstone, 6 for the Northwest Zone Mineralized, and 8 for the Northwest Zone Footwall.
Ordinary kriging grade interpolation (OK) methodology was used to assign grades for zinc (%), lead (%), copper (%), gold (g/t), silver (g/t), barite (%) and density (g/cm3) constrained within the domain wireframes. Contributing 1 metre downhole assay composites were capped according to their geological assignment; 36 % zinc, 14.5 g/t gold, and 550 g/t silver in Mineralized, 2.2 % copper, 4.6 g/t gold and 105 g/t silver in Upper Footwall, 4.8 % zinc and 8 g/t silver in Lower Footwall, and 2 % zinc, 5.2 g/t gold and 48 g/t silver in Mudstone. Up to three interpolation passes were applied using progressively increasing ellipsoid ranges to cover the range geological solid model sizes present. Variography assessment was performed for each metal independently, with an average range of 75 metres for the major axis, 50 metres semi-major axis, and 10 metres for the minor axis. Ellipsoid ranges reflect half, equal to, and one and a half times the ranges determined from the variography for the first, second, and third interpolation pass respectively. Ellipsoids are predominantly oriented north to north-west along strike with gentle dips to the east in the Main Zone and moderate dips to west in the Northwest Zone. The minimum number of contributing assay composites required to interpolate block grades was progressively decreased with increasing interpolation pass number. Interpolation pass one, two, and three require a minimum of six, five, and one contributing composites respectively. The maximum number of contributing composites was constrained to fifteen for the first interpolation pass, with no more than five contributing composites from a single drill hole, twelve for the second interpolation pass, with no more than four contributing composites from a single drill hole, and nine for the third interpolation pass, with no more than 4 contributing composites from a single drill hole. Block size is 5 m (x) by 5 m (y) by 5 m (z) with partial percentage volume assignment to estimate block volume. Resource categorization was applied using discrete solid models developed from contributing drill hole and assay composite parameters.
| | NI43-101 Technical Report and Updated Resource Estimate South Tally Pond Property – Lemarchant Deposit |
The drillhole database was received from NorZinc staff through delivery of various exported Excel (.xlsx) spreadsheets from the GEMS™ project database maintained by NorZinc staff. These files provided data for creation of the following separate MS-Access database tables: collar/header, downhole survey, lithology, minor lithology, alteration, mineralization, structure, rock quality designation (RQD), density (g/cm3), and assay including available zinc (%), lead (%) copper (%), gold (g/t), silver (g/t), and barium (%) data sets. The project database is setup in Universal Transverse Mercator (UTM) North American Datum 1983 (NAD83) Zone 21 coordination system.
The Lemarchant database received by Mercator contains 168 surface diamond drill holes for a total of 52,950.4 metres, including 91 completed diamond drill holes, 3 abandoned drillholes due to excessive deviation at the start of the drillhole, and 8 drillhole extensions for a total of 28,674.7 metres that were drilled by NorZinc from 2013 to 2017. The database includes 9,452 core samples, with a total of 1,640 samples from the 80 diamond drill holes that occur within the limits of the current Mineral Resource Estimate solids. Validation checks on overlapping intervals, inconsistent drill hole identifiers, improper lithological assignment, unreasonable assay value assignment, and missing interval data were performed, and no substantive issues were identified. Over 75% of the database analytical entries was also carried out against laboratory records supplied by NorZinc staff. Validation checks and checking of analytical entries did not identify any systematic or substantive errors that would materially affect a Mineral Resource Estimate. By extension, and combined with positive results of the 2017 core check sample program completed by Mercator, it was concluded that the drill hole database population selected for use in the current Mineral Resource estimation program was acceptable for such use.
Laboratory results for water immersion core sample specific gravity determinations included in the drilling database were comprehensively collected for mineralized intervals by Paragon and NorZinc staff for the 2007 through 2017 drilling campaigns and used as density values for Mineral Resource modelling. A total of 2,723 specific gravity determinations are present in the Lemarchant database.
| 14.5 | Data Domains and Solid Modelling |
Terrane Geoscience Inc (TGI) was retained in 2017 by NorZinc to conduct a structural analysis of the Lemarchant Deposit and develop a three-dimensional (3D) fault model for incorporation into the Mineral Resource Estimate. The results of the structural analysis as provided by TGI are as follows:
“[The Lemarchant] deposit has been subject to at least two deformation events. D1 structures comprise the Lemarchant Fault Zone, a broad ductile shear zone, and surrounding pervasive S1 foliation and close to tight F1 folds preserved in selective units. The orientation of the Lemarchant Fault based on drillhole intercepts shows a consistent orientation averaging 170°/33° in the Main Zone and steeping slightly to 45° in the Northwest Zone. The Northwest Zone also exhibits evidence of multiple sub-parallel splays to the main fault zone that were not observed outside elsewhere. Movement along the individual splays may, in part, be responsible for the structural complexity in the Northwest Zone relative to the Main Zone and explain the divergent orientation of the metalliferous mudstone.
| | NI43-101 Technical Report and Updated Resource Estimate South Tally Pond Property – Lemarchant Deposit |
Extensional tectonics during D2 resulted in late-stage brittle normal faulting that has dividing the Lemarchant into the Main and Northwest Zones. These faults cut all earlier ductile structures as well as the mafic dykes. Modelled orientations show two populations of D2 faults: 1) a NW-striking, NE-dipping set with an average orientation of 290°/60°, and 2) a SE-striking, SW-dipping 120°/68° set. The transition from NE to SW dip marks the southern boundary a broad structural corridor termed the Northwest Deformation Zone which is host to the Northwest Zone mineralization”
TGI developed a 3D model in Leapfrog GEO modelling software of major structures that outline the basic structural framework of the deposit. At total of 10 faults surfaces were developed for the D1structures and a total of 6 faults surfaces were developed for the D2 structures (Figure 14-1). The 3D fault model was used to constrain geological solid modelling where appropriate.
Figure 14-1: Isometric view to the northwest of the 3D fault surfaces (D1 = Red, D2 = Blue)
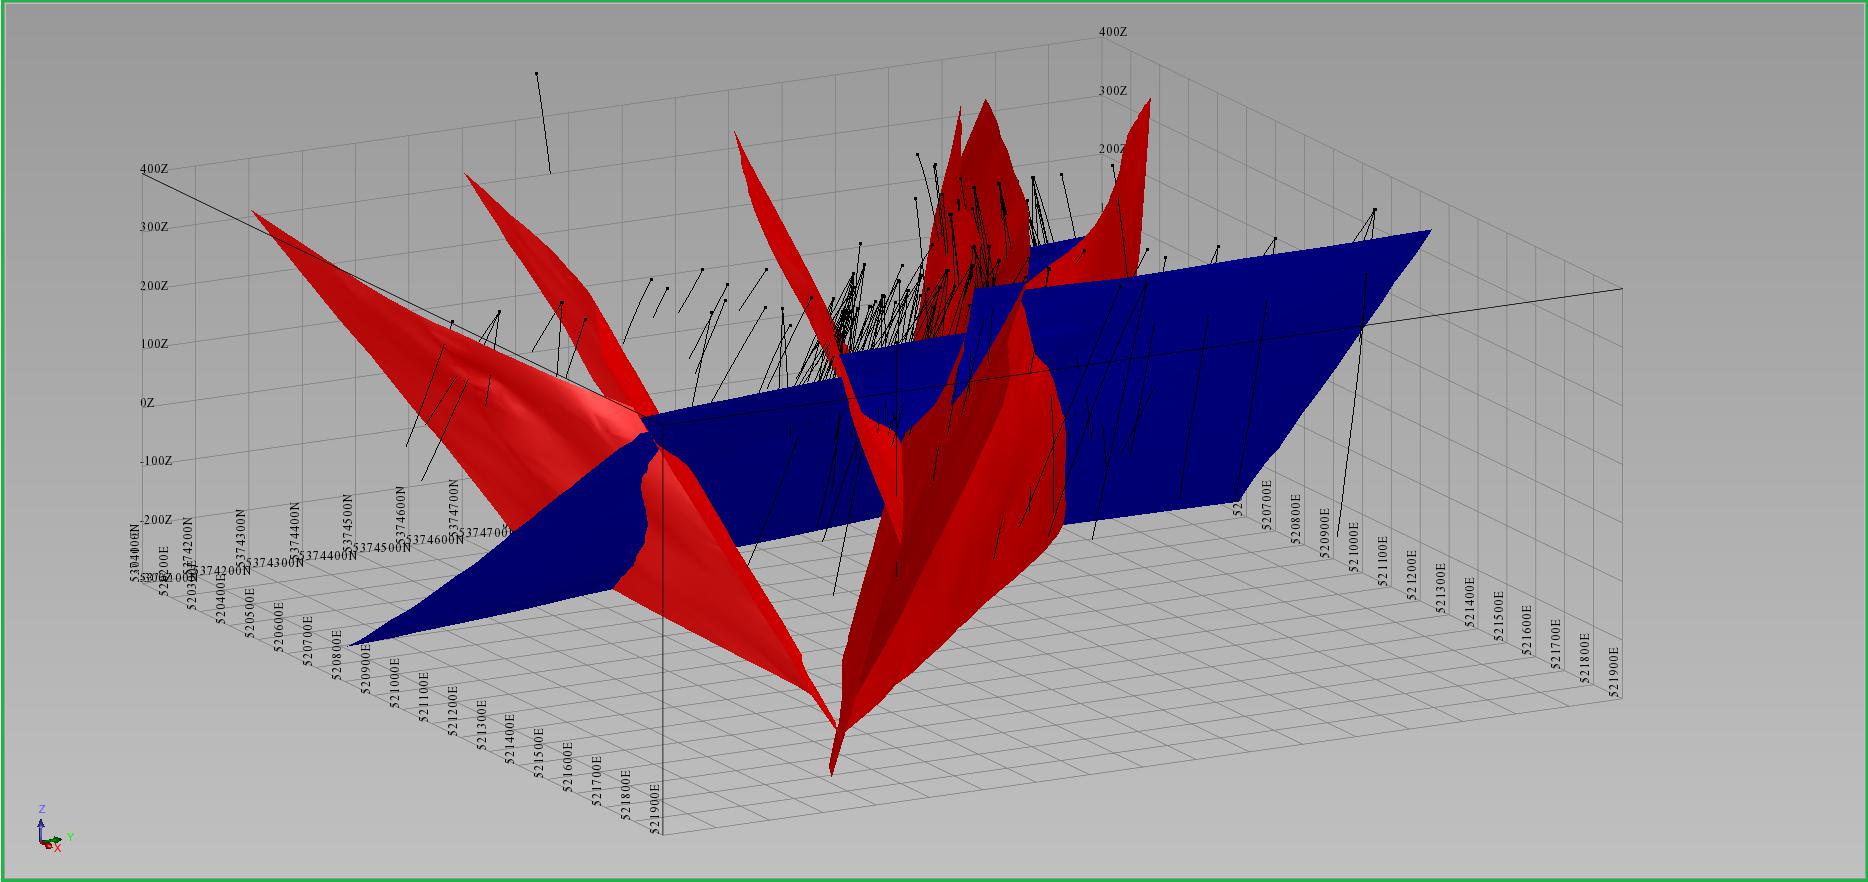
The procedure for developing the geological solid models, which define the peripheral limits and included volume for the Mineral Resource Estimate, consisted of a collaborative process between NorZinc staff and Mercator. NorZinc staff first created a solid model for each geological unit present in each zone at the 1 % zinc equivalent cut-off grade. These solid models were delivered to Mercator for consultative review and were subsequently returned to NorZinc for revision. The revised solid models by NorZinc were provided to Mercator for a final consultative review, revision and formatting. NorZinc staff performed all solid modelling within the Geovia GEMS™ modelling software and Mercator performed all respective review and revisions in Geovia Surpac ® Version 6.8.1modelingsoftware. Solid models deemed acceptable to both Mercator and NorZinc staff after combined review were used to estimate block volume and to constrain block model grade interpolations for Mineral Resource Estimate purposes. The solid models were used to define included downhole assay composite intercepts from drill hole database sampling records.
| | NI43-101 Technical Report and Updated Resource Estimate South Tally Pond Property – Lemarchant Deposit |
The geological solid models reflect modeling of massive to semi-massive sulphide intervals, adjacent footwall intervals with stockwork style sulphide mineralization, and an overlying mudstone unit enriched in gold with minor sulphide mineralization. These intervals have been categorized as Mineralized (massive to semi-massive sulphide), Upper Footwall (directly adjacent footwall mineralization), Lower Footwall, (below Upper Footwall mineralization), and Mudstone.
Nominal minimum included grades reflect 1 % zinc equivalent over minimum widths of the respective geological unit. Solid model downhole thickness averages and ranges are presented in Table 14-1. Lower Footwall and Mudstone units are not supported at the current minimum grade criterion in the Northwest Zone.
Table 14-1: Downhole thickness (m) of the Mineral Resource solid models
| | Downhole Thickness (m) |
| Zone | Unit | Minimum | Maximum | Average |
| Main | Mineralized | 0.20 | 26.85 | 5.74 |
| Upper Footwall | 0.49 | 29.30 | 7.46 |
| Lower Footwall | 1.10 | 25.26 | 8.50 |
| Mudstone | 0.35 | 9.15 | 1.77 |
| Northwest | Mineralized | 0.20 | 27.60 | 7.56 |
| Footwall | 1.55 | 21.78 | 9.04 |
Strike and dip limits of geological solid models were extended either to modelled 3D fault surfaces, up to 50 metres along strike and down dip from drill hole intercepts, or half the distance to a constraining drill hole if the qualifying grade criterion was not met. A total of 32 geological solid models were developed for the current Mineral Resource Estimate (Figure 14-2, 14-3, 14-8) , including 5 for the Main Zone Mineralized (Figure 14-4) , 7 for the Main Zone Upper Footwall (Figure 14-5), 4 for the Main Zone Lower Footwall (Figure 14-6), 2 for the Main Zone Mudstone (14-7), 6 for the Northwest Zone Mineralized (Figure 14-9), and 8 for the Northwest Zone Footwall (Figure 14-10).
| | NI43-101 Technical Report and Updated Resource Estimate South Tally Pond Property – Lemarchant Deposit |
Figure 14-2: Isometric view to the southwest of the Mineral Resource geological solid models (Red = Mineralized, Blue = Upper Footwall, Cyan = Lower Footwall, Yellow = Mudstone)
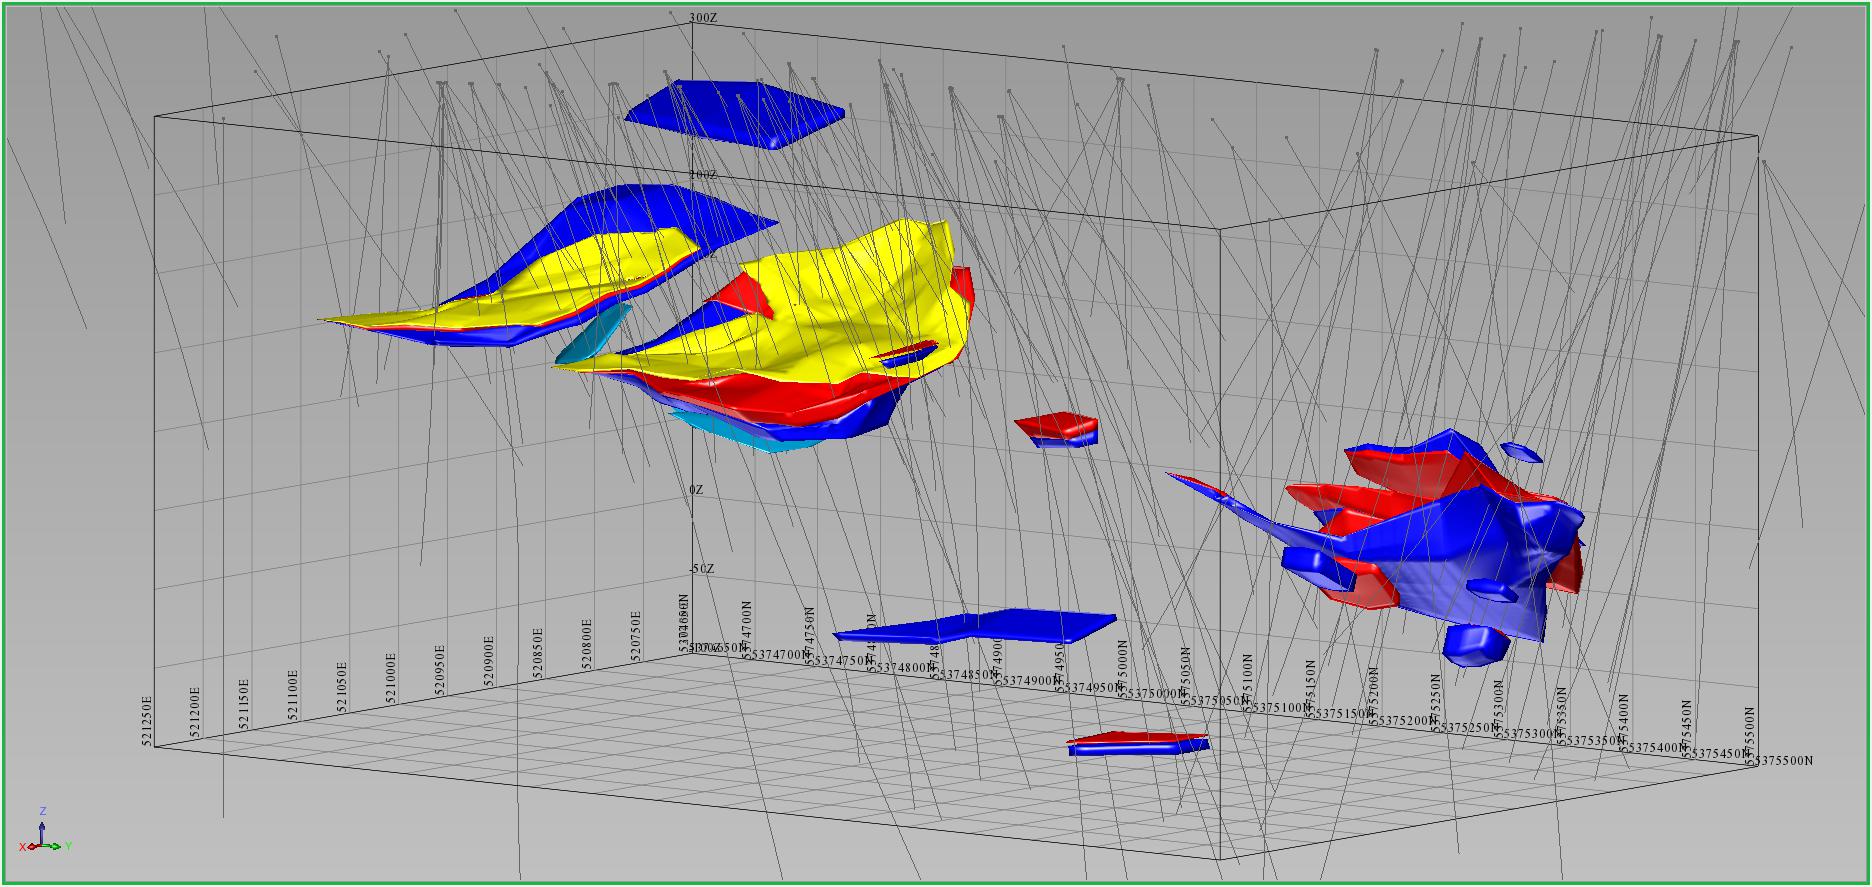
Figure 14-3: Isometric view to the northwest of the Mineral Resource Main Zone geological solid models (Red = Mineralized, Blue = Upper Footwall, Cyan = Lower Footwall, Yellow = Mudstone)
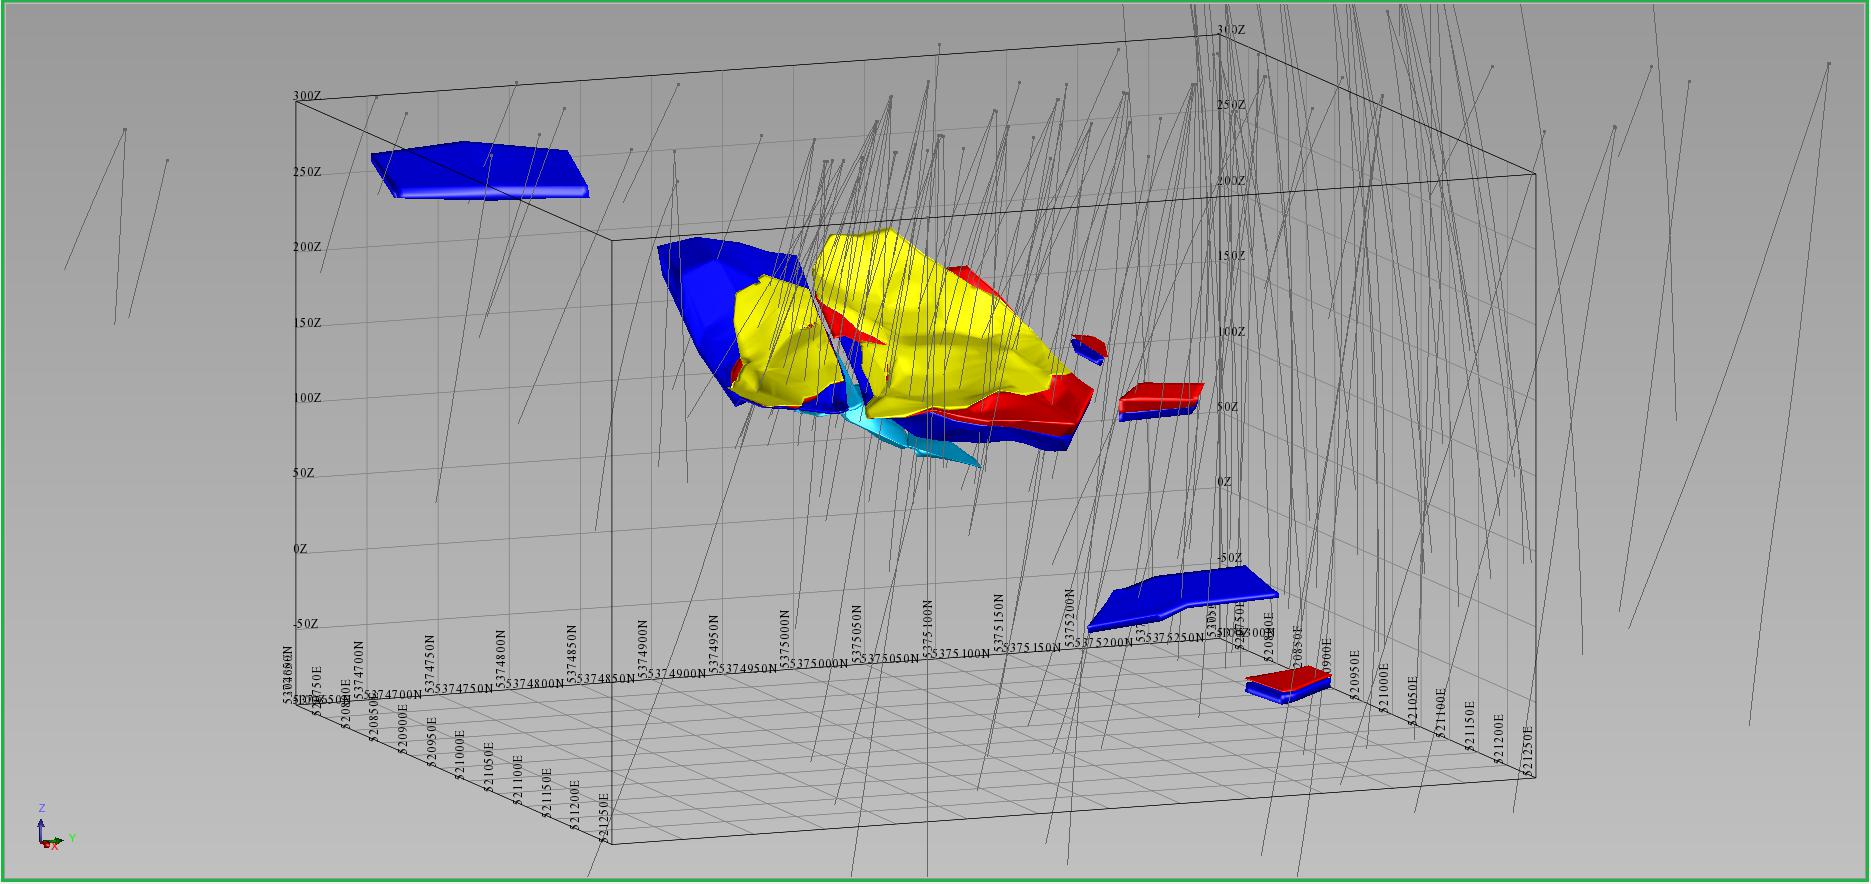
| | NI43-101 Technical Report and Updated Resource Estimate South Tally Pond Property – Lemarchant Deposit |
Figure 14-4: Isometric view to the northwest of the Mineral Resource Main Zone Mineralized solid model
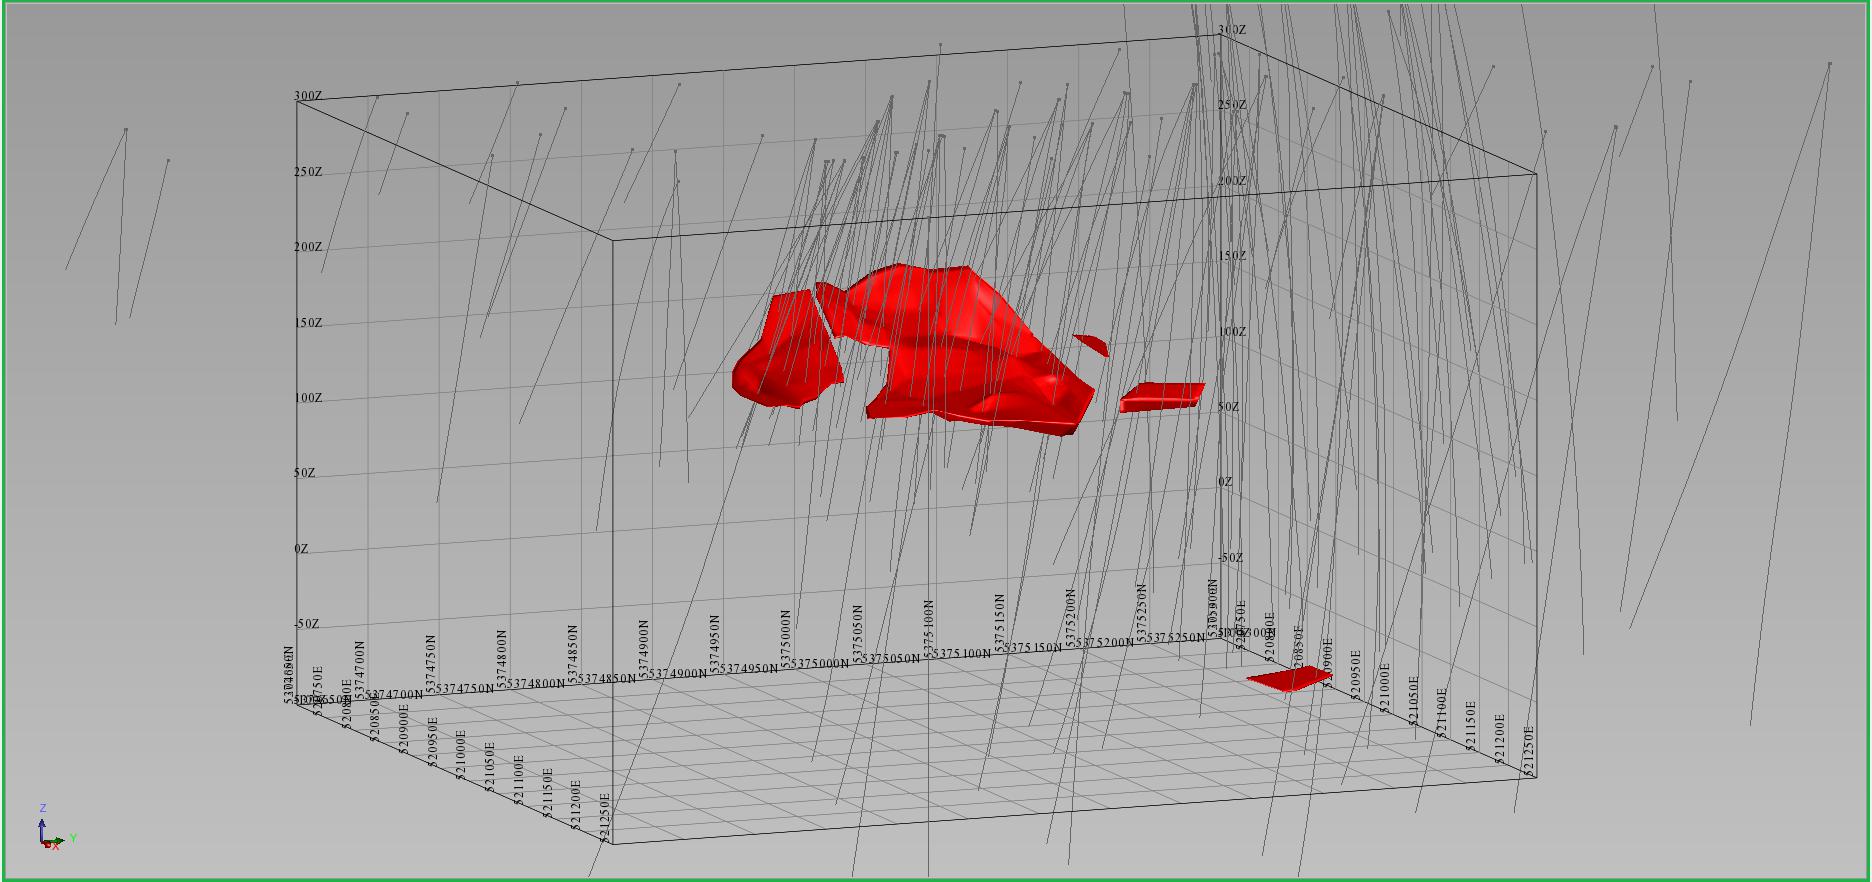
Figure 14-5: Isometric view to the northwest of the Mineral Resource Main Zone Upper Footwall solid model
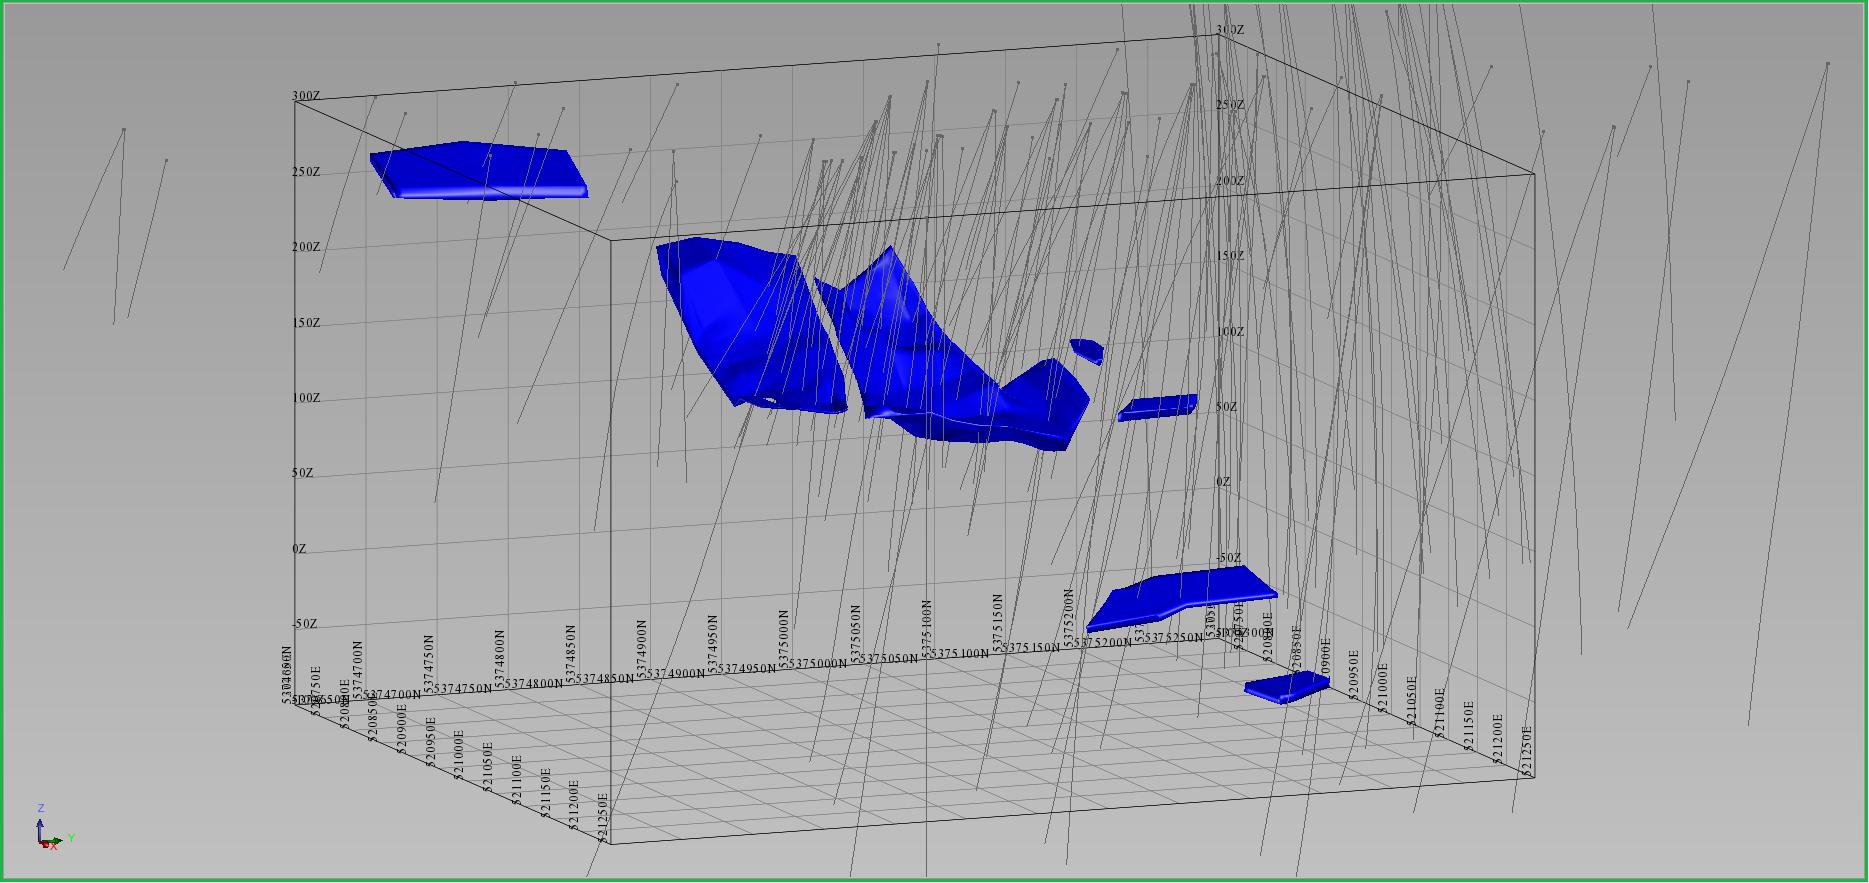
| | NI43-101 Technical Report and Updated Resource Estimate South Tally Pond Property – Lemarchant Deposit |
Figure 14-6: Isometric view to the northwest of the Mineral Resource Main Zone Lower Footwall solid model
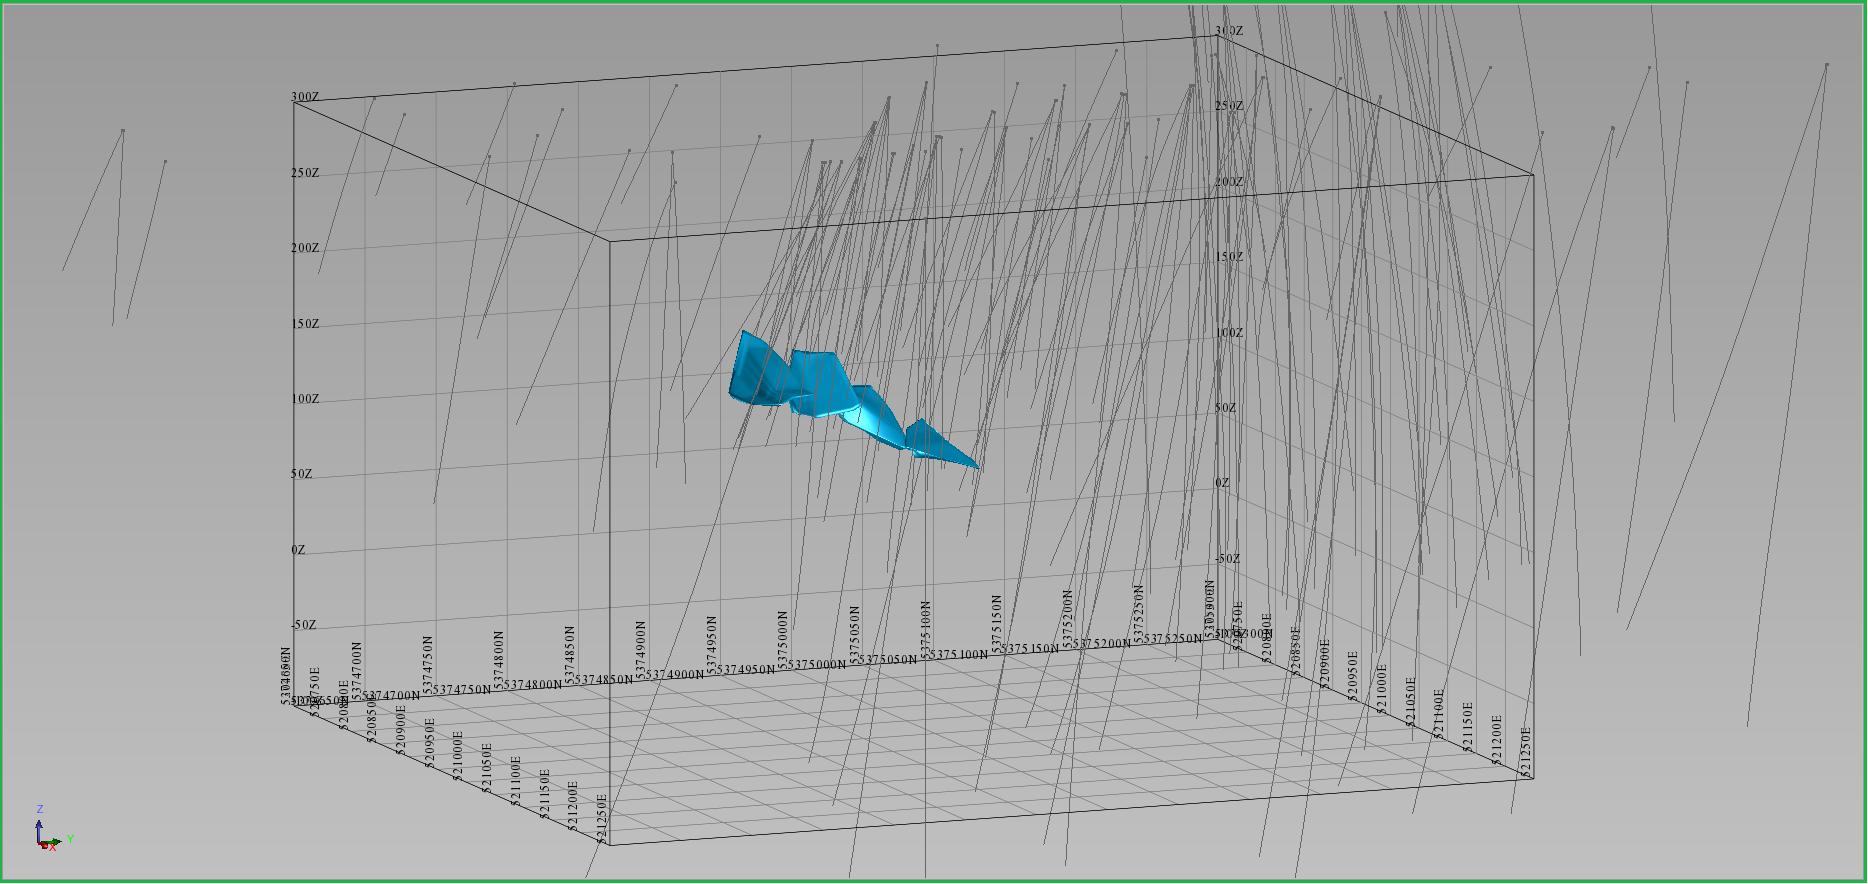
Figure 14-7: Isometric view to the northwest of the Mineral Resource Main Zone Mudstone solid model
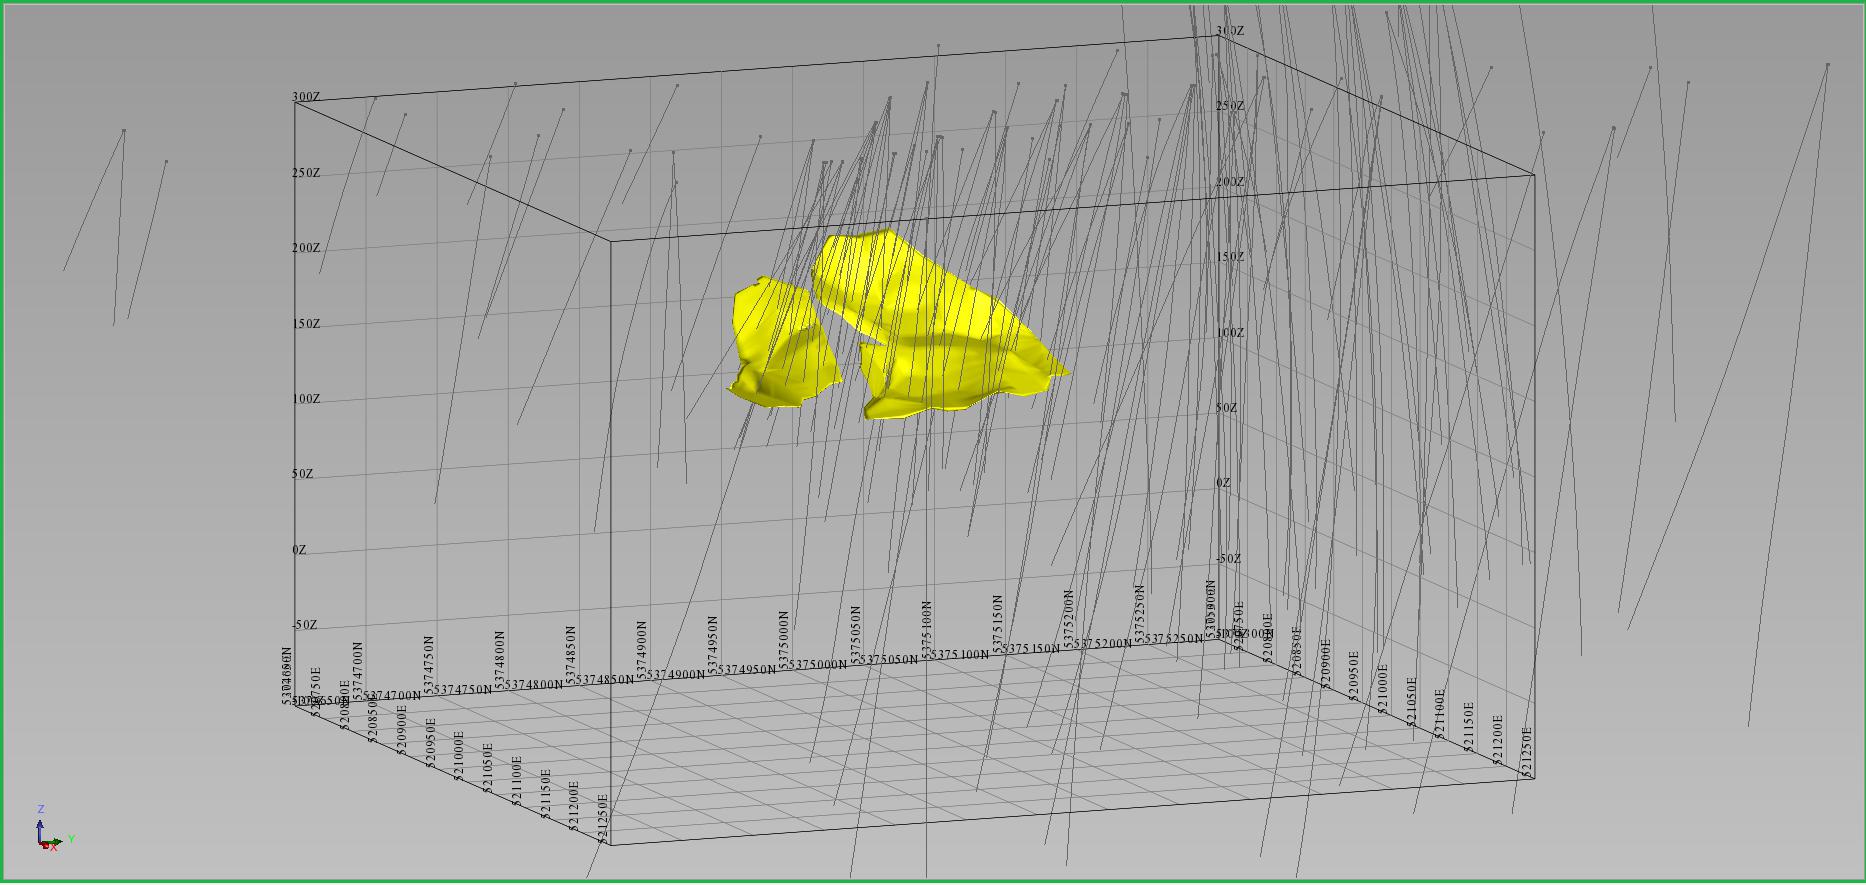
| | NI43-101 Technical Report and Updated Resource Estimate South Tally Pond Property – Lemarchant Deposit |
Figure 14-8: Isometric view to the southeast of the Mineral Resource Northwest Zone geological solid models (Red = Mineralized, Blue = Upper Footwall)
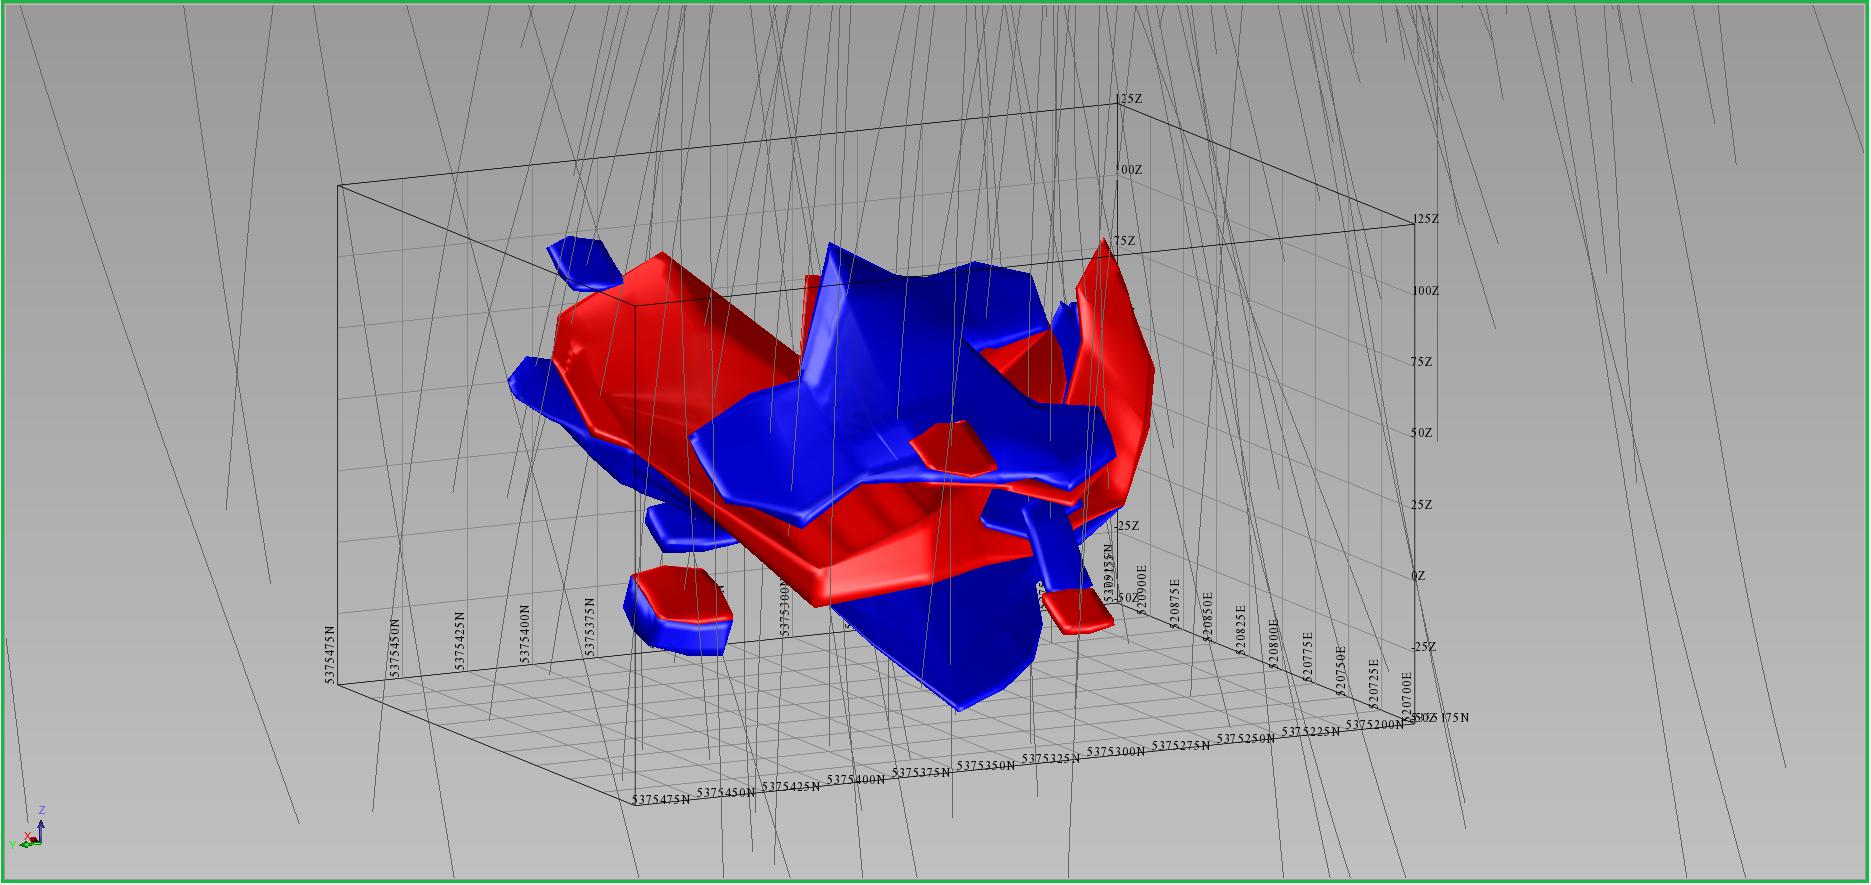
Figure 14-9: Isometric view to the southeast of the Mineral Resource Northwest Zone Mineralized solid model
| | NI43-101 Technical Report and Updated Resource Estimate South Tally Pond Property – Lemarchant Deposit |
Figure 14-10: Isometric view to the southeast of the Mineral Resource Northwest Zone Footwall solid model
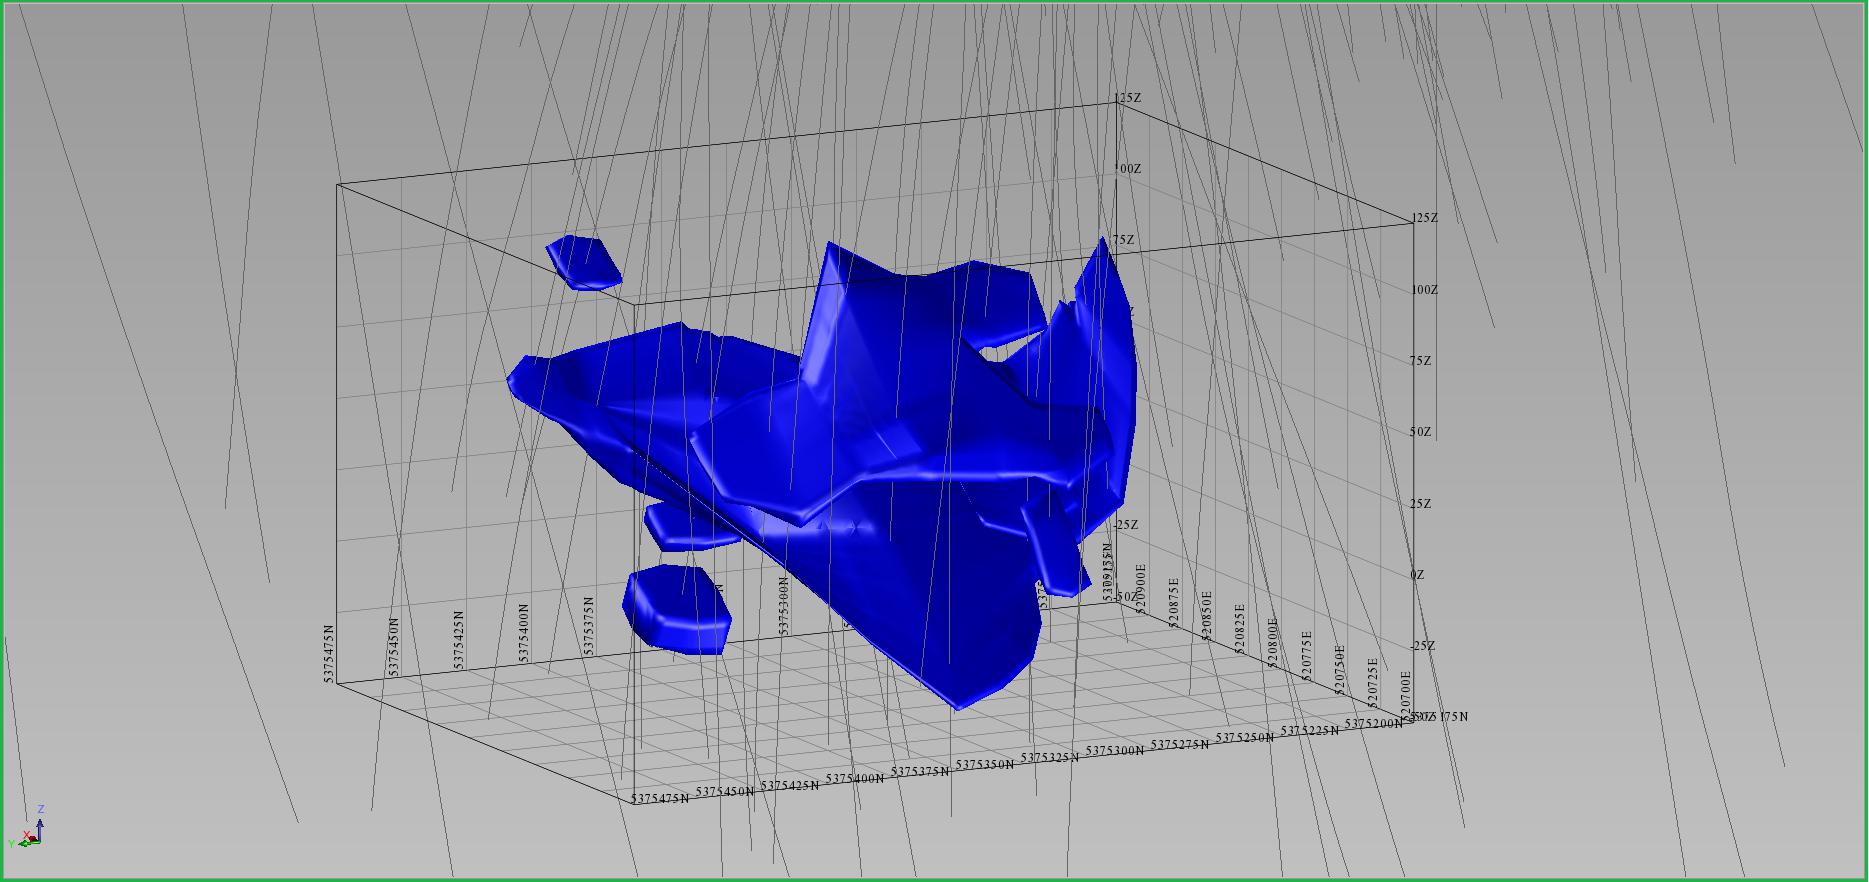
| 14.6 | Drill Core Assays and High Grade Capping |
To facilitate compositing of downhole assay data, a drill hole intercept table consisting of drillhole intervals to be composited for each area was created using solid model drillhole intersections. Assay sample length statistics showed a mean length of 0.82 m with a minimum length of 0.20 m and maximum length of 2.00 m. Downhole assay composites measuring 1 m in length, constrained to the drill hole intercepts for each area, were therefore created for zinc, lead, copper, gold, silver, barium and specific gravity (as density) using Surpac’s “best-fit” method (Table 14-2 through 14-5). Minimum and maximum acceptable composite lengths were selected at 0.70 m and 1.25 m respectively and composites created outside the minimum and maximum support thresholds were manually modified to meet the selected criterion.
A total of 1,242 assay composites were created with lengths ranging from 0.70 m to 1.23 m and a mean length of 0.99 m. Included un-sampled intervals were diluted to “0 %” (zero %) grade for zinc, lead, copper, gold and barium. Barium results are only present in the Mineralized unit and therefore barium was not composited or interpolated in the Footwall and Mudstones units. Density data are available for approximately 96 % of the included drillhole lengths and areas without available density were left blank. Assay composite descriptive statistics were reviewed each for Mineralized, Upper Footwall, Lower Footwall, and Mudstone units.
| | NI43-101 Technical Report and Updated Resource Estimate South Tally Pond Property – Lemarchant Deposit |
Contributing 1 m downhole assay composites were capped according to their geological assignment; 36 % zinc, 14.5 g/t gold, and 550 g/t silver in Mineralized, 2.2 % copper, 4.6 g/t gold and 105 g/t silver in Upper Footwall, 4.8 % zinc and 8 g/t silver in Lower Footwall, and 2 % zinc, 5.2 g/t gold and 48 g/t silver in Mudstone (Table 14-6 through 14-9). A total of 31 values were capped in the 1 m down hole assay composite dataset: 3 zinc values, 3 gold values, and 6 silver values in the Main Zone Mineralized; 1 gold value in the Northwest Zone Mineralized; 1 copper value, 2 gold values, and 2 silver values in the Main Upper Footwall; no values in the Northwest Footwall Zone; 2 zinc values and 5 silver values in the Main Zone Lower Footwall; and 2 zinc values, 3 gold values, and 1 silver value in the Main zone Mudstone.
Table 14-2: Lemarchant Mineralized zinc, lead, copper, gold, silver, barium and density raw statistics
| Parameter | Zn % | Pb % | Cu % | Au g/t | Ag g/t | Ba % | Density g/cm3 |
| Mean Grade | 8.28 | 2.13 | 0.82 | 1.37 | 89.60 | 17.71 | 3.72 |
| Maximum Grade | 48.19 | 15.27 | 5.76 | 23.62 | 3014.30 | 58 | 4.47 |
| Minimum Grade | 0 | 0 | 0 | 0 | 0 | 0 | 2.65 |
| Variance | 77.58 | 6.11 | 0.80 | 5.63 | 39,746.97 | 488.84 | 0.36 |
| Standard Deviation | 8.81 | 2.47 | 0.89 | 2.37 | 199.37 | 22.11 | 0.60 |
| Coefficient of Variation | 1.06 | 1.16 | 1.08 | 1.73 | 2.23 | 1.25 | 0.16 |
| Number of Samples | 425 | 425 | 425 | 425 | 425 | 425 | 422 |
Table 14-3: Lemarchant Upper Footwall zinc, lead, copper, gold, silver, and density raw statistics
| Parameter | Zn % | Pb % | Cu % | Au g/t | Ag g/t | Ba % | Density g/cm3 |
| Mean Grade | 1.94 | 0.23 | 0.23 | 0.29 | 12.1 | | 2.82 |
| Maximum Grade | 12.8 | 3.88 | 7.51 | 7.14 | 897.43 | | 3.53 |
| Minimum Grade | 0 | 0 | 0 | 0 | 0 | | 2.35 |
| Variance | 4.405 | 0.20 | 0.17 | 0.37 | 1522.41 | | 0.02 |
| Standard Deviation | 2.01 | 0.45 | 0.41 | 0.61 | 39.02 | | 0.13 |
| Coefficient of Variation | 1.04 | 1.93 | 1.78 | 2.10 | 3.23 | | 0.05 |
| Number of Samples | 607 | 607 | 607 | 607 | 607 | | 572 |
| | NI43-101 Technical Report and Updated Resource Estimate South Tally Pond Property – Lemarchant Deposit |
Table 14-4: Lemarchant Lower Footwall zinc, lead, copper, gold, silver, and density raw statistics
| Parameter | Zn % | Pb % | Cu % | Au g/t | Ag g/t | Ba % | Density g/cm3 |
| Mean Grade | 1.46 | 0.07 | 0.24 | 0.10 | 2.49 | | 2.79 |
| Maximum Grade | 11.32 | 2.16 | 2.57 | 0.545 | 24.9 | | 2.94 |
| Minimum Grade | 0.01 | 0 | 0 | 0 | 0.20 | | 2.66 |
| Variance | 1.94 | 0.06 | 0.12 | 0.01 | 10.63 | | 0.00 |
| Standard Deviation | 1.39 | 0.24 | 0.34 | 0.09 | 3.26 | | 0.05 |
| Coefficient of Variation | 0.96 | 3.40 | 1.46 | 0.86 | 1.31 | | 0.02 |
| Number of Samples | 129 | 129 | 129 | 129 | 129 | | 123 |
Table 14-5: Lemarchant Mudstone zinc, lead, copper, gold, silver, and density raw statistics
| Parameter | Zn % | Pb % | Cu % | Au g/t | Ag g/t | Ba % | Density g/cm3 |
| Mean Grade | 0.38 | 0.06 | 0.25 | 1.64 | 11.27 | | 3.30 |
| Maximum Grade | 7.30 | 1.60 | 4.58 | 11.58 | 94.29 | | 3.78 |
| Minimum Grade | 0 | 0 | 0 | 0 | 0 | | 2.77 |
| Variance | 1.18 | 0.04 | 0.47 | 3.61 | 204.25 | | 0.05 |
| Standard Deviation | 1.08 | 0.19 | 0.69 | 1.90 | 14.29 | | 0.23 |
| Coefficient of Variation | 2.86 | 3.02 | 2.69 | 1.16 | 1.27 | | 0.07 |
| Number of Samples | 81 | 81 | 81 | 81 | 81 | | 79 |
Table 14-6: Lemarchant Mineralized zinc, lead, copper, gold, silver, barium and density capped statistics
| Parameter | Zn % | Pb % | Cu % | Au g/t | Ag g/t | Ba % | Density g/cm3 |
| Mean Grade | 8.22 | 2.13 | 0.82 | 1.33 | 78.17 | 17.72 | 3.72 |
| Maximum Grade | 36 | 15.27 | 5.76 | 14.5 | 550 | 58 | 4.47 |
| Minimum Grade | 0 | 0 | 0 | 0 | 0 | 0 | 2.65 |
| Variance | 73.83 | 6.11 | 0.80 | 4.23 | 10,630.67 | 488.84 | 0.36 |
| Standard Deviation | 8.60 | 2.47 | 0.89 | 2.06 | 103.11 | 22.11 | 0.60 |
| Coefficient of Variation | 1.05 | 1.16 | 1.08 | 1.56 | 1.32 | 1.24 | 0.16 |
| Number of Samples | 425 | 425 | 425 | 425 | 425 | 425 | 422 |
| | NI43-101 Technical Report and Updated Resource Estimate South Tally Pond Property – Lemarchant Deposit |
Table 14-7: Lemarchant Upper Footwall zinc, lead, copper, gold, silver, and density capped statistics
| Parameter | Zn % | Pb % | Cu % | Au g/t | Ag g/t | Ba % | Density g/cm3 |
| Mean Grade | 1.94 | 0.23 | 0.22 | 0.28 | 10.69 | | 2.82 |
| Maximum Grade | 12.8 | 3.88 | 2.2 | 4.6 | 105 | | 3.53 |
| Minimum Grade | 0 | 0 | 0 | 0 | 0 | | 2.35 |
| Variance | 4.05 | 0.20 | 0.09 | 2.89 | 255.04 | | 0.02 |
| Standard Deviation | 2.01 | 0.45 | 0.30 | 0.54 | 15.00 | | 0.13 |
| Coefficient of Variation | 1.04 | 1.93 | 1.34 | 1.89 | 1.40 | | 0.05 |
| Number of Samples | 607 | 607 | 607 | 607 | 607 | | 572 |
Table 14-8: Lemarchant Lower Footwall zinc, lead, copper, gold, silver, and density capped statistics
| Parameter | Zn % | Pb % | Cu % | Au g/t | Ag g/t | Ba % | Density g/cm3 |
| Mean Grade | 1.38 | 0.07 | 0.24 | 0.10 | 2.18 | | 2.79 |
| Maximum Grade | 4.8 | 2.16 | 2.57 | 0.55 | 8.00 | | 2.94 |
| Minimum Grade | 0.01 | 0 | 0 | 0 | 0.20 | | 2.66 |
| Variance | 1.16 | 0.06 | 0.12 | 0.01 | 3.46 | | 0.00 |
| Standard Deviation | 1.08 | 0.24 | 0.34 | 0.09 | 1.86 | | 0.05 |
| Coefficient of Variation | 0.78 | 3.40 | 1.46 | 0.86 | 0.85 | | 0.02 |
| Number of Samples | 129 | 129 | 129 | 129 | 129 | | 123 |
Table 14-9: Lemarchant Mudstone zinc, lead, copper, gold, silver, and density capped statistics
| Parameter | Zn % | Pb % | Cu % | Au g/t | Ag g/t | Ba % | Density g/cm3 |
| Mean Grade | 0.26 | 0.06 | 0.025 | 1.51 | 10.70 | | 3.30 |
| Maximum Grade | 2.0 | 1.60 | 4.58 | 5.2 | 48 | | 3.78 |
| Minimum Grade | 0 | 0 | 0 | 0 | 0 | | 2.77 |
| Variance | 0.19 | 0.04 | 0.48 | 1.97 | 135.49 | | 0.05 |
| Standard Deviation | 0.43 | 0.19 | 0.69 | 1.40 | 11.64 | | 0.23 |
| Coefficient of Variation | 1.67 | 3.02 | 2.69 | 0.93 | 1.09 | | 0.07 |
| Number of Samples | 81 | 81 | 81 | 81 | 81 | | 79 |
| | NI43-101 Technical Report and Updated Resource Estimate South Tally Pond Property – Lemarchant Deposit |
| 14.7 | Variography and Interpolation Parameters |
Mercator prepared experimental downhole variograms for the Lemarchant Deposit from the respective 1 m assay composite dataset and completed experimental directional variograms for the Main Zone area. The Main Zone area is defined by systematic drill spacing predominantly from 2007 - 2017 drill programs and is less structurally complex than the Northwest Zone. As such, it was felt that the area could provide informative and representative grade distribution and continuity results. Experimental variograms were created for zinc, lead, copper, gold, silver and barium independently.
Good spherical model results were obtained for experimental downhole variograms, thereby providing assessment of global nugget values and providing a basis of consideration for interpolation ellipsoid minor axis ranges (Figure 14-11 through 14-16). Best experimental variogram results for the major axis and semi-major axis of continuity are presented in Table 14-10 for each individual metal. Average ranges of all assessed metals reflect 75 m for the major axis continuity and 50 m for the semi-major axis of continuity, showing trends with shallow to moderate plunges along strike and/or in the dip direction (Figure 14-7 through 14-22).
Table 14-10: Summary Lemarchant experimental variogram results for zinc, lead, copper, gold, silver, and barium
| | Range (m) | Orientation |
| Attribute | Nugget | Sill | Major | Semi-major | Minor | Bearing | Plunge | Dip |
| Zn | 0.10 | 0.90 | 70 | 45 | 10 | 340 | -5 | -11 |
| Pb | 0.20 | 0.80 | 80 | 45 | 10 | 350 | -5 | -11 |
| Cu | 0.15 | 0.85 | 55 | 35 | 10 | 350 | -5 | -11 |
| Au | 0.10 | 0.90 | 120 | 80 | 10 | 120 | -5 | 20 |
| Ag | 0.20 | 0.80 | 80 | 70 | 10 | 220 | 15 | 11 |
| Ba | 0.10 | 0.90 | 55 | 40 | 10 | 220 | 15 | 0 |
| | NI43-101 Technical Report and Updated Resource Estimate South Tally Pond Property – Lemarchant Deposit |
Figure 14-11: Downhole experimental variogram of zinc assay composites for Main Zone
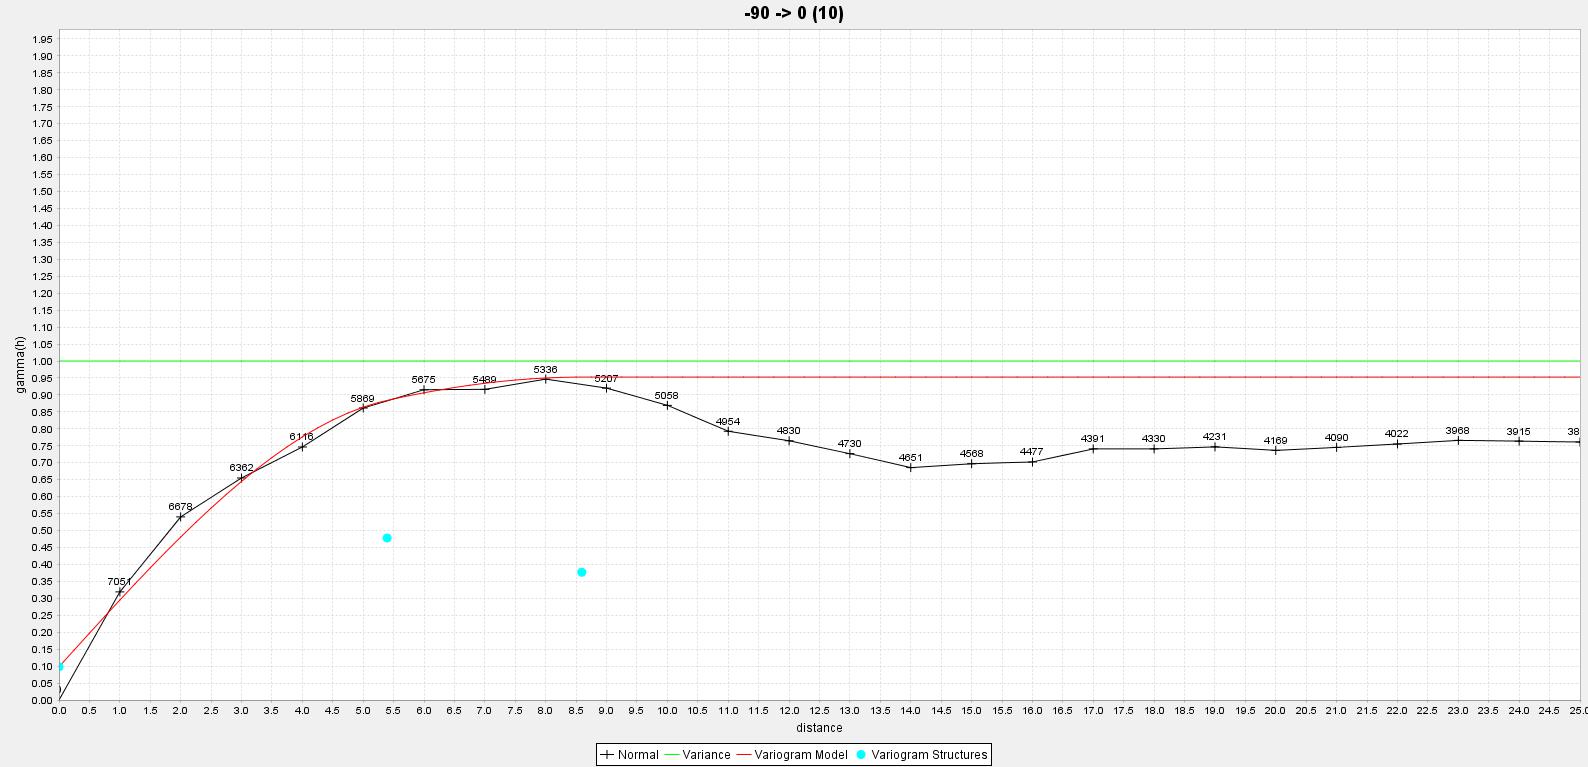
Figure 14-12: Downhole experimental variogram of lead assay composites for Main Zone
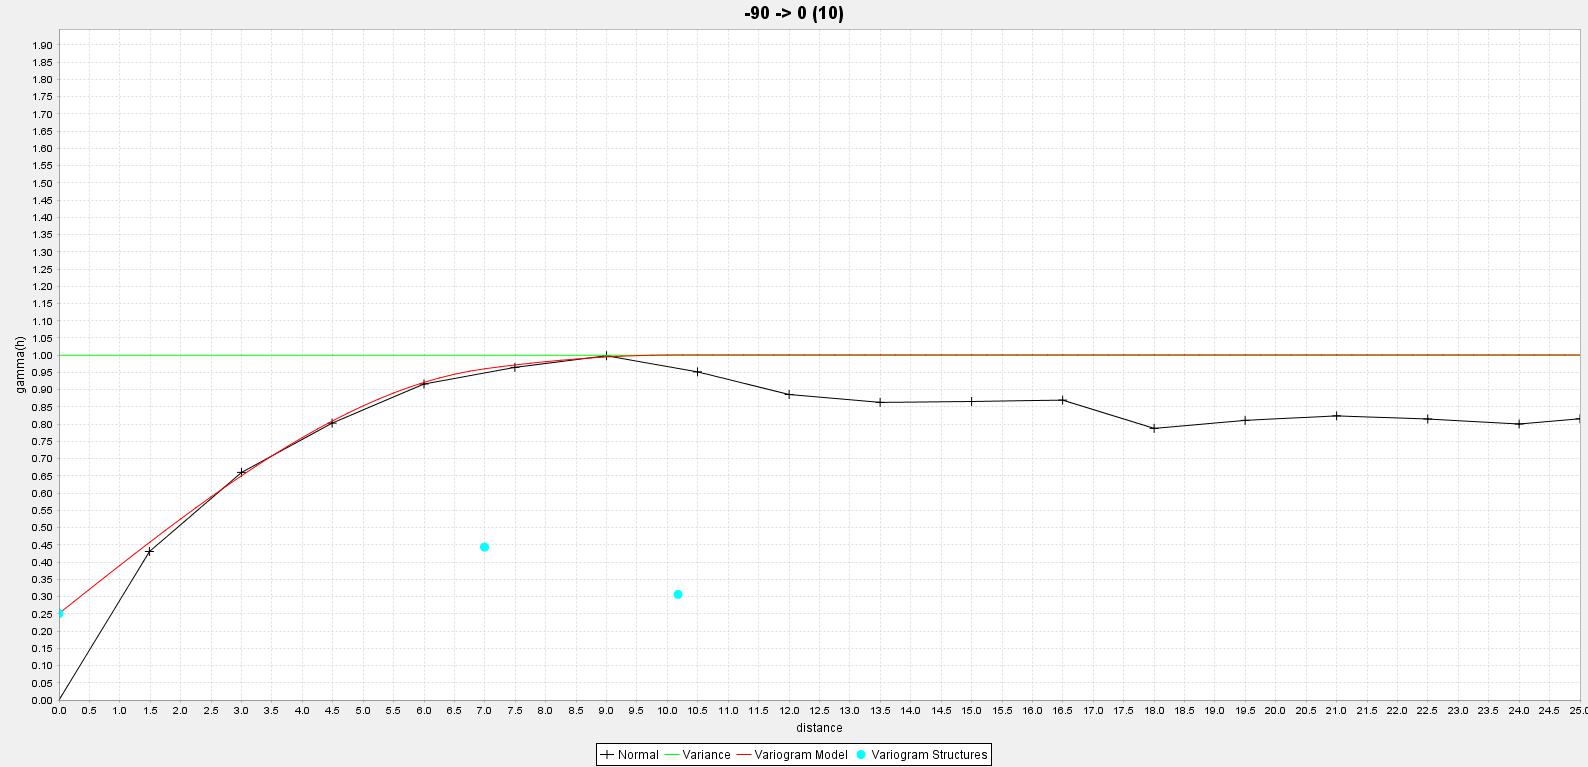
| | NI43-101 Technical Report and Updated Resource Estimate South Tally Pond Property – Lemarchant Deposit |
Figure 14-13: Downhole experimental variogram of copper assay composites for Main Zone
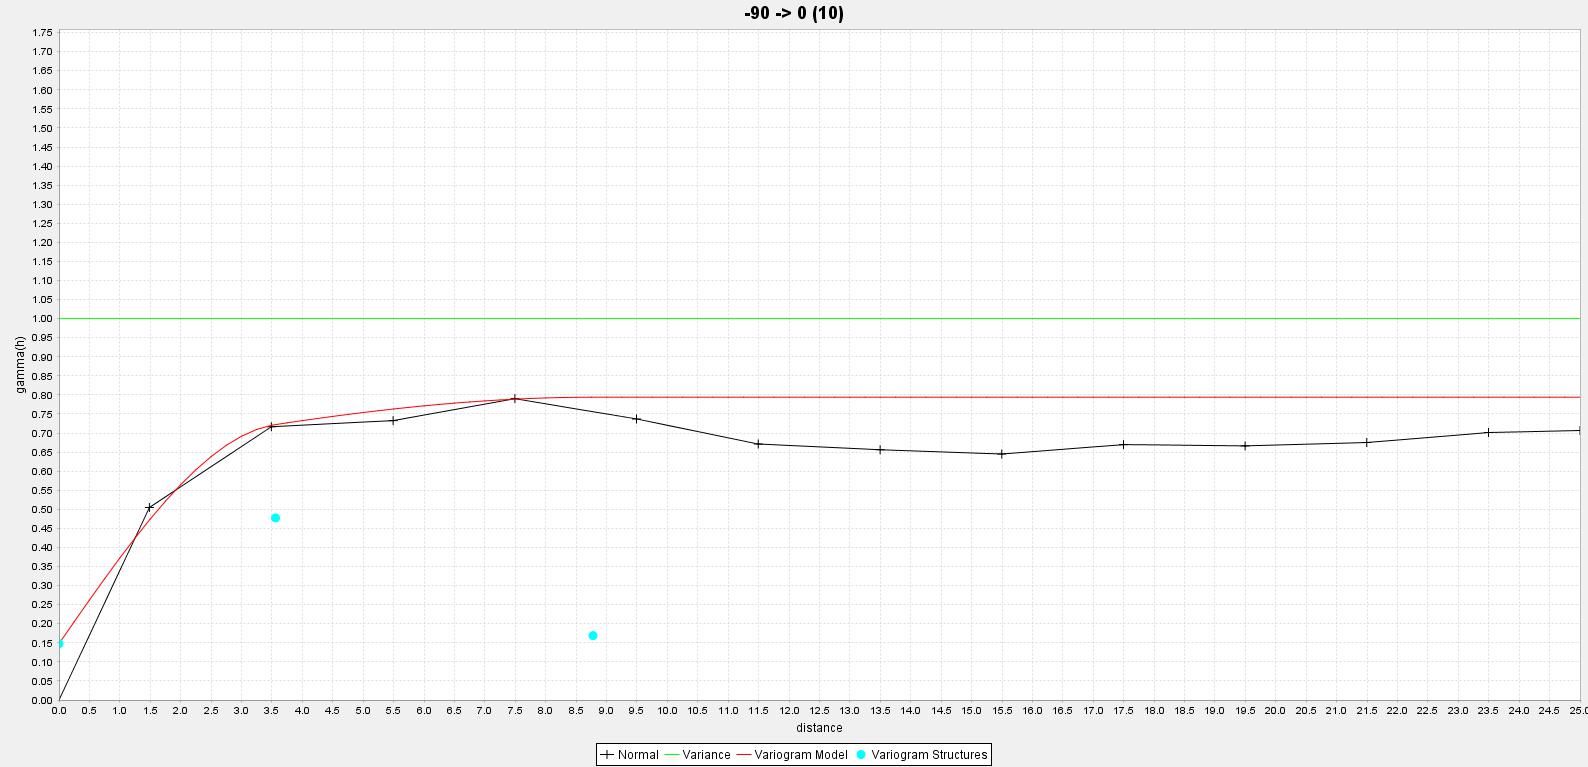
Figure 14-14: Downhole experimental variogram of gold assay composites for Main Zone
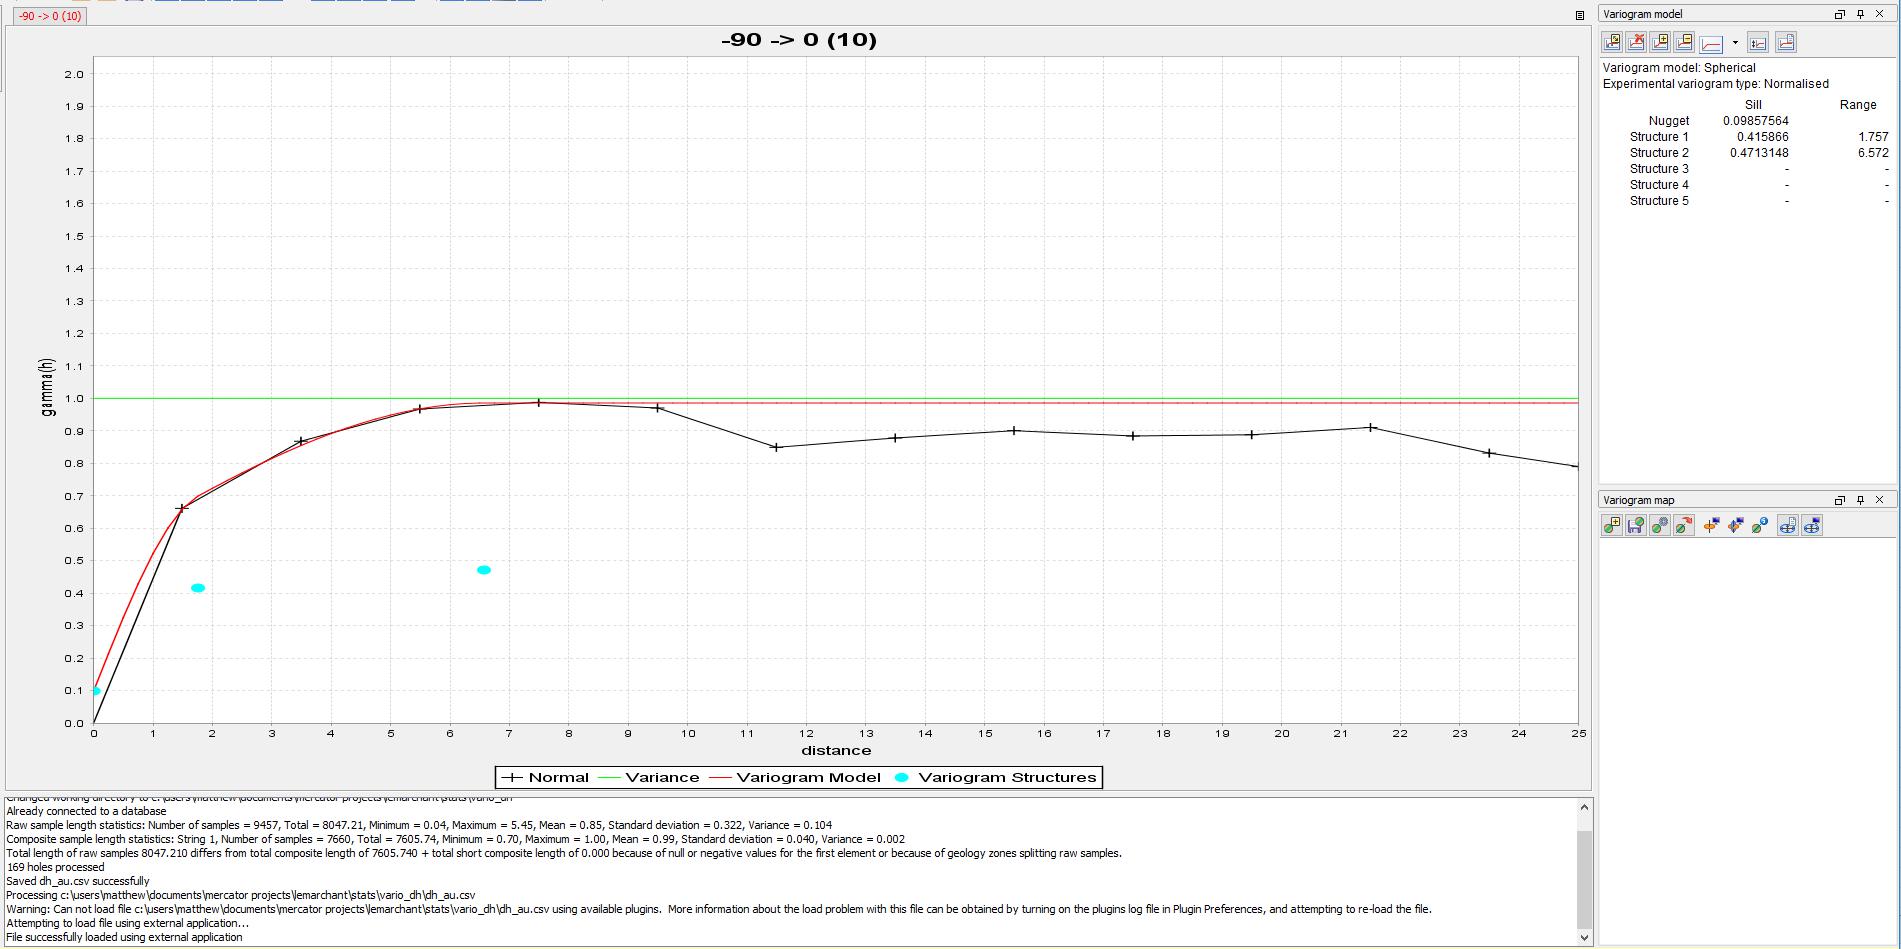
| | NI43-101 Technical Report and Updated Resource Estimate South Tally Pond Property – Lemarchant Deposit |
Figure 14-15: Downhole experimental variogram of silver assay composites for Main Zone

Figure 14-16: Downhole experimental variogram of barium assay composites for Main Zone
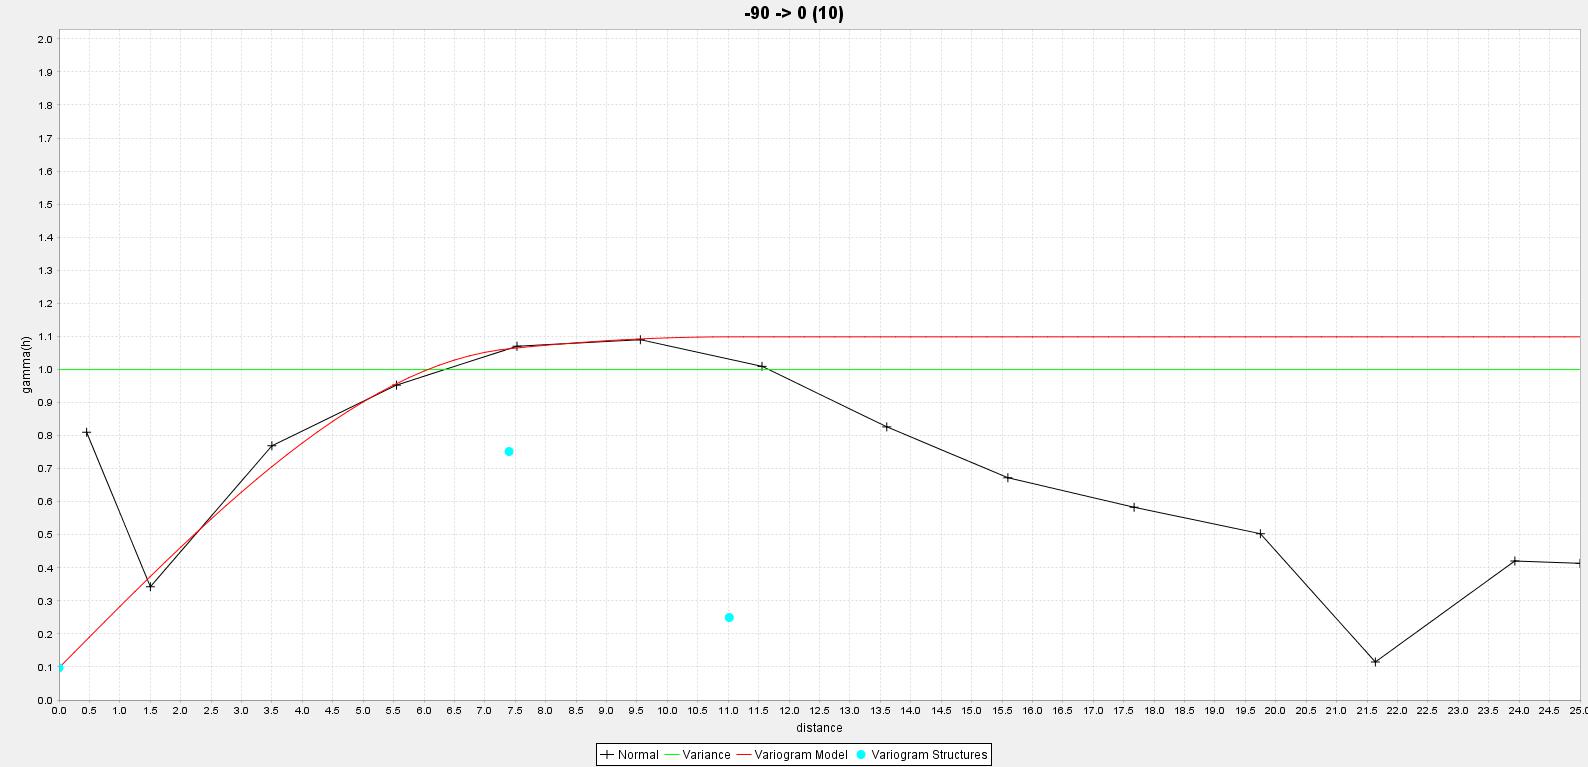
| | NI43-101 Technical Report and Updated Resource Estimate South Tally Pond Property – Lemarchant Deposit |
Figure 14-17: Directional experimental variograms of zinc assay composites for Main Zone
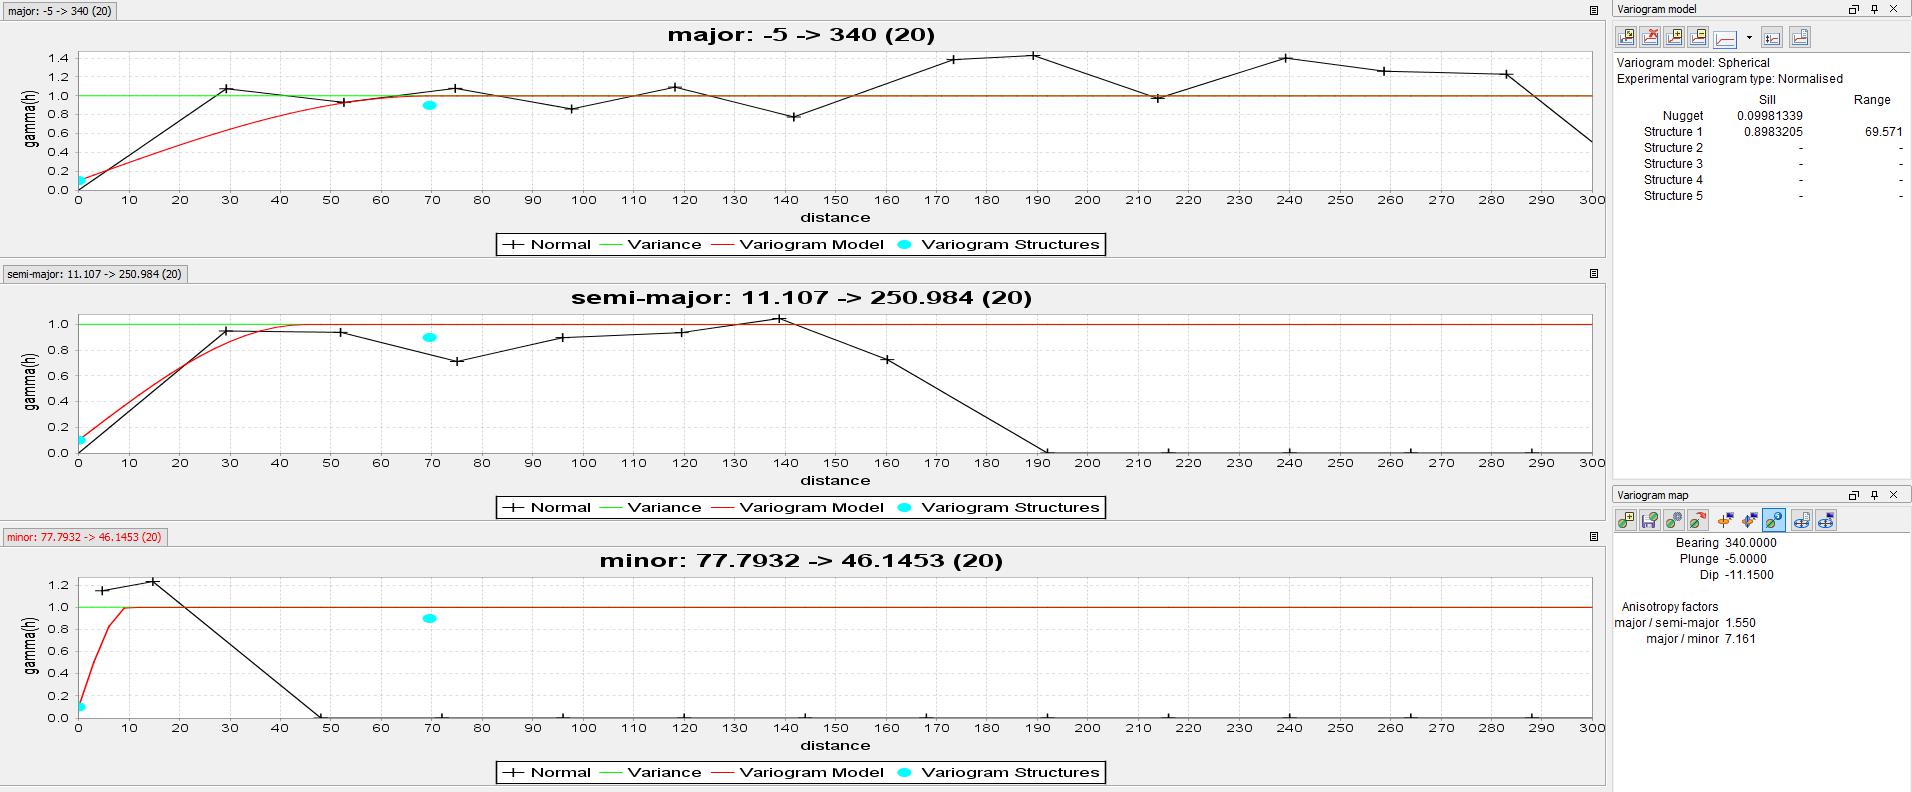
Figure 14-18: Directional experimental variograms of lead assay composites for Main Zone
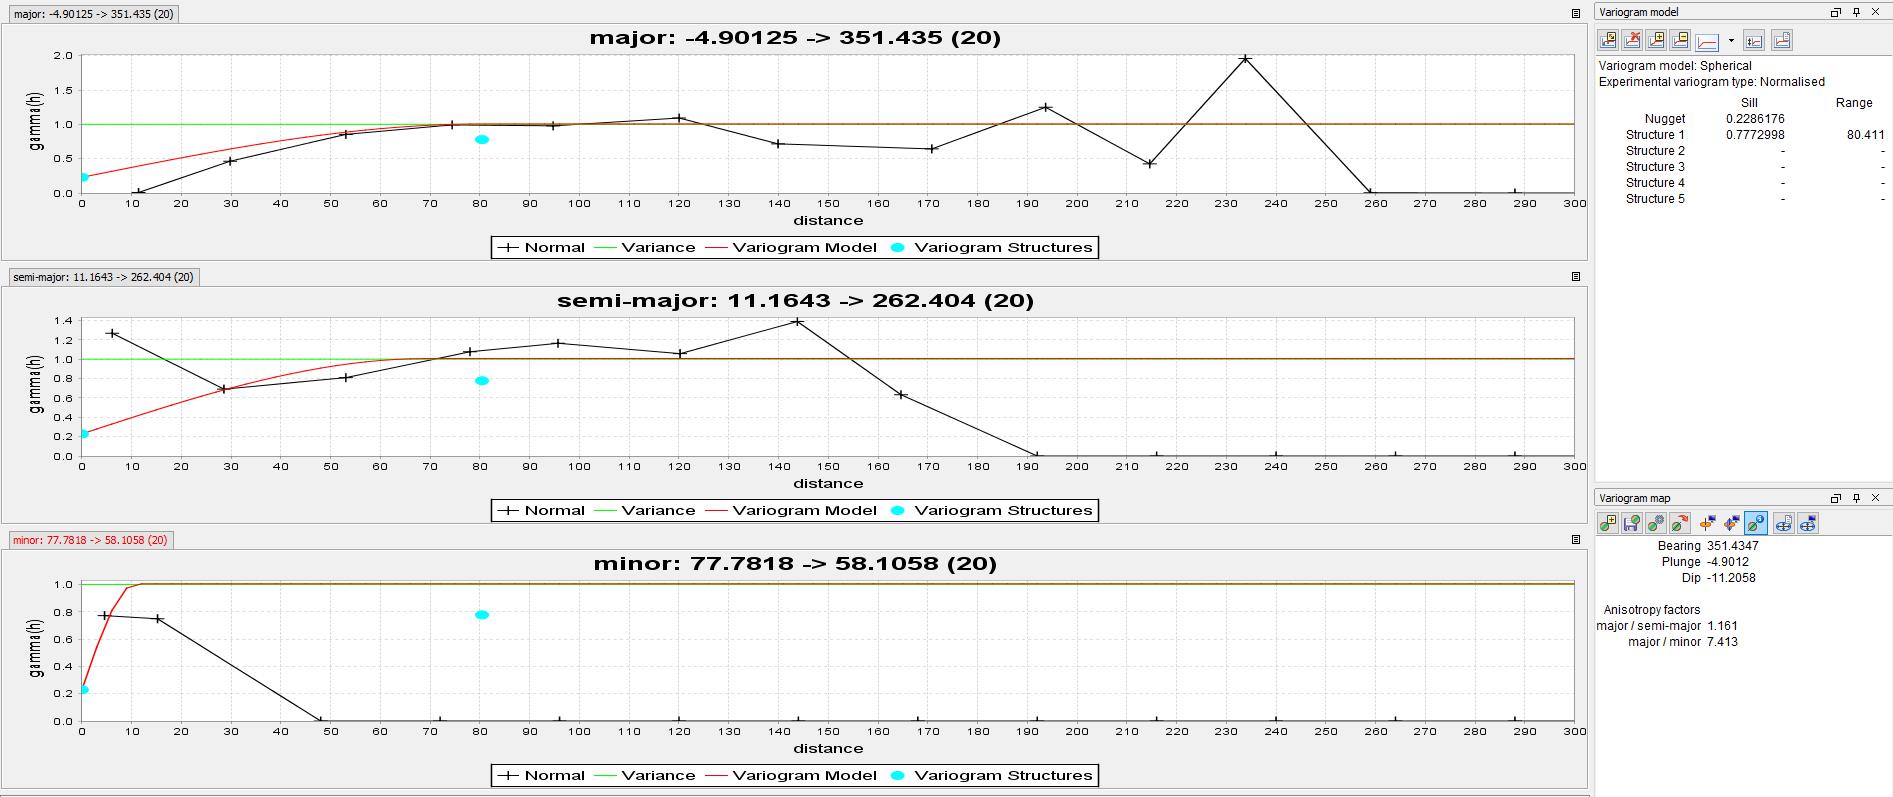
| | NI43-101 Technical Report and Updated Resource Estimate South Tally Pond Property – Lemarchant Deposit |
Figure 14-19: Directional experimental variograms of copper assay composites for Main Zone

Figure 14-20: Directional experimental variograms of gold assay composites for Main Zone
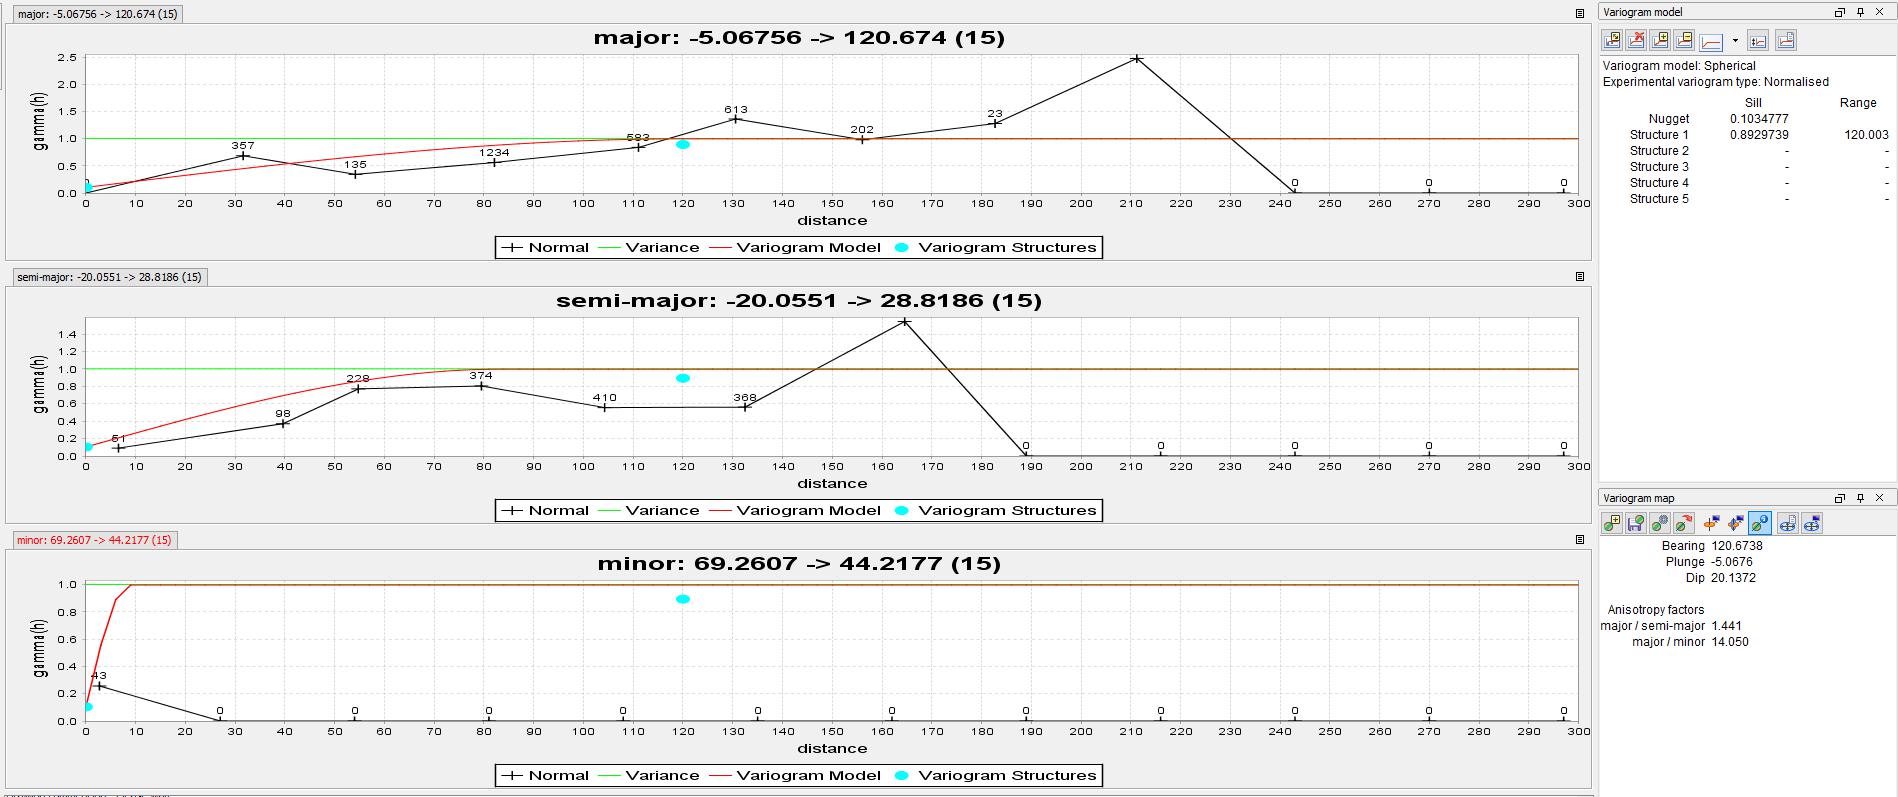
| | NI43-101 Technical Report and Updated Resource Estimate South Tally Pond Property – Lemarchant Deposit |
Figure 14-21: Directional experimental variograms of silver assay composites for Main Zone
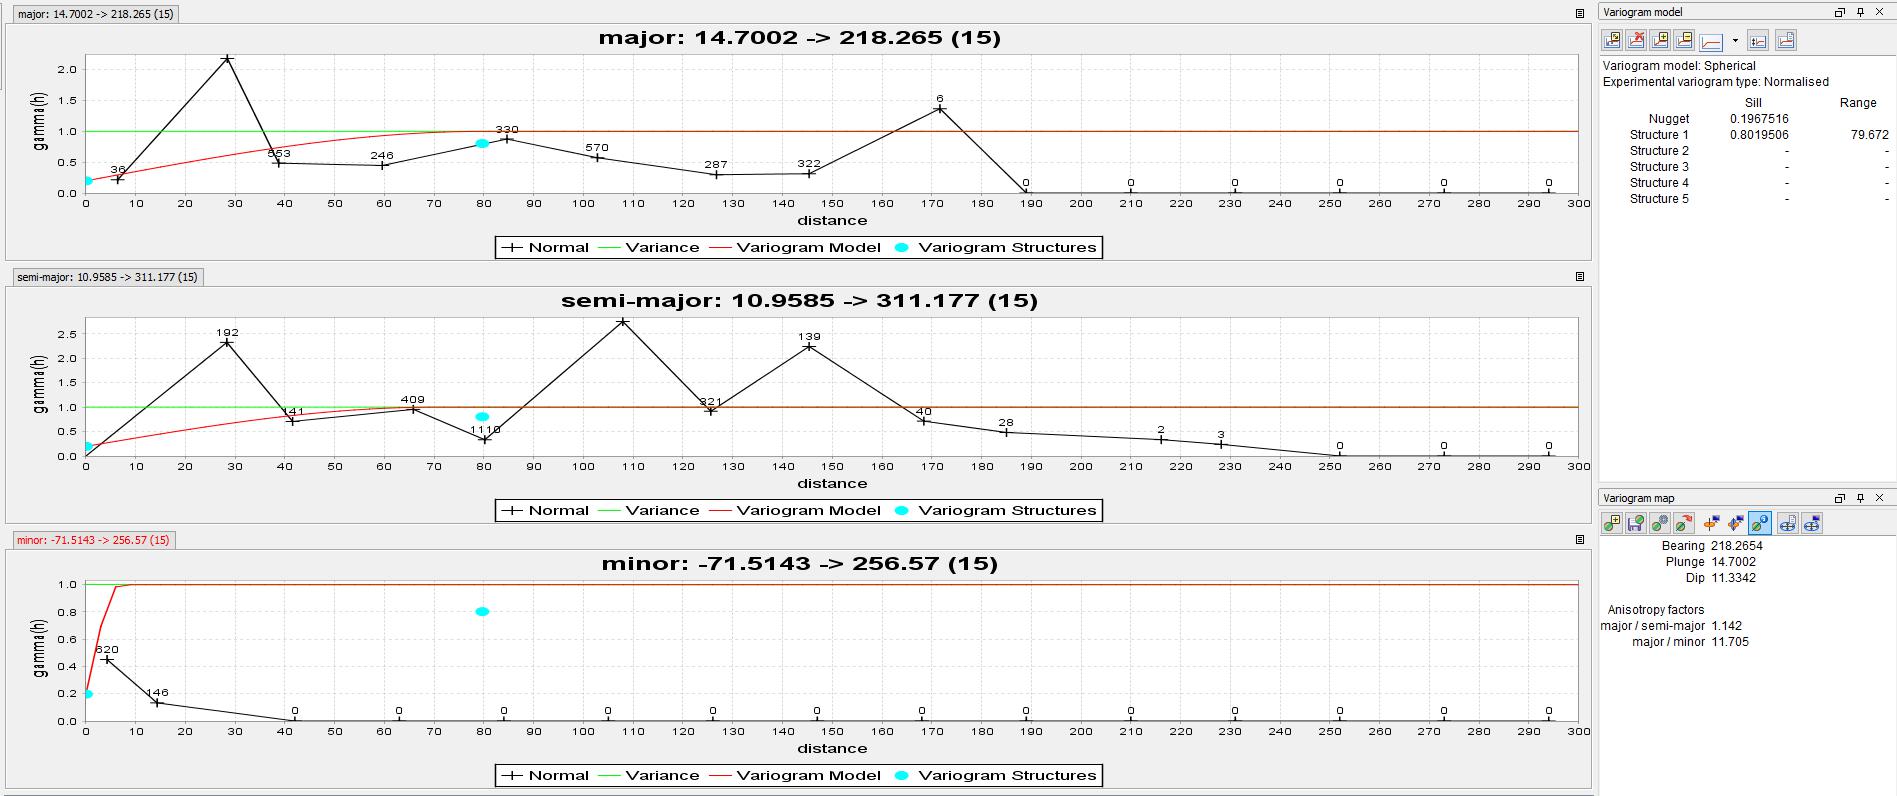
Figure 14-22: Directional experimental variograms of barium assay composites for Main Zone
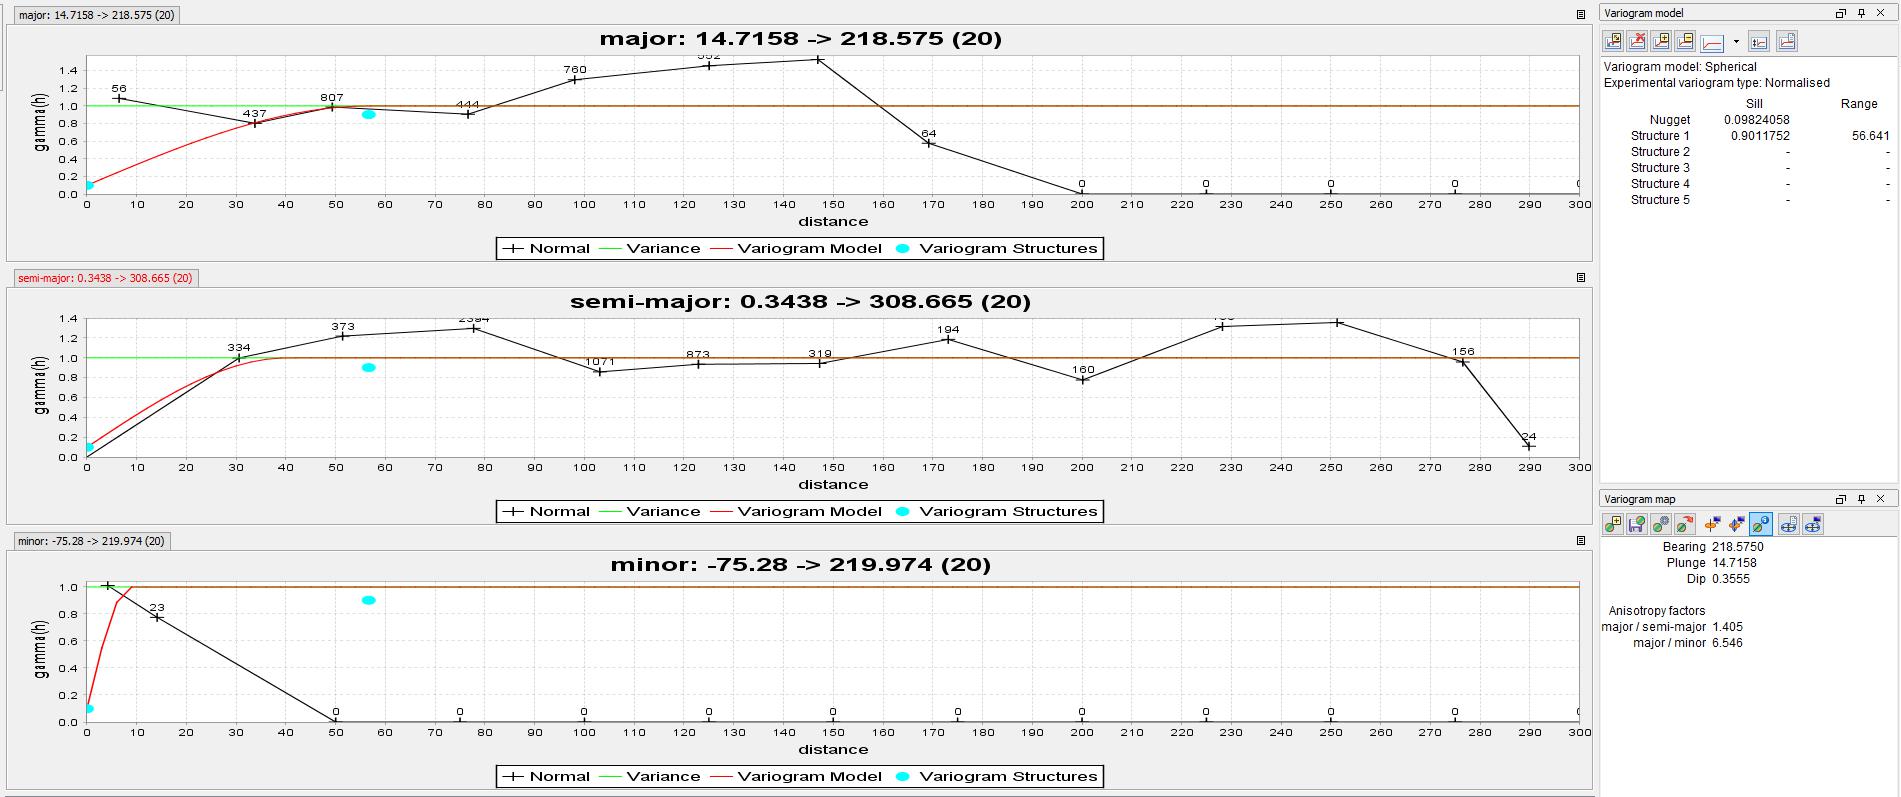
| | NI43-101 Technical Report and Updated Resource Estimate South Tally Pond Property – Lemarchant Deposit |
Interpolation ellipsoid ranges were developed through consideration of the variogram assessment, geological interpretation, project history, and resource categorization requirements. A multi-pass interpolation approach consisting of three separate stages was implemented using progressively increasing ellipsoid ranges for each pass. Ellipsoid ranges summarized in Table 14-11 below reflect half, equal to, and one and half the ranges determined through variography for the first, second, and third interpolation pass.
Table 14-11: Interpolation ellipsoid ranges (m)
| | Interpolation Pass 1 | Interpolation Pass 2 | Interpolation Pass 3 |
| Attribute | Major | Semi-major | Minor | Major | Semi-major | Minor | Major | Semi-major | Minor |
| Zn | 35 | 22.5 | 10 | 70 | 45 | 10 | 105 | 67.5 | 15 |
| Pb | 40 | 22.5 | 10 | 80 | 45 | 10 | 120 | 67.5 | 15 |
| Cu | 27.5 | 17.5 | 10 | 55 | 35 | 10 | 82.5 | 52.5 | 15 |
| Au | 60 | 40 | 10 | 120 | 80 | 10 | 180 | 120 | 15 |
| Ag | 40 | 35 | 10 | 80 | 70 | 10 | 120 | 105 | 15 |
| Ba | 27.5 | 20 | 10 | 82.5 | 60 | 15 | 82.5 | 60 | 15 |
Interpolation ellipsoids were oriented along the general geological trends identified for each deposit area solid and locally modified for changes in solid geometry. As such, each deposit area typically supports between 5 and 11 interpolation sub-domains, for a total of 49 interpolation sub-domains. Ellipsoids predominantly oriented north-northwest with gentle to moderate dips to east in the Main zone and moderate to steep dips to the west in the Northwest Zone.
| 14.8 | Setup of Three Dimensional Block Model |
The Lemarchant Deposit Mineral Resource Estimate is located in Universal Transverse Mercator (UTM) North American Datum 1983 (NAD83) Zone 21 coordination system and the minimum and maximum extents of the entire block model area are presented in Table 14-12. The block model supports a block size of 5m X by 5m Y by 5m Z with no sub-blocking and no rotation applied.
Table 14-12: Resource block model spatial parameters
| Type | Y (Northing m) | X (Easting m) | Z (Elevation m) |
| Minimum Coordinates | 5,374,600 | 520,650 | -100 |
| Maximum Coordinates | 5,375,500 | 521,300 | 350 |
| User Block Size (m) | 5 | 5 | 5 |
| Min. Block Size (5) | 5 | 5 | 5 |
| Rotation | 0 | 0 | 0 |
| | NI43-101 Technical Report and Updated Resource Estimate South Tally Pond Property – Lemarchant Deposit |
| 14.9 | Mineral Resource Estimation |
Ordinary Kriging (OK) grade interpolation methodology was used to assign block grades for zinc, lead, copper, gold, silver, barium and specific gravity within the Lemarchant deposit block model based on the 1 m capped assay composites. As reviewed earlier, interpolation ellipsoid orientation values and ranges used in the estimation reflect trends determined from variography plus sectional interpretations of geology and grade distributions for the deposit. Block volumes were estimated from solid models using partial percentage volume calculation precision 5.
Grade interpolation for Inferred and Indicated Mineral Resources were constrained to the block volumes defined by solid models using the 3 interpolation pass approach previously discussed. Interpolation passes, implemented sequentially from pass 1 to pass 3, progress from being restrictive to more inclusive in the composites available and number of composites required to assign block grades. Table 14-13 summarizes the included composite parameters and blocks available to assign grade for each interpolation pass. Block discretization was set at 5Y x 5X x 5Z. Each block is interpolated with a density value in g/cm3.
Table 14-13: Included composite parameters for each interpolation pass
| Interpolation Pass | Included Composite Parameters |
| Minimum | Maximum | Maximum/Hole |
| 1 | 6 | 15 | 5 |
| 2 | 5 | 12 | 4 |
| 3 | 1 | 9 | 4 |
Geological unit boundaries were assigned hard domain boundaries for grade estimation purposes and grade interpolation is restricted to the 1 m assay composites associated with the drill hole intercepts assigned to that deposit area solid. Hard boundaries, therefore, occur between geological solid model contacts, fault surfaces, and individual solid model peripheral limits. Alternatively, adjacent and connecting domains areas within a geological unit were assigned soft domain boundaries for grade estimation purposes. As such, the 1 m assay composites in adjacent and connecting domains contribute to the grade interpolation.
Laboratory results for water immersion core sample specific gravity determinations included in the drilling database were comprehensively collected for mineralized intervals by NorZinc staff for the 2007 through 2017 drilling campaigns and used as density values for Mineral Resource modelling. A total of 2,723 specific gravity determinations are present in the Lemarchant database and provides results for approximately 96 % of the included drill hole lengths within the solid models.
| | NI43-101 Technical Report and Updated Resource Estimate South Tally Pond Property – Lemarchant Deposit |
A density value in g/cm3 was assigned to each 2018 block centroid from the 1 m density composite dataset using the same multi-pass Ordinary Kriging (OK) approach discussed for the grade interpolations. Interpolation ellipsoid orientation values reflect those used for grade interpolations and interpolation ellipsoid ranges reflect average ranges for all metals for each pass. This provides a range of 37.5 m, 25 m, and 10 m for the major, semi-major, and minor axes of continuity for the first pass, a range of 75m, 50m, and 10m for the major, semi-major and minor axes of continuity for the seconds pass, and a range of 112.5 m, 75 m, and 15 m for the major, semi-major, and minor axes of continuity for the third pass.
Areas without sufficient density data to interpolate a valid density block value on the third interpolation pass were assigned the average density value for the respective geological unit. Average density values are 3.83 g/cm3 in the Main Zone Mineralized, 3.56 g/cm3 in the Northwest Zone Mineralized, 2.80 g/cm3 in the Main Zone Upper Footwall, 2.80 g/cm3 in the Northwest Zone Footwall, 2.74 g/cm3 in the Main Zone Lower Footwall, and 3.29 g/cm3 in the Main Mudstone. Average density values were applied to two interpolation sub-domains in the Main Zone Upper Footwall.
| 14.11 | Resource Category Definitions and Parameters Used in Current Estimate |
Definitions of Mineral Resources and associated Mineral Resource categories used in this report are those recognized under NI 43-101 and set out in the CIM Standards (as amended in 2014). Mineral Resources presented have been assigned to Inferred and Indicated Mineral Resource categories that reflect increasing levels of confidence with respect to spatial configuration of resources and corresponding grade assignment within the deposit. Several factors were considered in defining resource category assignments, including drill hole spacing, geological interpretations, and number and range of informing composites. Specific definition parameters for each resource category applied in the current estimate are set out below.
Measured Resource: No interpolated resource blocks were assigned to this category.
Indicated Resources:Indicated Mineral Resources are defined as all blocks with interpolated grade and specific gravity values from the first or second Ordinary Kriging interpolation passes with at least 2 contributing drill holes and 5 contributing composites having a maximum average distance of 50 metres from the block centroid
Inferred Resources: Inferred Mineral Resources are defined as all blocks with interpolated grade and specific gravity values from the first, second, or third Ordinary Kriging interpolation passes with at least 1 contributing composite and not previously categorized as Indicated resource.
Application of the Mineral Resource category parameters specified above provided a distribution of Indicated and Inferred Mineral Resource blocks for the Lemarchant Deposit. To eliminate irregular category assignment artifacts, the peripheral limits of blocks in close proximity to each other that share the same category designation and demonstrate reasonable continuity were wireframed and developed into discrete solid models. All blocks occurring within these category solid models was re-classified to match that model’s designation. This process resulted in more continuous zones of each Mineral Resource categorization and limited occurrences of orphaned blocks of one category occurring as isolated, imbedded zones in other category domains.
| | NI43-101 Technical Report and Updated Resource Estimate South Tally Pond Property – Lemarchant Deposit |
| 14.12 | Zinc Equivalent Equation and Resource Cut-off Grade |
Mercator and NorZinc staff developed a zinc equivalent (“Zn Eq.”) equation for Mineral Resource Estimation purposes. The equation is based on metal prices of $1.10/lb Zn, $1.00/lb Pb, $3.21/lb Cu, $1351/troy oz. Au and $19/troy oz. Ag (all US currency) and recoveries of 91.46 % Zn, 82.48 % Pb, 79.50% Cu, 84.23 % Au, and 68.22 % Ag. Metal prices for zinc, lead and silver reflect forecast pricing applied in the 2017 Prairie Creek feasibility study prepared for NorZinc and metal prices for copper and gold reflect an average of Consensus Economics Inc. projections for the 2018 through 2022 period. Metal recoveries reflect results from a 2018 Central Milling Facility Assessment completed by Thibault & Associates Inc. Barium was not included in the zinc equivalent calculation. The following zinc equivalent equation was derived using pricing and process recovery factors noted above:
Zn Eq. % = Zn % + ((Pb % * 22.046 * 0.8248 * 1.00) + (Cu % * 22.046 * 0.7950 * 3.21) + (Ag g/t / 31.10348 * 0.6822 * 19) + (Au g/t / 31.10348 * 0.8423 * 1351)) / (1.10 * 22.046 * 0.9146)
A resource zinc equivalent cut-off grade of 4.0 % was determined for Mineral Resources and is considered to reflect a reasonable expectation of economic extraction in the foreseeable future using conventional underground mining methods.
| 14.13 | Conversion of Barium to Barite |
Interpolated block values of barium percent (Ba %) were converted to barite % (BaSO4) for use in the Mineral Resource Estimate using the following conversion: BaSO4 % = Ba % / 0.58
| 14.14 | Statement of Mineral Resource Estimate |
Block grade, block density and block volume parameters for the Lemarchant Deposit were estimated using methods described in preceding sections of this report. Subsequent application of Mineral Resource category parameters resulted in the Lemarchant Deposit Mineral Resource Estimate statement presented below in Table 14-14. Figures 14-23 through 14-38 present isometric and /or plan views of block grade and Mineral Resource category distributions represented in the current Mineral Resource Estimate. Relationships between Zn Eq.%, Zn%, Pb%, Cu %, Au g/t, Ag g/t, and BaSO4 % relative to global deposit tonnage at various zinc equivalent cut-off values are highlighted in Figures 14-39 through 14-52.
| | NI43-101 Technical Report and Updated Resource Estimate South Tally Pond Property – Lemarchant Deposit |
Table 14-14: Lemarchant Mineral Resource Estimate
Lemarchant Deposit Mineral Resource Estimate at 4.0% Zn Eq. Cutoff Effective 20 September, 2018 |
| Category | Tonnes | Zn (%) | Pb (%) | Cu (%) | Au (g/t) | Ag (g/t) | Zn Eq. (%) | BaSO4 (%) |
| Indicated | 2,420,000 | 6.15 | 1.60 | 0.68 | 1.22 | 64.04 | 12.40 | 23.53 |
| Inferred | 560,000 | 4.68 | 1.08 | 0.45 | 1.06 | 44.67 | 9.31 | 13.11 |
| | | | | | | | | |
| Mineral Resource Estimate Contained Metal |
| Category | | Zn (M lbs) | Pb (M lbs) | Cu (M lbs) | Au (K oz) | Ag (M oz) | | Barite (tonnes) |
| Indicated | | 328.1 | 85.3 | 36.3 | 0.95 | 5.0 | | 570,000 |
| Inferred | | 57.8 | 13.3 | 5.6 | 0.19 | 0.8 | | 73,000 |
| 1. | Resource tonnages have been rounded to the nearest 10,000. Totals may vary due to rounding. |
| 2. | Price assumptions used were in USD $1.10/lb Zn, $1.00/lb Pb, $3.21/lb Cu, $1351/oz Au, and $19/oz Ag. |
| 3. | Metal recoveries used were 91.46% Zn, 82.42% Pb, 79.50% Cu, 84.23% Au and 68.22% Ag and are based on the 2017 Central Milling Facility Assessment prepared by Thibault & Associates Ltd. |
| 4. | Zn Eq. % = Zn% + ((Pb% * 22.046 * 0.8242*1.00) + (Cu% * 22.046 * 0.795 * 3.21) + (Ag g/t/31.10348 * 0.6822 * 19) + (Au g/t/31.10348 * 0.8423 * 1351))/(1.10 * 22.046 *0.9146) |
| 5. | BaSO4 % (Barite) is not included in the Zn Eq. % calculation. |
| 6. | A full block grade cut-off of 4.0 % Zn Eq. was used to estimate Mineral Resources. |
| 7. | Assay composites (1 metre) were capped at 36% Zn, 14.5 g/t Au, and 550 g/t Ag in the Mineralized domains, at 2.2% Cu, 4.6 g/t Au and 105 g/t Ag in the Upper Footwall domains, at 4.8% Zn and 8 g/t Ag in the Lower Footwall Domains and at 2% Zn, 5.2 g/t Au, and 48 g/t Ag in the Mudstone domains. |
| 8. | Results of an interpolated Ordinary Kriging bulk density model (g/cm3) have been applied. |
| 9. | Mineral Resources are considered to reflect reasonable prospects for economic extraction in the foreseeable future using conventional underground mining methods. |
| 10. | Mineral Resources do not have demonstrated economic viability. |
| 11. | This estimate of Mineral Resources may be materially affected by environmental, permitting, legal title, taxation, sociopolitical, marketing, or other relevant issues. |
| | NI43-101 Technical Report and Updated Resource Estimate South Tally Pond Property – Lemarchant Deposit |
Figure 14-23: Isometric southwest view of Zn Eq. % block model grade distribution at 4% Zn Eq. cutoff
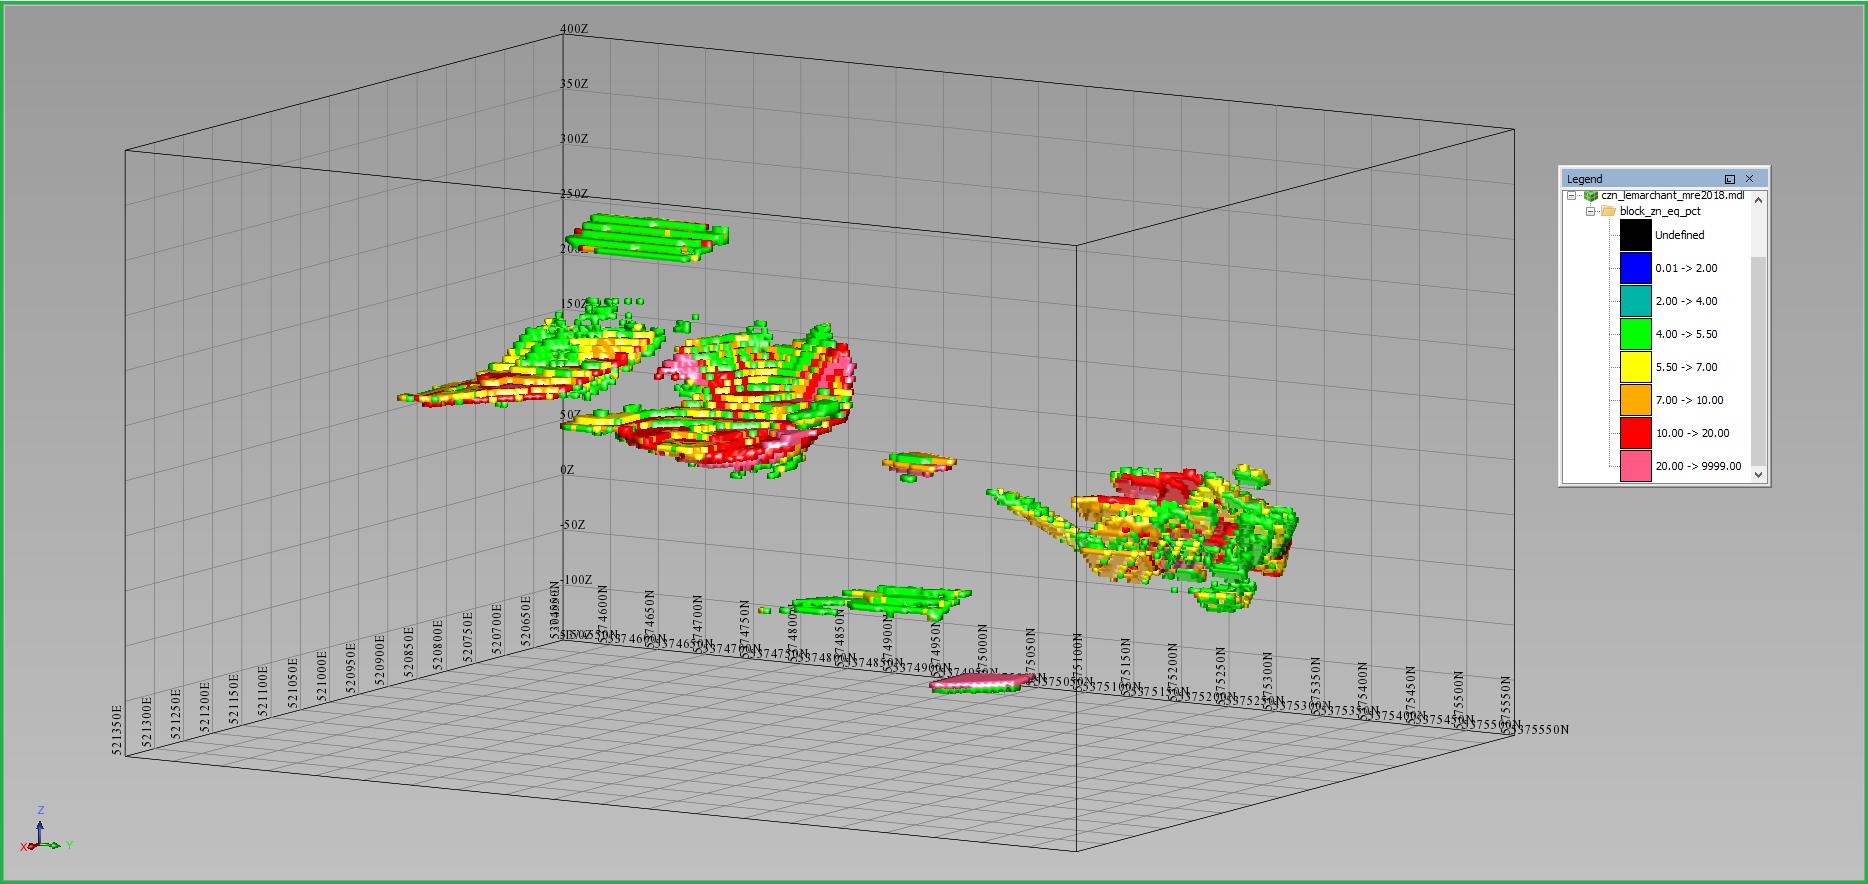
Note: Zn Eq. % Legend: < 2 (blue), 3 - 4 (cyan), 4 - 5(green), 6 - 7 (yellow), 7 - 10 (orange), 10 - 20 (red), > 20 (pink)
Figure 14-24: Isometric southwest view of Zn % block model grade distribution at 4% Zn Eq. cutoff
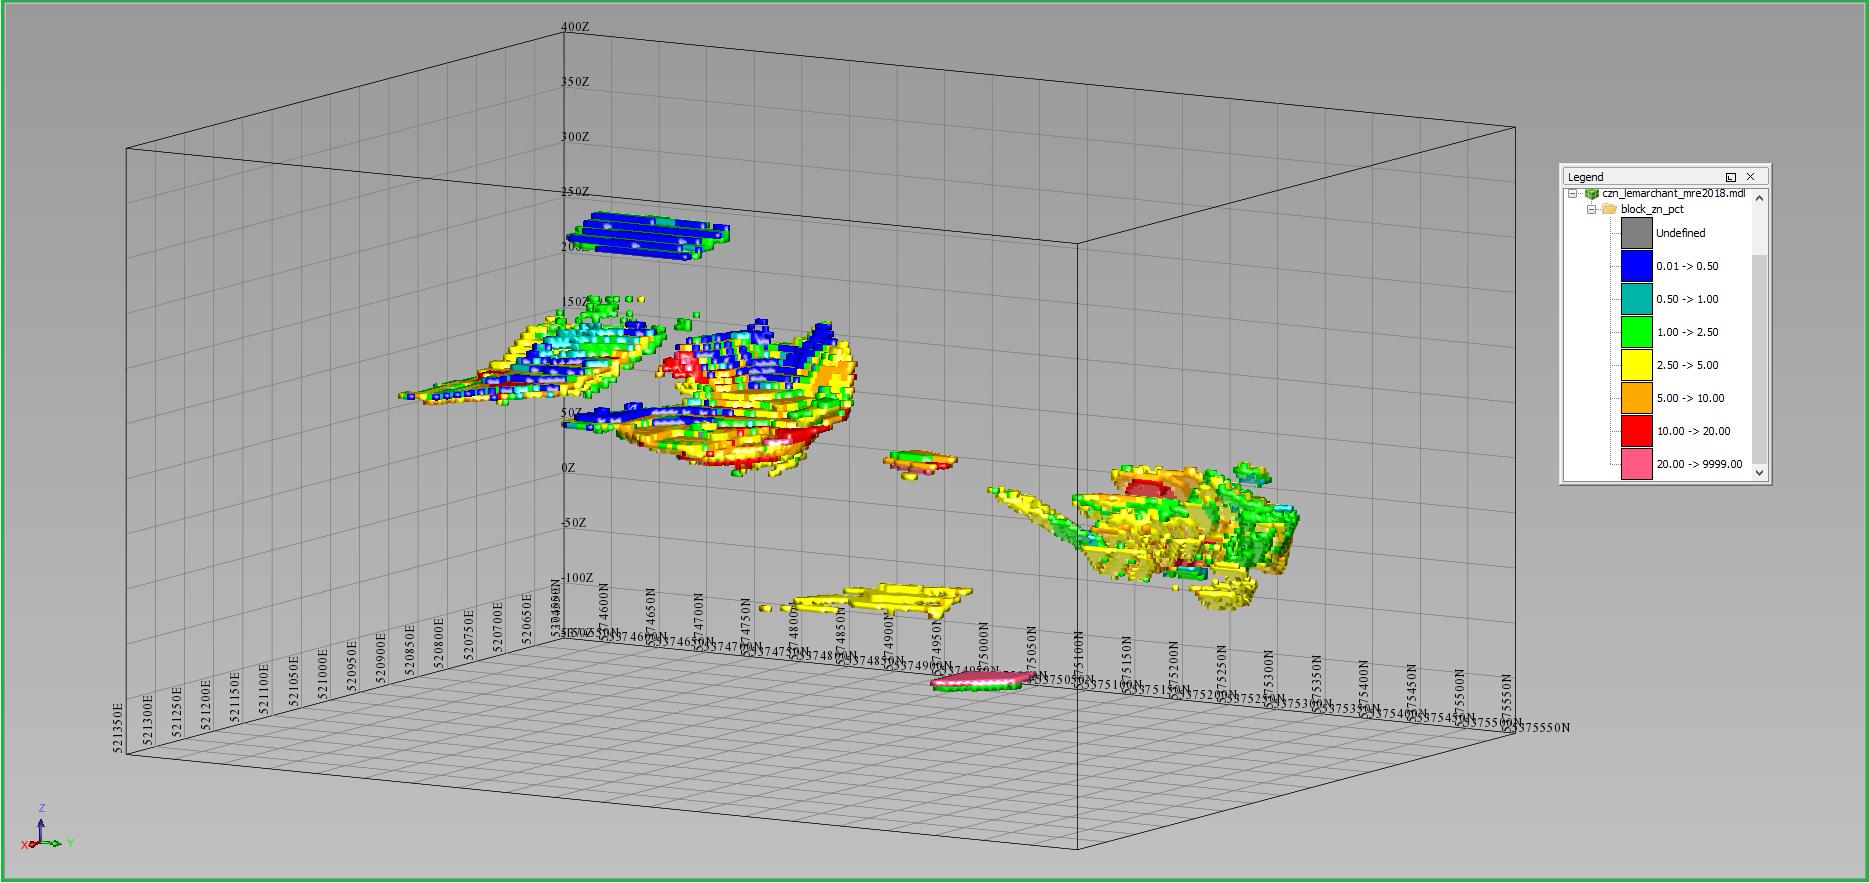
Note: Zn % Legend: < 0.5 (blue), 0.5 - 1 (cyan), 1 - 2.5 (green), 2.5 - 5 (yellow), 5 - 10 (orange), 10 - 20 (red), > 20 (pink)
| | NI43-101 Technical Report and Updated Resource Estimate South Tally Pond Property – Lemarchant Deposit |
Figure 14-25: Isometric southwest view of Pb % block model grade distribution at 4% Zn Eq. cutoff
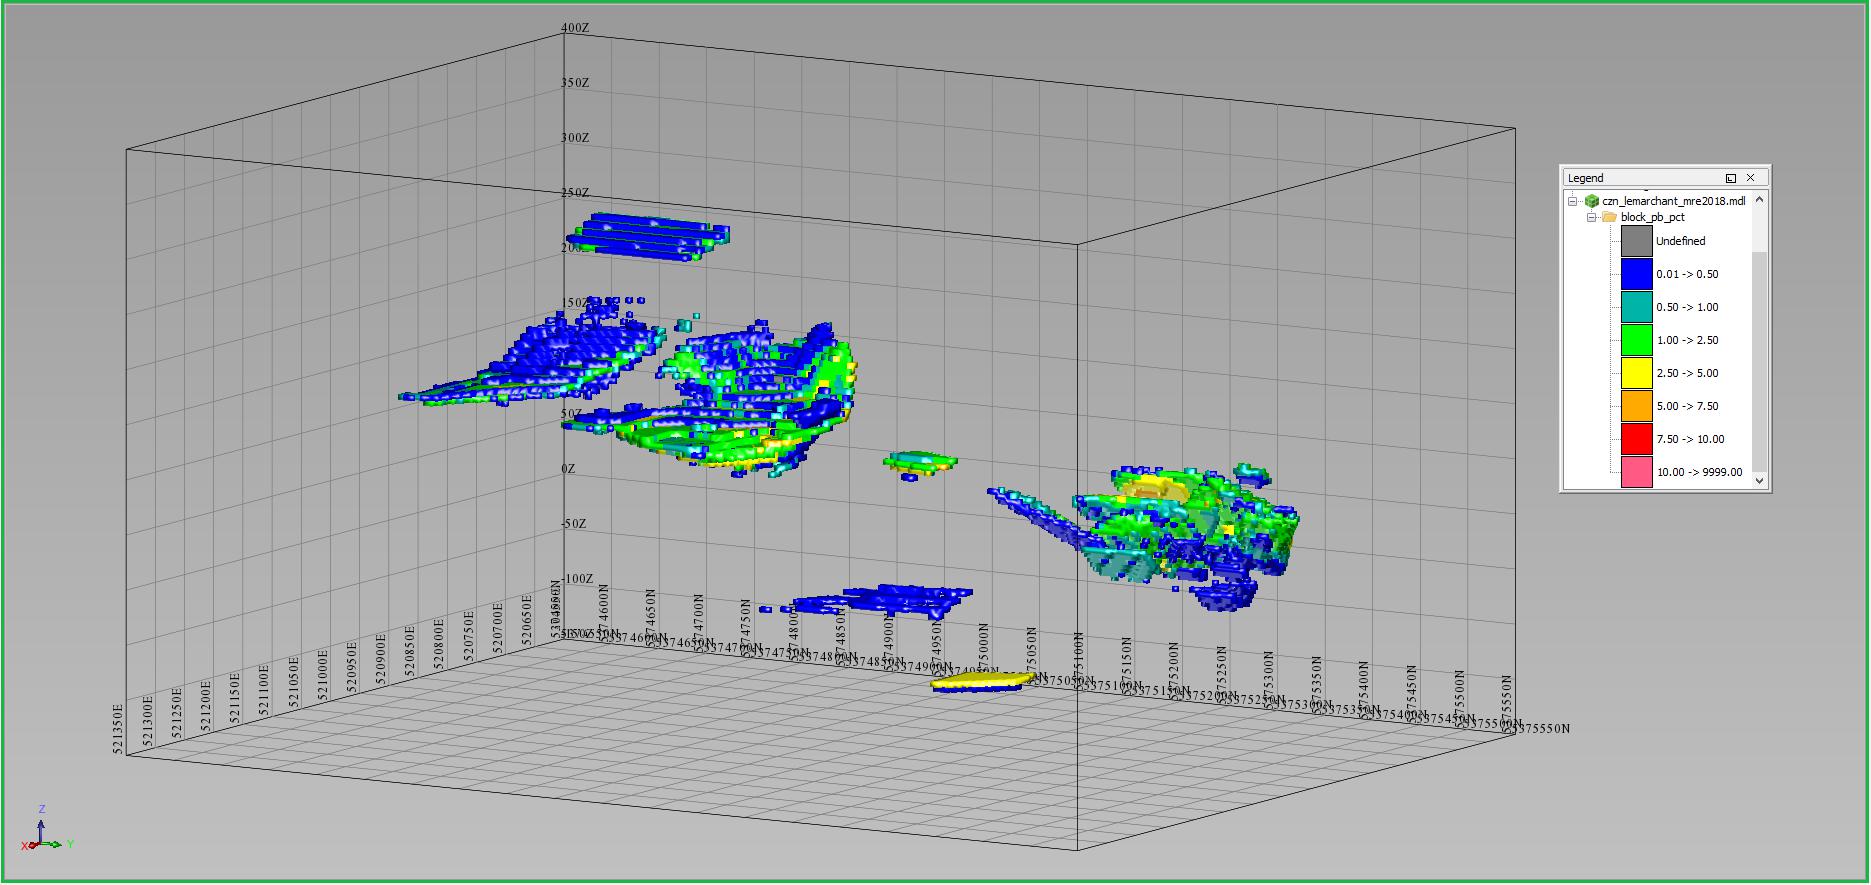
Note: Pb % Legend: < 0.5 (blue), 0.5 - 1 (cyan), 1 - 2.5 (green), 2.5 - 5 (yellow), 5 - 7.5 (orange), 7.5 - 10 (red), > 10 (pink)
Figure 14-26: Isometric southwest view of Cu % block model grade distribution at 4% Zn Eq. cutoff
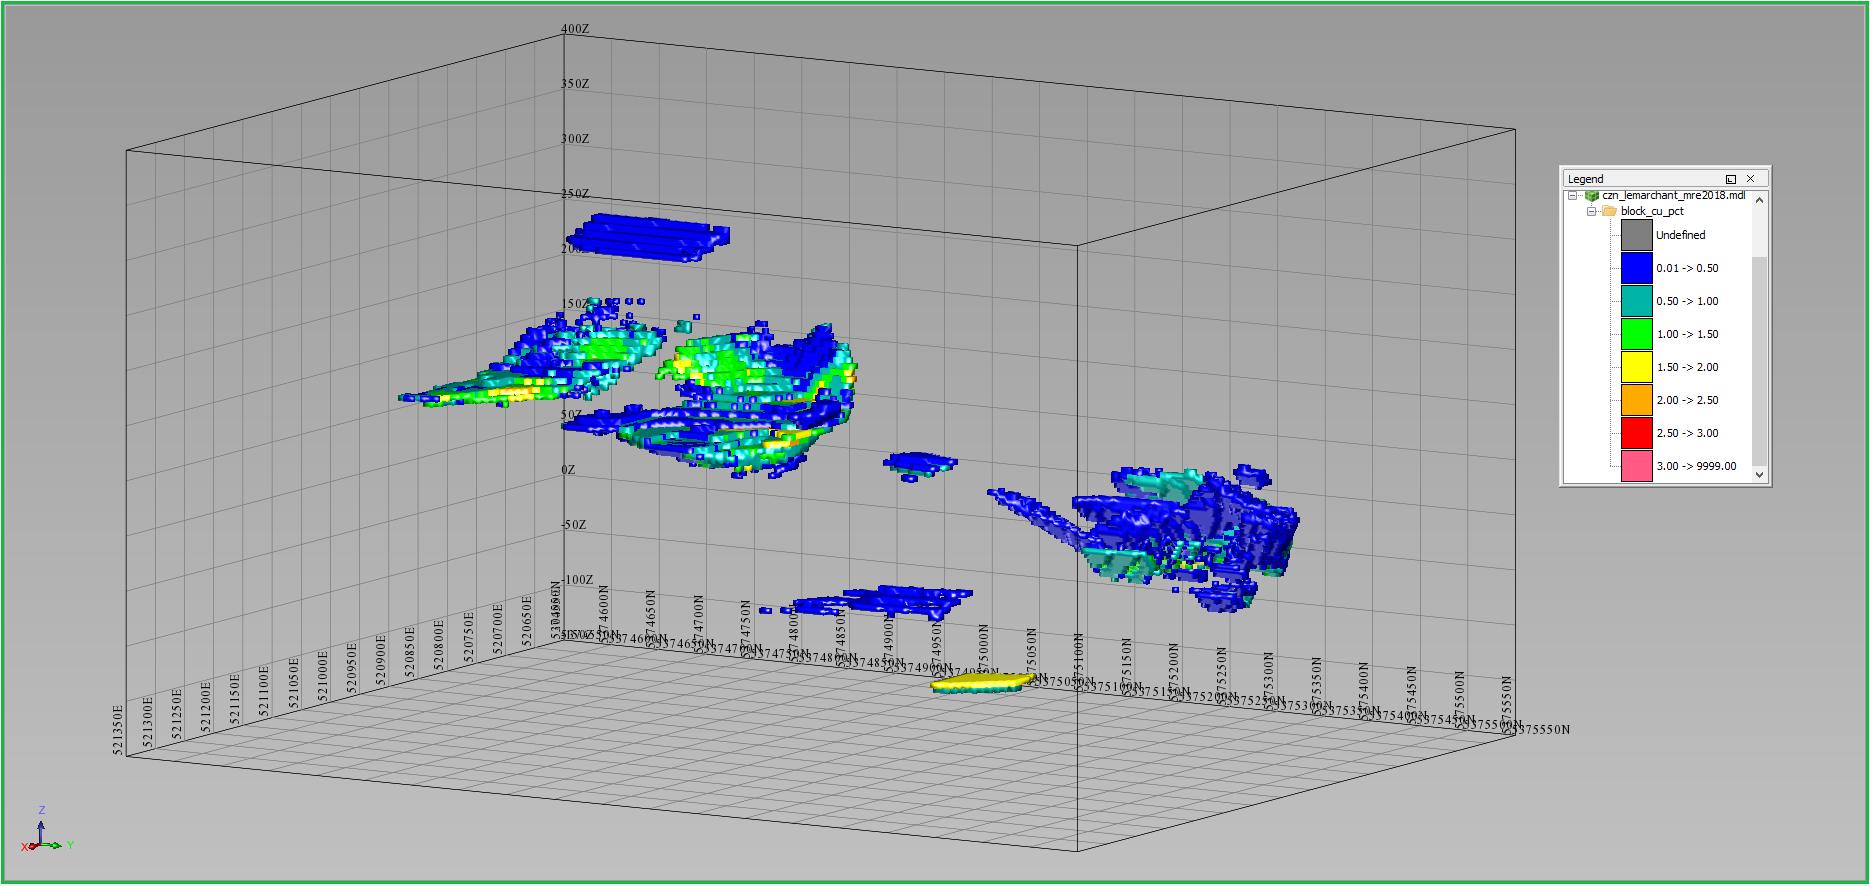
Note: Cu % Legend: < 0.5 (blue), 0.5 - 1 (cyan), 1 - 1.5 (green), 1.5 - 2 (yellow), 2 - 2.5 (orange), 2.5 - 3 (red), > 3 (pink)
| | NI43-101 Technical Report and Updated Resource Estimate South Tally Pond Property – Lemarchant Deposit |
Figure 14-27: Isometric southwest view of Au g/t block model grade distribution at 4 % Zn Eq. cutoff
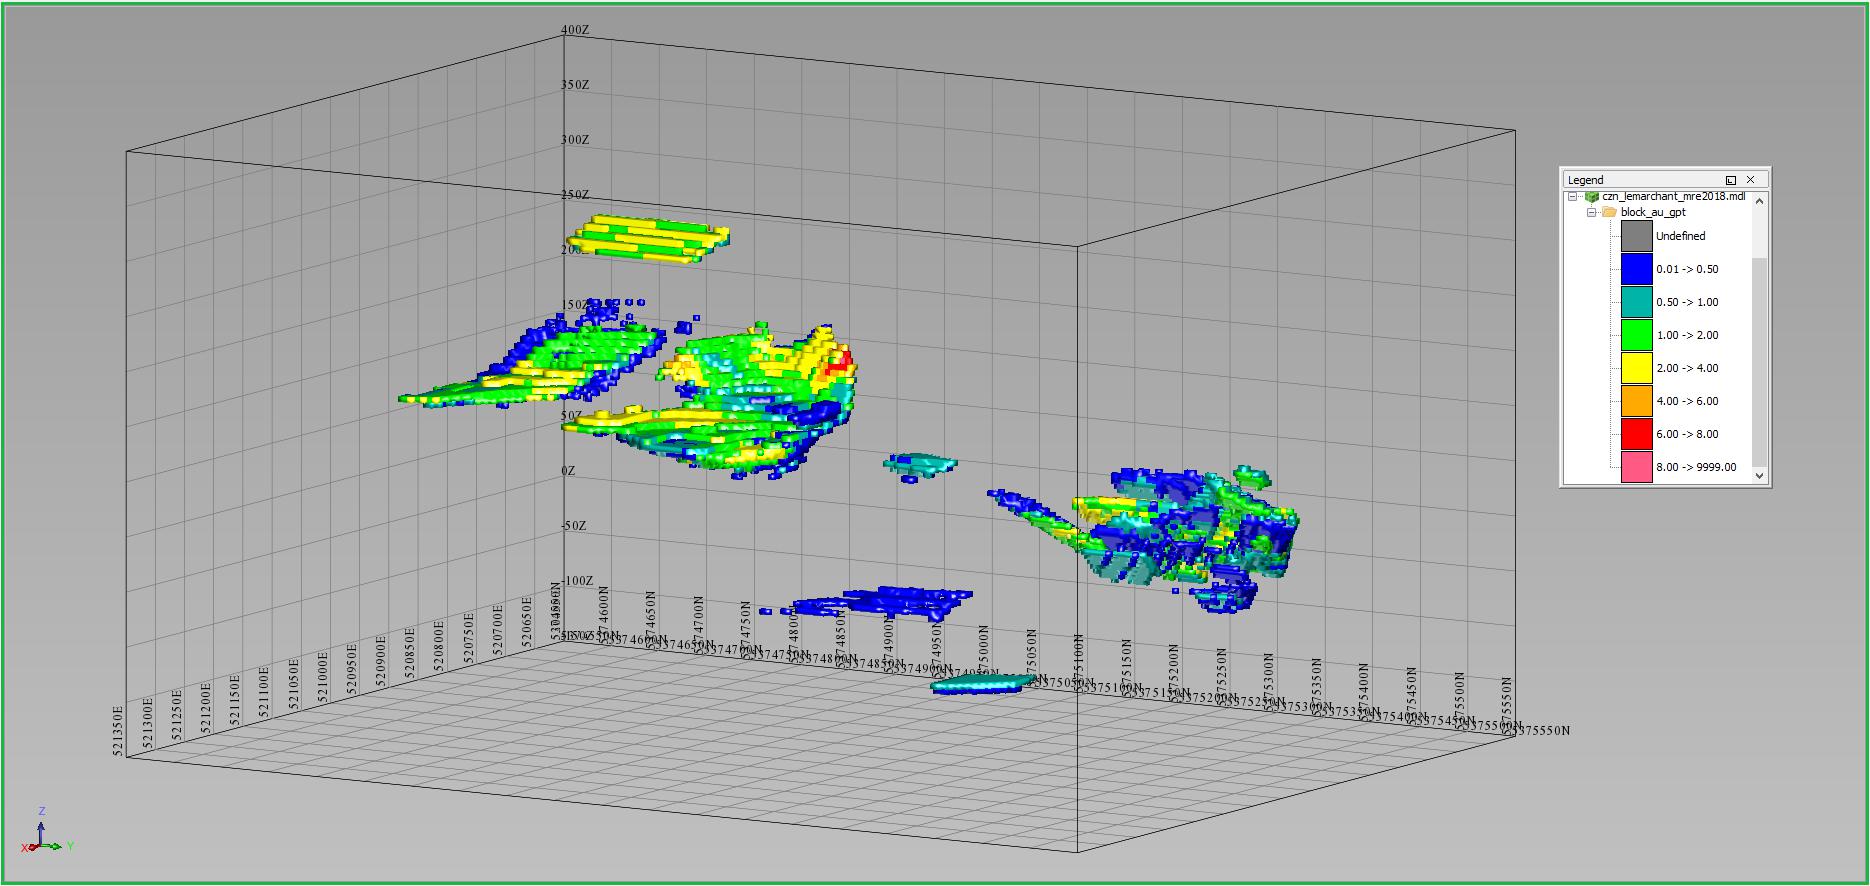
Note: Au g/t Legend: < 0.5 (blue), 0.5 - 1 (cyan), 1 - 2 (green), 2 - 4 (yellow), 4 - 6 (orange), 6 - 8 (red), > 8 (pink)
Figure 14-28: Isometric southwest view of Ag g/t block model grade distribution at 4 % Zn Eq. cutoff
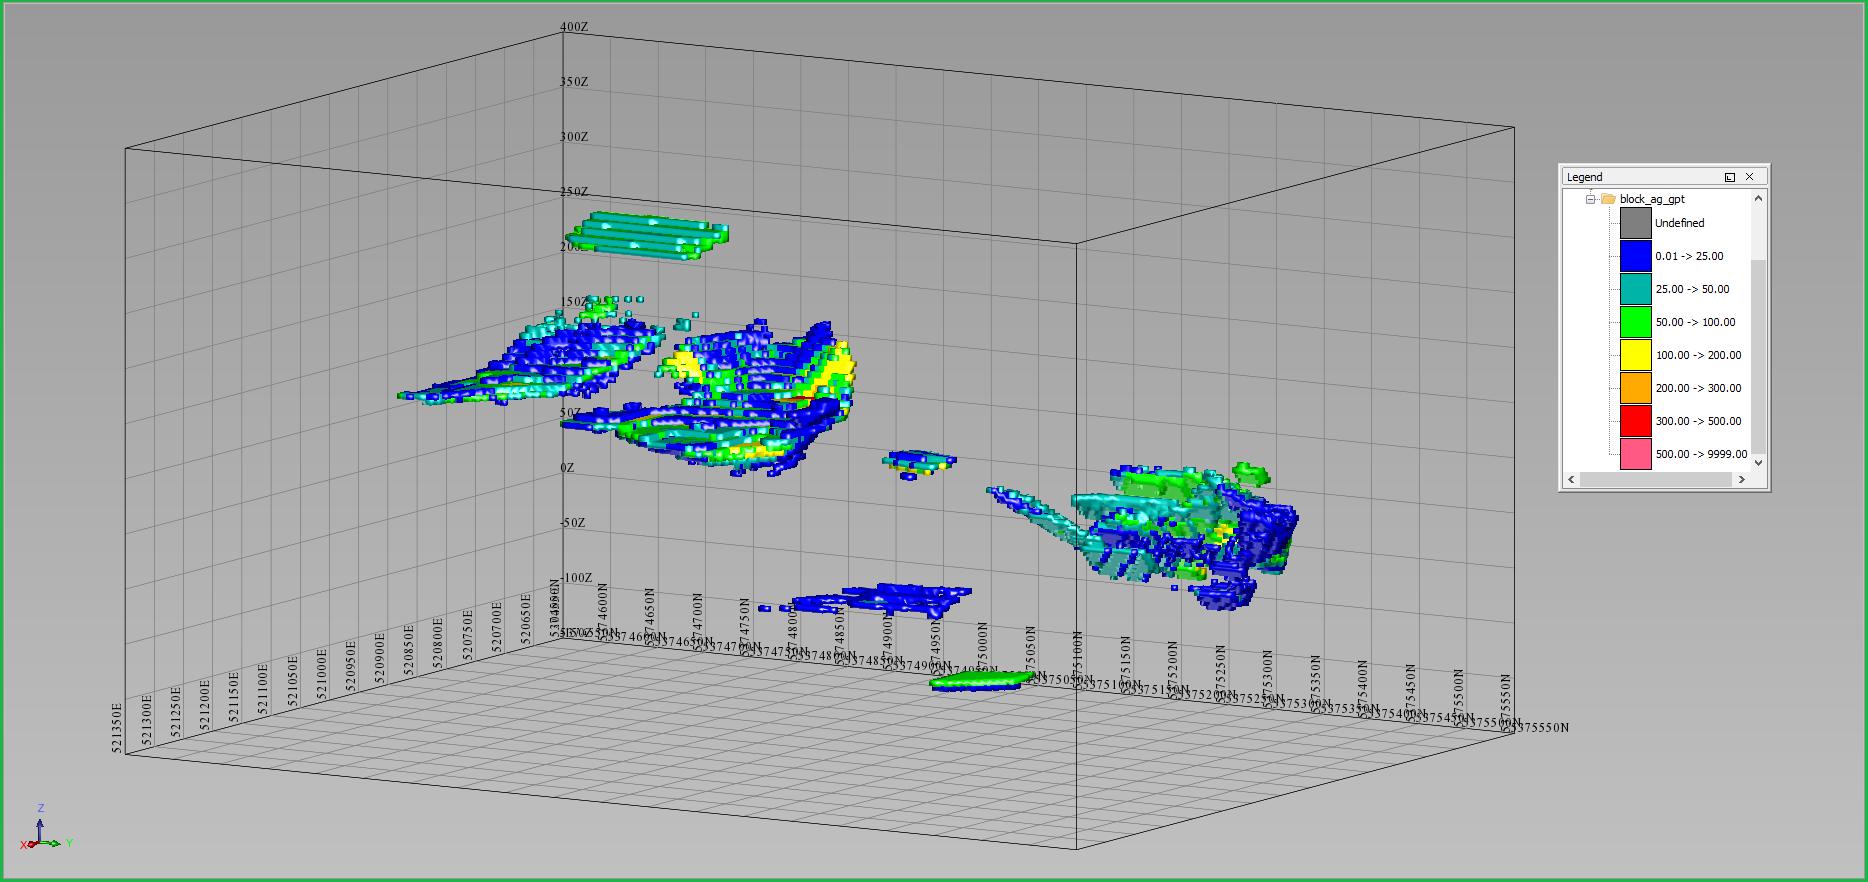
Note: Ag g/t Legend: < 25 (blue), 25 - 50 (cyan), 50 - 100 (green), 100 - 200 (yellow), 200 - 300 (orange), 300 - 500 (red), > 500 (pink)
| | NI43-101 Technical Report and Updated Resource Estimate South Tally Pond Property – Lemarchant Deposit |
Figure 14-29: Isometric southwest view of BaSO4 % block model grade distribution at 4 % Zn Eq. cutoff
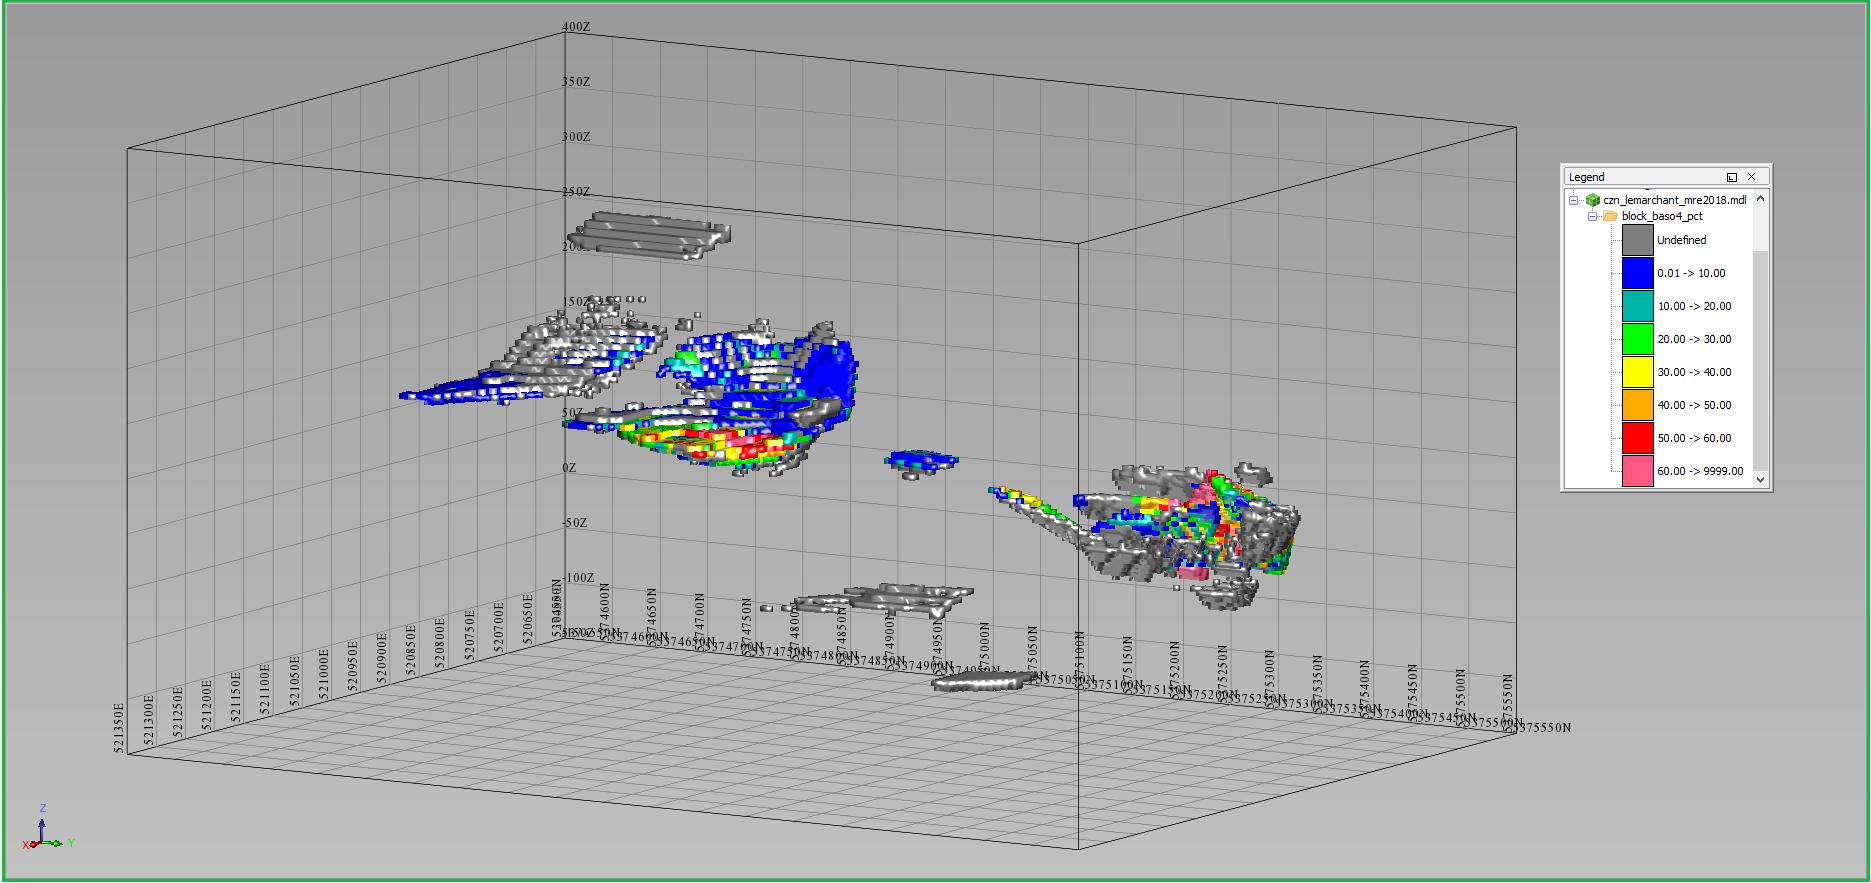
Note: BaSO4 % Legend: < 10 (blue), 10 - 20 (cyan), 20 - 30 (green), 30 - 40 (yellow), 40 - 50 (orange), 50 - 60 (red), > 60 (pink)
Figure 14-30: Isometric northeast view of Zn Eq. % block model grade distribution at 4 % Zn Eq. cutoff
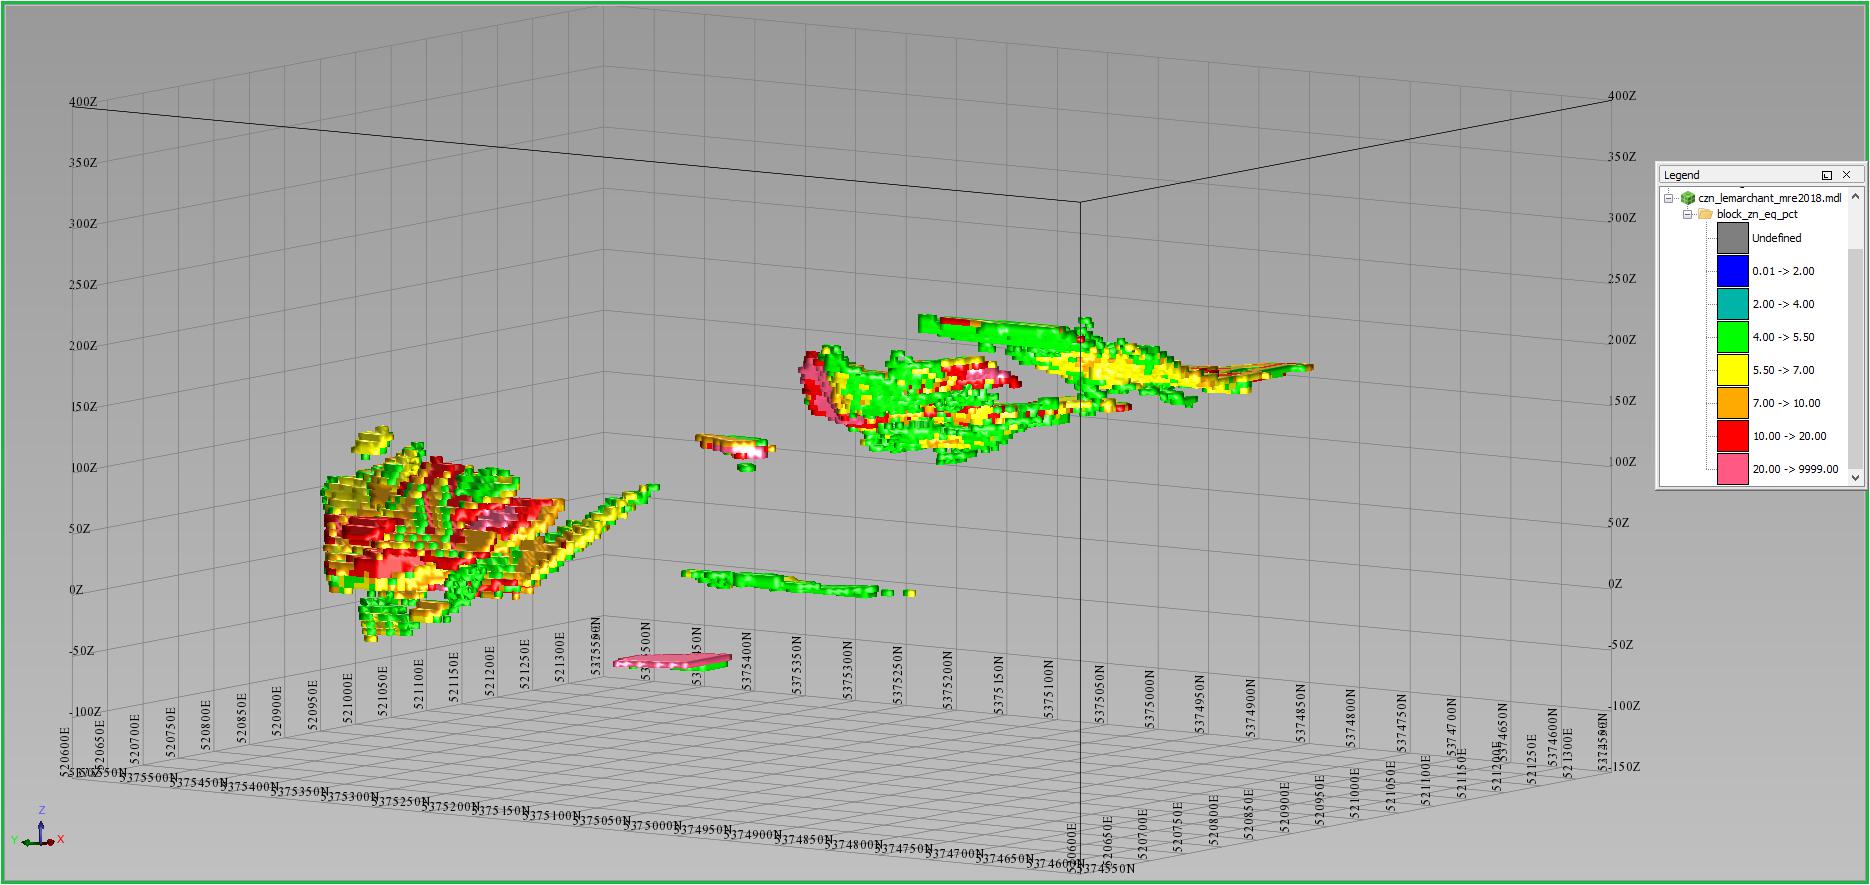
Note: Zn Eq. % Legend: < 2 (blue), 3 - 4 (cyan), 4 - 5(green), 6 - 7 (yellow), 7 - 10 (orange), 10 - 20 (red), > 20 (pink)
| | NI43-101 Technical Report and Updated Resource Estimate South Tally Pond Property – Lemarchant Deposit |
Figure 14-31: Isometric northeast view of Zn % block model grade distribution at 4 % Zn Eq. cutoff
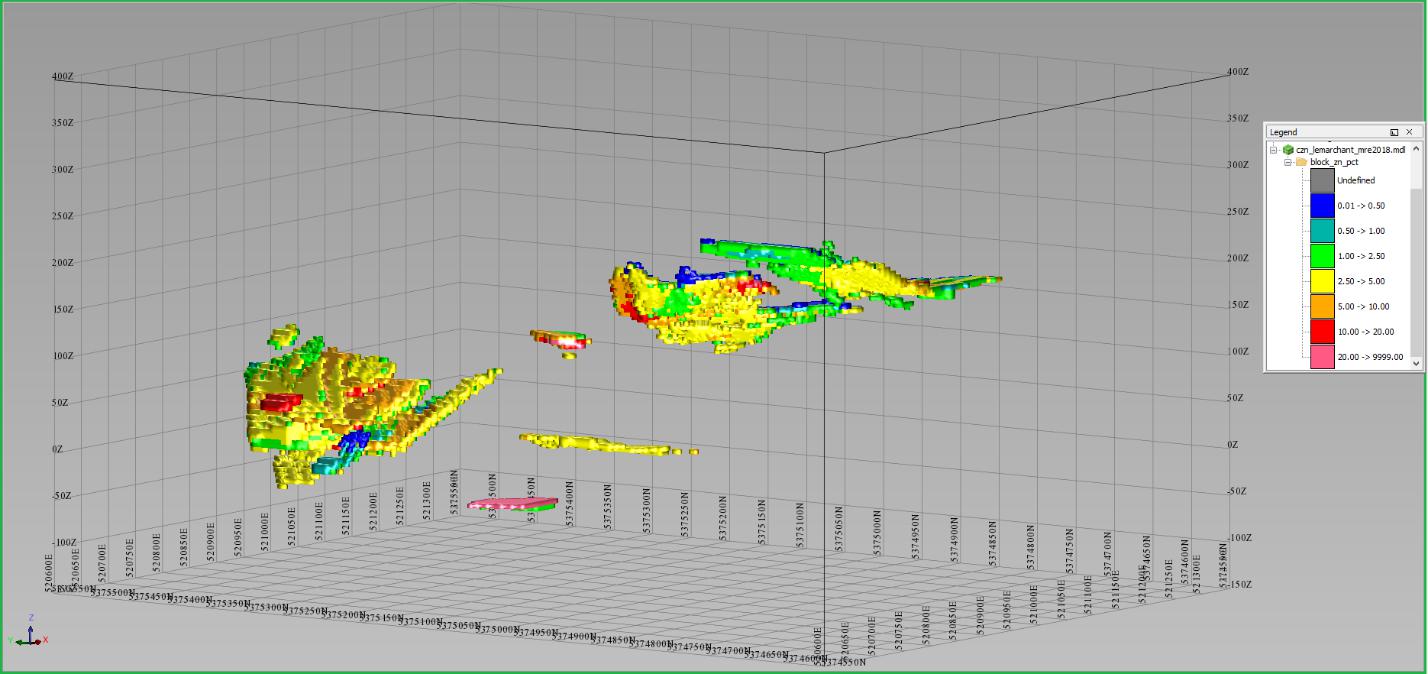
Note: Zn % Legend: < 0.5 (blue), 0.5 - 1 (cyan), 1 - 2.5 (green), 2.5 - 5 (yellow), 5 - 10 (orange), 10 - 20 (red), > 20 (pink)
Figure 14-32: Isometric northeast view of Pb % block model grade distribution at 4 % Zn Eq. cutoff
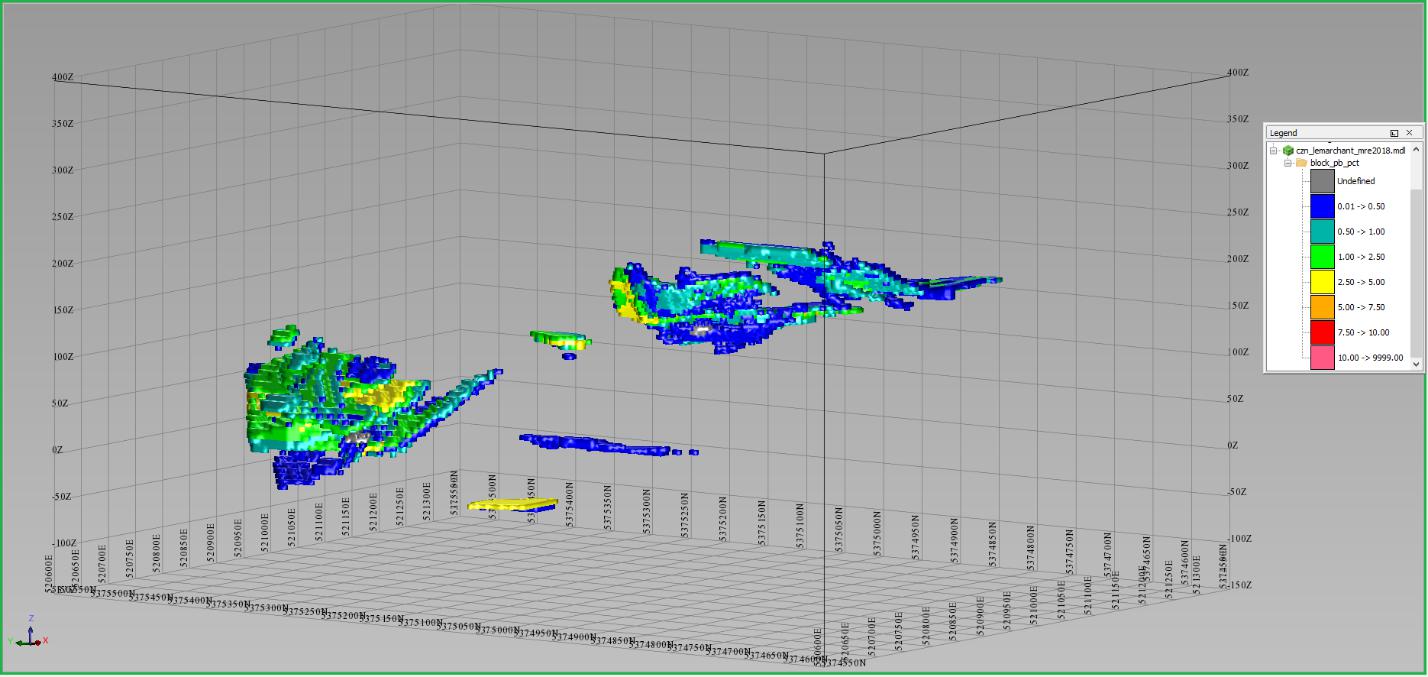
Note: Pb % Legend: < 0.5 (blue), 0.5 - 1 (cyan), 1 - 2.5 (green), 2.5 - 5 (yellow), 5 - 7.5 (orange), 7.5 - 10 (red), > 10 (pink)
| | NI43-101 Technical Report and Updated Resource Estimate South Tally Pond Property – Lemarchant Deposit |
Figure 14-33: Isometric northeast view of Cu % block model grade distribution at 4 % Zn Eq. cutoff
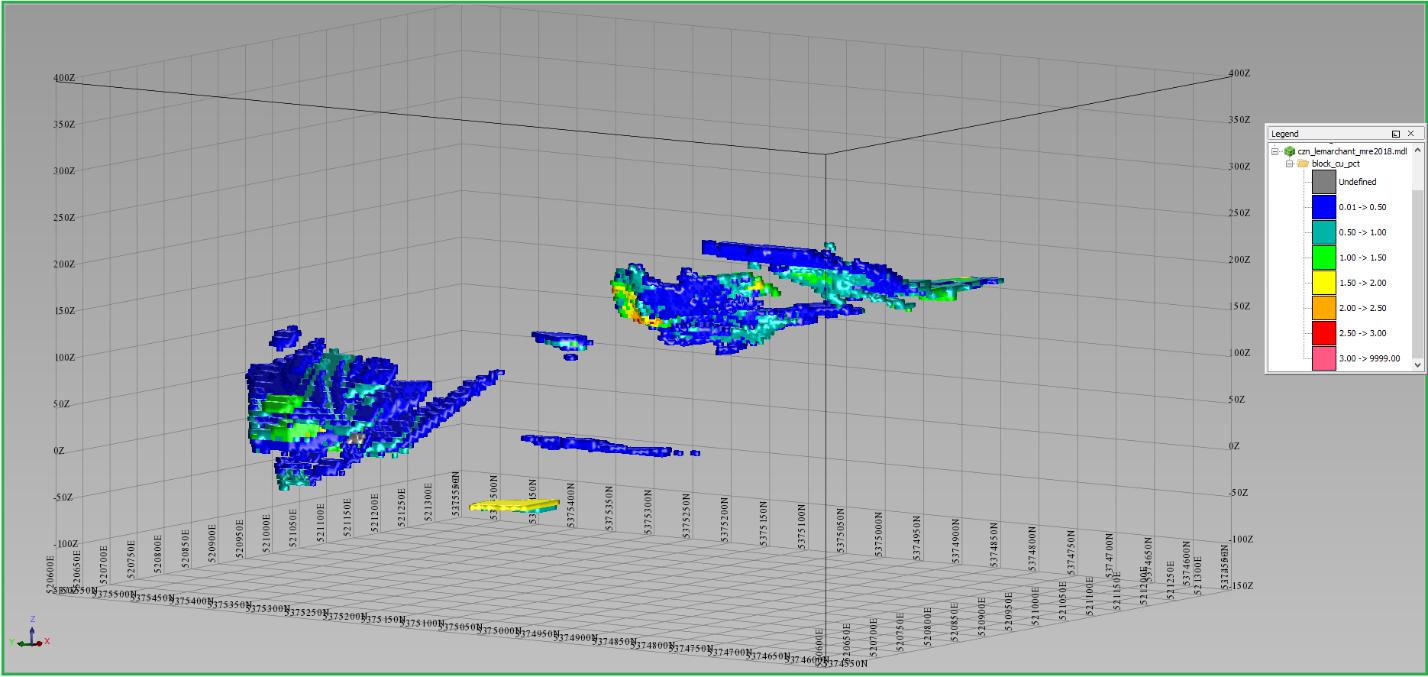
Note: Cu % Legend: < 0.5 (blue), 0.5 - 1 (cyan), 1 - 1.5 (green), 1.5 - 2 (yellow), 2 - 2.5 (orange), 2.5 - 3 (red), > 3 (pink)
Figure 14-34: Isometric northeast view of Au g/t block model grade distribution at 4 % Zn Eq. cutoff
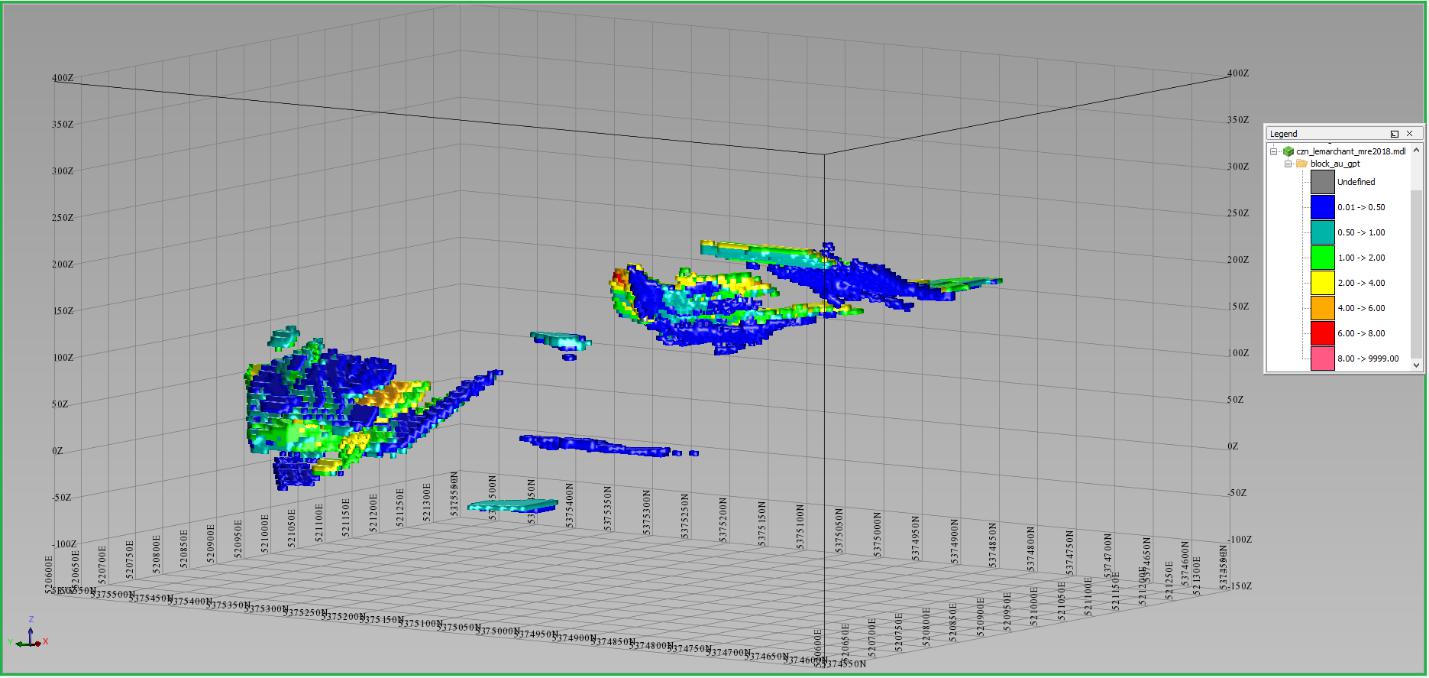
Note: Au g/t Legend: < 0.5 (blue), 0.5 - 1 (cyan), 1 - 2 (green), 2 - 4 (yellow), 4 - 6 (orange), 6 - 8 (red), > 8 (pink)
| | NI43-101 Technical Report and Updated Resource Estimate South Tally Pond Property – Lemarchant Deposit |
Figure 14-35: Isometric northeast view of Ag g/t block model grade distribution at 4 % Zn Eq. cutoff
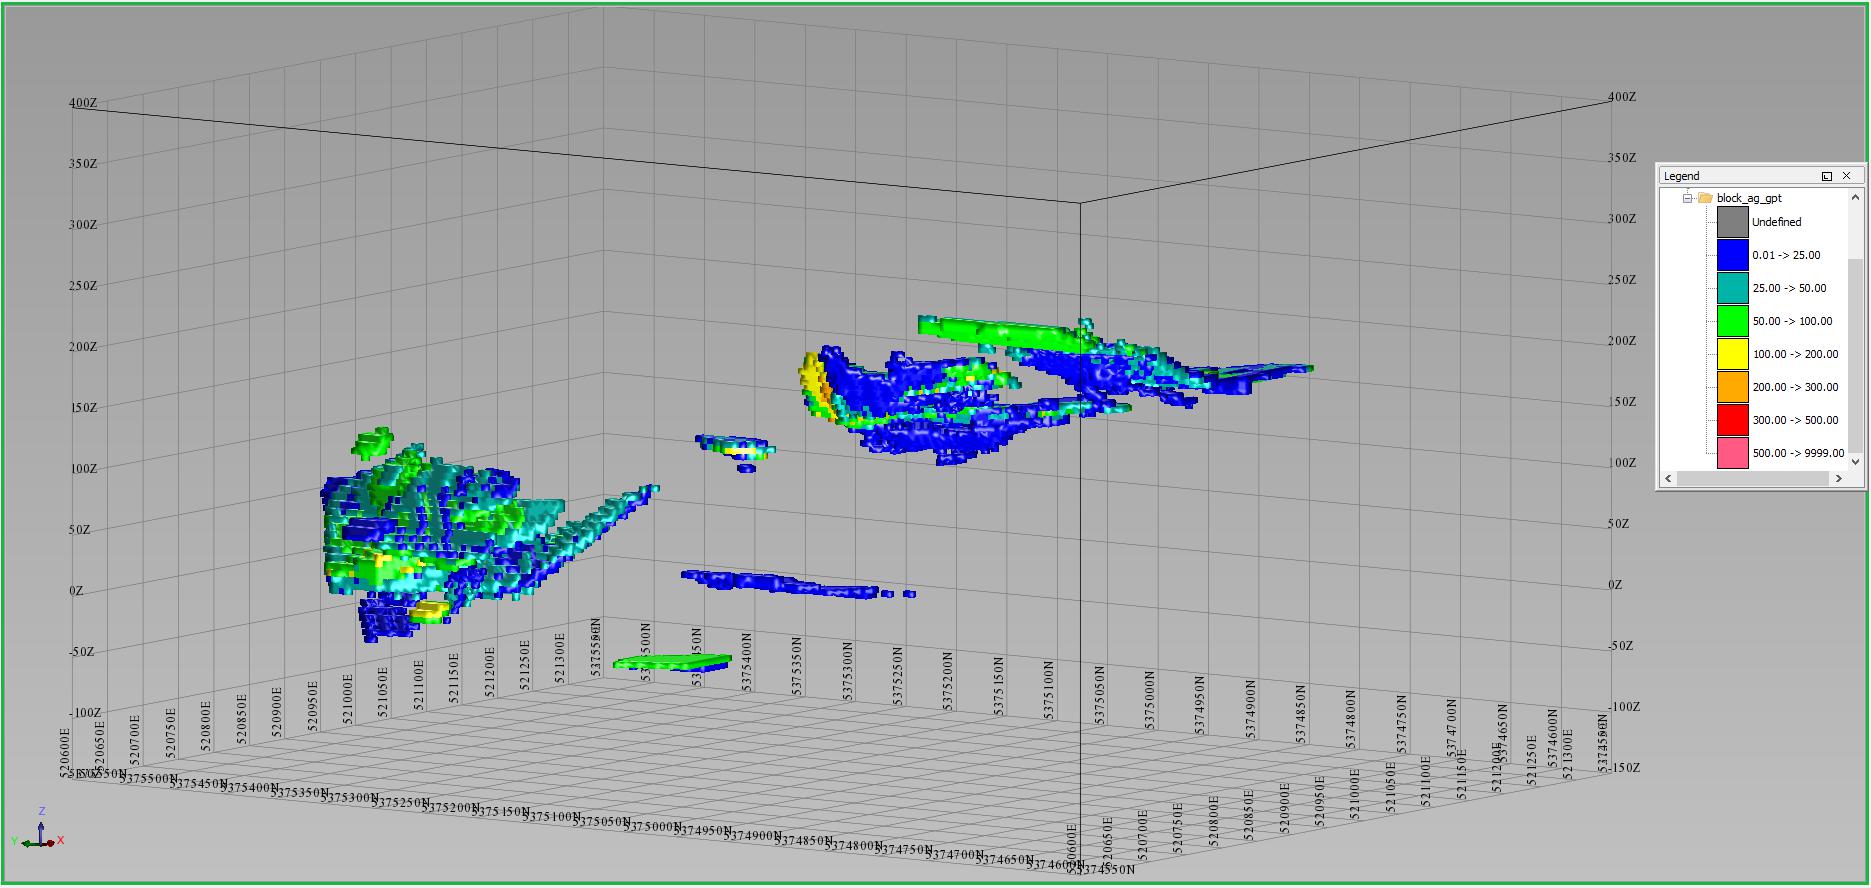
Note: Ag g/t Legend: < 25 (blue), 25 - 50 (cyan), 50 - 100 (green), 100 - 200 (yellow), 200 - 300 (orange), 300 - 500 (red), > 500 (pink)
Figure 14-36: Isometric northeast view of BaSO4 % block model grade distribution at 4 % Zn Eq. cutoff
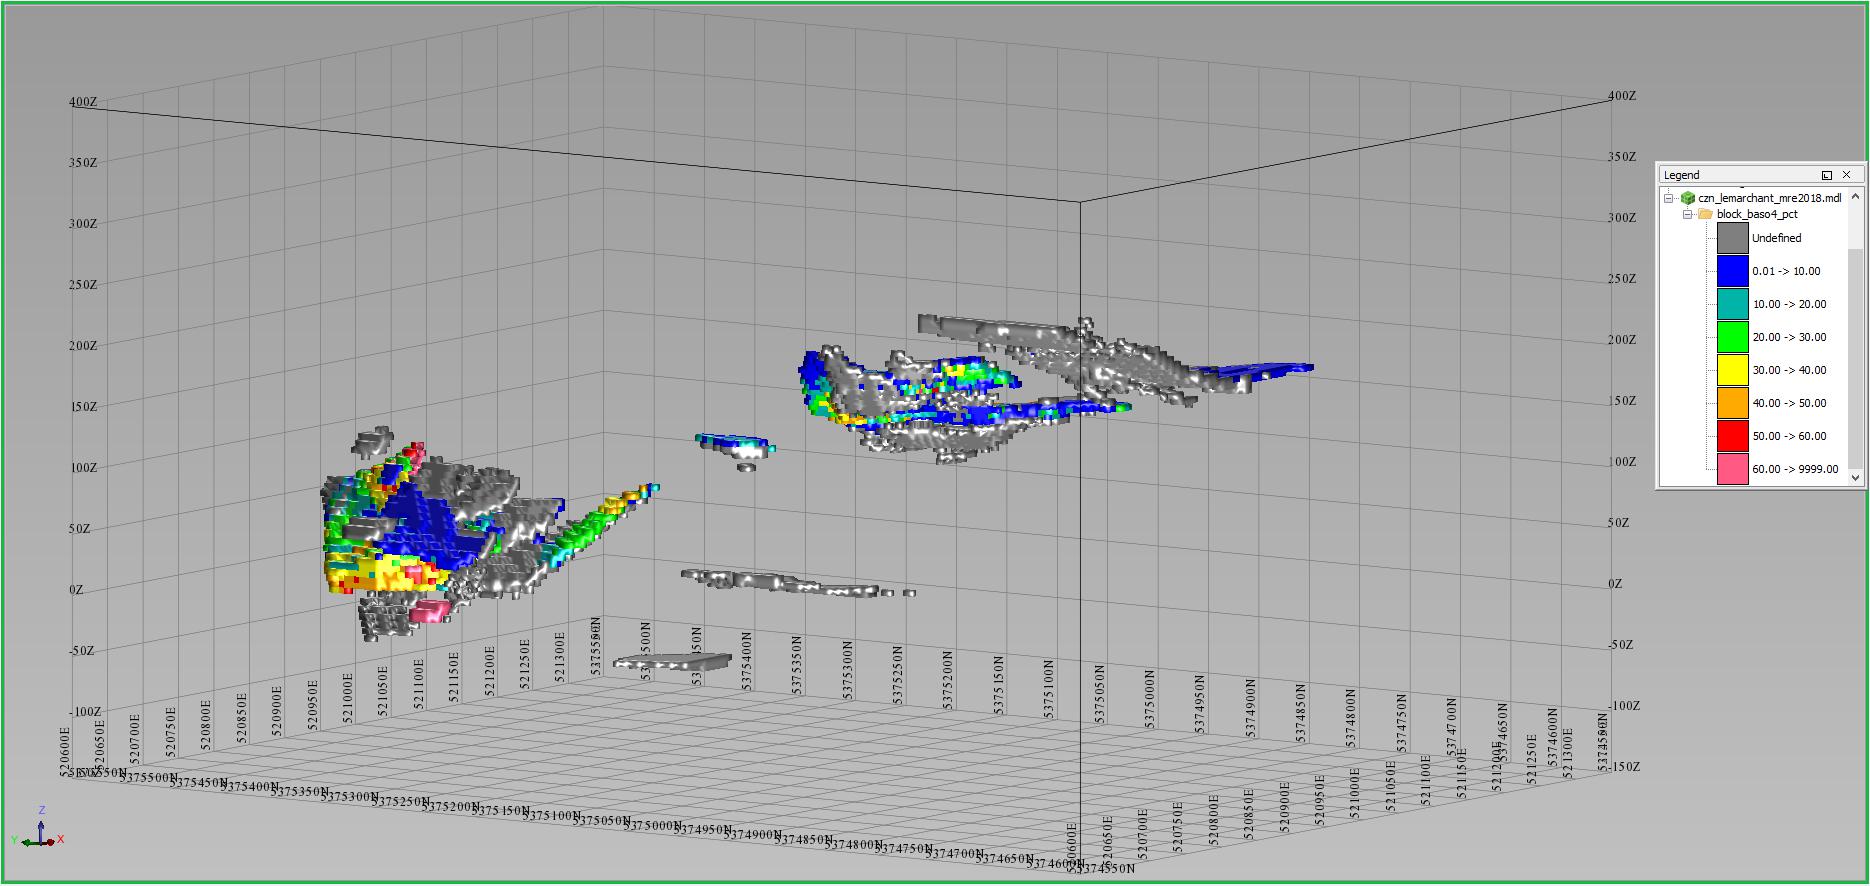
Note: BaSO4 % Legend: < 10 (blue), 10 - 20 (cyan), 20 - 30 (green), 30 - 40 (yellow), 40 - 50 (orange), 50 - 60 (red), > 60 (pink)
| | NI43-101 Technical Report and Updated Resource Estimate South Tally Pond Property – Lemarchant Deposit |
Figure 14-37: Plan view of block category distribution at 4% Zn Eq. cutoff

Note: Red = Indicated, Blue = Inferred
Figure 14-38: Isometric southwest view of block category distribution at 4% Zn Eq. cutoff
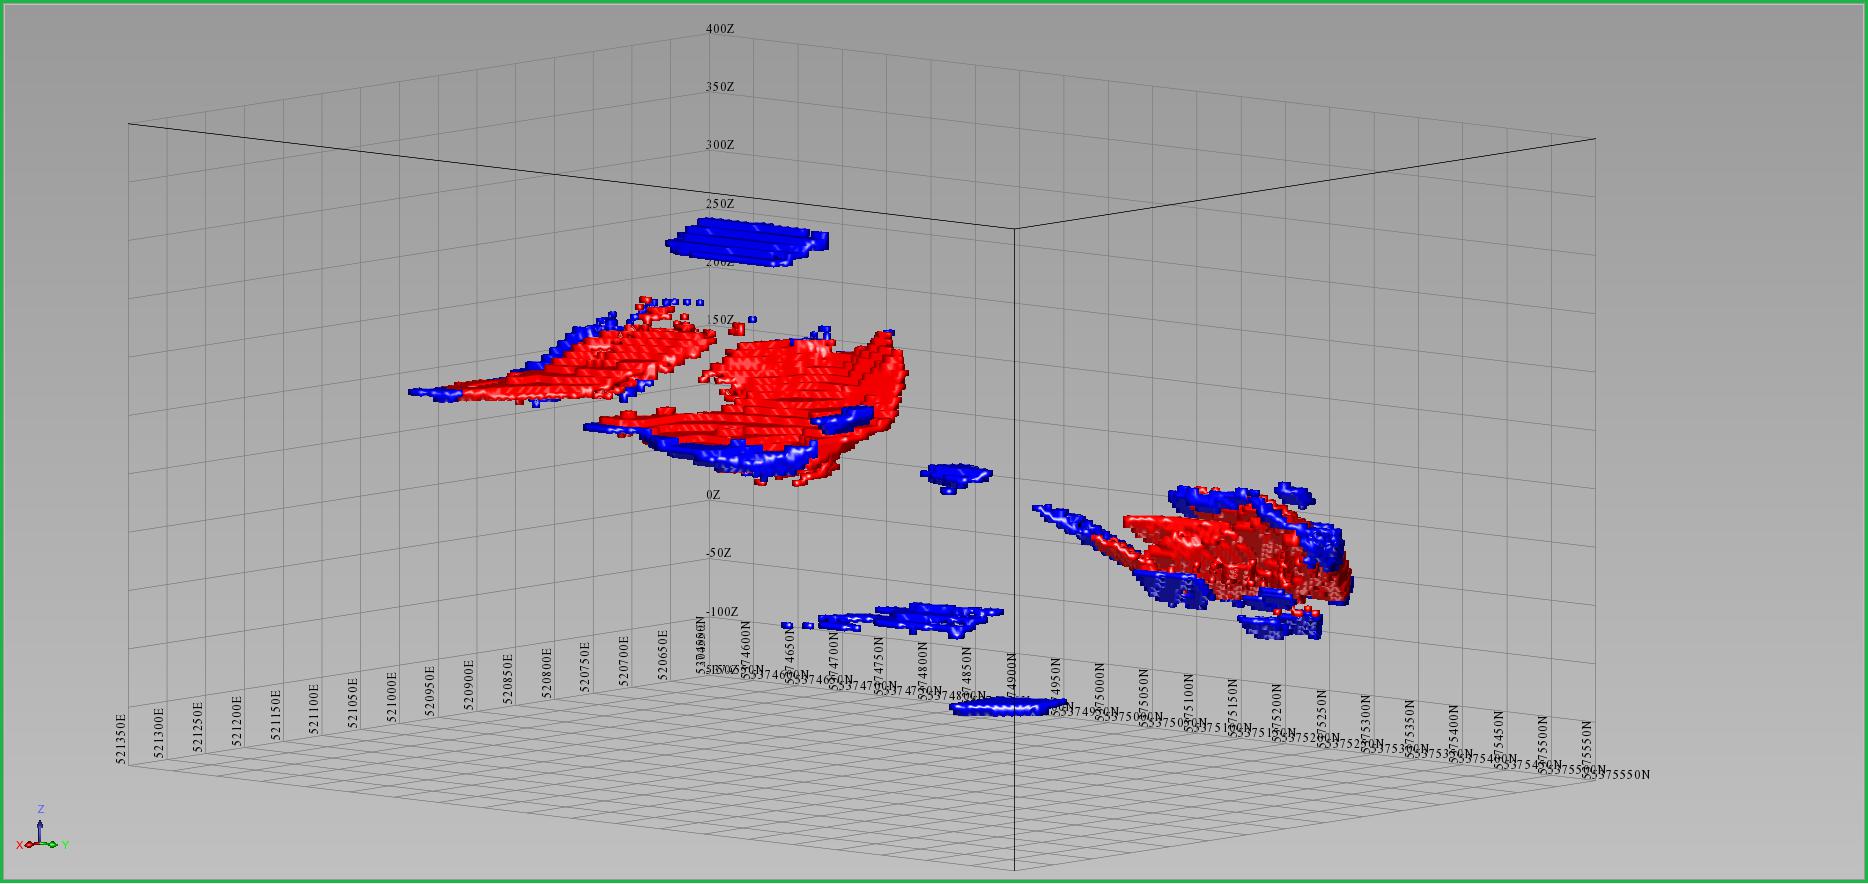
Note: Red = Indicated, Blue = Inferred
| | NI43-101 Technical Report and Updated Resource Estimate South Tally Pond Property – Lemarchant Deposit |
Figure 14-39: Lemarchant Deposit Zn Eq. % grade - tonnage chart

Figure 14-40: Lemarchant Main and Northwest Zone Zn Eq.% grade - tonnage chart
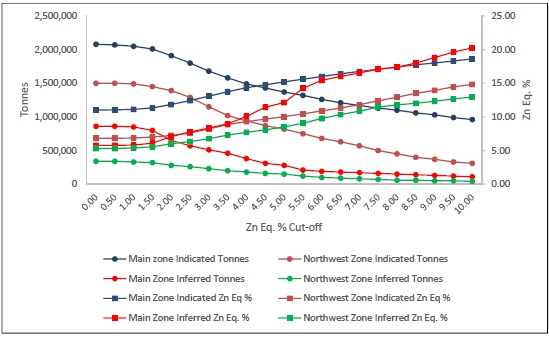
| | NI43-101 Technical Report and Updated Resource Estimate South Tally Pond Property – Lemarchant Deposit |
Figure 14-41: Lemarchant Deposit Zn % grade tonnage chart
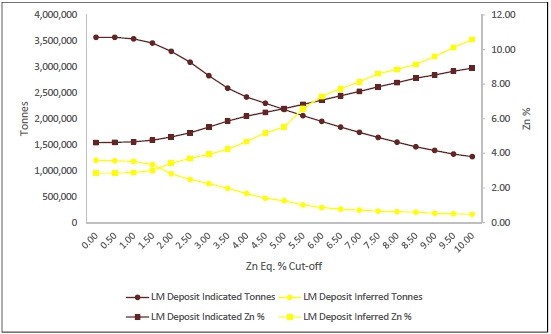
Figure 14-42: Lemarchant Main and Northwest Zone Zn % grade tonnage chart
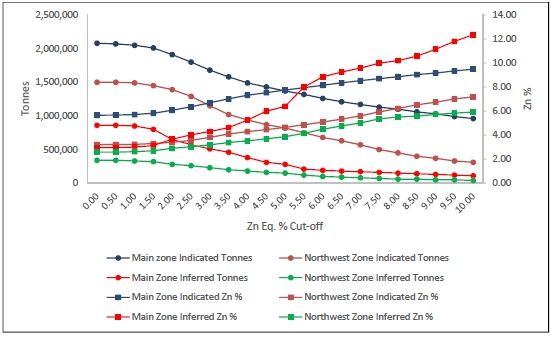
| | NI43-101 Technical Report and Updated Resource Estimate South Tally Pond Property – Lemarchant Deposit |
Figure 14-43: Lemarchant Deposit Pb % grade tonnage chart
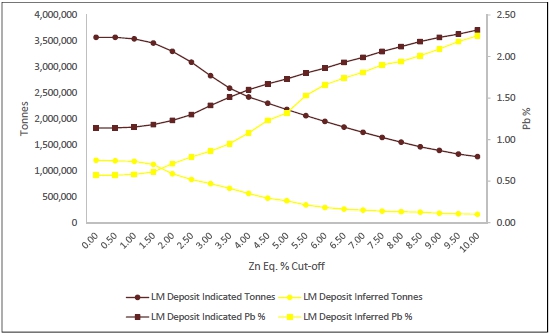
Figure 14-44: Lemarchant Main and Northwest Zone Pb % grade tonnage chart

| | NI43-101 Technical Report and Updated Resource Estimate South Tally Pond Property – Lemarchant Deposit |
Figure 14-45: Lemarchant Deposit Cu % grade tonnage chart
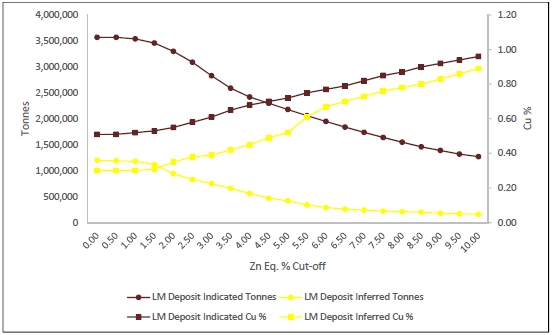
Figure 14-46: Lemarchant Main and Northwest Zone Cu % grade tonnage chart
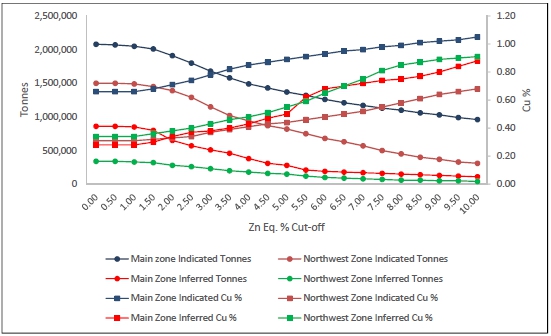
| | NI43-101 Technical Report and Updated Resource Estimate South Tally Pond Property – Lemarchant Deposit |
Figure 14-47: Lemarchant Deposit Au g/t grade tonnage chart
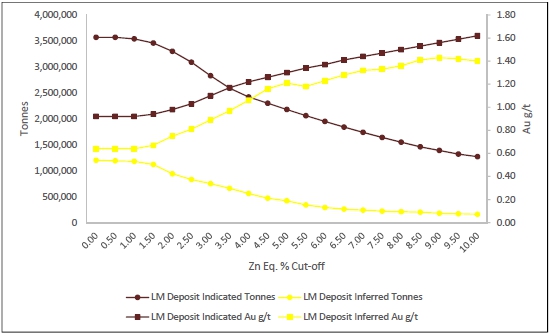
Figure 14-48: Lemarchant Main and Northwest Zone Au g/t grade tonnage chart

| | NI43-101 Technical Report and Updated Resource Estimate South Tally Pond Property – Lemarchant Deposit |
Figure 14-49: Lemarchant Deposit Ag g/t grade tonnage chart
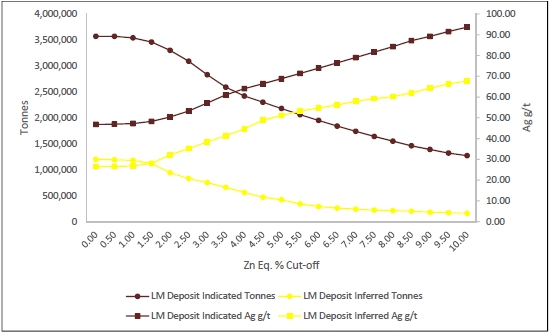
Figure 14-50: Lemarchant Main and Northwest Zone Ag g/t grade tonnage chart

| | NI43-101 Technical Report and Updated Resource Estimate South Tally Pond Property – Lemarchant Deposit |
Figure 14-51: Lemarchant Deposit BaSO4 % grade tonnage chart
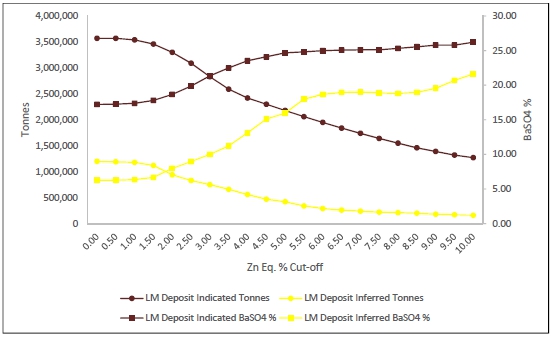
Figure 14-52: Lemarchant Main and Northwest Zone BaSO4 % grade tonnage chart
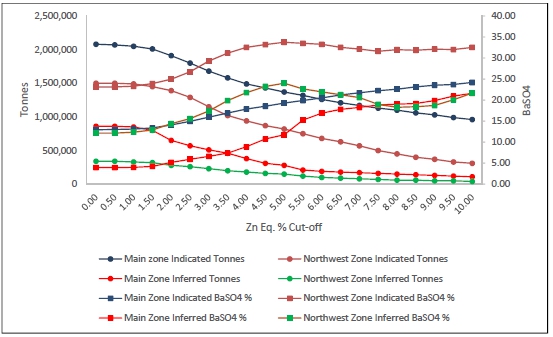
| | NI43-101 Technical Report and Updated Resource Estimate South Tally Pond Property – Lemarchant Deposit |
Results of block modeling were reviewed in three dimensions and compared on a section by section basis with associated drillhole data. Block grade distributions were deemed to show acceptable correlation with the drillhole data. Visual inspection of zinc, lead, copper, gold, silver, and barite distribution trends also showed consistency between the block model and the independently derived geological interpretations of the deposit. In addition, block model statistics for the combined resource solids were reported and tabulated at a zero cutoff value to facilitate inspection of basic statistical parameters. Results appear below in Table 14-15 and 14-16 and include favorably low coefficient of variation values for all metals.
Block volume estimates for each resource solid were compared with corresponding solid model volume reports generated in Surpac™ and results showed good correlation, indicating consistency in volume capture and block model volume reporting. For each geological unit, average block grade values were compared with the underlying assay composite dataset averages and in all cases results were deemed acceptable. Mercator also created horizontal swath plots in both northing and easting directions for each block values, tonnage and average assay composite values. The resulting spatial distribution trends of the average assay grades and the average block grade values compared favorably in all cases considered.
An inverse distance squared (ID2) check model for the Lemarchant Deposit was performed to check the ordinary kriging (OK) interpolation methodology and results appear in Table 14-17. Interpolation parameters were the same as those used in the OK model except each metal was interpolated with the average ellipsoid range from all metals. Results of the ID2 modeling showed that average grades and tonnage closely match those of the OK model. Results of the two methods are considered sufficiently consistent to provide an acceptable check.
Table 14-15: Composite zinc, lead, copper, gold, silver, barite and density statistics
| Parameter | Zn % | Pb % | Cu % | Au g/t | Ag g/t | BaSO4 % | Density g/cm3 |
| Mean Grade | 3.92 | 0.85 | 0.43 | 0.70 | 32.89 | 10.52 | 3.16 |
| Maximum Grade | 36 | 15.26 | 5.76 | 14.5 | 550 | 100 | 2.35 |
| Minimum Grade | 0 | 0 | 0 | 0 | 0 | 0 | 4.47 |
| Variance | 37.16 | 3.05 | 0.44 | 2.02 | 4,829.46 | 410.88 | 0.32 |
| Standard Deviation | 6.10 | 1.75 | 0.66 | 1.42 | 69.49 | 26.62 | 0.56 |
| Coefficient of Variation | 1.55 | 2.05 | 1.54 | 2.02 | 2.11 | 2.53 | 0.18 |
| Number of Samples | 1242 | 1242 | 1242 | 1242 | 1242 | 1242 | 1196 |
| | NI43-101 Technical Report and Updated Resource Estimate South Tally Pond Property – Lemarchant Deposit |
Table 14-16: Block zinc, lead, copper, gold, silver, barite and density statistics
| Parameter | Zn % | Pb % | Cu % | Au g/t | Ag g/t | BaSO4 % | Density g/cm3 |
| Mean Grade | 3.49 | 0.75 | 0.40 | 0.73 | 31.92 | 8.58 | 3.11 |
| Maximum Grade | 30.54 | 10.82 | 2.92 | 8.16 | 486.07 | 95.15 | 4.46 |
| Minimum Grade | 0 | 0 | 0 | 0 | 0.14 | 0 | 2.61 |
| Variance | 16.34 | 0.99 | 0.16 | 0.70 | 1742.496 | 333.05 | 0.18 |
| Standard Deviation | 4.04 | 0.99 | 0.39 | 0.83 | 41.74 | 18.25 | 0.42 |
| Coefficient of Variation | 1.16 | 1.33 | 1.00 | 1.15 | 1.31 | 2.13 | 0.13 |
| Number of Samples | 23,283 | 23,283 | 23,283 | 23,283 | 23,283 | 23,283 | 23,283 |
Table 14-17: Comparison between OK and ID2 methodologies (global estimates)
| Method | Category | Rounded Tonnes | Zn (%) | Pb (%) | Cu (%) | Au (g/t) | Ag (g/t) | BaSO4 (%) | Zn Eq. (%) |
| ID2 | Indicated | 3,570,000 | 4.53 | 1.16 | 0.50 | 0.92 | 48.27 | 18.41 | 9.17 |
| Inferred | 1,200,000 | 2.84 | 0.66 | 0.32 | 0.63 | 27.05 | 6.91 | 5.75 |
| |
| Ok | Indicated | 3,570,000 | 4.62 | 1.14 | 0.51 | 0.92 | 46.79 | 17.22 | 9.25 |
| Inferred | 1,200,000 | 2.86 | 0.57 | 0.30 | 0.64 | 26.46 | 6.26 | 5.63 |
| | NI43-101 Technical Report and Updated Resource Estimate South Tally Pond Property – Lemarchant Deposit |
| 15.0 | MINERAL RESERVE ESTIMATES |
There are no current Mineral Reserves at the Lemarchant Deposit
This section is not applicable.
This section is not applicable.
| 18.0 | PROJECT INFRASTRUCTURE |
This section is not applicable.
| 19.0 | MARKET STUDIES AND CONTRACTS |
This section is not applicable.
| 20.0 | ENVIRONMENTAL STUDIES, PERMITTING AND SOCIAL OR COMMUNITY IMPACT |
Baseline water sampling programs were completed by Stantec Consulting Ltd of St. Johns, NL in 2013 and 2014. The water sampling programs consisted of three sampling sessions each year: mid-winter low water conditions (February-March), spring peak high flow conditions (May), and summer medium flow conditions (August-September) at 6 sample sites in the area surrounding the Lemarchant Deposit.
Exploration activities are permitted under various Land Use and Exploration Permits that are issued by the Government of Newfoundland and Labrador, Department of Natural Resources Mineral Lands Division, on an as-needed basis. The Government of Newfoundland and Labrador monitor all exploration activity and periodically inspects the properties to ensure that the work is undertaken in a responsible manner and, when complete, have been properly reclaimed according to the mining guidelines.
NorZinc bases its’ Newfoundland exploration operations from its office and core storage facility located at Buchans Junction near Millertown. The Company tries to maximize and utilize what support services are available from the local communities and region.
| 21.0 | CAPITAL AND OPERATING COSTS |
This section is not applicable.
No economic analysis has been completed on the Property.
| | NI43-101 Technical Report and Updated Resource Estimate South Tally Pond Property – Lemarchant Deposit |
This section is not applicable.
| 24.0 | OTHER RELEVANT DATA AND INFORMATION |
There is no other relevant data or information to present on the Property.
| | NI43-101 Technical Report and Updated Resource Estimate South Tally Pond Property – Lemarchant Deposit |
| 25.0 | INTERPRETATION AND CONCLUSIONS |
The South Tally Pond Property is located in a proven mining district in central Newfoundland. Significant mineral deposits in the district include the world-class, past producing Buchans polymetallic massive sulphide deposits developed and mined by Asarco that supported Canada’s historically richest major base metal mining operation on a grade basis, and the past producing Duck Pond massive sulphide (Cu-Zn) deposit owned by Teck Resources Limited. The South Tally Pond Property is located in the same volcanic belt as the Duck Pond mine, which is 20 km northeast of the Lemarchant Deposit.
The South Tally Pond Property is underlain by the Tally Pond Group, one of six volcanic belts that make up the Victoria Lake Supergroup. The eastern-most Tally Pond Group, consists of a sequence of submarine felsic and mafic volcanic rocks and related intrusive rocks that are highly prospective for volcanogenic massive sulphide deposits. The volcanic and sedimentary rocks are obscured in most areas by thick surficial deposits, so map patterns are not well constrained and often determined by regional airborne geophysics.
Previous exploration in the area was focused extensively on the Duck Pond and Boundary massive sulphide deposits which are located immediately to the northeast and do not constitute part of the Property. Intermittent exploration outside of these areas ultimately led to the discovery of the Lemarchant, Rogerson Lake, Bindons Pond, Lemarchant SW, Spencer’s Pond and Beaver Lake prospects on the Property. Other than the more recent drilling programs by Paragon and NorZinc at the Lemarchant Deposit, each of these prospects has seen limited drilling and represents an underexplored, prospective VMS environment that requires additional exploration.
Drilling by Paragon at the Lemarchant prospect led to the discovery of the Lemarchant massive sulphide mineralization in 2007. Paragon’s exploration work outlined a significant precious metal rich, copper-lead-zinc massive sulphide zone (the Main Zone) between sections 101+00N to 104+00N. Based on Paragon’s drilling from 2007 to 2011, an initial National Instrument 43-101 resource estimate on the Main Zone was completed by Paragon in 2012.
NorZinc (formerly Canadian Zinc Corporation) acquired Paragon in 2012 and completed 28,675 metres of diamond drilling in 91 drill holes and 8 drillhole extensions over 7 drill programs. The drilling successfully extended the mineralization 250 metres to the northwest (Northwest Zone), located additional mineralization up-dip of the Main Zone, and provided further definition of the Lemarchant Deposit. A total of 165 drill holes for 52,950 metres have now been completed at the Lemarchant Deposit including 14 Noranda drill holes and 60 Paragon drill holes.
As currently defined, the Lemarchant Deposit consists of two stratiform massive to semi-massive sulphide zones and underlying stringer zones located between section 100+50N to 104+50N (Main Zone) and between section 105+00N to 107+00N (Northwest Zone). The Main Zone mineralization is located approximately 120 to 210 metres below surface, dips gently to the east, and is truncated by the Lemarchant thrust fault down dip. The Northwest Zone is located approximately 300 to 350 metres below surface, dips gently to the west, and is truncated by gabbroic intrusion(s) to the east and by thrust faults to the west. Mineralization is characterized by high-grade, zinc-lead-copper semi-massive to massive sulphides with significant precious metal (gold, silver) contents, massive mineralized barite intervals, and an underlying base metal rich stringer sulphide zone. The massive sulphides zones vary in thickness from less than 1 metre to 30.4 metres and are generally underlain by a sequence of intensely altered and mineralized felsic volcanic rocks.
| | NI43-101 Technical Report and Updated Resource Estimate South Tally Pond Property – Lemarchant Deposit |
Two principal deformation events are recognized in the Lemarchant area as having significantly affected the geometry of the deposit: i) a D1 event characterized as east-verging thrust faulting that occurred in response to terrane accretion in the late Paleozoic; and ii) a D2 event represented by steeply-dipping, oblique normal faulting during later extension. The D1 structures comprise broad ductile shear zones, pervasive S1 foliation and close to tight folds. Extensional tectonics resulted in late-stage D2 brittle faulting with strike-slip faults bisecting the deposit and leading to internal block rotation within the Northwest Zone. Syn- to post-mineralization mafic intrusions intruded along weakened stratigraphic contacts and structurally prepared D1 Lemarchant Fault, resulting in obscured structural contacts and destruction of mineralization along targeted horizons.
Structural complexities, specifically in the Northwest Zone remain unresolved at present due to limitations imposed by the lack of downhole structural data. In order to increase the resolution to the point where it can provide critical insights from an exploration perspective, additional structural orientation data should be collected.
Ground electromagnetic (EM) geophysical surveys have aided in defining additional drill targets in the Lemarchant area. The conductive targets are typically reflective of the pyrite and/or pyrrhotite rich mudstone horizons which may be associated with massive sulphide base metal mineralization.
Academic studies on the Lemarchant Deposit by Gill and Piercey (2015), Lode (2016), and Cloutier (2017) provide valuable insights into the geology and genesis of the Lemarchant Deposit. These studies provide useful information to aid exploration efforts in locating additional mineralization and/or new exploration targets.
Metallurgical studies completed by Thibault & Associates Inc. on a representative massive sulphide-barite sample and a footwall sample from the Lemarchant Deposit indicate favourable metal recoveries. The bench scale flotation tests provided open circuit flotation grades and recoveries at each individual process step. To-date, no closed circuit (lock cycle) tests have been conducted.
An updated Mineral Resource Estimate prepared in accordance with NI43-101 and the CIM Standards (as amended in 2014) having an effective date of September 20, 2018 was prepared for the Lemarchant Deposit by Mercator Geological Services Ltd. This estimate is based on a 4.0% Zn Eq. cutoff value, which is considered to reflect a reasonable expectation of economic extraction in the foreseeable future using conventional underground mining methods. The summarized Mineral Resource Estimate is as follows:
| | NI43-101 Technical Report and Updated Resource Estimate South Tally Pond Property – Lemarchant Deposit |
| • | Indicated Mineral Resource of2.42 million tonnes grading 6.5% Zn, 1.6% Pb, 0.68% Cu, 1.22 g/t Au and 64.04 g/t Ag (12.4 % Zn Eq) and 23.53% BaSO4 (at 4.0% Zn Eq. grade cut-off) |
| • | Inferred Mineral Resource of0.56 million tonnes grading 4.68% Zn, 1.08% Pb, 0.45% Cu, 1.08 g/t Au and 44.67 g/t Ag (9.31% Zn Eq) and 13.11% BaSO4 (at 4.0% Zn Eq. grade cut-off). |
The Lemarchant Deposit remains open for expansion along strike to the south and north of currently defined mineralization. Drilling in these areas, specifically where single drill holes have intersected altered felsic volcanic rocks and/or base metal mineralization should be further tested by drilling. Additional drilling up-dip of the currently defined Main Zone mineralization up to surface is also warranted.
Volcanogenic massive sulphide deposits are known to occur in clusters and a number of the nearby prospects, such as SW Lemarchant, Bindons Pond, and Rogerson Lake prospects should be further evaluated by diamond drilling.
| | NI43-101 Technical Report and Updated Resource Estimate South Tally Pond Property – Lemarchant Deposit |
Based on the encouraging results of the exploration work completed to date at the Lemarchant Deposit, addition exploration work aimed at further extending the Lemarchant Deposit is well warranted. The recommended work program consists of a combination of step-out drilling to further define the extent of the Lemarchant Deposit, infill drilling to support upgrading of Inferred Mineral Resources to Indicated Mineral Resources, plus geophysical surveying and drill testing of the nearby SW Lemarchant and Bindons Pond prospects. Additional work on defining barite recovery and marketability is also recommended.
A two-phase work program and budget is recommended, with commitment to Phase 2 being contingent on substantively positive results being returned from Phase 1. The proposed two phase program budget is summarized in Table 26-1.
The Phase 1 program includes 10,000 metres of diamond drilling in 40 drill holes to further define the nature and extend the Lemarchant Deposit and to begin investigating two other priority target areas. More specifically,
| 1) | Diamond drilling at the Lemarchant Deposit should focus on: |
| a) | Drill testing up-dip of the currently defined Main Zone mineralization to the surface between Sections 101 to 104N. |
| b) | Drill testing to the north of the currently defined Northwest Zone mineralization, where mineralization may have been offset by east-west trending structures. |
| c) | Drill testing to the south-southwest of the Main Zone massive sulphide in the vicinity of LM91-01 where drilling intersected significant stringer sulphides. |
| d) | Additional drill testing to the north and and down-dip of the massive sulphide mineralization intersected in LM08-24 (Section 105N), where massive sulphides, proximal felsic volcanic rocks and extensive hydrothermal alteration have been intersected. |
| 2) | Diamond drilling at SW Lemarchant prospect to begin testing the TDEM conductors outlined during the 2016 geophysical program. |
| 3) | Ground TDEM geophysical and/or gravity surveys to further define drill targets at the Bindons Pond prospect; and |
| 4) | Further define the potential of producing barite as a co-product of the Lemarchant Deposit. |
The Phase 2 program should focus on continued definition drilling of the Lemarchant Deposit and metallurgical studies leading to a PEA.
| | NI43-101 Technical Report and Updated Resource Estimate South Tally Pond Property – Lemarchant Deposit |
Table 26-1: Recommended Program Budget - Phase 1 and 2
| PHASE 1 PROGRAM | $ CDN |
| | |
| Project Management | $100,000 |
| Geologists / Geotechnicians (core logging, reporting) | $215,000 |
| Geophysical Consultant | $8,000 |
| Travel Costs (airfares, truck mileage) | $15,000 |
| Field Costs (truck rental, fuel, accommodation, food, etc.) | $50,000 |
| Communications | $3,000 |
| Computer hardware/software | $15,000 |
| | |
| Diamond drilling (1 Drill - 10,000 metres, 5 months) | |
| a)Lemarchant Main (up-dip) - 14 drill holes (2000 m @ $100) | $200,000 |
| b)Lemarchant Northwest (north extension) - 6 drill holes (3,000 m @ $100) | $300,000 |
| c)Lemarchant Main (south extension) - 12 drill holes (2,000 m @ $100) | $200,000 |
| d)Lemarchant North (lower block) - 4 drill holes (2,000 m @ $100) | $200,000 |
| e)Lemarchant SW - 4 drill holes (1000 m @ $100) | $100,000 |
| | |
| Geochemistry - Assaying (2000 samples) | $90,000 |
| Geochemistry - Whole Rock (300 samples) | $15,000 |
| Geophysics - Borehole EM (select new drill holes) | $35,000 |
| Geophysics - Ground Magnetics, Gravity, TDEM (Bindons Pond - 12 line km) | $72,000 |
| Environmental Baseline Studies & Consulting | $12,000 |
| | |
| Sub-total | $ 1,630,000 |
| Contingency (~8%) | $ 130,000 |
| TOTAL PHASE 1 | $ 1,760,000 |
| | |
| | |
| PHASE 2 PROGRAM | $ CDN |
| | |
| Infill Diamond Drilling - Lemarchant (10,000 metres) | $1,500,000 |
| Metallurgical Testing (lock cycle) | $150,000 |
| Update 43-101 Resource Estimate | $75,000 |
| Preliminary Economic Assessment | $100,000 |
| Continued Environmental Baseline Studies | $25,000 |
| | |
| Sub-total | 1,850,000 |
| Contingency (~8%) | 150,000 |
| TOTAL PHASE 2 | 2,000,000 |
| | |
| | NI43-101 Technical Report and Updated Resource Estimate South Tally Pond Property – Lemarchant Deposit |
AMEC et al. (2003): Duck Pond Feasibility Update, November 2003. Prepared by AMEC E&C Services Limited for Aur Resource Inc. Newfoundland and Labrador. Newfoundland and Labrador Geological Survey, Assessment File 12A/1292, 693 pages.
Barbour, D. and Churchill, R. (2002): Third Year Assessment Report on Geological & Lithogeochemical Investigations, License 8183M, South Tally Pond Property, Rogerson Lake Area, Central Newfoundland, 2 Reports, NTS 12A/10 & 12A/07. Newfoundland and Labrador Geological Survey, Assessment File 12A/0931, 108 pages.
Barbour, D. and Churchill, R. (2003): Fourth Year Assessment Report on Lithogeochemical Investigations, License 8183M, South Tally Pond Property, Rogerson Lake Area, Central Newfoundland, NTS 12A/10 & 12A/07. Newfoundland and Labrador Geological Survey, Assessment File 12A/1032, 42 pages.
Barbour, D. and Churchill, R. (2004): First and Fifth Year Assessment Report on Geological Mapping and Lithogeochemical investigations, Licenses 9569M & 8183M, South Tally Pond Property, Rogerson Lake Area, Central Newfoundland, NTS 12A/10 & 12A/07. Newfoundland and Labrador Geological Survey, Assessment File 12A/1112, 61 pages.
Barbour, D. and Churchill, R. (2005): First Year Supplementary & Second Year and Fifth Year Supplementary & Sixth Year Assessment Report on Geological Mapping, Lithogeochemistry, Diamond Drill Core Re-logging, & Airborne HTEM Surveying, Licenses 9569M & 8183M, South Tally Pond Property, Rogerson Lake Area, Central Newfoundland, NTS 12A10 & 12A07. Newfoundland and Labrador Geological Survey, Assessment File 12A/1184, 291 pages.
Barrie and Hannington, M.D. (1999): Classification of volcanogenic-associated massive sulfide deposits based on host-rock composition; in Volcanogenic-Associated Massive Sulfide Deposits: Processes and Examples in Modern and Ancient Settings. Reviews in Economic Geology, Vol. 8, pp 2-12.
Bartsch, C. (2017): Structural Analysis of the Lemarchant VMS Deposit, Central Newfoundland, unpublished report prepared for Canadian Zinc Corporation, 22 pages
Belleau, G. and Pelz, P. (2005): Technical Report on the Duck Pond Project, Central Newfoundland Canada. National Instrument 43-101 Report prepared for Aur Resources Inc and filed on SEDAR. 113 pages
Cloutier, J., Piercey, S.J., Lode, S., Vande Guchte, M. and Copeland, D.A. (2017): Lithostratigraphy and structural reconstruction of the Zn-Pb-Cu-Ag-Au Lemarchant volcanogenic massive sulphide (VMS) Deposit, Tally Pond group, central Newfoundland, Canada, Ore Geology Reviews, Vol. 84, pp. 154-173.
Collins, C.J. (1989): Report on Lithogeochemical Study of the Tally Pond Volcanics and associated alteration and mineralization, Newfoundland and Labrador Geological Survey, Assessment File Report 12A/1033, 34 pages.
| | NI43-101 Technical Report and Updated Resource Estimate South Tally Pond Property – Lemarchant Deposit |
Collins, C. (1990): Report of 1989 Assessment Work on Concession Lands within the Boundary of the Noranda - BP Mining Joint Venture (Reid Lot 229, 231, 234, 235 & AND Charter), NTS 12A/7, 9, 10. Newfoundland and Labrador Geological Survey, Assessment File Report, NFLD/1971
Collins, C. (1990): Fourth Year Assessment Report on the Harpoon Brook Property, Licence 3099, NTS 12A/10. Newfoundland and Labrador Geological Survey, Assessment File Report 12A/10/0604. 11 pages.
Collins, C. (1991): Report on 1990 Assessment work over Concession Lands within the boundary of the Noranda-BP Resources Ltd. Tally Pond Joint Venture, central Newfoundland (Reid Lots 229, 231, 235 and AND Charter). Newfoundland and Labrador Geological Survey, Assessment File Report 12A/10/0610.
Collins, C. (1992): Report on 1991 Assessment Work over Concession Lands within the boundary of the Noranda-BP Resources Ltd. Tally Pond Joint Venture (A.N.D. Charter, Reid Lot 229, 231, 234 & 235), NTS 12A/7, 9 and 10; Newfoundland and Labrador Geological Survey, Assessment File Report 12A/0630.
Collins, C. (1993): Report on 1992 Assessment Work over Concession Lands within the boundary of the Noranda-BP Resources Ltd. Tally Pond Joint Venture (A.N.D. Charter, Reid Lot 231, 234 & 235), NTS 12A/7, 9 and 10. Newfoundland and Labrador Geological Survey, Assessment File Report 12A/0643.
Collins, C. (1994): Assessment report on geochemical and diamond drilling exploration for the Lemarchant Project for 1993 submission on the Anglo-Newfoundland Development Company Limited Charter in the Spencers Pond area, central Newfoundland, Newfoundland and Labrador Geological Survey, Assessment File 12A/0723, 125 pages
Collins, C. (1994): Assessment report on geological, geochemical and geophysical exploration for the Tally Pond Recce Project for 1993 submission on the Anglo- Newfoundland Development Company Limited Charter and Reid Lot 231 in the Beaver Lake, Bindons Pond and Lake of the Woods areas, central Newfoundland, Newfoundland and Labrador Geological Survey, Assessment File 12A/0724, 116 pages
Collins, C. and Squires, G. (1991): Report on Assessment Work over Concession Lands within the Boundary of the Noranda - BP Resources Ltd. Tally Pond Joint Venture (Reid Lot 229, 231, 235 & AND Charter), NTS 12A/7, 9, 10. Government of Newfoundland and Labrador, Geological Survey Assessment File Report 12A/0630.
Coulson, S.T. (1992): Results of TEM Surface and Borehole Surveys over the Prescott, Lemarchant and Mary March Grids. Government of Newfoundland and Labrador, Geological Survey Assessment File Report 12A/0633.
Copeland, D.A. (2007): Assessment Report on Airborne Geophysical Surveying on the Harpoon Property (Licences 7695M, 10461M, 10464M, 10465M, 10607M, 11981M, 12357M, 12885M and 13667M) and the Barren Lake Property (Licences 9109M, 10207M, 13448M and 13449M), Lake Ambrose Area, Newfoundland and Labrador. Newfoundland and Labrador Geological Survey, Assessment File 12A/1341, 2007, 111 pages.
| | NI43-101 Technical Report and Updated Resource Estimate South Tally Pond Property – Lemarchant Deposit |
Copeland, D.A. (2008): Assessment Report on Data Compilation, Prospecting, Soil Sampling, Till Sampling, Trenching, Airborne Geophysical Surveying and Review of Historic Diamond Drill Core on the Harpoon Property (Licences 7695M, 10461M, 10464M, 10465M, 10607M, 11981M, 12357M, 12885M and 13667M) the Barren Lake Property (Licences 9109M, 10207M, 13448M and 13449M) and the South Tally Pond Property (Licence 8183M, 9569M and 14158M). Lake Ambrose Area, Newfoundland and Labrador, NTS 12A/10 and 12A/07. Newfoundland and Labrador Geological Survey, Assessment File Report 12A/1376, 193 pages.
Copeland, D.A., McClenaghan, A.H., and Piercey, S.J. (2008a): 9th Year Assessment Report on Diamond Drilling, Lithogeochemistry, Pulse EM Surveying and Line Cutting on Licence 8183M, South Tally Pond Property, Rogerson Lake Area, Newfoundland and Labrador. Newfoundland and Labrador Geological Survey, Assessment File 12A/1459, 471 pages.
Copeland, D.A., Toole, R.M.S., and Piercey, S.J. (2008b): 10th Year Assessment Report on Diamond Drilling and Soil Sampling on Licences 8183M and 9569M, South Tally Pond Property, Rogerson Lake Area, Newfoundland and Labrador. Newfoundland and Labrador Geological Survey, Assessment File 12A/1345, 985 pages.
Copeland, D.A., Toole, R.M.S., Piercey, S.P. (2009): 10th Year Supplementary Assessment Report on Diamond Drilling and Soil Sampling, Linecutting and Titan 24 Ground Geophysical Surveying, Licence 8183M, South Tally Pond Property, Rogerson Lake Area, Newfoundland and Labrador. Newfoundland and Labrador Geological Survey, Assessment File 12A/1461, 364 pages.
Copeland, D.A. (2010): 11th Year Assessment Report on Diamond Drilling and Borehole Pulse EM Surveying, Licence 16364M, South Tally Pond Property, Rogerson Lake Area, Newfoundland and Labrador. Newfoundland and Labrador Geological Survey, Assessment File 12A/10/1564, 371 pages
Copeland, D.A. and Devine, C.A. (2011): Assessment Report on Airborne Geophysical Surveying on the Harpoon Property and South Tally Pond Properties (Licences 14158M, 18888M, 13583M, 12357M and 18539M), Lake Ambrose Area, Newfoundland and Labrador. Newfoundland and Labrador Geological Survey, Assessment File 12A/1611, 82 pages.
Copeland, D.A., Devine, C.A., and Sparrow, B. (2011): 11th Year Assessment Report on Diamond Drilling on the Beaver Lake Prospect (Licences 07695M), Lake Ambrose Area, Newfoundland and Labrador. Newfoundland and Labrador Geological Survey, Assessment File 12A/10/1616, 186 pages.
Date, J., Watanabe, Y., Saeki, Y. (1983): Zonal alteration around the Fukazawa Kuroko deposits, Akita Prefecture, northern Japan. In: Ohmoto H, Skinner BJ (eds) Kuroko and Related Volcanogenic Massive Sulphide Deposits. pp 365-386.
De Mark, P. and Dearin, C. (2007): Messina Minerals Inc.: Tulk's South Property, central Newfoundland, Canada. Technical Report prepared for Messina Minerals Inc.by Snowden Group, Vancouver, B.C. Report filed by Messina Minerals Inc. on SEDAR.
Devine, C.A. (2011): Assessment Report on Diamond Drilling on the Harpoon Property (Licences 18539M and 18249M), Lake Ambrose Area, Newfoundland and Labrador. Newfoundland and Labrador Geological Survey, Assessment File 12A/10/1604, 97 pages
| | NI43-101 Technical Report and Updated Resource Estimate South Tally Pond Property – Lemarchant Deposit |
Devine, C.A., Copeland, D.A. and Sparrow, B. (2011) 13th Year Supplementary Assessment Report on Diamond Drilling, Borehole Pulse EM Surveying and Surface EM, Licences 19631M and 19092M, South Tally Pond Property, Rogerson Lake Area, Newfoundland and Labrador. Unpublished assessment work report prepared for Paragon Minerals Corporation.
Dunning, G.R., Swinden, H.S., Kean, B.F., Evans, D.T.W., Jenner, G.A. (1991): A Cambrian island arc in Iapetus; geochronology and geochemistry of the Lake Ambrose volcanic belt, Newfoundland Appalachians. Geological Magazine 128: 1-17.
Evans, D.T.W. and Kean, B.F. (2002): The Victoria Lake Supergroup, Central Newfoundland - Its Definition, Setting and Volcanogenic Massive Sulphide Mineralization. Newfoundland Department of Mines and Energy, Geological Survey, Open File NFLD/2790, 69 pages.
Evans, D.T.W. and Kean, B.F. and Dunning, G.R. (1990): Geological studies, Victoria Lake Group, central Newfoundland. In Current Research. Newfoundland Department of Mines and Energy, Geological Survey Branch, Report 90-1, pages 131-144.
Gill, S.B. and S.J. Piercey (2014): Preliminary observations on styles of mineralization and sulphide mineral zonation in the Cambrian Zn-Pb-Cu-Ag-Au Lemarchant volcanogenic massive sulphide deposit, Newfoundland and Labrador; Geological Survey of Canada, Current Research 2014-5, 17 p.
Gill, S.B., Piercey, S.J., Layton-Matthews, D., Layne, G.D., and Piercey, G., (2015): Mineralogical, sulphur, and lead isotopic study of the Lemarchant Zn-Pb-Cu-Ag-Au-VMS deposit: Implications for precious-metal enrichment processes in the VMS environment, In: Targeted Geoscience Initiative 4: Contributions to the Understanding of Volcanogenic Massive Sulphide Deposit Genesis and Exploration Methods Development, (ed.) J.M. Peter and P. Mercier-Langevin; Geological Survey of Canada, Open File 7853, p. 183-195.
Franklin, J., Gibson, H., Jonasson, I., & Galley, A., (2005): Volcanogenic massive sulfide deposits; in 100th Anniversary Volume, 1905-2005. Economic Geology, pp 523-560.
Franklin, J., Sangster, D., & Lydon, J. (1981): Volcanic-associated massive sulphide deposits. In 75th Anniversary Volume, 1905-1980. Economic Geology. pp 485-627.
Franklin, J. (1993): Volcanic-associated massive sulfide deposits; in Mineral Deposits Modelling: Geol. Assoc. Canada Paper 40, pp 315-334.
Fraser, D., Giroux, G., Copeland, D., Devine, C. (2012): NI43-101 Technical Report and Mineral Resource on the Lemarchant Deposit, South Tally Pond VMS Project, central Newfoundland. Prepared for Paragon Minerals Corporation and filed on SEDAR. Newfoundland and Labrador Geological Survey, Assessment File 12A/10/1518, 2012, 403 pages.
Galley, A.G., Hannington, M.D. and Jonasson, I.R. (2007) Volcanogenic massive sulphide deposits, in Goodfellow, W.D., ed., Mineral Deposits of Canada: A Synthesis of Major Deposit Types, District Metallogeny, the Evolution of Geological Provinces, and Exploration Methods: Geological Association of Canada, Mineral Deposits Division, Special Publication No. 5, p. 141-161.
| | NI43-101 Technical Report and Updated Resource Estimate South Tally Pond Property – Lemarchant Deposit |
Gibson, H., Morton, R. & Hudak, G., (1999): Submarine volcanic processes, deposits, and environments favorable for the location of volcanic-associated massive sulfide deposits. In Volcanogenic-Associated Massive Sulfide Deposits: Processes and Examples in Modern and Ancient Settings. Reviews in Economic Geology, Vol. 8, pp 2-12.
Hinchey, J.G. and McNicholl, V. (2016): The Long Lake Group: an Update on U-Pb Geochronological Studies, Current Research (2016), Newfoundland and Labrador, Department of Natural Resources, Geological Survey, Report 16-1, pages 27-38.
Hussey, A.M. and Vande Guchte, M.J. (2018): Assessment Report on the 2017 Winter Diamond Drilling at the Lemarchant VMS Deposit, South Tally Pond Project, Newfoundland and Labrador, Mineral License 023827M (19th Year), NTS 12A/07 and 12A/10 for Paragon Minerals Corporation. Unpublished assessment work report prepared for Paragon Minerals Corporation.
Ishikawa, Y., Sawaguchi, T., Ywaya, S. and Horiuchi, M. (1976): Delineation of prospecting targets for Kuroko deposits based on modes of volcanism of underlying dacite and alteration haloes. Mining Geology 26: 105-117.
Kean, B.F. and Evans, D.T.W. (1988a): Regional metallogeny of the Victoria Lake Group, central Newfoundland, In Current Research. Newfoundland Department of Mines, Mineral Development Division, Report 88-1, pages 319-330.
Kean, B.F. and Evans, D.T.W. (1988b): Geology and mineral deposits of the Victoria Lake Group, In The Volcanogenic Sulphide Districts of Central Newfoundland. Edited by H.S. Swinden and B.F. Kean. Geological Association of Canada, Mineral Development Division, pages 144-156.
Kean, B.F. and Jayasinghe, N.R. (1982): Geology of the Badger map area (12A/16), Newfoundland. Newfoundland Department of Mines and Energy, Mineral Development Division, Report 81- 2, 42 pages. Geofile Number: 012A/16/0283
Kean, B.F., Dean, P.L., and Strong, D.F. (1981): Regional geology of the Central Volcanic Belt of Newfoundland. Geological Association of Canada, Special Paper 22, pages 65-78.
Keller, G.D. and Bernier. S. (2012): Independent Technical Report for the Main Zone of the Long Lake Volcanic Massive Sulphide Project, Newfoundland and Labrador, Canada. Prepared for Messina Minerals Inc. by SRK Consulting (Canada) Inc. Report filed by Messina Minerals In. on SEDAR.
Kirkham, R.V., (1987): Buchans Geology, Newfoundland. Geological Survey of Canada, Paper 86-24, 1987; 288 pages.
Lascelles, D. and Imeson (2012): An investigation into the recovery of Copper, Lead and Zinc from a Lemarchant sample. Unpublished report prepared by SGS Minerals Services (SGS Canada Inc.) for Paragon Minerals Corporation.
Lode. S (2016): Role of shales in the localization and genesis of volcanogenic massive sulfide (VMS) deposits of the Central Mobile Belt, Newfoundland; Memorial University, September 2011-2016, Ph.D. Thesis
| | NI43-101 Technical Report and Updated Resource Estimate South Tally Pond Property – Lemarchant Deposit |
Lode, S., Piercey, S.J., and Squires, G.C. (2016): Role of metalliferous mudstones and detrital shales in the localization, genesis, and paleoenvironment of volcanogenic massive sulphide deposits of the Tally Pond volcanic belt, central Newfoundland, Canada. Canadian Journal of Earth Sciences, 2016, 53(4): 387-425
MacKenzie, A.C. (1985): Report on 1984 Field Work (Geophysical, Geochemical and Diamond Drilling) on Portions of Anglo-Newfoundland Development Charter and Associated Reid Lots, NTS.12A/7, 12A/9, 12A/10. Government of Newfoundland and Labrador, Geological Survey Assessment File Report 12A/0415.
MacKenzie, A.C. and Robertson, K. (1986): Report on 1985 Field Work on Portions of Anglo-Newfoundland Development Charter and Associated Reid Lots (Compilation, Geophysical, Geological), NTS.12A/7, 12A/9, 12A/10. Government of Newfoundland and Labrador, Geological Survey Assessment File Report 12A/0451
MacKenzie, A.C. (1988): An overview of the geology and tectonic setting of the Boundary volcanogenic massive sulphide deposit, Tally Pond Volcanics, central Newfoundland. In The volcanogenic sulphide districts of central Newfoundland, A guidebook and reference manual for volcanogenic sulphide deposits in the early Paleozoic oceanic volcanic terranes of central Newfoundland, (eds.) H.S. Swinden and B.F. Kean; Mineral Deposits Division, Geological Association of Canada, pp. 157-164.
McNicoll, V.J., Squires, G.C., Kerr, A., and Moore, P.J., (2008): Geological and metallogenic implications of U-Pb zircon geochronological data from the Tally Pond area, central Newfoundland: Current Research 2008: Newfoundland Department of Mines and Energy Geological Survey Report 08-01, p. 173-192
McNicoll V, Squires G, Kerr A, Moore P (2010): The Duck Pond and Boundary Cu-Zn deposits, Newfoundland: new insights into the ages of host rocks and the timing of VHMS mineralization. Can J Earth Sci 47(12):1481-1506.
Moore, P.J. (2003): Stratigraphic implications for mineralization: Preliminary findings of a metallogenic investigation of the Tally Pond Volcanics, central Newfoundland. In Current Research (2003), Newfoundland Department of Mines and Energy, Geological Survey, Report 03-01, p. 1-17.
MRDI (2001): Duck Pond Project-Feasibility Study, May 2001. Report prepared by MRDI Canada, a division of AMEC E&C Services Ltd. for Thundermin Resources Inc. and Queenston Mining Inc.. Newfoundland and Labrador. Newfoundland and Labrador Geological Survey, Assessment File 12A/0919, Six Volumes - 3853 pages
Noranda (1998): Noranda Mining and Exploration Inc. Atlantic Region. Precious and Base Metal Properties Available for Option in Central Newfoundland. Prepared by Noranda Staff February 1998. Government of Newfoundland and Labrador, Geological Survey Assessment File Report 012A/1231
O’Sullivan, J. (1987): Geological Mapping and Prospecting Harpoon Hill Licence 2782 and 2784 N.T.S. 12A/10 Central Newfoundland, Esso Minerals Canada. Newfoundland and Labrador Geological Survey, Assessment File 12A/10/0441, 13 pages.
| | NI43-101 Technical Report and Updated Resource Estimate South Tally Pond Property – Lemarchant Deposit |
Podolsky, G. (1988): Report on combined helicopter borne magnetic, electromagnetic and VLF survey, Duck Pond Area, Grand Falls District, Newfoundland. Aerodat Limited Report for Noranda Exploration Company Limited, Newfoundland and Labrador Geological Survey, Assessment File 12A/0500, 244 pages.
Pollock, J.C., Wilton, D.H.C., and van Staal, C.R. (2002a): Geological studies and definition of the Tally Pond Group, Victoria Lake Supergroup, Exploits Subzone, Newfoundland Appalachians. In Current Research (2002), Newfoundland and Labrador Department of Mines and Energy, Geological Survey, Report 02-1, p.155.
Pollock, J.C., Wilton, D.H.C., and van Staal, C.R., and Tubrett, M.N. (2002b); Laser ablation ICP-MS geochronology and provenance of detrital zircons from the Rogerson Lake Conglomerate, Botwood Belt, Newfoundland. In Current Research (2002), Newfoundland and Labrador Department of Mines and Energy, Geological Survey, Report 02-1, p. 169.
Reid, W. (1979): First Year Assessment Report (Geochemical), Licence Numbers 1249, 12064, 12065, Gill’s Pond North Area, N.T.S. 12A/10, Noranda Exploration Company Limited, Newfoundland and Labrador Geological Survey, Assessment File 12A/10/0251, 9 pages.
Reid, W. (1980): First Year Assessment Report (Geological, Geophysical and Geochemical), Licence Number 1334, Harpoon Brook Area, N.T.S. 12A/10, Noranda Exploration Company Limited, Newfoundland and Labrador Geological Survey, Assessment File 12A/10/0256, 30 pages.
Reid, W. (1981): Second Year Assessment Report (Geophysical, Geological and Geochemical), Licence Number 1249, 12064, 12065, Gill’s Pond North Area, N.T.S. 12A/10, Noranda Exploration Company Limited, Newfoundland and Labrador Geological Survey, Assessment File 12A/10/0278, 19 pages
Reid, W. (1981): Report on 1980 Field Work (Geological, Geophysical, Geochemical and Diamond Drilling) on portions of Anglo-Newfoundland Development Charter and Associated Reid Lots, NTS. 12A/7, 12A/9 & 12A/10. Government of Newfoundland and Labrador, Geological Survey Assessment File Report 12A/0293, 50 pages
Reid, W. (1982): Report on 1981 Field Work (Geological, Geophysical, Geochemical and Diamond Drilling) on portions of Anglo-Newfoundland Development Charter and Associated Reid Lots, NTS. 12A/7, 12A/9 & 12A/10. Government of Newfoundland and Labrador, Geological Survey Assessment File Report 12A/0319, 98 pages
Reid, W. (1983): Report on 1982 Field Work (Geological, Geophysical, Geochemical and Diamond Drilling) on portions of Anglo-Newfoundland Development Charter and Associated Reid Lots, NTS. 12A/7, 12A/9 & 12A/10. Government of Newfoundland and Labrador, Geological Survey Assessment File Report 12A/0356, 127 pages
Reid, W. (1984): Report on 1983 Field Work (Geological, Geophysical, Geochemical and Diamond Drilling on portions of Anglo-Newfoundland Development Charter and Associated Reid Lots. Government of Newfoundland and Labrador, Geological Survey Assessment File Report 12A/0376, 292 pages
| | NI43-101 Technical Report and Updated Resource Estimate South Tally Pond Property – Lemarchant Deposit |
Rogers, H.D. and Squires, G.C. (1988): Report of Assessment Work on Concession Lands within the Boundary of the BP Mining - Norex Joint Venture Agreement (Reid Lot 231, 234 and AND Charter), NTS 12A/7, 9, 10. Government of Newfoundland and Labrador, Geological Survey Assessment File Report 12A/0503, 32 pages
Rogers, H.D. and Collins, C. (1989): Report of Assessment Work on Concession Lands Within the Boundary of the Norex - BP Mining Norex Joint Venture Agreement Area (Reid Lot 231, 234, 235, AND Charter & Reid Lot 229), NTS 12A/7, 9, 10; Noranda Exploration Company Limited, Government of Newfoundland and Labrador, Geological Survey Assessment File Report 12A/0537 182 pages.
Rogers, N. and van Staal, C.R. (2002) Toward a Victoria Lake Supergroup: A provisional stratigraphic revision of the Red Indian to Victoria lakes area, central Newfoundland. In Current Research (2002), Newfoundland and Labrador Department of Mines and Energy, Geological Survey, Report 02-1.
Rogers, N., van Staal, C. R., McNicoll, V., Pollock, J., Zagorevski, A., and Whalen, J. (2006) Neoproterozoic and Cambrian arc magmatism along the eastern margin of the Victoria Lake Supergroup: A remnant of Ganderian basement in central Newfoundland?: Precambrian Research, v. 147, p. 320-341.
Saeki, Y. and Date, J. (1980) Computer application to the alteration data of the footwall dacite lava at the Ezuri Kuroko deposits, Akito Prefecture. Mining Geology 30: 241-250.
Smith, R.L., Barbour, D.M., Churchill, R. (2001) First & Second Year Assessment Report on Diamond Drilling & Geophysics, Licenses 6559M & 6560M, South Tally Pond Property, Rogerson Lake Area, Central Newfoundland, NTS 12A/10 & 12A/07, Altius Resources Inc. Government of Newfoundland and Labrador, Geological Survey Assessment File Report 12A/0987, 151 pages
Spitz, G., Darling, R. (1978): Major and minor element lithogeochemical anomalies surrounding the Louvem copper deposit, Val d'Or, Quebec. Canadian Journal of Earth Sciences 15: 1161-1169.
Squires, G.C. and Moore, P.J. (2004): Volcanogenic massive sulphide environments of the Tally Pond Volcanics and adjacent areas: Geological, lithogeochemical and geochronological results. In Current Research (2004), Newfoundland and Labrador Department of Mines and Energy, Geological Survey, Report 04-1, p. 63.
Squires, G.C. and Hinchey, J.G. (2006): Geology of the Tally Pond Volcanic Belt and adjacent areas (parts of 12A/09 and 12A/10). Map 2006-01. Government of Newfoundland and Labrador, Department of Natural Resources, Geological Survey, Open File 12A/1202.
Squires, G.C. and Vande Guchte, M.J. (2015): Report on the 2014 Diamond Drilling at the Lemarchant VMS Deposit, South Tally Pond Project (Mineral license 019631M), Lake Ambrose Area, NTS 12A/10, Newfoundland and Labrador. Unpublished assessment work report prepared for Paragon Minerals Corporation.
Swanson, E.A., and Brown, R.L., (1962): Geology of the Buchans orebodies. Canadian Mining and Metallurgical Bulletin, vol. 65 no. 9, 1962, pages 618-626. Geofile Number: 012A/15/0026.
| | NI43-101 Technical Report and Updated Resource Estimate South Tally Pond Property – Lemarchant Deposit |
Thilbault, J. D. and McKeen, T.R. (2017): Centralized Milling of Newfoundland Base Metal Deposits- Bench Scale DMS and Flotation Test Program, Unpublished Report prepared for Canadian Zinc Corporation and Buchans Minerals Corporation. Two Volumes.
Thicke, M. J., (1988) First and second year assessment report on geophysical exploration for license 2784 on claim block 2765 and license 3276 on claim blocks 4864-4874 in the Gills Pond area, Newfoundland, Rio Algom Exploration Incorporated, Government of Newfoundland and Labrador, Geological Survey Assessment File Report 12A/0491, 15 pages
Thicke, M. J., (1989) Report on diamond drilling, License 2784 & 3276, Gills Pond Project, August-November, 1988, Rio Algom Exploration Inc., Government of Newfoundland and Labrador, Geological Survey Assessment File Report 12A/10 0522, 40 pages
Thicke, M. J., (1990) Report on diamond drilling and pulse EM survey, License 2784, Gills Pond Project, May-August, 1989, Rio Algom Exploration Inc., Government of Newfoundland and Labrador, Geological Survey Assessment File Report 12A/10/0554, 12 pages.
Thurlow, J.G. and Swanson, E.A. (1981) The Buchans Group: its structural and stratigraphic setting, In The Buchans Orebodies: 50 Years of Geology and Mining. Edited by E.A. Swanson, D.F. Strong and J.G. Thurlow. Geological Association of Canada, Special Paper 22, pages 79-90.
Tuffy (1975) Diamond Drilling Report, Millertown Claim Group, Newfoundland. A report prepared for Labrador Mining and Exploration Co. Ltd. Newfoundland and Labrador Geological Survey, Assessment File 12A/10/0163, 70 pages.
Valverde-Vaquero, P. and van Staal, C.R. (2002) Geology and magnetic anomalies of the Exploits- Meelpaeg boundary zone in the Victoria lake area (central Newfoundland): Regional implications. In Current Research (2002), Newfoundland and Labrador Department of Mines and Energy, Geological Survey, Report 02-1, p. 197.
Vande Guchte, M.J. and Marcotte, A. (2013): Assessment Report on the 2013 Diamond Drilling at the Lemarchant VMS Deposit, South Tally Pond Project (Mineral licenses 019092M and 019631M), Lake Ambrose Area, NTS 12A/10, Newfoundland and Labrador. Unpublished assessment work report prepared for Paragon Minerals Corporation.
Vande Guchte, M.J. (2016): Assessment Report on the 2016 Magnetic, Gravity, Surface Pulse EM and Borehole Pulse EM Geophysical Surveys, South Tally Pond Project (Mineral License 019092M, 23624M and 023827M), Lake Ambrose Area, NTS 12A/10, Newfoundland and Labrador. Unpublished assessment work report prepared for Paragon Minerals Corporation
Vande Guchte, M.J. and Hussey, A.M. (2017): Assessment and Impost Report on the Metallurgical and Dense Media Separation Studies (DMS) completed on the Boomerang-Domino, Lemarchant, Long Lake and Tulks East VMS Deposits Tulks South, South Tally Pond and Long Lake Properties Central Newfoundland, Unpublished assessment work report prepared for Canadian Zinc Corporation
Williams, H. (1979): Appalachian Orogen in Canada. Canadian Journal of Earth Sciences, 16: pp. 702-807.
| | NI43-101 Technical Report and Updated Resource Estimate South Tally Pond Property – Lemarchant Deposit |
Williams, H., Colman-Sadd, S.P., Swinden, H.S. (1988): Tectonostratigraphic subdivisions of central Newfoundland. In Current Research, Part B. Geological Survey of Canada, Paper 88-1B, pp. 91-98.
Zagorevski, A., Rogers, N. and van Staal, C.R. (2003): Tectonostratigraphic relationships in the Lloyds River and Tulks Brook region of central Newfoundland: a geological link between Red Indian and King George IV lakes. In Current Research (2003), Newfoundland and Labrador Department of Mines and Energy, Geological Survey, Report 03-01, p. 167.
Zagorevski, A. and van Staal, C.R. (2002): Structures associated with the Red Indian Line in southwestern Newfoundland. In Current Research (2002), Newfoundland and Labrador Department of Mines and Energy, Geological Survey, Report 02-1, p. 211.
| | NI43-101 Technical Report and Updated Resource Estimate South Tally Pond Property – Lemarchant Deposit |
Certificate of Michael J. Vande Guchte, P. Geo.
I, Michael J. Vande Guchte, P.Geo., of Vancouver, British Columbia, do hereby certify that:
| 1. | I am currently employed as VP Exploration NL of NorZinc Ltd. with an office at Suite 1710, 650 West Georgia Street, Vancouver, British Columbia, V6B 4N9. |
| 2. | I graduated with a Bachelor of Science degree in Geology in 1986 from the University of Alberta in Edmonton, Alberta and a Diploma of Technology in 2000 from the British Columbia Institute of Technology in Vancouver, British Columbia. |
| 3. | I have worked as a geologist from 1986-1999 and 2005-present and have relevant experience in mineral exploration for base metals, gold and diamonds in North and South America for both senior and junior mining and exploration companies. I was employed as a systems analyst in the information technology industry from 2000-2005. |
| 4. | I am a geoscientist member in good standing with the Association of Professional Engineers and Geoscientists of Newfoundland & Labrador (License #08601) and a geoscientist member in good standing with the Association of Professional Engineers, Geologists and Geophysicists of British Columbia (License #20525). |
| 5. | This certificate applies to the technical report titled “NI 43-101 Technical Report and Updated Mineral Resource Estimate on the Lemarchant Deposit, South Tally Pond Property, Central Newfoundland, Canada” with an effective date of September 20, 2018, (the “Technical Report”) prepared for NorZinc Ltd. (“the Issuer”) |
I have read the definition of “Qualified Person” set out in National Instrument 43-101 (NI 43-101) and certify that by reason of my education, affiliation with a professional association (as defined in NI 43-101) and past relevant work experience, I am a “Qualified Person” for purposes of NI 43-101.
| 6. | I am responsible for Items (Sections) 2, 3, 4, 5, 6, 7, 8, 9, 10, 11, 13, 15, 16, 17, 18, 19, 20, 21, 22, 23, 24 and 27 and parts of 1, 25 and 26 of the Technical Report. I have reviewed all Items of the Technical Report. |
| 7. | I am not independent of the Issuer as described in Section 1.5 of NI 43-101. |
| 8. | I have had prior involvement with the property that is the subject of the Technical Report, having supervised exploration programs and co-authored reports for government assessment purposes. |
| 9. | My most recent personal inspection of the South Tally Pond Property was on August 27, 2018. |
| 10. | I have read NI43-101 and the Technical Report has been prepared in compliance with NI 43-101 and Form 43-101F1 |
| | NI43-101 Technical Report and Updated Resource Estimate South Tally Pond Property – Lemarchant Deposit |
| 11. | As of the effective date of the Technical Report and the date of this Certificate, to the best of my knowledge, information and belief, the Technical Report contains all scientific and technical information that is required to be disclosed to make the Technical Report not misleading. |
Signing Date: October 22, 2018
“Original signed and stamped by”
_______________________________
Michael J. Vande Guchte, P.Geo.
VP Exploration NL of NorZinc Ltd.
| | NI43-101 Technical Report and Updated Resource Estimate South Tally Pond Property – Lemarchant Deposit |
Certificate of Qualified Person
Matthew D. Harrington, P. Geo.
I, Matthew D. Harrington, P. Geo., do hereby certify that:
| 1. | I reside at 10 Commodore Road in Lewis Lake, Nova Scotia, Canada |
| 2. | I am currently employed as a Senior Resource Geologist with Mercator Geological Services Limited of 65 Queen St Dartmouth, Nova Scotia, Canada B2Y 1G4 |
| 3. | I received a Bachelor of Science degree (Honours, Geology) in 2004 from Dalhousie University. |
| 4. | I am a registered member in good standing of the following professional associations: (1) Association of Professional Geoscientists of Nova Scotia, registration number 0254, and (2) Professional Engineers and Geologists of Newfoundland and Labrador, registration number 09541. |
| 5. | I have worked as a geologist in Canada since graduation. |
| 6. | I have read the definition of “Qualified Person” set out in National Instrument 43-101 (“NI 43-101”) and certify that by reason of my education, affiliation with a professional association (as defined in NI 43-101) and past relevant work experience, I fulfill the requirements to be a “qualified person” for the purposes of NI 43-101. |
| 7. | I am one of the Qualified Persons responsible for preparation of the Technical Report titled “NI 43-101 TECHNICAL REPORT AND UPDATED MINERAL RESOURCE ESTIMATE ON THE LEMARCHANT DEPOSIT, SOUTH TALLY POND PROPERTY, CENTRAL NEWFOUNDLAND LABRADOR, CANADA, Effective Date: September 20, 2018” and dated October 22, 2018. |
I am responsible for Technical Report Item (Section) 14 and parts of Items 1, 25, and 26; I have reviewed all Items of the Technical Report
| 8. | I have professional experience with respect to geology of the Northern Appalachians and, more specifically, with geology of Proterozoic and Paleozoic volcanic, sedimentary and intrusive sequences of Newfoundland and Labrador. I have supervised and participated in various geological and resource estimation programs related to volcanogenic massive sulphide deposits in Central Newfoundland, where the subject Lemarchant deposit is located. |
| 9. | My past involvement with the Lemarchant Deposit is limited to participation in review of drilling information and geological modelling carried out by Mercator Geological Services Limited for Paragon Minerals Limited in 2011. |
| 10. | I am independent of NorZinc, applying all of the tests in section 1.5 of National Instrument 43-101 and National Instrument 43-101 Companion Policy Section 5.3 |
| | NI43-101 Technical Report and Updated Resource Estimate South Tally Pond Property – Lemarchant Deposit |
| 11. | I have read National Instrument 43-101, Form 43-101F1 and the Companion Policy and believe that this Technical Report has been prepared in compliance with that Instrument and Form. |
| 12. | As of the date of this certificate, to the best of my knowledge, information and belief, this Technical Report contains all scientific and technical information that is required to be disclosed to make this report not misleading. |
Dated this 22nd day of October, 2018
“Original signed and stamped by”
| _____________________________ | |
Matthew D. Harrington, P. Geo.
Senior Resource Geologist
Mercator Geological Services Limited
| | NI43-101 Technical Report and Updated Resource Estimate South Tally Pond Property – Lemarchant Deposit |
Certificate of Qualified Person
Michael P. Cullen, P. Geo.
I, Michael P. Cullen, P.Geo., do hereby certify that:
| 1. | I reside at 2071 Poplar St. in Halifax, Nova Scotia, Canada |
| 2. | I am currently employed as a Chief Geologist with Mercator Geological Services Limited,
65 Queen St., Dartmouth, Nova Scotia, Canada B2Y 1G4 |
| 3. | I received a Master of Science Degree (Geology) from Dalhousie University in 1984 and a Bachelor of Science Degree (Honours, Geology) in 1980 from Mount Allison University. |
| 4. | I am a registered member in good standing of the Association of Professional Geoscientists of Nova Scotia (Registration Number 064), Newfoundland and Labrador Professional Engineers and Geoscientists (Member Number 05058) and Association of Professional Engineers and Geoscientists of New Brunswick, (Registration Number L4333). |
| 5. | I have worked as a geologist in Canada and internationally since graduation. |
| 6. | I have read the definition of “Qualified Person” set out in National Instrument 43-101 (“NI 43-101”) and certify that by reason of my education, affiliation with a professional association (as defined in NI 43-101) and past relevant work experience, I fulfill the requirements to be a “qualified person” for the purposes of NI 43-101. |
| 7. | I am one of the Qualified Person responsible for preparation of the Technical Report titled “NI 43-101 TECHNICAL REPORT AND UPDATED MINERAL RESOURCE ESTIMATE ON THE LEMARCHANT DEPOSIT, SOUTH TALLY POND PROPERTY, CENTRAL NEWFOUNDLAND LABRADOR, CANADA, Effective Date: September 20, 2018” and dated October 22, 2018. |
I am responsible for Technical Report Item (Section) 12 and parts of Items 1, 25 and 26; I have reviewed all Items of the Technical Report.
| 8. | I have extensive professional experience with respect to geology of the Northern Appalachians and, more specifically, with geology of Proterozoic and Paleozoic volcanic, sedimentary and intrusive sequences of Newfoundland and Labrador. I have supervised and participated in various geological and resource estimation programs related to volcanogenic massive sulphide deposits in Central Newfoundland, where the subject Lemarchant deposit is located. |
| 9. | My past involvement with the Lemarchant Deposit is limited to participation in review of drilling information and geological modelling carried out by Mercator Geological Services Limited for Paragon Minerals Limited in 2011. |
| | NI43-101 Technical Report and Updated Resource Estimate South Tally Pond Property – Lemarchant Deposit |
| 10. | I last visited the Lemarchant deposit between September 30th and October 1st, 2017 to carry out the site visit described in this Technical report. I was accompanied at that time by Mr. Michael Vande Guchte, P. Geo., VP Exploration NL, for NorZinc Ltd. |
| 11. | I am independent of NorZinc, applying all of the tests in section 1.5 of National Instrument 43-101 and National Instrument 43-101 Companion Policy Section 5.3. |
| 12. | I have read National Instrument 43-101, Form 43-101F1 and the Companion Policy and believe that this Technical Report has been prepared in compliance with that Instrument and Form. |
| 13. | As of the date of this certificate, to the best of my knowledge, information and belief, this Technical Report contains all scientific and technical information that is required to be disclosed to make this report not misleading. |
Dated this 22nd day of October, 2018
“Original signed and stamped by”
| _____________________________ | |
Michael P. Cullen, P. Geo.
Chief Geologist
Mercator Geological Services Limited
| | NI43-101 Technical Report and Updated Resource Estimate South Tally Pond Property – Lemarchant Deposit |
APPENDIX I
2013-2017 Diamond Drillhole Information
| | NI43-101 Technical Report and Updated Resource Estimate South Tally Pond Property – Lemarchant Deposit |
2013-2017 DIAMOND DRILLHOLE INFORMATION
Drillhole | Section | Az. | Dip | Start | End | Length | Easting NAD83 | Northing NAD 83 | Elevation NAD 83 |
| LM13-73 | 106+00N | 90 | -72 | 0 | 422 | 422 | 520673.131 | 5375350.207 | 350.532 |
| LM13-74 | 106+00N | 90 | -66 | 0 | 368 | 368 | 520673.524 | 5375350.255 | 350.370 |
| LM08-27EXT | 106+00N | 90 | -65 | 262.4 | 485 | 222.6 | 520870.073 | 5375349.009 | 340.204 |
| LM13-75 | 106+00N | 270 | -67 | 0 | 539 | 539 | 521280.065 | 5375343.965 | 333.010 |
| LM13-76 | 100+50N | 90 | -80 | 0 | 216.4 | 216.4 | 521129.235 | 5374742.695 | 332.491 |
| LM13-77 | 100+50N | 90 | -90 | 0 | 209 | 209 | 521129.054 | 5374742.695 | 332.368 |
| LM13-78 | 99+75N | 270 | -55 | 0 | 187 | 187 | 521037.778 | 5374684.853 | 332.139 |
| LM13-79 | 101+25N | 270 | -53 | 0 | 229 | 229 | 521187.626 | 5374852.468 | 331.007 |
| LM13-80 | 101+50N | 275 | -55 | 0 | 272 | 272 | 521186.944 | 5374875.324 | 332.407 |
| LM11-52EXT | 102+70N | 270 | -62 | 318.8 | 570 | 251.2 | 521132.309 | 5374976.627 | 333.417 |
| LM13-81 | 109+50N | 270 | -85 | 0 | 455 | 455 | 521425.909 | 5375676.675 | 340.226 |
| LM13-82 | 105+50N | 90 | -80 | 0 | 378 | 378 | 520719.793 | 5375294.171 | 346.589 |
| LM13-83 | 105+50N | 90 | -73 | 0 | 432 | 432 | 520720.010 | 5375294.141 | 346.375 |
| LM13-84EXT | 105+50N | 90 | -65 | 0 | 441 | 441 | 520720.126 | 5375294.151 | 346.381 |
| LM13-85 | 106+50N | 90 | -80 | 0 | 402 | 402 | 520669.448 | 5375399.071 | 351.283 |
| LM13-86 | 105+00N | 90 | -83 | 0 | 362 | 362 | 520771.981 | 5375252.633 | 340.983 |
| LM13-87 | 105+00N | 90 | -75 | 0 | 441 | 441 | 520772.095 | 5375252.631 | 341.070 |
| LM11-61EXT | 103+00N | 270 | -60 | 310 | 534 | 224 | 521141.772 | 5375031.305 | 333.520 |
| LM13-88 | 102+80N | 270 | -60 | 0 | 264 | 264 | 521136.995 | 5375011.993 | 333.357 |
| LM13-89 | 103+50N | 270 | -82 | 0 | 225 | 225 | 521062.797 | 5375088.931 | 336.265 |
| LM13-90EXT | 104+00N | 270 | -61 | 0 | 540 | 540 | 521059.292 | 5375137.580 | 338.049 |
| LM13-91 | 108+35N | 90 | -70 | 0 | 340.8 | 340.8 | 520684.642 | 5375603.431 | 359.108 |
| LM13-92 | 104+50N | 270 | -85 | 0 | 186 | 186 | 520959.163 | 5375191.004 | 337.882 |
| LM13-93 | 107+00N | 270 | -70 | 0 | 398 | 398 | 521164.108 | 5375442.567 | 337.510 |
| LM13-94EXT | 106+50N | 90 | -70 | 0 | 468 | 468 | 520670.158 | 5375399.105 | 351.198 |
| LM14-95 | 106+50N | 90 | -64 | 0 | 429.5 | 429.5 | 520670.097 | 5375396.782 | 351.119 |
| LM14-96 | 106+50N | 90 | -58 | 0 | 425 | 425 | 520669.877 | 5375397.301 | 351.301 |
| LM14-97 | 105+50N | 90 | -80 | 0 | 394 | 394 | 520673.885 | 5375290.191 | 347.288 |
| LM14-98 | 105+00N | 90 | -74 | 0 | 413 | 413 | 520670.560 | 5375240.988 | 346.112 |
| LM14-99 | 106+50N | 90 | -68 | 0 | 314 | 314 | 520773.362 | 5375394.351 | 346.248 |
| LM14-100 | 107+00N | 90 | -58.3 | 0 | 380 | 380 | 520671.462 | 5375459.125 | 353.331 |
| LM14-101 | 106+50N | 90 | -64 | 0 | 252 | 252 | 520805.057 | 5375396.060 | 345.702 |
| LM14-102 | 106+50N | 90 | -74.5 | 0 | 467 | 467 | 520669.934 | 5375399.196 | 351.161 |
| LM14-103 | 105+50N | 90 | -77 | 0 | 446 | 446 | 520719.608 | 5375294.461 | 346.309 |
| LM14-104 | 105+50N | 90 | -57 | 0 | 431 | 431 | 520763.126 | 5375297.628 | 343.610 |
| LM14-105 | 107+00N | 90 | -77 | 0 | 413 | 413 | 520671.009 | 5375461.539 | 353.406 |
| LM14-106 | 107+00N | 90 | -50 | 0 | 497 | 497 | 520671.842 | 5375461.553 | 353.559 |
| LM15-107 | 102+50N | 280 | -90 | 0 | 239 | 239 | 521071.995 | 5374992.591 | 332.180 |
| | NI43-101 Technical Report and Updated Resource Estimate South Tally Pond Property – Lemarchant Deposit |
Drillhole | Section | Az. | Dip | Start | End | Length | Easting NAD83 | Northing NAD 83 | Elevation NAD 83 |
| LM17-108 | 104+00N | 275 | -84 | 0 | 387.4 | 387.4 | 521059.836 | 5375137.570 | 338.068 |
| LM17-109 | 102+00N | 90 | -86 | 0 | 217.7 | 217.7 | 521140.080 | 5374927.556 | 331.570 |
| LM11-68EXT | 102+00N | 270 | -70 | 252.1 | 327 | 74.9 | 521135.030 | 5374926.334 | 331.404 |
| LM17-110 | 101+25N | 270 | -67 | 0 | 191 | 191 | 521106.667 | 5374850.631 | 329.263 |
| LM17-111 | 101+25N | 270 | -57 | 0 | 200 | 200 | 521106.524 | 5374850.626 | 329.275 |
| LM17-112 | 101+25N | 270 | -47 | 0 | 215 | 215 | 521106.224 | 5374850.648 | 329.210 |
| LM17-113 | 101+00N | 230 | -75 | 0 | 200 | 200 | 521192.510 | 5374836.022 | 330.054 |
| LM17-114 | 102+00N | 270 | -50 | 0 | 245 | 245 | 521134.143 | 5374928.985 | 331.472 |
| LM17-115 | 102+50N | 270 | -57 | 0 | 230 | 230 | 521068.356 | 5374992.373 | 332.460 |
| LM17-116 | 102+50N | 270 | -50 | 0 | 254 | 254 | 521068.285 | 5374992.379 | 332.663 |
| LM11-50EXT | 108+00N | 270 | -75 | 230 | 473 | 243 | 521162.840 | 5375541.383 | 342.309 |
| LM17-117 | 105+00N | 90 | -66.5 | 0 | 377 | 377 | 520770.839 | 5375250.222 | 340.963 |
| LM17-118 | 102+50N | 270 | -65 | 0 | 167 | 167 | 520949.987 | 5374994.059 | 331.946 |
| LM17-119 | 102+50N | 270 | -75 | 0 | 179 | 179 | 520950.161 | 5374994.056 | 331.918 |
| LM17-120 | 102+50N | 270 | -55 | 0 | 170 | 170 | 520949.687 | 5374994.056 | 331.842 |
| LM17-121 | 102+00N | 270 | -76 | 0 | 188 | 188 | 520988.573 | 5374952.184 | 330.777 |
| LM17-122 | 102+00N | 270 | -67 | 0 | 200 | 200 | 520988.400 | 5374952.182 | 330.804 |
| LM17-123 | 102+00N | 270 | -58 | 0 | 194 | 194 | 520988.194 | 5374952.165 | 330.806 |
| LM17-124 | 102+00N | 270 | -85 | 0 | 188 | 188 | 520988.715 | 5374952.190 | 330.777 |
| LM17-125 | 103+00N | 270 | -51 | 0 | 242 | 242 | 521070.171 | 5375035.854 | 336.802 |
| LM17-126 | 103+00N | 270 | -63 | 0 | 242 | 242 | 521070.524 | 5375035.810 | 336.870 |
| LM17-127 | 103+00N | 270 | -55 | 0 | 173 | 173 | 520994.244 | 5375040.280 | 335.174 |
| LM17-128 | 103+25N | 270 | -75 | 0 | 218 | 218 | 521016.734 | 5375064.016 | 335.833 |
| LM17-129 | 103+25N | 270 | -68 | 0 | 218 | 218 | 521016.630 | 5375064.031 | 335.881 |
| LM17-130 | 101+75N | 270 | -60 | 0 | 218 | 218 | 521063.468 | 5374912.015 | 330.064 |
| LM17-131 | 101+75N | 270 | -52 | 0 | 200 | 200 | 521063.268 | 5374912.019 | 330.078 |
| LM17-132 | 101+75N | 270 | -69 | 0 | 191 | 191 | 521063.694 | 5374912.036 | 330.076 |
| LM17-133 | 101+75N | 270 | -45 | 0 | 191 | 191 | 521062.884 | 5374911.999 | 330.030 |
| LM17-134 | 101+75N' | 254 | -51 | 0 | 224 | 224 | 521063.138 | 5374911.393 | 330.040 |
| LM17-135 | 101+00N | 270 | -65 | 0 | 200 | 200 | 521184.900 | 5374831.557 | 329.538 |
| LM17-136 | 101+00N | 270 | -45 | 0 | 230 | 230 | 521184.183 | 5374831.586 | 329.505 |
| LM17-137 | 101+75N | 270 | -64 | 0 | 221 | 221 | 521161.432 | 5374899.131 | 331.745 |
| LM17-138 | 101+75N | 270 | -51 | 0 | 230 | 230 | 521161.081 | 5374899.162 | 331.676 |
| LM17-139 | 96+00N | 270 | -55 | 0 | 401 | 401 | 520940.803 | 5374313.220 | 336.931 |
| LM17-140 | 96+00N | 270 | -45 | 0 | 335 | 335 | 520940.549 | 5374313.230 | 337.006 |
| LM17-141 | 96+00N | 270 | -75 | 0 | 176 | 176 | 520941.382 | 5374313.275 | 336.962 |
| LM17-142 | 95+00N | 270 | -55 | 0 | 302 | 302 | 520941.776 | 5374225.386 | 331.527 |
| LM17-143 | 97+00N | 270 | -80 | 0 | 134 | 134 | 520929.200 | 5374437.723 | 334.337 |
| LM17-144 | 97+00N | 270 | -60 | 0 | 131 | 131 | 521029.631 | 5374426.135 | 331.116 |
| LM17-145 | 102+50N | 270 | -78 | 0 | 248 | 248 | 521130.675 | 5374976.567 | 333.480 |
| LM17-146 | 102+00N | 270 | -65 | 0 | 248 | 248 | 521134.957 | 5374926.157 | 331.484 |
| | NI43-101 Technical Report and Updated Resource Estimate South Tally Pond Property – Lemarchant Deposit |
Drillhole | Section | Az. | Dip | Start | End | Length | Easting NAD83 | Northing NAD 83 | Elevation NAD 83 |
| LM17-147 | 104+75N | 275 | -77 | 0 | 239 | 239 | 520964.985 | 5375220.267 | 336.678 |
| LM17-148 | 104+75N | 290 | -75 | 0 | 341 | 341 | 520964.829 | 5375220.277 | 336.619 |
| LM17-149 | 106+75N | 88 | -70 | 0 | 443 | 443 | 520675.205 | 5375430.417 | 351.669 |
| LM17-150 | 106+75N | 88 | -63 | 0 | 437 | 437 | 520675.354 | 5375430.362 | 351.635 |
| LM17-151 | 111+00N | 270 | -45 | 0 | 284 | 284 | 521139.391 | 5375847.834 | 360.066 |
| LM17-152 | 111+00N | 270 | -58 | 0 | 212 | 212 | 521139.944 | 5375847.821 | 360.248 |
| LM17-153 | 111+00N | 270 | -80 | 0 | 242 | 242 | 521140.345 | 5375847.807 | 360.243 |
| LM17-154 | 109+00N | 270 | -45 | 0 | 137 | 137 | 521173.644 | 5375642.210 | 346.286 |
| LM17-155 | 109+00N | 270 | -75 | 0 | 488 | 488 | 521174.400 | 5375642.172 | 346.273 |
| LM17-156 | 106+75N | 88 | -57 | 0 | 416 | 416 | 520674.190 | 5375430.000 | 351.669 |
| LM17-156A | 106+75N | 88 | -57 | 0 | 71 | 71 | 520674.185 | 5375430.000 | 351.669 |
| LM17-157 | 107+50N | 88 | -63 | 0 | 497 | 497 | 520679.059 | 5375509.901 | 354.735 |
| LM17-158 | 105+00N | 278 | -62.5 | 0 | 482 | 482 | 521137.000 | 5375238.000 | 337.130 |
| LM17-159 | 107+00N | 88 | -87 | 0 | 452 | 452 | 520671.000 | 5375459.000 | 353.000 |
| LM17-160 | 101+00N | 200 | -70 | 0 | 203.2 | 203.2 | 521192.500 | 5374836.022 | 330.540 |
| LM17-161 | 101+00N' | 230 | -68 | 0 | 203 | 203 | 521192.500 | 5374836.000 | 330.540 |
| LM17-162 | 106+00N | 87 | -76 | 0 | 500 | 500 | 520531.409 | 5375353.470 | 355.222 |
| LM17-162A | 106+00N | 87 | -76 | 0 | 116 | 116 | 520537.000 | 5375348.000 | 355.220 |
| LM17-162B | 106+00N | 86 | -76 | 0 | 32 | 32 | 520537.000 | 5375348.000 | 355.220 |
| LM17-163 | 101+00N' | 230 | -58 | 0 | 212 | 212 | 521192.500 | 5374836.000 | 330.540 |
| | | | | | | 28,674.7 | | | |
| | NI43-101 Technical Report and Updated Resource Estimate South Tally Pond Property – Lemarchant Deposit |
APPENDIX II
Performance of Standard Reference Materials
(Figure 12-1a-e to 12-4a-e)
| | NI43-101 Technical Report and Updated Resource Estimate South Tally Pond Property – Lemarchant Deposit |
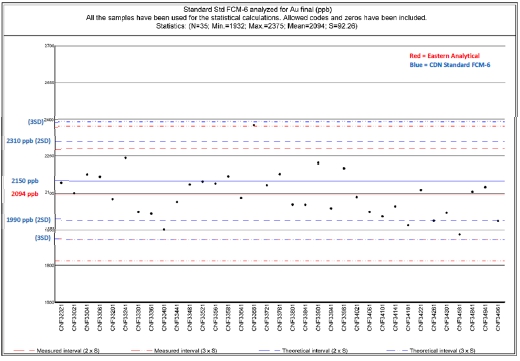
Figure 12-1a – Standard FCM-6 - Au ppb (Eastern Analytical)
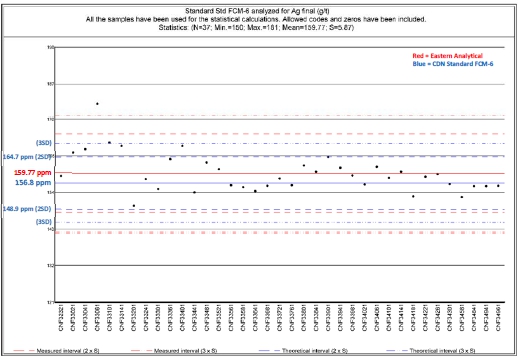
Figure 12-1b – Standard FCM-6 - Ag ppm (Eastern Analytical)
| | NI43-101 Technical Report and Updated Resource Estimate South Tally Pond Property – Lemarchant Deposit |
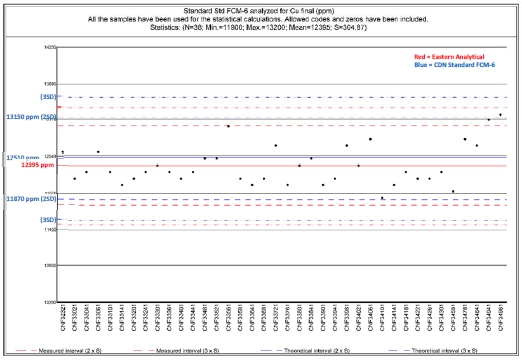
Figure 12-1c – Standard FCM-6 – Cu ppm (Eastern Analytical)
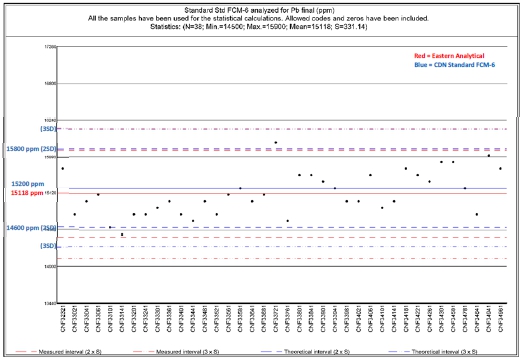
Figure 12-1d – Standard FCM-6 – Pb ppm (Eastern Analytical)
| | NI43-101 Technical Report and Updated Resource Estimate South Tally Pond Property – Lemarchant Deposit |
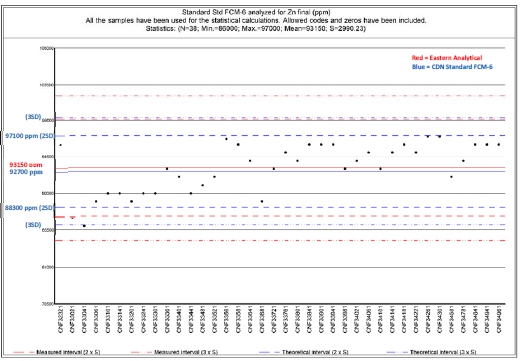
Figure 12-1e – Standard FCM-6 – Zn ppm (Eastern Analytical)
| | NI43-101 Technical Report and Updated Resource Estimate South Tally Pond Property – Lemarchant Deposit |
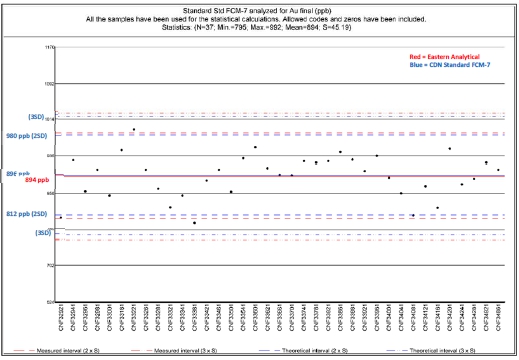
Figure 12-2a – Standard FCM-7 - Au ppb (Eastern Analytical)
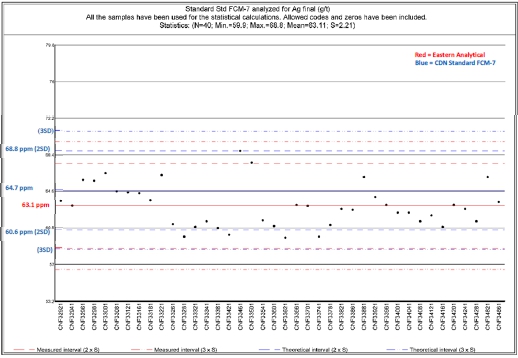
Figure 12-2b – Standard FCM-7 - Ag ppm (Eastern Analytical)
| | NI43-101 Technical Report and Updated Resource Estimate South Tally Pond Property – Lemarchant Deposit |

Figure 12-2c – Standard FCM-7 – Cu ppm (Eastern Analytical)
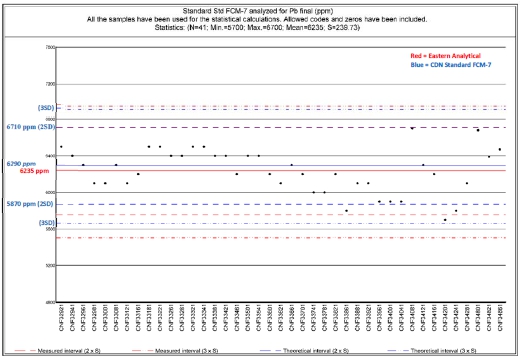
Figure 12-2d – Standard FCM-7 – Pb ppm (Eastern Analytical)
| | NI43-101 Technical Report and Updated Resource Estimate South Tally Pond Property – Lemarchant Deposit |
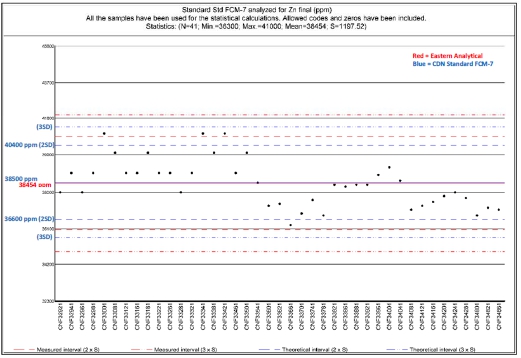
Figure 12-2e – Standard FCM-7 – Zn ppm (Eastern Analytical)
| | NI43-101 Technical Report and Updated Resource Estimate South Tally Pond Property – Lemarchant Deposit |
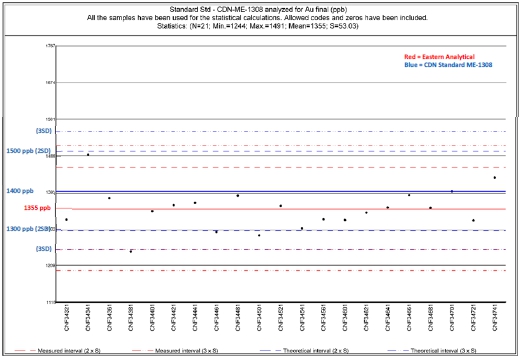
Figure 12-3a – Standard CDN-ME-1308 - Au ppb (Eastern Analytical)
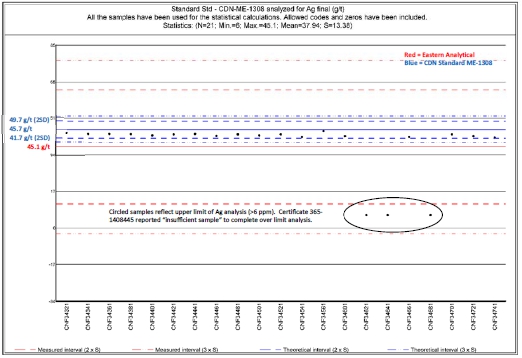
Figure 12-3b – Standard CDN-ME-1308 - Ag g/t (Eastern Analytical)
| | NI43-101 Technical Report and Updated Resource Estimate South Tally Pond Property – Lemarchant Deposit |
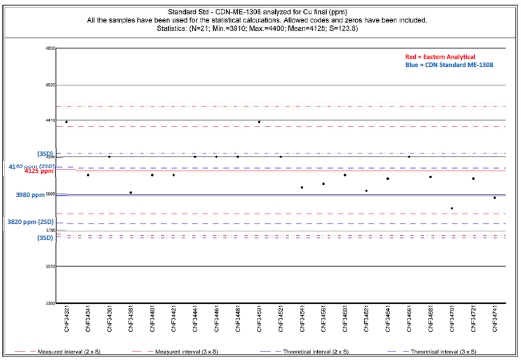
Figure 12-3c – Standard CDN-ME-1308 – Cu % (Eastern Analytical)
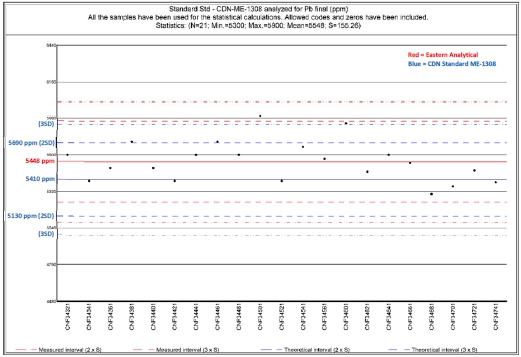
Figure 12-3d – Standard CDN-ME-1308 – Pb % (Eastern Analytical)
| | NI43-101 Technical Report and Updated Resource Estimate South Tally Pond Property – Lemarchant Deposit |
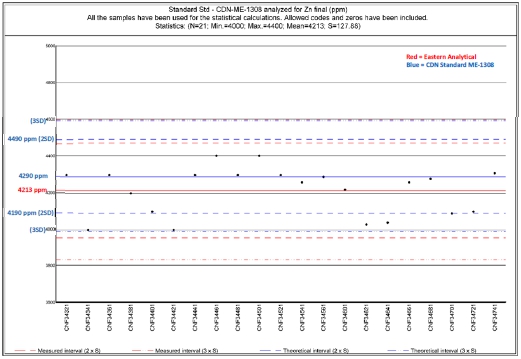
Figure 12-3e – Standard CDN-ME-1308 – Zn % (Eastern Analytical)
| | NI43-101 Technical Report and Updated Resource Estimate South Tally Pond Property – Lemarchant Deposit |
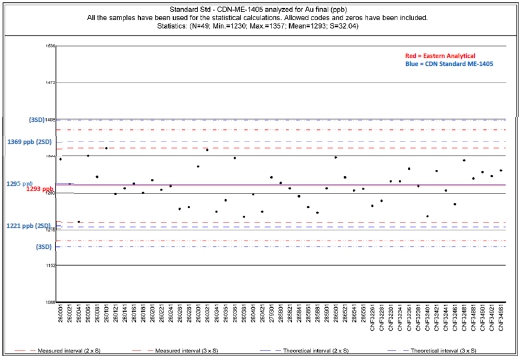
Figure 12-4a – Standard CDN-ME-1405 - Au ppb (Eastern Analytical)
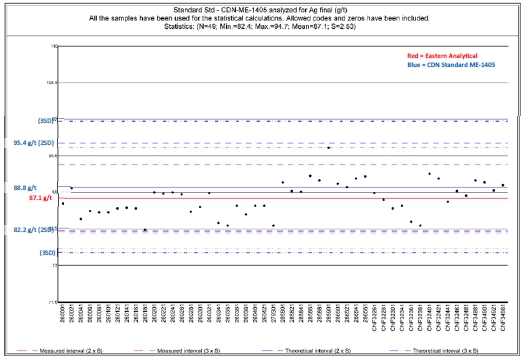
Figure 12-4b – Standard CDN-ME-1405 - Ag g/t (Eastern Analytical)
| | NI43-101 Technical Report and Updated Resource Estimate South Tally Pond Property – Lemarchant Deposit |
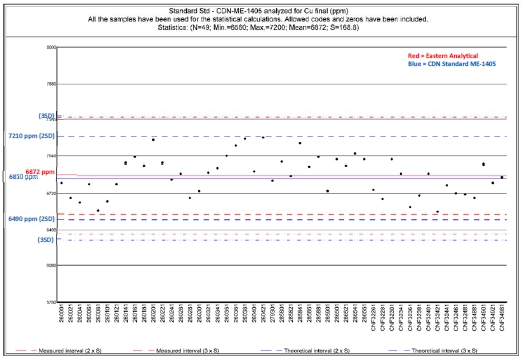
Figure 12-4c – Standard CDN-ME-1405 – Cu % (Eastern Analytical)
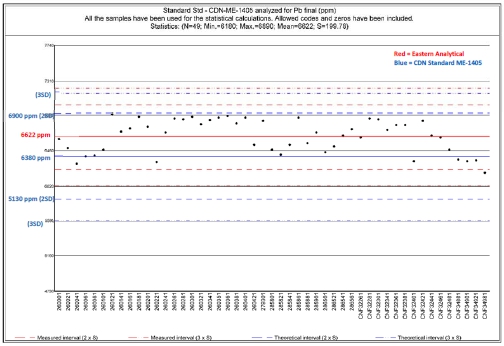
Figure 12-4d – Standard CDN-ME-1405 – Pb % (Eastern Analytical)
| | NI43-101 Technical Report and Updated Resource Estimate South Tally Pond Property – Lemarchant Deposit |
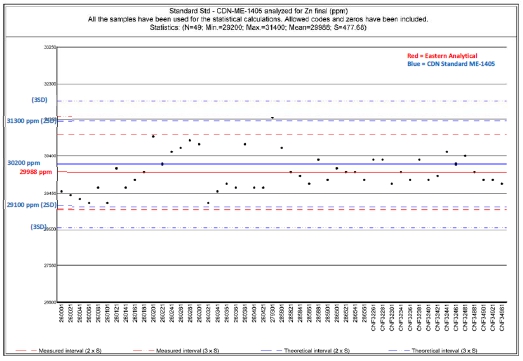
Figure 12-4e – Standard CDN-ME-1405 – Zn % (Eastern Analytical)