Exhibit 99.1
2018 INVESTOR DAY
UNEQUALED Regency’s unequaled combination of key strategic advantages and our thoughtful approach to the business will continue to clearly distinguish the company and grow shareholder value. Regency Centers | UNEQUALED 1–2
Unequaled Unequaled Combination of Strategic Combination of Achievements Objectives Strategic Advantages Regency Centers | UNEQUALED 1–3

Unequaled UnequaledUnequaled Combination of Achievements Regency Centers | UNEQUALED 1–4
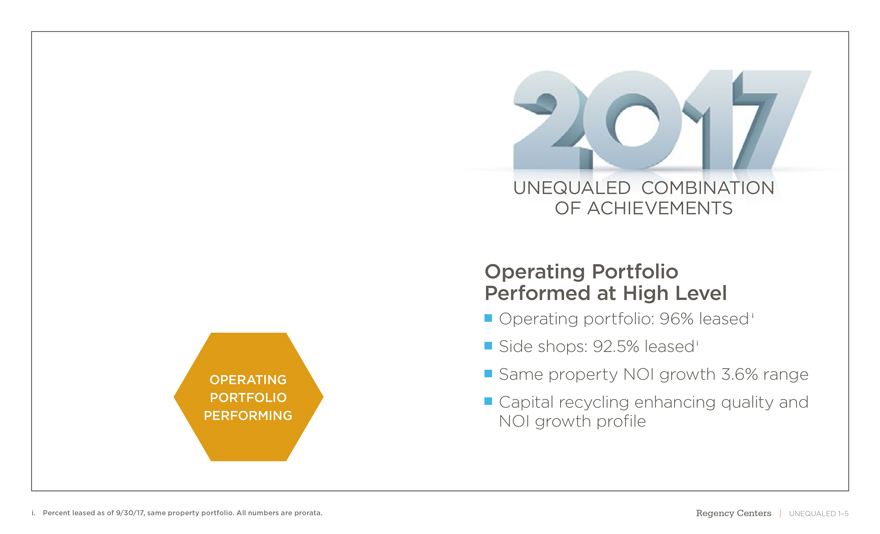
OPERATING PORTFOLIO PERFORMING UNEQUALED COMBINATION OF ACHIEVEMENTS Operating Portfolio Performed at High Level Operating portfolio: 96% leasedi Side shops: 92.5% leasedi Same property NOI growth 3.6% range Capital recycling enhancing quality and NOI growth profile i. Percent leased as of 9/30/17, same property portfolio. All numbers are prorata. Regency Centers | UNEQUALED 1–5
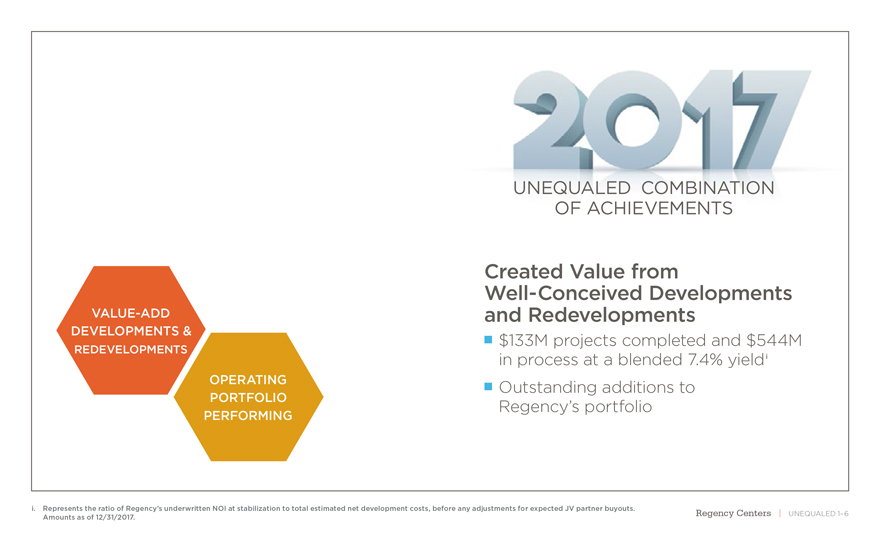
VALUE-ADD DEVELOPMENTS & REDEVELOPMENTS OPERATING PORTFOLIO PERFORMING UNEQUALED COMBINATION OF ACHIEVEMENTS Created Value from Well-Conceived Developments and Redevelopments $133M projects completed and $544M in process at a blended 7.4% yieldi Outstanding additions to Regency’s portfolio i. Represents the ratio of Regency’s underwritten NOI at stabilization to total estimated net development costs, before any adjustments for expected JV partner buyouts. Regency Centers | UNEQUALED 1–6 Amounts as of 12/31/2017.
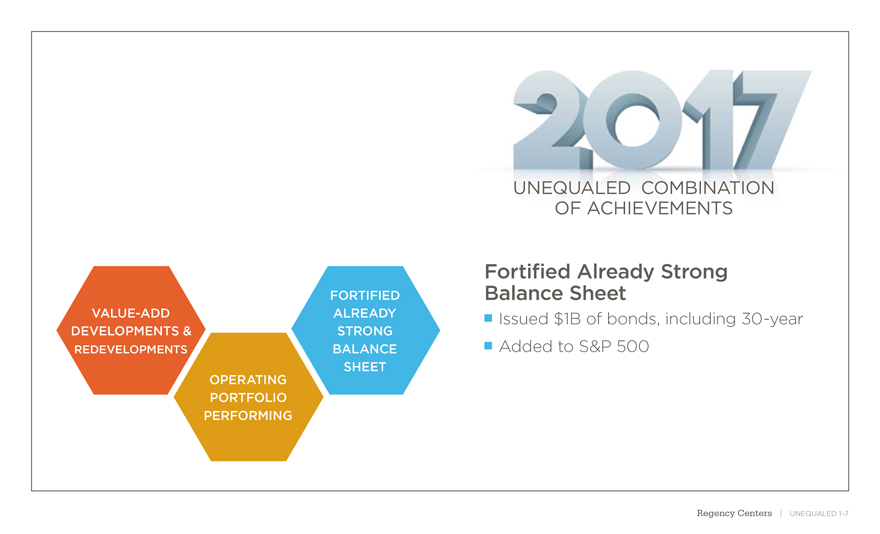
UNEQUALED COMBINATION OF ACHIEVEMENTS Fortified Already Strong FORTIFIED Balance SheetVALUE-ADD ALREADY Issued $1B of bonds, including30-year DEVELOPMENTS & STRONG REDEVELOPMENTS BALANCE Added to S&P 500 Regency Centers | UNEQUALED 1–7
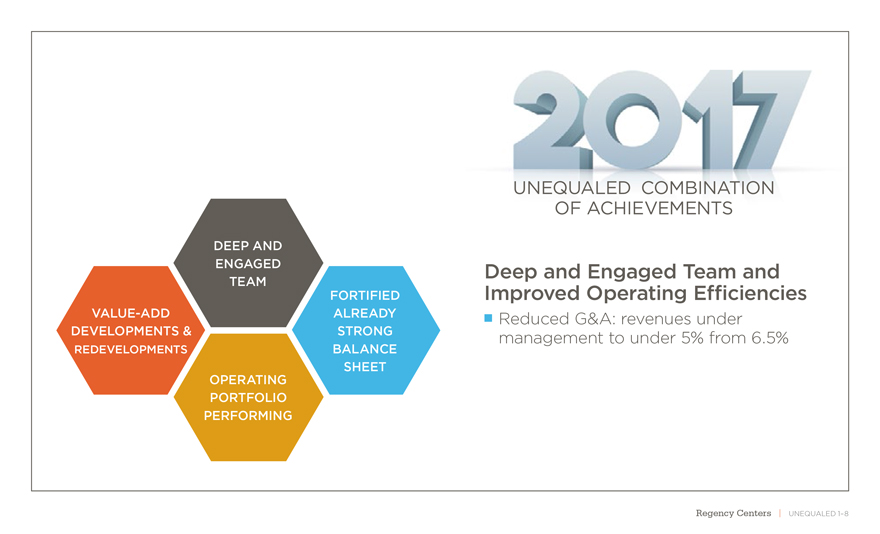
OPERATING SHEET PORTFOLIO UNEQUALED COMBINATION OF ACHIEVEMENTS DEEP AND ENGAGED Deep and Engaged Team and TEAM FORTIFIED Improved Operating EfficienciesVALUE-ADD ALREADY Reduced G&A: revenues under DEVELOPMENTS & STRONG management to under 5% from 6.5% REDEVELOPMENTS BALANCE OPERATING SHEET PORTFOLIO PERFORMING Regency Centers | UNEQUALED 1–8
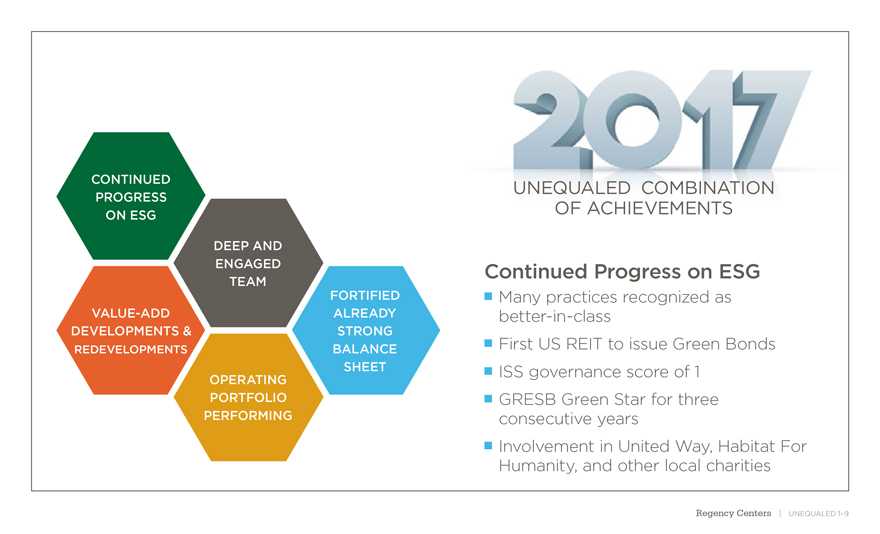
PERFORMINGCONTINUED UNEQUALED COMBINATION PROGRESS ON ESG OF ACHIEVEMENTS DEEP AND ENGAGED Continued Progress on ESG TEAM FORTIFIED Many practices recognizedas VALUE-ADD ALREADYbetter-in-class DEVELOPMENTS & STRONG REDEVELOPMENTS BALANCE First US REIT to issue Green Bonds OPERATING SHEET ISS governance score of 1 PORTFOLIO GRESB Green Star for three PERFORMING consecutive years Involvement in United Way, Habitat For Humanity, and other local charities Regency Centers | UNEQUALED 1–9
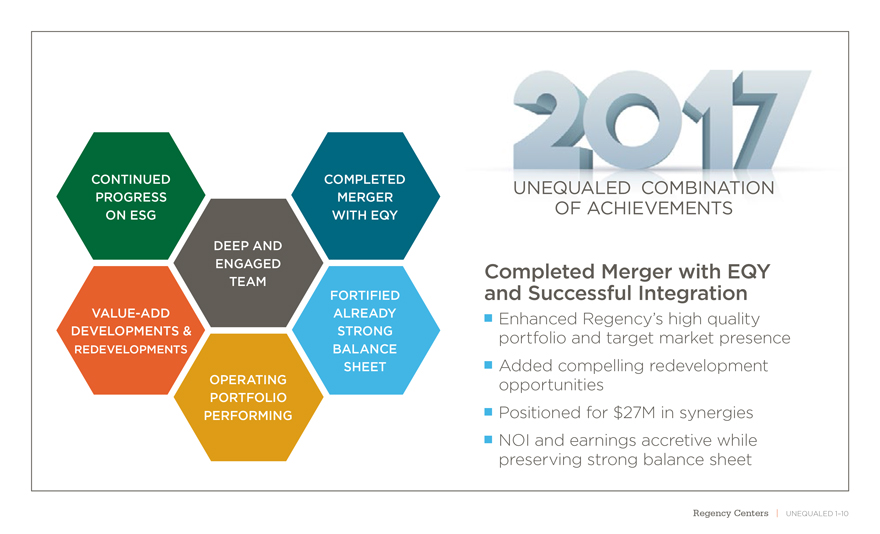
CONTINUED COMPLETED UNEQUALED COMBINATION PROGRESS MERGER ON ESG WITH EQY OF ACHIEVEMENTS DEEP AND ENGAGED Completed Merger with EQY TEAM FORTIFIED and Successful IntegrationVALUE-ADD ALREADY Enhanced Regency’s high quality DEVELOPMENTS & STRONG portfolio and target market presence REDEVELOPMENTS BALANCE SHEET Added compelling redevelopment OPERATING opportunities PORTFOLIO PERFORMING Positioned for $27M in synergies NOI and earnings accretive while preserving strong balance sheet Regency Centers | UNEQUALED 1–10
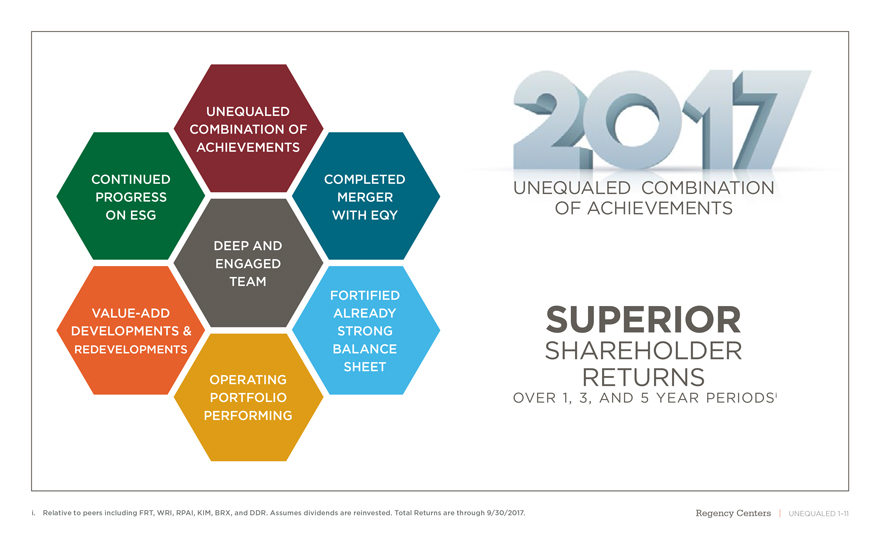
UNEQUALED COMBINATION OF ACHIEVEMENTS CONTINUED COMPLETED UNEQUALED COMBINATION PROGRESS MERGER ON ESG WITH EQY OF ACHIEVEMENTS DEEP AND ENGAGED TEAMFORTIFIED VALUE-ADD ALREADY SUPERIOR DEVELOPMENTS & STRONG REDEVELOPMENTS BALANCE SHAREHOLDER OPERATING SHEET RETURNS PORTFOLIO OVER 1, 3, AND 5 YEAR PERIODSi PERFORMING i. Relative to peers including FRT, WRI, RPAI, KIM, BRX, and DDR. Assumes dividends are reinvested. Total Returns are through 9/30/2017. Regency Centers | UNEQUALED 1–11

Strategic Objectives Regency Centers | UNEQUALED 1–12
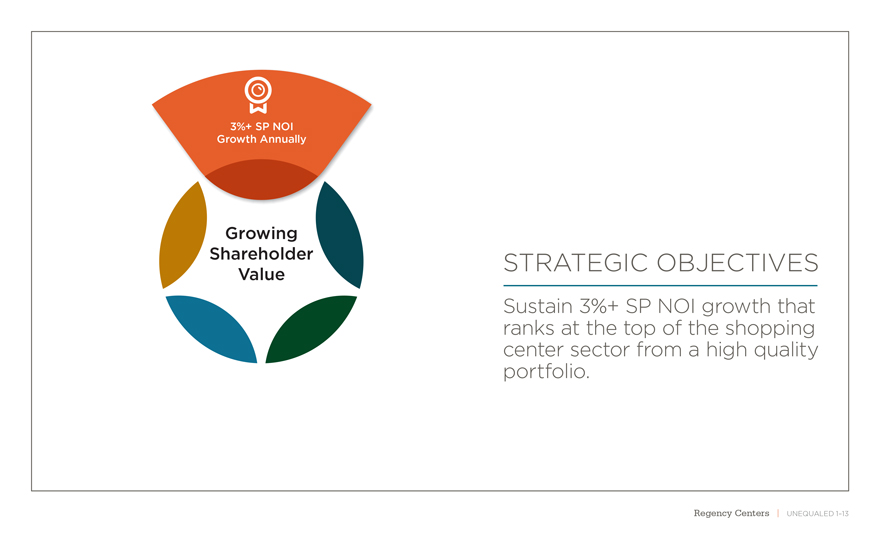
3%+ SP NOI Growth Annually Growing Shareholder STRATEGIC OBJECTIVES Value Sustain 3%+ SP NOI growth that ranks at the top of the shopping center sector from a high quality portfolio. Regency Centers | UNEQUALED 1–13
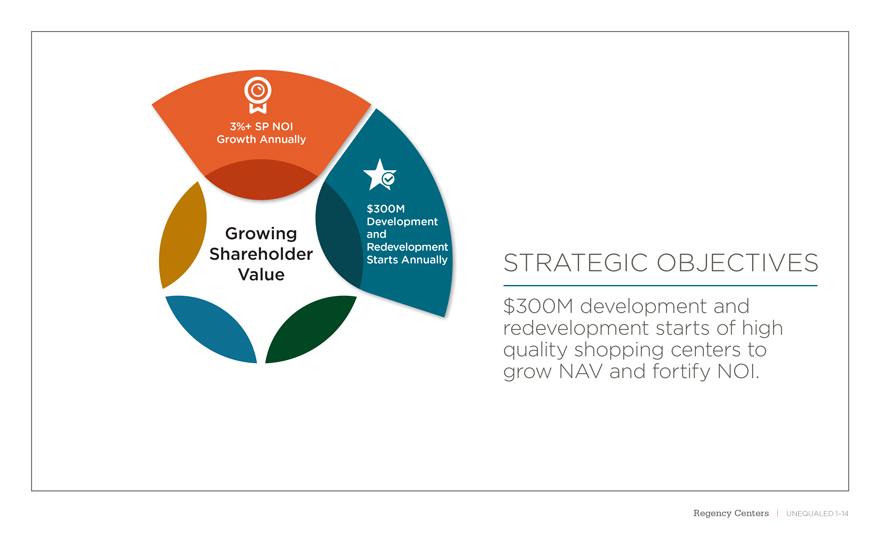
3%+ SP NOI Growth Annually $300M Development Growing and Shareholder Redevelopment Value Starts Annually STRATEGIC OBJECTIVES $300M development and redevelopment starts of high quality shopping centers to grow NAV and fortify NOI. Regency Centers | UNEQUALED 1–14
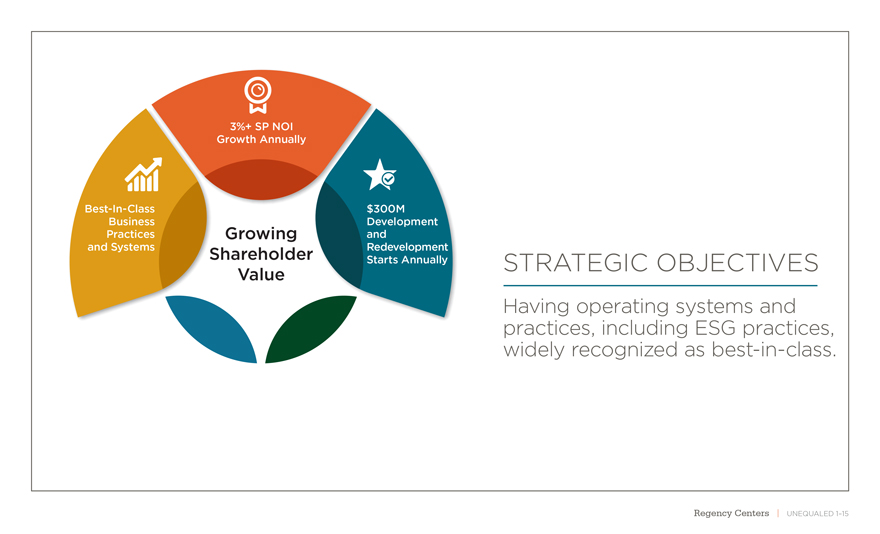
3%+ SP NOI Growth AnnuallyBest-In-Class $300M Business Development Practices Growing and and Systems Shareholder Redevelopment Value Starts Annually STRATEGIC OBJECTIVES Having operating systems and practices, including ESG practices, widely recognized asbest-in-class. Regency Centers | UNEQUALED 1–15
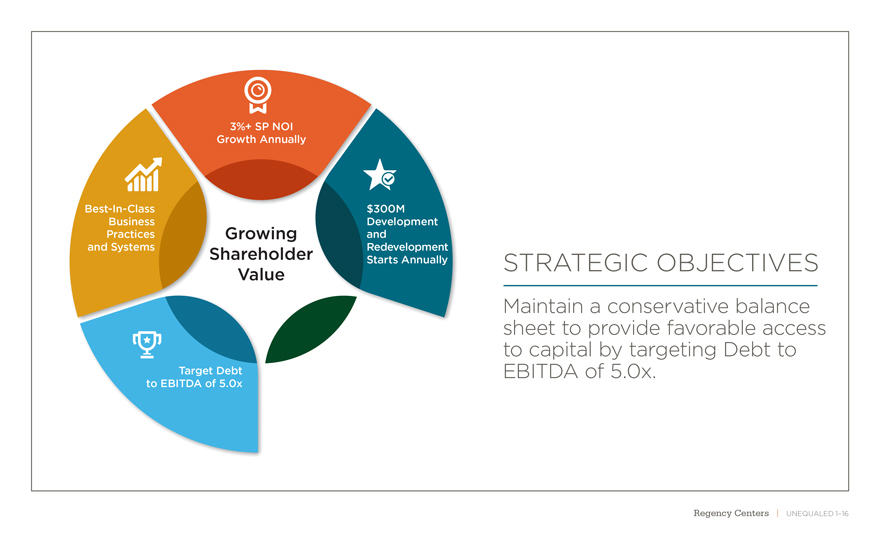
3%+ SP NOI Growth AnnuallyBest-In-Class $300M Business Development Practices Growing and and Systems Shareholder Redevelopment Value Starts Annually STRATEGIC OBJECTIVES Maintain a conservative balance sheet to provide favorable access to capital by targeting Debt to Target Debt EBITDA of 5.0x. to EBITDA of 5.0x Regency Centers | UNEQUALED 1–16
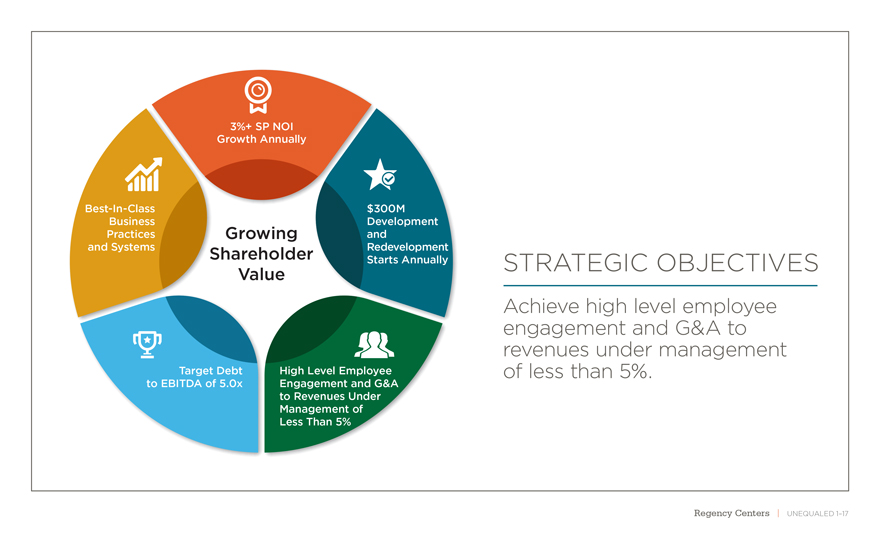
3%+ SP NOI Growth AnnuallyBest-In-Class $300M Business Development Practices Growing and and Systems Shareholder Redevelopment Value Starts Annually STRATEGIC OBJECTIVES Achieve high level employee engagement and G&A to revenues under management Target Debt High Level Employee of less than 5%. to EBITDA of 5.0x Engagement and G&A to Revenues Under Management of Less Than 5% Regency Centers | UNEQUALED 1–17
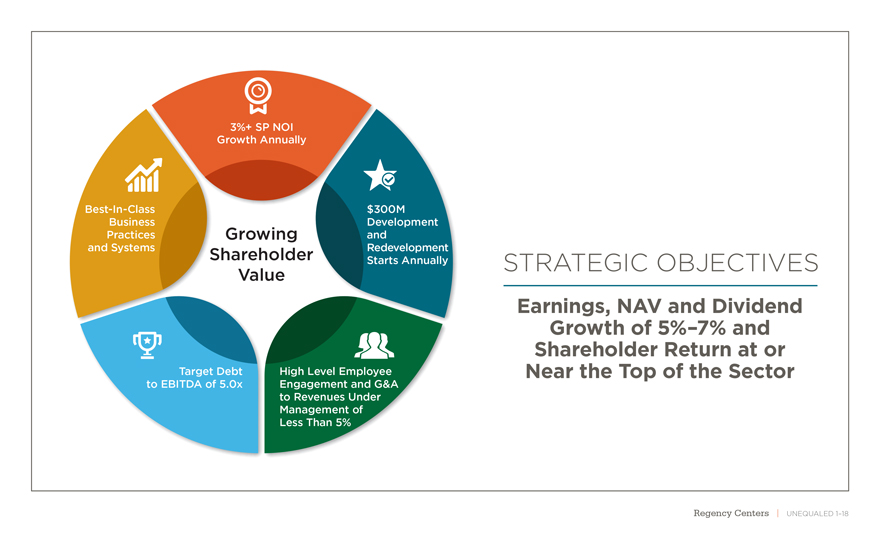
3%+ SP NOI Growth AnnuallyBest-In-Class $300M Business Development Practices Growing and and Systems Shareholder Redevelopment Value Starts Annually STRATEGIC OBJECTIVES Earnings, NAV and Dividend Growth of 5%–7% and Shareholder Return at or Target Debt High Level Employee Near the Top of the Sector to EBITDA of 5.0x Engagement and G&A to Revenues Under Management of Less Than 5% Regency Centers | UNEQUALED 1–18
STAYING RELEVANT In the ever-changing, challenging, and competitive environment for retail real estate, our commitment to striving to bebest-in-class; to staying relevant; and to continuously improve is a critical component of our business strategy. Regency will be even better positioned to benefit in both favorable and unfavorable conditions from an unequaled combination of strategic advantages. Regency Centers | UNEQUALED 1–19
Unequaled Combination of Strategic Advantages Regency Centers | UNEQUALED 1–20
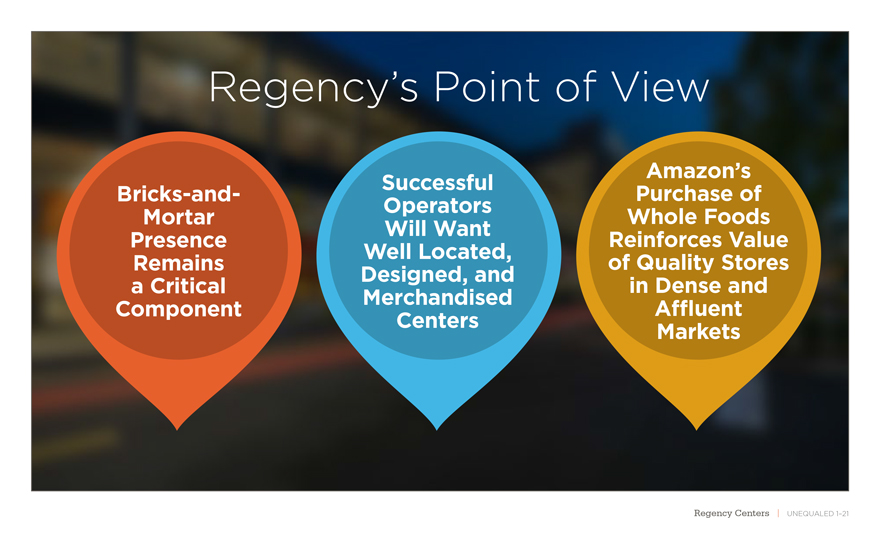
Regency’s Point of View Amazon’s Successful Purchase ofBricks-and-Operators Whole Foods Mortar Will Want Reinforces Value Presence Well Located, of Quality Stores Remains Designed, and in Dense and a Critical Merchandised Affluent Component Centers Markets Regency Centers | UNEQUALED 1–21

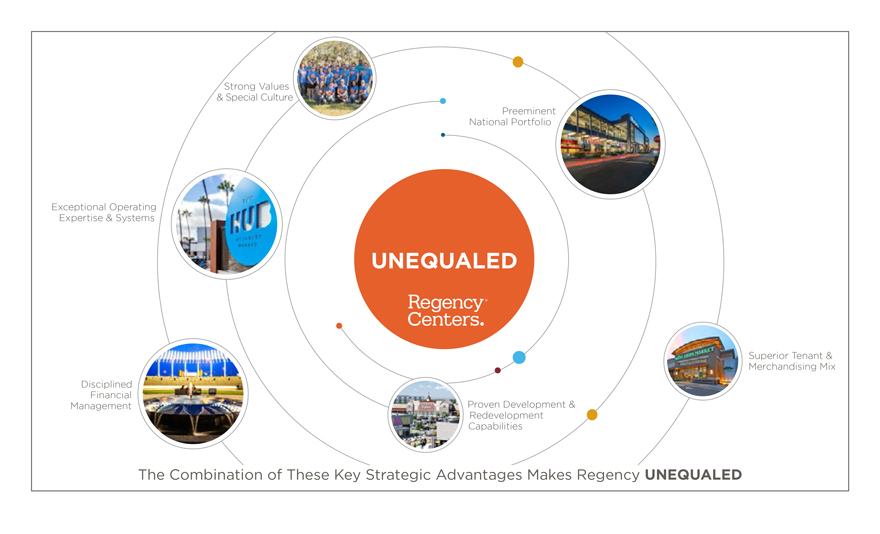
Strong Values & Special Culture Preeminent National Portfolio Exceptional Operating Expertise & Systems UNEQUALED Superior Tenant & Merchandising Mix Disciplined Financial Proven Development & Management Redevelopment Capabilities The Combination of These Key Strategic Advantages Makes Regency UNEQUALED Regency Centers | UNEQUALED 1–22
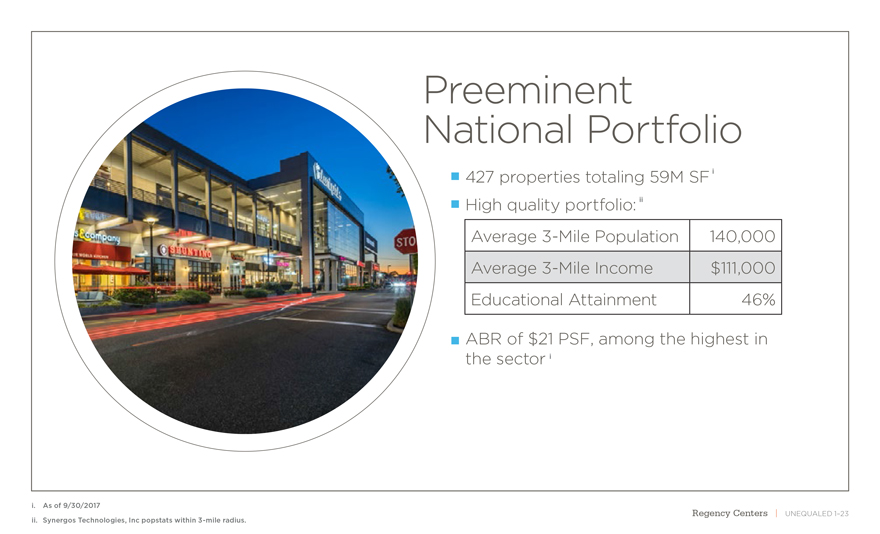
Preeminent National Portfolio i 427 properties totaling 59M SF ii High quality portfolio: Average 3-Mile Population 140,000 Average 3-Mile Income $111,000 Educational Attainment 46% ABR of $21 PSF, among the highest in the sector i i. As of 9/30/2017 ii. Synergos Technologies, Inc popstats within 3-mile radius. Regency Centers | UNEQUALED 1–23
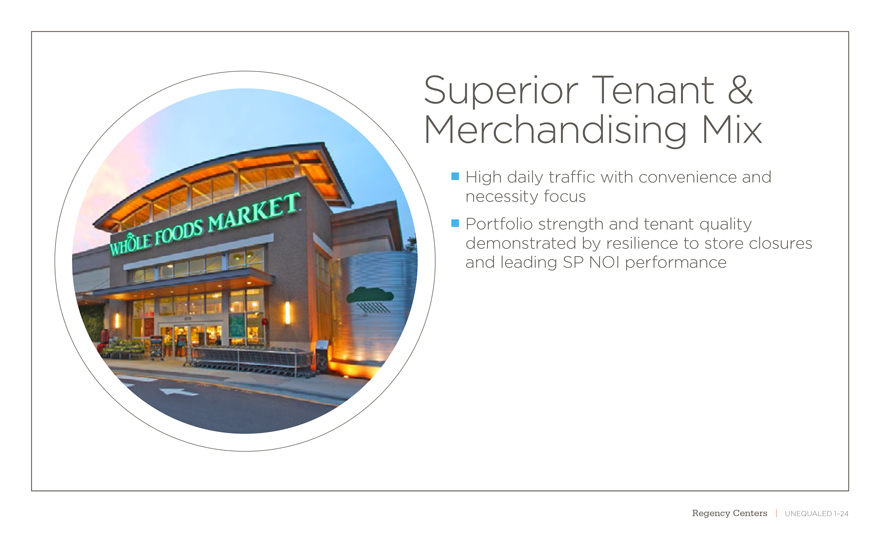
Superior Tenant & Merchandising Mix High daily traffic with convenience and necessity focus Portfolio strength and tenant quality demonstrated by resilience to store closures and leading SP NOI performance Regency Centers | UNEQUALED 1–24
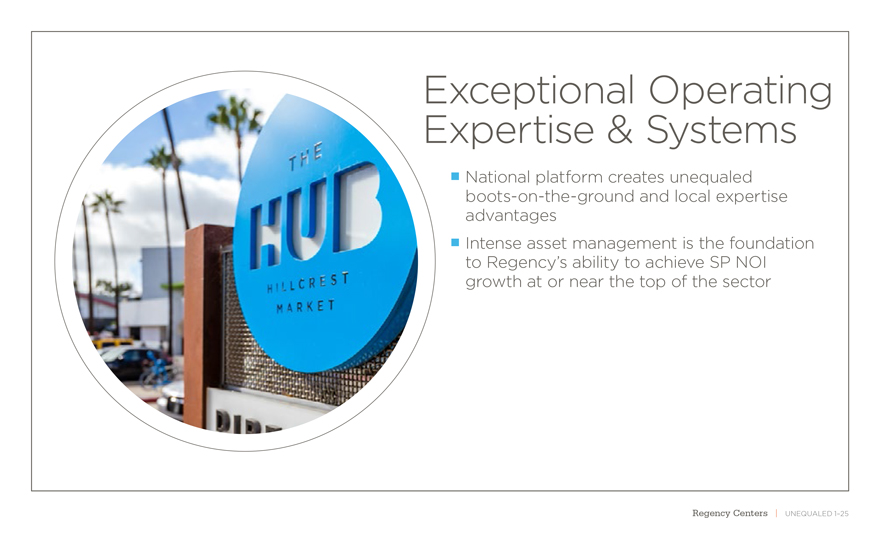
Exceptional Operating Expertise & Systems National platform creates unequaled boots-on-the-ground and local expertise advantages Intense asset management is the foundation to Regency’s ability to achieve SP NOI growth at or near the top of the sector Regency Centers | UNEQUALED 1–25
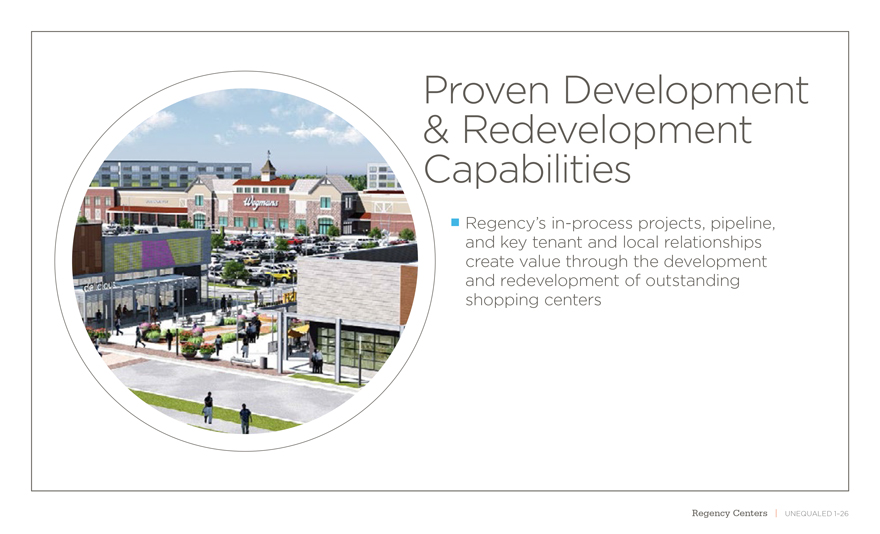
Proven Development Redevelopment capabilities Regency’sin-process projects, pipeline, and key tenant and local relationships create value through the development and redevelopment of outstanding shopping centers Regency Centers | UNEQUALED 1–26
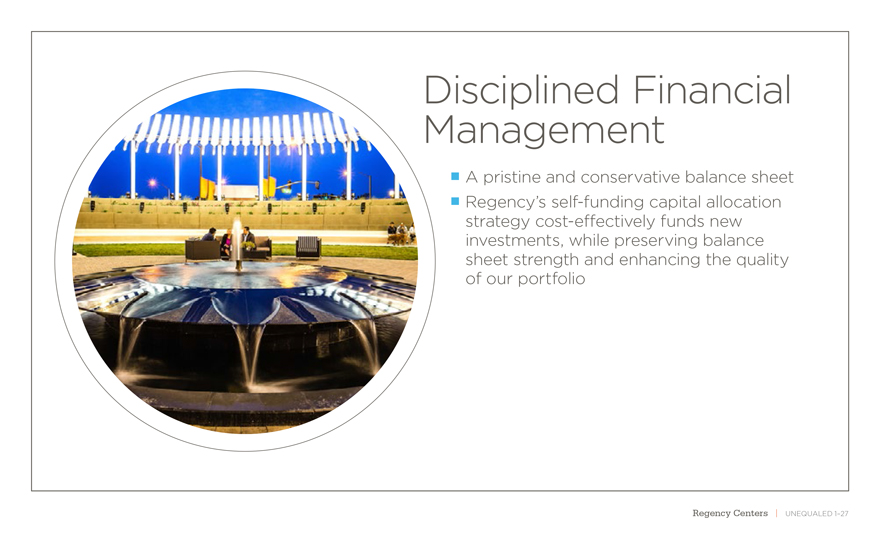
Disciplined Financial Management A pristine and conservative balance sheet Regency’s self-funding capital allocation strategy cost-effectively funds new investments, while preserving balance sheet strength and enhancing the quality of our portfolio Regency Centers | UNEQUALED 1–27
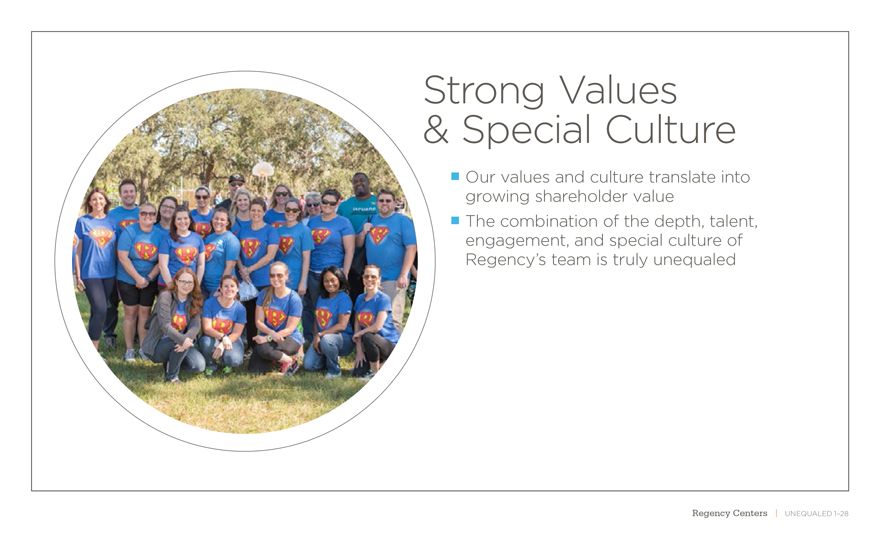
Strong Values & Special Culture Our values and culture translate into growing shareholder value The combination of the depth, talent, engagement, and special culture of Regency’s team is truly unequaled Regency Centers | UNEQUALED 1–28

Strong Values & Special Culture Preeminent National Portfolio Exceptional Operating Expertise & Systems UNEQUALED Superior Tenant & Merchandising Mix Disciplined Financial Proven Development & Management Redevelopment Capabilities The Combination of These Key Strategic Advantages Makes Regency UNEQUALED Regency Centers | UNEQUALED 1–29
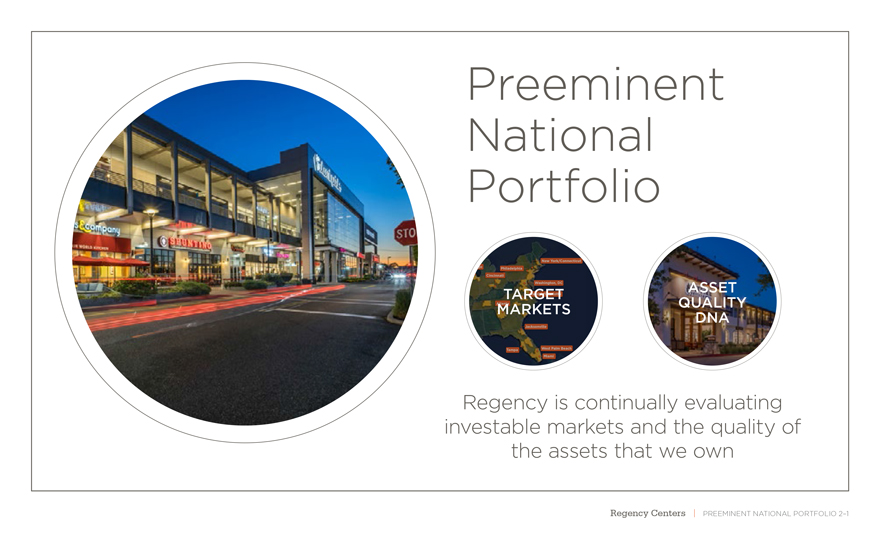
Preeminent National Portfolio New York/Connecticut Chicago Philadelphia Cincinnati Washington, DC ASSET TARGET Raleigh/Charlotte MARKETS tlanta QUALITY DNA Jacksonville Tampa West Palm Beach Miami Regency is continually evaluating investable markets and the quality of the assets that we own Regency Centers | PREEMINENT NATIONAL PORTFOLIO 2–1
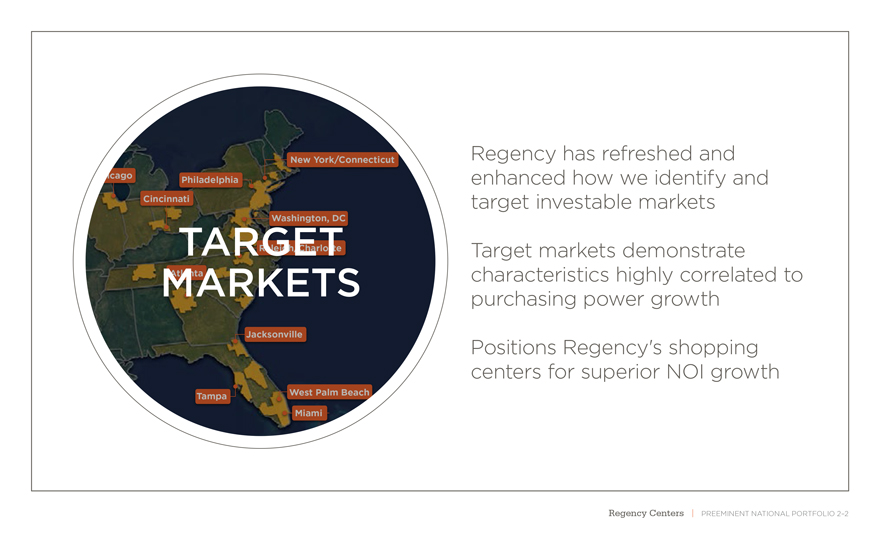
New York/Connecticut Regency has refreshed and Chicago Philadelphia enhanced how we identify and Cincinnati target investable markets Washington, DC TARGET Raleigh/Charlotte Target markets demonstrate MARKETS tlanta characteristics highly correlated to purchasing power growth Jacksonville Positions Regency’s shopping centers for superior NOI growth on Tampa West Palm Beach Miami Regency Centers | PREEMINENT NATIONAL PORTFOLIO 2–2
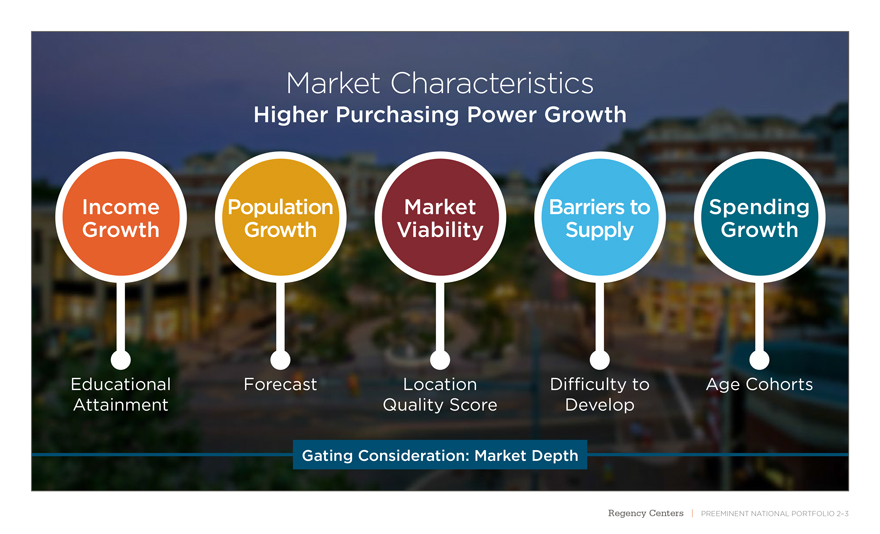
Market Characteristics Higher Purchasing Power Growth Income Population Market Barriers to Spending Growth Growth Viability Supply Growth Educational Forecast Location Difficulty to Age Cohorts Attainment Quality Score Develop Gating Consideration: Market Depth Regency Centers | PREEMINENT NATIONAL PORTFOLIO 2–3

Target Market Focus Seattle/Portland 3.4% Boston 2.7% New York Metro Chicago 11.3% Bay Area Denver/Boulder 15.7% 2.1% 2.4% DC/Baltimore/ Richmond LA/Orange 7.6% County Raleigh/Charlotte/ 8.6% Charleston Atlanta 2.5% San Diego 4.4% 5.3% Dallas/ Houston/Austin North Florida 7.2% 3.0% Southwest Florida 427 PROPERTIES IN TOP MARKETS 3.0% >96% PROPERTIES LOCATED IN TOP MARKETS Miami/Ft. Lauderdale/ Palm Beach Market concentration as a % of prorata value 12.0% Regency Centers | PREEMINENT NATIONAL PORTFOLIO 2–4
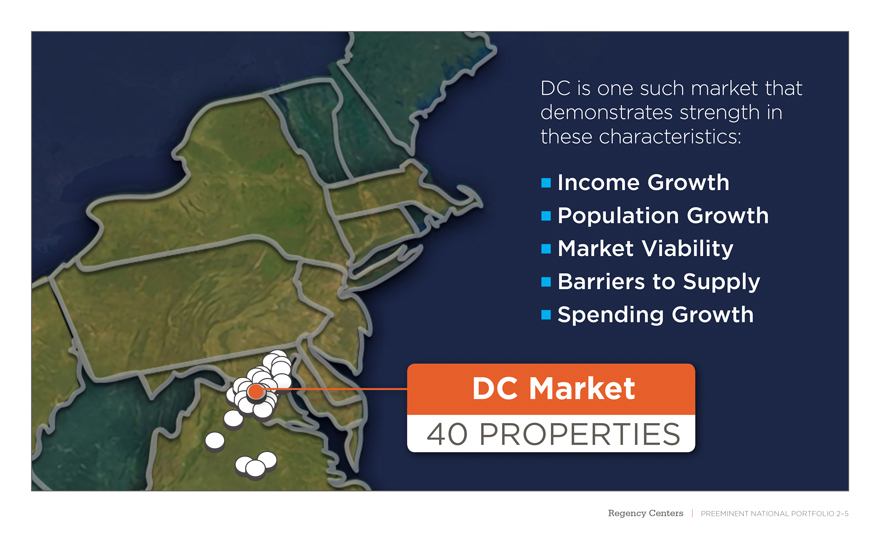
DC is one such market that demonstrates strength in these characteristics: n Income Growth n Population Growth n Market Viability n Barriers to Supply n Spending Growth DC Market 40 PROPERTIES Regency Centers | PREEMINENT NATIONAL PORTFOLIO 2–5
KINGS PARK SHOPPING CENTER Washington, DC Market Regency Centers | PREEMINENT NATIONAL PORTFOLIO 2–6

Washington DC Market Regency Centers | PREEMINENT NATIONAL PORTFOLIO 2–7

Preeminent National Portfolio New York/Connecticut Chicago Philadelphia Cincinnati Washington, DC ASSET TARGET Raleigh/Charlotte MARKETS tlanta QUALITY DNA Jacksonville Tampa West Palm Beach Miami Regency is continually evaluating investable markets and the quality of the assets that we own Regency Centers | PREEMINENT NATIONAL PORTFOLIO 2–8
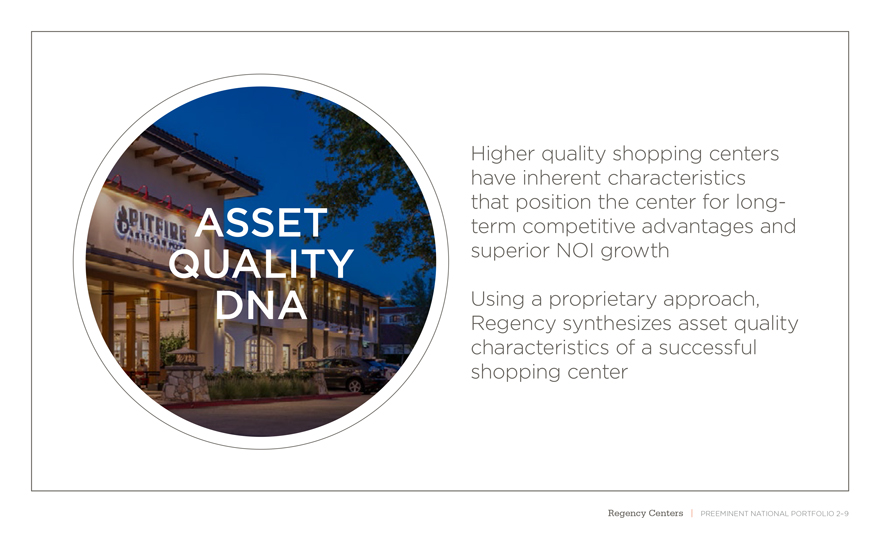
Higher quality shopping centers have inherent characteristics that position the center for long-ASSET term competitive advantages and QUALITY superior NOI growth DNA Using a proprietary approach, Regency synthesizes asset quality characteristics of a successful shopping center Regency Centers | PREEMINENT NATIONAL PORTFOLIO 2–9
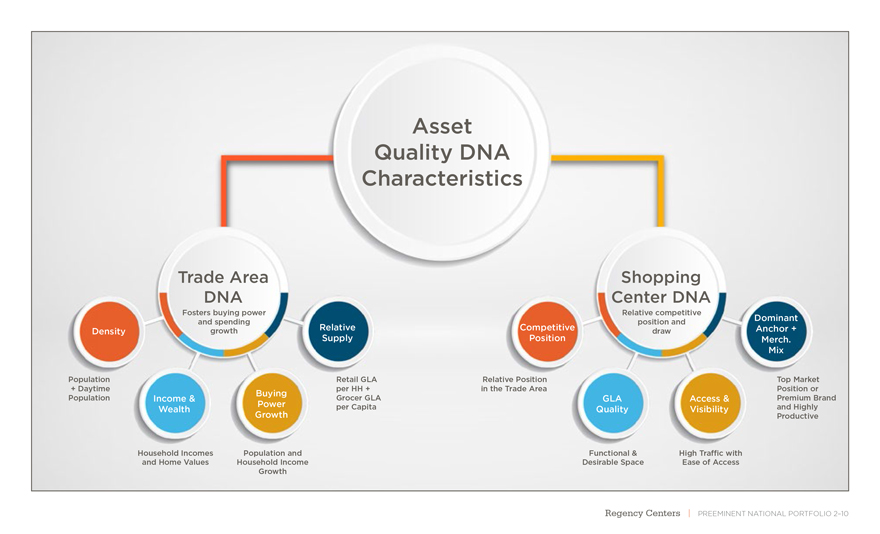
Asset Quality DNA Characteristics Trade Area Shopping DNA Center DNA Fosters buying power Relative competitive and spending position and Dominant Density growth Relative Competitive draw Anchor + Supply Position Merch. Mix Population Retail GLA Relative Position Top Market + Daytime Buying per HH + in the Trade Area Position or Population Income & Grocer GLA GLA Access & Premium Brand Power per Capita and Highly Wealth Quality Visibility Growth Productive Household Incomes Population and Functional & High Traffic with and Home Values Household Income Desirable Space Ease of Access Growth Regency Centers | PREEMINENT NATIONAL PORTFOLIO 2–10
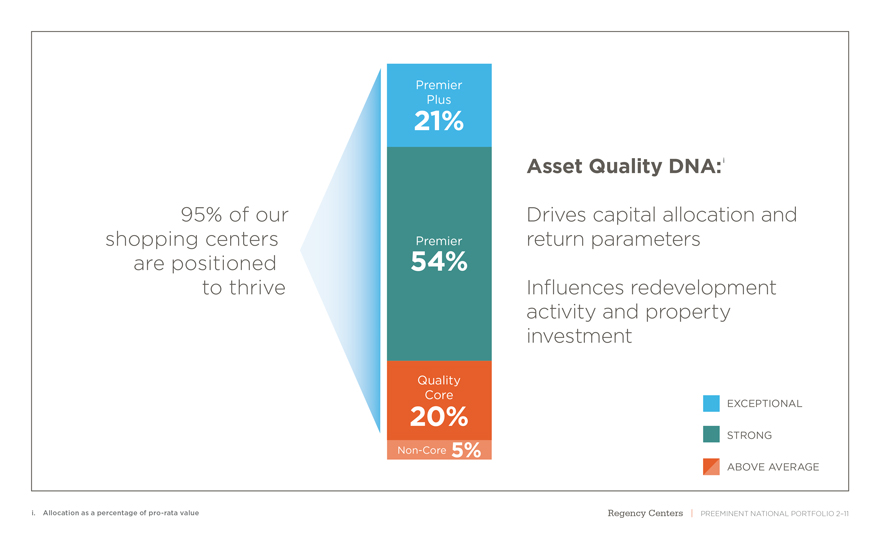
Premier Plus 21% Asset Quality DNA:i 95% of our Drives capital allocation and shopping centers Premier return parameters are positioned 54% to thrive Influences redevelopment activity and property investment Quality Core 20% EXCEPTIONAL STRONG Non-Core 5% ABOVE AVERAGE i. Allocation as a percentage of pro-rata value Regency Centers | PREEMINENT NATIONAL PORTFOLIO 2–11
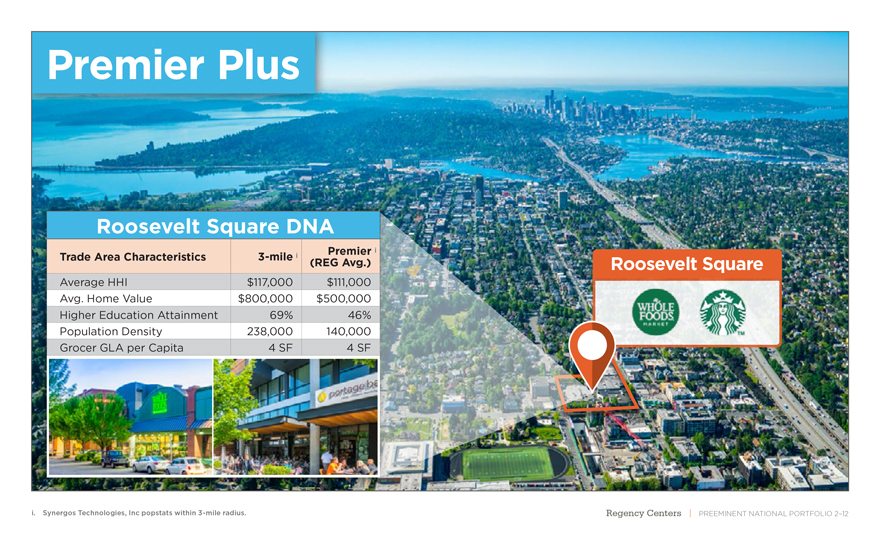
Premier Plus Roosevelt Square DNA Premier i Trade Area Characteristics3-mile i (REG Avg.) Average HHI $117,000 $111,000 Avg. Home Value $800,000 $500,000 Higher Education Attainment 69% 46% Population Density 238,000 140,000 Grocer GLA per Capita 4 SF 4 SF i. Synergos Technologies, Inc popstats within3-mile radius. Regency Centers | PREEMINENT NATIONAL PORTFOLIO 2–12 Roosevelt Square
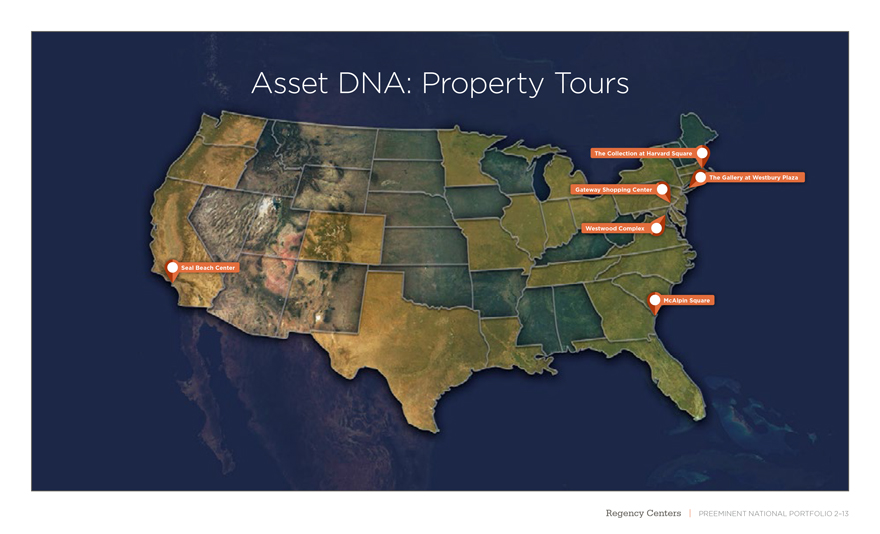
Asset DNA: Property Tours The Collection at Harvard Square The Gallery at Westbury Plaza Gateway Shopping Center Westwood Complex Seal Beach Center McAlpin Square Regency Centers | PREEMINENT NATIONAL PORTFOLIO 2–13
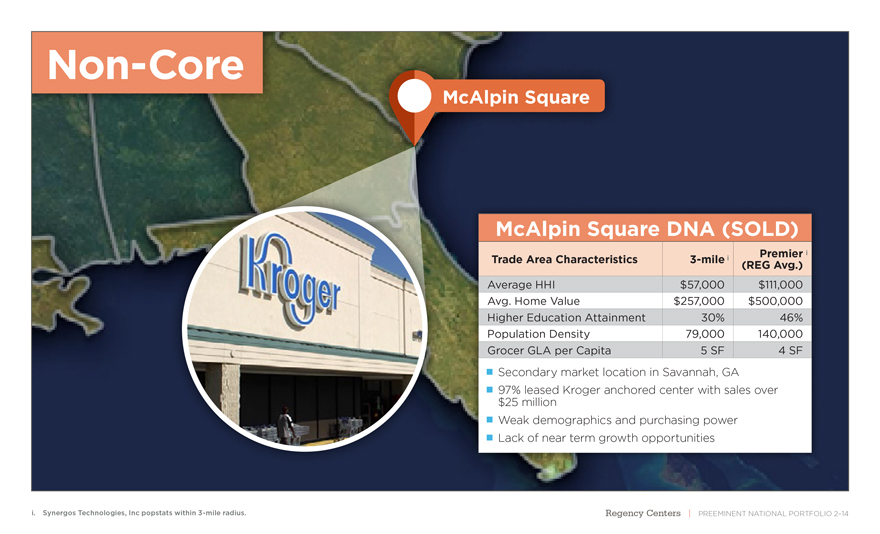
Non-Core McAlpin Square McAlpin Square DNA (SOLD) Premier i Trade Area Characteristics3-mile i (REG Avg.) Average HHI $57,000 $111,000 Avg. Home Value $257,000 $500,000 Higher Education Attainment 30% 46% Population Density 79,000 140,000 Grocer GLA per Capita 5 SF 4 SF Secondary market location in Savannah, GA 97% leased Kroger anchored center with sales over $25 million Weak demographics and purchasing power Lack of near term growth opportunities i. Synergos Technologies, Inc popstats within3-mile radius. Regency Centers | PREEMINENT NATIONAL PORTFOLIO 2–14
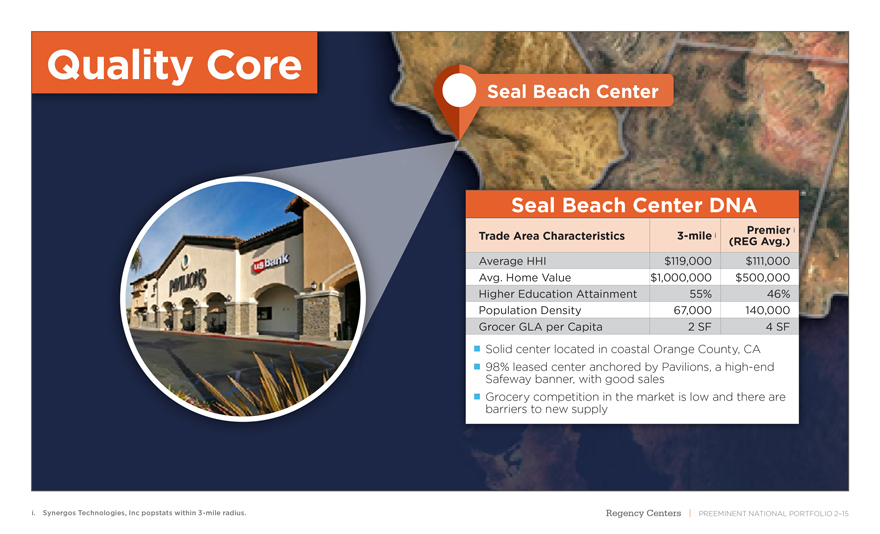
Quality Core Seal Beach Center Seal Beach Center DNA Premier i Trade Area Characteristics3-mile i (REG Avg.) Average HHI $119,000 $111,000 Avg. Home Value $1,000,000 $500,000 Higher Education Attainment 55% 46% Population Density 67,000 140,000 Grocer GLA per Capita 2 SF 4 SF Solid center located in coastal Orange County, CA 98% leased center anchored by Pavilions, ahigh-end Safeway banner, with good sales Grocery competition in the market is low and there are barriers to new supply i. Synergos Technologies, Inc popstats within3-mile radius. Regency Centers | PREEMINENT NATIONAL PORTFOLIO 2–15

GATEWAY SHOPPING CENTER Philadelphia Market Regency Centers | PREEMINENT NATIONAL PORTFOLIO 2–16
THE GALLERY AT WESTBURY PLAZA New York, NY Regency Centers | PREEMINENT NATIONAL PORTFOLIO 2–17
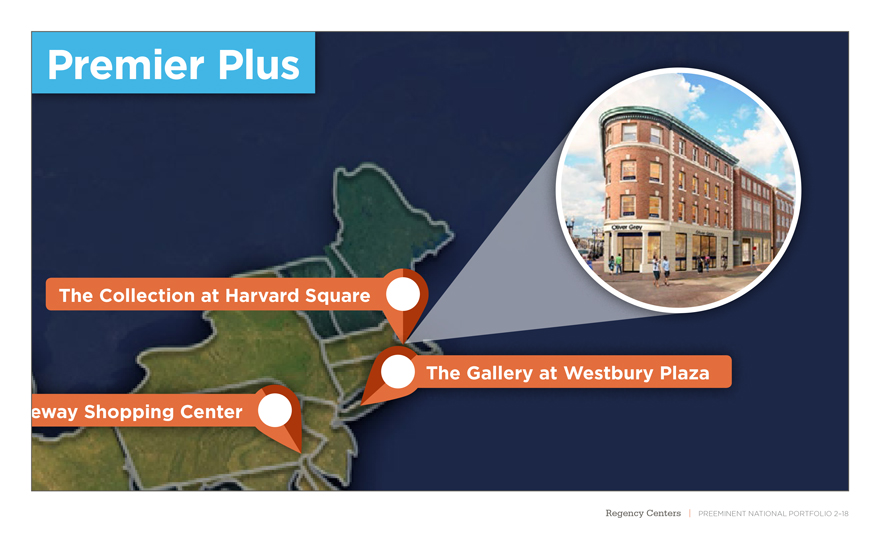
Premier Plus The Collection at Harvard Square The Gallery at Westbury Plaza eway Shopping Center Regency Centers | PREEMINENT NATIONAL PORTFOLIO 2–18
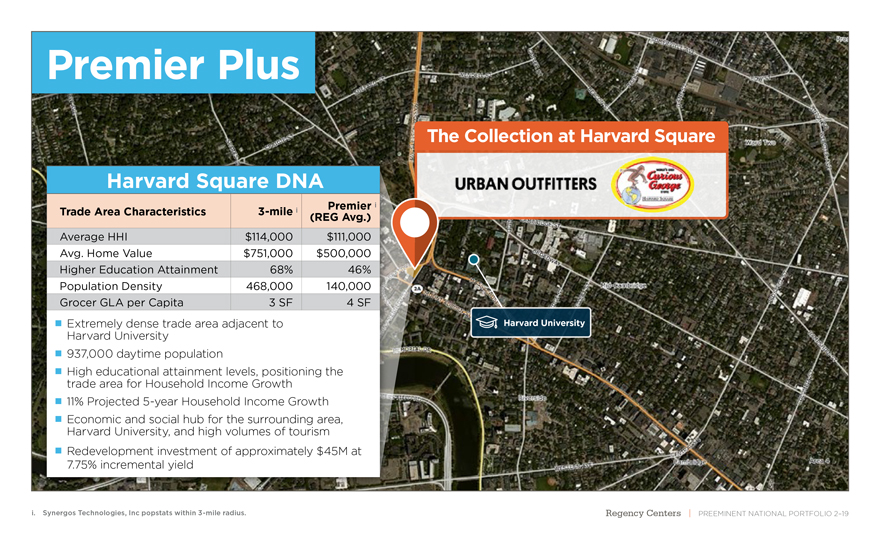
Premier Plus The Collection at Harvard Square Harvard Square DNA Premier i Trade Area Characteristics3-mile i (REG Avg.) Average HHI $114,000 $111,000 Avg. Home Value $751,000 $500,000 Higher Education Attainment 68% 46% Population Density 468,000 140,000 Grocer GLA per Capita 3 SF 4 SF Extremely dense trade area adjacent to Harvard University Harvard University 937,000 daytime population High educational attainment levels, positioning the trade area for Household Income Growth 11% Projected5-year Household Income Growth Economic and social hub for the surrounding area, Harvard University, and high volumes of tourism Redevelopment investment of approximately $45M at 7.75% incremental yield i. Synergos Technologies, Inc popstats within3-mile radius. Regency Centers | PREEMINENT NATIONAL PORTFOLIO 2–19
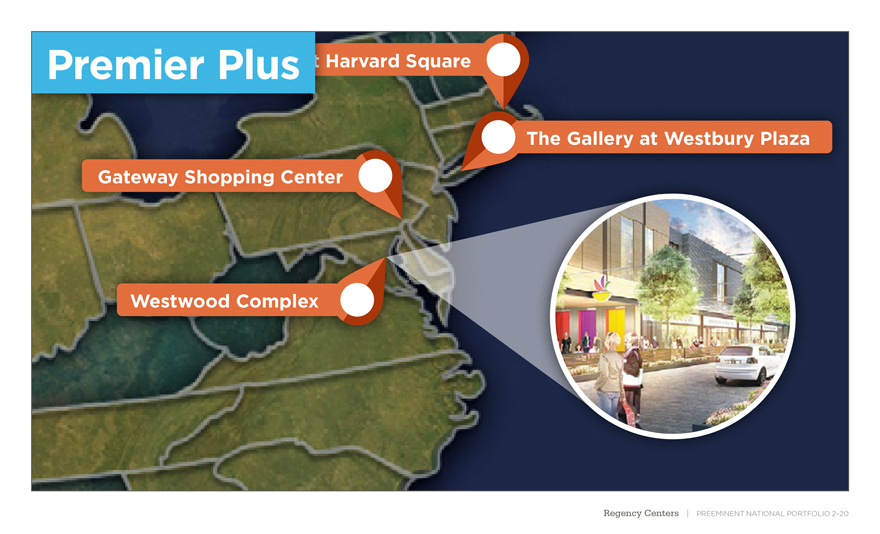
Premier Plus Harvard Square The Gallery at Westbury Plaza Gateway Shopping Center Westwood Complex Regency Centers | PREEMINENT NATIONAL PORTFOLIO 2–20
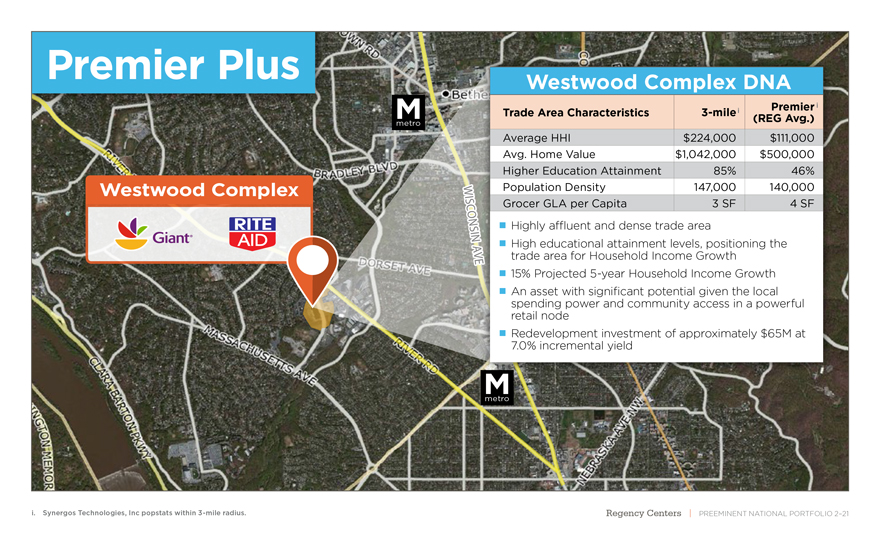
Premier Plus Westwood Complex DNA Premieri M Trade Area Characteristics3-milei (REG Avg.) metro Average HHI $224,000 $111,000 Avg. Home Value $1,042,000 $500,000 Higher Education Attainment 85% 46% Westwood Complex W Population Density 147,000 140,000 I S Grocer GLA per Capita 3 SF 4 SF C O N Highly affluent and dense trade area S I N High educational attainment levels, positioning the A trade area for Household Income Growth 15% Projected5-year Household Income Growth An asset with significant potential given the local spending power and community access in a powerful retail node Redevelopment investment of approximately $65M at 7.0% incremental yield M metro i. Synergos Technologies, Inc popstats within3-mile radius. Regency Centers | PREEMINENT NATIONAL PORTFOLIO 2–21

Strong Values & Special Culture Preeminent National Portfolio Exceptional Operating Expertise & Systems UNEQUALED Superior Tenant & Merchandising Mix Disciplined Financial Proven Development & Management Redevelopment Capabilities The Combination of These Key Strategic Advantages Makes Regency UNEQUALED
Superior Tenant & Merchandising Mix Regency Centers | SUPERIOR TENANT & MERCHANDISING MIX 3–1
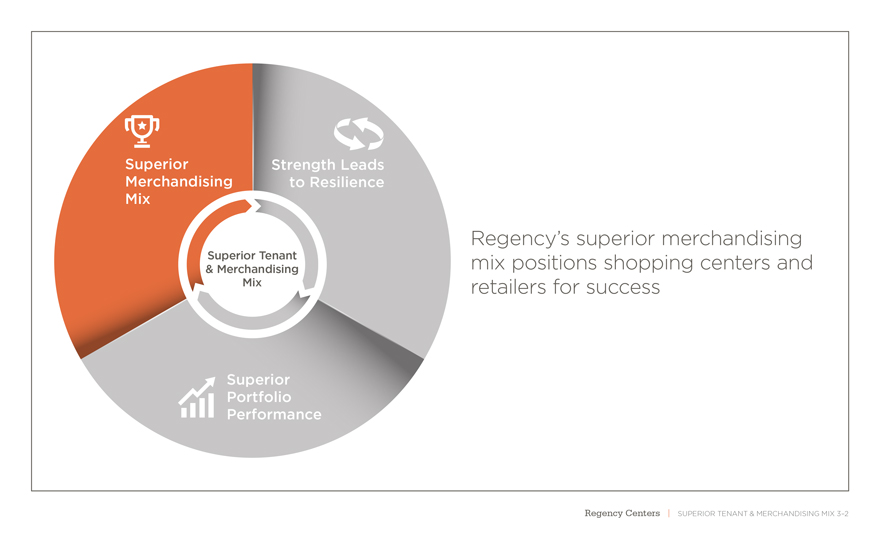
Superior Strength Leads Merchandising to Resilience Mix Regency’s superior merchandising Superior Tenant mix positions shopping centers and & Merchandising Mix retailers for success Superior Portfolio Performance Regency Centers | SUPERIOR TENANT & MERCHANDISING MIX 3–2
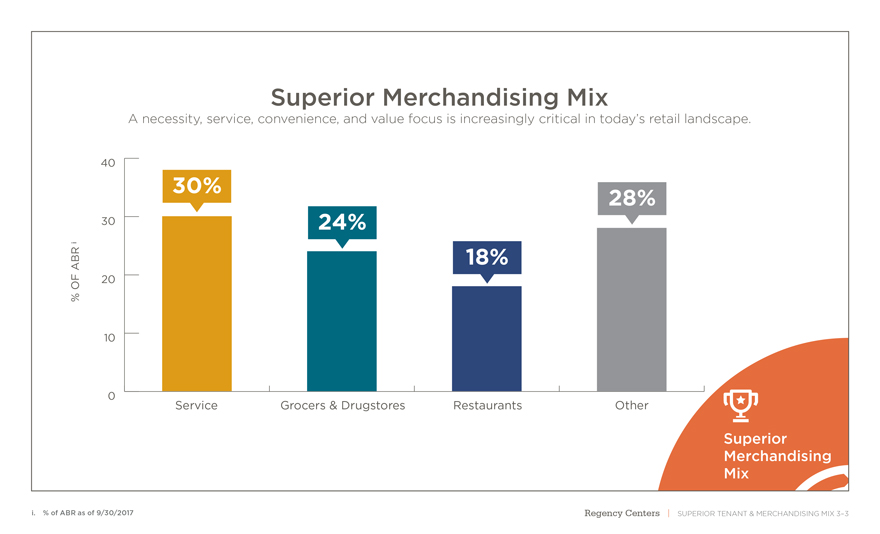
Superior Merchandising Mix A necessity, service, convenience, and value focus is increasingly critical in today’s retail landscape. 40 30% 28% 30 24% i 18% ABR OF 20 % 10 0 Service Grocers & Drugstores Restaurants Other Superior Merchandising Mix i. % of ABR as of 9/30/2017 Regency Centers | SUPERIOR TENANT & MERCHANDISING MIX 3–3
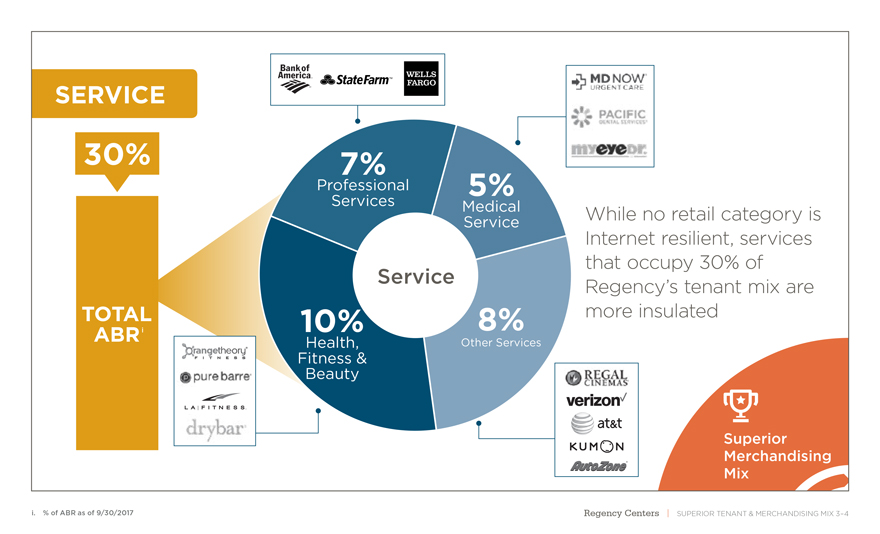
SERVICE 30% 7% Professional Services 5% Medical Service While no retail category is Internet resilient, services that occupy 30% of Service Regency’s tenant mix are TOTAL 10% 8% more insulated ABRi Health, Other Services Fitness Beauty & Superior Merchandising Mix i. % of ABR as of 9/30/2017 Regency Centers | SUPERIOR TENANT & MERCHANDISING MIX 3–4
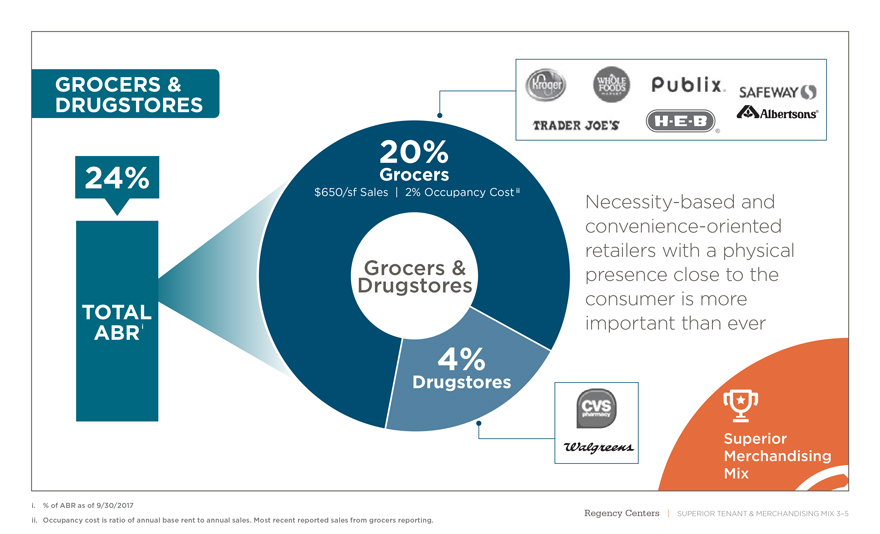
GROCERS & DRUGSTORES 20% Grocers 24% $650/sf Sales | 2% Occupancy Costii Necessity-based and convenience-oriented retailers with a physical Grocers & presence close to the Drugstores consumer is more TOTAL ABRi important than ever Drugstores 4% Superior Merchandising Mix i. % of ABR as of 9/30/2017 Centers ii. Occupancy cost is ratio of annual base rent to annual sales. Most recent reported sales from grocers reporting. Regency | SUPERIOR TENANT & MERCHANDISING MIX 3–5
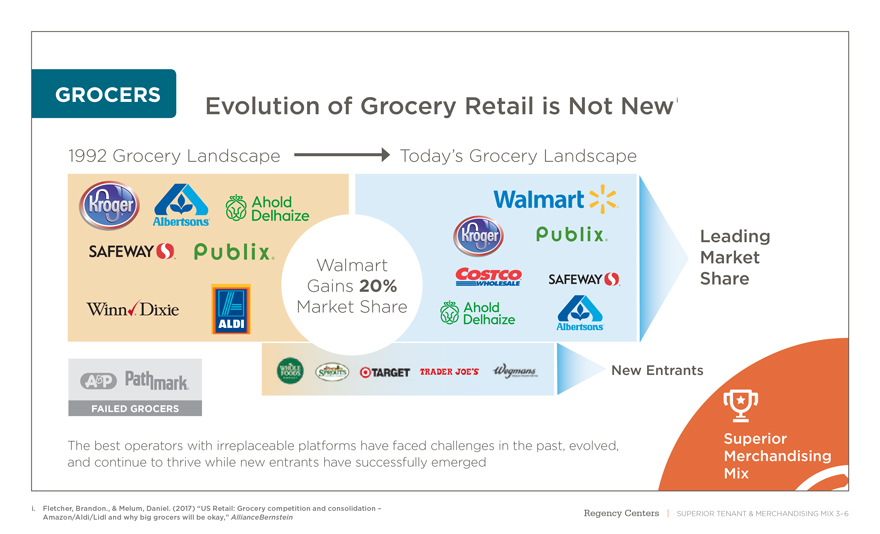
GROCERS Evolution of Grocery Retail is Not Newi 1992 Grocery Landscape Today’s Grocery Landscape Leading Walmart Market Gains 20% Share Market Share New Entrants FAILED GROCERS Superior The best operators with irreplaceable platforms have faced challenges in the past, evolved, and continue to thrive while new entrants have successfully emerged Merchandising Mix i. Fletcher, Brandon., & Melum, Daniel. (2017) “US Retail: Grocery competition and consolidation – Regency Centers | SUPERIOR TENANT & MERCHANDISING MIX 3–6 Amazon/Aldi/Lidl and why big grocers will be okay,” AllianceBernstein
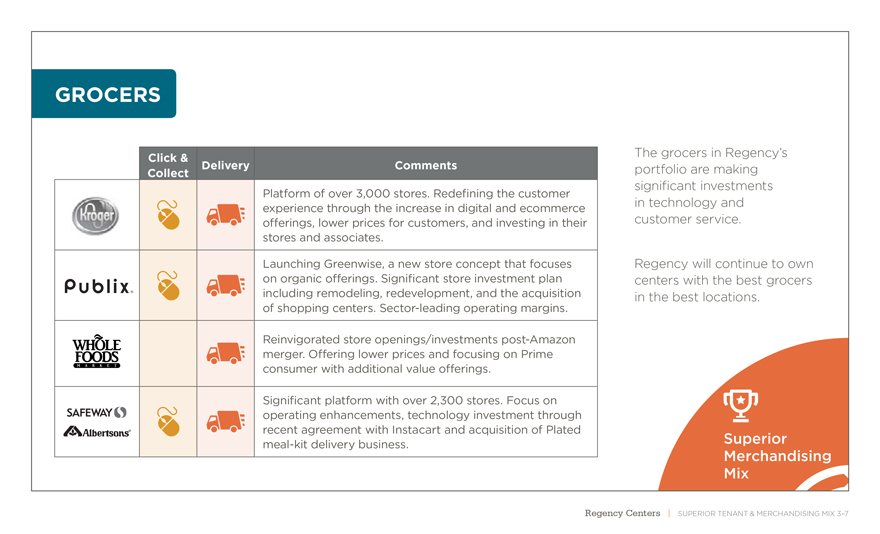
GROCERS Click & The grocers in Regency’s Delivery Comments portfolio are making Collect significant investments Platform of over 3,000 stores. Redefining the customer experience through the increase in digital and ecommerce in technology and offerings, lower prices for customers, and investing in their customer service. stores and associates. Launching Greenwise, a new store concept that focuses Regency will continue to own on organic offerings. Significant store investment plan centers with the best grocers including remodeling, redevelopment, and the acquisition in the best locations. of shopping centers. Sector-leading operating margins. Reinvigorated store openings/investmentspost-Amazon merger. Offering lower prices and focusing on Prime consumer with additional value offerings. Significant platform with over 2,300 stores. Focus on operating enhancements, technology investment through recent agreement with Instacart and acquisition of Platedmeal-kit delivery business. Superior Merchandising Mix Regency Centers | SUPERIOR TENANT & MERCHANDISING MIX 3–7
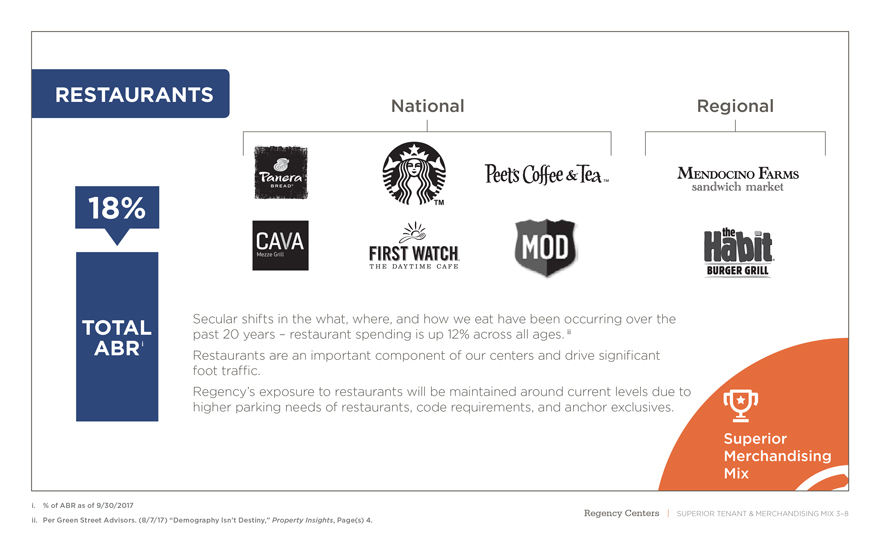
RESTAURANTS National Regional 18% Secular shifts in the what, where, and how we eat have been occurring over the TOTAL past 20 years – restaurant spending is up 12% across all ages. ii ABRi Restaurants are an important component of our centers and drive significant foot traffic. Regency’s exposure to restaurants will be maintained around current levels due to higher parking needs of restaurants, code requirements, and anchor exclusives. Superior Merchandising Mix i. % of ABR as of 9/30/2017 Centers ii. Per Green Street Advisors. (8/7/17) “Demography Isn’t Destiny,” Property Insights, Page(s) 4. Regency | SUPERIOR TENANT & MERCHANDISING MIX 3–8
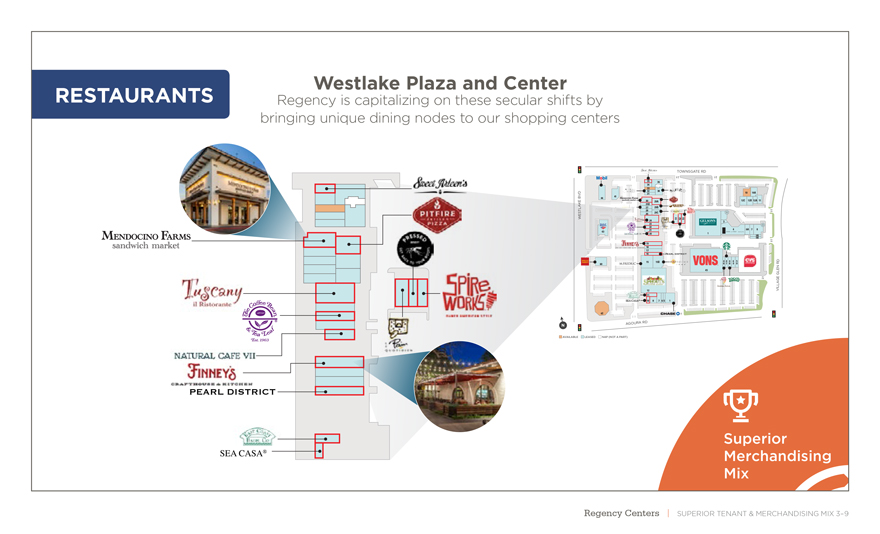
Westlake Plaza and Center RESTAURANTS Regency is capitalizing on these secular shifts by bringing unique dining nodes to our shopping centers TOWNSGATE RD 35 36 34 32 33 38 D V 31 10 10A B 41 44 30 12C 12B 12A 11 E K 29A 29D A 29B L 27 T S 28 29C E 26 W 51 52 53 24 3 23 22 4 6A 7 8 21 43 20 1 9A 9B 19 18 17 16 15 15B 6 4 7 4 4 8 9 4 0 5 R D 60 N 45 L E G G E L A I L 12 V 11 SEA CASA® 10 8 7 6 5 1 42 GOURA RD A AVAILABLE LEASED NAP (NOT A PART) Superior Merchandising Mix Regency Centers | SUPERIOR TENANT & MERCHANDISING MIX 3–9
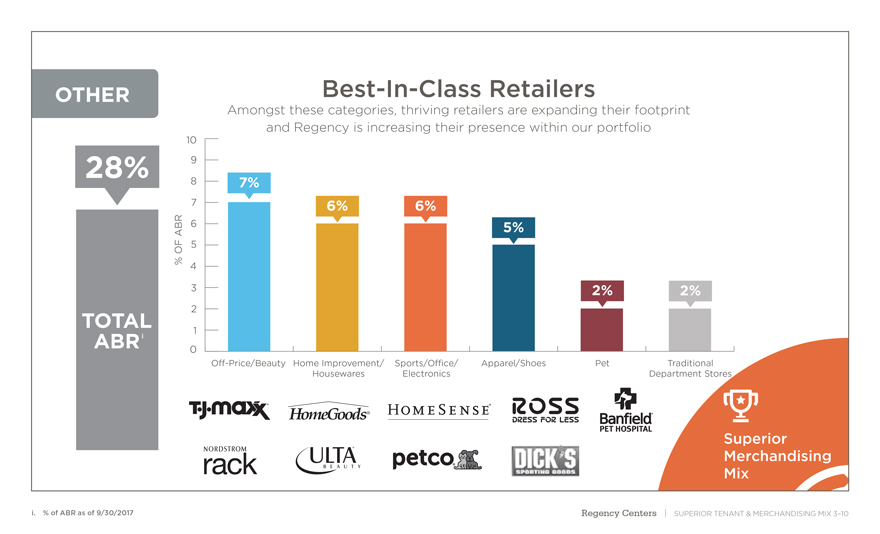
OTHERBest-In-Class Retailers Amongst these categories, thriving retailers are expanding their footprint and Regency is increasing their presence within our portfolio 10 28% 9 8 7% 7 6% 6% ABR 6 5% OF 5 % 4 3 2% 2% TOTAL 2 1 ABRi 0O-Price/Beauty Home Improvement/ Sports/Oce/ Apparel/Shoes Pet Traditional Housewares Electronics Department Stores Superior Merchandising Mix i. % of ABR as of 9/30/2017 Regency Centers | SUPERIOR TENANT & MERCHANDISING MIX 3–10
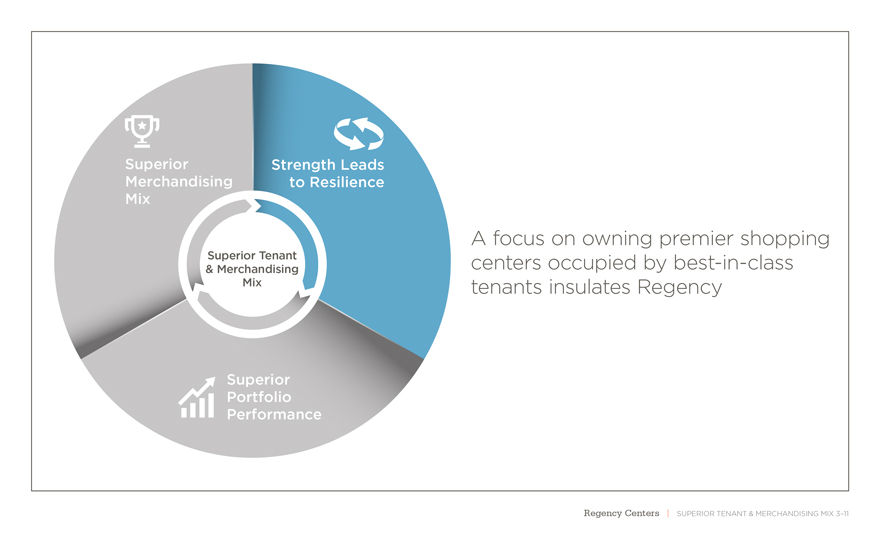
Superior Strength Leads Merchandising to Resilience Mix A focus on owning premier shopping Superior Tenant centers occupied bybest-in-class & Merchandising Mix tenants insulates Regency Superior Portfolio Performance Regency Centers | SUPERIOR TENANT & MERCHANDISING MIX 3–11
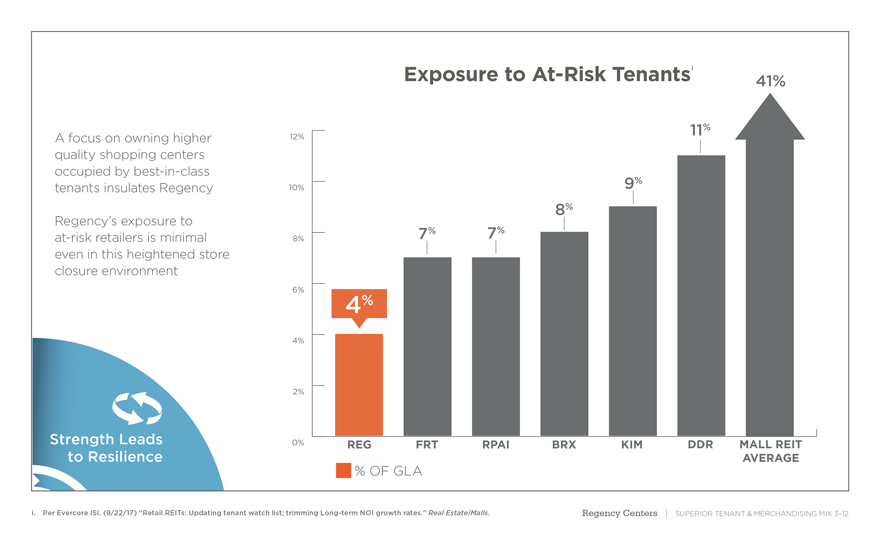
Exposure toAt-Risk Tenantsi 41% 11% A focus on owning higher 12% quality shopping centers occupied bybest-in-class 9% tenants insulates Regency 10% 8% Regency’s exposure to 8% 7% 7%at-risk retailers is minimal even in this heightened store closure environment 6% 4% 4% 2% Strength Leads 0% REG FRT RPAI BRX KIM DDR MALL REIT to Resilience AVERAGE % OF GLA i. Per Evercore ISI. (9/22/17) “Retail REITs: Updating tenant watch list; trimming Long-term NOI growth rates.” Real Estate|Malls. Regency Centers | SUPERIOR TENANT & MERCHANDISING MIX 3–12
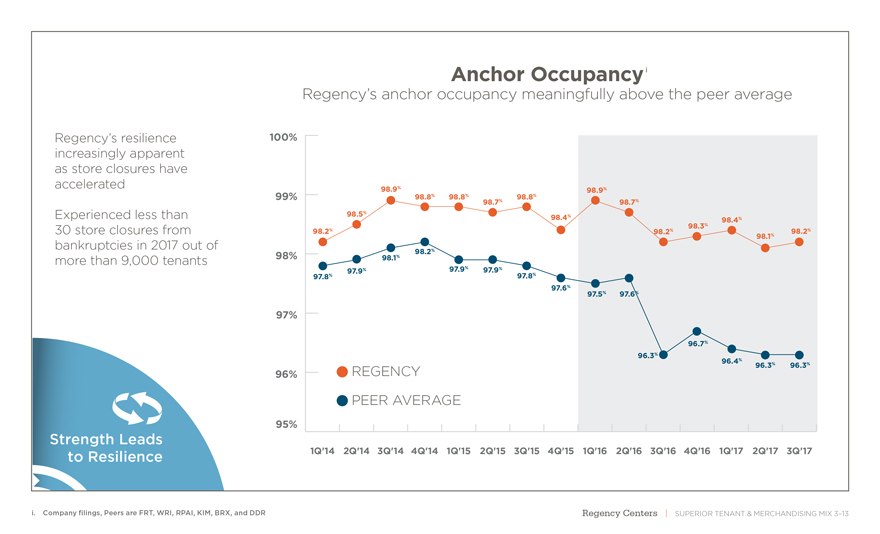
Anchor Occupancyi Regency’s anchor occupancy meaningfully above the peer average Regency’s resilience 100% increasingly apparent as store closures have accelerated 98.9% % % % % 98.9 99% 98.8 98.8 98.8 98.7% 98.7% 98.5% Experienced less than 98.4% 98.4% 98.3% 30 store closures from 98.2% 98.2% 98.2% 98.1% bankruptcies in 2017 out of 98.2% more than 9,000 tenants 98% 98.1% 97.9% 97.9% 97.9% 97.8% 97.8% 97.6% 97.5% 97.6% 97% 96.7% 96.3% 96.4% % % REGENCY 96.3 96.3 96% PEER AVERAGE 95% Strength Leads to Resilience 1Q’14 2Q’14 3Q’14 4Q’14 1Q’15 2Q’15 3Q’15 4Q’15 1Q’16 2Q’16 3Q’16 4Q’16 1Q’17 2Q’17 3Q’17 i. Company filings, Peers are FRT, WRI, RPAI, KIM, BRX, and DDR Regency Centers | SUPERIOR TENANT & MERCHANDISING MIX 3–13
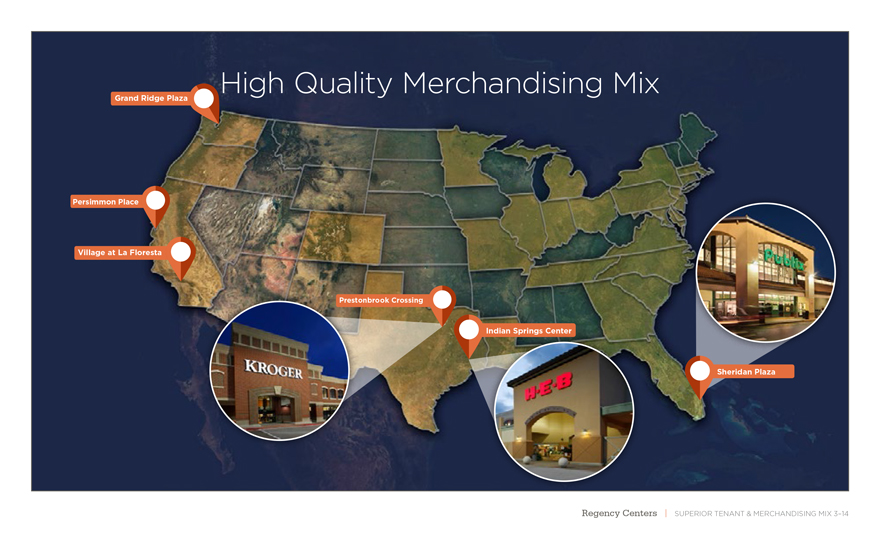
Grand Ridge Plaza High Quality Merchandising Mix Persimmon Place Village at La Floresta Prestonbrook Crossing Indian Springs Center Sheridan Plaza Regency Centers | SUPERIOR TENANT & MERCHANDISING MIX 3–14
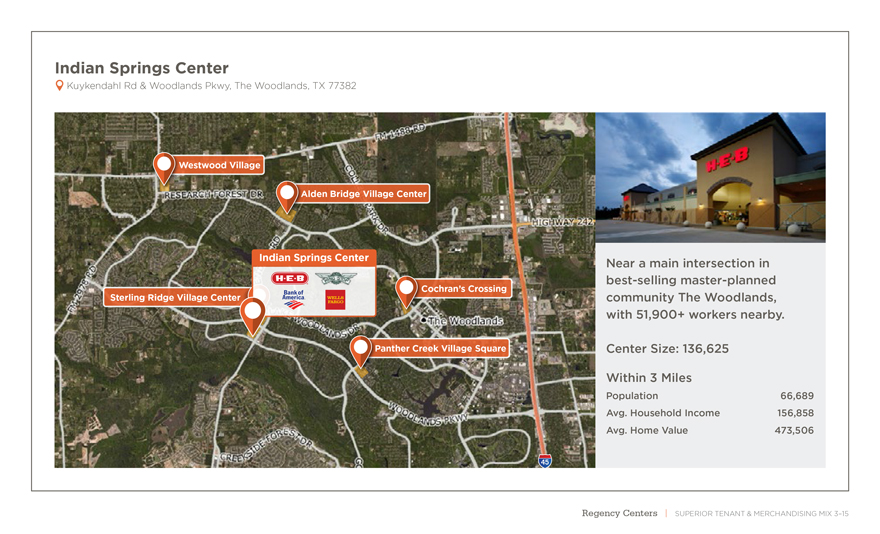
Indian Springs Center Kuykendahl Rd & Woodlands Pkwy, The Woodlands, TX 77382 Westwood Village Alden Bridge Village Center Indian Springs Center Near a main intersection in best-selling master-planned Cochran’s Crossing Sterling Ridge Village Center community The Woodlands, with 51,900+ workers nearby. Panther Creek Village Square Center Size: 136,625 Within 3 Miles Population 66,689 Avg. Household Income 156,858 Avg. Home Value 473,506 45 Regency Centers | SUPERIOR TENANT & MERCHANDISING MIX 3–15
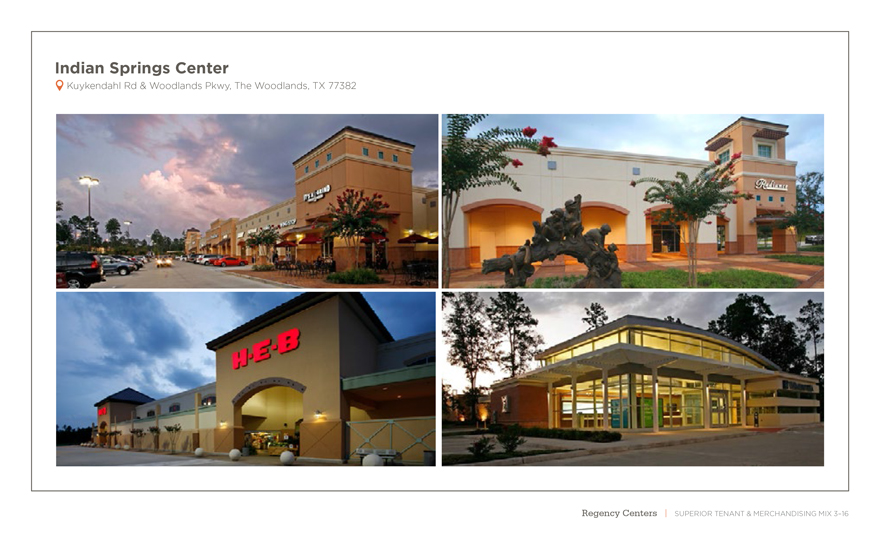
Indian Springs Center Kuykendahl Rd & Woodlands Pkwy, The Woodlands, TX 77382 Regency Centers | SUPERIOR TENANT & MERCHANDISING MIX 3–16
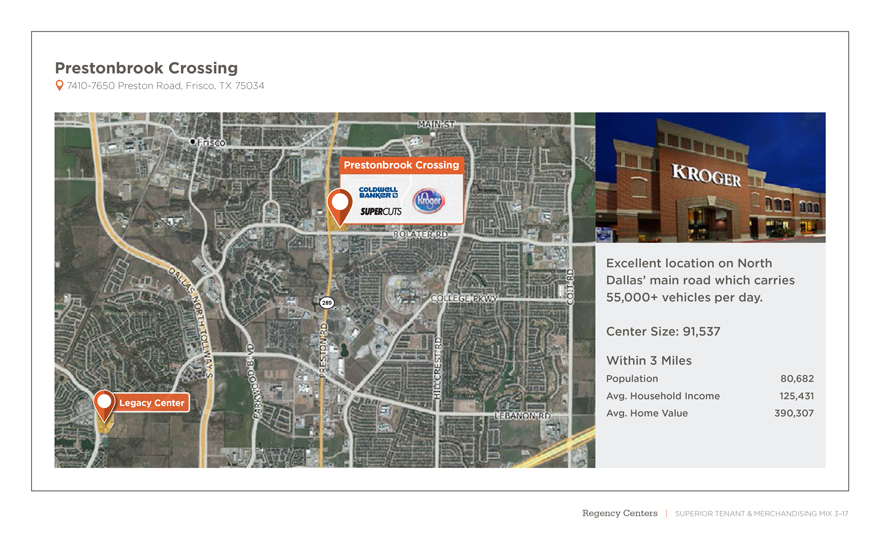
Prestonbrook Crossing 7410-7650 Preston Road, Frisco, TX 75034 Prestonbrook Crossing Excellent location on North Dallas’ main road which carries 55,000+ vehicles per day. 289 Center Size: 91,537 Within 3 Miles Population 80,682 Avg. Household Income 125,431 Legacy Center Avg. Home Value 390,307 Regency Centers | SUPERIOR TENANT & MERCHANDISING MIX 3–17
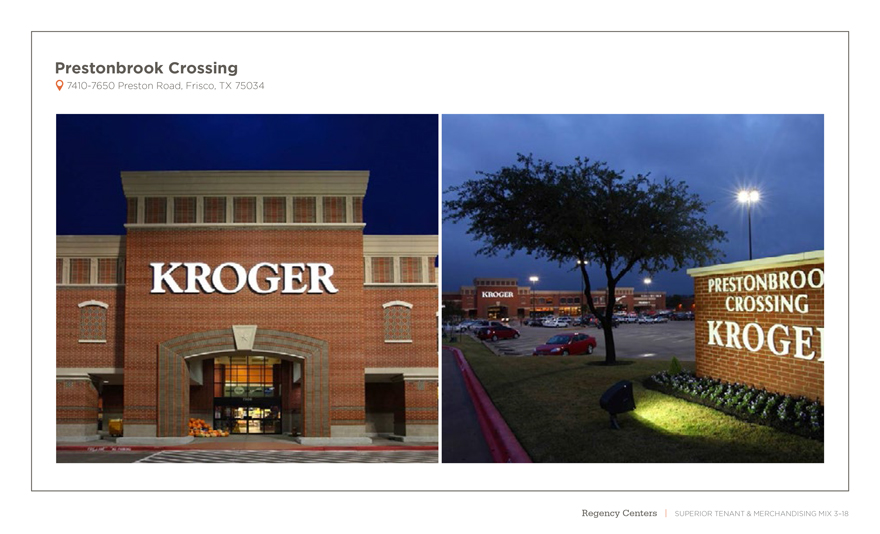
Prestonbrook Crossing 7410-7650 Preston Road, Frisco, TX 75034 Regency Centers | SUPERIOR TENANT & MERCHANDISING MIX 3–18
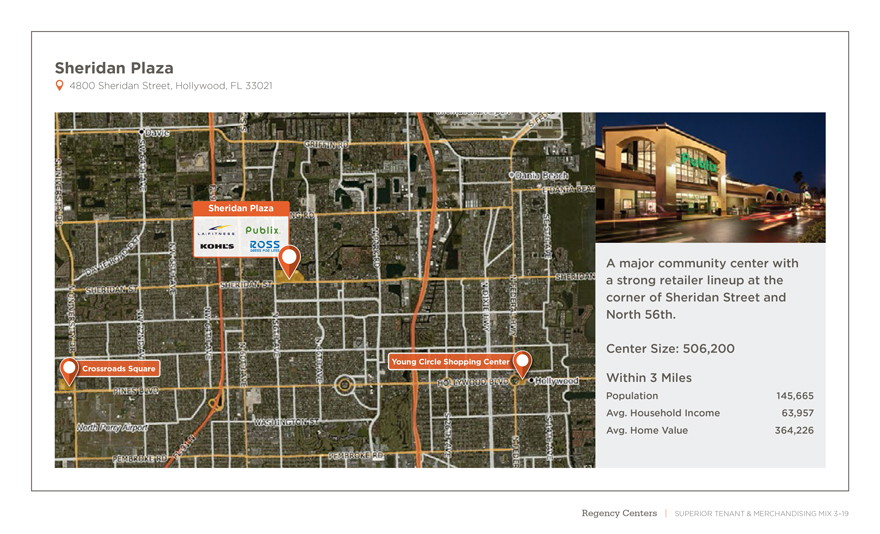
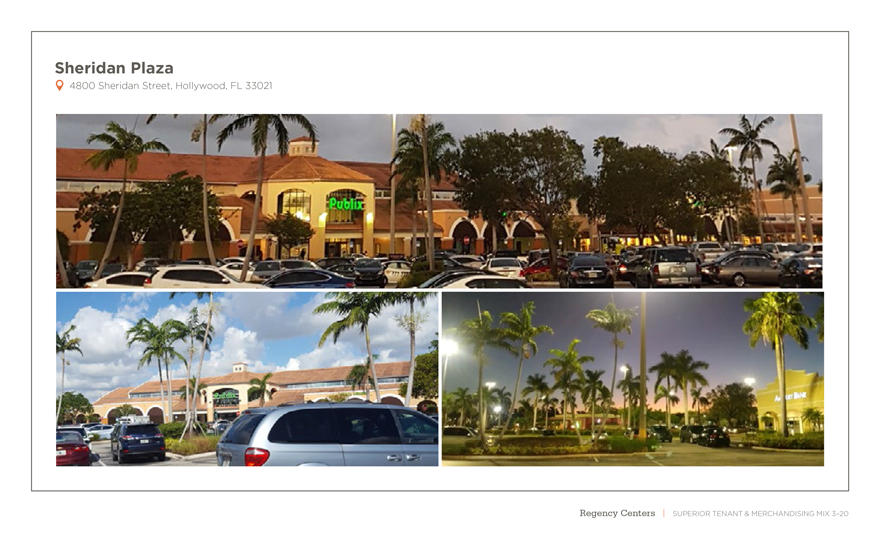
Sheridan Plaza 4800 Sheridan Street, Hollywood, FL 33021 Sheridan Plaza A major community center with a strong retailer lineup at the corner of Sheridan Street and North 56th. Center Size: 506,200 Young Circle Shopping Center Crossroads Square Within 3 Miles Population 145,665 Avg. Household Income 63,957 Avg. Home Value 364,226 Regency Centers | SUPERIOR TENANT & MERCHANDISING MIX 3–19
Sheridan Plaza 4800 Sheridan Street, Hollywood, FL 33021 Regency Centers | SUPERIOR TENANT & MERCHANDISING MIX 3–20
GRAND RIDGE PLAZA Seattle Market Regency Centers | SUPERIOR TENANT & MERCHANDISING MIX 3–21
PERSIMMON PLACE Bay Area Market Regency Centers | SUPERIOR TENANT & MERCHANDISING MIX 3–22

LA floresta V I L L A G E A T Los Angeles Market Regency Centers | SUPERIOR TENANT & MERCHANDISING MIX 3–23
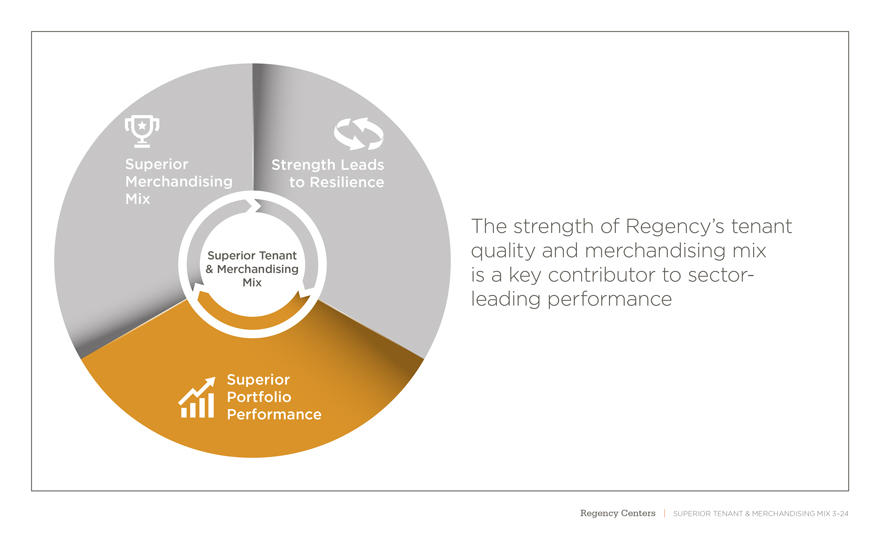
Superior Strength Leads Merchandising to Resilience Mix The strength of Regency’s tenant Superior Tenant quality and merchandising mix & Merchandising is a key contributor to sector- Mix leading performance Superior Portfolio Performance Regency Centers | SUPERIOR TENANT & MERCHANDISING MIX 3–24
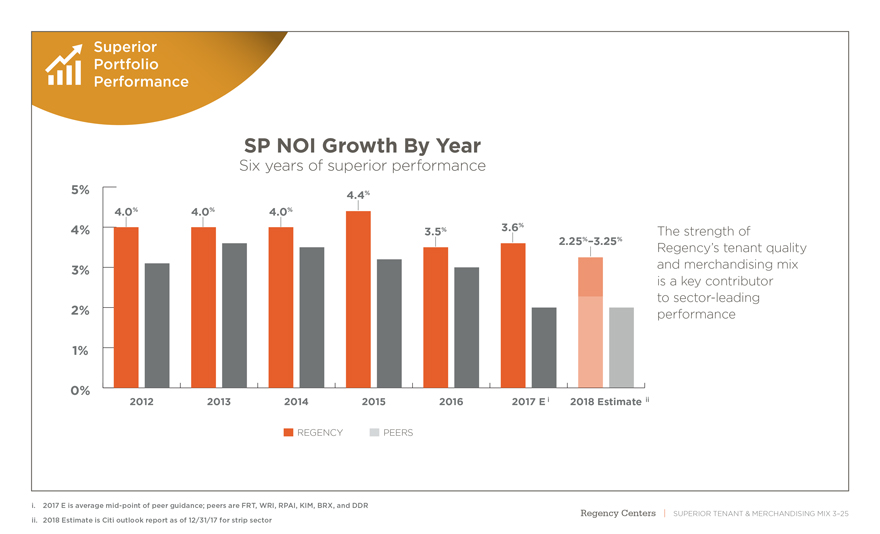
Superior Portfolio Performance SP NOI Growth By Year Six years of superior performance 5% 4.4% 4.0% 4.0% 4.0% 3.6% 4% 3.5% The strength of 2.25%–3.25% Regency’s tenant quality 3% and merchandising mix is a key contributor 2% to sector-leading performance 1% 0% 2012 2013 2014 2015 2016 2017 E i 2018 Estimate ii REGENCY PEERS i. 2017 E is averagemid-point of peer guidance; peers are FRT, WRI, RPAI, KIM, BRX, and DDR Centers ii. 2018 Estimate is Citi outlook report as of 12/31/17 for strip sector Regency | SUPERIOR TENANT & MERCHANDISING MIX 3–25

Strong Values & Special Culture Preeminent National Portfolio Exceptional Operating Expertise & Systems UNEQUALED Superior Tenant & Merchandising Mix Disciplined Financial Proven Development & Management Redevelopment Capabilities Regency Centers The Combination of These Key Strategic Advantages Makes Regency UNEQUALED
Exceptional Operating Expertise & Systems Regency Centers | EXCEPTIONAL OPERATING EXPERTISE & SYSTEMS 4–1
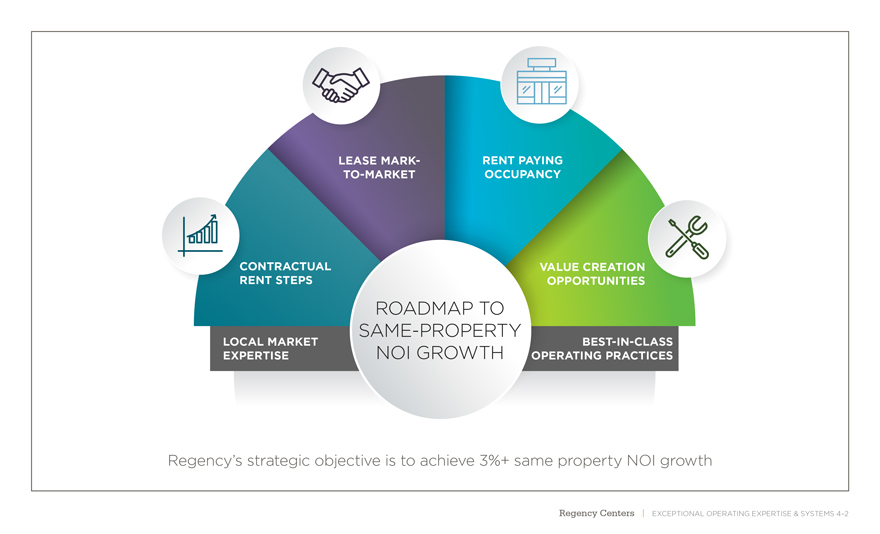
LEASE MARK- RENT PAYINGTO-MARKET OCCUPANCY CONTRACTUAL VALUE CREATION RENT STEPS OPPORTUNITIES ROADMAP TO SAME-PROPERTY LOCAL MARKETBEST-IN-CLASS EXPERTISE NOI GROWTH OPERATING PRACTICES Regency’s strategic objective is to achieve 3%+ same property NOI growth Regency Centers | EXCEPTIONAL OPERATING EXPERTISE & SYSTEMS 4–2
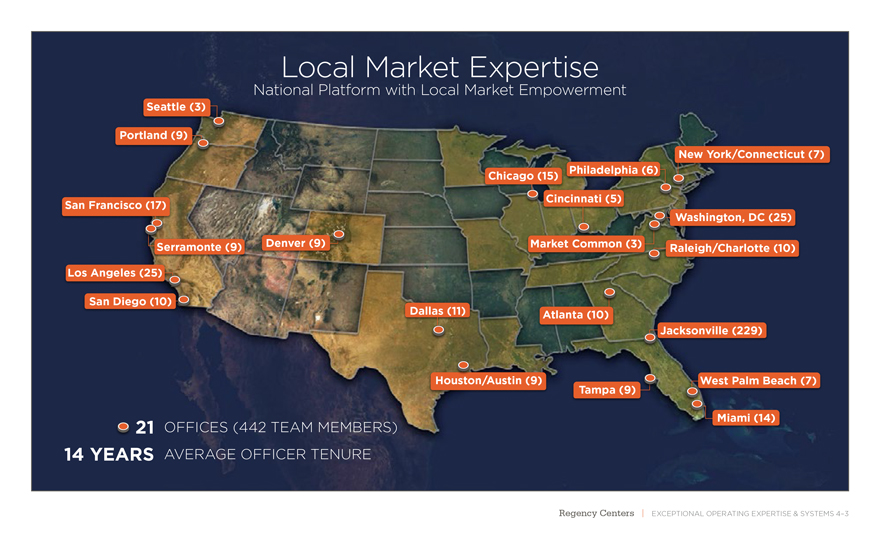
Local Market Expertise National Platform with Local Market Empowerment Seattle (3) Portland (9) New York/Connecticut (7) Philadelphia (6) Chicago (15) Cincinnati (5) San Francisco (17) Washington, DC (25) Serramonte (9) Denver (9) Market Common (3) Raleigh/Charlotte (10) Los Angeles (25) San Diego (10) Dallas (11) Atlanta (10) Jacksonville (229) Houston/Austin (9) West Palm Beach (7) Tampa (9) Miami (14) 21 OFFICES (442 TEAM MEMBERS) 14 YEARS AVERAGE OFFICER TENURE Regency Centers | EXCEPTIONAL OPERATING EXPERTISE & SYSTEMS 4–3
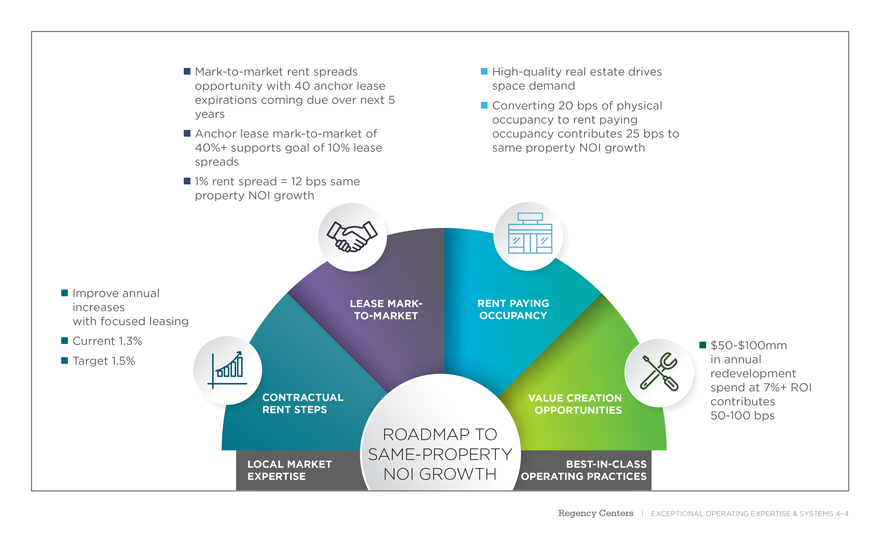
Mark-to-market rent spreads opportunity with 40 anchor lease expirations coming due over next 5 years Anchor leasemark-to-market of 40%+ supports goal of 10% lease spreads 1% rent spread = 12 bps same property NOI growth
High-quality real estate drives space demand Converting 20 bps of physical occupancy to rent paying occupancy contributes 25 bps to same property NOI growth
Improve annual increases with focused leasing Current 1.3% Target 1.5%
CONTRACTUAL RENT STEPS LOCAL MARKET EXPERTISE
LEASEMARK-TO-MARKET RENT PAYING OCCUPANCY
ROADMAP TO SAME-PROPERTY NOI GROWTH
VALUE CREATION OPPORTUNITIESBEST-IN-CLASS OPERATING PRACTICES
$50-$100mm in annual redevelopment spend at 7%+ ROI contributes50-100 bps
Regency Centers | EXCEPTIONAL OPERATING EXPERTISE & SYSTEMS 4–4
81
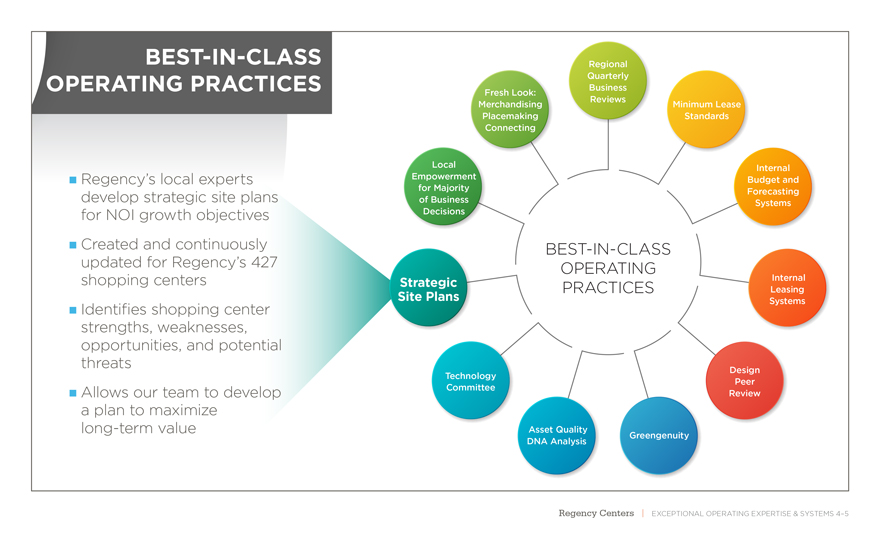
BEST-IN-CLASS OPERATING PRACTICES
Regency’s local experts develop strategic site plans for NOI growth objectives Created and continuously updated for Regency’s 427 shopping centers Identifies shopping center strengths, weaknesses, opportunities, and potential threats Allows our team to develop a plan to maximize long-term value Regional Quarterly Business Fresh Look: Reviews Merchandising Minimum Lease Placemaking Standards Connecting Local Internal Empowerment Budget and for Majority Forecasting of Business Systems Decisions
BEST-IN-CLASS OPERATING Strategic Internal PRACTICES Leasing Site Plans Systems
Design Technology Peer Committee Review Asset Quality Greengenuity DNA Analysis
Regency Centers | EXCEPTIONAL OPERATING EXPERTISE & SYSTEMS 4–5
82
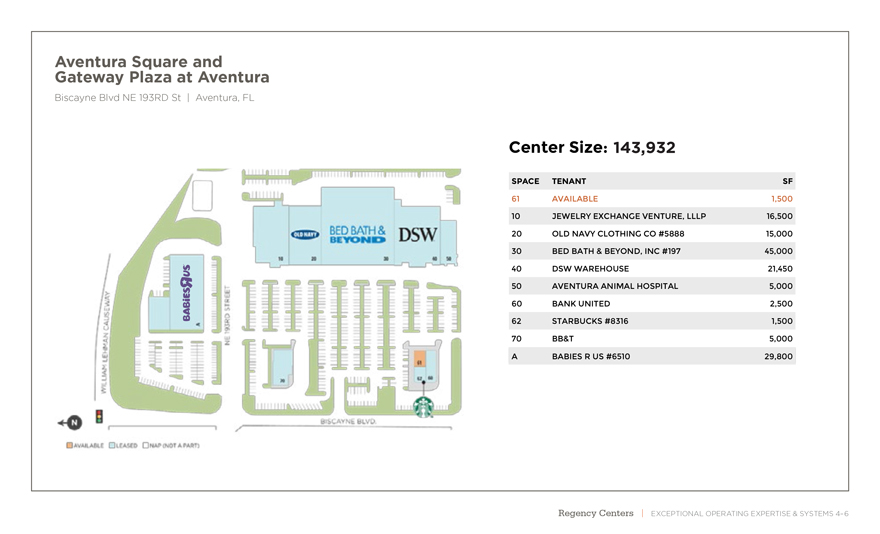
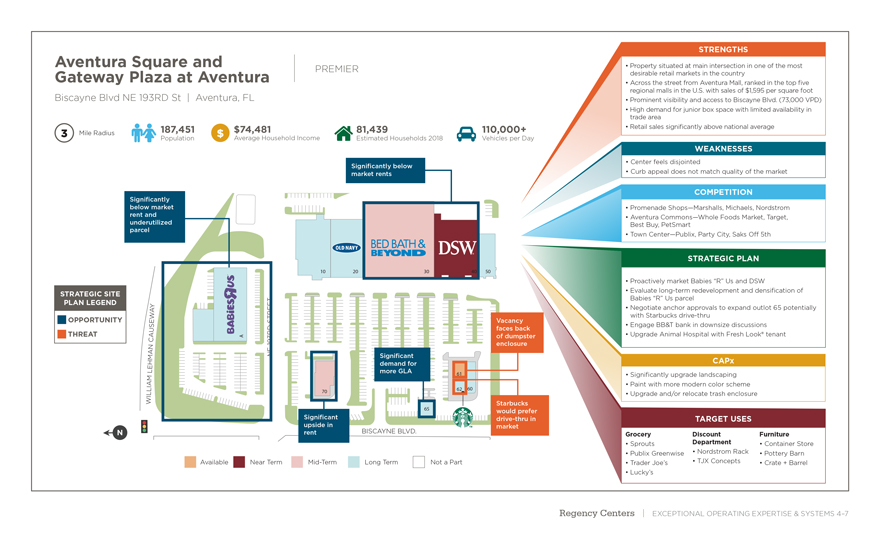
Aventura Square and Gateway Plaza at Aventura Biscayne Blvd NE 193RD St | Aventura, FL
Center Size: 143,932
SPACE TENANT SF
61 AVAILABLE 1,500
10 JEWELRY EXCHANGE VENTURE, LLLP 16,500
20 OLD NAVY CLOTHING CO #5888 15,000
30 BED BATH & BEYOND, INC #197 45,000
40 DSW WAREHOUSE 21,450
50 AVENTURA ANIMAL HOSPITAL 5,000
60 BANK UNITED 2,500
62 STARBUCKS #8316 1,500
70 BB&T 5,000
Regency Centers | EXCEPTIONAL OPERATING EXPERTISE & SYSTEMS 4–6
83
Aventura Square and Gateway Plaza at Aventura
Biscayne Blvd NE 193RD St | Aventura, FL
PREMIER Mile Radius 187,451$74,48181,439110,000+ Population $Average Household IncomeEstimated Households 2018Vehicles per Day Signifi cantly below market rents Signifi cantly below market rent and underutilized parcel 10 20 30 40 50 STRATEGIC SITE PLAN LEGEND Y A OPPORTUNITY W E STREET Vacancy U S faces back THREAT A A of dumpster C 193RD enclosure N M A NE Signifi cant E H demand for L more GLA 61 A M L I 62 60 70 I L W Starbucks 65 would prefer Signifi cant drive-thru in upside in BISCAYNE BLVD. market rent Available Near TermMid-Term Long Term Not a Part STRENGTHS Property situated at main intersection in one of the most desirable retail markets in the country Across the street from Aventura Mall, ranked in the top five regional malls in the U.S. with sales of $1,595 per square foot Prominent visibility and access to Biscayne Blvd. (73,000 VPD) High demand for junior box space with limited availability in trade area Retail sales significantly above national average WEAKNESSES Center feels disjointed Curb appeal does not match quality of the market
COMPETITION Promenade Shops—Marshalls, Michaels, Nordstrom Aventura Commons—Whole Foods Market, Target,
Best Buy, PetSmart Town Center—Publix, Party City, Saks O– 5th STRATEGIC PLAN Proactively market Babies “R” Us and DSW Evaluate long-term redevelopment and densification of Babies “R” Us parcel Negotiate anchor approvals to expand outlot 65 potentially with Starbucks drive-thru Engage BB&T bank in downsize discussions Upgrade Animal Hospital with Fresh Look® tenant CAPxSignificantly upgrade landscaping Paint with more modern color schemeUpgrade and/or relocate trash enclosure
TARGET USES Grocery Discount Furniture Sprouts Department Container Store Publix Greenwise Nordstrom Rack Pottery Barn Trader Joe’s TJX Concepts Crate + Barrel Lucky’s Regency Centers | EXCEPTIONAL OPERATING EXPERTISE & SYSTEMS 4–7 84
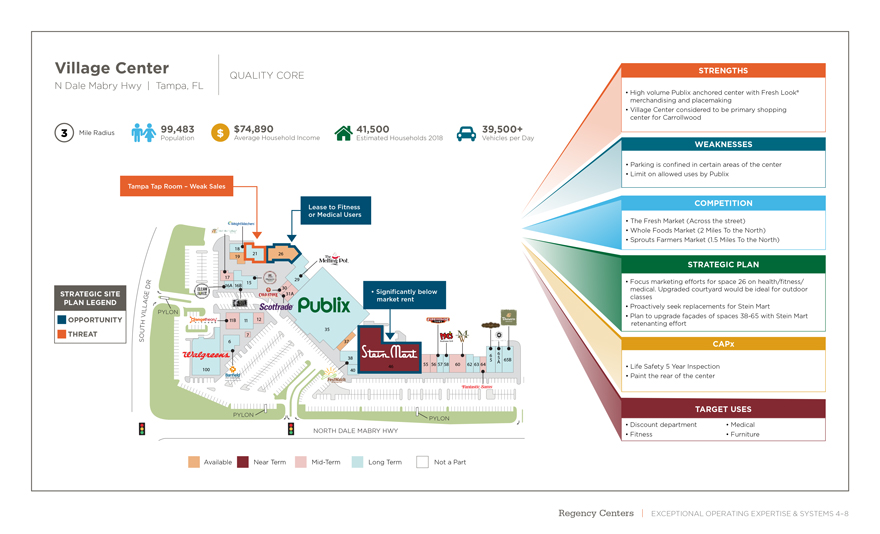
Village Center
QUALITY CORE N Dale Mabry Hwy | Tampa, FL Mile Radius 99,483 $ $74,890 41,500 39,500+ Population Average Household Income Estimated Households 2018 Vehicles per Day Tampa Tap Room – Weak Sales Lease to Fitness or Medical Users 18 21 26 19 17 29 R 15 D 16A 16B 30 STRATEGIC SITE E 31A Signifi cantly below A G market rent PLAN LEGEND
L L V I PYLON OPPORTUNITY H 11B 11 12 U T 35 THREAT O 7 S 6 37 38 6 5 6 55 56 57 58 60 62 63 64 5 A 65B 46 100 40
PYLON PYLON NORTH DALE MABRY HWY Available Near TermMid-Term Long Term Not a Part STRENGTHS High volume Publix anchored center with Fresh Look® merchandising and placemaking Village Center considered to be primary shopping center for Carrollwood WEAKNESSES Parking is confi ned in certain areas of the center Limit on allowed uses by Publix
COMPETITION The Fresh Market (Across the street) Whole Foods Market (2 Miles To the North) Sprouts Farmers Market (1.5 Miles To the North) STRATEGIC PLAN Focus marketing e orts for space 26 on health/fi tness/ medical. Upgraded courtyard would be ideal for outdoor classes Proactively seek replacements for Stein Mart Plan to upgrade façades of spaces38-65 with Stein Mart retenanting e ort CAPx Life Safety 5 Year Inspection Paint the rear of the center TARGET USES
Discount department Medical Fitness Furniture Regency Centers | EXCEPTIONAL OPERATING EXPERTISE & SYSTEMS 4–8 85

Regency Centers | EXCEPTIONAL OPERATING EXPERTISE & SYSTEMS 4–9
ROSCOE SQUARE
CHICAGO MARKET
86
EL CAMINO
SHOPPING CENTER
LOS ANGELESS MARKET
Regency Centers | EXCEPTIONAL OPERATING EXPERTISE & SYSTEMS 4–10
87
UNEQUALED
Preeminent National Portfolio Superior Tenant & Merchandising Mix Exceptional Operating
Expertise & Systems Proven Development & Redevelopment Capabilities
The Combination of These Key Strategic Advantages Makes Regency UNEQUALED
Disciplined Financial Management Strong Values & Special Culture 88
Regency Centers | PROVEN DEVELOPMENT & REDEVELOPMENT CAPABILITIES 5–1
Proven Development
& Redevelopment
Capabilities
DISCIPLINED
STRATEGY
NEW
OPPORTUNITIES
89
Regency Centers | PROVEN DEVELOPMENT & REDEVELOPMENT CAPABILITIES 5–2
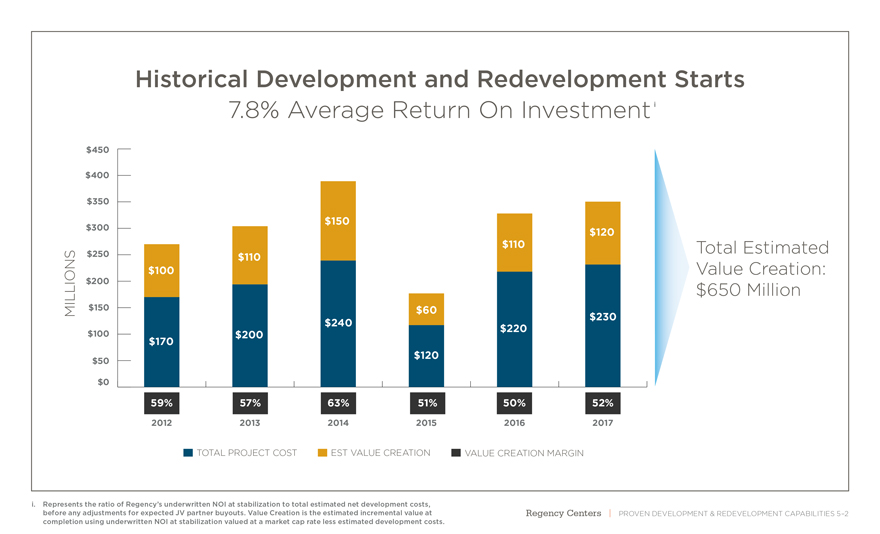
$0 $50 $100 $150 $200 $250 $300 $350 $400 $450 2012 2013 2014 2015 2016 2017
$170 $100 $110 $150 $60 $110 $120 $200 $240 $120 $220 $230 59% 57% 63% 51% 50% 52%
Historical Development and Redevelopment Starts 7.8% Average Return On Investment
TOTAL PROJECT COST EST VALUE CREATION VALUE CREATION MARGIN
MILLIONS Total Estimated Value Creation: $650 Million
i. Represents the ratio of Regency’s underwritten NOI at stabilization to total estimated net development costs,
before any adjustments for expected JV partner buyouts. Value Creation is the estimated incremental value at
completion using underwritten NOI at stabilization valued at a market cap rate less estimated development costs.
I 90
Regency Centers | PROVEN DEVELOPMENT & REDEVELOPMENT CAPABILITIES 5–3
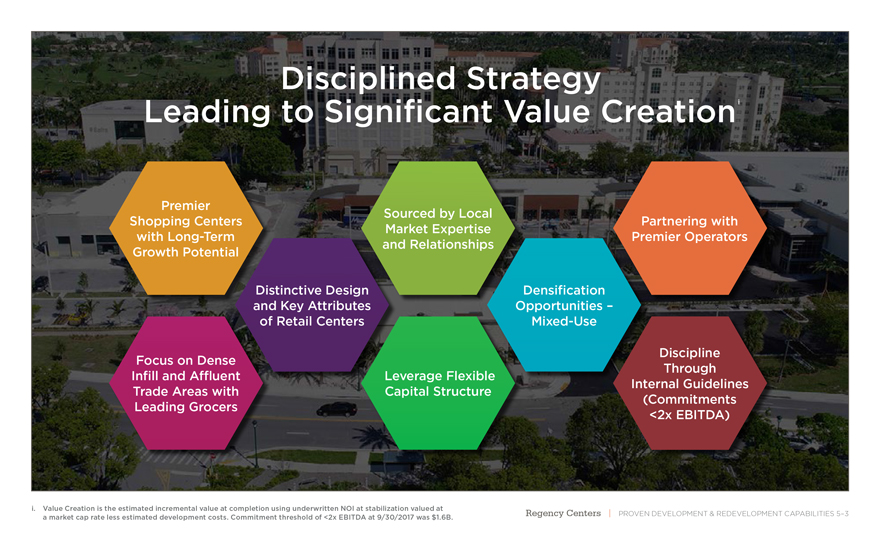
Premier Shopping Centers with Long-Term Growth Potential Focus on Dense Infill and Affluent Trade Areas with Leading Grocers Distinctive Design and Key Attributes of Retail Centers Sourced by Local Market Expertise and Relationships Densification Opportunities –Mixed-Use Partnering with Premier Operators Discipline Through Internal Guidelines (Commitments <2x EBITDA) Disciplined Strategy Leading to Significant Value Creation Leverage Flexible Capital Structure i. Value Creation is the estimated incremental value at completion using underwritten NOI at stabilization valued at
a market cap rate less estimated development costs. Commitment threshold of <2x EBITDA at 9/30/2017 was $1.6B.
i 91
Regency Centers | PROVEN DEVELOPMENT & REDEVELOPMENT CAPABILITIES 5–4
CHIMNEY ROCK NEW YORK/NEW JERSEY MARKET 92
Regency Centers | PROVEN DEVELOPMENT & REDEVELOPMENT CAPABILITIES 5–5
AVENTURA SHOPPING CENTER MIAMI MARKET 93
Regency Centers | PROVEN DEVELOPMENT & REDEVELOPMENT CAPABILITIES 5–6
THE FIELD AT COMMON WEALTH WASHINGTON DC MARKET 94

Regency Centers | PROVEN DEVELOPMENT & REDEVELOPMENT CAPABILITIES 5–7
Proven Development
& Redevelopment
Capabilities
DISCIPLINED
STRATEGY
NEW
OPPORTUNITIES
95
Regency Centers | PROVEN DEVELOPMENT & REDEVELOPMENT CAPABILITIES 5–8
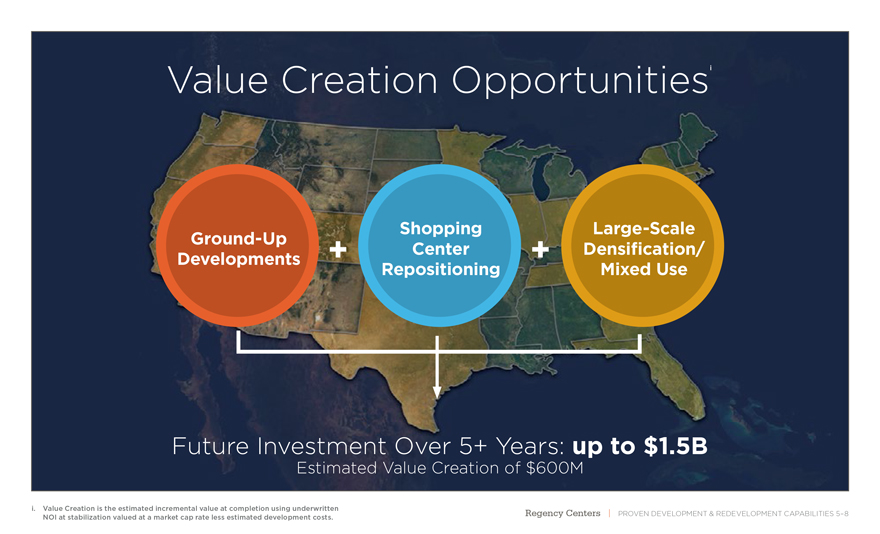
Value Creation Opportunities Future Investment Over 5+ Years: up to $1.5B Estimated Value Creation of $600MGround-Up + + Developments Shopping Center Repositioning Large-Scale Densification/ Mixed Use i. Value Creation is the estimated incremental value at completion using underwritten NOI at stabilization valued at a market cap rate less estimated development costs. I 96
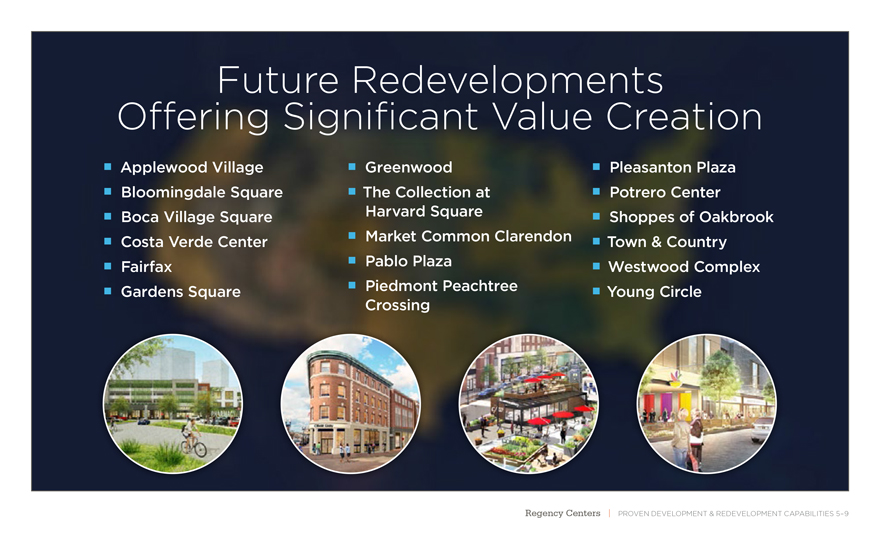
Future Redevelopments
Offering Significant Value Creation
Applewood Village GreenwoodPleasanton Plaza
Bloomingdale Square The Collection atPotrero Center
Boca Village Square Harvard SquareShoppes of Oakbrook
Costa Verde Center Market Common ClarendonTown & Country
Fairfax Pablo PlazaWestwood Complex
Gardens Square Piedmont PeachtreeYoung Circle
Crossing
Regency Centers | PROVEN DEVELOPMENT & REDEVELOPMENT CAPABILITIES 5–9
97
Regency Centers | PROVEN DEVELOPMENT & REDEVELOPMENT CAPABILITIES 5–10
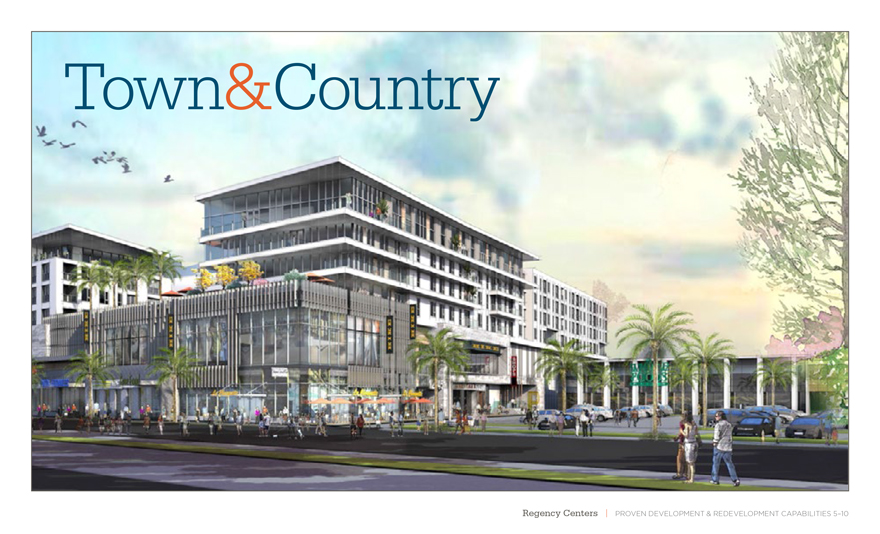
Town&Country 98
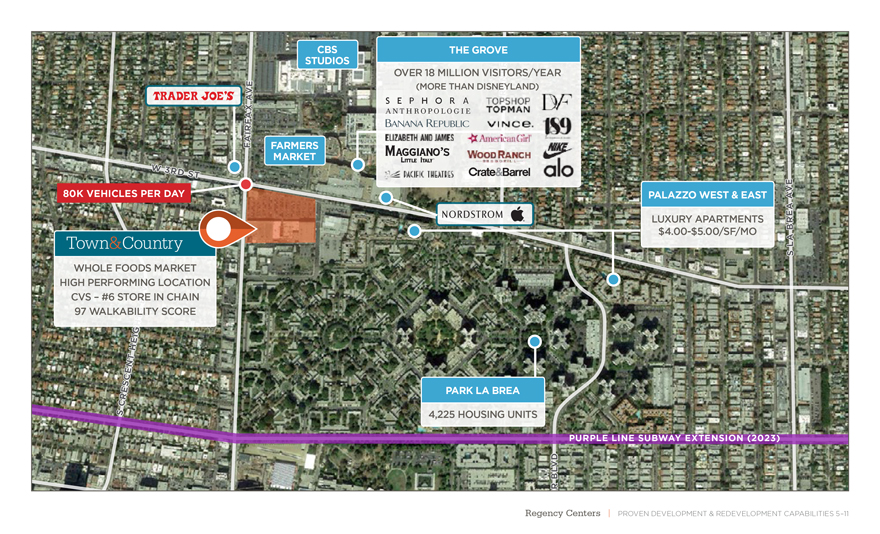
Regency Centers | PROVEN DEVELOPMENT & REDEVELOPMENT CAPABILITIES 5–11 PURPLE LINE SUBWAY EXTENSION (2023) W 3RD ST S CRESCENT HEIGHTS BLVD GARDNER ST HAUSER BLVD S LA BREA AVE FAIRFAX AVE WHOLE FOODS MARKET HIGH PERFORMING LOCATION CVS – #6 STORE IN CHAIN 97 WALKABILITY SCORE LUXURY APARTMENTS$4.00-$5.00/SF/MO 80K VEHICLES PER DAY PALAZZO WEST & EAST CBS STUDIOS FARMERS MARKET Town&Country 4,225 HOUSING UNITS PARK LA BREA OVER 18 MILLION VISITORS/YEAR (MORE THAN DISNEYLAND) THE GROVE 99
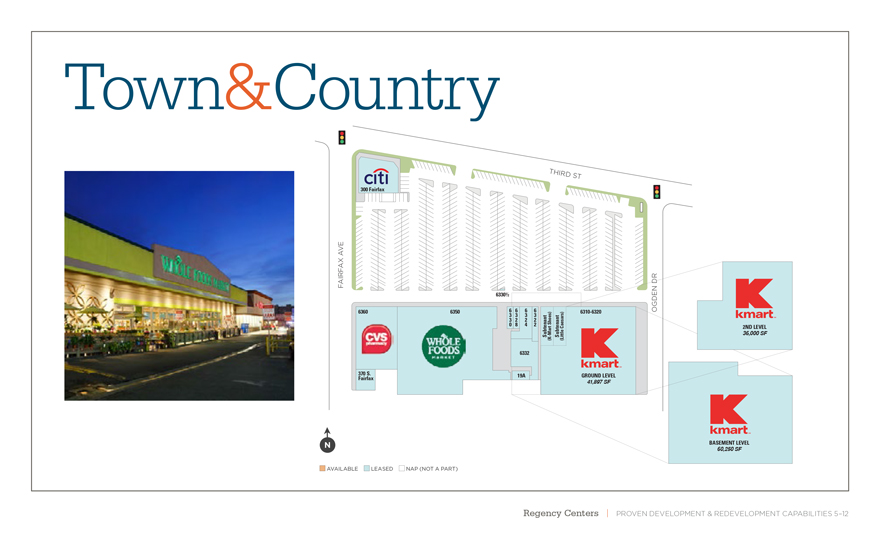
Regency Centers | PROVEN DEVELOPMENT & REDEVELOPMENT CAPABILITIES 5–12 AVAILABLE LEASED NAP (NOT A PART) THIRD ST OGDEN DR FAIRFAX AVE 6360 6310-6320 370 S. Fairfax 6350 300 Fairfax 6332 19A 6330 6328 6324 6322 Subtenant(K-Mart Shoes) Subtenant (Little Caesars) 6330 1⁄2 2ND LEVEL 36,000 SF GROUND LEVEL 41,897 SF BASEMENT LEVEL 60,250 SF Town&Country 100
Regency Centers | PROVEN DEVELOPMENT & REDEVELOPMENT CAPABILITIES 5–13
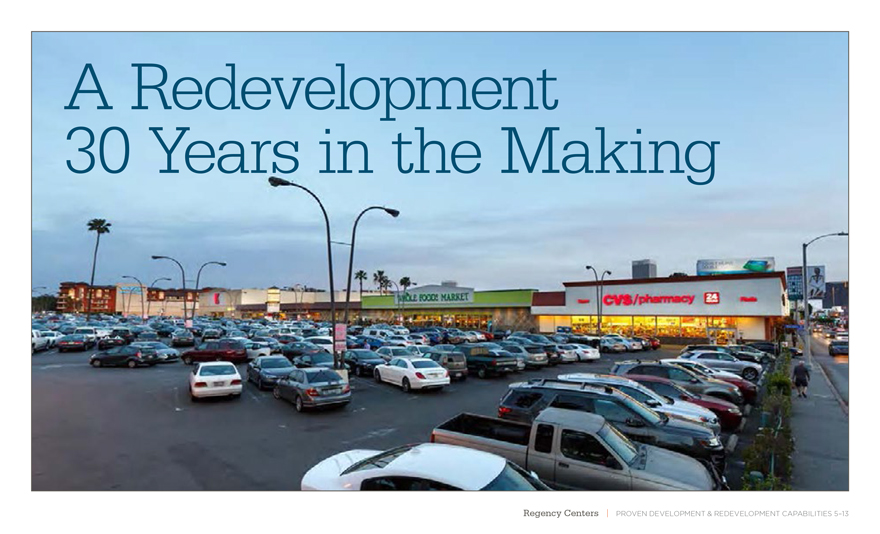
A Redevelopment
30 Years in the Making
101

Regency Centers | PROVEN DEVELOPMENT & REDEVELOPMENT CAPABILITIES 5–14
Retail-Only Scenario
102
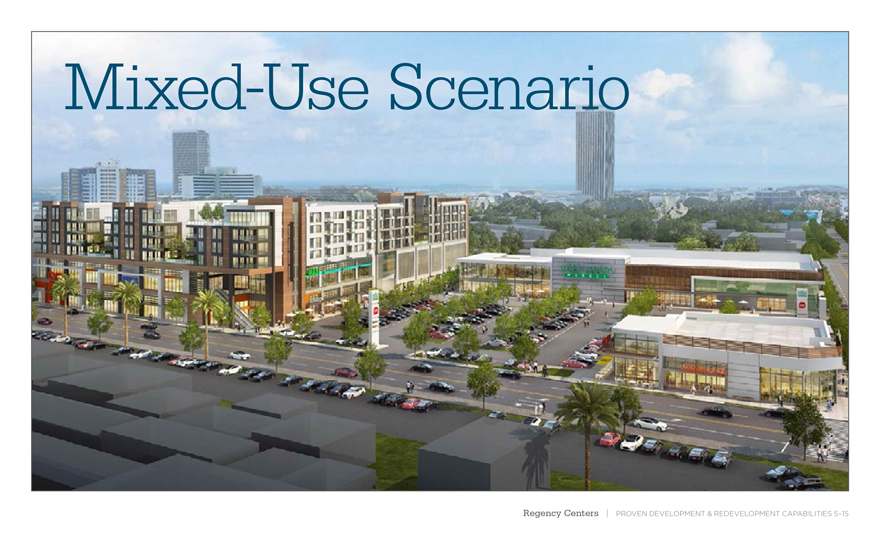
Regency Centers | PROVEN DEVELOPMENT & REDEVELOPMENT CAPABILITIES 5–15
Mixed-Use Scenario
103

UNEQUALED Preeminent National Portfolio Superior Tenant & Merchandising Mix Exceptional Operating Expertise & Systems Proven Development & Redevelopment Capabilities The Combination of These Key Strategic Advantages Makes Regency UNEQUALED Disciplined Financial Management Strong Values & Special Culture 104

Regency Centers | DISCIPLINED FINANCIAL MANAGEMENT 6–1 Disciplined Financial Management FORTRESS BALANCE SHEET FUNDING STRATEGY SUSTAINED EARNINGS GROWTH 105

Regency Centers | DISCIPLINED FINANCIAL MANAGEMENT 6–2 5.4x 0x 1x 2x 3x 4x 5x 6x 7x REG RPAI WRI FRT DDR BRX KIM 5.4x 5.6x 5.8x 6.5x 6.9x 6.9x Net Debt To EBITDA Sector-leading balance sheet provides flexibility to be opportunistic Target: 5x S&P Rating: BBB+ Moody’s Rating: Baa1 i. Source: Green Street Advisors i
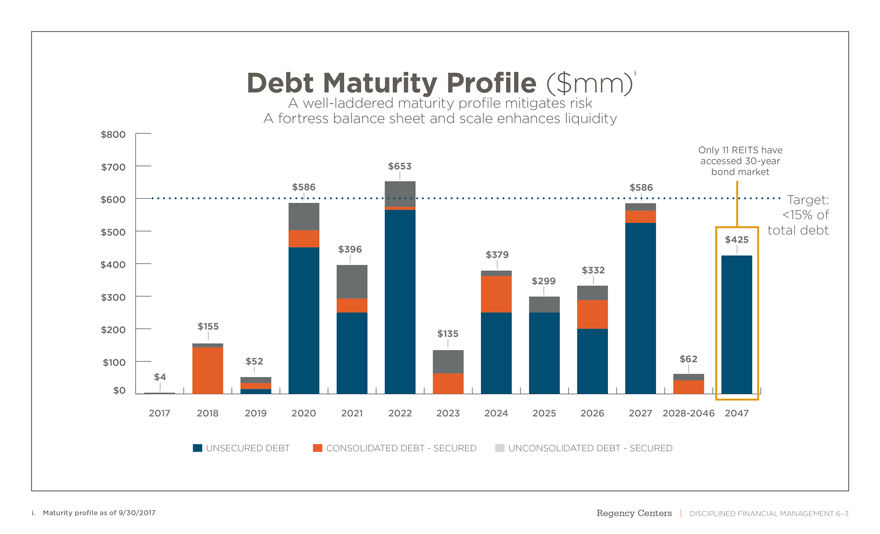
106 Regency Centers | DISCIPLINED FINANCIAL MANAGEMENT 6–3 $4 $155 $52 $62 $586 $396 $653 $135 $379 $299 $332 $586 $425 $0 $100 $200 $300 $400 $500 $600 $700 $800 2017 2018 2019 2020 2021 2022 2023 2024 2025 2026 2027 2028-2046 2047 UNSECURED DEBT CONSOLIDATED DEBT—SECURED UNCONSOLIDATED DEBT—SECURED Target: <15% of total debt Only 11 REITS have accessed30-year bond market Debt Maturity Profile ($mm) A well-laddered maturity profile mitigates risk A fortress balance sheet and scale enhances liquidity i. Maturity profile as of 9/30/2017 i 107
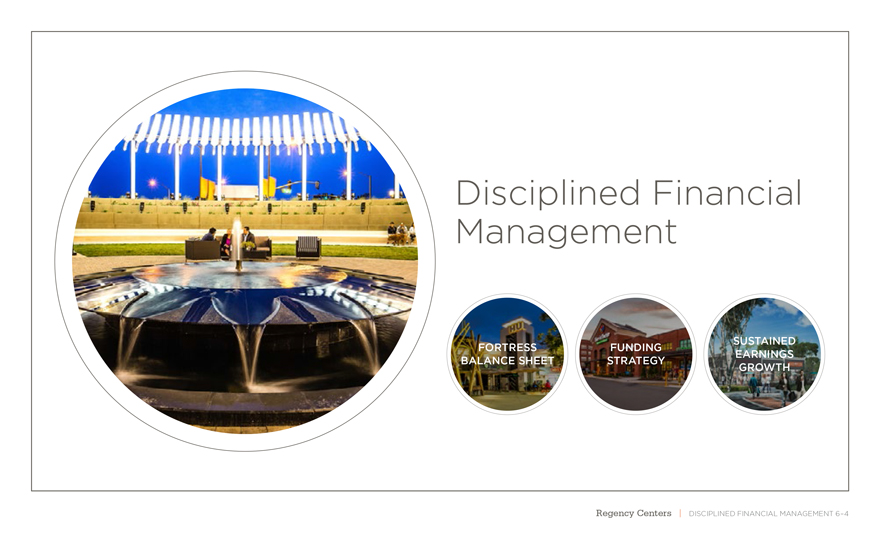
Regency Centers | DISCIPLINED FINANCIAL MANAGEMENT 6–4 Disciplined Financial Management FORTRESS BALANCE SHEET FUNDING STRATEGY SUSTAINED EARNINGS GROWTH 108
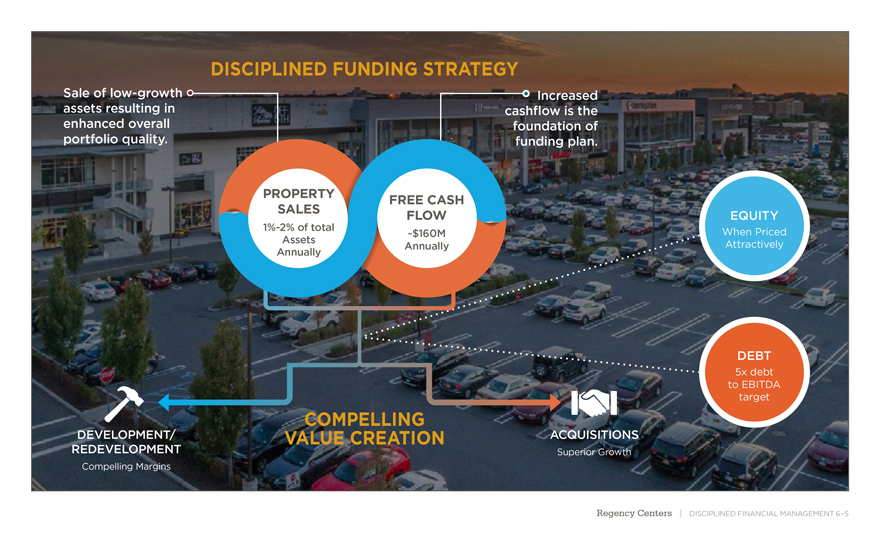
Regency Centers | DISCIPLINED FINANCIAL MANAGEMENT 6–5 Increased cashflow is the foundation of funding plan. Sale oflow-growth assets resulting in enhanced overall portfolio quality. DISCIPLINED FUNDING STRATEGY PROPERTY SALES1%-2% of total Assets Annually FREE CASH FLOW ~$160M Annually DEVELOPMENT/ REDEVELOPMENT Compelling Margins ACQUISITIONS Superior Growth COMPELLING VALUE CREATION EQUITY When Priced Attractively DEBT 5x debt to EBITDA target 109

Regency Centers | DISCIPLINED FINANCIAL MANAGEMENT 6–6 Disciplined Financial Management FORTRESS BALANCE SHEET FUNDING STRATEGY SUSTAINED EARNINGS GROWTH 110

UNEQUALED Preeminent National Portfolio Superior Tenant & Merchandising Mix Exceptional Operating Expertise & Systems Proven Development & Redevelopment Capabilities The Combination of These Key Strategic Advantages Makes Regency UNEQUALED Disciplined Financial Management Strong Values & Special Culture 111
Regency Centers | STRONG VALUES & SPECIAL CULTURE 7–1 Strong Values & Special Culture SPECIAL VALUES CULTURE 112
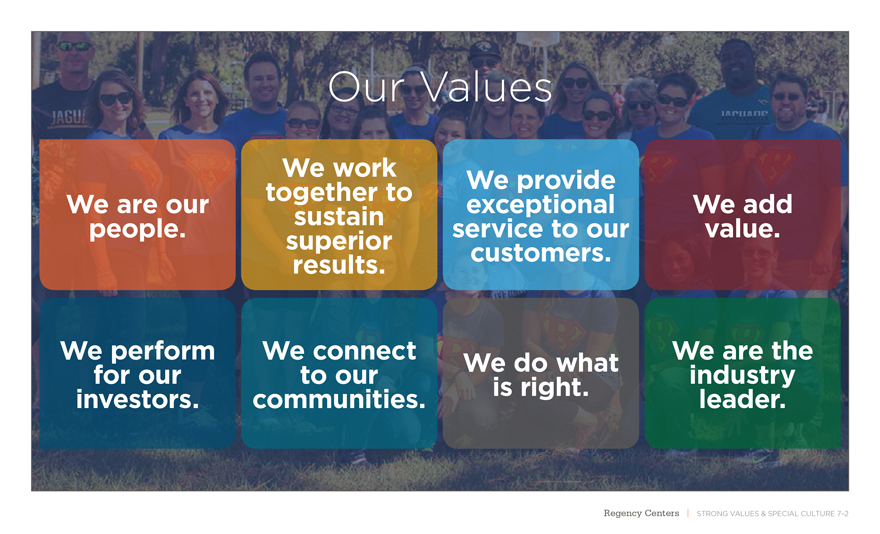
Regency Centers | STRONG VALUES & SPECIAL CULTURE 7–2 We are our people. We perform for our investors. We provide exceptional service to our customers. We do what is right. We work together to sustain superior results. We add value. We are the industry leader. We connect to our communities. Our Values 113
Regency Centers | STRONG VALUES & SPECIAL CULTURE 7–3 INDUSTRY LEADERSHIP Strong Values & Special Culture SPECIAL CULTURE 114

Regency Centers | STRONG VALUES & SPECIAL CULTURE 7–4 115

UNEQUALED Preeminent National Portfolio Superior Tenant & Merchandising Mix Exceptional Operating Expertise & Systems Proven Development & Redevelopment Capabilities The Combination of These Key Strategic Advantages Makes Regency UNEQUALED Disciplined Financial Management Strong Values & Special Culture 116
Regency Centers | GUIDANCE 8–1 Forward-Looking Statements Forward-looking statements involve risks and uncertainties. Actual future performance, outcomes and results may differ materially from those expressed in forward-looking statements. Please refer to the documents filed by Regency Centers Corporation (“Regency” or the “Company”) with the Securities and Exchange Commission (“SEC”), specifically the most recent reports on Forms10-K and10-Q, which identify important risk factors which could cause actual results to differ from those contained in the forward-looking statements. 117
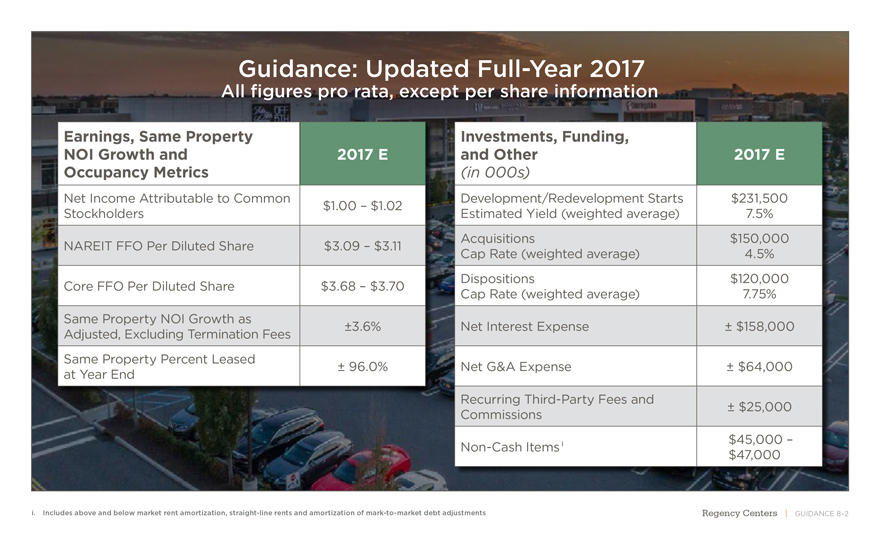
Guidance: Updated Full-Year 2017 All figures pro rata, except per share information Earnings, Same Property NOI Growth and 2017 E Occupancy Metrics Net Income Attributable to Common Stockholders $1.00 – $1.02 NAREIT FFO Per Diluted Share $3.09 – $3.11 Core FFO Per Diluted Share $3.68 – $3.70 Same Property NOI Growth as ±3.6% Adjusted, Excluding Termination Fees Same Property Percent Leased ± 96.0% at Year End Investments, Funding, and Other 2017 E (in 000s) Development/Redevelopment Starts $231,500 Estimated Yield (weighted average) 7.5% Acquisitions $150,000 Cap Rate (weighted average) 4.5% Dispositions $120,000 Cap Rate (weighted average) 7.75% Net Interest Expense ± $158,000 Net G&A Expense ± $64,000 Recurring Third-Party Fees and Commissions ± $25,000Non-Cash Items i $45,000 – $47,000 i. Includes above and below market rent amortization, straight-line rents and amortization ofmark-to-market debt adjustments Regency Centers | GUIDANCE 8–2 118
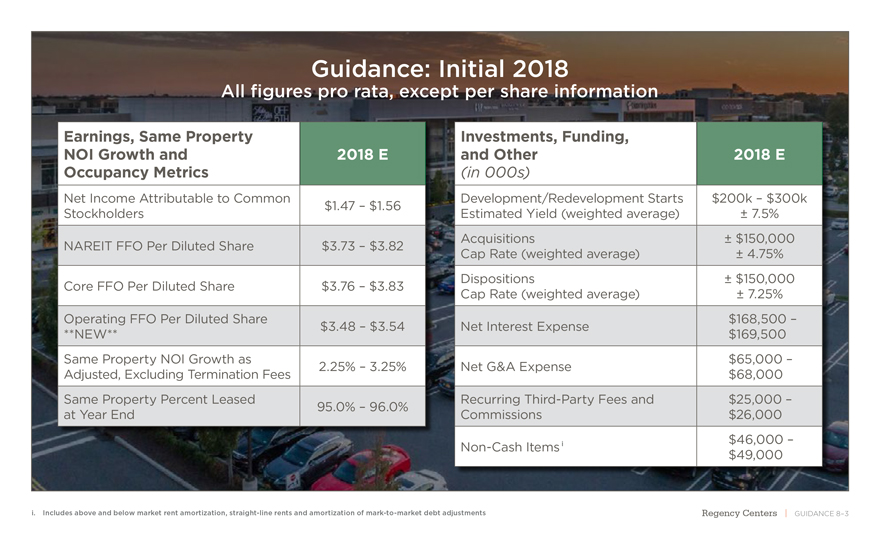
Guidance: Initial 2018 All figures pro rata, except per share information Earnings, Same Property NOI Growth and 2018 E Occupancy Metrics Net Income Attributable to Common Stockholders $1.47 – $1.56 NAREIT FFO Per Diluted Share $3.73 – $3.82 Core FFO Per Diluted Share $3.76 – $3.83 Operating FFO Per Diluted Share $3.48 – $3.54 **NEW** Same Property NOI Growth as 2.25% – 3.25% Adjusted, Excluding Termination Fees Same Property Percent Leased at Year End 95.0% – 96.0% Investments, Funding, and Other 2018 E (in 000s) Development/Redevelopment Starts $200k – $300k Estimated Yield (weighted average) ± 7.5% Acquisitions ± $150,000 Cap Rate (weighted average) ± 4.75% Dispositions ± $150,000 Cap Rate (weighted average) ± 7.25% Net Interest Expense $168,500 – $169,500 Net G&A Expense $65,000 – $68,000 Recurring Third-Party Fees and $25,000 – Commissions $26,000Non-Cash Items i $46,000 – $49,000 i. Includes above and below market rent amortization, straight-line rents and amortization ofmark-to-market debt adjustments Regency Centers | GUIDANCE 8–3 119
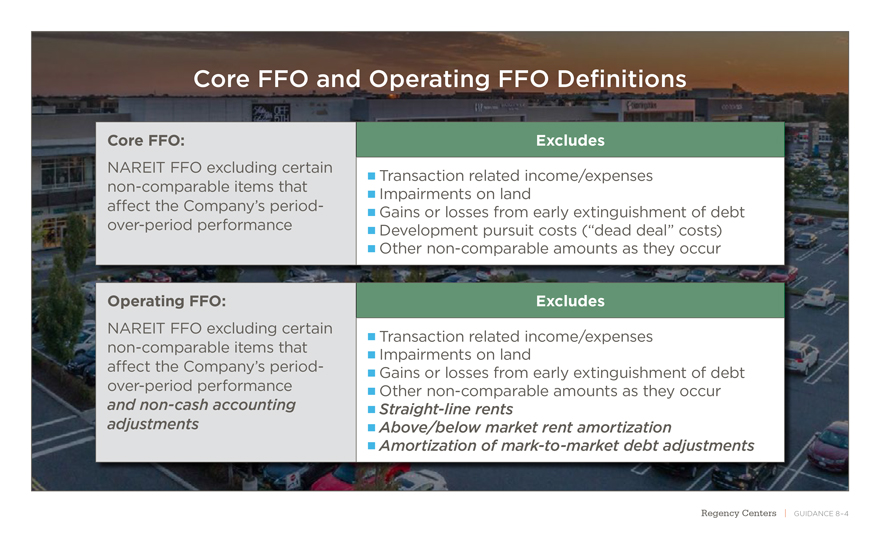
Core FFO and Operating FFO Definitions Core FFO: NAREIT FFO excluding certainnon-comparable items that affect the Company’s period-over-period performance Operating FFO: NAREIT FFO excluding certainnon-comparable items that affect the Company’s period-over-period performance andnon-cash accounting adjustments Excludes Transaction related income/expenses Impairments on land Gains or losses from early extinguishment of debt Development pursuit costs (“dead deal” costs) Othernon-comparable amounts as they occur Excludes Transaction related income/expenses Impairments on land Gains or losses from early extinguishment of debt Othernon-comparable amounts as they occur Straight-line rents Above/below market rent amortization Amortization ofmark-to-market debt adjustments Regency Centers | GUIDANCE 8–4 120
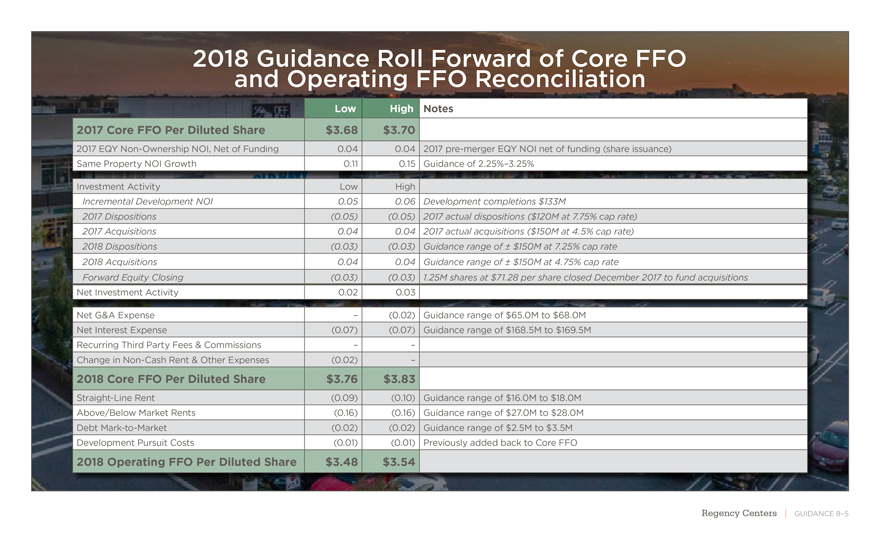
2018 Guidance Roll Forward of Core FFO and Operating FFO Reconciliation Low High Notes 2017 Core FFO Per Diluted Share $3.68 $3.70 2017 EQYNon-Ownership NOI, Net of Funding 0.04 0.042017pre-merger EQY NOI net of funding (share issuance) Same Property NOI Growth 0.11 0.15Guidance of 2.25%–3.25% Investment Activity Low High Incremental Development NOI 0.05 0.06Development completions $133M 2017 Dispositions (0.05) (0.05)2017 actual dispositions ($120M at 7.75% cap rate) 2017 Acquisitions 0.04 0.042017 actual acquisitions ($150M at 4.5% cap rate) 2018 Dispositions (0.03) (0.03)Guidance range of ± $150M at 7.25% cap rate 2018 Acquisitions 0.04 0.04Guidance range of ± $150M at 4.75% cap rate Forward Equity Closing (0.03) (0.03)1.25M shares at $71.28 per share closed December 2017 to fund acquisitions Net Investment Activity 0.02 0.03 Net G&A Expense – (0.02)Guidance range of $65.0M to $68.0M Net Interest Expense (0.07) (0.07)Guidance range of $168.5M to $169.5M Recurring Third Party Fees & Commissions – – Change inNon-Cash Rent & Other Expenses (0.02) – 2018 Core FFO Per Diluted Share $3.76 $3.83 Straight-Line Rent (0.09) (0.10)Guidance range of $16.0M to $18.0M Above/Below Market Rents (0.16) (0.16)Guidance range of $27.0M to $28.0M DebtMark-to-Market (0.02) (0.02)Guidance range of $2.5M to $3.5M Development Pursuit Costs (0.01) (0.01)Previously added back to Core FFO 2018 Operating FFO Per Diluted Share $3.48 $3.54 Regency Centers | GUIDANCE 8–5 121
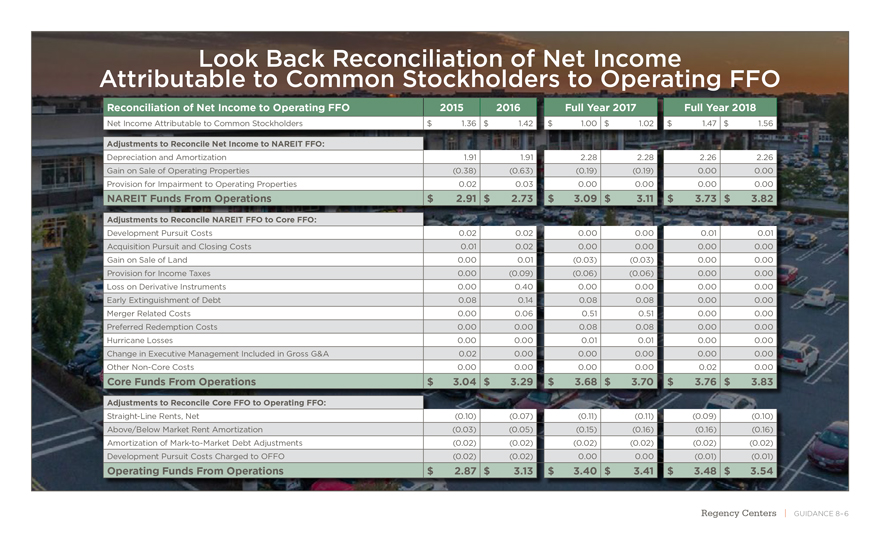
Look Back Reconciliation of Net Income Attributable to Common Stockholders to Operating FFO Reconciliation of Net Income to Operating FFO 2015 2016Full Year 2017Full Year 2018 Net Income Attributable to Common Stockholders $ 1.36 $1.42$1.00$1.02$1.47$1.56 Adjustments to Reconcile Net Income to NAREIT FFO: Depreciation and Amortization 1.91 1.912.282.282.262.26 Gain on Sale of Operating Properties (0.38) (0.63)(0.19)(0.19)0.000.00 Provision for Impairment to Operating Properties 0.02 0.030.000.000.000.00 NAREIT Funds From Operations $ 2.91 $2.73$3.09$3.11$3.73$3.82 Adjustments to Reconcile NAREIT FFO to Core FFO: Development Pursuit Costs 0.02 0.020.000.000.010.01 Acquisition Pursuit and Closing Costs 0.01 0.020.000.000.000.00 Gain on Sale of Land 0.00 0.01(0.03)(0.03)0.000.00 Provision for Income Taxes 0.00 (0.09)(0.06)(0.06)0.000.00 Loss on Derivative Instruments 0.00 0.400.000.000.000.00 Early Extinguishment of Debt 0.08 0.140.080.080.000.00 Merger Related Costs 0.00 0.060.510.510.000.00 Preferred Redemption Costs 0.00 0.000.080.080.000.00 Hurricane Losses 0.00 0.000.010.010.000.00 Change in Executive Management Included in Gross G&A 0.02 0.000.000.000.000.00 OtherNon-Core Costs 0.00 0.000.000.000.020.00 Core Funds From Operations $ 3.04 $3.29$3.68$3.70$3.76$3.83 Adjustments to Reconcile Core FFO to Operating FFO: Straight-Line Rents, Net (0.10) (0.07)(0.11)(0.11)(0.09)(0.10) Above/Below Market Rent Amortization (0.03) (0.05)(0.15)(0.16)(0.16)(0.16) Amortization ofMark-to-Market Debt Adjustments (0.02) (0.02)(0.02)(0.02)(0.02)(0.02) Development Pursuit Costs Charged to OFFO (0.02) (0.02)0.000.00(0.01)(0.01) Operating Funds From Operations $ 2.87 $3.13$3.40$3.41$3.48$3.54 Regency Centers | GUIDANCE 8–6 122
Non-GAAP Disclosure
The Company uses certainnon-GAAP performance measures, in addition to the required GAAP presentations, as it believes these measures improve the understanding of the Company’s operational results. Regency manages its entire real estate portfolio without regard to ownership structure, although certain decisions impacting properties owned through partnerships require partner approval. Therefore, the Company believes presenting itspro-rata share of operating results regardless of ownership structure, along with othernon-GAAP measures, makes comparisons of other REITs’ operating results to the Company’s more meaningful. Management continually evaluates the usefulness, relevance, limitations, and calculation of the Company’s reportednon-GAAP performance measures to determine how best to provide relevant information to the public, and thus such reported measures could change. NAREIT FFO is a commonly used measure of REIT performance, which the National Association of Real Estate Investment Trusts (“NAREIT”) defines as net income, computed in accordance with GAAP, excluding gains and losses from dispositions of depreciable property, net of tax, excluding operating real estate impairments, plus depreciation and amortization, and after adjustments for unconsolidated partnerships and joint ventures. Regency computes NAREIT FFO for all periods presented in accordance with NAREIT’s definition. Many companies use different depreciable lives and methods, and real estate values historically fluctuate with market conditions. Since NAREIT FFO excludes depreciation and amortization and gains and losses from depreciable property dispositions, and impairments, it can provide a performance measure that, when compared year over year, reflects the impact on operations from trends in occupancy rates, rental rates, operating costs, acquisition and development activities, and financing costs. This provides a perspective of the Company’s financial performance not immediately apparent from net income determined in accordance with GAAP. Thus, NAREIT FFO is a supplementalnon-GAAP financial measure of the Company’s operating performance, which does not represent cash generated from operating activities in accordance with GAAP and therefore, should not be considered a substitute measure of cash flows from operations. Core FFO and Operating FFO are additional performance measures used by Regency as the computation of NAREIT FFO includes certainnon-cash andnon-comparable items that affect the Company’s period-over-period performance. Core FFO excludes from NAREIT FFO: (a) transaction related income or expenses; (b) impairments on land; (c) gains or losses from the early extinguishment of debt; (d) development pursuit costs; and (e) othernon-comparable amounts as they occur. Operating FFO excludes from Core FFO:(a) non-cash components of earnings derived from above and below market rent amortization, straight-line rents, and amortization ofmark-to-market of debt adjustments; and includes (b) development pursuit costs. The Company provides a reconciliation of Net Income to NAREIT FFO to Core FFO to Operating FFO.
Regency Centers | GUIDANCE 8–7 123

Regency Centers | CLOSING REMARKS 9–1
CLOSING
REMARKS
124

Regency Centers | CLOSING REMARKS 9–2 UNEQUALED Preeminent National Portfolio Superior Tenant & Merchandising Mix Exceptional Operating Expertise & Systems Proven Development & Redevelopment Capabilities The Combination of These Key Strategic Advantages Makes Regency UNEQUALED Disciplined Financial Management Strong Values & Special Culture 125

Regency Centers | CLOSING REMARKS 9–3 Meeting our strategic objectives will allow us to achieve sector leading results: + = Increasing Dividends Growing Earnings & NAV Superior Total Shareholder Returns 126

THANK YOU
REGENCY
CENTERS
127