Exhibit 99.4

Regency Centers COVID-19 Business Update August 3, 2020 Pinecrest Place | Miami, FL

Safe Harbor and Non-GAAP Disclosures Forward-Looking Statements Certain statements in this document regarding anticipated financial, business, legal or other outcomes including business and market conditions, outlook and other similar statements relating to Regency’s future events, developments, or financial or operational performance or results, are “forward-looking statements” made pursuant to the safe harbor provisions of the Private Securities Litigation Reform Act of 1995 and other federal securities laws. These forward-looking statements are identified by the use of words such as “may,” “will,” “should,” “expect,” “estimate,” “believe,” “intend,” “forecast,” “anticipate,” “guidance,” and other similar language. However, the absence of these or similar words or expressions does not mean a statement is not forward-looking. While we believe these forward-looking statements are reasonable when made, forward-looking statements are not guarantees of future performance or events and undue reliance should not be placed on these statements. Although we believe the expectations reflected in any forward-looking statements are based on reasonable assumptions, we can give no assurance these expectations will be attained, and it is possible actual results may differ materially from those indicated by these forward-looking statements due to a variety of risks and uncertainties. Our operations are subject to a number of risks and uncertainties including, but not limited to, those listed below. When considering an investment in our securities, you should carefully read and consider these risks, together with all other information in our Annual Report on Form 10-K, Quarterly Reports on Form 10-Q and our other filings and submissions to the SEC, which provide much more information and detail on the risks described below. If any of the events described in the following risk factors actually occur, our business, financial condition or operating results, as well as the market price of our securities, could be materially adversely affected. Forward-looking statements are only as of the date they are made, and Regency undertakes no duty to update its forward-looking statements except as required by law. These risks and events include, without limitation: Risks Related to the COVID-19 Pandemic Pandemics or other health crises, such as the current COVID-19 crisis, may adversely affect our tenants’ financial condition, the profitability of our properties, our access to the capital markets and could have a material adverse effect on our business, results of operations, cash flows and financial condition. Risk Factors Related to the Retail Industry Economic and market conditions may adversely affect the retail industry and consequently reduce our revenues and cash flow, and increase our operating expenses; Shifts in retail sales and delivery methods between brick and mortar stores, e-commerce, home delivery, and curbside pick-up may adversely impact our revenues and cash flows; Changing economic and detail market conditions in geographic areas where our properties are concentrated may reduce our revenues and cash flow; Our success depends on the success and continued presence of “anchor” tenants; A significant percentage of our revenues are derived from smaller “shop space” tenants and our net income may be adversely impacted if our smaller shop tenants are not successful; We may be unable to collect balances due from tenants in bankruptcy. Risk Factors Related to Real Estate Investments and Operations We are subject to numerous laws and regulations that may adversely affect our operations or expose us to liability; Our real estate assets may decline in value and be subject to impairment losses which may reduce our net income; We face risks associated with development, redevelopment and expansion of properties; We face risks associated with the development of mixed-use commercial properties; We face risks associated with the acquisition of properties; We face risks if we expand into new markets; We may be unable to sell properties when desired because of market conditions; Certain of the properties in our portfolio are subject to ground leases; if we are unable to renew a ground lease, purchase the fee simple interest, or are found to be in breach of a ground lease, we may be adversely affected; Climate change may adversely impact our properties directly and may lead to additional compliance obligations and costs as well as additional taxes and fees; Geographic concentration of our properties makes our business more vulnerable to natural disasters, severe weather conditions and climate change; An uninsured loss or a loss that exceeds the insurance coverage on our properties may subject us to loss of capital and revenue on those properties; Loss of our key personnel may adversely affect our business and operations; We face competition from numerous sources, including other REITs and other real estate owners; Costs of environmental remediation may reduce our cash flow available for distribution to stock and unit holders; Compliance with the Americans with Disabilities Act and fire, safety and other regulations may require us to make unexpected expenditures; The unauthorized access, use, theft or destruction of tenant or employee personal, financial or other data or of Regency’s proprietary or confidential information stored in our information systems or by third parties on our behalf could impact our reputation and brand and expose us to potential liability and loss of revenues. Risk Factors Related to Our Partnership and Joint Ventures We do not have voting control over all of the properties owned in our co-investment partnerships and joint ventures, so we are unable to ensure that our objectives will be pursued; The termination of our partnerships may adversely affect our cash flow, operating results, and our ability to make distributions to stock and unit holders. Risk Factors Related to Funding Strategies and Capital Structure Our ability to sell properties and fund acquisitions and developments may be adversely impacted by higher market capitalization rates and lower NOI at our properties which may dilute earnings; We may acquire properties or portfolios of properties through tax-deferred contribution transactions, which may result in stockholder dilution and limit our ability to sell such assets; We depend on external sources of capital, which may not be available in the future on favorable terms or at all; Our debt financing may adversely affect our business and financial condition; Covenants in our debt agreements may restrict our operating activities and adversely affect our financial condition; Increases in interest rates would cause our borrowing costs to rise and negatively impact our results of operations; Hedging activity may expose us to risks, including the risks that a counterparty will not perform and that the hedge will not perform and that the hedge will not yield the economic benefits we anticipate, which may adversely affect us; The interest rates on our Unsecured Credit facilities as well as on our variable rate mortgages and interest rate swaps might change based on changes to the method in which LIBOR or its replacement rate is determined. Risk Factors Related to our Company and the Market Price for Our Securities Changes in economic and market conditions may adversely affect the market price of our securities; There is no assurance that we will continue to pay dividends at historical rates; Enhanced focus on corporate responsibility and sustainability, specifically related to environmental, social and governance matters, may impose additional costs and expose us to new risks. Risk Factors Related to Laws and Regulations If the Parent Company fails to qualify as a REIT for federal income tax purposes, it would be subject to federal income tax at regular corporate rates; Recent changes to the U.S. tax laws may have a significant negative impact on the overall economy, our tenants, our investors, and our business; Dividends paid by REITs generally do not qualify for reduced tax rates; Certain foreign stockholders may be subject to U.S. federal income tax on gain recognized on a disposition of our common stock if we do not qualify as a “domestically controlled” REIT; Legislative or other actions affecting REITs may have a negative effect on us; Complying with REIT requirements may limit our ability to hedge effectively and may cause us to incur tax liabilities; Restrictions on the ownership of the Parent Company's capital stock to preserve its REIT status may delay or prevent a change in control; The issuance of the Parent Company's capital stock may delay or prevent a change in control. Non-GAAP disclosure We believe these non-GAAP measures provide useful information to our Board of Directors, management and investors regarding certain trends relating to our financial condition and results of operations. Our management uses these non-GAAP measures to compare our performance to that of prior periods for trend analyses, purposes of determining management incentive compensation and budgeting, forecasting and planning purposes. We do not consider non-GAAP measures an alternative to financial measures determined in accordance with GAAP. The principal limitation of these non-GAAP financial measures is they may exclude significant expense and income items that are required by GAAP to be recognized in our consolidated financial statements. In addition, they reflect the exercise of management’s judgment about which expense and income items are excluded or included in determining these non-GAAP financial measures. In order to compensate for these limitations, reconciliations of the non-GAAP financial measures we use to their most directly comparable GAAP measures are provided. Non-GAAP financial measures should not be relied upon in evaluating the financial condition, results of operations or future prospects of the Company. NAREIT FFO is a commonly used measure of REIT performance, which the National Association of Real Estate Investment Trusts (“NAREIT”) defines as net income, computed in accordance with GAAP, excluding gains on sale and impairments of real estate, net of tax, plus depreciation and amortization, and after adjustments for unconsolidated partnerships and joint ventures. Regency computes NAREIT FFO for all periods presented in accordance with NAREIT's definition. Since NAREIT FFO excludes depreciation and amortization and gains on sales and impairments of real estate, it provides a performance measure that, when compared year over year, reflects the impact on operations from trends in occupancy rates, rental rates, operating costs, acquisition and development activities, and financing costs. This provides a perspective of the Company’s financial performance not immediately apparent from net income determined in accordance with GAAP. Thus, NAREIT FFO is a supplemental non-GAAP financial measure of the Company's operating performance, which does not represent cash generated from operating activities in accordance with GAAP; and, therefore, should not be considered a substitute measure of cash flows from operations. The Company provides a reconciliation of Net Income Attributable to Common Stockholders to NAREIT FFO. Core Operating Earnings is an additional performance measure that excludes from NAREIT FFO: (i) transaction related income or expenses (ii) gains or losses from the early extinguishment of debt; (iii) certain non-cash components of earnings derived from above and below market rent amortization, straight-line rents, and amortization of mark-to-market of debt adjustments; and (iv) other amounts as they occur. The Company provides a reconciliation of Net Income to NAREIT FFO to Core Operating Earnings. 2 REGENCY CENTERS COVID-19 BUSINESS UPDATE

Regency’s Unequaled Strategic Advantages Development/Redevelopment Opportunities Pipeline of flexible developments and redevelopments n Positioned to create value over the long-term Local Market Teams 22 offices throughout the country working with tenants and vendors at 415 properties Unparalleled team of experienced professionals Balance Sheet and Liquidity Strength Low leverage with limited near-term maturities Debt to EBITDAre of 5.6x ~$1.5B of Total Liquidity High Quality Real Estate Portfolio 80% Grocery-Anchored Necessity, service, convenience, and value retailers serving essential needs of our communities 3 REGENCY CENTERS COVID-19 BUSINESS UPDATE

Leading Corporate Responsibility Practices In June, Regency issued our Annual Corporate Responsibility Report. The report illustrates our continued commitment to corporate responsibility and key environmental, social, and governance initiatives and achievements. Some of our key achievements for the year include the following: n Achieved annual employee engagement goal of employee engagement of 85% or greater n Received the First Coast Healthiest Companies Award for the 11th consecutive year n Provided over 10,000 hours of employee training and continuing education and ensured 100% of employees received regular performance and career development reviews n Developed a Human Rights Policy n Approximately $1.4M contributed to charitable causes n More than 75% of employees participated in Company-sponsored volunteer opportunities n Developed a new program to allow employees the opportunity to participate in selecting recipients for corporate contributions, enabling them to direct assistance to a cause that is important to them and makes a difference in Regency’s communities n Recognized as a winning “W” company by 2020 Women on Boards for having more than 20% of its Board seats held by women n Achieved top ISS Governance Quality Score of 1 n Developed vendor and contractor management tools to help them adhere to the same high standards of the Company n Awarded a GRESB Green Star for the fifth consecutive year n Enhanced leases to include green clauses n Exceeded annual goals by reducing greenhouse gas emissions by 9%, reducing energy consumption by 6%, and increasing waste diversion by 3% n Expanded renewable energy produced to approximately 5,900-megawatt hours through power generation from 30 systems at 22 properties Our People Our Communities Environmental Ethics and Governance Stewardship 28 STRONG BRAND AND CULTURE Leading Corporate Responsibility Practices Connecting to Our Stakeholders While Executing Our Strategy OUR PEOPLE Regency's objective is to maintain a high level of employee engagement with an overall score of 85% or greater, while maintaining our award-winning benefits and wellness plans and enhancing our focus on diversity. ETHICS & GOVERNANCE Regency's objective is to maintain best-in-class corporate governance with adherence to the highest ethical behavior and corporate oversight, while continuing to achieve the highest overall scores from leading shareholder advisory firms. OUR COMMUNITIES Adhering to Regency's Core Values and culture, the Company's objective is to contribute to the betterment of communities through investment and philanthropic efforts. This includes a commitment to monetary donations as well as employees donating their time through volunteer hours annually. ENVIRONMENTAL STEWARDSHIP Regency's objectives include a continued commitment to being good stewards of our environment while reducing our overall impact, represented by our renewed goals to reduce energy consumption, greenhouse gas emissions and waste, coupled with our focus on climate resiliency. S&P 500® ESG ISS Qualityscore Materiality Disclosures GRFSB MSCI ESG Rating A TCFD SASB 4 REGENCY CENTERS COVID-19 BUSINESS UPDATE

Portfolio Composition(1) Pro-Rata Annual Base Rent (ABR) Exposure by Category Portfolio Composition (2) % of Pro-Rata ABR 38% Other - Retail & Services 19% Essential - Restaurants 43% Essential - Retail & Services Grocery/Drugstore 22% 12% 8% 7% 6% 5% 5% 4% 4% 4% 4% 3% 3% 3% 3% 2% 2% 2% 1% Home Fitness Business Services Restaurant - Casual/Fine Dining Pet Restaurant - Fast Food/ Limited Service Other Medical Banks Essential Medical Apparel Office/Communications Off-Price Other Retail Personal Services Other Essential Retail Hobby/Sports Home Improvement/Auto Entertainment Exposure by Category % of Pro-Rata ABR ESSENTIAL - RETAIL & SERVICES ESSENTIAL - RESTAURANTS OTHER - RETAIL & SERVICES (1) Percentages may not sum to 100% due to rounding. (2) Essential retailers defined as those that supply or provide consumers and essential businesses with any basic necessary goods and services; the definition varies across municipalities. While some restaurants are deemed to be essential retail, we have excluded them from the category. 5 REGENCY CENTERS COVID-19 BUSINESS UPDATE

Operational Update Tenant Operating Status as of July 31, 2020 Grocery/Drugstore Restaurant - Casual/Fine Dining Other Essential Retail Entertainment Home Improvement/Auto Other Medical Home Essential Medical Apparel Hobby/Sports Pet Business Services Restaurant - Fast Food/ Limited Service Personal Services Banks Other Retail Office/Communications Off-Price Fitness 100% 100% 100% 100% 98% 97% 97% 97% 97% 96% 96% 94% 94% 93% 93% 92% 89% 71% 54% Tenants Open by Category % of Pro-Rata ABR ESSENTIAL - RETAIL & SERVICES (99% OPEN) ESSENTIAL - RESTAURANTS (95% OPEN) OTHER - RETAIL & SERVICES (90% OPEN) 59% 75% 95% ‑April 30th May 31st July 31st ‑Status of Tenant Operations % of Pro-Rata ABR % of Pro-Rata ABR 5% Closed 95% Open 6 REGENCY CENTERS

Operational Update Q2 Base Rent Collections as of July 31, 2020 Q2 Base Rent Collections by Category % of Pro-Rata ABR Grocery/Drugstore Restaurant - Casual/Fine Dining Other Essential Retail Entertainment Home Improvement/Auto Other Medical Home Essential Medical Apparel Hobby/Sports Pet Business Services Restaurant - Fast Food/Limited Service Personal Services Banks Other Retail Office/Communications Off-Price Fitness 99% 99% 95% 95% 94% 93% 88% 80% 72% 66% 65% 55% 53% 53% 52% 41% 38% 21% 16% ESSENTIAL - RETAIL & SERVICES (97% COLLECTED) ESSENTIAL - RESTAURANTS (61% COLLECTED) OTHER - RETAIL & SERVICES (48% COLLECTED) Q2 Base Rent Collections % of Pro-Rata ABR 23% Uncollected 5% Uncollected (deferred) 72% Collected 7 REGENCY CENTERS COVID-19 BUSINESS UPDATE

Operational Update July Base Rent Collections as of July 31, 2020 July Base Rent Collections by Category % of Pro-Rata ABR Grocery/Drugstore Restaurant - Casual/Fine Dining Other Essential Retail Entertainment Home Improvement/Auto Other Medical Home Essential Medical Apparel Hobby/Sports Pet Business Services Restaurant - Fast Food/Limited Service Personal Services Banks Other Retail Office/Communications Off-Price Fitness 99% 99% 96% 95% 91% 91% 87% 84% 79% 79% 74% 74% 69% 56% 55% 51% 41% 30% 25% ESSENTIAL - RETAIL & SERVICES (96% COLLECTED) ESSENTIAL - RESTAURANTS (63% COLLECTED) OTHER - RETAIL & SERVICES (57% COLLECTED) July Base Rent Collections % of Pro-Rata ABR 21% Uncollected 4% Uncollected (deferred) 75% Collected 8 REGENCY CENTERS COVID-19 BUSINESS UPDATE

Operational Update Q2 & July Base Rent Collections as of July 31, 2020 Total Portfolio Composition % of Pro-Rata ABR Q2 and July Rent Collections % of Pro-Rata ABR National, Regional & Local Portfolio Composition(1) Anchor & Shop Portfolio Composition(2) 23% Local 77% National & Regional 56% Shop 44% Anchor (1) Local Tenants: <3 locations; National/Regional Tenants: ≥ 3 locations (2) Shop Tenants: <10K square feet; Anchor Tenants: ≥ 10K square feet 0% 20% 40% 60% 80% 100% Q2 July 74% 80% 64% 59% NATIONAL & REGIONAL LOCAL 0% 20% 40% 60% 80% 100% Q2 July 78% 82% 67% 70% ANCHOR SHOP 9 REGENCY CENTERS COVID-19 BUSINESS UPDATE

Operational Update Executed Deferral Agreements as of July 31, 2020 Total Executed Deferral Agreements (through July 31, 2020) Lease Count 633 Average Deferral Term (in months) 2.9 Total Deferred Rent (in 000s) $16,435(1) National, Regional & Local Tenant Composition Executed Deferral Agreements 16% Local 84% National & Regional Anchor & Shop Tenant Composition 53% Anchor 47% Shop Repayments by Year 78% 2021 4% 2022+ 18% 2020 (1) 80% of total deferred rent is for rent billed in Q2 2020. See Q2 supplemental package on page 33 for additional details. 10 REGENCY CENTERS COVID-19 BUSINESS UPDATE
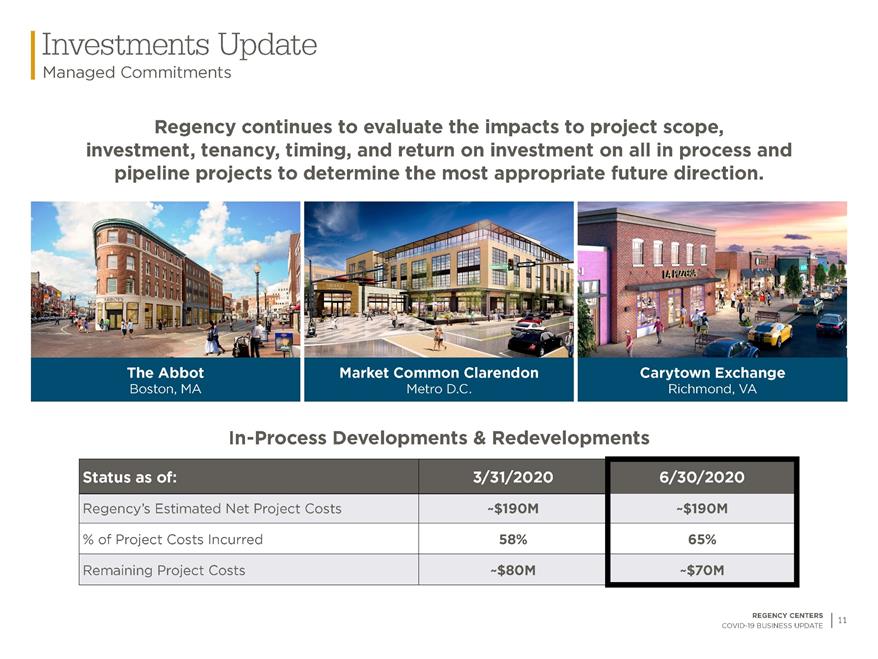
Investments Update Managed Commitments Regency continues to evaluate the impacts to project scope, investment, tenancy, timing, and return on investment on all in process and pipeline projects to determine the most appropriate future direction. Status as of: 3/31/2020 6/30/2020 Regency’s Estimated Net Project Costs ~$190M ~$190M % of Project Costs Incurred 58% 65% Remaining Project Costs ~$80M ~$70M In-Process Developments & Redevelopments The Abbot Boston, MA Market Common Clarendon Metro D.C. Carytown Exchange Richmond, VA 11 REGENCY CENTERS COVID-19 BUSINESS UPDATE

Investments Update Project Status as of August 3, 2020(1) IN-PROCESS Carytown Exchange Phase I Ground up Development in Richmond anchored by Publix; construction will be phased as 2 projects; Phase I construction will include Publix & Shop Building The Village at Hunter's Lake Ground up development in Tampa anchored by Sprouts; construction proceeding as planned and nearly complete West Bird Plaza Redevelopment in Miami to construct new Publix; construction proceeding as planned Point 50 Redevelopment in metro DC to construct new grocery anchored center; construction proceeding as planned and nearly complete Bloomingdale Square Redevelopment in Tampa to relocate Publix and add LA Fitness and HOME Centric The Abbot Phase I Redevelopment of historic Harvard Square buildings; construction was halted in late March and restarted June 1st when the government mandate was lifted; construction will be phased as 2 projects; Phase I includes the completion of 1 ground-up building Market Common Clarendon Office Phase I Redevelopment of a vacant office bldg. in Metro DC; construction will be phased as 2 projects; Phase I construction plan includes completing the shell building as well as the delivery to Equinox PIPELINE Gateway Plaza at Aventura Redevelopment of former Babies R Us space in Miami, lease negotiations continue with specialty grocer as scope of project is reviewed Westbard Square Redevelopment of Giant anchored center in metro DC into mixed use center, entitlements proceeding, scope and economics under review Hancock Center Potential sale or redevelopment of former Sears in Austin Costa Verde Center Large scale redevelopment in San Diego into mixed use with retail, office & hotel, entitlements advancing, economics and timing under review Town and Country Center Redevelopment of former Kmart in LA with retail below multifamily, entitlements advancing, economics and timing under review Serramonte Center Multi-phased redevelopment with plans of 3 projects including new retail as well as other uses to continue to augment this Class A mall. The project is currently under review as Management reassess the scope, merchandising, project costs, and return on investment in light of the COVID-19 pandemic. Culver Public Market Ground up development in LA; vertical construction had not commenced; management evaluating future direction The Abbot Phase II Phase 2 of this redevelopment in Harvard Square includes the interior building completion and tenant buildouts Market Common Clarendon Office Phase II Phase 2 of this redevelopment of a vacant office building in Metro DC; includes the interior building completion and tenant buildouts Carytown Exchange Phase II Phase II of this Richmond ground up development anchored by Publix will consist of the 3 additional shop buildings (1) Please refer to the 2Q'20 supplemental filing for additional project level detail. 12 REGENCY CENTERS COVID-19 BUSINESS UPDATE

Balance Sheet Strength Low Leverage Provides Flexibility Regency has taken additional steps to further strengthen its balance sheet and to provide financial flexibility amid the evolving effects of the COVID-19 pandemic, including issuing $600 million of 10-year 3.70% notes in May 2020. Total Pro-Rata Share Leverage Ratios 6/30/20 Net debt-to-Operating EBITDAre 5.6x Fixed charge coverage 4.0x Interest coverage 4.4x Unsecured Public Debt Covenants Required 6/30/20(3) Fair Market Value Calculation Method Covenants(1)(2) Total Consolidated Debt to Total Consolidated Assets ≤ 65% 31% Secured Consolidated Debt to Total Consolidated Assets ≤ 40% 4% Consolidated Income for Debt Service to Consolidated Debt Service ≥ 1.5x 4.3x Unencumbered Consolidated Assets to Unsecured Consolidated Debt >150% 328% (1) For a complete listing of all Debt Covenants related to the Company's Senior Unsecured Notes, as well as definitions of the above terms, please refer to the Company's filings with the Securities and Exchange Commission. (2) Current period debt covenants are finalized and submitted after the Company's most recent Form 10-Q or Form 10-K filing. (3) Trailing 12 months. 13 REGENCY CENTERS COVID-19 BUSINESS UPDATE

Balance Sheet Strength A Well-Laddered Maturity Schedule (Schedule below is pro forma for the noticed $300 million bond redemption) $40 $180 $376 $136 $373 $334 $320 $594 $337 $449 $672 $32 $425 $300 2020 2021 2022 2023 2024 2025 2026 2027 2028 2029 2030 2031 2046 2047 2049‑ IN MILLIONS Wtd average years to maturity: 9+ years Wtd average interest rate: 3.5% UNCONSOLIDATED DEBT - SECURED CONSOLIDATED DEBT - SECURED UNSECURED DEBT - BONDS UNSECURED DEBT - TERM Debt Maturity Profile as of August 3, 2020 (Cash Balance: $287M)1 (1) Net of planned September 2020 redemption of the $300 million senior unsecured notes due November 2022 14 REGENCY CENTERS COVID-19 BUSINESS UPDATE
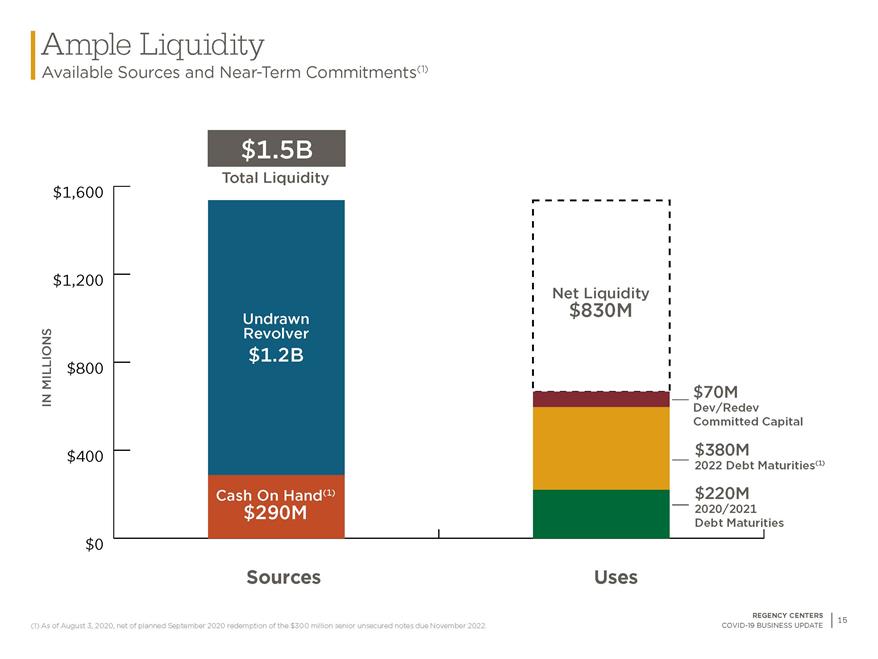
Ample Liquidity Available Sources and Near-Term Commitments(1) $220M 2020 2021 Debt Maturities $380M 2022 Debt Maturities(1) $70M Dev/Redev Committed Capital Cash On Hand(1) $290M Undrawn Revolver $1.2B $830M Net Liquidity $1.5B Total Liquidity IN MILLIONS Sources Uses (1) As of August 3, 2020, net of planned September 2020 redemption of the $300 million senior unsecured notes due November 2022. 15 REGENCY CENTERS COVID-19 BUSINESS UPDATE