Exhibit 99.2
Table of Contents
December 31, 2020
| |
Forward-Looking Statements and Non-GAAP Measures Disclosures | i |
| |
Earnings Press Release | v |
| |
Summary Information: | |
| |
Summary Financial Information | 1 |
| |
Summary Real Estate Information | 2 |
| |
Financial Information: | |
| |
Consolidated Balance Sheets | 3 |
| |
Consolidated Statements of Operations | 4 |
| |
Supplemental Details of Operations (Consolidated Only) | 5 |
| |
Supplemental Details of Assets and Liabilities (Real Estate Partnerships Only) | 6 |
| |
Supplemental Details of Operations (Real Estate Partnerships Only) | 7 |
| |
Supplemental Details of Same Property NOI (Pro-Rata) | 8 |
| |
Reconciliations of Non-GAAP Financial Measures and Additional Disclosures | 9 |
| |
Summary of Consolidated Debt | 11 |
| |
Summary of Consolidated Debt Detail | 12 |
| |
Summary of Unsecured Debt Covenants and Leverage Ratios | 13 |
| |
Summary of Unconsolidated Debt | 14 |
| |
Unconsolidated Investments | 15 |
| |
Investment Activity: | |
| |
Property Transactions | 16 |
| |
Summary of In-Process Developments and Redevelopments | 17 |
| |
Major Developments and Redevelopments Pipeline and Completions | 18 |
| |
Real Estate Information: | |
| |
Leasing Statistics | 19 |
| |
Average Base Rent by CBSA | 20 |
| |
Significant Tenant Rents | 21 |
| |
Tenant Lease Expirations | 22 |
| |
Portfolio Summary Report by State | 23 |
| |
Additional Disclosures Related to COVID-19 and Forward-Looking Information: | |
| |
Components of NAV | 38 |
| |
Additional Disclosures Related to COVID-19 Impact | 39 |
| |
Earnings Guidance | 41 |
| |
Reconciliation of Net Income to Nareit FFO | 42 |
| |
Glossary of Terms | 43 |
Forward-Looking Statements and Non-GAAP Measures Disclosures
December 31, 2020
Forward-Looking Statements
Certain statements in this document regarding anticipated financial, business, legal or other outcomes including business and market conditions, outlook and other similar statements relating to Regency’s future events, developments, or financial or operational performance or results, are “forward-looking statements” made pursuant to the safe harbor provisions of the Private Securities Litigation Reform Act of 1995 and other federal securities laws. These forward-looking statements are identified by the use of words such as “may,” “will,” “should,” “expect,” “estimate,” “believe,” “intend,” “forecast,” “anticipate,” “guidance,” and other similar language. However, the absence of these or similar words or expressions does not mean a statement is not forward-looking. While we believe these forward-looking statements are reasonable when made, forward-looking statements are not guarantees of future performance or events and undue reliance should not be placed on these statements. Although we believe the expectations reflected in any forward-looking statements are based on reasonable assumptions, we can give no assurance these expectations will be attained, and it is possible actual results may differ materially from those indicated by these forward-looking statements due to a variety of risks and uncertainties.
Our operations are subject to a number of risks and uncertainties including, but not limited to risk factors described in our SEC filings. When considering an investment in our securities, you should carefully read and consider these risks, together with all other information in our Annual Reports on Form 10-K, Quarterly Reports on Form 10-Q and our other filings and submissions to the SEC. If any of the events described in the risk factors actually occur, our business, financial condition or operating results, as well as the market price of our securities, could be materially adversely affected. Forward-looking statements are only as of the date they are made, and Regency undertakes no duty to update its forward-looking statements except as required by law. These risks and events include, without limitation:
Risk Factors Related to the COVID-19 Pandemic
| • | Pandemics or other health crises, such as the COVID-19 pandemic, may adversely affect our tenants’ financial condition, the profitability of our properties, and our access to the capital markets and could have a material adverse effect on our business, results of operations, cash flows and financial condition. |
Risk Factors Related to Operating Retail-Based Shopping Centers
| • | Economic and market conditions may adversely affect the retail industry and consequently reduce our revenues and cash flow, and increase our operating expenses. |
| • | Shifts in retail trends, sales, and delivery methods between brick and mortar stores, e-commerce, home delivery, and curbside pick-up may adversely impact our revenues and cash flows. |
| • | Changing economic and retail market conditions in geographic areas where our properties are concentrated may reduce our revenues and cash flow. |
| • | Our success depends on the continued presence and success of our “anchor” tenants. |
| • | A significant percentage of our revenues are derived from smaller “shop space” tenants and our net income may be adversely impacted if our smaller shop tenants are not successful. |
| • | We may be unable to collect balances due from tenants in bankruptcy. |
| • | Many of our costs and expenses associated with operating our properties may remain constant or increase, even if our lease income decreases. |
| • | Compliance with the Americans with Disabilities Act and fire, safety and other regulations may have a negative effect on us. |
Risk Factors Related to Real Estate Investments
| • | Our real estate assets may decline in value and be subject to impairment losses which may reduce our net income. |
| • | We face risks associated with development, redevelopment and expansion of properties. |
| • | We face risks associated with the development of mixed-use commercial properties. |
| • | We face risks associated with the acquisition of properties. |
| • | We may be unable to sell properties when desired because of market conditions. |
| • | Changes in tax laws could impact our acquisition or disposition of real estate. |
| | |

| Supplemental Information | i |
Risk Factors Related to the Environment Affecting Our Properties
| • | Climate change may adversely impact our properties directly, and may lead to additional compliance obligations and costs as well as additional taxes and fees. |
| • | Geographic concentration of our properties makes our business more vulnerable to natural disasters, severe weather conditions and climate change. |
| • | Costs of environmental remediation may impact our financial performance and reduce our cash flow. |
Risk Factors Related to Corporate Matters
| • | An uninsured loss or a loss that exceeds the insurance coverage on our properties may subject us to loss of capital and revenue on those properties. |
| • | Failure to attract and retain key personnel may adversely affect our business and operations. |
| • | The unauthorized access, use, theft or destruction of tenant or employee personal, financial or other data or of Regency’s proprietary or confidential information stored in our information systems or by third parties on our behalf could impact our reputation and brand and expose us to potential liability and loss of revenues. |
Risk Factors Related to Our Partnerships and Joint Ventures
| • | We do not have voting control over all of the properties owned in our co-investment partnerships and joint ventures, so we are unable to ensure that our objectives will be pursued. |
| • | The termination of our partnerships may adversely affect our cash flow, operating results, and our ability to make distributions to stock and unit holders. |
Risk Factors Related to Funding Strategies and Capital Structure
| • | Our ability to sell properties and fund acquisitions and developments may be adversely impacted by higher market capitalization rates and lower NOI at our properties which may dilute earnings. |
| • | We depend on external sources of capital, which may not be available in the future on favorable terms or at all. |
| • | Our debt financing may adversely affect our business and financial condition. |
| • | Covenants in our debt agreements may restrict our operating activities and adversely affect our financial condition. |
| • | Increases in interest rates would cause our borrowing costs to rise and negatively impact our results of operations. |
| • | Hedging activity may expose us to risks, including the risks that a counterparty will not perform and that the hedge will not yield the economic benefits we anticipate, which may adversely affect us. |
| • | The interest rates on our Unsecured Credit facilities as well as on our variable rate mortgages and interest rate swaps might change based on changes to the method in which LIBOR or its replacement rate is determined. |
Risk Factors Related to the Market Price for Our Securities
| • | Changes in economic and market conditions may adversely affect the market price of our securities. |
| • | There is no assurance that we will continue to pay dividends at historical rates. |
Risk Factors Relating to the Company’s Qualification as a REIT
| • | If the Parent Company fails to qualify as a REIT for federal income tax purposes, it would be subject to federal income tax at regular corporate rates. |
| • | Dividends paid by REITs generally do not qualify for reduced tax rates. |
| • | Certain foreign stockholders may be subject to U.S. federal income tax on gain recognized on a disposition of our common stock if we do not qualify as a “domestically controlled” REIT. |
| • | Legislative or other actions affecting REITs may have a negative effect on us. |
| • | Complying with REIT requirements may limit our ability to hedge effectively and may cause us to incur tax liabilities. |
| | |
| Supplemental Information | ii |
Risks Related to the Company’s Common Stock
| • | Restrictions on the ownership of the Parent Company’s capital stock to preserve its REIT status may delay or prevent a change in control. |
| • | The issuance of the Parent Company's capital stock may delay or prevent a change in control. |
| • | Ownership in the Parent Company may be diluted in the future. |
Non-GAAP Measures Disclosures
We believe these non-GAAP measures provide useful information to our Board of Directors, management and investors regarding certain trends relating to our financial condition and results of operations. Our management uses these non-GAAP measures to compare our performance to that of prior periods for trend analyses, purposes of determining management incentive compensation and budgeting, forecasting and planning purposes.
We do not consider non-GAAP measures an alternative to financial measures determined in accordance with GAAP. The principal limitation of these non-GAAP financial measures is they may exclude significant expense and income items that are required by GAAP to be recognized in our consolidated financial statements. In addition, they reflect the exercise of management’s judgment about which expense and income items are excluded or included in determining these non-GAAP financial measures. In order to compensate for these limitations, reconciliations of the non-GAAP financial measures we use to their most directly comparable GAAP measures are provided. Non-GAAP financial measures should not be relied upon in evaluating the financial condition, results of operations or future prospects of the Company.
The pro-rata information provided is not, and is not intended to be, presented in accordance with GAAP. The pro-rata supplemental details of assets and liabilities and supplemental details of operations reflect our proportionate economic ownership of the assets, liabilities and operating results of the properties in our portfolio.
| • | The items labeled as "Consolidated" are prepared on a basis consistent with the Company's consolidated financial statements as filed with the SEC on the most recent Form 10-Q or 10-K, as applicable. |
| • | The columns labeled "Share of JVs" represent our ownership interest in our unconsolidated (equity method) investments in real estate partnerships, and was derived on a partnership by partnership basis by applying to each financial statement line item our ownership percentage interest used to arrive at our share of investments in real estate partnerships and equity in income or loss of investments in real estate partnerships during the period when applying the equity method of accounting to each of our unconsolidated partnerships. |
| • | A similar calculation was performed for the amounts in columns labeled ''Noncontrolling Interests”, which represent the limited partners’ interests in consolidated partnerships attributable to each financial statement line item. |
We do not control the unconsolidated partnerships, and the presentations of the assets and liabilities and revenues and expenses do not necessarily represent our legal claim to such items. The partners are entitled to profit or loss allocations and distributions of cash flows according to the operating agreements, which generally provide for such allocations according to their invested capital. Our share of invested capital establishes the ownership interest we use to prepare our pro-rata share.
The presentation of pro-rata financial information has limitations as an analytical tool. Some of these limitations include, but are not limited to the following:
| • | The amounts shown on the individual line items were derived by applying our overall economic ownership interest percentage determined when applying the equity method of accounting or allocating noncontrolling interests, and do not necessarily represent our legal claim to the assets and liabilities, or the revenues and expenses; and |
| • | Other companies in our industry may calculate their pro-rata interests differently, limiting the comparability of pro-rata information. |
Because of these limitations, the supplemental details of assets and liabilities and supplemental details of operations should not be considered independently or as a substitute for our financial statements as reported under GAAP. We compensate for these limitations by relying primarily on our GAAP results and using the pro-rata details as a supplement.
| | |
| Supplemental Information | iii |
The following non-GAAP measures, as defined in the Glossary of Terms, are commonly used by management and the investing public to understand and evaluate our operating results and performance:
| • | Nareit Funds From Operations (Nareit FFO): The Company believes Nareit FFO provides a performance measure that, when compared year over year, reflects the impact on operations from trends in percent leased, rental rates, operating costs, acquisition and development activities, and financing costs. The Company provides a reconciliation of Net Income Attributable to Common Stockholders to Nareit FFO. |
| • | Net Operating Income (NOI): The Company believes NOI provides useful information to investors to measure the operating performance of its portfolio of properties. The Company provides a reconciliation of Net Income Attributable to Common Stockholders to pro-rata NOI. |
| • | Core Operating Earnings: The Company believes Core Operating Earnings, which excludes certain non-cash and non-comparable items from the computation of Nareit FFO that affect the Company's period-over-period performance, is useful to investors because it is more reflective of the core operating performance of its portfolio of properties. The Company provides a reconciliation of Nareit FFO to Core Operating Earnings. |
| • | Same Property NOI: The Company provides disclosure of NOI on a same property basis because it believes the measure provides investors with additional information regarding the operating performances of comparable assets. Same Property NOI excludes all development, non-same property and corporate level revenue and expenses. The Company also provides disclosure of NOI excluding termination fees, which excludes both termination fee income and expenses. |
| | |
| Supplemental Information | iv |
| | |

| | NEWS RELEASE For immediate release Christy McElroy 904 598 7616 ChristyMcElroy@regencycenters.com |
Regency Centers Reports Fourth Quarter and Full Year 2020 Results
JACKSONVILLE, FL (February 11, 2021) – Regency Centers Corporation (“Regency” or the “Company”) (NASDAQ:REG) today reported financial and operating results for the period ended December 31, 2020, provided an update related to the COVID-19 pandemic, and provided initial guidance for 2021 Nareit FFO. For the three months ended December 31, 2020 and 2019, Net Income was $0.23 per diluted share and $0.24 per diluted share, respectively. For the twelve months ended December 31, 2020 and 2019, Net Income was $0.26 per diluted share and $1.43 per diluted share, respectively.
Fourth Quarter and Full Year 2020 Highlights
| • | Reported Nareit FFO for the fourth quarter of $0.76 per diluted share; one-time items include a write-off of development pursuit costs of $0.05 per diluted share, a swap breakage charge of $0.02 per diluted share, and a write-off of straight line rents receivable of $0.04 per diluted share |
| o | Nareit FFO also reflects uncollectible lease income of $0.10 per diluted share, primarily related to the COVID-19 pandemic |
| • | Same property Net Operating Income (“NOI”), excluding termination fees, decreased 10.5% during the fourth quarter and 11.6% during the full year 2020, respectively, from prior periods driven primarily by a higher rate of uncollectible lease income due to the COVID-19 pandemic |
| • | Realized percent leased of 92.9% in the same property portfolio as of December 31, 2020 |
| • | Collected 92% of fourth quarter pro-rata base rent, as of February 8, 2021 |
| • | Executed 1.7 million square feet of new and renewal leases in the fourth quarter at a blended rent spread of +0.6%, and executed 5.9 million square feet of new and renewal leases in the full year 2020 at a blended rent spread of +2.2% |
| • | Started over $124 million of development and redevelopment projects, and completed over $71 million of projects with a stabilized yield of 8%, during the full year 2020 |
| • | Completed property dispositions of $77.8 million and non-income producing land sales of $8.1 million, each at Regency’s share, during the fourth quarter. Completed property and outparcel dispositions of $190.8 million at a cap rate of 5.7% and non-income producing land sales of $18.6 million, all at Regency’s share, during the full year 2020 |
| • | Realized pro-rata net debt-to-operating EBITDAre of 6.0x at December 31, 2020. |
Subsequent Highlights
| • | Subsequent to year-end, closed on the sale of one shopping center for a gross sales price of $9.0 million, and one non-income producing asset for $29.4 million, both at Regency’s share |
| • | On January 15, 2021, repaid the $265 million term loan originally due January 2022 (the “Term Loan”) using cash available, leaving no unsecured debt maturities until 2024 |
| • | On January 27, 2021, Regency issued its first TCFD Climate Change Risk Report, illustrating the Company’s continued commitment to corporate responsibility and transparency |
| • | On February 9, 2021, closed on an amended and restated $1.25 billion revolving credit facility maturing March 23, 2025, replacing the existing revolving credit facility |
| | |
| Supplemental Information | v |
| • | On February 10, 2021, Regency’s Board of Directors (the “Board”) declared a quarterly cash dividend on the Company’s common stock of $0.595 per share |
| • | Included on Newsweek’s Most Responsible Companies List 2021 for the second year in a row |
“I’m so proud of how our team has navigated the incredible challenges we faced this past year, working harder than ever to serve our tenants, our customers, our communities and our shareholders,” said Lisa Palmer, President and Chief Executive Officer. “While we acknowledge the meaningful uncertainty that still exists in 2021, we are encouraged by the continued improvement in rent collections and positive momentum in leasing activity that we experienced in the fourth quarter.”
Financial Results
Net Income
| • | For the three months ended December 31, 2020, Net Income Attributable to Common Stockholders (“Net Income”) was $38.5 million, or $0.23 per diluted share, compared to Net Income of $40.3 million, or $0.24 per diluted share, for the same period in 2019 |
| o | Fourth quarter Net Income includes a $0.10 per diluted share non-cash impairment charge primarily related to 101 7th Avenue, previously occupied by Barneys New York |
| • | For the twelve months ended December 31, 2020, Net Income was $44.9 million, or $0.26 per diluted share, compared to $239.4 million, or $1.43 per diluted share, for the same period in 2019 |
Nareit FFO
| • | For the three months ended December 31, 2020, Nareit Funds From Operations (“Nareit FFO”) was $129.5 million, or $0.76 per diluted share, compared to $168.5 million, or $1.00 per diluted share, for the same period in 2019. Items that impact fourth quarter Nareit FFO comparability include: |
| o | A $0.05 per diluted share write-off of previously-capitalized development pursuit costs; |
| o | A $0.02 per diluted share charge related to the termination of interest rate swap contracts associated with the repayment of the Company’s $265 million term loan; |
| o | Uncollectible lease income of $0.10 per diluted share and a $0.04 per diluted share write-off of straight line rents receivable, primarily related to uncollected rent due to the COVID-19 pandemic. For additional detail, please refer to pages 32 and 33 of the fourth quarter 2020 supplemental disclosure. |
| • | For the twelve months ended December 31, 2020, Nareit FFO was $502.0 million, or $2.95 per diluted share, compared to $654.4 million, or $3.89 per diluted share, for the same period in 2019. |
Core Operating Earnings
| • | For the three months ended December 31, 2020, Core Operating Earnings was $125.1 million, or $0.73 per diluted share, compared to $152.9 million, or $0.91 per diluted share, for the same period in 2019. |
| • | For the twelve months ended December 31, 2020, Core Operating Earnings was $505.2 million, or $2.97 per diluted share, compared to $611.7 million, or $3.64 per diluted share, for the same period in 2019. |
Portfolio Performance
Same Property NOI
| • | Fourth quarter same property Net Operating Income (“NOI”), excluding termination fees, declined by 10.5% compared to the same period in 2019. |
| o | The decline in same property NOI in the fourth quarter of 2020 was driven primarily by a higher rate of uncollectible lease income of $15.3 million in the same property pool due to the COVID-19 pandemic. |
| | |
| Supplemental Information | vi |
Leased Occupancy
| • | As of December 31, 2020, Regency’s wholly-owned portfolio plus its pro-rata share of co-investment partnerships, was 92.3% leased. |
| • | As of December 31, 2020, Regency’s same property portfolio was 92.9% leased, a decline of 60 basis points sequentially. |
| o | Within the same property portfolio, anchor percent leased, which includes spaces greater than or equal to 10,000 square feet, was 95.4%, a decline of 60 basis points sequentially. |
| o | Same property shop percent leased, which includes spaces less than 10,000 square feet, was 88.5%, a decline of 70 basis points sequentially. |
Leasing Activity
| • | For the three months ended December 31, 2020, Regency executed 1.7 million square feet of comparable new and renewal leases at blended rent spreads of +0.6%. |
| • | For the trailing twelve months, the Company executed 5.9 million square feet of comparable new and renewal leases at blended rents spreads of +2.2%. |
COVID-19 Update
| • | As of January 31, 2021, approximately 97% of the Company’s tenants were open based on pro-rata Annual Base Rent (“ABR”), although governmental restrictions on specific tenant businesses can change daily. |
| • | As of January 31, 2021, the Company had executed rent deferral agreements on over 1,600 leases, with total deferred rent of $40.8 million. |
| • | As of February 8, 2021, the Company collected 92% of fourth quarter pro-rata base rent, in addition to 1% subject to executed deferral agreements. |
| • | The Company also continues to make progress on second and third quarter receivables. As of February 8, 2021, the Company collected 79% and 89% of second and third quarter pro-rata base rent, respectively. The Company has also signed deferral agreements for 12% and 4%, respectively, of second and third quarter pro-rata base rent. |
| • | A “Business Update” presentation is posted on our website at investors.regencycenters.com, and includes additional information regarding COVID-19 impacts. |
Portfolio Enhancement and Capital Allocation
Developments and Redevelopments
| • | During 2020, the Company started over $124 million of development and redevelopment projects. |
| • | As of December 31, 2020, the Company had 14 properties in development or redevelopment with estimated net project costs of $319.3 million and an estimated $170 million of remaining costs to complete. |
| • | In-process developments and redevelopments were 88% leased as of December 31, 2020. |
| • | In the fourth quarter, Regency completed one development and two redevelopment projects with combined pro-rata costs of $29.8 million. |
| • | In light of the COVID-19 pandemic, the Company continues to evaluate the impacts to scope, timing, tenancy, and return on investment for all in-process and pipeline projects to determine the most appropriate strategy for each project. |
| o | As previously disclosed, as a result of this process and the decision not to pursue certain projects or components of projects, the Company wrote off certain previously-capitalized development pursuit costs of $7.9 million in the fourth quarter of 2020. |
| | |
| Supplemental Information | vii |
Property Transactions
| • | During the fourth quarter, the Company sold five shopping centers for a combined gross sales price of $77.8 million at Regency’s share, and non-income producing land for a combined gross sales price of $8.1 million at Regency’s share. |
| • | During the full year 2020, Regency sold eight shopping centers and income producing outparcels for a combined gross sales price of $190.8 million, at a weighted average cap rate of 5.7%. The Company’s full-year non-income producing land sales totals $18.6 million, at Regency’s share. |
| • | Subsequent to year-end, closed on the sale of one shopping center for a gross sales price of $9.0 million, and one non-income producing asset for $29.4 million, both at Regency’s share. |
Share Repurchase Program
| • | On February 3, 2021, Regency’s Board of Directors authorized the repurchase by Regency of up to $250 million of its common stock. This authorization is scheduled to expire on February 3, 2023, unless earlier terminated by the Board. The timing of share repurchases is dependent upon market conditions and other factors. |
Balance Sheet
| • | As of December 31, 2020, Regency had full capacity under its $1.2 billion revolving credit facility. |
| • | As of December 31, 2020, Regency’s pro-rata net debt-to-operating EBITDAre ratio was 6.0x. |
| • | On January 15, 2021, as previously disclosed, the Company repaid its $265 million term loan due January 2022 (the “Term Loan”) using cash available, leaving no unsecured debt maturities until 2024. |
Revolving Credit Facility
| • | Regency announced today its amended and restated unsecured revolving credit facility (the “Facility”), which closed on February 9, 2021. |
| • | The amendment and restatement maintains the size of the Facility at $1.25 billion and extends the maturity date to March 23, 2025, with options for Regency to extend the maturity for two additional six-month periods. |
| • | Borrowings will bear interest at an annual rate of LIBOR plus 87.5 basis points, subject to the continuation of the Company’s current credit ratings, in line with the previous facility. An annual facility fee of 15 basis points, subject to the Company’s credit ratings, applies to the entire $1.25 billion Facility. |
| • | To further Regency’s environmental, social, and governance (“ESG”) sustainability initiatives, the Company’s lenders have agreed that the margin for purposes of determining the interest rate on the Facility may be reduced by an additional 0.01% if, as of any fiscal year, a sustainability metric related to reduction in greenhouse gas (“GHG”) emissions is achieved. |
| • | The Facility is held by 13 U.S. and International banks. The syndication is led by Wells Fargo Securities, LLC and PNC Capital Markets LLC as Joint Bookrunners and Lead Arrangers. Wells Fargo Bank, National Association acts as Administrative Agent for the Facility and PNC Bank, National Association acts as Syndication Agent. U.S. Bank National Association, Truist Securities, Inc. and Regions Capital Markets, a division of Regions Bank, act as Joint Lead Arrangers and Documentation Agents. Bank of America, N.A., JPMorgan Chase Bank, N.A., and Mizuho Bank, Ltd. are Co-Documentation Agents. BMO Harris Bank, N.A., Bank of New York Mellon, Bank of Nova Scotia and TD Bank, N.A. act as Senior Managing Agents. Comerica Bank also participates in the Facility. |
Dividend
| • | On February 10, 2021, Regency’s Board of Directors declared a quarterly cash dividend on the Company’s common stock of $0.595 per share. The dividend is payable on April 6, 2021, to shareholders of record as of March 15, 2021. |
| | |
| Supplemental Information | viii |
2021 Guidance
Regency Centers offered initial 2021 guidance concurrently with the fourth quarter 2020 earnings release, as summarized below. Please refer to the fourth quarter 2020 Supplemental package for a complete list of guidance assumptions.
“While we are gratified to return to more customary guidance practices as transparency remains a key tenet of our values, we believe a wide range of potential outcomes is prudent given the uncertainty that remains in our operating environment,” said Mike Mas, EVP and Chief Financial Officer. “The potential outcomes can best be described as three independent scenarios, which each could result in different and distinct impacts to our Net Operating Income.”
| • | The lower end of our guidance range is based on a “reverse course” scenario, which assumes more shutdowns and increased restrictions, leading to a decline in rent collection rates. |
| • | The midpoint area of our range is based on a “status quo” scenario, which assumes a continuation of our fourth quarter 2020 same-property NOI and collection rates. |
| • | The higher end of our range is based on a “continued improvement” scenario, which assumes further lifting of restrictions and added federal stimulus, leading to increases in collection rates. |
Please refer to the Company’s “Business Update” presentation for additional guidance details, including a reconciliation of Nareit FFO per diluted share from 2020 to 2021, posted on the website at investors.regencycenters.com.
Full Year 2021 Guidance |
All figures pro-rata and in thousands, except per share data |
| |
Net Income Attributable to Common Stockholders per diluted share | $0.55 - $0.73 |
| |
| |
Nareit Funds From Operations (“Nareit FFO”) per diluted share | $2.96 - $3.14 |
| |
| |
Core Operating Earnings per diluted share* | $2.79 - $2.97 |
| |
| |
Same Property Net Operating Income ("SPNOI") Growth (ex. termination fees) | -1.0% - +2.5% |
| |
| |
Net G&A expense | $82,500 - $86,500 |
| |
| |
Net interest expense | $166,000 - $167,000 |
| |
| |
Rucurring third party fees & commissions | $23,000 - $24,000 |
| |
| |
Development and Redevelopment Spend | +/- $150,000 |
| |
| |
Acquisitions Cap rate (weighted average) | +/- $0 +/- 0.0% |
| |
| |
Dispositions Cap rate (weighted average) | +/- $150,000 5.5% - 6.0% (1) |
| |
*Core Operating Earnigns excludes certain non-cash items, including straight-line rents, above/below market rent amortization, and amortization of mark-to-market debt, as well as extinguishment charges.
| (1) | Average cap rate calculation excludes the sale of the non-income producing asset for $29.4 million in the first quarter. | |
| | |
| Supplemental Information | ix |
Conference Call Information
To discuss Regency’s fourth quarter results and provide further business updates related to COVID-19, management will host a conference call on Friday, February 12, 2021, at 12:00 p.m. ET. Dial-in and webcast information is listed below.
Fourth Quarter 2020 Earnings Conference Call
Date:Friday, February 12, 2021
Time:12:00 p.m. ET
Dial#:877-407-0789 or 201-689-8562
Webcast:investors.regencycenters.com
Replay
Webcast Archive: Investor Relations page under Events & Webcasts
Non-GAAP Disclosure
We believe these non-GAAP measures provide useful information to our Board of Directors, management and investors regarding certain trends relating to our financial condition and results of operations. Our management uses these non-GAAP measures to compare our performance to that of prior periods for trend analyses, purposes of determining management incentive compensation and budgeting, forecasting and planning purposes.
We do not consider non-GAAP measures an alternative to financial measures determined in accordance with GAAP. The principal limitation of these non-GAAP financial measures is they may exclude significant expense and income items that are required by GAAP to be recognized in our consolidated financial statements. In addition, they reflect the exercise of management’s judgment about which expense and income items are excluded or included in determining these non-GAAP financial measures. In order to compensate for these limitations, reconciliations of the non-GAAP financial measures we use to their most directly comparable GAAP measures are provided. Non-GAAP financial measures should not be relied upon in evaluating the financial condition, results of operations or future prospects of the Company.
Nareit FFO is a commonly used measure of REIT performance, which the National Association of Real Estate Investment Trusts (“Nareit”) defines as net income, computed in accordance with GAAP, excluding gains on sale and impairments of real estate, net of tax, plus depreciation and amortization, and after adjustments for unconsolidated partnerships and joint ventures. Regency computes Nareit FFO for all periods presented in accordance with Nareit's definition. Since Nareit FFO excludes depreciation and amortization and gains on sales and impairments of real estate, it provides a performance measure that, when compared year over year, reflects the impact on operations from trends in percent leased, rental rates, operating costs, acquisition and development activities, and financing costs. This provides a perspective of the Company’s financial performance not immediately apparent from net income determined in accordance with GAAP. Thus, Nareit FFO is a supplemental non-GAAP financial measure of the Company's operating performance, which does not represent cash generated from operating activities in accordance with GAAP; and, therefore, should not be considered a substitute measure of cash flows from operations. The Company provides a reconciliation of Net Income Attributable to Common Stockholders to Nareit FFO.
Core Operating Earnings is an additional performance measure that excludes from Nareit FFO: (i) transaction related income or expenses; (ii) gains or losses from the early extinguishment of debt; (iii) certain non-cash components of earnings derived from above and below market rent amortization, straight-line rents, and amortization of mark-to-market of debt adjustments; and (iv) other amounts as they occur. The Company provides a reconciliation of Net Income to Nareit FFO to Core Operating Earnings.
| | |
| Supplemental Information | x |
Reconciliation of Net Income Attributable to Common Stockholders to Nareit FFO and Core Operating
Earnings - Actual (in thousands)
For the Periods Ended December 31, 2020 and 2019 | | Three Months Ended | | | Year to Date | |
| | 2020 | | | 2019 | | | 2020 | | | 2019 | |
Reconciliation of Net Income to Nareit FFO: | | | | | | | | | | | | | | | | |
| | | | | | | | | | | | | | | | |
Net Income Attributable to Common Stockholders | | $ | 38,487 | | | | 40,291 | | | $ | 44,889 | | | | 239,430 | |
Adjustments to reconcile to Nareit Funds From Operations (1): | | | | | | | | | | | | | | | | |
Depreciation and amortization (excluding FF&E) | | | 94,289 | | | | 99,270 | | | | 375,865 | | | | 402,888 | |
Goodwill impairment | | | - | | | | - | | | | 132,128 | | | | - | |
Gain on sale of real estate | | | (21,228 | ) | | | (13,333 | ) | | | (69,879 | ) | | | (53,664 | ) |
Provision for impairment of real estate | | | 17,764 | | | | 42,076 | | | | 18,778 | | | | 65,074 | |
Exchangeable operating partnership units | | | 174 | | | | 178 | | | | 203 | | | | 634 | |
Nareit Funds From Operations | | $ | 129,486 | | | | 168,482 | | | $ | 501,984 | | | | 654,362 | |
| | | | | | | | | | | | | | | | |
| | | | | | | | | | | | | | | | |
Reconciliation of Nareit FFO to Core Operating Earnings: | | | | | | | | | | | | | | | | |
| | | | | | | | | | | | | | | | |
Nareit Funds From Operations | | $ | 129,486 | | | | 168,482 | | | $ | 501,984 | | | | 654,362 | |
Adjustments to reconcile to Core Operating Earnings (1): | | | | | | | | | | | | | | | | |
Early extinguishment of debt | | | 2,685 | | | | - | | | | 22,043 | | | | 11,982 | |
Interest on bonds for period from notice to redemption | | | - | | | | - | | | | - | | | | 367 | |
Straight line rent | | | (3,778 | ) | | | (3,082 | ) | | | (15,605 | ) | | | (15,526 | ) |
Uncollectible straight line rent | | | 7,681 | | | | 1,698 | | | | 39,255 | | | | 7,002 | |
Above/below market rent amortization, net | | | (10,860 | ) | | | (13,833 | ) | | | (41,293 | ) | | | (44,666 | ) |
Debt premium/discount amortization | | | (117 | ) | | | (395 | ) | | | (1,233 | ) | | | (1,776 | ) |
Core Operating Earnings | | $ | 125,097 | | | | 152,870 | | | $ | 505,151 | | | | 611,745 | |
| | | | | | | | | | | | | | | | |
| | | | | | | | | | | | | | | | |
Weighted Average Shares For Diluted Earnings per Share | | | 169,980 | | | | 167,892 | | | | 169,460 | | | | 167,771 | |
| | | | | | | | | | | | | | | | |
Weighted Average Shares For Diluted FFO and Core Operating Earnings per Share | | | 170,745 | | | | 168,638 | | | | 170,225 | | | | 168,235 | |
(1) | Includes Regency's consolidated entities and its pro-rata share of unconsolidated co-investment partnerships, net of pro-rata share attributable to noncontrolling interests. |
Same property NOI is a key non-GAAP measure used by management in evaluating the operating performance of Regency’s properties. The Company provides a reconciliation of Net Income Attributable to Common Stockholders to pro-rata same property NOI.
| | |
| Supplemental Information | xi |
Reconciliation of Net Income Attributable to Common Stockholders to Pro-Rata Same Property NOI – Actual (in thousands)
For the Periods Ended December 31, 2020 and 2019 | | Three Months Ended | | | Year to Date | |
| | 2020 | | | 2019 | | | 2020 | | | 2019 | |
Net Income Attributable to Common Stockholders | | $ | 38,487 | | | | 40,291 | | | $ | 44,889 | | | | 239,430 | |
Less: | | | | | | | | | | | | | | | | |
Management, transaction, and other fees | | | (7,417 | ) | | | (7,868 | ) | | | (26,501 | ) | | | (29,636 | ) |
Other(1) | | | (8,544 | ) | | | (16,811 | ) | | | (25,912 | ) | | | (58,904 | ) |
Plus: | | | | | | | | | | | | | | | | |
Depreciation and amortization | | | 86,739 | | | | 91,644 | | | | 345,900 | | | | 374,283 | |
General and administrative | | | 20,512 | | | | 18,262 | | | | 75,001 | | | | 74,984 | |
Other operating expense | | | 7,617 | | | | 3,328 | | | | 12,642 | | | | 7,814 | |
Other expense | | | 35,474 | | | | 71,860 | | | | 256,407 | | | | 187,610 | |
Equity in income of investments in real estate excluded from NOI (2) | | | 12,838 | | | | 8,109 | | | | 59,726 | | | | 39,807 | |
Net income attributable to noncontrolling interests | | | 729 | | | | 840 | | | | 2,428 | | | | 3,828 | |
NOI | | | 186,435 | | | | 209,655 | | | | 744,580 | | | | 839,216 | |
| | | | | | | | | | | | | | | | |
Less non-same property NOI (3) | | | (6,760 | ) | | | (10,245 | ) | | | (31,490 | ) | | | (38,150 | ) |
| | | | | | | | | | | | | | | | |
Same Property NOI | | $ | 179,675 | | | | 199,410 | | | $ | 713,090 | | | | 801,066 | |
| | | | | | | | | | | | | | | | |
Same Property NOI without Termination Fees | | $ | 177,437 | | | | 198,339 | | | $ | 705,420 | | | | 798,148 | |
| | | | | | | | | | | | | | | | |
Same Property NOI without Termination Fees or Redevelopments | | $ | 160,973 | | | | 180,163 | | | $ | 640,152 | | | | 722,090 | |
(1) | Includes straight-line rental income and expense, net of reserves, above and below market rent amortization, other fees, and noncontrolling interests. |
(2) | Includes non-NOI expenses incurred at our unconsolidated real estate partnerships, such as, but not limited to, straight-line rental income, above and below market rent amortization, depreciation and amortization, interest expense, and real estate gains and impairments. |
(3) | Includes revenues and expenses attributable to Non-Same Property, Projects in Development, corporate activities, and noncontrolling interests. |
Reported results are preliminary and not final until the filing of the Company’s Form 10-K with the SEC and, therefore, remain subject to adjustment.
The Company has published forward-looking statements and additional financial information in its fourth quarter 2020 supplemental information package that may help investors estimate earnings for 2021. A copy of the Company’s fourth quarter 2020 supplemental information will be available on the Company's website at https://investors.regencycenters.com/ or by written request to: Investor Relations, Regency Centers Corporation, One Independent Drive, Suite 114, Jacksonville, Florida, 32202. The supplemental information package contains more detailed financial and property results including financial statements, an outstanding debt summary, acquisition and development activity, investments in partnerships, information pertaining to securities issued other than common stock, property details, a significant tenant rent report and a lease expiration table in addition to earnings and valuation guidance assumptions. The information provided in the supplemental package is unaudited and includes non-GAAP measures, and there can be no assurance that the information will not vary from the final information in the Company’s Form 10-K for the year-ended December 31, 2020. Regency may, but assumes no obligation to, update information in the supplemental package from time to time.
About Regency Centers Corporation (NASDAQ: REG)
Regency Centers is the preeminent national owner, operator, and developer of shopping centers located in affluent and densely populated trade areas. Our portfolio includes thriving properties merchandised with highly productive grocers, restaurants, service providers, and best-in-class retailers that connect to their neighborhoods, communities, and customers. Operating as a fully integrated real estate company, Regency Centers is a qualified real estate investment trust (REIT) that is self-administered, self-managed, and an S&P 500 Index member. For more information, please visit RegencyCenters.com.
###
| | |
| Supplemental Information | xii |
Forward-Looking Statements
Certain statements in this document regarding anticipated financial, business, legal or other outcomes including business and market conditions, outlook and other similar statements relating to Regency’s future events, developments, or financial or operational performance or results such as our 2021 Guidance, are “forward-looking statements” made pursuant to the safe harbor provisions of the Private Securities Litigation Reform Act of 1995 and other federal securities laws. These forward-looking statements are identified by the use of words such as “may,” “will,” “should,” “expect,” “estimate,” “believe,” “intend,” “forecast,” “anticipate,” “guidance,” and other similar language. However, the absence of these or similar words or expressions does not mean a statement is not forward-looking. While we believe these forward-looking statements are reasonable when made, forward-looking statements are not guarantees of future performance or events and undue reliance should not be placed on these statements. Although we believe the expectations reflected in any forward-looking statements are based on reasonable assumptions, we can give no assurance these expectations will be attained, and it is possible actual results may differ materially from those indicated by these forward-looking statements due to a variety of risks and uncertainties.
Our operations are subject to a number of risks and uncertainties including, but not limited to, those risk factors described in our SEC filings. When considering an investment in our securities, you should carefully read and consider these risks, together with all other information in our Annual Reports on Form 10-K, Quarterly Reports on Form 10-Q and our other filings and submissions to the SEC. If any of the events described in the risk factors actually occur, our business, financial condition or operating results, as well as the market price of our securities, could be materially adversely affected. Forward-looking statements are only as of the date they are made, and Regency undertakes no duty to update its forward-looking statements except as required by law. These risks and events include, without limitation:
Risk Factors
Risk Factors Related to the COVID-19 Pandemic
Pandemics or other health crises, such as the COVID-19 pandemic, may adversely affect our tenants’ financial condition, the profitability of our properties, and our access to the capital markets and could have a material adverse effect on our business, results of operations, cash flows and financial condition.
Risk Factors Related to Operating Retail-Based Shopping Centers
Economic and market conditions may adversely affect the retail industry and consequently reduce our revenues and cash flow, and increase our operating expenses. Shifts in retail trends, sales, and delivery methods between brick and mortar stores, e-commerce, home delivery, and curbside pick-up may adversely impact our revenues and cash flows. Changing economic and retail market conditions in geographic areas where our properties are concentrated may reduce our revenues and cash flow. Our success depends on the continued presence and success of our “anchor” tenants. A significant percentage of our revenues are derived from smaller “shop space” tenants and our net income may be adversely impacted if our smaller shop tenants are not successful. We may be unable to collect balances due from tenants in bankruptcy. Many of our costs and expenses associated with operating our properties may remain constant or increase, even if our lease income decreases. Compliance with the Americans with the Disabilities Act and fire, safety and other regulations may have a negative effect on us.
Risk Factors Related to Real Estate Investments
Our real estate assets may decline in value and be subject to impairment losses which may reduce our net income. We face risks associated with development, redevelopment and expansion of properties.
We face risks associated with the development of mixed-use commercial properties. We face risks associated with the acquisition of properties. We may be unable to sell properties when desired because of market conditions. Changes in tax laws could impact our acquisition or disposition of real estate.
| | |
| Supplemental Information | xiii |
Risk Factors Related to the Environment Affecting Our Properties
Climate change may adversely impact our properties directly, and may lead to additional compliance obligations and costs as well as additional taxes and fees. Geographic concentration of our properties makes our business more vulnerable to natural disasters, severe weather conditions and climate change. Costs of environmental remediation may impact our financial performance and reduce our cash flow.
Risk Factors Related to Corporate Matters
An uninsured loss or a loss that exceeds the insurance coverage on our properties may subject us to loss of capital and revenue on those properties. Failure to attract and retain key personnel may adversely affect our business and operations. The unauthorized access, use, theft or destruction of tenant or employee personal, financial or other data or of Regency’s proprietary or confidential information stored in our information systems or by third parties on our behalf could impact our reputation and brand and expose us to potential liability and loss of revenues.
Risk Factors Related to Our Partnerships and Joint Ventures
We do not have voting control over all of the properties owned in our co-investment partnerships and joint ventures, so we are unable to ensure that our objectives will be pursued. The termination of our partnerships may adversely affect our cash flow, operating results, and our ability to make distributions to stock and unit holders.
Risk Factors Related to Funding Strategies and Capital Structure
Our ability to sell properties and fund acquisitions and developments may be adversely impacted by higher market capitalization rates and lower NOI at our properties which may dilute earnings. We depend on external sources of capital, which may not be available in the future on favorable terms or at all. Our debt financing may adversely affect our business and financial condition. Covenants in our debt agreements may restrict our operating activities and adversely affect our financial condition. Increases in interest rates would cause our borrowing costs to rise and negatively impact our results of operations. Hedging activity may expose us to risks, including the risks that a counterparty will not perform and that the hedge will not yield the economic benefits we anticipate, which may adversely affect us. The interest rates on our Unsecured Credit facilities as well as on our variable rate mortgages and interest rate swaps might change based on changes to the method in which LIBOR or its replacement rate is determined.
Risk Factors Related to the Market Price for Our Securities
Changes in economic and market conditions may adversely affect the market price of our securities. There is no assurance that we will continue to pay dividends at historical rates.
Risk Factors Relating to the Company’s Qualification as a REIT
If the Parent Company fails to qualify as a REIT for federal income tax purposes, it would be subject to federal income tax at regular corporate rates. Dividends paid by REITs generally do not qualify for reduced tax rates. Certain foreign stockholders may be subject to U.S. federal income tax on gain recognized on a disposition of our common stock if we do not qualify as a “domestically controlled” REIT.
Legislative or other actions affecting REITs may have a negative effect on us. Complying with REIT requirements may limit our ability to hedge effectively and may cause us to incur tax liabilities.
Risks Related to the Company’s Common Stock
Restrictions on the ownership of the Parent Company’s capital stock to preserve its REIT status may delay or prevent a change in control. The issuance of the Parent Company's capital stock may delay or prevent a change in control. Ownership in the Parent Company may be diluted in the future.
| | |
| Supplemental Information | xiv |
Summary Financial Information
December 31, 2020
(in thousands, except per share data)
| | Three Months Ended | | Year to Date |
| | 2020 | | 2019 | | 2020 | | 2019 |
Financial Results | | | | | | | | |
| | | | | | | | |
Net income attributable to common stockholders (page 4) | | $38,487 | | $40,291 | | $44,889 | | $239,430 |
Net income per diluted share | | $0.23 | | $0.24 | | $0.26 | | $1.43 |
| | | | | | | | |
Nareit Funds From Operations (Nareit FFO) (page 9) | | $129,486 | | $168,482 | | $501,984 | | $654,362 |
Nareit FFO per diluted share | | $0.76 | | $1.00 | | $2.95 | | $3.89 |
| | | | | | | | |
Core Operating Earnings (page 9) | | $125,097 | | $152,870 | | $505,151 | | $611,745 |
Core Operating Earnings per diluted share | | $0.73 | | $0.91 | | $2.97 | | $3.64 |
| | | | | | | | |
Same Property NOI without termination fees (page 8) | | $177,437 | | $198,339 | | $705,420 | | $798,148 |
% growth | | -10.5% | | | | -11.6% | | |
| | | | | | | | |
Operating EBITDAre (page 10) | | $170,898 | | $199,613 | | $693,648 | | $798,568 |
| | | | | | | | |
Dividends declared per share and unit | | $0.595 | | $0.585 | | $2.380 | | $2.340 |
Payout ratio of Core Operating Earnings per share (diluted) | | 81.5% | | 64.3% | | 80.1% | | 64.3% |
| | | | | | | | |
| | | | | | | | |
Diluted share and unit count | | | | | | | | |
| | | | | | | | |
Weighted average shares (diluted) - Net income | | 169,980 | | 167,892 | | 169,460 | | 167,771 |
Weighted average shares (diluted) - Nareit FFO and Core Operating Earnings | | 170,745 | | 168,638 | | 170,225 | | 168,235 |
_________________________________________________________________________________________________
| | As of | | As of | | As of | | As of |
| | 12/31/2020 | | 12/31/2019 | | 12/31/2018 | | 12/31/2017 |
Capital Information | | | | | | | | |
| | | | | | | | |
Market price per common share | | $45.59 | | $63.09 | | $58.47 | | $69.18 |
| | | | | | | | |
Common shares outstanding | | 169,680 | | 167,571 | | 167,905 | | 171,365 |
Exchangeable units held by noncontrolling interests | | 765 | | 746 | | 350 | | 350 |
Common shares and equivalents issued and outstanding | | 170,445 | | 168,317 | | 168,255 | | 171,715 |
Market equity value of common and convertible shares | | $7,770,596 | | $10,619,161 | | $9,837,840 | | $11,879,231 |
| | | | | | | | |
Outstanding debt | | $4,457,742 | | $4,445,591 | | $4,241,758 | | $4,115,588 |
Less: cash | | (378,450) | | (115,562) | | (45,190) | | (49,381) |
Net debt | | $4,079,292 | | $4,330,029 | | $4,196,568 | | $4,066,207 |
| | | | | | | | |
Total market capitalization | | $11,849,888 | | $14,949,190 | | $14,034,408 | | $15,945,438 |
| | | | | | | | |
| | | | | | | | |
Debt metrics (pro-rata; trailing 12 months "TTM") | | | | | | | | |
| | | | | | | | |
Net Debt-to-Operating EBITDAre | | 6.0x | | 5.4x | | 5.3x | | 5.4x |
Fixed charge coverage | | 3.6x | | 4.3x | | 4.2x | | 4.1x |
| | |

| Supplemental Information | 1 |
Summary Real Estate Information
December 31, 2020
(GLA in thousands)
Wholly Owned and 100% of Co-investment Partnerships | | 12/31/2020 | | | 9/30/2020 | | | 6/30/2020 | | | 3/31/2020 | | | 12/31/2019 | |
Number of properties | | 411 | | | 414 | | | 415 | | | 416 | | | 419 | |
Number of retail operating properties | | 403 | | | 407 | | | 407 | | | 408 | | | 412 | |
Number of same properties | | 393 | | | 398 | | | 398 | | | 399 | | | 396 | |
Number of properties in redevelopment | | 11 | | | 12 | | | 14 | | | 16 | | | 19 | |
Number of properties in development (1) | | 3 | | | 2 | | | 3 | | | 3 | | | 3 | |
| | | | | | | | | | | | | | | | | | | | |
| | | | | | | | | | | | | | | | | | | | |
Gross Leasable Area (GLA) - All properties | | | 51,912 | | | | 52,155 | | | | 52,181 | | | | 52,226 | | | | 52,607 | |
GLA including retailer-owned stores - All properties | | | 56,000 | | | | 56,243 | | | | 56,269 | | | | 56,314 | | | | 56,695 | |
GLA - Retail operating properties | | | 51,048 | | | | 51,238 | | | | 51,238 | | | | 51,284 | | | | 52,109 | |
GLA - Same properties | | | 49,635 | | | | 50,043 | | | | 50,043 | | | | 50,089 | | | | 49,892 | |
GLA - Properties in redevelopment (2) | | | 2,929 | | | | 3,062 | | | | 3,434 | | | | 3,736 | | | | 4,515 | |
GLA - Properties in development (1) | | | 281 | | | | 188 | | | | 215 | | | | 215 | | | | 215 | |
| | | | | | | | | | | | | | | | | | | | |
| | | | | | | | | | | | | | | | | | | | |
Wholly Owned and Pro-Rata Share of Co-investment Partnerships | | | | | | | | | | | | | | | | | | | | |
GLA - All properties | | | 42,242 | | | | 42,423 | | | | 42,449 | | | | 42,496 | | | | 42,769 | |
GLA including retailer-owned stores - All properties | | | 46,330 | | | | 46,511 | | | | 46,537 | | | | 46,584 | | | | 46,857 | |
GLA - Retail operating properties | | | 41,540 | | | | 41,580 | | | | 41,580 | | | | 41,626 | | | | 42,334 | |
GLA - Same properties (3) | | | 40,228 | | | | 40,278 | | | | 40,278 | | | | 40,276 | | | | 40,277 | |
Spaces > 10,000 sf (3) | | | 25,314 | | | | 25,369 | | | | 25,361 | | | | 25,353 | | | | 25,367 | |
Spaces < 10,000 sf (3) | | | 14,915 | | | | 14,909 | | | | 14,917 | | | | 14,923 | | | | 14,910 | |
GLA - Properties in redevelopment (2) | | | 2,777 | | | | 2,851 | | | | 3,167 | | | | 3,384 | | | | 3,976 | |
GLA - Properties in development (1) | | | 228 | | | | 124 | | | | 145 | | | | 136 | | | | 134 | |
| | | | | | | | | | | | | | | | | | | | |
| | | | | | | | | | | | | | | | | | | | |
% leased - All properties | | 92.3% | | | 92.9% | | | 93.9% | | | 94.5% | | | 94.8% | |
% leased - Retail operating properties | | 92.9% | | | 93.5% | | | 94.5% | | | 95.0% | | | 95.0% | |
% leased - Same properties (3) | | 92.9% | | | 93.5% | | | 94.5% | | | 95.0% | | | 95.1% | |
Spaces > 10,000 sf (3) | | 95.4% | | | 96.0% | | | 97.0% | | | 97.1% | | | 97.2% | |
Spaces < 10,000 sf (3) | | 88.5% | | | 89.2% | | | 90.3% | | | 91.4% | | | 91.5% | |
Average % leased - Same properties (3) | | 94.2% | | | 94.6% | | | 94.9% | | | 95.1% | | | 95.2% | |
% commenced - Same properties (3) (4) | | 91.1% | | | 91.5% | | | 92.6% | | | 92.9% | | | 92.9% | |
| | | | | | | | | | | | | | | | | | | | |
| | | | | | | | | | | | | | | | | | | | |
Same property NOI growth - YTD (see page 8) | | -11.0% | | | -11.3% | | | -9.6% | | | 0.2% | | | 2.3% | |
Same property NOI growth without termination fees - YTD (see page 8) | | -11.6% | | | -11.9% | | | -10.3% | | | -0.7% | | | 2.1% | |
Same property NOI growth without termination fees or redevelopments - YTD (see page 8) | | -11.3% | | | -11.5% | | | -10.2% | | | -0.9% | | | 2.0% | |
Rent spreads - Trailing 12 months (5) (see page 19) | | 2.2% | | | 5.7% | | | 7.0% | | | 7.4% | | | 8.5% | |
| | | | | | | | | | | | | | | | | | | | |
(1) | Includes current ground up developments. |
(2) | Represents entire center GLA rather than redevelopment portion only. Included in Same Property pool unless noted otherwise. |
(3) | Prior periods adjusted for current same property pool. |
(4) | Excludes leases that are signed but have not yet commenced. |
(5) | Retail operating properties only. Rent spreads are calculated on a comparable-space, cash basis for new and renewal leases executed. |
| | |
| Supplemental Information | 2 |
Consolidated Balance Sheets
December 31, 2020 and 2019
(in thousands)
| | 2020 | | | 2019 | |
| | (unaudited) | | | | | |
Assets | | | | | | | | |
Net real estate investments: | | | | | | | | |
Real estate assets at cost | | $ | 11,101,858 | | | $ | 11,095,294 | |
Less: accumulated depreciation | | | 1,994,108 | | | | 1,766,162 | |
| | | 9,107,750 | | | | 9,329,132 | |
Investments in real estate partnerships | | | 467,155 | | | | 469,522 | |
Net real estate investments | | | 9,574,905 | | | | 9,798,654 | |
| | | | | | | | |
Properties held for sale | | | 33,934 | | | | 45,565 | |
Cash, cash equivalents, and restricted cash | | | 378,450 | | | | 115,562 | |
Tenant and other receivables (1) | | | 143,633 | | | | 169,337 | |
Deferred leasing costs, net | | | 67,910 | | | | 76,798 | |
Acquired lease intangible assets, net | | | 188,799 | | | | 242,822 | |
Right of use assets | | | 287,827 | | | | 292,786 | |
Other assets | | | 261,446 | | | | 390,729 | |
| | | | | | | | |
Total assets | | $ | 10,936,904 | | | $ | 11,132,253 | |
| | | | | | | | |
| | | | | | | | |
Liabilities and Equity | | | | | | | | |
Liabilities: | | | | | | | | |
Notes payable | | $ | 3,658,405 | | | $ | 3,435,161 | |
Unsecured credit facilities | | | 264,679 | | | | 484,383 | |
Total notes payable | | | 3,923,084 | | | | 3,919,544 | |
| | | | | | | | |
Accounts payable and other liabilities | | | 302,361 | | | | 213,705 | |
Acquired lease intangible liabilities, net | | | 377,712 | | | | 427,260 | |
Lease liabilities | | | 220,390 | | | | 222,918 | |
Tenants' security, escrow deposits, and prepaid rent | | | 55,210 | | | | 58,865 | |
Total liabilities | | | 4,878,757 | | | | 4,842,292 | |
| | | | | | | | |
Equity: | | | | | �� | | | |
Stockholders' Equity: | | | | | | | | |
Common stock, $.01 par | | | 1,697 | | | | 1,676 | |
Additional paid in capital | | | 7,767,646 | | | | 7,631,731 | |
Accumulated other comprehensive (loss) | | | (18,625 | ) | | | (11,997 | ) |
Distributions in excess of net income | | | (1,765,806 | ) | | | (1,408,062 | ) |
Total stockholders' equity | | | 5,984,912 | | | | 6,213,348 | |
Noncontrolling Interests: | | | | | | | | |
Exchangeable operating partnership units | | | 35,727 | | | | 36,100 | |
Limited partners' interest | | | 37,508 | | | | 40,513 | |
Total noncontrolling interests | | | 73,235 | | | | 76,613 | |
Total equity | | | 6,058,147 | | | | 6,289,961 | |
| | | | | | | | |
Total liabilities and equity | | $ | 10,936,904 | | | $ | 11,132,253 | |
| (1) | For additional details, see Supplemental COVID-19 Disclosure on pages 39 and 40. | |
These consolidated balance sheets should be read in conjunction with the Company's most recent Form 10-Q and Form 10-K filed with the Securities and Exchange Commission.
| | |
| Supplemental Information | 3 |
Consolidated Statements of Operations
For the Periods Ended December 31, 2020 and 2019
(in thousands)
(unaudited)
| | Three Months Ended | | | Year to Date | |
| | 2020 | | | 2019 | | | 2020 | | | 2019 | |
Revenues: | | | | | | | | | | | | | | | | |
Lease income (1) | | $ | 248,536 | | | | 278,619 | | | $ | 980,166 | | | | 1,094,301 | |
Other property income | | | 2,507 | | | | 2,245 | | | | 9,508 | | | | 9,201 | |
Management, transaction, and other fees | | | 7,417 | | | | 7,868 | | | | 26,501 | | | | 29,636 | |
Total revenues | | | 258,460 | | | | 288,732 | | | | 1,016,175 | | | | 1,133,138 | |
| | | | | | | | | | | | | | | | |
Operating Expenses: | | | | | | | | | | | | | | | | |
Depreciation and amortization | | | 86,739 | | | | 91,644 | | | | 345,900 | | | | 374,283 | |
Operating and maintenance | | | 46,327 | | | | 44,817 | | | | 170,073 | | | | 169,909 | |
General and administrative | | | 20,512 | | | | 18,262 | | | | 75,001 | | | | 74,984 | |
Real estate taxes | | | 34,386 | | | | 34,973 | | | | 143,004 | | | | 136,236 | |
Other operating expense | | | 7,617 | | | | 3,328 | | | | 12,642 | | | | 7,814 | |
Total operating expenses | | | 195,581 | | | | 193,024 | | | | 746,620 | | | | 763,226 | |
| | | | | | | | | | | | | | | | |
Other Expense (Income): | | | | | | | | | | | | | | | | |
Interest expense, net | | | 38,073 | | | | 38,086 | | | | 156,678 | | | | 151,264 | |
Goodwill impairment | | | - | | | | - | | | | 132,128 | | | | - | |
Provision for impairment of real estate, net of tax | | | 17,522 | | | | 42,076 | | | | 18,536 | | | | 54,174 | |
Gain on sale of real estate, net of tax | | | (18,775 | ) | | | (6,423 | ) | | | (67,465 | ) | | | (24,242 | ) |
Early extinguishment of debt | | | 2,479 | | | | - | | | | 21,837 | | | | 11,982 | |
Net investment (income) | | | (3,825 | ) | | | (1,879 | ) | | | (5,307 | ) | | | (5,568 | ) |
Total other expense | | | 35,474 | | | | 71,860 | | | | 256,407 | | | | 187,610 | |
| | | | | | | | | | | | | | | | |
Income from operations before equity in income of | | | | | | | | | | | | | | | | |
investments in real estate partnerships | | | 27,405 | | | | 23,848 | | | | 13,148 | | | | 182,302 | |
| | | | | | | | | | | | | | | | |
Equity in income of investments in real estate partnerships | | | 11,811 | | | | 17,283 | | | | 34,169 | | | | 60,956 | |
| | | | | | | | | | | | | | | | |
Net income | | | 39,216 | | | | 41,131 | | | | 47,317 | | | | 243,258 | |
| | | | | | | | | | | | | | | | |
Noncontrolling Interests: | | | | | | | | | | | | | | | | |
Exchangeable operating partnership units | | | (174 | ) | | | (178 | ) | | | (203 | ) | | | (634 | ) |
Limited partners' interests in consolidated partnerships | | | (555 | ) | | | (662 | ) | | | (2,225 | ) | | | (3,194 | ) |
Income attributable to noncontrolling interests | | | (729 | ) | | | (840 | ) | | | (2,428 | ) | | | (3,828 | ) |
| | | | | | | | | | | | | | | | |
Net income attributable to common stockholders | | $ | 38,487 | | | | 40,291 | | | $ | 44,889 | | | | 239,430 | |
| (1) | For additional details, see Supplemental COVID-19 Disclosure on pages 39 and 40. | |
These consolidated statements of operations should be read in conjunction with the Company's most recent Form 10-Q and Form 10-K filed with the Securities and Exchange Commission.
| | |
| Supplemental Information | 4 |
Supplemental Details of Operations (Consolidated Only)
For the Periods Ended December 31, 2020 and 2019
(in thousands)
| | | Three Months Ended | | | Year to Date | |
| | | 2020 | | | 2019 | | | 2020 | | | 2019 | |
| Revenues: | | | | | | | | | | | | | | | | |
* | Base rent | | $ | 191,487 | | | | 195,857 | | | $ | 772,288 | | | | 777,992 | |
* | Recoveries from tenants | | | 60,784 | | | | 63,519 | | | | 246,915 | | | | 246,968 | |
* | Percentage rent | | | 885 | | | | 1,587 | | | | 6,163 | | | | 7,536 | |
* | Termination Fees | | | 1,366 | | | | 729 | | | | 5,176 | | | | 2,582 | |
* | Uncollectible lease income | | | (16,376 | ) | | | (1,727 | ) | | | (82,367 | ) | | | (5,394 | ) |
* | Other lease income | | | 2,539 | | | | 2,831 | | | | 8,725 | | | | 9,706 | |
| Straight line rent on lease income | | | (3,261 | ) | | | 1,764 | | | | (18,953 | ) | | | 9,519 | |
| Above/below market rent amortization | | | 11,112 | | | | 14,059 | | | | 42,219 | | | | 45,392 | |
| Lease income (1) | | | 248,536 | | | | 278,619 | | | | 980,166 | | | | 1,094,301 | |
| | | | | | | | | | | | | | | | | |
* | Other property income | | | 2,507 | | | | 2,245 | | | | 9,508 | | | | 9,201 | |
| | | | | | | | | | | | | | | | | |
| Property management fees | | | 3,614 | | | | 3,667 | | | | 14,444 | | | | 14,744 | |
| Asset management fees | | | 1,713 | | | | 1,795 | | | | 6,963 | | | | 7,135 | |
| Leasing commissions and other fees | | | 2,090 | | | | 2,406 | | | | 5,094 | | | | 7,757 | |
| Management, transaction, and other fees | | | 7,417 | | | | 7,868 | | | | 26,501 | | | | 29,636 | |
| | | | | | | | | | | | | | | | | |
| Total revenues | | | 258,460 | | | | 288,732 | | | | 1,016,175 | | | | 1,133,138 | |
| | | | | | | | | | | | | | | | | |
| Operating Expenses: | | | | | | | | | | | | | | | | |
| Depreciation and amortization (including FF&E) | | | 86,739 | | | | 91,644 | | | | 345,900 | | | | 374,283 | |
| | | | | | | | | | | | | | | | | |
* | Operating and maintenance | | | 42,442 | | | | 41,093 | | | | 154,600 | | | | 153,714 | |
* | Ground rent | | | 2,841 | | | | 2,896 | | | | 11,304 | | | | 12,169 | |
* | Termination expense | | | 188 | | | | - | | | | 713 | | | | 520 | |
| Straight line rent on ground rent | | | 437 | | | | 441 | | | | 1,777 | | | | 1,981 | |
| Above/below market ground rent amortization | | | 419 | | | | 387 | | | | 1,679 | | | | 1,525 | |
| Operating and maintenance | | | 46,327 | | | | 44,817 | | | | 170,073 | | | | 169,909 | |
| | | | | | | | | | | | | | | | | |
| Gross general & administrative | | | 17,012 | | | | 21,804 | | | | 66,207 | | | | 73,895 | |
| Stock-based compensation | | | 3,284 | | | | 4,128 | | | | 14,248 | | | | 16,254 | |
| Capitalized direct development compensation costs | | | (3,096 | ) | | | (9,312 | ) | | | (10,238 | ) | | | (20,429 | ) |
| General & administrative, net | | | 17,200 | | | | 16,620 | | | | 70,217 | | | | 69,720 | |
| Loss on deferred compensation plan (2) | | | 3,312 | | | | 1,642 | | | | 4,784 | | | | 5,264 | |
| General & administrative | | | 20,512 | | | | 18,262 | | | | 75,001 | | | | 74,984 | |
| | | | | | | | | | | | | | | | | |
* | Real estate taxes | | | 34,386 | | | | 34,973 | | | | 143,004 | | | | 136,236 | |
| | | | | | | | | | | | | | | | | |
| Other expenses | | | (277 | ) | | | 1,627 | | | | 2,172 | | | | 5,277 | |
| Development pursuit costs | | | 7,894 | | | | 1,701 | | | | 10,470 | | | | 2,537 | |
| Other operating expenses | | | 7,617 | | | | 3,328 | | | | 12,642 | | | | 7,814 | |
| | | | | | | | | | | | | | | | | |
| Total operating expenses | | | 195,581 | | | | 193,024 | | | | 746,620 | | | | 763,226 | |
| | | | | | | | | | | | | | | | | |
| Other Expense (Income): | | | | | | | | | | | | | | | | |
| Gross interest expense | | | 37,607 | | | | 36,791 | | | | 153,794 | | | | 145,490 | |
| Derivative amortization | | | 110 | | | | 1,650 | | | | 4,329 | | | | 7,564 | |
| Debt cost amortization | | | 1,476 | | | | 1,354 | | | | 5,782 | | | | 5,280 | |
| Debt premium/discount amortization | | | (127 | ) | | | (405 | ) | | | (1,272 | ) | | | (1,809 | ) |
| Capitalized interest | | | (765 | ) | | | (1,103 | ) | | | (4,355 | ) | | | (4,192 | ) |
| Interest income | | | (228 | ) | | | (201 | ) | | | (1,600 | ) | | | (1,069 | ) |
| Interest expense, net | | | 38,073 | | | | 38,086 | | | | 156,678 | | | | 151,264 | |
| | | | | | | | | | | | | | | | | |
| Provision for impairment of real estate, net of tax | | | 17,522 | | | | 42,076 | | | | 18,536 | | | | 54,174 | |
| Goodwill impairment | | | - | | | | - | | | | 132,128 | | | | - | |
| Gain on sale of real estate, net of tax | | | (18,775 | ) | | | (6,423 | ) | | | (67,465 | ) | | | (24,242 | ) |
| Early extinguishment of debt | | | 2,479 | | | | - | | | | 21,837 | | | | 11,982 | |
| Net investment (income) (2) | | | (3,825 | ) | | | (1,879 | ) | | | (5,307 | ) | | | (5,568 | ) |
| | | | | | | | | | | | | | | | | |
| Total other expense (income) | | | 35,474 | | | | 71,860 | | | | 256,407 | | | | 187,610 | |
| * | Component of Net Operating Income | |
| (1) | For additional details, see Supplemental COVID-19 Disclosure on pages 39 and 40. | |
| (2) | The change in value of participant obligations within Regency’s non-qualified deferred compensation plan is included in General and administrative expense. The expense is offset by unrealized gains of assets held in the pain which is included in Net investment income. | |
These consolidated supplemental details of operations should be read in conjunction with the Company’s most recent Form 10-Q and Form 10-K filed with the Securities and Exchange Commission.
| | |
| Supplemental Information | 5 |
Supplemental Details of Assets and Liabilities (Real Estate Partnerships Only)
December 31, 2020 and 2019
(in thousands)
| | Noncontrolling Interests | | | Share of JVs | |
| | 2020 | | | 2019 | | | 2020 | | | 2019 | |
Assets | | | | | | | | | | | | | | | | |
Real estate assets at cost | | $ | (88,130 | ) | | | (93,476 | ) | | $ | 1,389,171 | | | | 1,366,504 | |
Less: accumulated depreciation | | | (15,252 | ) | | | (14,264 | ) | | | 438,374 | | | | 413,833 | |
Net real estate investments | | | (72,878 | ) | | | (79,212 | ) | | | 950,797 | | | | 952,671 | |
| | | | | | | | | | | | | | | | |
Cash, cash equivalents, and restricted cash | | | (2,676 | ) | | | (2,941 | ) | | | 21,588 | | | | 12,202 | |
Tenant and other receivables (1) | | | (2,213 | ) | | | (2,333 | ) | | | 23,133 | | | | 25,224 | |
Deferred leasing costs, net | | | (1,017 | ) | | | (1,157 | ) | | | 14,856 | | | | 15,436 | |
Acquired lease intangible assets, net | | | (540 | ) | | | (747 | ) | | | 9,440 | | | | 11,230 | |
Right of use assets | | | (1,649 | ) | | | (1,699 | ) | | | 5,487 | | | | 5,705 | |
Other assets | | | (68 | ) | | | (147 | ) | | | 18,854 | | | | 17,545 | |
| | | | | | | | | | | | | | | | |
Total assets | | $ | (81,041 | ) | | | (88,236 | ) | | $ | 1,044,156 | | | | 1,040,013 | |
| | | | | | | | | | | | | | | | |
| | | | | | | | | | | | | | | | |
Liabilities | | | | | | | | | | | | | | | | |
Notes payable | | $ | (37,461 | ) | | | (42,803 | ) | | $ | 534,658 | | | | 526,048 | |
Accounts payable and other liabilities | | | (3,704 | ) | | | (2,359 | ) | | | 24,588 | | | | 24,128 | |
Acquired lease intangible liabilities, net | | | (193 | ) | | | (290 | ) | | | 9,183 | | | | 11,606 | |
Lease liabilities | | | (1,903 | ) | | | (1,909 | ) | | | 4,387 | | | | 4,447 | |
Tenants' security, escrow deposits, and prepaid rent | | | (272 | ) | | | (362 | ) | | | 4,185 | | | | 4,262 | |
| | | | | | | | | | | | | | | | |
Total liabilities | | $ | (43,533 | ) | | | (47,723 | ) | | $ | 577,001 | | | | 570,491 | |
(1) | For additional details, see Supplemental COVID-19 Disclosure on pages 39 and 40. | |
Note
Noncontrolling interests represent limited partners' interests in consolidated partnerships' activities and Share of JVs represents the Company's share of co-investment partnerships' activities, of which each are included on a single line presentation in the Company's consolidated financial statements in accordance with GAAP.
| | |
| Supplemental Information | 6 |
Supplemental Details of Operations (Real Estate Partnerships Only)
For the Periods Ended December 31, 2020 and 2019
(in thousands)
| | | Noncontrolling Interests | | | Share of JVs | |
| | | Three Months Ended | | | Year to Date | | | Three Months Ended | | | Year to Date | |
| | | 2020 | | | 2019 | | | 2020 | | | 2019 | | | 2020 | | | 2019 | | | 2020 | | | 2019 | |
| Revenues: | | | | | | | | | | | | | | | | | | | | | | | | | | | | | | | | |
* | Base rent | | $ | (1,777 | ) | | | (2,005 | ) | | $ | (7,177 | ) | | | (8,218 | ) | | $ | 26,281 | | | | 26,438 | | | $ | 105,789 | | | | 104,501 | |
* | Recoveries from tenants | | | (539 | ) | | | (594 | ) | | | (2,070 | ) | | | (2,470 | ) | | | 8,580 | | | | 8,676 | | | | 33,599 | | | | 33,698 | |
* | Percentage rent | | | - | | | | - | | | | (3 | ) | | | (6 | ) | | | 232 | | | | 156 | | | | 1,047 | | | | 1,254 | |
* | Termination Fees | | | (50 | ) | | | (12 | ) | | | (160 | ) | | | (13 | ) | | | 894 | | | | 371 | | | | 2,617 | | | | 975 | |
* | Uncollectible lease income | | | 97 | | | | 38 | | | | 531 | | | | 85 | | | | (1,410 | ) | | | (145 | ) | | | (9,803 | ) | | | (484 | ) |
* | Other lease income | | | (28 | ) | | | (35 | ) | | | (115 | ) | | | (134 | ) | | | 353 | | | | 334 | | | | 1,437 | | | | 1,262 | |
| Straight line rent on lease income | | | (1 | ) | | | 65 | | | | (167 | ) | | | (180 | ) | | | (163 | ) | | | 17 | | | | (2,664 | ) | | | 1,497 | |
| Above/below market rent amortization | | | (14 | ) | | | (12 | ) | | | (86 | ) | | | (57 | ) | | | 191 | | | | 184 | | | | 878 | | | | 889 | |
| Lease income (1) | | | (2,312 | ) | | | (2,555 | ) | | | (9,247 | ) | | | (10,993 | ) | | | 34,958 | | | | 36,031 | | | | 132,900 | | | | 143,592 | |
| | | | | | | | | | | | | | | | | | | | | | | | | | | | | | | | | |
* | Other property income | | | (1 | ) | | | (8 | ) | | | (9 | ) | | | (19 | ) | | | 348 | | | | 126 | | | | 761 | | | | 657 | |
| | | | | | | | | | | | | | | | | | | | | | | | | | | | | | | | | |
| Asset management fees | | | - | | | | - | | | | - | | | | - | | | | (267 | ) | | | (280 | ) | | | (1,090 | ) | | | (1,120 | ) |
| Management, transaction, and other fees | | | - | | | | - | | | | - | | | | - | | | | (267 | ) | | | (280 | ) | | | (1,090 | ) | | | (1,120 | ) |
| | | | | | | | | | | | | | | | | | | | | | | | | | | | | | | | | |
| Total revenues | | | (2,313 | ) | | | (2,563 | ) | | | (9,256 | ) | | | (11,012 | ) | | | 35,039 | | | | 35,877 | | | | 132,571 | | | | 143,129 | |
| | | | | | | | | | | | | | | | | | | | | | | | | | | | | | | | | |
| Operating Expenses: | | | | | | | | | | | | | | | | | | | | | | | | | | | | | | | | |
| Depreciation and amortization (including FF&E) | | | (619 | ) | | | (644 | ) | | | (2,459 | ) | | | (2,635 | ) | | | 8,723 | | | | 8,476 | | | | 34,508 | | | | 33,021 | |
| | | | | | | | | | | | | | | | | | | | | | | | | | | | | | | | | |
* | Operating and maintenance | | | (401 | ) | | | (433 | ) | | | (1,441 | ) | | | (1,609 | ) | | | 6,004 | | | | 5,953 | | | | 22,333 | | | | 22,064 | |
* | Ground rent | | | (28 | ) | | | (27 | ) | | | (113 | ) | | | (111 | ) | | | 74 | | | | 87 | | | | 343 | | | | 390 | |
| Straight line rent on ground rent | | | (16 | ) | | | (15 | ) | | | (63 | ) | | | (63 | ) | | | 29 | | | | 30 | | | | 119 | | | | 307 | |
| Above/below market ground rent amortization | | | - | | | | - | | | | - | | | | - | | | | 10 | | | | 10 | | | | 39 | | | | 33 | |
| Operating and maintenance | | | (445 | ) | | | (475 | ) | | | (1,617 | ) | | | (1,783 | ) | | | 6,117 | | | | 6,080 | | | | 22,834 | | | | 22,794 | |
| | | | | | | | | | | | | | | | | | | | | | | | | | | | | | | | | |
| General & administrative, net | | | - | | | | - | | | | - | | | | - | | | | 106 | | | | 145 | | | | 369 | | | | 444 | |
| | | | | | | | | | | | | | | | | | | | | | | | | | | | | | | | | |
* | Real estate taxes | | | (320 | ) | | | (340 | ) | | | (1,347 | ) | | | (1,556 | ) | | | 4,551 | | | | 4,524 | | | | 18,876 | | | | 18,646 | |
| | | | | | | | | | | | | | | | | | | | | | | | | | | | | | | | | |
| Other expenses | | | (23 | ) | | | (14 | ) | | | (83 | ) | | | (102 | ) | | | 294 | | | | 190 | | | | 949 | | | | 873 | |
| Development pursuit costs | | | - | | | | - | | | | - | | | | - | | | | - | | | | 1 | | | | 67 | | | | 29 | |
| Other operating expenses | | | (23 | ) | | | (14 | ) | | | (83 | ) | | | (102 | ) | | | 294 | | | | 191 | | | | 1,016 | | | | 902 | |
| | | | | | | | | | | | | | | | | | | | | | | | | | | | | | | | | |
| Total operating expenses | | | (1,407 | ) | | | (1,473 | ) | | | (5,506 | ) | | | (6,076 | ) | | | 19,791 | | | | 19,416 | | | | 77,603 | | | | 75,807 | |
| | | | | | | | | | | | | | | | | | | | | | | | | | | | | | | | | |
| Other Expense (Income): | | | | | | | | | | | | | | | | | | | | | | | | | | | | | | | | |
| Gross interest expense | | | (336 | ) | | | (409 | ) | | | (1,461 | ) | | | (1,669 | ) | | | 5,298 | | | | 5,905 | | | | 22,069 | | | | 24,163 | |
| Debt cost amortization | | | (15 | ) | | | (19 | ) | | | (64 | ) | | | (73 | ) | | | 134 | | | | 173 | | | | 657 | | | | 691 | |
| Debt premium/discount amortization | | | - | | | | - | | | | - | | | | - | | | | 10 | | | | 10 | | | | 39 | | | | 34 | |
| Interest expense, net | | | (351 | ) | | | (428 | ) | | | (1,525 | ) | | | (1,742 | ) | | | 5,442 | | | | 6,088 | | | | 22,765 | | | | 24,888 | |
| | | | | | | | | | | | | | | | | | | | | | | | | | | | | | | | | |
| Provision for impairment of real estate | | | - | | | | - | | | | - | | | | - | | | | 242 | | | | - | | | | 242 | | | | 10,900 | |
| (Gain) loss on sale of real estate | | | - | | | | - | | | | - | | | | - | | | | (2,453 | ) | | | (6,910 | ) | | | (2,414 | ) | | | (29,422 | ) |
| Early extinguishment of debt | | | - | | | | - | | | | - | | | | - | | | | 206 | | | | - | | | | 206 | | | | - | |
| | | | | | | | | | | | | | | | | | | | | | | | | | | | | | | | | |
| Total other expense (income) | | | (351 | ) | | | (428 | ) | | | (1,525 | ) | | | (1,742 | ) | | | 3,437 | | | | (822 | ) | | | 20,799 | | | | 6,366 | |
* | Component of Net Operating Income |
(1) | For additional details, see Supplemental COVID-19 Disclosure on pages 39 and 40. | |
Note
Noncontrolling interests represent limited partners’ interests in consolidated partnerships’ activities and Share of JVs represents the Company’s share of co-investment partnerships’ activities, of which each are included on a single line presentation in the Company’s consolidated financial statements in accordance with GAAP.
| | |
| Supplemental Information | 7 |
Supplemental Details of Same Property NOI (Pro-Rata)
For the Periods Ended December 31, 2020 and 2019
(in thousands)
| | Three Months Ended | | | Year to Date | |
| | 2020 | | | 2019 | | | 2020 | | | 2019 | |
Same Property NOI Detail: | | | | | | | | | | | | | | | | |
| | | | | | | | | | | | | | | | |
Real Estate Revenues: | | | | | | | | | | | | | | | | |
Base rent | | $ | 206,116 | | | | 209,447 | | | $ | 830,516 | | | | 833,749 | |
Recoveries from tenants | | | 65,404 | | | | 68,137 | | | | 265,616 | | | | 266,792 | |
Percentage rent | | | 1,055 | | | | 1,566 | | | | 6,963 | | | | 8,476 | |
Termination fees | | | 2,238 | | | | 1,071 | | | | 7,695 | | | | 3,438 | |
Uncollectible lease income | | | (15,339 | ) | | | (1,188 | ) | | | (84,073 | ) | | | (5,073 | ) |
Other lease income | | | 2,872 | | | | 2,917 | | | | 9,914 | | | | 10,336 | |
Other property income | | | 1,804 | | | | 1,710 | | | | 6,445 | | | | 7,507 | |
Total real estate revenues | | | 264,150 | | | | 283,660 | | | | 1,043,076 | | | | 1,125,225 | |
| | | | | | | | | | | | | | | | |
Real Estate Operating Expenses: | | | | | | | | | | | | | | | | |
Operating and maintenance | | | 45,519 | | | | 44,550 | | | | 168,039 | | | | 167,190 | |
Termination expense | | | - | | | | - | | | | 25 | | | | 520 | |
Real estate taxes | | | 36,317 | | | | 37,057 | | | | 151,615 | | | | 145,839 | |
Ground rent | | | 2,639 | | | | 2,643 | | | | 10,307 | | | | 10,610 | |
Total real estate operating expenses | | | 84,475 | | | | 84,250 | | | | 329,986 | | | | 324,159 | |
| | | | | | | | | | | | | | | | |
Same Property NOI | | $ | 179,675 | | | | 199,410 | | | $ | 713,090 | | | | 801,066 | |
% change | | | -9.9 | % | | | | | | | -11.0 | % | | | | |
| | | | | | | | | | | | | | | | |
Same Property NOI without Termination Fees | | $ | 177,437 | | | | 198,339 | | | $ | 705,420 | | | | 798,148 | |
% change | | | -10.5 | % | | | | | | | -11.6 | % | | | | |
| | | | | | | | | | | | | | | | |
Same Property NOI without Termination Fees or Redevelopments | | $ | 160,973 | | | | 180,163 | | | $ | 640,152 | | | | 722,090 | |
% change | | | -10.7 | % | | | | | | | -11.3 | % | | | | |
| | | | | | | | | | | | | | | | |
| | | | | | | | | | | | | | | | |
Reconciliation of Net Income Attributable to Common Stockholders to Same Property NOI: | | | | | | | | | |
| | | | | | | | | | | | | | | | |
Net income attributable to common stockholders | | $ | 38,487 | | | | 40,291 | | | $ | 44,889 | | | | 239,430 | |
Less: | | | | | | | | | | | | | | | | |
Management, transaction, and other fees | | | (7,417 | ) | | | (7,868 | ) | | | (26,501 | ) | | | (29,636 | ) |
Other (1) | | | (8,544 | ) | | | (16,811 | ) | | | (25,912 | ) | | | (58,904 | ) |
Plus: | | | | | | | | | | | | | | | | |
Depreciation and amortization | | | 86,739 | | | | 91,644 | | | | 345,900 | | | | 374,283 | |
General and administrative | | | 20,512 | | | | 18,262 | | | | 75,001 | | | | 74,984 | |
Other operating expense | | | 7,617 | | | | 3,328 | | | | 12,642 | | | | 7,814 | |
Other expense | | | 35,474 | | | | 71,860 | | | | 256,407 | | | | 187,610 | |
Equity in income of investments in real estate excluded from NOI (2) | | | 12,838 | | | | 8,109 | | | | 59,726 | | | | 39,807 | |
Net income attributable to noncontrolling interests | | | 729 | | | | 840 | | | | 2,428 | | | | 3,828 | |
NOI | | | 186,435 | | | | 209,655 | | | | 744,580 | | | | 839,216 | |
| | | | | | | | | | | | | | | | |
Less non-same property NOI (3) | | | (6,760 | ) | | | (10,245 | ) | | | (31,490 | ) | | | (38,150 | ) |
| | | | | | | | | | | | | | | | |
Same Property NOI | | $ | 179,675 | | | | 199,410 | | | $ | 713,090 | | | | 801,066 | |
(1) | Includes straight-line rental income and expense, net of reserves, above and below market rent amortization, other fees, and noncontrolling interests. |
(2) | Includes non-NOI income and expenses incurred at our unconsolidated real estate partnerships, such as, but not limited to, straight-line rental income, above and below market rent amortization, depreciation and amortization, interest expense, and real estate gains and impairments. |
(3) | Includes revenues and expenses attributable to Non-Same Property, Projects in Development, corporate activities, and noncontrolling interests. |
| | |
| Supplemental Information | 8 |
Reconciliations of Non-GAAP Financial Measures and Additional Disclosures
Wholly Owned and Regency's Pro-rata Share of Co-investment Partnerships
For the Periods Ended December 31, 2020 and 2019
(in thousands, except per share data)
| | Three Months Ended | | | Year to Date | |
| | 2020 | | | 2019 | | | 2020 | | | 2019 | |
| | | | | | | | | | | | | | | | |
Reconciliation of Net Income to Nareit FFO: | | | | | | | | | | | | | | | | |
| | | | | | | | | | | | | | | | |
Net Income Attributable to Common Stockholders | | $ | 38,487 | | | | 40,291 | | | $ | 44,889 | | | | 239,430 | |
Adjustments to reconcile to Nareit Funds From Operations (1): | | | | | | | | | | | | | | | | |
Depreciation and amortization (excluding FF&E) | | | 94,289 | | | | 99,270 | | | | 375,865 | | | | 402,888 | |
Goodwill impairment | | | - | | | | - | | | | 132,128 | | | | - | |
Gain on sale of real estate | | | (21,228 | ) | | | (13,333 | ) | | | (69,879 | ) | | | (53,664 | ) |
Provision for impairment of real estate | | | 17,764 | | | | 42,076 | | | | 18,778 | | | | 65,074 | |
Exchangeable operating partnership units | | | 174 | | | | 178 | | | | 203 | | | | 634 | |
Nareit Funds From Operations | | $ | 129,486 | | | | 168,482 | | | $ | 501,984 | | | | 654,362 | |
| | | | | | | | | | | | | | | | |
| | | | | | | | | | | | | | | | |
Nareit FFO per share (diluted) | | $ | 0.76 | | | | 1.00 | | | $ | 2.95 | | | | 3.89 | |
Weighted average shares (diluted) | | | 170,745 | | | | 168,638 | | | | 170,225 | | | | 168,235 | |
| | | | | | | | | | | | | | | | |
Reconciliation of Nareit FFO to Core Operating Earnings: | | | | | | | | | | | | | | | | |
Nareit Funds From Operations | | $ | 129,486 | | | | 168,482 | | | $ | 501,984 | | | | 654,362 | |
Adjustments to reconcile to Core Operating Earnings (1): | | | | | | | | | | | | | | | | |
Non Comparable Items | | | | | | | | | | | | | | | | |
Early extinguishment of debt | | | 2,685 | | | | - | | | | 22,043 | | | | 11,982 | |
Interest on bonds for period from notice to redemption | | | - | | | | - | | | | - | | | | 367 | |
Certain Non Cash Items | | | | | | | | | | | | | | | | |
Straight line rent | | | (3,778 | ) | | | (3,082 | ) | | | (15,605 | ) | | | (15,526 | ) |
Uncollectible straight line rent | | | 7,681 | | | | 1,698 | | | | 39,255 | | | | 7,002 | |
Above/below market rent amortization, net | | | (10,860 | ) | | | (13,833 | ) | | | (41,293 | ) | | | (44,666 | ) |
Debt premium/discount amortization | | | (117 | ) | | | (395 | ) | | | (1,233 | ) | | | (1,776 | ) |
Core Operating Earnings | | $ | 125,097 | | | | 152,870 | | | $ | 505,151 | | | | 611,745 | |
| | | | | | | | | | | | | | | | |
| | | | | | | | | | | | | | | | |
Core Operating Earnings per share (diluted) | | $ | 0.73 | | | | 0.91 | | | $ | 2.97 | | | | 3.64 | |
Weighted average shares (diluted) | | | 170,745 | | | | 168,638 | | | | 170,225 | | | | 168,235 | |
| | | | | | | | | | | | | | | | |
| | | | | | | | | | | | | | | | |
Additional Disclosures: | | | | | | | | | | | | | | | | |
| | | | | | | | | | | | | | | | |
Other Non Cash Expense (1) | | | | | | | | | | | | | | | | |
Derivative amortization | | $ | 110 | | | | 1,650 | | | $ | 4,329 | | | | 7,564 | |
Debt cost amortization | | | 1,595 | | | | 1,508 | | | | 6,375 | | | | 5,897 | |
Stock-based compensation | | | 3,284 | | | | 4,128 | | | | 14,248 | | | | 16,254 | |
Other Non Cash Expense | | $ | 4,989 | | | | 7,286 | | | $ | 24,952 | | | | 29,715 | |
| | | | | | | | | | | | | | | | |
| | | | | | | | | | | | | | | | |
| | | | | | | | | | | | | | | | |
Maintenance and Leasing Capital Expenditures (2) | | | | | | | | | | | | | | | | |
Tenant allowance and landlord work | | $ | 6,768 | | | | 10,446 | | | $ | 29,660 | | | | 43,161 | |
Building improvements | | | 5,414 | | | | 13,498 | | | | 19,104 | | | | 28,757 | |
Leasing commissions | | | 2,134 | | | | 2,862 | | | | 7,425 | | | | 10,028 | |
Capital Expenditures | | $ | 14,316 | | | | 26,806 | | | $ | 56,189 | | | | 81,946 | |
| | | | | | | | | | | | | | | | |
| (1) | Includes Regency’s consolidated entities and its pro-rata share of unconsolidated co-investment partnerships, net of pro-rata share attributable to noncontrolling interests, which can be found on page 7. | |
| (2) | Includes Regency’s consolidated entities and its pro-rata share of unconsolidated co-investment partnerships. | |
| | |
| Supplemental Information | 9 |
Reconciliations of Non-GAAP Financial Measures and Additional Disclosures (continued)
For the Periods Ended December 31, 2020 and 2019
(in thousands)
| | Three Months Ended | | | Year to Date | |
| | 2020 | | | 2019 | | | 2020 | | | 2019 | |
Reconciliation of Net Income to Nareit EBITDAre: | | | | | | | | | | | | | | | | |
| | | | | | | | | | | | | | | | |
Net Income | | $ | 39,216 | | | | 41,131 | | | $ | 47,317 | | | | 243,258 | |
Adjustments to reconcile to Nareit EBITDAre (1): | | | | | | | | | | | | | | | | |
Interest expense | | | 43,743 | | | | 44,375 | | | | 181,043 | | | | 177,221 | |
Income tax expense (benefit) | | | 212 | | | | 394 | | | | (357 | ) | | | 757 | |
Depreciation and amortization | | | 95,462 | | | | 100,120 | | | | 380,408 | | | | 407,304 | |
Gain on sale of real estate | | | (21,228 | ) | | | (13,333 | ) | | | (69,879 | ) | | | (53,664 | ) |
Provision for impairment of real estate | | | 17,764 | | | | 42,076 | | | | 18,778 | | | | 65,074 | |
Goodwill impairment | | | - | | | | - | | | | 132,128 | | | | - | |
Nareit EBITDAre | | $ | 175,169 | | | | 214,763 | | | $ | 689,438 | | | | 839,950 | |
| | | | | | | | | | | | | | | | |
| | | | | | | | | | | | | | | | |
| | | | | | | | | | | | | | | | |
Reconciliation of Nareit EBITDAre to Operating EBITDAre: | | | | | | | | | | | | | | | | |
| | | | | | | | | | | | | | | | |
Nareit EBITDAre | | $ | 175,169 | | | | 214,763 | | | $ | 689,438 | | | | 839,950 | |
Adjustments to reconcile to Operating EBITDAre (1): | | | | | | | | | | | | | | | | |
Early extinguishment of debt | | | 2,685 | | | | - | | | | 22,043 | | | | 11,982 | |
Straight line rent, net | | | 3,918 | | | | (1,304 | ) | | | 23,546 | | | | (8,641 | ) |
Above/below market rent amortization, net | | | (10,874 | ) | | | (13,846 | ) | | | (41,379 | ) | | | (44,723 | ) |
Operating EBITDAre | | $ | 170,898 | | | | 199,613 | | | $ | 693,648 | | | | 798,568 | |
| (1) | Includes Regency's consolidated entities and its pro-rata share of unconsolidated co-investment partnerships. | |
| | |
| Supplemental Information | 10 |
Summary of Consolidated Debt
December 31, 2020 and 2019
(in thousands)
Total Debt Outstanding: | | 12/31/2020 | | | 12/31/2019 | |
Notes Payable: | | | | | | | | |
Fixed rate mortgage loans | | $ | 384,734 | | | $ | 455,411 | |
Variable-rate mortgage loans | | | 34,061 | | | | 34,998 | |
Fixed rate unsecured public debt | | | 3,047,715 | | | | 2,754,322 | |
Fixed rate unsecured private debt | | | 191,894 | | | | 190,430 | |
Unsecured credit facilities: | | | | | | | | |
Revolving line of credit | | | - | | | | 220,000 | |
Term Loans (4) | | | 264,680 | | | | 264,383 | |
Total | | $ | 3,923,084 | | | $ | 3,919,544 | |
Schedule of Maturities by Year: | | Scheduled Principal Payments | | | Mortgage Loan Maturities | | | Unsecured Maturities (1) | | | Total | | | Weighted Average Contractual Interest Rate on Maturities | |
2021 | | $ | 11,598 | | | | 31,562 | | | | - | | | | 43,160 | | | 1.93% | |
2022 | | | 11,797 | | | | 5,848 | | | | 265,000 | | (4) | | 282,645 | | | 2.12% | |
2023 | | | 10,124 | | | | 65,724 | | | | - | | | | 75,848 | | | 3.18% | |
2024 | | | 5,301 | | | | 90,744 | | | | 250,000 | | | | 346,045 | | | 3.70% | |
2025 | | | 4,207 | | | | 40,000 | | | | 250,000 | | | | 294,207 | | | 3.79% | |
2026 | | | 4,420 | | | | 88,000 | | | | 200,000 | | | | 292,420 | | | 3.83% | |
2027 | | | 4,312 | | | | 32,915 | | | | 525,000 | | | | 562,227 | | | 3.63% | |
2028 | | | 3,350 | | | | 170 | | | | 300,000 | | | | 303,520 | | | 4.13% | |
2029 | | | 602 | | | | 146 | | | | 425,000 | | | | 425,748 | | | 2.95% | |
2030 | | | 633 | | | | - | | | | 600,000 | | | | 600,633 | | | 3.70% | |
>10 years | | | 4,188 | | | | 72 | | | | 725,000 | | | | 729,260 | | | 4.50% | |
Unamortized debt premium/(discount), net of issuance costs | | | - | | | | 3,082 | | | | (35,711 | ) | | | (32,629 | ) | | | | |
| | $ | 60,532 | | | | 358,263 | | | | 3,504,289 | | | | 3,923,084 | | | 3.70% | |
Percentage of Total Debt: | | 12/31/2020 | | | 12/31/2019 | |
Fixed | | 99.1% | | | 93.5% | |
Variable | | 0.9% | | | 6.5% | |
| | | | | | | | |
Current Weighted Average Contractual Interest Rates:(2) | | | | | | | | |
Fixed | | 3.7% | | | 3.8% | |
Variable | | 1.2% | | | 2.6% | |
Combined | | 3.7% | | | 3.7% | |
| | | | | | | | |
| | | | | | | | |
Current Weighted Average Effective Interest Rate:(3) | | | | | | | | |
Combined | | 3.9% | | | 3.9% | |
| | | | | | | | |
| | | | | | | | |
Average Years to Maturity: | | | | | | | | |
Fixed | | | 10.1 | | | 10.3 | |
Variable | | | 1.2 | | | 2.2 | |
(1) | Includes unsecured public and private placement debt, unsecured term loan, and unsecured revolving line of credit. | |
(2) | Interest rates are calculated as of the quarter end. | |
(3) | Effective interest rates are calculated in accordance with US GAAP, as of the quarter end, and include the impact of debt premium/(discount) amortization, issuance cost amortization, interest rate swaps, and facility fees. | |
(4) | The $265 million Term loan was repaid in full on January 15, 2021. | |
| | |
| Supplemental Information | 11 |
Summary of Consolidated Debt
December 31, 2020 and 2019
(in thousands)
| | | | Contractual | | | | Effective | | | | | | | | | | | |
Lender | | Collateral | | Rate | | | | Rate(1) | | | Maturity | | 12/31/2020 | | | 12/31/2019 | |
Secured Debt - Fixed Rate Mortqaqe Loans | | | | | | | | | | | | | | | | | | | | | |
Jefferson Pilot | | BridgeMill | | 7.94% | | | | | | | | 05/05/21 | | $ | 4,012 | | | $ | 4,582 | |
John Hancock Life Insurance Company | | Kirkwood Commons | | 7.68% | | | | | | | | 10/01/22 | | | 7,302 | | | | 8,050 | |
Wells Fargo | | Hewlett I | | 4.41% | | | | | | | | 01/06/23 | | | 9,235 | | | | 9,400 | |
TD Bank | | Black Rock Shopping Center | | 2.80% | | | | | | | | 04/01/23 | | | 19,405 | | | | 19,767 | |
State Farm Life Insurance Company | | Tech Ridge Center | | 5.83% | | | | | | | | 06/01/23 | | | 3,346 | | | | 4,554 | |
American United Life Insurance Company | | Westport Plaza | | 7.49% | | | | �� | | | | 08/01/23 | | | 2,098 | | | | 2,385 | |
TD Bank | | Brickwalk Shopping Center | | 3.19% | | | | | | | | 11/01/23 | | | 32,369 | | | | 32,952 | |
Genworth Life Insurance Company | | Aventura, Oakbrook & Treasure Coast | | 6.50% | | | | | | | | 02/28/24 | | | 9,525 | | | | 12,067 | |
Prudential Insurance Company of America | | 4S Commons Town Center | | 3.50% | | | | | | | | 06/05/24 | | | 84,191 | | | | 85,000 | |
Ellis Partners | | Pruneyard | | 4.00% | | | | | | | | 06/30/24 | | | 2,200 | | | | 2,200 | |
Great-West Life & Annuity Insurance Co | | Erwin Square | | 3.78% | | | | | | | | 09/01/24 | | | 10,000 | | | | 10,000 | |
PNC Bank | | Circle Marina Center | | 2.54% | | | | | | | | 03/17/25 | | | 24,000 | | | | 24,000 | |
Prudential Insurance Company of America | | Country Walk Plaza | | 3.91% | | | | | | | | 11/05/25 | | | 16,000 | | | | - | |
Metropolitan Life Insurance Company | | Westbury Plaza | | 3.76% | | | | | | | | 02/01/26 | | | 88,000 | | | | 88,000 | |
PNC Bank | | Fellsway Plaza | | 4.07% | | | | | | | | 06/02/27 | | | 36,590 | | | | 37,166 | |
New York Life Insurance | | Oak Shade Town Center | | 6.05% | | | | | | | | 05/10/28 | | | 6,301 | | | | 6,954 | |
New York Life Insurance | | Von's Circle Center | | 5.20% | | | | | | | | 10/10/28 | | | 6,434 | | | | 7,083 | |
New York Life Insurance | | Copps Hill Plaza | | 6.06% | | | | | | | | 01/01/29 | | | 11,258 | | | | 12,306 | |
City of Rollingwood | | Shops at Mira Vista | | 8.00% | | | | | | | | 03/01/32 | | | 204 | | | | 215 | |
Reliastar Life Insurance Company | | Circle Center West | | 5.01% | | | | | | | | 10/01/36 | | | 9,143 | | | | 9,513 | |
CUNA Mutual Insurance Society | | Ocala Corners | | 6.45% | | | | | | | | 04/01/20 | | | - | | | | 3,891 | |
Nationwide Bank | | Kent Place | | 3.30% | | | | | | | | 04/01/20 | | | - | | | | 8,250 | |
New York Life Insurance Company | | Scripps Ranch Marketplace | | 3.80% | | | | | | | | 11/10/20 | | | - | | | | 27,000 | |
Wells Fargo | | University Commons | | 5.50% | | | | | | | | 01/10/21 | | | - | | | | 35,824 | |
Unamortized premiums on assumed debt of acquired properties, net of issuance costs | | | | | | | | | | | | | | 3,121 | | | | 4,252 | |
Total Fixed Rate Mortgage Loans | | 3.97% | | | | 3.79% | | | | | $ | 384,734 | | | $ | 455,411 | |
| | | | | | | | | | | | | | | | | | | | | |
| | | | | | | | | | | | | | | | | | | | | |
Unsecured Debt | | | | | | | | | | | | | | | | | | | | | |
Debt Offering (5/16/14) | | Fixed-rate unsecured | | 3.75% | | | | | | | | 06/15/24 | | $ | 250,000 | | | $ | 250,000 | |
Debt Offering (8/17/15) | | Fixed-rate unsecured | | 3.90% | | | | | | | | 11/01/25 | | | 250,000 | | | | 250,000 | |
Debt Placement (5/11/16) | | Fixed-rate unsecured | | 3.81% | | | | | | | | 05/11/26 | | | 100,000 | | | | 100,000 | |
Debt Placement (8/11/16) | | Fixed-rate unsecured | | 3.91% | | | | | | | | 08/11/26 | | | 100,000 | | | | 100,000 | |
Debt Offering (1/17/17) | | Fixed-rate unsecured | | 3.60% | | | | | | | | 02/01/27 | | | 525,000 | | | | 525,000 | |
Debt Offering (3/9/18) | | Fixed-rate unsecured | | 4.13% | | | | | | | | 03/15/28 | | | 300,000 | | | | 300,000 | |
Debt Offering (8/13/19) | | Fixed-rate unsecured | | 2.95% | | | | | | | | 09/15/29 | | | 425,000 | | | | 425,000 | |
Debt Offering (5/13/20) | | Fixed-rate unsecured | | 3.70% | | | | | | | | 06/15/30 | | | 600,000 | | | | - | |
Debt Offering (1/17/17) | | Fixed-rate unsecured | | 4.40% | | | | | | | | 02/01/47 | | | 425,000 | | | | 425,000 | |
Debt Offering (3/6/19) | | Fixed-rate unsecured | | 4.65% | | | | | | | | 03/15/49 | | | 300,000 | | | | 300,000 | |
Term Loan | | Fixed-rate unsecured | | 2.00% | | (2) | | | | | | 01/05/22 | | | 265,000 | | | | 265,000 | |
Revolving Line of Credit | | Variable-rate unsecured | | LIBOR + 0.875% | | (3) | | | | | | 03/23/22 | | | - | | | | 220,000 | |
Debt Offering (10/22/12) | | Fixed-rate unsecured | | 3.75% | | | | | | | | 11/15/22 | | | - | | | | 300,000 | |
Unamortized debt discount and issuance costs | | | | | | | | | | | | | | (35,711 | ) | | | (30,865 | ) |
Total Unsecured Debt, Net of Discounts | | 3.70% | | | | 3.83% | | | | | $ | 3,504,289 | | | $ | 3,429,135 | |
| | | | | | | | | | | | | | | | | | | | | |
Variable Rate Mortgage Loans | | | | | | | | | | | | | | | | | | | | | |
PNC Bank | | Market at Springwoods Village | | LIBOR + 1.50% | | | | | | | | 03/28/23 | | $ | 6,350 | | | $ | 7,350 | |
TD Bank, N.A. | | Concord Shopping Plaza | | LIBOR + 0.95% | | | | | | | | 12/21/21 | | | 27,750 | | | | 27,750 | |
Unamortized debt discount and issuance costs | | | | | | | | | | | | | | (39 | ) | | | (102 | ) |
Total Variable Rate Mortgage Loans | | 1.21% | | | | 1.39% | | | | | $ | 34,061 | | | $ | 34,998 | |
| | | | | | | | | | | | | | | | | | | | | |
Total | | | | 3.70% | | | | 3.91% | | | | | $ | 3,923,084 | | | $ | 3,919,544 | |
(1) | Effective interest rates are calculated in accordance with US GAAP, as of the quarter end, and include the impact of debt premium/(discount) amortization, issuance cost amortization, interest rate swaps, and facility and unused fees. |
(2) | The interest rate on the underlying debt is LIBOR + 0.95%, with an interest rate swap in place to fix the interest rate on the entire $265 million balance at 2.00% through maturity. On January 15, 2021, the $265 million Term loan was repaid in full, as well as the related interest rate swap. |
(3) | On February 9, 2021, the maturity date on the line of credit was extended to March 23, 2025, retaining the same overall borrowing capacity and credit-based interest spread. Rate applies to drawn balance only. Additional annual facility fee of 0.15% applies to entire $1.25 billion line of credit. Maturity is subject to two additional six-month periods at the Company’s option. |
| | |
| Supplemental Information | 12 |
Summary of Unsecured Debt Covenants and Leverage Ratios
December 31, 2020
(in thousands)
Outstanding Unsecured Public Debt: | | Origination | | Maturity | | Rate | | | Balance | |
| | 05/16/14 | | 06/15/24 | | 3.750% | | | $ | 250,000 | |
| | 08/17/15 | | 11/01/25 | | 3.900% | | | $ | 250,000 | |
| | 01/17/17 | | 02/01/27 | | 3.600% | | | $ | 525,000 | |
| | 03/09/18 | | 03/15/28 | | 4.125% | | | $ | 300,000 | |
| | 08/20/19 | | 09/15/29 | | 2.950% | | | $ | 425,000 | |
| | 05/13/20 | | 06/15/30 | | 3.700% | | | $ | 600,000 | |
| | 01/17/17 | | 02/01/47 | | 4.400% | | | $ | 425,000 | |
| | 03/06/19 | | 03/15/49 | | 4.650% | | | $ | 300,000 | |
Unsecured Public Debt Covenants: | | Required | | 12/31/2020 | | 9/30/2020 | | 6/30/2020 | | 3/31/2020 | | 12/31/2019 |
Fair Market Value Calculation Method Covenants (1) (2) | | | | | | | | | | | | |
Total Consolidated Debt to Total Consolidated Assets | | ≤ 65% | | 29% | | 30% | | 31% | | 31% | | 29% |
Secured Consolidated Debt to Total Consolidated Assets | | ≤ 40% | | 3% | | 4% | | 4% | | 4% | | 4% |
Consolidated Income for Debt Service to Consolidated Debt Service | | ≥ 1.5x | | 4.2x | | 4.3x | | 4.3x | | 5.1x | | 5.4x |
Unencumbered Consolidated Assets to Unsecured Consolidated Debt | | >150% | | 345% | | 344% | | 328% | | 327% | | 356% |
| | | | | | | | | | | | |
| | | | | | | | | | | | |
| | | | | | | | | | | | |
| | | | | | | | | | | | |
Ratios: | | | | 12/31/2020 | | 9/30/2020 | | 6/30/2020 | | 3/31/2020 | | 12/31/2019 |
Consolidated only | | | | | | | | | | | | |
| | | | | | | | | | | | |
Net debt to total market capitalization | | | | 31.3% | | 36.4% | | 32.2% | | 36.0% | | 26.4% |
Net debt to real estate assets, before depreciation | | | | 30.5% | | 31.7% | | 31.8% | | 31.6% | | 32.7% |
Net debt to total assets, before depreciation | | | | 28.2% | | 29.3% | | 29.2% | | 29.0% | | 29.7% |
| | | | | | | | | | | | |
Net debt to Operating EBITDAre - TTM | | | | 5.4x | | 5.4x | | 5.1x | | 4.8x | | 4.9x |
Fixed charge coverage | | | | 4.1x | | 4.3x | | 4.6x | | 5.0x | | 5.0x |
Interest coverage | | | | 4.3x | | 4.6x | | 4.9x | | 5.3x | | 5.3x |
| | | | | | | | | | | | |
Unsecured assets to total real estate assets | | | | 89.6% | | 88.5% | | 88.8% | | 88.6% | | 88.6% |
Unsecured NOI to total NOI - TTM | | | | 90.4% | | 89.5% | | 90.2% | | 90.0% | | 90.0% |
Unencumbered assets to unsecured debt | | | | 284% | | 282% | | 260% | | 247% | | 287% |
| | | | | | | | | | | | |
Total Pro-Rata Share | | | | | | | | | | | | |
| | | | | | | | | | | | |
Net debt to total market capitalization | | | | 34.4% | | 39.6% | | 35.2% | | 39.1% | | 29.0% |
Net debt to real estate assets, before depreciation | | | | 32.6% | | 33.7% | | 33.7% | | 33.5% | | 34.6% |
Net debt to total assets, before depreciation | | | | 30.1% | | 31.0% | | 31.0% | | 30.8% | | 31.4% |
| | | | | | | | | | | | |
Net debt to Operating EBITDAre - TTM | | | | 6.0x | | 5.9x | | 5.6x | | 5.3x | | 5.4x |
Fixed charge coverage | | | | 3.6x | | 3.7x | | 4.0x | | 4.3x | | 4.3x |
Interest coverage | | | | 3.9x | | 4.1x | | 4.4x | | 4.7x | | 4.7x |
(1) | For a complete listing of all Debt Covenants related to the Company’s Senior Unsecured Notes, as well as definitions of the above terms, please refer to the Company’s filings with the Securities and Exchange Commission. |
(2) | Current period debt covenants are finalized and submitted after the Company’s most recent Form 10-Q or Form 10-K filing. |
| | |
| Supplemental Information | 13 |
Summary of Unconsolidated Debt
December 31, 2020 and 2019
(in thousands)
Total Debt Outstanding: | | 12/31/2020 | | | 12/31/2019 | |
Mortgage loans payable: | | | | | | | | |
Fixed rate secured loans | | $ | 1,424,103 | | | $ | 1,441,840 | |
Variable rate secured loans | | | 117,305 | | | | 115,992 | |
Unsecured credit facilities variable rate | | | 15,635 | | | | 19,635 | |
Total | | $ | 1,557,043 | | | $ | 1,577,467 | |
Schedule of Maturities by Year: | | Scheduled Principal Payments | | | Mortgage Loan Maturities | | | Unsecured Maturities | | | Total | | | Regency's Pro Rata Share | | | Weighted Average Contractual Interest Rate on Maturities | |
2021 | | $ | 11,257 | | | | 333,068 | | | | 15,635 | | | | 359,960 | | | | 124,100 | | | 4.38% | |
2022 | | | 7,736 | | | | 254,873 | | | | - | | | | 262,609 | | | | 97,465 | | | 3.76% | |
2023 | | | 3,196 | | | | 171,608 | | | | - | | | | 174,804 | | | | 65,137 | | | 4.76% | |
2024 | | | 1,796 | | | | 33,690 | | | | - | | | | 35,486 | | | | 14,217 | | | 3.89% | |
2025 | | | 2,168 | | | | 146,000 | | | | - | | | | 148,168 | | | | 44,853 | | | 3.59% | |
2026 | | | 2,390 | | | | 79,286 | | | | - | | | | 81,676 | | | | 32,551 | | | 3.83% | |
2027 | | | 2,364 | | | | 137,800 | | | | - | | | | 140,164 | | | | 32,950 | | | 3.53% | |
2028 | | | 2,258 | | | | 62,450 | | | | - | | | | 64,708 | | | | 22,555 | | | 4.26% | |
2029 | | | 1,710 | | | | 60,000 | | | | - | | | | 61,710 | | | | 12,550 | | | 4.34% | |
2030 | | | 763 | | | | 179,288 | | | | - | | | | 180,051 | | | | 69,960 | | | 2.93% | |
>10 Years | | | 1,374 | | | | 55,497 | | | | - | | | | 56,871 | | | | 21,374 | | | 4.12% | |
Unamortized debt premium/(discount) and issuance costs (2) | | | - | | | | (9,164 | ) | | | - | | | | (9,164 | ) | | | (3,054 | ) | | | | |
| | $ | 37,012 | | | | 1,504,396 | | | | 15,635 | | | | 1,557,043 | | | | 534,658 | | | 3.94% | |
Percentage of Total Debt: | | 12/31/2020 | | | 12/31/2019 | |
Fixed | | 91.5% | | | 91.4% | |
Variable | | 8.5% | | | 8.6% | |
| | | | | | | | |
| | | | | | | | |
| | | | | | | | |
Current Weighted Average Contractual Interest Rates:(1) | | | | | | | | |
Fixed | | 4.1% | | | 4.5% | |
Variable | | 2.4% | | | 3.9% | |
Combined | | 3.9% | | | 4.4% | |
| | | | | | | | |
| | | | | | | | |
Current Weighted Average Effective Interest Rates:(2) | | | | | | | | |
Combined | | 4.1% | | | 4.6% | |
| | | | | | | | |
| | | | | | | | |
Average Years to Maturity: | | | | | | | | |
Fixed | | | 4.4 | | | | 4.1 | |
Variable | | | 1.1 | | | | 0.6 | |
(1) | Interest rates are calculated as of the quarter end. |
(2) | Effective interest rates are calculated in accordance with US GAAP, as of the quarter end, and include the impact of debt premium/(discount) amortization, issuance cost, amortization, interest rate swaps, and facility and unused fees. |
| | |
| Supplemental Information | 14 |
Unconsolidated Investments
December 31, 2020
(in thousands)
| | | | | | | | | | | | | | | | | | Regency | |
Investment Partner and | | Number of | | | Total | | | Total | | | Total | | | Ownership | | | Share | | | Investment | | | Equity | |
Portfolio Summary Abbreviation | | Properties | | | GLA | | | Assets | | | Debt | | | Interest | | | of Debt | | | 12/31/2020 | | | Pick-up | |
State of Oregon | | | | | | | | | | | | | | | | | | | | | | | | | | | | | | | | |
(JV-C, JV-C2) | | | 20 | | | | 2,219 | | | $ | 513,366 | | | $ | 244,199 | | | 20.00% | | | $ | 48,840 | | | $ | 46,581 | | | $ | 2,075 | |
(JV-CCV) | | | 1 | | | | 558 | | | | 94,551 | | | | 59,955 | | | 30.00% | | | | 17,986 | | | | 10,108 | | | | 757 | |
| | | 21 | | | | 2,777 | | | | 607,917 | | | | 304,154 | | | | | | | | | | | | | | | | | |
GRI | | | | | | | | | | | | | | | | | | | | | | | | | | | | | | | | |
(JV-GRI) | | | 67 | | | | 8,652 | | | | 1,583,097 | | | | 909,234 | | | 40.00% | | | | 363,694 | | | | 179,728 | | | | 25,425 | |
| | | | | | | | | | | | | | | | | | | | | | | | | | | | | | | | |
CalSTRS | | | | | | | | | | | | | | | | | | | | | | | | | | | | | | | | |
(JV-RC) | | | 6 | | | | 611 | | | | 107,283 | | | | - | | | 25.00% | | | | - | | | | 25,908 | | | | 1,296 | |
| | | | | | | | | | | | | | | | | | | | | | | | | | | | | | | | |
NYSCRF | | | | | | | | | | | | | | | | | | | | | | | | | | | | | | | | |
(JV-NYC) | | | 4 | | | | 971 | | | | 205,332 | | | | 113,998 | | | 30.00% | | | | 34,199 | | | | 27,627 | | | | 488 | |
| | | | | | | | | | | | | | | | | | | | | | | | | | | | | | | | |
USAA (1) | | | | | | | | | | | | | | | | | | | | | | | | | | | | | | | | |
(JV-USA) | | | 7 | | | | 683 | | | | 85,006 | | | | 104,161 | | | 20.01% | | | | 20,840 | | | | (4,401 | ) | | | 790 | |
| | | | | | | | | | | | | | | | | | | | | | | | | | | | | | | | |
Publix | | | | | | | | | | | | | | | | | | | | | | | | | | | | | | | | |
(JV-O) | | | 2 | | | | 211 | | | | 25,689 | | | | - | | | 50.00% | | | | - | | | | 12,786 | | | | 1,519 | |
| | | | | | | | | | | | | | | | | | | | | | | | | | | | | | | | |
Individual Investors | | | | | | | | | | | | | | | | | | | | | | | | | | | | | | | | |
Ballard Blocks | | | 2 | | | | 249 | | | | 127,716 | | | | - | | | 49.90% | | | | - | | | | 63,010 | | | | 315 | |
Town and Country Center (2) | | | 1 | | | | 230 | | | | 205,457 | | | | 91,001 | | | 35.00% | | | | 31,850 | | | | 39,239 | | | | (74 | ) |
Others | | | 4 | | | | 499 | | | | 119,730 | | | | 34,495 | | | 50.00% | | | | 17,249 | | | | 62,168 | | | | 1,578 | |
| | | | | | | | | | | | | | | | | | | | | | | | | | | | | | | | |
| | | 114 | | | | 14,883 | | | $ | 3,067,227 | | | $ | 1,557,043 | | | | | | | $ | 534,658 | | | $ | 462,754 | | | $ | 34,169 | |
(1) | The USAA partnership has distributed proceeds from debt refinancing and real estate sales in excess of Regency’s carrying value of its investment resulting in a negative investment balance, which is classified within Accounts Payable and Other Liabilities in the Consolidated Balance Sheets. |
(2) | In January 2020, we purchased an additional 16.6% interest in Town and Country Center, bringing our total ownership interest to 35%. |
| | |
| Supplemental Information | 15 |
Property Transactions
December 31, 2020
(in thousands)
Acquisitions:
Date | Property Name | Co-investment Partner (REG %) | Market | Total GLA | Regency's Share of Purchase Price | Weighted Average Cap Rate | Anchor(s) |
Jan-20 | Country Walk Plaza (1) | NYCRF (70%) | Miami, FL | 101 | $27,740 | | Publix, CVS |
| Property Total | | 101 | $27,740 | 4.8% | |
Dispositions:
Date | Property Name | Co-investment Partner (REG %) | Market | Total GLA | Regency's Share of Purchase Price | | Weighted Average Cap Rate | | Anchor(s) |
Jan-20 | Young Circle Shopping Center | | Hollywood, FL | 65 | $ | 15,750 | | | | | Walgreens |
Jan-20 | Stonewall Shopping Center | | Gainesville, VA | 315 | | 82,625 | | | | | Wegmans, Dick's Sporting Goods, Staples, Bed Bath & Beyond, Michael's, Ross Dress For Less |
Apr-20 | Kent Place | Other (50%) | Denver, CO | 48 | | 9,825 | | | | | King Soopers |
Oct-20 | Whole Foods at Swampscott | | Boston, MA | 36 | | 19,250 | | | | | Whole Foods |
Oct-20 | Jefferson Square | | La Quinta, CA | 38 | | 6,000 | | | | | -- |
Nov-20 | Stonebrook Plaza | GRI (40%) | Chicago, IL | 96 | | 5,760 | | | | | Jewel |
Nov-20 | Old Conneticut Path | NYCR (30%) | Boston, MA | 80 | | 7,050 | | | | | Stop & Shop |
Dec-20 | South Bay Village | | Los Angeles, CA | 108 | | 39,750 | | | | | Homegoods, Wal-Mart, Orchard Supply |
| Income Producing Outparcel(s) | | | | | 4,760 | | | | | |
| Property/Outparcel(s) Total | | 786 | $ | 190,770 | | 5.7% | | |
| | | | | | | | | | | |
| Non-Income Producing Land Total | | | $ | 18,570 | | | | | |
(1) | REG closed on the purchase of its partner’s New York Common Retirement Fund (“NYCRF”), 70% interest. Upon closing this asset became 100% REG owned. |
| | |
| Supplemental Information | 16 |
Summary of In-Process Developments and Redevelopments
December 31, 2020
(in thousands)
In-Process Developments and Redevelopments 1 | |
Shopping Center Name | | Market | | Grocer/Anchor Tenant | | GLA | | | % Leased | | | Project Start | | Est Initial Rent Commencement(a) | | Est Stabilization Year(b) | | REG'S Est Net Project Costs | | | % of Costs Incurred | | | Stabilized Yield +/-© | |
Carytown Exchange 2 | | Richmond, VA | | Publix | | | 46 | | | 80% | | | Q4-2018 | | 2H-2020 | | 2023 | | | 19,595 | | | 65% | | | 5% | |
East San Marco 2 | | Jacksonville, FL | | Publix | | | 59 | | | 74% | | | Q4-2020 | | 2H-2022 | | 2024 | | | 19,519 | | | 23% | | | 7%-8% | |
Eastfield at Baybrook 2 | | Houston, TX | | H.E.B. | | | 53 | | | 100% | | | Q4-2020 | | 2H-2021 | | 2022 | | | 2,337 | | | 84% | | | 7% | |
Bloomingdale Square | | Tampa, FL | | Publix, LA Fitness | | | 252 | | | 94% | | | Q3-2018 | | 2H-2019 | | 2022 | | | 21,327 | | | 88% | | | 8%-9% | |
Market Common Clarendon | | Metro, DC | | Retail/Office Users | | | 130 | | | 3% | | | Q4-2018 | | 2H-2022 | | 2024 | | | 57,691 | | | 54% | | | 8%-9% | |
Point 50 | | Metro, DC | | Grocer | | | 48 | | | 96% | | | Q4-2018 | | 2H-2020 | | 2023 | | | 17,664 | | | 84% | | | 7.8% | |
The Abbot | | Boston, MA | | Retail/Office Users | | | 65 | | | 23% | | | Q2-2019 | | 2H-2022 | | 2024 | | | 55,420 | | | 47% | | | 8%-9% | |
Sheridan Plaza | | Hollywood, FL | | Publix, Burlington | | | 506 | | | 94% | | | Q3-2019 | | 2H-2020 | | 2022 | | | 12,115 | | | 50% | | | 9%-10% | |
West Bird Plaza | | Miami, FL | | Publix | | | 99 | | | 99% | | | Q4-2019 | | 2H-2021 | | 2022 | | | 10,338 | | | 50% | | | 7% | |
Preston Oaks 2 | | Dallas, TX | | H.E.B. | | | 103 | | | 74% | | | Q4-2020 | | 2H-2021 | | 2023 | | | 22,327 | | | 24% | | | 6% | |
Serramonte Center | | San Francisco, CA | | Macy's/Target/Dick's Sporting Goods/ Ross/Nordstrom Rack | | | 917 | | | 88% | | | Q4-2020 | | 2H-2021 | | 2026 | | | 55,000 | | | 22% | | | 5% | |
Various Redevelopments (est costs < $10 million individually) | | | | | | | 1,555 | | | 96% | | | | | | | | | | 26,010 | | | 36% | | | 11% | |
Total In-Process (In Construction) | | | 3,833 | | | 88% | | | | | | | | | $ | 319,342 | | | 46% | | | 7%-8% | |
In Process Development and Redevelopment Descriptions |
Carytown Exchange | | Located in Richmond's most desirable retail corridor, Carytown is a ground up development anchored by Publix and complemented by street retail and structured parking. Construction on Publix, Shop Bldg E, Shop Bldg B and structured parking continue as planned. Project scope now includes construction and leasing of the multi-tenant Building B. Further value creation in the form of additional multi-tenant buildings will remain under review. |
East San Marco | | Located in one of the most desirable areas of Jacksonville, Florida, East San Marco is an infill ground-up retail development anchored by Publix. In addition, an adjacent parcel will be sold to a residential builder for housing. |
Eastfield at Baybrook | | Ground-up development in Houston,TX, featuring the market's leading grocer, H.E.B. The scope for Phase 1A calls for H.E.B. to construct a 106k SF grocery store, along with a fuel center/carwash. |
Bloomingdale Square | | Reconfiguration of the former Walmart box for the relocation and expansion of Publix and HOME centric; backfilling the former Publix box with LA Fitness; construction of an additional 14K SF retail shop building; facade renovations and enhancements to remaining center. |
Market Common Clarendon | | Redevelopment of vacant 1960's era office building into a 130K SF modern, mixed-use building, three floors of creative office, and ground floor retail to complement the existing dominant, mixed-use center in Arlington, VA. |
Point 50 | | Redevelopment includes the demolition of a deteriorated center and develop new 30K SF identified Grocer, and 18K SF of shop space. |
The Abbot | | Generational redevelopment and modernization of 3 historic buildings in the heart of Harvard Square into mixed-use project with retail and office. Entire $1.1M of the property NOI came offline in early 2019 with no NOI in 2020. Construction in Cambridge was halted in late March 2020. Since the ban was lifted effective June 1st 2020, construction has resumed to complete the ground up building. |
Sheridan Plaza | | Repositioning with addition of Burlington, façade renovations and other placemaking enhancement. |
West Bird Plaza | | Redevelopment includes the demolition of Publix and adjacent CVS space and construct new 48K SF Publix; update façade and additional site work improvements. |
Preston Oaks | | Redevelopment includes substantial rebuild following tornado damage of a 101,000 SF, H.E.B. Central Market anchored shopping center located in Dallas, TX. Redevelopment spend is reimbursable through insurance proceeds. |
Serramonte Center | | Redevelopment includes continued densification and enhancement of a premier location and A mall that includes addition of new retail that willl augment the evolving merchandising mix, a new hotel by a best-in-class developer on a ground lease and redevelopment of the former J.C. Penney space. Redevelopment represents multiple phases occuring over approximately 4 years, with expected stabilization around 2026. |
Various Redevelopments (est costs < $10 million individually) | | Various Redevelopment properties where estimated incremental costs are less than $10 Million. |
(1) | Scope, economics and timing of development and redevelopment projects could change materially from estimates provided. Amounts reported are at Regency’s pro-rata share. |
(2) | Ground up development or redevelopment that is excluded from the Same Property NOI pool. |
Note: Regency’s Estimated Net GAAP Project Costs, after additional interest and overhead capitalization, are $331,370 for ground up Developments and Redevelopments In-Process. Percent of costs incurred is 46% for Developments and Redevelopments In-Process.
(a) | Estimated Initial Rent Commencement represents the estimated date that the anchor or first tenants at each project will rent commence. |
(b) | Estimated Stabilization Year represents the estimated first full calendar year that the project will reach the stated stabilized yield. |
(c) | A stabilized yield for a redevelopment property represents the incremental NOI (estimated stabilized NOI less NOI prior to project commencement) over the total project costs. |
| | |
| Supplemental Information | 17 |
Major Developments and Redevelopments Pipeline and Current Year Completions
December 31, 2020
(in thousands)
Select Operating Properties with Near Term Developments and Redevelopment* |
Shopping Center Name | | Market | | GLA | | | % Leased | | | Est Project Start | | REG’s Est Net Project Costs | | Current Description |
Westbard Square | | Bethesda, MD | | | 213 | | | 87% | | | 2021 | | $110,000 - $125,000 | | Redevelopment of a dated multi-parcel project which consists of a Giant anchored retail center, a 3 level garden office building, 2 gas stations, and a vacant senior housing building into a vibrant mixed-use project consisting of 170K SF of new retail anchored by Giant, 200 units of apartments, 100 units of assisted living, and ~100 for-sale townhomes. Estimated incremental project costs include Regency's non-retail co-investment. The core entitlements have been attained, and the project's timing, stabilization and economics are being further analyzed. |
Hancock Center | | Austin, TX | | | 410 | | | 55% | | | 2021 | | $55,000 - $65,000 | | Transformative adaptive reuse of former Sears building (Sears rent ceased in 2/2019) into office and/or retail. Project has intrinsic demand for various commercial uses in this desirable infill market. Several transaction structures are being contemplated including a JV, ground lease or sale. |
Town and Country Center | | Los Angeles, CA | | | 230 | | | 37% | | | 2022 | | $20,000 - $30,000 | | Redevelopment of former 3-level K-Mart box with new retail below 325 mid-rise apartments on a ground lease. Effective January 2020, Regency purchased an additional 16.6% interest, bringing total ownership interest to 35%. As we continue to advance entitlements and position this redevelopment to start, economics and timing of project are being further analyzed. |
Costa Verde Center | | San Diego, CA | | | 179 | | | 77% | | | 2022 | | $175,000 - $200,000 | | Large-scale redevelopment of existing Shopping Center with new retail, office, hotel (on a ground lease) and structured parking, adjacent to new transit station. Entitlements for 575,000 sf of commercial space (retail/office) and a 200 room hotel were approved in December 2020. The project's precise scope, timing, stabilzation and economics are being further analyzed. |
Gateway Plaza at Aventura | | Miami, FL | | | 30 | | | 0% | | | 2022 | | $10,000 - $15,000 | | Located on Biscayne Boulevard in a vibrant sub-market of Miami, project will redevelop existing retail (former Babies R Us box) with potential to add a grocer to the center and additional retail GLA. The project's timing, stabilization and economics are being further analyzed. |
Current Year Development and Redevelopment Completions | |
Shopping Center Name | | Market | | GLA | | | % Leased | | | Project Start | | Est Initial Rent Commencement | | Est Stabilization Year | | REG's Est Net Project Costs | | | % of Costs Incurred | | | Incremental Stabilized Yield | |
The Village at Hunter's Lake | | Tampa, FL | | | 72 | | | 100% | | | Q4-2018 | | 2H-2020 | | 2021 | | | 21,442 | | | 93% | | | 8% | |
Pablo Plaza Ph. II | | Jacksonville, FL | | | 157 | | | 98% | | | Q4-2018 | | 1H-2021 | | 2022 | | | 14,627 | | | 92% | | | 6% | |
Various Redevelopments (est costs < $10 million individually) | | | | | 1,750 | | | 92% | | | | | | | | | | 35,376 | | | 95% | | | 8% | |
Total Completions | | | 1,978 | | | 92% | | | | | | | | | | 71,445 | | | 94% | | | 8% | |
*Selection reflects material under earning assets. Selection does not incorporate all pipeline opportunities.
Note: Scope, economics and timing of development and redevelopment program and projects could change materially from estimates provided.
| | |
| Supplemental Information | 18 |
Leasing Statistics - Wholly Owned and Regency's Pro-Rata Share of Co-investment Partnerships
December 31, 2020
(Retail Operating Properties Only)
Leasing Statistics - Comparable | | | | | | | | | | | | | | | | | |
Total | | Leasing Transactions | | | GLA (in 000s) | | | New Base Rent/Sq. Ft | | | Rent Spread % | | | Weighted Avg. Lease Term | | | Tenant Allowance and Landlord Work/Sq. Ft. | |
4th Quarter 2020 | | | 413 | | | | 1,662 | | | $ | 24.55 | | | 0.6% | | | | 6.1 | | | $ | 7.72 | |
3rd Quarter 2020 | | | 335 | | | | 1,414 | | | | 23.48 | | | 1.2% | | | | 4.9 | | | | 3.23 | |
2nd Quarter 2020 | | | 185 | | | | 1,307 | | | | 17.15 | | | 4.0% | | | | 6.5 | | | | 1.64 | |
1st Quarter 2020 | | | 313 | | | | 1,471 | | | | 22.16 | | | 4.1% | | | | 5.4 | | | | 2.42 | |
Total - 12 months | | | 1,246 | | | | 5,854 | | | $ | 22.04 | | | 2.2% | | | | 5.7 | | | $ | 3.92 | |
| | | | | | | | | | | | | | | | | | | | | | | | |
New Leases | | Leasing Transactions | | | GLA (in 000s) | | | New Base Rent/Sq. Ft | | | Rent Spread % | | | Weighted Avg. Lease Term | | | Tenant Allowance and Landlord Work/Sq. Ft. | |
4th Quarter 2020 | | 91 | | | | 316 | | | $ | 25.34 | | | 1.7% | | | | 9.0 | | | $ | 37.06 | |
3rd Quarter 2020 | | 72 | | | | 183 | | | | 31.80 | | | -3.4% | | | | 7.0 | | | | 19.97 | |
2nd Quarter 2020 | | 23 | | | | 121 | | | | 15.23 | | | 20.1% | | | | 12.9 | | | | 8.00 | |
1st Quarter 2020 | | 61 | | | | 144 | | | | 32.93 | | | -0.9% | | | | 7.7 | | | | 19.81 | |
Total - 12 months | | | 247 | | | | 764 | | | $ | 26.34 | | | 1.3% | | | | 9.0 | | | $ | 24.93 | |
| | | | | | | | | | | | | | | | | | | | | | | | |
Renewals | | Leasing Transactions | | | GLA (in 000s) | | | New Base Rent/Sq. Ft | | | Rent Spread % | | | Weighted Avg. Lease Term | | | Tenant Allowance and Landlord Work/Sq. Ft. | |
4th Quarter 2020 | | | 322 | | | | 1,346 | | | $ | 24.35 | | | 0.3% | | | | 5.4 | | | $ | 0.49 | |
3rd Quarter 2020 | | | 263 | | | | 1,231 | | | | 22.40 | | | 2.2% | | | | 4.6 | | | | 1.04 | |
2nd Quarter 2020 | | | 162 | | | | 1,185 | | | | 17.38 | | | 2.6% | | | | 5.7 | | | | 0.88 | |
1st Quarter 2020 | | | 252 | | | | 1,327 | | | | 21.01 | | | 4.9% | | | | 5.1 | | | | 0.56 | |
Total - 12 months | | | 999 | | | | 5,089 | | | $ | 21.38 | | | 2.4% | | | | 5.2 | | | $ | 0.73 | |
| | | | | | | | | | | | | | | | | | | | | | | | |
Leasing Statistics - Comparable and Non-comparable | | | | | | | | | | | | | | | | | |
Total | | Leasing Transactions | | | GLA (in 000s) | | | New Base Rent/Sq. Ft | | | | | | | Weighted Avg. Lease Term | | | Tenant Allowance and Landlord Work/Sq. Ft. | |
4th Quarter 2020 | | | 480 | | | | 2,153 | | | $ | 23.01 | | | | | | | | 6.0 | | | $ | 9.37 | |
3rd Quarter 2020 | | | 404 | | | | 1,660 | | | | 23.78 | | | | | | | | 4.9 | | | | 5.61 | |
2nd Quarter 2020 | | | 228 | | | | 1,491 | | | | 18.07 | | | | | | | | 6.2 | | | | 2.75 | |
1st Quarter 2020 | | | 370 | | | | 1,651 | | | | 22.64 | | | | | | | | 5.5 | | | | 5.28 | |
Total - 12 months | | | 1,482 | | | | 6,955 | | | $ | 22.10 | | | | | | | | 5.6 | | | $ | 6.11 | |
Notes:
• | All amounts reported at execution. |
• | Number of leasing transactions and GLA leased reported at 100%; All other statistics reported at pro-rata share. |
• | Rent spreads are calculated on a comparable-space, cash basis for new and renewal leases executed and include all teasing transactions, including spaces vacant > 12 months. |
• | Tenant Allowance & Landlord Work are costs required to make the space leasable and include improvements of a space as it relates to a specific lease. These costs include tenant improvements and inducements. |
• | Excludes Non-Retail Properties |
| | |
| Supplemental Information | 19 |
Average Base Rent by CBSA - Wholly Owned and Regency's Pro-Rata Share of Co-investment Partnerships
December 31, 2020
(in thousands)
Largest CBSAs by Population (1) | | Number of Properties | | | GLA | | | % Leased (2) | | | ABR | | | ABR/Sq. Ft. | | | % of Number of Properties | | | % of GLA | | | % of ABR | |
New York-Newark-Jersey City | | 16 | | | | 1,738 | | | | 90.9 | % | | $ | 60,647 | | | $ | 38.40 | | | | 3.9 | % | | | 4.1 | % | | | 6.8 | % |
Los Angeles-Long Beach-Anaheim | | 25 | | | | 2,452 | | | | 94.3 | % | | | 66,329 | | | | 28.67 | | | | 6.1 | % | | | 5.8 | % | | | 7.4 | % |
Chicago-Naperville-Elgin | | 10 | | | | 1,590 | | | | 95.2 | % | | | 29,478 | | | | 19.48 | | | | 2.4 | % | | | 3.8 | % | | | 3.3 | % |
Dallas-Fort Worth-Arlington | | 12 | | | | 773 | | | | 91.0 | % | | | 15,303 | | | | 21.75 | | | | 2.9 | % | | | 1.8 | % | | | 1.7 | % |
Houston-Woodlands-Sugar Land | | 14 | | | | 1,642 | | | | 96.2 | % | | | 29,532 | | | | 18.71 | | | | 3.4 | % | | | 3.9 | % | | | 3.3 | % |
Washington-Arlington-Alexandri | | 27 | | | | 1,880 | | | | 87.7 | % | | | 46,020 | | | | 27.92 | | | | 6.6 | % | | | 4.5 | % | | | 5.1 | % |
Philadelphia-Camden-Wilmington | | 8 | | | | 696 | | | | 90.2 | % | | | 14,437 | | | | 23.00 | | | | 1.9 | % | | | 1.6 | % | | | 1.6 | % |
Miami-Ft Lauderdale-PompanoBch | | 44 | | | | 5,373 | | | | 91.0 | % | | | 104,186 | | | | 21.31 | | | | 10.7 | % | | | 12.7 | % | | | 11.7 | % |
Atlanta-SandySprings-Alpharett | | 22 | | | | 2,065 | | | | 91.5 | % | | | 42,197 | | | | 22.34 | | | | 5.4 | % | | | 4.9 | % | | | 4.7 | % |
Phoenix-Mesa-Chandler | | -- | | | -- | | | -- | | | -- | | | -- | | | -- | | | -- | | | -- | |
Boston-Cambridge-Newton | | | 8 | | | | 898.02 | | | | 90.7 | % | | | 20,355 | | | | 24.99 | | | | 1.9 | % | | | 2.1 | % | | | 2.3 | % |
San Francisco-Oakland-Berkeley | | 22 | | | | 3,780 | | | | 87.5 | % | | | 100,228 | | | | 30.29 | | | | 5.4 | % | | | 8.9 | % | | | 11.2 | % |
Rvrside-San Bernardino-Ontario | | 1 | | | | 99 | | | | 100.0 | % | | | 3,010 | | | | 30.48 | | | | 0.2 | % | | | 0.2 | % | | | 0.3 | % |
Detroit-Warren-Dearborn | | -- | | | -- | | | -- | | | -- | | | -- | | | -- | | | -- | | | -- | |
Seattle-Tacoma-Bellevue | | 16 | | | | 1,164 | | | | 96.6 | % | | | 31,096 | | | | 27.64 | | | | 3.9 | % | | | 2.8 | % | | | 3.5 | % |
Minneapol-St. Paul-Bloomington | | 5 | | | | 205 | | | | 98.5 | % | | | 3,511 | | | | 17.41 | | | | 1.2 | % | | | 0.5 | % | | | 0.4 | % |
San Diego-Chula Vista-Carlsbad | | 11 | | | | 1,541 | | | | 93.7 | % | | | 42,149 | | | | 29.19 | | | | 2.7 | % | | | 3.6 | % | | | 4.7 | % |
Tampa-St Petersburg-Clearwater | | 9 | | | | 1,290 | | | | 92.3 | % | | | 23,049 | | | | 19.34 | | | | 2.2 | % | | | 3.1 | % | | | 2.6 | % |
Denver-Aurora-Lakewood | | 11 | | | | 939 | | | | 94.5 | % | | | 13,660 | | | | 15.40 | | | | 2.7 | % | | | 2.2 | % | | | 1.5 | % |
St. Louis | | 4 | | | | 408 | | | | 100.0 | % | | | 4,402 | | | | 10.78 | | | | 1.0 | % | | | 1.0 | % | | | 0.5 | % |
Baltimore-Columbia-Towson | | 5 | | | | 357 | | | | 90.6 | % | | | 7,683 | | | | 23.76 | | | | 1.2 | % | | | 0.8 | % | | | 0.9 | % |
Charlotte-Concord-Gastonia | | 4 | | | | 232 | | �� | | 87.2 | % | | | 4,414 | | | | 21.79 | | | | 1.0 | % | | | 0.5 | % | | | 0.5 | % |
Orlando-Kissimmee-Sanford | | 8 | | | | 809 | | | | 94.5 | % | | | 13,915 | | | | 18.19 | | | | 1.9 | % | | | 1.9 | % | | | 1.6 | % |
San Antonio-New Braunfels | | -- | | | -- | | | -- | | | -- | | | -- | | | -- | | | -- | | | -- | |
Portland-Vancouver-Hillsboro | | 5 | | | | 436 | | | | 95.8 | % | | | 8,475 | | | | 20.28 | | | | 1.2 | % | | | 1.0 | % | | | 0.9 | % |
Top 25 CBSAs by Population | | 287 | | | | 30,367 | | | | 92.0 | % | | $ | 684,075 | | | $ | 23.37 | | | | 69.8 | % | | | 71.9 | % | | | 76.5 | % |
| | | | | | | | | | | | | | | | | | | | | | | | | | | | | | | | |
CBSAs Ranked 26 - 50 by Population | | | 63 | | | | 6,599 | | | | 91.7 | % | | | 111,952 | | | | 18.44 | | | | 15.3 | % | | | 15.6 | % | | | 12.5 | % |
| | | | | | | | | | | | | | | | | | | | | | | | | | | | | | | | |
CBSAs Ranked 51 - 75 by Population | | | 23 | | | | 2,138 | | | | 94.9 | % | | | 50,526 | | | | 24.56 | | | | 5.6 | % | | | 5.1 | % | | | 5.7 | % |
| | | | | | | | | | | | | | | | | | | | | | | | | | | | | | | | |
CBSAs Ranked 76 - 100 by Population | | | 12 | | | | 760 | | | | 96.6 | % | | | 12,038 | | | | 16.39 | | | | 2.9 | % | | | 1.8 | % | | | 1.3 | % |
| | | | | | | | | | | | | | | | | | | | | | | | | | | | | | | | |
Other CBSAs | | | 26 | | | | 2,377 | | | | 94.4 | % | | | 35,330 | | | | 15.71 | | | | 6.3 | % | | | 5.6 | % | | | 4.0 | % |
| | | | | | | | | | | | | | | | | | | | | | | | | | | | | | | | |
Total All Properties | | | 411 | | | | 42,242 | | | | 92.3 | % | | $ | 893,920 | | | $ | 22.86 | | | | 100 | % | | | 100 | % | | | 100 | % |
(1) | 2020 Population Data Source: Synergos Technologies, Inc. |
(2) | Includes Properties in Development and leases that are executed but have not commenced. |
| | |
| Supplemental Information | 20 |
Significant Tenant Rents - Wholly Owned and Regency's Pro-Rata Share of
Co-investment Partnerships
(Includes Tenants ≥ 0.5% of ABR)
December 31, 2020
(in thousands)
# | | Tenant | | Tenant GLA | | | % of Company- Owned GLA | | | Total Annualized Base Rent | | | % of Total Annualized Base Rent | | | Total # of Leased Stores - 100% Owned and JV | | | # of Leased Stores in JV | |
1 | | Publix | | | 2,827 | | | 6.7% | | | $ | 31,034 | | | 3.5% | | | | 69 | | | 12 | |
2 | | Kroger Co. (1) | | | 2,784 | | | 6.6% | | | | 27,355 | | | 3.1% | | | | 54 | | | 15 | |
3 | | Albertsons Companies, Inc. (2) | | | 1,794 | | | 4.2% | | | | 25,957 | | | 2.9% | | | | 45 | | | 17 | |
4 | | Amazon/Whole Foods | | | 1,099 | | | 2.6% | | | | 23,431 | | | 2.6% | | | | 35 | | | 13 | |
5 | | TJX Companies, Inc. (3) | | | 1,337 | | | 3.2% | | | | 22,705 | | | 2.5% | | | | 62 | | | 20 | |
6 | | CVS | | | 652 | | | 1.5% | | | | 15,345 | | | 1.7% | | | | 56 | | | 19 | |
7 | | Ahold/Delhaize (4) | | | 455 | | | 1.1% | | | | 11,356 | | | 1.3% | | | | 12 | | | 6 | |
8 | | L.A. Fitness Sports Club | | | 487 | | | 1.2% | | | | 9,920 | | | 1.1% | | | | 14 | | | 4 | |
9 | | Nordstrom (5) | | | 320 | | | 0.8% | | | | 9,085 | | | 1.0% | | | | 9 | | | - | |
10 | | Bed Bath & Beyond Inc. (6) | | | 469 | | | 1.1% | | | | 8,876 | | | 1.0% | | | | 18 | | | - | |
11 | | Trader Joe's | | | 271 | | | 0.6% | | | | 8,723 | | | 1.0% | | | | 27 | | | 7 | |
12 | | Ross Dress For Less | | | 545 | | | 1.3% | | | | 8,521 | | | 1.0% | | | | 25 | | | 9 | |
13 | | JPMorgan Chase Bank | | | 132 | | | 0.3% | | | | 7,507 | | | 0.8% | | | | 43 | | | 10 | |
14 | | Gap, Inc (7) | | | 232 | | | 0.5% | | | | 7,328 | | | 0.8% | | | | 18 | | | 3 | |
15 | | Starbucks | | | 137 | | | 0.3% | | | | 7,164 | | | 0.8% | | | | 96 | | | 31 | |
16 | | PETCO Animal Supplies, Inc (8) | | | 286 | | | 0.7% | | | | 7,144 | | | 0.8% | | | | 34 | | | 11 | |
17 | | JAB Holding Company (9) | | | 179 | | | 0.4% | | | | 7,090 | | | 0.8% | | | | 65 | | | 16 | |
18 | | Bank of America | | | 132 | | | 0.3% | | | | 6,945 | | | 0.8% | | | | 43 | | | 16 | |
19 | | Target | | | 570 | | | 1.3% | | | | 6,642 | | | 0.7% | | | | 6 | | | 2 | |
20 | | Wells Fargo Bank | | | 131 | | | 0.3% | | | | 6,587 | | | 0.7% | | | | 48 | | | 18 | |
21 | | H.E. Butt Grocery Company (10) | | | 411 | | | 1.0% | | | | 6,143 | | | 0.7% | | | | 6 | | | 1 | |
22 | | Kohl's | | | 612 | | | 1.4% | | | | 5,867 | | | 0.7% | | | | 8 | | | 2 | |
23 | | Walgreens Boots Alliance (11) | | | 223 | | | 0.5% | | | | 5,509 | | | 0.6% | | | | 22 | | | 9 | |
24 | | Best Buy | | | 229 | | | 0.5% | | | | 5,308 | | | 0.6% | | | | 7 | | | 1 | |
25 | | Dick's Sporting Goods, Inc. | | | 291 | | | 0.7% | | | | 5,010 | | | 0.6% | | | | 5 | | | 1 | |
26 | | T-Mobile (12) | | | 118 | | | 0.3% | | | | 5,005 | | | 0.6% | | | | 82 | | | 31 | |
27 | | Ulta | | | 166 | | | 0.4% | | | | 4,847 | | | 0.5% | | | | 18 | | | 2 | |
28 | | AT&T, Inc (13) | | | 107 | | | 0.3% | | | | 4,712 | | | 0.5% | | | | 59 | | | 14 | |
29 | | Staples, Inc. | | | 183 | | | 0.4% | | | | 4,192 | | | 0.5% | | | | 10 | | | 1 | |
30 | | Wal-Mart | | | 630 | | | 1.5% | | | | 4,186 | | | 0.5% | | | | 6 | | | - | |
| | Top Tenants | | | 17,809 | | | 42.0% | | | $ | 309,494 | | | 34.6% | | | | 1,002 | | | | 291 | |
(1) | Kroger 20 / King Soopers 11 / Harris Teeter 9 / Ralphs 9 / Mariano's Fresh Market 3 / Quality Food Centers 2 |
(2) | Safeway 21 / VONS 7 / Albertson's 4 / Acme Markets 3 / Shaw's 3 / Tom Thumb 3 / Randalls Food & Drug 2 / Star Market 2 |
(3) | TJ Maxx 26 / Homegoods 17 / Marshalls 16 / Homesense 2 / Sierra Trading Post 1 |
(4) | Giant 8 / Stop & Shop 3 / Food Lion 1 |
(6) | Bed Bath & Beyond 11 / Cost Plus World Market 5 / Buy Buy Baby 1 / Harmon Face Values 1 |
(7) | Old Navy 13 / The Gap 1 / Athleta 2 / Banana Republic 1 / GAP BR Factory 1 |
(8) | Petco 28 / Unleashed by Petco 6 |
(9) | Panera 32 / Einstein Bros Bagels 12 / Peet's' Coffee & Tea 11 / Bruegger’s Bagel 4 / Krispy Kreme 3 / Noah’s NY Bagels 3 |
(10) | H.E.B. 5 / Central Market 1 |
(11) | Walgreens 21 / Duane Reade 1 |
(12) | T-Mobile 48 / Sprint 23 / MetroPC 10 / Connectivity Source 1 |
| | |
| Supplemental Information | 21 |
Tenant Lease Expirations - Wholly Owned and Regency's Pro-Rata Share of Co-investment Partnerships
December 31, 2020
(GLA in thousands)
| | | | | | Anchor Tenants(1) | | | | | | | | | |
Year | | GLA | | | Percent of GLA | | | Percent of Total ABR(3) | | | ABR | |
MTM(4) | | | 144 | | | 0.4% | | | 0.2% | | | $ | 12.47 | |
2021 | | | 1,143 | | | 3.0% | | | 1.6% | | | | 12.53 | |
2022 | | | 3,030 | | | 7.8% | | | 5.0% | | | | 14.67 | |
2023 | | | 2,568 | | | 6.6% | | | 4.6% | | | | 15.93 | |
2024 | | | 3,391 | | | 8.8% | | | 6.0% | | | | 15.50 | |
2025 | | | 2,989 | | | 7.7% | | | 5.4% | | | | 16.01 | |
2026 | | | 2,388 | | | 6.2% | | | 4.3% | | | | 16.01 | |
2027 | | | 1,293 | | | 3.3% | | | 2.6% | | | | 17.54 | |
2028 | | | 1,599 | | | 4.1% | | | 3.3% | | | | 18.30 | |
2029 | | | 1,187 | | | 3.1% | | | 1.7% | | | | 12.38 | |
2030 | | | 1,223 | | | 3.2% | | | 2.4% | | | | 17.08 | |
10 Year Total | | | 20,955 | | | 54.0% | | | 37.2% | | | $ | 15.64 | |
Thereafter | | | 3,822 | | | 10.0% | | | 7.1% | | | | 16.26 | |
| | | 24,777 | | | 64.0% | | | 44.3% | | | $ | 15.73 | |
| | | | | | Shop Tenants(2) | | | | | | | | | |
Year | | GLA | | | Percent of GLA | | | Percent of Total ABR(3) | | | ABR | |
MTM(4) | | | 348 | | | 0.9% | | | 1.3% | | | $ | 34.14 | |
2021 | | | 1,785 | | | 4.6% | | | 6.8% | | | | 33.37 | |
2022 | | | 2,266 | | | 5.9% | | | 8.6% | | | | 33.34 | |
2023 | | | 2,044 | | | 5.3% | | | 8.0% | | | | 34.51 | |
2024 | | | 1,836 | | | 4.7% | | | 7.1% | | | | 34.26 | |
2025 | | | 1,784 | | | 4.6% | | | 7.3% | | | | 36.02 | |
2026 | | | 1,024 | | | 2.6% | | | 4.3% | | | | 36.61 | |
2027 | | | 662 | | | 1.7% | | | 2.8% | | | | 37.89 | |
2028 | | | 617 | | | 1.6% | | | 2.9% | | | | 41.01 | |
2029 | | | 505 | | | 1.3% | | | 2.3% | | | | 40.07 | |
2030 | | | 543 | | | 1.4% | | | 2.4% | | | | 38.56 | |
10 Year Total | | | 13,414 | | | 34.7% | | | 53.9% | | | $ | 35.32 | |
Thereafter | | | 476 | | | 41.6% | | | 1.9% | | | | 34.79 | |
| | | 13,889 | | | 35.0% | | | 55.8% | | | $ | 35.30 | |
| | | | | | All Tenants | | | | | | | | | |
Year | | GLA | | | Percent of GLA | | | Percent of Total ABR(3) | | | ABR | |
MTM(4) | | | 492 | | | 1.3% | | | 1.6% | | | $ | 27.80 | |
2021 | | | 2,928 | | | 7.6% | | | 8.4% | | | | 25.24 | |
2022 | | | 5,296 | | | 13.7% | | | 13.6% | | | | 22.66 | |
2023 | | | 4,612 | | | 11.9% | | | 12.7% | | | | 24.17 | |
2024 | | | 5,227 | | | 13.5% | | | 13.1% | | | | 22.09 | |
2025 | | | 4,774 | | | 12.3% | | | 12.7% | | | | 23.49 | |
2026 | | | 3,412 | | | 8.8% | | | 8.6% | | | | 22.19 | |
2027 | | | 1,955 | | | 5.1% | | | 5.4% | | | | 24.43 | |
2028 | | | 2,216 | | | 5.7% | | | 6.2% | | | | 24.62 | |
2029 | | | 1,692 | | | 4.4% | | | 4.0% | | | | 20.64 | |
2030 | | | 1,767 | | | 4.6% | | | 4.8% | | | | 23.68 | |
10 Year Total | | | 34,368 | | | 88.9% | | | 91.1% | | | $ | 23.32 | |
Thereafter | | | 4,298 | | | 11.1% | | | 8.9% | | | | 18.31 | |
| | | 38,666 | | | 100% | | | 100% | | | $ | 22.76 | |
Note: Reflects commenced leases only. Does not account for contractual rent steps and assumes that no tenants exercise renewal options.
| (1) | Anchor tenants represent any tenant occupying at least 10,000 square feet. |
| (2) | Shop tenants represent any tenant occupying less than 10,000 square feet. |
| (3) | Total Annual Base Rent ("ABR") excludes additional rent such as percentage rent, common area maintenance, real estate taxes, and insurance reimbursements. | |
| (4) | Month to month lease or in process of renewal. |
| | |
| Supplemental Information | 22 |
Portfolio Summary Report By State
December 31, 2020
(GLA in thousands)
| | | | | | JVs at 100% | REG's pro-rata share | REG's pro-rata share | REG's pro-rata share | | | | |
Property Name | JV | REG % | State | CBSA | GLA | GLA | % Leased | % Leased - Retail Operating Properties | Retailer-Owned GLA | Grocery Anchor GLA | Major Tenants (1) | Avg. Base Rent PSF |
| 200 Potrero | | | CA | San Francisco-Oakland-Berkeley | 31 | 31 | 100.0% | | | | Gizmo Art Production, INC. | $13.77 |
| 4S Commons Town Center | M | 85% | CA | San Diego-Chula Vista-Carlsbad | 245 | 245 | 95.5% | | | 68 | Ralphs, Jimbo's...Naturally!, Bed Bath & Beyond, Cost Plus World Market, CVS, Ace Hardware, Ulta | $33.24 |
| Amerige Heights Town Center | | | CA | Los Angeles-Long Beach-Anaheim | 89 | 89 | 97.4% | | 143 | 58 | Albertsons, (Target) | $29.48 |
| Balboa Mesa Shopping Center | | | CA | San Diego-Chula Vista-Carlsbad | 207 | 207 | 98.7% | | | 42 | Von's, Kohl's, CVS | $26.91 |
| Bayhill Shopping Center | GRI | 40% | CA | San Francisco-Oakland-Berkeley | 122 | 49 | 98.7% | | | 32 | Mollie Stone's Market, CVS | $26.55 |
| Blossom Valley | USAA | 20% | CA | San Jose-Sunnyvale-Santa Clara | 93 | 19 | 100.0% | | | 34 | Safeway, CVS | $28.21 |
| Brea Marketplace | GRI | 40% | CA | Los Angeles-Long Beach-Anaheim | 352 | 141 | 100.0% | | | 25 | Sprout's, Target, 24 Hour Fitness, Big 5 Sporting Goods, Childtime Childcare, Old Navy, Chef's Toys | $20.83 |
| Circle Center West | | | CA | Los Angeles-Long Beach-Anaheim | 64 | 64 | 100.0% | | | | Marshalls | $30.69 |
(2) | Circle Marina Center | | | CA | Los Angeles-Long Beach-Anaheim | 118 | 118 | 93.3% | | | | Staples, Big 5 Sporting Goods, Centinela Feed & Pet Supplies | $29.21 |
| Clayton Valley Shopping Center | | | CA | San Francisco-Oakland-Berkeley | 260 | 260 | 92.1% | | | 14 | Grocery Outlet, Central, CVS, Dollar Tree, Ross Dress For Less | $23.26 |
| Corral Hollow | RC | 25% | CA | Stockton | 167 | 42 | 99.2% | | | 66 | Safeway, CVS | $17.63 |
(2) | Costa Verde Center | | | CA | San Diego-Chula Vista-Carlsbad | 179 | 179 | 69.5% | | | 40 | Bristol Farms, Bookstar, The Boxing Club | $26.26 |
| Culver Center | | | CA | Los Angeles-Long Beach-Anaheim | 217 | 217 | 87.7% | | | 37 | Ralphs, Best Buy, LA Fitness, Sit N' Sleep | $30.97 |
| Diablo Plaza | | | CA | San Francisco-Oakland-Berkeley | 63 | 63 | 98.5% | | 53 | 53 | (Safeway), (CVS), Beverages & More! | $41.43 |
| El Camino Shopping Center | | | CA | Los Angeles-Long Beach-Anaheim | 136 | 136 | 97.6% | | | 31 | Bristol Farms, CVS | $37.25 |
| El Cerrito Plaza | | | CA | San Francisco-Oakland-Berkeley | 256 | 256 | 92.1% | | 67 | 78 | (Lucky's), Trader Joe's, (CVS), Bed Bath & Beyond, Barnes & Noble, Jo-Ann Fabrics, PETCO, Ross Dress For Less | $29.78 |
| El Norte Pkwy Plaza | | | CA | San Diego-Chula Vista-Carlsbad | 91 | 91 | 97.0% | | | 42 | Von's, Children's Paradise, ACE Hardware | $21.90 |
| Encina Grande | | | CA | San Francisco-Oakland-Berkeley | 106 | 106 | 99.1% | | | 38 | Whole Foods, Walgreens | $33.55 |
| Five Points Shopping Center | GRI | 40% | CA | Santa Maria-Santa Barbara | 145 | 58 | 97.0% | | | 35 | Smart & Final, CVS, Ross Dress for Less, Big 5 Sporting Goods, PETCO | $29.76 |
| French Valley Village Center | | | CA | Rvrside-San Bernardino-Ontario | 99 | 99 | 100.0% | | | 44 | Stater Bros, CVS | $27.55 |
| Friars Mission Center | | | CA | San Diego-Chula Vista-Carlsbad | 147 | 147 | 96.9% | | | 55 | Ralphs, CVS | $36.46 |
| Gateway 101 | | | CA | San Francisco-Oakland-Berkeley | 92 | 92 | 100.0% | | 212 | | (Home Depot), (Best Buy), Target, Nordstrom Rack | $34.95 |
| Gelson's Westlake Market Plaza | | | CA | Oxnard-Thousand Oaks-Ventura | 85 | 85 | 100.0% | | | 40 | Gelson's Markets, John of Italy Salon & Spa | $29.74 |
| Golden Hills Plaza | | | CA | San Luis Obispo-Paso Robles | 244 | 244 | 94.1% | | | | Lowe's, Bed Bath & Beyond, TJ Maxx | $7.42 |
| Granada Village | GRI | 40% | CA | Los Angeles-Long Beach-Anaheim | 226 | 91 | 85.7% | | | 24 | Sprout's Markets, Rite Aid, PETCO, Homegoods | $26.75 |
| Hasley Canyon Village | USAA | 20% | CA | Los Angeles-Long Beach-Anaheim | 66 | 13 | 97.5% | | | 52 | Ralphs | $26.87 |
| Heritage Plaza | | | CA | Los Angeles-Long Beach-Anaheim | 230 | 230 | 93.2% | | | 44 | Ralphs, CVS, Daiso, Mitsuwa Marketplace | $40.86 |
| Supplemental Information | 23 |
Portfolio Summary Report By State
December 31, 2020
(GLA in thousands)
| | | | | | JVs at 100% | REG's pro-rata share | REG's pro-rata share | REG's pro-rata share | | | | |
Property Name | JV | REG % | State | CBSA | GLA | GLA | % Leased | % Leased - Retail Operating Properties | Retailer-Owned GLA | Grocery Anchor GLA | Major Tenants (1) | Avg. Base Rent PSF |
| Laguna Niguel Plaza | GRI | 40% | CA | Los Angeles-Long Beach-Anaheim | 42 | 17 | 100.0% | | 39 | 39 | (Albertsons), CVS | $29.36 |
| Marina Shores | C | 20% | CA | Los Angeles-Long Beach-Anaheim | 68 | 14 | 98.3% | | | 26 | Whole Foods, PETCO | $36.45 |
| Mariposa Shopping Center | GRI | 40% | CA | San Jose-Sunnyvale-Santa Clara | 127 | 51 | 94.0% | | | 43 | Safeway, CVS, Ross Dress for Less | $21.23 |
| Morningside Plaza | | | CA | Los Angeles-Long Beach-Anaheim | 91 | 91 | 94.8% | | | 43 | Stater Bros. | $23.69 |
| Navajo Shopping Center | GRI | 40% | CA | San Diego-Chula Vista-Carlsbad | 102 | 41 | 92.2% | | | 44 | Albertsons, Rite Aid, O'Reilly Auto Parts | $14.21 |
| Newland Center | | | CA | Los Angeles-Long Beach-Anaheim | 152 | 152 | 98.9% | | | 58 | Albertsons | $27.31 |
| Oak Shade Town Center | | | CA | Sacramento-Roseville-Folsom | 104 | 104 | 99.3% | | | 40 | Safeway, Office Max, Rite Aid | $22.36 |
| Oakbrook Plaza | | | CA | Oxnard-Thousand Oaks-Ventura | 83 | 83 | 89.8% | | | 44 | Gelson's Markets, (Longs Drug) | $19.03 |
(2) | Parnassus Heights Medical | RLP | 50% | CA | San Francisco-Oakland-Berkeley | 146 | 73 | 92.4% | | | | University of CA | $87.48 |
| Persimmon Place | | | CA | San Francisco-Oakland-Berkeley | 153 | 153 | 96.1% | | | 40 | Whole Foods, Nordstrom Rack, Homegoods | $36.71 |
| Plaza Escuela | | | CA | San Francisco-Oakland-Berkeley | 154 | 154 | 84.3% | | | | The Container Store, Trufusion, Talbots, The Cheesecake Factory | $44.69 |
| Plaza Hermosa | | | CA | Los Angeles-Long Beach-Anaheim | 95 | 95 | 100.0% | | | 37 | Von's, CVS | $27.66 |
| Pleasant Hill Shopping Center | GRI | 40% | CA | San Francisco-Oakland-Berkeley | 227 | 91 | 100.0% | | | | Target, Burlington, Ross Dress for Less, Homegoods | $24.13 |
(2) | Pleasanton Plaza | | | CA | San Francisco-Oakland-Berkeley | 163 | 163 | 11.0% | | | | Cost Plus World Market | $23.10 |
| Point Loma Plaza | GRI | 40% | CA | San Diego-Chula Vista-Carlsbad | 205 | 82 | 93.4% | | | 50 | Von's, Jo-Ann Fabrics, Marshalls, UFC Gym | $21.29 |
| Potrero Center | | | CA | San Francisco-Oakland-Berkeley | 227 | 227 | 96.8% | | | 60 | Safeway, Decathlon Sport, 24 Hour Fitness, Ross Dress for Less, Petco, Party City | $32.98 |
| Powell Street Plaza | | | CA | San Francisco-Oakland-Berkeley | 166 | 166 | 97.0% | | | 10 | Trader Joe's, Beverages & More!, Ross Dress For Less, Marshalls, Old Navy | $34.89 |
| Prairie City Crossing | | | CA | Sacramento-Roseville-Folsom | 90 | 90 | 100.0% | | | 55 | Safeway | $21.30 |
| Raley's Supermarket | C | 20% | CA | Sacramento-Roseville-Folsom | 63 | 13 | 100.0% | | | 63 | Raley's | $14.00 |
| Ralphs Circle Center | | | CA | Los Angeles-Long Beach-Anaheim | 60 | 60 | 100.0% | | | 35 | Ralphs | $18.91 |
| Rancho San Diego Village | GRI | 40% | CA | San Diego-Chula Vista-Carlsbad | 153 | 61 | 96.5% | | | 40 | Smart & Final, (Longs Drug), 24 Hour Fitness | $23.16 |
| Rona Plaza | | | CA | Los Angeles-Long Beach-Anaheim | 52 | 52 | 97.7% | | | 37 | Superior Super Warehouse | $21.71 |
| San Carlos Marketplace | | | CA | San Francisco-Oakland-Berkeley | 154 | 154 | 100.0% | | | | TJ Maxx, Best Buy, PetSmart, Bassett Furniture | $36.27 |
| Scripps Ranch Marketplace | | | CA | San Diego-Chula Vista-Carlsbad | 132 | 132 | 98.7% | | | 57 | Vons, CVS | $32.14 |
| San Leandro Plaza | | | CA | San Francisco-Oakland-Berkeley | 50 | 50 | 100.0% | | 38 | 38 | (Safeway), (CVS) | $37.22 |
| Seal Beach | C | 20% | CA | Los Angeles-Long Beach-Anaheim | 97 | 19 | 95.7% | | | 48 | Safeway, CVS | $26.45 |
(2) | Sequoia Station | | | CA | San Francisco-Oakland-Berkeley | 103 | 103 | 86.9% | | 62 | 62 | (Safeway), CVS, Barnes & Noble, Old Navy | $43.63 |
| Serramonte Center | | | CA | San Francisco-Oakland-Berkeley | 1070 | 1070 | 88.0% | | | | Macy's, Target, Dick's Sporting Goods, Dave & Buster's, Nordstrom Rack, Buy Buy Baby, Cost Plus World Market, DAISO, H&M, Old Navy, Party City, Ross, TJ Maxx, Uniqlo | $25.66 |
| Supplemental Information | 24 |
Portfolio Summary Report By State
December 31, 2020
(GLA in thousands)
| | | | | | JVs at 100% | REG's pro-rata share | REG's pro-rata share | REG's pro-rata share | | | | |
Property Name | JV | REG % | State | CBSA | GLA | GLA | % Leased | % Leased - Retail Operating Properties | Retailer-Owned GLA | Grocery Anchor GLA | Major Tenants (1) | Avg. Base Rent PSF |
| Shoppes at Homestead | | | CA | San Jose-Sunnyvale-Santa Clara | 113 | 113 | 96.9% | | 53 | | (Orchard Supply Hardware), CVS, Crunch Fitness | $24.00 |
| Silverado Plaza | GRI | 40% | CA | Napa | 85 | 34 | 96.3% | | | 32 | Nob Hill, CVS | $21.61 |
| Snell & Branham Plaza | GRI | 40% | CA | San Jose-Sunnyvale-Santa Clara | 92 | 37 | 96.4% | | | 53 | Safeway | $20.39 |
| Talega Village Center | | | CA | Los Angeles-Long Beach-Anaheim | 102 | 102 | 95.9% | | | 46 | Ralphs | $22.39 |
| Tassajara Crossing | | | CA | San Francisco-Oakland-Berkeley | 146 | 146 | 97.6% | | | 56 | Safeway, CVS, Alamo Hardware | $23.79 |
| The Hub Hillcrest Market | | | CA | San Diego-Chula Vista-Carlsbad | 149 | 149 | 96.8% | | | 52 | Ralphs, Trader Joe's | $40.74 |
| The Marketplace | | | CA | Sacramento-Roseville-Folsom | 111 | 111 | 98.6% | | | 35 | Safeway,CVS, Petco | $26.51 |
(2) | The Pruneyard | | | CA | San Jose-Sunnyvale-Santa Clara | 260 | 260 | 97.3% | | | 13 | Trader Joe's, The Sports Basement, Camera Cinemas, Marshalls | $39.76 |
| Town and Country Center | O | 35% | CA | Los Angeles-Long Beach-Anaheim | 230 | 81 | 37.5% | | | 41 | Whole Foods, CVS, Citibank | $48.94 |
| Tustin Legacy | | | CA | Los Angeles-Long Beach-Anaheim | 112 | 112 | 97.9% | | | 44 | Stater Bros, CVS | $32.34 |
| Twin Oaks Shopping Center | GRI | 40% | CA | Los Angeles-Long Beach-Anaheim | 98 | 39 | 99.1% | | | 41 | Ralphs, Rite Aid | $21.49 |
| Twin Peaks | | | CA | San Diego-Chula Vista-Carlsbad | 208 | 208 | 98.0% | | | 45 | Target, Grocer | $21.79 |
| Valencia Crossroads | | | CA | Los Angeles-Long Beach-Anaheim | 173 | 173 | 100.0% | | | 35 | Whole Foods, Kohl's | $28.18 |
| Village at La Floresta | | | CA | Los Angeles-Long Beach-Anaheim | 87 | 87 | 100.0% | | | 37 | Whole Foods | $35.18 |
| Von's Circle Center | | | CA | Los Angeles-Long Beach-Anaheim | 151 | 151 | 98.4% | | | 45 | Von's, Ross Dress for Less, Planet Fitness | $22.20 |
| West Park Plaza | | | CA | San Jose-Sunnyvale-Santa Clara | 88 | 88 | 95.9% | | | 25 | Safeway, Rite Aid | $18.48 |
| Westlake Village Plaza and Center | | | CA | Oxnard-Thousand Oaks-Ventura | 201 | 201 | 94.9% | | | 72 | Von's, Sprouts, (CVS) | $39.43 |
| Willows Shopping Center | | | CA | San Francisco-Oakland-Berkeley | 249 | 249 | 67.8% | | | | REI, UFC Gym, Old Navy, Ulta | $29.31 |
| Woodman Van Nuys | | | CA | Los Angeles-Long Beach-Anaheim | 108 | 108 | 99.2% | | | 78 | El Super | $16.61 |
| Woodside Central | | | CA | San Francisco-Oakland-Berkeley | 81 | 81 | 90.0% | | 113 | | (Target),Chuck E. Cheese, Marshalls | $25.62 |
| Ygnacio Plaza | GRI | 40% | CA | San Francisco-Oakland-Berkeley | 110 | 44 | 97.0% | | | | Sports Basement,TJ Maxx | $37.72 |
| | | | CA | | 11,413 | 9,504 | 91.9% | 93.5% | 780 | 2,670 | | |
| Applewood Shopping Ctr | GRI | 40% | CO | Denver-Aurora-Lakewood | 354 | 141 | 90.2% | | | 71 | King Soopers, Hobby Lobby, Applejack Liquors, PetSmart, Homegoods, Sierra Trading Post, Ulta | $14.98 |
| Alcove On Arapahoe | GRI | 40% | CO | Boulder | 159 | 64 | 80.9% | | | 44 | Safeway, Jo-Ann Fabrics, PETCO, HomeGoods | $18.37 |
| Belleview Square | | | CO | Denver-Aurora-Lakewood | 117 | 117 | 98.8% | | | 65 | King Soopers | $20.49 |
| Boulevard Center | | | CO | Denver-Aurora-Lakewood | 79 | 79 | 78.1% | | 53 | 53 | (Safeway), One Hour Optical | $30.43 |
| Buckley Square | | | CO | Denver-Aurora-Lakewood | 116 | 116 | 95.5% | | | 62 | King Soopers, Ace Hardware | $11.56 |
| Centerplace of Greeley III | | | CO | Greeley | 119 | 119 | 100.0% | | | | Hobby Lobby, Best Buy, TJ Maxx | $11.48 |
| Cherrywood Square Shop Ctr | GRI | 40% | CO | Denver-Aurora-Lakewood | 97 | 39 | 94.2% | | | 72 | King Soopers | $10.62 |
| Crossroads Commons | C | 20% | CO | Boulder | 143 | 29 | 91.2% | | | 66 | Whole Foods, Barnes & Noble | $29.36 |
| Crossroads Commons II | C | 20% | CO | Boulder | 19 | 4 | 93.4% | | | | (Whole Foods), (Barnes & Noble) | $35.69 |
| Falcon Marketplace | | | CO | Colorado Springs | 22 | 22 | 93.8% | | 184 | 50 | (Wal-Mart) | $24.10 |
| Hilltop Village | | | CO | Denver-Aurora-Lakewood | 100 | 100 | 97.8% | | | 66 | King Soopers | $11.45 |
| Littleton Square | | | CO | Denver-Aurora-Lakewood | 99 | 99 | 98.5% | | | 78 | King Soopers | $11.25 |
| Lloyd King Center | | | CO | Denver-Aurora-Lakewood | 83 | 83 | 93.3% | | | 61 | King Soopers | $11.76 |
| Marketplace at Briargate | | | CO | Colorado Springs | 29 | 29 | 96.3% | | 66 | 66 | (King Soopers) | $32.82 |
| Supplemental Information | 25 |
Portfolio Summary Report By State
December 31, 2020
(GLA in thousands)
| | | | | | JVs at 100% | REG's pro-rata share | REG's pro-rata share | REG's pro-rata share | | | | |
Property Name | JV | REG % | State | CBSA | GLA | GLA | % Leased | % Leased - Retail Operating Properties | Retailer-Owned GLA | Grocery Anchor GLA | Major Tenants (1) | Avg. Base Rent PSF |
| Monument Jackson Creek | | | CO | Colorado Springs | 85 | 85 | 100.0% | | | 70 | King Soopers | $12.60 |
| Ralston Square Shopping Center | GRI | 40% | CO | Denver-Aurora-Lakewood | 83 | 33 | 97.0% | | | 55 | King Soopers | $11.97 |
| Shops at Quail Creek | | | CO | Denver-Aurora-Lakewood | 38 | 38 | 96.3% | | 100 | 100 | (King Soopers) | $26.84 |
| Stroh Ranch | | | CO | Denver-Aurora-Lakewood | 93 | 93 | 100.0% | | | 70 | King Soopers | $13.65 |
| Woodmen Plaza | | | CO | Colorado Springs | 116 | 116 | 91.8% | | | 70 | King Soopers | $13.06 |
| | | | CO | | 1,951 | 1,407 | 93.2% | 94.4% | 403 | 1,119 | | |
| 22 Crescent Road | | | CT | Bridgeport-Stamford-Norwalk | 4 | 4 | 100.0% | | | | - | $60.00 |
| 91 Danbury Road | | | CT | Bridgeport-Stamford-Norwalk | 5 | 5 | 100.0% | | | | - | $27.94 |
| Black Rock | M | 80% | CT | Bridgeport-Stamford-Norwalk | 98 | 98 | 89.4% | | | | Old Navy, The Clubhouse | $30.70 |
| Brick Walk | M | 80% | CT | Bridgeport-Stamford-Norwalk | 122 | 122 | 94.8% | | | | - | $44.38 |
| Brookside Plaza | | | CT | Hartford-E Hartford-Middletown | 220 | 220 | 80.0% | | | 60 | ShopRite, Bed, Bath & Beyond, TJ Maxx, PetSmart, Staples, Burlington Coat Factory | $15.29 |
| Compo Acres Shopping Center | | | CT | Bridgeport-Stamford-Norwalk | 43 | 43 | 95.9% | | | 12 | Trader Joe's | $52.36 |
| Copps Hill Plaza | | | CT | Bridgeport-Stamford-Norwalk | 185 | 185 | 100.0% | | | 59 | Stop & Shop, Kohl's, Rite Aid | $13.70 |
| Corbin's Corner | GRI | 40% | CT | Hartford-E Hartford-Middletown | 186 | 74 | 95.8% | | | 10 | Trader Joe's, Best Buy, Edge Fitness, Old Navy, The Tile Shop, Total Wine and More | $30.40 |
| Danbury Green | | | CT | Bridgeport-Stamford-Norwalk | 124 | 124 | 95.6% | | | 12 | Trader Joe's, Hilton Garden Inn, DSW, Staples, Rite Aid, Warehouse Wines & Liquors | $25.34 |
| Darinor Plaza | | | CT | Bridgeport-Stamford-Norwalk | 153 | 153 | 100.0% | | | | Kohl's, Old Navy, Party City | $18.99 |
| Fairfield Center | M | 80% | CT | Bridgeport-Stamford-Norwalk | 94 | 94 | 92.8% | | | | Fairfield University Bookstore, Merril Lynch | $32.82 |
| Post Road Plaza | | | CT | Bridgeport-Stamford-Norwalk | 20 | 20 | 100.0% | | | 11 | Trader Joe's | $54.83 |
| Southbury Green | | | CT | New Haven-Milford | 156 | 156 | 84.6% | | | 60 | ShopRite, Homegoods | $22.84 |
| Westport Row (fka The Village Center) | | | CT | Bridgeport-Stamford-Norwalk | 90 | 90 | 74.9% | | | 22 | The Fresh Market | $42.71 |
| Walmart Norwalk | | | CT | Bridgeport-Stamford-Norwalk | 142 | 142 | 100.0% | | | 112 | WalMart, HomeGoods | $0.56 |
| | | | CT | | 1,643 | 1,531 | 92.1% | 91.9% | 0 | 358 | | |
| Shops at The Columbia | RC | 25% | DC | Washington-Arlington-Alexandri | 23 | 6 | 100.0% | | | 12 | Trader Joe's | $39.31 |
| Spring Valley Shopping Center | GRI | 40% | DC | Washington-Arlington-Alexandri | 17 | 7 | 82.4% | | | | - | $108.55 |
| | | | DC | | 40 | 12 | 92.5% | 90.5% | 0 | 12 | | |
| Pike Creek | | | DE | Philadelphia-Camden-Wilmington | 232 | 232 | 94.6% | | | 49 | Acme Markets | $15.01 |
| Shoppes of Graylyn | GRI | 40% | DE | Philadelphia-Camden-Wilmington | 64 | 26 | 89.7% | | | | Rite Aid | $24.40 |
| | | | DE | | 296 | 257 | 93.5% | 94.1% | 0 | 49 | | |
| Alafaya Village | | | FL | Orlando-Kissimmee-Sanford | 38 | 38 | 93.9% | | 58 | 58 | (Lucky's) | $23.19 |
| Anastasia Plaza | | | FL | Jacksonville | 102 | 102 | 95.9% | | | 49 | Publix | $13.94 |
| Atlantic Village | | | FL | Jacksonville | 110 | 110 | 97.4% | | | | LA Fitness, Pet Supplies Plus | $17.56 |
| Aventura Shopping Center | | | FL | Miami-Ft Lauderdale-PompanoBch | 97 | 97 | 97.5% | | | 49 | Publix, CVS | $37.14 |
| Supplemental Information | 26 |
Portfolio Summary Report By State
December 31, 2020
(GLA in thousands)
| | | | | | JVs at 100% | REG's pro-rata share | REG's pro-rata share | REG's pro-rata share | | | | |
Property Name | JV | REG % | State | CBSA | GLA | GLA | % Leased | % Leased - Retail Operating Properties | Retailer-Owned GLA | Grocery Anchor GLA | Major Tenants (1) | Avg. Base Rent PSF |
| Aventura Square | | | FL | Miami-Ft Lauderdale-PompanoBch | 144 | 144 | 77.8% | | | | Bed, Bath & Beyond, DSW, Jewelry Exchange, Old Navy | $38.77 |
(2) | Banco Popular Building | | | FL | Miami-Ft Lauderdale-PompanoBch | 33 | 33 | 0.0% | | | | - | $0.00 |
| Berkshire Commons | | | FL | Naples-Marco Island | 110 | 110 | 97.9% | | | 66 | Publix, Walgreens | $14.74 |
| Bird 107 Plaza | | | FL | Miami-Ft Lauderdale-PompanoBch | 40 | 40 | 92.9% | | | | Walgreens | $21.44 |
| Bird Ludlam | | | FL | Miami-Ft Lauderdale-PompanoBch | 192 | 192 | 96.8% | | | 44 | Winn-Dixie, CVS, Goodwill | $24.05 |
| Bloomingdale Square | | | FL | Tampa-St Petersburg-Clearwater | 252 | 252 | 94.5% | | | 48 | Publix, Bealls, Dollar Tree, Home Centric, LA Fitness | $18.56 |
| Boca Village Square | | | FL | Miami-Ft Lauderdale-PompanoBch | 92 | 92 | 94.2% | | | 36 | Publix, CVS | $22.54 |
| Boynton Lakes Plaza | | | FL | Miami-Ft Lauderdale-PompanoBch | 110 | 110 | 97.9% | | | 46 | Publix, Citi Trends, Pet Supermarket | $16.69 |
| Boynton Plaza | | | FL | Miami-Ft Lauderdale-PompanoBch | 105 | 105 | 97.2% | | | 54 | Publix, CVS | $21.45 |
| Brooklyn Station on Riverside | | | FL | Jacksonville | 50 | 50 | 97.2% | | | 20 | The Fresh Market | $26.74 |
| Caligo Crossing | | | FL | Miami-Ft Lauderdale-PompanoBch | 11 | 11 | 61.0% | | 98 | | (Kohl's) | $48.33 |
| Carriage Gate | | | FL | Tallahassee | 73 | 73 | 95.9% | | | 13 | Trader Joe's, TJ Maxx | $23.81 |
| Cashmere Corners | | | FL | Port St. Lucie | 86 | 86 | 80.0% | | | 44 | WalMart | $14.04 |
| Charlotte Square | | | FL | Punta Gorda | 91 | 91 | 89.2% | | | 44 | WalMart, Buffet City | $10.92 |
| Chasewood Plaza | | | FL | Miami-Ft Lauderdale-PompanoBch | 152 | 152 | 96.4% | | | 54 | Publix, Pet Smart | $26.61 |
| Concord Shopping Plaza | | | FL | Miami-Ft Lauderdale-PompanoBch | 309 | 309 | 97.1% | | | 78 | Winn-Dixie, Home Depot, Big Lots, Dollar Tree, YouFit Health Club | $13.06 |
| Coral Reef Shopping Center | | | FL | Miami-Ft Lauderdale-PompanoBch | 75 | 75 | 91.2% | | | 25 | Aldi, Walgreens | $32.80 |
| Corkscrew Village | | | FL | Cape Coral-Fort Myers | 82 | 82 | 91.5% | | | 51 | Publix | $14.28 |
| Country Walk Plaza | | | FL | Miami-Ft Lauderdale-PompanoBch | 101 | 101 | 90.5% | | | 40 | Publix, CVS | $20.37 |
| Countryside Shops | | | FL | Miami-Ft Lauderdale-PompanoBch | 193 | 193 | 70.4% | | | 46 | Publix, Ross Dress for Less | $24.21 |
| Courtyard Shopping Center | | | FL | Jacksonville | 137 | 137 | 100.0% | | 63 | 63 | (Publix), Target | $3.50 |
(2) | East San Marco | | | FL | Jacksonville | 59 | 59 | 71.3% | | | 39 | Publix | $26.20 |
| Fleming Island | | | FL | Jacksonville | 132 | 132 | 97.3% | | 130 | 48 | Publix, (Target), PETCO, Planet Fitness | $16.92 |
| Fountain Square | | | FL | Miami-Ft Lauderdale-PompanoBch | 177 | 177 | 89.1% | | 140 | 46 | Publix,(Target), Ross Dress for Less, TJ Maxx, Ulta | $26.88 |
| Gardens Square | | | FL | Miami-Ft Lauderdale-PompanoBch | 90 | 90 | 98.7% | | | 42 | Publix | $18.61 |
| Glengary Shoppes | | | FL | North Port-Sarasota-Bradenton | 93 | 93 | 97.0% | | | | Best Buy, Barnes & Noble | $19.55 |
| Shoppes of Grande Oak | | | FL | Cape Coral-Fort Myers | 79 | 79 | 100.0% | | | 54 | Publix | $16.78 |
| Greenwood Shopping Centre | | | FL | Miami-Ft Lauderdale-PompanoBch | 133 | 133 | 93.2% | | | 50 | Publix, Beall's | $15.99 |
| Hammocks Town Center | | | FL | Miami-Ft Lauderdale-PompanoBch | 187 | 187 | 97.5% | | 86 | 40 | Publix, Metro-Dade Public Library, (Kendall Ice Arena), YouFit Health Club, Goodwill, CVS | $17.53 |
| Hibernia Pavilion | | | FL | Jacksonville | 51 | 51 | 92.0% | | | 39 | Publix | $16.33 |
| Homestead McDonald's | | | FL | Miami-Ft Lauderdale-PompanoBch | 4 | 4 | 100.0% | | | | - | $27.74 |
| John's Creek Center | C | 20% | FL | Jacksonville | 75 | 15 | 100.0% | | | 45 | Publix | $16.03 |
| Julington Village | C | 20% | FL | Jacksonville | 82 | 16 | 100.0% | | | 51 | Publix, (CVS) | $16.73 |
| Kirkman Shoppes | | | FL | Orlando-Kissimmee-Sanford | 115 | 115 | 93.8% | | | | LA Fitness, Walgreens | $23.85 |
| Supplemental Information | 27 |
Portfolio Summary Report By State
December 31, 2020
(GLA in thousands)
| | | | | | JVs at 100% | REG's pro-rata share | REG's pro-rata share | REG's pro-rata share | | | | |
Property Name | JV | REG % | State | CBSA | GLA | GLA | % Leased | % Leased - Retail Operating Properties | Retailer-Owned GLA | Grocery Anchor GLA | Major Tenants (1) | Avg. Base Rent PSF |
| Lake Mary Centre | | | FL | Orlando-Kissimmee-Sanford | 360 | 360 | 94.3% | | | 25 | The Fresh Market, Academy Sports, Hobby Lobby, LA Fitness, Ross Dress for Less, Office Depot | $16.72 |
| Lantana Outparcels | | | FL | Miami-Ft Lauderdale-PompanoBch | 11 | 11 | 58.3% | | | | - | $22.22 |
| Mandarin Landing | | | FL | Jacksonville | 140 | 140 | 89.1% | | | 50 | Whole Foods, Office Depot, Aveda Institute | $18.15 |
| Millhopper Shopping Center | | | FL | Gainesville | 83 | 83 | 100.0% | | | 46 | Publix | $18.11 |
| Naples Walk | | | FL | Naples-Marco Island | 125 | 125 | 96.8% | | | 51 | Publix | $17.86 |
| Newberry Square | | | FL | Gainesville | 181 | 181 | 92.4% | | | 40 | Publix, Floor & Décor, Dollar Tree | $9.38 |
| Nocatee Town Center | | | FL | Jacksonville | 112 | 112 | 97.7% | | | 54 | Publix | $20.88 |
| Northgate Square | | | FL | Tampa-St Petersburg-Clearwater | 75 | 75 | 93.5% | | | 48 | Publix | $14.77 |
| Oakleaf Commons | | | FL | Jacksonville | 74 | 74 | 96.2% | | | 46 | Publix | $15.61 |
| Ocala Corners | | | FL | Tallahassee | 87 | 87 | 95.9% | | | 61 | Publix | $15.12 |
| Old St Augustine Plaza | | | FL | Jacksonville | 248 | 248 | 100.0% | | | 52 | Publix, Burlington Coat Factory, Hobby Lobby, LA Fitness, Ross Dress for Less | $11.01 |
| Pablo Plaza | | | FL | Jacksonville | 161 | 161 | 96.6% | | | 34 | Whole Foods, Office Depot, Marshalls, HomeGoods, PetSmart | $17.14 |
| Pavillion | | | FL | Naples-Marco Island | 168 | 168 | 96.2% | | | | LA Fitness, Paragon Theaters, J. Lee Salon Suites | $21.84 |
| Pine Island | | | FL | Miami-Ft Lauderdale-PompanoBch | 255 | 255 | 97.5% | | | 40 | Publix, Burlington Coat Factory, Beall's Outlet, YouFit Health Club | $14.63 |
| Pine Ridge Square | | | FL | Miami-Ft Lauderdale-PompanoBch | 118 | 118 | 97.0% | | | 17 | The Fresh Market, Bed, Bath & Beyond, Marshalls, Ulta | $18.33 |
| Pine Tree Plaza | | | FL | Jacksonville | 63 | 63 | 98.4% | | | 38 | Publix | $14.77 |
(2) | Pinecrest Place | | | FL | Miami-Ft Lauderdale-PompanoBch | 70 | 70 | 94.3% | | 173 | 47 | Whole Foods, (Target) | $39.99 |
| Plaza Venezia | C | 20% | FL | Orlando-Kissimmee-Sanford | 202 | 40 | 98.9% | | | 51 | Publix, Eddie V's | $27.53 |
| Point Royale Shopping Center | | | FL | Miami-Ft Lauderdale-PompanoBch | 202 | 202 | 92.4% | | | 45 | Winn-Dixie, Burlington Coat Factory, Pasteur Medical Center, Planet Fitness | $15.97 |
| Prosperity Centre | | | FL | Miami-Ft Lauderdale-PompanoBch | 124 | 124 | 95.1% | | | | Bed, Bath & Beyond, Office Depot, TJ Maxx, CVS | $22.46 |
| Regency Square | | | FL | Tampa-St Petersburg-Clearwater | 352 | 352 | 92.7% | | 66 | | AMC Theater, (Best Buy), (Macdill), Dollar Tree, Five Below, Marshall's, Michael's, PETCO, Shoe Carnival, Staples, TJ Maxx, Ulta, Old Navy | $19.18 |
| Ryanwood Square | | | FL | Sebastian-Vero Beach | 115 | 115 | 90.5% | | | 40 | Publix, Beall's, Harbor Freight Tools | $11.63 |
| Salerno Village | | | FL | Port St. Lucie | 5 | 5 | 100.0% | | | | - | $16.53 |
| Sawgrass Promenade | | | FL | Miami-Ft Lauderdale-PompanoBch | 107 | 107 | 88.5% | | | 36 | Publix, Walgreens, Dollar Tree | $12.28 |
| Seminole Shoppes | O | 50% | FL | Jacksonville | 87 | 44 | 97.4% | | | 54 | Publix | $22.52 |
| Sheridan Plaza | | | FL | Miami-Ft Lauderdale-PompanoBch | 507 | 507 | 93.8% | | | 66 | Publix, Kohl's, LA Fitness, Office Depot, Ross Dress for Less, Pet Supplies Plus, Wellmax | $19.07 |
| Shoppes @ 104 | | | FL | Miami-Ft Lauderdale-PompanoBch | 112 | 112 | 92.8% | | | 46 | Winn-Dixie, CVS | $19.54 |
| Shoppes at Bartram Park | O | 50% | FL | Jacksonville | 135 | 67 | 95.4% | | 97 | 45 | Publix, (Kohl's), (Tutor Time) | $20.77 |
| Supplemental Information | 28 |
Portfolio Summary Report By State
December 31, 2020
(GLA in thousands)
| | | | | | JVs at 100% | REG's pro-rata share | REG's pro-rata share | REG's pro-rata share | | | | |
Property Name | JV | REG % | State | CBSA | GLA | GLA | % Leased | % Leased - Retail Operating Properties | Retailer-Owned GLA | Grocery Anchor GLA | Major Tenants (1) | Avg. Base Rent PSF |
| Shoppes at Lago Mar | | | FL | Miami-Ft Lauderdale-PompanoBch | 83 | 83 | 90.8% | | | 42 | Publix, YouFit Health Club | $15.29 |
| Shoppes at Sunlake Centre | | | FL | Tampa-St Petersburg-Clearwater | 111 | 111 | 98.7% | | | 46 | Publix | $21.86 |
| Shoppes of Jonathan's Landing | | | FL | Miami-Ft Lauderdale-PompanoBch | 27 | 27 | 100.0% | | 54 | 54 | (Publix) | $26.07 |
| Shoppes of Oakbrook | | | FL | Miami-Ft Lauderdale-PompanoBch | 200 | 200 | 63.8% | | | 44 | Publix, Tuesday Morning, Duffy's Sports Bar, CVS | $17.17 |
| Shoppes of Pebblebrook Plaza | O | 50% | FL | Naples-Marco Island | 77 | 38 | 100.0% | | | 61 | Publix, (Walgreens) | $15.69 |
| Shoppes of Silver Lakes | | | FL | Miami-Ft Lauderdale-PompanoBch | 127 | 127 | 92.5% | | | 48 | Publix, Goodwill | $19.79 |
| Shoppes of Sunset | | | FL | Miami-Ft Lauderdale-PompanoBch | 22 | 22 | 94.8% | | | | - | $25.78 |
| Shoppes of Sunset II | | | FL | Miami-Ft Lauderdale-PompanoBch | 28 | 28 | 67.5% | | | | - | $22.92 |
| Shops at John's Creek | | | FL | Jacksonville | 15 | 15 | 100.0% | | | | - | $24.79 |
| Shops at Skylake | | | FL | Miami-Ft Lauderdale-PompanoBch | 287 | 287 | 91.5% | | | 51 | Publix, LA Fitness, TJ Maxx, Goodwill | $24.03 |
| South Beach Regional | | | FL | Jacksonville | 308 | 308 | 85.8% | | | 13 | Trader Joe's, Home Depot, Ross Dress for Less, Bed Bath & Beyond, Staples | $16.56 |
| South Point | | | FL | Sebastian-Vero Beach | 65 | 65 | 97.8% | | | 45 | Publix | $17.07 |
| Starke | | | FL | Jacksonville | 13 | 13 | 100.0% | | | | CVS | $27.05 |
| Suncoast Crossing | | | FL | Tampa-St Petersburg-Clearwater | 118 | 118 | 95.2% | | 143 | | Kohl's, (Target) | $6.76 |
| Tamarac Town Square | | | FL | Miami-Ft Lauderdale-PompanoBch | 125 | 125 | 72.3% | | | 38 | Publix, Dollar Tree | $12.79 |
| The Grove | NYC | 30% | FL | Orlando-Kissimmee-Sanford | 152 | 46 | 95.4% | | | 52 | Publix, LA Fitness | $21.36 |
| The Plaza at St. Lucie West | | | FL | Port St. Lucie | 27 | 27 | 93.6% | | | | - | $23.78 |
(2) | The Village at Hunter's Lake | | | FL | Tampa-St Petersburg-Clearwater | 72 | 72 | 100.0% | | | 29 | Sprouts | $27.43 |
| Town and Country | | | FL | Orlando-Kissimmee-Sanford | 78 | 78 | 97.9% | | | | Ross Dress for Less | $10.85 |
| Town Square | | | FL | Tampa-St Petersburg-Clearwater | 44 | 44 | 76.9% | | | | PETCO | $35.19 |
| Treasure Coast Plaza | | | FL | Sebastian-Vero Beach | 134 | 134 | 94.6% | | | 59 | Publix, TJ Maxx | $16.97 |
| Unigold Shopping Center | | | FL | Orlando-Kissimmee-Sanford | 115 | 115 | 91.5% | | | 31 | Lucky's, YouFit Health Club, Ross Dress for Less | $15.34 |
| University Commons | | | FL | Miami-Ft Lauderdale-PompanoBch | 180 | 180 | 100.0% | | | 51 | Whole Foods, Nordstrom Rack, Barnes & Noble, Bed Bath & Beyond | $32.49 |
| Veranda Shoppes | NYC | 30% | FL | Miami-Ft Lauderdale-PompanoBch | 45 | 13 | 97.3% | | | 29 | Publix | $27.11 |
| Village Center | | | FL | Tampa-St Petersburg-Clearwater | 187 | 187 | 80.2% | | | 50 | Publix, Walgreens | $23.83 |
| Waterstone Plaza | | | FL | Miami-Ft Lauderdale-PompanoBch | 61 | 61 | 100.0% | | | 46 | Publix | $17.19 |
| Welleby Plaza | | | FL | Miami-Ft Lauderdale-PompanoBch | 110 | 110 | 90.5% | | | 47 | Publix, Dollar Tree | $13.67 |
| Wellington Town Square | | | FL | Miami-Ft Lauderdale-PompanoBch | 112 | 112 | 97.2% | | | 45 | Publix, CVS | $31.11 |
| West Bird Plaza | | | FL | Miami-Ft Lauderdale-PompanoBch | 99 | 99 | 98.5% | | | 38 | - | $24.77 |
| West Lake Shopping Center | | | FL | Miami-Ft Lauderdale-PompanoBch | 101 | 101 | 95.4% | | | 46 | Winn-Dixie, CVS | $19.30 |
| Westchase | | | FL | Tampa-St Petersburg-Clearwater | 79 | 79 | 100.0% | | | 51 | Publix | $17.01 |
| Westport Plaza | | | FL | Miami-Ft Lauderdale-PompanoBch | 47 | 47 | 100.0% | | | 28 | Publix | $20.54 |
| Willa Springs | USAA | 20% | FL | Orlando-Kissimmee-Sanford | 90 | 18 | 95.7% | | | 44 | Publix | $21.60 |
| | | | FL | | 11,678 | 11,031 | 92.8% | 92.9% | 1,107 | 3,503 | | |
| Ashford Place | | | GA | Atlanta-SandySprings-Alpharett | 53 | 53 | 96.7% | | | | Harbor Freight Tools | $22.45 |
| Briarcliff La Vista | | | GA | Atlanta-SandySprings-Alpharett | 43 | 43 | 100.0% | | | | Michael's | $21.98 |
| Supplemental Information | 29 |
Portfolio Summary Report By State
December 31, 2020
(GLA in thousands)
| | | | | | JVs at 100% | REG's pro-rata share | REG's pro-rata share | REG's pro-rata share | | | | |
Property Name | JV | REG % | State | CBSA | GLA | GLA | % Leased | % Leased - Retail Operating Properties | Retailer-Owned GLA | Grocery Anchor GLA | Major Tenants (1) | Avg. Base Rent PSF |
| Briarcliff Village | | | GA | Atlanta-SandySprings-Alpharett | 189 | 189 | 98.4% | | | 43 | Publix, Party City, Shoe Carnival, TJ Maxx, Burlington | $16.82 |
| Bridgemill Market | | | GA | Atlanta-SandySprings-Alpharett | 89 | 89 | 84.7% | | | 38 | Publix | $17.12 |
| Brighten Park | | | GA | Atlanta-SandySprings-Alpharett | 137 | 137 | 86.7% | | | 25 | Lidl, Dance 101 | $28.00 |
| Buckhead Court | | | GA | Atlanta-SandySprings-Alpharett | 49 | 49 | 100.0% | | | | - | $28.56 |
| Buckhead Station | | | GA | Atlanta-SandySprings-Alpharett | 234 | 234 | 100.0% | | | | Nordstrom Rack, TJ Maxx, Bed Bath & Beyond, Saks Off Fifth, DSW, Cost Plus World Market, Old Navy, Ulta | $24.43 |
| Cambridge Square | | | GA | Atlanta-SandySprings-Alpharett | 71 | 71 | 42.8% | | | 41 | - | $24.24 |
| Chastain Square | | | GA | Atlanta-SandySprings-Alpharett | 92 | 92 | 98.4% | | | 37 | Publix | $22.63 |
| Cornerstone Square | | | GA | Atlanta-SandySprings-Alpharett | 80 | 80 | 100.0% | | | 18 | Aldi, CVS, HealthMarkets Insurance, Diazo Specialty Blueprint | $17.77 |
| Sope Creek Crossing | | | GA | Atlanta-SandySprings-Alpharett | 99 | 99 | 95.5% | | | 45 | Publix | $16.32 |
| Dunwoody Hall | USAA | 20% | GA | Atlanta-SandySprings-Alpharett | 86 | 17 | 93.8% | | | 44 | Publix | $20.31 |
| Dunwoody Village | | | GA | Atlanta-SandySprings-Alpharett | 121 | 121 | 92.3% | | | 18 | The Fresh Market, Walgreens, Dunwoody Prep | $20.16 |
| Howell Mill Village | | | GA | Atlanta-SandySprings-Alpharett | 92 | 92 | 98.5% | | | 31 | Publix, Walgreens | $24.01 |
| Paces Ferry Plaza | | | GA | Atlanta-SandySprings-Alpharett | 82 | 82 | 99.9% | | | 30 | Whole Foods | $38.69 |
| Piedmont Peachtree Crossing | | | GA | Atlanta-SandySprings-Alpharett | 152 | 152 | 80.5% | | | 56 | Kroger, Binders Art Supplies & Frames | $20.48 |
| Powers Ferry Square | | | GA | Atlanta-SandySprings-Alpharett | 101 | 101 | 100.0% | | | | HomeGoods, PETCO | $32.24 |
| Powers Ferry Village | | | GA | Atlanta-SandySprings-Alpharett | 79 | 79 | 87.3% | | | 48 | Publix, The Juice Box | $10.17 |
| Russell Ridge | | | GA | Atlanta-SandySprings-Alpharett | 101 | 101 | 93.3% | | | 63 | Kroger | $12.90 |
| Sandy Springs | | | GA | Atlanta-SandySprings-Alpharett | 116 | 116 | 90.8% | | | 12 | Trader Joe's, Fox's, Peter Glenn Ski & Sports | $23.41 |
| The Shops at Hampton Oaks | | | GA | Atlanta-SandySprings-Alpharett | 21 | 21 | 30.1% | | | | (CVS) | $11.07 |
| Williamsburg at Dunwoody | | | GA | Atlanta-SandySprings-Alpharett | 45 | 45 | 79.6% | | | | - | $26.77 |
| | | | GA | | 2,133 | 2,065 | 91.5% | 91.5% | 0 | 551 | | |
| Civic Center Plaza | GRI | 40% | IL | Chicago-Naperville-Elgin | 265 | 106 | 96.1% | | | 87 | Super H Mart, Home Depot, O'Reilly Automotive, King Spa | $11.29 |
| Clybourn Commons | | | IL | Chicago-Naperville-Elgin | 32 | 32 | 78.3% | | | | PETCO | $36.82 |
| Glen Oak Plaza | | | IL | Chicago-Naperville-Elgin | 63 | 63 | 89.2% | | | 12 | Trader Joe's, Walgreens, Northshore University Healthsystems | $24.99 |
| Hinsdale | | | IL | Chicago-Naperville-Elgin | 185 | 185 | 92.1% | | | 57 | Whole Foods, Goodwill, Charter Fitness, Petco | $15.72 |
(2) | Mellody Farm | | | IL | Chicago-Naperville-Elgin | 259 | 259 | 97.3% | | | 45 | Whole Foods, Nordstrom Rack, REI, HomeGoods, Barnes & Noble, West Elm | $28.51 |
| Riverside Sq & River's Edge | GRI | 40% | IL | Chicago-Naperville-Elgin | 169 | 68 | 97.5% | | | 74 | Mariano's Fresh Market, Dollar Tree, Party City, Blink Fitness | $17.39 |
| Roscoe Square | GRI | 40% | IL | Chicago-Naperville-Elgin | 140 | 56 | 100.0% | | | 51 | Mariano's Fresh Market, Ashley Furniture, Walgreens | $21.83 |
| Westchester Commons | | | IL | Chicago-Naperville-Elgin | 139 | 139 | 92.4% | | | 80 | Mariano's Fresh Market, Goodwill | $18.34 |
| Supplemental Information | 30 |
Portfolio Summary Report By State
December 31, 2020
(GLA in thousands)
| | | | | | JVs at 100% | REG's pro-rata share | REG's pro-rata share | REG's pro-rata share | | | | |
Property Name | JV | REG % | State | CBSA | GLA | GLA | % Leased | % Leased - Retail Operating Properties | Retailer-Owned GLA | Grocery Anchor GLA | Major Tenants (1) | Avg. Base Rent PSF |
| Willow Festival | | | IL | Chicago-Naperville-Elgin | 404 | 404 | 96.9% | | | 60 | Whole Foods, Lowe's, CVS, HomeGoods, REI, Best Buy, Ulta | $17.99 |
| | | | IL | | 1,655 | 1,311 | 95.6% | 95.1% | 0 | 467 | | |
| Shops on Main | M | 94% | IN | Chicago-Naperville-Elgin | 279 | 279 | 95.8% | | | 40 | Whole Foods, Dick's Sporting Goods, Ross Dress for Less, HomeGoods, DSW, Nordstrom Rack, Marshalls | $15.85 |
| Willow Lake Shopping Center | GRI | 40% | IN | Indianapolis-Carmel-Anderson | 86 | 34 | 62.0% | | 64 | 64 | (Kroger) | $17.59 |
| Willow Lake West Shopping Center | GRI | 40% | IN | Indianapolis-Carmel-Anderson | 53 | 21 | 78.5% | | | 12 | Trader Joe's | $26.99 |
| | | | IN | | 418 | 335 | 86.7% | 91.2% | 64 | 116 | | |
| Fellsway Plaza | M | 75% | MA | Boston-Cambridge-Newton | 158 | 158 | 84.2% | | | 61 | Stop & Shop, Planet Fitness | $25.07 |
| Northborough Crossing | NYC | 30% | MA | Worcester | 646 | 194 | 96.6% | | | 139 | Wegmans, BJ's Wholesale Club, Kohl's,Dick's Sporting Goods, Pottery Barn Outlet, TJ Maxx, Michael's, PetSmart, Homegoods, Old Navy, Homesense | $13.36 |
| Shaw's at Plymouth | | | MA | Boston-Cambridge-Newton | 60 | 60 | 100.0% | | | 60 | Shaw's | $17.58 |
| Shops at Saugus | | | MA | Boston-Cambridge-Newton | 87 | 87 | 90.8% | | | 11 | Trader Joe's, La-Z-Boy, PetSmart | $29.81 |
| Star's at Cambridge | | | MA | Boston-Cambridge-Newton | 66 | 66 | 100.0% | | | 66 | Star Market | $37.44 |
| Star's at Quincy | | | MA | Boston-Cambridge-Newton | 101 | 101 | 100.0% | | | 101 | Star Market | $21.48 |
| Star's at West Roxbury | | | MA | Boston-Cambridge-Newton | 76 | 76 | 100.0% | | | 55 | Shaw's | $25.10 |
| The Abbot | | | MA | Boston-Cambridge-Newton | 65 | 65 | 22.7% | | | | - | $0.00 |
| Twin City Plaza | | | MA | Boston-Cambridge-Newton | 285 | 285 | 100.0% | | | 63 | Shaw's, Marshall's, Extra Space Storage, Walgreens, K&G Fashion, Dollar Tree, Everfitness, Formlabs | $21.30 |
| | | | MA | | 1,544 | 1,092 | 93.2% | 91.7% | 0 | 556 | | |
| Burnt Mills | C | 20% | MD | Washington-Arlington-Alexandri | 31 | 6 | 100.0% | | | 9 | Trader Joe's | $40.42 |
| Cloppers Mill Village | GRI | 40% | MD | Washington-Arlington-Alexandri | 137 | 55 | 89.0% | | | 70 | Shoppers Food Warehouse, CVS, Dollar Tree | $17.80 |
| Festival at Woodholme | GRI | 40% | MD | Baltimore-Columbia-Towson | 81 | 32 | 85.3% | | | 10 | Trader Joe's | $39.80 |
| Firstfield Shopping Center | GRI | 40% | MD | Washington-Arlington-Alexandri | 22 | 9 | 74.7% | | | | - | $44.05 |
| Parkville Shopping Center | GRI | 40% | MD | Baltimore-Columbia-Towson | 165 | 66 | 96.0% | | | 41 | Giant, Parkville Lanes, Dollar Tree, Petco, The Cellar Parkville | $16.25 |
| Southside Marketplace | GRI | 40% | MD | Baltimore-Columbia-Towson | 125 | 50 | 95.5% | | | 44 | Shoppers Food Warehouse | $21.82 |
| Takoma Park | GRI | 40% | MD | Washington-Arlington-Alexandri | 104 | 42 | 100.0% | | | 64 | Lidl | $13.94 |
| Valley Centre | GRI | 40% | MD | Baltimore-Columbia-Towson | 220 | 88 | 81.5% | | | 18 | Aldi,TJ Maxx, Ross Dress for Less, PetSmart, Michael's | $16.93 |
| Village at Lee Airpark | | | MD | Baltimore-Columbia-Towson | 121 | 121 | 93.6% | | 75 | 63 | Giant, (Sunrise) | $29.21 |
| Watkins Park Plaza | GRI | 40% | MD | Washington-Arlington-Alexandri | 111 | 45 | 100.0% | | | | LA Fitness, CVS | $27.45 |
| Westbard Square | | | MD | Washington-Arlington-Alexandri | 213 | 213 | 86.6% | | | 55 | Giant, Citgo, Bowlmor AMF | $31.35 |
| Woodmoor Shopping Center | GRI | 40% | MD | Washington-Arlington-Alexandri | 69 | 28 | 98.4% | | | | CVS | $34.08 |
| | | | MD | | 1,400 | 754 | 91.2% | 90.6% | 75 | 374 | | |
| Fenton Marketplace | | | MI | Flint | 97 | 97 | 100.0% | | | | Family Farm & Home, Michael's | $8.64 |
| Supplemental Information | 31 |
Portfolio Summary Report By State
December 31, 2020
(GLA in thousands)
| | | | | | JVs at 100% | REG's pro-rata share | REG's pro-rata share | REG's pro-rata share | | | | |
Property Name | JV | REG % | State | CBSA | GLA | GLA | % Leased | % Leased - Retail Operating Properties | Retailer-Owned GLA | Grocery Anchor GLA | Major Tenants (1) | Avg. Base Rent PSF |
| | | | MI | | 97 | 97 | 100.0% | 100.0% | 0 | 0 | | |
| Apple Valley Square | RC | 25% | MN | Minneapol-St. Paul-Bloomington | 176 | 44 | 100.0% | | 87 | | Jo-Ann Fabrics, Experience Fitness, (Burlington Coat Factory), (Aldi), Savers, PETCO | $16.12 |
| Cedar Commons (fka Calhoun Commons) | RC | 25% | MN | Minneapol-St. Paul-Bloomington | 66 | 17 | 97.6% | | | 50 | Whole Foods | $27.84 |
| Colonial Square | GRI | 40% | MN | Minneapol-St. Paul-Bloomington | 93 | 37 | 100.0% | | | 44 | Lund's | $25.43 |
| Rockford Road Plaza | GRI | 40% | MN | Minneapol-St. Paul-Bloomington | 204 | 82 | 99.3% | | | | Kohl's, PetSmart, HomeGoods, TJ Maxx | $13.49 |
| Rockridge Center | C | 20% | MN | Minneapol-St. Paul-Bloomington | 125 | 25 | 92.0% | | | 89 | CUB Foods | $13.53 |
| | | | MN | | 665 | 205 | 98.0% | 98.5% | 87 | 183 | | |
| Brentwood Plaza | | | MO | St. Louis | 60 | 60 | 100.0% | | | 52 | Schnucks | $11.29 |
| Bridgeton | | | MO | St. Louis | 71 | 71 | 100.0% | | 130 | 63 | Schnucks, (Home Depot) | $12.26 |
| Dardenne Crossing | | | MO | St. Louis | 67 | 67 | 100.0% | | | 63 | Schnucks | $11.05 |
| Kirkwood Commons | | | MO | St. Louis | 210 | 210 | 100.0% | | 258 | 136 | Walmart, (Target), (Lowe's), TJ Maxx, HomeGoods, Famous Footwear | $10.05 |
| | | | MO | | 408 | 408 | 100.0% | 100.0% | 388 | 314 | | |
| Carmel Commons | | | NC | Charlotte-Concord-Gastonia | 135 | 135 | 79.1% | | | 14 | The Fresh Market, Chuck E. Cheese, Party City | $23.96 |
| Cochran Commons | C | 20% | NC | Charlotte-Concord-Gastonia | 66 | 13 | 100.0% | | | 42 | Harris Teeter, (Walgreens) | $16.99 |
| Market at Colonnade Center | | | NC | Raleigh-Cary | 58 | 58 | 100.0% | | | 40 | Whole Foods | $27.82 |
| Glenwood Village | | | NC | Raleigh-Cary | 43 | 43 | 100.0% | | | 28 | Harris Teeter | $16.63 |
| Harris Crossing | | | NC | Raleigh-Cary | 65 | 65 | 100.0% | | | 53 | Harris Teeter | $9.50 |
| Holly Park | | | NC | Raleigh-Cary | 160 | 160 | 100.0% | | | 12 | DSW, Trader Joe's, Ross Dress For Less, Staples, US Fitness Products, Jerry's Artarama, Pet Supplies Plus, Ulta | $17.92 |
| Lake Pine Plaza | | | NC | Raleigh-Cary | 88 | 88 | 100.0% | | | 58 | Harris Teeter | $13.43 |
(2) | Midtown East | O | 50% | NC | Raleigh-Cary | 159 | 79 | 98.2% | | | 120 | Wegmans | $23.64 |
| Providence Commons | RC | 25% | NC | Charlotte-Concord-Gastonia | 74 | 19 | 100.0% | | | 50 | Harris Teeter | $19.09 |
| Ridgewood Shopping Center | C | 20% | NC | Raleigh-Cary | 93 | 19 | 86.3% | | | 30 | Whole Foods, Walgreens | $18.82 |
| Shops at Erwin Mill | M | 55% | NC | Durham-Chapel Hill | 91 | 91 | 94.7% | | | 53 | Harris Teeter | $18.56 |
| Shoppes of Kildaire | GRI | 40% | NC | Raleigh-Cary | 145 | 58 | 97.8% | | | 46 | Trader Joe's, Aldi, Fitness Connection, Staples | $18.91 |
| Southpoint Crossing | | | NC | Durham-Chapel Hill | 103 | 103 | 98.4% | | | 59 | Harris Teeter | $16.47 |
| Sutton Square | C | 20% | NC | Raleigh-Cary | 101 | 20 | 86.8% | | | 24 | The Fresh Market | $20.51 |
| Village District (fka Cameron Village) | C | 30% | NC | Raleigh-Cary | 558 | 167 | 90.2% | | | 87 | Harris Teeter, The Fresh Market, Wake Public Library, Walgreens, Talbots, Great Outdoor Provision Co., York Properties,The Cheshire Cat Gallery, Crunch Fitness Select Club, Bailey's Fine Jewelry, Sephora | $25.06 |
| Village Plaza | C | 20% | NC | Durham-Chapel Hill | 74 | 15 | 100.0% | | | 42 | Whole Foods, Community Worx | $22.07 |
| Willow Oaks | | | NC | Charlotte-Concord-Gastonia | 65 | 65 | 97.9% | | | 49 | Publix | $17.32 |
| Supplemental Information | 32 |
Portfolio Summary Report By State
December 31, 2020
(GLA in thousands)
| | | | | | JVs at 100% | REG's pro-rata share | REG's pro-rata share | REG's pro-rata share | | | | |
Property Name | JV | REG % | State | CBSA | GLA | GLA | % Leased | % Leased - Retail Operating Properties | Retailer-Owned GLA | Grocery Anchor GLA | Major Tenants (1) | Avg. Base Rent PSF |
| Woodcroft Shopping Center | | | NC | Durham-Chapel Hill | 90 | 90 | 100.0% | | | 41 | Food Lion, ACE Hardware | $13.87 |
| | | | NC | | 2,167 | 1,288 | 94.3% | 95.3% | 0 | 848 | | |
| Chimney Rock | | | NJ | New York-Newark-Jersey City | 218 | 218 | 99.3% | | | 50 | Whole Foods, Nordstrom Rack, Saks Off 5th, The Container Store, Cost Plus World Market, Ulta | $36.78 |
| District at Metuchen | C | 20% | NJ | New York-Newark-Jersey City | 67 | 13 | 100.0% | | | 44 | Whole Foods | $29.76 |
| Haddon Commons | GRI | 40% | NJ | Philadelphia-Camden-Wilmington | 54 | 22 | 100.0% | | | 34 | Acme Markets | $15.06 |
| Plaza Square | GRI | 40% | NJ | New York-Newark-Jersey City | 104 | 42 | 85.9% | | | 60 | Shop Rite | $21.73 |
| Riverfront Plaza | NYC | 30% | NJ | New York-Newark-Jersey City | 129 | 39 | 91.7% | | | 70 | ShopRite | $26.82 |
| | | | NJ | | 572 | 333 | 95.3% | 96.8% | 0 | 258 | | |
| 101 7th Avenue | | | NY | New York-Newark-Jersey City | 57 | 57 | 0.0% | | | | - | $0.00 |
| 1175 Third Avenue | | | NY | New York-Newark-Jersey City | 25 | 25 | 100.0% | | | 25 | The Food Emporium | $116.62 |
| 1225-1239 Second Ave | | | NY | New York-Newark-Jersey City | 18 | 18 | 100.0% | | | | CVS | $125.79 |
| 90 - 30 Metropolitan Avenue | | | NY | New York-Newark-Jersey City | 60 | 60 | 93.9% | | | 11 | Trader Joe's, Staples, Michaels | $34.27 |
| Broadway Plaza | | | NY | New York-Newark-Jersey City | 147 | 147 | 91.8% | | | 18 | Aldi, Bob's Discount Furniture, TJ Maxx, Blink Fitness, Best Buy | $40.88 |
| Clocktower Plaza Shopping Ctr | | | NY | New York-Newark-Jersey City | 79 | 79 | 100.0% | | | 63 | Stop & Shop | $49.56 |
| The Gallery at Westbury Plaza | | | NY | New York-Newark-Jersey City | 312 | 312 | 98.0% | | | 13 | Trader Joe's, Nordstrom Rack, Saks Fifth Avenue, Bloomingdale's, The Container Store, HomeGoods, Old Navy, Gap Outlet, Bassett Home Furnishings, Famous Footwear | $48.75 |
| Hewlett Crossing I & II | | | NY | New York-Newark-Jersey City | 53 | 53 | 98.7% | | | | Petco | $40.60 |
| Rivertowns Square | 0 | | NY | New York-Newark-Jersey City | 116 | 116 | 58.4% | | | 18 | Ulta, The Learning Experience, Mom's Organic Market | $33.80 |
| The Point at Garden City Park | | | NY | New York-Newark-Jersey City | 105 | 105 | 97.4% | | | 52 | King Kullen | $28.96 |
| Lake Grove Commons | GRI | 40% | NY | New York-Newark-Jersey City | 141 | 57 | 100.0% | | | 48 | Whole Foods, LA Fitness, PETCO | $35.24 |
| Westbury Plaza | | | NY | New York-Newark-Jersey City | 397 | 397 | 95.6% | | | 110 | WalMart, Costco, Marshalls, Total Wine and More, Olive Garden | $25.40 |
| | | | NY | | 1,511 | 1,426 | 90.2% | 89.6% | 0 | 357 | | |
| Cherry Grove | | | OH | Cincinnati | 196 | 196 | 98.2% | | | 66 | Kroger, Shoe Carnival, TJ Maxx, Tuesday Morning | $11.99 |
| East Pointe | | | OH | Columbus | 109 | 109 | 94.3% | | | 76 | Kroger | $10.56 |
| Hyde Park | | | OH | Cincinnati | 401 | 401 | 96.6% | | | 169 | Kroger, Remke Markets, Walgreens, Jo-Ann Fabrics, Ace Hardware, Staples, Marshalls | $16.51 |
| Kroger New Albany Center | M | 50% | OH | Columbus | 93 | 93 | 100.0% | | | 65 | Kroger | $13.10 |
| Northgate Plaza (Maxtown Road) | | | OH | Columbus | 114 | 114 | 100.0% | | 90 | 91 | Kroger, (Home Depot) | $11.75 |
| Red Bank Village | | | OH | Cincinnati | 176 | 176 | 99.2% | | | 152 | WalMart | $7.47 |
| Regency Commons | | | OH | Cincinnati | 34 | 34 | 79.2% | | | | - | $26.31 |
| West Chester Plaza | | | OH | Cincinnati | 88 | 88 | 100.0% | | | 67 | Kroger | $10.15 |
| | | | OH | | 1,211 | 1,211 | 97.4% | 97.4% | 90 | 685 | | |
| Supplemental Information | 33 |
Portfolio Summary Report By State
December 31, 2020
(GLA in thousands)
| | | | | | JVs at 100% | REG's pro-rata share | REG's pro-rata share | REG's pro-rata share | | | | |
Property Name | JV | REG % | State | CBSA | GLA | GLA | % Leased | % Leased - Retail Operating Properties | Retailer-Owned GLA | Grocery Anchor GLA | Major Tenants (1) | Avg. Base Rent PSF |
| Corvallis Market Center | | | OR | Corvallis | 85 | 85 | 90.9% | | | 12 | Trader Joe's, TJ Maxx, Michael's | $21.75 |
| Greenway Town Center | GRI | 40% | OR | Portland-Vancouver-Hillsboro | 93 | 37 | 100.0% | | | 38 | Whole Foods, Rite Aid, Dollar Tree | $16.05 |
| Murrayhill Marketplace | | | OR | Portland-Vancouver-Hillsboro | 150 | 150 | 88.7% | | | 41 | Safeway, Planet Fitness | $19.89 |
| Northgate Marketplace | | | OR | Medford | 81 | 81 | 91.6% | | | 13 | Trader Joe's, REI, PETCO | $22.80 |
| Northgate Marketplace Ph II | | | OR | Medford | 177 | 177 | 97.4% | | | | Dick's Sporting Goods, Homegoods, Marshalls | $17.10 |
| Sherwood Crossroads | | | OR | Portland-Vancouver-Hillsboro | 88 | 88 | 100.0% | | | 55 | Safeway | $12.02 |
| Tanasbourne Market | | | OR | Portland-Vancouver-Hillsboro | 71 | 71 | 100.0% | | | 57 | Whole Foods | $30.18 |
| Walker Center | | | OR | Portland-Vancouver-Hillsboro | 90 | 90 | 98.4% | | | | Bed Bath & Beyond | $21.88 |
| | | | OR | | 835 | 779 | 95.5% | 95.2% | 0 | 215 | | |
| Allen Street Shopping Ctr | GRI | 40% | PA | Allentown-Bethlehem-Easton | 46 | 18 | 100.0% | | | 22 | Ahart's Market | $16.08 |
| City Avenue Shopping Center | GRI | 40% | PA | Philadelphia-Camden-Wilmington | 162 | 65 | 80.4% | | | | Ross Dress for Less, TJ Maxx, Dollar Tree | $19.32 |
| Gateway Shopping Center | | | PA | Philadelphia-Camden-Wilmington | 221 | 221 | 95.9% | | | 11 | Trader Joe's, Staples, TJ Maxx, Jo-Ann Fabrics | $32.63 |
| Hershey | | | PA | Harrisburg-Carlisle | 6 | 6 | 100.0% | | | | - | $30.00 |
| Lower Nazareth Commons | | | PA | Allentown-Bethlehem-Easton | 90 | 90 | 100.0% | | 244 | 111 | (Wegmans), (Target), Burlington Coat Factory, PETCO | $26.41 |
| Mercer Square Shopping Center | GRI | 40% | PA | Philadelphia-Camden-Wilmington | 91 | 37 | 94.7% | | | 51 | Weis Markets | $24.37 |
| Newtown Square Shopping Center | GRI | 40% | PA | Philadelphia-Camden-Wilmington | 143 | 57 | 85.6% | | | 56 | Acme Markets, Michael's | $18.73 |
| Stefko Boulevard Shopping Center | GRI | 40% | PA | Allentown-Bethlehem-Easton | 134 | 54 | 94.1% | | | 73 | Valley Farm Market, Dollar Tree, Retro Fitness | $10.63 |
| Warwick Square Shopping Center | GRI | 40% | PA | Philadelphia-Camden-Wilmington | 93 | 37 | 44.3% | | | 51 | - | $28.33 |
| | | | PA | | 987 | 585 | 87.2% | 90.4% | 244 | 375 | | |
(2) | Indigo Square | | | SC | Charleston-North Charleston | 51 | 51 | 98.4% | | | 22 | Publix | $29.20 |
| Merchants Village | GRI | 40% | SC | Charleston-North Charleston | 80 | 32 | 98.5% | | | 38 | Publix | $17.10 |
| | | | SC | | 131 | 83 | 98.4% | 98.4% | 0 | 59 | | |
| Harpeth Village Fieldstone | | | TN | Nashvil-Davdsn-Murfree-Frankln | 70 | 70 | 100.0% | | | 55 | Publix | $15.88 |
| Northlake Village | | | TN | Nashvil-Davdsn-Murfree-Frankln | 138 | 138 | 87.7% | | | 75 | Kroger | $14.05 |
| Peartree Village | | | TN | Nashvil-Davdsn-Murfree-Frankln | 110 | 110 | 100.0% | | | 84 | Kroger, PETCO | $19.96 |
| | | | TN | | 318 | 318 | 94.6% | 94.6% | 0 | 214 | | |
| Alden Bridge | USAA | 20% | TX | Houston-Woodlands-Sugar Land | 139 | 28 | 98.0% | | | 68 | Kroger, Walgreens | $20.91 |
| Bethany Park Place | USAA | 20% | TX | Dallas-Fort Worth-Arlington | 99 | 20 | 96.6% | | | 83 | Kroger | $11.66 |
| CityLine Market | | | TX | Dallas-Fort Worth-Arlington | 81 | 81 | 95.0% | | | 40 | Whole Foods | $27.65 |
| CityLine Market Phase II | | | TX | Dallas-Fort Worth-Arlington | 22 | 22 | 93.8% | | | | CVS | $26.64 |
| Cochran's Crossing | | | TX | Houston-Woodlands-Sugar Land | 138 | 138 | 90.8% | | | 63 | Kroger, CVS | $19.00 |
(2) | Eastfield at Baybrook | O | 50% | TX | Houston-Woodlands-Sugar Land | 106 | 53 | 100.0% | | | 106 | H.E.B | $3.16 |
| Hancock | | | TX | Austin-Round Rock-Georgetown | 410 | 410 | 55.3% | | | 90 | H.E.B, Twin Liquors, PETCO, 24 Hour Fitness, Firestone Complete Auto Care | $20.75 |
| Hickory Creek Plaza | | | TX | Dallas-Fort Worth-Arlington | 28 | 28 | 84.6% | | 81 | 81 | (Kroger) | $28.81 |
| Supplemental Information | 34 |
Portfolio Summary Report By State
December 31, 2020
(GLA in thousands)
| | | | | | JVs at 100% | REG's pro-rata share | REG's pro-rata share | REG's pro-rata share | | | | |
Property Name | JV | REG % | State | CBSA | GLA | GLA | % Leased | % Leased - Retail Operating Properties | Retailer-Owned GLA | Grocery Anchor GLA | Major Tenants (1) | Avg. Base Rent PSF |
| Hillcrest Village | | | TX | Dallas-Fort Worth-Arlington | 15 | 15 | 100.0% | | | | - | $47.73 |
| Indian Springs Center | | | TX | Houston-Woodlands-Sugar Land | 137 | 137 | 96.7% | | | 79 | H.E.B. | $24.67 |
| Keller Town Center | | | TX | Dallas-Fort Worth-Arlington | 120 | 120 | 94.2% | | | 64 | Tom Thumb | $16.31 |
| Lebanon/Legacy Center | | | TX | Dallas-Fort Worth-Arlington | 56 | 56 | 78.8% | | 63 | 63 | (Wal-Mart) | $28.21 |
| Market at Preston Forest | | | TX | Dallas-Fort Worth-Arlington | 96 | 96 | 98.9% | | | 64 | Tom Thumb | $21.34 |
| Market at Round Rock | | | TX | Austin-Round Rock-Georgetown | 123 | 123 | 95.6% | | | 30 | Sprout's Markets, Office Depot, Tuesday Morning | $18.52 |
| Market at Springwoods Village | M | 53% | TX | Houston-Woodlands-Sugar Land | 167 | 167 | 95.1% | | | 100 | Kroger | $16.55 |
| Mockingbird Commons | | | TX | Dallas-Fort Worth-Arlington | 120 | 120 | 89.2% | | | 49 | Tom Thumb, Ogle School of Hair Design | $18.37 |
| North Hills | | | TX | Austin-Round Rock-Georgetown | 145 | 145 | 94.2% | | | 60 | H.E.B. | $22.37 |
| Panther Creek | | | TX | Houston-Woodlands-Sugar Land | 166 | 166 | 96.1% | | | 66 | CVS, The Woodlands Childrens Museum, Fitness Project | $22.65 |
| Prestonbrook | | | TX | Dallas-Fort Worth-Arlington | 92 | 92 | 100.0% | | | 64 | Kroger | $15.03 |
(2) | Preston Oaks | | | TX | Dallas-Fort Worth-Arlington | 101 | 101 | 77.0% | | | 30 | H.E.B., Central Market, Talbots | $27.71 |
| Shiloh Springs | USAA | 20% | TX | Dallas-Fort Worth-Arlington | 110 | 22 | 87.3% | | | 61 | Kroger | $14.24 |
| Shops at Mira Vista | | | TX | Austin-Round Rock-Georgetown | 68 | 68 | 100.0% | | | 15 | Trader Joe's, Champions Westlake Gymnastics & Cheer | $23.80 |
| Southpark at Cinco Ranch | | | TX | Houston-Woodlands-Sugar Land | 265 | 265 | 97.6% | | | 101 | Kroger, Academy Sports, PETCO, Spec's Liquor and Finer Foods | $13.46 |
| Sterling Ridge | | | TX | Houston-Woodlands-Sugar Land | 129 | 129 | 95.5% | | | 63 | Kroger,CVS | $21.01 |
| Sweetwater Plaza | C | 20% | TX | Houston-Woodlands-Sugar Land | 134 | 27 | 94.6% | | | 65 | Kroger, Walgreens | $17.79 |
| Tech Ridge Center | | | TX | Austin-Round Rock-Georgetown | 215 | 215 | 89.0% | | | 84 | H.E.B., Pinstack | $23.22 |
(2) | The Village at Riverstone | | | TX | Houston-Woodlands-Sugar Land | 165 | 165 | 96.1% | | | 100 | Kroger | $16.78 |
| Weslayan Plaza East | GRI | 40% | TX | Houston-Woodlands-Sugar Land | 169 | 68 | 99.1% | | | | Berings, Ross Dress for Less, Michaels, The Next Level Fitness, Spec's Liquor, Bike Barn | $20.44 |
| Weslayan Plaza West | GRI | 40% | TX | Houston-Woodlands-Sugar Land | 186 | 74 | 95.5% | | | 52 | Randalls Food, Walgreens, PETCO, Jo-Ann's, Tuesday Morning, Homegoods | $19.97 |
| Westwood Village | | | TX | Houston-Woodlands-Sugar Land | 187 | 187 | 97.1% | | 127 | | (Target), Fitness Project, PetSmart, Office Max, Ross Dress For Less, TJ Maxx | $20.06 |
| Woodway Collection | GRI | 40% | TX | Houston-Woodlands-Sugar Land | 97 | 39 | 97.3% | | | 45 | Whole Foods | $30.07 |
| | | | TX | | 4,086 | 3,376 | 90.6% | 89.8% | 271 | 1,788 | | |
| Ashburn Farm Village Center | GRI | 40% | VA | Washington-Arlington-Alexandri | 92 | 37 | 100.0% | | | 27 | Patel Brothers, The Shop Gym | $16.34 |
| Belmont Chase | | | VA | Washington-Arlington-Alexandri | 91 | 91 | 100.0% | | | 40 | Whole Foods, Cooper's Hawk Winery | $32.60 |
| Braemar Village Center | RC | 25% | VA | Washington-Arlington-Alexandri | 104 | 26 | 98.1% | | | 58 | Safeway | $23.18 |
(2) | Carytown Exchange | M | 47% | VA | Richmond | 116 | 116 | 54.6% | | | 38 | Publix, CVS | $21.02 |
| Centre Ridge Marketplace | GRI | 40% | VA | Washington-Arlington-Alexandri | 107 | 43 | 98.9% | | | 55 | United States Coast Guard Ex | $19.68 |
| Point 50 | | | VA | Washington-Arlington-Alexandri | 48 | 48 | 96.3% | | | 30 | Whole Foods | $29.21 |
| Festival at Manchester Lakes | GRI | 40% | VA | Washington-Arlington-Alexandri | 169 | 67 | 79.9% | | | 65 | Grocer, Homesense | $28.42 |
| Supplemental Information | 35 |
Portfolio Summary Report By State
December 31, 2020
(GLA in thousands)
| | | | | | JVs at 100% | REG's pro-rata share | REG's pro-rata share | REG's pro-rata share | | | | |
Property Name | JV | REG % | State | CBSA | GLA | GLA | % Leased | % Leased - Retail Operating Properties | Retailer-Owned GLA | Grocery Anchor GLA | Major Tenants (1) | Avg. Base Rent PSF |
| Fox Mill Shopping Center | GRI | 40% | VA | Washington-Arlington-Alexandri | 103 | 41 | 100.0% | | | 50 | Giant | $26.68 |
| Greenbriar Town Center | GRI | 40% | VA | Washington-Arlington-Alexandri | 340 | 136 | 98.7% | | | 62 | Giant, Bob's Discount Furniture, CVS,Ross Dress for Less, Marshalls, Planet Fitness, Big Blue Swim School | $27.96 |
| Hanover Village Shopping Center | GRI | 40% | VA | Richmond | 90 | 36 | 100.0% | | | 18 | Aldi, Tractor Supply Company, Harbor Freight Tools, Tuesday Morning | $9.34 |
| Kamp Washington Shopping Center | GRI | 40% | VA | Washington-Arlington-Alexandri | 71 | 29 | 69.3% | | | 20 | - | $41.09 |
| Kings Park Shopping Center | GRI | 40% | VA | Washington-Arlington-Alexandri | 96 | 39 | 100.0% | | | 51 | Giant, CVS | $32.65 |
| Lorton Station Marketplace | C | 20% | VA | Washington-Arlington-Alexandri | 132 | 26 | 68.9% | | | 63 | Grocer | $26.94 |
| Market Common Clarendon | | | VA | Washington-Arlington-Alexandri | 421 | 421 | 65.8% | | | 34 | Whole Foods, Crate & Barrel, The Container Store, Barnes & Noble, Pottery Barn, Ethan Allen, The Cheesecake Factory, Jumping Joeys, Equinox | $33.18 |
| Saratoga Shopping Center | GRI | 40% | VA | Washington-Arlington-Alexandri | 113 | 45 | 98.8% | | | 56 | Giant | $21.90 |
| Shops at County Center | | | VA | Washington-Arlington-Alexandri | 97 | 97 | 94.0% | | | 52 | Harris Teeter | $20.47 |
| The Field at Commonwealth | | | VA | Washington-Arlington-Alexandri | 167 | 167 | 99.0% | | | 122 | Wegmans | $22.05 |
| Village Center at Dulles | C | 20% | VA | Washington-Arlington-Alexandri | 301 | 60 | 97.0% | | | 48 | Giant, Gold's Gym, CVS, Advance Auto Parts, Chuck E. Cheese, HomeGoods, Goodwill, Furniture Max | $27.36 |
| Village Shopping Center | GRI | 40% | VA | Richmond | 116 | 46 | 85.9% | | | 45 | Publix, CVS | $24.70 |
| Willston Centre I | GRI | 40% | VA | Washington-Arlington-Alexandri | 105 | 42 | 89.9% | | | | CVS, Fashion K City | $27.78 |
| Willston Centre II | GRI | 40% | VA | Washington-Arlington-Alexandri | 136 | 54 | 100.0% | | 141 | 59 | Safeway, (Target) | $27.08 |
| | | | VA | | 3,017 | 1,669 | 88.5% | 87.1% | 141 | 994 | | |
| 6401 Roosevelt | | | WA | Seattle-Tacoma-Bellevue | 8 | 8 | 69.0% | | | | - | $18.58 |
| Aurora Marketplace | GRI | 40% | WA | Seattle-Tacoma-Bellevue | 107 | 43 | 98.8% | | | 49 | Safeway, TJ Maxx | $16.97 |
| Ballard Blocks I | O | 50% | WA | Seattle-Tacoma-Bellevue | 132 | 66 | 95.9% | | | 12 | Trader Joe's, LA Fitness, Ross Dress for Less | $26.06 |
(2) | Ballard Blocks II | O | 50% | WA | Seattle-Tacoma-Bellevue | 117 | 58 | 99.3% | | | 25 | PCC Community Markets, Bright Horizons, West Marine,Trufusion, Kaiser Permanente, Prokarma | $34.71 |
| Broadway Market | C | 20% | WA | Seattle-Tacoma-Bellevue | 140 | 28 | 95.3% | | | 64 | Quality Food Centers, Gold's Gym | $29.30 |
| Cascade Plaza | C | 20% | WA | Seattle-Tacoma-Bellevue | 206 | 41 | 95.0% | | | 49 | Safeway, Jo-Ann Fabrics, Ross Dress For Less, Big Lots, Fplanet Fitness, Big 5 Sporting Goods, Dollar Tree | $12.35 |
| Eastgate Plaza | GRI | 40% | WA | Seattle-Tacoma-Bellevue | 85 | 34 | 100.0% | | | 29 | Safeway, Rite Aid | $30.59 |
| Grand Ridge Plaza | | | WA | Seattle-Tacoma-Bellevue | 331 | 331 | 98.8% | | | 45 | Safeway, Regal Cinemas, Dick's Sporting Goods, Marshalls, Ulta , Bevmo! | $25.45 |
| Inglewood Plaza | | | WA | Seattle-Tacoma-Bellevue | 17 | 17 | 91.9% | | | | - | $43.19 |
| Klahanie Shopping Center | | | WA | Seattle-Tacoma-Bellevue | 67 | 67 | 94.7% | | 40 | 40 | (QFC) | $35.05 |
| Melrose Market | | | WA | Seattle-Tacoma-Bellevue | 21 | 21 | 85.3% | | | | - | $34.32 |
| Overlake Fashion Plaza | GRI | 40% | WA | Seattle-Tacoma-Bellevue | 93 | 37 | 92.3% | | 230 | 13 | Marshalls, Bevmo!, Amazon Go Grocery | $28.57 |
| Supplemental Information | 36 |
Portfolio Summary Report By State
December 31, 2020
(GLA in thousands)
| | | | | | JVs at 100% | REG's pro-rata share | REG's pro-rata share | REG's pro-rata share | | | | |
Property Name | JV | REG % | State | CBSA | GLA | GLA | % Leased | % Leased - Retail Operating Properties | Retailer-Owned GLA | Grocery Anchor GLA | Major Tenants (1) | Avg. Base Rent PSF |
| Pine Lake Village | | | WA | Seattle-Tacoma-Bellevue | 103 | 103 | 95.7% | | | 41 | Quality Food Centers, Rite Aid | $24.78 |
| Roosevelt Square | | | WA | Seattle-Tacoma-Bellevue | 150 | 150 | 96.0% | | | 50 | Whole Foods, Bartell, Guitar Center, LA Fitness | $26.11 |
| Sammamish-Highlands | | | WA | Seattle-Tacoma-Bellevue | 101 | 101 | 100.0% | | 55 | 67 | Trader Joe's, (Safeway), Bartell Drugs | $35.65 |
| Southcenter | | | WA | Seattle-Tacoma-Bellevue | 58 | 58 | 93.0% | | 112 | | (Target) | $31.64 |
| | | | WA | | 1,737 | 1,164 | 96.5% | 96.6% | 437 | 484 | | |
| | | | | | | | | | | | | |
| Regency Centers Total | | | | | 51,912 | 42,242 | 92.3% | 92.9% | 4,088 | 16,548 | | $22.86 |
(1) | Major Tenants are the grocery anchor and any tenant 10,000 square feet or greater. Retailers in parenthesis are a shadow anchor and not a part of the owned property. |
Note: In-process developments are bolded and italicized.
C: | Co-investment Partnership with Oregon |
GRI: | Co-investment Partnership with GRI |
M: | Co-investment Partnership with Minority Partner |
NYC: | Co-investment Partnership with NYCRF |
O: | Other, single property co-investment Partnerships |
RC: | Co-investment Partnership with CalSTRS |
RLP: | Co-investment Partnership with Rider |
USAA: | Co-investment Partnership with USAA |
| Supplemental Information | 37 |
Components of Net Asset Value (NAV)
As of December 31, 2020
(unaudited and in thousands)
Real Estate - Operating | |
Operating Portfolio NOI excluding Straight-line Rent and Above/Below Market Rent - Current Quarter | | | | |
Wholly Owned NOI (page 5) | | $ | 163,335 | |
Share of JV NOI (page 7) | | $ | 24,649 | |
Less: Noncontrolling Interests (page 7) | | $ | (1,549 | ) |
| | | | |
Base Rent from leases signed but not yet rent-paying - Current Quarter | | | | |
Retail Operating Properties including redevelopments | | $ | 3,080 | |
| | | | |
Real Estate - In-Process Ground Up Developments | | | | |
In-Process Development (1) | |
REG's Estimated Net GAAP Project Costs (2) (page 17, footnote) | | $ | 44,793 | |
% of Costs Incurred (page 17) | | | 43 | % |
Construction in Progress | | $ | 19,300 | |
| | | | |
NOI from In-Process Development - Current Quarter | |
Proforma Stabilized NOI from current quarter completions | | $ | 243 | |
In-place NOI from In-Process Developments (In Construction) | | $ | 51 | |
| | | | |
Fee Income | | | | |
Third-Party Management Fees and Commissions - Current Quarter (page 5) | | $ | 7,417 | |
| | | | |
Less: Share of JV's Total fee income - Current Quarter (page 7) | | $ | (267 | ) |
| | | | |
Other Assets | | | | |
Estimated Market Value of Undeveloped Land | | | | |
Land held for sale or future development | | $ | 39,416 | |
Outparcels at retail operating properties | | | 12,915 | |
101 7th Avenue at Book Value, Net | | | 25,000 | |
Total Estimated Market Value of Undeveloped Land | | $ | 77,331 | |
| | | | |
Wholly Owned Assets (page 3) | | | | |
Cash and Cash Equivalents | | $ | 378,450 | |
Tenant and other receivables, excluding Straight line rent receivables | | $ | 143,633 | |
Other Assets, excluding Goodwill | | $ | 87,578 | |
Share of JV Assets (page 6) | | | | |
Cash and Cash Equivalents | | $ | 21,588 | |
Tenant and other receivables, excluding Straight line rent receivables | | $ | 23,133 | |
Other Assets | | $ | 18,854 | |
| | | | |
Less: Noncontrolling Interests (page 6) | | $ | (4,957 | ) |
| | | | |
Liabilities | | | | |
Wholly Owned Debt Outstanding (page 12) | | | | |
Mortgage Loans | | $ | 415,713 | |
Unsecured Public/Private Notes | | | 3,275,000 | |
Unsecured Credit Facilities | | | 265,000 | |
Total Wholly Owned Debt Outstanding | | $ | 3,955,713 | |
| | | | |
Share of JV Debt Outstanding (page 14) | | $ | 537,712 | |
| | | | |
Other Wholly Owned Liabilities (page 3) | | | | |
Accounts Payable and Other Liabilities | | $ | 302,361 | |
Tenants' Security and Escrow Deposits | | $ | 55,210 | |
Other Share of JV Accounts Liabilities (page 6) | | | | |
Accounts Payable and Other Liabilities | | $ | 24,588 | |
Tenants' Security and Escrow Deposits | | $ | 4,185 | |
| | | | |
Less: Noncontrolling Interests (page 6) | | $ | (41,437 | ) |
| | | | |
Common Shares and Equivalents Outstanding | | | | |
Common Shares and Equivalents Issued and Outstanding (page 1) | | | 170,445 | |
| | | | |
| (1) | Includes Carytown Exchange, East San Marco, Eastfield at Baybrook |
| (2) | Includes additional interest and overhead capitalization |
| | |
| Supplemental Information | 38 |
Supplemental Details of Lease Income (Pro Rata)
COVID-19 Disclosure
For the Three Months and Nine Months Ended December 31, 2020
(unaudited and in thousands)
 For the Three Months Ended December 31, 2020

Composition of Lease Income | | Total Pro Rata | |
Base rent | | $ | 215,991 | |
Recoveries from tenants | | | 68,825 | |
Percentage Rent, Termination Fees , and Other Lease Income | | | 6,191 | |
Total Billings/Deferrals and Other Revenue | | $ | 291,007 | |
Uncollectible Lease Income (3) | | | (17,689 | ) |
Non-Cash Revenues (1) | | | 7,864 | |
Total Lease Income (see pages 5 & 7) | | $ | 281,182 | |
| | | | |
| | | | |
Lease Income Accrual Reconciliation | | Total Pro Rata | |
Collected - Billed Base Rent/Recoveries & Other Revenue (2) | | $ | 263,822 | |
Uncollected - Base Rent/Recoveries - Accrued | | | 9,496 | |
Uncollected - Base Rent/Recoveries - Reserved (3) | | | 17,689 | |
Total Billings/Deferrals and Other Revenue | | $ | 291,007 | |
Uncollectible Lease Income (3) | | | (17,689 | ) |
Non-Cash Revenues (1) | | | 7,864 | |
Total Lease Income (see pages 5 & 7) | | $ | 281,182 | |
| | | | |
Composition of Deferred Rent | | Total Pro Rata | |
Deferred Rent - Accrued | | $ | 1,234 | |
Deferred Rent - Reserved | | | 1,693 | |
Total Deferrals | | $ | 2,927 | |
For the Nine Months Ended December 31, 2020
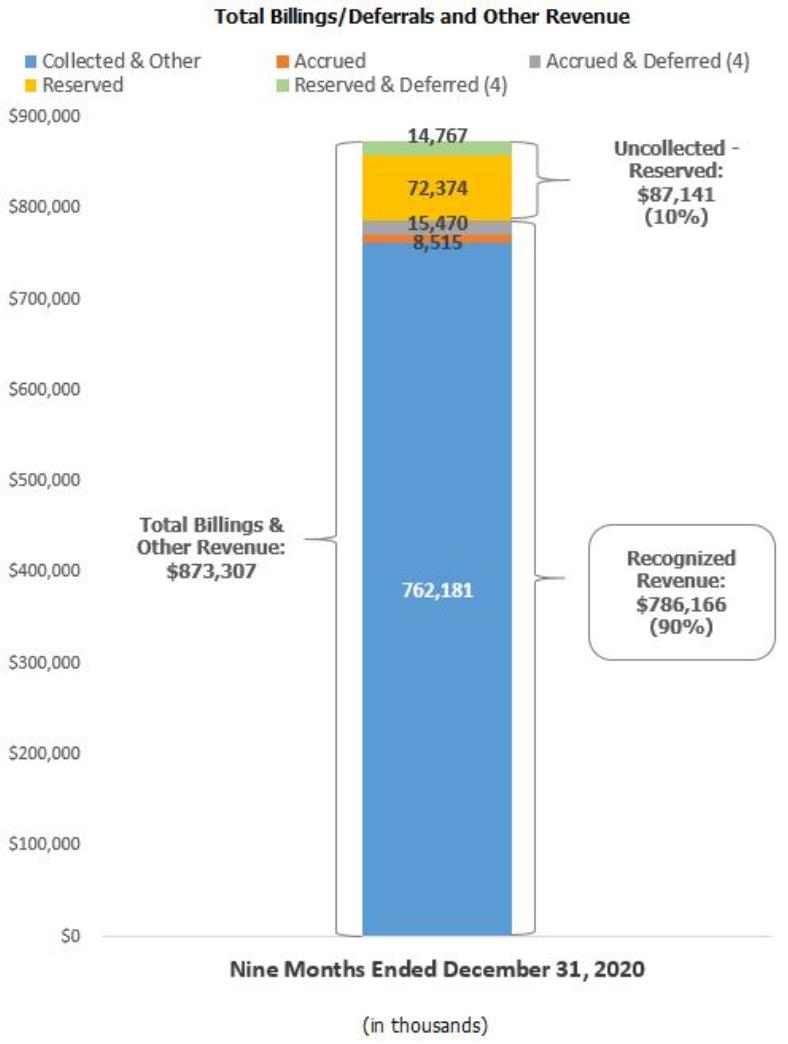

Composition of Lease Income | | Total Pro Rata | |
Base rent | | $ | 650,070 | |
Recoveries from tenants | | | 207,028 | |
Percentage Rent, Termination Fees , and Other Lease Income | | | 16,209 | |
Total Billings/Deferrals and Other Revenue | | $ | 873,307 | |
Uncollectible Lease Income (3) | | | (87,141 | ) |
Non-Cash Revenues (1) | | | 8,308 | |
Total Lease Income (see pages 5 & 7) | | $ | 794,474 | |
| | | | |
| | | | |
Lease Income Accrual Reconciliation | | Total Pro Rata | |
Collected - Billed Base Rent/Recoveries & Other Revenue (2) | | $ | 762,181 | |
Uncollected - Base Rent/Recoveries - Accrued | | | 23,985 | |
Uncollected - Base Rent/Recoveries - Reserved (3) | | | 87,141 | |
Total Billings/Deferrals and Other Revenue | | $ | 873,307 | |
Uncollectible Lease Income (3) | | | (87,141 | ) |
Non-Cash Revenues (1) | | | 8,308 | |
Total Lease Income (see pages 5 & 7) | | $ | 794,474 | |
| | | | |
Composition of Deferred Rent | | Total Pro Rata | |
Deferred Rent - Accrued | | $ | 15,470 | |
Deferred Rent - Reserved | | | 14,767 | |
Total Deferrals | | $ | 30,237 | |
(1) | Includes pro rata share of straight-line rent on lease income, net of uncollectible amounts, and above/below market rent amortization. |
(2) | Unbilled recoveries are included in Other Revenues, and represent unbilled amounts for quarterly, semi-annual and annual payers of property expenses. |
(3) | Represents Base Rent and Recoveries deemed uncollectible. |
(4) | Contractual deferrals of rent and recoveries billed and recognized through December 31, 2020. Includes deferral agreements executed through January 31, 2021. |
| | |
| Supplemental Information | 39 |
Supplemental Details of Same Property NOI (Pro Rata)
COVID-19 Disclosure
For the Three Months and Nine Months Ended December 31, 2020
(unaudited and in thousands)
| | | Three Months | | | Nine Months | |
| | | Ended 12/31/20 | | | Ended 12/31/20 | |
| | | | | | | | | |
* | Same Property NOI | | $ | 179,675 | | | $ | 510,945 | |
| % change | | | -9.9 | % | | | -14.8 | % |
| | | | | | | | | |
| | | | | | | | | |
* | Same Property NOI without Termination Fees | | $ | 177,437 | | | $ | 505,413 | |
| % change | | | -10.5 | % | | | -15.3 | % |
| | | | | | | | | |
| | | | | | | | | |
* | Same Property NOI without Termination Fees or Redevelopments | | $ | 160,973 | | | $ | 460,106 | |
| % change | | | -10.7 | % | | | -15.0 | % |
| | | | | | | | | |
| | | | | | | | | |
| Same Property NOI excluding Accrued Lease Income Not Collected | | | | | | | | |
| Accrued Lease Income Not Collected | | $ | 9,404 | | | $ | 18,742 | |
| Same Property NOI without Termination Fees and Accrued Lease Income Not Collected | | $ | 168,033 | | | $ | 486,671 | |
| % change | | | -15.3 | % | | | -18.5 | % |
Supplemental Details of Tenant and Other Receivables (Pro Rata)
COVID-19 Disclosure
As of December 31, 2020
(in thousands)
| | | Total Pro Rata | | | |
| | | | | | | |
| Tenant receivables | | $ | 139,924 | | | |
| Less: Uncollectible tenant receivables | | | (94,731 | ) | | |
| Net tenant receivables | | $ | 45,193 | | | |
| | | | | | | |
| Straigh line rent receivables | | | 141,580 | | | |
| Less: Uncollectible straight line rent receivables | | | (41,136 | ) | | |
| Net Straight line receivables | | $ | 100,444 | | | |
| | | | | | | |
| Other receivables (1) | | | 18,916 | | | |
| Total tenant and other receivables (See pages 3 and 6) | | $ | 164,553 | | | |
| (1) | Other receivables includes construction receivables, insurance receivables and amounts due from real estate partnerships for Management, transaction and other fee income. | |
| | |
| Supplemental Information | 40 |
Earnings Guidance
December 31, 2020
(in thousands, except per share data)
| 2020A | 2021E |
| | |
Net Income / Share | $0.26 | $0.55 - $0.73 |
NAREIT FFO / Share | $2.95 | $2.96 - $3.14 |
Core Operating Earnings / Share | $2.97 | $2.79 - $2.97 |
| | |
Same Property | | |
Same property NOI growth without termination fees (pro-rata) | -11.6% | -1.0% to 2.5% |
| | |
New Investments | | |
Development and Redevelopment spend (pro-rata) | $141,437 | +/- $150,000 |
| | |
Acquisitions (pro-rata) | $27,740 | +/- $0 |
Cap rate (weighted average) | 4.8% | 0.0% |
| | |
Disposition Activity | | |
Dispositions (pro-rata) | $190,770 | +/- $150,000 |
Cap rate (weighted average) | 5.7% | 5.5% - 6.0% (2) |
| | |
Other | | |
Early extinguishment of debt (pro-rata) | $22,042 | $0 |
Net interest expense (pro-rata) | $179,443 | $166,000 - $167,000 |
Net G&A expense (pro-rata) | $70,586 | $82,500 - $86,500 |
Recurring third party fees & commissions (pro-rata) | $25,411 | $23,000 - $24,000 |
Certain non-cash items (pro-rata) (1) | $19,066 | +/- $30,000 |

| (1) | Includes above and below market rent amortization and straight-line rents and amortization of mark-to-market debt adjustments |
| (2) | Average cap rate calculation excludes the sale of non-income producing asset for $29.4 million in the first quarter |
Forward-looking statements involve risks, uncertainties and assumptions. Actual future performance, outcomes and results may differ materially from those expressed in forward-looking statements. Please refer to the documents filed by Regency Center Corporation with the SEC, specifically the most recent reports on forms 10K and 10Q, which identify important risk factors which could cause actual results to differ from those contained in the forward-looking statements.
| | |
| Supplemental Information | 41 |
Reconciliation of Net Income to Earnings Guidance
December 31, 2020
(per diluted share)
Nareit FFO and Core Operating Earnings Guidance: | | Full Year 2021 | |
| | Low | | | High | |
| | | | | | | | |
Net income attributable to common stockholders | | $ | 0.55 | | | | 0.73 | |
| | | | | | | | |
Adjustments to reconcile net income to Nareit FFO: | | | | | | | | |
| | | | | | | | |
Depreciation and amortization | | | 2.41 | | | | 2.41 | |
| | | | | | | | |
Nareit Funds From Operations | | $ | 2.96 | | | | 3.14 | |
| | | | | | | | |
| | | | | | | | |
Adjustments to reconcile Nareit FFO to Core Operating Earnings: | | | | | | | | |
| | | | | | | | |
Straight line rent, net | | | (0.03 | ) | | | (0.03 | ) |
| | | | | | | | |
Market rent amortization, net | | | (0.14 | ) | | | (0.14 | ) |
| | | | | | | | |
Core Operating Earnings | | $ | 2.79 | | | | 2.97 | |
| | |
| Supplemental Information | 42 |
Glossary of Terms
December 31, 2020
Core Operating Earnings: An additional performance measure used by Regency as the computation of Nareit FFO includes certain non-comparable items that affect the Company's period-over-period performance. Core Operating Earnings excludes from Nareit FFO: (i) transaction related income or expenses (ii) gains or losses from the early extinguishment of debt; (iii) certain non-cash components of earnings derived from above and below market rent amortization, straight-line rents, and amortization of mark-to-market of debt adjustments; and (iv) other amounts as they occur. The Company provides a reconciliation of Net Income Attributable to Common Stockholders to Nareit FFO to Core Operating Earnings.
Development Completion: A Property in Development is deemed complete upon the earliest of: (i) 90% of total estimated net development costs have been incurred and percent leased equals or exceeds 95%, or (ii) the property features at least two years of anchor operations, or (iii) three years have passed since the start of construction. Once deemed complete, the property is termed a Retail Operating Property the following calendar year.
Fixed Charge Coverage Ratio: Operating EBITDAre divided by the sum of the gross interest and scheduled mortgage principal paid to our lenders.
Nareit Funds From Operations (Nareit FFO): Nareit FFO is a commonly used measure of REIT performance, which the National Association of Real Estate Investment Trusts (“Nareit”) defines as net income, computed in accordance with GAAP, excluding gains on sales and impairments of real estate, net of tax, plus depreciation and amortization, and after adjustments for unconsolidated partnerships and joint ventures. Regency computes Nareit FFO for all periods presented in accordance with Nareit's definition. Many companies use different depreciable lives and methods, and real estate values historically fluctuate with market conditions. Since Nareit FFO excludes depreciation and amortization and gains on sale and impairments of real estate, it provides a performance measure that, when compared year over year, reflects the impact on operations from trends in percent leased, rental rates, operating costs, acquisition and development activities, and financing costs. This provides a perspective of the Company’s financial performance not immediately apparent from net income determined in accordance with GAAP. Thus, Nareit FFO is a supplemental non-GAAP financial measure of the Company's operating performance, which does not represent cash generated from operating activities in accordance with GAAP; and, therefore, should not be considered a substitute measure of cash flows from operations. The Company provides a reconciliation of Net Income Attributable to Common Stockholders to Nareit FFO.
Net Operating Income (NOI): The sum of base rent, percentage rent, recoveries from tenants, other lease income, and other property income, less operating and maintenance expenses, real estate taxes, ground rent, and uncollectible lease income. NOI excludes straight-line rental income and expense, above and below market rent and ground rent amortization, tenant lease inducement amortization, and other fees. The Company also provides disclosure of NOI excluding termination fees, which excludes both termination fee income and expenses.
Non-Same Property: During either calendar year period being compared, a property acquired, sold, a Property in Development, a Development Completion, or a property under, or being positioned for, significant redevelopment that distorts comparability between periods. Non-retail properties and corporate activities, including the captive insurance program, are part of Non-Same Property. Please refer to the footnote on Property Summary Report for Non-Same Property detail.
Operating EBITDAre: Nareit EBITDAre is a measure of REIT performance, which the Nareit defines as net income, computed in accordance with GAAP, excluding (i) interest expense; (ii) income tax expense; (iii) depreciation and amortization; (iv) gains on sales of real estate; (v) impairments of real estate; and (vi) adjustments to reflect the Company’s share of unconsolidated partnerships and joint ventures. Operating EBITDAre excludes from Nareit EBITDAre certain non-cash components of earnings derived from above and below market rent amortization and straight-line rents. The Company provides a reconciliation of Net Income to Nareit EBITDAre to Operating EBITDAre.
Property In Development: Properties in various stages of ground-up development.
Property In Redevelopment: Retail Operating Properties under redevelopment or being positioned for redevelopment. Unless otherwise indicated, a Property in Redevelopment is included in the Same Property pool.
Retail Operating Property: Any retail property not termed a Property In Development. A retail property is any property where the majority of the income is generated from retail uses.
Same Property: Retail Operating Properties that were owned and operated for the entirety of both calendar year periods being compared. This term excludes Property in Development, prior year Development Completions, and Non-Same Properties. Property in Redevelopment is included unless otherwise indicated.
| | |
| Supplemental Information | 43 |