UNITED STATES
SECURITIES AND EXCHANGE COMMISSION
Washington, D.C. 20549
FORM 6-K
REPORT OF FOREIGN PRIVATE ISSUER
PURSUANT TO RULE 13a-16 OR 15d-16 UNDER
THE SECURITIES EXCHANGE ACT OF 1934
For the month of July2019
Commission File Number1-12260
COCA-COLA FEMSA, S.A.B. de C.V.
(Translation of registrant’s name into English)
United Mexican States
(Jurisdiction of incorporation or organization)
Calle Mario Pani No. 100,
Santa Fe Cuajimalpa,
Cuajimalpa de Morelos,
05348, Ciudad de México,
México
(Address of principal executive offices)
Indicate by check mark whether the registrant files or will file annual reports under cover of Form 20-F or Form 40-F.
Form 20-F X Form 40-F
Indicate by check mark if the registrant is submitting the Form 6-K in paper as permitted by Regulation S-T Rule 101(b)(1)
Yes No X
Indicate by check mark if the registrant is submitting the Form 6-K in paper as permitted by Regulation S-T Rule 101(b)(7)
Yes No X
Indicate by check mark whether the registrant by furnishing the information contained in this Form is also thereby furnishing the information to the Commission pursuant to Rule 12g3-2(b) under the Securities Exchange Act of 1934.
Yes No X
If "Yes" is marked, indicate below the file number assigned to the registrant in connection with
Rule 12g3-2(b): 82-__.

Coca-Cola FEMSA Announces Results For Second Quarter and First Six Months Of 2019
Mexico City, July 25, 2019, Coca-Cola FEMSA, S.A.B. de C.V. (BMV: KOF UBL, NYSE: KOF) (“Coca-Cola FEMSA”, “KOF” or the “Company”), the largest Coca-Cola franchise bottler in the world by sales volume, announces results for the second quarter and the first six months of 2019.
SECOND QUARTER OPERATIONAL AND FINANCIAL HIGHLIGHTS
· | Volumes increased in Brazil, Central America and Colombia; transactions outperformed volumes in Argentina and Brazil. |
· | Revenues increased 7.6%, while comparable revenues grew 11.6%. Solid pricing, revenue management initiatives across our operations and volume growth in Brazil, Central America and Colombia were partially offset by unfavorable currency translation effects from all of our operating currencies. |
· | Operating income increased 6.5%, while comparable operating income increased 13.8%. Favorable price mix effect, more stable raw material prices, and operating expense efficiencies, were partially offset by higher concentrate costs, the depreciation of most of our operating currencies as applied to our U.S. dollar denominated raw material costs, and restructuring severances for Ps. 512 million in Argentina, Central America, Colombia, and Mexico related to our efficiency initiatives to create a leaner and more agile organization. |
· | Earnings per share1 were Ps. 0.21 (Earnings per unit were Ps. 1.66 and per ADS were Ps. 16.60). |
FINANCIAL SUMMARY FOR THE SECOND QUARTER AND FIRST SIX MONTHS OF 2019 | ||||||||||||
Change vs. same period of last year | ||||||||||||
Total Revenues | Gross Profit | Operating Income | Majority Net Income | |||||||||
|
| 2Q 2019 | YTD 2019 | 2Q 2019 | YTD 2019 | 2Q 2019 | YTD 2019 | 2Q 2019 | YTD 2019 | |||
As Reported(2) | Consolidated | 7.6% | 6.5% | 6.0% | 4.9% | 6.5% | 3.0% | 25.4% | 17.2% | |||
Mexico & Central America | 9.9% | 10.6% | 10.0% | 11.1% | 19.1% | 17.6% | ||||||
South America | 4.4% | 1.5% | (0.5%) | (3.2%) | (15.8%) | (15.0%) | ||||||
|
|
|
|
|
|
|
| |||||
Comparable(3) | Consolidated | 11.6% | 10.8% | 10.1% | 9.5% | 13.8% | 11.7% | |||||
Mexico & Central America | 9.2% | 8.3% | 9.3% | 8.8% | 18.6% | 16.1% | ||||||
South America | 15.9% | 14.7% |
| 11.8% | 10.6% |
| 2.4% | 4.1% |
|
|
| |
John Santa Maria, Coca-Cola FEMSA’s CEO, commented:
“Our second quarter results show continuous progress and positive momentum. Despite prevailing external volatility and currency headwinds, our consolidated revenues grew 7.6% while our comparable revenues grew 11.6%. Importantly, our majority net income grew 25.4%, reflecting our progress to transform Coca-Cola FEMSA into a stronger and more resilient business. In Mexico and Central America, we continue to report healthy top-and-bottom line growth. In South America, we continue to see strong top-line performance driven mainly by strong volumes in Brazil, better-than-expected volume performance in Colombia and signs of stabilization in Argentina —encouraging trends as we move into the second half of the year.
Finally, as part of our commitment to drive agility and efficiency across our organization, we started the rollout of a set of initiatives during the first half of the year to create a leaner, more agile organization that is fully focused on its consumers. We expect that these efforts, which will be rolled out to all of our operations throughout the coming months, combined with ongoing digitalization, will provide us with the required flexibility to continue driving growth in our business.”
(1) | Quarterly earnings / outstanding shares. Earnings per share (EPS) for all periods are adjusted to give effect to the stock split resulting in 16,806.7 million shares outstanding. For the convenience of the reader, as a KOF UBL Unit is comprised of 8 shares (3 Series B shares and 5 Series L shares); earnings per unit are equal to EPS multiplied by 8. Each ADS represents 10 KOF UBL Units. |
(2) | According to IFRS 5, figures for 2018 do not include the Philippines as it is presented as a discontinued operation as of January 1, 2018. |
(3) | Please refer to page 9 for our definition of “comparable” and a description of the factors affecting the comparability of our financial and operating performance. |
Page 1 of 16
![]()
RECENT DEVELOPMENTS
· On May 3, 2019, Coca-Cola FEMSA paid the first installment of the 2018 dividend in the amount of Ps. 0.4425 per
share.
CONFERENCE CALL INFORMATION

Coca-Cola FEMSA Reports 2Q2019 Results July 25, 2019 | Page 2 of 16 |
![]()
CONSOLIDATED SECOND QUARTER RESULTS
CONSOLIDATED SECOND QUARTER RESULTS | ||||||
|
|
|
|
|
|
|
|
| As Reported(1) |
| Comparable (2) | ||
Expressed in millions of Mexican pesos |
| 2Q 2019 | 2Q 2018 | Δ% |
| Δ% |
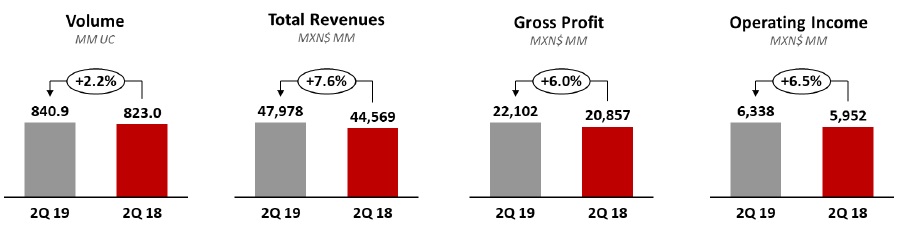
Total revenues |
| 47,978 | 44,569 | 7.6% |
| 11.6% |
Gross profit | 22,102 | 20,857 | 6.0% | 10.1% | ||
Operating income | 6,338 | 5,952 | 6.5% | 13.8% | ||
Operating cash flow(3) |
| 9,180 | 8,726 | 5.2% |
| 9.2% |
Volumeincreased 2.2% to 840.9 million unit cases, driven mainly by 7.2% growth in Brazil, slight growth in Colombia and the consolidation of recently acquired territories in Guatemala and Uruguay; partially offset by volume declines in Mexico and Argentina. On a comparable basis, total volumes increased 1.3%.
Total revenuesincreased 7.6% to Ps. 47,978 million, driven mainly by price increases above inflation and revenue management initiatives across our territories, volume growth in Brazil, Central America and Colombia, the consolidation of recently acquired territories in Guatemala and Uruguay and a favorable mix effect driven by transactions growing ahead of volumes in Argentina and Brazil. These factors were partially offset by the negative translation effect resulting from the depreciation of all of our operating currencies as compared to the Mexican Peso, combined with volume decline in Argentina and Mexico. On a comparable basis, total revenues increased 11.6%.
Gross profitincreased 6.0% to Ps. 22,102 million and gross margin contracted 70 basis points to 46.1%. More stable sweetener and packaging prices were offset by i) higher concentrate costs in Mexico; ii) higher concentrate costs in Brazil, related to the reduction of tax credits on concentrate purchased from the Manaus Free Trade Zone; iii) an unfavorable currency hedging position in most of our operations; and iv) the depreciation in the average exchange rate of most of our operating currencies as applied to our U.S. dollar-denominated raw material costs. On a comparable basis, gross profit increased 10.1%.
Operating incomeincreased 6.5% to Ps. 6,338 million, and operating margin contracted 20 basis points to 13.2%. This increase was driven mainly by operating expense efficiencies and freight efficiencies in Brazil and Mexico; effects that were partially offset by restructuring severance in Argentina, Central America, Colombia, and Mexico. On a comparable basis, operating income increased 13.8%.
(1) | According to IFRS 5, figures from 2018 do not include the Philippines as it is presented as a discontinued operation as of January 1, 2018. |
(2) | Please refer to page 9 for our definition of “comparable” and a description of the factors affecting the comparability of our financial and operating performance. |
(3) | Operating cash flow = operating income + depreciation + amortization & other operating non-cash charges. |
Coca-Cola FEMSA Reports 2Q2019 Results July 25, 2019 | Page 3 of 16 |
![]()
Comprehensive financing result recorded an expense of Ps. 1,559 million, compared to an expense of Ps. 1,438 million in the same period of 2018. This quarter we had a reduction in our interest expense, net, as compared to the same period of 2018, a foreign exchange loss —as our cash exposure in U.S. dollars was negatively impacted by the appreciation of the Mexican Peso during the second quarter of 2019—and a reduction in other financial expenses.
Income taxasa percentage of income before taxes was 24.7% as compared to 30.7% during the same period of the previous year. This decrease was driven mainly by the increase in the relative weight of our Mexico operation´s profits in our consolidated results, which have a lower tax rate, coupled with certain tax efficiencies and ongoing efforts to reduce non-deductible items across our operations.
Net income attributable to equity holders of the company reached Ps. 3,487 million as compared to Ps. 2,781 million during the same period of the previous year. Earnings per share1 were Ps. 0.21 (Earnings per unit were Ps. 1.66 and earnings per ADS were Ps. 16.60).
(1) | Quarterly earnings / outstanding shares. Earnings per share (EPS) for all periods are adjusted to give effect to the stock split resulting in 16,806.7 million shares outstanding. For the convenience of the reader, as a KOF UBL Unit is comprised of 8 shares (3 Series B shares and 5 Series L shares); earnings per unit are equal to EPS multiplied by 8. Each ADS represents 10 KOF UBL Units. |
Coca-Cola FEMSA Reports 2Q2019 Results July 25, 2019 | Page 4 of 16 |
![]()
CONSOLIDATED FIRST SIX MONTHS RESULTS
CONSOLIDATED FIRST SIX MONTHS RESULTS | ||||||
|
|
|
|
|
|
|
|
| As Reported(1) |
| Comparable (2) | ||
Expressed in millions of Mexican pesos |
| YTD 2019 | YTD 2018 | Δ% |
| Δ% |
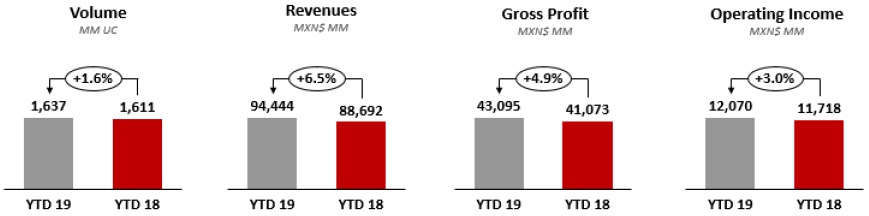
Total revenues |
| 94,444 | 88,692 | 6.5% |
| 10.8% |
Gross profit | 43,095 | 41,073 | 4.9% | 9.5% | ||
Operating income | 12,070 | 11,718 | 3.0% | 11.7% | ||
Operating cash flow(3) |
| 17,756 | 16,891 | 5.1% |
| 10.1% |
Volumeincreased 1.6% to 1,637.1 million unit cases in the first six months of 2019 as compared to the same period of 2018, driven mainly by 8.2% growth in Brazil, and the consolidation of recently acquired territories in Guatemala and Uruguay, partially offset by volume declines in the rest of our operations. On a comparable basis, total volumes increased 0.7%.
Total revenuesincreased 6.5% to Ps. 94,444 million in the first six months of 2019 as compared to the same period of 2018, driven mainly by price increases above inflation and revenue management initiatives across our territories, volume growth in Brazil, the consolidation of recently acquired territories in Guatemala and Uruguay, and a favorable mix effect driven by transactions growing ahead of volumes in Argentina and Brazil. These factors were partially offset by the negative translation effect resulting from the depreciation of all of our operating currencies as compared to the Mexican Peso, combined with volume declines in Argentina, Colombia and Mexico. On a comparable basis, total revenues increased 10.8%.
Gross profitincreased 4.9% to Ps. 43,095 million in the first six months of 2019 as compared to the same period of 2018, and gross margin contracted 70 basis points to 45.6%. Lower sweetener prices were offset by i) higher concentrate costs in Mexico; ii) higher concentrate costs in Brazil, related to the reduction of tax credits on concentrate purchased from the Manaus Free Trade Zone; iii) higher PET prices during the first quarter of 2019 across most of our operations; and iv) the depreciation in the average exchange rate of most of our operating currencies as applied to our U.S. dollar-denominated raw material costs. On a comparable basis, gross profit increased 9.5%.
Operating incomeincreased 3.0% to Ps. 12,070 million in the first six months of 2019 as compared to the same period of 2018, and operating margin contracted 40 basis points to 12.8%. This increase was driven mainly by operating expense efficiencies, and freight efficiencies in Brazil and Mexico; effects that were partially offset by restructuring severance of Ps. 701 million in Argentina, Central America, Colombia, and Mexico. On a comparable basis, operating income increased 11.7%.
(1) | According to IFRS 5, figures from 2018 do not include the Philippines as it is presented as a discontinued operation as of January 1, 2018. |
(2) | Please refer to page 9 for our definition of “comparable” and a description of the factors affecting the comparability of our financial and operating performance. |
(3) | Operating cash flow = operating income + depreciation + amortization & other operating non-cash charges. |
Coca-Cola FEMSA Reports 2Q2019 Results July 25, 2019 | Page 5 of 16 |
![]()
Comprehensive financing result recorded an expense of Ps. 3,153 million during the first six months of 2019 compared to an expense of Ps. 3,539 million in the same period of 2018. For this period we had a reduction in our interest expense, net, as compared to the same period of 2018, a foreign exchange loss —as our cash exposure in U.S. dollars was negatively impacted by the appreciation of the Mexican Peso during the first six months of 2019—and a reduction in other financial expenses.
Income taxasa percentage of income before taxes was 28.4% as compared to 31.0% during the first six months of the previous year. This decrease was driven mainly by the increase in the relative weight of our Mexico operation´s profits in our consolidated results, which have a lower tax rate, coupled with certain tax efficiencies and ongoing efforts to reduce non-deductible items across our operations.
Net income attributable to equity holders of the company reached Ps. 6,088 million in the first six months of 2019 as compared to Ps. 5,195 million during the same period of the previous year. Earnings per share1 were Ps. 0.56 (Earnings per unit were Ps. 28.98 and earnings per ADS were Ps. 12.33).
(1) | Quarterly earnings / outstanding shares. Earnings per share (EPS) for all periods are adjusted to give effect to the stock split resulting in 16,806.7 million shares outstanding. For the convenience of the reader, as each KOF UBL Unit is comprised of 8 shares (3 Series B shares and 5 Series L shares), earnings per unit are equal to EPS multiplied by 8. Each ADS represents 10 KOF UBL Units. |
Coca-Cola FEMSA Reports 2Q2019 Results July 25, 2019 | Page 6 of 16 |
![]()
MEXICO & CENTRAL AMERICA DIVISION SECOND QUARTER RESULTS
(Mexico, Guatemala, Costa Rica, Panama, and Nicaragua) |  |

MEXICO & CENTRAL AMERICA DIVISION RESULTS | ||||||
|
|
|
|
|
|
|
|
| As Reported(1) |
| Comparable (2) | ||
Expressed in millions of Mexican pesos |
| 2Q 2019 | 2Q 2018 | Δ% |
| Δ% |
Total revenues |
| 29,008 | 26,392 | 9.9% |
| 9.2% |
Gross profit | 14,166 | 12,881 | 10.0% | 9.3% | ||
Operating income | 4,527 | 3,800 | 19.1% | 18.6% | ||
Operating cash flow(3) |
| 6,285 | 5,614 | 12.0% |
| 11.4% |
Volume increased 0.5% to 554.7 million unit cases, driven by the consolidation of recently acquired territories in Guatemala and volume growth in Costa Rica, Panama and organic volume in Guatemala, partially offset by volume decline in Mexico and Nicaragua. On a comparable basis, volume decreased 0.5%.
Total revenues increased 9.9% to Ps. 29,008 million, driven by pricing ahead of inflation across the division, volume growth in Costa Rica, Panama and organic volume growth in Guatemala, and the consolidation of recently acquired territories in Guatemala as of May 1, 2018. These effects were partially offset by volume declines in Mexico and Nicaragua and a slightly unfavorable mix driven by volumes outperforming transactions. On a comparable basis, total revenues increased 9.2%.
Gross profitincreased 10.0% to Ps. 14,166 million and gross profit margin remained flat at 48.8% driven mainly by our pricing initiatives and lower sweetener and PET costs. These factors were partially offset by higher concentrate costs in Mexico, and an unfavorable currency hedging position.On a comparable basis, gross profit increased 9.3%.
Operating incomeincreased 19.1% to Ps. 4,527 million in the second quarter of 2019, and operating income margin expanded 120 basis points to 15.6% during the period driven mainly by operating expense efficiencies and lower freight in Mexico, partially offset by restructuring severances of Ps. 436 million in the division.On a comparable basis, operating income increased 18.6%.
(1) | According to IFRS 5, figures from 2018 do not include the Philippines as it is presented as a discontinued operation as of January 1, 2018. |
(2) | Please refer to page 9 for our definition of “comparable” and a description of the factors affecting the comparability of our financial and operating performance. |
(3) | Operating cash flow = operating income + depreciation + amortization & other operating non-cash charges. |
Coca-Cola FEMSA Reports 2Q2019 Results July 25, 2019 | Page 7 of 16 |
![]()
SOUTH AMERICA DIVISION SECOND QUARTER RESULTS
(Brazil, Argentina, Colombia, and Uruguay) |  |
SOUTH AMERICA DIVISION RESULTS | ||||||
|
|
|
|
|
|
|
|
| As Reported(1) |
| Comparable (2) | ||
Expressed in millions of Mexican pesos |
| 2Q 2019 | 2Q 2018 | Δ% |
| Δ% |
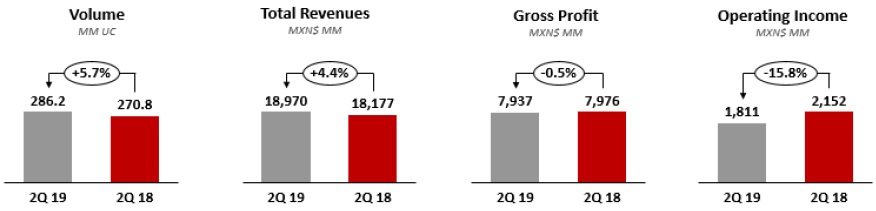
Total revenues |
| 18,970 | 18,177 | 4.4% |
| 15.9% |
Gross profit | 7,937 | 7,976 | (0.5%) | 11.8% | ||
Operating income | 1,811 | 2,152 | (15.8%) | 2.4% | ||
Operating cash flow(3) |
| 2,895 | 3,112 | (7.0%) |
| 4.1% |
Volume increased 5.7% to 286.2 million unit cases, driven by volume growth of 7.2% in Brazil, 0.6% in Colombia, and the consolidation of the recently acquired territory in Uruguay partially offset by a volume decline in Argentina. On a comparable basis, volume grew 5.4%.
Total revenues increased 4.4% to Ps. 18,970 million, driven mainly by strong volume growth in Brazil, pricing ahead or in line with inflation in the division, a favorable mix effect driven by transactions outperforming volumes in Argentina and Brazil, and the consolidation of the recently acquired territory in Uruguay as of July 1, 2018. These factors were partially offset by a volume contraction in Argentina, coupled with an unfavorable currency translation effect resulting from the depreciation of all our local currencies in the division as compared to the Mexican Peso.On a comparable basis,total revenues increased 15.9%.
Gross profitdecreased 0.5% to Ps. 7,937 million, and gross profit margin contracted 210 basis points to 41.8%. This isa result of higher concentrate costs in Brazil related to the reduction of tax credits on concentrate purchased from the Manaus free trade zone, and the depreciation of the average exchange rate of all our local currencies in the division as applied to our U.S. dollar-denominated raw material costs. These factors were partially offset by our pricing initiatives, lower sweetener and PET prices.On a comparable basis,gross profit increased 11.8%.
Operating incomedecreased 15.8% to Ps. 1,812 million in the second quarter of 2019, resulting in a margin contraction of 230 basis points to 9.5% driven mainly by a decline in Argentina´s top line and restructuring severances of Ps. 76 million in Argentina and Colombia, partially offset by freight efficiencies in Brazil and expense control in the division.On a comparable basis,operating income increased 2.4%.
(1) | According to IFRS 5, figures from 2018 do not include the Philippines as it is presented as a discontinued operation as of January 1, 2018. |
(2) | Please refer to page 9 for our definition of “comparable” and a description of the factors affecting the comparability of our financial and operating performance. |
(3) | Operating cash flow = operating income + depreciation + amortization & other operating non-cash charges. |
Coca-Cola FEMSA Reports 2Q2019 Results July 25, 2019 | Page 8 of 16 |
![]()
DEFINITIONS
Volume is expressed in unit cases. Unit case refers to 192 ounces of finished beverage product (24 eight-ounce servings) and, when applied to soda fountains, refers to the volume of syrup, powders and concentrate that is required to produce 192 ounces of finished beverage product.
Transactions refers to the number of single units (e.g. a can or a bottle) sold, regardless of their size or volume or whether they are sold individually or in multipacks, except for soda fountains, which represent multiple transactions based on a standard 12 oz. serving.
Operating income is a non-GAAP financial measure computed as “gross profit – operating expenses – other operating expenses, net + operative equity method (gain) loss in associates.”
Operating cash flow is a non-GAAP financial measure computed as “operating income + depreciation + amortization & other operating non-cash charges.”
Earnings per share are equal to “quarterly earnings / outstanding shares.” Earnings per share (EPS) for all periods are adjusted to give effect to the stock split resulting in 16,806,658,096 shares outstanding. For the convenience of the reader, as each KOF UBL Unit is comprised of 8 shares (3 Series B shares and 5 Series L shares), earnings per unit are equal to EPS multiplied by 8. Each ADS represents 10 KOF UBL Units.
COMPARABILITY
In an effort to provide our readers with a more useful representation of our company's underlying financial and operating performance, we are including the term “Comparable.” This means, with respect to a year-over-year comparison, the change of a given measure excluding the effects of: (i) mergers, acquisitions, and divestitures, including acquisitions made in Guatemala and Uruguay as of May and July 2018, respectively; (ii) translation effects resulting from exchange rate movements; and (iii) the results of hyperinflationary subsidiaries in both periods: Argentina’s results from 2019 and 2018. In preparing this measure, management has used its best judgment, estimates, and assumptions in order to maintain comparability. The relation between our reported and comparable figures is described in the following chart:

*Reported 2018 figures reflect the Philippines as a discontinued operation.
Coca-Cola FEMSA Reports 2Q2019 Results July 25, 2019 | Page 9 of 16 |
![]()
ABOUT THE COMPANY
Stock listing information: Mexican Stock Exchange, Ticker: KOF UBL | NYSE (ADS), Ticker: KOF | Ratio of KOF UBL to KOF = 10:1
Coca-Cola FEMSA files reports, including annual reports and other information with the U.S. Securities and Exchange Commission, or the “SEC”, and the Mexican Stock Exchange (Bolsa Mexicana de Valores, or the “BMV”) pursuant to the rules and regulations of the SEC (that apply to foreign private issuers) and of the BMV. Filings we make electronically with the SEC and the BMV are available to the public on the Internet at the SEC’s website at www.sec.gov, the BMV’s website at www.bmv.com.mx and our website at www.coca-colafemsa.com.
Coca-Cola FEMSA, S.A.B. de C.V. is the largest Coca-Cola franchise bottler in the world by sales volume. The Company produces and distributes trademark beverages of The Coca-Cola Company, offering a wide portfolio of 131 brands to a population of more than 257 million. With over 83 thousand employees, the Company markets and sells approximately 3.3 billion unit cases through close to 2 million points of sale a year. Operating 49 manufacturing plants and 275 distribution centers, Coca-Cola FEMSA is committed to generating economic, social, and environmental value for all of its stakeholders across the value chain. The Company is a member of the Dow Jones Sustainability Emerging Markets Index, Dow Jones Sustainability MILA Pacific Alliance Index, FTSE4Good Emerging Index, and the Mexican Stock Exchange’s IPC and Social Responsibility and Sustainability Indices, among others. Its operations encompass franchise territories in Mexico, Brazil, Guatemala, Colombia, and Argentina, and, nationwide, in Costa Rica, Nicaragua, Panama, Uruguay, and Venezuela through its investment in KOF Venezuela. For further information, please visit www.coca-colafemsa.com

ADDITIONAL INFORMATION
All of the financial information presented in this report was prepared under International Financial Reporting Standards (IFRS).
This news release may contain forward-looking statements concerning Coca-Cola FEMSA’s future performance, which should be considered as good faith estimates by Coca-Cola FEMSA. These forward-looking statements reflect management’s expectations and are based upon currently available data. Actual results are subject to future events and uncertainties, many of which are outside Coca-Cola FEMSA’s control, which could materially impact the Company’s actual performance. References herein to “US$” are to United States dollars. This news release contains translations of certain Mexican peso amounts into U.S. dollars for the convenience of the reader. These translations should not be construed as representations that Mexican peso amounts actually represent such U.S. dollars amounts or could be converted into U.S. dollars at the rate indicated.
(5 pages of tables to follow)
Coca-Cola FEMSA Reports 2Q2019 Results July 25, 2019 | Page 10 of 16 |
![]()
COCA-COLA FEMSA | ||||||||||||||
CONSOLIDATED INCOME STATEMENT | ||||||||||||||
Millions of Pesos(1) | ||||||||||||||
|
|
|
|
|
|
|
|
|
|
|
|
|
| |
|
| For the Second Quarter of: | For the First Six Months of: | |||||||||||
|
| 2019 | % of Rev. | 2018(4) | % of Rev. | Δ% Reported | Δ% Comparable(8) |
| 2019 | % of Rev. | 2018(4) | % of Rev. | Δ% Reported | Δ% Comparable(8) |
Transactions (million transactions) |
| 5,012.5 |
| 4,880.4 |
| 2.7% | 1.4% | 9,850.2 |
| 9,565.9 |
| 3.0% | 1.2% | |
Volume (million unit cases) |
| 840.9 |
| 823.0 |
| 2.2% | 1.3% | 1,637.1 |
| 1,610.9 |
| 1.6% | 0.7% | |
Average price per unit case |
| 52.82 |
| 50.58 |
| 4.4% |
|
| 52.83 |
| 50.93 |
| 3.7% |
|
Net revenues |
| 47,672 |
| 44,468 |
| 7.2% |
| 93,909 |
| 88,473 |
| 6.1% |
| |
Other operating revenues |
| 306 |
| 101 |
| 202.1% |
| 535 |
| 218 |
| 145.1% |
| |
Total revenues(2) |
| 47,978 | 100.0% | 44,569 | 100.0% | 7.6% | 11.6% | 94,444 | 100.0% | 88,692 | 100.0% | 6.5% | 10.8% | |
Cost of goods sold |
| 25,876 | 53.9% | 23,712 | 53.2% | 9.1% |
| 51,349 | 54.4% | 47,619 | 53.7% | 7.8% |
| |
Gross profit |
| 22,102 | 46.1% | 20,857 | 46.8% | 6.0% | 10.1% | 43,095 | 45.6% | 41,073 | 46.3% | 4.9% | 9.5% | |
Operating expenses |
| 15,036 | 31.3% | 14,368 | 32.2% | 4.7% |
| 29,963 | 31.7% | 28,738 | 32.4% | 4.3% |
| |
Other operative expenses, net |
| 655 | 1.4% | 470 | 1.1% | 39.4% |
| 968 | 1.0% | 501 | 0.6% | 93.3% |
| |
Operative equity method (gain) loss in associates(3) |
| 73 | 0.2% | 67 | 0.2% | 8.6% |
| 95 | 0.1% | 116 | 0.1% | -18.4% |
| |
Operating income(6) |
| 6,338 | 13.2% | 5,952 | 13.4% | 6.5% | 13.8% | 12,070 | 12.8% | 11,718 | 13.2% | 3.0% | 11.7% | |
Other non operative expenses, net |
| (3) | 0.0% | 59 | 0.1% | NA |
|
| 73 | 0.1% | 121 | 0.1% | -39.8% |
|
Non Operative equity method (gain) loss in associates(5) |
| 3 | 0.0% | (18) | 0.0% | NA |
| (31) | 0.0% | (6) | 0.0% | 399.5% |
| |
Interest expense |
| 1,732 |
| 1,679 |
| 3.2% |
| 3,475 |
| 3,688 |
| -5.8% |
| |
Interest income |
| 300 |
| 50 |
| 505.2% |
| 551 |
| 426 |
| 29.4% |
| |
Interest expense, net |
| 1,433 |
| 1,629 |
| -12.1% |
|
| 2,924 |
| 3,262 |
| -10.4% |
|
Foreign exchange loss (gain) |
| 91 |
| (251) |
| NA |
| 199 |
| (29) |
| NA |
| |
Loss (gain) on monetary position in inflationary subsidiries |
| 36 |
| - |
| NA |
| 30 |
| - |
| NA |
| |
Market value (gain) loss on financial instruments |
| (0) |
| 59 |
| NA |
|
| (0) |
| 305 |
| NA |
|
Comprehensive financing result |
| 1,559 |
| 1,438 |
| 8.4% |
|
| 3,153 |
| 3,539 |
| -10.9% |
|
Income before taxes |
| 4,779 |
| 4,473 |
| 6.8% |
|
| 8,875 |
| 8,065 |
| 10.0% |
|
Income taxes |
| 1,181 |
| 1,397 |
| -15.5% |
|
| 2,519 |
| 2,499 |
| 0.8% |
|
Result of discontinued operations |
| - |
| 115 |
| NA |
|
| - |
| 166 |
| NA |
|
Consolidated net income |
| 3,598 |
| 3,191 |
| 12.7% |
|
| 6,357 |
| 5,732 |
| 10.9% |
|
Net income attributable to equity holders of the company |
| 3,487 | 7.3% | 2,781 | 6.2% | 25.4% |
|
| 6,088 | 6.4% | 5,195 | 5.9% | 17.2% |
|
Non-controlling interest |
| 111 | 0.2% | 410 | 0.9% | -73.0% |
|
| 269 | 0.3% | 537 | 0.6% | -49.9% |
|
|
|
|
|
|
|
|
|
|
|
|
|
|
| |
Operating Cash Flow & CAPEX |
| 2019 | % of Rev. | 2018(4) | % of Rev. | Δ% Reported | Δ% Comparable(8) | 2019 | % of Rev. | 2018(4) | % of Rev. | Δ% Reported | Δ% Comparable(8) | |
Operating income(6) |
| 6,338 | 13.2% | 5,952 | 13.4% | 6.5% |
| 12,070 | 12.8% | 11,718 | 13.2% | 3.0% |
| |
Depreciation |
| 2,218 |
| 2,065 |
| 7.4% |
| 4,493 |
| 4,048 |
| 11.0% |
| |
Amortization and other operative non-cash charges |
| 625 |
| 709 |
| -12.0% |
| 1,193 |
| 1,125 |
| 6.0% |
| |
Operating cash flow(6)(7) |
| 9,180 | 19.1% | 8,726 | 19.6% | 5.2% | 9.2% | 17,756 | 18.8% | 16,891 | 19.0% | 5.1% | 10.1% | |
CAPEX |
| 2,407 |
| 2,404 |
| 0.1% |
| 3,961 |
| 4,016 |
| -1.4% |
| |
|
|
|
|
|
|
|
|
|
|
|
|
|
| |
(1) | Except volume and average price per unit case figures. |
(2) | Please refer to pages 14 and 15 for revenue breakdown. |
(3) | Includes equity method in Jugos del Valle, Leao Alimentos, Estrella Azul, among others. |
(4) | According to IFRS 5, figures from 2018 do not include the Philippines as it is presented as a discontinued operation as of January 1, 2018. |
(5) | Includes equity method in PIASA, IEQSA, Beta San Miguel, IMER and KSP Participacoes among others. |
(6) | The operating income and operating cash flow lines are presented as non-gaap measures for the convenience of the reader. |
(7) | Operating cash flow = operating income + depreciation, amortization & other operating non-cash charges. |
(8) | Please refer to page 9 for our definition of “comparable” and a description of the factors affecting the comparability of our financial and operating performance. |
Coca-Cola FEMSA Reports 2Q2019 Results July 25, 2019 | Page 11 of 16 |
![]()
MEXICO & CENTRAL AMERICA DIVISION | ||||||||||||||
RESULTS OF OPERATIONS | ||||||||||||||
Millions of Pesos(1) | ||||||||||||||
|
|
|
|
|
|
|
|
|
|
|
|
|
|
|
|
| For the Second Quarter of: |
| For the First Six Months of: | ||||||||||
|
| 2019 | % of Rev. | 2018 | % of Rev. | Δ% | Δ% |
| 2019 | % of Rev. | 2018 | % of Rev. | Δ% | Δ% |
Transactions (million transactions) |
| 3,060.6 |
| 3,072.2 |
| -0.4% | -1.8% |
| 5,749.0 |
| 5,746.2 |
| 0.0% | -2.6% |
Volume (million unit cases) |
| 554.7 |
| 552.2 |
| 0.5% | -0.5% |
| 1,032.7 |
| 1,027.1 |
| 0.5% | -1.3% |
Average price per unit case |
| 52.28 |
| 47.78 |
| 9.4% |
|
| 52.09 |
| 47.37 |
| 10.0% |
|
Net revenues |
| 29,001 |
| 26,383 |
|
|
|
| 53,789 |
| 48,652 |
|
|
|
Other operating revenues |
| 7 |
| 9 |
|
|
|
| 42 |
| 17 |
|
|
|
Total Revenues(2) |
| 29,008 | 100.0% | 26,392 | 100.0% | 9.9% | 9.2% |
| 53,831 | 100.0% | 48,669 | 100.0% | 10.6% | 8.3% |
Cost of goods sold |
| 14,842 | 51.2% | 13,511 | 51.2% |
|
|
| 27,884 | 51.8% | 25,305 | 52.0% |
|
|
Gross profit |
| 14,166 | 48.8% | 12,881 | 48.8% | 10.0% | 9.3% |
| 25,946 | 48.2% | 23,365 | 48.0% | 11.1% | 8.8% |
Operating expenses |
| 9,130 | 31.5% | 8,719 | 33.0% |
|
|
| 17,686 | 32.9% | 16,585 | 34.1% |
|
|
Other operative expenses, net |
| 422 | 1.5% | 276 | 1.0% |
|
|
| 535 | 1.0% | 172 | 0.4% |
|
|
Operative equity method (gain) loss in associates(3) |
| 87 | 0.3% | 85 | 0.3% |
|
|
| 123 | 0.2% | 144 | 0.3% |
|
|
Operating income (4) |
| 4,527 | 15.6% | 3,800 | 14.4% | 19.1% | 18.6% |
| 7,603 | 14.1% | 6,463 | 13.3% | 17.6% | 16.1% |
Depreciation, amortization & other operating non-cash charges | 1,758 | 6.1% | 1,814 | 6.9% |
|
| 3,454 | 6.4% | 3,247 | 6.7% |
|
| ||
Operating cash flow(4)(5) |
| 6,285 | 21.7% | 5,614 | 21.3% | 12.0% | 11.4% |
| 11,057 | 20.5% | 9,710 | 20.0% | 13.9% | 11.8% |
|
|
|
|
|
|
|
|
|
|
|
|
|
| |
(1) | Except volume and average price per unit case figures. |
(2) | Please refer to pages 14 and 15 for revenue breakdown. |
(3) | Includes equity method in Jugos del Valle, Estrella Azul, among others. |
(4) | The operating income and operating cash flow lines are presented as non-gaap measures for the convenience of the reader. |
(5) | Operating cash flow = operating income + depreciation, amortization & other operating non-cash charges. |
(6) | Please refer to page 9 for our definition of “comparable” and a description of the factors affecting the comparability of our financial and operating performance. |
SOUTH AMERICA DIVISION | ||||||||||||||
RESULTS OF OPERATIONS | ||||||||||||||
Millions of Pesos(1) | ||||||||||||||
|
|
|
|
|
|
|
|
|
|
|
|
|
|
|
|
| For the Second Quarter of: |
| For the First Six Months of: | ||||||||||
|
| 2019 | % of Rev. | 2018 | % of Rev. | Δ% | Δ% |
| 2019 | % of Rev. | 2018 | % of Rev. | Δ% | Δ% |
Transactions (million transactions) |
| 1,951.8 |
| 1,808.2 |
| 7.9% | 7.6% |
| 4,101.2 |
| 3,819.7 |
| 7.4% | 7.8% |
Volume (million unit cases) |
| 286.2 |
| 270.8 |
| 5.7% | 5.4% |
| 604.5 |
| 583.8 |
| 3.5% | 4.9% |
Average price per unit case |
| 53.88 |
| 56.29 |
| -4.3% |
|
| 54.10 |
| 57.20 |
| -5.4% |
|
Net revenues |
| 18,671 |
| 18,085 |
|
|
|
| 40,120 |
| 39,821 |
|
|
|
Other operating revenues |
| 299 |
| 93 |
|
|
|
| 493 |
| 201 |
|
|
|
Total Revenues(2) |
| 18,970 | 100.0% | 18,177 | 100.0% | 4.4% | 15.9% |
| 40,614 | 100.0% | 40,022 | 100.0% | 1.5% | 14.7% |
Cost of goods sold |
| 11,034 | 58.2% | 10,201 | 56.1% |
|
|
| 23,465 | 57.8% | 22,314 | 55.8% |
|
|
Gross profit |
| 7,937 | 41.8% | 7,976 | 43.9% | -0.5% | 11.8% |
| 17,149 | 42.2% | 17,708 | 44.2% | -3.2% | 10.6% |
Operating expenses |
| 5,906 | 31.1% | 5,649 | 31.1% |
|
|
| 12,277 | 30.2% | 12,153 | 30.4% |
|
|
Other operative expenses, net |
| 233 | 1.2% | 194 | 1.1% |
|
|
| 433 | 1.1% | 329 | 0.8% |
|
|
Operative equity method (gain) loss in associates(3) |
| (14) | -0.1% | (18) | -0.1% |
|
|
| (29) | -0.1% | (28) | -0.1% |
|
|
Operating income (4) |
| 1,811 | 9.5% | 2,152 | 11.8% | -15.8% | 2.4% |
| 4,467 | 11.0% | 5,255 | 13.1% | -15.0% | 4.1% |
Depreciation, amortization & other operating non-cash charges | 1,084 | 5.7% | 961 | 5.3% |
|
| 2,232 | 5.5% | 1,925 | 4.8% |
|
| ||
Operating cash flow(4)(5) |
| 2,895 | 15.3% | 3,112 | 17.1% | -7.0% | 4.1% |
| 6,699 | 16.5% | 7,181 | 17.9% | -6.7% | 6.9% |
(1) | Except volume and average price per unit case figures. |
(2) | Please refer to pages 14 and 15 for revenue breakdown. |
(3) | Includes equity method in Leao Alimentos, Verde Campo, among others. |
(4) | The operating income and operating cash flow lines are presented as non-gaap measures for the convenience of the reader. |
(5) | Operating cash flow = operating income + depreciation, amortization & other operating non-cash charges. |
(6) | Please refer to page 9 for our definition of “comparable” and a description of the factors affecting the comparability of our financial and operating performance. |
Coca-Cola FEMSA Reports 2Q2019 Results July 25, 2019 | Page 12 of 16 |
![]()
COCA-COLA FEMSA | ||||||||||
CONSOLIDATED BALANCE SHEET | ||||||||||
Millions of Pesos | ||||||||||
|
|
|
|
|
|
|
|
|
|
|
Assets | Jun-19 | Dec-18 | % Var. |
| Liabilities & Equity | Jun-19 | Dec-18 | % Var. | ||
Current Assets |
|
|
|
|
| Current Liabilities |
|
|
|
|
Cash, cash equivalents and marketable securities |
|
|
|
|
| Short-term bank loans and notes payable |
| 16,726 | 11,604 | 44% |
23,486 | 23,727 | -1% |
| Suppliers |
| 15,993 | 19,746 | -19% | ||
Total accounts receivable |
| 11,530 | 14,847 | -22% |
| Short-term leasing Liabilities |
| 487 | - |
|
Inventories | 10,020 | 10,051 | 0% |
| Other current liabilities |
| 20,142 | 14,174 | 42% | |
Other current assets |
| 8,900 | 8,865 | 0% |
| Total current liabilities |
| 53,347 | 45,524 | 17% |
Total current assets |
| 53,936 | 57,490 | -6% |
| Non-Current Liabilities |
|
|
|
|
Non-Current Assets |
|
|
|
|
| Long-term bank loans and notes payable |
| 58,863 | 70,201 | -16% |
Property, plant and equipment | 106,874 | 106,259 | 1% |
| Long Term Leasing Liabilities |
| 1,076 | - |
| |
Accumulated depreciation |
| (46,393) | (44,316) | 5% |
| Other long-term liabilities |
| 17,254 | 16,313 | 6% |
Total property, plant and equipment, net |
| 60,481 | 61,942 | -2% |
| Total liabilities |
| 130,540 | 132,037 | -1% |
Right of use assets |
| 1,552 | - | NA |
| Equity |
|
|
|
|
Investment in shares | 10,618 | 10,518 | 1% |
| Non-controlling interest |
| 6,942 | 6,807 | 2% | |
Intangible assets and other assets |
| 115,709 | 116,804 | -1% |
| Total controlling interest |
| 122,248 | 124,943 | -2% |
Other non-current assets |
| 17,434 | 17,033 | 2% |
| Total equity |
| 129,190 | 131,750 | -2% |
Total Assets | 259,730 | 263,788 | -2% |
| Total Liabilities and Equity | 259,730 | 263,788 | -2% | ||
|
|
|
|
|
|
|
|
|
|
|
|
| June 30, 2019 |
|
|
|
|
| |||
| ||||||||||
Debt Mix | % Total Debt(1) | % Interest Rate Floating(1) (2) | Average Rate |
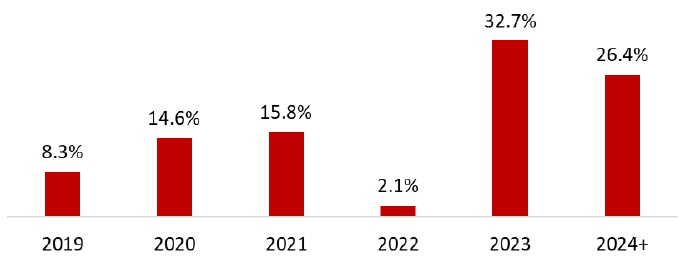
| Debt Maturity Profile | |||||
Currency |
|
|
|
|
|
| ||||
Mexican Pesos |
| 58.5% | 10.9% | 8.4% |
| |||||
U.S. Dollars |
| 8.9% | 0.0% | 3.9% |
| |||||
Colombian Pesos |
| 1.7% | 100.0% | 5.5% |
| |||||
Brazilian Reals |
| 29.0% | 1.7% | 7.8% |
| |||||
Uruguayan Pesos |
| 1.6% | 0.0% | 10.0% |
| |||||
Argentine Pesos |
| 0.3% | 20.0% | 65.5% |
| |||||
Total Debt |
| 100% | 4.6% | 8.0% |
| |||||
(1) After giving effect to cross- currency swaps. |
|
|
|
|
|
| ||||
(2) Calculated by weighting each year´s outstanding debt balance mix. |
|
|
|
|
|
| ||||
|
|
|
|
|
|
|
|
|
|
|
|
|
|
|
|
|
|
|
|
|
|
Financial Ratios |
| LTM 2019 | FY 2018 | Δ% |
|
|
|
|
|
|
Net debt including effect of hedges(1)(3) | 51,670 | 56,934 | -9.2% |
|
|
|
|
|
| |
Net debt including effect of hedges / Operating cash flow(1)(3) |
| 1.39 | 1.61 |
|
|
|
|
|
| |
Operating cash flow/ Interest expense, net(1) | 6.07 | 5.40 |
|
|
|
|
|
|
| |
Capitalization(2) |
| 40.2% | 40.5% |
|
|
|
|
|
|
|
(1) Net debt = total debt - cash |
|
|
|
|
|
| ||||
(2) Total debt / (long-term debt + shareholders' equity) |
|
|
|
|
|
| ||||
(3) After giving effect to cross-currency swaps. |
|
|
|
|
|
| ||||
Coca-Cola FEMSA Reports 2Q2019 Results July 25, 2019 | Page 13 of 16 |
![]()
COCA-COLA FEMSA | ||||||||||||||
QUARTERLY- VOLUME, TRANSACTIONS & REVENUES | ||||||||||||||
|
|
|
|
|
|
|
|
|
|
|
|
|
|
|
Volume | ||||||||||||||
|
| 2Q 2019 |
| 2Q 2018(3) |
| YoY | ||||||||
| Sparkling | Water(1) | Bulk(2) | Stills | Total |
| Sparkling | Water(1) | Bulk(2) | Stills | Total |
| Δ % | |
Mexico | 357.1 | 28.3 | 77.6 | 31.5 | 494.5 |
| 360.9 | 29.0 | 76.4 | 32.4 | 498.7 |
| -0.8% | |
Central America | 51.6 | 3.2 | 0.1 | 5.4 | 60.2 |
| 45.5 | 2.6 | 0.1 | 5.2 | 53.5 |
| 12.6% | |
Mexico and Central America | 408.7 | 31.4 | 77.8 | 36.8 | 554.7 |
| 406.4 | 31.6 | 76.5 | 37.7 | 552.2 |
| 0.5% | |
Colombia | 48.6 | 5.8 | 4.6 | 3.2 | 62.2 |
| 47.3 | 5.9 | 4.7 | 3.9 | 61.8 |
| 0.6% | |
Brazil | 157.9 | 10.4 | 1.6 | 13.1 | 183.1 |
| 150.0 | 9.7 | 1.6 | 9.6 | 170.8 |
| 7.2% | |
Argentina | 25.5 | 3.1 | 0.9 | 2.0 | 31.6 |
| 31.0 | 3.6 | 1.0 | 2.5 | 38.1 |
| -17.2% | |
Uruguay | 8.6 | 0.7 | - | 0.1 | 9.4 |
| - | - | - | - | - |
| NA | |
South America | 240.6 | 20.0 | 7.1 | 18.4 | 286.2 |
| 228.3 | 19.2 | 7.3 | 16.0 | 270.8 |
| 5.7% | |
TOTAL |
| 649.3 | 51.5 | 84.8 | 55.2 | 840.9 |
| 634.6 | 50.8 | 83.8 | 53.7 | 823.0 |
| 2.2% |
|
|
|
|
|
|
|
|
|
|
|
|
|
|
|
(1) Excludes water presentations larger than 5.0 Lt ; includes flavored water. | ||||||||||||||
(2) Bulk Water = Still bottled water in 5.0, 19.0 and 20.0 - liter packaging presentations; includes flavored water | ||||||||||||||
|
|
|
|
|
|
|
|
|
|
|
|
|
|
|
Transactions |
|
|
|
|
|
|
|
|
|
|
|
|
|
|
|
| 2Q 2019 |
| 2Q 2018(3) |
| YoY | ||||||||
| Sparkling | Water | Stills | Total |
| Sparkling | Water | Stills | Total | Δ % | ||||
Mexico | 2,112.7 | 181.6 | 265.6 | 2,559.8 |
| 2,154.8 | 211.5 | 261.2 | 2,627.5 | -2.6% | ||||
Central America | 414.2 | 24.5 | 62.1 | 500.8 | 364.9 | 16.0 | 63.7 | 444.7 | 12.6% | |||||
Mexico and Central America | 2,526.9 | 206.1 | 327.7 | 3,060.6 |
| 2,519.8 | 227.5 | 325.0 | 3,072.2 | -0.4% | ||||
Colombia | 352.8 | 77.8 | 33.9 | 464.5 |
| 348.0 | 82.2 | 44.4 | 474.5 | -2.1% | ||||
Brazil | 1,047.8 | 91.6 | 117.5 | 1,256.9 |
| 936.1 | 82.2 | 107.2 | 1,125.5 | 11.7% | ||||
Argentina | 147.4 | 19.5 | 15.9 | 182.8 |
| 169.5 | 20.5 | 18.1 | 208.2 | -12.2% | ||||
Uruguay | 43.8 | 3.0 | 0.8 | 47.6 |
| - | - | - | - | - | ||||
South America | 1,591.7 | 191.9 | 168.2 | 1,951.8 |
| 1,453.6 | 184.9 | 169.7 | 1,808.2 | 7.9% | ||||
TOTAL |
| 4,118.6 | 398.0 | 495.8 | 5,012.5 |
| 3,973.3 | 412.4 | 494.7 | 4,880.4 |
| 2.7% | ||
|
|
|
|
|
|
|
|
|
|
|
|
| ||
Revenues |
|
|
|
| ||||||||||
Expressed in million Mexican Pesos |
| 2Q 2019 | 2Q 2018(3) | Δ % |
|
|
|
|
|
|
|
|
|
|
Mexico |
| 24,474 | 22,437 | 9.1% |
|
|
|
|
|
|
|
|
|
|
Central America |
| 4,534 | 3,955 | 14.6% |
|
|
|
|
|
|
|
|
|
|
Mexico and Central America |
| 29,008 | 26,392 | 9.9% |
|
|
|
|
|
|
|
|
|
|
Colombia |
| 3,220 | 3,493 | -7.8% |
|
|
|
|
|
|
|
|
|
|
Brazil(4) |
| 13,265 | 12,318 | 7.7% |
|
|
|
|
|
|
|
|
|
|
Argentina |
| 1,731 | 2,366 | -26.8% |
|
|
|
|
|
|
|
|
|
|
Uruguay |
| 754 | - | - |
|
|
|
|
|
|
|
|
|
|
South America |
| 18,970 | 18,177 | 4.4% |
|
|
|
|
|
|
|
|
|
|
TOTAL |
| 47,978 | 44,569 | 7.6% |
|
|
|
|
|
|
|
|
|
|
|
|
|
|
|
|
|
|
|
|
|
|
|
|
|
(3) Volume, transactions and revenues for 2Q 2018 are re-presented excluding the Philippines. | ||||||||||||||
(4) Brazil includes beer revenues of Ps.3,253.3 million for the second quarter of 2019 and Ps. 2,842.6 million for the same period of the previous year. | ||||||||||||||
(1) Volume is expressed in unit cases. Unit case refers to 192 ounces of finished beverage product (24 eight-ounce servings) and, when applied to soda fountains, refers to the volume of syrup, powders and concentrate that is required to produce 192 ounces of finished beverage product.
(2) Transactions refers to the number of single units (e.g. a can or a bottle) sold, regardless of their size or volume or whether they are sold individually or in multipacks, except for fountain which represents multiple transactions based on a standard 12 oz. serving.
Coca-Cola FEMSA Reports 2Q2019 Results July 25, 2019 | Page 14 of 16 |
![]()
COCA-COLA FEMSA | ||||||||||||||
YTD - VOLUME, TRANSACTIONS & REVENUES | ||||||||||||||
|
|
|
|
|
|
|
|
|
|
|
|
|
|
|
Volume | ||||||||||||||
|
| YTD 2019 |
| YTD 2018(3) |
| YoY | ||||||||
| Sparkling | Water(1) | Bulk(2) | Stills | Total |
| Sparkling | Water(1) | Bulk(2) | Stills | Total |
| Δ % | |
Mexico | 661.6 | 50.2 | 143.6 | 60.7 | 916.1 |
| 671.0 | 54.2 | 142.9 | 60.6 | 928.7 |
| -1.4% | |
Central America | 99.7 | 6.2 | 0.3 | 10.4 | 116.6 |
| 82.3 | 5.5 | 0.3 | 10.2 | 98.4 |
| 18.5% | |
Mexico and Central America | 761.3 | 56.4 | 144.0 | 71.1 | 1,032.7 |
| 753.3 | 59.7 | 143.2 | 70.8 | 1,027.1 |
| 0.5% | |
Colombia | 94.3 | 12.1 | 9.3 | 6.8 | 122.5 |
| 97.7 | 12.8 | 9.8 | 8.2 | 128.5 |
| -4.6% | |
Brazil | 342.6 | 24.9 | 4.0 | 24.0 | 395.5 |
| 319.3 | 22.1 | 3.6 | 20.6 | 365.6 |
| 8.2% | |
Argentina | 52.9 | 6.9 | 1.9 | 4.6 | 66.3 |
| 71.8 | 8.9 | 2.5 | 6.5 | 89.7 |
| -26.1% | |
Uruguay | 18.2 | 1.7 | - | 0.1 | 20.0 |
| - | - | - | - | - |
| NA | |
South America | 508.0 | 45.6 | 15.2 | 35.5 | 604.3 |
| 488.8 | 43.8 | 15.9 | 35.3 | 583.8 |
| 3.5% | |
TOTAL |
| 1,269.2 | 102.0 | 159.2 | 106.6 | 1,637.0 |
| 1,242.1 | 103.5 | 159.1 | 106.1 | 1,610.9 |
| 1.6% |
|
|
|
|
|
|
|
|
|
|
|
|
|
|
|
(1) Excludes water presentations larger than 5.0 Lt ; includes flavored water. | ||||||||||||||
(2) Bulk Water = Still bottled water in 5.0, 19.0 and 20.0 - liter packaging presentations; includes flavored water | ||||||||||||||
|
|
|
|
|
|
|
|
|
|
|
|
|
|
|
Transactions |
|
|
|
|
|
|
|
|
|
|
|
|
|
|
|
| YTD 2019 |
| YTD 2018(3) |
| YoY | ||||||||
| Sparkling | Water | Stills | Total |
| Sparkling | Water | Stills | Total | Δ % | ||||
Mexico | 3,940.1 | 371.2 | 471.6 | 4,782.9 |
| 4,041.3 | 394.1 | 491.6 | 4,927.0 | -2.9% | ||||
Central America | 797.3 | 47.7 | 121.1 | 966.1 | 659.8 | 32.2 | 127.2 | 819.2 | 17.9% | |||||
Mexico and Central America | 4,737.4 | 418.9 | 592.8 | 5,749.0 |
| 4,701.1 | 426.4 | 618.8 | 5,746.2 | 0.0% | ||||
Colombia | 686.2 | 162.6 | 73.5 | 922.3 |
| 722.4 | 167.6 | 90.3 | 980.4 | -5.9% | ||||
Brazil | 2,228.7 | 216.4 | 247.5 | 2,692.6 |
| 1,960.3 | 190.6 | 223.3 | 2,374.2 | 13.4% | ||||
Argentina | 307.4 | 43.0 | 33.3 | 383.7 |
| 373.9 | 48.0 | 43.2 | 465.1 | -17.5% | ||||
Uruguay | 93.9 | 7.2 | 1.5 | 102.6 |
| - | - | - | - | - | ||||
South America | 3,316.2 | 429.2 | 355.8 | 4,101.2 |
| 6,763.2 | 837.5 | 764.4 | 8,365.1 | -51.0% | ||||
TOTAL |
| 8,053.6 | 848.1 | 948.5 | 9,850.2 |
| 11,464.3 | 1,263.9 | 1,383.1 | 14,111.3 |
| -30.2% | ||
|
|
|
|
|
|
|
|
|
|
|
|
| ||
Revenues |
|
|
|
| ||||||||||
Expressed in million Mexican Pesos |
| YTD 2019 | YTD 2018(3) | Δ % |
|
|
|
|
|
|
|
|
|
|
Mexico |
| 45,049 | 41,521 | 8.5% |
|
|
|
|
|
|
|
|
|
|
Central America |
| 8,782 | 7,148 | 22.9% |
|
|
|
|
|
|
|
|
|
|
Mexico and Central America |
| 53,831 | 48,669 | 10.6% |
|
|
|
|
|
|
|
|
|
|
Colombia |
| 6,409 | 7,093 | -9.6% |
|
|
|
|
|
|
|
|
|
|
Brazil(4) |
| 28,778 | 27,166 | 5.9% |
|
|
|
|
|
|
|
|
|
|
Argentina |
| 3,774 | 5,763 | -34.5% |
|
|
|
|
|
|
|
|
|
|
Uruguay |
| 1,653 | - | - |
|
|
|
|
|
|
|
|
|
|
South America |
| 40,614 | 40,022 | 1.5% |
|
|
|
|
|
|
|
|
|
|
TOTAL |
| 94,444 | 88,692 | 6.5% |
|
|
|
|
|
|
|
|
|
|
|
|
|
|
|
|
|
|
|
|
|
|
|
|
|
(3) Volume, transactions and revenues for Year to date are re-presented excluding the Philippines. | ||||||||||||||
(4) Brazil includes beer revenues of Ps. 7,419.9 million for the first six months of 2019 and Ps. 6,429.1 million for the same period of the previous year. | ||||||||||||||

(1) Volume is expressed in unit cases. Unit case refers to 192 ounces of finished beverage product (24 eight-ounce servings) and, when applied to soda fountains, refers to the volume of syrup, powders and concentrate that is required to produce 192 ounces of finished beverage product.
(2) Transactions refers to the number of single units (e.g. a can or a bottle) sold, regardless of their size or volume or whether they are sold individually or in multipacks, except for fountain which represents multiple transactions based on a standard 12 oz. serving.
Coca-Cola FEMSA Reports 2Q2019 Results July 25, 2019 | Page 15 of 16 |
![]()
COCA-COLA FEMSA | ||||||||
MACROECONOMIC INFORMATION | ||||||||
|
|
|
|
|
|
|
|
|
Inflation(1) |
|
|
|
|
| |||
|
| LTM | 2Q19 | YTD |
| |||
Mexico | 4.15% | -0.11% | -0.08% | |||||
Colombia | 3.37% | 0.99% | 2.76% | |||||
Brazil | 4.38% | 1.15% | 2.35% | |||||
Argentina | 58.81% | 10.84% | 22.81% | |||||
Costa Rica | 2.57% | 0.60% | 0.82% | |||||
Panama | 0.08% | 0.78% | 0.69% | |||||
Guatemala | 4.32% | 0.95% | 2.60% | |||||
Nicaragua | 6.30% | 4.10% | 4.40% | |||||
Uruguay |
| 7.28% | 0.80% | 5.01% | ||||
|
|
|
|
|
|
|
|
|
(1) Source: inflation estimated by the company based on historic publications from the Central Bank of each country. | ||||||||
|
|
|
|
|
|
|
| |
|
|
|
|
|
|
|
| |
Average Exchange Rates for each period(2) | ||||||||
|
| Quarterly Exchange Rate (Local Currency per USD) | Quarterly Exchange Rate (Local Currency per USD) | |||||
|
| 2Q19 | 2Q18 | Δ % | YTD 19 | YTD 18 | Δ % | |
Mexico |
| 19.12 | 19.37 | -1.3% | 19.17 | 19.07 | 0.6% | |
Colombia |
| 3,239.81 | 2,840.31 | 14.1% | 3,187.08 | 2,850.34 | 11.8% | |
Brazil |
| 3.92 | 3.61 | 8.6% | 3.84 | 3.43 | 12.2% | |
Argentina |
| 43.96 | 23.53 | 86.8% | 41.53 | 21.62 | 92.1% | |
Costa Rica |
| 595.98 | 569.03 | 4.7% | 602.97 | 570.49 | 5.7% | |
Panama |
| 1.00 | 1.00 | 0.0% | 1.00 | 1.00 | 0.0% | |
Guatemala |
| 7.67 | 7.44 | 3.1% | 7.70 | 7.40 | 3.9% | |
Nicaragua |
| 32.92 | 31.36 | 5.0% | 32.73 | 31.17 | 5.0% | |
Uruguay |
| 34.85 | 30.07 | 15.9% | 33.84 | 29.27 | 15.6% | |
|
|
|
|
|
|
|
|
|
|
|
|
|
|
|
|
|
|
End-of-period Exchange Rates | ||||||||
|
| Closing Exchange Rate (Local Currency per USD) |
| Closing Exchange Rate (Local Currency per USD) | ||||
| �� | Jun-19 | Jun-18 | Δ % |
| Mar-19 | Mar-18 | Δ % |
Mexico |
| 19.17 | 19.86 | -3.5% | 19.38 | 18.34 | 5.6% | |
Colombia |
| 3,205.67 | 2,930.80 | 9.4% | 3,174.79 | 2,780.47 | 14.2% | |
Brazil |
| 3.83 | 3.86 | -0.6% | 3.90 | 3.32 | 17.2% | |
Argentina |
| 42.46 | 28.85 | 47.2% | 43.35 | 20.15 | 115.1% | |
Costa Rica |
| 583.64 | 570.08 | 2.4% | 602.36 | 569.31 | 5.8% | |
Panama |
| 1.00 | 1.00 | 0.0% | 1.00 | 1.00 | 0.0% | |
Guatemala |
| 7.71 | 7.49 | 2.9% | 7.68 | 7.40 | 3.8% | |
Nicaragua |
| 33.12 | 31.55 | 5.0% | 32.72 | 31.16 | 5.0% | |
Uruguay |
| 35.18 | 31.47 | 11.8% |
| 32.39 | 28.76 | 12.6% |
|
|
|
|
|
|
|
|
|
(2) Average exchange rate for each period computed with the average exchange rate of each month. | ||||||||
Coca-Cola FEMSA Reports 2Q2019 Results July 25, 2019 | Page 16 of 16 |
SIGNATURES
Pursuant to the requirements of the Securities Exchange Act of 1934, the registrant has duly caused this report to be signed on its behalf by the undersigned, thereunto duly authorized.
|
|
| COCA-COLA FEMSA, S.A.B. DE C.V. |
| By: /s/ Constantino Spas Montesinos |
| Constantino Spas Montesinos Chief Financial Officer |
|
|
Date: July24, 2019 |
|