UNITED STATES
SECURITIES AND EXCHANGE COMMISSION
Washington, D.C. 20549
FORM 6-K
REPORT OF FOREIGN PRIVATE ISSUER
PURSUANT TO RULE 13a-16 OR 15d-16 UNDER
THE SECURITIES EXCHANGE ACT OF 1934
For the month of February 2023
Commission File Number 1-12260
COCA-COLA FEMSA, S.A.B. de C.V.
(Translation of registrant’s name into English)
United Mexican States
(Jurisdiction of incorporation or organization)
Calle Mario Pani No. 100,
Santa Fe Cuajimalpa,
Cuajimalpa de Morelos,
05348, Ciudad de México,
México
(Address of principal executive offices)
Indicate by check mark whether the registrant files or will file annual reports under cover of Form 20-F or Form 40-F.
Form 20-F X Form 40-F
Indicate by check mark if the registrant is submitting the Form 6-K in paper as permitted by Regulation S-T Rule 101(b)(1)
Yes No X
Indicate by check mark if the registrant is submitting the Form 6-K in paper as permitted by Regulation S-T Rule 101(b)(7)
Yes No X
Indicate by check mark whether the registrant by furnishing the information contained in this Form is also thereby furnishing the information to the Commission pursuant to Rule 12g3-2(b) under the Securities Exchange Act of 1934.
Yes No X
If "Yes" is marked, indicate below the file number assigned to the registrant in connection with
Rule 12g3-2(b): 82-__.

Mexico City, February 23, 2023, Coca-Cola FEMSA, S.A.B. de C.V. (BMV: KOFUBL, NYSE: KOF) (“Coca-Cola FEMSA”, “KOF” or the “Company”), the largest Coca-Cola franchise bottler in the world by sales volume, announces results for the fourth quarter and full year of 2022.
FOURTH QUARTER OPERATIONAL AND FINANCIAL HIGHLIGHTS
| · | Consolidated volumes increased 4.6%, driven mainly by volume growth in Brazil, Mexico, Guatemala, Argentina, and Uruguay, partially offset by a slight volume decline in Colombia. On a comparable basis, volume increased 3.6%. |
| · | Total revenues increased 14.9%, while comparable revenues increased 18.9%, driven mainly by favorable price-mix effects, coupled with volume growth. These effects were partially offset by unfavorable currency translation effects. |
| · | Operating income increased 15.9%, while comparable operating income increased 18.0%. Our solid top-line growth, raw material hedging strategies, and operating expense efficiencies were partially offset by higher raw material costs. |
| · | Majority net income increased 23.0%, resulting in earnings per share1 of Ps. 0.43 (Earnings per unit were Ps. 3.40, and per ADS were Ps. 34.00.). |
FULL YEAR OPERATIONAL AND FINANCIAL HIGHLIGHTS
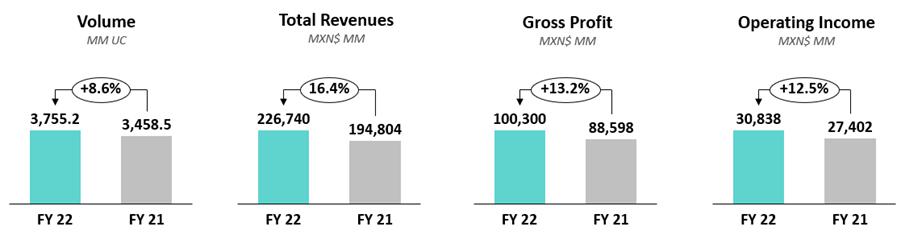
| · | Consolidated volumes increased 8.6% driven by volume growth across all our territories, including double-digit increases in Brazil, Colombia, Argentina, and Guatemala coupled with a solid performance in Mexico and Uruguay. On a comparable basis, excluding M&A, our volume increased 7.5%. |
| · | Total revenues increased 16.4%, while comparable revenues increased 17.8%, driven mainly by our pricing initiatives, favorable price-mix effects, and volume growth. These factors were partially offset by a decline in beer revenues related to the transition of the beer portfolio in Brazil and unfavorable currency translation effects. |
| · | Operating income increased 12.5%, while comparable operating income increased 11.6% driven mainly by solid top-line and operating expense efficiencies. These effects were partially offset by higher raw material costs, coupled with a tough comparison base that includes the recognition of non-recurring tax effects in Brazil during 2021. |
| · | Majority net income increased 21.2%, resulting in earnings per share1 of Ps. 1.13 (Earnings per unit were Ps. 9.06, and per ADS were Ps. 90.60.). |
RESULTS FINANCIAL SUMMARY
| FINANCIAL SUMMARY FOR THE FOURTH QUARTER AND FULL YEAR OF 2022 | ||||||||||||
| Change vs. same period of last year | ||||||||||||
| Total Revenues | Gross Profit | Operating Income | Majority Net Income | |||||||||
| 4Q 2022 | FY 2022 | 4Q 2022 | FY 2022 | 4Q 2022 | FY 2022 | 4Q 2022 | FY 2022 | |||||
| As Reported | Consolidated | 14.9% | 16.4% | 12.9% | 13.2% | 15.9% | 12.5% | 23.0% | 21.2% | |||
| Mexico & Central America | 9.7% | 13.1% | 5.1% | 8.1% | 2.6% | 11.2% | ||||||
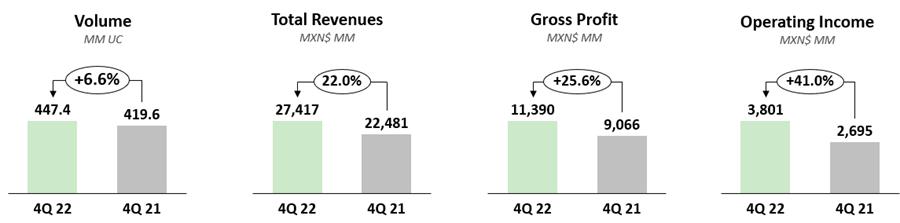
| South America | 22.0% | 21.2% | 25.6% | 22.5% | 41.0% | 15.5% | ||||||
| Comparable (2) | Consolidated | 18.9% | 17.8% | 16.9% | 14.6% | 18.0% | 11.6% | |||||
| Mexico & Central America | 10.9% | 13.5% | 6.1% | 8.5% | 3.6% | 11.6% | ||||||
| South America | 30.9% | 24.4% | 36.1% | 26.4% | 46.1% | 11.6% | ||||||
Ian Craig, Coca-Cola FEMSA’s CEO, commented: |
“2022 was a positive year for Coca-Cola FEMSA. In the face of an inflationary environment, our company was able to deliver its highest ever top-line, operating income, and operating cash flow levels. Notably, we were able to deliver double-digit top-line growth across our territories, reflecting our company’s ability to execute the right strategies locally, our revenue growth management initiatives, and effective point-of-sale execution. Simultaneously, we leveraged our enhanced cooperation framework with The Coca-Cola Company to increase investments in the business, advanced the rollout of our B2B omnichannel platform, and expand our multi-category strategy to explore new revenue streams in key territories.
Looking ahead, I am encouraged by the opportunities we see for our company. I am convinced that we have a talented team, clear rights-to-win, and positive momentum to enter a new chapter of growth and sustainable value creation for Coca-Cola FEMSA.”
| (1) | Quarterly earnings / outstanding shares. Earnings per share (EPS) were calculated using 16,806.7 million shares outstanding. For the convenience of the reader, as a KOFUBL Unit is comprised of 8 shares (3 Series B shares and 5 Series L shares), earnings per unit are equal to EPS multiplied by 8. Each ADS represents 10 KOFUBL Units. |
| (2) | Please refer to page 9 for our definition of “comparable” and a description of the factors affecting the comparability of our financial and operating performance. |
RECENT DEVELOPMENTS
| · | On November 3, 2022, Coca-Cola FEMSA paid the second installment of the ordinary dividend approved during 2022. |
| · | On November 29, 2022, Coca-Cola FEMSA announced that the Board of Directors appointed Mr. Gerardo Cruz Celaya to succeed Mr. Constantino Spas Montesinos as Coca-Cola FEMSA´s Chief Financial Officer. Mr. Cruz´s appointment became effective January 1, 2023. |
| · | On December 19, 2022, Coca-Cola FEMSA announced it had been included in the Dow Jones Sustainability MILA Pacific Alliance Index for the sixth year. Additionally, it announced it is the only company in the Latin America beverage industry included in the Dow Jones Sustainability Emerging Markets Index, for which it was included for the tenth consecutive year. |
CONFERENCE CALL INFORMATION

CONSOLIDATED FOURTH QUARTER RESULTS

| CONSOLIDATED FOURTH QUARTER RESULTS | ||||||
| As Reported | Comparable (1) | |||||
| Expressed in millions of Mexican pesos | 4Q 2022 | 4Q 2021 | Δ% | Δ% | ||
| Total revenues | 61,209 | 53,273 | 14.9% | 18.9% | ||
| Gross profit | 27,068 | 23,985 | 12.9% | 16.9% | ||
| Operating income | 9,013 | 7,778 | 15.9% | 18.0% | ||
| Operating cash flow (2) | 11,954 | 10,648 | 12.3% | 16.5% | ||
Volume increased 4.6% to 995.3 million unit cases, driven mainly by volume growth in Brazil, Mexico, Guatemala, Argentina, and Uruguay. This increase was partially offset by a slight volume decline in Colombia. On a comparable basis, our volume would have increased 3.6%.
Total revenues increased 14.9% to Ps. 61,209 million. This increase was driven mainly by our pricing initiatives to offset increases in raw material costs, favorable price-mix effects, and volume growth. These effects were partially offset by unfavorable currency translation effects of most of our operating currencies into Mexican Pesos. On a comparable basis, total revenues would have increased 18.9%.
Gross profit increased 12.9% to Ps. 27,068 million, and gross margin decreased 80 basis points to 44.2%. This gross margin decrease was driven by higher raw material costs, mainly PET and sweeteners. These effects were partially offset by our top-line growth, the appreciation of the Mexican Peso as applied to our U.S. dollar-denominated raw material costs, and favorable raw material hedging initiatives. On a comparable basis, gross profit would have increased 16.9%.
Operating income increased 15.9% to Ps. 9,013 million, and operating margin increased 10 basis points to 14.7%. This increase was driven mainly by our solid top-line performance, operational leverage, coupled with operating expense efficiencies across our operations. These effects were partially offset by increases in raw material costs. On a comparable basis, operating income would have increased 18.0%.
| (1) | Please refer to page 9 for our definition of “comparable” and a description of the factors affecting the comparability of our financial and operating performance. |
| (2) | Operating cash flow = operating income + depreciation + amortization & other operating non-cash charges. |
Comprehensive financing result recorded an expense of Ps. 1,092 million, compared to an expense of Ps. 748 million in the same period of 2021.
This increase was driven mainly by a foreign exchange loss of Ps. 281 million as compared to a gain of Ps. 79 million recorded during the same period of 2021, as our cash exposure in U.S. dollars was negatively impacted by the quarterly appreciation of the Mexican Peso.
In addition, we recorded higher interest expenses of Ps. 1,833 million as compared to Ps. 1,592 million recorded during the same period of 2021. This is a result of increases in interest rates.
Moreover, we recognized a lower gain in monetary position in inflationary subsidiaries of Ps. 128 million during the fourth quarter of 2022, as compared to a gain of Ps. 270 during the same period of the previous year.
Finally, this quarter we recognized a lower gain in the market value of financial instruments of Ps. 72 million, as compared to a gain of Ps. 131 million during the fourth quarter of 2021.
These effects were partially offset by higher interest income for Ps. 821 million as compared to a gain of Ps. 365 million recorded during the same period of 2021, related to an increase in interest rates.
Income tax as a percentage of income before taxes was 7.7% as compared to 14.1% during the same period of the previous year. This lower effective tax rate was mainly driven by deferred tax effects.
Net income attributable to equity holders of the company was Ps. 7,144 million as compared to Ps. 5,809 million during the same period of the previous year, driven mainly by solid operating results, coupled with a decline in the effective tax rate. Earnings per share1 were Ps. 0.43 (Earnings per unit were Ps. 3.40 and per ADS were Ps. 34.0.).
CONSOLIDATED FULL YEAR RESULTS
| CONSOLIDATED FULL YEAR RESULTS | ||||||
| As Reported | Comparable (1) | |||||
| Expressed in millions of Mexican pesos | FY 2022 | FY 2021 | Δ% | Δ% | ||
| Total revenues | 226,740 | 194,804 | 16.4% | 17.8% | ||
| Gross profit | 100,300 | 88,598 | 13.2% | 14.6% | ||
| Operating income | 30,838 | 27,402 | 12.5% | 11.6% | ||
| Operating cash flow (2) | 43,001 | 38,849 | 10.7% | 11.4% | ||
Volume increased 8.6% to 3,755.2 million unit cases, driven mainly by volume growth across all of our territories, including double-digit increases in Brazil, Colombia, Argentina and Guatemala, coupled with solid performances in Mexico and Uruguay. On a comparable basis, excluding M&A, our volume would have increased 7.5%.
Total revenues increased 16.4% to Ps. 226,740 million. This increase was driven mainly by volume growth, our pricing initiatives to offset increases in raw material costs, and favorable price-mix effects. These factors were partially offset by a decline in beer revenues related to the transition of the beer portfolio in Brazil and unfavorable currency translation effects from most of our operating currencies into Mexican Pesos. On a comparable basis, excluding M&A and currency translation effects, total revenues would have increased 17.8%.
Gross profit increased 13.2% to Ps. 100,300 million, and gross margin decreased 130 basis points to 44.2%. This decrease in gross margin was driven mainly by (i) a tough comparison base due to the recognition of an extraordinary Ps. 1,083 million during the second quarter of 2021, related to credits on concentrate purchased from the Manaus Free Trade Zone in Brazil; and (ii) higher raw material costs, mainly PET and sweeteners. These effects were partially offset by top-line growth and favorable raw material hedging initiatives. On a comparable basis, gross profit would have increased 14.6%.
Operating income increased 12.5% to Ps. 30,838 million, and operating margin decreased 50 basis points to 13.6%. This operating margin decrease was driven mainly by higher raw material costs, coupled with a tough comparison base that included the recognition of non-recurring tax income of Ps. 620 million during the third quarter of 2021. These effects were partially offset by our solid top-line performance, coupled with operating expense efficiencies across our territories. On a comparable basis, operating income would have increased 11.6%.
| (1) | Please refer to page 9 for our definition of “comparable” and a description of the factors affecting the comparability of our financial and operating performance. |
| (2) | Operating cash flow = operating income + depreciation + amortization & other operating non-cash charges. |
Comprehensive financing result recorded an expense of Ps. 4,549 million, compared to an expense of Ps. 4,219 million in 2021.
This increase was driven mainly by a foreign exchange loss of Ps. 324 million as compared to a gain of Ps. 227 million recorded during the same period of 2021, as our cash exposure in U.S. dollars was negatively impacted by the appreciation of the Mexican Peso.
In addition, we recognized a loss in the market value of financial instruments of Ps. 672 million, as compared to a gain of Ps. 80 million during 2021.
Additionally, we recorded an increase in interest expense. During the year, interest expenses were Ps. 6,500 million, as compared to an expense of Ps. 6,192 million during 2021. This increase was mainly driven by increases in interest rates, partially offset by the tender offer completed during the third quarter of 2022.
Finally, we recognized a lower gain in monetary position in inflationary subsidiaries, recording Ps. 536 million during 2022, as compared to a gain of Ps. 734 million during the previous year.
These effects were partially offset by higher interest income, resulting in Ps. 2,411 million during 2022, as compared to a gain of Ps. 932 million recorded during 2021. This increase is related to an increase in interest rates.
Income tax as a percentage of income before taxes was 25.4% as compared to 28.9% during the same period of the previous year, mainly driven by deferred tax effects.
Net income attributable to equity holders of the company was Ps. 19,034 million as compared to Ps. 15,708 million during the same period of the previous year, an increase of 21.2%. This was driven mainly by operating income growth, coupled with a decline in our effective tax rate during the year. Earnings per share1 were Ps. 1.13 (Earnings per unit were Ps. 9.06, and per ADS were Ps. 90.61.).
MEXICO & CENTRAL AMERICA DIVISION FOURTH QUARTER RESULTS
(Mexico, Guatemala, Costa Rica, Panama, and Nicaragua)


| MEXICO & CENTRAL AMERICA DIVISION RESULTS | ||||||
| As Reported | Comparable (1) | |||||
| Expressed in millions of Mexican pesos | 4Q 2022 | 4Q 2021 | Δ% | Δ% | ||
| Total revenues | 33,792 | 30,792 | 9.7% | 10.9% | ||
| Gross profit | 15,678 | 14,918 | 5.1% | 6.1% | ||
| Operating income | 5,212 | 5,083 | 2.6% | 3.6% | ||
| Operating cash flow (2) | 6,902 | 6,835 | 1.0% | 4.5% | ||
Volume increased 3.0% to 547.9 million unit cases, driven by volume growth across our territories in the division, including 11.0% growth in Guatemala and 2.3% growth in Mexico.
Total revenues increased 9.7% to Ps. 33,792 million, driven mainly by our pricing initiatives to offset increases in raw material costs, favorable price-mix effects, and volume growth in all our territories. These factors were partially offset by unfavorable currency translation effects into Mexican Pesos. On a comparable basis, total revenues would have increased 10.9%.
Gross profit increased 5.1% to Ps. 15,678 million, and gross margin contracted 200 basis points to 46.4%. This margin contraction was driven mainly by increases in raw material costs such as PET and sweeteners. These effects were partially offset by our favorable price-mix effects, coupled with the appreciation of the Mexican Peso as applied to our U.S. dollar-denominated raw material costs. On a comparable basis, gross profit would have increased 6.1%.
Operating income increased 2.6% to Ps. 5,212 million, and operating margin contracted 110 basis points to 15.4%. This margin contraction was driven mainly by higher raw material costs that were partially offset by a non-cash operating foreign exchange gain, resulting from the appreciation of the Mexican Peso. On a comparable basis, operating income would have increased 3.6%.
| (1) | Please refer to page 9 for our definition of “comparable” and a description of the |
factors affecting the comparability of our financial and operating performance.
| (2) | Operating cash flow = operating income + depreciation + amortization & other |
operating non-cash charges.

SOUTH AMERICA DIVISION FOURTH QUARTER RESULTS
(Brazil, Argentina, Colombia, and Uruguay)

| SOUTH AMERICA DIVISION RESULTS | ||||||
| As Reported | Comparable (1) | |||||
| Expressed in millions of Mexican pesos | 4Q 2022 | 4Q 2021 | Δ% | Δ% | ||
| Total revenues | 27,417 | 22,481 | 22.0% | 30.9% | ||
| Gross profit | 11,390 | 9,066 | 25.6% | 36.1% | ||
| Operating income | 3,801 | 2,695 | 41.0% | 46.1% | ||
| Operating cash flow (2) | 5,052 | 3,813 | 32.5% | 38.7% | ||
Volume increased 6.6% to 447.4 million unit cases, driven mainly by the solid performance achieved in Brazil, Argentina, and Uruguay. Growth in these markets was partially offset by a slight volume decline in Colombia. On a comparable basis, excluding M&A, our volume for the division would have increased 4.4%.
Total revenues increased 22.0% to Ps. 27,417 million, driven mainly by our pricing initiatives to offset increases in raw material costs, favorable price-mix effects, and volume growth. These effects were partially offset by unfavorable currency translation effects of most of our operating currencies into Mexican pesos. On a comparable basis, total revenues would have increased 30.9%.
Gross profit increased 25.6% to Ps. 11,390 million, and gross margin expanded 120 basis points to 41.5%. This growth was driven mainly by favorable price-mix effects and volume growth. These effects were partially offset by increases in raw material costs such as PET and sweeteners. On a comparable basis, gross profit would have increased 36.1%.
Operating income increased 41.0% to Ps. 3,801 million, resulting in a margin expansion of 190 basis points to 13.9%. This increase was driven mainly by operating leverage resulting from our solid top-line performance in the division, coupled with operating expense efficiencies. On a comparable basis, operating income would have increased 46.1%.
| (1) | Please refer to page 9 for our definition of “comparable” and a description of the |
factors affecting the comparability of our financial and operating performance.
| (2) | Operating cash flow = operating income + depreciation + amortization & other operating non-cash charges. |

DEFINITIONS
Volume is expressed in unit cases. Unit case refers to 192 ounces of finished beverage product (24 eight-ounce servings) and, when applied to soda fountains, refers to the volume of syrup, powders, and concentrate that is required to produce 192 ounces of finished beverage product.
Transactions refers to the number of single units (e.g., a can or a bottle) sold, regardless of their size or volume or whether they are sold individually or in multipacks, except for soda fountains, which represent multiple transactions based on a standard 12 oz. serving.
Operating income is a non-GAAP financial measure computed as “gross profit – operating expenses – other operating expenses, net + operative equity method (gain) loss in associates.”
Operating cash flow is a non-GAAP financial measure computed as “operating income + depreciation + amortization & other operating non-cash charges.”
Earnings per share are equal to “quarterly earnings / outstanding shares.” Earnings per share (EPS) for all periods are adjusted to give effect to the stock split resulting in 16,806,658,096 shares outstanding. For the convenience of the reader, as a KOFUBL Unit is comprised of 8 shares (3 Series B shares and 5 Series L shares), earnings per unit are equal to EPS multiplied by 8. Each ADS represents 10 KOFUBL Units.
COMPARABILITY
In an effort to provide our readers with a more useful representation of our company's underlying financial and operating performance, as of the first quarter 2020, we adjusted our methodology to calculate our comparable figures, no longer excluding hyperinflationary operations. Due to this change, our “comparable” term means, with respect to a year-over-year comparison, the change of a given measure excluding the effects of: (i) mergers, acquisitions, and divestitures; and (ii) translation effects resulting from exchange rate movements. In preparing this measure, management has used its best judgment, estimates, and assumptions in order to maintain comparability.
ABOUT THE COMPANY
Stock listing information: Mexican Stock Exchange, Ticker: KOFUBL | NYSE (ADS), Ticker: KOF | Ratio of KOFUBL to KOF = 10:1
Coca-Cola FEMSA files reports, including annual reports and other information with the U.S. Securities and Exchange Commission, or the “SEC,” and the Mexican Stock Exchange (Bolsa Mexicana de Valores, or the “BMV”) pursuant to the rules and regulations of the SEC (that apply to foreign private issuers) and of the BMV. Filings we make electronically with the SEC and the BMV are available to the public on the Internet at the SEC’s website at www.sec.gov, the BMV’s website at www.bmv.com.mx, and our website at www.coca-colafemsa.com.
Coca-Cola FEMSA, S.A.B. de C.V. is the largest Coca-Cola franchise bottler in the world by sales volume. The Company produces and distributes trademark beverages of The Coca-Cola Company, offering a wide portfolio of 131 brands to a population of more than 266 million. With over 80 thousand employees, the Company markets and sells approximately 3.5 billion unit cases through 2 million points of sale a year. Operating 49 manufacturing plants and 260 distribution centers, Coca-Cola FEMSA is committed to generating economic, social, and environmental value for all of its stakeholders across the value chain. The Company is a member of the Dow Jones Sustainability Emerging Markets Index, Dow Jones Sustainability MILA Pacific Alliance Index, FTSE4Good Emerging Index, and the Mexican Stock Exchange’s IPC and Social Responsibility and Sustainability Indices, among others. Its operations encompass franchise territories in Mexico, Brazil, Guatemala, Colombia, and Argentina, and, nationwide, in Costa Rica, Nicaragua, Panama, Uruguay, and Venezuela through its investment in KOF Venezuela. For further information, please visit www.coca-colafemsa.com.

ADDITIONAL INFORMATION
All of the financial information presented in this report was prepared under International Financial Reporting Standards (IFRS).
This news release may contain forward-looking statements concerning Coca-Cola FEMSA’s future performance, which should be considered as good faith estimates by Coca-Cola FEMSA. These forward-looking statements reflect management’s expectations and are based upon currently available data. Actual results are subject to future events and uncertainties, many of which are outside Coca-Cola FEMSA’s control, which could materially impact the Company’s actual performance. References herein to “US$” are to United States dollars. This news release contains translations of certain Mexican peso amounts into U.S. dollars for the convenience of the reader. These translations should not be construed as representations that Mexican peso amounts actually represent such U.S. dollar amounts or could be converted into U.S. dollars at the rate indicated.
(6 pages of tables to follow)
| COCA-COLA FEMSA | ||||||||||||||
| CONSOLIDATED INCOME STATEMENT | ||||||||||||||
| Millions of Pesos (1) | ||||||||||||||
| For the Fourth Quarter of: | For Full Year: | |||||||||||||
| 2022 | % of Rev. | 2021 | % of Rev. | Δ% Reported | Δ% Comparable (7) | 2022 | % of Rev. | 2021 | % of Rev. | Δ% Reported | Δ% Comparable (7) | |||
| Transactions (million transactions) | 5,987.7 | 5,564.3 | 7.6% | 6.6% | 22,315.1 | 19,490.9 | 14.5% | 13.4% | ||||||
| Volume (million unit cases) | 995.3 | 951.3 | 4.6% | 3.6% | 3,755.2 | 3,457.8 | 8.6% | 7.5% | ||||||
| Average price per unit case | 59.54 | 54.31 | 9.6% | 58.75 | 52.99 | 10.9% | ||||||||
| Net revenues | 61,005 | 53,092 | 14.9% | 226,222 | 193,899 | 16.7% | ||||||||
| Other operating revenues | 204 | 181 | 12.9% | 518 | 905 | -42.7% | ||||||||
| Total revenues (2) | 61,209 | 100.0% | 53,273 | 100.0% | 14.9% | 18.9% | 226,740 | 100.0% | 194,804 | 100.0% | 16.4% | 17.8% | ||
| Cost of goods sold | 34,142 | 55.8% | 29,288 | 55.0% | 16.6% | 126,441 | 55.8% | 106,206 | 54.5% | 19.1% | ||||
| Gross profit | 27,068 | 44.2% | 23,985 | 45.0% | 12.9% | 16.9% | 100,300 | 44.2% | 88,598 | 45.5% | 13.2% | 14.6% | ||
| Operating expenses | 17,868 | 29.2% | 15,905 | 29.9% | 12.3% | 68,981 | 30.4% | 60,721 | 31.2% | 13.6% | ||||
| Other operative expenses, net | 226 | 0.4% | 323 | 0.6% | NA | 673 | 0.3% | 560 | 0.3% | 20.2% | ||||
| Operative equity method (gain) loss in associates(3) | (40) | -0.1% | (20) | 0.0% | NA | (192) | -0.1% | (85) | 0.0% | NA | ||||
| Operating income (5) | 9,013 | 14.7% | 7,778 | 14.6% | 15.9% | 18.0% | 30,838 | 13.6% | 27,402 | 14.1% | 12.5% | 11.6% | ||
| Other non operative expenses, net | (34) | -0.1% | 30 | 0.1% | NA | 310 | 0.1% | 247 | 0.1% | NA | ||||
| Non Operative equity method (gain) loss in associates (4) | (52) | -0.1% | (54) | -0.1% | NA | (194) | -0.1% | (3) | 0.0% | NA | ||||
| Interest expense | 1,833 | 1,592 | 15.1% | 6,500 | 6,192 | 5.0% | ||||||||
| Interest income | 821 | 365 | 125.3% | 2,411 | 932 | 158.7% | ||||||||
| Interest expense, net | 1,012 | 1,227 | -17.6% | 4,089 | 5,260 | -22.3% | ||||||||
| Foreign exchange loss (gain) | 281 | (79) | NA | 324 | (227) | NA | ||||||||
| Loss (gain) on monetary position in inflationary subsidiries | (128) | (270) | -52.3% | (536) | (734) | -27.1% | ||||||||
| Market value (gain) loss on financial instruments | (72) | (131) | NA | 672 | (80) | NA | ||||||||
| Comprehensive financing result | 1,092 | 748 | 45.9% | 4,549 | 4,219 | 7.8% | ||||||||
| Income before taxes | 8,008 | 7,053 | 13.5% | 26,173 | 22,940 | 14.1% | ||||||||
| Income taxes | 611 | 978 | -37.5% | 6,547 | 6,609 | -0.9% | ||||||||
| Result of discontinued operations | - | - | NA | - | - | NA | ||||||||
| Consolidated net income | 7,396 | 6,076 | 21.7% | 19,626 | 16,331 | 20.2% | ||||||||
| Net income attributable to equity holders of the company | 7,144 | 11.7% | 5,809 | 10.9% | 23.0% | 19,034 | 8.4% | 15,708 | 8.1% | 21.2% | ||||
| Non-controlling interest | 253 | 0.4% | 267 | 0.5% | -17.6% | 592 | 0.3% | 623 | 0.3% | NA | ||||
| Operating Cash Flow & CAPEX | 2022 | % of Rev. | 2021 | % of Rev. | Δ% Reported | Δ% Comparable (7) | 2022 | % of Rev. | 2021 | % of Rev. | Δ% Reported | Δ% Comparable (7) | ||
| Operating income (5) | 9,013 | 14.7% | 7,778 | 14.6% | 15.9% | 30,838 | 13.6% | 27,402 | 14.1% | 12.5% | ||||
| Depreciation | 2,397 | 2,277 | 5.3% | 9,657 | 8,946 | 8.0% | ||||||||
| Amortization and other operative non-cash charges | 544 | 593 | -8.2% | 2,506 | 2,501 | 0.2% | ||||||||
| Operating cash flow (5)(6) | 11,954 | 19.5% | 10,648 | 20.0% | 12.3% | 16.5% | 43,001 | 19.0% | 38,849 | 19.9% | 10.7% | 11.4% | ||
| CAPEX | 8,489 | 5,681 | 49.4% | 19,665 | 13,865 | 41.8% | ||||||||
(1) Except volume and average price per unit case figures.
(2) Please refer to page 14 for revenue breakdown.
(3) Includes equity method in Jugos del Valle and Leão Alimentos, among others.
(4) Includes equity method in PIASA, IEQSA, Beta San Miguel, IMER, and KSP Participacoes, among others.
(5) The operating income and operating cash flow lines are presented as non-GAAP measures for the convenience of the reader.
(6) Operating cash flow = operating income + depreciation, amortization & other operating non-cash charges.
(7) Please refer to page 9 for our definition of “comparable” and a description of the factors affecting the comparability of our financial and operating performance.
(8) For the Full year of 2022, total CAPEX effectively paid was Ps. 19,665 million.
| MEXICO & CENTRAL AMERICA DIVISION | ||||||||||||||
| RESULTS OF OPERATIONS | ||||||||||||||
| Millions of Pesos (1) | ||||||||||||||
| For the Fourth Quarter of: | For Full Year: | |||||||||||||
| 2022 | % of Rev. | 2021 | % of Rev. | Δ% Reported | Δ% Comparable (6) | 2022 | % of Rev. | 2021 | % of Rev. | Δ% Reported | Δ% Comparable (6) | |||
| Transactions (million transactions) | 2,921.2 | 2,816.4 | 3.7% | 3.7% | 11,633.2 | 10,610.0 | 9.6% | 9.6% | ||||||
| Volume (million unit cases) | 547.9 | 531.8 | 3.0% | 3.0% | 2,188.4 | 2,057.9 | 6.3% | 6.3% | ||||||
| Average price per unit case | 61.69 | 57.85 | 6.6% | 59.85 | 56.24 | 6.4% | ||||||||
| Net revenues | 33,797 | 30,765 | 130,981 | 115,731 | ||||||||||
| Other operating revenues | (5) | 26 | 21 | 63 | ||||||||||
| Total Revenues (2) | 33,792 | 100.0% | 30,792 | 100.0% | 9.7% | 10.9% | 131,002 | 100.0% | 115,794 | 100.0% | 13.1% | 13.5% | ||
| Cost of goods sold | 18,114 | 53.6% | 15,873 | 51.6% | 68,967 | 52.6% | 58,428 | 50.5% | ||||||
| Gross profit | 15,678 | 46.4% | 14,918 | 48.4% | 5.1% | 6.1% | 62,035 | 47.4% | 57,366 | 49.5% | 8.1% | 8.5% | ||
| Operating expenses | 10,451 | 30.9% | 9,666 | 31.4% | 40,829 | 31.2% | 38,049 | 32.9% | ||||||
| Other operative expenses, net | 39 | 0.1% | 203 | 0.7% | 394 | 0.3% | 615 | 0.5% | ||||||
| Operative equity method (gain) loss in associates (3) | (25) | -0.1% | (34) | -0.1% | (136) | -0.1% | (140) | -0.1% | ||||||
| Operating income (4) | 5,212 | 15.4% | 5,083 | 16.5% | 2.6% | 3.6% | 20,948 | 16.0% | 18,841 | 16.3% | 11.2% | 11.6% | ||
| Depreciation, amortization & other operating non-cash charges | 1,690 | 5.0% | 1,753 | 5.7% | 7,380 | 5.6% | 7,040 | 6.1% | ||||||
| Operating cash flow (4)(5) | 6,902 | 20.4% | 6,835 | 22.2% | 1.0% | 4.5% | 28,329 | 21.6% | 25,881 | 22.4% | 9.5% | 10.5% | ||
(1) Except volume and average price per unit case figures.
(2) Please refer to page 14 for revenue breakdown.
(3) Includes equity method in Jugos del Valle, among others.
(4) The operating income and operating cash flow lines are presented as non-GAAP measures for the convenience of the reader.
(5) Operating cash flow = operating income + depreciation, amortization & other operating non-cash charges.
(6) Please refer to page 9 for our definition of “comparable” and a description of the factors affecting the comparability of our financial and operating performance.
| SOUTH AMERICA DIVISION | ||||||||||||||
| RESULTS OF OPERATIONS | ||||||||||||||
| Millions of Pesos (1) | ||||||||||||||
| For the Fourth Quarter of: | For Full Year: | |||||||||||||
| 2022 | % of Rev. | 2021 | % of Rev. | Δ% Reported | Δ% Comparable (6) | 2022 | % of Rev. | 2021 | % of Rev. | Δ% Reported | Δ% Comparable (6) | |||
| Transactions (million transactions) | 3,066.5 | 2,747.9 | 11.6% | 9.6% | 10,681.9 | 8,880.9 | 20.3% | 17.8% | ||||||
| Volume (million unit cases) | 447.4 | 419.6 | 6.6% | 4.4% | 1,566.8 | 1,400.0 | 11.9% | 9.2% | ||||||
| Average price per unit case | 56.91 | 49.81 | 14.3% | 57.21 | 48.21 | 18.7% | ||||||||
| Net revenues | 27,208 | 22,327 | 95,241 | 78,168 | ||||||||||
| Other operating revenues | 209 | 154 | 497 | 841 | ||||||||||
| Total Revenues (2) | 27,417 | 100.0% | 22,481 | 100.0% | 22.0% | 30.9% | 95,738 | 100.0% | 79,010 | 100.0% | 21.2% | 24.4% | ||
| Cost of goods sold | 16,027 | 58.5% | 13,415 | 59.7% | 57,473 | 60.0% | 47,778 | 60.5% | ||||||
| Gross profit | 11,390 | 41.5% | 9,066 | 40.3% | 25.6% | 36.1% | 38,265 | 40.0% | 31,232 | 39.5% | 22.5% | 26.4% | ||
| Operating expenses | 7,417 | 27.1% | 6,238 | 27.7% | 28,152 | 29.4% | 22,671 | 28.7% | ||||||
| Other operative expenses, net | 187 | 0.7% | 119 | 0.5% | 279 | 0.3% | (56) | -0.1% | ||||||
| Operative equity method (gain) loss in associates (3) | (15) | -0.1% | 14 | 0.1% | (55) | -0.1% | 55 | 0.1% | ||||||
| Operating income (4) | 3,801 | 13.9% | 2,695 | 12.0% | 41.0% | 46.1% | 9,890 | 10.3% | 8,561 | 10.8% | 15.5% | 11.6% | ||
| Depreciation, amortization & other operating non-cash charges | 1,251 | 4.6% | 1,118 | 5.0% | 4,782 | 5.0% | 4,407 | 5.6% | ||||||
| Operating cash flow (4)(5) | 5,052 | 18.4% | 3,813 | 17.0% | 32.5% | 38.7% | 14,672 | 15.3% | 12,968 | 16.4% | 13.1% | 13.1% | ||
| (1) | Except volume and average price per unit case figures. |
| (2) | Please refer to page 14 for revenue breakdown. |
| (3) | Includes equity method in Leão Alimentos and Verde Campo, among others. |
| (4) | The operating income and operating cash flow lines are presented as non-GAAP measures for the convenience of the reader. |
| (5) | Operating cash flow = operating income + depreciation, amortization & other operating non-cash charges. |
| (6) | Please refer to page 9 for our definition of “comparable” and a description of the factors affecting the comparability of our financial and operating performance. |
| COCA-COLA FEMSA | ||||||||||
| CONSOLIDATED BALANCE SHEET | ||||||||||
| Millions of Pesos | ||||||||||
| Assets | Dec-22 | Dec-21 | % Var. | Liabilities & Equity | Dec-22 | Dec-21 | % Var. | |||
| Current Assets | Current Liabilities | |||||||||
| Cash, cash equivalents and marketable securities | Short-term bank loans and notes payable | 8,524 | 2,453 | 247% | ||||||
| 40,277 | 47,248 | -15% | Suppliers | 26,834 | 22,745 | 18% | ||||
| Total accounts receivable | 16,318 | 13,014 | 25% | Short-term leasing Liabilities | 472 | 614 | ||||
| Inventories | 11,888 | 11,960 | -1% | Other current liabilities | 22,129 | 20,409 | 8% | |||
| Other current assets | 10,729 | 8,142 | 32% | Total current liabilities | 57,959 | 46,221 | 25% | |||
| Total current assets | 79,211 | 80,364 | -1% | Non-Current Liabilities | ||||||
| Non-Current Assets | Long-term bank loans and notes payable | 70,146 | 83,329 | -16% | ||||||
| Property, plant and equipment | 125,293 | 113,827 | 10% | Long Term Leasing Liabilities | 1,663 | 891 | ||||
| Accumulated depreciation | (54,088) | (51,644) | 5% | Other long-term liabilities | 16,351 | 13,554 | 21% | |||
| Total property, plant and equipment, net | 71,205 | 62,183 | 15% | Total liabilities | 146,119 | 143,995 | 1% | |||
| Right of use assets | 2,069 | 1,472 | 41% | Equity | ||||||
| Investment in shares | 8,452 | 7,494 | 13% | Non-controlling interest | 6,491 | 6,022 | 8% | |||
| Intangible assets and other assets | 103,122 | 102,174 | 1% | Total controlling interest | 125,384 | 121,550 | 3% | |||
| Other non-current assets | 13,936 | 17,880 | -22% | Total equity | 131,876 | 127,572 | 3% | |||
| Total Assets | 277,995 | 271,567 | 2% | Total Liabilities and Equity | 277,995 | 271,567 | 2% | |||
| December 30, 2022 | ||||||||||
| Debt Mix | % Total Debt (1) | % Interest Rate Floating (1) (2) | Average Rate | Debt Maturity Profile | ||||||
| Currency |  | |||||||||
| Mexican Pesos | 62.0% | 7.3% | 8.3% | |||||||
| U.S. Dollars | 17.4% | 30.9% | 4.3% | |||||||
| Colombian Pesos | 1.4% | 0.0% | 7.0% | |||||||
| Brazilian Reals | 18.0% | 67.2% | 12.4% | |||||||
| Uruguayan Pesos | 1.2% | 0.0% | 6.3% | |||||||
| Total Debt | 100% | 23.2% | 8.3% | |||||||
| (1) After giving effect to cross- currency swaps and financial leases. | ||||||||||
| (2) Calculated by weighting each year´s outstanding debt balance mix. | ||||||||||
| Financial Ratios | FY 22 | FY 2021 | Δ% | |||||||
| Net debt including effect of hedges (1)(3) | 38,104 | 35,243 | 8.1% | |||||||
| Net debt including effect of hedges / Operating cash flow (1)(3) | 0.89 | 0.91 | ||||||||
| Operating cash flow/ Interest expense, net (1) | 10.34 | 7.39 | ||||||||
| Capitalization (2) | 38.9% | 40.7% | ||||||||
| (1) Net debt = total debt - cash | ||||||||||
| (2) Total debt / (long-term debt + shareholders' equity) | ||||||||||
| (3) After giving effect to cross-currency swaps. | ||||||||||
| COCA-COLA FEMSA | ||||||||||||||
| QUARTERLY- VOLUME, TRANSACTIONS & REVENUES | ||||||||||||||
| Volume | ||||||||||||||
| 4Q 2022 | 4Q 2021 | YoY | ||||||||||||
| Sparkling | Water (1) | Bulk (2) | Stills | Total | Sparkling | Water (1) | Bulk (2) | Stills | Total | Δ % | ||||
| Mexico | 335.3 | 25.0 | 74.8 | 33.6 | 468.7 | 337.6 | 21.3 | 67.7 | 31.6 | 458.1 | 2.3% | |||
| Guatemala | 36.0 | 1.1 | - | 2.1 | 39.2 | 32.5 | 0.9 | - | 2.0 | 35.3 | 11.0% | |||
| CAM South | 32.6 | 1.7 | 0.1 | 5.4 | 39.9 | 31.9 | 1.7 | 0.1 | 4.6 | 38.4 | 4.1% | |||
| Mexico and Central America | 404.0 | 27.8 | 75.0 | 41.1 | 547.9 | 401.9 | 23.9 | 67.8 | 38.2 | 531.8 | 3.0% | |||
| Colombia | 66.0 | 9.0 | 3.4 | 6.9 | 85.4 | 66.9 | 8.7 | 3.8 | 6.9 | 86.2 | -1.0% | |||
| Brazil (3) | 250.0 | 20.3 | 2.8 | 22.7 | 295.8 | 234.8 | 16.6 | 2.3 | 18.5 | 272.1 | 8.7% | |||
| Argentina | 41.1 | 5.0 | 1.1 | 4.3 | 51.6 | 38.2 | 4.0 | 1.2 | 3.8 | 47.2 | 9.3% | |||
| Uruguay | 12.4 | 1.8 | - | 0.6 | 14.7 | 12.1 | 1.6 | - | 0.4 | 14.0 | 5.1% | |||
| South America | 369.5 | 36.1 | 7.4 | 34.5 | 447.4 | 352.0 | 30.8 | 7.3 | 29.5 | 419.6 | 6.6% | |||
| TOTAL | 773.5 | 63.9 | 82.3 | 75.6 | 995.3 | 753.9 | 54.7 | 75.1 | 67.7 | 951.3 | 4.6% | |||
| (1) Excludes water presentations larger than 5.0 Lt ; includes flavored water. | ||||||||||||||
| (2) Bulk Water = Still bottled water in 5.0, 19.0 and 20.0 - liter packaging presentations; includes flavored water | ||||||||||||||
| Transactions | ||||||||||||||
| 4Q 2022 | 4Q 2021 | YoY | ||||||||||||
| Sparkling | Water | Stills | Total | Sparkling | Water | Stills | Total | Δ % | ||||||
| Mexico | 1,888.8 | 179.8 | 239.3 | 2,307.8 | 1,871.3 | 154.7 | 226.4 | 2,252.4 | 2.5% | |||||
| Guatemala | 271.2 | 10.9 | 20.6 | 302.7 | 250.2 | 8.5 | 20.0 | 278.6 | 8.7% | |||||
| CAM South | 237.6 | 11.6 | 61.4 | 310.6 | 225.2 | 11.3 | 48.8 | 285.4 | 8.8% | |||||
| Mexico and Central America | 2,397.6 | 202.3 | 321.3 | 2,921.2 | 2,346.7 | 174.5 | 295.2 | 2,816.4 | 3.7% | |||||
| Colombia | 481.4 | 94.2 | 70.4 | 645.9 | 455.2 | 93.8 | 66.9 | 615.9 | 4.9% | |||||
| Brazil (3) | 1,579.3 | 177.6 | 324.5 | 2,081.5 | 1,470.8 | 147.2 | 205.3 | 1,823.2 | 14.2% | |||||
| Argentina | 201.9 | 32.0 | 37.0 | 270.8 | 188.5 | 25.3 | 28.6 | 242.5 | 11.7% | |||||
| Uruguay | 56.0 | 7.0 | 5.2 | 68.2 | 56.4 | 6.3 | 3.5 | 66.2 | 3.0% | |||||
| South America | 2,318.6 | 310.8 | 437.1 | 3,066.5 | 2,170.9 | 272.7 | 304.3 | 2,747.9 | 11.6% | |||||
| TOTAL | 4,716.2 | 513.1 | 758.4 | 5,987.7 | 4,517.6 | 447.2 | 599.5 | 5,564.3 | 7.6% | |||||
| Revenues | ||||||||||||||
| Expressed in million Mexican Pesos | 4Q 2022 | 4Q 2021 | Δ % | |||||||||||
| Mexico | 27,388 | 24,857 | 10.2% | |||||||||||
| Guatemala | 3,130 | 2,927 | 6.9% | |||||||||||
| CAM South | 3,275 | 3,007 | 8.9% | |||||||||||
| Mexico and Central America | 33,792 | 30,792 | 9.7% | |||||||||||
| Colombia | 3,567 | 4,146 | -14.0% | |||||||||||
| Brazil (4) | 19,293 | 14,558 | 32.5% | |||||||||||
| Argentina | 3,273 | 2,640 | 24.0% | |||||||||||
| Uruguay | 1,283 | 1,137 | 12.9% | |||||||||||
| South America | 27,417 | 22,481 | 22.0% | |||||||||||
| TOTAL | 61,209 | 53,273 | 14.9% | |||||||||||
| (3) Volume and transactions in Brazil do not include beer. | ||||||||||||||
| (4) Brazil includes beer revenues of Ps. 1,742.4 million for the fourth quarter of 2022 and Ps. 1,429.4 million for the same period of the previous year. | ||||||||||||||

| (1) | Volume is expressed in unit cases. Unit case refers to 192 ounces of finished beverage product (24 eight-ounce servings) and, when applied to soda fountains, refers to the volume of syrup, powders, and concentrate that is required to produce 192 ounces of finished beverage product. |
| (2) | Transactions refers to the number of single units (e.g., a can or a bottle) sold, regardless of their size or volume or whether they are sold individually or in multipacks, except for fountain which represents multiple transactions based on a standard 12 oz. serving. |
| COCA-COLA FEMSA | ||||||||||||||
| FY - VOLUME, TRANSACTIONS & REVENUES | ||||||||||||||
| Volume | ||||||||||||||
| FY 2022 | FY 2021 | YoY | ||||||||||||
| Sparkling | Water (1) | Bulk (2) | Stills | Total | Sparkling | Water (1) | Bulk (2) | Stills | Total | Δ % | ||||
| Mexico | 1,348.8 | 104.4 | 300.6 | 135.1 | 1,888.9 | 1,304.0 | 82.3 | 281.4 | 122.3 | 1,790.0 | 5.5% | |||
| Guatemala | 133.7 | 4.8 | - | 8.7 | 147.2 | 120.3 | 3.8 | - | 7.2 | 131.3 | 12.1% | |||
| CAM South | 124.2 | 6.5 | 0.7 | 20.9 | 152.3 | 113.5 | 6.4 | 0.5 | 16.2 | 136.6 | 11.5% | |||
| Mexico and Central America | 1,606.7 | 115.6 | 301.3 | 164.7 | 2,188.4 | 1,537.8 | 92.5 | 282.0 | 145.6 | 2,057.9 | 6.3% | |||
| Colombia | 254.6 | 34.0 | 12.5 | 29.0 | 330.1 | 234.6 | 26.7 | 15.1 | 21.6 | 297.9 | 10.8% | |||
| Brazil (3) | 854.6 | 66.5 | 10.7 | 84.5 | 1,016.2 | 786.3 | 48.4 | 7.9 | 60.7 | 903.3 | 12.5% | |||
| Argentina | 139.4 | 16.0 | 3.8 | 14.6 | 173.9 | 125.1 | 11.8 | 5.4 | 13.1 | 155.4 | 11.9% | |||
| Uruguay | 39.2 | 5.7 | - | 1.6 | 46.6 | 37.7 | 4.9 | - | 0.8 | 43.4 | 7.5% | |||
| South America | 1,287.8 | 122.2 | 27.1 | 129.7 | 1,566.8 | 1,183.7 | 91.8 | 28.3 | 96.2 | 1,400.0 | 11.9% | |||
| TOTAL | 2,894.5 | 237.8 | 328.4 | 294.4 | 3,755.2 | 2,721.4 | 184.3 | 310.3 | 241.9 | 3,457.9 | 8.6% | |||
| (1) Excludes water presentations larger than 5.0 Lt ; includes flavored water. | ||||||||||||||
| (2) Bulk Water = Still bottled water in 5.0, 19.0 and 20.0 - liter packaging presentations; includes flavored water | ||||||||||||||
| Transactions | ||||||||||||||
| FY 2022 | FY 2021 | YoY | ||||||||||||
| Sparkling | Water | Stills | Total | Sparkling | Water | Stills | Total | Δ % | ||||||
| Mexico | 7,569.8 | 739.5 | 967.1 | 9,276.4 | 7,105.8 | 604.8 | 859.0 | 8,569.5 | 8.2% | |||||
| Guatemala | 1,027.3 | 48.0 | 85.5 | 1,160.8 | 922.5 | 39.1 | 73.5 | 1,035.2 | 12.1% | |||||
| CAM South | 920.5 | 38.8 | 236.7 | 1,196.0 | 797.7 | 41.7 | 165.8 | 1,005.3 | 19.0% | |||||
| Mexico and Central America | 9,517.6 | 826.3 | 1,289.3 | 11,633.2 | 8,826.0 | 685.6 | 1,098.4 | 10,610.0 | 9.6% | |||||
| Colombia | 1,834.4 | 361.5 | 307.8 | 2,503.7 | 1,557.1 | 289.6 | 199.5 | 2,046.2 | 22.4% | |||||
| Brazil (3) | 5,478.5 | 581.6 | 954.3 | 7,014.5 | 4,798.5 | 419.5 | 648.6 | 5,866.6 | 19.6% | |||||
| Argentina | 713.6 | 103.8 | 122.0 | 939.5 | 599.3 | 71.7 | 94.8 | 765.8 | 22.7% | |||||
| Uruguay | 187.3 | 22.4 | 14.6 | 224.2 | 175.0 | 18.6 | 8.5 | 202.1 | 10.9% | |||||
| South America | 8,213.8 | 1,069.3 | 1,398.8 | 10,681.9 | 7,130.0 | 799.4 | 951.5 | 8,880.9 | 20.3% | |||||
| TOTAL | 17,731.4 | 1,895.6 | 2,688.1 | 22,315.1 | 15,956.0 | 1,485.1 | 2,049.9 | 19,490.9 | 14.5% | |||||
| Revenues | ||||||||||||||
| Expressed in million Mexican Pesos | FY 2022 | FY 2021 | Δ % | |||||||||||
| Mexico | 106,911 | 94,762 | 12.8% | |||||||||||
| Guatemala | 12,059 | 10,535 | 14.5% | |||||||||||
| CAM South | 12,031 | 10,497 | 14.6% | |||||||||||
| Mexico and Central America | 131,002 | 115,794 | 13.1% | |||||||||||
| Colombia | 16,800 | 14,180 | 18.5% | |||||||||||
| Brazil (4) | 63,944 | 53,051 | 20.5% | |||||||||||
| Argentina | 10,917 | 8,408 | 29.8% | |||||||||||
| Uruguay | 4,078 | 3,371 | 21.0% | |||||||||||
| South America | 95,738 | 79,010 | 21.2% | |||||||||||
| TOTAL | 226,740 | 194,804 | 16.4% | |||||||||||
| (3) Volume and transactions in Brazil do not include beer. | ||||||||||||||
| (4) Brazil includes beer revenues of Ps. 5,599.9 million for the full year of 2022 and Ps. 10,677.2 million for the same period of the previous year. | ||||||||||||||

| (1) | Volume is expressed in unit cases. Unit case refers to 192 ounces of finished beverage product (24 eight-ounce servings) and, when applied to soda fountains, refers to the volume of syrup, powders, and concentrate that is required to produce 192 ounces of finished beverage product. |
| (2) | Transactions refers to the number of single units (e.g., a can or a bottle) sold, regardless of their size or volume or whether they are sold individually or in multipacks, except for fountain which represents multiple transactions based on a standard 12 oz. serving. |
| COCA-COLA FEMSA | ||||||||
| MACROECONOMIC INFORMATION | ||||||||
| Inflation (1) | ||||||||
| 4Q22 | FY 22 | |||||||
| Mexico | 1.54% | 7.82% | ||||||
| Colombia | 3.41% | 13.12% | ||||||
| Brazil | 0.76% | 5.79% | ||||||
| Argentina | 18.24% | 94.80% | ||||||
| Costa Rica | -1.22% | 7.88% | ||||||
| Panama | 0.24% | 2.07% | ||||||
| Guatemala | 1.09% | 9.24% | ||||||
| Nicaragua | 2.89% | 11.59% | ||||||
| Uruguay | 0.11% | 8.30% | ||||||
| (1) Source: inflation estimated by the company based on historic publications from the Central Bank of each country. | ||||||||
| Average Exchange Rates for each period (2) | ||||||||
| Quarterly Exchange Rate (Local Currency per USD) | Year to Date Exchange Rate (Local Currency per USD) | |||||||
| 4Q22 | 4Q21 | Δ % | FY 22 | FY 21 | Δ % | |||
| Mexico | 19.70 | 20.75 | -5.1% | 20.13 | 20.28 | -0.8% | ||
| Colombia | 4,808.38 | 3,879.98 | 23.9% | 4,256.19 | 3,744.25 | 13.7% | ||
| Brazil | 5.26 | 5.58 | -5.9% | 5.16 | 5.40 | -4.3% | ||
| Argentina | 162.54 | 100.50 | 61.7% | 130.72 | 95.10 | 37.5% | ||
| Costa Rica | 614.10 | 638.48 | -3.8% | 650.75 | 624.10 | 4.3% | ||
| Panama | 1.00 | 1.00 | 0.0% | 1.00 | 1.00 | 0.0% | ||
| Guatemala | 7.85 | 7.73 | 1.6% | 7.75 | 7.74 | 0.2% | ||
| Nicaragua | 36.14 | 35.43 | 2.0% | 35.87 | 35.17 | 2.0% | ||
| Uruguay | 39.97 | 43.98 | -9.1% | 41.17 | 43.55 | -5.5% | ||
| End-of-period Exchange Rates | ||||||||
| Closing Exchange Rate (Local Currency per USD) | Closing Exchange Rate (Local Currency per USD) | |||||||
| Dec-22 | Dec-21 | Δ % | Sep-22 | Sep-21 | Δ % | |||
| Mexico | 19.36 | 20.58 | -5.9% | 20.31 | 20.31 | 0.0% | ||
| Colombia | 4,810.20 | 3,981.16 | 20.8% | 4,532.07 | 3,834.68 | 18.2% | ||
| Brazil | 5.22 | 5.58 | -6.5% | 5.41 | 5.44 | -0.6% | ||
| Argentina | 177.16 | 102.72 | 72.5% | 147.32 | 98.74 | 49.2% | ||
| Costa Rica | 601.99 | 645.25 | -6.7% | 632.72 | 629.71 | 0.5% | ||
| Panama | 1.00 | 1.00 | 0.0% | 1.00 | 1.00 | 0.0% | ||
| Guatemala | 7.85 | 7.72 | 1.7% | 7.88 | 7.73 | 1.9% | ||
| Nicaragua | 36.23 | 35.52 | 2.0% | 36.05 | 35.34 | 2.0% | ||
| Uruguay | 40.07 | 44.70 | -10.3% | 41.74 | 42.94 | -2.8% | ||
| (2) Average exchange rate for each period computed with the average exchange rate of each month. | ||||||||
SIGNATURES
Pursuant to the requirements of the Securities Exchange Act of 1934, the registrant has duly caused this report to be signed on its behalf by the undersigned, thereunto duly authorized.
| COCA-COLA FEMSA, S.A.B. DE C.V. | |
| By: /s/ Constantino Spas Montesinos | |
Constantino Spas Montesinos Chief Financial Officer | |
| Date: February 23, 2023 |