UNITED STATES
SECURITIES AND EXCHANGE COMMISSION
Washington, D.C. 20549
FORM 6-K
REPORT OF FOREIGN PRIVATE ISSUER
PURSUANT TO RULE 13a-16 OR 15d-16 UNDER
THE SECURITIES EXCHANGE ACT OF 1934
For the month of February 2025
Commission File Number 1-12260
COCA-COLA FEMSA, S.A.B. de C.V.
(Translation of registrant’s name into English)
United Mexican States
(Jurisdiction of incorporation or organization)
Calle Mario Pani No. 100,
Santa Fe Cuajimalpa,
Cuajimalpa de Morelos,
05348, Ciudad de México,
México
(Address of principal executive offices)
Indicate by check mark whether the registrant files or will file annual reports under cover of Form 20-F or Form 40-F.
Form 20-F X Form 40-F
Indicate by check mark if the registrant is submitting the Form 6-K in paper as permitted by Regulation S-T Rule 101(b)(1)
Yes No X
Indicate by check mark if the registrant is submitting the Form 6-K in paper as permitted by Regulation S-T Rule 101(b)(7)
Yes No X
Indicate by check mark whether the registrant by furnishing the information contained in this Form is also thereby furnishing the information to the Commission pursuant to Rule 12g3-2(b) under the Securities Exchange Act of 1934.
Yes No X
If "Yes" is marked, indicate below the file number assigned to the registrant in connection with
Rule 12g3-2(b): 82-__.

Mexico City, February 21, 2025, Coca-Cola FEMSA, S.A.B. de C.V. (BMV: KOFUBL, NYSE: KOF) (“Coca-Cola FEMSA,” “KOF” or the “Company”), the largest Coca-Cola franchise bottler in the world by sales volume, announces results for the fourth quarter of 2024.
FOURTH QUARTER HIGHLIGHTS |
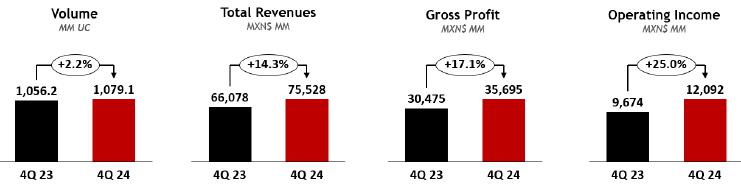
| · | Volume growth 2.2% |
| · | Revenue growth 14.3% |
| · | Operating income growth 25.0% |
| · | Majority net income growth 35.1% |
| · | Earnings per share1 were Ps. 0.43. (Earnings per unit were Ps. 3.47 and per ADS were Ps. 34.68.) |
| · | Reached more than 1.3 million active users in Juntos+ B2B platform; and more than 1.1 million in Premia Juntos+ loyalty program. |
TWELVE MONTHS HIGHLIGHTS |
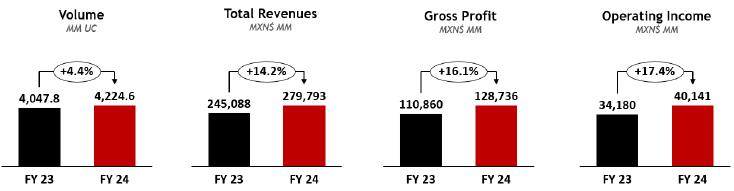
| · | Volume growth 4.4% |
| · | Revenue growth 14.2% |
| · | Operating income growth 17.4% |
| · | Majority net income growth 21.5% |
| · | Earnings per share1 were Ps. 1.41. (Earnings per unit were Ps. 11.30 and per ADS were Ps. 112.95.) |
| FINANCIAL SUMMARY FOR THE FOURTH QUARTER RESULTS | ||||||||||||
| Change vs. same period of last year | ||||||||||||
| Total Revenues | Gross Profit | Operating Income | Majority Net Income | |||||||||
| 4Q24 | FY 2024 | 4Q24 | FY 2024 | 4Q24 | FY 2024 | 4Q24 | FY 2024 | |||||
| As Reported | Consolidated | 14.3% | 14.2% | 17.1% | 16.1% | 25.0% | 17.4% | 35.1% | 21.5% | |||
| Mexico & Central America | 10.4% | 11.8% | 10.0% | 12.7% | 23.7% | 14.9% | ||||||
| South America | 19.4% | 17.8% | 28.1% | 22.3% | 26.9% | 22.7% | ||||||
| Comparable (2) | Consolidated | 13.0% | 14.3% | 15.5% | 16.1% | 23.2% | 17.6% | |||||
| Mexico & Central America | 7.2% | 10.8% | 6.7% | 11.6% | 19.0% | 13.7% | ||||||
| South America | 21.0% | 20.1% | 29.5% | 24.4% | 29.3% | 26.0% | ||||||
Ian Craig, Coca-Cola FEMSA’s CEO, commented:
“2024 marks the second chapter of our transformation. During the year, we continued to build on the growth momentum of our core business, strengthened our portfolio, and increased our customer base. On the digital front, we took Juntos+, our B2B omnichannel platform, to the next level with the deployment of advanced AI capabilities. Juntos+ now reaches 1.3 million active users across Latin America, with more than 1.1 million users engaged in our Juntos+ Premia loyalty plan. Notably, we successfully developed and began the rollout in Brazil of a new salesforce tool, Juntos+ Advisor. This tool leverages advanced AI models to enhance our salesforce capabilities and improve customer engagement. All of this, as we reinforced our desired culture across our operations.
Looking ahead, we remain optimistic about the opportunities across our markets. We are transforming Coca-Cola FEMSA into a highly adaptive organization to successfully navigate ever-changing environments. Indeed, last year we deployed a record amount of CAPEX, mainly focused on expanding production and distribution capacity. We are participating in a vibrant beverage industry within a growing region, and our teams are well-positioned to capture these opportunities and continue generating value for all of our stakeholders.”
| (1) | Quarterly earnings / outstanding shares. Earnings per share (EPS) were calculated using 16,806.7 million shares outstanding. For the convenience of the reader, as a KOFUBL Unit is comprised of 8 shares (3 Series B shares and 5 Series L shares), earnings per unit are equal to EPS multiplied by 8. Each ADS represents 10 KOFUBL Units. |
| (2) | Please refer to page 10 for our definition of “comparable” and a description of the factors affecting the comparability of our financial and operating performance. |
Coca-Cola FEMSA Reports 4Q24 Results February 21, 2025 | Page 2 of 17 |
RECENT DEVELOPMENTS
| · | On December 9, 2024, Coca-Cola FEMSA paid the fourth installment of the ordinary dividend approved for Ps. 0.19 per share, for a total cash distribution of Ps. 3,193.26 million. |
| · | In 2024, Coca-Cola FEMSA reaffirmed its commitment to sustainability by updating its Sustainability Framework. Company-wide efforts led to significant improvements in sustainability assessments, such as the S&P Global Corporate Sustainability Assessment (CSA), earning inclusion in the Sustainability Yearbook 2025 and maintaining its position in the DJSI MILA Pacific Alliance Index. The Company also significantly improved its ratings in the FTSE4Good index, ISS-ESG, Sustainalytics, and CDP Climate Change and Water Stewardship. Last September, the Company achieved a water efficiency rate of 1.36 liters of water per liter of beverage produced, solidifying its position as a global leader in water efficiency. |
CONFERENCE CALL INFORMATION

Coca-Cola FEMSA Reports 4Q24 Results February 21, 2025 | Page 3 of 17 |
CONSOLIDATED FOURTH QUARTER RESULTS
| CONSOLIDATED FOURTH QUARTER RESULTS | ||||||
| As Reported | Comparable (1) | |||||
| Expressed in millions of Mexican pesos | 4Q 2024 | 4Q 2023 | Δ% | Δ% | ||
| Total revenues | 75,528 | 66,078 | 14.3% | 13.0% | ||
| Gross profit | 35,695 | 30,475 | 17.1% | 15.5% | ||
| Operating income | 12,092 | 9,674 | 25.0% | 23.2% | ||
| Adj. EBITDA (2) | 16,104 | 13,149 | 22.5% | 20.7% | ||
Volume increased 2.2% to 1,079.1 million unit cases, driven by volume growth across most of our territories. Volume growth was driven mainly by Brazil, Mexico, and Guatemala, partially offset by a slight volume decline in Colombia.
Total revenues increased 14.3% to Ps. 75,528 million. This increase was driven by volume growth, revenue management initiatives, and favorable mix effects. Excluding currency translation effects, total revenues increased 13.0%.
Gross profit increased 17.1% to Ps. 35,695 million, and gross margin increased 120 basis points to 47.3%. This expansion was driven mainly by our top-line growth, favorable mix effects coupled with easing sweetener and PET costs and favorable hedging initiatives. These effects were partially offset by higher fixed costs, such as maintenance, and the depreciation of our main operating currencies as applied to our U.S. dollar-denominated raw material costs. Excluding currency translation effects, gross profit increased 15.5%.
Operating income increased 25.0% to Ps. 12,092 million, and operating margin increased 140 basis points to 16.0%. This margin expansion was driven mainly by top-line growth and operating expense efficiencies, that mitigated margin pressures related to higher operating expenses such as maintenance, freight, operative foreign exchange loss, and labor. Additionally, we incurred a one-time net expense of Ps. 730 million, primarily related to asset write-offs, site cleaning, and debris removal following the impact of hurricanes in Guerrero and the flooding in Rio Grande do Sul. This figure already reflects the recognition of insurance claims in both Mexico and Brazil. Excluding currency translation effects, operating income increased 23.2%.
| (1) | Please refer to page 10 for our definition of “comparable” and a description of the factors affecting the comparability of our financial and operating performance. |
| (2) | Adjusted EBITDA = operating income + depreciation + amortization & other operating non-cash charges. |
Coca-Cola FEMSA Reports 4Q24 Results February 21, 2025 | Page 4 of 17 |
Comprehensive financing result recorded an expense of Ps. 980 million, compared to an expense of Ps. 1,285 million in the previous year. This decrease was driven mainly by a foreign exchange gain of Ps. 57 million in the fourth quarter of 2024 as compared to a loss of Ps. 317 million in the same period of the previous year, which was driven by the quarterly depreciation of the Mexican Peso and the Brazilian Real as applied to our U.S. dollar-denominated cash position. In addition, we recognized a higher gain in monetary positions in inflationary subsidiaries of Ps. 61 million as compared to a gain of Ps. 4 million in the same period of the previous year.
These effects were partially offset by a loss in financial instruments of Ps. 33 million as compared to a gain of Ps. 90 million in the same period of the previous year.
Finally, we recognized interest expense, net, of Ps. 1,065 million as compared to Ps. 1,062 million in the same period of the previous year as higher interest expense mainly driven by new financing in Argentina was offset by higher interest income related increases in notional and interest rates.
Income tax as a percentage of income before taxes was 33.1% as compared to 33.8% during the same period of 2023.
Net income attributable to equity holders of the company was Ps. 7,286 million as compared to Ps. 5,392 million during the same period of the previous year. This increase was driven mainly by operating income growth, coupled with a decrease in our comprehensive financing result. Earnings per share1 were Ps. 0.43 (Earnings per unit were Ps. 3.47 and per ADS were Ps. 34.68.).
| (1) | Quarterly earnings / outstanding shares. Earnings per share (EPS) were calculated using 16,806.7 million shares outstanding. For the convenience of the reader, as a KOFUBL Unit is comprised of 8 shares (3 Series B shares and 5 Series L shares), earnings per unit are equal to EPS multiplied by 8. Each ADS represents 10 KOFUBL Units. |
Coca-Cola FEMSA Reports 4Q24 Results February 21, 2025 | Page 5 of 17 |
CONSOLIDATED TWELVE months RESULTS
| CONSOLIDATED FULL YEAR RESULTS | ||||||
| As Reported | Comparable (1) | |||||
| Expressed in millions of Mexican pesos | FY 2024 | FY 2023 | Δ% | Δ% | ||
| Total revenues | 279,793 | 245,088 | 14.2% | 14.3% | ||
| Gross profit | 128,736 | 110,860 | 16.1% | 16.1% | ||
| Operating income | 40,141 | 34,180 | 17.4% | 17.6% | ||
| Adj. EBITDA (2) | 56,205 | 46,418 | 21.1% | 21.1% | ||
Volume increased 4.4% to 4,224.6 million unit cases, driven by volume growth in most of our territories, including Mexico, Brazil, Guatemala, Colombia, and our Central America South territories, partially offset by a decrease in Argentina and Uruguay.
Total revenues increased 14.2% to Ps. 279,793 million. This increase was driven by volume growth, revenue management initiatives, and favorable mix effects. Excluding currency translation effects, total revenues increased 14.3%.
Gross profit increased 16.1% to Ps. 128,736 million, and gross margin expanded 80 basis points to 46.0%. This gross profit increase was driven mainly by our top-line growth, favorable packaging and sweetener costs, and hedging initiatives. These effects were partially offset by fixed costs and the depreciation of most of our operating currencies as applied to our U.S. dollar-denominated raw material costs. Excluding currency translation effects, gross profit increased 16.1%.
Operating income increased 17.4% to Ps. 40,141 million, and operating margin increased 40 basis points to 14.3%. This increase was driven mainly by top-line growth and operating expense efficiencies. These effects were partially offset by increases in operating expenses such as labor, freight, and maintenance and a non-cash operating foreign exchange loss. In addition, we recognized additional net expenses of Ps. 1,637 million related to asset write-offs and the removal of debris resulting from the impact of the hurricanes in Mexico and the floodings in Brazil. This figure includes the recognition of insurance claims in Mexico and Brazil. Excluding currency translation effects, operating income increased 17.6%.
| (1) | Please refer to page 10 for our definition of “comparable” and a description of the factors affecting the comparability of our financial and operating performance. |
| (2) | Adjusted EBITDA = operating income + depreciation + amortization & other operating non-cash charges. |
Coca-Cola FEMSA Reports 4Q24 Results February 21, 2025 | Page 6 of 17 |
Comprehensive financing result recorded an expense of Ps. 3,906 million, compared to an expense of Ps. 4,697 million in the previous year. This decrease is explained mainly by a foreign exchange gain of Ps. 304 million as compared to a loss of Ps. 1,046 million, as our net cash exposure in U.S. dollars was positively impacted by the depreciation of the Mexican Peso and the Brazilian Real during 2024. In addition, we recorded a higher gain on monetary position of inflationary subsidiaries of Ps. 216 million as compared to Ps. 93 million.
These effects were partially offset by an increase in our interest expense, net, of Ps. 4,492 million as compared to an expense of Ps. 3,914 million in the same period of the previous year. This increase was mainly driven by an increase in our debt in Argentina and a reduction in our interest income.
Income tax as a percentage of income before taxes was 32.7% as compared to 30.5% during 2023. This increase was driven mainly by adjustments in deferred taxes.
Net income attributable to equity holders of the company increased 21.5% to reach Ps. 23,729 million during the year 2024, as compared to Ps. 19,536 million during the previous year. This increase was driven mainly by operating income growth, coupled with a decrease in our comprehensive financing result. These effects were partially offset by a higher income taxes rate. Earnings per share1 were Ps. 1.41 (Earnings per unit were Ps. 11.30 and per ADS were Ps. 112.95.).
| (1) | Quarterly earnings / outstanding shares. Earnings per share (EPS) were calculated using 16,806.7 million shares outstanding. For the convenience of the reader, as a KOFUBL Unit is comprised of 8 shares (3 Series B shares and 5 Series L shares), earnings per unit are equal to EPS multiplied by 8. Each ADS represents 10 KOFUBL Units. |
Coca-Cola FEMSA Reports 4Q24 Results February 21, 2025 | Page 7 of 17 |
MEXICO & CENTRAL AMERICA DIVISION FOURTH QUARTER RESULTS
(Mexico, Guatemala, Costa Rica, Panama, and Nicaragua)

| MEXICO & CENTRAL AMERICA DIVISION RESULTS | ||||||
| As Reported | Comparable (1) | |||||
| Expressed in millions of Mexican pesos | 4Q 2024 | 4Q 2023 | Δ% | Δ% | ||
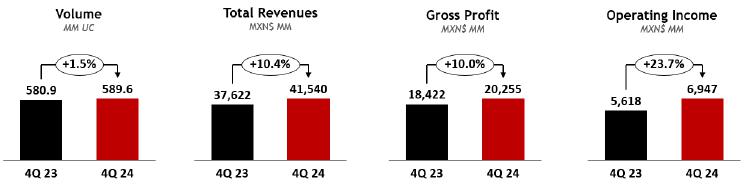
| Total revenues | 41,540 | 37,622 | 10.4% | 7.2% | ||
| Gross profit | 20,255 | 18,422 | 10.0% | 6.7% | ||
| Operating income | 6,947 | 5,618 | 23.7% | 19.0% | ||
| Adj. EBITDA (2) | 9,531 | 7,704 | 23.7% | 19.2% | ||
Volume increased 1.5%, driven by volume growth in all our territories across the division.
Total revenues increased 10.4% to Ps. 41,540 million, driven mainly by revenue management initiatives and the favorable translation effect from most of our operating currencies into Mexican Pesos. Excluding currency translation effects, total revenues increased 7.2%.
Gross profit increased 10.0% to Ps. 20,255 million, and gross margin contracted 20 basis points to 48.8%. This margin decrease was driven mainly by higher fixed costs, such as maintenance and the depreciation of the Mexican Peso as applied to our U.S. dollar-denominated raw material costs, that offset our top-line growth and easing sweetener and packaging costs, coupled with favorable hedging initiatives. Excluding currency translation effects, gross profit increased 6.7%.
Operating income increased 23.7% to Ps. 6,947 million, and operating margin increased 180 basis points to 16.7%. This margin increase was driven mainly by our top-line growth, and operating expense efficiencies that mitigated margin pressures related to higher operating expenses such as labor, freight, and maintenance, coupled with an operating foreign exchange loss. In addition, this quarter we recognized one-time net expenses of Ps. 399 million related to asset write-offs and the removal of debris related to the impact of hurricanes in Mexico. This figure includes the recognition of insurance claims. Excluding currency translation effects, operating income increased 19.0%.
| (1) | Please refer to page 10 for our definition of “comparable” and a description of the factors affecting the comparability of our financial and operating performance. |
| (2) | Adjusted EBITDA = operating income + depreciation + amortization & other operating non-cash charges. |
Coca-Cola FEMSA Reports 4Q24 Results February 21, 2025 | Page 8 of 17 |
SOUTH AMERICA DIVISION FOURTH QUARTER RESULTS
(Brazil, Argentina, Colombia, and Uruguay)


| SOUTH AMERICA DIVISION RESULTS | ||||||
| As Reported | Comparable (1) | |||||
| Expressed in millions of Mexican pesos | 4Q 2024 | 4Q 2023 | Δ% | Δ% | ||
| Total revenues | 33,988 | 28,456 | 19.4% | 21.0% | ||
| Gross profit | 15,439 | 12,054 | 28.1% | 29.5% | ||
| Operating income | 5,145 | 4,056 | 26.9% | 29.3% | ||
| Adj. EBITDA (2) | 6,572 | 5,444 | 20.7% | 22.8% | ||
Volume increased 3.0% to 489.5 million unit cases, driven mainly by 3.7% volume growth in Brazil, 8.9% volume growth in Uruguay, and a 2.9% increase in Argentina, partially offset by a 0.3% decrease in Colombia.
Total revenues increased 19.4% to Ps. 33,988 million. This increase was driven mainly by volume growth, coupled with revenue management initiatives. These effects were partially offset by unfavorable currency translation effects from the Argentine Peso and the Brazilian Real into Mexican pesos. Excluding currency translation effects, total revenues increased 21.0%.
Gross profit increased 28.1% to Ps. 15,439 million, and gross margin expanded 300 basis points to 45.4%. This expansion was driven mainly by top-line growth, coupled with a decrease in raw material costs, such as sweetener and PET, and fixed cost efficiencies, which were partially offset by purchases of finished products, and inventory write-offs in Brazil. Excluding currency translation effects, gross profit increased 29.5%.
Operating income increased 26.9% to Ps. 5,145 million, resulting in an operating margin expansion of 80 basis points to 15.1%. This increase was driven mainly by an increase in our gross profit, which was partially offset by higher operating expenses such as freight and marketing. In addition, this quarter we recognized one-time net expenses of Ps. 331 million related to asset write-offs and the removal of debris related to the impact of the floodings in Rio Grande do Sul. This figure includes the recognition of insurance claims. Excluding currency translation effects, operating income increased 29.3%.
| (1) | Please refer to page 10 for our definition of “comparable” and a description of the factors affecting the comparability of our financial and operating performance. |
| (2) | Adjusted EBITDA = operating income + depreciation + amortization & other operating non-cash charges. |
Coca-Cola FEMSA Reports 4Q24 Results February 21, 2025 | Page 9 of 17 |
DEFINITIONS
Volume is expressed in unit cases. Unit case refers to 192 ounces of finished beverage product (24 eight-ounce servings) and, when applied to soda fountains, refers to the volume of syrup, powders, and concentrate that is required to produce 192 ounces of finished beverage product.
Transactions refers to the number of single units (e.g., a can or a bottle) sold, regardless of their size or volume or whether they are sold individually or in multipacks, except for soda fountains, which represent multiple transactions based on a standard 12 oz. serving.
Operating income is a non-GAAP financial measure computed as “gross profit – operating expenses – other operating expenses, net + operative equity method (gain) loss in associates.”
Adjusted EBITDA is a non-GAAP financial measure computed as “operating income + depreciation + amortization & other operating non-cash charges.”
Earnings per share are equal to “quarterly earnings / outstanding shares.” Earnings per share (EPS) for all periods are adjusted to give effect to the stock split resulting in 16,806,658,096 shares outstanding. For the convenience of the reader, as a KOFUBL Unit is comprised of 8 shares (3 Series B shares and 5 Series L shares), earnings per unit are equal to EPS multiplied by 8. Each ADS represents 10 KOFUBL Units.
COMPARABILITY
Our “comparable” term means, with respect to a year-over-year comparison, the change of a given measure excluding the effects of: (i) mergers, acquisitions, and divestitures; and (ii) translation effects resulting from exchange rate movements. In preparing this measure, management has used its best judgment, estimates, and assumptions to maintain comparability.
Coca-Cola FEMSA Reports 4Q24 Results February 21, 2025 | Page 10 of 17 |
ABOUT THE COMPANY
Stock listing information: Mexican Stock Exchange, Ticker: KOFUBL | NYSE (ADS), Ticker: KOF | Ratio of KOFUBL to KOF = 10:1
Coca-Cola FEMSA, S.A.B. de C.V. is the largest franchise bottler in the world by sales volume. The Company produces and distributes trademark beverages of The Coca-Cola Company, offering a wide portfolio to more than 272 million consumers. With over 104,000 employees, the Company markets and sells approximately 4 billion unit cases through more than 2.1 million points of sale a year. Operating 56 manufacturing plants and 252 distribution centers, Coca-Cola FEMSA is committed to generating economic, social, and environmental value for all its stakeholders across the value chain. The Company is a member of the Dow Jones Sustainability MILA Pacific Alliance Index, FTSE4Good Emerging Index, and the S&P/BMV Total Mexico ESG Index, among others. Its operations encompass certain territories in Mexico, Brazil, Guatemala, Colombia, and Argentina and, nationwide, in Costa Rica, Nicaragua, Panama, Uruguay and, in Venezuela, through an investment in KOF Venezuela. For further information, please visit www.coca-colafemsa.com

ADDITIONAL INFORMATION
All of the financial information presented in this report was prepared under International Financial Reporting Standards (IFRS).
This news release may contain forward-looking statements concerning Coca-Cola FEMSA’s future performance, which should be considered as good faith estimates by Coca-Cola FEMSA. These forward-looking statements reflect management’s expectations and are based upon currently available data. Actual results are subject to future events and uncertainties, many of which are outside Coca-Cola FEMSA’s control, which could materially impact the Company’s actual performance. References herein to “US$” are to United States dollars. This news release contains translations of certain Mexican peso amounts into U.S. dollars for the convenience of the reader. These translations should not be construed as representations that Mexican peso amounts actually represent such U.S. dollar amounts or could be converted into U.S. dollars at the rate indicated.
(6 pages of tables to follow)
Coca-Cola FEMSA Reports 4Q24 Results February 21, 2025 | Page 11 of 17 |
| COCA-COLA FEMSA | ||||||||||||||
| CONSOLIDATED INCOME STATEMENT | ||||||||||||||
| Millions of Pesos (1) | ||||||||||||||
| For the Fourth Quarter of: | For Full Year: | |||||||||||||
| 2024 | % of Rev. | 2023 | % of Rev. | Δ% Reported | Δ% Comparable (7) | 2024 | % of Rev. | 2023 | % of Rev. | Δ% Reported | Δ% Comparable (7) | |||
| Transactions (million transactions) | 6,445.3 | 6,194.6 | 4.0% | 4.0% | 24,929.2 | 23,743.2 | 5.0% | 5.0% | ||||||
| Volume (million unit cases) | 1,079.1 | 1,056.2 | 2.2% | 2.2% | 4,224.6 | 4,047.8 | 4.4% | 4.4% | ||||||
| Average price per unit case | 67.45 | 60.24 | 12.0% | 64.23 | 58.54 | 9.7% | ||||||||
| Net revenues | 75,302 | 65,830 | 14.4% | 279,030 | 244,264 | 14.2% | ||||||||
| Other operating revenues | 226 | 248 | -9.2% | 763 | 824 | -7.4% | ||||||||
| Total revenues (2) | 75,528 | 100.0% | 66,078 | 100.0% | 14.3% | 13.0% | 279,793 | 100.0% | 245,088 | 100.0% | 14.2% | 14.3% | ||
| Cost of goods sold | 39,833 | 52.7% | 35,603 | 53.9% | 11.9% | 151,057 | 54.0% | 134,228 | 54.8% | 12.5% | ||||
| Gross profit | 35,695 | 47.3% | 30,475 | 46.1% | 17.1% | 15.5% | 128,736 | 46.0% | 110,860 | 45.2% | 16.1% | 16.1% | ||
| Operating expenses | 23,883 | 31.6% | 20,413 | 30.9% | 17.0% | 88,101 | 31.5% | 76,098 | 31.0% | 15.8% | ||||
| Other operative expenses, net | (253) | -0.3% | 433 | 0.7% | NA | 688 | 0.2% | 813 | 0.3% | -15.4% | ||||
| Operative equity method (gain) loss in associates(3) | (27) | 0.0% | (45) | -0.1% | -39.6% | (194) | -0.1% | (232) | -0.1% | -16.5% | ||||
| Operating income (5) | 12,092 | 16.0% | 9,674 | 14.6% | 25.0% | 23.2% | 40,141 | 14.3% | 34,180 | 13.9% | 17.4% | 17.6% | ||
| Other non operative expenses, net | (36) | 0.0% | 50 | 0.1% | NA | 31 | 0.0% | 459 | 0.2% | -93.3% | ||||
| Non Operative equity method (gain) loss in associates (4) | (37) | 0.0% | (132) | -0.2% | -71.7% | (112) | 0.0% | 17 | 0.0% | NA | ||||
| Interest expense | 1,935 | 1,791 | 8.0% | 7,532 | 7,102 | 6.1% | ||||||||
| Interest income | 870 | 730 | 19.2% | 3,039 | 3,188 | -4.7% | ||||||||
| Interest expense, net | 1,065 | 1,062 | 0.3% | 4,492 | 3,914 | 14.8% | ||||||||
| Foreign exchange loss (gain) | (57) | 317 | NA | (304) | 1,046 | -129.1% | ||||||||
| Loss (gain) on monetary position in inflationary subsidiaries | (61) | (4) | 1564.0% | (216) | (93) | 131.4% | ||||||||
| Market value (gain) loss on financial instruments | 33 | (90) | NA | (67) | (169) | -60.2% | ||||||||
| Comprehensive financing result | 980 | 1,285 | -23.7% | 3,906 | 4,697 | -16.9% | ||||||||
| Income before taxes | 11,185 | 8,470 | 32.1% | 36,316 | 29,007 | 25.2% | ||||||||
| Income taxes | 3,686 | 2,802 | 31.6% | 11,768 | 8,781 | 34.0% | ||||||||
| Result of discontinued operations | - | - | NA | - | - | NA | ||||||||
| Consolidated net income | 7,499 | 5,669 | 32.3% | 24,549 | 20,226 | 21.4% | ||||||||
| Net income attributable to equity holders of the company | 7,286 | 9.6% | 5,392 | 8.2% | 35.1% | 32.0% | 23,729 | 8.5% | 19,536 | 8.0% | 21.5% | 21.7% | ||
| Non-controlling interest | 213 | 0.3% | 277 | 0.4% | -22.9% | 820 | 0.3% | 690 | 0.3% | 18.8% | ||||
| Adj. EBITDA & CAPEX | 2024 | % of Rev. | 2023 | % of Rev. | Δ% Reported | Δ% Comparable (7) | 2024 | % of Rev. | 2023 | % of Rev. | Δ% Reported | Δ% Comparable (7) | ||
| Operating income (5) | 12,092 | 16.0% | 9,674 | 14.6% | 25.0% | 23.2% | 40,141 | 14.3% | 34,180 | 13.9% | 17.4% | 17.6% | ||
| Depreciation | 3,012 | 2,632 | 14.4% | 11,142 | 9,695 | 14.9% | ||||||||
| Amortization and other operative non-cash charges | 1,000 | 843 | 18.6% | 4,922 | 2,542 | 93.6% | ||||||||
| Adj. EBITDA (5)(6) | 16,104 | 21.3% | 13,149 | 19.9% | 22.5% | 20.7% | 56,205 | 20.1% | 46,418 | 18.9% | 21.1% | 21.1% | ||
| CAPEX(8) | 13,778 | 9,837 | 40.1% | 29,416 | 21,396 | 37.5% | ||||||||
| (1) | Except volume and average price per unit case figures. |
| (2) | Please refer to page 15 and 16 for revenue breakdown. |
| (3) | Includes equity method in Jugos del Valle and Leão Alimentos, among others. |
| (4) | Includes equity method in PIASA, IEQSA, Beta San Miguel, IMER, and KSP Participacoes, among others. |
| (5) | The operating income and Adjusted EBITDA lines are presented as non-GAAP measures for the convenience of the reader. |
| (6) | Adjusted EBITDA = operating income + depreciation, amortization & other operating non-cash charges. |
| (7) | Please refer to page 10 for our definition of “comparable” and a description of the factors affecting the comparability of our financial and operating performance. |
| (8) | As of December 31, 2024, the investment in fixed assets effectively paid is equivalent to Ps. 25,316 million. |
Coca-Cola FEMSA Reports 4Q24 Results February 21, 2025 | Page 12 of 17 |
| MEXICO & CENTRAL AMERICA DIVISION | ||||||||||||||
| RESULTS OF OPERATIONS | ||||||||||||||
| Millions of Pesos (1) | ||||||||||||||
| For the Fourth Quarter of: | For the Full Year: | |||||||||||||
| 2024 | % of Rev. | 2023 | % of Rev. | Δ% Reported | Δ% Comparable (6) | 2024 | % of Rev. | 2023 | % of Rev. | Δ% Reported | Δ% Comparable (6) | |||
| Transactions (million transactions) | 3,091.7 | 2,981.7 | 3.7% | 3.7% | 12,926.6 | 12,344.9 | 4.7% | 4.7% | ||||||
| Volume (million unit cases) | 589.6 | 580.9 | 1.5% | 1.5% | 2,494.1 | 2,394.8 | 4.1% | 4.1% | ||||||
| Average price per unit case | 69.66 | 64.28 | 8.4% | 66.48 | 62.07 | 7.1% | ||||||||
| Net revenues | 41,517 | 37,603 | 166,972 | 149,320 | ||||||||||
| Other operating revenues | 23 | 19 | 24 | 42 | ||||||||||
| Total Revenues (2) | 41,540 | 100.0% | 37,622 | 100.0% | 10.4% | 7.2% | 166,996 | 100.0% | 149,362 | 100.0% | 11.8% | 10.8% | ||
| Cost of goods sold | 21,284 | 51.2% | 19,200 | 51.0% | 86,214 | 51.6% | 77,698 | 52.0% | ||||||
| Gross profit | 20,255 | 48.8% | 18,422 | 49.0% | 10.0% | 6.7% | 80,782 | 48.4% | 71,665 | 48.0% | 12.7% | 11.6% | ||
| Operating expenses | 13,485 | 32.5% | 12,663 | 33.7% | 53,810 | 32.2% | 48,343 | 32.4% | ||||||
| Other operative expenses, net | (176) | -0.4% | 150 | 0.0% | 457 | 0.3% | 281 | 0.2% | ||||||
| Operative equity method (gain) loss in associates (3) | (1) | 0.0% | (9) | 0.0% | (115) | -0.1% | (130) | -0.1% | ||||||
| Operating income (4) | 6,947 | 16.7% | 5,618 | 14.9% | 23.7% | 19.0% | 26,630 | 15.9% | 23,170 | 15.5% | 14.9% | 13.7% | ||
| Depreciation, amortization & other operating non-cash charges | 2,584 | 6.2% | 2,086 | 5.5% | 9,938 | 6.0% | 7,652 | 5.1% | ||||||
| Adj. EBITDA (4)(5) | 9,531 | 22.9% | 7,704 | 20.5% | 23.7% | 19.2% | 36,568 | 21.9% | 30,822 | 20.6% | 18.6% | 17.4% | ||
| (1) | Except volume and average price per unit case figures. |
| (2) | Please refer to page 15 and 16 for revenue breakdown. |
| (3) | Includes equity method in Jugos del Valle, among others. |
| (4) | The operating income and Adjusted EBITDA lines are presented as non-GAAP measures for the convenience of the reader. |
| (5) | Adjusted EBITDA = operating income + depreciation, amortization & other operating non-cash charges. |
| (6) | Please refer to page 10 for our definition of “comparable” and a description of the factors affecting the comparability of our financial and operating performance. |
| SOUTH AMERICA DIVISION | ||||||||||||||
| RESULTS OF OPERATIONS | ||||||||||||||
| Millions of Pesos (1) | ||||||||||||||
| For the Fourth Quarter of: | For the Full Year: | |||||||||||||
| 2024 | % of Rev. | 2023 | % of Rev. | Δ% Reported | Δ% Comparable (6) | 2024 | % of Rev. | 2023 | % of Rev. | Δ% Reported | Δ% Comparable (6) | |||
| Transactions (million transactions) | 3,353.5 | 3,212.9 | 4.4% | 4.4% | 12,002.6 | 11,398.3 | 5.3% | 5.3% | ||||||
| Volume (million unit cases) | 489.5 | 475.3 | 3.0% | 3.0% | 1,730.6 | 1,653.1 | 4.7% | 4.7% | ||||||
| Average price per unit case | 64.80 | 55.32 | 17.1% | 60.98 | 53.43 | 14.1% | ||||||||
| Net revenues | 33,785 | 28,227 | 112,058 | 94,944 | ||||||||||
| Other operating revenues | 203 | 229 | 739 | 782 | ||||||||||
| Total Revenues (2) | 33,988 | 100.0% | 28,456 | 100.0% | 19.4% | 21.0% | 112,797 | 100.0% | 95,726 | 100.0% | 17.8% | 20.1% | ||
| Cost of goods sold | 18,549 | 54.6% | 16,403 | 57.6% | 64,843 | 57.5% | 56,531 | 59.1% | ||||||
| Gross profit | 15,439 | 45.4% | 12,054 | 42.4% | 28.1% | 29.5% | 47,954 | 42.5% | 39,195 | 40.9% | 22.3% | 24.4% | ||
| Operating expenses | 10,398 | 30.6% | 7,750 | 27.2% | 34,291 | 30.4% | 27,755 | 29.0% | ||||||
| Other operative expenses, net | (77) | -0.2% | 284 | 1.0% | 231 | 0.2% | 531 | 0.6% | ||||||
| Operative equity method (gain) loss in associates (3) | (27) | -0.1% | (36) | -0.1% | (78) | -0.1% | (102) | -0.1% | ||||||
| Operating income (4) | 5,145 | 15.1% | 4,056 | 14.3% | 26.9% | 29.3% | 13,511 | 12.0% | 11,011 | 11.5% | 22.7% | 26.0% | ||
| Depreciation, amortization & other operating non-cash charges | 1,427 | 4.2% | 1,389 | 4.9% | 6,127 | 5.4% | 4,585 | 4.8% | ||||||
| Adj. EBITDA (4)(5) | 6,572 | 19.3% | 5,444 | 19.1% | 20.7% | 22.8% | 19,637 | 17.4% | 15,596 | 16.3% | 25.9% | 28.8% | ||
| (1) | Except volume and average price per unit case figures. |
| (2) | Please refer to page 15 and 16 for revenue breakdown. |
| (3) | Includes equity method in Leão Alimentos, among others. |
| (4) | The operating income and Adjusted EBITDA lines are presented as non-GAAP measures for the convenience of the reader. |
| (5) | Adjusted EBITDA = operating income + depreciation, amortization & other operating non-cash charges. |
| (6) | Please refer to page 10 for our definition of “comparable” and a description of the factors affecting the comparability of our financial and operating performance. |
Coca-Cola FEMSA Reports 4Q24 Results February 21, 2025 | Page 13 of 17 |
| COCA-COLA FEMSA | ||||||||||
| CONSOLIDATED BALANCE SHEET | ||||||||||
| Millions of Pesos | ||||||||||
| Assets | Dec-24 | Dec-23 | % Var. | Liabilities & Equity | Dec-24 | Dec-23 | % Var. | |||
| Current Assets | Current Liabilities | |||||||||
| Cash, cash equivalents and marketable securities | Short-term bank loans and notes payable | 3,314 | 140 | 2267% | ||||||
| 32,779 | 31,060 | 6% | Suppliers | 33,773 | 27,351 | 23% | ||||
| Total accounts receivable | 18,620 | 17,749 | 5% | Short-term leasing Liabilities | 889 | 752 | 18% | |||
| Inventories | 14,059 | 11,880 | 18% | Other current liabilities | 29,194 | 26,673 | 9% | |||
| Other current assets | 9,675 | 7,049 | 37% | Total current liabilities | 67,171 | 54,916 | 22% | |||
| Total current assets | 75,132 | 67,738 | 11% | Non-Current Liabilities | - | - | ||||
| Non-Current Assets | - | - | Long-term bank loans and notes payable | 70,383 | 65,074 | 8% | ||||
| Property, plant and equipment | 161,785 | 133,406 | 21% | Long Term Leasing Liabilities | 2,295 | 1,769 | 30% | |||
| Accumulated depreciation | (62,404) | (54,676) | 14% | Other long-term liabilities | 17,595 | 18,056 | -3% | |||
| Total property, plant and equipment, net | 99,381 | 78,730 | 26% | Total liabilities | 157,445 | 139,815 | 13% | |||
| Right of use assets | 2,989 | 2,388 | 25% | Equity | - | - | ||||
| Investment in shares | 10,233 | 9,246 | 11% | Non-controlling interest | 7,113 | 6,680 | 6% | |||
| Intangible assets and other assets | 101,876 | 101,162 | 1% | Total controlling interest | 143,428 | 127,025 | 13% | |||
| Other non-current assets | 18,375 | 14,256 | 29% | Total equity | 150,542 | 133,705 | 13% | |||
| Total Assets | 307,986 | 273,520 | 13% | Total Liabilities and Equity | 307,986 | 273,520 | 13% | |||
| Dec 30, 2024 | ||||||||||
| Debt Mix | % Total Debt (1) | % Interest Rate Floating (1) (2) | Average Rate | Debt Maturity Profile | ||||||
| Currency | 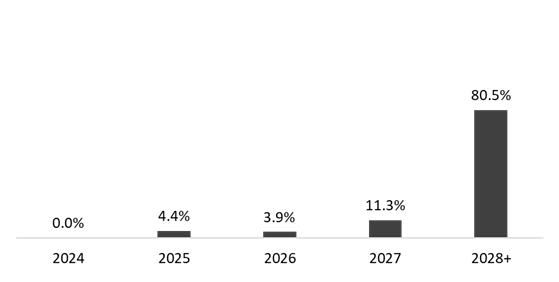 | |||||||||
| Mexican Pesos | 59.1% | 3.7% | 8.7% | |||||||
| U.S. Dollars | 18.3% | 53.2% | 4.2% | |||||||
| Colombian Pesos | 2.4% | 15.5% | 8.1% | |||||||
| Brazilian Reals | 19.2% | 18.8% | 9.8% | |||||||
| Argentine Pesos | 0.9% | 0.0% | 50.1% | |||||||
| Total Debt | 100% | 23.9% | 8.4% | |||||||
| (1) After giving effect to cross- currency swaps. | ||||||||||
| (2) Calculated by weighting each year´s outstanding debt balance mix. | ||||||||||
| Financial Ratios | 4Q 2024 | FY 2024 | Δ% | |||||||
| Net debt including effect of hedges (1)(3) | 38,329 | 37,794 | 1.4% | |||||||
| Net debt including effect of hedges / Adj. EBITDA (1)(3) | 0.68 | 0.81 | ||||||||
| Adj. EBITDA/ Interest expense, net (1) | 12.51 | 11.86 | ||||||||
| Capitalization (2) | 33.3% | 32.8% | ||||||||
| (1) Net debt = total debt - cash | ||||||||||
| (2) Total debt / (total debt + shareholders' equity) | ||||||||||
| (3) After giving effect to cross-currency swaps. | ||||||||||
Coca-Cola FEMSA Reports 4Q24 Results February 21, 2025 | Page 14 of 17 |
| COCA-COLA FEMSA | ||||||||||||||
| QUARTERLY- VOLUME, TRANSACTIONS & REVENUES | ||||||||||||||
| Volume | ||||||||||||||
| 4Q 2024 | 4Q 2023 | YoY | ||||||||||||
| Sparkling | Water (1) | Bulk (2) | Stills | Total | Sparkling | Water (1) | Bulk (2) | Stills | Total | Δ % | ||||
| Mexico | 346.9 | 29.1 | 84.9 | 36.6 | 497.4 | 346.1 | 26.4 | 85.8 | 35.1 | 493.4 | 0.8% | |||
| Guatemala | 44.4 | 2.5 | - | 2.3 | 49.2 | 41.3 | 2.1 | - | 2.3 | 45.7 | 7.5% | |||
| CAM South | 36.3 | 0.9 | 0.9 | 4.9 | 43.0 | 34.7 | 1.1 | 0.9 | 5.0 | 41.8 | 3.0% | |||
| Mexico and Central America | 427.6 | 32.5 | 85.8 | 43.8 | 589.6 | 422.1 | 29.7 | 86.7 | 42.5 | 580.9 | 1.5% | |||
| Colombia | 71.4 | 10.0 | 3.7 | 6.6 | 91.6 | 70.9 | 10.2 | 3.5 | 7.4 | 91.9 | -0.3% | |||
| Brazil (3) | 274.5 | 24.6 | 2.8 | 27.7 | 329.6 | 266.4 | 22.4 | 3.2 | 26.0 | 318.0 | 3.7% | |||
| Argentina | 39.0 | 7.1 | 1.9 | 4.6 | 52.6 | 37.8 | 6.6 | 1.9 | 4.8 | 51.1 | 2.9% | |||
| Uruguay | 12.4 | 2.1 | - | 1.1 | 15.7 | 12.0 | 1.7 | - | 0.8 | 14.4 | 8.9% | |||
| South America | 397.4 | 43.8 | 8.4 | 40.0 | 489.5 | 387.0 | 40.8 | 8.5 | 39.0 | 475.3 | 3.0% | |||
| TOTAL | 824.9 | 76.3 | 94.2 | 83.7 | 1,079.1 | 809.1 | 70.5 | 95.2 | 81.5 | 1,056.2 | 2.2% | |||
| (1) Excludes water presentations larger than 5.0 Lt ; includes flavored water. | ||||||||||||||
| (2) Bulk Water = Still bottled water in 5.0, 19.0 and 20.0 - liter packaging presentations; includes flavored water | ||||||||||||||
| Transactions | ||||||||||||||
| 4Q 2024 | 4Q 2023 | YoY | ||||||||||||
| Sparkling | Water | Stills | Total | Sparkling | Water | Stills | Total | Δ % | ||||||
| Mexico | 1,937.0 | 208.6 | 259.2 | 2,404.7 | 1,900.7 | 190.7 | 243.8 | 2,335.2 | 3.0% | |||||
| Guatemala | 339.1 | 16.3 | 24.9 | 380.3 | 313.4 | 14.8 | 24.0 | 352.2 | 8.0% | |||||
| CAM South | 248.2 | 10.3 | 48.2 | 306.7 | 231.1 | 11.4 | 51.8 | 294.3 | 4.2% | |||||
| Mexico and Central America | 2,524.3 | 235.2 | 332.2 | 3,091.7 | 2,445.2 | 216.9 | 319.7 | 2,981.7 | 3.7% | |||||
| Colombia | 511.0 | 101.4 | 49.4 | 661.7 | 513.5 | 106.6 | 68.2 | 688.2 | -3.9% | |||||
| Brazil (3) | 1,821.5 | 213.9 | 314.3 | 2,349.8 | 1,705.0 | 191.3 | 292.1 | 2,188.3 | 7.4% | |||||
| Argentina | 189.1 | 40.9 | 37.0 | 267.0 | 182.6 | 41.0 | 44.5 | 268.1 | -0.4% | |||||
| Uruguay | 57.7 | 8.3 | 9.1 | 75.1 | 55.0 | 6.6 | 6.5 | 68.2 | 10.1% | |||||
| South America | 2,579.3 | 364.4 | 409.8 | 3,353.5 | 2,456.1 | 345.5 | 411.2 | 3,212.9 | 4.4% | |||||
| TOTAL | 5,103.6 | 599.6 | 742.0 | 6,445.3 | 4,901.3 | 562.4 | 730.9 | 6,194.6 | 4.0% | |||||
| Revenues | ||||||||||||||
| Expressed in million Mexican Pesos | 4Q 2024 | 4Q 2023 | Δ % | |||||||||||
| Mexico | 33,078 | 30,709 | 7.7% | |||||||||||
| Guatemala | 4,123 | 3,353 | 23.0% | |||||||||||
| CAM South | 4,339 | 3,560 | 21.9% | |||||||||||
| Mexico and Central America | 41,540 | 37,622 | 10.4% | |||||||||||
| Colombia | 6,145 | 5,094 | 20.6% | |||||||||||
| Brazil (4) | 22,099 | 20,125 | 9.8% | |||||||||||
| Argentina | 3,996 | 1,932 | 106.8% | |||||||||||
| Uruguay | 1,748 | 1,305 | 33.9% | |||||||||||
| South America | 33,988 | 28,456 | 19.4% | |||||||||||
| TOTAL | 75,528 | 66,078 | 14.3% | |||||||||||
| (3) Volume and transactions in Brazil do not include beer | ||||||||||||||
| (4) Brazil includes beer revenues of Ps. 1,571.7 million for the fourth quarter of 2024 and Ps. 1,734.2 million for the same period of the previous year. | ||||||||||||||
| (1) | Volume is expressed in unit cases. Unit case refers to 192 ounces of finished beverage product (24 eight-ounce servings) and, when applied to soda fountains, refers to the volume of syrup, powders, and concentrate that is required to produce 192 ounces of finished beverage product. |
| (2) | Transactions refers to the number of single units (e.g., a can or a bottle) sold, regardless of their size or volume or whether they are sold individually or in multipacks, except for soda fountains, which represent multiple transactions based on a standard 12 oz. serving. |
Coca-Cola FEMSA Reports 4Q24 Results February 21, 2025 | Page 15 of 17 |
| COCA-COLA FEMSA | ||||||||||||||
| YTD- VOLUME, TRANSACTIONS & REVENUES | ||||||||||||||
| Volume | ||||||||||||||
| YTD 2024 | YTD 2023 | YoY | ||||||||||||
| Sparkling | Water (1) | Bulk (2) | Stills | Total | Sparkling | Water (1) | Bulk (2) | Stills | Total | Δ % | ||||
| Mexico | 1,454.8 | 136.1 | 375.2 | 158.2 | 2,124.3 | 1,408.7 | 121.7 | 376.6 | 145.9 | 2,052.9 | 3.5% | |||
| Guatemala | 174.0 | 9.8 | - | 9.0 | 192.8 | 157.6 | 7.7 | - | 8.9 | 174.2 | 10.7% | |||
| CAM South | 145.6 | 5.6 | 3.8 | 22.0 | 177.0 | 136.4 | 6.1 | 2.7 | 22.5 | 167.7 | 5.5% | |||
| Mexico and Central America | 1,774.3 | 151.5 | 379.0 | 189.3 | 2,494.1 | 1,702.7 | 135.4 | 379.3 | 177.3 | 2,394.8 | 4.1% | |||
| Colombia | 267.9 | 40.4 | 15.6 | 28.4 | 352.3 | 264.7 | 39.2 | 14.0 | 29.6 | 347.6 | 1.4% | |||
| Brazil (3) | 966.1 | 83.3 | 10.2 | 99.7 | 1,159.3 | 902.4 | 75.2 | 10.2 | 87.4 | 1,075.1 | 7.8% | |||
| Argentina | 126.4 | 21.4 | 7.1 | 13.4 | 168.3 | 135.1 | 21.0 | 5.8 | 16.8 | 178.7 | -5.8% | |||
| Uruguay | 40.6 | 6.9 | - | 3.2 | 50.7 | 40.6 | 8.7 | - | 2.4 | 51.7 | -1.9% | |||
| South America | 1,400.9 | 152.1 | 32.9 | 144.7 | 1,730.6 | 1,342.7 | 144.2 | 30.0 | 136.1 | 1,653.1 | 4.7% | |||
| TOTAL | 3,175.3 | 303.5 | 411.9 | 333.9 | 4,224.6 | 3,045.4 | 279.7 | 409.3 | 313.5 | 4,047.8 | 4.4% | |||
| (1) Excludes water presentations larger than 5.0 Lt ; includes flavored water. | ||||||||||||||
| (2) Bulk Water = Still bottled water in 5.0, 19.0 and 20.0 - liter packaging presentations; includes flavored water | ||||||||||||||
| Transactions | ||||||||||||||
| YTD 2024 | YTD 2023 | YoY | ||||||||||||
| Sparkling | Water | Stills | Total | Sparkling | Water | Stills | Total | Δ % | ||||||
| Mexico | 8,071.4 | 948.3 | 1,112.2 | 10,131.9 | 7,835.7 | 866.4 | 1,026.9 | 9,729.0 | 4.1% | |||||
| Guatemala | 1,299.1 | 65.2 | 95.3 | 1,459.6 | 1,179.8 | 56.9 | 91.9 | 1,328.5 | 9.9% | |||||
| CAM South | 1,058.5 | 56.0 | 220.6 | 1,335.1 | 996.4 | 53.6 | 237.3 | 1,287.4 | 3.7% | |||||
| Mexico and Central America | 10,428.9 | 1,069.6 | 1,428.1 | 12,926.6 | 10,011.8 | 976.9 | 1,356.2 | 12,344.9 | 4.7% | |||||
| Colombia | 1,951.1 | 412.9 | 228.8 | 2,592.8 | 1,942.5 | 411.8 | 302.2 | 2,656.5 | -2.4% | |||||
| Brazil (3) | 6,428.1 | 725.8 | 1,132.2 | 8,286.2 | 5,887.7 | 655.1 | 981.1 | 7,523.9 | 10.1% | |||||
| Argentina | 634.6 | 129.4 | 113.4 | 877.4 | 689.8 | 135.2 | 149.3 | 974.4 | -10.0% | |||||
| Uruguay | 193.3 | 26.9 | 26.1 | 246.2 | 190.7 | 32.6 | 20.3 | 243.6 | 1.1% | |||||
| South America | 9,207.1 | 1,295.0 | 1,500.5 | 12,002.6 | 8,710.7 | 1,234.7 | 1,452.9 | 11,398.3 | 5.3% | |||||
| TOTAL | 19,636.0 | 2,364.6 | 2,928.6 | 24,929.2 | 18,722.5 | 2,211.6 | 2,809.1 | 23,743.2 | 5.0% | |||||
| Revenues | ||||||||||||||
| Expressed in million Mexican Pesos | YTD 2024 | YTD 2023 | Δ % | |||||||||||
| Mexico | 135,906 | 122,615 | 10.8% | |||||||||||
| Guatemala | 15,524 | 13,016 | 19.3% | |||||||||||
| CAM South | 15,566 | 13,731 | 13.4% | |||||||||||
| Mexico and Central America | 166,996 | 149,362 | 11.8% | |||||||||||
| Colombia | 20,994 | 17,680 | 18.7% | |||||||||||
| Brazil (4) | 74,126 | 66,963 | 10.7% | |||||||||||
| Argentina | 12,557 | 6,668 | 88.3% | |||||||||||
| Uruguay | 5,119 | 4,415 | 15.9% | |||||||||||
| South America | 112,797 | 95,726 | 17.8% | |||||||||||
| TOTAL | 279,793 | 245,088 | 14.2% | |||||||||||
| (3) Volume and transactions in Brazil do not include beer | ||||||||||||||
| (4) Brazil includes beer revenues of Ps. 5,276.1 million for the full year of 2024 and Ps. 6,116.7 million for the same period of the previous year. | ||||||||||||||

| (1) | Volume is expressed in unit cases. Unit case refers to 192 ounces of finished beverage product (24 eight-ounce servings) and, when applied to soda fountains, refers to the volume of syrup, powders, and concentrate that is required to produce 192 ounces of finished beverage product. |
| (2) | Transactions refers to the number of single units (e.g., a can or a bottle) sold, regardless of their size or volume or whether they are sold individually or in multipacks, except for soda fountains, which represent multiple transactions based on a standard 12 oz. serving. |
Coca-Cola FEMSA Reports 4Q24 Results February 21, 2025 | Page 16 of 17 |
| COCA-COLA FEMSA | ||||||||
| MACROECONOMIC INFORMATION | ||||||||
| Inflation (1) | ||||||||
| LTM | 4Q24 | YTD | ||||||
| Mexico | 4.21% | 1.32% | 4.21% | |||||
| Colombia | 5.20% | 0.55% | 5.20% | |||||
| Brasil | 4.83% | 1.81% | 4.83% | |||||
| Argentina | 117.76% | 7.87% | 117.76% | |||||
| Costa Rica | 0.84% | 0.47% | 0.84% | |||||
| Panama | -0.19% | -0.55% | -0.19% | |||||
| Guatemala | 1.70% | -0.57% | 1.70% | |||||
| Nicaragua | 2.84% | -0.10% | 2.84% | |||||
| Uruguay | 5.49% | 1.15% | 5.49% | |||||
| (1) Source: inflation estimated by the company based on historic publications from the Central Bank of each country. | ||||||||
| Average Exchange Rates for each period (2) | ||||||||
| Quarterly Exchange Rate (Local Currency per USD) | Year to Date Exchange Rate (Local Currency per USD) | |||||||
| 4Q24 | 4Q23 | Δ % | YTD 24 | YTD 23 | Δ % | |||
| México | 20.07 | 17.58 | 14.1% | 18.30 | 17.77 | 3.0% | ||
| Colombia | 4,351.70 | 4,071.19 | 6.9% | 4,074.44 | 4,325.96 | -5.8% | ||
| Brasil | 5.84 | 4.95 | 18.0% | 5.39 | 4.99 | 7.9% | ||
| Argentina | 1001.46 | 448.97 | 123.1% | 916.29 | 296.61 | 208.9% | ||
| Costa Rica | 513.80 | 534.44 | -3.9% | 518.22 | 547.36 | -5.3% | ||
| Panama | 1.00 | 1.00 | 0.0% | 1.00 | 1.00 | 0.0% | ||
| Guatemala | 7.72 | 7.83 | -1.5% | 7.76 | 7.83 | -0.9% | ||
| Nicaragua | 36.62 | 36.58 | 0.1% | 36.62 | 36.44 | 0.5% | ||
| Uruguay | 42.67 | 39.53 | 7.9% | 40.21 | 38.82 | 3.6% | ||
| End-of-period Exchange Rates | ||||||||
| Closing Exchange Rate (Local Currency per USD) | Closing Exchange Rate (Local Currency per USD) | |||||||
| Dec-24 | Dec-23 | Δ % | Sep-24 | Sep-23 | Δ % | |||
| México | 20.27 | 16.89 | 20.0% | 19.63 | 17.62 | 11.4% | ||
| Colombia | 4,409.15 | 3,822.05 | 15.4% | 4,164.21 | 4,053.76 | 2.7% | ||
| Brasil | 6.19 | 4.84 | 27.9% | 5.45 | 5.01 | 8.8% | ||
| Argentina | 1,032.00 | 808.45 | 27.7% | 970.50 | 349.95 | 177.3% | ||
| Costa Rica | 512.73 | 526.88 | -2.7% | 522.87 | 542.35 | -3.6% | ||
| Panama | 1.00 | 1.00 | 0.0% | 1.00 | 1.00 | 0.0% | ||
| Guatemala | 7.71 | 7.83 | -1.5% | 7.72 | 7.86 | -1.7% | ||
| Nicaragua | 36.62 | 36.62 | 0.0% | 36.62 | 36.53 | 0.3% | ||
| Uruguay | 44.07 | 39.02 | 12.9% | 41.64 | 38.56 | 8.0% | ||
| (2) Average exchange rate for each period computed with the average exchange rate of each month. | ||||||||
Coca-Cola FEMSA Reports 4Q24 Results February 21, 2025 | Page 17 of 17 |
SIGNATURES
Pursuant to the requirements of the Securities Exchange Act of 1934, the registrant has duly caused this report to be signed on its behalf by the undersigned, thereunto duly authorized.
| COCA-COLA FEMSA, S.A.B. DE C.V. | |
| By: /s/ Gerardo Cruz Celaya | |
Gerardo Cruz Celaya Chief Financial Officer | |
| Date: February 20, 2025 |