3D Systems Corporation
Nasdaq: TDSC
Investor Day
New York
January 10, 2005
www.3dsystems.com
EXPERIENCE THE DIFFERENCE
Transforming the way people design, develop and manufacture products | [LOGO] |
Experience the difference…
Forward-Looking Statements
Certain statements made by the company in this presentation are forward-looking statements. These statements include comments as to the company’s beliefs and expectations as to future events and trends affecting the company’s business. These forward-looking statements are based upon management’s current expectations concerning future events and trends and are necessarily subject to uncertainties, many of which are outside the control of the company. The factors stated under the headings “Forward-Looking Statements” and “Cautionary Statements and Risk Factors” in management’s discussion and analysis of results of operations and financial condition, which appear in the company’s periodic filings with the Securities and Exchange Commission as well as other factors, could cause actual results to differ materially from such statements.
© Copyright 2005 by 3D Systems, Inc. All rights reserved. The 3D logo, 3D Systems, SLA, SLS, Sinterstation, DuraForm, VisiJet, ThermoJet and Accura are registered trademarks and SLS, InVision, Amethyst, Bluestone, HiQ, LaserForm and CastForm are trademarks of 3D Systems. All other product names or services mentioned are trademarks or registered trademarks of their respective companies.
2
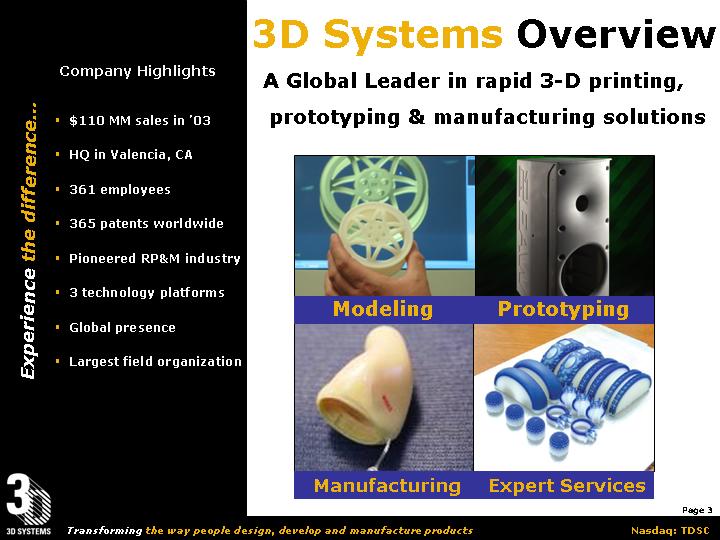
Company Highlights
• $110 MM sales in ‘03
• HQ in Valencia, CA
• 361 employees
• 365 patents worldwide
• Pioneered RP&M industry
• 3 technology platforms
• Global presence
• Largest field organization Company Highlights
3D Systems Overview
A Global Leader in rapid 3-D printing, prototyping & manufacturing solutions
[GRAPHIC] | | [GRAPHIC] |
Modeling | | Prototyping |
| | |
[GRAPHIC] | | [GRAPHIC] |
Manufacturing | | Expert Services |
3
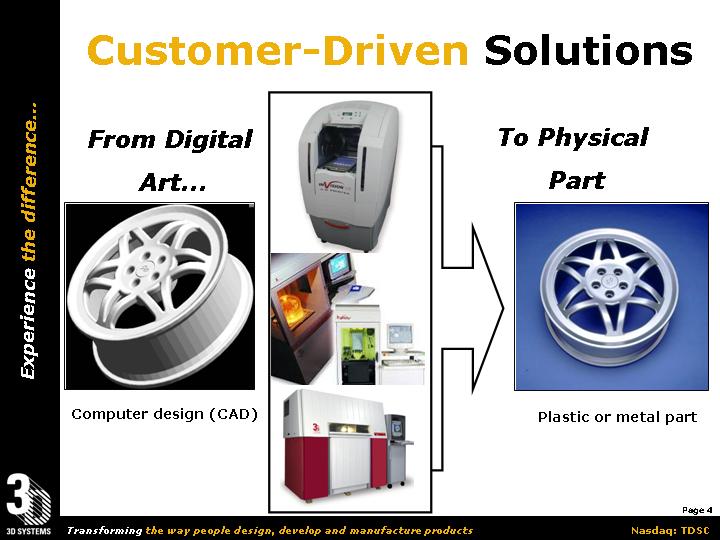
Customer-Driven Solutions
From Digital
Art... | | To Physical
Part |
| | |
[GRAPHIC] | [GRAPHIC] | [GRAPHIC] |
| | |
Computer design (CAD) | | Plastic or metal part |
4
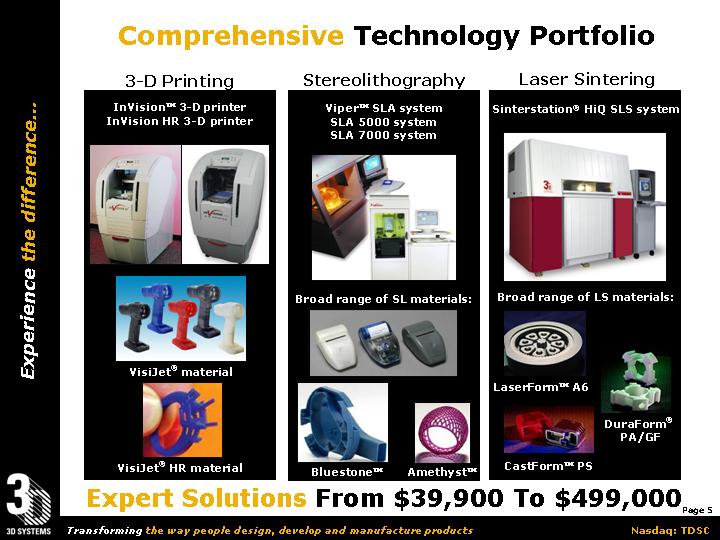
Comprehensive Technology Portfolio
3-D Printing | Stereolithography | Laser Sintering |
| | |
InVisionTM 3-D printer | ViperTM SLA system | Sinterstation® HiQ SLS system |
InVision HR 3-D Printer | SLA 5000 system | [GRAPHIC] |
| SLA 7000 system | |
[GRAPHIC] | [GRAPHIC] | Broad range of LS materials: |
| Broad range of SL materials: | [GRAPHIC] | [GRAPHIC]
DuraForm®
PA/GF |
VisiJet® material | [GRAPHIC] | Laser FormTM A6 |
[GRAPHIC] | [GRAPHIC] | [GRAPHIC] | [GRAPHIC] |
VisiJet® HR material | BluestoneTM | AmethystTM | CastFormTM PS |
| | |
Expert Solutions From $39,900 To $499,000
5
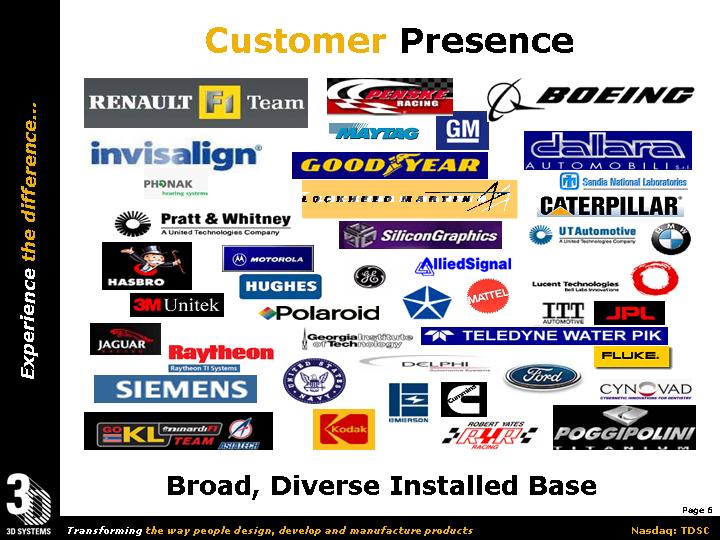
Customer Presence
[GRAPHIC]
Broad, Diverse Installed Base
6
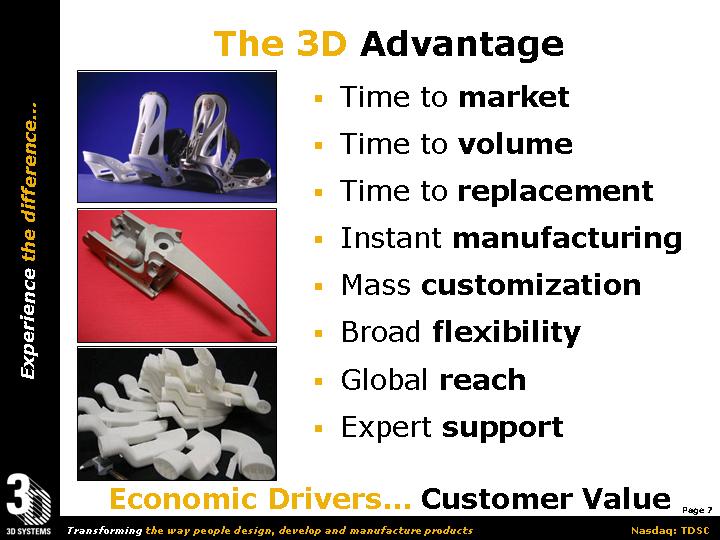
The 3D Advantage
[GRAPHIC]
• Time to market
• Time to volume
• Time to replacement
• Instant manufacturing
• Mass customization
• Broad flexibility
• Global reach
• Expert support
Economic Drivers… Customer Value
7
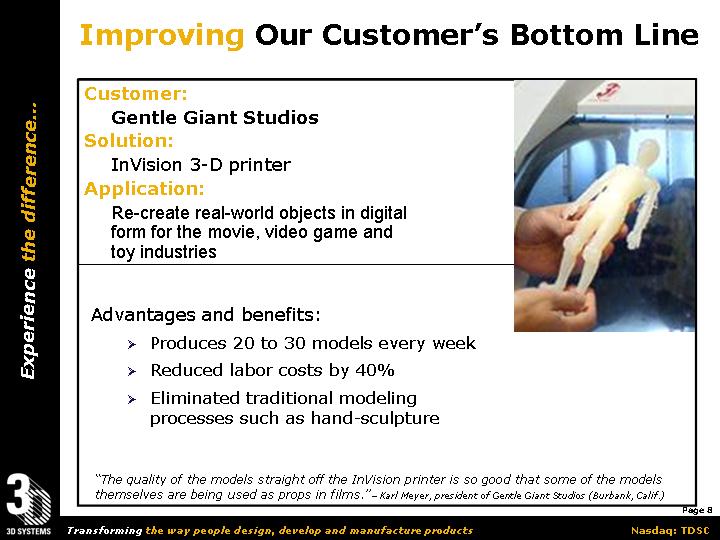
Improving Our Customer’s Bottom Line
Customer: | [GRAPHIC] |
Gentle Giant Studios |
|
Solution: |
InVision 3-D printer |
|
Application: |
Re-create real-world objects in digital form for the movie, video game and toy industries |
Advantages and benefits:
• Produces 20 to 30 models every week
• Reduced labor costs by 40%
• Eliminated traditional modeling processes such as hand-sculpture
“The quality of the models straight off the InVision printer is so good that some of the models themselves are being used as props in films.” – Karl Meyer, president of Gentle Giant Studios (Burbank, Calif.)
8
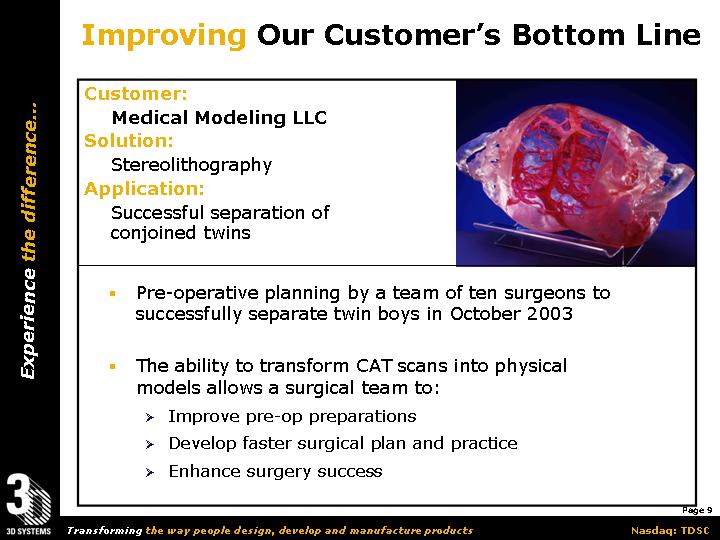
Customer: | [GRAPHIC] |
Medical Modeling LLC |
|
Solution: |
Stereolithography |
|
Application: |
Successful separation of conjoined twins |
• Pre-operative planning by a team of ten surgeons to successfully separate twin boys in October 2003
• The ability to transform CAT scans into physical models allows a surgical team to:
• Improve pre-op preparations
• Develop faster surgical plan and practice
• Enhance surgery success
9
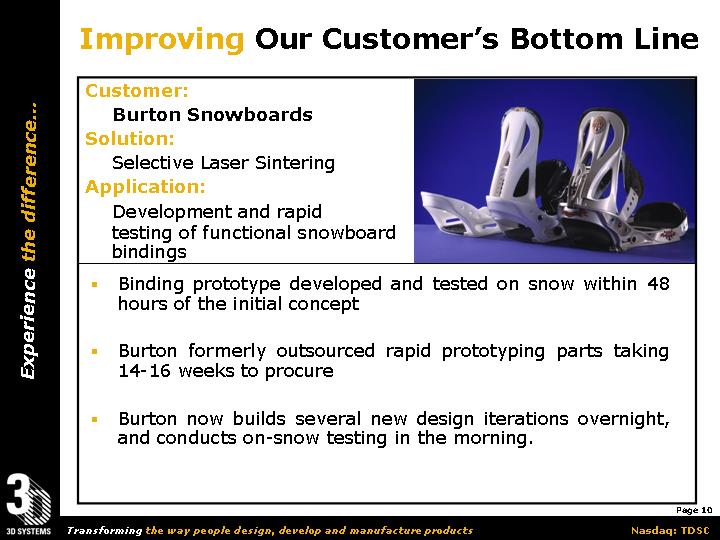
Customer: | [GRAPHIC] |
Burton Snowboards |
|
Solution: |
Selective Laser Sintering |
|
Application: |
Development and rapid testing of functional snowboard bindings |
• Binding prototype developed and tested on snow within 48 hours of the initial concept
• Burton formerly outsourced rapid prototyping parts taking 14-16 weeks to procure
• Burton now builds several new design iterations overnight, and conducts on-snow testing in the morning.
10
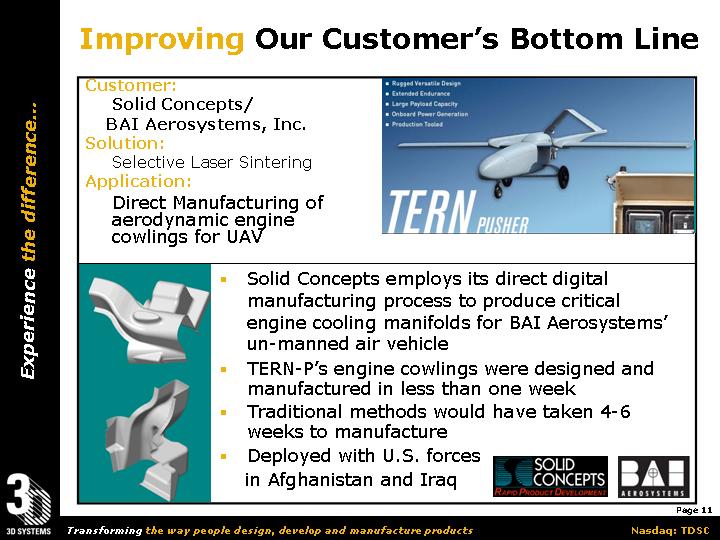
Customer: | |
Solid Concepts/BAI Aerosystems, Inc. | |
| |
Solution: | |
Selective Laser Sintering | |
| |
Application: | |
Direct Manufacturing of aerodynamic engine cowlings for UAV | |
[GRAPHIC]
• Rugged Versatile Design
• Extended Endurance
• Large Payload Capacity
• Onboard Power Generation
• Production Tooled
[GRAPHIC]
• Solid Concepts employs its direct digital manufacturing process to produce critical engine cooling manifolds for BAI Aerosystems’ un-manned air vehicle
• TERN-P’s engine cowlings were designed and manufactured in less than one week
• Traditional methods would have taken 4-6 weeks to manufacture
• Deployed with U.S. forces in Afghanistan and Iraq
[LOGO]
11
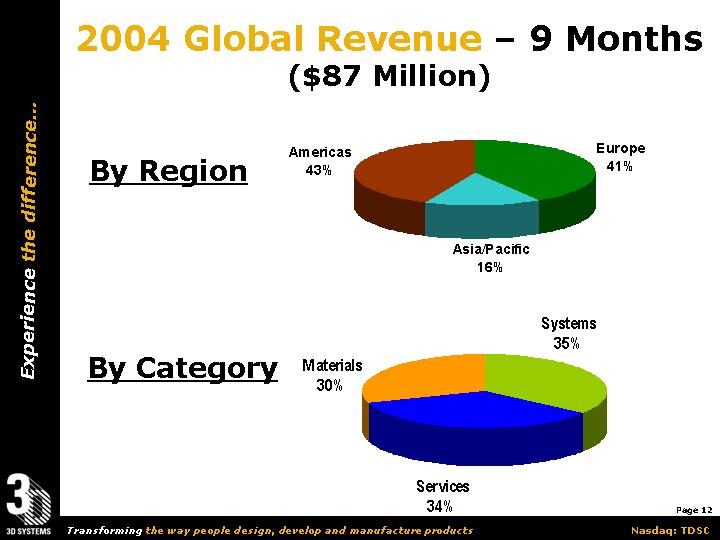
2004 Global Revenue — 9 Months
($87 Million)
By Region | [CHART] |
| |
By Category | [CHART] |
| |
12
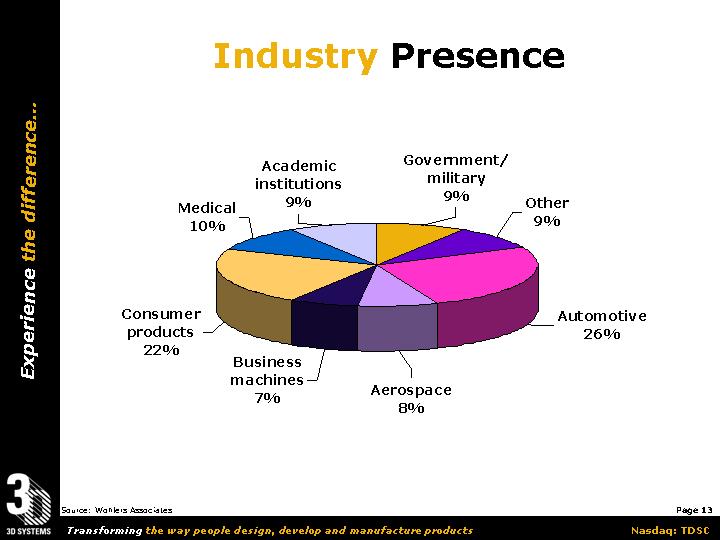
Industry Presence
[CHART]
Source: Wohlers Associates
13
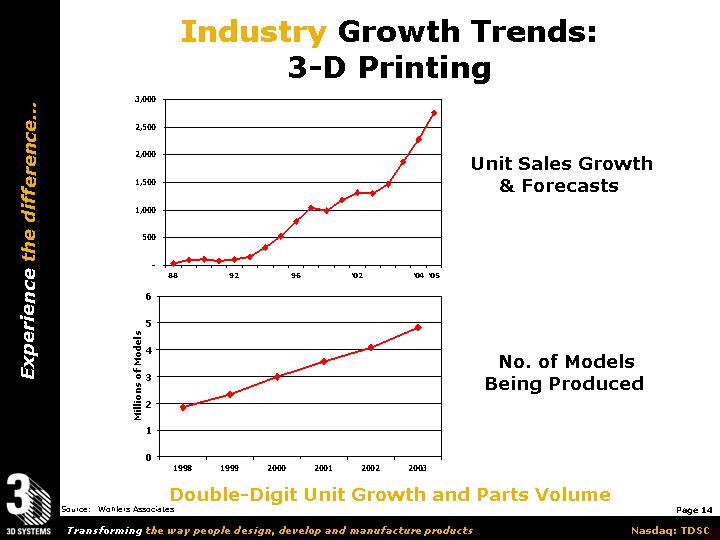
Industry Growth Trends:
3-D Printing
[CHART] | Unit Sales Growth
& Forecasts |
| |
[CHART] | No. of Models
Being Produced |
Double-Digit Unit Growth and Parts Volume
Source: Wohlers Associates
14
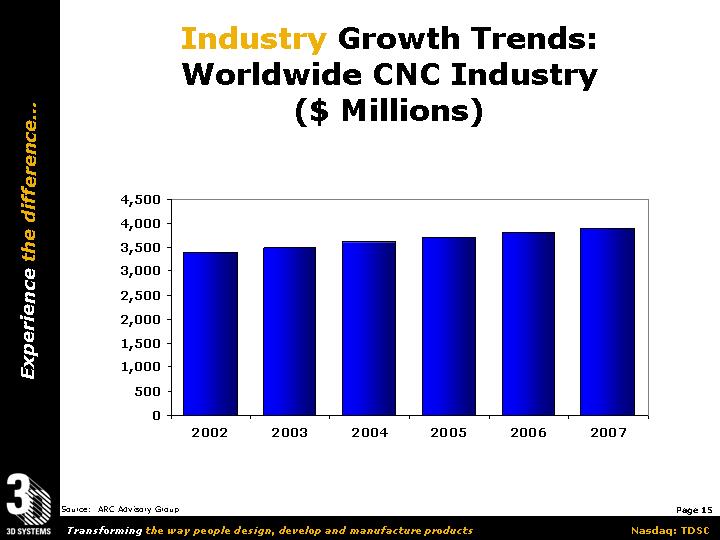
Industry Growth Trends:
Worldwide CNC Industry
($ Millions)
[CHART]
Source: ARC Advisory Group
15
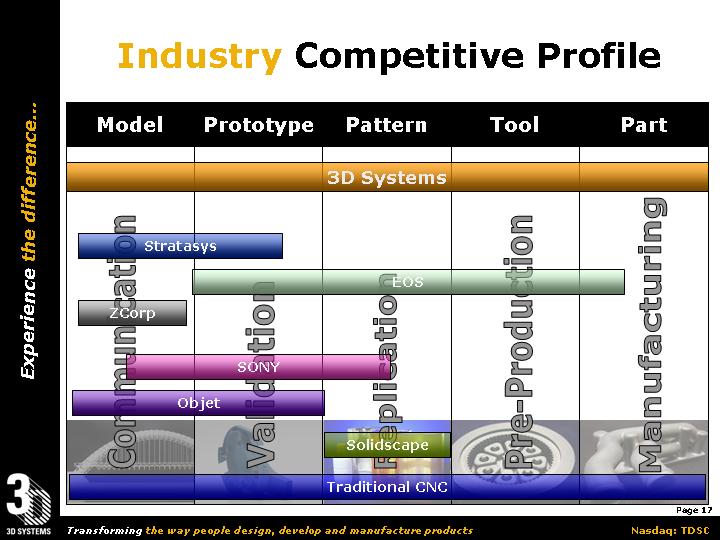
Industry Competitive Profile
Model | Prototype | Pattern | Tool | Part |
| | | | |
| | 3D Systems | | |
| | | | |
Communication | Validation | Replication | Pre-Production | Manufacturing |
[GRAPHIC] | [GRAPHIC] | [GRAPHIC] | [GRAPHIC] | [GRAPHIC] |
16
Model | Prototype | Pattern | Tool | Part |
| | | | |
| | 3D Systems | | |
| | | | |
Stratasys | | | |
| EOS | |
ZCorp | | | | |
SONY | | |
| | |
Object | | | |
| | Solidscape | | |
| | | | |
Traditional CNC |
| | | | | | | | | | |
17
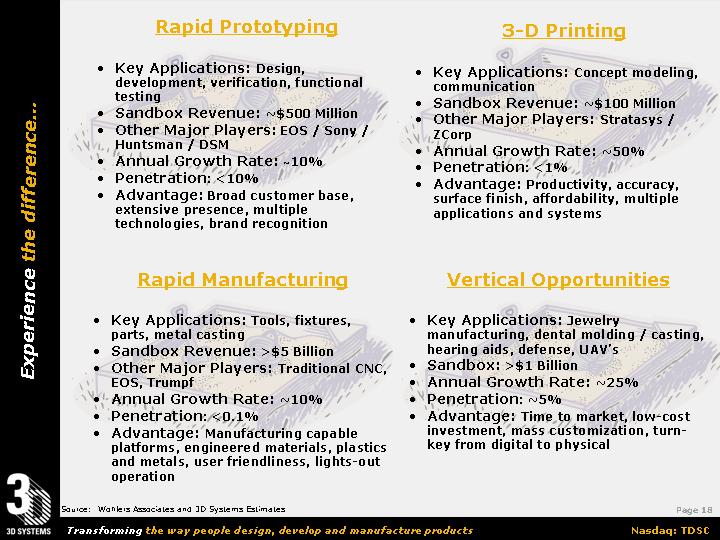
[GRAPHIC]
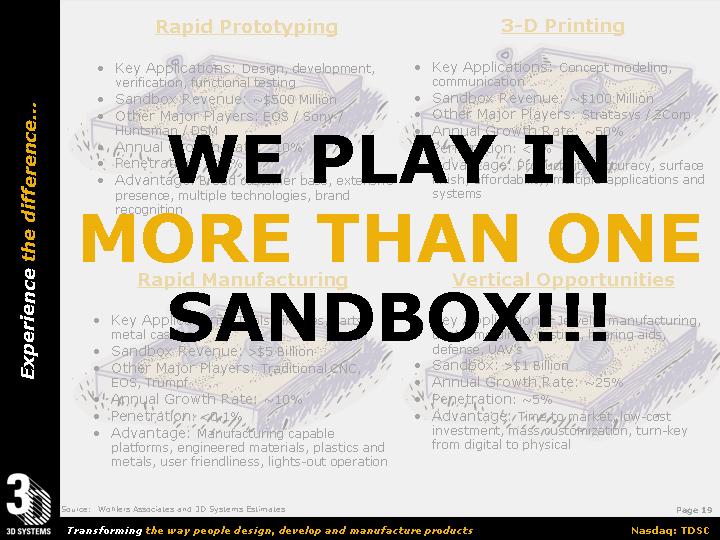
Rapid Prototyping
• Key Applications: Design, development, verification, functional testing
• Sandbox Revenue: ~$500 Million
• Other Major Players: EOS / Sony / Huntsman / DSM
• Annual Growth Rate: ~10%
• Penetration: <10%
• Advantage: Broad customer base, extensive presence, multiple technologies, brand recognition
Rapid Manufacturing
• Key Applications: Tools, fixtures, parts, metal casting
• Sandbox Revenue: >$5 Billion
• Other Major Players: Traditional CNC, EOS, Trumpf
• Annual Growth Rate: ~10%
• Penetration: <0.1%
• Advantage: Manufacturing capable platforms, engineered materials, plastics and metals, user friendliness, lights-out operation
3-D Printing
• Key Applications: Concept modeling, communication
• Sandbox Revenue: ~$100 Million
• Other Major Players: Stratasys / ZCorp
• Annual Growth Rate: ~50%
• Penetration: <1%
• Advantage: Productivity, accuracy, surface finish, affordability, multiple applications and systems
Vertical Opportunities
• Key Applications: Jewelry manufacturing, dental molding / casting, hearing aids, defense, UAV’s
• Sandbox: >$1 Billion
• Annual Growth Rate: ~25%
• Penetration: ~5%
• Advantage: Time to market, low-cost investment, mass customization, turn-key from digital to physical
Source: Wohlers Associates and 3D Systems Estimates
18
[GRAPHIC]
WE PLAY IN
MORE THAN ONE
SANDBOX!!!
19
Significance to Investors—
Lower Expected Volatility
• Diversified portfolio: four growth areas in same business
• Global composition: different economic cycles
• Significant recurring revenue: independent of capex spending cycles
• Growing penetration: tiny base permits expansion even during downturns
• Dampened impacts during economic downturns:
• Rapid prototyping: low growth rate dampens swings
• 3D printing: low entry price is less susceptible to capex restrictions; design & communication tool, not capacity expansion
• Rapid manufacturing: offers cost-reduction opportunities attractive in slowdowns
• Vertical opportunities: addition of new applications has low correlation, if any, to economic cycles
20
First Fifteen Months’
Accomplishments
• Established clear priorities
• Developed comprehensive strategy
• Recruited and realigned management team
• Recapitalized the business
• Settled significant litigation
• Created strategic alliances
• Effected corporate governance changes
• Implemented preferable accounting policies
• Enacted stronger financial controls
• Secured revolving credit line
• Introduced new products
• Outsourced equipment assembly operations
• �� Migrated convertible debt to equity
• Improved operating results
Building A Stronger Company
21
Strategic Priorities & Initiatives
• Improve our customer’s bottom line
• Develop key applications
• 3-D printing
• Manufacturing
• Expand range of customer services
• Accelerate new product development
• Optimize cash flow and supply chain
• Create performance and ethical culture
• Develop people and opportunities
Focused Execution… E.P.S.
22
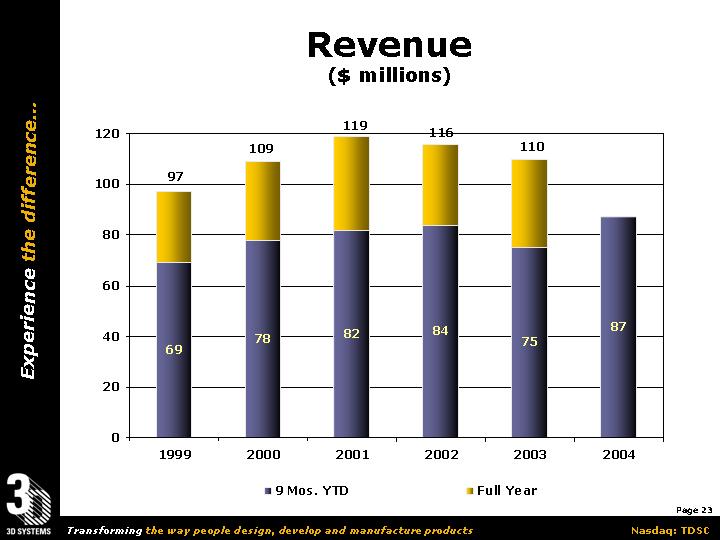
Revenue
($ millions)
[CHART]
23
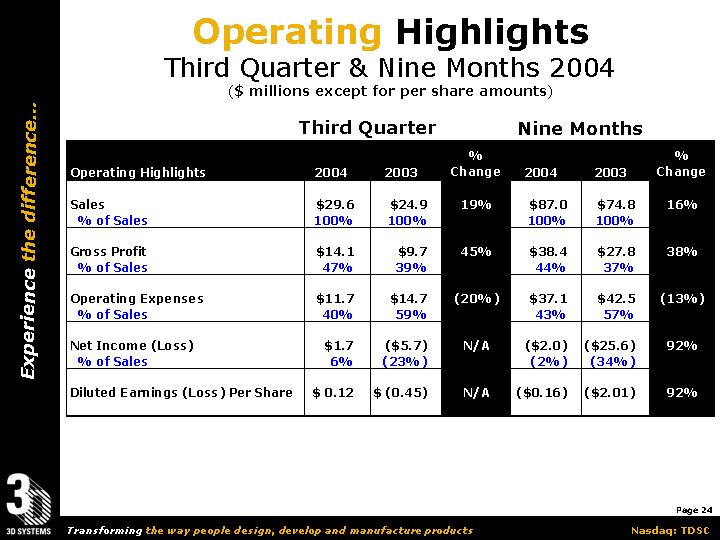
Operating Highlights
Third Quarter & Nine Months 2004
($ millions except for per share amounts)
| | Third Quarter | | % | | Nine Months | | % | |
Operating Highlights | | 2004 | | 2003 | | Change | | 2004 | | 2003 | | Change | |
| | | | | | | | | | | | | |
Sales | | $ | 29.6 | | $ | 24.9 | | 19 | % | $ | 87.0 | | $ | 74.8 | | 16 | % |
% of Sales | | 100 | % | 100 | % | | | 100 | % | 100 | % | | |
| | | | | | | | | | | | | |
Gross Profit | | $ | 14.1 | | $ | 9.7 | | 45 | % | $ | 38.4 | | $ | 27.8 | | 38 | % |
% of Sales | | 47 | % | 39 | % | | | 44 | % | 37 | % | | |
| | | | | | | | | | | | | |
Operating Expenses | | $ | 11.7 | | $ | 14.7 | | (20 | )% | $ | 37.1 | | $ | 42.5 | | (13 | )% |
% of Sales | | 40 | % | 59 | % | | | 43 | % | 57 | % | | |
| | | | | | | | | | | | | |
Net Income (Loss) | | $ | 1.7 | | $ | (5.7 | ) | N/A | | $ | (2.0 | ) | $ | (25.6 | ) | 92 | % |
% of Sales | | 6 | % | (23 | )% | | | (2 | )% | (34 | )% | | |
| | | | | | | | | | | | | |
Diluted Earnings (Loss) Per Share | | $ | 0.12 | | $ | (0.45 | ) | N/A | | $ | (0.16 | ) | $ | (2.01 | ) | 92 | % |
24
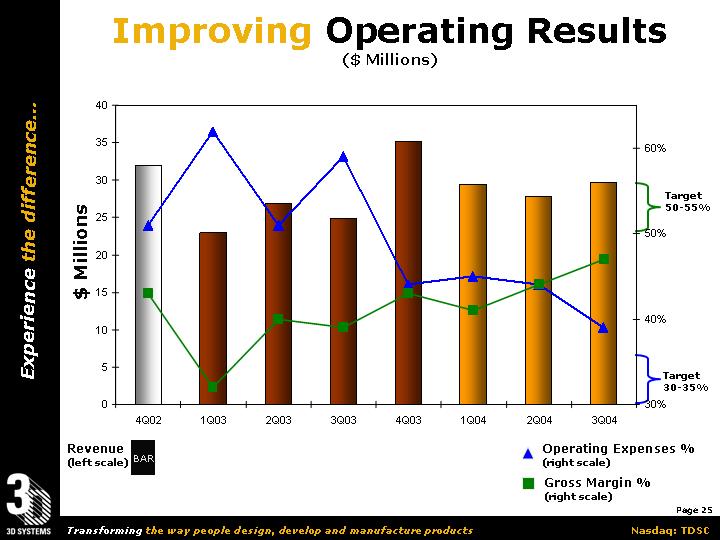
Improving Operating Results
($ Millions)
[CHART]
25
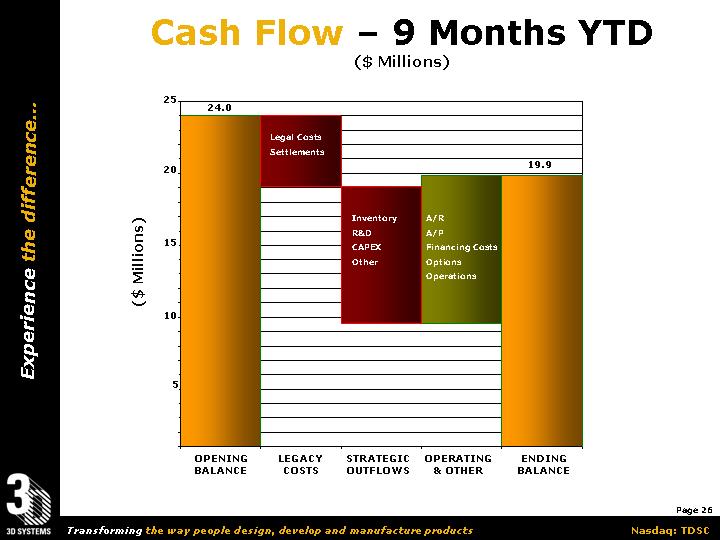
Cash Flow – 9 Months YTD
($ Millions)
[CHART]
26
Commitments for Debt Service, Preferred Stock & Operating Leases
Estimated at 12/31/04
[CHART]
27
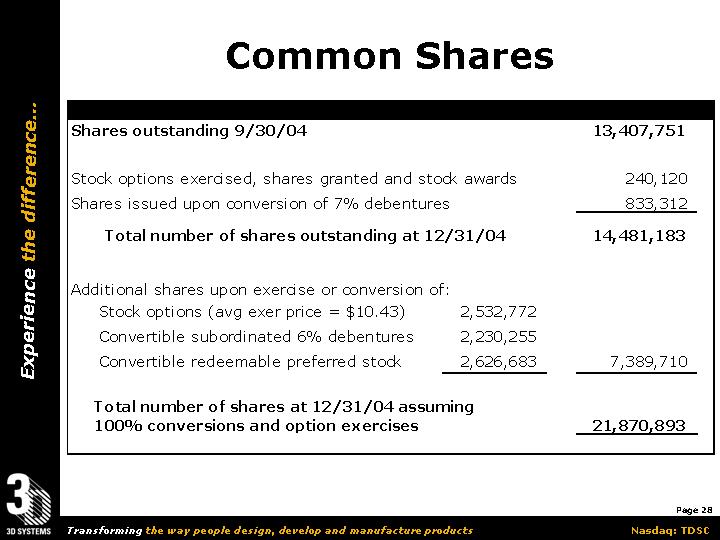
Common Shares
Shares outstanding 9/30/04 | | | | 13,407,751 | |
| | | | | |
Stock options exercised, shares granted and stock awards | | | | 240,120 | |
Shares issued upon conversion of 7% debentures | | | | 833,312 | |
| | | | | |
Total number of shares outstanding at 12/31/04 | | | | 14,481,183 | |
| | | | | |
Additional shares upon exercise or conversion of: | | | | | |
Stock options (avg exer price = $10.43) | | 2,532,772 | | | |
Convertible subordinated 6% debentures | | 2,230,255 | | | |
Convertible redeemable preferred stock | | 2,626,683 | | 7,389,710 | |
| | | | | |
Total number of shares at 12/31/04 assuming 100% conversions and option exercises | | | | 21,870,893 | |
28
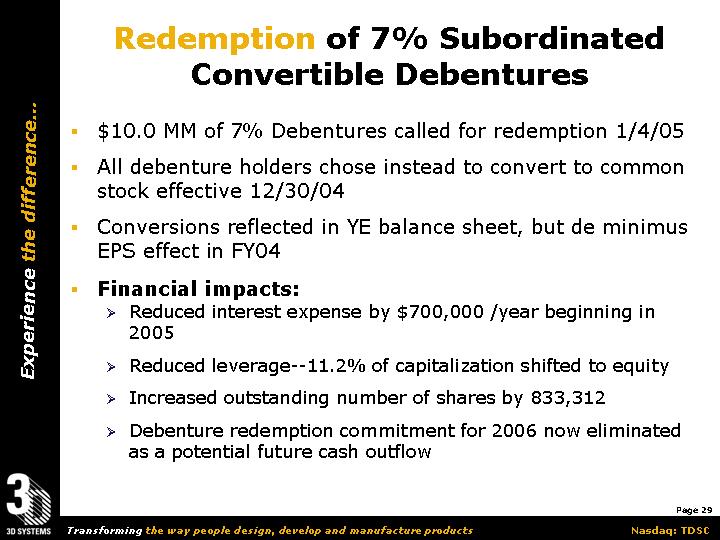
Redemption of 7% Subordinated Convertible Debentures
• $10.0 MM of 7% Debentures called for redemption 1/4/05
• All debenture holders chose instead to convert to common stock effective 12/30/04
• Conversions reflected in YE balance sheet, but de minimus EPS effect in FY04
• Financial impacts:
• Reduced interest expense by $700,000 /year beginning in 2005
• Reduced leverage—11.2% of capitalization shifted to equity
• Increased outstanding number of shares by 833,312
• Debenture redemption commitment for 2006 now eliminated as a potential future cash outflow
29
Capitalization
($ 000’s)
| | Actual | | | | Pro Forma | | | |
| | 9/30/2004 | | Adjmts(a) | | 9/30/2004 (b) | | | |
Current portion L-T debt | | $ | 180 | | 0.2 | % | | | $ | 180 | | 0.2 | % |
| | | | | | | | | | | |
Long-term senior debt | | 3,745 | | 4.2 | % | | | 3,745 | | 4.2 | % |
| | | | | | | | | | | |
Long-term subordinated debt | | 32,704 | | 36.7 | % | (10,000 | ) | 22,704 | (c) | 25.5 | % |
| | | | | | | | | | | |
Series B preferred stock (d) | | 15,214 | | 17.1 | % | | | 15,214 | | 17.1 | % |
| | | | | | | | | | | |
Common equity | | 37,159 | | 41.8 | % | 10,000 | | 47,159 | | 53.0 | % |
| | | | | | | | | | | |
Total capitalization | | $ | 89,002 | | 100.0 | % | | | $ | 89,002 | | 100.0 | % |
| | | | | | | | | | | |
Unrestricted cash | | $ | 19,854 | | | | $ | (173 | ) | $ | 19,681 | | | |
| | | | | | | | | | | | | | |
(a) $10,000 of 7% debentures elected to convert to common stock during the fourth quarter of 2004.
(b) Pro forma giving effect to the conversion during 4Q04 of $10,000 of 7% debentures
(c) Conversion price of remaining 6% convertible subordinated debentures is $10.18 / share; callable after Nov. ‘06
(d) Convertible 1:1 into common; redeemable at $6.00 / share after May ‘06
30
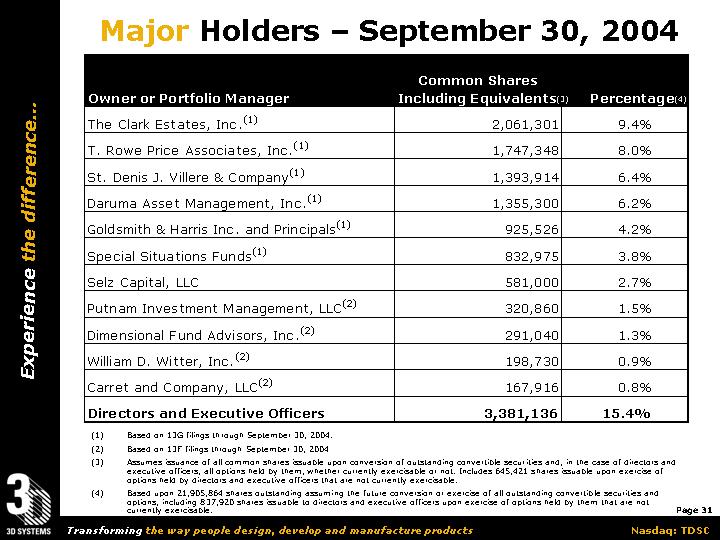
Major Holders – September 30, 2004
| | Common Shares | | | |
Owner or Portfolio Manager | | Including Equivalents(3) | | Percentage(4) | |
The Clark Estates, Inc.(1) | | 2,061,301 | | 9.4 | % |
T. Rowe Price Associates, Inc.(1) | | 1,747,348 | | 8.0 | % |
St. Denis J. Villere & Company(1) | | 1,393,914 | | 6.4 | % |
Daruma Asset Management, Inc.(1) | | 1,355,300 | | 6.2 | % |
Goldsmith & Harris Inc. and Principals(1) | | 925,526 | | 4.2 | % |
Special Situations Funds(1) | | 832,975 | | 3.8 | % |
Selz Capital, LLC | | 581,000 | | 2.7 | % |
Putnam Investment Management, LLC(2) | | 320,860 | | 1.5 | % |
Dimensional Fund Advisors, Inc.(2) | | 291,040 | | 1.3 | % |
William D. Witter, Inc.(2) | | 198,730 | | 0.9 | % |
Carret and Company, LLC(2) | | 167,916 | | 0.8 | % |
Directors and Executive Officers | | 3,381,136 | | 15.4 | % |
(1) Based on 13G filings through September 30, 2004.
(2) Based on 13F filings through September 30, 2004
(3) Assumes issuance of all common shares issuable upon conversion of outstanding convertible securities and, in the case of directors and executive officers, all options held by them, whether currently exercisable or not. Includes 645,421 shares issuable upon exercise of options held by directors and executive officers that are not currently exercisable.
(4) Based upon 21,905,864 shares outstanding assuming the future conversion or exercise of all outstanding convertible securities and options, including 837,920 shares issuable to directors and executive officers upon exercise of options held by them that are not currently exercisable.
31
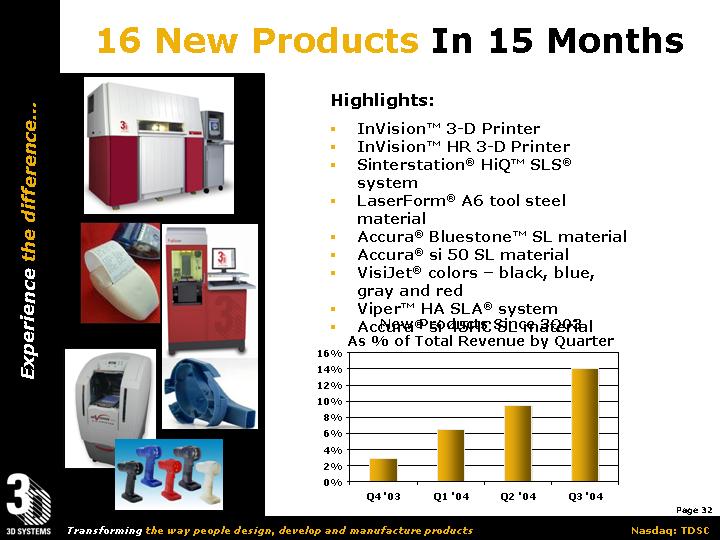
16 New Products In 15 Months
[GRAPHIC]
Highlights:
• InVision™ 3-D Printer
• InVision™ HR 3-D Printer
• Sinterstation® HiQ™ SLS® system
• LaserForm® A6 tool steel material
• Accura® Bluestone™ SL material
• Accura® si 50 SL material
• VisiJet® colors – black, blue, gray and red
• Viper™ HA SLA® system
• Accura® si 45HC SL material
New Products Since 3Q03
As % of Total Revenue by Quarter
[CHART]
32
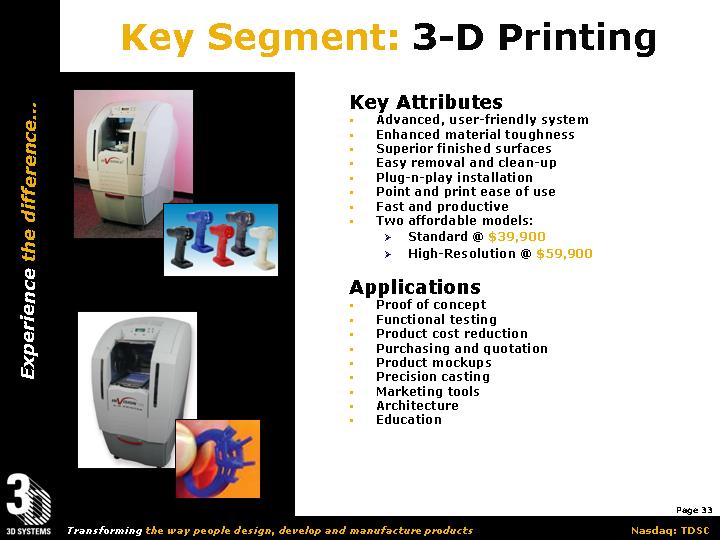
Key Segment: 3-D Printing
[GRAPHIC]
Key Attributes
• Advanced, user-friendly system
• Enhanced material toughness
• Superior finished surfaces
• Easy removal and clean-up
• Plug-n-play installation
• Point and print ease of use
• Fast and productive
• Two affordable models:
• Standard @ $39,900
• High-Resolution @ $59,900
Applications
• Proof of concept
• Functional testing
• Product cost reduction
• Purchasing and quotation
• Product mockups
• Precision casting
• Marketing tools
• Architecture
• Education
33
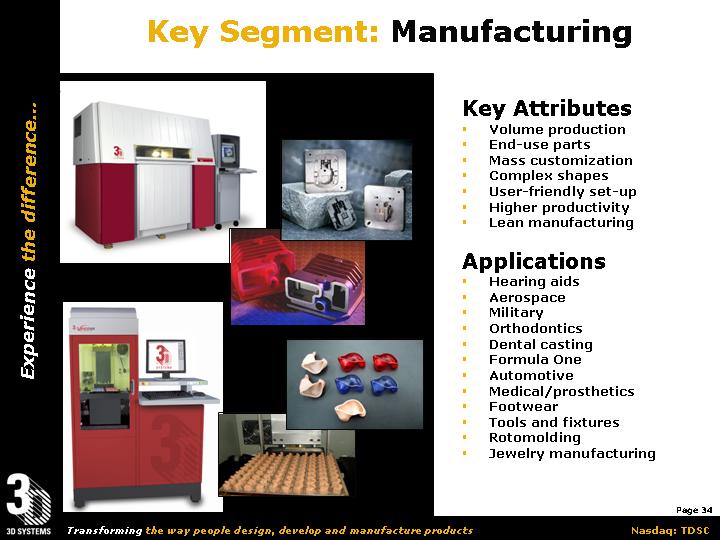
Key Segment: Manufacturing
[GRAPHIC]
Key Attributes
• Volume production
• End-use parts
• Mass customization
• Complex shapes
• User-friendly set-up
• Higher productivity
• Lean manufacturing
Applications
• Hearing aids
• Aerospace
• Military
• Orthodontics
• Dental casting
• Formula One
• Automotive
• Medical/prosthetics
• Footwear
• Tools and fixtures
• Rotomolding
• Jewelry manufacturing
34
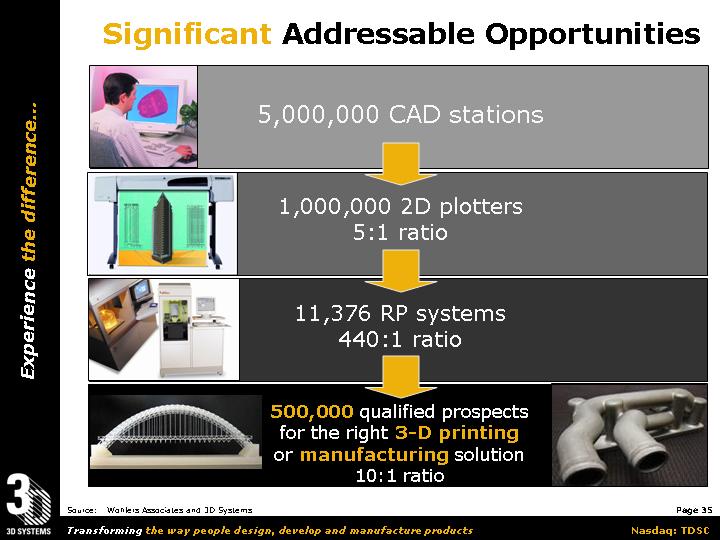
Significant Addressable Opportunities
[GRAPHIC] | 5,000,000 CAD stations | |
| | |
[GRAPHIC] | 1,000,000 2D plotters 5:1 ratio | |
| | |
[GRAPHIC] | 11,376 RP systems 440:1 ratio | |
| | |
[GRAPHIC] | 500,000 qualified prospects for the right 3-D printing or manufacturing solution 10:1 ratio | [GRAPHIC] |
Source: Wohlers Associates and 3D Systems
35
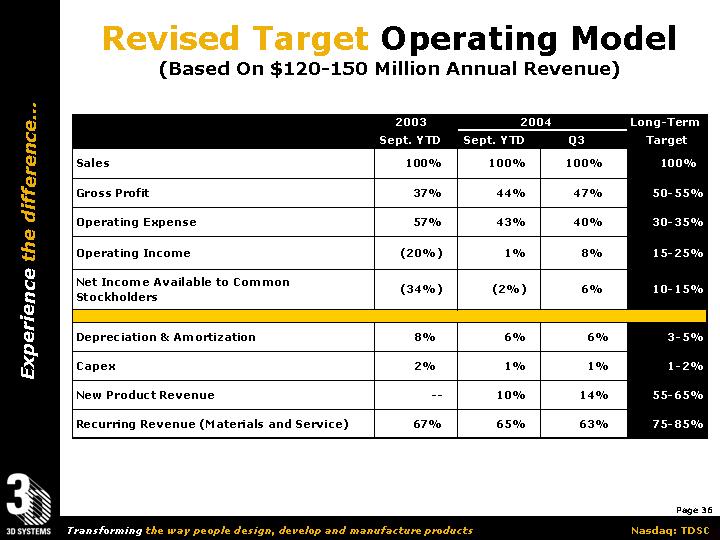
Revised Target Operating Model
(Based On $120-150 Million Annual Revenue)
| | 2003 | | 2004 | | Long-Term | |
| | Sept. YTD | | Sept. YTD | | Q3 | | Target | |
Sales | | 100 | % | 100 | % | 100 | % | 100 | % |
| | | | | | | | | |
Gross Profit | | 37 | % | 44 | % | 47 | % | 50-55 | % |
| | | | | | | | | |
Operating Expense | | 57 | % | 43 | % | 40 | % | 30-35 | % |
| | | | | | | | | |
Operating Income | | (20 | )% | 1 | % | 8 | % | 15-25 | % |
| | | | | | | | | |
Net Income Available to Common Stockholders | | (34 | )% | (2 | )% | 6 | % | 10-15 | % |
| | | | | | | | | |
Depreciation & Amortization | | 8 | % | 6 | % | 6 | % | 3-5 | % |
| | | | | | | | | |
Capex | | 2 | % | 1 | % | 1 | % | 1-2 | % |
| | | | | | | | | |
New Product Revenue | | — | | 10 | % | 14 | % | 55-65 | % |
| | | | | | | | | |
Recurring Revenue (Materials and Service) | | 67 | % | 65 | % | 63 | % | 75-85 | % |
36
Outsourcing Equipment Update
• Strategic re-direction of resources
• Utilize others’ core competencies in assembly
• Leverage others’ R&D resources
• Focus on our core capabilities & unique expertise
• Commenced transition during the third quarter
• Low transition costs; P&L benefit beginning in ‘05
• Near-term working capital increase, reduced levels thereafter
• All equipment assembly operations transitioned as of Dec 2004
• Anticipate completion of remaining supply chain activities by mid-2005 — ahead of schedule
37
Organizational Update
• Senior Executive Team
• Experienced, energized team fully in place
• Sales & Marketing
• Recruited, realigned over 50% of team
• New sales leadership in US, Europe and Asia
• Expanded product management team with product P&L responsibilities
• Dedicated InVision 3-D printing sales force in US, Europe and Asia
• New incentive comp structure for systems, materials and service
• Defined sales territories, ownership and accountability
• Team selling approach with service and application reps
• Discontinued quarter end discounts
• Research & Development
• Recruited, realigned key positions to reflect outsourcing needs
• Expanded systems and materials research activities
• Accelerated tactical and strategic new product introductions
38
• Finance & Administration
• Recruited new:
• Corporate Controller
• Director of Treasury & Risk Management
• Director of External Reporting
• Strengthened financial controls…. SOX
• Operations
• Realigned and reduced staff to reflect outsourcing needs
• Recruited new Director of all order-to-cash activities
• Expect to complete organizational realignment without headcount increase by mid-2005
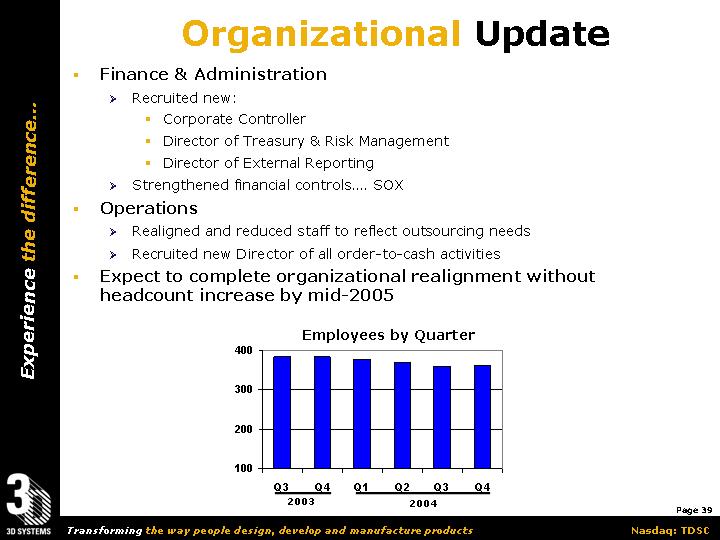
Employees by Quarter
[CHART]
39
Next Fifteen Months’ Initiatives
• Strengthening sales & marketing
• Commercializing new SLA & SLS platforms
• Growing 3-D printing portfolio & reseller channel
• Expanding geographical presence: China & Japan
• Enhancing service portfolio & profitability
• Developing new vertical applications
• Introducing new engineered materials: plastics & metals
• Increasing recurring revenue, materials & services
• Adding alliance & outsourcing partners
• Improving operating results
Building Stronger Company
40
Expected Mid-Term Outlook
• Outsourcing assembly operations
• Low transition costs: P&L benefit beginning in ‘05
• Near-term working capital increase, reduced levels thereafter
• Assembly operations fully transitioned
• Supply chain transition nearing completion
• Accelerating new product development
• Higher R&D expenditures through 2005 in the range of 8% of revenue
• Faster new product introductions
• Significant new platform launches
• Reshaping and expanding sales and marketing
• Enhanced productivity and coverage globally
• Expanding distribution; growing 3-D printing revenue contribution
41
• Improving business model and results
• Further COGS improvements
• Lower legal expenses from resolution of legacy matters
• Better service productivity and effectiveness
• Greater contributions from materials and services
• Reducing working capital investment
• Accelerating growth
• Traditional applications…. from new products
• New applications…. new verticals
• Geographic expansion….new markets
42
Bottom Line
• Leading industry position & technology
• Energized, experienced management team
• Clear priorities… demonstrated execution
• Stronger financial base & flexibility
• Favorable results from recent strategic initiatives
• Outsourcing assembly operations
• Reshaping, expanding sales and marketing
• Healthy pipeline of growth opportunities
• Improving operating results & cash flow
• Significant addressable applications
• 3-D printing
• Manufacturing
• Measurable value, customers, stockholders & employees
Transitioning from Restructuring to Growth
43
Future… Profitable Growth
Thank You!
Experience The Difference
44