Searchable text section of graphics shown above
[GRAPHIC]
3D Systems Corporation
Investor Day
New York, NY
January 11, 2006
| NASDAQ:TDSC | |
[LOGO] | www.3dsystems.com | Transform Your Products |
Experience the difference…
Forward-Looking Statements
Certain statements made in this release that are not statements of historical or current facts are forward-looking statements within the meaning of the Private Securities Litigation Reform Act of 1995. Forward-looking statements may involve known and unknown risks, uncertainties and other factors that may cause the actual results, performance or achievements of the Company to be materially different from historical results or from any future results expressed or implied by such forward-looking statements. In addition to statements which explicitly describe such risks and uncertainties, readers are urged to consider statements in the future or conditional tense or that include the terms “believes,” “belief,” “expects,” “intends,” “anticipates” or “plans” to be uncertain and forward-looking. Forward-looking statements may include comments as to the company’s beliefs and expectations as to future events and trends affecting its business. Forward-looking statements are based upon management’s current expectations concerning future events and trends and are necessarily subject to uncertainties, many of which are outside the control of the company. The factors stated under the heading “Forward-Looking Statements” and “Cautionary Statements and Risk Factors” in management’s discussion and analysis of results of operations and financial condition, which appear in the company’s periodic filings with the Securities and Exchange Commission, as well as other factors, could cause actual results to differ materially from those reflected or predicted in forward-looking statements.
© Copyright 2006 by 3D Systems Corporation. All rights reserved. 3D Systems, 3D logo, SLA, SLS, VisiJet, Sinterstation, Accura and DuraForm are registered trademarks and SLS, InVision, HiQ, Bluestone, LaserForm and VisiJet are trademarks of 3D Systems. All other product names or services mentioned are trademarks or registered trademarks of their respective companies.
[LOGO] | 3D Systems Corporation – Investor Day New York, 2006 | | Transform Your Products |
2
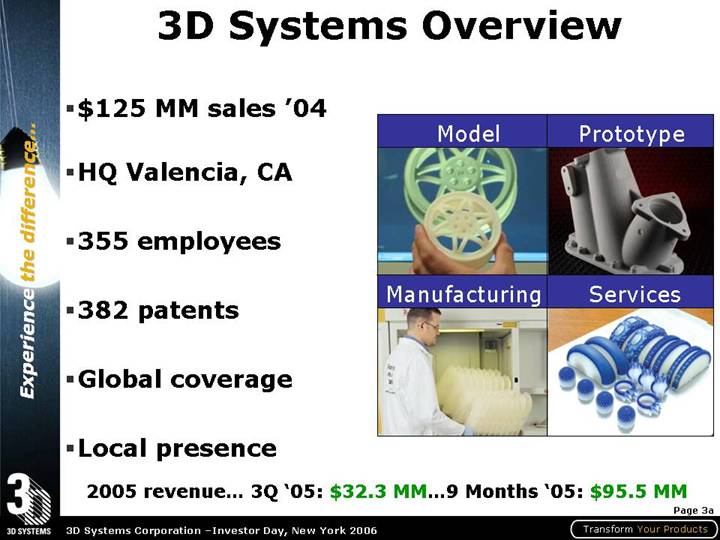
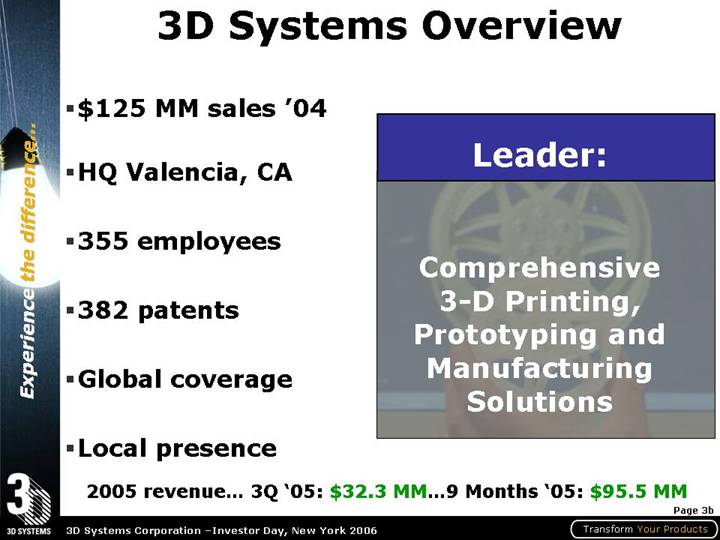
3D Systems Overview
• $125 MM sales ‘04
• HQ Valencia, CA
• 355 employees
• 382 patents
• Global coverage
• Local presence
Model
[GRAPHIC]
Prototype
[GRAPHIC]
Manufacturing
[GRAPHIC]
Services
[GRAPHIC]
2005 revenue… 3Q ‘05: $32.3 MM…9 Months ‘05: $95.5 MM
3a
• $125 MM sales ‘04
• HQ Valencia, CA
• 355 employees
• 382 patents
• Global coverage
• Local presence
[GRAPHIC]
Leader:
Comprehensive 3-D Printing, Prototyping and Manufacturing Solutions
2005 revenue… 3Q ‘05: $32.3 MM…9 Months ‘05: $95.5 MM
3b
• $125 MM sales ‘04
• HQ Valencia, CA
• 355 employees
• 382 patents
• Global coverage
• Local presence
[GRAPHIC]
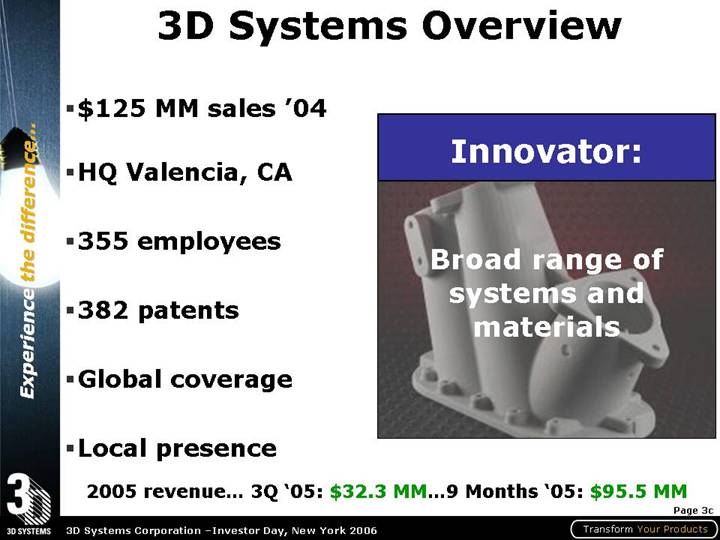
Innovator:
Broad range of systems and materials
2005 revenue… 3Q ‘05: $32.3 MM…9 Months ‘05: $95.5 MM
3c
• $125 MM sales ‘04
• HQ Valencia, CA
• 355 employees
• 382 patents
• Global coverage
• Local presence
[GRAPHIC]
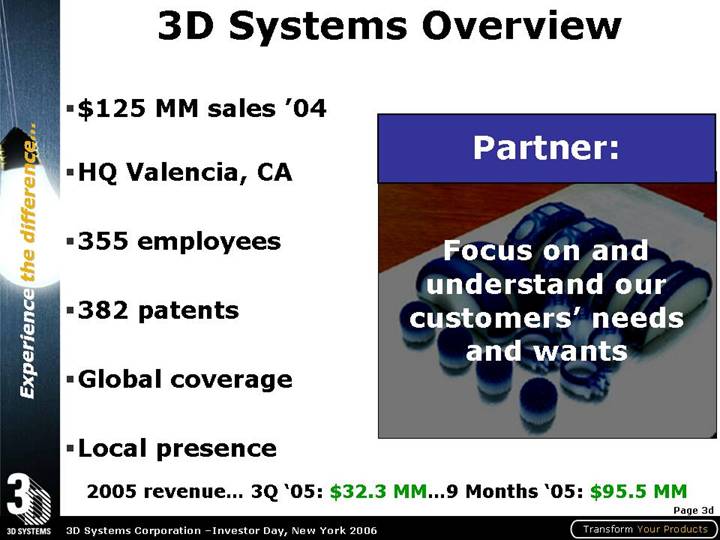
Partner:
Focus on and understand our customers’ needs and wants
2005 revenue… 3Q ‘05: $32.3 MM…9 Months ‘05: $95.5 MM
3d
• $125 MM sales ‘04
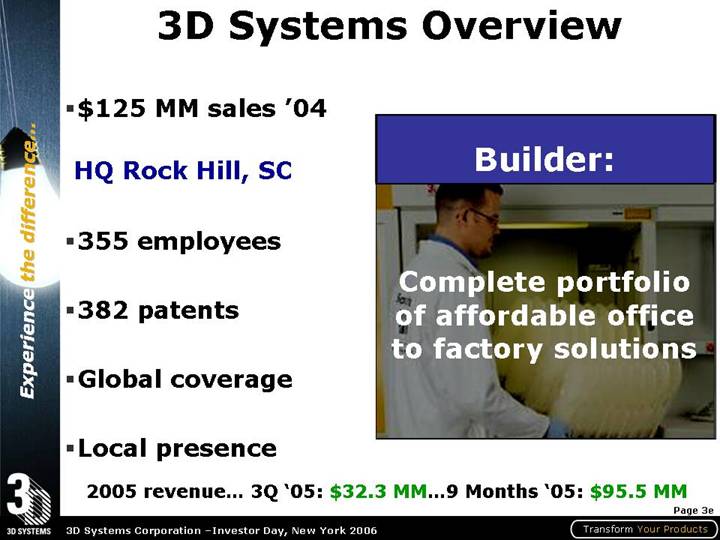
HQ Rock Hill, SC
• 355 employees
• 382 patents
• Global coverage
• Local presence
[GRAPHIC]
Builder:
Complete portfolio of affordable office to factory solutions
2005 revenue… 3Q ‘05: $32.3 MM…9 Months ‘05: $95.5 MM
3e
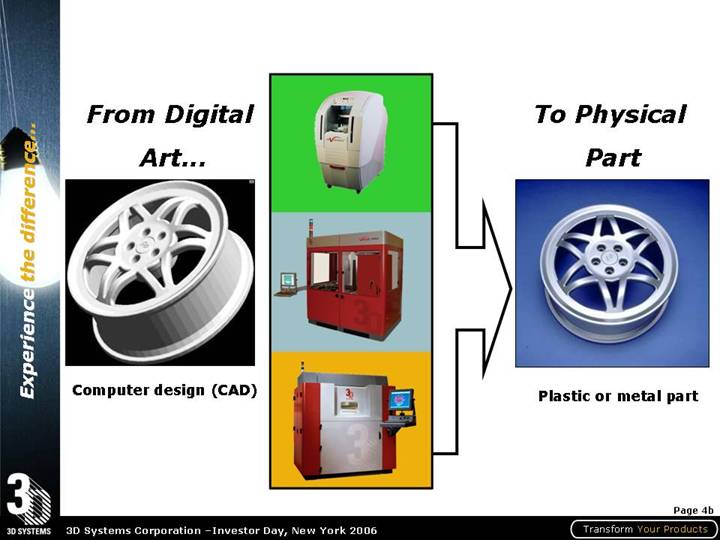
Cutting Edge Technology That Transforms The Way Companies Design, Develop and Manufacture New Products
4a
From Digital | [GRAPHIC] | To Physical |
Art... | | Part |
| | |
[GRAPHIC] | [GRAPHIC] | [GRAPHIC] |
| | |
Computer design (CAD) | | Plastic or metal part |
| [GRAPHIC] | |
4b
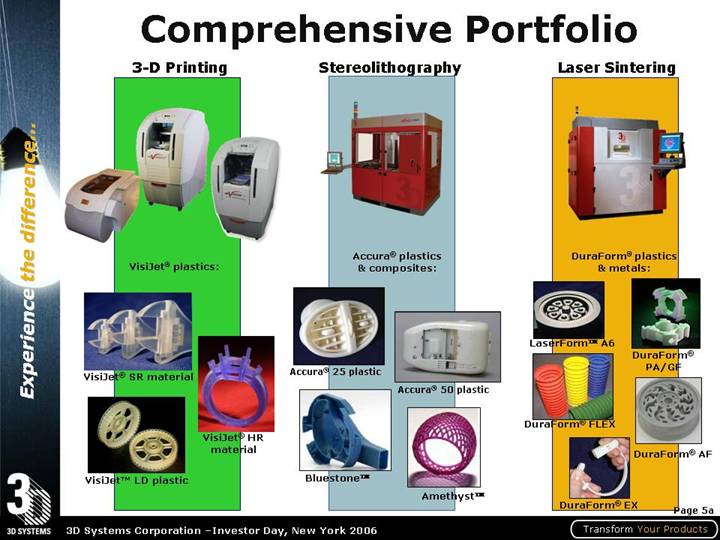
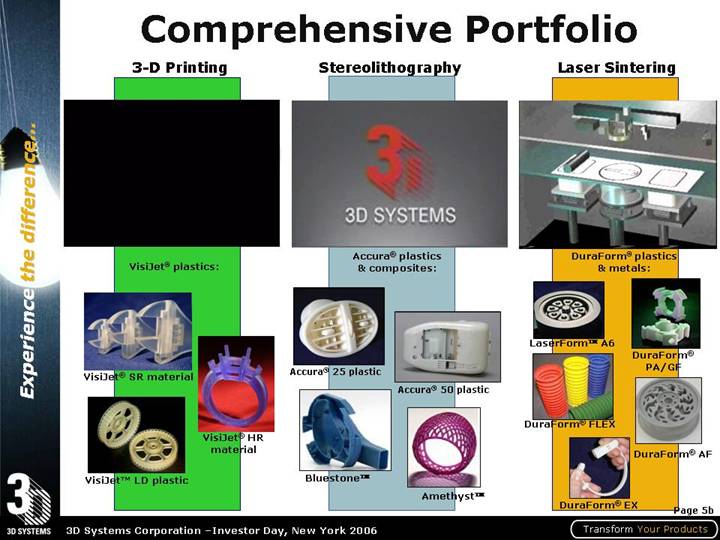
Comprehensive Portfolio
3-D Printing | Stereolithography | Laser Sintering |
| | |
[GRAPHIC] | [GRAPHIC] | [GRAPHIC] |
VisiJet® plastics: | Accura® plastics
& composites: | DuraForm® plastics
& metals: |
| | | | | |
[GRAPHIC] | | [GRAPHIC] | | [GRAPHIC] | |
VisiJet® SR material | | Accura® 25 plastic | [GRAPHIC] | LaserFormÔ A6 | [GRAPHIC] |
| [GRAPHIC] | | Accura® 50 plastic | | DuraForm® |
| VisiJet® HR | | | [GRAPHIC] | PA/GF |
[GRAPHIC] | material | [GRAPHIC] | | DuraForm® FLEX | |
VisiJet™ LD plastic | | BluestoneÔ | [GRAPHIC] | | [GRAPHIC] |
| | | AmethystÔ | [GRAPHIC] | DuraForm® AF |
| | | | DuraForm® EX | |
5a
3-D Printing | Stereolithography | Laser Sintering |
| | |
[GRAPHIC] | [GRAPHIC] | [GRAPHIC] |
| | |
VisiJet® plastics: | Accura® plastics
& composites: | DuraForm® plastics
& metals: |
| | | | | |
[GRAPHIC] | | [GRAPHIC] | | [GRAPHIC] | |
VisiJet® SR material | | Accura® 25 plastic | [GRAPHIC] | LaserFormÔ A6 | [GRAPHIC] |
| [GRAPHIC] | | Accura® 50 plastic | | DuraForm® |
| VisiJet® HR | | | [GRAPHIC] | PA/GF |
[GRAPHIC] | material | [GRAPHIC] | | DuraForm® FLEX | |
VisiJet™ LD plastic | | BluestoneÔ | [GRAPHIC] | | [GRAPHIC] |
| | | AmethystÔ | [GRAPHIC] | DuraForm® AF |
| | | | DuraForm® EX | |
5b
2004 Global Revenue — $125 Million
By Region
[CHART]
By Category
[CHART]
12
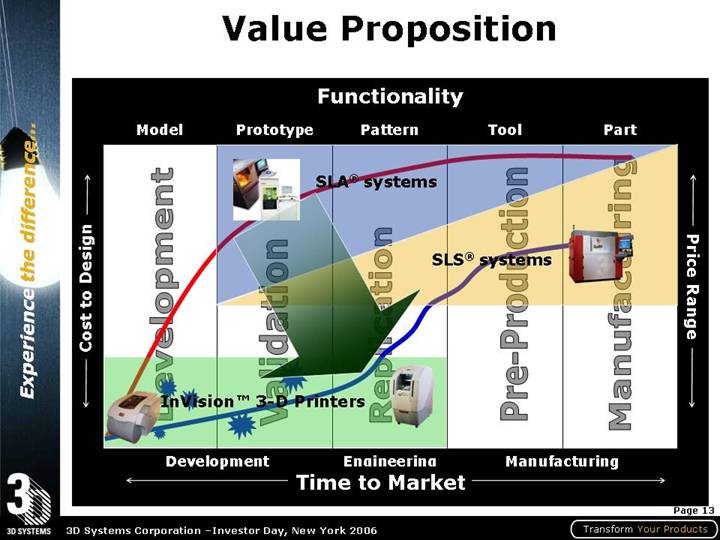
Value Proposition
[CHART]
13
Customer Value
• Reduce
• Design cost
• Manufacturing cost
• Cost of Goods
[CHART]
Profitability
• Reduce
• Time to design
• Time to production
• Time to market
[CHART]
Market Share
14
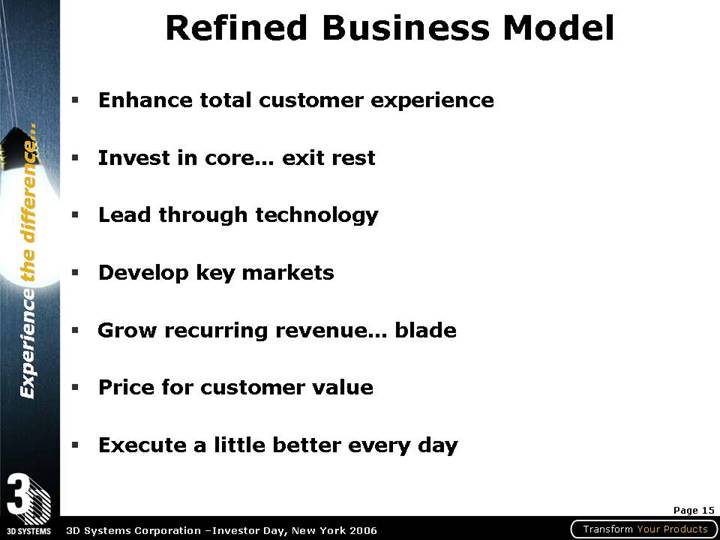
Refined Business Model
• Enhance total customer experience
• Invest in core… exit rest
• Lead through technology
• Develop key markets
• Grow recurring revenue… blade
• Price for customer value
• Execute a little better every day
15
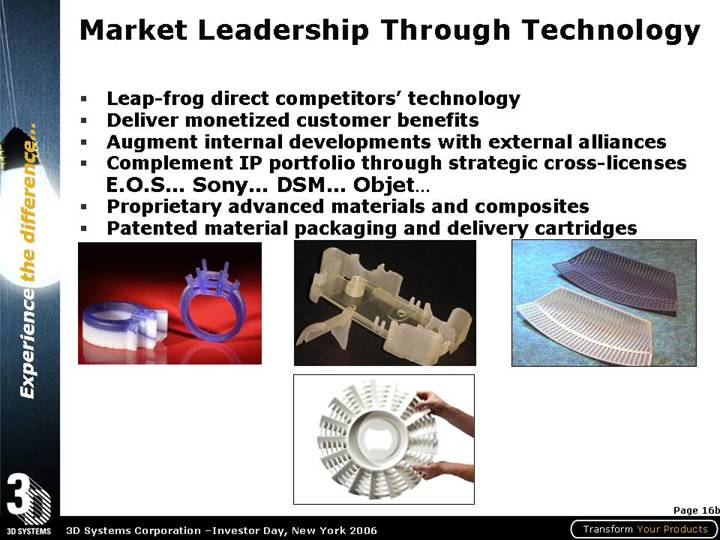
Market Leadership Through Technology
• Leap-frog direct competitors’ technology
• Deliver monetized customer benefits
• Augment internal developments with external alliances
• Complement IP portfolio through strategic cross-licenses
• Proprietary advanced materials and composites
• Patented material packaging and delivery cartridges
[GRAPHIC]
16a
• Leap-frog direct competitors’ technology
• Deliver monetized customer benefits
• Augment internal developments with external alliances
• Complement IP portfolio through strategic cross-licenses E.O.S… Sony… DSM… Objet…
• Proprietary advanced materials and composites
• Patented material packaging and delivery cartridges
[GRAPHIC]
16b
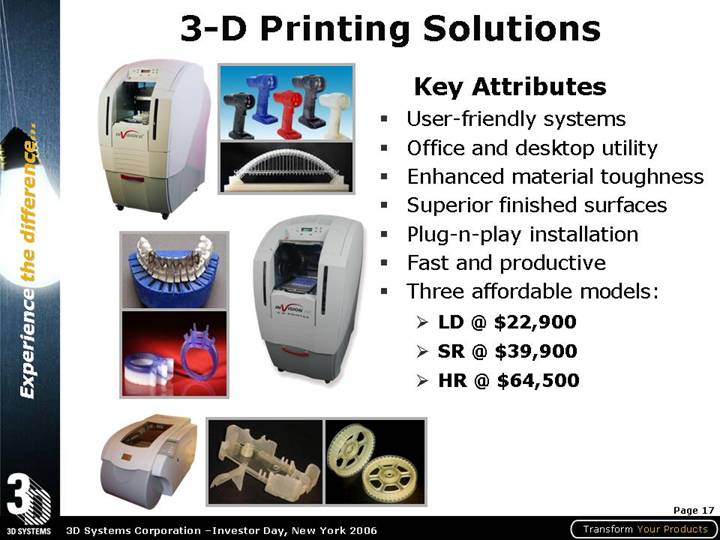
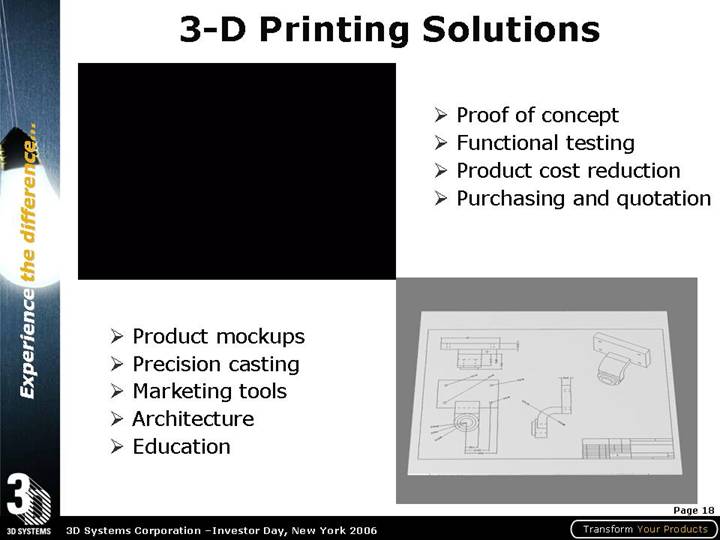
3-D Printing Solutions
[GRAPHIC]
Key Attributes
• User-friendly systems
• Office and desktop utility
• Enhanced material toughness
• Superior finished surfaces
• Plug-n-play installation
• Fast and productive
• Three affordable models:
• LD @ $22,900
• SR @ $39,900
• HR @ $64,500
17
[GRAPHIC]
• Proof of concept
• Functional testing
• Product cost reduction
• Purchasing and quotation
[GRAPHIC]
• Product mockups
• Precision casting
• Marketing tools
• Architecture
• Education
18
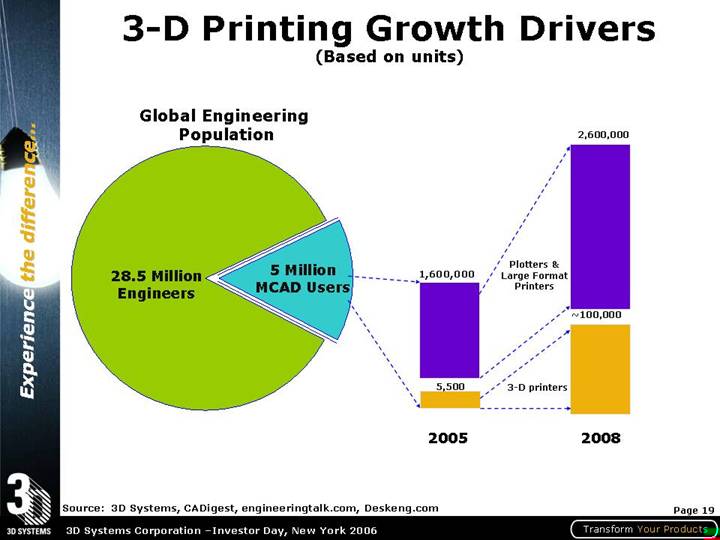
3-D Printing Growth Drivers
(Based on units)
Global Engineering
Population
[CHART]
Source: 3D Systems, CADigest, engineeringtalk.com, Deskeng.com
19
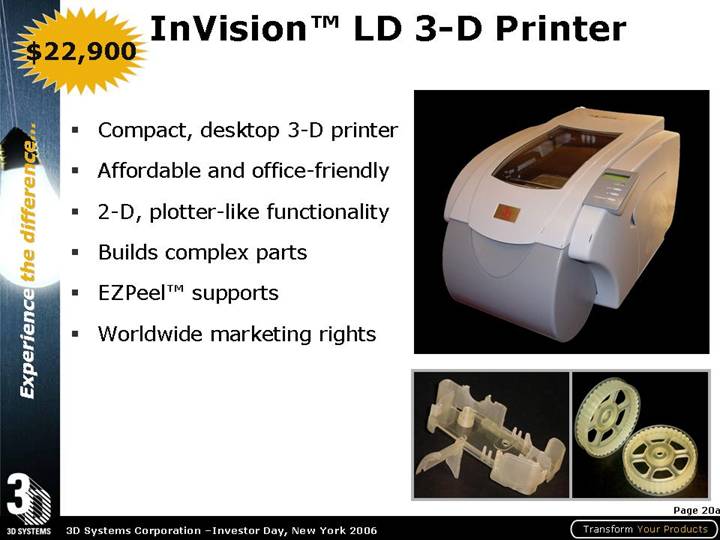
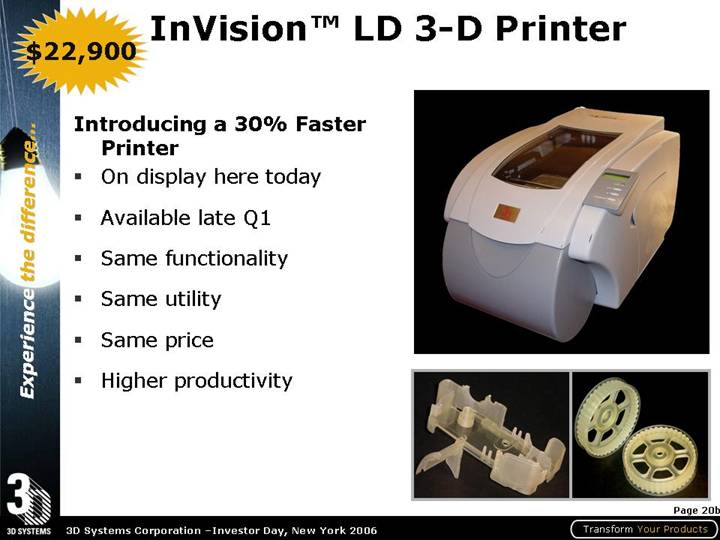
InVision™ LD 3-D Printer
$22,900
• Compact, desktop 3-D printer
• Affordable and office-friendly
• 2-D, plotter-like functionality
• Builds complex parts
• EZPeel™ supports
• Worldwide marketing rights
[GRAPHIC]
20a
Introducing a 30% Faster Printer
• On display here today
• Available late Q1
• Same functionality
• Same utility
• Same price
• Higher productivity
[GRAPHIC]
20b
New Vertical…Education
16 Colleges Purchased 3-D Printers
• Aiken Technical College
• Central Carolina Technical College
• Denmark Technical College
• Florence-Darlington Technical College
• Greenville Technical College
• Horry-Georgetown Technical College
• Midlands Technical College
• Northeastern Technical College
• Orangeburg-Calhoun Technical College
• Spartanburg Technical College
• Technical College of the Lowcountry
• Tri-county Technical College
• Trident Technical College
• Williamsburg Technical College
• York Technical College
• Winthrop University
[GRAPHIC]
21
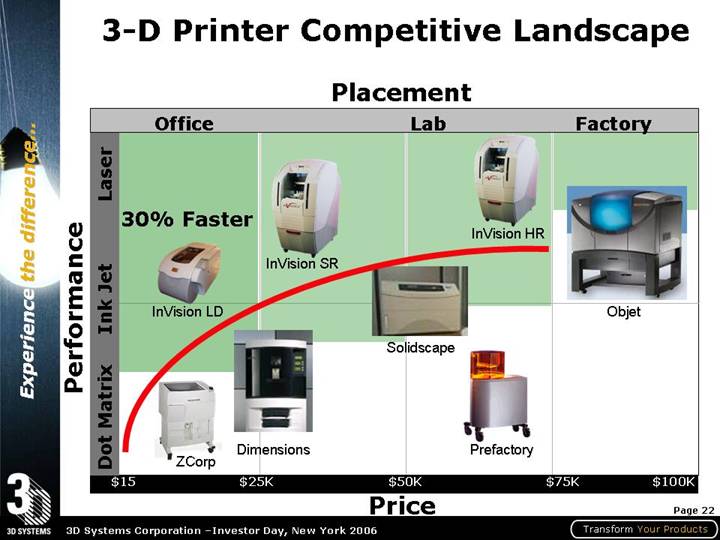
3-D Printer Competitive Landscape
[CHART]
22
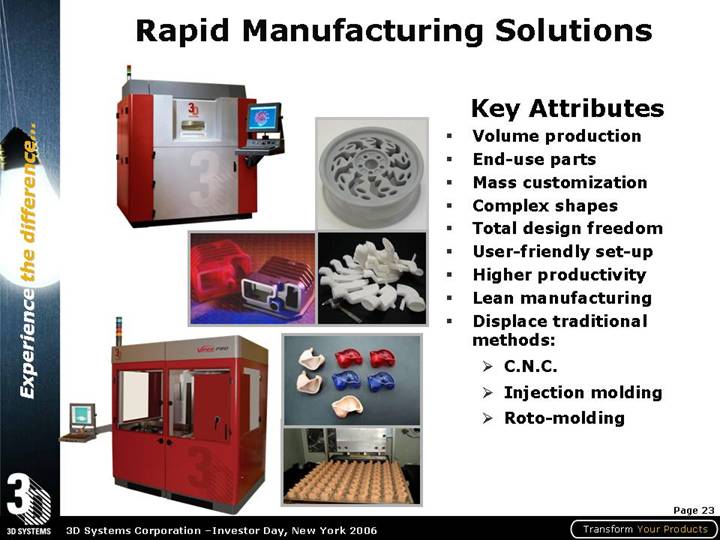
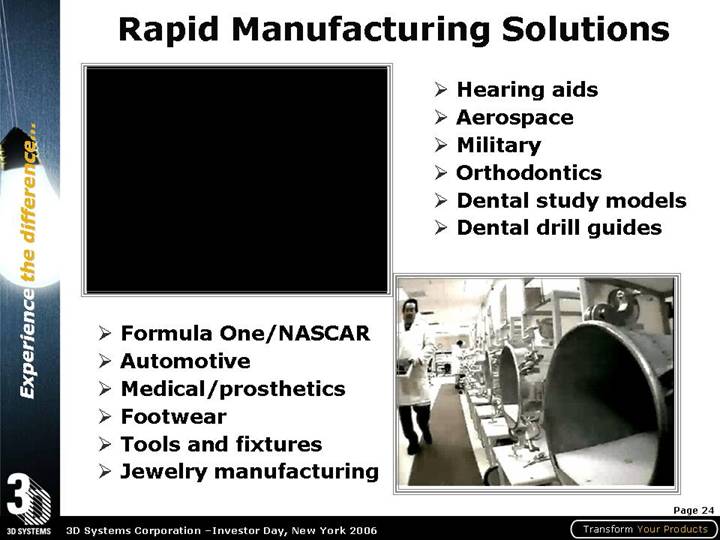
Rapid Manufacturing Solutions
[GRAPHIC]
Key Attributes
• Volume production
• End-use parts
• Mass customization
• Complex shapes
• Total design freedom
• User-friendly set-up
• Higher productivity
• Lean manufacturing
• Displace traditional methods:
• C.N.C.
• Injection molding
• Roto-molding
23
[GRAPHIC]
• Hearing aids
• Aerospace
• Military
• Orthodontics
• Dental study models
• Dental drill guides
[GRAPHIC]
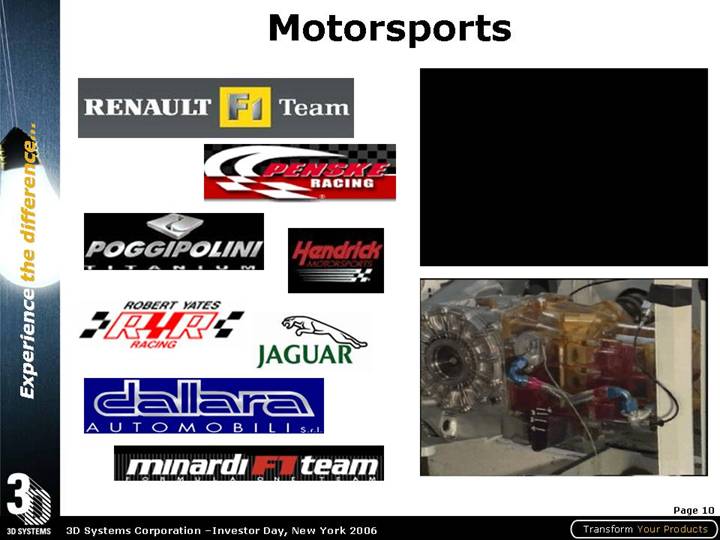
• Formula One/NASCAR
• Automotive
• Medical/prosthetics
• Footwear
• Tools and fixtures
• Jewelry manufacturing
24
Rapid Manufacturing Growth Drivers
(Based on $US)
Global CAPEX
Production Machinery
[CHART]
Source: 3D Systems and ARC Advisory Group
25
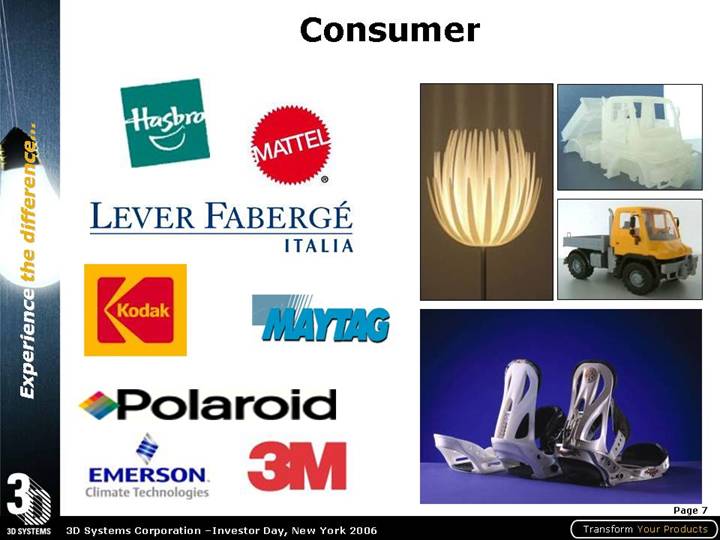
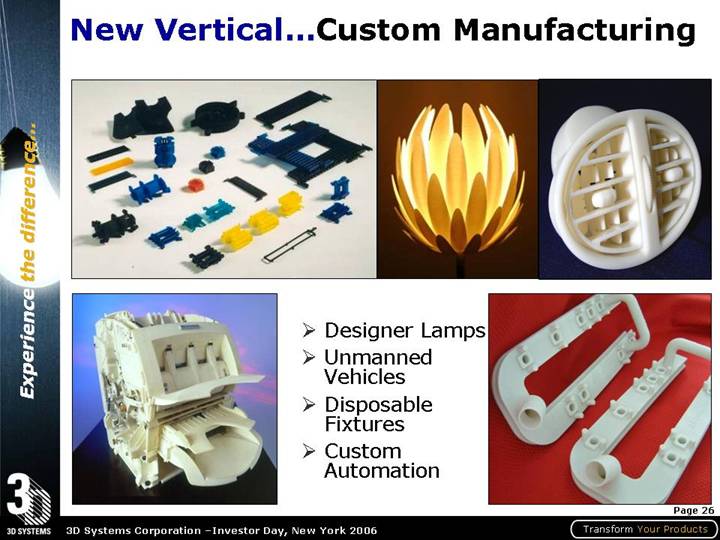
New Vertical…Custom Manufacturing
[GRAPHIC]
• Designer Lamps
• Unmanned Vehicles
• Disposable Fixtures
• Custom Automation
26
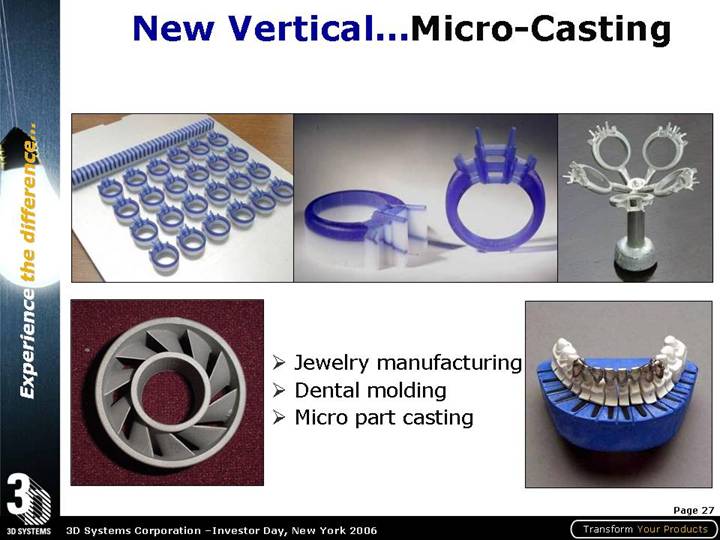
New Vertical…Micro-Casting
[GRAPHIC]
• Jewelry manufacturing
• Dental molding
• Micro part casting
27
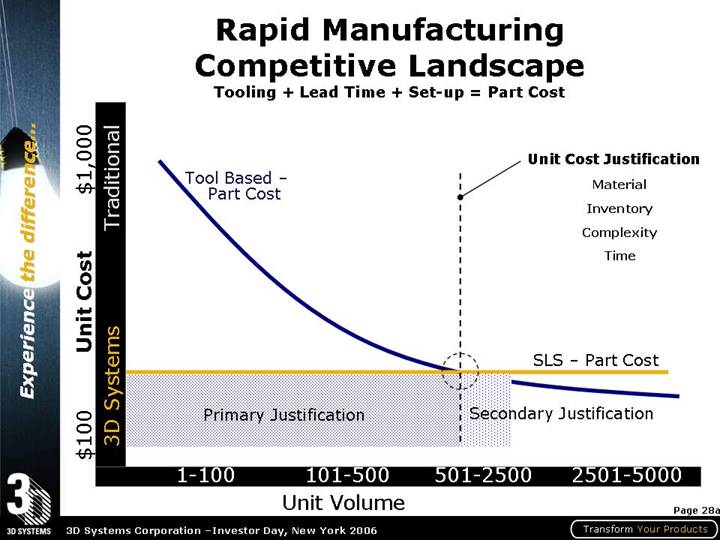
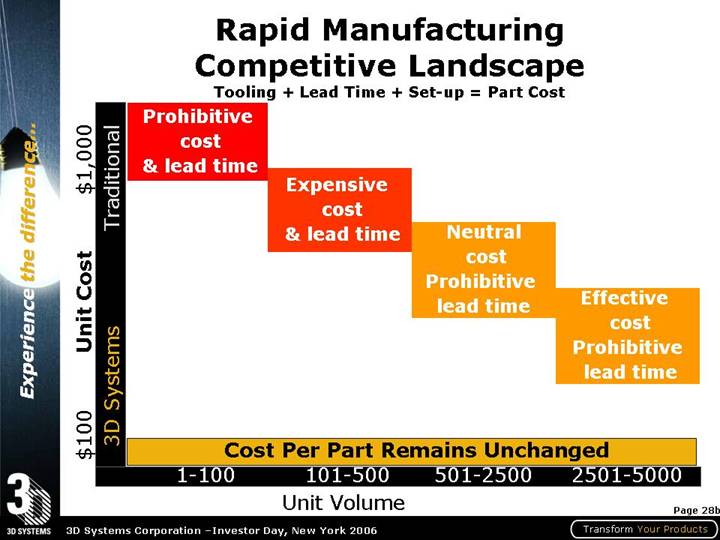
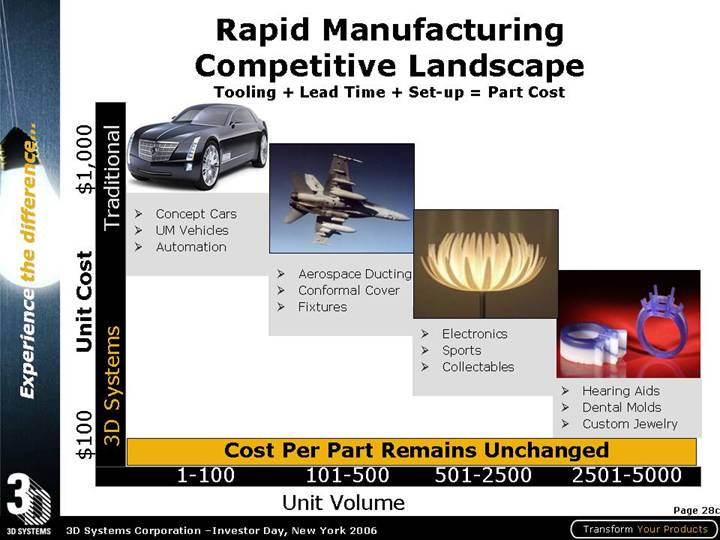
Rapid Manufacturing
Competitive Landscape
Tooling + Lead Time + Set-up = Part Cost
[CHART]
28a
[CHART]
[GRAPHIC]
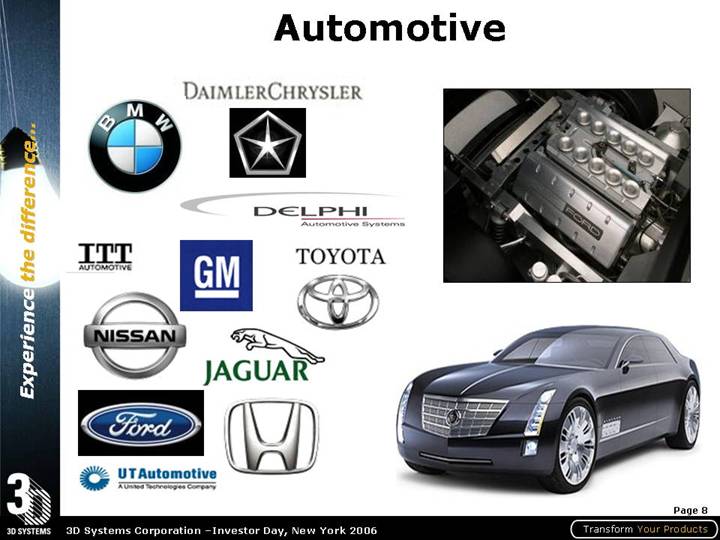
• Concept Cars
• UM Vehicles
• Automation
[GRAPHIC]
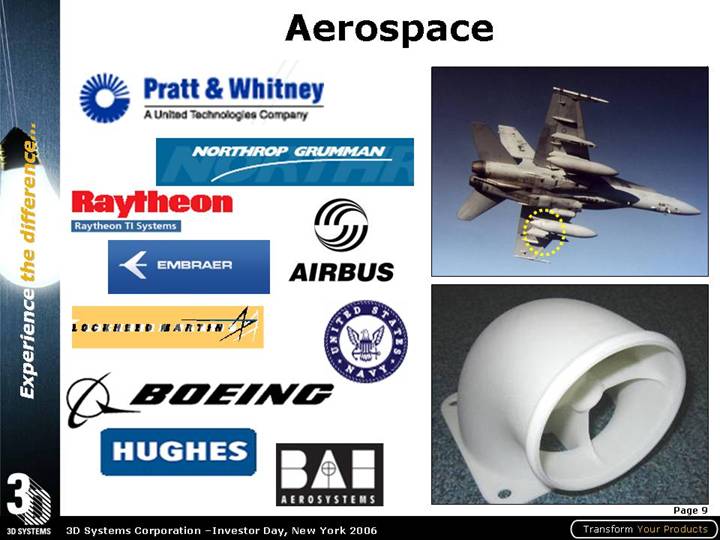
• Aerospace Ducting
• Conformal Cover
• Fixtures
[GRAPHIC]
• Electronics
• Sports
• Collectables
[GRAPHIC]
• Hearing Aids
• Dental Molds
• Custom Jewelry
28c
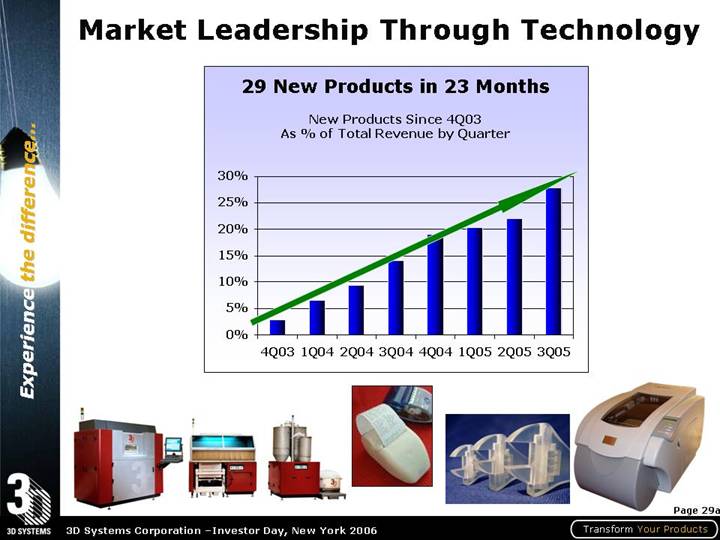
Market Leadership Through Technology
29 New Products in 23 Months
New Products Since 4Q03
As % of Total Revenue by Quarter
[CHART]
29a
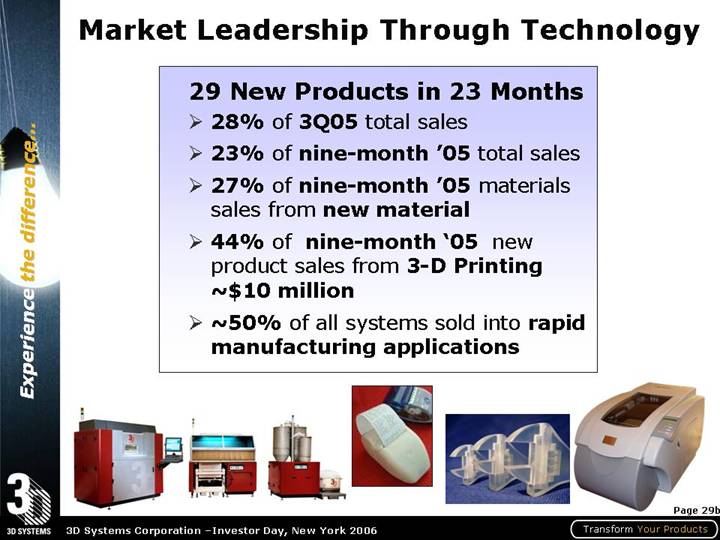
29 New Products in 23 Months
• 28% of 3Q05 total sales
• 23% of nine-month ‘05 total sales
• 27% of nine-month ‘05 materials sales from new material
• 44% of nine-month ‘05 new product sales from 3-D Printing ~$10 million
• ~50% of all systems sold into rapid manufacturing applications
[GRAPHIC]
29b
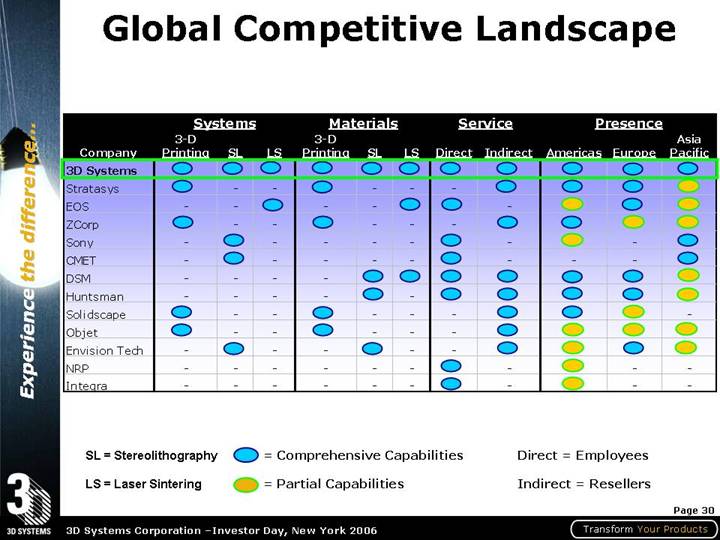
Global Competitive Landscape
| | Systems | | Materials | | Service | | Presence | |
Company | | 3-D
Printing | | SL | | LS | | 3-D
Printing | | SL | | LS | | Direct | | Indirect | | Americas | | Europe | | Asia
Pacific | |
3D Systems | | X | | X | | X | | X | | X | | X | | X | | X | | X | | X | | X | |
Stratasys | | X | | — | | — | | X | | — | | — | | — | | X | | X | | X | | Y | |
EOS | | — | | — | | X | | — | | — | | X | | X | | — | | Y | | X | | Y | |
ZCorp | | X | | — | | — | | X | | — | | — | | — | | X | | X | | Y | | Y | |
Sony | | — | | X | | — | | — | | — | | — | | X | | — | | Y | | — | | X | |
CMET | | — | | X | | — | | — | | — | | — | | X | | — | | — | | — | | X | |
DSM | | — | | — | | — | | — | | X | | X | | X | | X | | X | | X | | Y | |
Huntsman | | — | | — | | — | | — | | X | | — | | X | | X | | X | | X | | Y | |
Solidscape | | X | | — | | — | | X | | — | | — | | — | | X | | X | | Y | | — | |
Objet | | X | | — | | — | | X | | — | | — | | — | | X | | Y | | Y | | Y | |
Envision Tech | | — | | X | | — | | — | | X | | — | | — | | X | | Y | | X | | Y | |
NRP | | — | | — | | — | | — | | — | | — | | X | | — | | Y | | — | | — | |
Integra | | — | | — | | — | | — | | — | | — | | X | | — | | Y | | — | | — | |
SL = Stereolithography | | X = Comprehensive Capabilities | | Direct = Employees |
| | | | |
LS = Laser Sintering | | Y = Partial Capabilities | | Indirect = Resellers |
30
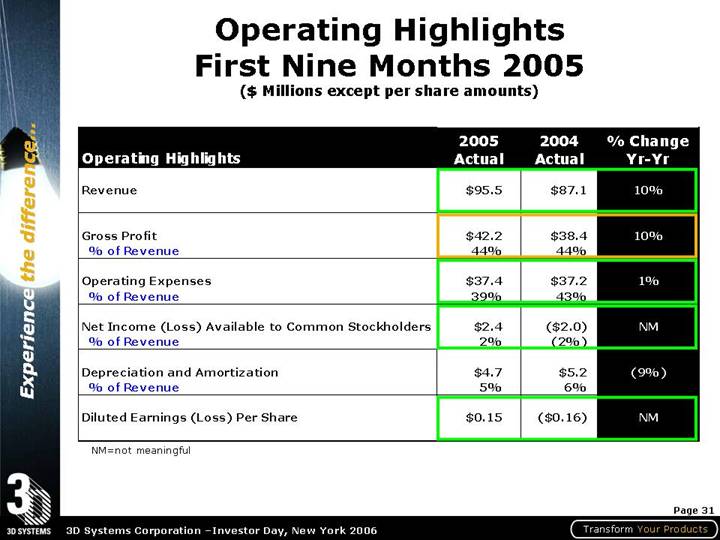
Operating Highlights
First Nine Months 2005
($ Millions except per share amounts)
| | 2005 | | 2004 | | % Change | |
Operating Highlights | | Actual | | Actual | | Yr-Yr | |
| | | | | | | |
Revenue | | $ | 95.5 | | $ | 87.1 | | 10 | % |
| | | | | | | |
Gross Profit | | $ | 42.2 | | $ | 38.4 | | 10 | % |
% of Revenue | | 44 | % | 44 | % | | |
| | | | | | | |
Operating Expenses | | $ | 37.4 | | $ | 37.2 | | 1 | % |
% of Revenue | | 39 | % | 43 | % | | |
| | | | | | | |
Net Income (Loss) Available to Common Stockholders | | $ | 2.4 | | $ | (2.0 | ) | NM | |
% of Revenue | | 2 | % | (2 | )% | | |
| | | | | | | |
Depreciation and Amortization | | $ | 4.7 | | $ | 5.2 | | (9 | )% |
% of Revenue | | 5 | % | 6 | % | | |
| | | | | | | |
Diluted Earnings (Loss) Per Share | | $ | 0.15 | | $ | (0.16 | ) | NM | |
NM=not meaningful
31
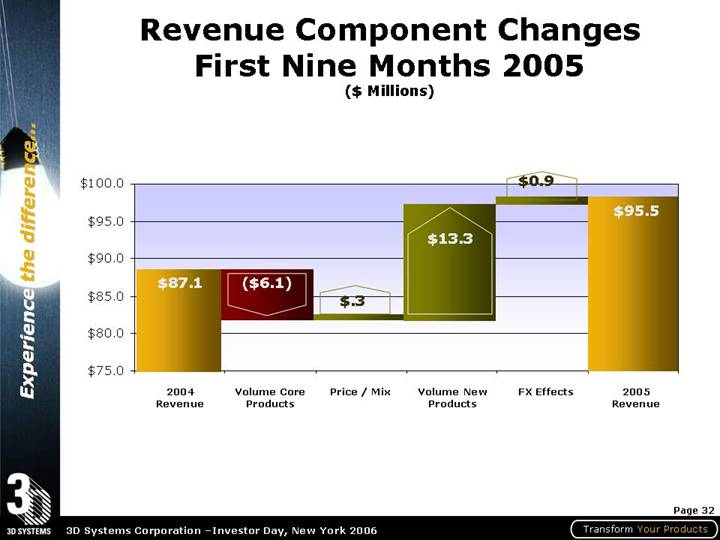
Revenue Component Changes
First Nine Months 2005
($ Millions)
[CHART]
32
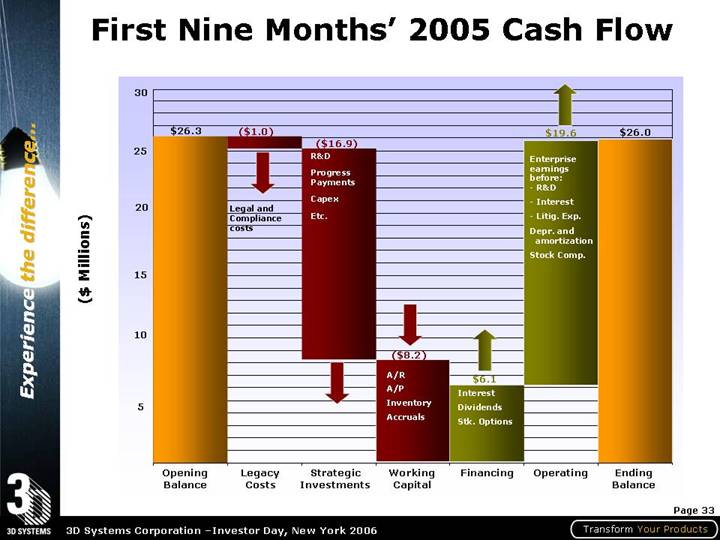
First Nine Months’ 2005 Cash Flow
[CHART]
33
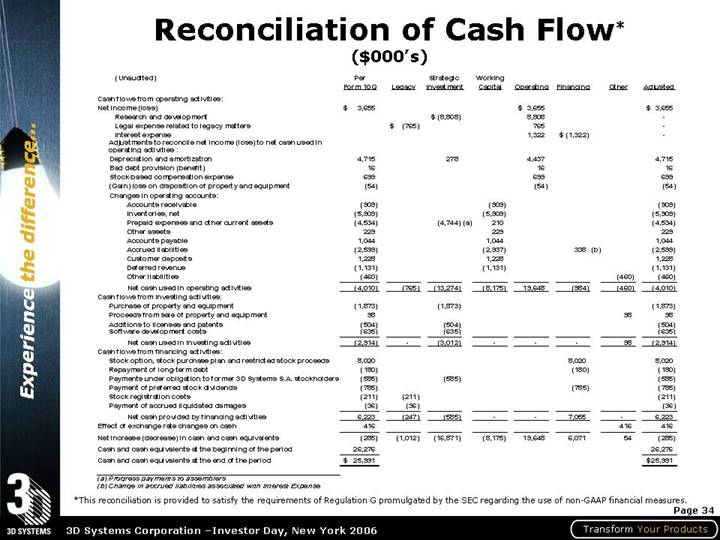
Reconciliation of Cash Flow*
($000’s)
| | Per | | | | Strategic | | Working | | | | | | | | | |
(Unaudited) | | Form 10Q | | Legacy | | Investment | | Capital | | Operating | | Financing | | Other | | Adjusted | |
Cash flows from operating activities: | | | | | | | | | | | | | | | | | |
Net income (loss) | | $ | 3,655 | | | | | | | | $ | 3,655 | | | | | | $ | 3,655 | |
Research and development | | | | | | $ | (8,808 | ) | | | 8,808 | | | | | | — | |
Legal expense related to legacy matters | | | | $ | (765 | ) | | | | | 765 | | | | | | — | |
Interest expense | | | | | | | | | | 1,322 | | $ | (1,322 | ) | | | — | |
Adjustments to reconcile net income (loss) to net cash used in operating activities : | | | | | | | | | | | | | | | | | |
Depreciation and amortization | | 4,715 | | | | 278 | | | | 4,437 | | | | | | 4,715 | |
Bad debt provision (benefit) | | 16 | | | | | | | | 16 | | | | | | 16 | |
Stock-based compensation expense | | 699 | | | | | | | | 699 | | | | | | 699 | |
(Gain) loss on disposition of property and equipment | | (54 | ) | | | | | | | (54 | ) | | | | | (54 | ) |
Changes in operating accounts: | | | | | | | | | | | | | | | | | |
Accounts receivable | | (909 | ) | | | | | (909 | ) | | | | | | | (909 | ) |
Inventories, net | | (5,909 | ) | | | | | (5,909 | ) | | | | | | | (5,909 | ) |
Prepaid expenses and other current assets | | (4,534 | ) | | | (4,744 | )(a) | 210 | | | | | | | | (4,534 | ) |
Other assets | | 229 | | | | | | 229 | | | | | | | | 229 | |
Accounts payable | | 1,044 | | | | | | 1,044 | | | | | | | | 1,044 | |
Accrued liabilities | | (2,599 | ) | | | | | (2,937 | ) | | | 338 | (b) | | | (2,599 | ) |
Customer deposits | | 1,228 | | | | | | 1,228 | | | | | | | | 1,228 | |
Deferred revenue | | (1,131 | ) | | | | | (1,131 | ) | | | | | | | (1,131 | ) |
Other liabilities | | (460 | ) | | | | | | | | | | | (460 | ) | (460 | ) |
Net cash used in operating activities | | (4,010 | ) | (765 | ) | (13,274 | ) | (8,175 | ) | 19,648 | | (984 | ) | (460 | ) | (4,010 | ) |
Cash flows from investing activities: | | | | | | | | | | | | | | | | | |
Purchase of property and equipment | | (1,873 | ) | | | (1,873 | ) | | | | | | | | | (1,873 | ) |
Proceeds from sale of property and equipment | | 98 | | | | | | | | | | | | 98 | | 98 | |
Additions to licenses and patents | | (504 | ) | | | (504 | ) | | | | | | | | | (504 | ) |
Software development costs | | (635 | ) | | | (635 | ) | | | | | | | | | (635 | ) |
Net cash used in investing activities | | (2,914 | ) | — | | (3,012 | ) | — | | — | | — | | 98 | | (2,914 | ) |
Cash flows from financing activities: | | | | | | | | | | | | | | | | | |
Stock option, stock purchase plan and restricted stock proceeds | | 8,020 | | | | | | | | | | 8,020 | | | | 8,020 | |
Repayment of long-term debt | | (180 | ) | | | | | | | | | (180 | ) | | | (180 | ) |
Payments under obligation to former 3D Systems S.A. stockholders | | (585 | ) | | | (585 | ) | | | | | | | | | (585 | ) |
Payment of preferred stock dividends | | (785 | ) | | | | | | | | | (785 | ) | | | (785 | ) |
Stock registration costs | | (211 | ) | (211 | ) | | | | | | | | | | | (211 | ) |
Payment of accrued liquidated damages | | (36 | ) | (36 | ) | | | | | | | | | | | (36 | ) |
Net cash provided by financing activities | | 6,223 | | (247 | ) | (585 | ) | — | | — | | 7,055 | | — | | 6,223 | |
Effect of exchange rate changes on cash | | 416 | | | | | | | | | | | | 416 | | 416 | |
Net increase (decrease) in cash and cash equivalents | | (285 | ) | (1,012 | ) | (16,871 | ) | (8,175 | ) | 19,648 | | 6,071 | | 54 | | (285 | ) |
Cash and cash equivalents at the beginning of the period | | 26,276 | | | | | | | | | | | | | | 26,276 | |
Cash and cash equivalents at the end of the period | | $ | 25,991 | | | | | | | | | | | | | | $ | 25,991 | |
| | | | | | | | | | | | | | | | | | | | | | | |
(a) Progress payments to assemblers
(b) Change in accrued liabilities associated with Interest Expense
*This reconciliation is provided to satisfy the requirements of Regulation G promulgated by the SEC regarding the use of non-GAAP financial measures.
34
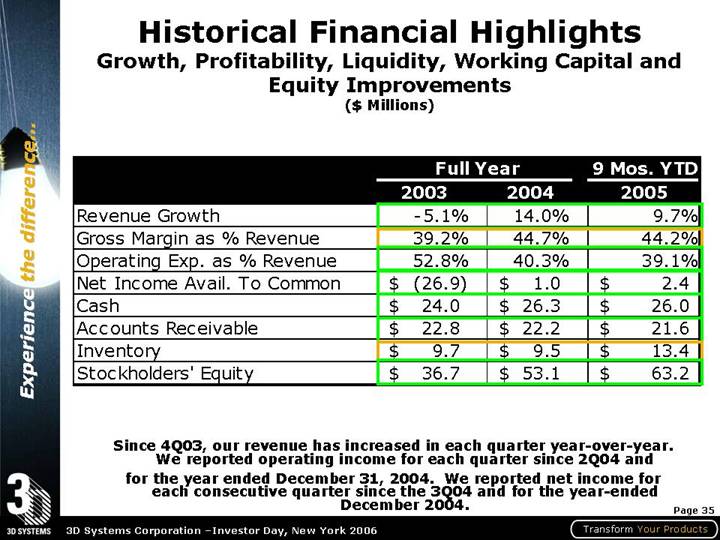
Historical Financial Highlights
Growth, Profitability, Liquidity, Working Capital and Equity Improvements
($ Millions)
| | Full Year | | 9 Mos. YTD | |
| | 2003 | | 2004 | | 2005 | |
Revenue Growth | | -5.1 | % | 14.0 | % | 9.7 | % |
Gross Margin as % Revenue | | 39.2 | % | 44.7 | % | 44.2 | % |
Operating Exp. as % Revenue | | 52.8 | % | 40.3 | % | 39.1 | % |
Net Income Avail. To Common | | $ | (26.9 | ) | $ | 1.0 | | $ | 2.4 | |
Cash | | $ | 24.0 | | $ | 26.3 | | $ | 26.0 | |
Accounts Receivable | | $ | 22.8 | | $ | 22.2 | | $ | 21.6 | |
Inventory | | $ | 9.7 | | $ | 9.5 | | $ | 13.4 | |
Stockholders’ Equity | | $ | 36.7 | | $ | 53.1 | | $ | 63.2 | |
Since 4Q03, our revenue has increased in each quarter year-over-year. We reported operating income for each quarter since 2Q04 and for the year ended December 31, 2004. We reported net income for each consecutive quarter since the 3Q04 and for the year-ended December 2004.
35
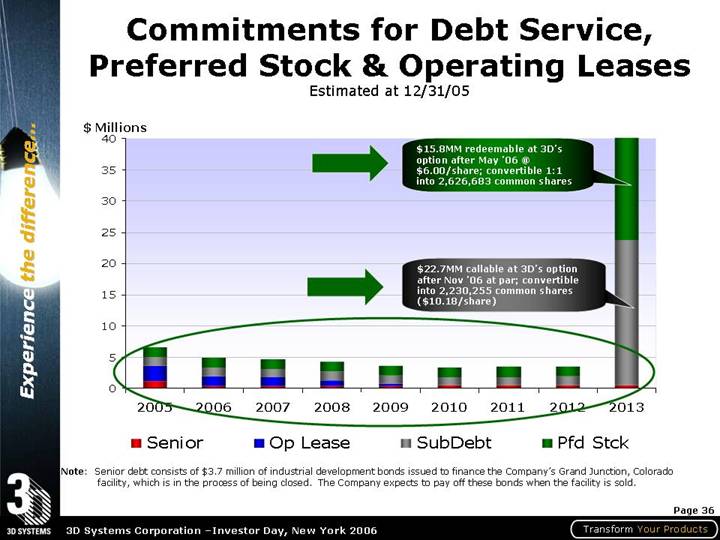
Commitments for Debt Service, Preferred Stock & Operating Leases
Estimated at 12/31/05
[CHART]
Note: Senior debt consists of $3.7 million of industrial development bonds issued to finance the Company’s Grand Junction, Colorado facility, which is in the process of being closed. The Company expects to pay off these bonds when the facility is sold.
36
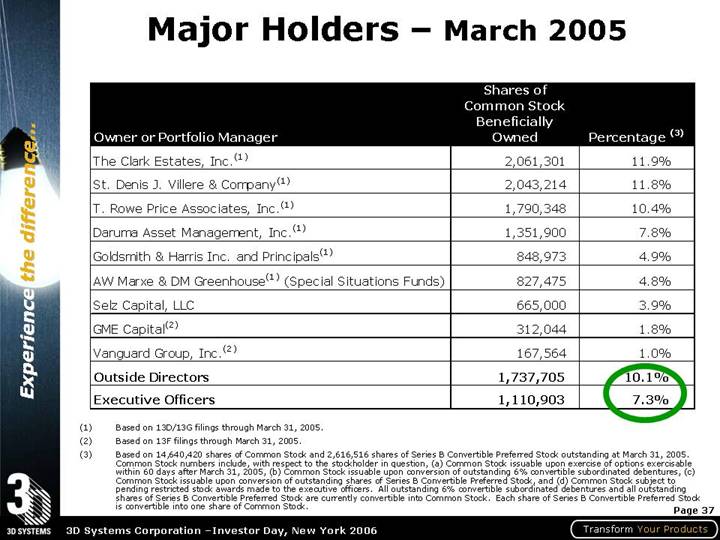
Major Holders – March 2005
Owner or Portfolio Manager | | Shares of
Common Stock
Beneficially
Owned | | Percentage (3) | |
The Clark Estates, Inc.(1) | | 2,061,301 | | 11.9 | % |
St. Denis J. Villere & Company(1) | | 2,043,214 | | 11.8 | % |
T. Rowe Price Associates, Inc.(1) | | 1,790,348 | | 10.4 | % |
Daruma Asset Management, Inc.(1) | | 1,351,900 | | 7.8 | % |
Goldsmith & Harris Inc. and Principals(1) | | 848,973 | | 4.9 | % |
AW Marxe & DM Greenhouse(1) (Special Situations Funds) | | 827,475 | | 4.8 | % |
Selz Capital, LLC | | 665,000 | | 3.9 | % |
GME Capital(2) | | 312,044 | | 1.8 | % |
Vanguard Group, Inc.(2) | | 167,564 | | 1.0 | % |
Outside Directors | | 1,737,705 | | 10.1 | % |
Executive Officers | | 1,110,903 | | 7.3 | % |
(1) Based on 13D/13G filings through March 31, 2005.
(2) Based on 13F filings through March 31, 2005.
(3) Based on 14,640,420 shares of Common Stock and 2,616,516 shares of Series B Convertible Preferred Stock outstanding at March 31, 2005. Common Stock numbers include, with respect to the stockholder in question, (a) Common Stock issuable upon exercise of options exercisable within 60 days after March 31, 2005, (b) Common Stock issuable upon conversion of outstanding 6% convertible subordinated debentures, (c) Common Stock issuable upon conversion of outstanding shares of Series B Convertible Preferred Stock, and (d) Common Stock subject to pending restricted stock awards made to the executive officers. All outstanding 6% convertible subordinated debentures and all outstanding shares of Series B Convertible Preferred Stock are currently convertible into Common Stock. Each share of Series B Convertible Preferred Stock is convertible into one share of Common Stock.
37
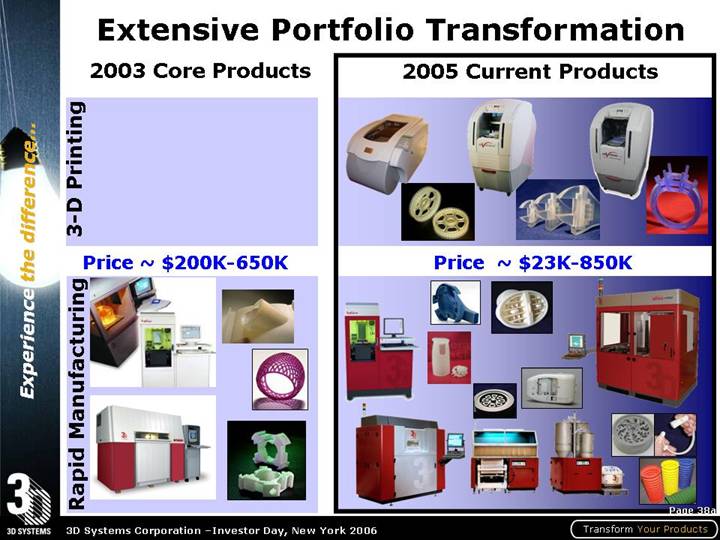
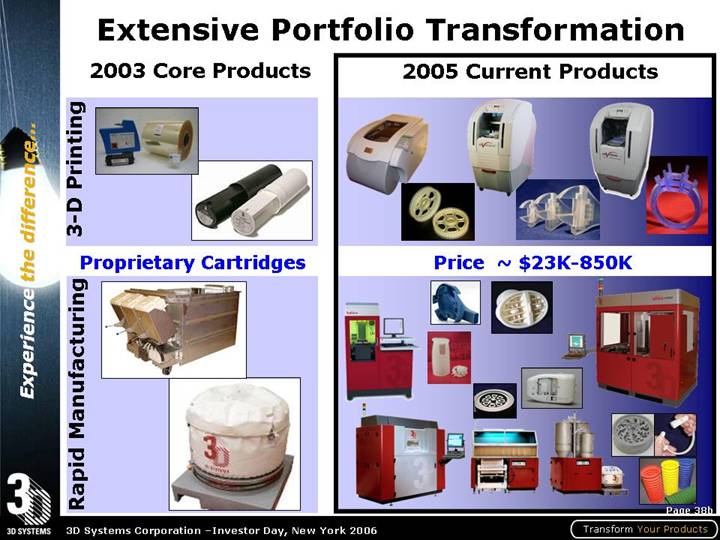
Extensive Portfolio Transformation
2003 Core Products | | | | 2005 Current Products |
| | | | |
3-D Printing | | | | [GRAPHIC] |
| | | | |
Price ~ $200K-650K | | | | Price ~ $23K-850K |
| | | | |
Rapid Manufacturing | | | | [GRAPHIC] |
[GRAPHIC] | | | | |
38a
2003 Core Products | | | | 2005 Current Products |
| | | | |
3-D Printing | | | | [GRAPHIC] |
[GRAPHIC] | | | | |
| | | | |
Proprietary Cartridges | | | | Price ~ $23K-850K |
| | | | |
Rapid Manufacturing | | | | [GRAPHIC] |
[GRAPHIC] | | | | |
38b
Technology Driven Business Development… and Results
Kevin McAlea
Vice-President Global Marketing
39
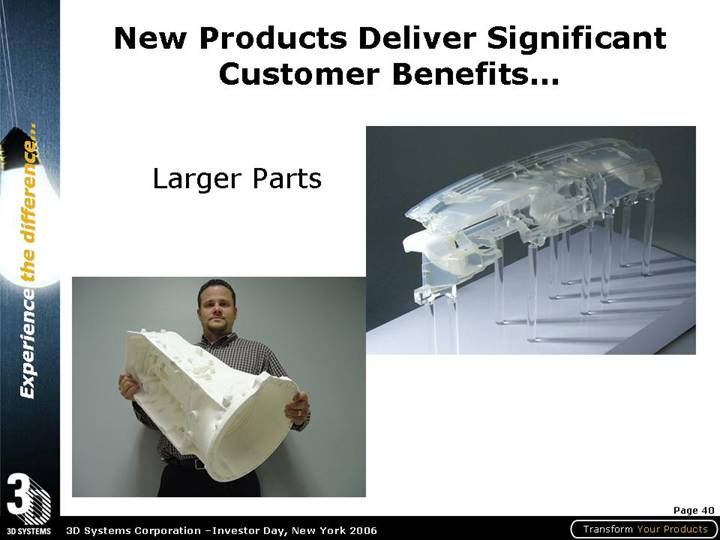
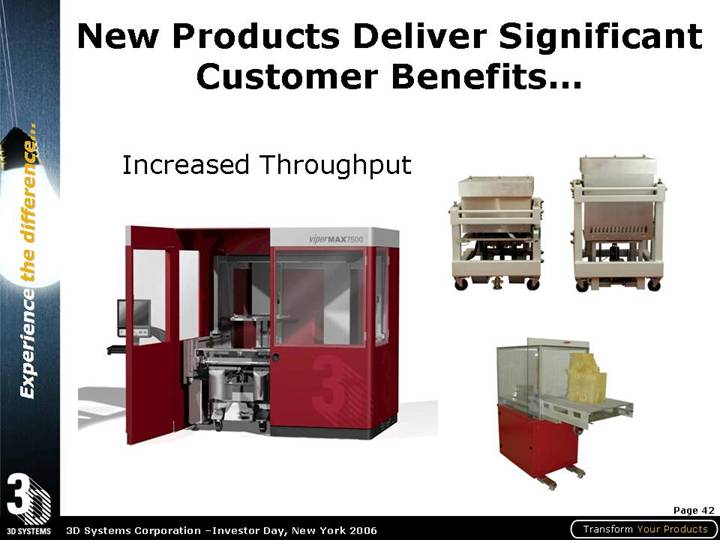
New Products Deliver Significant Customer Benefits…
Larger Parts
[GRAPHIC]
40
More Accurate Parts
[GRAPHIC]
41
Increased Throughput
[GRAPHIC]
42
More Materials
[GRAPHIC]
Better Materials Utilization
[GRAPHIC]
43
• Reduced part cost
• Improved part functionality
• More applications
• New business opportunities
44
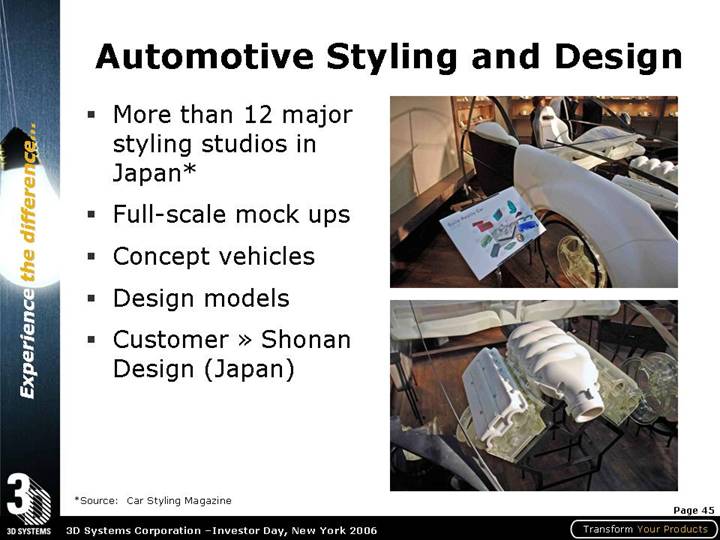
Automotive Styling and Design
• More than 12 major styling studios in Japan*
• Full-scale mock ups
• Concept vehicles
• Design models
• Customer » Shonan Design (Japan)
[GRAPHIC]
*Source: Car Styling Magazine
45
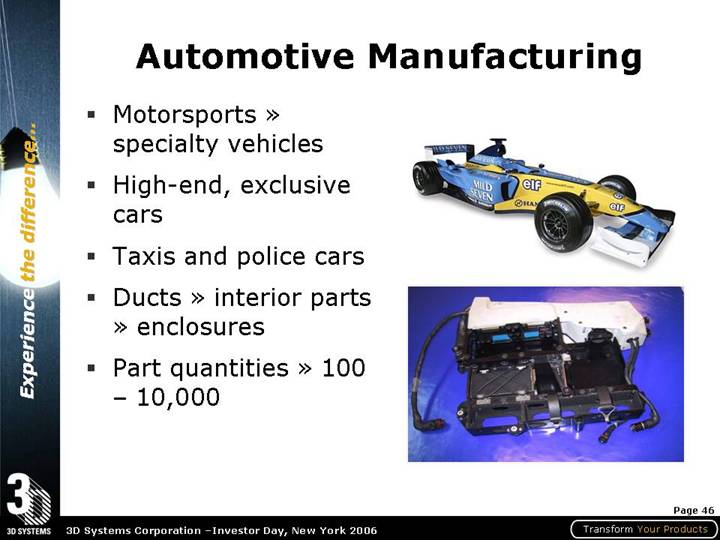
Automotive Manufacturing
• Motorsports » specialty vehicles
• High-end, exclusive cars
• Taxis and police cars
• Ducts » interior parts » enclosures
• Part quantities » 100 – 10,000
[GRAPHIC]
46
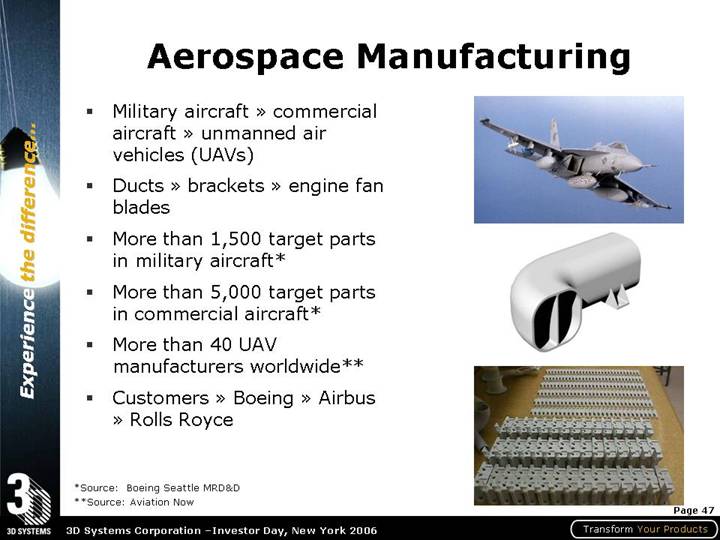
Aerospace Manufacturing
• Military aircraft » commercial aircraft » unmanned air vehicles (UAVs)
• Ducts » brackets » engine fan blades
• More than 1,500 target parts in military aircraft*
• More than 5,000 target parts in commercial aircraft*
• More than 40 UAV manufacturers worldwide**
• Customers » Boeing » Airbus » Rolls Royce
[GRAPHIC]
*Source: Boeing Seattle MRD&D
**Source: Aviation Now
47
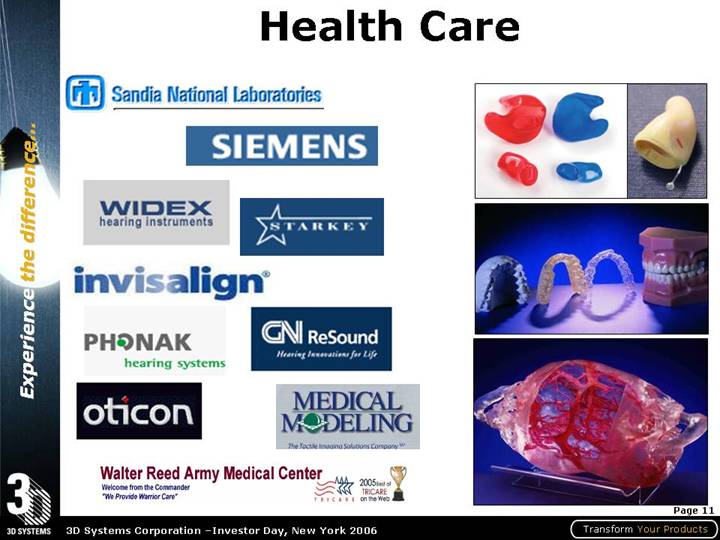
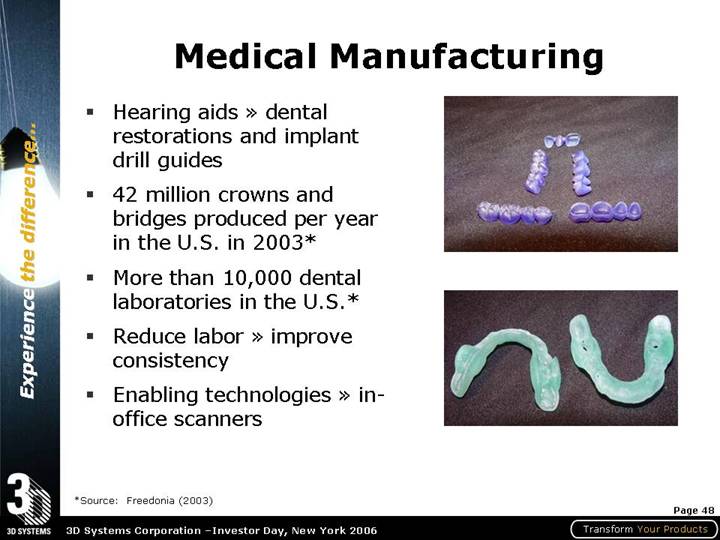
Medical Manufacturing
• Hearing aids » dental restorations and implant drill guides
• 42 million crowns and bridges produced per year in the U.S. in 2003*
• More than 10,000 dental laboratories in the U.S.*
• Reduce labor » improve consistency
• Enabling technologies » in-office scanners
[GRAPHIC]
*Source: Freedonia (2003)
48
Customized Machinery
• More than 400 packaging machinery companies in the U.S.*
• Pharmaceutical packaging
• Customized feed wheels and tubes
• Difficult-to-manufacture parts
[GRAPHIC]
*Source: D&B (SIC 3565)
49
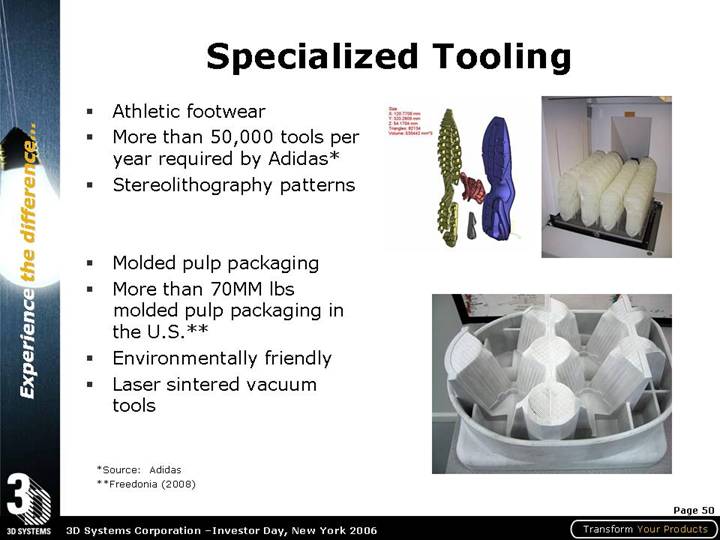
Specialized Tooling
• Athletic footwear
• More than 50,000 tools per year required by Adidas*
• Stereolithography patterns
• Molded pulp packaging
• More than 70MM lbs molded pulp packaging in the U.S.**
• Environmentally friendly
• Laser sintered vacuum tools
[GRAPHIC]
*Source: Adidas
**Freedonia (2008)
50
Machine and Molding Shops
• More than 7,000 machine and molding shops in the U.S.*
• 35% of production runs less than 1,000 parts/assemblies**
• Pro systems » competitive advantage » broader solutions
• Customer » Butler Tool (U.S.)
[GRAPHIC]
*Source: D&B (SIC 3543 and 3089)
**Source: Assembly Magazine (2004)
51
HQ Relocation/Consolidation
Key Objectives:
• Centralize HQ and operations
• 3D Systems University
• Rapid Manufacturing Center
• Advanced Research and Development Center
• Do more with less…half the current space
• Improve work force affordability and availability
• Obtain attractive incentives
Estimated Investment:
• In the range of $8.3 to $10.0 million
• Expect $3.5 to $6.5 million proceeds from GJ facility disposition
Anticipated Savings:
• Expect first full year (2007) savings of $2.5 million
• Lower personnel-related and occupancy costs
• Job development credits
52
Site Selection Criteria
- - Grounded in Our Priorities -
• Quality — People and Opportunities
• Rated in the top 10 metros for business expansion by major global companies
• Employment Conditions — Performance Culture
• Center for accelerated learning and training
• Transportation — Customers’ Success
• Accessibility to major markets
• Proximity to key customers
• Operating Costs — Cash Flow and ROA
• Competitive domestically and internationally
53
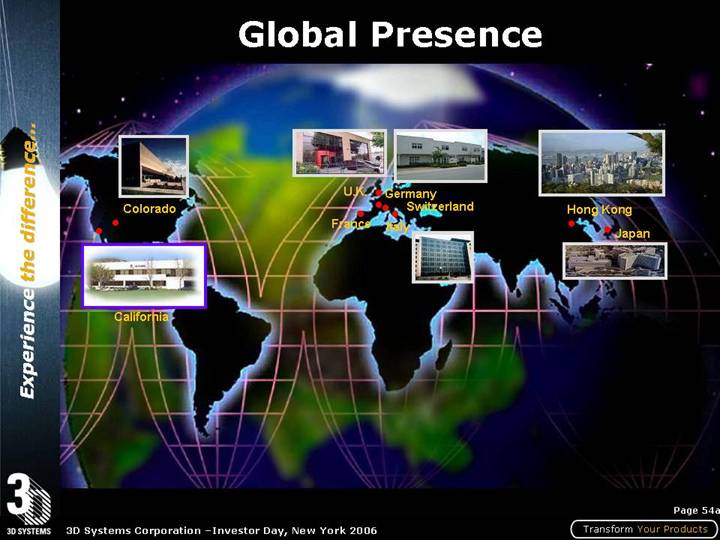
Global Presence
[GRAPHIC]
54a
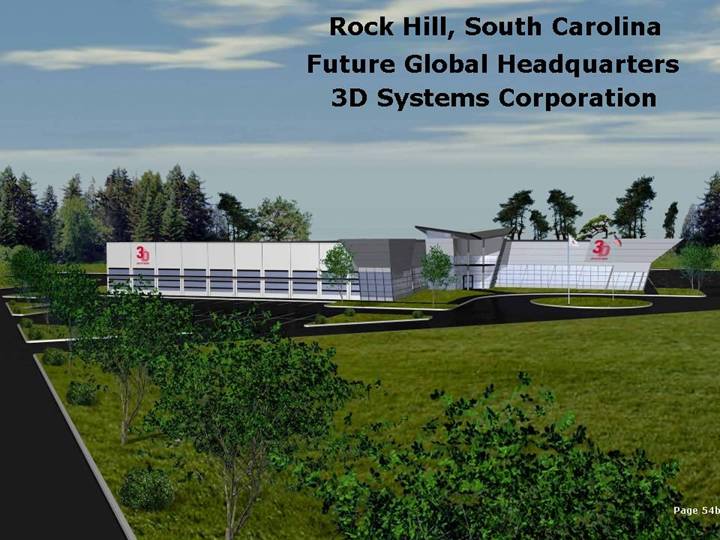
Rock Hill, South Carolina
Future Global Headquarters
3D Systems Corporation
[GRAPHIC]
54b
3D Systems University
- -In Partnership With-
York Tech – Institute for Manufacturing Productivity
• Customer training
• Reseller training
• Team 3D training
• 2-year RP&M degree
• Co-ops and internships
• 3D Systems’ showcase
[GRAPHIC]
55
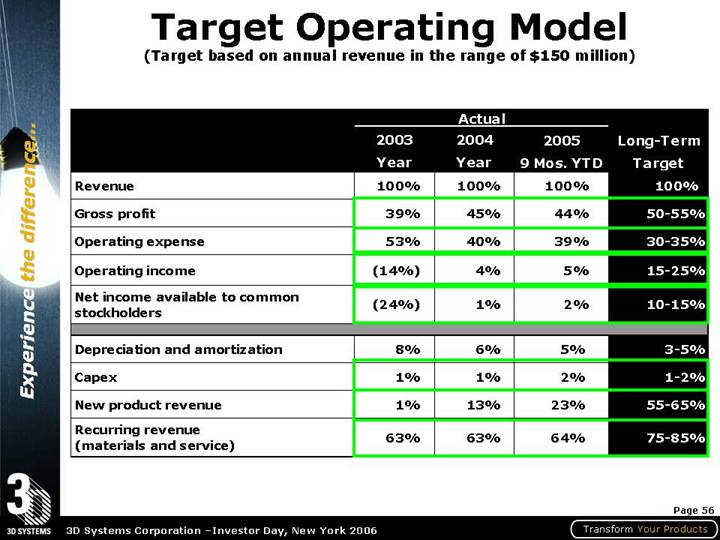
Target Operating Model
(Target based on annual revenue in the range of $150 million)
| | Actual | | | |
| | 2003 | | 2004 | | 2005 | | Long-Term | |
| | Year | | Year | | 9 Mos. YTD | | Target | |
Revenue | | 100 | % | 100 | % | 100 | % | 100 | % |
Gross profit | | 39 | % | 45 | % | 44 | % | 50-55 | % |
Operating expense | | 53 | % | 40 | % | 39 | % | 30-35 | % |
Operating income | | (14 | )% | 4 | % | 5 | % | 15-25 | % |
Net income available to common stockholders | | (24 | )% | 1 | % | 2 | % | 10-15 | % |
| | | | | | | | | |
Depreciation and amortization | | 8 | % | 6 | % | 5 | % | 3-5 | % |
Capex | | 1 | % | 1 | % | 2 | % | 1-2 | % |
New product revenue | | 1 | % | 13 | % | 23 | % | 55-65 | % |
Recurring revenue (materials and service) | | 63 | % | 63 | % | 64 | % | 75-85 | % |
56
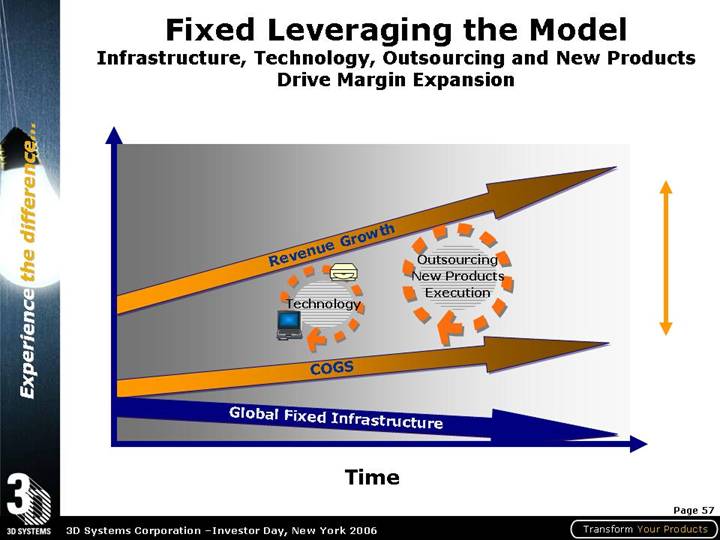
Fixed Leveraging the Model
Infrastructure, Technology, Outsourcing and New Products Drive Margin Expansion
[CHART]
57
Key Initiatives
• Completing planned HQ consolidation
• Strengthening sales and marketing Europe and Japan
• Commercializing additional 3-D printers
• Growing 3-D printer reseller channel globally
• Enhancing service effectiveness and profitability
• Developing new Rapid Manufacturing applications
• Introducing new, engineered materials and composites
• Implementing Oracle-based ERP system
• Pruning portfolio and retiring older legacy systems
• Improving operations and customer experience
58
Business Fundamentals
• Leading technology and industry position
• Experienced management team and organization
• Clear customer priorities … demonstrated execution
• Stronger financial base and flexibility
• Comprehensive solutions’ portfolio
• Significant and steady new product introductions
• Healthy pipeline of additional opportunities
• Improving operating results, efficiencies and cash flow
• Significant growth programs
• 3-D printing
• Rapid manufacturing
• Measurable value, customers and stockholders
59
[GRAPHIC]
Transform Your Products
Thank You!