Exhibit 99.2
Second Quarter and Six Months 2017 August 2, 2017

Welcome and Participants • Vyomesh Joshi – President & Chief Executive Officer • John McMullen – Executive Vice President & Chief Financial Officer • Patrick Rogers – Vice President & Assistant General Counsel • Stacey Witten – Vice President, Investor Relations To participate via phone, please dial: US: 1 - 800 - 407 - 8291 Outside the US: 1 - 201 - 689 - 8345 2
Forward Looking Statements This presentation contains certain statements that are not statements of historical or current facts are forward - looking stateme nts within the meaning of the Private Securities Litigation Reform Act of 1995. Forward - looking statements include statements concerning plans, objectives, goals, strategies, expectations , intentions, projections, developments, future events, performance or products, underlying assumptions, and other statements which are other than statements of historical facts. I n s ome cases, you can identify forward - looking statements by terms such as “believes,” “beliefs,” ''may,'' ''will,'' ''should,'' expects,'' ''intends,'' ''plans,'' ''anticipates,'' ''est ima tes,'' ''predicts,'' ''projects,'' ''potential,'' ''continue,'' and other similar terminology or the negative of these terms. From time to time, we may publish or otherwise make available forward - looking statements of thi s nature. All such forward - looking statements, whether written or oral, and whether made by us or on our behalf, are expressly qualified by the cautionary statements described on t his message including those set forth below. Forward - looking statements are based upon management’s beliefs, assumptions and current expectations concerning future events and trends, usi ng information currently available, and are necessarily subject to uncertainties, many of which are outside our control. In addition, we undertake no obligation to u pda te or revise any forward - looking statements made by us or on our behalf, whether as a result of future developments, subsequent events or circumstances, or otherwise, or to reflect the o ccu rrence or likelihood of unanticipated events, and we disclaim any such obligation. Forward - looking statements are only predictions that relate to future events or our future performance and are subject to known and unknown r isk s, uncertainties, assumptions, and other factors, many of which are beyond our control, that may cause actual results, outcomes, levels of activity, performance, deve lop ments, or achievements to be materially different from any future results, outcomes, levels of activity, performance, developments, or achievements expressed, anticipated, or implied b y t hese forward - looking statements. Although we believe that the expectations reflected in the forward - looking statements are reasonable, forward - looking statements are not, and should not be relied upon as a guarantee of future performance or results, nor will they necessarily prove to be accurate indications of the times at or by which any such performance or resul ts will be achieved. 3D System’s actual results could differ materially from those stated or implied in forward - looking statements. Past performance is not necessarily indicative of future results. We do not undertake any obligation to and do not intend to update any forward - looking statements whether as a result of future developments, subsequent events or circumstances o r otherwise. Further , we encourage you to review “Risk Factors” in Part 1 of our Annual Report on Form 10 - K and Part II of our quarterly reports on Form 10 - Q filed with the SEC as well as other information about us in our filings with the SEC. These are available at www.SEC.gov. 3
Vyomesh Joshi (VJ) President & Chief Executive Officer
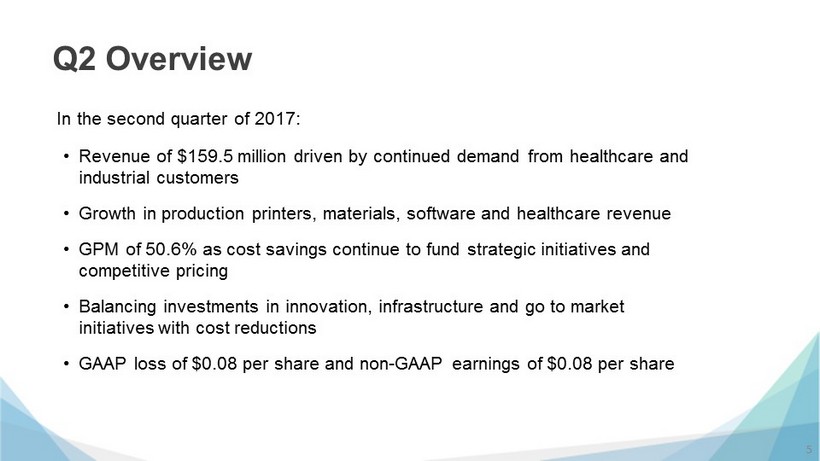
Q2 Overview 5 • Revenue of $159.5 million driven by continued demand from healthcare and industrial customers • Growth in production printers, materials, software and healthcare revenue • GPM of 50.6% as cost savings continue to fund strategic initiatives and competitive pricing • Balancing investments in innovation, infrastructure and go to market initiatives with cost reductions • GAAP loss of $0.08 per share and non - GAAP earnings of $0.08 per share In the second quarter of 2017:
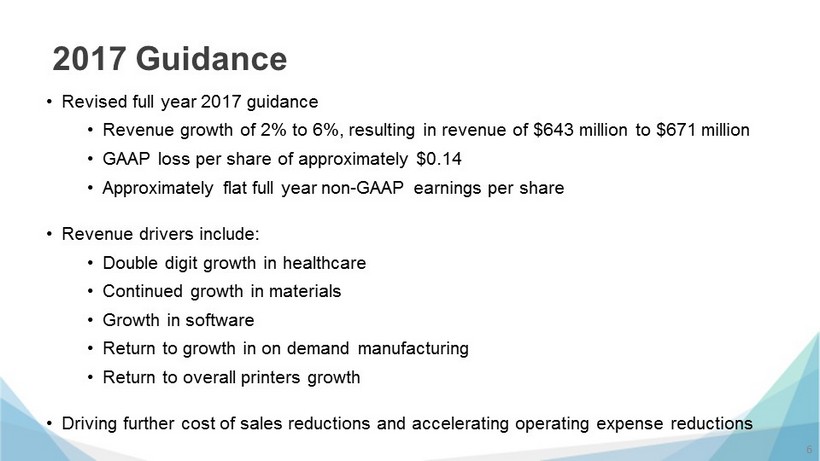
2017 Guidance 6 • Revised full year 2017 guidance • Revenue growth of 2% to 6%, resulting in revenue of $643 million to $671 million • GAAP loss per share of approximately $0.14 • Approximately flat full year non - GAAP earnings per share • Revenue drivers include: • Double digit growth in healthcare • Continued growth in materials • Growth in software • Return to growth in on demand manufacturing • Return to overall printers growth • Driving further cost of sales reductions and accelerating operating expense reductions
John McMullen Executive Vice President & Chief Financial Officer
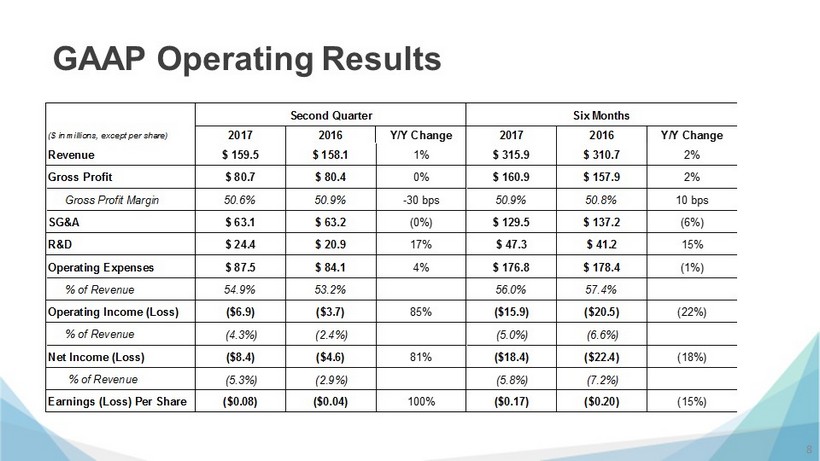
GAAP Operating Results 8 2017 2016 Y/Y Change 2017 2016 Y/Y Change $ 159.5 $ 158.1 1% $ 315.9 $ 310.7 2% $ 80.7 $ 80.4 0% $ 160.9 $ 157.9 2% 50.6% 50.9% -30 bps 50.9% 50.8% 10 bps $ 63.1 $ 63.2 (0%) $ 129.5 $ 137.2 (6%) $ 24.4 $ 20.9 17% $ 47.3 $ 41.2 15% $ 87.5 $ 84.1 4% $ 176.8 $ 178.4 (1%) 54.9% 53.2% 56.0% 57.4% ($6.9) ($3.7) 85% ($15.9) ($20.5) (22%) (4.3%) (2.4%) (5.0%) (6.6%) ($8.4) ($4.6) 81% ($18.4) ($22.4) (18%) (5.3%) (2.9%) (5.8%) (7.2%) ($0.08) ($0.04) 100% ($0.17) ($0.20) (15%) Six MonthsSecond Quarter Earnings (Loss) Per Share % of Revenue Net Income (Loss) % of Revenue Revenue ($ in millions, except per share) Operating Income (Loss) % of Revenue Operating Expenses Gross Profit Margin Gross Profit SG&A R&D
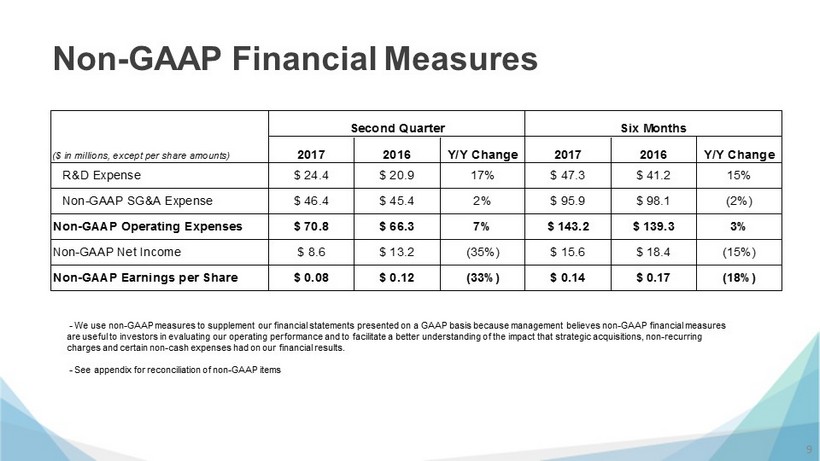
Non - GAAP Financial Measures 9 - We use non - GAAP measures to supplement our financial statements presented on a GAAP basis because management believes non - GAAP fina ncial measures are useful to investors in evaluating our operating performance and to facilitate a better understanding of the impact that s tra tegic acquisitions, non - recurring charges and certain non - cash expenses had on our financial results . - See appendix for reconciliation of non - GAAP items 2017 2016 Y/Y Change 2017 2016 Y/Y Change R&D Expense $ 24.4 $ 20.9 17% $ 47.3 $ 41.2 15% Non-GAAP SG&A Expense $ 46.4 $ 45.4 2% $ 95.9 $ 98.1 (2%) Non-GAAP Operating Expenses $ 70.8 $ 66.3 7% $ 143.2 $ 139.3 3% Non-GAAP Net Income $ 8.6 $ 13.2 (35%) $ 15.6 $ 18.4 (15%) Non-GAAP Earnings per Share $ 0.08 $ 0.12 (33%) $ 0.14 $ 0.17 (18%) ($ in millions, except per share amounts) Second Quarter Six Months
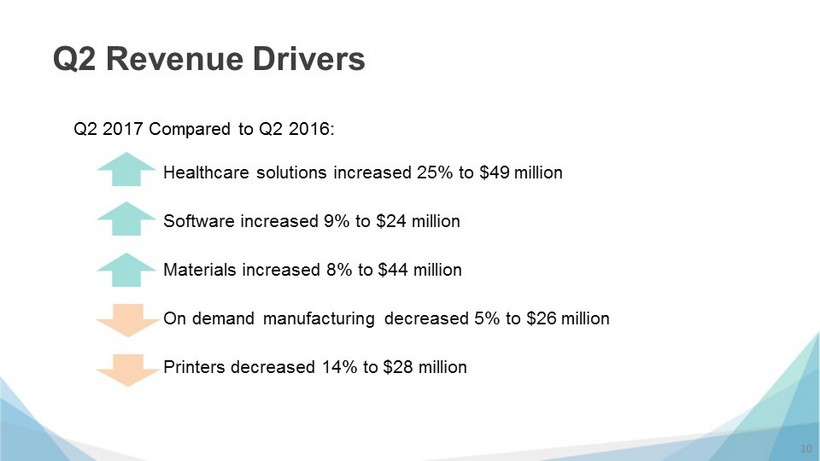
Q2 Revenue Drivers • Healthcare solutions increased 25% to $49 million • Software increased 9% to $24 million • Materials increased 8% to $44 million • On demand manufacturing decreased 5 % to $26 million • Printers decreased 14% to $28 million Q2 2017 Compared to Q2 2016: 10
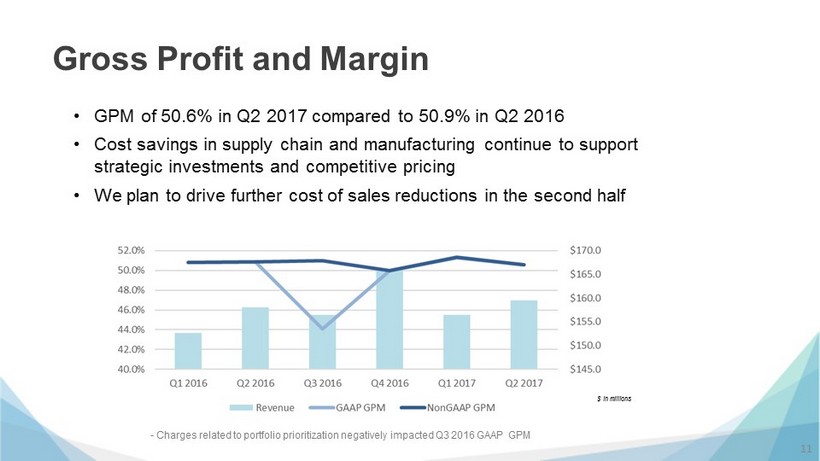
Gross Profit and Margin • GPM of 50.6% in Q2 2017 compared to 50.9% in Q2 2016 • Cost savings in supply chain and manufacturing continue to support strategic investments and competitive pricing • We plan to drive further cost of sales reductions in the second half 11 - Charges related to portfolio prioritization negatively impacted Q3 2016 GAAP GPM $ in millions
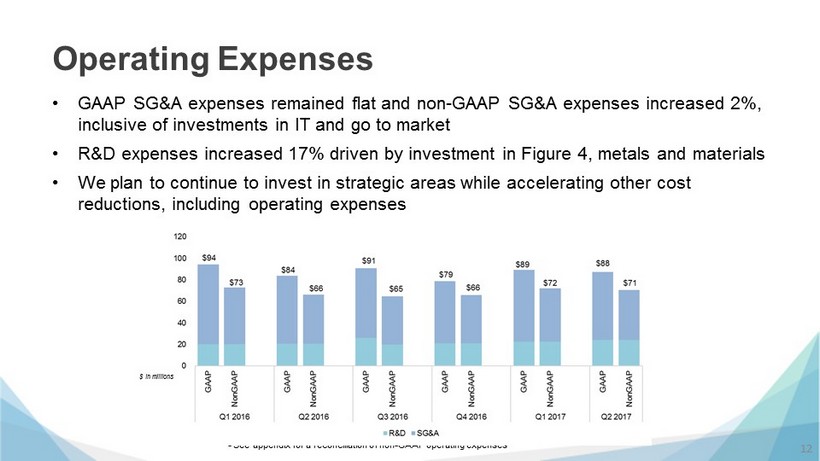
Operating Expenses 12 • GAAP SG&A expenses remained flat and non - GAAP SG&A expenses increased 2%, inclusive of investments in IT and go to market • R&D expenses increased 17% driven by investment in Figure 4, metals and materials • We plan to continue to invest in strategic areas while accelerating other cost reductions, including operating expenses - See appendix for a reconciliation of non - GAAP operating expenses $ in millions
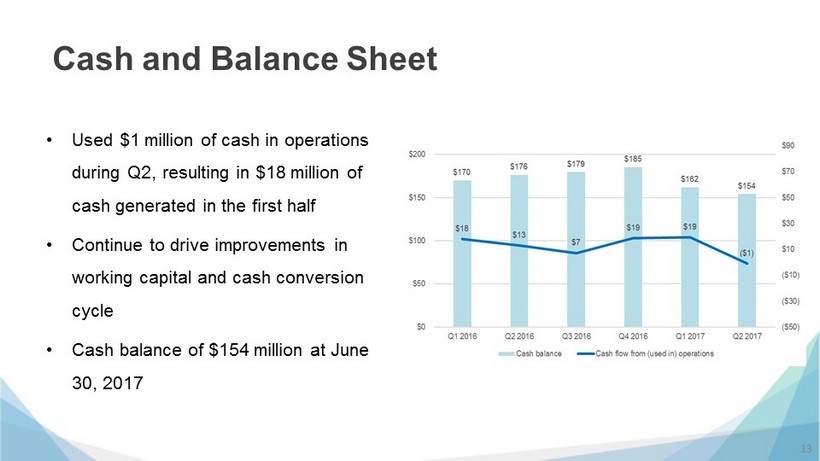
Cash and Balance Sheet • Used $1 million of cash in operations during Q2, resulting in $18 million of cash generated in the first half • Continue to drive improvements in working capital and cash conversion cycle • Cash balance of $154 million at June 30, 2017 13
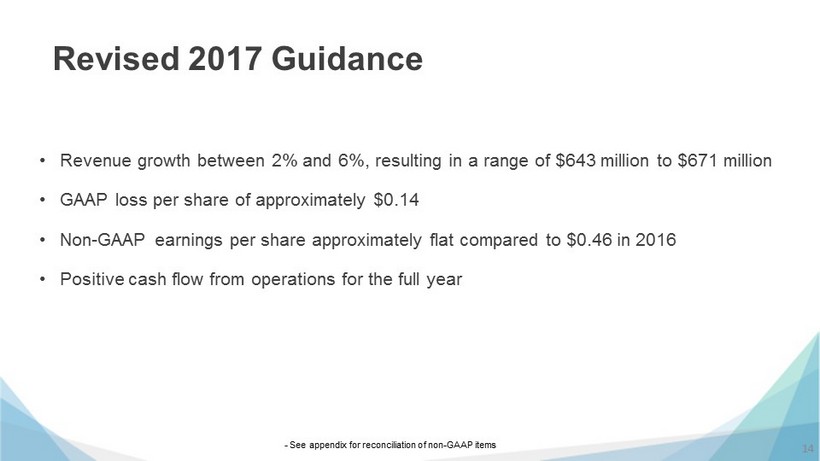
Revised 2017 Guidance 14 • Revenue growth between 2% and 6%, resulting in a range of $643 million to $671 million • GAAP loss per share of approximately $0.14 • Non - GAAP earnings per share approximately flat compared to $0.46 in 2016 • Positive cash flow from operations for the full year - See appendix for reconciliation of non - GAAP items

Vyomesh Joshi (VJ) President & Chief Executive Officer
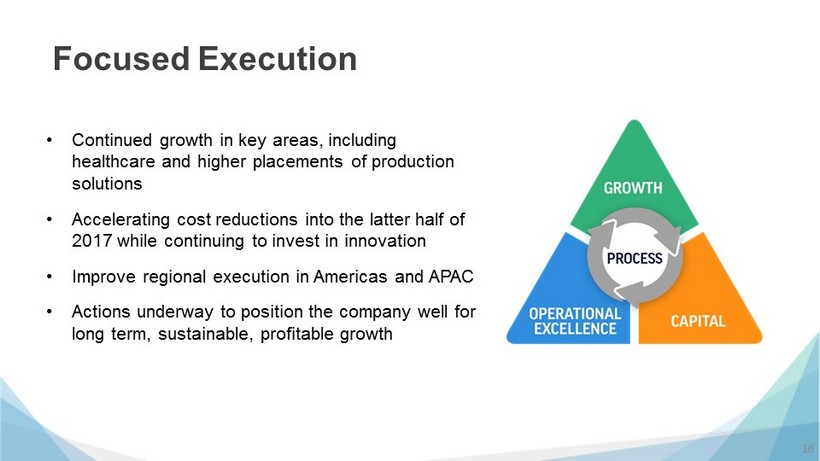
Focused Execution 16 • Continued growth in key areas, including healthcare and higher placements of production solutions • Accelerating cost reductions into the latter half of 2017 while continuing to invest in innovation • Improve regional execution in Americas and APAC • Actions underway to position the company well for long term , sustainable, profitable growth
Q&A Session In the USA: 1 - 877 - 407 - 8291 Outside the USA: 1 - 201 - 689 - 8345

Thank You
Appendix
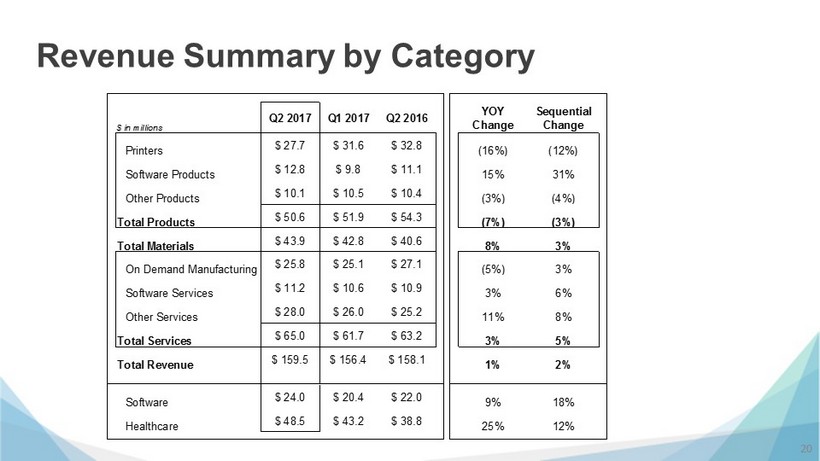
Revenue Summary by Category 20 $ in millions Q2 2017 Q1 2017 Q2 2016 YOY Change Sequential Change Printers $ 27.7 $ 31.6 $ 32.8 (16%) (12%) Software Products $ 12.8 $ 9.8 $ 11.1 15% 31% Other Products $ 10.1 $ 10.5 $ 10.4 (3%) (4%) Total Products $ 50.6 $ 51.9 $ 54.3 (7%) (3%) Total Materials $ 43.9 $ 42.8 $ 40.6 8% 3% On Demand Manufacturing $ 25.8 $ 25.1 $ 27.1 (5%) 3% Software Services $ 11.2 $ 10.6 $ 10.9 3% 6% Other Services $ 28.0 $ 26.0 $ 25.2 11% 8% Total Services $ 65.0 $ 61.7 $ 63.2 3% 5% Total Revenue $ 159.5 $ 156.4 $ 158.1 1% 2% Software $ 24.0 $ 20.4 $ 22.0 9% 18% Healthcare $ 48.5 $ 43.2 $ 38.8 25% 12%
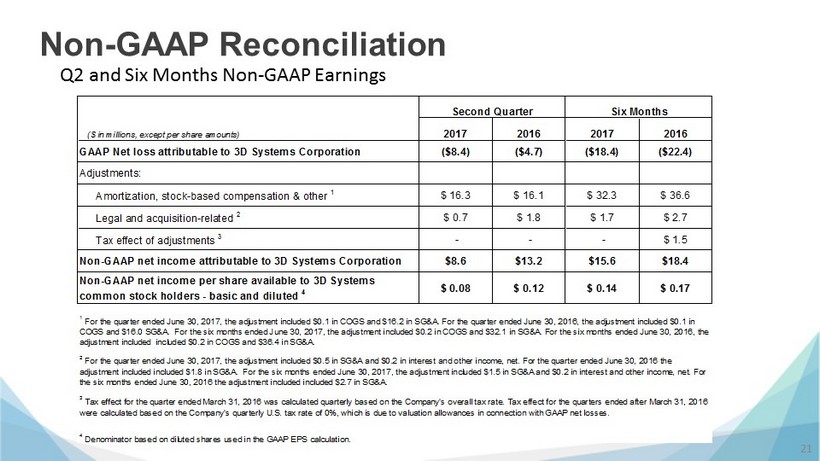
Non - GAAP Reconciliation 21 Q2 and Six Months Non - GAAP Earnings 2017 2016 2017 2016 GAAP Net loss attributable to 3D Systems Corporation ($8.4) ($4.7) ($18.4) ($22.4) Adjustments: Amortization, stock-based compensation & other 1 $ 16.3 $ 16.1 $ 32.3 $ 36.6 Legal and acquisition-related 2 $ 0.7 $ 1.8 $ 1.7 $ 2.7 Tax effect of adjustments 3 - - - $ 1.5 Non-GAAP net income attributable to 3D Systems Corporation $8.6 $13.2 $15.6 $18.4 Non-GAAP net income per share available to 3D Systems common stock holders - basic and diluted 4 $ 0.08 $ 0.12 $ 0.14 $ 0.17 4 Denominator based on diluted shares used in the GAAP EPS calculation. ($ in millions, except per share amounts) Second Quarter Six Months 1 For the quarter ended June 30, 2017, the adjustment included $0.1 in COGS and $16.2 in SG&A. For the quarter ended June 30, 2016, the adjustment included $0.1 in COGS and $16.0 SG&A. For the six months ended June 30, 2017, the adjustment included $0.2 in COGS and $32.1 in SG&A. For the six months ended June 30, 2016, the adjustment included included $0.2 in COGS and $36.4 in SG&A. 2 For the quarter ended June 30, 2017, the adjustment included $0.5 in SG&A and $0.2 in interest and other income, net. For the quarter ended June 30, 2016 the adjustment included included $1.8 in SG&A. For the six months ended June 30, 2017, the adjustment included $1.5 in SG&A and $0.2 in interest and other income, net. For the six months ended June 30, 2016 the adjustment included included $2.7 in SG&A. 3 Tax effect for the quarter ended March 31, 2016 was calculated quarterly based on the Company's overall tax rate. Tax effect for the quarters ended after March 31, 2016 were calculated based on the Company's quarterly U.S. tax rate of 0%, which is due to valuation allowances in connection with GAAP net losses.
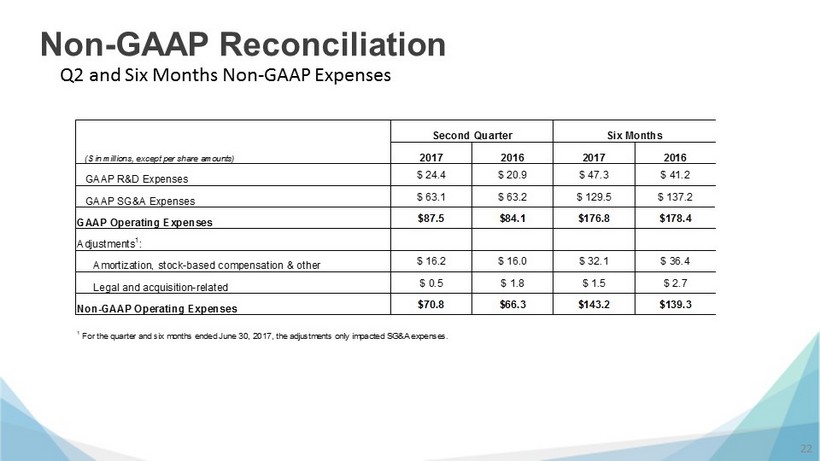
Non - GAAP Reconciliation 22 Q2 and Six Months Non - GAAP Expenses 2017 2016 2017 2016 GAAP R&D Expenses $ 24.4 $ 20.9 $ 47.3 $ 41.2 GAAP SG&A Expenses $ 63.1 $ 63.2 $ 129.5 $ 137.2 GAAP Operating Expenses $87.5 $84.1 $176.8 $178.4 Adjustments 1 : Amortization, stock-based compensation & other $ 16.2 $ 16.0 $ 32.1 $ 36.4 Legal and acquisition-related $ 0.5 $ 1.8 $ 1.5 $ 2.7 Non-GAAP Operating Expenses $70.8 $66.3 $143.2 $139.3 ($ in millions, except per share amounts) Second Quarter Six Months 1 For the quarter and six months ended June 30, 2017, the adjustments only impacted SG&A expenses.
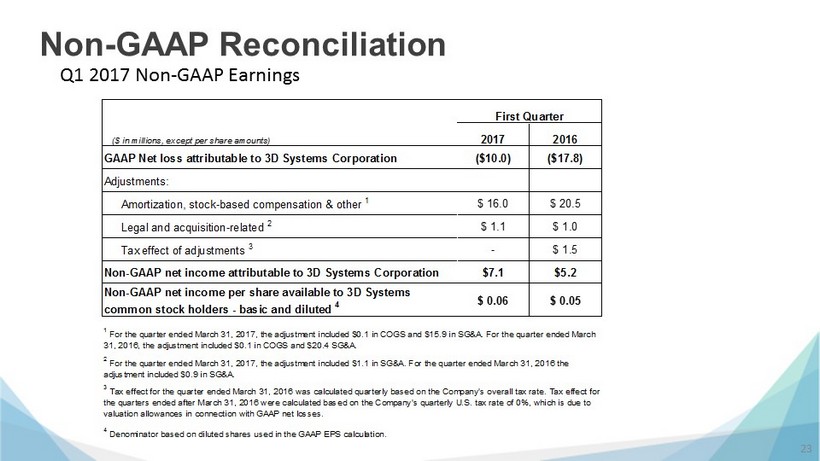
Non - GAAP Reconciliation 23 Q1 2017 Non - GAAP Earnings 2017 2016 GAAP Net loss attributable to 3D Systems Corporation ($10.0) ($17.8) Adjustments: Amortization, stock-based compensation & other 1 $ 16.0 $ 20.5 Legal and acquisition-related 2 $ 1.1 $ 1.0 Tax effect of adjustments 3 - $ 1.5 Non-GAAP net income attributable to 3D Systems Corporation $7.1 $5.2 Non-GAAP net income per share available to 3D Systems common stock holders - basic and diluted 4 $ 0.06 $ 0.05 4 Denominator based on diluted shares used in the GAAP EPS calculation. ($ in millions, except per share amounts) First Quarter 1 For the quarter ended March 31, 2017, the adjustment included $0.1 in COGS and $15.9 in SG&A. For the quarter ended March 31, 2016, the adjustment included $0.1 in COGS and $20.4 SG&A. 2 For the quarter ended March 31, 2017, the adjustment included $1.1 in SG&A. For the quarter ended March 31, 2016 the adjustment included $0.9 in SG&A. 3 Tax effect for the quarter ended March 31, 2016 was calculated quarterly based on the Company's overall tax rate. Tax effect for the quarters ended after March 31, 2016 were calculated based on the Company's quarterly U.S. tax rate of 0%, which is due to valuation allowances in connection with GAAP net losses.
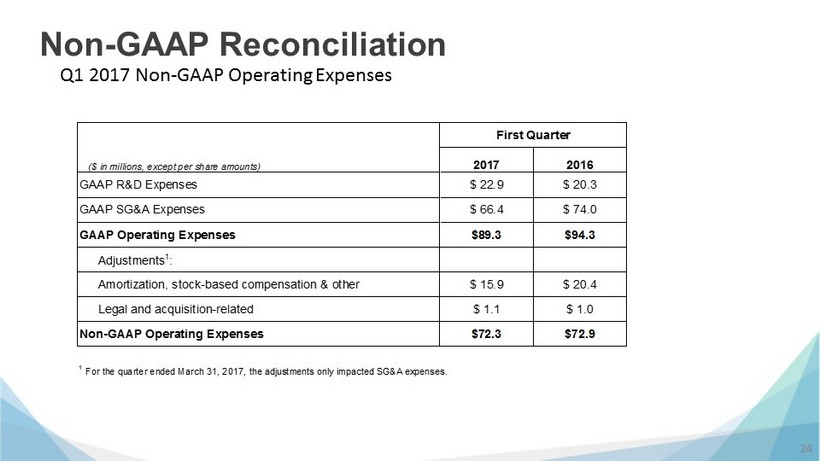
Non - GAAP Reconciliation 24 Q1 2017 Non - GAAP Operating Expenses 2017 2016 GAAP R&D Expenses $ 22.9 $ 20.3 GAAP SG&A Expenses $ 66.4 $ 74.0 GAAP Operating Expenses $89.3 $94.3 Adjustments 1 : Amortization, stock-based compensation & other $ 15.9 $ 20.4 Legal and acquisition-related $ 1.1 $ 1.0 Non-GAAP Operating Expenses $72.3 $72.9 ($ in millions, except per share amounts) First Quarter 1 For the quarter ended March 31, 2017, the adjustments only impacted SG&A expenses.
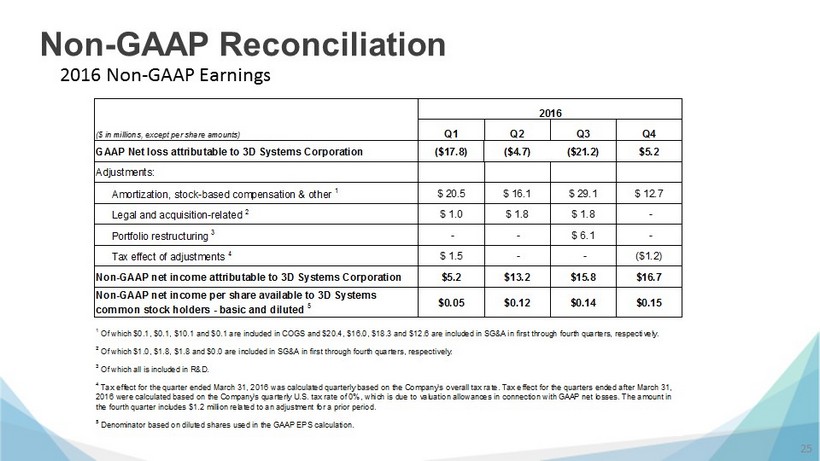
Non - GAAP Reconciliation 25 2016 Non - GAAP Earnings Q1 Q2 Q3 Q4 GAAP Net loss attributable to 3D Systems Corporation ($17.8) ($4.7) ($21.2) $5.2 Adjustments: Amortization, stock-based compensation & other 1 $ 20.5 $ 16.1 $ 29.1 $ 12.7 Legal and acquisition-related 2 $ 1.0 $ 1.8 $ 1.8 - Portfolio restructuring 3 - - $ 6.1 - Tax effect of adjustments 4 $ 1.5 - - ($1.2) Non-GAAP net income attributable to 3D Systems Corporation $5.2 $13.2 $15.8 $16.7 Non-GAAP net income per share available to 3D Systems common stock holders - basic and diluted 5 $0.05 $0.12 $0.14 $0.15 5 Denominator based on diluted shares used in the GAAP EPS calculation. ($ in millions, except per share amounts) 2016 1 Of which $0.1, $0.1, $10.1 and $0.1 are included in COGS and $20.4, $16.0, $18.3 and $12.6 are included in SG&A in first through fourth quarters, respectively. 2 Of which $1.0, $1.8, $1.8 and $0.0 are included in SG&A in first through fourth quarters, respectively. 3 Of which all is included in R&D. 4 Tax effect for the quarter ended March 31, 2016 was calculated quarterly based on the Company's overall tax rate. Tax effect for the quarters ended after March 31, 2016 were calculated based on the Company's quarterly U.S. tax rate of 0%, which is due to valuation allowances in connection with GAAP net losses. The amount in the fourth quarter includes $1.2 million related to an adjustment for a prior period.
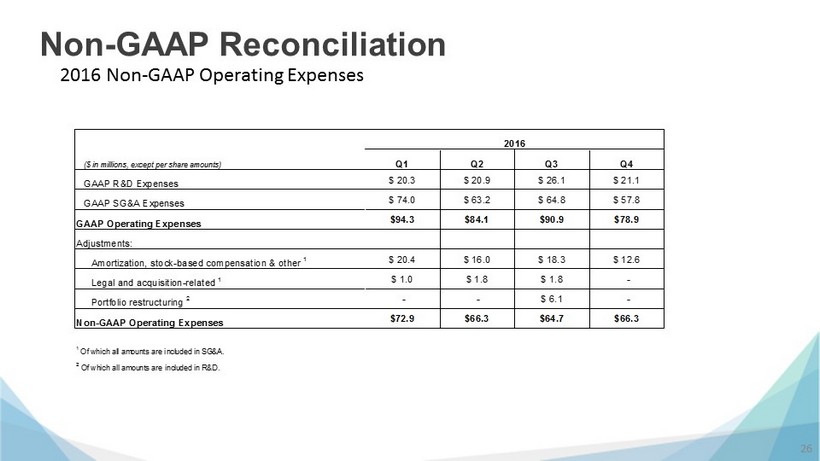
Non - GAAP Reconciliation 26 2016 Non - GAAP Operating Expenses Q1 Q2 Q3 Q4 GAAP R&D Expenses $ 20.3 $ 20.9 $ 26.1 $ 21.1 GAAP SG&A Expenses $ 74.0 $ 63.2 $ 64.8 $ 57.8 GAAP Operating Expenses $94.3 $84.1 $90.9 $78.9 Adjustments: Amortization, stock-based compensation & other 1 $ 20.4 $ 16.0 $ 18.3 $ 12.6 Legal and acquisition-related 1 $ 1.0 $ 1.8 $ 1.8 - Portfolio restructuring 2 - - $ 6.1 - Non-GAAP Operating Expenses $72.9 $66.3 $64.7 $66.3 ($ in millions, except per share amounts) 2016 1 Of which all amounts are included in SG&A. 2 Of which all amounts are included in R&D.
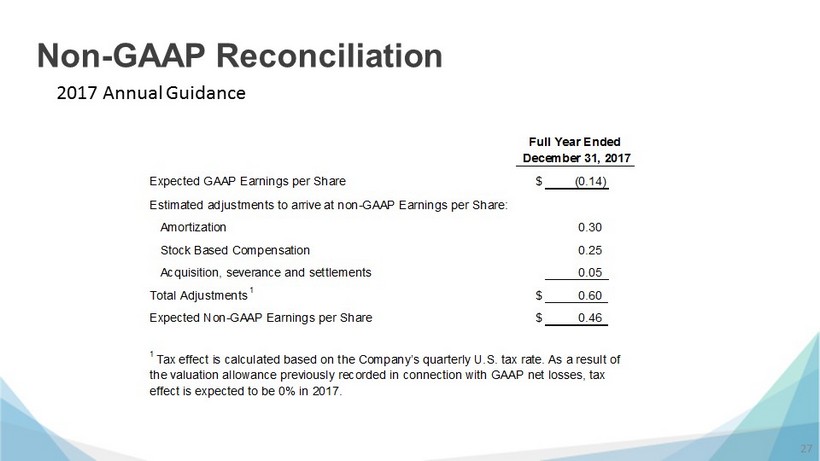
Non - GAAP Reconciliation 27 2017 Annual Guidance Expected GAAP Earnings per Share $ (0.14) Estimated adjustments to arrive at non-GAAP Earnings per Share: Amortization 0.30 Stock Based Compensation 0.25 Acquisition, severance and settlements 0.05 Total Adjustments 1 $ 0.60 Expected Non-GAAP Earnings per Share $ 0.46 Full Year Ended December 31, 2017 1 Tax effect is calculated based on the Company’s quarterly U.S. tax rate. As a result of the valuation allowance previously recorded in connection with GAAP net losses, tax effect is expected to be 0% in 2017.

Thank You