
Conference Call
and Webcast
NASDAQ: TDSC www.3dsystems.com
and Webcast
NASDAQ: TDSC www.3dsystems.com
November 4, 2009
1

Participants
q Amanda Molbert
Coordinator, Investor Relations
Coordinator, Investor Relations
q Abe Reichental
President & Chief Executive Officer
President & Chief Executive Officer
q Damon Gregoire
Vice President & Chief Financial Officer
Vice President & Chief Financial Officer
q Bob Grace
Vice President & General Counsel
Vice President & General Counsel
2

Welcome Webcast Viewers
q To listen to the conference via phone and to ask questions
during our Q&A session, please dial:
during our Q&A session, please dial:
n 1-888-336-3485 in the United States
n 1-706-634-0653 from outside the United States
n Confirmation Code: 36028148
3

Forward-Looking Statements
Certain statements made in this presentation that are not statements of historical or current facts are
forward-looking statements within the meaning of the Private Securities Litigation Reform Act of 1995.
Forward-looking statements may involve known and unknown risks, uncertainties and other factors
that may cause the actual results, performance or achievements of the company to be materially
different from historical results or from any future results expressed or implied by such forward-looking
statements. In addition to statements which explicitly describe such risks and uncertainties, readers
are urged to consider statements in the future or conditional tenses or that include the terms
“believes,” “belief,” “estimates,” “expects,” “intends,” “anticipates” or “plans” to be uncertain and
forward-looking. Forward-looking statements may include comments as to the company’s beliefs and
expectations as to future events and trends affecting its business. Forward-looking statements are
based upon management’s current expectations concerning future events and trends and are
necessarily subject to uncertainties, many of which are outside the control of the company. The factors
stated under the headings “Forward-Looking Statements,” “Cautionary Statements and Risk Factors,”
and “Risk Factors” that appear in the company’s periodic filings with the Securities and Exchange
Commission, as well as other factors, could cause actual results to differ materially from those
reflected or predicted in forward-looking statements.
4

Operating Results
Abe Reichental
President & CEO
President & CEO
5

q Sequential revenue growth from all revenue buckets.
q Systems revenue increased by $0.9 million.
q Materials sales grew by $1.4 million.
q Service revenue increased by 8% to $7.7 million.
q V-Flash® commercial activities generated $0.9 million in revenue.
n V-Flash® sales negatively affected our total gross profit margin by 4.1
percentage points for the quarter.
percentage points for the quarter.
Factors Shaping Third Quarter 2009 Results
Q3-09 vs. Q2-09 Revenue Growth | |||||
U.S. | Europe | AP | Total | ||
Systems | (10.9)% | 2.3% | 198.9% | 16.0% | |
Materials | 5.5% | 10.3% | 43.1% | 12.1% | |
Service | 25.1% | (12.5%) | 36.3% | 8.4% | |
Total | 6.6% | 1.7% | 80.4% | 12.0% | |
6

q Gross profit margin and operating expenses both improved compared to the third quarter of
2008, which contributed to net earnings.
2008, which contributed to net earnings.
q Net income of $0.9 million included $1.8 million of non-cash expenses.
q Primarily related to depreciation and amortization expense.
q Earnings per share of 4 cents included 4.1% gross profit margin drag from V-Flash® sales
and litigation cost of $0.9 million.
and litigation cost of $0.9 million.
q Cash position remained unchanged from the previous quarter at $24 million.
q For the first nine months of 2009, the company generated $1.8 million of net cash.
q Inventory rose modestly, reflecting changes in our manufacturing strategy, expanding
portfolio and procurement timing.
portfolio and procurement timing.
Factors Shaping Third Quarter 2009 Results
Q3-08 | Q4-08 | Q1-09 | Q2-09 | Q3-09 | ||
Total Operating Expenses | $14.3 | $13.9 | $12.1 | $11.7 | $11.2 | |
Gross Profit Margin | 39% | 44% | 44% | 44% | 45% | |
Cash | $18.1 | $22.2 | $23.4 | $24.0 | $24.0 | |
Inventory | $23.9 | $21.0 | $19.9 | $19.1 | $20.3 |
7
Financial Review
8

Third Quarter 2009 Operating Results
Operating Results | Third Quarter | % Change | |
2009 | 2008 | Favorable (Unfavorable) | |
Revenue | $27.7 | $35.6 | (22%) |
Gross Profit | $12.3 | $14.0 | (12%) |
% of Revenue | 45% | 39% | |
Operating Expenses | $11.2 | $14.3 | 22% |
% of Revenue | 41% | 40% | |
Net Income (Loss) | $0.9 | ($1.0) | 191% |
Depreciation & Amortization | $1.3 | $1.8 | 28% |
% of Revenue | 5% | 5% | |
Fully Diluted Earnings (Loss) Per Share | $0.04 | ($0.04) | 190% |
($ Millions except per share amounts)
9

Nine Months 2009 Operating Results
Operating Results | Nine Months | % Change | |
2009 | 2008 | Favorable (Unfavorable) | |
Revenue | $76.4 | $104.0 | (27%) |
Gross Profit | $33.6 | $40.3 | (17%) |
% of Revenue | 44% | 39% | |
Operating Expenses | $35.0 | $47.1 | 26% |
% of Revenue | 46% | 45% | |
Net Loss | ($2.5) | ($8.0) | 69% |
Depreciation & Amortization | $4.3 | $5.0 | 12% |
% of Revenue | 6% | 5% | |
Fully Diluted Loss Per Share | ($0.11) | ($0.36) | 69% |
($ Millions except per share amounts)
10

Q3 2009 Revenue Mix By Category and Region
5
10
15
20
25
30
35
0
40
2009
2008
2009
2008
Asia Pacific
Europe
North America
28%
$27.7
40%
45%
15%
$35.6
44%
40%
16%
$27.7
$35.6
25%
29%
25%
47%
46%
11
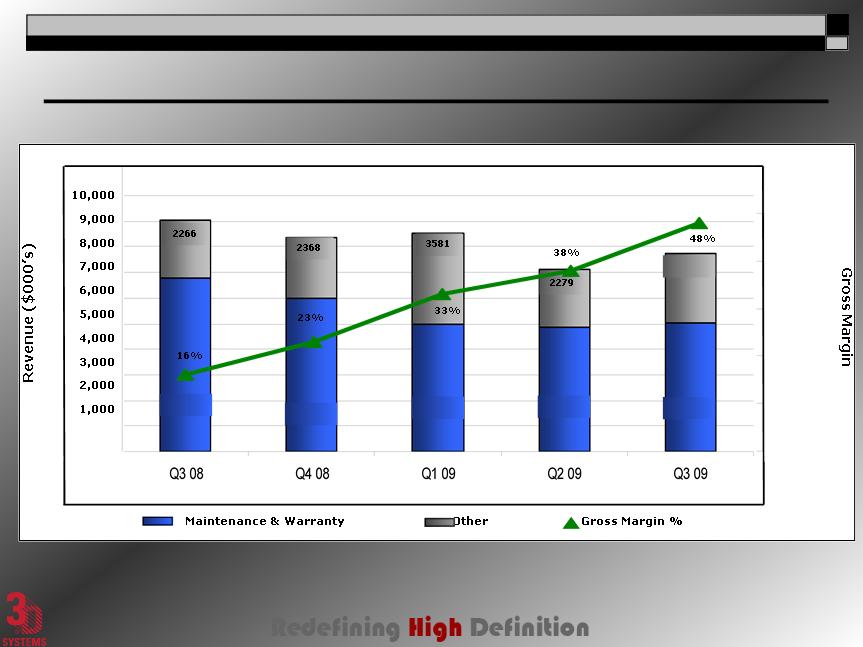
Service Revenue Trends
0
60%
50%
40%
30%
20%
10%
0%
2680
5039
4842
4961
5976
6752
12

Third Quarter 2009 Gross Profit and Margin
q Items favorably affecting gross profit margin:
n Supply chain efficiencies and cost reduction measures
n Reduction in field service costs
n Reduction in manufacturing costs as a result of our change in manufacturing strategy
q Items negatively impacting gross profit margin:
n Overhead absorption on lower revenue
n Impact of initial V-Flash® Desktop Printer sales
13

Nine Months 2009 Gross Profit and Margin
q Items favorably affecting gross profit margin:
n Supply chain efficiencies and cost reduction measures
n Movement in Q2 2008 of certain third-party logistics activities in-house
n Reduction in field service costs
n Reduction in manufacturing costs as a result of our change in manufacturing strategy
n Sale of system upgrades
o Items negatively impacting gross profit margin:
n Overhead absorption on lower revenue
n Impact of initial V-Flash® Desktop Printer sales
($ Millions)
14

Third Quarter 2009 Operating Expenses
Expect fourth quarter of 2009 SG&A to be in the range of $8.5-10 million and
R&D in the range of $2-3 million.
R&D in the range of $2-3 million.
($ Millions)
15
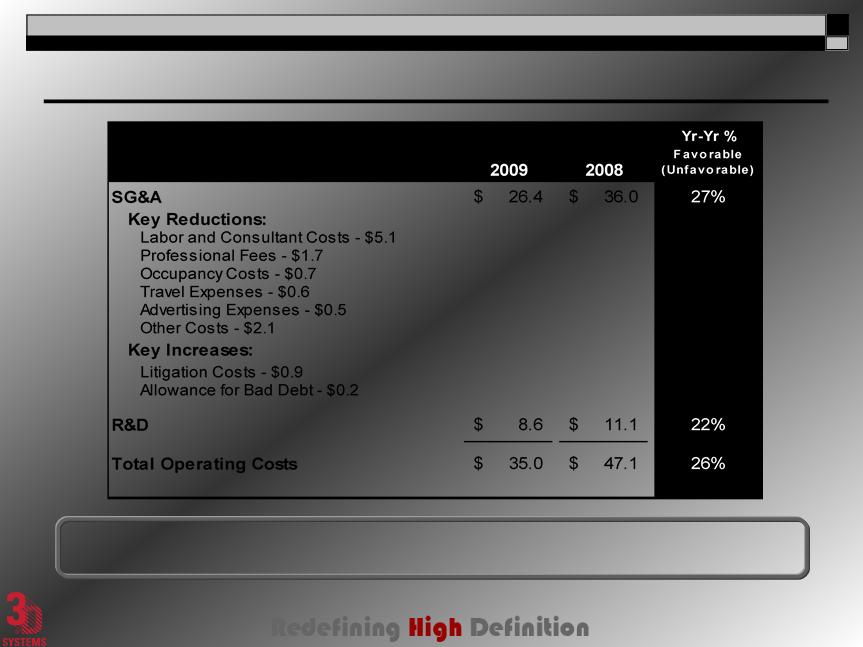
Nine Months 2009 Operating Expenses
Expect fourth quarter of 2009 SG&A to be in the range of $8.5-10 million and
R&D in the range of $2-3 million.
R&D in the range of $2-3 million.
($ Millions)
16
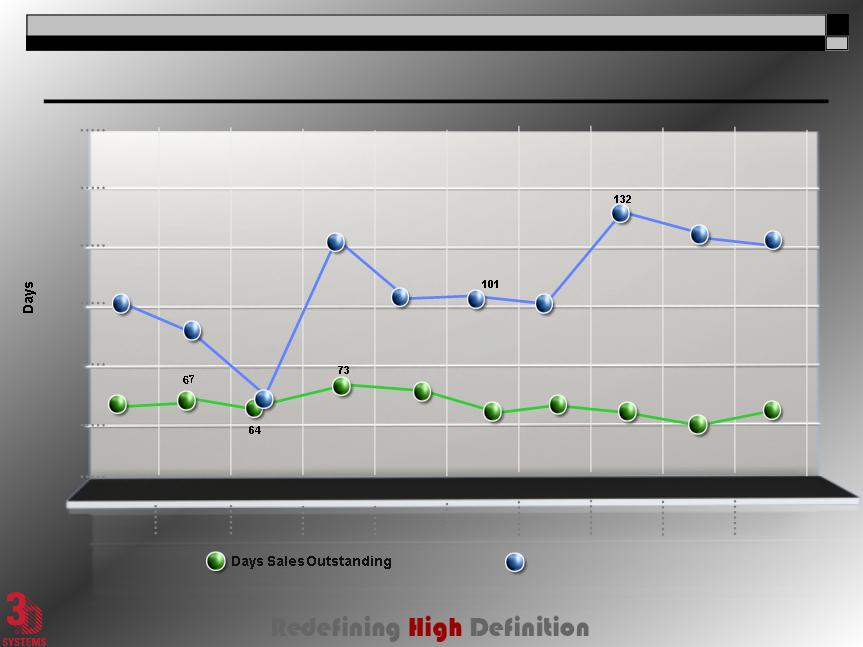
Working Capital Management
40
60
80
100
120
140
160
Days Inventory On Hand
Q2 2007
Q3 2007
Q4 2007
Q1 2008
Q2 2008
Q3 2008
Q4 2008
Q1 2009
Q2 2009
63
65
63
70
66
68
100
93
121
102
100
125
60
122
63
Q3 2009
17
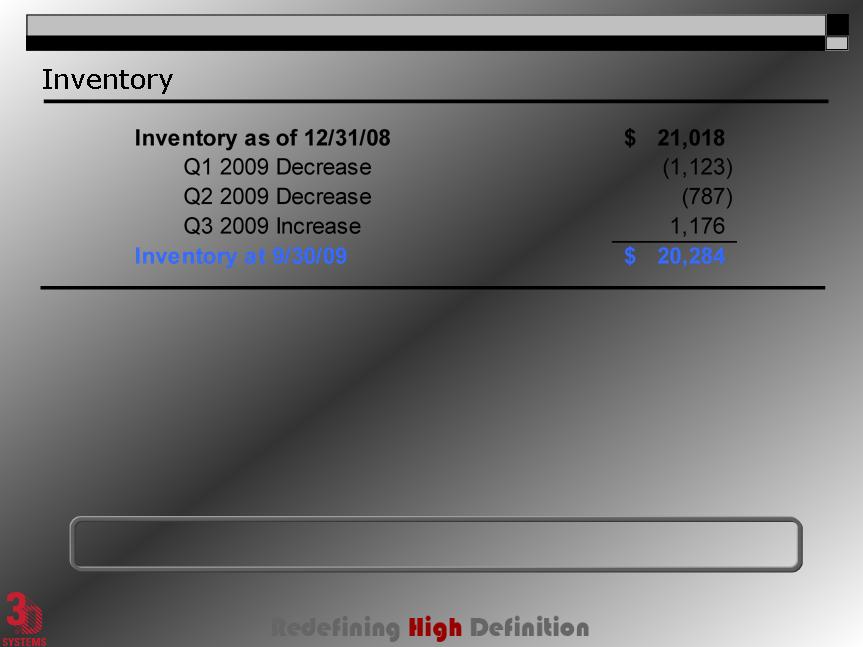
We are continuing to focus on achieving additional inventory reductions.
q Inventory decrease from the fourth quarter 2008 resulted from a $2.0
million decrease in finished good inventory consisting of:
million decrease in finished good inventory consisting of:
n Reduced materials inventory and
n Reduced spare parts inventory.
q Inventory increase in Q3 2009 resulted from our change in manufacturing
strategy.
strategy.
($000’s)
18
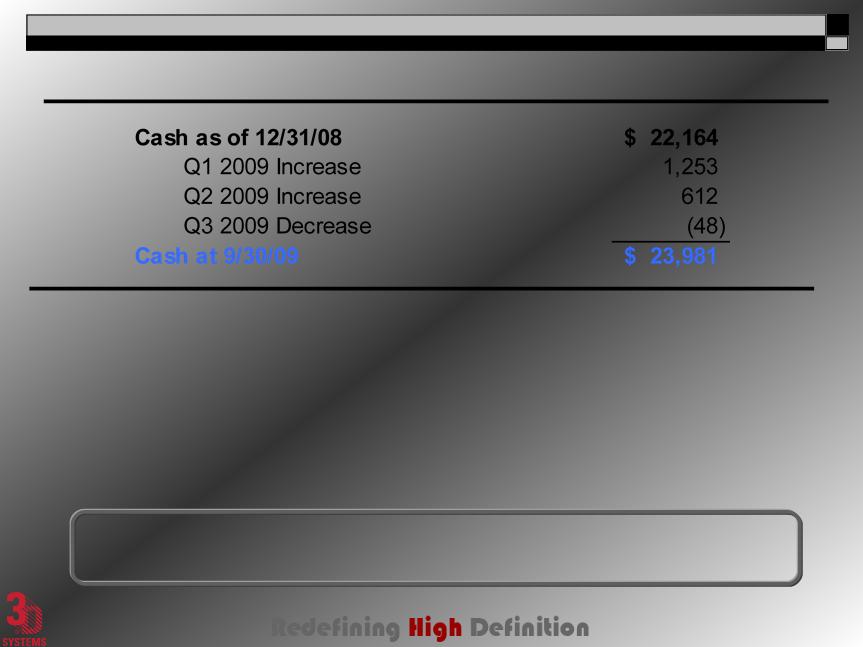
2009 Available Cash
q Available cash increased from the fourth quarter 2008 due to:
n Inventory reductions,
n Cost reductions, and
n Improved cash management.
q Operating activities provided $2.2 million of cash.
q We have no debt, except for capital leases.
Expect our capital expenditures for the fourth quarter of 2009 to be in
the range of $0.5-1 million, exclusive of acquisitions.
($000’s)
19
Progress Report
Abe Reichental
President & CEO
President & CEO
20
Customer Value From Proprietary
Systems, Materials and Parts
Technology
Systems, Materials and Parts
Technology
Stockholder Value From Profitable
Recurring Revenue Growth
21

Announced Growth Initiatives
o We acquired certain assets of Desktop
Factory, an Idealab company that was
developing a sub-$5,000 3-D printer.
Factory, an Idealab company that was
developing a sub-$5,000 3-D printer.
n We plan to further develop this
technology and integrate it into our
expanding family of desktop and
professional 3-D Printers.
technology and integrate it into our
expanding family of desktop and
professional 3-D Printers.
o We acquired the assets of Acu-Cast
Technologies, a leading provider of
rapid prototyping and manufacturing
services.
Technologies, a leading provider of
rapid prototyping and manufacturing
services.
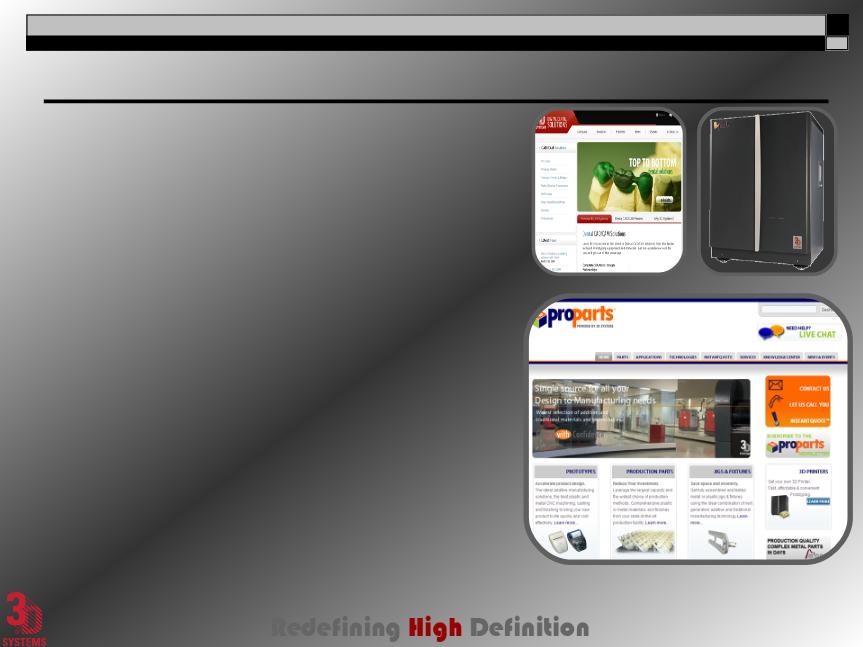
o We launched 3Dproparts™, the
world’s largest rapid prototyping and
direct rapid manufacturing parts
service.
world’s largest rapid prototyping and
direct rapid manufacturing parts
service.
22
Revenue Growth Drivers
q We entered the fourth quarter of 2009 with a stronger
sales funnel than in the third quarter of 2009.
sales funnel than in the third quarter of 2009.
q We are pleased with our first full quarter of V-Flash®
sales and believe that we are on track to achieve our
targeted first anniversary run rate of 250 units per
quarter.
sales and believe that we are on track to achieve our
targeted first anniversary run rate of 250 units per
quarter.
q We expect sales of our expanding lineup of 3-D printers
to continue to grow, helped by our expected commercial
shipments of the new ProJet™ 5000 in the fourth
quarter.
to continue to grow, helped by our expected commercial
shipments of the new ProJet™ 5000 in the fourth
quarter.
q We added 35 new resellers since January of 2009 and
expect to continue to add resellers at a rate of 10-15
per quarter.
expect to continue to add resellers at a rate of 10-15
per quarter.
q We expect revenue growth from our new 3Dproparts™
service and its related Acu-Cast acquisition.
service and its related Acu-Cast acquisition.
q We expect sales of our dental solutions to grow,
benefiting from our expanding portfolio of dental
production systems and dental marketplace technology
leadership.
benefiting from our expanding portfolio of dental
production systems and dental marketplace technology
leadership.
23

Looking Ahead: Revenue Outlook
o While we expect economic recovery to be agonizingly slow,
we believe that market conditions have stabilized.
we believe that market conditions have stabilized.
o Given our strengthened portfolio of products and services,
we expect sequential revenue growth during the fourth
quarter.
we expect sequential revenue growth during the fourth
quarter.
n We anticipate slower materials revenue growth for the fourth
quarter of 2009.
quarter of 2009.
n We expect service revenue to lag in its recovery behind systems
and materials.
and materials.
o We intend to grow our newly created 3Dproparts™ activity
both internally and through additional strategic acquisitions.
both internally and through additional strategic acquisitions.
n We expect sales of 3Dproparts™ to reach a minimum level of
10% of total revenue by the end of 2010.
10% of total revenue by the end of 2010.
We expect to benefit competitively from our new and expanded
products and services portfolio and stronger financial position.
24

Looking Ahead: Operating Expenses And Cash
q We expect our gross profit margin to remain strong, notwithstanding lower
revenue, adverse systems mix and a negative 2-4 percentage point drag from
initial V-Flash® shipments.
revenue, adverse systems mix and a negative 2-4 percentage point drag from
initial V-Flash® shipments.
q We expect SG&A to be in the range of $8.5-10 million for the fourth quarter of
2009.
2009.
n Inclusive of our anticipated higher litigation expenses and increased operating
costs associated with the Acu-Cast acquisition.
costs associated with the Acu-Cast acquisition.
q We expect R&D spending for the fourth quarter of 2009 to be in the range of $2-
3 million without impairing our pace and rate of planned new product
introductions.
3 million without impairing our pace and rate of planned new product
introductions.
q We anticipate our capital spending to be in the range of $0.5-1 million for the
fourth quarter of 2009. This range does not include expenditures that may be
associated with acquisitions.
fourth quarter of 2009. This range does not include expenditures that may be
associated with acquisitions.
We recognize that the current market conditions present unique
opportunities to enhance our business model and expect to make additional
strategic investments in the coming periods.
opportunities to enhance our business model and expect to make additional
strategic investments in the coming periods.
25

Bottom Line
q With these growth initiatives in place, our
funnel of new opportunities for the remainder
of 2009 is stronger than it was in the third
quarter.
funnel of new opportunities for the remainder
of 2009 is stronger than it was in the third
quarter.
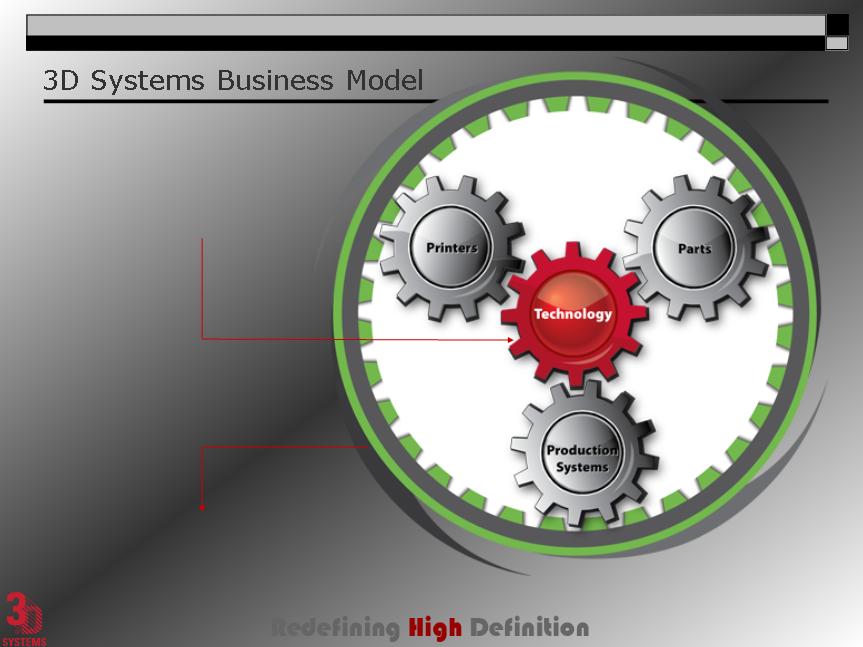
q Our three pillars of business: Parts, Printers
and Production Systems should help drive
demand for our products by OEMs.
and Production Systems should help drive
demand for our products by OEMs.
q Our business model is built around
significant, recurring revenue
components that have begun to generate
improved contribution margins.
significant, recurring revenue
components that have begun to generate
improved contribution margins.
We remain committed to our long-term growth
objectives and are confident in our ability to provide
value to our customers and stockholders.
objectives and are confident in our ability to provide
value to our customers and stockholders.
26

• Phone: 1-888-336-3485
• International: 1-706-634-0653
• Confirmation Code: 3602 8148
Question and Answer Session
27
A replay of this webcast will be
available approximately three hours
after the call on the 3D Systems
Investor Relations Web site,
www.3dsystems.com/ir.
available approximately three hours
after the call on the 3D Systems
Investor Relations Web site,
www.3dsystems.com/ir.
Check out our new 3Dproparts™
website at www.3Dproparts.com
website at www.3Dproparts.com
Thank You For Participating
28