Exhibit 99.2

Second Quarter 2018 August 7, 2018

Welcome and Participants ⦁ Vyomesh Joshi ⦁ President & Chief Executive Officer ⦁ John McMullen ⦁ Executive Vice President & Chief Financial Officer ⦁ Patrick Rogers ⦁ Assistant General Counsel ⦁ Stacey Witten ⦁ Vice President, IR and FP&A To participate via phone, please dial: In the US: 1 - 877 - 407 - 8291 Outside the US: 1 - 201 - 689 - 8345 2

Forward Looking Statements This presentation contains certain statements that are not statements of historical or current facts are forward - looking stateme nts within the meaning of the Private Securities Litigation Reform Act of 1995. Forward - looking statements include statements concerning plans, objectives, goals, strategies, expectations , intentions, projections, developments, future events, performance or products, underlying assumptions, and other statements which are other than statements of historical facts. I n s ome cases, you can identify forward - looking statements by terms such as “believes,” “beliefs,” ''may,'' ''will,'' ''should,'' expects,'' ''intends,'' ''plans,'' ''anticipates,'' ''est ima tes,'' ''predicts,'' ''projects,'' ''potential,'' ''continue,'' and other similar terminology or the negative of these terms. From time to time, we may publish or otherwise make available forward - looking statements of thi s nature. All such forward - looking statements, whether written or oral, and whether made by us or on our behalf, are expressly qualified by the cautionary statements described on t his message including those set forth below. Forward - looking statements are based upon management’s beliefs, assumptions and current expectations concerning future events an d trends, using information currently available, and are necessarily subject to uncertainties, many of which are outside our control. In addition, we undertake no obligation to u pda te or revise any forward - looking statements made by us or on our behalf, whether as a result of future developments, subsequent events or circumstances, or otherwise, or to reflect the o ccu rrence or likelihood of unanticipated events, and we disclaim any such obligation. Forward - looking statements are only predictions that relate to future events or our future performance and are subject to known and unknown risks, uncertainties, assumptions, and other factors, many of which are beyond our control, that may cause actual results, outcomes, levels of activity, performance, deve lop ments, or achievements to be materially different from any future results, outcomes, levels of activity, performance, developments, or achievements expressed, anticipated, or implied b y t hese forward - looking statements. Although we believe that the expectations reflected in the forward - looking statements are reasonable, forward - looking statements are not, and should not be relied upon as a guarantee of future performance or results, nor will they necessarily prove to be accurate indications of the times at or by which any such performance or resul ts will be achieved. 3D System’s actual results could differ materially from those stated or implied in forward - looking statements. Past performance is not necessarily indicative of future results. We do not undertake any obligation to and do not intend to update any forward - looking statements whether as a result of future developments, subsequent events or circumstances o r otherwise. Further, we encourage you to review “Risk Factors” in Part 1 of our Annual Report on Form 10 - K and Part II of our quarterly repo rts on Form 10 - Q filed with the SEC as well as other information about us in our filings with the SEC. These are available at www.SEC.gov. 3

Vyomesh Joshi (VJ) President & Chief Executive Officer

Execution and Progress 5 • We believe we are turning the corner in the transformation of the company and are seeing early returns on our investments • We have made significant progress to drive growth and improve execution worldwide • We improved Net Promoter Score (NPS) another 10 points, increased customer satisfaction scores and improved customer loyalty measures • Our go - to - market strategy is more effective with better sales motions and enhanced sales tools based on meeting customer needs • We have the broadest portfolio in the industry and multiple sales channels to meet the needs of a wide range of customers and the broad market opportunity
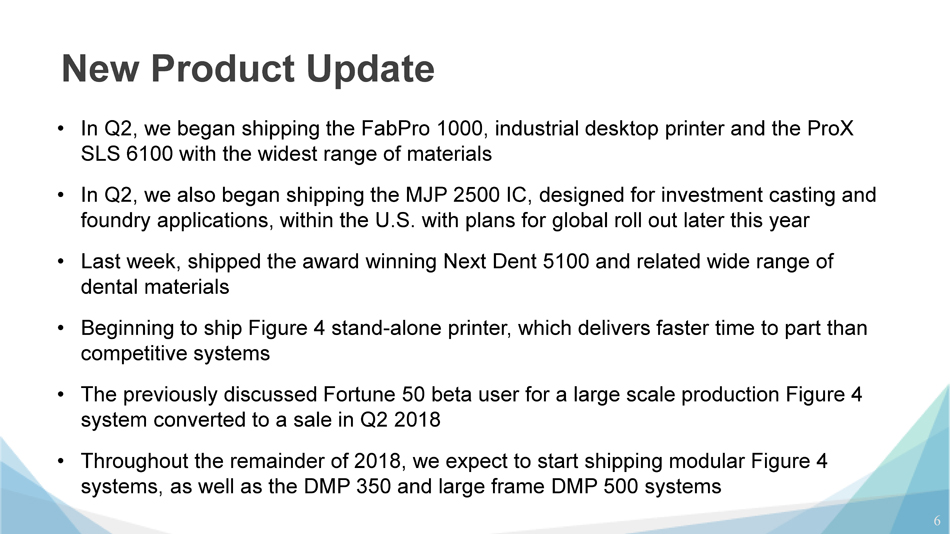
New Product Update 6 • In Q2, we began shipping the FabPro 1000, industrial desktop printer and the ProX SLS 6100 with the widest range of materials • In Q2, we also began shipping the MJP 2500 IC, designed for investment casting and foundry applications, within the U.S. with plans for global roll out later this year • Last week, shipped the award winning Next Dent 5100 and related wide range of dental materials • Beginning to ship Figure 4 stand - alone printer, which delivers faster time to part than competitive systems • The previously discussed Fortune 50 beta user for a large scale production Figure 4 system converted to a sale in Q2 2018 • Throughout the remainder of 2018, we expect to start shipping modular Figure 4 systems, as well as the DMP 350 and large frame DMP 500 systems
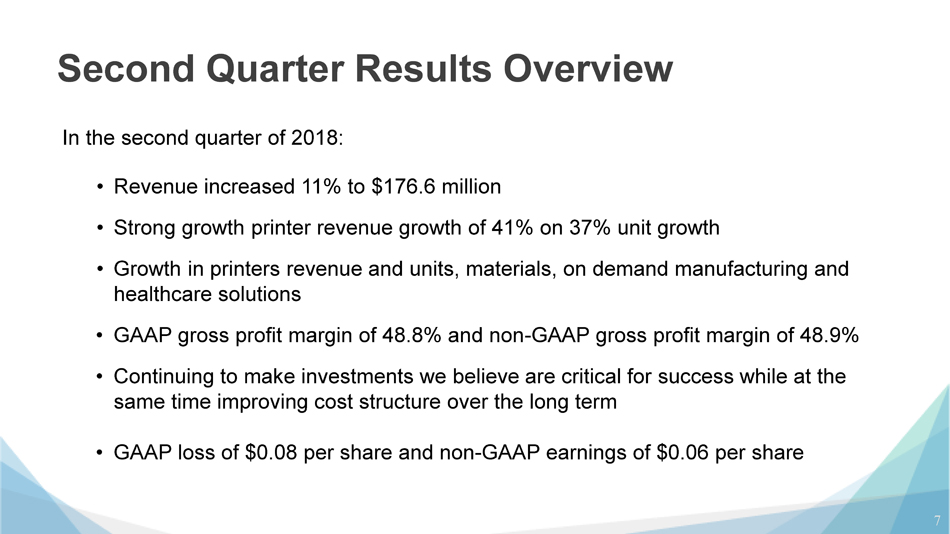
Second Quarter Results Overview 7 • Revenue increased 11% to $176.6 million • Strong growth printer revenue growth of 41% on 37% unit growth • Growth in printers revenue and units, materials, on demand manufacturing and healthcare solutions • GAAP gross profit margin of 48.8% and non - GAAP gross profit margin of 48.9% • Continuing to make investments we believe are critical for success while at the same time improving cost structure over the long term • GAAP loss of $0.08 per share and non - GAAP earnings of $0.06 per share In the second quarter of 2018:

John McMullen Executive Vice President & Chief Financial Officer
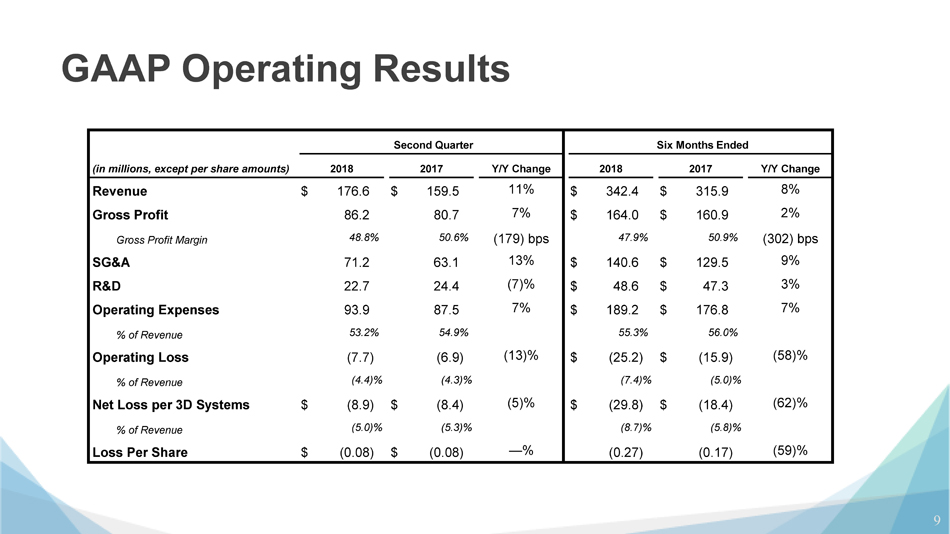
GAAP Operating Results 9 Second Quarter Six Months Ended (in millions, except per share amounts) 2018 2017 Y/Y Change 2018 2017 Y/Y Change Revenue $ 176.6 $ 159.5 11% $ 342.4 $ 315.9 8% Gross Profit 86.2 80.7 7% $ 164.0 $ 160.9 2% Gross Profit Margin 48.8 % 50.6 % (179) bps 47.9 % 50.9 % (302) bps SG&A 71.2 63.1 13% $ 140.6 $ 129.5 9% R&D 22.7 24.4 (7)% $ 48.6 $ 47.3 3% Operating Expenses 93.9 87.5 7% $ 189.2 $ 176.8 7% % of Revenue 53.2 % 54.9 % 55.3 % 56.0 % Operating Loss (7.7 ) (6.9 ) (13)% $ (25.2 ) $ (15.9 ) (58)% % of Revenue (4.4 )% (4.3 )% (7.4 )% (5.0 )% Net Loss per 3D Systems $ (8.9 ) $ (8.4 ) (5)% $ (29.8 ) $ (18.4 ) (62)% % of Revenue (5.0 )% (5.3 )% (8.7 )% (5.8 )% Loss Per Share $ (0.08 ) $ (0.08 ) — % (0.27 ) (0.17 ) (59)%
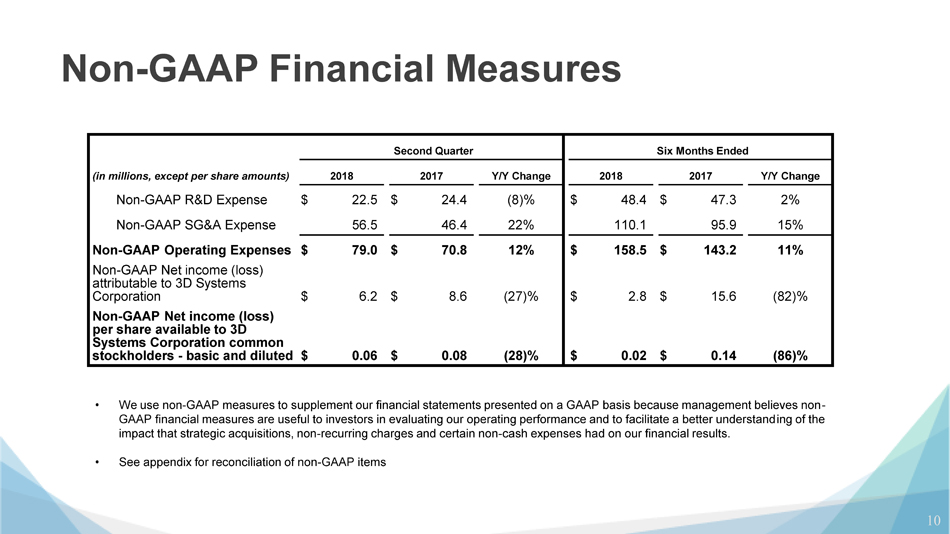
Non - GAAP Financial Measures 10 • We use non - GAAP measures to supplement our financial statements presented on a GAAP basis because management believes non - GAAP financial measures are useful to investors in evaluating our operating performance and to facilitate a better understand ing of the impact that strategic acquisitions, non - recurring charges and certain non - cash expenses had on our financial results. • See appendix for reconciliation of non - GAAP items Second Quarter Six Months Ended (in millions, except per share amounts) 2018 2017 Y/Y Change 2018 2017 Y/Y Change Non - GAAP R&D Expense $ 22.5 $ 24.4 (8)% $ 48.4 $ 47.3 2% Non - GAAP SG&A Expense 56.5 46.4 22% 110.1 95.9 15% Non - GAAP Operating Expenses $ 79.0 $ 70.8 12% $ 158.5 $ 143.2 11% Non - GAAP Net income (loss) attributable to 3D Systems Corporation $ 6.2 $ 8.6 (27)% $ 2.8 $ 15.6 (82)% Non - GAAP Net income (loss) per share available to 3D Systems Corporation common stockholders - basic and diluted $ 0.06 $ 0.08 (28)% $ 0.02 $ 0.14 (86)%
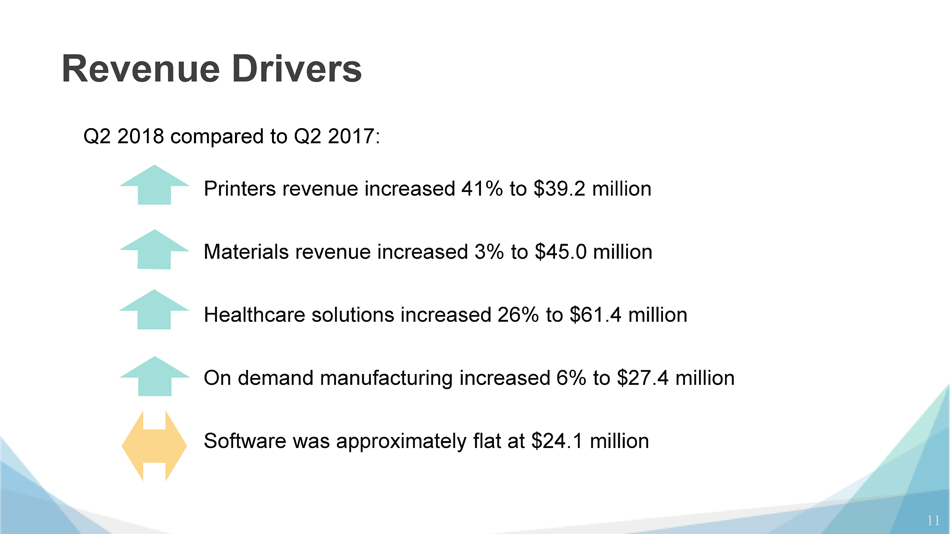
Revenue Drivers Printers revenue increased 41% to $39.2 million Materials revenue increased 3% to $45.0 million Healthcare solutions increased 26% to $61.4 million On demand manufacturing increased 6% to $27.4 million Software was approximately flat at $24.1 million Q2 2018 compared to Q2 2017: 11
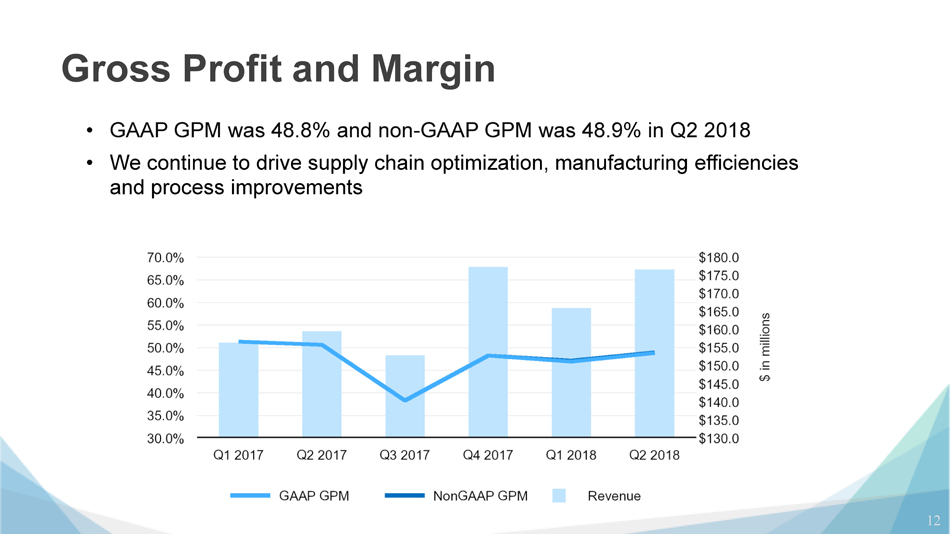
Gross Profit and Margin • GAAP GPM was 48.8% and non - GAAP GPM was 48.9% in Q2 2018 • We continue to drive supply chain optimization, manufacturing efficiencies and process improvements 12
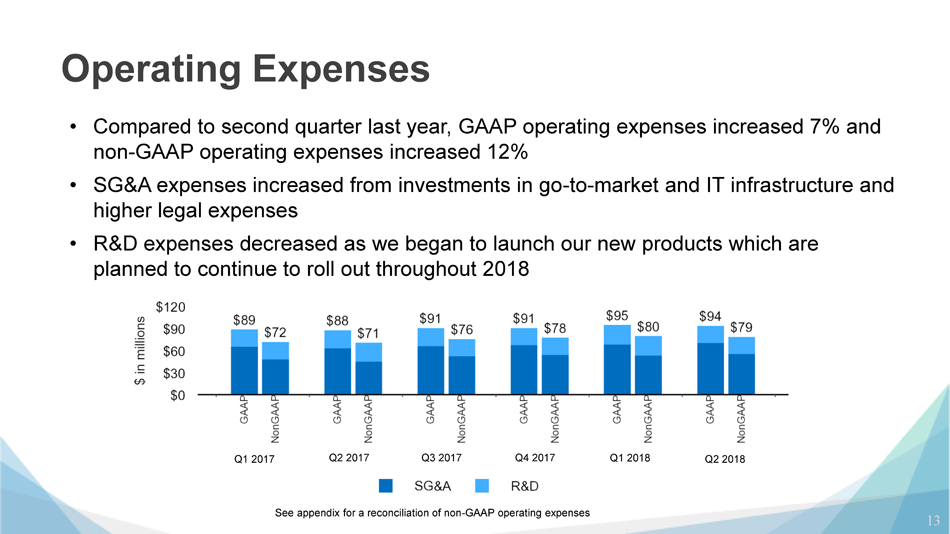
Operating Expenses 13 • GAAP operating expenses increased 7% and non - GAAP operating expenses increased 12% compared to the first quarter of the prior year • SG&A expenses increased from investments in go - to - market and IT infrastructure and higher legal expenses • R&D expenses decreased as we began to launch our new products which are planned to continue to roll out throughout 2018 Q1 2017 Q2 2017 Q3 2017 Q4 2017 Q1 2018 See appendix for a reconciliation of non - GAAP operating expenses Q2 2018
Vyomesh Joshi (VJ) President & Chief Executive Officer
Redefining Manufacturing 15 • Partnership with Georg Fischer machining solutions, one of the world's leading providers in precision machining. • Immediately expands our global network and market opportunity • We are excited to be working with a partner of the caliber of GF Machining Solutions to redefine manufacturing and the factory of the future. • Together, we plan to offer an integrated additive and subtractive solution with automation and post processing to provide seamless workflows for advanced manufacturing while reducing total cost of operation • We plan to debut our first combined solution at IMTS in Chicago the week of September 10, 2018
Conclusion 16 • We are pleased with our results this quarter and the progress we have made to transform the company and improve execution to leverage our unmatched offering of additive solutions for the entire digital manufacturing workflow. • We are very excited about our enhanced and complete end - to - end portfolio, ongoing innovation and significant market opportunities, while continuing to be keenly focused on execution and operational efficiency to drive long - term growth and profitability.

Q&A Session In the USA: 1 - 877 - 407 - 8291 Outside the USA: 1 - 201 - 689 - 8345
Thank You
Appendix

Revenue Summary by Category 20 (in millions) Q2 2018 Q1 2018 Q2 2017 Sequential Change YOY Change Printers $ 39.2 $ 39.1 $ 27.7 — % 41% Software Products 12.9 12.3 12.8 5% 1% Other Products 13.7 11.2 13.2 22% 4% Total Products 65.7 62.6 53.7 5% 22% Total Materials 45.0 42.5 43.9 6% 3% On Demand Manufacturing 27.4 25.7 25.8 7% 6% Software Services 11.2 10.8 11.2 4% — % Other Services 27.2 24.3 24.9 12% 9% Total Services 65.8 60.8 61.9 8% 6% Total Revenue $ 176.6 $ 165.9 $ 159.5 6% 11% Software $ 24.1 $ 23.1 $ 24.0 4% — % Healthcare $ 61.4 $ 52.4 $ 48.5 17% 26% Second Quarter 2018 Comparative Analysis
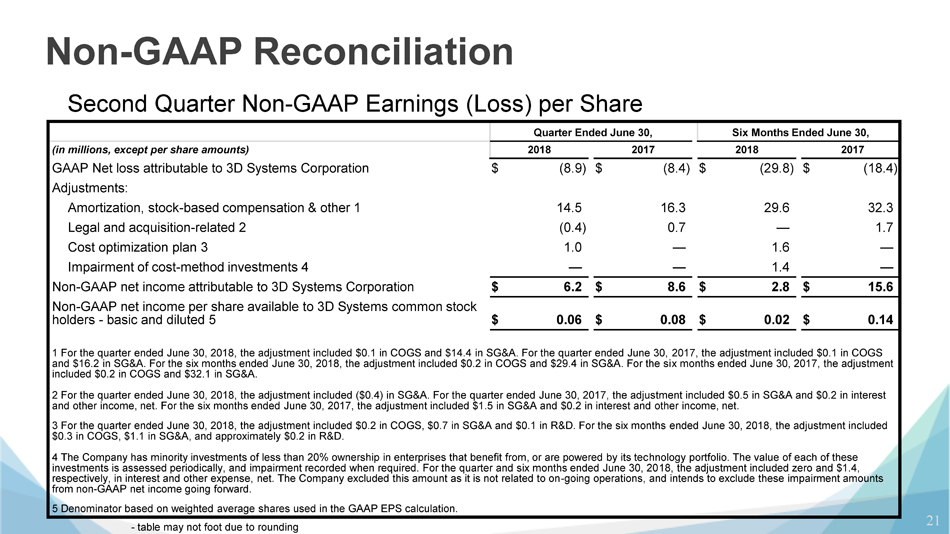
Non - GAAP Reconciliation 21 Second Quarter Non - GAAP Earnings (Loss) per Share Quarter Ended June 30, Six Months Ended June 30, (in millions, except per share amounts) 2018 2017 2018 2017 GAAP Net loss attributable to 3D Systems Corporation $ (8.9 ) $ (8.4 ) $ (29.8 ) $ (18.4 ) Adjustments: Amortization, stock - based compensation & other 1 14.5 16.3 29.6 32.3 Legal and acquisition - related 2 (0.4 ) 0.7 — 1.7 Cost optimization plan 3 1.0 — 1.6 — Impairment of cost - method investments 4 — — 1.4 — Non - GAAP net income attributable to 3D Systems Corporation $ 6.2 $ 8.6 $ 2.8 $ 15.6 Non - GAAP net income per share available to 3D Systems common stock holders - basic and diluted 5 $ 0.06 $ 0.08 $ 0.02 $ 0.14 1 For the quarter ended June 30, 2018, the adjustment included $0.1 in COGS and $14.4 in SG&A. For the quarter ended June 30, 20 17, the adjustment included $0.1 in COGS and $16.2 in SG&A. For the six months ended June 30, 2018, the adjustment included $0.2 in COGS and $29.4 in SG&A. For the si x m onths ended June 30, 2017, the adjustment included $0.2 in COGS and $32.1 in SG&A. 2 For the quarter ended June 30, 2018, the adjustment included ($0.4) in SG&A. For the quarter ended June 30, 2017, the adjus tme nt included $0.5 in SG&A and $0.2 in interest and other income, net. For the six months ended June 30, 2017, the adjustment included $1.5 in SG&A and $0.2 in interest and oth er income, net. 3 For the quarter ended June 30, 2018, the adjustment included $0.2 in COGS, $0.7 in SG&A and $0.1 in R&D. For the six months en ded June 30, 2018, the adjustment included $0.3 in COGS, $1.1 in SG&A, and approximately $0.2 in R&D. 4 The Company has minority investments of less than 20% ownership in enterprises that benefit from, or are powered by its tec hno logy portfolio. The value of each of these investments is assessed periodically, and impairment recorded when required. For the quarter and six months ended June 30, 20 18, the adjustment included zero and $1.4, respectively, in interest and other expense, net. The Company excluded this amount as it is not related to on - going operations, and intends to exclude these impairment amounts from non - GAAP net income going forward. 5 Denominator based on weighted average shares used in the GAAP EPS calculation. - table may not foot due to rounding
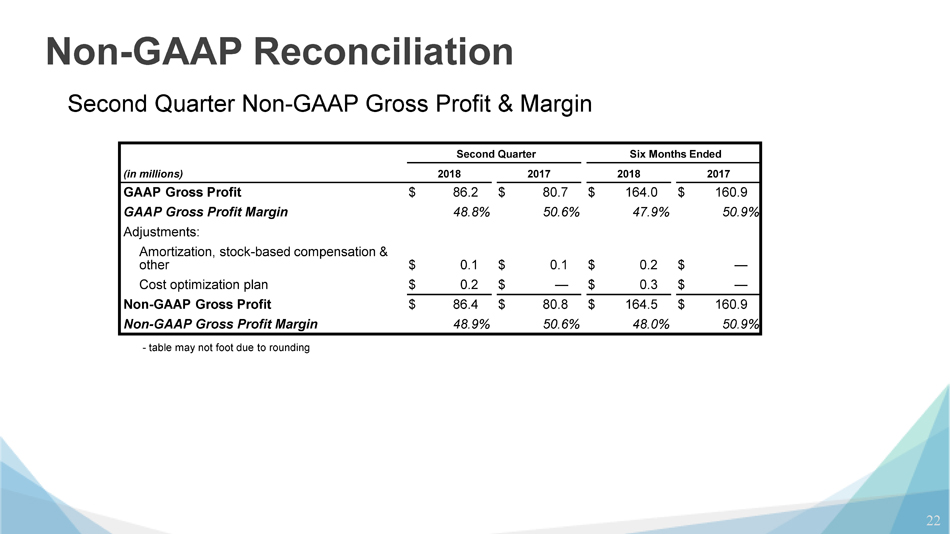
Non - GAAP Reconciliation 22 Second Quarter Non - GAAP Gross Profit & Margin Second Quarter Six Months Ended (in millions) 2018 2017 2018 2017 GAAP Gross Profit $ 86.2 $ 80.7 $ 164.0 $ 160.9 GAAP Gross Profit Margin 48.8 % 50.6 % 47.9 % 50.9 % Adjustments: Amortization, stock - based compensation & other $ 0.1 $ 0.1 $ 0.2 $ — Cost optimization plan $ 0.2 $ — $ 0.3 $ — Non - GAAP Gross Profit $ 86.4 $ 80.8 $ 164.5 $ 160.9 Non - GAAP Gross Profit Margin 48.9 % 50.6 % 48.0 % 50.9 % - table may not foot due to rounding

Non - GAAP Reconciliation 23 Second Quarter Non - GAAP Operating Expenses Second Quarter Six Months Ended (in millions) 2018 2017 2018 2017 GAAP R&D Expenses $ 22.7 $ 24.4 $ 48.6 $ 47.3 GAAP SG&A Expenses 71.2 63.1 140.6 129.5 GAAP Operating Expenses $ 93.9 $ 87.5 $ 189.2 $ 176.8 Adjustments to R&D Expenses: Cost optimization plan 0.2 — 0.2 — Non - GAAP R&D Expenses $ 22.5 $ 24.4 $ 48.4 $ 47.3 Adjustments to SG&A Expenses: Amortization, stock - based compensation & other 14.3 16.2 29.4 32.1 Legal and acquisition - related (0.4 ) 0.5 — 1.5 Cost optimization plan 0.7 — 1.1 — Total Adjustments to SG&A Expenses 14.7 16.7 30.5 33.6 Non - GAAP SG&A Expenses $ 56.5 $ 46.4 $ 110.1 $ 95.9 Non - GAAP Operating Expenses $ 79.0 $ 70.8 $ 158.5 $ 143.2 - table may not foot due to rounding

Non - GAAP Reconciliation 24 First Quarter Non - GAAP Gross Profit and Margin First Quarter (in millions) 2018 2017 GAAP Gross Profit $ 77.9 $ 80.2 GAAP Gross Profit Margin 46.9 % 51.3 % Adjustments: Amortization, stock - based compensation & other 0.1 0.1 Cost optimization plan 0.2 — Non - GAAP Gross Profit $ 78.1 $ 80.3 Non - GAAP Gross Profit Margin 47.1 % 51.3 % - table may not foot due to rounding
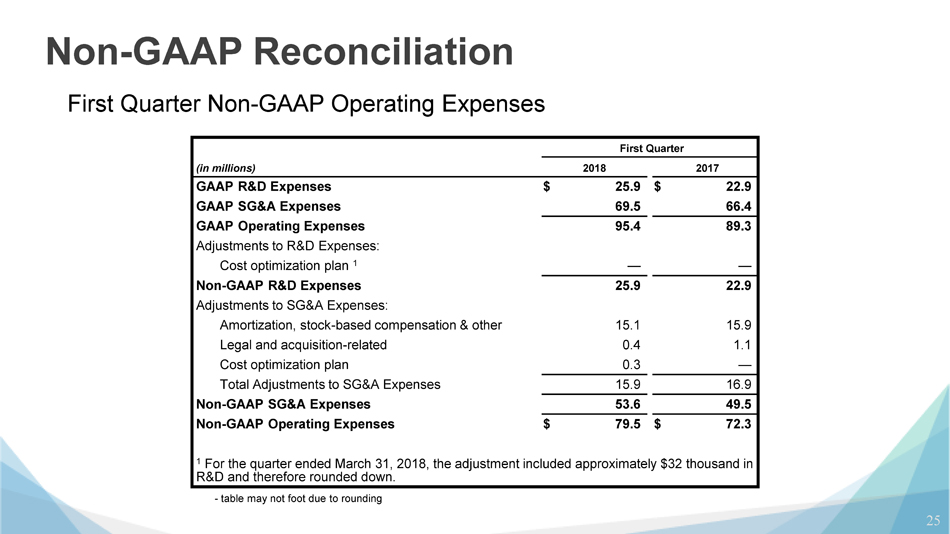
Non - GAAP Reconciliation 25 First Quarter Non - GAAP Operating Expenses First Quarter (in millions) 2018 2017 GAAP R&D Expenses $ 25.9 $ 22.9 GAAP SG&A Expenses 69.5 66.4 GAAP Operating Expenses 95.4 89.3 Adjustments to R&D Expenses: Cost optimization plan 1 — — Non - GAAP R&D Expenses 25.9 22.9 Adjustments to SG&A Expenses: Amortization, stock - based compensation & other 15.1 15.9 Legal and acquisition - related 0.4 1.1 Cost optimization plan 0.3 — Total Adjustments to SG&A Expenses 15.9 16.9 Non - GAAP SG&A Expenses 53.6 49.5 Non - GAAP Operating Expenses $ 79.5 $ 72.3 1 For the quarter ended March 31, 2018, the adjustment included approximately $32 thousand in R&D and therefore rounded down. - table may not foot due to rounding
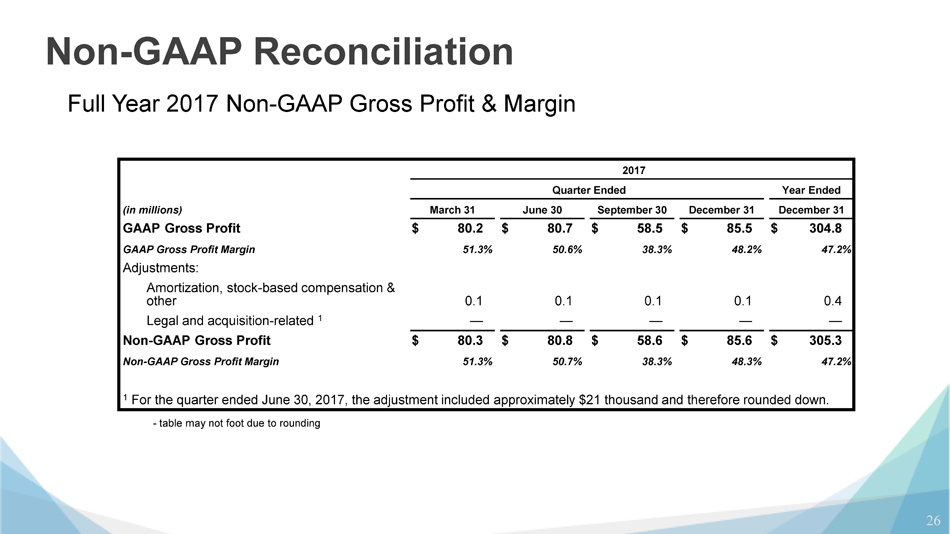
Non - GAAP Reconciliation 26 Full Year 2017 Non - GAAP Gross Profit & Margin 2017 Quarter Ended Year Ended (in millions) March 31 June 30 September 30 December 31 December 31 GAAP Gross Profit $ 80.2 $ 80.7 $ 58.5 $ 85.5 $ 304.8 GAAP Gross Profit Margin 51.3 % 50.6 % 38.3 % 48.2 % 47.2 % Adjustments: Amortization, stock - based compensation & other 0.1 0.1 0.1 0.1 0.4 Legal and acquisition - related 1 — — — — — Non - GAAP Gross Profit $ 80.3 $ 80.8 $ 58.6 $ 85.6 $ 305.3 Non - GAAP Gross Profit Margin 51.3 % 50.7 % 38.3 % 48.3 % 47.2 % 1 For the quarter ended June 30, 2017, the adjustment included approximately $21 thousand and therefore rounded down. - table may not foot due to rounding

Non - GAAP Reconciliation 27 Full Year 2017 Non - GAAP Operating Expenses 2017 Quarter Ended Year Ended (in millions) March 31 June 30 September 30 December 31 December 31 GAAP R&D Expenses $ 22.9 $ 24.4 $ 24.4 $ 23.0 $ 94.6 GAAP SG&A Expenses 66.4 63.1 66.5 68.2 264.2 GAAP Operating Expenses 89.3 87.5 90.9 91.2 358.8 Non - GAAP R&D Expenses 22.9 24.4 24.4 23.0 94.6 Adjustments to SG&A Expenses: Amortization, stock - based compensation & other 15.9 16.2 15.8 15.0 62.5 Legal and acquisition - related 1.1 0.5 (0.8 ) (1.4 ) (0.3 ) Total Adjustments to SG&A Expenses 17.0 16.7 15.0 13.6 62.2 Non - GAAP SG&A Expenses 49.4 46.4 51.5 54.6 202.0 Non - GAAP Operating Expenses $ 72.3 $ 70.8 $ 75.9 $ 77.6 $ 296.6 - table may not foot due to rounding

Thank You