EXHIBIT 99.2

Fourth Quarter 202 2 Financial Results March 1 , 202 3

2 Welcome and Participants Dr. Jeffrey Graves President & Chief Executive Officer Michael Turner Executive Vice President & Chief Financial Officer Andrew Johnson Executive Vice President & Chief Legal Officer Russell Johnson Vice President, Treasury & Investor Relations To participate via phone, please dial: 1 - 201 - 689 - 8345
Certain statements made in this presentation that are not statements of historical or current facts are forward - looking statements within the meaning of the Private Securities Litigation Reform Act of 1995 . Forward - looking statements involve known and unknown risks, uncertainties and other factors that may cause the actual results, performance or achievements of the company to be materially different from historical results or from any future results or projections expressed or implied by such forward - looking statements . In many cases, forward looking statements can be identified by terms such as “believes,” “belief,” “expects,” “may,” “will,” “estimates,” “intends,” “anticipates” or “plans” or the negative of these terms or other comparable terminology . Forward - looking statements are based upon management’s beliefs, assumptions and current expectations and may include comments as to the company’s beliefs and expectations as to future events and trends affecting its business and are necessarily subject to uncertainties, many of which are outside the control of the company . The factors described under the headings “Forward - Looking Statements” and “Risk Factors” in the company’s periodic filings with the Securities and Exchange Commission, as well as other factors, could cause actual results to differ materially from those reflected or predicted in forward - looking statements . Although management believes that the expectations reflected in the forward - looking statements are reasonable, forward - looking statements are not, and should not be relied upon as a guarantee of future performance or results, nor will they necessarily prove to be accurate indications of the times at which such performance or results will be achieved . The forward - looking statements included are made only as the date of the statement . 3 D Systems undertakes no obligation to update or revise any forward - looking statements made by management or on its behalf, whether as a result of future developments, subsequent events or circumstances or otherwise, except as required by law Further, we encourage you to review “Risk Factors” in Part 1 of our Annual Report on Form 10 - K and Part II of our Quarterly Reports on Form 10 - Q filed with the SEC as well as other information about us in our filings with the SEC . These are available at www . SEC . gov . 3 Forward Looking Statements

Dr. Jeffrey Graves President & Chief Executive Officer 4

5 2022 Highlights • Challenging 2022 business environment • Macroeconomic and geopolitical headwinds • Softer dental market demand due to inflationary pressure on elective procedures • Pivoted in second half of year to finish near revised guidance • Efficiency gains from manufacturing in - sourcing • 2022 was year of strategic investment • Platform refreshes • Technology acquisitions • Regenerative medicine • Business well positioned for continued growth
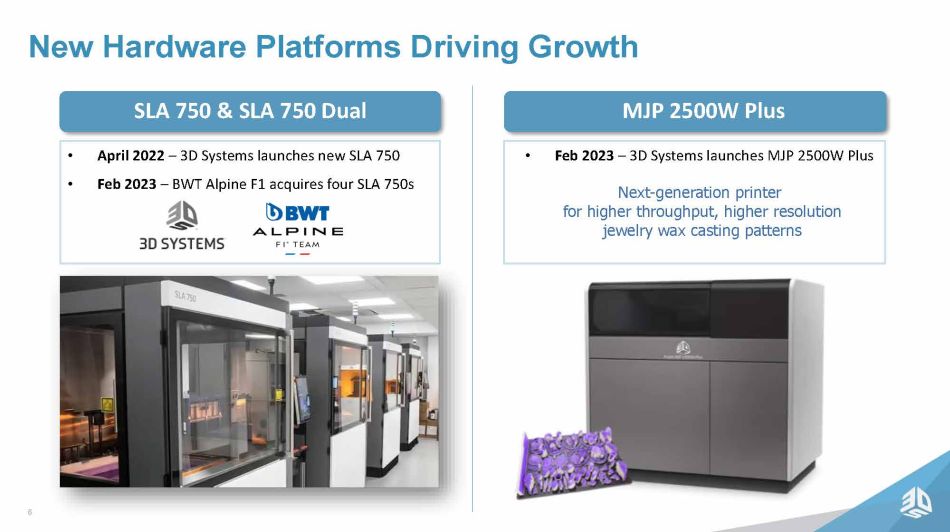
New Hardware Platforms Driving Growth 6 • April 2022 – 3D Systems launches new SLA 750 • Feb 2023 – BWT Alpine F1 acquires four SLA 750s SLA 750 & SLA 750 Dual MJP 2500W Plus • Feb 2023 – 3D Systems launches MJP 2500W Plus Next - generation printer for higher throughput, higher resolution jewelry wax casting patterns
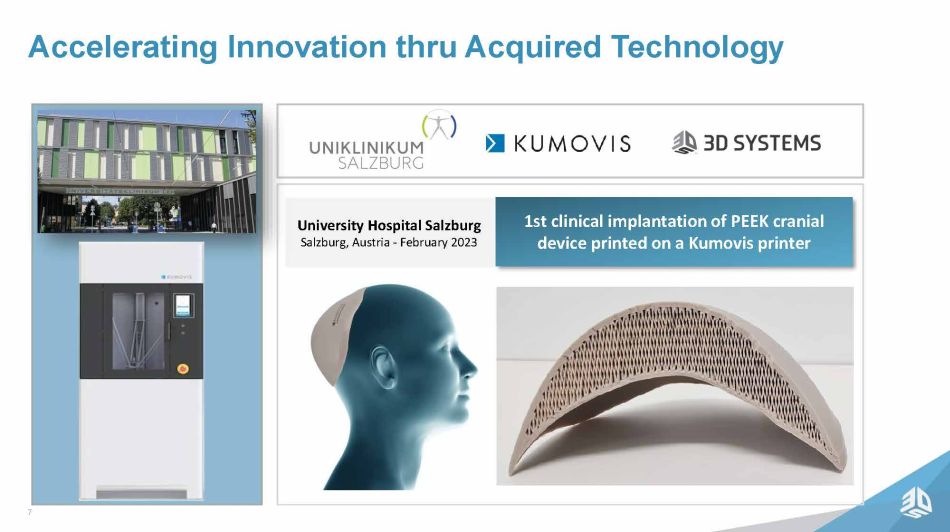
Accelerating Innovation thru Acquired Technology 7 University Hospital Salzburg Salzburg, Austria - February 2023 1st clinical implantation of PEEK cranial device printed on a Kumovis printer

Organ development partnership since 2017 Acquired in 2021 to expand bioprinting capabilities 35+ Years of developing advanced 3D printing applications Human Organs Regenerative Tissue Program Drug Development 3D printed human lung scaffold x 2 Lobes x 5,000 kilometers of vasculature x 213 Million Alveoli x 44 Trillion Voxels Most Complex Object Ever 3D Printed Vascularized Breast Tissue Scaffold for Implantation & Cellularization Bioprinted “Organ - on - a - chip” can accurately replicate organ - specific drug response in pre - clinical drug trials h - VIOS 2 chip with perfused vasculature 3D Systems Bioprinting Leadership 3D Systems Proprietary and Confidential Investing in Regenerative Medicine
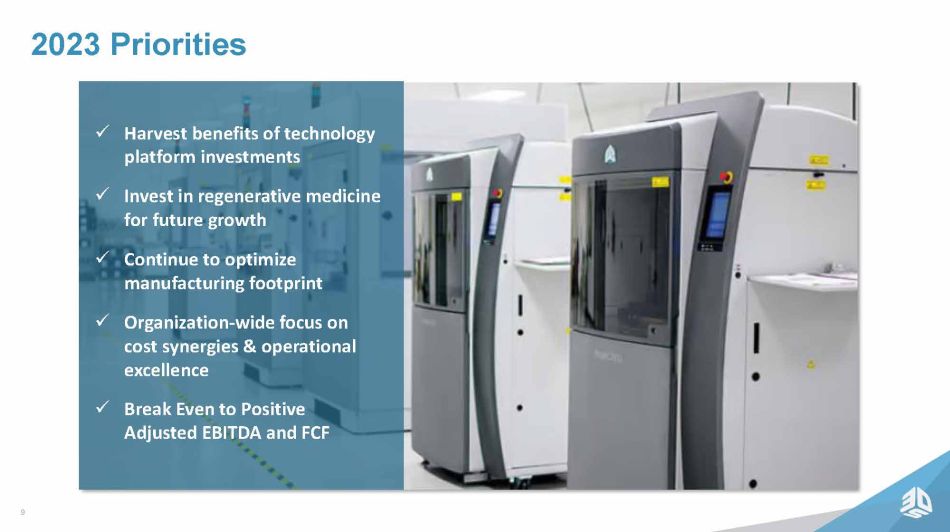
9 2023 Priorities x Harvest benefits of technology platform investments x Invest in regenerative medicine for future growth x Continue to optimize manufacturing footprint x Organization - wide focus on cost synergies & operational excellence x Break Even to Positive Adjusted EBITDA and FCF

Michael Turner Chief Financial Officer 10
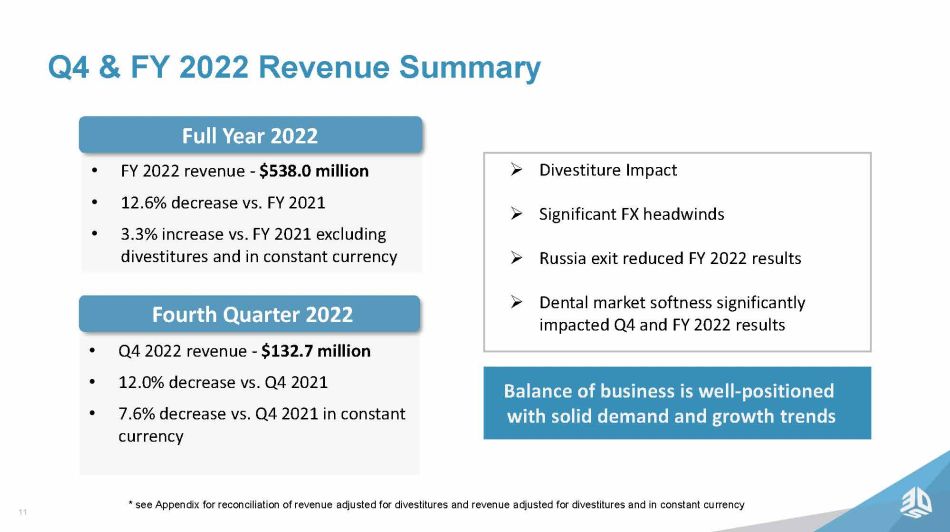
11 Q4 & FY 2022 Revenue Summary * see Appendix for reconciliation of revenue adjusted for divestitures and revenue adjusted for divestitures and in constant cu rre ncy • Q4 2022 revenue - $132.7 million • 12.0% decrease vs. Q4 2021 • 7.6% decrease vs. Q4 2021 in constant currency • FY 2022 revenue - $538.0 million • 12.6% decrease vs. FY 2021 • 3.3% increase vs. FY 2021 excluding divestitures and in constant currency Full Year 2022 Fourth Quarter 2022 Balance of business is well - positioned with solid demand and growth trends » Divestiture Impact » Significant FX headwinds » Russia exit reduced FY 2022 results » Dental market softness significantly impacted Q4 and FY 2022 results
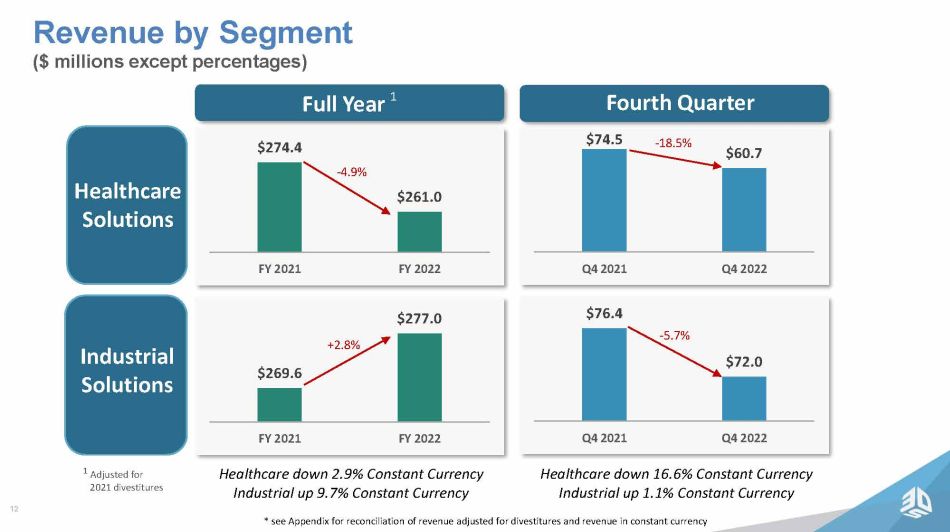
12 Revenue by Segment ($ millions except percentages) Healthcare Solutions Industrial Solutions Full Year $274.4 $261.0 FY 2021 FY 2022 $269.6 $277.0 FY 2021 FY 2022 - 4.9% +2.8% Healthcare down 2.9% Constant Currency Industrial up 9.7% Constant Currency Fourth Quarter $74.5 $60.7 Q4 2021 Q4 2022 $76.4 $72.0 Q4 2021 Q4 2022 Healthcare down 16.6% Constant Currency Industrial up 1.1% Constant Currency - 18.5% - 5.7% 1 1 Adjusted for 2021 divestitures * see Appendix for reconciliation of revenue adjusted for divestitures and revenue in constant currency

13 Gross Profit Margin (non - GAAP) 44% 40% 38% 40% 41% 30% 35% 40% 45% 50% Q4 2021 Q1 2022 Q2 2022 Q3 2022 Q4 2022 FY 2022 vs. FY 2021 • FY 2022 GM% of 39.8% vs. FY 2021 42.5% • Impacted by divestitures, inflation, freight, and mix Q4 2022 vs. Q4 2021 • Q4 2022 GM% of 40.9% vs. Q4 2021 44.1% • Impacted by divestitures, inflation, freight, and mix Sequential Improvement Q2 Q4 • Focus on operational excellence, including continued benefits from Q3 2022 in - sourcing actions FY 2022 – 39.8%
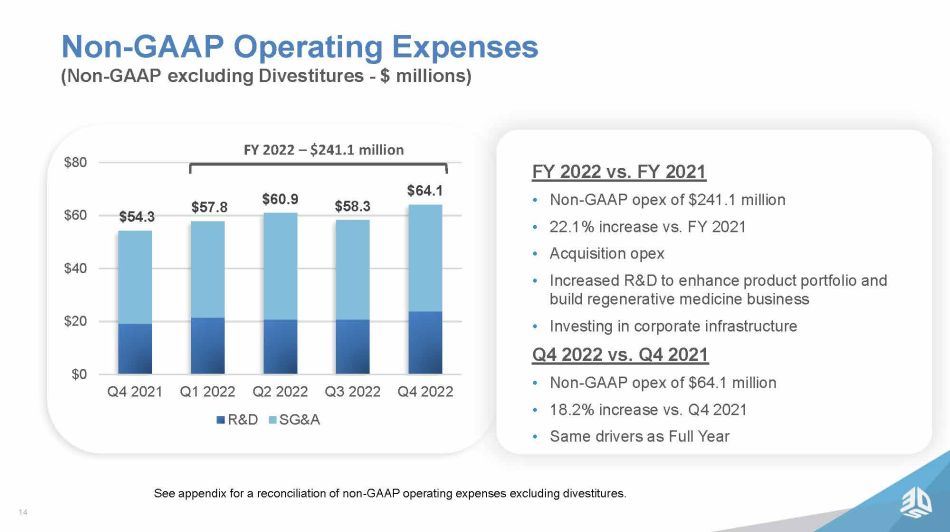
14 Non - GAAP Operating Expenses (Non - GAAP excluding Divestitures - $ millions) $54.3 $57.8 $ 60.9 $ 58.3 $64.1 $0 $20 $40 $60 $80 Q4 2021 Q1 2022 Q2 2022 Q3 2022 Q4 2022 R&D SG&A See appendix for a reconciliation of non - GAAP operating expenses excluding divestitures . FY 2022 vs. FY 2021 • Non - GAAP opex of $241.1 million • 22.1% increase vs. FY 2021 • Acquisition opex • Increased R&D to enhance product portfolio and build regenerative medicine business • Investing in corporate infrastructure Q4 2022 vs. Q4 2021 • Non - GAAP opex of $64.1 million • 18.2% increase vs. Q4 2021 • Same drivers as Full Year FY 2022 – $241.1 million
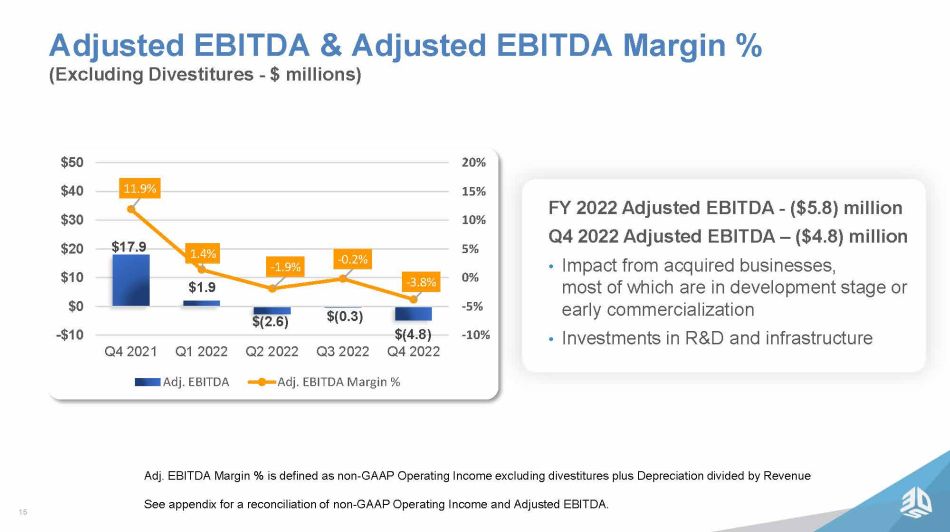
15 $17.9 $1.9 $(2.6) $(0.3) $(4.8) 11.9% 1.4% - 1.9% - 0.2% - 3.8% -10% -5% 0% 5% 10% 15% 20% -$10 $0 $10 $20 $30 $40 $50 Q4 2021 Q1 2022 Q2 2022 Q3 2022 Q4 2022 Adj. EBITDA Adj. EBITDA Margin % Adj. EBITDA Margin % is defined as non - GAAP Operating Income excluding divestitures plus Depreciation divided by Revenue See appendix for a reconciliation of n on - GAAP Operating Income and Adjusted EBITDA. FY 2022 Adjusted EBITDA - ($5.8) million Q4 2022 Adjusted EBITDA – ($4.8) million • Impact from acquired businesses, most of which are in development stage or early commercialization • Investments in R&D and infrastructure Adjusted EBITDA & Adjusted EBITDA Margin % (Excluding Divestitures - $ millions)

16 Strong Balance Sheet • Ended the quarter with $568.7 million dollars of cash and short - term investments • We have sufficient cash to support organic growth, including in regenerative medicine • Invested $104.3 million in acquisitions and investments in FY 2022 • Current focus is on operational execution and integration of recent acquisitions
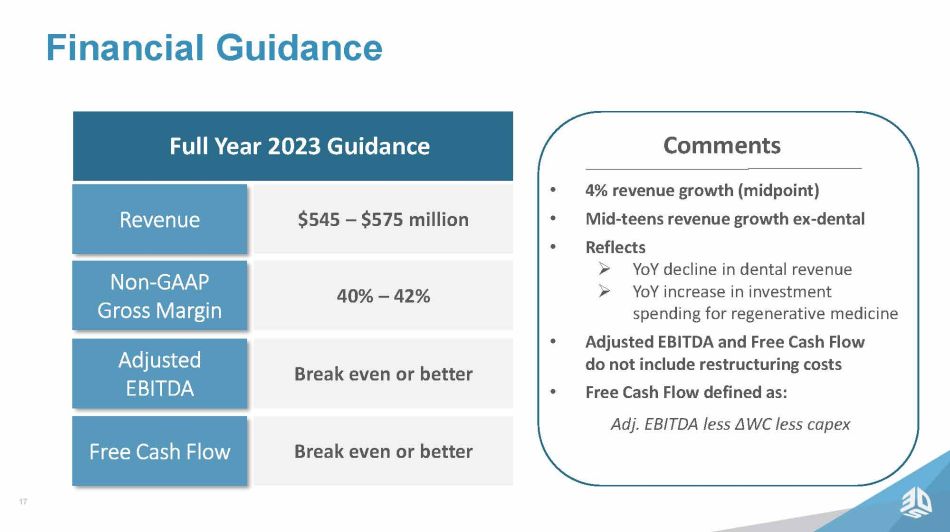
17 Financial Guidance Comments Full Year 2023 Guidance $545 – $575 million Revenue 40% – 42% Non - GAAP Gross Margin Break even or better Adjusted EBITDA Break even or better Free Cash Flow • 4% revenue growth (midpoint) • Mid - teens revenue growth ex - dental • Reflects » YoY decline in dental revenue » YoY increase in investment spending for regenerative medicine • Adjusted EBITDA and Free Cash Flow do not include restructuring costs • Free Cash Flow defined as: Adj. EBITDA less Δ WC less capex

18 Q&A Session 1 - 201 - 689 - 8345

19 Thank You Find out more at: www.3dsystems.com

©202 2 3D Systems, Inc. | All Rights Reserved. Appendix

21 Presentation of Information 3 D Systems reports its financial results in accordance with GAAP . Management also reviews and reports certain non - GAAP measures, including : non - GAAP revenue excluding divestitures and on a constant currency basis (sometimes referred to as excluding divestitures and FX effects), non - GAAP Gross profit, non - GAAP Gross profit margin, non - GAAP Operating expenses, non - GAAP Operating (loss)/income, non - GAAP Interest and other income/(expense), net, non - GAAP Net income (loss), non - GAAP Basic and Diluted Income (Loss) per Share, adjusted EBITDA and adjusted EBITDA Margin . These non - GAAP measures exclude certain special items that management does not view as part of 3 D Systems’ underlying results as they may be highly variable, may be unusual or infrequent, are difficult to predict and can distort underlying business trends and results . Management believes that the non - GAAP measures provide useful additional insight into underlying business trends and results and provide a more meaningful comparison of period - over - period results . Additionally, management uses the non - GAAP measures for planning, forecasting and evaluating business and financial performance, including allocating resources and evaluating results relative to employee compensation targets . 3 D Systems’ non - GAAP measures are not calculated in accordance with or as required by GAAP and may not be calculated the same as similarly titled measures used by other companies . These non - GAAP measures should thus be considered as supplemental in nature and not considered in isolation or as a substitute for the related financial information prepared in accordance with GAAP . A reconciliation of GAAP to non - GAAP financial measures is provided in the accompanying schedules in the Appendix . 3 D Systems does not provide forward - looking guidance for certain measures on a GAAP basis . The company is unable to provide a quantitative reconciliation of forward - looking non - GAAP gross profit margins and non - GAAP operating expenses to the most directly comparable forward - looking GAAP measures without unreasonable effort because certain items, including legal, acquisition expenses, stock - compensation expense, intangible amortization expense, restructuring expenses, and goodwill impairment, are difficult to predict and estimate . These items are inherently uncertain and depend on various factors, many of which are beyond the company’s control, and as such, any associated estimate and its impact on GAAP performance could vary materially .

Non - GAAP Reconciliation – Quarter Ended Dec. 31, 2021 (Unaudited) 22

Non - GAAP Reconciliation – Quarter Ended March 31, 2022 (Unaudited) 23

Non - GAAP Reconciliation – Quarter Ended June 30, 2022 (Unaudited) 24

Non - GAAP Reconciliation – Quarter Ended Sept. 30, 2022 (Unaudited) 25
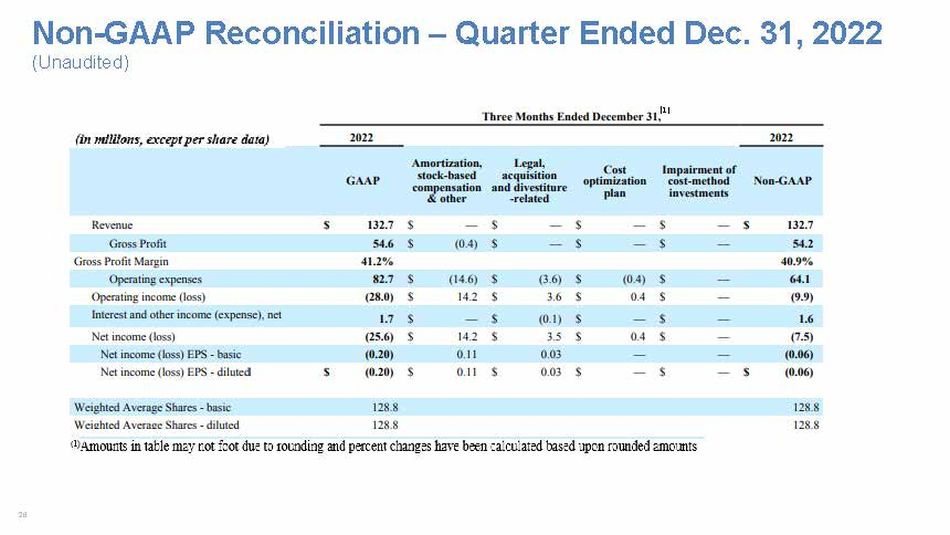
Non - GAAP Reconciliation – Quarter Ended Dec. 31, 2022 (Unaudited) 26 (1)

Non - GAAP Operating Income to Adjusted EBITDA Reconciliation (in Millions, Unaudited) 27 (in millions) Q4-2021 Q1-2022 Q2-2022 Q3-2022 Q4-2022 Revenue - 2021 excludes revenue from divestiture 150.9$ 133.0$ 140.0$ 132.3$ 132.7$ Non-GAAP Operating (loss) income 12.3 (3.9) (7.6) (5.5) (9.9) Depreciation 5.6 5.8 5.0 5.2 5.1 Adjusted EBITDA 17.9$ 1.9$ (2.6)$ (0.3)$ (4.8)$ Adjusted EBITDA Margin 11.9% 1.4% (1.9)% (0.2)% (3.6)% (1) Amounts in table may not foot due to rounding and percent changes have been calculated based on rounded amounts.
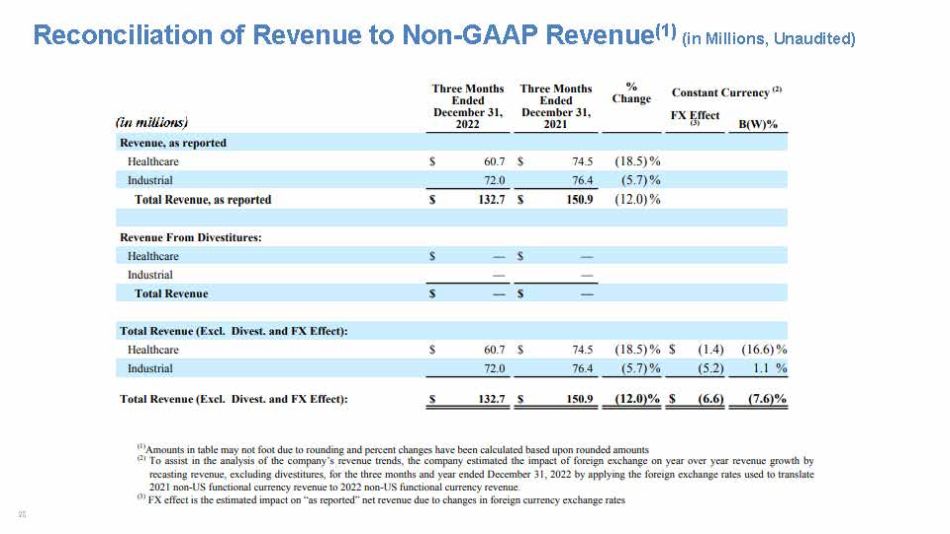
Reconciliation of Revenue to Non - GAAP Revenue (1) (in Millions, Unaudited) 28
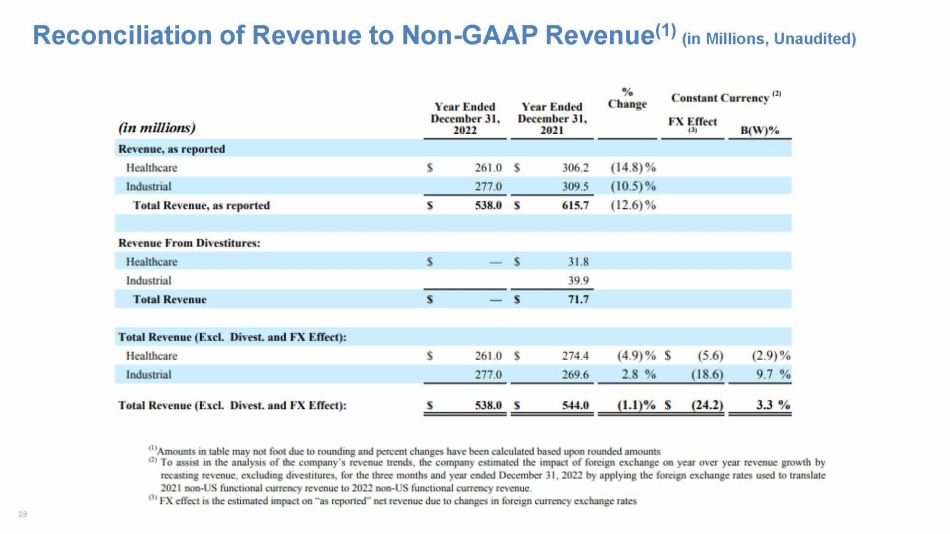
29 Reconciliation of Revenue to Non - GAAP Revenue (1) (in Millions, Unaudited)