UNITED STATES
SECURITIES AND EXCHANGE COMMISSION
Washington, D.C. 20549
FORM N-CSR
CERTIFIED SHAREHOLDER REPORT OF REGISTERED
MANAGEMENT INVESTMENT COMPANIES
Investment Company Act File Number: 811-07075
| T. Rowe Price Communications & Technology Fund, Inc. |
|
| (Exact name of registrant as specified in charter) |
| |
| 100 East Pratt Street, Baltimore, MD 21202 |
|
| (Address of principal executive offices) |
| |
| David Oestreicher |
| 100 East Pratt Street, Baltimore, MD 21202 |
|
| (Name and address of agent for service) |
Registrant’s telephone number, including area code: (410) 345-2000
Date of fiscal year end: December 31
Date of reporting period: December 31, 2018
Item 1. Report to Shareholders
| Communications & Technology Fund | December 31, 2018 |
Beginning on January 1, 2021, as permitted by SEC regulations, paper copies of the T. Rowe Price funds’ annual and semiannual shareholder reports will no longer be mailed, unless you specifically request them. Instead, shareholder reports will be made available on the funds’ website (troweprice.com/prospectus), and you will be notified by mail with a website link to access the reports each time a report is posted to the site.
If you already elected to receive reports electronically, you will not be affected by this change and need not take any action. At any time, shareholders who invest directly in T. Rowe Price funds may generally elect to receive reports or other communications electronically by enrolling attroweprice.com/paperlessor, if you are a retirement plan sponsor or invest in the funds through a financial intermediary (such as an investment advisor, broker-dealer, insurance company, or bank), by contacting your representative or your financial intermediary.
You may elect to continue receiving paper copies of future shareholder reports free of charge. To do so, if you invest directly with T. Rowe Price, please call T. Rowe Price as follows: IRA, nonretirement account holders, and institutional investors,1-800-225-5132; small business retirement accounts,1-800-492-7670. If you are a retirement plan sponsor or invest in the T. Rowe Price funds through a financial intermediary, please contact your representative or financial intermediary or follow additional instructions if included with this document. Your election to receive paper copies of reports will apply to all funds held in your account with your financial intermediary or, if you invest directly in the T. Rowe Price funds, with T. Rowe Price. Your election can be changed at any time in the future.
| T. ROWE PRICE COMMUNICATIONS & TECHNOLOGY FUND |
|
HIGHLIGHTS
| ■ | Stocks suffered their worst year in a decade as growth, interest rate, and trade worries weighed on sentiment.
|
| ■ | The Communications & Technology Fund recorded a small loss in 2018 but handily outperformed its benchmark.
|
| ■ | Leading U.S. internet firms pulled back late in the year but remained among our top contributors, while our Chinese internet holdings suffered from trade and regulatory concerns.
|
| ■ | As we did in our 2014 letter, we focus much of our discussion on why we are sticking with our largest detractor for the past year and what that reveals about our investment process. |

Log in to your account attroweprice.comfor more information.
*Certain mutual fund accounts that are assessed an annual account service fee can also save money by switching to e-delivery.
Management’s Discussion of Fund Performance
Fellow Shareholders
The past year was not an easy one for investors, but our fund managed to emerge from 2018 with only a modest loss. Our portfolio’s resilience was largely due to its focus on firms whose fortunes are less tied to the health of the overall economy, which helped as growth expectations dimmed considerably late in the year. Many of the top positions in our fund are companies that are exploiting the internet and other new technologies to create new markets or seize share in existing ones. To be sure, these firms will not be immune to a downturn should one arrive in the coming months, but we are optimistic that their longer-term prospects remain very bright.
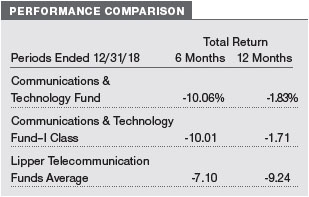
PERFORMANCE COMPARISON
The Communications & Technology Fund returned -1.83% in the year ended December 31, 2018. The fund again outpaced the Lipper Telecommunication Funds Average by a wide margin, and its long-term relative performanceremained exceptional, making it Lipper’s top-ranked fund in its category over the standard longer-term time periods ended in June. Based on cumulative total return, Lipper ranked the Communications & Technology Fund 3 of 34 (its I Class counterpart was ranked second), 1 of 33, 1 of 33, and 1 of30 telecommunication funds for the 1-, 3-, 5-, and 10-year periods ended December 31, 2018, respectively. (Returns for I Class shares varied, reflecting their different fee structure.Past performance cannot guarantee future results.)
MARKET ENVIRONMENT
Stocks endured their worst year in roughly a decade in 2018 as investors worried about a host of issues, including rising interest rates, slowing growth, and a deepening trade dispute between the U.S. and China. Markets fell sharply early in the year as longer-term bond yields spiked following signs of rising wage pressures. Bond yields fell back as wage gains soon moderated, but investors remained worried about inflation pressures as growth picked up following the fiscal stimulus from federal tax cuts and spending increases. Stocks regained momentum and reached new highs in October but then fell back again by year-end as inflation worries were replaced with growth concerns. Signs of a slowdown in Europe and a faster-than-expected drop-off in Chinese growth, along with some disappointing data in the U.S., weighed on sentiment.
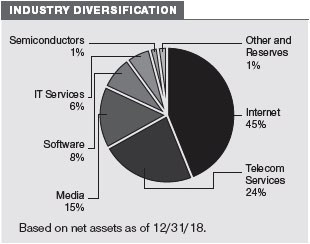
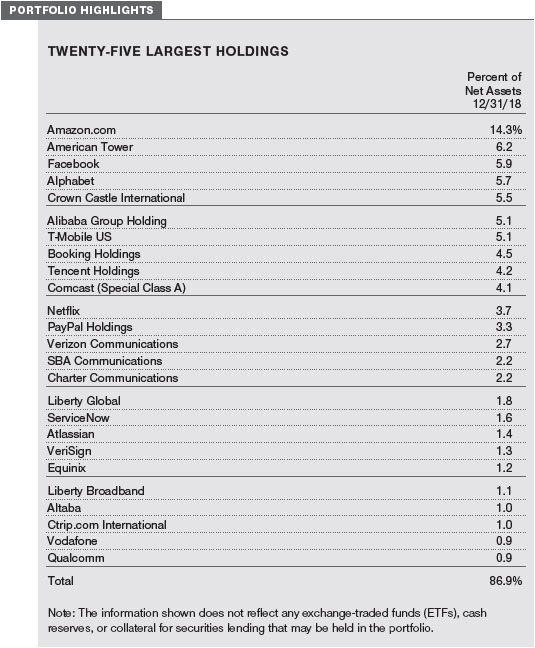
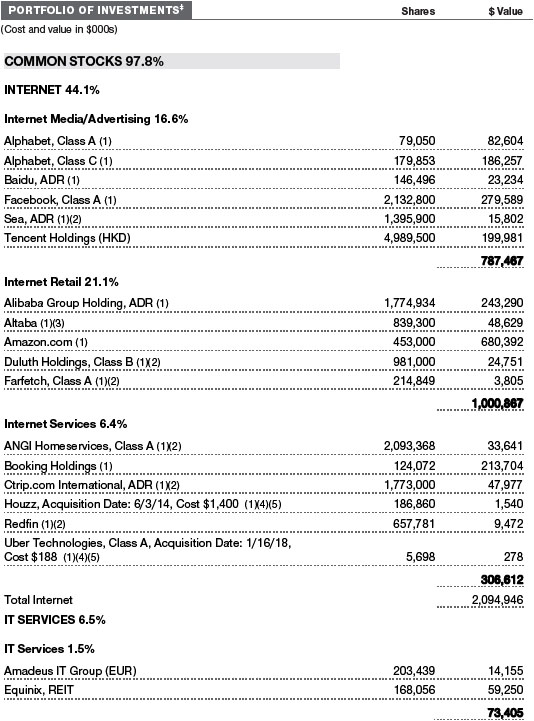
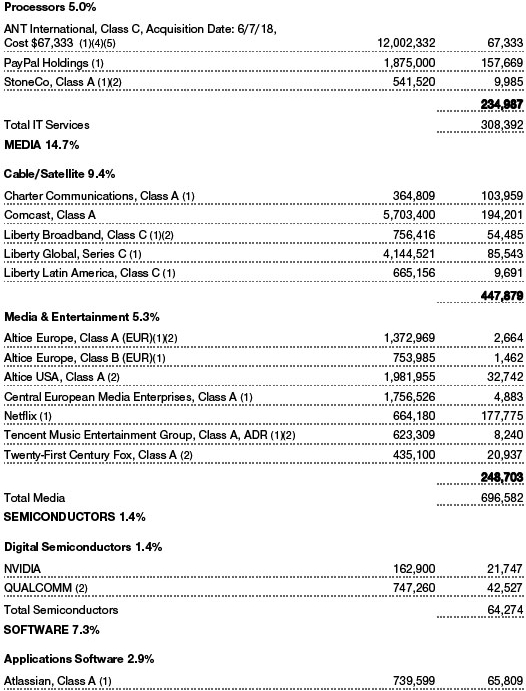
In terms of our investment universe, the year was notable for merger and acquisition activity. AT&T completed its acquisition of Time Warner in June, andComcastand Disney continued a bruising battle forTwenty-First Century Foxbefore Disney emerged as the victor in the summer. The deal has yet to close, however, and Fox lost out to Comcast on its own bid for British broadcaster Sky. “Cutting the cord” by abandoning cable for video delivered over the internet remained a dominant theme, and the year brought plans from Disney and several other firms to start their own streaming services. Meanwhile, social media firms came under deepening scrutiny, as we discuss below. (Please refer to the fund’s portfolio of investments for a complete list of our holdings and the amount each represents in the portfolio.)
The past year also saw the unveiling of a new “communication services” sector in official market classifications. The new sector replaces the small telecommunication services sector and includes several heavily weighted media firms, making it a much larger portion of the overall S&P 500 Index. We were happy to see the change to the new, more broadly defined sector, which better reflects the emphasis we have long placed on the media and internet firms that are changing the way we communicate.
PORTFOLIO REVIEW
Our leading contributor over the past year wasAmazon.com, a holding that has been one of the central drivers of our success in recent years. The company continued to see solid growth in its online retail business and even more rapid acceleration in its cloud computing franchise, Amazon Web Services. We thinkthe company is also on the cusp of being a major force in advertising, which should bring with it a very attractive margin profile.
Netflixalso continued to perform well for us. The company is benefiting from a virtuous cycle, in which healthy subscriber growth both in the U.S. and overseas funds investment in programming, which in turn lures more subscribers.The company’s massive scale and global operations offer it unique leverage in purchasing content and providing value to customers, and we see negligible threats to its businesses from recently arrived competitors in digital streaming. The stock had a brief stumble at midyear, when second-quarter subscriber growth came in a bit below forecasts. This proved an aberration, as we expected, and growth bounced back later in year. The company also appears poised over the next couple of years to grow expenses slower than revenues, which should lead to a long stretch of steadily improving margins.
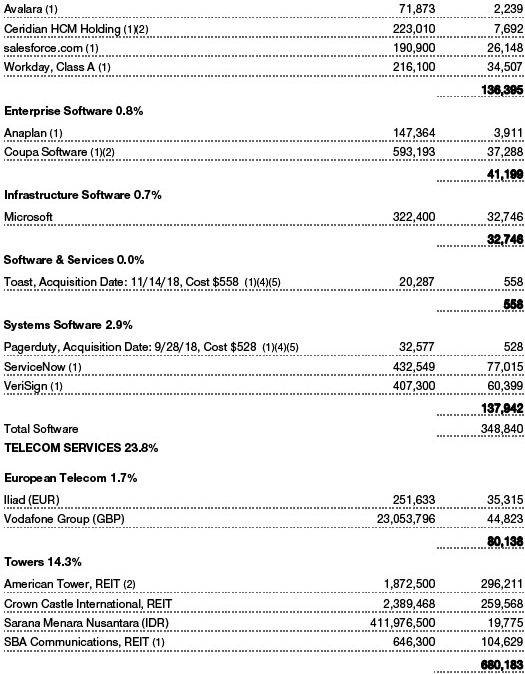
We generally limit our investment in the wireless industry, but the cellular tower operators have long been an exception. Our third-best contributor wasAmerican Tower, the leading tower operator in the world. The company’s large international footprint weighed on results a bit early in the year as many currencies fell against the dollar, but improved billings in the U.S. more than compensated. Rival tower operatorCrown Castle Internationalalso boosted results. Our focus on the tower companies helped us avoid some of the major pitfalls in the space and boosted our relative returns, but we did not escape the damage entirely. We discussed the poor performance of European wireless operatorsLiberty Global,Vodafone, andIliadin my last letter.
Our focus on Chinese internet firms did not serve us well in 2018, although we expect the group to remain a key source of opportunity in the coming years. The slowdown in the Chinese economy, driven in part by the trade conflict with the U.S., bore some responsibility for the weak performance of our holdings. The stocks also pulled back as the Chinese government began tightening regulations on online commerce, internet usage, and gaming.Alibaba Group Holding, China’s largest e-commerce business, continued togrow rapidly but not as fast as expected, and the company reduced its profit guidance based on the downturn in consumer sentiment.Tencent Holdingshas a massive mobile gaming franchise, and the stock suffered as Chinese officials stopped approving new game titles. Online travel providerCtrip.com Internationalwas also weak. I described in my letter a year ago how Chinese companies are leading the way in exploiting the internet and mobile telephony, and we are largely sticking with our investments.
OUTLOOK: SEEING PAST THE NOISE ON FACEBOOK
My letter to you in our 2014 annual report went into detail on the largest detractor to our performance that year, Amazon. As I noted at the time, focusing on Amazon may have seemed like an odd choice given the fund’s strong overall performance during the year, but I thought it was important to let shareholders know why we owned so much of the company and why we were sticking with our position. Given the recent travails of another core holding,Facebook, I thought such an exercise might again shed light on the core principles that drive the management of your fund.
Facebook’s troubles over the past year have been well publicized, and I should start by acknowledging that the company bears blame for some missteps. In terms of user privacy, it is clear, in retrospect, that Facebook needed to have tighter controls over how data were taken from its website and then used by third parties—a shortcoming revealed by political consultant Cambridge Analytica’s unauthorized use of Facebook user data in the 2016 elections. The company has made—and continues to make—numerous changes to its policies to better protect user data.
That said, a good dose of perspective is sorely needed, especially given the tremendous amount of negative press around Facebook. Since the Cambridge Analytica story broke, there has been a deluge of other press articles about how Facebook “sells” or otherwise mistreats user data, how they track users without their permission, and so on. These reports are often flat-out inaccurate, and in most cases, they misrepresent Facebook’s motives as malicious and lack highly relevant context about what the company is actually doing and the details of how the company is doing it. Furthermore, many accusations made against Facebook are clearly coming from uninformed, or at least willfully ignorant, accusers who seem to lack a basic understanding of how the internet works. Otherwise, they would realize that Facebook is not doing anything “malicious”or “heinous” and, instead, are simply behaving in line with industry standards. Said another way, many of these accusations are not Facebook specific but instead relate to how virtually every company on the internet operates.
Facebook’s detractors often come to the table with their own agenda. It should be noted that Facebook is widely seen by publishers as a threat to their businesses. In my view, many journalists seem to have set aside objectivity in their coverage of the company and its “scandals.” As I write, for example,The New York Timeshas bought a sponsored post on Facebook to promote a step-by-step guide explaining to users how to disable their accounts—a step that seems to go beyond reporting to advocacy. Some journalists may be driven by the high profile of Mark Zuckerberg—certainly the only living CEO to have had a major movie (and not a very flattering or wholly accurate one) made about the start of his career. It also simply makes for more compelling copy to paint the company’s moves as malicious or even evil rather than to examine them in context.
Politicians have also seen an attractive target in the company, although most probably have little idea how Facebook or other social media platforms actually function. Many on the left of the political spectrum have focused on the Cambridge Analytica scandal and the false allegations that Facebook knowingly facilitated unauthorized use of customer data and Russian interference in the 2016 election. While it is true that malicious actors made use of Facebook, Twitter, and other social media platforms, investigators have uncovered no evidence that Facebook employees were aware and turned a blind eye. Moreover, many politicians now criticizing the use of social media in elections were happy use it in their own campaigns, and it is easy to forget how President Obama was hailed for his campaign’s data mining and social media savvy just six years ago.
Meanwhile, Facebook’s efforts to prevent the misuse of its platform have also drawn criticism from the right. Politicians and right-wing media have begun criticizing Facebook for a supposed liberal bias—an allegation that assumes Facebook is willing to write off the conservative users who make up roughly half of the company’s user base. The hypocrisy, or at least confusion, of many politicians was in clear view when Mark Zuckerberg was called before the Senate in April and essentially accused by each side of the aisle of favoring the other.
Above all, regulators, politicians, and the media need to understand that social media is not going away—just as other media revolutions have left indelible changes on society. The most recent and compelling comparison may be with television. It is worth examining some of the criticisms leveled at Facebook and the parallels with early concerns about television:
| ● | Facebook has the power to mislead voters and artificially sway people’s opinions during elections.TV was also recognized as a hugely influential new force in politics in its early days, credited with handing John F. Kennedy the 1960 presidential election. John F. Kennedy himself acknowledged that “It was the TV more than anything else that turned the tide,” and a prominent national news anchor even advocated banning campaign ads.
|
| ● | Facebook has made political discourse more superficial.TV suffered withering criticism in its early days for encouraging voters to focus on appearance rather than substance. The prominent historian Henry Steele Commager warned inThe New York Timesin 1960 that “The glib, the evasive, the dogmatic, the melodramatic will drive out the sincere, the serious, the judicious, the sober, the honest in political discussion.”
|
| ● | Foreign actors, especially Russia, have used Facebook to subvert democracy.Fears were similarly raised of communist sympathizers using TV to meddle in domestic affairs, and FBI Chief J. Edgar Hoover urged station owners to search for communists among their employees.
|
| ● | Facebook is reducing face-to-face interaction and causing a dumbing down of society.Media critics similarly worried that people’s fixation on TV screens would lead them to forsake social activity, and the medium was famously characterized as a “vast wasteland” by former Federal Communications Commissioner Chairman Newton N. Minow.
|
| ● | Facebook has outsize control over the information we absorb.Vice President Spiro Agnew similarly criticized the influence of the three major television networks and alleged that “no more than a dozen” men determined what news made it to the public.
|
| ● | Facebook enables the spread of fake news.While the term fake news has only recently become a common part of our vocabulary, assailing TV networks for promoting falsehoods is not a new phenomenon. In the late 1950s, the revelation that some quiz shows were providing participants with the answers in advance provoked a national scandal and a congressional inquiry. |
Several of these criticisms proved accurate, and many are still relevant today. But TV did not ruin our minds or destroy our democracy—something worth keeping in mind when people make impassioned arguments about how social media is going to rot our society, values, and politics. We have simply learned to adapt to the medium and to regulate it where appropriate—for example, Congress banned rigging game shows in 1960. Broadcast networks have learned how to operate within standards that disallow nudity, profanity, and other types of content, which has made most Americans comfortable owning a television set and allowing children to watch unsupervised—rules that have ultimately benefited both the public and the industry.
As with television, the social media genie is not going back into the bottle. If Facebook were to disappear, the social platforms that took its place would have to deal with the same problems. Indeed, regulators probably realize that it will be easier to work with an established, large-scale company to devise fixes rather than trying to corral many smaller players in finding solutions. It is also my belief that Mark Zuckerberg cares deeply about fixing the problems that surround social media and, specifically, Facebook. To be sure, his wealth is tied to the firm, but it is also his creation—and he wants its impact on the world to be a positive one. Ultimately, I believe that regulators will view Facebook as an ally in the fight to address some of the less desirable aspects of social media, and the result will be a set of commonly accepted standards for the medium, just as television has now.
Finally, at the deepest level, Facebook is also simply a reflection of humanity. Some of its 2.5 billion users will continue to use the platform for noxious purposes—as scam artists do with television, robo-callers do with the telephone, and others have done with every previous communications revolution. Some of these problems will never be completely fixed, in other words, but they can be mitigated—and Facebook is investing heavily in finding solutions. For example, Facebook has already made significant, if overlooked, progress in clamping down on nefarious actors attempting to influence elections. Indeed, there were numerous elections around the world in the second half of 2018, including the U.S. midterm elections, and no issues have surfaced in spite of a journalist community that is licking its chops to write about the next failure.
Over time, I suspect a lot of the fervor around Facebook will diminish as these issues are brought into perspective. As the spectacle of Senate testimony gives way to the deliberation of what new regulations are feasible and useful, reality will matter more than the narrative, and Facebook is likely to benefit. It isvery difficult to win a headline war with the press or politicians, and moving the discussions out of the spotlight and rooting them in facts often leads to progress.
As the current media and political frenzy surrounding Facebook abates, investors’ attention should shift back to the company’s business performance. To the extent that the company’s business has garnered attention in recent months, almost every press account has focused on how Facebook is losing users and engagement while advertisers are pushing back and spending less. There is scant material evidence to back up these claims; in fact, everything I look at points to the opposite—Facebook is growing.
One major source of growth has been the new image- and video-focused “Stories” function, which has become a gigantic draw for Facebook by creating better experiences for users. Stories, which is currently most popular on Facebook’s Whatsapp and Instagram applications, is complementing Facebook’s core news feed and messaging products to create a platform with dexterity around how people communicate. Users are responding by spending more time exploring the platform, which is creating significantly more ad inventory—or space available for advertisers to reach potential customers. Stories also creates an entirely new canvas to work with for advertisers, and I believe that Stories will eventually monetize at least as well, if not better than, the traditional news feed—although there will remain room for both on the platform. Finally, Stories also points to a clear monetization model for Facebook’s messaging services, especially WhatsApp, which currently creates minimal revenue.
Assuming Facebook continues to have a plentiful supply of ad inventory, revenue is then really a function of demand. Here the story is strong for Facebook as well, as the company has significant room to continue growing demand by driving stronger return on investment for advertisers, driven in turn through improved ad targeting, ad formats, and analytics. As TV advertising continues to dwindle, ad dollars will flow elsewhere, and I suspect Facebook will capture a good portion of them. In short, Facebook still has abundant growth potential over the next several years.
Facebook’s stock price has been hammered on the back of recent controversies, making what was already a very attractive return outlook for the stock even brighter. In my view, all the worries surrounding Facebook have been more than discounted in the stock, and we have been eagerly adding to our position. This is not to say that the stock cannot go lower in the interim, but I think that there is great potential for patient investors to realize very attractive returns. Judging by Facebook’s aggressive share repurchases, it looks like the executiveteam agrees. In an area of the market where it is common to see companies hoard mountains of cash, it is nice to see a company be willing to bet on itself when its stock is out of favor.
When I discussed Amazon back in 2014, I admitted that I was not sure when the market would begin converging to our view. As it turned out, the market’s view on Amazon began to turn around almost before the ink was dry on that letter, but we were prepared to wait much longer if necessary. In the four years since, Amazon has contributed tremendously to the fund’s results, with its share price having increased by a factor of six over that period.
It would be great if the same thing happened with Facebook, of course, but I cannot promise such an outcome. What I can assure you is that we will remain patient investors, which positions us to benefit from opportunities that elude those focused only on what the next quarter or year will bring.
Respectfully submitted,

Paul D. Greene II
Chairman of the fund’s Investment Advisory Committee
January 15, 2019
The committee chairman has day-to-day responsibility for managing the portfolio and works with committee members in developing and executing the fund’s investment program.
RISKS OF INVESTING IN THE FUND
Securities of companies in the same industry may decline in price at the same time due to industry-specific developments since these companies may share common characteristics and are more likely to react similarly to industry-specific market or economic developments. Since the fund is focused on industries related to communications and technology, it is less diversified than stock funds investing in a broader range of industries and, therefore, could experience significant volatility. Companies in these industries are subject to the additional risks of rapid obsolescence of their products or services, lack of investor or consumer acceptance, lack of standardization or compatibility with existing technologies, an unfavorable regulatory environment, intense competition, and a dependency on patent and copyright protection. Likewise, if the portfolio has substantial exposure to mid-cap companies, it would be subject to the greater volatility of those stocks compared with the stocks of larger companies.
GLOSSARY
Lipper averages:The averages of available mutual fund performance returns for specified periods in categories defined by Lipper Inc.
S&P 500 Index:An unmanaged index that tracks the stocks of 500 primarily large-cap U.S. companies.

GROWTH OF $10,000
This chart shows the value of a hypothetical $10,000 investment in the fund over the past 10 fiscal year periods or since inception (for funds lacking 10-year records). The result is compared with benchmarks, which include a broad-based market index and may also include a peer group average or index. Market indexes do not include expenses, which are deducted from fund returns as well as mutual fund averages and indexes.

AVERAGE ANNUAL COMPOUND TOTAL RETURN

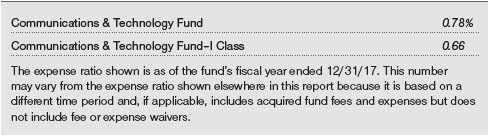
EXPENSE RATIO
FUND EXPENSE EXAMPLE
As a mutual fund shareholder, you may incur two types of costs: (1) transaction costs, such as redemption fees or sales loads, and (2) ongoing costs, including management fees, distribution and service (12b-1) fees, and other fund expenses. The following example is intended to help you understand your ongoing costs (in dollars) of investing in the fund and to compare these costs with the ongoing costs of investing in other mutual funds. The example is based on an investment of $1,000 invested at the beginning of the most recent six-month period and held for the entire period.
Please note that the fund has two share classes: The original share class (Investor Class) charges no distribution and service (12b-1) fee, and the I Class shares are also available to institutionally oriented clients and impose no 12b-1 or administrative fee payment. Each share class is presented separately in the table.
Actual Expenses
The first line of the following table (Actual) provides information about actual account values and expenses based on the fund’s actual returns. You may use the information on this line, together with your account balance, to estimate the expenses that you paid over the period. Simply divide your account value by $1,000 (for example, an $8,600 account value divided by $1,000 = 8.6), then multiply the result by the number on the first line under the heading “Expenses Paid During Period” to estimate the expenses you paid on your account during this period.
Hypothetical Example for Comparison Purposes
The information on the second line of the table (Hypothetical) is based on hypothetical account values and expenses derived from the fund’s actual expense ratio and an assumed 5% per year rate of return before expenses (not the fund’s actual return). You may compare the ongoing costs of investing in the fund with other funds by contrasting this 5% hypothetical example and the 5% hypothetical examples that appear in the shareholder reports of the other funds. The hypothetical account values and expenses may not be used to estimate the actual ending account balance or expenses you paid for the period.
Note:T. Rowe Price charges an annual account service fee of $20, generally for accounts with less than $10,000. The fee is waived for any investor whose T. Rowe Price mutual fund accounts total $50,000 or more; accounts electing to receive electronic delivery of account statements, transaction confirmations, prospectuses, and shareholder reports; or accounts of an investor who is a T. Rowe Price Personal Services or Enhanced Personal Services client (enrollment in these programs generally requires T. Rowe Price assets of at least $250,000). This fee is not included in the accompanying table. If you are subject to the fee, keep it in mind when you are estimating the ongoing expenses of investing in the fund and when comparing the expenses of this fund with other funds.
You should also be aware that the expenses shown in the table highlight only your ongoing costs and do not reflect any transaction costs, such as redemption fees or sales loads. Therefore, the second line of the table is useful in comparing ongoing costs only and will not help you determine the relative total costs of owning different funds. To the extent a fund charges transaction costs, however, the total cost of owning that fund is higher.


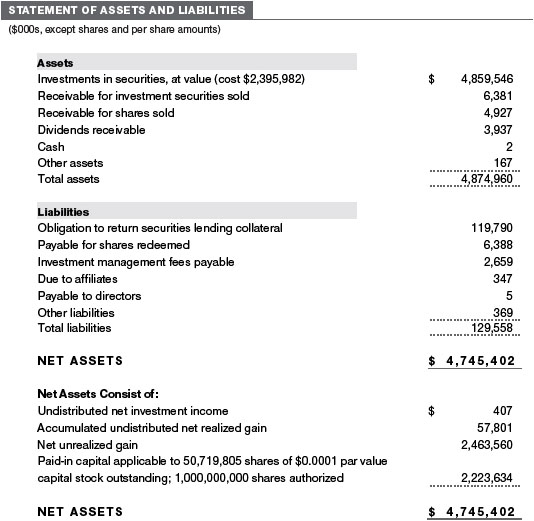
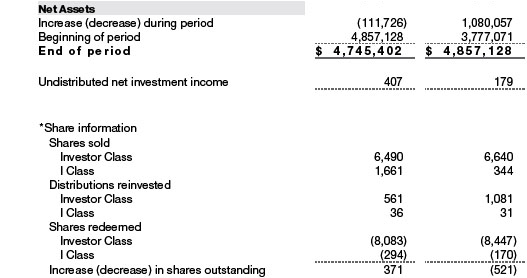
The accompanying notes are an integral part of these financial statements.


The accompanying notes are an integral part of these financial statements.


The accompanying notes are an integral part of these financial statements.

The accompanying notes are an integral part of these financial statements.


The accompanying notes are an integral part of these financial statements.

The accompanying notes are an integral part of these financial statements.
| NOTES TO FINANCIAL STATEMENTS |
T. Rowe Price Communications & Technology Fund, Inc. (the fund), formerly the T. Rowe Price Media & Telecommunications Fund, Inc., is registered under the Investment Company Act of 1940 (the 1940 Act) as a nondiversified, open-end management investment company. The fund seeks to provide long-term capital growth. The fund has two classes of shares: the Communications & Technology Fund (Investor Class) and the Communications & Technology Fund–I Class (I Class).I Class shares generally are available only to investors meeting a $1,000,000 minimum investment, although the minimum is generally waived for certain client accounts. Each class has exclusive voting rights on matters related solely to that class; separate voting rights on matters that relate to both classes; and, in all other respects, the same rights and obligations as the other class.
NOTE 1 - SIGNIFICANT ACCOUNTING POLICIES
Basis of PreparationThe fund is an investment company and follows accounting and reporting guidance in the Financial Accounting Standards Board (FASB)Accounting Standards CodificationTopic 946 (ASC 946). The accompanying financial statements were prepared in accordance with accounting principles generally accepted in the United States of America (GAAP), including, but not limited to, ASC 946. GAAP requires the use of estimates made by management. Management believes that estimates and valuations are appropriate; however, actual results may differ from those estimates, and the valuations reflected in the accompanying financial statements may differ from the value ultimately realized upon sale or maturity. Certain ratios in the accompanying Financial Highlights have been included to conform to the current year presentation.
Investment Transactions, Investment Income, and DistributionsInvestment transactions are accounted for on the trade date basis. Income and expenses are recorded on the accrual basis. Realized gains and losses are reported on the identified cost basis. Income tax-related interest and penalties, if incurred, are recorded as income tax expense. Dividends received from mutual fund investments are reflected as dividend income; capital gain distributions are reflected as realized gain/loss. Dividend income and capital gain distributions are recorded on the ex-dividend date. Distributions from REITs are initially recorded as dividend income and, to the extent such represent a return of capital or capital gain for tax purposes, are reclassified when such information becomes available. Distributions to shareholders are recorded on the ex-dividend date. Income distributions, if any, are declared and paid by each class annually. A capital gain distribution may also be declared and paid by the fund annually.
Currency TranslationAssets, including investments, and liabilities denominated in foreign currencies are translated into U.S. dollar values each day at the prevailing exchange rate, using the mean of the bid and asked prices of such currencies against U.S. dollars as quoted by a major bank. Purchases and sales of securities, income, and expenses are translated into U.S. dollars at the prevailing exchange rate on the respective date of such transaction. The effect of changes in foreign currency exchange rates on realized and unrealized security gains and losses is not bifurcated from the portion attributable to changes in market prices.
Class AccountingShareholder servicing, prospectus, and shareholder report expenses incurred by each class are charged directly to the class to which they relate. Expenses common to both classes, investment income, and realized and unrealized gains and losses are allocated to the classes based upon the relative daily net assets of each class. To the extent any expenses are waived or reimbursed in accordance with an expense limitation (see Note 5), the waiver or reimbursement is charged to the applicable class or allocated across the classes in the same manner as the related expense.
New Accounting GuidanceIn March 2017, the FASB issued amended guidance to shorten the amortization period for certain callable debt securities held at a premium. The guidance is effective for fiscal years and interim periods beginning after December 15, 2018. Adoption will have no effect on the fund’s net assets or results of operations.
IndemnificationIn the normal course of business, the fund may provide indemnification in connection with its officers and directors, service providers, and/or private company investments. The fund’s maximum exposure under these arrangements is unknown; however, the risk of material loss is currently considered to be remote.
NOTE 2 - VALUATION
The fund’s financial instruments are valued and each class’s net asset value (NAV) per share is computed at the close of the New York Stock Exchange (NYSE), normally 4 p.m. ET, each day the NYSE is open for business. However, the NAV per share may be calculated at a time other than the normal close of the NYSE if trading on the NYSE is restricted, if the NYSE closes earlier, or as may be permitted by the SEC.
Fair ValueThe fund’s financial instruments are reported at fair value, which GAAP defines as the price that would be received to sell an asset or paid to transfer a liability in an orderly transaction between market participants at the measurement date. The T. Rowe Price Valuation Committee (the Valuation Committee) is an internal committee that has been delegated certain responsibilities by the fund’s Board of Directors (theBoard) to ensure that financial instruments are appropriately priced at fair value in accordance with GAAP and the 1940 Act. Subject to oversight by the Board, the Valuation Committee develops and oversees pricing-related policies and procedures and approves all fair value determinations. Specifically, the Valuation Committee establishes procedures to value securities; determines pricing techniques, sources, and persons eligible to effect fair value pricing actions; oversees the selection, services, and performance of pricing vendors; oversees valuation-related business continuity practices; and provides guidance on internal controls and valuation-related matters. The Valuation Committee reports to the Board and has representation from legal, portfolio management and trading, operations, risk management, and the fund’s treasurer.
Various valuation techniques and inputs are used to determine the fair value of financial instruments. GAAP establishes the following fair value hierarchy that categorizes the inputs used to measure fair value:
Level 1 – quoted prices (unadjusted) in active markets for identical financial instruments that the fund can access at the reporting date
Level 2 – inputs other than Level 1 quoted prices that are observable, either directly or indirectly (including, but not limited to, quoted prices for similar financial instruments in active markets, quoted prices for identical or similar financial instruments in inactive markets, interest rates and yield curves, implied volatilities, and credit spreads)
Level 3 – unobservable inputs
Observable inputs are developed using market data, such as publicly available information about actual events or transactions, and reflect the assumptions that market participants would use to price the financial instrument. Unobservable inputs are those for which market data are not available and are developed using the best information available about the assumptions that market participants would use to price the financial instrument. GAAP requires valuation techniques to maximize the use of relevant observable inputs and minimize the use of unobservable inputs. When multiple inputs are used to derive fair value, the financial instrument is assigned to the level within the fair value hierarchy based on the lowest-level input that is significant to the fair value of the financial instrument. Input levels are not necessarily an indication of the risk or liquidity associated with financial instruments at that level but rather the degree of judgment used in determining those values.
Valuation TechniquesEquity securities listed or regularly traded on a securities exchange or in the over-the-counter (OTC) market are valued at the last quoted sale price or, for certain markets, the official closing price at the time the valuations are made. OTC Bulletin Board securities are valued at the mean of the closing bid and asked prices. A security that is listed or traded on more than one exchange is valued at the quotation on the exchange determined to be the primary market for such security. Listed securities not traded on a particular day are valued at the mean of the closing bid and asked prices for domestic securities and the last quoted sale or closing price for international securities.
For valuation purposes, the last quoted prices of non-U.S. equity securities may be adjusted to reflect the fair value of such securities at the close of the NYSE. If the fund determines that developments between the close of a foreign market and the close of the NYSE will affect the value of some or all of its portfolio securities, the fund will adjust the previous quoted prices to reflect what it believes to be the fair value of the securities as of the close of the NYSE. In deciding whether it is necessary to adjust quoted prices to reflect fair value, the fund reviews a variety of factors, including developments in foreign markets, the performance of U.S. securities markets, and the performance of instruments trading in U.S. markets that represent foreign securities and baskets of foreign securities. The fund may also fair value securities in other situations, such as when a particular foreign market is closed but the fund is open. The fund uses outside pricing services to provide it with quoted prices and information to evaluate or adjust those prices. The fund cannot predict how often it will use quoted prices and how often it will determine it necessary to adjust those prices to reflect fair value. As a means of evaluating its security valuation process, the fund routinely compares quoted prices, the next day’s opening prices in the same markets, and adjusted prices.
Actively traded equity securities listed on a domestic exchange generally are categorized in Level 1 of the fair value hierarchy. Non-U.S. equity securities generally are categorized in Level 2 of the fair value hierarchy despite the availability of quoted prices because, as described above, the fund evaluates and determines whether those quoted prices reflect fair value at the close of the NYSE or require adjustment. OTC Bulletin Board securities, certain preferred securities, and equity securities traded in inactive markets generally are categorized in Level 2 of the fair value hierarchy.
Investments in mutual funds are valued at the mutual fund’s closing NAV per share on the day of valuation and are categorized in Level 1 of the fair value hierarchy. Assets and liabilities other than financial instruments, including short-term receivables and payables, are carried at cost, or estimated realizable value, if less, which approximates fair value.
Thinly traded financial instruments and those for which the above valuation procedures are inappropriate or are deemed not to reflect fair value are stated at fair value as determined in good faith by the Valuation Committee. The objective of any fair value pricing determination is to arrive at a price that could reasonably be expected from a current sale. Financial instruments fair valued by the Valuation Committee are primarily private placements, restricted securities, warrants, rights, and other securities that are not publicly traded.
Subject to oversight by the Board, the Valuation Committee regularly makes good faith judgments to establish and adjust the fair valuations of certain securities as events occur and circumstances warrant. For instance, in determining the fair value of an equity investment with limited market activity, such as a private placement or a thinly traded public company stock, the Valuation Committee considers a variety of factors, which may include, but are not limited to, the issuer’s business prospects, its financial standing and performance, recent investment transactions in the issuer, new rounds of financing, negotiated transactions of significant size between other investors in the company, relevant market valuations of peer companies, strategic events affecting the company, market liquidity for the issuer, and general economic conditions and events. In consultation with the investment and pricing teams, the Valuation Committee will determine an appropriate valuation technique based on available information, which may include both observable and unobservable inputs. The Valuation Committee typically will afford greatest weight to actual prices in arm’s length transactions, to the extent they represent orderly transactions between market participants; transaction information can be reliably obtained, and prices are deemed representative of fair value. However, the Valuation Committee may also consider other valuation methods such as market-based valuation multiples; a discount or premium from market value of a similar, freely traded security of the same issuer; or some combination. Fair value determinations are reviewed on a regular basis and updated as information becomes available, including actual purchase and sale transactions of the issue. Because any fair value determination involves a significant amount of judgment, there is a degree of subjectivity inherent in such pricing decisions, and fair value prices determined by the Valuation Committee could differ from those of other market participants. Depending on the relative significance of unobservable inputs, including the valuation technique(s) used, fair valued securities may be categorized in Level 2 or 3 of the fair value hierarchy.
Valuation InputsThe following table summarizes the fund’s financial instruments, based on the inputs used to determine their fair values on December 31, 2018 (for further detail by category, please refer to the accompanying Portfolio of Investments):

There were no material transfers between Levels 1 and 2 during the year ended December 31, 2018.
Following is a reconciliation of the fund’s Level 3 holdings for the year ended December 31, 2018. Gain (loss) reflects both realized and change in unrealized gain/ loss on Level 3 holdings during the period, if any, and is included on the accompanying Statement of Operations. The change in unrealized gain/loss on Level 3 instruments held at December 31, 2018, totaled $5,986,000 for the year ended December 31, 2018. Transfers into and out of Level 3 are reflected at the value of the financial instrument at the beginning of the period. During the year, transfers out of Level 3 were because observable market data became available for the security.

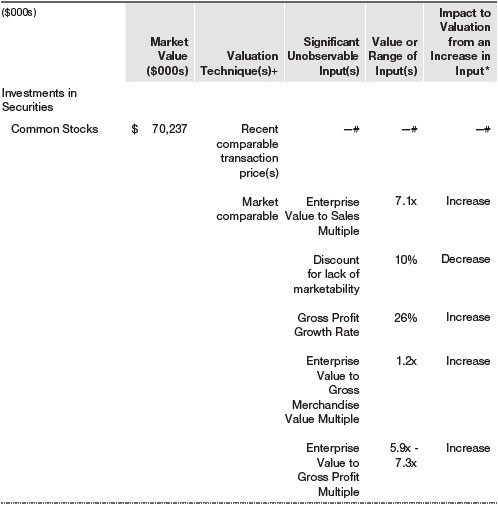
In accordance with GAAP, the following table provides quantitative information about significant unobservable inputs used to determine the fair valuations of the fund’s Level 3 assets, by class of financial instrument; it also indicates the sensitivity of theLevel 3 valuations to changes in those significant unobservable inputs. Because the Valuation Committee considers a wide variety of factors and inputs, both observable and unobservable, in determining fair values, the unobservable inputs presented do not reflect all inputs significant to the fair value determination.

NOTE 3 - OTHER INVESTMENT TRANSACTIONS
Consistent with its investment objective, the fund engages in the following practices to manage exposure to certain risks and/or to enhance performance. The investment objective, policies, program, and risk factors of the fund are described more fully in the fund’s prospectus and Statement of Additional Information.
Emerging MarketsThe fund may invest, either directly or through investments in T. Rowe Price institutional funds, in securities of companies located in, issued by governments of, or denominated in or linked to the currencies of emerging market countries; at period-end, approximately 13% of the fund’s net assets were invested in emerging markets. Emerging markets generally have economic structures that are less diverse and mature, and political systems that are less stable, than developed countries. These markets may be subject to greater political, economic, and social uncertainty and differing regulatory environments that may potentially impact the fund’s ability to buy or sell certain securities or repatriate proceeds to U.S. dollars. Such securities are often subject to greater price volatility, less liquidity, and higher rates of inflation than U.S. securities.
Restricted SecuritiesThe fund may invest in securities that are subject to legal or contractual restrictions on resale. Prompt sale of such securities at an acceptable price may be difficult and may involve substantial delays and additional costs.
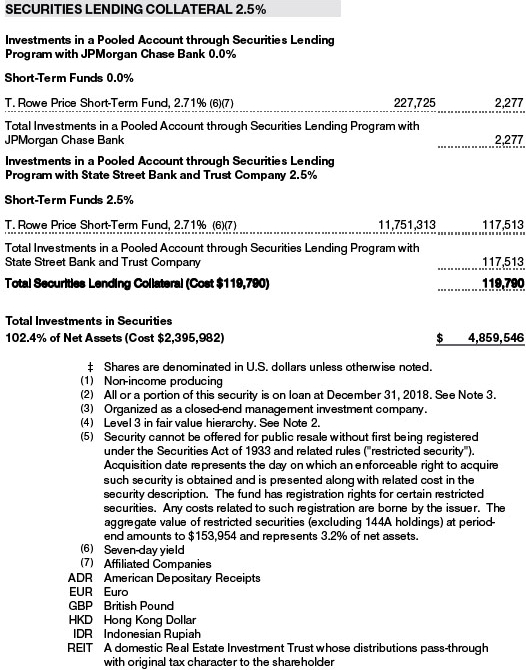
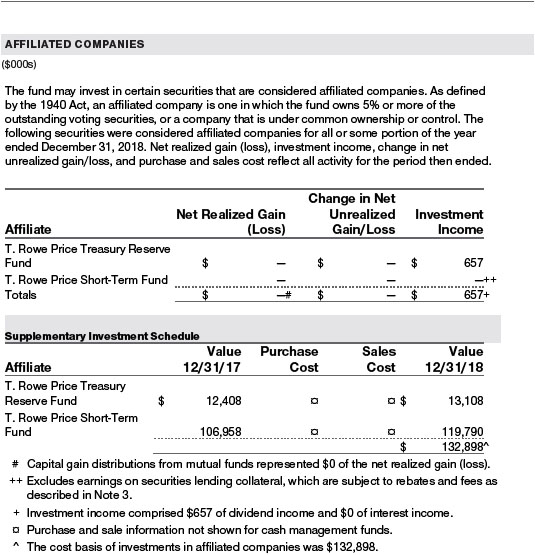
Securities LendingThe fund may lend its securities to approved borrowers to earn additional income. Its securities lending activities are administered by a lending agent in accordance with a securities lending agreement. Security loans generally do not have stated maturity dates, and the fund may recall a security at any time. The fund receives collateral in the form of cash or U.S. government securities. Collateral is maintained over the life of the loan in an amount not less than the value of loaned securities; any additional collateral required due to changes in security values is delivered to the fund the next business day. Cash collateral is invested in accordance with investment guidelines approved by fund management. Additionally, the lending agent indemnifies the fund against losses resulting from borrower default. Although risk is mitigated by the collateral and indemnification, the fund could experience a delay in recovering its securities and a possible loss of income or value if the borrower fails to return the securities, collateral investments decline in value, and the lending agent fails to perform. Securities lending revenue consists of earnings on invested collateral and borrowing fees, net of any rebates to the borrower, compensation to the lending agent, and other administrative costs. In accordance with GAAP, investments made with cash collateral arereflected in the accompanying financial statements, but collateral received in the form of securities is not. At December 31, 2018, the value of loaned securities was $117,217,000; and the value of cash collateral and related investments was $119,790,000.
OtherPurchases and sales of portfolio securities other than short-term securities aggregated $358,162,000 and $355,959,000, respectively, for the year ended December 31, 2018.
NOTE 4 - FEDERAL INCOME TAXES
No provision for federal income taxes is required since the fund intends to continue to qualify as a regulated investment company under Subchapter M of the Internal Revenue Code and distribute to shareholders all of its taxable income and gains. Distributions determined in accordance with federal income tax regulations may differ in amount or character from net investment income and realized gains for financial reporting purposes. Financial reporting records are adjusted for permanent book/tax differences to reflect tax character but are not adjusted for temporary differences.
The fund files U.S. federal, state, and local tax returns as required. The fund’s tax returns are subject to examination by the relevant tax authorities until expiration of the applicable statute of limitations, which is generally three years after the filing of the tax return but which can be extended to six years in certain circumstances. Tax returns for open years have incorporated no uncertain tax positions that require a provision for income taxes.
Reclassifications to paid-in capital relate primarily to a tax practice that treats a portion of the proceeds from each redemption of capital shares as a distribution of taxable net investment income or realized capital gain. For the year ended December 31, 2018, the following reclassifications were recorded to reflect tax character (there was no impact on results of operations or net assets):

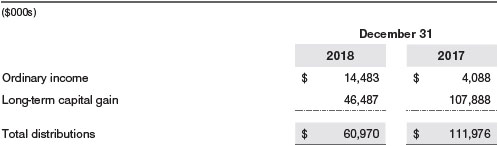
Distributions during the years ended December 31, 2018 and December 31, 2017, were characterized for tax purposes as follows:
At December 31, 2018, the tax-basis cost of investments and components of net assets were as follows:

The difference between book-basis and tax-basis net unrealized appreciation (depreciation) is attributable to the deferral of losses from wash sales and the realization of gains/losses on passive foreign investment companies for tax purposes.
NOTE 5 - RELATED PARTY TRANSACTIONS
The fund is managed by T. Rowe Price Associates, Inc. (Price Associates), a wholly owned subsidiary of T. Rowe Price Group, Inc. (Price Group). The investment management agreement between the fund and Price Associates provides for an annual investment management fee, which is computed daily and paid monthly. The fee consists of an individual fund fee, equal to 0.35% of the fund’s average daily net assets, and a groupfee. The group fee rate is calculated based on the combined net assets of certain mutual funds sponsored by Price Associates (the group) applied to a graduated fee schedule, with rates ranging from 0.48% for the first $1 billion of assets to 0.265% for assets in excess of $650 billion. The fund’s group fee is determined by applying the group fee rate to the fund’s average daily net assets. At December 31, 2018, the effective annual group fee rate was 0.29%.
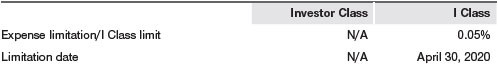
The I Class is subject to an operating expense limitation (I Class limit) pursuant to which Price Associates is contractually required to pay all operating expenses of the I Class, excluding management fees, interest, expenses related to borrowings, taxes, brokerage, and other non-recurring expenses permitted by the investment management agreement, to the extent such operating expenses, on an annualized basis, exceed the I Class limit. This agreement will continue through the limitation date indicated in the table below, and may be renewed, revised, or revoked only with approval of the fund’s Board. The I Class is required to repay Price Associates for expenses previously paid to the extent the class’s net assets grow or expenses decline sufficiently to allow repayment without causing the class’s operating expenses (after the repayment is taken into account) to exceed both: (1) the I Class limit in place at the time such amounts were paid; and (2) the current I Class limit. However, no repayment will be made more than three years after the date of a payment or waiver.
In addition, the fund has entered into service agreements with Price Associates and two wholly owned subsidiaries of Price Associates, each an affiliate of the fund (collectively, Price). Price Associates provides certain accounting and administrative services to the fund. T. Rowe Price Services, Inc. provides shareholder and administrative services in its capacity as the fund’s transfer and dividend-disbursing agent. T. Rowe Price Retirement Plan Services, Inc. provides subaccounting and recordkeeping services for certain retirement accounts invested in the Investor Class. For the year ended December 31, 2018, expenses incurred pursuant to these service agreements were $79,000 for Price Associates; $2,369,000 for T. Rowe Price Services, Inc.; and $568,000 for T. Rowe Price Retirement Plan Services, Inc. All amounts due to and due from Price, exclusive of investment management fees payable, are presented net on the accompanying Statement of Assets and Liabilities.
The fund may invest its cash reserves in certain open-end management investment companies managed by Price Associates and considered affiliates of the fund: the T. Rowe Price Government Reserve Fund or the T. Rowe Price Treasury Reserve Fund, organized as money market funds, or the T. Rowe Price Short-Term Fund, a short-term bond fund (collectively, the Price Reserve Funds). The Price Reserve Funds are offered as short-term investment options to mutual funds, trusts, and other accounts managed by Price Associates or its affiliates and are not available for direct purchase by members of the public. Cash collateral from securities lending is invested in the T. Rowe Price Short-Term Fund. The Price Reserve Funds pay no investment management fees.
The fund may participate in securities purchase and sale transactions with other funds or accounts advised by Price Associates (cross trades), in accordance with procedures adopted by the fund’s Board and Securities and Exchange Commission rules, which require, among other things, that such purchase and sale cross trades be effected at the independent current market price of the security. During the year ended December 31, 2018, the fund had no purchases or sales cross trades with other funds or accounts advised by Price Associates.
REPORT OF INDEPENDENT REGISTERED PUBLIC ACCOUNTING FIRM
To the Board of Directors and Shareholders of T. Rowe Price Communications
& Technology Fund, Inc. (formerly known as T. Rowe Price Media &
Telecommunications Fund, Inc.)
Opinion on the Financial Statements
We have audited the accompanying statement of assets and liabilities, including the portfolio of investments, of T. Rowe Price Communications & Technology Fund, Inc. (formerly known as T. Rowe Price Media & Telecommunications Fund, Inc.) (the “Fund”) as of December 31, 2018, the related statement of operations for the year ended December 31, 2018, the statement of changes in net assets for each of the two years in the period ended December 31, 2018, including the related notes, and the financial highlights for each of the periods indicated therein (collectively referred to as the “financial statements”). In our opinion, the financial statements present fairly, in all material respects, the financial position of the Fund as of December 31, 2018, the results of its operations for the year then ended, the changes in its net assets for each of the two years in the period ended December 31, 2018 and the financial highlights for each of the periods indicated therein, in conformity with accounting principles generally accepted in the United States of America.
Basis for Opinion
These financial statements are the responsibility of the Fund’s management. Our responsibility is to express an opinion on the Fund’s financial statements based on our audits. We are a public accounting firm registered with the Public Company Accounting Oversight Board (United States) (PCAOB) and are required to be independent with respect to the Fund in accordance with the U.S. federal securities laws and the applicable rules and regulations of the Securities and Exchange Commission and the PCAOB.
We conducted our audits of these financial statements in accordance with the standards of the PCAOB. Those standards require that we plan and perform the audit to obtain reasonable assurance about whether the financial statements are free of material misstatement, whether due to error or fraud.
Our audits included performing procedures to assess the risks of material misstatement of the financial statements, whether due to error or fraud, and performing procedures that respond to those risks. Such procedures included examining, on a test basis, evidence regarding the amounts and disclosures in the financial statements. Our audits also included evaluating the accounting principles used and significant estimates made by management, as well as evaluating the overall presentation of the financial statements. Our procedures included confirmation of securities owned as of December 31, 2018 by correspondence with the custodians and transfer agent. We believe that our audits provide a reasonable basis for our opinion.
PricewaterhouseCoopers LLP
Baltimore, Maryland
February 15, 2019
We have served as the auditor of one or more investment companies in the T. Rowe Price group of investment companies since 1973.
TAX INFORMATION (UNAUDITED) FOR THE TAX YEAR ENDED 12/31/18
We are providing this information as required by the Internal Revenue Code. The amounts shown may differ from those elsewhere in this report because of differences between tax and financial reporting requirements.
The fund’s distributions to shareholders included:
| ■ | $5,486,000 from short-term capital gains,
|
| ■ | $49,627,000 from long-term capital gains, subject to a long-term capital gains tax rate of not greater than 20%. |
For taxable non-corporate shareholders, $14,136,000 of the fund’s income represents qualified dividend income subject to a long-term capital gains tax rate of not greater than 20%.
For corporate shareholders, $14,136,000 of the fund’s income qualifies for the dividends-received deduction.
INFORMATION ON PROXY VOTING POLICIES, PROCEDURES, AND RECORDS
A description of the policies and procedures used by T. Rowe Price funds and portfolios to determine how to vote proxies relating to portfolio securities is available in each fund’s Statement of Additional Information. You may request this document by calling 1-800-225-5132 or by accessing the SEC’s website, sec.gov.
The description of our proxy voting policies and procedures is also available on our corporate website. To access it, please visit the following Web page:
https://www3.troweprice.com/usis/corporate/en/utility/policies.html
Scroll down to the section near the bottom of the page that says, “Proxy Voting Policies.” Click on the Proxy Voting Policies link in the shaded box.
Each fund’s most recent annual proxy voting record is available on our website and through the SEC’s website. To access it through T. Rowe Price, visit the website location shown above, and scroll down to the section near the bottom of the page that says, “Proxy Voting Records.” Click on the Proxy Voting Records link in the shaded box.
HOW TO OBTAIN QUARTERLY PORTFOLIO HOLDINGS
Effective for reporting periods on or after March 1, 2019, the fund files a complete schedule of portfolio holdings with the Securities and Exchange Commission (SEC) for the first and third quarters of each fiscal year as an exhibit to its reports on Form N-PORT. Prior to March 1, 2019, the fund filed a complete schedule of portfolio holdings with the SEC for the first and third quarters of each fiscal year on Form N-Q. The fund’s Forms N-PORT and N-Q are available electronically on the SEC’s website (sec.gov).
ABOUT THE FUND’S DIRECTORS AND OFFICERS
Your fund is overseen by a Board of Directors (Board) that meets regularly to review a wide variety of matters affecting or potentially affecting the fund, including performance, investment programs, compliance matters, advisory fees and expenses, service providers, and business and regulatory affairs. The Board elects the fund’s officers, who are listed in the final table. At least 75% of the Board’s members are independent of the Boards of T. Rowe Price Associates, Inc. (T. Rowe Price), and its affiliates; “inside” or “interested” directors are employees or officers of T. Rowe Price. The business address of each director and officer is 100 East Pratt Street, Baltimore, Maryland 21202. The Statement of Additional Information includes additional information about the fund directors and is available without charge by calling a T. Rowe Price representative at 1-800-638-5660.
| INDEPENDENT DIRECTORS(a) |
| | | |
Name
(Year of Birth)
Year Elected*
[Number of T. Rowe Price
Portfolios Overseen] | | Principal Occupation(s) and Directorships of Public Companies and Other Investment Companies During the Past Five Years |
| | | |
Teresa Bryce Bazemore(b)
(1959)
2018
[189] | | President, Radian Guaranty (2008 to 2017); Member, Bazemore Consulting LLC (2018 to present); Member, Chimera Investment Corporation (2017 to present); Member, Federal Home Loan Bank of Pittsburgh (2017 to present) |
| | | |
Ronald J. Daniels(b)
(1959)
2018
[189] | | President, The Johns Hopkins University(c)and Professor, Political Science Department, The Johns Hopkins University (2009 to present); Director, Lyndhurst Holdings (2015 to present) |
| | | |
Bruce W. Duncan
(1951)
2013
[189] | | Chief Executive Officer and Director (January 2009 to December 2016), Chairman of the Board (January 2016 to present), and President (January 2009 to September 2016), First Industrial Realty Trust, an owner and operator of industrial properties; Chairman of the Board (2005 to September 2016) and Director (1999 to September 2016), Starwood Hotels & Resorts, a hotel and leisure company; Director, Boston Properties (May 2016 to present); Director, Marriott International, Inc. (September 2016 to present) |
| | | |
Robert J. Gerrard, Jr.
(1952)
2012
[189] | | Advisory Board Member, Pipeline Crisis/Winning Strategies, a collaborative working to improve opportunities for young African Americans (1997 to present); Chairman of the Board, all funds (since July 2018) |
| | | |
Paul F. McBride
(1956)
2013
[189] | | Advisory Board Member, Vizzia Technologies (2015 to present); Board Member, Dunbar Armored (2012 to present) |
| | | |
Cecilia E. Rouse, Ph.D.
(1963)
2012
[189] | | Dean, Woodrow Wilson School (2012 to present); Professor and Researcher, Princeton University (1992 to present); Member of National Academy of Education (2010 to present); Director, MDRC, a nonprofit education and social policy research organization (2011 to present); Research Associate of Labor Studies Program at the National Bureau of Economic Research (2011 to 2015); Board Member of the National Bureau of Economic Research (2011 to present); Chair of Committee on the Status of Minority Groups in the Economic Profession of the American Economic Association (2012 to 2017); Vice President (2015 to 2016), American Economic Association |
| | | |
John G. Schreiber
(1946)
2001
[189] | | Owner/President, Centaur Capital Partners, Inc., a real estate investment company (1991 to present); Cofounder, Partner, and Cochairman of the Investment Committee, Blackstone Real Estate Advisors, L.P. (1992 to 2015); Director, General Growth Properties, Inc. (2010 to 2013); Director, Blackstone Mortgage Trust, a real estate finance company (2012 to 2016); Director and Chairman of the Board, Brixmor Property Group, Inc. (2013 to present); Director, Hilton Worldwide (2013 to present); Director, Hudson Pacific Properties (2014 to 2016); Director, Invitation Homes (2014 to present) |
| | | |
Mark R. Tercek
(1957)
2009
[189] | | President and Chief Executive Officer, The Nature Conservancy (2008 to present) |
| | | |
(a)All information about the independent directors was current as of December 31, 2017, except for the information provided for Ms. Bazemore and Mr. Daniels, which is current as of January 1, 2018. |
(b)Effective January 1, 2018, Ms. Bazemore and Mr. Daniels were elected as independent directors of the Price Funds. |
(c)William J. Stromberg, president and chief executive officer of T. Rowe Price Group, Inc., the parent company of the Price Funds’ investment advisor, has served on the Board of Trustees of Johns Hopkins University since 2014 and is a member of the Johns Hopkins University Board’s Compensation Committee. |
| | | |
| INSIDE DIRECTORS | | |
| | | |
Name
(Year of Birth)
Year Elected*
[Number of T. Rowe Price
Portfolios Overseen] | | Principal Occupation(s) and Directorships of Public Companies and Other Investment Companies During the Past Five Years |
| | | |
Edward C. Bernard**
(1956)
2006
[0] | | Director and Vice President, T. Rowe Price; Vice Chairman of the Board, Director, and Vice President, T. Rowe Price Group, Inc.; Chairman of the Board, Director, and Vice President, T. Rowe Price Investment Services, Inc., and T. Rowe Price Services, Inc.; Chairman of the Board and Director, T. Rowe Price Retirement Plan Services, Inc.; Chairman of the Board, Chief Executive Officer, Director, and President, T. Rowe Price International and T. Rowe Price Trust Company; Chairman of the Board, all funds (2006 to July 2018) |
| | | |
David Oestreicher
(1967)
2018
[189] | | Chief Legal Officer, Vice President, and Secretary, T. Rowe Price Group, Inc.; Director, Vice President, and Secretary, T. Rowe Price Investment Services, Inc., T. Rowe Price Retirement Plan Services, Inc., T. Rowe Price Services, Inc., and T. Rowe Price Trust Company; Vice President and Secretary, T. Rowe Price, T. Rowe Price Hong Kong, and T. Rowe Price International; Vice President, T. Rowe Price Japan and T. Rowe Price Singapore; Principal Executive Officer and Executive Vice President, all funds |
| | | |
Robert W. Sharps, CFA, CPA
(1971)
2017
[135] | | Vice President, T. Rowe Price, T. Rowe Price Group, Inc., and T. Rowe Price Trust Company |
| | | |
*Each inside director serves until retirement, resignation, or election of a successor. |
**Effective at the conclusion of a meeting of the Boards of the Price Funds held on July 25, 2018, Mr. Bernard resigned from his role as a director and chairman of the Boards of all the Price Funds. |
| OFFICERS | | |
| | | |
Name (Year of Birth)
Position Held With Communications &
Technology Fund | | Principal Occupation(s) |
| | | |
Darrell N. Braman (1963)
Vice President and Secretary | | Vice President, Price Hong Kong, Price Singapore, T. Rowe Price, T. Rowe Price Group, Inc., T. Rowe Price International, T. Rowe Price Investment Services, Inc., and T. Rowe Price Services, Inc. |
| | | |
Paul Y. Cho (1986)
Vice President | | Vice President, T. Rowe Price and T. Rowe Price Group, Inc.; formerly, student, The Wharton School, University of Pennsylvania (to 2015); formerly, Investment Analyst, Maverick Capital (to 2013) |
| | | |
Gregory Dunham, CFA (1974)
Vice President | | Vice President, T. Rowe Price and T. Rowe Price Group, Inc.; formerly, Analyst, Goldman Sachs (to 2015) |
| | | |
David J. Eiswert, CFA (1972)
Vice President | | Vice President, T. Rowe Price, T. Rowe Price Group, Inc., and T. Rowe Price International |
| | | |
Henry M. Ellenbogen (1973)
Vice President | | Vice President, T. Rowe Price, T. Rowe Price Group, Inc., and T. Rowe Price Trust Company |
| | | |
Joseph B. Fath, CPA (1971)
Vice President | | Vice President, T. Rowe Price, T. Rowe Price Group, Inc., and T. Rowe Price Trust Company |
| | | |
John R. Gilner (1961)
Chief Compliance Officer | | Chief Compliance Officer and Vice President, T. Rowe Price; Vice President, T. Rowe Price Group, Inc., and T. Rowe Price Investment Services, Inc. |
| | | |
Gary J. Greb (1961)
Vice President | | Vice President, T. Rowe Price, T. Rowe Price International, and T. Rowe Price Trust Company |
| | | |
Paul D. Greene II (1978)
President | | Vice President, T. Rowe Price and T. Rowe Price Group, Inc. |
| | | |
Paul J. Krug, CPA (1964)
Vice President | | Vice President, T. Rowe Price, T. Rowe Price Group, Inc., and T. Rowe Price Trust Company |
| | | |
Jacqueline L. Liu (1979)
Vice President | | Vice President, Price Hong Kong and T. Rowe Price Group, Inc.; formerly, Investment Analyst, Fidelity International Hong Kong Limited (to 2014) |
| | | |
Daniel Martino, CFA (1974)
Vice President | | Vice President, T. Rowe Price and T. Rowe Price Group, Inc. |
| | | |
Catherine D. Mathews (1963)
Treasurer and Vice President | | Vice President, T. Rowe Price, T. Rowe Price Group, Inc., and T. Rowe Price Trust Company |
| | | |
Philip A. Nestico (1976)
Vice President | | Vice President, T. Rowe Price and T. Rowe Price Group, Inc. |
| | | |
John W. Ratzesberger (1975)
Vice President | | Vice President, T. Rowe Price, T. Rowe Price Group, Inc., and T. Rowe Price Trust Company; formerly, North American Head of Listed Derivatives Operation, Morgan Stanley (to 2013) |
| | | |
Shannon H. Rauser (1987)
Assistant Secretary | | Employee, T. Rowe Price |
| | | |
Corey D. Shull, CFA (1983)
Vice President | | Vice President, T. Rowe Price and T. Rowe Price Group, Inc. |
| | | |
James Stillwagon (1982)
Vice President | | Vice President, T. Rowe Price and T. Rowe Price Group, Inc.; formerly, Partner, Cat Rock Capital (to 2016); formerly, Managing Director, Lone Pine Capital (to 2015); formerly, Managing Director, Media & Telecommunications Group, Maverick Capital (to 2013) |
| | | |
Verena E. Wachnitz, CFA (1978)
Vice President | | Vice President, T. Rowe Price Group, Inc., and T. Rowe Price International |
| | | |
Megan Warren (1968)
Vice President | | Vice President, T. Rowe Price, T. Rowe Price Group, Inc., T. Rowe Price Retirement Plan Services, Inc., T. Rowe Price Services, Inc., and T. Rowe Price Trust Company; formerly, Executive Director, JP Morgan Chase (to 2017) |
| | | |
Justin P. White (1981)
Vice President | | Vice President, T. Rowe Price and T. Rowe Price Group, Inc. |
| | | |
Christopher S. Whitehouse (1972)
Vice President | | Vice President, T. Rowe Price Group, Inc., and T. Rowe Price International |
| | | |
Ernest C. Yeung, CFA (1979)
Vice President | | Director, Responsible Officer, and Vice President, Price Hong Kong; Vice President, T. Rowe Price Group, Inc. |
| | | |
Wenli Zheng (1979)
Vice President | | Vice President, Price Hong Kong and T. Rowe Price Group, Inc. |
Unless otherwise noted, officers have been employees of T. Rowe Price or T. Rowe Price International for at least 5 years.
Item 2. Code of Ethics.
The registrant has adopted a code of ethics, as defined in Item 2 of Form N-CSR, applicable to its principal executive officer, principal financial officer, principal accounting officer or controller, or persons performing similar functions. A copy of this code of ethics is filed as an exhibit to this Form N-CSR. No substantive amendments were approved or waivers were granted to this code of ethics during the period covered by this report.
Item 3. Audit Committee Financial Expert.
The registrant’s Board of Directors/Trustees has determined that Mr. Bruce W. Duncan qualifies as an audit committee financial expert, as defined in Item 3 of Form N-CSR. Mr. Duncan is considered independent for purposes of Item 3 of Form N-CSR.
Item 4. Principal Accountant Fees and Services.
(a) – (d) Aggregate fees billed for the last two fiscal years for professional services rendered to, or on behalf of, the registrant by the registrant’s principal accountant were as follows:

Audit fees include amounts related to the audit of the registrant’s annual financial statements and services normally provided by the accountant in connection with statutory and regulatory filings. Audit-related fees include amounts reasonably related to the performance of the audit of the registrant’s financial statements and specifically include the issuance of a report on internal controls and, if applicable, agreed-upon procedures related to fund acquisitions. Tax fees include amounts related to services for tax compliance, tax planning, and tax advice. The nature of these services specifically includes the review of distribution calculations and the preparation of Federal, state, and excise tax returns. All other fees include the registrant’s pro-rata share of amounts for agreed-upon procedures in conjunction with service contract approvals by the registrant’s Board of Directors/Trustees.
(e)(1) The registrant’s audit committee has adopted a policy whereby audit and non-audit services performed by the registrant’s principal accountant for the registrant, its investment adviser, and any entity controlling, controlled by, or under common control with the investment adviser that provides ongoing services to the registrant require pre-approval in advance at regularly scheduled audit committee meetings. If such a service is required between regularly scheduled audit committee meetings, pre-approval may be authorized by one audit committee member with ratification at the next scheduled audit committee meeting. Waiver of pre-approval for audit or non-audit services requiring fees of a de minimis amount is not permitted.
(2) No services included in (b) – (d) above were approved pursuant to paragraph (c)(7)(i)(C) of Rule 2-01 of Regulation S-X.
(f) Less than 50 percent of the hours expended on the principal accountant’s engagement to audit the registrant’s financial statements for the most recent fiscal year were attributed to work performed by persons other than the principal accountant’s full-time, permanent employees.
(g) The aggregate fees billed for the most recent fiscal year and the preceding fiscal year by the registrant’s principal accountant for non-audit services rendered to the registrant, its investment adviser, and any entity controlling, controlled by, or under common control with the investment adviser that provides ongoing services to the registrant were $2,544,000 and $2,169,000, respectively.
(h) All non-audit services rendered in (g) above were pre-approved by the registrant’s audit committee. Accordingly, these services were considered by the registrant’s audit committee in maintaining the principal accountant’s independence.
Item 5. Audit Committee of Listed Registrants.
Not applicable.
Item 6. Investments.
(a) Not applicable. The complete schedule of investments is included in Item 1 of this Form N-CSR.
(b) Not applicable.
Item 7. Disclosure of Proxy Voting Policies and Procedures for Closed-End Management Investment Companies.
Not applicable.
Item 8. Portfolio Managers of Closed-End Management Investment Companies.
Not applicable.
Item 9. Purchases of Equity Securities by Closed-End Management Investment Company and Affiliated Purchasers.
Not applicable.
Item 10. Submission of Matters to a Vote of Security Holders.
Not applicable.
Item 11. Controls and Procedures.
(a) The registrant’s principal executive officer and principal financial officer have evaluated the registrant’s disclosure controls and procedures within 90 days of this filing and have concluded that the registrant’s disclosure controls and procedures were effective, as of that date, in ensuring that information required to be disclosed by the registrant in this Form N-CSR was recorded, processed, summarized, and reported timely.
(b) During the period, the Price Funds’ accounting agent, The Bank of New York Mellon (BNYM), converted the fund’s books and records from a legacy fund accounting system / operating model to a BNYM fund accounting system / operating model.
Item 12. Exhibits.
(a)(1) The registrant’s code of ethics pursuant to Item 2 of Form N-CSR is attached.
(2) Separate certifications by the registrant's principal executive officer and principal financial officer, pursuant to Section 302 of the Sarbanes-Oxley Act of 2002 and required by Rule 30a-2(a) under the Investment Company Act of 1940, are attached.
(3) Written solicitation to repurchase securities issued by closed-end companies: not applicable.
(b) A certification by the registrant’s principal executive officer and principal financial officer, pursuant to Section 906 of the Sarbanes-Oxley Act of 2002 and required by Rule 30a-2(b) under the Investment Company Act of 1940, is attached.
SIGNATURES
Pursuant to the requirements of the Securities Exchange Act of 1934 and the Investment Company Act of 1940, the registrant has duly caused this report to be signed on its behalf by the undersigned, thereunto duly authorized.
T. Rowe Price Communications & Technology Fund, Inc.
| By | | /s/ David Oestreicher |
| | | David Oestreicher |
| | | Principal Executive Officer |
| |
| Date | | February 15, 2019 | | | | |
Pursuant to the requirements of the Securities Exchange Act of 1934 and the Investment Company Act of 1940, this report has been signed below by the following persons on behalf of the registrant and in the capacities and on the dates indicated.
| By | | /s/ David Oestreicher |
| | | David Oestreicher |
| | | Principal Executive Officer |
| |
| Date | | February 15, 2019 | | | | |
| |
| |
| By | | /s/ Catherine D. Mathews |
| | | Catherine D. Mathews |
| | | Principal Financial Officer |
| |
| Date | | February 15, 2019 | | | | |