UNITED STATES
SECURITIES AND EXCHANGE COMMISSION
Washington, D.C. 20549
FORM N-CSR
CERTIFIED SHAREHOLDER REPORT OF REGISTERED
MANAGEMENT INVESTMENT COMPANIES
Investment Company Act File Number: 811-07075
| T. Rowe Price Communications & Technology Fund, Inc. |
|
| (Exact name of registrant as specified in charter) |
| |
| 100 East Pratt Street, Baltimore, MD 21202 |
|
| (Address of principal executive offices) |
| |
| David Oestreicher |
| 100 East Pratt Street, Baltimore, MD 21202 |
|
| (Name and address of agent for service) |
Registrant’s telephone number, including area code: (410) 345-2000
Date of fiscal year end: December 31
Date of reporting period: June 30, 2019
Item 1. Reports to Shareholders
(a) Report pursuant to Rule 30e-1.
| Communications & Technology Fund | June 30, 2019 |
| PRMTX | Investor Class |
| TTMIX | I Class |
Beginning on January 1, 2021, as permitted by SEC regulations, paper copies of the T. Rowe Price funds’ annual and semiannual shareholder reports will no longer be mailed, unless you specifically request them. Instead, shareholder reports will be made available on the funds’ website (troweprice.com/prospectus), and you will be notified by mail with a website link to access the reports each time a report is posted to the site.
If you already elected to receive reports electronically, you will not be affected by this change and need not take any action. At any time, shareholders who invest directly in T. Rowe Price funds may generally elect to receive reports or other communications electronically by enrolling attroweprice.com/paperlessor, if you are a retirement plan sponsor or invest in the funds through a financial intermediary (such as an investment advisor, broker-dealer, insurance company, or bank), by contacting your representative or your financial intermediary.
You may elect to continue receiving paper copies of future shareholder reports free of charge. To do so, if you invest directly with T. Rowe Price, please call T. Rowe Price as follows: IRA, nonretirement account holders, and institutional investors,1-800-225-5132; small business retirement accounts,1-800-492-7670. If you are a retirement plan sponsor or invest in the T. Rowe Price funds through a financial intermediary, please contact your representative or financial intermediary or follow additional instructions if included with this document. Your election to receive paper copies of reports will apply to all funds held in your account with your financial intermediary or, if you invest directly in the T. Rowe Price funds, with T. Rowe Price. Your election can be changed at any time in the future.
| T. ROWE PRICE COMMUNICATIONS & TECHNOLOGY FUND |
|
HIGHLIGHTS
| ■ | Stocks rebounded from a difficult 2018, bolstered by signs that U.S.-China trade tensions were improving and expectations that the Federal Reserve is more likely to cut interest rates than keep them steady. |
| |
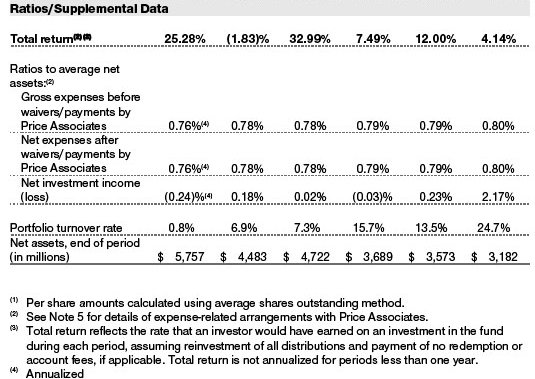
| ■ | The Communications & Technology Fund posted a 25.28% return in the first six months of 2019 and handily outperformed its benchmark. |
| |
| ■ | Large-cap internet stocks in the U.S. and China were leading contributors, along with companies that own towers housing equipment for cellular networks. Our biggest detractors included internet holdings that came under pressure from earnings misses and European telecommunication services stocks. |
| |
| ■ | We explain the philosophical and practical reasons behind why the portfolio holds smaller positions. |

Log in to your account attroweprice.comfor more information.
*Certain mutual fund accounts that are assessed an annual account service fee can also save money by switching to e-delivery.
Management’s Discussion of Fund Performance
Fellow Shareholders
After a challenging 2018, the first half of 2019 brought solid returns for U.S. equities and our investment universe. Our balanced portfolio of rapidly growing innovators and steady compounders fared even better, outperforming its primary benchmark andthe broader market by a wide margin.
This period wasn’t without bouts of volatility in equity markets, as investor sentiment and short-term risk appetites fluctuated with the latest news on U.S.-China trade relations and the potential implications for economic growth. Within the information technology sector, U.S.-China trade tensions and the U.S. ban on technology shipments to Chinese telecom equipment giant Huawei contributed to volatility, as did reports that federal regulators had taken steps that could set the stage for antitrust investigations into some of the leading U.S. online platforms. In that vein, my views onFacebook, expressed in the annual shareholder letter for 2018, still stand. We acknowledge the risks associated with the potential for increased regulatory scrutiny of Facebook. However, we also like the stickiness of Facebook’s social media platforms among users and its leverage to the secular growth in online advertising. The portfolio’s strength in this environment reflects its limited exposure to cyclical stocks and emphasis on firms that are exploiting the internet and other new technologies to create markets or take share in existing ones. These businesses will not necessarily be immune to a downturn. Frothy valuations are another risk, particularly in the software subsector. We don’t have any special insight into the timing of the next downturn in the economy and markets; however, we do have conviction in our process as well as the sustainability of the high-quality growth stocks we own and their potential to compound value for shareholders over a longer time frame. (Please refer to the fund’s portfolio of investments for a complete list of our holdings and the amount each represents in the portfolio.)
PERFORMANCE COMPARISON
The Communications & Technology Fund returned 25.28% in the six months ended June 30, 2019. The fund again outpaced the Lipper Telecommunication Funds Average by a wide margin, and its long-term relative performance remained strong, making it one of Lipper’s top two funds in its category over the standard longer-term time periods ended June 30, 2019. Based on cumulative total return, Lipper ranked the Communications & TechnologyFund 5 of 29 (its I Class counterpart ranked third), 2 of 28, 1 of 27, and 1 of 24 telecommunication funds for the 1-, 3-, 5-, and 10-year periods ended June 30, 2019, respectively. Returns and rankings for I Class shares varied, reflecting their different fee structure. (Past performance cannot guarantee future results.)

MARKET ENVIRONMENT
Markets overcame a bout of volatility in May and recorded exceptional returns in the six months ended June 30, 2019. The large-cap S&P 500 Index reached record highs and notched its best start to a year in over two decades. Overseas equity markets were also strong, while bond prices rose as longer-term interest rates fell to their lowest levels since late 2016. Investors seemed most relieved by a dovish pivot in the Federal Reserve’s monetary policy outlook and growing confidence that the U.S. central bank would cut interest rates rather than keeping them steady. Headlines related to U.S.-China trade relations contributed to volatility during the period, though stocks received a lift in June from optimism that discussions between U.S. and Chinese leaders at the Group of 20 summit could help to ease these tensions.
In terms of our investment universe, speculation that the dominant U.S. online platforms could face stepped-up regulatory scrutiny from federal regulators became a bit more concrete when news broke that the Department of Justice and Federal Trade Commission reportedly had determined which agency would have the jurisdiction to launch potential probes intoAmazon.com, Apple, Facebook, andAlphabet, Google’s parent company. The outlook section in my last letter addressed these concerns as they apply to Facebook. My views still stand; however, given recent news flow and the prominence of Amazon, Facebook, and Alphabet in our portfolio, a few more words are warranted.
In our view, the risk of increased regulation is a fact of life for these companies, and we acknowledge the potential that news flow on this front could lead to increased volatility for these stocks. However, precedents suggest that any antitrust investigation would take multiple years, and we believe that,to varying degrees, the large internet companies have taken important steps to address some concerns related to content issues and data privacy. It’s also important not to lose sight of fundamentals. We believe Amazon, Facebook, and Alphabet enjoy durable competitive advantages, including their strong balance sheets, scale, internal talent, and computing infrastructure, as well as the stickiness of their platforms among consumers. Consider Amazon, which continues to distance itself from the competition through ongoing investments in its logistics network to deliver a level of service that its rivals cannot match. And that says nothing about the company’s willingness and capacity to pluck low-hanging fruit from its existing operations while making big bets on future opportunities.
The first six months of 2019 also featured a robust crop of high-quality internet and cloud-based software companies going public. Investors snapped up many of these high-profile issues, resulting in some impressive post-listing stock performance. The success of these listings underscores the value the market attaches to companies leveraging the internet and cloud computing to create new markets and disrupt existing ones. With the window for initial public offerings (IPO) wide open, we could see more internet and software-as-a-service companies coming to the stock market. Your fund participated in several new listings in the first half of the year, and future IPOs could be a source of starter positions in companies that we believe can compound value over a longer time frame. (More on the strategy behind the portfolio’s long tail of smaller positions below.)
PORTFOLIO REVIEW
The portfolio’s large-cap holdings posted strong absolute returns and largely recovered from pullbacks related to fears about increased regulatory scrutiny and the potential that U.S. agencies could pursue antitrust investigations of the dominant U.S. online platforms.
Our leading contributor over the six months was Amazon, the portfolio’s largest holding at the end of the period and a stock that has been one of the central drivers of our success in recent years. Although the internet giant’s retail business decelerated slightly, the company’s operating income increased at a faster-than-expected pace, driven by strength in its advertising business and cloud computing franchise. The scale and strength of Amazon’s retail and public cloud businesses, coupled with its strong balance sheet and forward-looking management team, give the company the necessary resources to make big bets on future innovation and disruption. In our view, the market does notfully understand the potential embedded in the company’s advertising business, which boasts high profit margins and has inherent advantages relative to competing ad platforms because of its proximity to the point of sale.

Facebook was the second-best contributor. The social media giant, which also operates the popular Instagram and WhatsApp platforms, reported two consecutive quarters of strongresults that showed no signs that users or advertisers were abandoning its products. Facebook’s share of consumer time spent on mobile devices, coupled with its ad targeting capabilities, should help it generate advertising-led revenue growth over the next several years. We also like the company’s opportunity to monetize Instagram via e-commerce, the privacy-focused WhatsApp messaging service’s long-term potential, and management’s efforts to address concerns about content and data issues. Facebook’s announcement of plans to develop a digital currency, Libra, demonstrates the company’s commitment to innovation, though we regard this as a longer-term opportunity that is not necessarily a sure success.
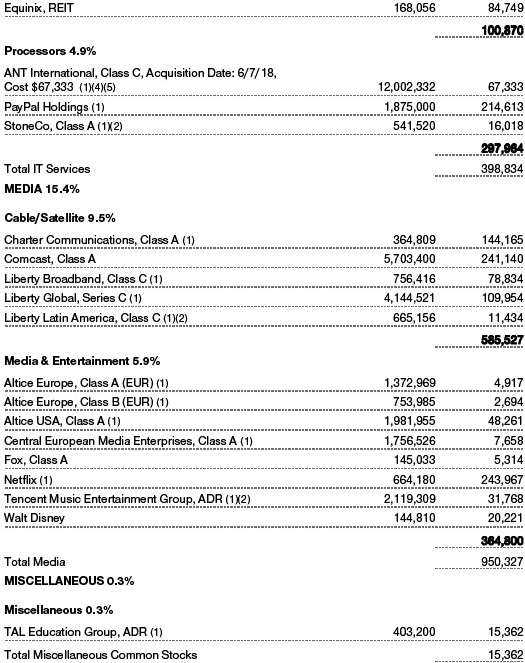
We generally limit our investment in the wireless industry, but the cellular tower operators have long been an exception. We view these low-tech businesses as long-term compounders that benefit from growing consumption of wireless data. Our third-best contributor during the period wasAmerican Tower, the world’s largest tower owner.Crown Castle InternationalandSBA Communications, which also compete in this space, ranked among the portfolio’s 10 best absolute performers. The stocks rallied on generally solid quarterly results, declining interest rates, and expectations that the Fed is more likely to cut rates than hold them steady. Lower interest rates tend to increase the value and appeal of the tower companies’ dividend payments. Although the prospect of wireless providersT-Mobile USand Sprint combining could lead to some churn for tower companies, we believe that these challenges will be manageable and should not undermine the potential for our tower holdings to compound value for shareholders over the long haul.
Netflix, the leader in streaming video on demand and a prime beneficiary of consumers embracing alternatives to traditional cable television, was another leading contributor. In January, the stock surged after the company reported strong viewership numbers for its original content, announced plans to raise the price for its U.S. service, and reported stronger-than-expected subscriber additions in the fourth quarter. We believe Netflix has a long runway to grow its international subscriber base, and its margins should improve over time as revenue increases at a faster pace than expenses.
Alibaba Group Holdingrounds out the top five contributors. The stock rallied with the broader Chinese equity market on signs that U.S.-China trade tensions were easing, though the company’s solid quarterly results also provided a lift and stood out in a challenging macroeconomic environment. Alibaba’s investments in its cloud business and offline retail show promise and should pay off by expanding the company’s total addressable market. The company’s leadership in e-commerce also offers exposure to rising household incomes in China and other emerging markets.
Some of the portfolio’s biggest detractors also came from the internet subsector, though smaller position sizes helped to limit the damage.Duluth Holdings, an apparel brand that specializes in casual and work wear, generates the bulk of its direct sales through its website. The stock plunged and trended lower on weakness in direct sales and concerns about the productivity of its brick-and-mortar locations. With proper execution, the company’s strong identity and experience in omnichannel selling should create value for shareholders over time.ANGI Homeservicesoperates complementary online platforms—HomeAdvisor and Angie’s List—that help to pair homeowners with plumbers, roofers, landscapers, and other local service providers. The stock came under pressure from weakness in home service requests and worries about increasing competition from Google. We’ll see whether management’s investments and strategy pay off by attracting quality service providers to the platform and growing the number of homeowners who use the site regularly.
China’s vast internet market remains a focus of the portfolio.Baidu, another meaningful detractor in the internet subsector, operates China’s dominant search engine and leading application store and maps product. The company’s quarterly results have suffered more from the macroeconomic slowdown and uncertainty than Alibaba’s andTencent Holdings’earnings, reflecting weak advertising demand among small and mid-size businesses. Emerging platforms also continue to take market share from Baidu.
European wireless companiesIliadandVodafonealso ranked among the five largest detractors. Iliad, which provides broadband and wireless services in France, tumbled early in the period on concerns about the intense competitive environment and the company’s disappointing growth relative to its peers. UK-based Vodafone sold off after the company announced a dividend cut. Albeit disappointing, this development should not impair the potential for the company to unlock value from its acquisition ofLiberty Global’s telecom assets in Germany and smaller European markets.
OUTLOOK: DOWN ON THE FARM—THE PORTFOLIO’S SMALL POSITIONS
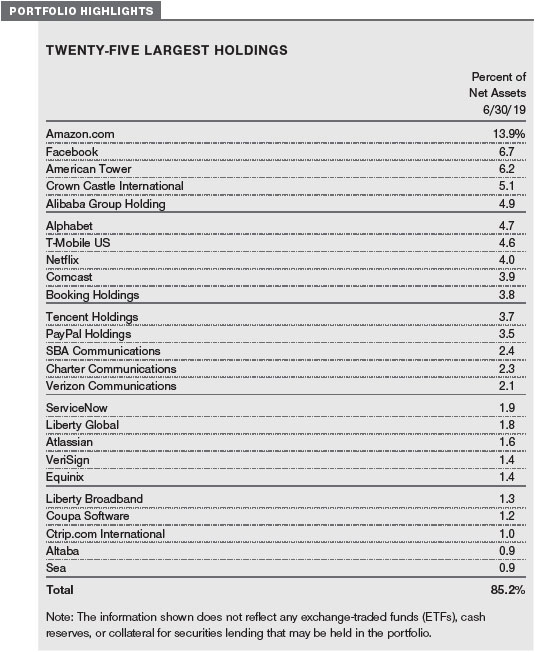
In past letters, I’ve often written on topics related to our largest holdings, in part because these positions represent some of our highest-conviction bets and tend to exert a greater influence on the portfolio’s overall performance. In fact, at the end of June, our top 20 holdings by issuer accounted for almost 80% of assets.
The other roughly 20% of the fund comprised holdings from 49 issuers, which translates into an average position size of about 41 basis points (0.41%) of assets. Of these positions, 32 were below 32 basis points. In other words, the portfolio is concentrated but has a long tail of smaller positions.
Why do we have this collection of smaller positions? There are several reasons, but I’ll start with a reminder of our philosophy. In general, we aim to find the very best businesses that we think can durably earn outsized returns over many years. Once we identify these companies, we want to own a lot of them and hold on to them. To make these big bets, we like to see a combination of four characteristics:
| ■ | A strong fundamental backdrop, including sustainably robust demand for the company’s product or service, a favorable industry structure, durable competitive advantages, and a high-quality management team; |
| |
| ■ | An accommodating valuation that will not get in the way of us earning above-average returns over time; |
| |
| ■ | Unique insights that we don’t think the market appreciates; and |
| |
| ■ | Research-backed conviction that our insights are correct. |
When a stock checks all these boxes, we can feel confident about making a big bet; if we find opportunities that only exhibit a subset of these factors, then we may take a smaller position.
For example, let’s say we have found a potentially great company and believe we have a differentiated view into its growth prospects. Although we like the company, we’ve not been able to prove to ourselves that our insights are indeed accurate. The valuation is also very rich. In a situation like this, we may choose to own a smaller position in the stock until we can build more conviction through our research process and/or if the stock’s valuation becomes less demanding.
In a sense, these smaller positions are the farm team where companies prove their worth on the way to joining the majors (the top 20 holdings) down the road. Not every company will make it to the big league, but they all have a chance.
Much of our trading activity falls into this bucket as well, reflecting both positive and negative outcomes. Maybe we’ve built conviction through further research and added to our position. Maybe we were wrong and needed to exit a position. I believe it is healthy if the majority of our trading activity continues to occur in this bucket.
In addition to the philosophical reasons for holding a long tail of smaller positions, there are practical considerations. In many cases, we simply cannot own more of a stock. Two common constraints are a stock’s lack of liquidity and ownership limitations that restrict our capacity to purchase more shares. Capacity constraints tend to be most pronounced for small- and mid-cap companies, especially new IPOs. A company may float only a small percentage of its shares when it goes public, making it impossible to build larger positions before running into regulatory limits on how much of a stock T. Rowe Price can own. Liquidity challenges occur most often with private investments. Unlike securities that trade in the public markets, where we can usually purchase more if desired, in the case of private investments, we usually need to wait for a liquidity event (e.g., another round of fundraising or an IPO) before we’re able to add to our position.
While individual positions in this bucket may be small, they are very important for two reasons:
| ■ | First, if we do a good job of selecting stocks that land in this bucket, then their collective performance can be additive to the fund’s returns; and |
| |
| ■ | Second, as mentioned above, they are the farm team that can become top bets over time. |
Some managers may be unwilling to own stocks where they are relegated to small positions, taking the view that these holdings won’t move the needle on the portfolio’s performance. We have found that a willingness to own smaller positions and the patience to hold them can really pay off.
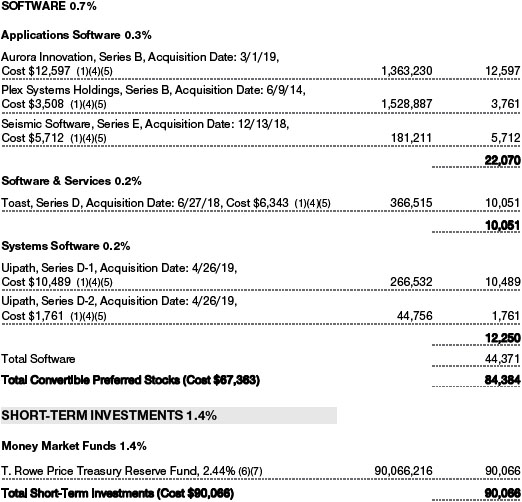
ConsiderAtlassian, a position that we first established via a private placement and added to at the fast-growing software company’s eventual IPO. Priced at cost, these combined purchases would represent about 21 basis points (0.21%) of the portfolio’s value at the end of June 2019. However, at period-end, this position’s portfolio weighting stood at 157 basis points, making Atlassian our 18th-largest holding. In other words, 86.5% of the value of our Atlassian position came from price appreciation.
Coupa Softwareis another example. Similar to Atlassian, our investment in Coupa Software began as a private placement. We increased this position slightly at the IPO and then added to the holding modestly over the subsequent months. When priced at cost, these combined purchases accounted for 19 basis points (0.19%) of the portfolio’s value as of June 30, 2019. In contrast, Coupa Software’s weighting stood at 122 basis points at the end of the second quarter, making it the portfolio’s 22nd-largest position. That means 84.5% of the value of our stake in Coupa Software came from price appreciation.
These examples highlight why it’s worthwhile to hold small positions and allocate time to researching and analyzing them. Atlassian and Coupa Software also demonstrate how our activities in private markets can add value, though we note that the outcomes of our private investments have varied.
In closing, regardless of whether a position size is small or large, the most important factors in generating strong returns are to correctly identify special companies and to have the patience to let them compound for you over time. This is at the heart of our investment process and will remain our priority going forward.
Respectfully submitted,

Paul D. Greene II
Chairman of the fund’s Investment Advisory Committee
July 18, 2019
The committee chairman has day-to-day responsibility for managing the portfolio and works with committee members in developing and executing the fund’s investment program.
RISKS OF INVESTING IN THE FUND
Securities of companies in the same industry may decline in price at the same time due to industry-specific developments since these companies may share common characteristics and are more likely to react similarly to industry-specific market or economic developments. Since the fund is focused on industries related to communications and technology, it is less diversified than stock funds investing in a broader range of industries and, therefore, could experience significant volatility. Companies in these industries are subject to the additional risks of rapid obsolescence of their products or services, lack of investor or consumer acceptance, lack of standardization or compatibility with existing technologies, an unfavorable regulatory environment, intense competition, and a dependency on patent and copyright protection. Likewise, if the portfolio has substantial exposure to mid-cap companies, it would be subject to the greater volatility of those stocks compared with stocks of larger companies.
GLOSSARY
Lipper averages:The averages of available mutual fund performance returns for specified periods in categories defined by Lipper Inc.
S&P 500 Index:An unmanaged index that tracks the stocks of 500 primarily large-cap U.S. companies.

GROWTH OF $10,000
This chart shows the value of a hypothetical $10,000 investment in the fund over the past 10 fiscal year periods or since inception (for funds lacking 10-year records). The result is compared with benchmarks, which include a broad-based market index and may also include a peer group average or index. Market indexes do not include expenses, which are deducted from fund returns as well as mutual fund averages and indexes.

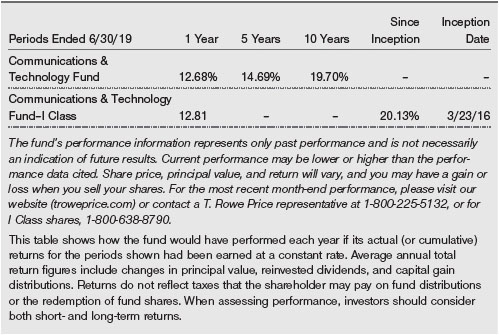
AVERAGE ANNUAL COMPOUND TOTAL RETURN
EXPENSE RATIO

FUND EXPENSE EXAMPLE
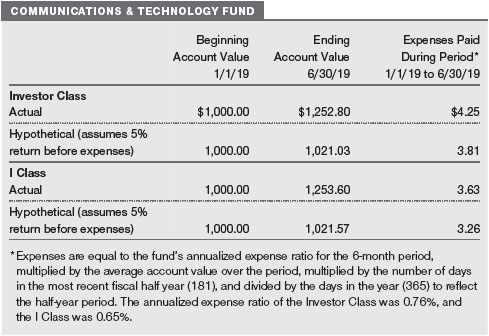
As a mutual fund shareholder, you may incur two types of costs: (1) transaction costs, such as redemption fees or sales loads, and (2) ongoing costs, including management fees, distribution and service (12b-1) fees, and other fund expenses. The following example is intended to help you understand your ongoing costs (in dollars) of investing in the fund and to compare these costs with the ongoing costs of investing in other mutual funds. The example is based on an investment of $1,000 invested at the beginning of the most recent six-month period and held for the entire period.
Please note that the fund has two share classes: The original share class (Investor Class) charges no distribution and service (12b-1) fee, and the I Class shares are also available to institutionally oriented clients and impose no 12b-1 or administrative fee payment. Each share class is presented separately in the table.
Actual Expenses
The first line of the following table (Actual) provides information about actual account values and expenses based on the fund’s actual returns. You may use the information on this line, together with your account balance, to estimate the expenses that you paid over the period. Simply divide your account value by $1,000 (for example, an $8,600 account value divided by $1,000 = 8.6), then multiply the result by the number on the first line under the heading “Expenses Paid During Period” to estimate the expenses you paid on your account during this period.
Hypothetical Example for Comparison Purposes
The information on the second line of the table (Hypothetical) is based on hypothetical account values and expenses derived from the fund’s actual expense ratio and an assumed 5% per year rate of return before expenses (not the fund’s actual return). You may compare the ongoing costs of investing in the fund with other funds by contrasting this 5% hypothetical example and the 5% hypothetical examples that appear in the shareholder reports of the other funds. The hypothetical account values and expenses may not be used to estimate the actual ending account balance or expenses you paid for the period.
Note:T. Rowe Price charges an annual account service fee of $20, generally for accounts with less than $10,000. The fee is waived for any investor whose T. Rowe Price mutual fund accounts total $50,000 or more; accounts electing to receive electronic delivery of account statements, transaction confirmations, prospectuses, and shareholder reports; or accounts of an investor who is a T. Rowe Price Personal Services or Enhanced Personal Services client (enrollment in these programs generally requires T. Rowe Price assets of at least $250,000). This fee is not included in the accompanying table. If you are subject to the fee, keep it in mind when you are estimating the ongoing expenses of investing in the fund and when comparing the expenses of this fund with other funds.
You should also be aware that the expenses shown in the table highlight only your ongoing costs and do not reflect any transaction costs, such as redemption fees or sales loads. Therefore, the second line of the table is useful in comparing ongoing costs only and will not help you determine the relative total costs of owning different funds. To the extent a fund charges transaction costs, however, the total cost of owning that fund is higher.
Unaudited

The accompanying notes are an integral part of these financial statements.
Unaudited


The accompanying notes are an integral part of these financial statements.
Unaudited


The accompanying notes are an integral part of these financial statements.
Unaudited
The accompanying notes are an integral part of these financial statements.
Unaudited


The accompanying notes are an integral part of these financial statements.
Unaudited


The accompanying notes are an integral part of these financial statements.
Unaudited
| NOTES TO FINANCIAL STATEMENTS |
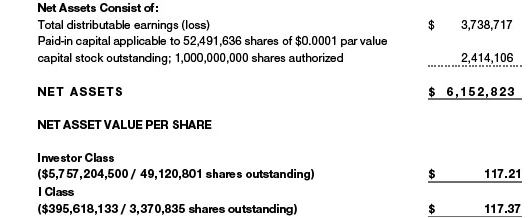
T. Rowe Price Communications & Technology Fund, Inc. (the fund) is registered under the Investment Company Act of 1940 (the 1940 Act) as a nondiversified, open-end management investment company. The fund seeks to provide long-term capital growth. The fund has two classes of shares: the Communications & Technology Fund (Investor Class) and the Communications & Technology Fund–I Class (I Class). I Class shares require a $1 million initial investment minimum, although the minimum generally is waived for retirement plans, financial intermediaries, and certain other accounts. Each class has exclusive voting rights on matters related solely to that class; separate voting rights on matters that relate to both classes; and, in all other respects, the same rights and obligations as the other class.
NOTE 1 - SIGNIFICANT ACCOUNTING POLICIES
Basis of PreparationThe fund is an investment company and follows accounting and reporting guidance in the Financial Accounting Standards Board (FASB)Accounting Standards Codification Topic 946 (ASC 946). The accompanying financial statements were prepared in accordance with accounting principles generally accepted in the United States of America (GAAP), including, but not limited to, ASC 946. GAAP requires the use of estimates made by management. Management believes that estimates and valuations are appropriate; however, actual results may differ from those estimates, and the valuations reflected in the accompanying financial statements may differ from the value ultimately realized upon sale or maturity. Certain prior year amounts in the accompanying financial statements and financial highlights have been restated to conform to current year presentation.
Investment Transactions, Investment Income, and DistributionsInvestment transactions are accounted for on the trade date basis. Income and expenses are recorded on the accrual basis. Realized gains and losses are reported on the identified cost basis. Income tax-related interest and penalties, if incurred, are recorded as income tax expense. Dividends received from mutual fund investments are reflected as dividend income; capital gain distributions are reflected as realized gain/loss. Dividend income and capital gain distributions are recorded on the ex-dividend date. Distributions from REITs are initially recorded as dividend income and, to the extent such represent a return of capital or capital gain for tax purposes, are reclassified when such information becomes available. Distributions to shareholders are recorded on the ex-dividend date. Income distributions, if any, are declared and paid by each class annually. A capital gain distribution may also be declared and paid by the fund annually.
Currency TranslationAssets, including investments, and liabilities denominated in foreign currencies are translated into U.S. dollar values each day at the prevailing exchange rate, using the mean of the bid and asked prices of such currencies against U.S. dollars as quoted by a major bank. Purchases and sales of securities, income, and expenses are translated into U.S. dollars at the prevailing exchange rate on the respective date of such transaction. The effect of changes in foreign currency exchange rates on realized and unrealized security gains and losses is not bifurcated from the portion attributable to changes in market prices.
Class AccountingShareholder servicing, prospectus, and shareholder report expenses incurred by each class are charged directly to the class to which they relate. Expenses common to both classes, investment income, and realized and unrealized gains and losses are allocated to the classes based upon the relative daily net assets of each class.
New Accounting GuidanceIn March 2017, the FASB issued amended guidance to shorten the amortization period for certain callable debt securities held at a premium. The guidance is effective for fiscal years and interim periods beginning after December 15, 2018. Adoption will have no effect on the fund’s net assets or results of operations.
IndemnificationIn the normal course of business, the fund may provide indemnification in connection with its officers and directors, service providers, and/or private company investments. The fund’s maximum exposure under these arrangements is unknown; however, the risk of material loss is currently considered to be remote.
NOTE 2 - VALUATION
The fund’s financial instruments are valued and each class’s net asset value (NAV) per share is computed at the close of the New York Stock Exchange (NYSE), normally 4 p.m. ET, each day the NYSE is open for business. However, the NAV per share may be calculated at a time other than the normal close of the NYSE if trading on the NYSE is restricted, if the NYSE closes earlier, or as may be permitted by the SEC.
Fair ValueThe fund’s financial instruments are reported at fair value, which GAAP defines as the price that would be received to sell an asset or paid to transfer a liability in an orderly transaction between market participants at the measurement date. The T. Rowe Price Valuation Committee (the Valuation Committee) is an internal committee that has been delegated certain responsibilities by the fund’s Board of Directors (the Board) to ensure that financial instruments are appropriately priced at fair value in accordance with GAAP and the 1940 Act. Subject to oversight by the Board, the Valuation Committee develops and oversees pricing-related policies and procedures and approves all fair valuedeterminations. Specifically, the Valuation Committee establishes procedures to value securities; determines pricing techniques, sources, and persons eligible to effect fair value pricing actions; oversees the selection, services, and performance of pricing vendors; oversees valuation-related business continuity practices; and provides guidance on internal controls and valuation-related matters. The Valuation Committee reports to the Board and has representation from legal, portfolio management and trading, operations, risk management, and the fund’s treasurer.
Various valuation techniques and inputs are used to determine the fair value of financial instruments. GAAP establishes the following fair value hierarchy that categorizes the inputs used to measure fair value:
Level 1 – quoted prices (unadjusted) in active markets for identical financial instruments that the fund can access at the reporting date
Level 2 – inputs other than Level 1 quoted prices that are observable, either directly or indirectly (including, but not limited to, quoted prices for similar financial instruments in active markets, quoted prices for identical or similar financial instruments in inactive markets, interest rates and yield curves, implied volatilities, and credit spreads)
Level 3 – unobservable inputs
Observable inputs are developed using market data, such as publicly available information about actual events or transactions, and reflect the assumptions that market participants would use to price the financial instrument. Unobservable inputs are those for which market data are not available and are developed using the best information available about the assumptions that market participants would use to price the financial instrument. GAAP requires valuation techniques to maximize the use of relevant observable inputs and minimize the use of unobservable inputs. When multiple inputs are used to derive fair value, the financial instrument is assigned to the level within the fair value hierarchy based on the lowest-level input that is significant to the fair value of the financial instrument. Input levels are not necessarily an indication of the risk or liquidity associated with financial instruments at that level but rather the degree of judgment used in determining those values.
Valuation TechniquesEquity securities listed or regularly traded on a securities exchange or in the over-the-counter (OTC) market are valued at the last quoted sale price or, for certain markets, the official closing price at the time the valuations are made. OTC Bulletin Board securities are valued at the mean of the closing bid and asked prices. A security thatis listed or traded on more than one exchange is valued at the quotation on the exchange determined to be the primary market for such security. Listed securities not traded on a particular day are valued at the mean of the closing bid and asked prices for domestic securities and the last quoted sale or closing price for international securities.
For valuation purposes, the last quoted prices of non-U.S. equity securities may be adjusted to reflect the fair value of such securities at the close of the NYSE. If the fund determines that developments between the close of a foreign market and the close of the NYSE will affect the value of some or all of its portfolio securities, the fund will adjust the previous quoted prices to reflect what it believes to be the fair value of the securities as of the close of the NYSE. In deciding whether it is necessary to adjust quoted prices to reflect fair value, the fund reviews a variety of factors, including developments in foreign markets, the performance of U.S. securities markets, and the performance of instruments trading in U.S. markets that represent foreign securities and baskets of foreign securities. The fund may also fair value securities in other situations, such as when a particular foreign market is closed but the fund is open. The fund uses outside pricing services to provide it with quoted prices and information to evaluate or adjust those prices. The fund cannot predict how often it will use quoted prices and how often it will determine it necessary to adjust those prices to reflect fair value. As a means of evaluating its security valuation process, the fund routinely compares quoted prices, the next day’s opening prices in the same markets, and adjusted prices.
Actively traded equity securities listed on a domestic exchange generally are categorized in Level 1 of the fair value hierarchy. Non-U.S. equity securities generally are categorized in Level 2 of the fair value hierarchy despite the availability of quoted prices because, as described above, the fund evaluates and determines whether those quoted prices reflect fair value at the close of the NYSE or require adjustment. OTC Bulletin Board securities, certain preferred securities, and equity securities traded in inactive markets generally are categorized in Level 2 of the fair value hierarchy.
Investments in mutual funds are valued at the mutual fund’s closing NAV per share on the day of valuation and are categorized in Level 1 of the fair value hierarchy. Assets and liabilities other than financial instruments, including short-term receivables and payables, are carried at cost, or estimated realizable value, if less, which approximates fair value.
Thinly traded financial instruments and those for which the above valuation procedures are inappropriate or are deemed not to reflect fair value are stated at fair value as determined in good faith by the Valuation Committee. The objective of any fair value pricing determination is to arrive at a price that could reasonably be expected from a current sale. Financial instruments fair valued by the Valuation Committee are primarily private placements, restricted securities, warrants, rights, and other securities that are not publicly traded.
Subject to oversight by the Board, the Valuation Committee regularly makes good faith judgments to establish and adjust the fair valuations of certain securities as events occur and circumstances warrant. For instance, in determining the fair value of an equity investment with limited market activity, such as a private placement or a thinly traded public company stock, the Valuation Committee considers a variety of factors, which may include, but are not limited to, the issuer’s business prospects, its financial standing and performance, recent investment transactions in the issuer, new rounds of financing, negotiated transactions of significant size between other investors in the company, relevant market valuations of peer companies, strategic events affecting the company, market liquidity for the issuer, and general economic conditions and events. In consultation with the investment and pricing teams, the Valuation Committee will determine an appropriate valuation technique based on available information, which may include both observable and unobservable inputs. The Valuation Committee typically will afford greatest weight to actual prices in arm’s length transactions, to the extent they represent orderly transactions between market participants, transaction information can be reliably obtained, and prices are deemed representative of fair value. However, the Valuation Committee may also consider other valuation methods such as market-based valuation multiples; a discount or premium from market value of a similar, freely traded security of the same issuer; or some combination. Fair value determinations are reviewed on a regular basis and updated as information becomes available, including actual purchase and sale transactions of the issue. Because any fair value determination involves a significant amount of judgment, there is a degree of subjectivity inherent in such pricing decisions, and fair value prices determined by the Valuation Committee could differ from those of other market participants. Depending on the relative significance of unobservable inputs, including the valuation technique(s) used, fair valued securities may be categorized in Level 2 or 3 of the fair value hierarchy.
Valuation InputsThe following table summarizes the fund’s financial instruments, based on the inputs used to determine their fair values on June 30, 2019 (for further detail by category, please refer to the accompanying Portfolio of Investments):

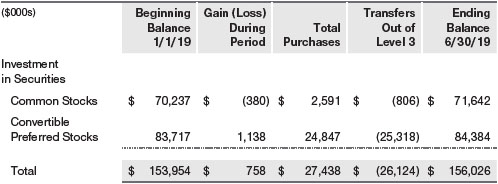
Following is a reconciliation of the fund’s Level 3 holdings for the six months ended June 30, 2019. Gain (loss) reflects both realized and change in unrealized gain/loss on Level 3 holdings during the period, if any, and is included on the accompanying Statement of Operations. The change in unrealized gain/loss on Level 3 instruments held at June 30, 2019, totaled $758,000 for the six months ended June 30, 2019. During the six months, transfers out of Level 3 were because observable market data became available for the security. Additionally, during the period, transfers out of Level 3 include the impact of securities acquired through a corporate action.
NOTE 3 - OTHER INVESTMENT TRANSACTIONS
Consistent with its investment objective, the fund engages in the following practices to manage exposure to certain risks and/or to enhance performance. The investment objective, policies, program, and risk factors of the fund are described more fully in the fund’s prospectus and Statement of Additional Information.
Emerging MarketsThe fund may invest, either directly or through investments in T. Rowe Price institutional funds, in securities of companies located in, issued by governments of, or denominated in or linked to the currencies of emerging market countries; at period-end, approximately 13% of the fund’s net assets were invested in emerging markets. Emerging markets generally have economic structures that are less diverse and mature, and political systems that are less stable, than developed countries. These markets may be subject to greater political, economic, and social uncertainty and differing regulatory environments that may potentially impact the fund’s ability to buy or sell certain securities or repatriate proceeds to U.S. dollars. Such securities are often subject to greater price volatility, less liquidity, and higher rates of inflation than U.S. securities.
Restricted SecuritiesThe fund may invest in securities that are subject to legal or contractual restrictions on resale. Prompt sale of such securities at an acceptable price may be difficult and may involve substantial delays and additional costs.
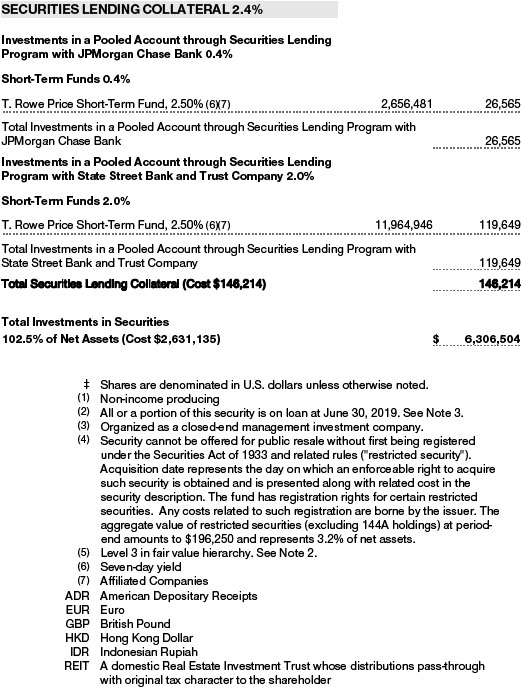
Securities LendingThe fund may lend its securities to approved borrowers to earn additional income. Its securities lending activities are administered by a lending agent in accordance with a securities lending agreement. Security loans generally do not have stated maturity dates, and the fund may recall a security at any time. The fund receives collateral in the form of cash or U.S. government securities. Collateral is maintained over the life of the loan in an amount not less than the value of loaned securities; any additional collateral required due to changes in security values is delivered to the fund the next business day. Cash collateral is invested in accordance with investment guidelines approved by fund management. Additionally, the lending agent indemnifies the fund against losses resulting from borrower default. Although risk is mitigated by the collateral and indemnification, the fund could experience a delay in recovering its securities and a possible loss of income or value if the borrower fails to return the securities, collateral investments decline in value, and the lending agent fails to perform. Securities lending revenue consists of earnings on invested collateral and borrowing fees, net of any rebates to the borrower, compensation to the lending agent, and other administrative costs. In accordance with GAAP, investments made with cash collateral are reflected in the accompanying financial statements, but collateral received in the form of securities is not. At June 30, 2019, the value of loaned securities was $141,158,000; the value of cash collateral and related investments was $146,214,000.
OtherPurchases and sales of portfolio securities other than short-term securities aggregated $171,018,000 and $46,533,000, respectively, for the six months ended June 30, 2019.
NOTE 4 - FEDERAL INCOME TAXES
No provision for federal income taxes is required since the fund intends to continue to qualify as a regulated investment company under Subchapter M of the Internal Revenue Code and distribute to shareholders all of its taxable income and gains. Distributions determined in accordance with federal income tax regulations may differ in amount or character from net investment income and realized gains for financial reporting purposes. Financial reporting records are adjusted for permanent book/tax differences to reflect tax character but are not adjusted for temporary differences. The amount and character of tax-basis distributions and composition of net assets are finalized at fiscal year-end; accordingly, tax-basis balances have not been determined as of the date of this report.
At June 30, 2019, the cost of investments for federal income tax purposes was $2,637,866,000. Net unrealized gain aggregated $3,668,635,000 at period-end, of which $3,783,249,000 related to appreciated investments and $114,614,000 related to depreciated investments.
NOTE 5 - RELATED PARTY TRANSACTIONS
The fund is managed by T. Rowe Price Associates, Inc. (Price Associates), a wholly owned subsidiary of T. Rowe Price Group, Inc. (Price Group). The investment management agreement between the fund and Price Associates provides for an annual investment management fee, which is computed daily and paid monthly. The fee consists of an individual fund fee, equal to 0.35% of the fund’s average daily net assets, and a group fee. The group fee rate is calculated based on the combined net assets of certain mutual funds sponsored by Price Associates (the group) applied to a graduated fee schedule, with rates ranging from 0.48% for the first $1 billion of assets to 0.265% for assets in excess of $650 billion. The fund’s group fee is determined by applying the group fee rate to the fund’s average daily net assets. At June 30, 2019, the effective annual group fee rate was 0.29%.
The I Class is subject to an operating expense limitation (I Class Limit) pursuant to which Price Associates is contractually required to pay all operating expenses of the I Class, excluding management fees; interest; expenses related to borrowings, taxes, and brokerage; and other non-recurring expenses permitted by the investment management agreement, to the extent such operating expenses, on an annualized basis, exceed the I Class Limit. This agreement will continue through the limitation date indicated in the table below, and may be renewed, revised, or revoked only with approval of the fund’s Board. The I Class is required to repay Price Associates for expenses previously paid to the extent the class’s net assets grow or expenses decline sufficiently to allow repayment without causing the class’s operating expenses (after the repayment is taken into account) to exceed the lesser of: (1) the I Class Limit in place at the time such amounts were paid; or (2) the current I Class Limit. However, no repayment will be made more than three years after the date of a payment or waiver.

In addition, the fund has entered into service agreements with Price Associates and two wholly owned subsidiaries of Price Associates, each an affiliate of the fund (collectively, Price). Price Associates provides certain accounting and administrative services to the fund. T. Rowe Price Services, Inc. provides shareholder and administrative services in its capacity as the fund’s transfer and dividend-disbursing agent. T. Rowe Price Retirement Plan Services, Inc. provides subaccounting and recordkeeping services for certain retirement accounts invested in the Investor Class. For the six months ended June 30, 2019, expenses incurred pursuant to these service agreements were $34,000 for Price Associates; $1,092,000 for T. Rowe Price Services, Inc.; and $249,000 for T. Rowe Price Retirement Plan Services, Inc. All amounts due to and due from Price, exclusive of investment management fees payable, are presented net on the accompanying Statement of Assets and Liabilities.
The fund may invest its cash reserves in certain open-end management investment companies managed by Price Associates and considered affiliates of the fund: the T. Rowe Price Government Reserve Fund or the T. Rowe Price Treasury Reserve Fund, organized as money market funds, or the T. Rowe Price Short-Term Fund, a short-term bond fund (collectively, the Price Reserve Funds). The Price Reserve Funds are offered as short-term investment options to mutual funds, trusts, and other accounts managed by Price Associates or its affiliates and are not available for direct purchase by members of the public. Cash collateral from securities lending is invested in the T. Rowe Price Short-Term Fund. The Price Reserve Funds pay no investment management fees.
The fund may participate in securities purchase and sale transactions with other funds or accounts advised by Price Associates (cross trades), in accordance with procedures adopted by the fund’s Board and Securities and Exchange Commission rules, which require, among other things, that such purchase and sale cross trades be effected at the independent current market price of the security. During the six months ended June 30, 2019, the fund had no purchases or sales cross trades with other funds or accounts advised by Price Associates.
INFORMATION ON PROXY VOTING POLICIES, PROCEDURES, AND RECORDS
A description of the policies and procedures used by T. Rowe Price funds and portfolios to determine how to vote proxies relating to portfolio securities is available in each fund’s Statement of Additional Information. You may request this document by calling 1-800-225-5132 or by accessing the SEC’s website, sec.gov.
The description of our proxy voting policies and procedures is also available on our corporate website. To access it, please visit the following Web page:
https://www3.troweprice.com/usis/corporate/en/utility/policies.html
Scroll down to the section near the bottom of the page that says, “Proxy Voting Policies.” Click on the Proxy Voting Policies link in the shaded box.
Each fund’s most recent annual proxy voting record is available on our website and through the SEC’s website. To access it through T. Rowe Price, visit the website location shown above, and scroll down to the section near the bottom of the page that says, “Proxy Voting Records.” Click on the Proxy Voting Records link in the shaded box.
HOW TO OBTAIN QUARTERLY PORTFOLIO HOLDINGS
Effective for reporting periods on or after March 1, 2019, a fund, except a money market fund, files a complete schedule of portfolio holdings with the Securities and Exchange Commission (SEC) for the first and third quarters of each fiscal year as an exhibit to its reports on Form N-PORT. Prior to March 1, 2019, a fund, including a money market fund, filed a complete schedule of portfolio holdings with the SEC for the first and third quarters of each fiscal year on Form N-Q. A money market fund files detailed month-end portfolio holdings information on Form N-MFP with the SEC each month and posts a complete schedule of portfolio holdings on its website (troweprice.com) as of each month-end for the previous six months. A fund’s Forms N-PORT, N-MFP and N-Q are available electronically on the SEC’s website (sec.gov).
APPROVAL OF INVESTMENT MANAGEMENT AGREEMENT
Each year, the fund’s Board of Directors (Board) considers the continuation of the investment management agreement (Advisory Contract) between the fund and its investment advisor, T. Rowe Price Associates, Inc. (Advisor), on behalf of the fund. In that regard, at an in-person meeting held on March 11–12, 2019 (Meeting), the Board, including a majority of the fund’s independent directors, approved the continuation of the fund’s Advisory Contract. At the Meeting, the Board considered the factors and reached the conclusions described below relating to the selection of the Advisor and the approval of the Advisory Contract. The independent directors were assisted in their evaluation of the Advisory Contract by independent legal counsel from whom they received separate legal advice and with whom they met separately.
In providing information to the Board, the Advisor was guided by a detailed set of requests for information submitted by independent legal counsel on behalf of the independent directors. In considering and approving the Advisory Contract, the Board considered the information it believed was relevant, including, but not limited to, the information discussed below. The Board considered not only the specific information presented in connection with the Meeting but also the knowledge gained over time through interaction with the Advisor about various topics. The Board meets regularly and, at each of its meetings, covers an extensive agenda of topics and materials and considers factors that are relevant to its annual consideration of the renewal of the T. Rowe Price funds’ advisory contracts, including performance and the services and support provided to the funds and their shareholders.
Services Provided by the Advisor
The Board considered the nature, quality, and extent of the services provided to the fund by the Advisor. These services included, but were not limited to, directing the fund’s investments in accordance with its investment program and the overall management of the fund’s portfolio, as well as a variety of related activities such as financial, investment operations, and administrative services; compliance; maintaining the fund’s records and registrations; and shareholder communications. The Board also reviewed the background and experience of the Advisor’s senior management team and investment personnel involved in the management of the fund, as well as the Advisor’s compliance record. The Board concluded that it was satisfied with the nature, quality, and extent of the services provided by the Advisor.
Investment Performance of the Fund
The Board took into account discussions with the Advisor and reports that it receives throughout the year relating to fund performance. In connection with the Meeting, the Board reviewed the fund’s net annualized total returns for the 1-, 2-, 3-, 4-, 5-, and 10-year periods as of September 30, 2018, and compared these returns with the performance of a peer group of funds with similar investment programs and a wide variety of other previously agreed-upon comparable performance measures and market data, including those supplied by Broadridge, which is an independent provider of mutual fund data.
On the basis of this evaluation and the Board’s ongoing review of investment results, and factoring in the relative market conditions during certain of the performance periods, the Board concluded that the fund’s performance was satisfactory.
Costs, Benefits, Profits, and Economies of Scale
The Board reviewed detailed information regarding the revenues received by the Advisor under the Advisory Contract and other benefits that the Advisor (and its affiliates) may have realized from its relationship with the fund, including any research received under “soft dollar” agreements and commission-sharing arrangements with broker-dealers. The Board considered that the Advisor may receive some benefit from soft-dollar arrangements pursuant to which research is received from broker-dealers that execute the fund’s portfolio transactions. The Board received information on the estimated costs incurred and profits realized by the Advisor from managing the T. Rowe Price funds. The Board also reviewed estimates of the profits realized from managing the fund in particular, and the Board concluded that the Advisor’s profits were reasonable in light of the services provided to the fund.
The Board also considered whether the fund benefits under the fee levels set forth in the Advisory Contract from any economies of scale realized by the Advisor. Under the Advisory Contract, the fund pays a fee to the Advisor for investment management services composed of two components—a group fee rate based on the combined average net assets of most of the T. Rowe Price funds (including the fund) that declines at certain asset levels and an individual fund fee rate based on the fund’s average daily net assets—and the fund pays its own expenses of operations. The Board concluded that the advisory fee structure for the fund continued to provide for a reasonable sharing of benefits from any economies of scale with the fund’s investors.
Fees and Expenses
The Board was provided with information regarding industry trends in management fees and expenses. Among other things, the Board reviewed data for peer groups that were compiled by Broadridge, which compared: (i) contractual management fees, total expenses, actual management fees, and nonmanagement expenses of the Investor Class of the fund with a group of competitor funds selected by Broadridge (Expense Group) and (ii) total expenses, actual management fees, and nonmanagement expenses of the Investor Class of the fund with a broader set of funds within the Lipper investment classification (Expense Universe). The Board considered the fund’s contractual management fee rate, actual management fee rate (which reflect the management fees actually received from the fund by the Advisor after any applicable waivers, reductions, or reimbursements), operating expenses, and total expenses (which reflects the net total expense ratio of the fund after any waivers, reductions, or reimbursements) in comparison with the information for the Broadridge peer groups. Broadridge generally constructed the peer groups by seeking the most comparable funds based on similar investment classifications and objectives, expense structure, asset size, and operating components and attributes and ranked funds into quintiles, with the first quintile representing the fundswith the lowest relative expenses and the fifth quintile representing the funds with the highest relative expenses. The information provided to the Board indicated that the fund’s contractual management fee ranked in the fourth quintile (Expense Group), the fund’s actual management fee rate ranked in the fourth quintile (Expense Group) and third quintile (Expense Universe), and the fund’s total expenses ranked in the first and second quintiles (Expense Group) and first quintile (Expense Universe).
The Board also reviewed the fee schedules for institutional accounts and private accounts with similar mandates that are advised or subadvised by the Advisor and its affiliates. Management provided the Board with information about the Advisor’s responsibilities and services provided to subadvisory and other institutional account clients, including information about how the requirements and economics of the institutional business are fundamentally different from those of the mutual fund business. The Board considered information showing that the Advisor’s mutual fund business is generally more complex from a business and compliance perspective than its institutional account business and considered various relevant factors, such as the broader scope of operations and oversight, more extensive shareholder communication infrastructure, greater asset flows, heightened business risks, and differences in applicable laws and regulations associated with the Advisor’s proprietary mutual fund business. In assessing the reasonableness of the fund’s management fee rate, the Board considered the differences in the nature of the services required for the Advisor to manage its mutual fund business versus managing a discrete pool of assets as a subadvisor to another institution’s mutual fund or for an institutional account and that the Advisor generally performs significant additional services and assumes greater risk in managing the fund and other T. Rowe Price funds than it does for institutional account clients.
On the basis of the information provided and the factors considered, the Board concluded that the fees paid by the fund under the Advisory Contract are reasonable.
Approval of the Advisory Contract
As noted, the Board approved the continuation of the Advisory Contract. No single factor was considered in isolation or to be determinative to the decision. Rather, the Board concluded, in light of a weighting and balancing of all factors considered, that it was in the best interests of the fund and its shareholders for the Board to approve the continuation of the Advisory Contract (including the fees to be charged for services thereunder).
Item 1. (b) Notice pursuant to Rule 30e-3.
Not applicable.
Item 2. Code of Ethics.
A code of ethics, as defined in Item 2 of Form N-CSR, applicable to its principal executive officer, principal financial officer, principal accounting officer or controller, or persons performing similar functions is filed as an exhibit to the registrant’s annual Form N-CSR. No substantive amendments were approved or waivers were granted to this code of ethics during the registrant’s most recent fiscal half-year.
Item 3. Audit Committee Financial Expert.
Disclosure required in registrant’s annual Form N-CSR.
Item 4. Principal Accountant Fees and Services.
Disclosure required in registrant’s annual Form N-CSR.
Item 5. Audit Committee of Listed Registrants.
Not applicable.
Item 6. Investments.
(a) Not applicable. The complete schedule of investments is included in Item 1 of this Form N-CSR.
(b) Not applicable.
Item 7. Disclosure of Proxy Voting Policies and Procedures for Closed-End Management Investment Companies.
Not applicable.
Item 8. Portfolio Managers of Closed-End Management Investment Companies.
Not applicable.
Item 9. Purchases of Equity Securities by Closed-End Management Investment Company and Affiliated Purchasers.
Not applicable.
Item 10. Submission of Matters to a Vote of Security Holders.
Not applicable.
Item 11. Controls and Procedures.
(a) The registrant’s principal executive officer and principal financial officer have evaluated the registrant’s disclosure controls and procedures within 90 days of this filing and have concluded that the registrant’s disclosure controls and procedures were effective, as of that date, in ensuring that information required to be disclosed by the registrant in this Form N-CSR was recorded, processed, summarized, and reported timely.
(b) The registrant’s principal executive officer and principal financial officer are aware of no change in the registrant’s internal control over financial reporting that occurred during the period covered by this report that has materially affected, or is reasonably likely to materially affect, the registrant’s internal control over financial reporting.
Item 12. Disclosure of Securities Lending Activities for Closed-End Management Investment Companies.
Not applicable.
Item 13. Exhibits.
(a)(1) The registrant’s code of ethics pursuant to Item 2 of Form N-CSR is filed with the registrant’s annual Form N-CSR.
(2) Separate certifications by the registrant's principal executive officer and principal financial officer, pursuant to Section 302 of the Sarbanes-Oxley Act of 2002 and required by Rule 30a-2(a) under the Investment Company Act of 1940, are attached.
(3) Written solicitation to repurchase securities issued by closed-end companies: not applicable.
(b) A certification by the registrant's principal executive officer and principal financial officer, pursuant to Section 906 of the Sarbanes-Oxley Act of 2002 and required by Rule 30a-2(b) under the Investment Company Act of 1940, is attached.
SIGNATURES
Pursuant to the requirements of the Securities Exchange Act of 1934 and the Investment Company Act of 1940, the registrant has duly caused this report to be signed on its behalf by the undersigned, thereunto duly authorized.
T. Rowe Price Communications & Technology Fund, Inc.
| By | | /s/ David Oestreicher |
| | | David Oestreicher |
| | | Principal Executive Officer |
| |
| Date | | August 16, 2019 | | | | |
Pursuant to the requirements of the Securities Exchange Act of 1934 and the Investment Company Act of 1940, this report has been signed below by the following persons on behalf of the registrant and in the capacities and on the dates indicated.
| By | | /s/ David Oestreicher |
| | | David Oestreicher |
| | | Principal Executive Officer |
| |
| Date | | August 16, 2019 | | | | |
| |
| |
| By | | /s/ Catherine D. Mathews |
| | | Catherine D. Mathews |
| | | Principal Financial Officer |
| |
| Date | | August 16, 2019 | | | | |
