Table of Contents
UNITED STATES
SECURITIES AND EXCHANGE COMMISSION
Washington, D. C. 20549
FORM 10-K/A
Amendment No. 1
(Mark One)
| x | ANNUAL REPORT PURSUANT TO SECTION 13 OR 15(d) OF THE SECURITIES EXCHANGE ACT OF 1934 |
For the fiscal year ended April 30, 2005
OR
| ¨ | TRANSITION REPORT PURSUANT TO SECTION 13 OR 15(d) OF THE SECURITIES EXCHANGE ACT OF 1934 |
For the transition period from to
Commission file number: 033-67532
SHEFFIELD STEEL CORPORATION
(Exact name of registrant as specified in its charter)
| Delaware | 74-2191557 | |||
| (State or other jurisdiction of incorporation or organization) | (I.R.S. Employer Identification No.) | |||
| 220 North Jefferson Street, Sand Springs, OK | 74063 | |||
| (Address of principal executive offices) | (Zip Code) | |||
Registrant’s telephone number, including area code (918) 245-1335
Securities registered pursuant to Section 12(b) of the Act: None
Securities registered pursuant to Section 12(g) of the Act: None
Indicate by check mark whether the registrant (1) has filed all reports required to be filed by Section 13 or 15(d) of the Securities Exchange Act of 1934 during the preceding 12 months (or for such shorter period that the registrant was required to file such reports), and (2) has been subject to such filing requirements for the past 90 days. Yesþ No¨
Indicate by check mark if disclosure of delinquent filers pursuant to Item 405 of Regulation S-K is not contained herein, and will not be contained, to the best of registrant’s knowledge, in definitive proxy or information statements incorporated by reference in Part III of this Form 10-K or any amendment to this Form 10-K þ
Indicate by check mark whether the registrant is an accelerated filer (as defined in Rule 12b-2 of the Act).
Yes¨. Noþ.
The aggregate market value of voting stock held by nonaffiliates is unknown as the Registrant’s stock is not traded on an established public trading market.
APPLICABLE ONLY TO REGISTRANTS INVOLVED IN BANKRUPTCY
PROCEEDINGS DURING THE PRECEDING FIVE YEARS:
Indicate by check mark whether the registrant has filed all documents and reports required to be filed by Section 12, 13 or 15(d) of the Securities Exchange Act of 1934 subsequent to the distribution of securities under a plan confirmed by a court. YESþ NO¨
As of July 14, 2005, there were 4,956,819 shares of the Registrants $.01 par value Common Stock outstanding.
DOCUMENTS INCORPORATED BY REFERENCE
Portions of the Proxy Statement for the Company’s Annual Meeting of Shareholders to be held on September 14, 2005 are incorporated by reference into Part III of this Report on Form 10-K.
Table of Contents
EXPLANATORY NOTE
We are filing this amendment (the “Amendment”) to our Annual Report on Form 10-K for the fiscal year ended April 30, 2005 (the “Original Filing”) to provide information relating to our inability to include an audit report (the “Audit Report”) from the our predecessor auditor, KPMG, on the statements of income and cash flows for the period from August 14, 2002 to April 30, 2003 (the “2003 Period”) appearing in the Original Filing. As reported in the Form 12b-25 which we filed on July 15, 2005, KPMG has refused to reissue the Audit Report as a result of receiving a letter from us outlining a malpractice claim against them related to company-sponsored pension plans. KPMG claims that the allegations in the letter compromise its independence and prevent it from reissuing the Audit Report.
Because we have not previously been required to file audited financial statements for the 2003 Period under the Securities Exchange Act of 1934, as amended (the “Exchange Act”), the Audit Report has not been included in any Exchange Act filings by us. KPMG consented, however, to the inclusion of the Audit Report in our Registration Statement on Form S-4 (File No. 333-121176) filed on December 10, 2004 and amended December 17, 2004, February 8, 2005, February 23, 2005 and March 7, 2005. We cannot give any assurance that KPMG would reissue the Audit Report in its original form and without qualification if the independence issue were resolved. However, we are not aware of any subsequent events, transactions or other matters that may have affected the Audit Report as previously issued.
This Amendment reproduces the Original Filing with the addition of this Explanatory Note and certain revisions to more clearly indicate that the statements of income and cash flows for the 2003 Period are unaudited. This Amendment also corrects certain references to our 2005 Proxy Statement appearing in Part III of this report. Except for these changes, this Amendment does not reflect any events that have occurred after July 15, 2005, the filing date of the Original Filing, or modify or update the disclosures presented in the Original Filing.
Table of Contents
Part I
FORWARD LOOKING STATEMENTS
This report contains statements that are forward-looking. You should read the following discussion in connection with our consolidated financial statements, including the notes to those statements, included in this document. The following discussion contains forward-looking statements which include numerous risks which you should carefully consider. These statements are based on current expectations and assumptions that are subject to uncertainties not currently known to us or that we currently deem to be immaterial which could cause actual results to differ materially. Additional risks and uncertainties may also materially and adversely affect our business. Any risks could materially adversely affect our business, financial condition or results of operations.
| ITEM 1. | BUSINESS |
(a) General Development of Business
We are engaged in the manufacturing, fabricating and sale of steel products including hot rolled steel bar, concrete reinforcing bar, or “rebar,” and fabricated products which focus on niche products and target customers with special needs. We believe that our product quality and responsive service are two competitive advantages that distinguish us in the market place. Additionally, since our predecessor’s inception almost 75 years ago, we have maintained a competitive cost structure as a result of our efficient melt and cast operations, high productivity levels, low energy costs and competitive steel scrap costs. We focus on building and maintaining long-term relationships with our customers by providing competitive pricing, assured product availability and reliable, prompt delivery and service. This strategy increases the competitiveness of our customers and has significantly contributed to our strong customer relationships. Our fiscal years end on April 30.
(b) Financial Information and Classes of Products or Services
We are a regional mini-mill with one line of business which is producing a range of steel products including hot rolled steel bar, rebar, and fabricated products.
The following table provides information regarding the historical shipment levels and average selling prices per ton of our products:
| Year ended April 30, | ||||||||||||
| 2005 | 2004 | 2003 | ||||||||||
Tons shipped: | ||||||||||||
Rebar | 52 | % | 59 | % | 46 | % | ||||||
Hot Rolled Bars | 32 | % | 28 | % | 36 | % | ||||||
Fabricated Products | 14 | % | 12 | % | 14 | % | ||||||
Total finished products | 98 | % | 99 | % | 96 | % | ||||||
Billets | 2 | % | 1 | % | 4 | % | ||||||
Total tons shipped | 100 | % | 100 | % | 100 | % | ||||||
Average price per ton shipped | $ | 578.89 | $ | 396.91 | $ | 366.16 | ||||||
Average production cost per ton | $ | 479.12 | $ | 347.80 | $ | 334.11 | ||||||
Average gross margin per ton | $ | 99.77 | $ | 49.11 | $ | 32.05 | ||||||
1
Table of Contents
(c) Narrative Description of Business
The following diagram illustrates the production capabilities and inter-relationship between our facilities.
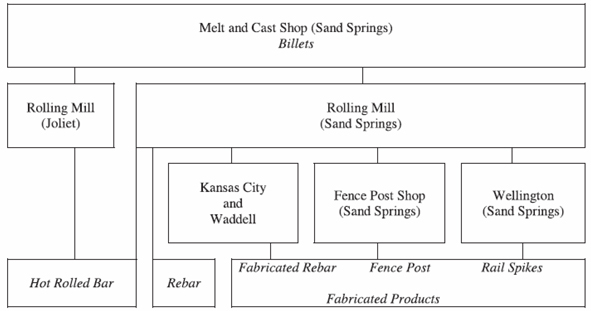
In Sand Springs, steel scrap is conveyed by rail car from our scrap yard to the melt shop, where the steel scrap is melted in two 85-ton electric arc furnaces. During the scrap melting process, impurities are removed from the molten steel. The molten steel is refined and then poured into a ladle, where metal alloys are added to obtain desired chemical compositions. This manufacturing process consumes large amounts of electricity which we purchase from the Public Service Company of Oklahoma (“PSO”) under a real-time pricing tariff at a contracted price, adjusted for fuel costs. During the summer months, we may elect to shutdown our melt shop during peak periods of power costs.
The molten steel is then conveyed to a six-strand continuous caster that casts various sizes of billets. The continuous caster is capable of casting billets up to 6 inches square and 50 feet long. These billets are then reheated in the natural gas reheat furnaces and rolled into various finished steel products at the rolling mills in Sand Springs or Joliet. The new reheat furnace in Sand Springs significantly reduces natural gas usage due to its greater efficiency.
The rolling mill in Sand Springs produces rebar, “T”-section (which is further processed into fence posts) and a range of hot rolled bar products, including squares (which are forged into track spikes at Wellington). The rolling mill in Joliet produces an extensive range of hot rolled bar products. A portion of the rebar produced in Sand Springs is epoxy coated at our Kansas City facility and fabricated at either Kansas City or Waddell as epoxy coated or uncoated bar.
Our production capabilities are highly flexible and enable us to shift our product mix to take advantage of changing market conditions. Factors that affect the allocation of our production capacity include product demand, margins and throughput potential. As an example, if the construction markets are active and a profit potential exists, we have the capability to increase our production of rebar while decreasing our production of hot rolled bar products. Conversely, when construction activity and demand for rebar slows, we can shift the production of these two products, decreasing rebar production while increasing hot rolled bar production. This flexibility enables us to achieve an optimal product mix within our primary markets. We also generally maintain a base level of production in most of our product lines in order to ensure an adequate supply to meet projected customer needs.
Our management team is comprised of a number of seasoned, industry veterans that average 30 years of experience in the steel industry. Over the past five years, management has implemented numerous initiatives to achieve significant operating efficiencies and cost savings which have increased our rolling mill capacity at our Sand Springs plant significantly. These initiatives include the successful installation of a reheat furnace, implementation of improved mill set-up techniques and implementation of preventive maintenance practices.
2
Table of Contents
We have been aggressively instituting more effective maintenance and operating practices and process efficiencies. We perform routine and preventive maintenance on a weekly basis, which has increased the efficiency of our Sand Springs rolling mill and has enabled us to reduce the overall amount of equipment-related down time. We have been able to make productivity and cost improvements in the Sand Springs melt shop as well.
(i) Products
Rebar
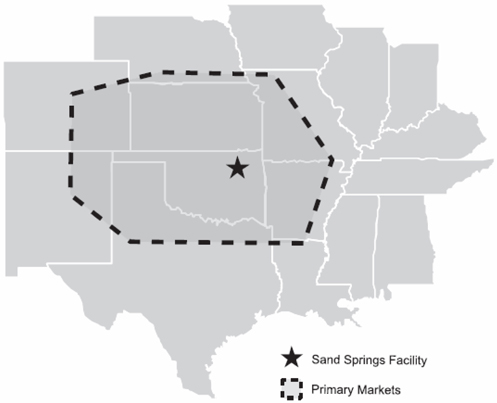
Our facility located in Sand Springs, Oklahoma provides us with a competitive geographical advantage as a primary rebar supplier in the south-central United States comprising Oklahoma, western Arkansas, western Missouri, Kansas, eastern Colorado, northeastern New Mexico and northern Texas and we have developed significant customer relationships in Arizona, California and Nevada. Our targeted customer focus often enables us to act as the sole supplier of particular products to our customers who are leading fabricators who then shear and bend the rebar to meet engineering or architectural specifications for construction projects. Rebar demand is driven by infrastructure investment trends and trends in commercial and industrial construction. During periods of overall reduced steel industry demand, we have maintained relatively stable rebar sales volume due to the level of public sector investment in roads, bridges, water projects, airports and public facilities.
We believe that we supply in excess of 50% of the rebar purchased by rebar fabricators in these markets.
Rebar is rolled in standard diameters from #3 bar (3/8 inch or 10mm) to #18 bar (2¼ inches or 57mm) and sheared to standard lengths from 20 feet to 60 feet. To provide rapid response to customer needs, we maintain a finished goods inventory of 25,000 to 35,000 tons of rebar. Our primary methods of rebar distribution are by tractor trailer and rail.
Hot Rolled Bar
We sell a variety of specialty hot rolled bar products, including flats, squares, rounds and special shapes for end use applications that include auto parts, conveyor assemblies, pole line hardware, wrenches, farm equipment and construction machinery. Hot rolled bar products produced in Sand Springs are sold primarily to end product manufacturers. The majority of hot rolled bar products produced in Joliet are sold direct to original
3
Table of Contents
equipment manufacturers and cold drawn bar finishers. We focus on specialty products and target customers with special requirements as to bar shape, size and chemical composition and, in many cases, small volume needs. Our primary method of hot rolled bar distribution is by tractor trailer.
Fabricated Steel Products
We manufacture three fabricated steel products: (1) fabricated rebar, including epoxy-coated rebar, (2) railroad track spikes and (3) fence posts, which are sold to distributors and farm cooperatives. Fabricated rebar is shipped from Waddell and Kansas City to highway and commercial construction contractors in Missouri, Kansas, Nebraska, Iowa and contiguous markets, with Waddell handling smaller, higher value added jobs and Kansas City handling large volume jobs.
We forge rail spikes at Wellington, our railroad track spike manufacturing operations located in Sand Springs. Wellington provides a downstream market for our rolling mill products (square hot rolled bar). Wellington sells primarily to the two large western railroads.
Fence posts are produced in a post fabrication shop located within the Sand Springs facility and adjacent to the Sand Springs rolling mill in two weights (1.25 pounds per foot and 1.33 pounds per foot), in orange and green colors and various lengths from 4 feet to 8 feet. Our primary method of fabricated steel product distribution is by tractor trailer to locations in Oklahoma, Kansas, Missouri, Texas and Arkansas.
Billets
Billets are semi-finished steel products that are usually rolled or forged into a finished steel product. As we have improved productivity in the Sand Springs mill, we have been able to convert virtually all of our billet production internally, and routine billet sales to third parties have ceased. We did make a single, opportunistic billet sale during fiscal year 2005. Sales volume potential and pricing for billets, particularly in the spot market, is highly variable. The dominant competitive factors are price and availability. Billet sales to other steel mills are generally at extremely low margins, and sales are dependent on market conditions that vary widely.
(ii) New products
During fiscal year 2005 we did not introduce any product or segment that would require the investment of a material amount of assets or that is otherwise material.
(iii) Raw Materials - Scrap
Our primary raw material is steel scrap, which is generated principally from industrial, automotive, demolition, railroad, obsolete and other sources. Scrap comprises approximately 100% (we have used a very limited amount of scrap substitutes in the past) of the metallic melt mix in our electric arc furnace steelmaking, in contrast to integrated mill steelmaking, where the proportion of scrap has traditionally been approximately 20%. We purchase scrap in the open market directly from dealers. The cost of steel scrap is subject to market forces, including demand by other steel producers, export/import volumes and utilization of scrap substitutes such as pig iron and hot-briquette iron. Our cost of scrap can vary significantly, and we may not be able to adjust product prices in the short-term to recover large increases in scrap costs. Over longer periods of time, however, product prices and steel scrap prices have tended to move in the same direction.
Many variables can impact scrap prices, the most critical of which, until recently, was the level of U.S. steel production. The United States has generally been a net scrap exporter. Generally, as domestic steel demand increased, so did scrap demand and resulting scrap prices. The reverse was also normally true, with scrap prices following steel prices downward where supply exceeded demand. However, during late 2000, the flood of imported steel, much of it unfairly traded, resulted in sharply reduced new steel production with corresponding decreases in the demand and the price of scrap. Starting during the latter part of 2002 and continuing through 2003 and into 2004, the price of scrap has risen sharply upward and remains extremely volatile. Scrap prices increased by $91.43 (85.5%) per ton from March 2003 to March 2004. This increase resulted largely from foreign scrap demand, particularly from China, a relatively weak U.S. dollar that makes U.S. scrap exports more attractive and relatively static if not limited scrap availability in the United States due to a weak economy and the shrinking domestic manufacturing base.
We currently purchase approximately 90% of our scrap from dealers in Oklahoma, southern Kansas, western Arkansas and southwestern Missouri. We believe this is a relatively close area to source such a high percentage of our scrap needs relative to other western mills. This is due to being in a well supplied area and our
4
Table of Contents
strategy to produce both rebar and hot rolled bars, which allows us to use both secondary and premium scrap grades in reasonable balance to local scrap supply. In response to recent increases in scrap prices, we implemented a raw material surcharge effective January 1, 2004. This surcharge is intended to help us maintain margins for our products and insulate us from volatile scrap market price movements. Our ability to continue this surcharge, however, is uncertain and dependent on our customers’ ability and willingness to absorb these costs.
(iv) Patents, trademarks, licenses, franchises and concessions
We hold no patents, trademarks, licenses, franchises or concessions that are material to our business operations.
(v) Seasonality
The steel industry, in general, and our business in particular, is subject to seasonality. Our customers are primarily located in the south-central United States and their demand for steel declines in the winter due to reduced activity in the construction industry. As a result, our sales generally decline during the third fiscal quarter (November, December and January). We have attempted to reduce our exposure to seasonality by expanding our customer base to include “all-season” customers located in the western United States.
In fiscal year 2002, we began a sales and marketing effort targeting Arizona, California and Nevada due to their booming construction markets. As a result, we were able to develop supply relationships with several growing customers in these areas. These customers have purchased the majority of our increased production during fiscal year 2004 and have largely been responsible for an increase in our volume of sales from 452,951 tons in fiscal year 2003, with a peak of 616,531 tons in fiscal year 2004, to 512,460 tons in fiscal year 2005. In addition, many of our newer customers in the western United States are “all season” customers. Increased sales to these customer groups serve to reduce the seasonality of our business by increasing rebar sales during the winter months. We believe that increasing our market penetration in these areas and adding new geographically appropriate markets will enable us to reduce our exposure to the historical cycles and seasonality of the steel industry by expanding the demand base for our products.
(vi) Working Capital practices
We do not offer extended payment terms to our customers, nor are we required to carry certain inventory levels to meet rapid delivery requirements of customers; although, the market requires stocking rebar by size, grade, and length.
(vii) Customers
Approximately 39% of our sales are made to ten customers. No single customer accounts for more than 10% of sales, with our largest customer accounting for 7.7% of sales.
In Sand Springs, we have a competitive geographical advantage in the south-central United States hot rolled bar market. This enables our customers to benefit from lower freight costs, shorter lead times and more timely deliveries. As a result of these advantages and our reputation for quality and service, we have developed a number of close relationships with hot rolled bar product customers in our region.
We have been able to forge relationships with customers based upon differentiated customer service rather than solely on price. Our strategy is to work with only one major fabricator in each of our primary markets. As a result of providing consistent product quality, reliable and prompt delivery and customized service, we have become the majority or sole source supplier of particular shapes, sizes or steel chemistries to many of our customers.
Our ability to provide superior service and create strategic value for our customers has enabled us to maintain long-term relationships with our customers.
(viii) Backlogs
We do not have a material amount of backlogged products. Virtually all our backlog is shipped within the fiscal year.
(ix) Government contracts
We do not have material contracts subject to renegotiation of profits or termination at the election of the Government.
5
Table of Contents
(x) Competition
We compete with a number of domestic mini-mills in each of our markets. There are common competitive factors in the steel bar business — price, proximity to market, quality and service — although their relative importance varies in the different market segments.
Rebar
Since pricing, availability, freight costs and delivery times are the most important competitive factors in the sale of rebar, sales tend to be concentrated within about 350 miles of a mini-mill. In the south-central United States, we have a competitive advantage as the closest mill serving an area comprising Oklahoma, western Arkansas, western Missouri, Kansas, eastern Colorado, northeastern New Mexico and northern Texas. The majority of our rebar tonnage is shipped to this area, although we have had recent success in opening new markets in Arizona, California and Nevada. We compete in the rebar market with a number of other mini-mills, principally Structural Metals, Incorporated, Gerdau-Ameristeel, Nucor Steel and others. Foreign competition does impact certain customers or geographic locations.
Our strategy is to focus on end-users and to provide our customers with tailored services and a broad product offering. Imported rebar lacks a complete size and length range to offer to the market generally focusing on only the small diameter bars in 20 foot lengths. Therefore, the twenty-foot length rebar and no-grade rebar markets have been impacted by foreign imports, which has had the effect of significantly reducing selling prices in the past.
Hot Rolled Bar
In the market for hot rolled bar products, our Joliet facility occupies a niche position at the specialty end of the product range. We believe we are the sole supplier to certain customers because of their requirements for particular shapes, sizes, small order quantities or steel chemistries. In other cases, we compete with a limited number of other producers of specialty hot rolled bar products, including Kentucky Electric Steel Incorporated, Gerdau Ameristeel and others. From Sand Springs and to a much lesser degree from Joliet, we compete with mini-mill producers of standard hot rolled bar products, including Chaparral Steel Company, Gerdau Ameristeel, Nucor Steel and Structural Metals, Incorporated. Competitors vary from customer to customer depending on location, product specifications and requirements for order sizes and inventory support.
Fabricated Steel Products
For fabricated rebar, our primary competitors are fabrication shops that are furnished with rebar from other mini-mills in the Midwest. In recent years, we believe that increased demand for product which is epoxy-coated prior to fabrication (to protect against corrosion in the field), from contractors bidding on infrastructure projects has provided Kansas City with a competitive advantage. Other competitive factors include delivery performance, engineering support, accurate fabrication and competitive pricing. Waddell’s focus is on small rebar projects, which complements Kansas City’s larger projects. The different market focus of the two locations allows for the most efficient production at each location.
In the railroad track spike market competitive factors include quality, service and price. Our primary competitors are Gerdau-Ameristeel and Birmingham Rail.
Competitive factors in fence post sales include product quality measured by durability, appearance, workmanship, delivery response time, price and freight costs. Competitors include Structural Metals, Incorporated, Chicago Heights Steel Company and foreign suppliers.
Competition from foreign producers is typically strong. In general, approximately 25% of U.S. domestic steel demand is satisfied by imported steel. However, the level of imports is substantially affected by the relative strength of foreign economies and fluctuation in the value of the U.S. dollar against foreign currencies, with steel imports tending to increase when the value of the dollar is strong in relation to foreign currencies. During the late 1990s, the situation was exacerbated by the weakening of certain economies, particularly in Eastern Europe, Asia and Latin America. Because of the ownership, control or subsidization of some foreign steel producers by
6
Table of Contents
their governments, decisions by such producers with respect to their production, sales and pricing decisions are often influenced to a greater degree by political and economic policy considerations than by prevailing market conditions, realities of the marketplace or considerations of profit or loss.
Most foreign markets are less open than the U.S. market, allowing foreign producers to maintain higher prices in their own markets, while dumping excess production at lower and often subsidized prices into the U.S. market. Dumping involves selling a product below cost or for less than in the exporter’s home country and is a violation of U.S. trade laws. A number of steel industry anti-dumping initiatives, or trade cases, have been brought in recent years in an attempt to stem the flow of these unlawful imports. Some have been successful while others have not.
(xi) Research and Development
During the past three fiscal years, we did not have any material research and development activities.
(xii) Regulatory Matters
We are subject to a broad range of environmental laws, including those governing air emissions, storm water discharges and the handling and disposal of wastes. We have spent substantial amounts to comply with these requirements. In addition, in the event that we release hazardous materials into the environment, we could be responsible for the remediation of contamination associated with such a release. Primarily because the melting process in Sand Springs generates emission dust that contains lead, cadmium and other heavy metals, we are classified, in the same manner as other electric arc furnace operators in this industry, as a generator of hazardous waste.
The RCRA regulates emissions of sludge/dust from electric arc furnaces (“KO61”), a waste stream generated in significant quantities in Sand Springs. All of the KO61 generated in Sand Springs is shipped to Mexico, where a High Temperature Metals Recovery processor, Zinc Nacional, S.A., recovers the zinc, lead and cadmium and manufactures commercial and high purity zinc products. Zinc Nacional, S.A. is in compliance with the Mexican agency, Office of Environmental Protection, which is similar to the EPA in the United States.
In accordance with the Clean Air Act Amendments of 1990 and Oklahoma’s State Implementation Plan, we received a Title V operating permit in March 1998. We have been routinely audited and have had no resulting violations or outstanding issues. Late in 2000, we participated in a plant-wide EPA self-audit at our Sand Springs plant. No financially significant issues were found to exist in our opinion. In October 2003 we received our Title V Permit Renewal, which is formally described as our Part 70 Operating Permit Renewal 2002-019-TVR. Additional or new air emission control regulations or requirements applicable to our operations may be promulgated under the Clean Air Act in the future. We cannot at this time accurately estimate the costs, if any, of compliance with such future Clean Air Act regulations or requirements.
We are subject to a broad range of federal, state and local environmental regulations and requirements, including those governing air emissions and discharges into water, and the handling and disposal of solid and/or hazardous wastes. As part of the normal course of business, we incur an average of $1.0 to $2.0 million in expenses annually, primarily for the disposal of baghouse dust generated in the melt shop, to comply with these regulations and requirements. In addition, in the event that we release a hazardous substance, we could be responsible for the remediation of contamination associated with such a release. We believe that we are currently in substantial compliance with all material and applicable environmental regulations.
(xiii) Employees
As of April 30, 2005, we had 661 employees. Approximately 68% of our employees are represented by one of three collective bargaining units affiliated with the United Steelworkers of America (Sand Springs, Joliet and Kansas City). Sand Springs is party to a collective bargaining agreement covering 292 hourly-paid production and maintenance employees. This agreement, which was negotiated and ratified during April 2004, is for a two-year period expiring on March 2, 2006. Joliet is also party to a collective bargaining agreement, which was ratified in May 2004, covering 122 hourly-paid production and maintenance employees that expires on January 31, 2006. Kansas City had a collective bargaining agreement, covering 26 employees that expired on October 31, 2003. Kansas City is operating under the terms of the expired agreement. The Railway has 15 employees of which 10 are represented by various labor unions.
7
Table of Contents
| ITEM 2. | PROPERTIES |
We own properties related to our operation of the Sand Springs facility, the Joliet facility and the Waddell facility. We lease nine acres of land adjacent to the Joliet facility from the Metropolitan Water Reclamation District of Greater Chicago under a long-term lease expiring in 2053. We also lease the plant in Kansas City and the Wellington facility in Sand Springs.
The Railway provides freight service between Sand Springs and Tulsa, Oklahoma. The Railway owns 32 miles of railroad track located on approximately 10 acres of land, three locomotives, 28 gondola railcars and four flat railcars. The Railway owns and operates a maintenance shop for normal repairs and upkeep of locomotives and railcars located on approximately six acres of land. The Railway also owns and operates an eight acre transload facility and a warehouse facility.
The following table provides information about our owned and leased properties, as of April 30, 2005:
| Buildings | ||||||||
Location | Acres | Square Feet | Employees | Leased/ Owned | ||||
Sheffield - Sand Springs, OK | 398 | |||||||
Mill | 148 | 616,548 | Owned | |||||
Corporate Office | 1 | 24,955 | Owned | |||||
Total | 149 | 641,503 | ||||||
Sheffield - Joliet, IL | 155 | |||||||
Mill | 30 | 345,735 | Owned | |||||
Joliet, IL adjacent to mill | 9 | — | Leased | |||||
Total | 39 | 345,735 | ||||||
Team Rebar - Missouri | 53 | |||||||
Sheffield - Kansas City, MO | 3 | 77,100 | Leased | |||||
Waddell’s Independence, MO | 2 | 32,213 | Owned | |||||
Total | 5 | 109,313 | ||||||
Wellington - Sand Springs, OK | 40 | |||||||
Mill | 4 | 26,000 | Leased | |||||
Total | 4 | 26,000 | ||||||
Sand Springs Railway - Sand Springs, OK | 15 | |||||||
Sand Springs Railway Transload | 8 | 68,722 | Owned | |||||
Sand Springs Railway Maintenance | 6 | 44,778 | Owned | |||||
Sand Springs Railway Track (32 miles of track) | n/a | n/a | Owned/ right of way | |||||
Total | 14 | 113,500 | ||||||
Company Total | 211 | 1,236,051 | 661 | |||||
We have granted a first priority lien on substantially all of our real property and equipment (excluding the real property and equipment of the Railway) to US Bank National Association, as trustee for the notes.
We have granted a second priority lien on such real property and equipment and a first priority lien on the real property and equipment of the Railway to The CIT Group/Business Credit, Inc. as lender under the credit facility. The credit facility is secured by a first lien on substantially all of our other personal property and US Bank National Association, as trustee for the notes, has a second lien on all such property.
8
Table of Contents
We have total capacity to produce 600,000 tons of semi-finished goods and 620,000 tons of finished goods annually.
| • | Sand Springs, Oklahoma - 600,000 tons of annual semi-finished goods production capacity and 500,000 tons of annual finished goods capacity |
| • | Joliet, Illinois - 120,000 tons of annual finished goods capacity |
| • | Kansas City & Independence, Missouri – 35,000 tons annual capacity. |
| ITEM 3. | LEGAL PROCEEDINGS |
We are involved in claims and legal actions arising in the ordinary course of business. We believe that the ultimate disposition of these matters will not have a material adverse effect on our financial position, results of operations or liquidity.
| ITEM 4. | SUBMISSION OF MATTERS TO A VOTE OF SECURITY HOLDERS |
None.
PART II
| ITEM 5. | MARKET FOR THE REGISTRANT’S COMMON EQUITY, RELATED STOCKHOLDER MATTERS AND ISSUER PURCHASES OF EQUITY SECURITIES |
None.
| ITEM 6. | SELECTED FINANCIAL DATA |
The following selected consolidated financial data for the five years ended April 30, 2005 and at our emergence from bankruptcy on August 14, 2002 should be read in conjunction with our consolidated financial statements and the related notes and “Management’s Discussion and Analysis of Financial Condition and Results of Operations”, included in Item 7 of this Report.
On August 14, 2002, we emerged from Chapter 11 bankruptcy. In accordance with AICPA Statement of Position 90-7,Financial Reporting by Entities in Reorganization Under the Bankruptcy Code, we adopted freshstart accounting as of August 14, 2002 and our emergence from Chapter 11 resulted in a new reporting entity. Under fresh-start accounting, the reorganization value of the entity is allocated to the entity’s assets based on fair values, and liabilities are stated at the present value of amounts to be paid determined at appropriate current interest rates. The effective date is considered to be August 14, 2002 for financial reporting purposes. The periods presented prior to August 14, 2002 have been designated “predecessor company” and the periods starting on August 14, 2002 have been designated “successor company.”
As a result of the implementation of fresh-start accounting as of August 14, 2002, our financial statements after that date are not comparable to our financial statements for prior periods because of the differences in the basis of accounting and the debt and equity structure for the predecessor company and the successor company. The most significant effect of the differences in the basis of accounting on the successor company’s financial statements is lower interest expense as a result of the discharge of $136.0 million of debt upon our emergence from bankruptcy.
9
Table of Contents
The other financial data set forth below include calculations of EBITDA. This measure is not required by or presented in accordance with GAAP. Please see footnote 1 below for a discussion of EBITDA.
| Successor Company | Predecessor Company | |||||||||||||||||||||||
| Fiscal Year Ended April 30, | Eight and One-Half Months Ended April 30, 2003 | Three and One - Half Months Ended August 13, 2002 | Fiscal Year Ended April 30, | |||||||||||||||||||||
| 2005 | 2004 | 2002 | 2001 | |||||||||||||||||||||
| (dollars in thousands, except per ton data) | ||||||||||||||||||||||||
Income Statement Data: | ||||||||||||||||||||||||
Sales | $ | 296,659 | $ | 244,708 | $ | 121,231 | $ | 44,621 | $ | 152,636 | $ | 166,110 | ||||||||||||
Cost of sales | 245,530 | 214,619 | 111,527 | 39,810 | 130,708 | 140,666 | ||||||||||||||||||
Gross profit | 51,129 | 30,089 | 9,704 | 4,811 | 21,928 | 25,444 | ||||||||||||||||||
Selling, general and administrative expense | 13,178 | 13,068 | 8,816 | 3,952 | 16,346 | 14,763 | ||||||||||||||||||
Depreciation and amortization | 7,037 | 6,955 | 5,694 | 1,773 | 15,776 | 8,446 | ||||||||||||||||||
Postretirement benefit expense other than pensions | 2,634 | 2,715 | 1,671 | — | 2,819 | 2,686 | ||||||||||||||||||
Litigation settlement | — | — | — | — | (1,119 | ) | — | |||||||||||||||||
Operating income (loss) | 28,280 | 7,351 | (6,477 | ) | (914 | ) | (11,894 | ) | (451 | ) | ||||||||||||||
Interest expense | 9,677 | 6,935 | 4,264 | 762 | 9,735 | 16,919 | ||||||||||||||||||
Other (income) expense | (1,259 | ) | — | 49 | 1,619 | 2,576 | 36 | |||||||||||||||||
Income (loss) before income taxes and extraordinary item | 19,862 | 416 | (10,790 | ) | (3,295 | ) | (24,205 | ) | (17,406 | ) | ||||||||||||||
Income tax benefit | (2,592 | ) | — | — | — | — | — | |||||||||||||||||
Income (loss) from continuing operations | 22,454 | 416 | (10,790 | ) | (3,295 | ) | (24,205 | ) | (17,406 | ) | ||||||||||||||
Extraordinary item - loss on retirement of long-term debt | — | — | — | — | — | 7,400 | ||||||||||||||||||
Net income (loss) | $ | 22,454 | $ | 416 | $ | (10,790 | ) | $ | (3,295 | ) | $ | (24,205 | ) | $ | (24,806 | ) | ||||||||
Other Operational Data: | ||||||||||||||||||||||||
Tons sold | 512,460 | 616,531 | 328,968 | 123,983 | 423,508 | 442,228 | ||||||||||||||||||
Sales per ton | $ | 578.89 | $ | 396.91 | $ | 368.52 | $ | 359.90 | $ | 360.41 | $ | 375.62 | ||||||||||||
Balance Sheet Data (at end of period): | ||||||||||||||||||||||||
Total assets | $ | 161,825 | $ | 123,894 | $ | 116,089 | $ | 117,614 | $ | 119,661 | $ | 138,238 | ||||||||||||
Long-term debt (including current portion) | 83,051 | 70,245 | 65,538 | 29,064 | 28,224 | 146,270 | ||||||||||||||||||
Liabilities subject to compromise | — | — | — | — | 138,178 | — | ||||||||||||||||||
Stockholders’ equity (deficit) | $ | 11,541 | $ | (9,053 | ) | $ | (8,569 | ) | $ | (81,474 | ) | $ | (78,179 | ) | $ | (49,189 | ) | |||||||
Other Financial Data: | ||||||||||||||||||||||||
EBITDA (1) | $ | 36,576 | $ | 14,306 | $ | (832 | ) | $ | (760 | ) | $ | 1,306 | $ | 7,959 | ||||||||||
Ratio of earnings to fixed charges (2) | 2. | 6x | 1.1 | x | — | — | — | — | ||||||||||||||||
Depreciation expense | 7,037 | 6,955 | 5,694 | 1,773 | 15,776 | 8,446 | ||||||||||||||||||
Capital expenditures | $ | 13,681 | $ | 1,381 | $ | 1,103 | $ | 559 | $ | 1,139 | $ | 5,871 | ||||||||||||
| (1) | EBITDA, which we define as earnings before interest, taxes, depreciation and amortization, is not a measure of financial performance calculated in accordance with accounting principles generally accepted in the United States (“GAAP”). EBITDA does not represent and should not be considered as an alternative to net income or cash flows from operations, which are determined in accordance with GAAP. |
10
Table of Contents
We use EBITDA as a measure of operating performance, but not as a measure of liquidity. It assists us in comparing our performance on a consistent basis as it removes the impact of our capital structure (primarily interest charges from our outstanding debt) and asset base (primarily depreciation and amortization of machinery and equipment) from our operating results.
We also use it with respect to compliance with our credit facility, which requires us to maintain a specified amount of Free Cash Flow for a rolling 12-month period that ends on the last day of each of our fiscal quarters. Free Cash Flow is defined as EBITDA (as defined in our credit facility) less certain fixed charges. EBITDA as that term is defined under our credit facility differs from the EBITDA measure used herein in that it includes a further adjustment to exclude the effect of extraordinary and/or nonrecurring gains or losses. We are in compliance with our Free Cash Flow covenant through the 12-month period ending April 30, 2005.
Material limitations exist to using EBITDA, as compared to net income, including difficulty in comparing our EBITDA results with similarly titled measures of other companies and the inability to analyze certain items, including depreciation and interest expense, that directly affect our net income or loss. We compensate for these limitations by considering the economic effect of excluded items independently and in connection with our analysis of net income. EBITDA should not be considered in isolation or as a substitute for operating income, net income or loss, cash flows provided by operating, investing and financing activities, or other income or cash flow statement data prepared in accordance with GAAP or as a measure of liquidity.
We believe EBITDA is useful to investors in evaluating our operating performance because:
| • | it is widely used in the steel industry to measure a company’s operating performance without regard to items such as depreciation and amortization, which can vary depending upon accounting methods and the book value of assets. We believe that, by eliminating such effects, EBITDA provides a meaningful measure of overall corporate performance exclusive of our capital structure and the method by which our assets were acquired; and |
| • | it helps investors more meaningfully evaluate and compare the results of our operations from period to period by removing the impact of our capital structure (primarily interest charges from our outstanding debt) and asset base (primarily depreciation and amortization of machinery and equipment) from our operating results. Set forth below is a reconciliation of net income to EBITDA: |
The following is a reconciliation of EBITDA to net income:
| Successor Company | Predecessor Company | ||||||||||||||||||||||
| Fiscal Year Ended April 30, | Eight and One-Half | Three and One-Half Months Ended August 13, 2002 | Fiscal Year Ended April 30, | ||||||||||||||||||||
| 2005 | 2004 | 2002 | 2001 | ||||||||||||||||||||
| (dollars in thousands) | |||||||||||||||||||||||
Net income (loss) | $ | 22,454 | $ | 416 | $ | (10,790 | ) | $ | (3,295 | ) | $ | (24,205 | ) | $ | (24,806 | ) | |||||||
Interest expense, net | 9,677 | 6,935 | 4,264 | 762 | 9,735 | 16,919 | |||||||||||||||||
Income tax benefit | (2,592 | ) | — | — | — | — | |||||||||||||||||
Depreciation | 7,037 | 6,955 | 5,694 | 1,773 | 15,776 | 8,446 | |||||||||||||||||
Extraordinary Item | — | — | — | — | — | 7,400 | |||||||||||||||||
EBITDA | $ | 36,576 | $ | 14,306 | $ | (832 | ) | $ | (760 | ) | $ | 1,306 | $ | 7,959 | |||||||||
| (2) | For purposes of calculating this ratio, “earnings” consists of income before income taxes and fixed charges. “Fixed charges” consist of interest expense on indebtedness, amortization of debt issuance costs, amortization of debt discount and the interest portion of rental expense. Earnings were insufficient to cover fixed charges in the eight and one-half month period ended April 30, 2003 by approximately $10.8 million; in the three and one-half month period ended August 13, 2002 by approximately $3.3 million; in the fiscal year ended April 30, 2002 by approximately $24.2 million and in the fiscal year ended April 30, 2001 by approximately $17.4 million. |
11
Table of Contents
| ITEM 7. | MANAGEMENT’S DISCUSSION AND ANALYSIS OF FINANCIAL CONDITION AND RESULTS OF OPERATION |
MD&A contains statements that are forward-looking. You should read the following discussion in connection with our consolidated financial statements, including the notes to those statements, included in this document. The following discussion contains forward-looking statements which include numerous risks which you should carefully consider. These statements are based on current expectations and assumptions that are subject to uncertainties not currently known to us or that we currently deem to be immaterial which could cause actual results to differ materially. Additional risks and uncertainties may also materially and adversely affect our business. Any risks could materially adversely affect our business, financial condition or results of operations. Our fiscal years end on April 30.
Management Summary
Sheffield Steel is a regional mini-mill that produces a range of steel products including concrete reinforcing bar, hot rolled steel bar, and fabricated products such as fabricated rebar, railroad track spikes, and steel fence posts. Our headquarters and largest manufacturing facility is located in Sand Springs, Oklahoma, where we have an annual billet-making capacity of 600,000 tons. We also have a rolling mill in Joliet, Illinois, two rebar fabrication plants in the Kansas City area, a railroad spike manufacturing operation in Sand Springs, a post fabrication shop located adjacent to the Sand Springs mill, and a short-line railroad. The major cost components of our products are steel scrap and other raw materials, energy, labor, warehousing and handling and freight costs.
Several external factors exist which impact our results of operations, including volatility of steel prices, the cost of purchased raw materials, the magnitude and durability of world economy, the impact of production and consumption of steel in developing countries (which has a large impact on the volatility of steel raw material supplies and global steel pricing), and the fluctuating volume of imports to the United States.
History
Our Sand Springs facility was started in 1929 and was originally named Tulsa Rolling Mills. In 1936, the facility was leased by Sheffield Steel Corporation, a subsidiary of Armco Steel Corporation. In 1946, Sheffield Steel Corporation, a subsidiary of Armco Steel Corporation, purchased the plant. During the early 1950s Sheffield Steel Corporation became a division of Armco Steel. The Sheffield name and logo continued to be used in the Midwest for steel fence posts and wire products. In 1981, Armco sold the Sand Springs facility to HMK Enterprises and the Sheffield name was retained creating the new Sheffield Steel Corporation. Sheffield started up the Kansas City Rebar fabrication facility in 1985, acquired the Joliet, Illinois mill in 1986 and acquired the Railway in 1987. Later, Sheffield acquired Waddell’s rebar Fabricators in 1997 and Wellington Industries in 1998.
During the late 1990s, the U.S. steel industry experienced high energy costs, an increased volume of imported steel due in part to the illegal dumping of steel by foreign producers and a slowdown in the general economy. As a result of these factors and our significant debt service obligations at the time, our predecessor became unable to meet its financial obligations. In December 2001, our predecessor voluntarily filed a petition for relief under Chapter 11 of the Bankruptcy Code in the United States Bankruptcy Court for the Northern District of Oklahoma. On August 14, 2002, a plan of reorganization was confirmed by the bankruptcy court and we emerged from bankruptcy. Under the plan, we satisfied our predecessor’s indebtedness with an exchange representing 95% of the equity interest in our common stock and $30.0 million principal amount of new 10% senior secured notes due 2007. In total, $136.0 million was discharged under the plan of reorganization. The bankruptcy case was fully closed on March 30, 2005.
After we emerged from bankruptcy, our financial performance has improved due to significant changes in our business and industry. Annualized utilization at our Sands Springs rolling mill improved approximately 25%. Company-wide annual rolling capacity increased from approximately 460,000 tons to 620,000 tons as a result of the implementation of several operating initiatives, including (1) performance of scheduled preventive
12
Table of Contents
maintenance, (2) improvement to our mill setup techniques and (3) revamping of our employee incentive plans. In addition, we expanded our sales efforts into Arizona, Nevada and California which reduced the impact of seasonality and increased our volume. The impact of rising scrap prices continues to be partially offset by scrap surcharges that were implemented in January 2004.
Due to these business improvements and industry changes, we believe that we will be able to perform significantly better in comparison to the periods prior to our emergence from bankruptcy and the implementation of these improvements and changes.
(1-2) Liquidity and Capital Resources
Our business is capital intensive and requires substantial capital expenditures for, among other things, the purchase and maintenance of equipment used in our steelmaking and finishing operations and necessary to remain in compliance with environmental laws. For fiscal year ending April 30, 2005, our capital expenditures were $13.7 million, including $8.7 million for the purchase of a previously-leased reheat furnace that we purchased with a portion of the proceeds from the sale of the new notes. In addition to capital expenditures, our short-term and long-term liquidity needs arise largely from working capital requirements, principal and interest payments related to our outstanding indebtedness. We have met, and anticipate continuing to meet, our liquidity requirements with cash provided by operations, equity, long-term borrowings, our revolving credit facility, state and local grants and capital cost reimbursements.
As of April 30, 2005, we had long-term indebtedness of $83.1 million, including a current portion of $11.9 million, and we had approximately $15.0 million of additional borrowing availability under our revolving credit facility. Our current liquidity requirements include working capital needs, cash for debt service including an excess cash flow offer to repurchase notes as required by our indenture and capital expenditures. We intend to finance current operations and investing activities with cash from operations and borrowings under our revolving credit facility.
Borrowings under our revolving credit facility bear interest at a floating rate. To the extent that interest rates increase or decrease, and to the extent that amounts outstanding under the revolving credit facility increase or decrease, there will be corresponding increases or decreases in our interest obligations. In addition, our revolving credit facility and long-term indebtedness contain certain customary covenants. Since our emergence from bankruptcy we have been in non-compliance with a covenant on three occasions, in each instance receiving a waiver of non-compliance. In July 2003, at no cost to us, we obtained a permanent waiver of the covenant to provide the lender a post-bankruptcy opening balance sheet and analysis of tax consequences of rescheduling and forgiveness of the indentures within 90 days under our previous working capital term loan. In July 2003, we received a waiver for a violation of the cash flow covenant of the revolving credit facility. We paid an accommodation fee of $100 thousand for the waiver, which was effective for the period ending on April 30, 2003. In June 2004, at no cost to us, we amended the working capital term loan, which included obtaining a waiver for non-compliance with the negative pledge, debt and capital expenditures covenants. We repaid the working capital term loan with a portion of the proceeds from the issuance of the old notes.
Bond Indenture Excess Cash Flow Offer
Under the indenture governing our 11 3/8% senior notes due 2011, we are required to offer to repurchase an amount of the 11 3/8% notes equal to half the amount of excess cash flow (as defined in the indenture) generated during fiscal year 2005. Repurchases are scheduled to occur in late August or early September 2005 and will be funded with cash on hand. The repurchase offer will be for $11.8 million of the 11 3/8% notes, as calculated below.
| Fiscal Year Ended April 30, 2005 | |||
| (in thousands) | |||
Consolidated EBITDA (1) | $ | 38,965 | |
Unfunded Capital Expenditures (2) | 3,622 | ||
Principal payments on debt | 838 | ||
Cash Interest paid | 8,396 | ||
Income tax paid | 2,440 | ||
Less Total Cash Items | 15,296 | ||
Excess Cash Flow | 23,669 | ||
50% of Excess Cash Flow | $ | 11,835 | |
13
Table of Contents
| (1) | Consolidated EBITDA, as defined in the indenture for our 11 3/8% notes, is earnings before interest, taxes, depreciation and amortization with an add back of “consolidated non-cash charges less any non-cash items increasing consolidated net income for such period” (the “Indenture add back”). For fiscal year 2005, the add back consists of the write-off of non-cash debt issuance costs related to the retired notes as well as the write off of unamortized discount on the issuance of the retired notes. Consolidated EBITDA does not represent and should not be considered as an alternative to net income or cash flows from operations, which are determined in accordance with GAAP. We are required by our note indenture to calculate Consolidated EBITDA for the purpose of computing excess cash flow (as defined in the indenture). |
Reconciliation of Consolidated EBITDA and Net Income:
| Fiscal Year Ended April 30, 2005 | ||||
| (in thousands) | ||||
Net income (loss) | $ | 22,454 | ||
Interest expense, net | 9,677 | |||
Income tax benefit | (2,592 | ) | ||
Depreciation | 7,037 | |||
Indenture add back (defined in (1) above) | 2,389 | |||
Consolidated EBITDA | $ | 38,965 | ||
| (2) | Unfunded Capital Expenditures are capital expenditures less those expenditures made with financed funds during the year. For fiscal year 2005, financed funds were used to purchase our reheat furnace and our Railway transload facility. |
Reconciliation of Unfunded Capital Expenditures and Capital Expedentitures:
| Fiscal Year Ended April 30, 2005 | |||
| (in thousands) | |||
Unfunded capital expenditures | $ | 3,622 | |
Funded capital expenditures: | |||
Reheat furnace | 8,573 | ||
Transload facility | 1,486 | ||
Capital expenditures | $ | 13,681 | |
As required by the indenture, notice of the offer to repurchase the 11 3/8% notes must be mailed within 90 days of the fiscal year end, the offer will remain open for 20 business days and the repurchase date can be no earlier than 30 days nor later than 60 days after the notice was mailed.
3) Results of Operations
Fiscal Year 2005 As Compared To Fiscal Year 2004
The following presents an overview of our results of operations for the years ended April 30, 2005 and 2004.
Sales
Sales for fiscal year 2005 were $296.7 million. This was a 22% increase over fiscal year 2004. During the period, pricing increased 47% in comparison to the prior year, while shipments decreased 17%.
| • | Rebar sales increased 8% for fiscal year 2005 in comparison to fiscal year 2004. Shipments, however, decreased 27% as demand decreased during the second and third fiscal quarters due to customers reducing their inventories, which were at high levels, in anticipation of slower winter business. Rebar pricing was 48% higher than the prior year. |
| • | Sales of hot rolled bar increased 40% for fiscal year 2005. However, shipments decreased 4% as compared to fiscal year 2004 while the sales price increased 46% over the same period. |
| • | Fabricated product sales increased 25% for fiscal year 2005 in comparison to fiscal year 2004. This resulted from an increase in prices for fabricated products of 31% during the period, offset by a decrease in overall shipments of 4% between the periods. Within the product categories, fabricated |
14
Table of Contents
rebar shipments increased by 9% and railroad spike shipments by 10%, offset by a 29% decrease in fence post shipments. Prices increased for all three categories. |
Cost of Sales and Expenses
Average cost per ton increased 38% to $479 in fiscal year 2005 from $348 in fiscal year 2004 primarily due to increased scrap and alloy prices. During the period, the average price of scrap increased $61.77 per ton, or 47%, and alloy prices increased an average of $15.50 per billet ton, or 130%. Sales volumes decreased approximately 104,000 tons during the same period.
Selling, general and administrative expense increased $0.1 million in fiscal year 2005 as compared to fiscal year 2004. Administrative costs and selling costs increased approximately $0.8 million while insurance and taxes and general expenses decreased $0.7 million.
| • | Administrative costs increased $0.4 million during fiscal year April 30, 2005 due to employee profit sharing accruals and selling costs increased $0.4 million resulting from filling open staffing positions. |
| • | Insurance costs decreased $0.3 million during the same period as a result of lower negotiated rates. A decrease of $0.4 million in general expenses resulted from lower miscellaneous expenses. |
Depreciation expense increased $0.1 million during fiscal year 2005 as compared to fiscal year 2004 due to capital expenditures offset by assets becoming fully depreciated.
Post-retirement benefit expense other than pensions decreased by $0.1 million (3%) in fiscal year ended April 30, 2005 compared to fiscal year 2004 due to a revision in actuarial estimates.
Interest expense increased 40%, or $2.7 million, during fiscal year 2005 compared to fiscal year 2004. This increase was due to $12.8 million additional debt and the higher interest rate resulting from the new 11 3/8% bonds as of fiscal year ended April 30, 2005.
The loss on debt retirement of $3.5 million which occurred as a result of the bond refinancing during the second quarter of fiscal year 2005 consisted of $2.4 million for the write-off of the unamortized discount and unamortized debt issuance costs on the bonds retired by the transaction, $0.6 million early-retirement premium of old bonds and $0.5 million in fees for early payoff of working capital revolver.
A gain of $4.8 million resulting from a litigation settlement with our former owners was recognized in fiscal year 2005. This litigation related to the payment of dividends to the former owners and redemption of stock at a time when we were insolvent or on the verge of insolvency. The gain consisted of the following:
| (in millions) | ||||
Cash | $ | 4.5 | ||
Note Receivable | 1.3 | |||
Payments to prepetition unsecured creditors | (1.2 | ) | ||
Fees paid | (0.6 | ) | ||
Decrease in bankruptcy liabilities | 0.8 | |||
Total | $ | 4.8 | ||
15
Table of Contents
Income Taxes
The effective tax rate for fiscal year 2005 is approximately 38%. We have paid the following federal and state taxes in fiscal year 2005:
| (in thousands) | |||
Illinois state tax | $ | 88.0 | |
Missouri state tax | 39.0 | ||
2004 federal alternate minimum tax applied to 2005 | 70.0 | ||
2005 1st quarter federal safe harbor | 17.5 | ||
2005 2nd quarter federal estimated | 1,475.0 | ||
2005 4th quarter federal estimated | 750.0 | ||
Total | $ | 2,439.5 | |
Federal tax payments were made after applying our available net operating loss carryforwards. The provision for income taxes include these payments, offset by the reduction of our valuation allowance, which allowed us to recognize the value of our deferred tax assets on the balance sheet.
Fiscal Year 2004 as Compared to the 2003 Combined Period
The following presents an overview of our results of operations for the year ended April 30, 2004, and the period from May 1, 2002 to August 13, 2002 combined with the period from August 14, 2002 to April 30, 2003 (collectively the “2003 Combined Period”). (Our results before August 14, 2002 are not generally comparable to the results of operations after that date due to the effects of fresh-start accounting and our reorganization. The 2003 Combined Period is not presented in accordance with generally accepted accounting principles.)
Sales
The increase in sales was due primarily to improved demand, which was driven in part by new customers in the western United States and a sharp reduction in steel imports resulting from strong Chinese demand for steel, a weaker dollar and high ocean shipping costs. The increase in sales was also due to the addition of a new product line at the Sand Springs facility. As explained below, shipments and pricing generally increased in fiscal year 2004 compared to the 2003 Combined Period.
| • | Shipments of hot rolled bar from Sand Springs increased 17% in fiscal year 2004 compared to the 2003 Combined Period. Sales volume for hot rolled bar products increased due in part to increased production and productivity rates at the Sand Springs mill. Shipments of hot rolled bar products from Joliet decreased 2%. Pricing improved at both locations. |
| • | Shipments of rebar increased 76% and rebar pricing increased 20% in fiscal year 2004 compared to the 2003 Combined Period. |
| • | Shipments of fabricated products increased 16% and fabricated product pricing increased 8% in fiscal year 2004 compared to the 2003 Combined Period. Pricing improved on fabricated rebar, railroad spikes and fence posts and shipments improved on all fabricated products except railroad spikes, which were essentially unchanged. |
Cost of Sales and Expenses
Average cost of sales increased to $348 per ton in fiscal year 2004 from $334 per ton in the 2003 Combined Period due primarily to increases in scrap costs and, to a lesser degree, to increases in energy costs. These increases were partially offset by cost reductions related to the increased throughput in Sand Springs. Costs per ton decreased due to increased production and generally consistent fixed or semi-fixed costs.
Selling, general and administrative expense increased $0.3 million in fiscal year 2004 compared to the 2003 Combined Period. This increase primarily relates to higher net periodic pension costs.
Depreciation expense decreased $0.04 million in fiscal year 2004 compared to the 2003 Combined Period due to a company-wide restricted capital expenditure program under which only essential or maintenance-related expenditures were made. Capital spending was $1.4 million for fiscal year 2004.
16
Table of Contents
Post-retirement benefit expense increased $1.0 million in fiscal year 2004 compared to the 2003 Combined Period. No expense was recorded during the three and one-half month predecessor portion of the Combined Period due to the bankruptcy.
Interest expense increased $1.4 million in fiscal year 2004 compared to the 2003 Combined Period. This increase relates to (i) prior to emergence from bankruptcy our first mortgage debt was undersecured and subject to compromise in the Chapter 11 proceedings and, accordingly, no interest was accrued; and (ii) changes subsequent to our fresh-start date relate to changes in the level of debt outstanding and the floating interest rate.
Cash Flow Analysis
Fiscal Year 2005 As Compared To Fiscal Year 2004
Cash provided by operating activities was $6.6 million in fiscal year 2005, compared with cash flow used by operating activities of $1.1 million in fiscal year 2004. Cash provided by operations in fiscal year 2005 included:
| • | $22.5 million in net income, |
| • | $2.3 million increase in accounts payable and current liabilities due to $3.9 million increase in profit sharing accruals and $1.0 million increase in vacation accrual and other liabilities, offset by $2.4 million decrease in bankruptcy accrual and current pension benefit obligations. |
| • | $0.5 million increase in long-term liabilities, |
| • | $0.2 million increase in accrued interest, and |
| • | $7.0 million in depreciation. |
Cash used by operations included:
| • | $17.4 million increase in inventories due to an inventory build. We started fiscal year 2005 with very low levels of inventory resulting from robust shipping levels seen in early calendar year 2004. Since shipments slowed, starting in September 2004, we have been able to restore what we believe to be normal inventory levels. Additionally, inventories increased due to rising costs of our raw materials (scrap, alloys, energy, electrodes and refractories), |
| • | $2.4 million increase in other long term assets due to $1.1 million long-term portion of note receivable from litigation settlement, |
| • | $1.0 million increase in prepaid expenses and other due to prepaid income taxes and the current portion of note receivable from litigation settlement, |
| • | $1.6 million increase in accounts receivable due to increased sales, and |
| • | $1.9 increase in other comprehensive income due to adjustment in pension liability, net of tax. |
Cash used in investing activities in fiscal year 2005 was $13.7 million compared to $1.4 million in fiscal year 2004. Cash used in investing activities in fiscal year 2005 included $8.7 million for the purchase of our reheat furnace operating lease, $1.5 million by the Railway for the purchase of approximately eight acres of land that contain a 68,722 square foot office building, transloading/ warehouse facility and $0.7 million for a billet cast crane. Remaining capital expenditures are up $1.5 in fiscal year 2005 over fiscal year 2004 due to the resumption of a normal capital program.
Cash flow provided by financing activities was $7.7 million during fiscal year 2005 due to the refinancing of our debt and the resulting increase in our outstanding debt. During fiscal year 2004 cash flow provided by financing activities was $3.7 million resulting from revolving credit borrowings partially offset by debt repayments.
17
Table of Contents
Fiscal Year 2004 as Compared to the 2003 Combined Period
Cash used in operating activities was $1.1 million in fiscal year 2004 compared to $8.1 million in the 2003 Combined Period. Cash used in operating activities in fiscal year 2004 included a $14.5 million increase in accounts receivable due to the increase in sales. This increase in accounts receivable was partially offset by $7.4 million in net income plus depreciation expense. Of the $6.4 million of interest expenses, only $3.8 million was paid in cash during fiscal year 2004, and the balance was deferred by bondholder consent. As of the end of fiscal year 2004, two quarterly bond payments remained outstanding; these payments were made on May 28, 2004 and June 30, 2004.
Cash used in investing activities in fiscal year 2004 was $1.4 million compared to $1.7 million in the 2003 Combined Period. Expenditures in both years were limited to essential maintenance related capital spending. Maintenance related spending (an expense that is included in cost of goods sold) increased in fiscal year 2004 compared to the 2003 Combined Period, contributing to an increase in our utilization rate and the resulting increase in tons produced and shipped.
Cash provided by financing activities was $3.7 million during fiscal year 2004 and consisted of increased borrowings under the revolving credit facility of $6.6 million used to finance capital spending and the increase in working capital. Other long-term debt decreased by $2.9 million in fiscal year 2004.
Borrowings - Fiscal Year 2005
As of April 30, 2005, we had long-term indebtedness of $83.1 million. We had approximately $15 million of additional borrowing availability under our revolving agreements and $4.5 million in cash for a total liquidity of $19.5 million.
Increase Cash Flow Through Capital Improvements
We have identified areas of capital improvements that will upgrade our existing equipment and processes and enable us to increase capacity, reduce costs and extend the usable life of our existing equipment. Foremost among these capital improvements is the addition of a ladle arc furnace. The addition of a ladle arc furnace will enable us to operate our electric arc furnaces at greater efficiencies by creating a very controlled refining environment that results in less alloy, energy and electric furnace consumables usage, and can accommodate more restrictive chemistries. The cost to purchase and install this equipment is approximately $8.0 to $9.0 million.
We anticipate we can have a ladle arc furnace operational in our Sand Springs facility by the second quarter of fiscal year 2007. The timing of this upgrade is, however, subject to many factors, including operational delays and our general financial condition. We believe the completion of this project would result in savings of approximately $7.50 per ton, increasing EBITDA and net income by approximately $4.0 million per year.
We used a portion of the net proceeds from the sale of the $80 million 11 3/8% notes to purchase our reheat furnace for approximately $8.7 million. Previously, we had financed the reheat furnace through an operating lease (rental expense). The purchase eliminated our exposure to a fair market value buyout of the reheat furnace in 2008.
Critical Accounting Policies and Estimates
Management’s discussion and analysis of our financial condition and results of operations is based upon our consolidated financial statements, which have been prepared in accordance with accounting principles generally accepted in the United States of America. We review the accounting policies we use in reporting our financial results on a regular basis. The preparation of these financial statements requires us to make estimates and judgments that affect the reported amounts of assets, liabilities, revenues and expenses and related disclosure
18
Table of Contents
of contingent assets and liabilities. We evaluate the appropriateness of these estimates and judgments on an ongoing basis. We base our estimates on historical experience and on various other assumptions we believe are reasonable under the circumstances. Actual results may differ from these estimates due to actual outcomes being different from those upon which we based our assumptions.
The following critical accounting policies, which we have discussed with our audit committee, reflect our more significant judgments and estimates used in the preparation of our consolidated financial statements. We do not believe that changes in these assumptions and estimates that are reasonably likely to occur from period to period would have a material impact on our consolidated financial statements.
Cash Equivalents
We consider all highly liquid debt instruments with original maturities of three months or less to be cash equivalents.
Accounts Receivable
We grant credit to customers on standard industry terms of net 30 days. At April 30, 2005 and 2004, accounts receivable were outstanding an average of 40 days and 41 days, respectively. This variance from our typical credit terms is largely a result of the practice of several larger customers to pay upon receipt of monthly statements summarizing the previous month’s invoices, resulting in payment for invoices issued early in the previous month to be made outside of the 30 day credit period. The variance also is a result of our government contractor customers who pay us only after they receive payment from the government, which occurs outside of the 30 day credit period. Finally, the variance is also due in part to customers purchasing products that require further processing from third-party vendors paying only after the customer receives the finished product from those vendors, which may occur outside the 30 day credit period.
At April 30, 2005 and 2004, approximately 30% and 39% of accounts receivable were outstanding 30 days or more and, of these, approximately 80% and 86%, respectively, were outstanding 60 days or less.
We have policies and procedures in place to evaluate the collectibility of customer accounts and to estimate bad debts based on each customer’s creditworthiness and general economic conditions. We evaluate all customer accounts quarterly and our top ten customer accounts monthly. However, any adverse change in the financial condition of customers could affect our estimate of bad debts.
Inventories
Raw materials and scrap inventories are stated at the lower of average cost or market. The cost of work-in-process and finished goods inventories is based on standards which approximate the lower of cost or market. Work-in-process and finished goods include direct labor and allocated overhead. Generally, we do not have obsolete inventory. Excess finished goods inventory is written down to its scrap value and can be converted into a saleable finished good.
Other Assets
Other assets consist primarily of debt issuance costs of $4.5 million. Debt issuance costs are amortized over the term of the related indebtedness.
Reorganization Value in Excess of Identifiable Assets
Reorganization value in excess of identifiable assets is treated as goodwill in accordance with Statement of Financial Accounting Standards (SFAS) No. 142,Goodwill and Other Intangible Assets,and is evaluated by management for impairment annually. No impairment existed as of April 30, 2005 and 2004.
Property, Plant and Equipment
Property, plant and equipment, which include capital leases, is stated at cost. Depreciation and amortization is provided over the estimated useful lives of the individual assets using the straight-line method. The useful lives of the property and equipment range from three to twenty-five years. Significant renewals and betterments are capitalized; costs of maintenance and repairs are charged to expense as incurred. Equipment under capital leases is amortized over the shorter of the life of the lease or asset life.
19
Table of Contents
Income Taxes
Deferred tax assets and liabilities are recognized for the estimated future tax consequences attributable to differences between the financial statement carrying amounts of existing assets and liabilities and their respective tax bases. Deferred tax assets and liabilities are measured using enacted tax rates in effect for the year in which those temporary differences are expected to be recovered or settled. The effect on deferred tax assets and liabilities of a change in tax rates is recognized in income in the period that includes the enactment date.
Pension and Other Post-retirement Plans
We have defined benefit pension plans covering the hourly employees at Sand Springs and Joliet and the salaried employees at Sand Springs. The benefits are based on years of service and the employee’s compensation during the highest five of the last ten years before retirement.
We also sponsor a defined benefit health care plan for retirees and employees in Sand Springs. We measure the costs of this obligation based on our best estimate. The net periodic costs are recognized as employees render the services necessary to earn the post-retirement benefits.
Environmental Compliance Costs
We accrue for losses associated with environmental remediation obligations when such losses are probable and reasonably estimable. Accruals for estimated losses from environmental remediation obligations generally are recognized no later than completion of the remedial feasibility study. Such accruals are adjusted as further information develops or circumstances change. Environmental remediation costs have not had a material impact on the Company’s financial position, results of operations, or liquidity.
Revenue Recognition
Revenues from sales are recognized when title passes to the customer, which occurs when products are shipped. Raw material surcharges per ton are calculated based on the monthly Metal Market for Chicago #1 Heavy Melt and are included on the sales invoice on a per ton basis. There are no customer acceptance provisions and customer returns are resolved on a case-by-case basis. Customer returns were 0.05%, 0.08% and 0.5% of sales for the periods ended April 30, 2005, 2004, and 2003 respectively, and were recognized at the time the expense was incurred, except for a quality reserve at Joliet which is established at each year end and subsequently charged with prior year quality issues.
Railway revenue on inbound and outbound shipments is recognized upon delivery to either the interchange or the end user. Revenues for demurrage, equipment rental and switching are recognized at the time of service.
Use of Estimates
The preparation of financial statements in conformity with accounting principles generally accepted in the United States of America requires us to make estimates and assumptions that affect the amounts reported. We believe that these estimates are reasonable and proper; however, actual results could differ from estimates.
Asset Impairment
We periodically evaluate the carrying value of long-lived assets when events and circumstances warrant such a review. A long-lived asset is considered impaired when the anticipated undiscounted future cash flows from a logical grouping of assets is less than its carrying value. In that event, we recognize a loss equal to the amount by which the carrying value exceeds the fair market value of assets. No impairments were recorded for the years ended April 30, 2005 and 2004.
Advertising Costs
All advertising costs are expensed as incurred.
20
Table of Contents
Shipping and Handling
Internal shipping and handling costs and costs associated with inbound freight are included in inventory or cost of sales. Shipping costs charged to customers are recorded as revenue and the associated costs incurred are recorded as cost of goods sold.
Planned Maintenance Activities
Annually, we shut down the plant for planned major maintenance activities. We accrue for these planned major maintenance activities costs throughout the year. These costs include estimated costs for material, labor, supplies and contractor assistance for (i) repairs to furnace refractories, (ii) maintenance on transformers and (iii) work on other equipment.
Segment and Product Revenue Information
We provide steel products and services to the steel manufacturing and fabricating industry and therefore believe that all of the business activities from which it earns revenues and incurs expenses are from a single segment. The products produced, production processes, customers and methods of distribution are of a similar nature throughout the company. Our chief operating decision maker does not make decisions that affect the company based on discrete financial information with respect to products or production facilities. None of our sales were outside the United States. We sell our products through our own sales force and, to a limited extent, through sales agencies. All of our assets are located in the United States.
Stock Based Compensation
We granted 250,000 shares of restricted stock to certain members of senior management and the Board of Directors in December 2003. As we had recently emerged from bankruptcy and the market conditions in the steel industry at the time of issuance were depressed and volatile, the fair value of the restricted stock was determined by the Board of Directors to be $0.01 per share. A portion of these awards vested on December 3, 2003, the grant date, with the remaining awards vesting on August 14, 2004. We used the fair value method to account for stock based employee compensation.
Reclassifications
Certain amounts in 2003 and 2004 have been reclassified to conform to 2005. These reclassifications have no impact on net income (loss) or accumulated earnings (deficit).
Recent Accounting Pronouncements
In November 2002, the FASB issued Financial Interpretation No. 45,Guarantor’s Accounting andDisclosure Requirements/or Guarantees, Including Indirect Guarantees of Indebtedness of Others(“FIN 45”). FIN 45 expands the existing disclosure requirements for guarantees and requires that companies recognize a liability for guarantees issued after December 31, 2002. The implementation of FIN 45 did not have a significant impact on our financial position or results of operations.
In 2003, the FASB issued FASB Staff Position FAS No. 106-1,Accounting and Disclosure Requirements Related to the Medicare Prescription Drug, Improvement and Modernization Act of 2003. The Medicare Prescription Drug, Improvement and Modernization Act of 2003 (the “MMA”) provides a federal subsidy to sponsors of retiree health care benefit plans that provide a benefit that is at least actuarially equivalent to the Medicare Part D benefit. Any measures of our accumulated post-retirement benefit obligation (“APBO”) or net post-retirement benefit expense provided in these financial statements and accompanying notes to the financial statements, do not reflect the effects of the MMA on any of our post-retirement healthcare plans.
In 2004, the FASB issued (FSP) FAS 106-2,Accounting and Disclosure Requirements related to the Medicare Prescription Drug Improvement and Modernization Act of 2003, which supersedes (FSP) FAS 106-1.
21
Table of Contents
The FSP is effective for the Company’s first interim or annual period beginning after June 15, 2004 and did not have a financial impact on the Company for fiscal year 2004.
In January of 2003, the Financial Accounting Standards Board (“FASB”) issuedFinancial Interpretation No. 46 Consolidation of Variable interest Entities—An Interpretation of ARB No. 51(FIN 46). In December 2003, the FASB issued FIN 46R, which clarified certain issues identified in FIN 46. FIN 46R requires an entity to consolidate a variable interest entity if the entity is designated as the primary beneficiary of that variable interest entity even if the entity does not have a majority of voting interest. A variable interest entity is generally defined as an entity where its equity is unable to finance its activities or where the owners of the entity lack the risk and rewards of ownership. The provisions of this statement apply at inception of any entity created after April 30, 2003. For an entity created before February 1, 2003, the provisions of this interpretation must be applied at the beginning of the first interim or annual period beginning after March 15, 2004. The implementation of FIN 46 did not have a significant impact on Sheffield’s financial position or results of operations.
In May 2003, the FASB issued Statement No. 150,Accounting for Certain Financial Instruments with Characteristics of both Liabilities and Equity(SFAS 150). SFAS 150 establishes standards for how an issuer classifies and measures certain financial instruments with characteristics of both liabilities and equity. It requires that an issuer classify a financial instrument that is within the scope of SFAS 150 as a liability (or an asset in some circumstances). This statement is effective for financial instruments entered into or modified after May 31, 2003, and otherwise is effective at the beginning of the first interim period beginning after June 15, 2003. Sheffield adopted the provisions of SFAS 150 as of September 1, 2003. The adoption did not have a material impact on Sheffield’s consolidated financial position or results of operations.
(4) Off-balance sheet arrangements
We have no off-balance sheet arrangements that have or are reasonably likely to have an effect on our financial condition.
(5) Contractual Commitments
Our contractual commitments as of April 30, 2005, are:
| Payment due by period | |||||||||||||||
| Total | FY 06 | FY 07 - 08 | FY 09 - 10 | After FY 10 | |||||||||||
| (dollars in thousands) | |||||||||||||||
11 3/8 % Senior Secured Notes due 2011 (1) | $ | 80,000 | $ | 11,835 | $ | — | $ | — | $ | 68,165 | |||||
Revolving credit facility | 8 | 8 | — | — | — | ||||||||||
Other long-term debt obligations | 3,000 | — | — | 3,000 | — | ||||||||||
Capital lease obligations | 43 | 18 | 25 | — | — | ||||||||||
Interest payments | 55,231 | 9,258 | 18,515 | 18,358 | 9,100 | ||||||||||
Pension benefits | 28,810 | 2,542 | 5,186 | 5,551 | 15,531 | ||||||||||
Other post-retirement benefits | 21,380 | 1,763 | 3,859 | 4,306 | 11,452 | ||||||||||
Utility purchase obligations | 600 | 600 | — | — | — | ||||||||||
Total | $ | 189,072 | $ | 26,024 | $ | 27,585 | $ | 31,215 | $ | 104,248 | |||||
| (1) | Includes obligation to make free cash flow sweep offer to buy back bonds up to $11,835 for FY 06. |
Our ability to meet our debt service obligations and reduce our total debt will depend upon our future performance, which in turn, will depend upon general economic, financial and business conditions, along with competition, legislation and regulation factors that are largely beyond our control. In addition, we cannot assure you that our operating results, cash flow and capital resources will be sufficient for repayment of our
22
Table of Contents
indebtedness in the future. We believe that based upon current levels of operations and anticipated growth, cash flow from operations, together with other available sources of funds, including additional borrowings under the revolving credit facility, will be adequate for the next twelve months for making required payments of principal and interest on our indebtedness and for funding anticipated capital expenditures and working capital requirements.
Retirement Obligations
We have funding obligations pursuant to the defined benefits plans we offer certain employees. On three occasions, we have requested waivers from the minimum funding requirements imposed by applicable law for these plans. In 1984 and 1993, our predecessor requested waivers of funding obligations which were granted. In 1993, as a result of improved financial circumstances, we timely satisfied the minimum funding requirements despite our receipt of a waiver. In March 2004, we applied for a waiver of our $2.2 million minimum funding obligation. In September 2004, we withdrew our waiver application, submitted in March 2004, and paid our $2.2 million minimum funding requirement. In 2004, we permanently closed two of our three defined benefits plans for any new enrollments.
Inflation
We have not experienced any material adverse effects on operations in recent years because of inflation, although margins can be affected by inflationary conditions. Our primary cost components are ferrous scrap and other raw materials, energy and labor, all of which are susceptible to domestic inflationary pressures. The pricing of finished products, however, can be influenced by general economic conditions and competitive factors in the steel industry. While we have been successful in passing on cost increases to our customers through price adjustments, the effect of steel imports, severe market price competition and under-utilized industry capacity has in the past, and could in the future, limit our ability to adjust pricing.
Outlook
Our outlook for the fiscal year ended April 30, 2006 remains positive. We anticipate that demand and pricing for rebar, hot-rolled bar and fabricated products will remain strong. We anticipate domestic demand for steel will remain strong as imports of steel remain low due to continued domestic demand, a relatively weak U.S. dollar and high ocean shipping costs. We also expect that our continued presence in the western United States will help keep demand for our products strong. We anticipate pricing will remain strong as a result of continued use of the raw material surcharges that were implemented in January 2004. After increasing during fiscal year 2004, scrap prices have fluctuated monthly, however we expect that the continued use of the surcharges will provide adequate margins for our products. We plan on continuing our effort to increase production efficiency through further capital expenditures and maintenance efforts. Foremost among our expected capital expenditures is the addition of a ladle arc furnace, which we estimate will cost approximately $8.0 million to $9.0 million. We hope to have the furnace operational by the second quarter of fiscal year 2007.
| ITEM 7A. | QUANTITATIVE AND QUALITATIVE DISCLOSURES ABOUT MARKET RISK |
We are exposed to market risk in the form of interest rate risk relating to borrowings under our credit facility. Revolving credit loans and the Railway term loan under our credit facility accrue interest at floating rates equal to prime plus 0.5% or LIBOR plus 3.0%, as applicable. Advances under the letters of credit under the credit facility accrue interest at floating rates equal to prime plus 0.5%. Because the prime and LIBOR rates may increase or decrease at any time, we are subject to the risk that they may increase, thereby increasing the interest rates applicable to our borrowings under the credit facility. Increases in the applicable interest rates would increase our interest expense and reduce our net income.
We do not have any instruments, such as interest rate swaps or caps, in place that would mitigate our exposure to interest rate risk relating to these borrowings. At April 30, 2005, $3.0 million under the Railway term loan was outstanding under the credit facility and accruing interest under a LIBOR interest lock at 6.00% per annum. Based on this amount of borrowings under the credit facility, the effect of a hypothetical one percent increase in interest rates would increase our annual interest expense and reduce our net income by approximately $0.03 million. We also maintain a portion of our cash and cash equivalents in short-term financial instruments
23
Table of Contents
that are subject to interest rate risks. However, due to the short duration of these instruments, we do not believe that any changes in interest rates with respect to these instruments would materially affect our financial condition or results of operations.
| ITEM 8. | FINANCIAL STATEMENTS AND SUPPLEMENTARY DATA |
See Item 15 (a).
| ITEM 9. | CHANGES IN AND DISAGREEMENTS WITH ACCOUNTANTS ON ACCOUNTING AND FINANCIAL DISCLOSURE |
None.
| ITEM 9A. | CONTROLS AND PROCEDURES |
We have established disclosure controls and procedures to ensure that material information relating to us, including our consolidated subsidiaries, is made known to the officers who certify our financial reports and to other members of senior management and the Board of Directors.
(a)Evaluation of disclosure controls and procedures. Our management, with the participation of our principal executive officer and principal financial officer, has evaluated the effectiveness of the design and operation of our disclosure controls and procedures (as defined in Rules 13a-15(e) and 15d-15(e) under the Securities Exchange Act of 1934, as amended) as of the end of the period covered by this Annual Report on Form 10-K. Based on this evaluation, our principal executive officer and principal financial officer concluded that these disclosure controls and procedures are effective and designed to ensure that the information required to be disclosed in our reports filed or submitted under the Securities Exchange Act of 1934 is recorded, processed, summarized and reported within the requisite time periods.
(b)Changes in internal controls. There was no change in our internal control over financial reporting (as defined in Rules 13a-15(f) and 15d-15(f) under the Securities Exchange Act of 1934, as amended) identified in connection with the evaluation of our internal control performed during our last annual report that has materially affected, or is reasonably likely to materially affect, our internal control over financial reporting.
| ITEM 9B. | OTHER INFORMATION |
None.
PART III
| ITEM 10. | DIRECTORS AND EXECUTIVE OFFICERS OF THE REGISTRANT |
The information with respect to directors and executive officers is incorporated by reference to the information under the captions entitled “Election of Directors” and “Executive Officers” in our 2005 Proxy Statement.
Because we do not have a class of securities registered under the Securities and Exchange Act of 1934, as amended (the “Exchange Act”), none of our directors, executive officers or ten percent or greater security holders are subject to the reporting requirements of Section 16(a) of the Exchange Act. Accordingly, disclosure of delinquent filers pursuant to Item 405 of Regulation S-K is not applicable.
Our Board of Directors has determined Kevin S. Flannery is an independent, audit committee financial expert.
| ITEM 11. | EXECUTIVE COMPENSATION |
The information regarding compensation of our executive officers is incorporated by reference to the information under the caption entitled “Executive Compensation” in our 2005 Proxy Statement.
24
Table of Contents
| ITEM 12. | SECURITY OWNERSHIP OF CERTAIN BENEFICIAL OWNERS AND MANAGEMENT AND RELATED STOCKHOLDER MATTERS |
The information regarding beneficial ownership of our Common Stock by certain beneficial owners and by management is incorporated by reference to the information under the caption entitled “Security Ownership of Directors, Officers & Certain Beneficial Owners” in our 2005 Proxy Statement.
| ITEM 13. | CERTAIN RELATIONSHIPS AND RELATED TRANSACTIONS |
The information regarding certain relationships and related transactions with management and others is incorporated by reference to the information under the caption entitled “Certain Relationships and Related Transactions” in our 2005 Proxy Statement.
| ITEM 14. | PRINCIPAL ACCOUNTING FEES AND SERVICES |
The information required by this item concerning the principal accounting fees paid by the Company and the Audit Committee’s pre-approval policies and procedures, is incorporated by reference to the information under the caption “Audit Committee and Other Audit Matters” in our 2005 Proxy Statement.
PART IV
| ITEM 15. | EXHIBITS AND FINANCIAL STATEMENT SCHEDULES |
(a) The following documents are filed as a part of this report:
| 1. | Financial Statements.See Index to Consolidated Financial Statements, which appears on page F-1 hereof. The financial statements listed in the accompanying Index to Consolidated Financial Statements are filed herewith in response to this Item. |
| 2. | Financial Statement Schedules.All schedules are omitted because they are not applicable or because the required information is contained in the consolidated financial statements or notes included in this annual report on Form 10-K. |
| 3. | Exhibits. See Index to Exhibits. The exhibits listed in the Index to Exhibits immediately preceding the exhibits are filed herewith in response to this Item. |
25
Table of Contents
SIGNATURES
Pursuant to the requirements of Section 13 or 15(d) of the Securities Exchange Act of 1934, the Registrant has duly caused this report to be signed on its behalf by the undersigned, thereunto duly authorized on the 29th day of July 2005.
SHEFFIELD STEEL CORPORATION | ||
| By: | /s/ James P. Nolan | |
| James P. Nolan | ||
| President and Chief Executive Officer | ||
Pursuant to the requirements of the Securities Exchange Act of 1934, this report has been duly signed below by the following persons on behalf of the Registrant and in the capacities and on the dates indicated on the 29th day of July 2005.
Signature | Title | |||
/s/ James P. Nolan James P. Nolan | President, Chief Executive Officer and Director (Principal Executive Officer) | |||
/s/ Stephen R. Johnson Stephen R. Johnson | Vice President and Chief Financial Officer (Principal Financial and Accounting Officer) | |||
/s/ John V. Koerber John V. Koerber | Chairman of the Board of Directors | |||
/s/ Peter Blum Peter Blum | Director | |||
/s/ Kevin S. Flannery Kevin S. Flannery | Director | |||
/s/ Robert L. Purdum Robert L. Purdum | Director | |||
26
Table of Contents
INDEX TO CONSOLIDATED FINANCIAL STATEMENTS
Consolidated Financial Statements for:
| F-2 | ||
| F-25 | ||
F-1
Table of Contents
REPORT OF INDEPENDENT REGISTERED PUBLIC ACCOUNTING FIRM
Board of Directors and Stockholders
Sheffield Steel Corporation
We have audited the accompanying consolidated balance sheets of Sheffield Steel Corporation and subsidiary (a Delaware corporation) as of April 30, 2005 and 2004, and the related consolidated statements of operations, stockholders’ equity (deficit) and other comprehensive income (loss), and cash flows for the years then ended. These financial statements are the responsibility of the Company’s management. Our responsibility is to express an opinion on these financial statements based on our audits. The financial statements of Sheffield Steel Corporation and subsidiary for the eight and one-half months ended April 30, 2003 were audited by other auditors. Those auditors expressed an unqualified opinion on those financial statements in their report dated July 10, 2003.
We conducted our audits in accordance with the standards of the Public Company Accounting Oversight Board (United States). Those standards require that we plan and perform the audit to obtain reasonable assurance about whether the financial statements are free of material misstatement. The Company is not required to have, nor were we engaged to perform an audit of its internal control over financial reporting. Our audits included consideration of internal control over financial reporting as a basis for designing audit procedures that are appropriate in the circumstances, but not for the purpose of expressing an opinion on the effectiveness of the Company’s internal control over financial reporting. Accordingly, we express no such opinion. An audit also includes examining, on a test basis, evidence supporting the amounts and disclosures in the financial statements, assessing the accounting principles used and significant estimates made by management, as well as evaluating the overall financial statement presentation. We believe that our audits provide a reasonable basis for our opinion.
In our opinion, the 2005 and 2004 consolidated financial statements referred to above present fairly, in all material respects, the financial position of Sheffield Steel Corporation and subsidiary as of April 30, 2005 and 2004, and the results of their operations and their cash flows for the years then ended in conformity with accounting principles generally accepted in the United States of America.
/s/ GRANT THORNTON LLP
Tulsa, Oklahoma
June 24, 2005
F-2
Table of Contents
Sheffield Steel Corporation and Subsidiary
Consolidated Balance Sheets
April 30, 2005 and 2004
| 2005 | 2004 | |||||||
ASSETS | ||||||||
CURRENT ASSETS: | ||||||||
Cash and cash equivalents | $ | 4,463 | $ | 3,794 | ||||
Accounts receivable, less allowance for doubtful accounts of $548 and $398, respectively | 37,315 | 35,721 | ||||||
Inventories | 53,305 | 35,909 | ||||||
Prepaid expenses and other | 4,126 | 833 | ||||||
Total current assets | 99,209 | 76,257 | ||||||
PROPERTY, PLANT AND EQUIPMENT, net | 52,037 | 45,412 | ||||||
REORGANIZATION VALUE IN EXCESS OF IDENTIFIABLE ASSETS | 1,476 | 1,476 | ||||||
OTHER ASSETS: | ||||||||
Deferred income tax asset | 3,019 | — | ||||||
Other assets | 6,084 | 749 | ||||||
| $ | 161,825 | $ | 123,894 | |||||
LIABILITIES AND STOCKHOLDERS’ EQUITY (DEFICIT) | ||||||||
CURRENT LIABILITIES: | ||||||||
Current portion of long-term debt | $ | 11,861 | $ | 5,910 | ||||
Accounts payable | 9,972 | 9,911 | ||||||
Accrued interest payable | 1,930 | 1,754 | ||||||
Accrued liabilities | 14,020 | 11,458 | ||||||
Total current liabilities | 37,783 | 29,033 | ||||||
LONG-TERM DEBT, LESS CURRENT PORTION | ||||||||
Long-term debt | $ | 68,190 | $ | 64,335 | ||||
Term loan | 3,000 | — | ||||||
Total long-term debt, less current portion | 71,190 | 64,335 | ||||||
ACCRUED POSTRETIREMENT BENEFIT COSTS | 30,661 | 30,584 | ||||||
OTHER LIABILITIES | 10,650 | 8,995 | ||||||
Total liabilities | 150,284 | 132,947 | ||||||
COMMITMENTS AND CONTINGENCIES | ||||||||
STOCKHOLDERS’ EQUITY (DEFICIT): | ||||||||
Common stock (7,500 authorized, 5,000 issued and outstanding on April 30, 2005 and 2004, $.01 par value) | 50 | 50 | ||||||
Contributed capital | 4,056 | 4,056 | ||||||
Accumulated other comprehensive loss, net of tax of $1,135 | (4,645 | ) | (2,785 | ) | ||||
Accumulated earnings (deficit) | 12,080 | (10,374 | ) | |||||
Total stockholders’ equity (deficit) | 11,541 | (9,053 | ) | |||||
| $ | 161,825 | $ | 123,894 | |||||
F-3
Table of Contents
Sheffield Steel Corporation and Subsidiary
Consolidated Statements of Operations
(In thousands)
| For the year ended April 30, | Eight and (unaudited) | |||||||||||
| 2005 | 2004 | |||||||||||
SALES | $ | 282,720 | $ | 230,926 | $ | 113,993 | ||||||
BILLED FREIGHT | 13,939 | 13,782 | 7,238 | |||||||||
COST OF SALES | (231,591 | ) | (200,837 | ) | (104,289 | ) | ||||||
FREIGHT COST | (13,939 | ) | (13,782 | ) | (7,238 | ) | ||||||
Gross Profit | 51,129 | 30,089 | 9,704 | |||||||||
SELLING, GENERAL AND ADMINISTRATIVE EXPENSE | 13,178 | 13,068 | 8,816 | |||||||||
DEPRECIATION EXPENSE | 7,037 | 6,955 | 5,694 | |||||||||
POST-RETIREMENT BENEFIT EXPENSE OTHER THAN PENSIONS | 2,634 | 2,715 | 1,671 | |||||||||
Operating income (loss) | 28,280 | 7,351 | (6,477 | ) | ||||||||
OTHER EXPENSE (INCOME): | ||||||||||||
Interest expense, net | 9,677 | 6,935 | 4,264 | |||||||||
Reorganization expense | — | — | 49 | |||||||||
Loss on debt retirement | 3,534 | — | — | |||||||||
Gain from litigation settlement | (4,793 | ) | — | — | ||||||||
Net income (loss) before taxes | 19,862 | 416 | (10,790 | ) | ||||||||
INCOME TAX BENEFIT | (2,592 | ) | — | — | ||||||||
Net income (loss) | $ | 22,454 | $ | 416 | $ | (10,790 | ) | |||||
The accompanying notes are an integral part of these consolidated financial statements.
F-4
Table of Contents
Sheffield Steel Corporation and Subsidiary
Consolidated Statements of Stockholders’ Equity (Deficit) and Other Comprehensive Income (Loss)
For the periods from August 14, 2002 (date of reorganization) to April 30, 2005
(In thousands)
(Eight and one-half months ended April 30, 2003 unaudited)
| Common Stock | Contributed Capital | Accumulated Other Comprehensive Loss | Accumulated Earnings (Deficit) | Total | ||||||||||||||
Balance at August 14, 2002 | $ | — | $ | — | $ | — | $ | — | $ | — | ||||||||
Reorganization of company - reorganization value | 48 | 4,056 | — | — | 4,104 | |||||||||||||
Net loss | — | — | — | (10,790 | ) | (10,790 | ) | |||||||||||
Change in minimum pension liability | — | — | (1,883 | ) | — | (1,883 | ) | |||||||||||
Comprehensive loss | — | — | — | — | (12,673 | ) | ||||||||||||
Balance at April 30, 2003 | 48 | 4,056 | (1,883 | ) | (10,790 | ) | (8,569 | ) | ||||||||||
Common stock issued | 2 | — | — | — | 2 | |||||||||||||
Net income | — | — | — | 416 | 416 | |||||||||||||
Change in minimum pension liability | — | — | (902 | ) | — | (902 | ) | |||||||||||
Comprehensive loss | — | — | — | — | (486 | ) | ||||||||||||
Balance at April 30, 2004 | 50 | 4,056 | (2,785 | ) | (10,374 | ) | (9,053 | ) | ||||||||||
Net income | — | — | — | 22,454 | 22,454 | |||||||||||||
Change in minimum pension liability, net of tax of $1,135 | — | — | (1,860 | ) | — | (1,860 | ) | |||||||||||
Comprehensive income | — | — | — | — | 20,594 | |||||||||||||
Balance at April 30, 2005 | $ | 50 | $ | 4,056 | $ | (4,645 | ) | $ | 12,080 | $ | 11,541 | |||||||
The accompanying notes are an integral part of these consolidated financial statements.
F-5
Table of Contents
Sheffield Steel Corporation and Subsidiary
Consolidated Statements of Cash Flows
(In thousands)
| For the year ended April 30, | Eight and (unaudited) | |||||||||||
| 2005 | 2004 | |||||||||||
CASH FLOWS FROM OPERATING ACTIVITIES: | ||||||||||||
Net income (loss) | $ | 22,454 | $ | 416 | $ | (10,790 | ) | |||||
Adjustments to reconcile net income (loss) to net cash provided by (used in) operating activities- | ||||||||||||
Note interest added to principal | — | — | 2,202 | |||||||||
Depreciation | 7,037 | 6,955 | 5,694 | |||||||||
Accretion of discount on senior secured notes | 304 | 1,045 | 627 | |||||||||
Accrual of postretirement benefits other than pensions, net of cash paid | 77 | 510 | 181 | |||||||||
Bad-debt expense | 383 | 356 | 969 | |||||||||
Deferred taxes | (2,592 | ) | — | — | ||||||||
Gain on litigation settlement | (4,793 | ) | — | — | ||||||||
Loss on debt retirement | 3,534 | — | — | |||||||||
Changes in assets and liabilities- | ||||||||||||
Accounts receivable | (1,977 | ) | (14,517 | ) | (4,129 | ) | ||||||
Inventories | (17,396 | ) | 195 | 2,053 | ||||||||
Prepaid expenses and other | (954 | ) | 1,673 | (1,167 | ) | |||||||
Other assets | (2,491 | ) | 125 | 1,133 | ||||||||
Accounts payable | 61 | 3,421 | 2,547 | |||||||||
Accrued interest payable | 176 | 1,649 | 94 | |||||||||
Accrued other current liabilities | 2,259 | 2,557 | (3,806 | ) | ||||||||
Other long-term liabilities | 548 | (5,457 | ) | (1,978 | ) | |||||||
Net cash provided by (used in) operating activities | 6,630 | (1,072 | ) | (6,370 | ) | |||||||
CASH FLOWS FROM INVESTING ACTIVITIES: | ||||||||||||
Capital expenditures | (13,681 | ) | (1,381 | ) | (1,103 | ) | ||||||
Proceeds on sale of assets | 18 | — | — | |||||||||
Net cash used in investing activities | (13,663 | ) | (1,381 | ) | (1,103 | ) | ||||||
CASH FLOWS FROM FINANCING ACTIVITIES: | ||||||||||||
Issuance of common stock | — | 2 | — | |||||||||
Net payments (proceeds) of long-term debt under revolving lines of credit | (36,375 | ) | 6,605 | 5,643 | ||||||||
Proceeds from issuance of senior notes | 80,000 | — | — | |||||||||
Payments on long-term debt | (33,042 | ) | (2,943 | ) | (2,428 | ) | ||||||
Payments to retire debt | (1,147 | ) | — | — | ||||||||
Debt issuance costs | (4,476 | ) | — | — | ||||||||
Net proceeds received from litigation settlement | 2,742 | — | — | |||||||||
Net cash provided by financing activities | 7,702 | 3,664 | 3,215 | |||||||||
NET INCREASE (DECREASE) IN CASH AND CASH EQUIVALENTS | 669 | 1,211 | (4,258 | ) | ||||||||
CASH AND CASH EQUIVALENTS, beginning of period | 3,794 | 2,583 | 6,841 | |||||||||
CASH AND CASH EQUIVALENTS, end of period | $ | 4,463 | $ | 3,794 | $ | 2,583 | ||||||
SUPPLEMENTAL DISCLOSURE OF CASH FLOW INFORMATION | ||||||||||||
CASH PAID DURING THE PERIOD FOR INTEREST | $ | 8,396 | $ | 3,818 | $ | 1,341 | ||||||
CASH PAID DURING THE PERIOD FOR TAXES | $ | 2,440 | $ | — | $ | — | ||||||
NONCASH ITEMS- | ||||||||||||
Additional minimum pension liability, net of tax | $ | 1,860 | $ | 902 | $ | 1,883 | ||||||
Write-off of debt issuance costs | $ | 2,387 | $ | — | $ | — | ||||||
Note receivable from litigation settlement | $ | 2,051 | $ | — | $ | — | ||||||
F-6
Table of Contents
Sheffield Steel Corporation and Subsidiary
Notes to Consolidated Financial Statements
April 30, 2005, 2004 and 2003
(In thousands)
(April 30, 2003 unaudited)
A. Organization
1. Nature of Business
The consolidated financial statements of Sheffield Steel Corporation (Sheffield) include the accounts of its divisions, Sheffield Steel - Sand Springs (Sand Springs), Sheffield Steel — Joliet (Joliet), Sheffield Steel — Kansas City (Kansas City) and Waddell’s Rebar Fabricators (Waddell) (Kansas City and Waddell - collectively Team Rebar), Wellington Industries (Wellington), and its wholly owned subsidiary Sand Springs Railway Company (the Railway). All material intercompany transactions and balances have been eliminated in consolidation.
Sheffield is a mini-mill that produces steel products such as hot-rolled steel bar, concrete reinforcing bar (“rebar”) and fabricated products. Sheffield’s principal markets include Oklahoma, Western Arkansas, Western Missouri, Kansas, Eastern Colorado, Northeastern New Mexico and Northern Texas.
On December 7, 2001, “old” Sheffield Steel Corporation and two of its wholly owned subsidiaries (collectively, the Debtors or Predecessor) filed voluntary petitions for reorganization under Chapter 11 of the United States Bankruptcy Code (the Code) in the United States Bankruptcy Court for the Northern District of Oklahoma (the court). Sheffield’s remaining subsidiary, Sand Springs Railway, did not participate in the bankruptcy. The Company completed a stand-alone plan of reorganization (the Plan or Plan of Reorganization) and emerged from Chapter 11 bankruptcy as of August 14, 2002 (date of reorganization). The Company adopted fresh-start accounting pursuant to American Institute of Certified Public Accountants Statement of Position 90-7,Financial Reporting by Entities in Reorganization under the Bankruptcy Code(SOP 90-7). Under fresh-start accounting, the reorganization fair value of the Company is allocated to the entity’s assets, the Company’s accumulated deficit is eliminated, and the equity in the new company is issued according to the Plan. As a result of adopting fresh-start accounting and emerging from Chapter 11 status, the Company’s financial statements are not comparable with those prepared before the Plan was consummated.
B. Summary of Significant Accounting Policies
1. Organization and Nature of Business
Sheffield’s primary business is the production of concrete reinforcing bar, and a range of hot rolled bar products including rounds, flats and squares and fabricated products, which include fabricated rebar, railroad spikes, and fence posts. The Company operates in an economic environment wherein the commodity nature of both the products for sale and the primary raw materials cause sales prices and purchase costs to fluctuate, often on a short-term basis, due to the worldwide supply and demand situation for those commodities. The supply and demand factors for products for sale, and the supply and demand factors for primary raw materials correlate to a degree, but are not necessarily the same. Therefore, margins between sales price and production costs can fluctuate significantly on a short-term basis.
2. Cash Equivalents
Sheffield considers all highly liquid debt instruments with original maturities of three months or less to be cash equivalents.
3. Accounts Receivable
Sheffield grants credit to customers on standard industry terms of net 30 days. At April 30, 2005 and 2004, accounts receivable were outstanding an average of 40 days and 41 days, respectively. This variance from the Company’s typical credit terms is largely a result of the practice of several larger customers to pay upon receipt of monthly statements summarizing the previous month’s invoices, resulting in payment for invoices issued early in the previous month to be made outside of the 30 day credit period. The variance also is a result of the Company’s government contractor customers who pay Sheffield only after they receive payment from the government, which occurs outside of the 30 day credit
F-7
Table of Contents
Sheffield Steel Corporation and Subsidiary
Notes to Consolidated Financial Statements-(continued)
April 30, 2005, 2004 and 2003
(In thousands)
(April 30, 2003 unaudited)
period. Finally, the variance is also due in part to customers purchasing products that require further processing from third-party vendors paying the Company only after the customer receives the finished product from those vendors, which may occur outside the 30 day credit period.
At April 30, 2005 and 2004, approximately 30% and 39% of accounts receivable were outstanding 30 days or more and, of these, approximately 80% and 86%, respectively, were outstanding 60 days or less.
The Company has policies and procedures in place to evaluate the collectibility of customer accounts and to estimate bad debts based on each customer’s creditworthiness and general economic conditions. The Company evaluates all customer accounts quarterly and its top ten customer accounts monthly. However, any adverse change in the financial condition of customers could affect the Company’s estimate of bad debts.
| Year Ended April 30, | Eight and (unaudited) | |||||||||||
| 2005 | 2004 | |||||||||||
Balance, beginning of the period | $ | 398 | $ | 543 | $ | — | ||||||
Provision for loss on accounts receivable | 383 | 356 | 969 | |||||||||
Accounts receivable written off, net of recoveries | (233 | ) | (501 | ) | (426 | ) | ||||||
Balance, end of period | $ | 548 | $ | 398 | $ | 543 | ||||||
4. Inventories
Raw materials and scrap inventories are stated at the lower of average cost or market. The cost of work-in-process and finished goods inventories is based on standards which approximate the lower of cost or market. Work-in-process and finished goods include direct labor and allocated overhead. Generally, the Company does not have obsolete inventory. Excess finished goods inventory is written down to its scrap value and can be converted into a saleable finished good.
5. Other Assets
Other assets consist primarily of debt issuance costs of $4,476. Debt issuance costs are amortized over the term of the related indebtedness.
6. Reorganization Value in Excess of Identifiable Assets
Reorganization value in excess of identifiable assets is treated as goodwill in accordance with Statement of Financial Accounting Standards (SFAS) No. 142,Goodwill and Other Intangible Assets,and is evaluated by management for impairment annually. No impairment existed as of April 30, 2005 and 2004.
7. Property, Plant and Equipment
Property, plant and equipment, which include capital leases, is stated at cost. Depreciation and amortization is provided over the estimated useful lives of the individual assets using the straight-line method. The useful lives of the property and equipment range from three to twenty-five years. Significant renewals and betterments are capitalized; costs of maintenance and repairs are charged to expense as incurred. Equipment under capital leases is amortized over the shorter of the life of the lease or asset life.
8. Income Taxes
Deferred tax assets and liabilities are recognized for the estimated future tax consequences attributable to differences between the financial statement carrying amounts of existing assets and
F-8
Table of Contents
Sheffield Steel Corporation and Subsidiary
Notes to Consolidated Financial Statements-(continued)
April 30, 2005, 2004 and 2003
(In thousands)
(April 30, 2003 unaudited)
liabilities and their respective tax bases. Deferred tax assets and liabilities are measured using enacted tax rates in effect for the year in which those temporary differences are expected to be recovered or settled. The effect on deferred tax assets and liabilities of a change in tax rates is recognized in income in the period that includes the enactment date.
9. Pension and Other Post-retirement Plans
The Company has defined benefit pension plans covering the hourly employees at Sand Springs and Joliet and the salaried employees at Sand Springs. The benefits are based on years of service and the employee’s compensation during the highest five of the last ten years before retirement.
The Company also sponsors a defined benefit health care plan for retirees and employees in Sand Springs. Sheffield measures the costs of this obligation based on the Company’s best estimate. The net periodic costs are recognized as employees render the services necessary to earn the post-retirement benefits.
10. Environmental Compliance Costs
Sheffield accrues for losses associated with environmental remediation obligations when such losses are probable and reasonably estimable. Accruals for estimated losses from environmental remediation obligations generally are recognized no later than completion of the remedial feasibility study. Such accruals are adjusted as further information develops or circumstances change. Environmental remediation costs have not had a material impact on the Company’s financial position, results of operations, or liquidity.
11. Revenue Recognition
Revenues from sales are recognized when title passes to the customer, which occurs when products are shipped. Raw material surcharges per ton are calculated based on the monthly Metal Market for Chicago #1 Heavy Melt and are included on the sales invoice on a per ton basis. There are no customer acceptance provisions and customer returns are resolved on a case-by-case basis. Customer returns were 0.05%, 0.08% and 0.5% of sales for the periods ended April 30, 2005, 2004, and 2003 respectively, and were recognized at the time the expense was incurred, except for a quality reserve at Joliet which is established at each year end and subsequently charged with prior year quality issues.
Railway revenue on inbound and outbound shipments is recognized upon delivery to either the interchange or the end user. Revenues for demurrage, equipment rental and switching are recognized at the time of service.
12. Use of Estimates
The preparation of financial statements in conformity with accounting principles generally accepted in the United States of America requires the Company to make estimates and assumptions that affect the amounts reported. The Company believes that these estimates are reasonable and proper; however, actual results could differ from estimates.
13. Asset Impairment
Sheffield periodically evaluates the carrying value of long-lived assets when events and circumstances warrant such a review. A long-lived asset is considered impaired when the anticipated undiscounted future cash flows from a logical grouping of assets is less than its carrying value. In that event, the Company recognizes a loss equal to the amount by which the carrying value exceeds the fair market value of assets. No impairments were recorded for the years ended April 30, 2005 and 2004.
14. Recently Issued Accounting Standards
In November 2002, the FASB issued Financial Interpretation No. 45,Guarantor’s Accounting and Disclosure Requirements for Guarantees, Including Indirect Guarantees of Indebtedness of Others (FIN 45).
F-9
Table of Contents
Sheffield Steel Corporation and Subsidiary
Notes to Consolidated Financial Statements-(continued)
April 30, 2005, 2004 and 2003
(In thousands)
(April 30, 2003 unaudited)
FIN 45 expands the existing disclosure requirements for guarantees and requires that companies recognize a liability for guarantees issued after December 31, 2002. The implementation of FIN 45 did not have an impact on Sheffield Steel Corporation’s financial position or results of operations.
In 2003, the FASB issued FASB Staff Position (FSP) 106-1,Accounting and Disclosure Requirements Related to the Medicare Prescription Drug, Improvement and Modernization Act of 2003. The Medicare Prescription Drug, Improvement and Modernization Act of 2003 (the Act) provides a federal subsidy to sponsors of retiree health care benefit plans that provide a benefit that is at least actuarially equivalent to the Act. Any measures of the AMBO or net periodic post-retirement benefit cost provided in these financial statements and accompanying notes to the financial statements, do not reflect the effects of the Act.
In 2004, the FASB issued (FSP) FAS 106-2,Accounting and Disclosure Requirements related to the Medicare Prescription Drug Improvement and Modernization Act of 2003, which supersedes (FSP) FAS 106-1. The FSP is effective for the Company’s first interim or annual period beginning after June 15, 2004 and did not have a financial impact on the Company for the fiscal year ended April 30, 2005.
In January of 2003, the Financial Accounting Standards Board (“FASB”) issuedFinancial Interpretation No. 46 Consolidation of Variable Interest Entities - An Interpretation of ARB No. 51(FIN 46). In December 2003, the FASB issued FIN 46R, which clarified certain issues identified in FIN 46. FIN 46R requires an entity to consolidate a variable interest entity if the entity is designated as the primary beneficiary of that variable interest entity even if the entity does not have a majority of voting interest. A variable interest entity is generally defined as an entity where its equity is unable to finance its activities or where the owners of the entity lack the risk and rewards of ownership. The provisions of this statement apply at inception of any entity created after January 31, 2003. For an entity created before February 1, 2003, the provisions of this interpretation must be applied at the beginning of the first interim or annual period beginning after March 15, 2004. The implementation of FIN 46 did not have an impact on Sheffield’s financial position or results of operations.
In May 2003, the FASB issued Statement No. 150,Accounting for Certain Financial Instruments with Characteristics of both Liabilities and Equity(SFAS 150). SFAS 150 establishes standards for how an issuer classifies and measures certain financial instruments with characteristics of both liabilities and equity. It requires that an issuer classify a financial instrument that is within the scope of SFAS 150 as a liability (or an asset in some circumstances). This statement is effective for financial instruments entered into or modified after May 31, 2003, and otherwise is effective at the beginning of the first interim period beginning after June 15, 2003. Sheffield adopted the provisions of SFAS 150 as of September 1, 2003. The adoption did not have a material impact on Sheffield’s consolidated financial position or results of operations.
15. Advertising Costs
All advertising costs of the Company are expensed as incurred. Advertising expenses totaled approximately $23, $28 and $20 for the periods ended April 30, 2005, 2004 and 2003, respectively.
16. Shipping and Handling
Internal shipping and handling costs and costs associated with inbound freight are included in inventory or cost of sales. Shipping costs charged to customers are recorded as revenue and the associated costs incurred are recorded as cost of goods sold.
F-10
Table of Contents
Sheffield Steel Corporation and Subsidiary
Notes to Consolidated Financial Statements-(continued)
April 30, 2005, 2004 and 2003
(In thousands)
(April 30, 2003 unaudited)
17. Accrued and Other Long-Term Liabilities as of April 30,
| 2005 | 2004 | |||||
Accrued Liabilities | ||||||
Workers Compensation | $ | 1,272 | $ | 1,210 | ||
Pension Benefit Obligation | 3,038 | 4,731 | ||||
Vacation Accrual | 1,424 | 1,000 | ||||
Bankruptcy Accrual | — | 662 | ||||
Bonus and Profit Sharing Accrual | 4,930 | 1,010 | ||||
Other | 3,356 | 2,845 | ||||
Total | $ | 14,020 | $ | 11,458 | ||
Other Long-Term Liabilities | ||||||
Pension Benefit Obligation | 10,638 | 8,950 | ||||
Other | 12 | 45 | ||||
Total | $ | 10,650 | $ | 8,995 | ||
18. Planned Maintenance Activities
Annually, the Company shuts down the plant for planned major maintenance activities. The Company accrues for these planned major maintenance activities costs throughout the year. These costs include estimated costs for material, labor, supplies and contractor assistance for (i) repairs to furnace refractories, (ii) maintenance on transformers and (iii) work on other equipment.
The costs associated with the major maintenance activities were accrued as follows:
| Year Ended April 30, | ||||||||
| 2005 | 2004 | |||||||
Beginning Balance | $ | — | $ | — | ||||
Accrued Planned Major Maintenance Costs | 1,835 | 1,521 | ||||||
Planned Major Maintenance Costs Paid | (1,835 | ) | (1,521 | ) | ||||
Ending Balance | $ | — | $ | — | ||||
19. Segment and Product Revenue Information
The Company provides steel products and services to the steel manufacturing and fabricating industry and therefore believes that all of the business activities from which it earns revenues and incurs expenses are from a single segment. The products produced, production processes, customers and methods of distribution are of a similar nature throughout the Company. The chief operating decision maker of the Company does not make decisions that affect the Company based on discrete financial information with respect to products or production facilities. The Company had consolidated sales of $296,659, $244,708 and $121,231 for the years ended April 30, 2005, 2004 and the eight and one-half months ended April 30, 2003, respectively. None of these sales were outside the United States. The Company sells its products through its own sales force and, to a limited extent, through sales agencies. All of Sheffield’s assets are located in the United States. The Company had one customer that accounted for approximately 8%, 11% and 11 % of sales for the years ended April 30, 2005, 2004 and the eight and one-half months ended April 30, 2003, respectively.
F-11
Table of Contents
Sheffield Steel Corporation and Subsidiary
Notes to Consolidated Financial Statements-(continued)
April 30, 2005, 2004 and 2003
(In thousands)
(April 30, 2003 unaudited)
The following table sets forth the Company’s revenues by product line:
| Year ended April 30, | Eight and One-Half Months Ended April 30, 2003 | ||||||||
| 2005 | 2004 | ||||||||
Billets | $ | 4,047 | $ | 661 | $ | 2,922 | |||
Mill Bars (1) | 228,843 | 189,847 | 87,050 | ||||||
Fabricated Products | 47,158 | 37,585 | 21,399 | ||||||
Total Product Revenues | $ | 280,048 | $ | 228,093 | $ | 111,371 | |||
| (1) | Consists of hot rolled bars and rebar. |
The table above does not include revenues of the Railway, which were $2,672, $2,833 and $2,622 for the years ended April 30, 2005, 2004 and the eight and one-half months ended April 30, 2003, respectively.
20. Stock Based Compensation
Sheffield granted 250,000 shares of restricted stock to certain members of senior management and the Board of Directors in December 2003. As the Company had recently emerged from bankruptcy and the market conditions in the steel industry at the time of issuance were depressed and volatile, the fair value of the restricted stock was determined by the Board of Directors to be $0.01 per share. A portion of these awards vested on December 3, 2003, the grant date, with the remaining awards vesting on August 14, 2004. The Company used the fair value method to account for stock based employee compensation. The Company recorded the entire $2 of compensation expense in the statement of operations on the grant date and thus no unearned compensation existed.
21. Reclassifications
Certain amounts in 2003 and 2004 have been reclassified to conform to 2005. These reclassifications have no impact on net income (loss) or accumulated earnings (deficit).
C. Fair Value of Financial Instruments
The Company defines the fair value of a financial instrument as the amount at which the instrument could be exchanged in a current transaction between willing parties. The carrying value of cash and cash equivalents, trade accounts receivable and trade accounts payable approximates the fair value because of the short maturity of those instruments. The carrying amounts of notes payable to banks and equipment financing companies approximate the fair value due to these debt instruments having variable interest rates similar to those that are currently available to us. The fair value of the senior secured notes at April 30, 2005 and 2004 was approximately $80,000 and $29,674, respectively.
D. Inventories
The components of inventories at April 30 are as follows:
| 2005 | 2004 | |||||
Raw materials | $ | 15,236 | $ | 11,443 | ||
Work in process | 10,748 | 5,273 | ||||
Finished goods | 27,321 | 19,193 | ||||
| $ | 53,305 | $ | 35,909 | |||
F-12
Table of Contents
Sheffield Steel Corporation and Subsidiary
Notes to Consolidated Financial Statements-(continued)
April 30, 2005, 2004 and 2003
(In thousands)
(April 30, 2003 unaudited)
E. Property, Plant and Equipment
The components of property, plant and equipment, net at April 30 are as follows:
| 2005 | 2004 | |||||||
Land and buildings | $ | 7,589 | $ | 10,620 | ||||
Machinery and equipment | 61,137 | 44,480 | ||||||
Office equipment | 1,717 | 1,617 | ||||||
Vehicles | 388 | 341 | ||||||
Construction in progress | 544 | 715 | ||||||
| 71,375 | 57,773 | |||||||
Less-accumulated depreciation | (19,338 | ) | (12,361 | ) | ||||
| $ | 52,037 | $ | 45,412 | |||||
Depreciation of property, plant and equipment charged to operations was $7,037, $6,955 and $5,694 for the periods ending April 30, 2005, 2004 and 2003, respectively. The range of estimated useful lives for determining depreciation and amortization of the major classes of assets are:
Buildings | 5-25 years | |
Machinery and equipment | 3-25 years | |
Office equipment | 3-15 years | |
Vehicles | 3 years |
Machinery and equipment is used in the plant and includes computers and electronic processing equipment, which have an estimated useful life range of 3-5 years, and other production type equipment, which has an estimated useful life range of 5-25 years.
F. Long-Term Debt
Long-term debt at April 30 is comprised of the following:
| 2005 | 2004 | |||||||
Senior secured notes, net of discount (a) | $ | — | $ | 29,674 | ||||
Senior secured notes (11 3/8% due 2011) (a) | 80,000 | — | ||||||
Working capital facility (b) | 8 | 35,802 | ||||||
Term loan (c) | — | 3,131 | ||||||
Railway term loan (d) | 3,000 | — | ||||||
Railway term loan & mortgage (d) | — | 1,198 | ||||||
Capital leases (e) | $ | 43 | $ | 440 | ||||
| $ | 83,051 | $ | 70,245 | |||||
Less current portion | (11,861 | ) | (5,910 | ) | ||||
| $ | 71,190 | $ | 64,335 | |||||
(a) Senior secured notes
In August 2004, the Company issued new notes at 11 3/8% due in 2011. The principal balance of $32,202 on the old notes was paid off and we recorded a loss of $3,534 as a result of the transaction.
The cumulative principal balance of the new notes remains at $80,000 as of April 30, 2005, as no principal payments were due through April 30, 2005. Interest is paid semi-annually. The senior secured notes are governed by the Indenture and are secured by property, plant and equipment and a second priority interest in the receivables and inventory of the Company. The indenture agreement includes a
F-13
Table of Contents
Sheffield Steel Corporation and Subsidiary
Notes to Consolidated Financial Statements-(continued)
April 30, 2005, 2004 and 2003
(In thousands)
(April 30, 2003 unaudited)
covenant which requires we make an Excess Cash Flow offer to buy back notes equal to 50% of excess cash flow for the fiscal year. Based on excess cash flow for fiscal year 2005, our offer, to be made in September 2005 will be $11,835.
The indenture defines Excess Cash Flow as “for any period, the excess of (i) Consolidated EBITDA for such period over (ii) the sum of (A) the aggregate amount of capital expenditures made in cash by the Company and its Restricted Subsidiaries during such period (other than any such capital expenditures made with insurance or condemnation proceeds), (B) the aggregate principal amount of senior secured Indebtedness of the Company and its Restricted Subsidiaries permanently repaid or prepaid during such period by the Company and its Restricted Subsidiaries to any Person (other than the Company or any Restricted Subsidiary), (C) the cash portion of Consolidated Interest Expense paid by the Company and its Restricted Subsidiaries during such period and (D) the aggregate amount (without duplication) of all income and franchise taxes paid in cash by the Company and its Restricted Subsidiaries.”
(b) Working capital facility
The terms of the working capital facility from The CIT Group/Business Credit, Inc. (CIT) include maximum loan availability of $15,000, interest at prime plus .50%. Our borrowing rate was 6.00% and 4.50% at April 30, 2005 and 2004, respectively. We had $15,000 availability on April 30, 2005. The facility is secured by all of the Company’s accounts receivable and inventory and expires on August 12, 2008.
(c) Term loan
As a part of issuing new notes, the Company paid off the $4,500 term loan in August 2004.
(d) Railway term loan
In April 2004, the Railway amended the credit agreement with the bank to consist of a $1,250 term loan and a $250 revolving line of credit. This note and mortgage was paid off when the new notes were issued in August 2005. A new $3,000 term loan was obtained at that time. At April 30, 2005 our borrowing rate for this loan was 6.00%. This loan is secured by all of the Company’s accounts receivable and inventory and is due on August 12, 2008.
(e) Capital leases
Capital leases are payable to financing companies and vendors related to the financing of machinery and equipment and mobile purchases. The leases are payable in monthly principal installments of approximately $2 plus interest payable at variable rates. The majority of the leases mature in fiscal year 2007 and are secured by mobile equipment.
The aggregate maturities of long-term debt for the years ended April 30, are as follows:
2006 | $ | 11,861 | |
2007 | 15 | ||
2008 | 10 | ||
2009 | 3,000 | ||
2010 | 0 | ||
Thereafter | 68,165 | ||
Total maturities | $ | 83,051 | |
Interest costs were $9,696 and $6,382 in 2005 and 2004, respectively, which included $304 and $1,045 of bond discount amortization. Various agreements contain restrictive covenants including limitations on additional borrowings, dividends and other distributions and the retirement of stock. Additionally, certain agreements require maintenance of specified performance ratios. In the event of
F-14
Table of Contents
Sheffield Steel Corporation and Subsidiary
Notes to Consolidated Financial Statements-(continued)
April 30, 2005, 2004 and 2003
(In thousands)
(April 30, 2003 unaudited)
default of the restrictive covenants or failure to maintain the specified performance measures, the lender may withdraw the credit agreements.
In July 2003, at no cost to the Company, Sheffield obtained a permanent waiver of the covenant to provide the lender a post-bankruptcy opening balance sheet and analysis of tax consequences of rescheduling and forgiveness of the indentures within 90 days under the Term Loan Agreement. The Company also received a waiver in July 2003 for a violation of the cash flow covenant of the Working Capital Facility. The Company paid an accommodation fee of $10 for the waiver, which was effective for the period ending on April 30, 2003. In June 2004, Sheffield amended the Term Loan, which included a waiver for non-compliance with the Negative Pledge, Debt and Capital Expenditures covenants of the Term Loan agreement. These violations resulted from the purchase of the office building and transloading and warehouse facility. Sheffield paid no consideration for the amendment to the Term Loan. The Term Loan was subsequently paid off with the new bonds in August 2004.
The Company’s current revolving credit facility and the indenture governing the 11 3/8% senior secured notes, each contain cross default provisions, under which an event of default under one of these instruments may give rise to an event of default under the other.
G. Income Taxes
Income taxes attributable to operations differed form the amounts computed by applying the U.S. federal income tax rate of 34% at April 30, as a result of the following:
| 2005 | 2004 | 2003 | ||||||||||
Computed “expected” tax provision (benefit) | $ | 6,753 | $ | 142 | $ | (3,668 | ) | |||||
Non deductible expenses | 12 | 6 | — | |||||||||
State income tax provision (benefit), net of federal provision (benefit) | 787 | 17 | (431 | ) | ||||||||
Change in valuation allowance | (10,144 | ) | (165 | ) | 4,099 | |||||||
Net tax benefit | $ | (2,592 | ) | $ | — | $ | — | |||||
Current income tax provision | $ | 1,394 | — | — | ||||||||
Deferred income tax benefit | (3,986 | ) | — | — | ||||||||
Net tax benefit | $ | (2,592 | ) | — | — | |||||||
The tax effects of temporary differences that gave rise to significant portions of the deferred tax assets and deferred tax liabilities are presented below at April 30: | ||||||||||||
Deductible temporary differences: | ||||||||||||
Allowance for doubtful accounts | $ | 208 | $ | 151 | $ | 206 | ||||||
Inventory | 724 | 984 | — | |||||||||
Accrued liabilities not deductible until paid | 1,386 | 1,750 | 722 | |||||||||
Post-retirement benefit costs | 11,871 | 11,618 | 11,428 | |||||||||
Pension liability | 5,192 | 4,914 | 5,149 | |||||||||
Net operating loss carryforwards | — | 1,733 | 30,623 | |||||||||
Alternative minimum tax credit carryforwards | — | 70 | 1,142 | |||||||||
Investment tax credit carryforwards | — | 2,919 | 3,506 | |||||||||
| 19,381 | 24,139 | 52,776 | ||||||||||
Less - valuation allowance | — | (14,527 | ) | (41,333 | ) | |||||||
| 19,381 | 9,612 | 11,443 | ||||||||||
Taxable temporary difference— property, plant and equipment | (14,260 | ) | (9,612 | ) | (11,443 | ) | ||||||
Net deferred tax asset | $ | 5,121 | $ | — | $ | — | ||||||
Management believes that a valuation reserve is no longer required related to the net current and long-term deferred income tax assets as it is more likely than not these assets will reduce future income tax
F-15
Table of Contents
Sheffield Steel Corporation and Subsidiary
Notes to Consolidated Financial Statements-(continued)
April 30, 2005, 2004 and 2003
(In thousands)
(April 30, 2003 unaudited)
payments of the Company. Significant factors considered by management in its determination of the probability of the realization of the deferred tax benefits include: (a) current year operating results, (b) expectation of future earnings and (c) certain tax strategies that will accelerate the realization of the assets.
H. Employee Benefit Plans
The Company has defined benefit plans that cover the hourly employees at Sand Springs and Joliet and the salaried employees at Sand Springs. Benefits are generally based on years of service and the employee’s highest compensation during five of the last ten years of employment. The Company’s funding policy is to contribute annually at least the minimum required amount.
In addition to the defined benefit pension plan, the Company also provides post-retirement health and life insurance benefits to certain retirees and their beneficiaries, generally for the remainder of their lives. The Plan is contributory, with retiree contributions adjusted periodically, and contains other cost-sharing features such deductibles, co-insurance and Medicare. The Company’s policy is to fund the accumulated post-retirement benefits on a “pay-as-you-go” basis.
Sheffield expects future benefit payments as follows:
| Pension | Other | |||
2006 | 2,542 | 1,763 | ||
2007 | 2,570 | 1,853 | ||
2008 | 2,616 | 2,006 | ||
2009 | 2,723 | 2,121 | ||
2010 | 2,828 | 2,185 | ||
Years 2011-2015 | 15,531 | 11,452 |
The following tables set forth the plan’s benefit obligations, fair value of plan assets and funded status at April 30, 2005 and 2004, respectively, as determined by an independent actuary:
| Pension Benefits | Other Benefits | |||||||||||||||
| FY 2005 | FY 2004 | FY 2005 | FY 2004 | |||||||||||||
Change in Projected Benefit Obligation | ||||||||||||||||
Benefit obligation at beginning of year | $ | 41,177 | $ | 39,210 | $ | 36,049 | $ | 33,327 | ||||||||
Service cost | 1,004 | 920 | 579 | 439 | ||||||||||||
Interest cost | 2,482 | 2,442 | 2,052 | 2,155 | ||||||||||||
Actuarial (gain)/loss, including discount rate changes | 1,954 | 1,040 | 859 | 2,333 | ||||||||||||
Benefits paid (net of participant contributions) | (2,700 | ) | (2,435 | ) | (2,555 | ) | (2,205 | ) | ||||||||
Benefit obligation at end of year | $ | 43,917 | $ | 41,177 | $ | 36,984 | $ | 36,049 | ||||||||
| The total accumulated benefit obligation for the three pension plans was $40,352 as of April 30, 2005 and $37,957 as of April 30, 2004. | ||||||||||||||||
Change in Plan Assets | ||||||||||||||||
Fair value of plan assets at beginning of year | $ | 24,277 | $ | 22,245 | $ | — | $ | — | ||||||||
Actual return on plan assets (net of expenses) | 787 | 2,208 | — | — | ||||||||||||
Employer contributions | 4,311 | 2,259 | — | — | ||||||||||||
Benefits paid | (2,700 | ) | (2,435 | ) | — | — | ||||||||||
Fair value of plan assets at end of year | $ | 26,675 | $ | 24,277 | $ | — | $ | — | ||||||||
F-16
Table of Contents
Sheffield Steel Corporation and Subsidiary
Notes to Consolidated Financial Statements-(continued)
April 30, 2005, 2004 and 2003
(In thousands)
(April 30, 2003 unaudited)
| Pension Benefits | Other Benefits | |||||||||||||||
| FY 2005 | FY 2004 | FY 2005 | FY 2004 | |||||||||||||
Reconciliation of Funded Status | ||||||||||||||||
Funded status | $ | (17,242 | ) | $ | (16,899 | ) | $ | (36,984 | ) | $ | (36,048 | ) | ||||
Unrecognized net actuarial (gain)/loss | 9,345 | 6,004 | 6,323 | 5,464 | ||||||||||||
(Accrued)/prepaid pension cost at end of year | $ | (7,897 | ) | $ | (10,895 | ) | $ | (30,661 | ) | $ | (30,584 | ) | ||||
Reconciliation of (Accrued)/Prepaid Pension Cost | ||||||||||||||||
(Accrued)/prepaid pension cost at beginning of year | $ | (10,895 | ) | $ | (11,581 | ) | $ | (30,584 | ) | $ | (30,074 | ) | ||||
Net periodic pension (cost)/credit | (1,312 | ) | (1,573 | ) | (2,632 | ) | (2,715 | ) | ||||||||
Employer contributions (net of participant contributions) | 4,310 | 2,259 | 2,555 | 2,205 | ||||||||||||
(Accrued)/prepaid pension cost at end of year | $ | (7,897 | ) | $ | (10,895 | ) | $ | (30,661 | ) | $ | (30,584 | ) | ||||
Amounts Recognized In the Statement of Financial Position Consist of: | ||||||||||||||||
Accrued benefit cost | $ | (13,677 | ) | $ | (13,680 | ) | $ | (30,661 | ) | $ | (30,584 | ) | ||||
Accumulated other comprehensive income | 5,780 | 2,785 | — | — | ||||||||||||
Net amount recognized | $ | (7,897 | ) | $ | (10,895 | ) | $ | (30,661 | ) | $ | (30,584 | ) | ||||
The Company has three pension plans: the Sand Springs Plan, Sand Springs Salaried Pension Plan and the Joliet Pension Plan. Each of these plans had a projected benefit obligation in excess of plan assets. The company expects to contribute approximately $2,315 to its pension plans in fiscal year 2006.
For measurement purposes, the assumed health care cost trend rate used for the post-retirement plan was 9.00%. The trend rate is assumed to decrease gradually to 4.50% by 2009 and remain at that level thereafter. The health care cost trend rate assumption has a significant effect on the amounts reported. The following table presents the components of the net periodic benefit cost:
|
| |||||||||||||||
| Pension Benefits | Other Benefits | |||||||||||||||
| FY 2005 | FY 2004 | FY 2005 | FY 2004 | |||||||||||||
Components of Net Periodic Benefit Cost | ||||||||||||||||
Service cost | $ | 1,004 | $ | 919 | $ | 579 | $ | 440 | ||||||||
Interest cost | 2,483 | 2,442 | 2,052 | 2,155 | ||||||||||||
Expected return on plan assets | (2,303 | ) | (1,966 | ) | — | — | ||||||||||
Amortization of net (gain)/loss | 128 | 178 | — | 121 | ||||||||||||
Net periodic pension cost | $ | 1,312 | $ | 1,573 | $ | 2,631 | $ | 2,716 | ||||||||
Assumed health care cost trend rates have a significant effect on the amounts reported for the health care plan. A one-percentage-point change in assumed health care cost trend rates would have the following effects:
| 1-Percentage -Point Increase | 1-Percentage - Point Increase | ||||
Effect of Health Care Cost Trend Rate | |||||
Effect on total of service and interest cost | 516 | (410 | ) | ||
Effect on postretirement benefit obligation | 5,813 | (4,769 | ) |
F-17
Table of Contents
Sheffield Steel Corporation and Subsidiary
Notes to Consolidated Financial Statements-(continued)
April 30, 2005, 2004 and 2003
(In thousands)
(April 30, 2003 unaudited)
The following table describes the percentage of fair value of total plan assets held by the pension plans as of April 30, 2004 and 2003, the measurement date:
| FY 2005 | FY 2004 | |||||
The Plan’s Asset Components as of April 30 Are as Follows: | ||||||
U.S. government securities | 24 | % | 15 | % | ||
Corporate bonds | 18 | % | 16 | % | ||
Equities | 56 | % | 54 | % | ||
Other | 2 | % | 15 | % | ||
Total | 100 | % | 100 | % | ||
The Plan’s assets are to be invested as a balanced portfolio consisting of equity, fixed income, cash equivalent securities and other assets in a moderately conservative manner in accordance with the maximum and minimum range for each asset category as stated below:
| Minimum | Target | Maximum | |||||||
Asset Category | |||||||||
Equity | 25 | % | 50 | % | 70 | % | |||
Fixed income | 30 | % | 40 | % | 50 | % | |||
Cash and equivalents | 0 | % | 5 | % | 20 | % | |||
Other assets including alternative investments (which will generally not be liquid) | 0 | % | 5 | % | 15 | % |
As defined in FAS 87,Employers Accounting for Pensions, assumptions used to determine the rate of return on plan assets reflect the average rate of earnings expected on the funds invested or to be invested to provide for the benefits included in the benefit obligation. Assumptions have been determined by reflecting expectations regarding future rates of return for the investment portfolio, with consideration given to the distribution of investments by asset class and historical rates of return for each individual asset class. Assumptions used are as follows:
| Pension Benefits | Other Benefits | |||||||||||
| FY 2005 | FY 2004 | FY 2005 | FY 2004 | |||||||||
Assumptions Used to Determine Benefit Obligation at April 30 | ||||||||||||
Discount rate | 5.75 | % | 6.25 | % | 5.75 | % | 6.25 | % | ||||
Compensation increases (Joliet Pension Agreement) | N/A | N/A | N/A | N/A | ||||||||
Compensation increases (Retirement Plan) | 4.00 | % | 4.00 | % | N/A | N/A | ||||||
Compensation increases (Pension Agreement Plan) | 3.00 | % | 3.00 | % | N/A | N/A | ||||||
Assumptions Used to Determine Net Periodic Benefit Cost for years ending April 30 | ||||||||||||
Discount rate | 6.25 | % | 6.25 | % | 6.25 | % | 6.25 | % | ||||
Compensation increases (Joliet Pension Agreement) | N/A | N/A | N/A | N/A | ||||||||
Compensation increases (Retirement Plan) | 4.00 | % | 4.00 | % | N/A | N/A | ||||||
Compensation increases (Pension Agreement Plan) | 3.00 | % | 3.00 | % | N/A | N/A | ||||||
Long-term rate of return on assets for fiscal year | 9.00 | % | 9.00 | % | N/A | N/A | ||||||
The Company has certain divisions that maintain defined contributions plans in which various groups of employees participate. The Company made contributions to these plans of $106 and $87 in 2005 and 2004, respectively.
In December 2003, the Medicare Prescription Drug, Improvement and Modernization Act of 2003 (MMA) was signed into law. The MMA adds a prescription drug benefit under Medicare (Medicare Part D). Additionally, retiree health care plan sponsors that provide a benefit that is at least actuarially
F-18
Table of Contents
Sheffield Steel Corporation and Subsidiary
Notes to Consolidated Financial Statements-(continued)
April 30, 2005, 2004 and 2003
(In thousands)
(April 30, 2003 unaudited)
equivalent to Medicare Part D will receive a federal subsidy. Accordingly, the Company is unable to reasonably estimate the amount or timing of any cost savings. As permitted by FASB Staff Position (FSP) FAS 106-1,Accounting and Disclosure Requirements Related to the Medicare Prescription Drug Improvement and Modernization Act of 2003,the Company has elected to defer recognizing the effects of the MMA in its post-retirement plan accounting at December 31, 2005 and 2004. This deferral will remain in effect until the issuance of authoritative accounting guidance, or until certain other events, such as a plan amendment, settlement or curtailment occur. It is possible that the specific authoritative guidance, when issued, could require the Company to update previously reported information.
I. Operating Leases
The Company is obligated under various noncancelable operating leases for certain machinery and equipment and land and buildings. These leases generally contain inflationary rent escalations and require the Company to pay all executory costs such as maintenance and insurance. Rental expense for operating leases (except those with lease terms of a month or less that were not renewed) was $1,139 in 2005. Future minimum lease payments under noncancelable operating leases (with initial or remaining lease terms in excess of one year) for the year ending April 30 are as follows:
2006 | $ | 284 | |
2007 | 276 | ||
2008 | 261 | ||
2009 | 218 | ||
2010 | 188 | ||
Thereafter | 678 | ||
| $ | 1,905 | ||
J. Workers’ Compensation
The Company is partially self-insured for certain risks consisting primarily of employee health insurance programs and workers’ compensation. Probable losses and claims are accrued as they become estimable. The Company maintains letters of credit totaling approximately $2,505 in accordance with workers’ compensation arrangements and maintains stop loss insurance policies, which limit exposure under the self-insured programs to $175 per person per year for health insurance programs and $500 per incident for workers’ compensation. The liability of $1,272 and $1,210 at April 30, 2005 and 2004, respectively, is included in other liabilities on the consolidated balance sheets.
K. Litigation Settlement
A gain of $4,793 resulting from a litigation settlement with the Company’s former owners was recognized in fiscal year 2005. This litigation related to the payment of dividends to the former owners and redemption of stock at a time when the Company was insolvent or on the verge of insolvency. The gain consisted of the following:
Cash | $ | 4,500 | ||
Note Receivable | 1,300 | |||
Payments to prepetition unsecured creditors | (1,180 | ) | ||
Fees paid | (590 | ) | ||
Decrease in bankruptcy liabilities | 763 | |||
| $ | 4,793 | |||
F-19
Table of Contents
Sheffield Steel Corporation and Subsidiary
Notes to Consolidated Financial Statements-(continued)
April 30, 2005, 2004 and 2003
(In thousands)
(April 30, 2003 unaudited)
L. Commitments and Contingencies
The Company is involved in claims and legal actions arising in the ordinary course of business. The Company believes that the ultimate disposition of these matters will not have a material adverse effect on its financial position, results of operations, or liquidity.
M. Concentration of Credit Risk
The Company’s standard credit terms are net 30 days. Management evaluates the creditworthiness of all customers quarterly and evaluates the creditworthiness of its top ten customers monthly. If management determines that a customer’s credit has deteriorated, management will put the customer on credit hold and require that the customer prepay for all future purchases. The Company does not have a policy for requiring collateral from customers for sales.
Approximately 39%, 40% and 34% of Sheffield’s sales were derived from their top ten customers for the periods ended April 30, 2005, 2004 and 2003, respectively. Their top ten customers accounted for approximately $12,534 and $12,600, or 33% and 35% of outstanding accounts receivable, at April 30, 2005 and 2004, respectively. Sales to these customers consisted of rebar, flats, squares, dowels and railroad spikes. These customers have historically paid within the payments terms established by the Company’s credit policy and management does not believe these customers pose a significant credit risk.
N. Liquidity and Management’s Plan
The Company continues to perform at improved levels. The Company generated income from operations in fiscal year 2005 sufficient to meet operating needs. The Company expects to continue to generate income from operations in fiscal year 2006 sufficient to continue to meet covenant requirements and operating needs.
O. Subsidiary Guarantor
Sheffield’s Senior Secured Notes are unconditionally guaranteed by all of Sheffield’s existing and future domestic restricted subsidiaries on a Senior Secured basis. Sheffield Steel Corporation is comprised of its operating divisions: Sheffield Steel - Sand Springs, Sheffield Steel - Joliet, Sheffield Steel - Kansas City and Waddell’s Rebar Fabricators (collectively, “Team Rebar”) and Wellington Industries (collectively, the “Parent”) and its wholly owned subsidiary Sand Springs Railway Company (the “Guarantor”).
F-20
Table of Contents
Sheffield Steel Corporation and Subsidiary
Notes to Consolidated Financial Statements-(continued)
April 30, 2005, 2004 and 2003
(In thousands)
(April 30, 2003 unaudited)
Condensed Consolidating Financial Information
Condensed consolidating financial information for the Parent and Guarantor is as follows:
| Condensed Consolidating Balance Sheet April 30, 2005 | |||||||||||||||
| Parent | Guarantor | Eliminations | Total | ||||||||||||
Assets | |||||||||||||||
Cash and cash equivalents | $ | 4,463 | $ | — | $ | — | $ | 4,463 | |||||||
Accounts receivable, net | 37,094 | 221 | — | 37,315 | |||||||||||
Inventories | 53,241 | 64 | — | 53,305 | |||||||||||
Other current assets | 3,699 | 17 | 410 | 4,126 | |||||||||||
Total current assets | 98,497 | 302 | 410 | 99,209 | |||||||||||
Property, plant and equipment | 47,364 | 4,673 | — | 52,037 | |||||||||||
Other assets, net | 10,571 | 8 | — | 10,579 | |||||||||||
Total assets | $ | 156,432 | $ | 4,983 | $ | 410 | $ | 161,825 | |||||||
Liabilities and Stockholders’ Deficit | |||||||||||||||
Current liabilities | $ | 36,276 | $ | 1,097 | $ | 410 | $ | 37,783 | |||||||
Long-term debt, less current portion | 68,174 | 3,016 | — | 71,190 | |||||||||||
Accrued post-retirement benefit costs | 30,661 | — | — | 30,661 | |||||||||||
Other liabilities | 10,650 | — | — | 10,650 | |||||||||||
Total stockholders’ equity | 10,671 | 870 | — | 11,541 | |||||||||||
Total liabilities and stockholders’ equity | $ | 156,432 | $ | 4,983 | $ | 410 | $ | 161,825 | |||||||
| Condensed Consolidating Balance Sheet April 30, 2004 | |||||||||||||||
| Parent | Guarantor | Eliminations | Total | ||||||||||||
Assets | |||||||||||||||
Cash and cash equivalents | $ | 2,810 | $ | 984 | $ | — | $ | 3,794 | |||||||
Accounts receivable, net | 35,495 | 226 | — | 35,721 | |||||||||||
Inventories | 35,843 | 66 | — | 35,909 | |||||||||||
Other current assets | 2,098 | 15 | (1,280 | ) | 833 | ||||||||||
Total current assets | 76,246 | 1,291 | (1,280 | ) | 76,257 | ||||||||||
Property, plant and equipment | 42,074 | 3,338 | — | 45,412 | |||||||||||
Other assets, net | 2,168 | 57 | — | 2,225 | |||||||||||
Total assets | $ | 120,488 | $ | 4,686 | $ | (1,280 | ) | $ | 123,894 | ||||||
Liabilities and Stockholders’ Deficit | |||||||||||||||
Current liabilities | $ | 26,677 | $ | 3,636 | $ | (1,280 | ) | $ | 29,033 | ||||||
Long-term debt, less current portion | 63,740 | 595 | — | 64,335 | |||||||||||
Accrued post-retirement benefit costs | 30,584 | — | — | 30,584 | |||||||||||
Other liabilities | 8,995 | — | — | 8,995 | |||||||||||
Total stockholders’ equity (deficit) | (9,508 | ) | 455 | — | (9,053 | ) | |||||||||
Total liabilities and stockholders’ equity | $ | 120,488 | $ | 4,686 | $ | (1,280 | ) | $ | 123,894 | ||||||
F-21
Table of Contents
Sheffield Steel Corporation and Subsidiary
Notes to Consolidated Financial Statements-(continued)
April 30, 2005, 2004 and 2003
(In thousands)
(April 30, 2003 unaudited)
| Condensed Consolidating Statements of Operations For the year ended April 30, 2005 | ||||||||||||||||
| Parent | Guarantor | Eliminations | Total | |||||||||||||
Sales, including billed freight | $ | 293,987 | $ | 4,161 | $ | (1,489 | ) | $ | 296,659 | |||||||
Cost of sales | (243,695 | ) | (1,835 | ) | — | (245,530 | ) | |||||||||
Gross profit | 50,292 | 2,326 | (1,489 | ) | 51,129 | |||||||||||
Selling, general and administrative expense | 12,720 | 458 | — | 13,178 | ||||||||||||
Depreciation and amortization expense | 6,683 | 354 | — | 7,037 | ||||||||||||
Post-retirement benefit expense other than pension | 2,621 | 13 | — | 2,634 | ||||||||||||
Operating income | 28,268 | 1,501 | (1,489 | ) | 28,280 | |||||||||||
Other (income) expense: | ||||||||||||||||
Interest expense, net | 9,527 | 150 | — | 9,677 | ||||||||||||
Other (income) expense, net | (1,259 | ) | — | — | (1,259 | ) | ||||||||||
Income before taxes | 20,000 | 1,351 | (1,489 | ) | 19,862 | |||||||||||
Income tax provision (benefit) | (2,732 | ) | 140 | — | (2,592 | ) | ||||||||||
Net income | $ | 22,732 | $ | 1,211 | $ | (1,489 | ) | $ | 22,454 | |||||||
| Condensed Consolidating Statements of Operations For the year ended April 30, 2004 | ||||||||||||||||
| Parent | Guarantor | Eliminations | Total | |||||||||||||
Sales, including billed freight | $ | 241,793 | $ | 4,258 | $ | (1,343 | ) | $ | 244,708 | |||||||
Cost of sales | (212,767 | ) | (1,852 | ) | — | (214,619 | ) | |||||||||
Gross profit | 29,026 | 2,406 | (1,343 | ) | 30,089 | |||||||||||
Selling, general and administrative expense | 12,430 | 638 | — | 13,068 | ||||||||||||
Depreciation and amortization expense | 6,628 | 327 | — | 6,955 | ||||||||||||
Post-retirement benefit expense other than pension | 2,715 | — | — | 2,715 | ||||||||||||
Operating income | 7,253 | 1,441 | (1,343 | ) | 7,351 | |||||||||||
Other (income) expense: | ||||||||||||||||
Interest expense, net | 6,905 | 30 | — | 6,935 | ||||||||||||
Net income | $ | 348 | $ | 1,411 | $ | (1,343 | ) | $ | 416 | |||||||
F-22
Table of Contents
Sheffield Steel Corporation and Subsidiary
Notes to Consolidated Financial Statements-(continued)
April 30, 2005, 2004 and 2003
(In thousands)
(April 30, 2003 unaudited)
| Condensed Consolidating Statements of Operations For the eight and one-half months ended April 30, 2003 | ||||||||||||||||
| Parent | Guarantor | Eliminations | Total | |||||||||||||
Sales, including billed freight | $ | 119,229 | $ | 2,622 | $ | (620 | ) | $ | 121,231 | |||||||
Cost of sales | (110,345 | ) | (1,182 | ) | — | (111,527 | ) | |||||||||
Gross profit | 8,884 | 1,440 | (620 | ) | 9,704 | |||||||||||
Selling, general and administrative expense | 8,310 | 506 | — | 8,816 | ||||||||||||
Depreciation and amortization expense | 5,459 | 235 | — | 5,694 | ||||||||||||
Post-retirement benefit expense other than pension | 1,671 | — | — | 1,671 | ||||||||||||
Operating income | (6,556 | ) | 699 | (620 | ) | (6,477 | ) | |||||||||
Other expense: | ||||||||||||||||
Interest expense, net | 4,210 | 54 | — | 4,264 | ||||||||||||
Other expense, net | 49 | — | — | 49 | ||||||||||||
Net (loss) income | $ | (10,815 | ) | $ | 645 | $ | (620 | ) | $ | (10,790 | ) | |||||
F-23
Table of Contents
Sheffield Steel Corporation and Subsidiary
Notes to Consolidated Financial Statements-(continued)
April 30, 2005, 2004 and 2003
(In thousands)
(April 30, 2003 unaudited)
| Condensed Consolidating Statements of Cash Flows For the year ended April 30, 2005 | |||||||||||||||
| Parent | Guarantor | Eliminations | Total | ||||||||||||
Net cash flows provided by (used in) operations | $ | 7,702 | $ | (1,072 | ) | $ | — | $ | 6,630 | ||||||
Net cash used in investing activities | (11,955 | ) | (1,708 | ) | — | (13,663 | ) | ||||||||
Net cash provided by financing activities | 5,906 | 1,796 | — | 7,702 | |||||||||||
Net increase (decrease) in cash and cash equivalents | 1,653 | (984 | ) | — | 669 | ||||||||||
Cash and cash equivalents at beginning of period | 2,810 | 984 | — | 3,794 | |||||||||||
Cash and cash equivalents at end of period | $ | 4,463 | $ | — | $ | — | $ | 4,463 | |||||||
| Condensed Consolidating Statements of Cash Flows For the year ended April 30, 2004 | |||||||||||||||
| Parent | Guarantor | Eliminations | Total | ||||||||||||
Net cash flows (used in) provided by operations | $ | (1,486 | ) | $ | 414 | $ | — | $ | (1,072 | ) | |||||
Net cash used in investing activities | (1,206 | ) | (175 | ) | — | (1,381 | ) | ||||||||
Net cash provided by financing activities | 3,035 | 629 | — | 3,664 | |||||||||||
Net increase in cash and cash equivalents | 343 | 868 | — | 1,211 | |||||||||||
Cash and cash equivalents at beginning of period | 2,467 | 116 | — | 2,583 | |||||||||||
Cash and cash equivalents at end of period | $ | 2,810 | $ | 984 | $ | — | $ | 3,794 | |||||||
| Condensed Consolidating Statements of Cash Flows For the eight and one-half months ended April 30, 2003 | |||||||||||||||
| Parent | Guarantor | Eliminations | Total | ||||||||||||
Net cash flows (used in) provided by operations | $ | (8,388 | ) | $ | 2,018 | $ | — | $ | (6,370 | ) | |||||
Net cash used in investing activities | (514 | ) | (589 | ) | — | (1,103 | ) | ||||||||
Net cash provided by (used in) financing activities | 4,545 | (1,330 | ) | — | 3,215 | ||||||||||
Net (decrease) increase in cash and cash equivalents | (4,357 | ) | 99 | — | (4,258 | ) | |||||||||
Cash and cash equivalents at beginning of period | 6,824 | 17 | — | 6,841 | |||||||||||
Cash and cash equivalents at end of period | $ | 2,467 | $ | 116 | $ | — | $ | 2,583 | |||||||
F-24
Table of Contents
REPORT OF INDEPENDENT REGISTERED PUBLIC ACCOUNTING FIRM
Board of Directors and Stockholders
Sheffield Steel Corporation
We have audited the accompanying consolidated statements of operations, stockholders’ deficit and cash flows of Sheffield Steel Corporation and subsidiaries (the “Company”) for the three and one-half months ended August 13, 2002. These financial statements are the responsibility of the Company’s management. Our responsibility is to express an opinion on these financial statements based on our audit.
We conducted our audit in accordance with the standards of the Public Company Accounting Oversight Board (United States). Those standards require that we plan and perform the audit to obtain reasonable assurance about whether the financial statements are free of material misstatement. The Company is not required to have, nor were we engaged to perform an audit of its internal control over financial reporting. Our audit included consideration of internal control over financial reporting as a basis for designing audit procedures that are appropriate in the circumstances, but not for the purpose of expressing an opinion on the effectiveness of the Company’s internal control over financial reporting. Accordingly, we express no such opinion. An audit also includes examining, on a test basis, evidence supporting the amounts and disclosures in the financial statements, assessing the accounting principles used and significant estimates made by management, as well as evaluating the overall financial statement presentation. We believe that our audit provides a reasonable basis for our opinion.
In our opinion, the financial statements referred to above present fairly, in all material respects, the results of operations and cash flows of Sheffield Steel Corporation and subsidiaries for the three and one-half months ended August 13, 2002, in conformity with accounting principles generally accepted in the United States of America.
As more fully described in the notes to the financial statements, on December 7, 2001, the Company filed a voluntary petition for reorganization under Chapter 11 of the United States Bankruptcy Code. On August 14, 2002, the Company’s reorganization was completed and the Company emerged from Chapter 11 bankruptcy. The financial statements for the three and one-half months ended August 13, 2002 do not include any adjustments that might result from the effects of applying the provision of the plan, the related financing transactions and the adoption of fresh-start accounting.
/s/ Grant Thornton LLP
Tulsa, Oklahoma
November 12, 2004
F-25
Table of Contents
Sheffield Steel Corporation and Subsidiaries
(Debtor in Possession)
Consolidated Statement of Operations
(In thousands)
| Three and One-Half Months Ended August 13, 2002 | ||||
SALES | $ | 42,055 | ||
BILLED FREIGHT | 2,566 | |||
COST OF SALES | (37,244 | ) | ||
FREIGHT COST | (2,566 | ) | ||
Gross Profit | 4,811 | |||
SELLING, GENERAL AND ADMINISTRATIVE EXPENSE | 3,952 | |||
DEPRECIATION EXPENSE | �� | 1,773 | ||
Operating loss | (914 | ) | ||
OTHER EXPENSE: | ||||
Interest expense, net | (762 | ) | ||
Reorganization expense | (1,619 | ) | ||
Net loss | $ | (3,295 | ) | |
F-26
Table of Contents
Sheffield Steel Corporation and Subsidiaries
(Debtor in Possession)
Consolidated Statement of Stockholders’ Deficit
For the period from May 1, 2002 to August 13, 2002
(In thousands)
| Common Stock | Contributed Capital | Accumulated Other Comprehensive Loss | Accumulated Deficit | Total | ||||||||||||||
Balance at May 1, 2002 | $ | 34 | $ | — | $ | (4,722 | ) | $ | (73,491 | ) | $ | (78,179 | ) | |||||
Net loss | — | — | — | (3,295 | ) | (3,295 | ) | |||||||||||
Balance at August 13, 2002 | $ | 34 | $ | — | $ | (4,722 | ) | $ | (76,786 | ) | $ | (81,474 | ) | |||||
The accompanying notes are an integral part of these consolidated financial statements.
F-27
Table of Contents
Sheffield Steel Corporation and Subsidiaries
(Debtor in Possession)
Consolidated Statement of Cash Flows
(In thousands)
| Three and One-Half Months Ended August 13, 2002 | ||||
CASH FLOWS FROM OPERATING ACTIVITIES: | ||||
Net loss | $ | (3,295 | ) | |
Adjustments to reconcile net loss to net cash used in operating activities- | ||||
Depreciation | 1,773 | |||
Bad-debt expense | 505 | |||
Changes in assets and liabilities- | ||||
Accounts receivable | (584 | ) | ||
Inventories | (3,893 | ) | ||
Prepaid expenses and other | 1,469 | |||
Other assets | 1,209 | |||
Accounts payable | 1,197 | |||
Accrued interest payable | (1 | ) | ||
Accrued liabilities | 129 | |||
Other liabilities | (216 | ) | ||
Net cash provided by (used in) operating activities | (1,707 | ) | ||
CASH FLOWS FROM INVESTING ACTIVITIES: | ||||
Capital expenditures | (559 | ) | ||
CASH FLOWS FROM FINANCING ACTIVITIES: | ||||
Increase in long-term debt | 139 | |||
NET DECREASE IN CASH AND CASH EQUIVALENTS | (2,127 | ) | ||
CASH AND CASH EQUIVALENTS, beginning of period | 4,468 | |||
CASH AND CASH EQUIVALENTS, end of period | $ | 2,341 | ||
The accompanying notes are an integral part of these consolidated financial statements.
F-28
Table of Contents
Sheffield Steel Corporation and Subsidiaries
(Debtor in Possession)
Notes to Consolidated Financial Statements
For the three months ended August 13, 2002
(in thousands)
(1) Reorganization Under Chapter 11
On December 7, 2001, Sheffield Steel Corporation and two of its wholly owned subsidiaries (collectively, the Debtors) filed voluntary petitions for reorganization under Chapter 11 of the United States Bankruptcy Code (the Code) in the United States Bankruptcy Court for the Northern District of Oklahoma (the Court). The wholly owned subsidiary that did not file for Chapter 11 reorganization is not material in relation to Sheffield’s consolidated financial position and results of operations. Sheffield continues to manage its properties and operate its businesses under Sections 1107 and 1108 of the Code as a debtor-in-possession. This raises substantial doubt about the Company’s ability to continue as a going concern.
These consolidated financial statements have been prepared in conformity with accounting principles generally accepted in the United States of America on a going concern basis, which contemplates continuity of operations, realization of assets and payment of liabilities. This basis contemplates the continuation of operations, realization of assets and discharge of liabilities in the ordinary course of business. The financial statements also present the assets of the Company at historical cost and reflect the intention that they will be realized as a going concern and in the normal course of business. The implementation of the Plan will materially change certain amounts currently disclosed in the accompanying financial statements. Under bankruptcy law, actions by creditors to collect indebtedness owed by the Debtors prior to December 7, 2001 (pre-petition) are stayed and certain other pre-petition contractual obligations may not be enforced against the Debtors. As of April 30, 2002, pre-petition claims are carried at face value in the financial statements. The accompanying financial statements do not present the amounts which will ultimately be assigned to assets and amounts paid to settle liabilities and contingencies in accordance with the Plan. Subsequent to year end, Sheffield completed a standalone plan of reorganization and emerged from Chapter 11 bankruptcy as of August 14, 2002.
Significant provisions of the plan of reorganization approved on August 14, 2002 are as follows:
| • | Forgiveness of debt of $110,000 plus accrued interest on the first mortgage bonds, in exchange for 100% of the equity in Sheffield Steel Corporation and $30,000 of new senior secured notes. |
| • | Unsecured liabilities totaling $33,500 will be settled for $1,500. |
| • | Sheffield Steel Corporation entered into a new $35,000 working capital facility and a new $4,500 term loan. |
| • | Upon emergence, Waddell’s Rebar Fabricators, Inc. and Wellington Industries, Inc. have been consolidated into new Sheffield Steel Corporation. |
These consolidated financial statements have been prepared in accordance with AICPA’s Statement of Position 90-7,Financial Reporting by Entities in Reorganization Under the Bankruptcy Code(SOP 90-7). SOP 90-7 provides for segregating pre-petition liabilities that are subject to compromise identifying all transactions and events that are directly associated with the reorganization of the Debtors and discontinuing interest accrual on unsecured or undersecured debt.
Except for secured debt and capital lease obligations, all recorded pre-petition liabilities of the Debtors have been classified as liabilities subject to compromise. The Court authorized, but did not require, payments of certain pre-petition wages, employee benefits and other obligations. Claims classified as liabilities subject to compromise at April 30, 2002 are as follows:
| April 30, 2002 | |||
Other long-term liabilities | $ | 3,153 | |
First mortgage notes | 110,000 | ||
Accrued interest payable | 11,791 | ||
Accounts payable | 13,234 | ||
Total | $ | 138,178 | |
F-29
Table of Contents
Sheffield Steel Corporation and Subsidiary
Notes to Consolidated Financial Statements-(continued)
For the three month period ended August 13, 2002
(in thousands)
For the three and one-half months ended August 13, 2002, the Company recorded $1,619 of reorganization expenses relating primarily to legal, consulting and accounting costs.
The Company did not record interest totaling approximately $3.6 million on undersecured first mortgage notes that was subject to compromise for the three and one-half months ended August 13, 2002.
The Company will adopt, as of the effective date of the Plan, fresh-start accounting pursuant to SOP 90-7. Under fresh-start accounting, the reorganization fair value of the Company is allocated to the entity’s assets, the Company’s accumulated deficit is eliminated, and the equity in the new company is issued according to the Plan.
As a result of adopting fresh-start accounting and emerging from Chapter 11 status, the Company’s financial statements will not be comparable with those prepared before the Plan was consummated, including the accompanying financial statements.
(2) Summary of Significant Accounting Policies
(a) Organization and Nature of Business
The consolidated financial statements of Sheffield Steel Corporation (the Company, which may be referred to as we, us, or our) include the accounts of its divisions, Sheffield Steel-Sand Springs (Sand Springs), Sheffield Steel-Kansas City (Kansas City) and Sheffield Steel-Joliet (Joliet) and its wholly owned subsidiaries, Waddell’s Rebar Fabricators, Inc. (Waddell), Wellington Industries, Inc. (Wellington) and Sand Springs Railway Company (the Railway). HMK Enterprises, Inc. (HMK) owns approximately 95% of our currently issued and outstanding common stock. All material intercompany transactions and balances have been eliminated in consolidation.
Our primary business is the production of concrete reinforcing bar, fence posts and a range of hot rolled bar products including rounds, flats and squares. We operate in an economic environment wherein the commodity nature of both our products for sale and our primary raw materials cause sales prices and purchase costs to fluctuate, often on a short-term basis, due to the worldwide supply and demand situation for those commodities.
The supply and demand factors for our products for sale and the supply and demand factors for our primary raw materials correlate to a degree, but are not necessarily the same. Therefore, margins between sales price and production costs can fluctuate significantly on a short-term basis. We grant credit to customers under normal industry standards and terms. We have established policies and procedures that allow for proper evaluation of each customer’s creditworthiness as well as general economic conditions. Consequently, an adverse change in those factors could affect our estimate of bad debts.
(b) Cash Equivalents
We consider all highly liquid debt instruments with original maturities of three months or less to be cash equivalents.
(c) Accounts Receivable
We grant credit to customers on standard industry terms of net 30 days. At August 13, 2002, accounts receivable were outstanding an average of 45 days. This variance from our typical credit terms is largely a result of the practice of several larger customers to pay upon receipt of monthly statements summarizing the previous month’s invoices, resulting in payment for invoices issued early in the previous month to be made outside of the 30 day credit period. The variance also is a result of our government contractor customers who pay us only after they receive payment from the government, which occurs outside of the 30 day credit period. Finally, the variance is also due in part to customers purchasing products that require further processing from third-party vendors paying us only after the customer
F-30
Table of Contents
Sheffield Steel Corporation and Subsidiary
Notes to Consolidated Financial Statements-(continued)
For the three month period ended August 13, 2002
(in thousands)
receives the finished product from those vendors, which may occur outside the 30 day credit period. At August 13, 2002 50% of accounts receivable were outstanding 30 days or more and, of these, approximately 53% were outstanding 60 days or less.
We have policies and procedures in place to evaluate the collectibility of customer accounts and to estimate bad debts based on each customer’s creditworthiness and general economic conditions. We evaluate all customer accounts quarterly and our top ten customer accounts monthly. However, any adverse change in the financial condition of customers could affect our estimate of bad debts.
For the three and one-half months ended August 13, 2002:
Balance, beginning of the period | $ | 576 | ||
Provision for loss on accounts receivable | 505 | |||
Accounts receivable written off, net of recoveries | (257 | ) | ||
Balance, end of period | $ | 824 | ||
(d) Inventories
Inventories are stated at the lower of cost (as determined by the first-in first-out method) or market. The cost of work-in-process and finished goods inventories is based on standards which approximate cost. Work-in-process and finished goods include direct labor and allocated overhead. Generally, we do not have obsolete inventory. Excess finished goods inventory is written down to its scrap value and can be converted into a saleable finished good.
(e) Intangible Assets
Intangible assets consist primarily of goodwill and debt issuance costs. Debt issuance costs are amortized over the term of the related indebtedness.
(f) Property, Plant and Equipment
Property, plant and equipment, which includes capitalized leases, is stated at cost. Depreciation and amortization of leased equipment is provided over the estimated useful lives of the individual assets using the straight-line method.
The range of estimated useful lives for determining depreciation and amortization of the major classes of assets are:
| Buildings | 5-25 years | |
| Machinery and equipment | 3-25 years | |
| Office equipment | 3-15 years | |
| Vehicles | 3 years |
Machinery and equipment is used in the plant and includes computers and electronic processing equipment, which have an estimated useful life range of 3-5 years, and other production type equipment, which has an estimated useful life range of 5-25 years.
(g) Income Taxes
Deferred tax assets and liabilities are recognized for the estimated future tax consequences attributable to differences between the financial statement carrying amounts of existing assets and liabilities and their respective tax bases. Deferred tax assets and liabilities are measured using enacted tax rates in effect for the year in which those temporary differences are expected to be recovered or settled.
F-31
Table of Contents
Sheffield Steel Corporation and Subsidiary
Notes to Consolidated Financial Statements-(continued)
For the three month period ended August 13, 2002
(in thousands)
The effect on deferred tax assets and liabilities of a change in tax rates is recognized in income in the period that includes the enactment date.
We are members of a group that files a consolidated income tax return with HMK (the Group). The Group’s tax-sharing agreement provides that current and deferred income taxes are determined as if each member of the Group were a separate taxpayer. All income taxes payable or receivable are due to or from HMK.
(h) Pension and Other Post-retirement Plans
We have defined benefit pension plans covering the hourly employees at Sand Springs and Joliet and the salary employees at Sand Springs. The benefits are based on years of service and the employee’s compensation during the highest five out of the last ten years before retirement. The cost of this program is being funded currently.
We also sponsor a defined benefit health care plan for retirees and employees in Sand Springs. We measure the costs of this obligation based on our best estimate. The net periodic costs are recognized as employees render the services necessary to earn the post-retirement benefits.
(i) Environmental Compliance Costs
We accrue for losses associated with environmental remediation obligations when such losses are probable and reasonably estimable. Accruals for estimated losses from environmental remediation obligations generally are recognized no later than completion of the remedial feasibility study. Such accruals are adjusted as further information develops or circumstances change. Environmental remediation costs have not had a material impact on our financial position, results of operations or liquidity.
(j) Revenue Recognition
Revenues from sales are recognized when title passes to the customer, which occurs when products are shipped. There are no customer acceptance provisions and customer returns are resolved on a case-by-case basis.
Railway revenue on inbound and outbound shipments is recognized upon delivery to either the interchange or the end user. Revenues for demurrage, equipment rental and switching are recognized at the time of service.
(k) Use of Estimates
The preparation of financial statements in conformity with generally accepted accounting principles requires us to make estimates and assumptions that affect the amounts reported. We believe that these estimates are reasonable and proper; however, actual results could differ from our estimates.
(l) Stock Option Plan
We adopted SFAS No. 123,Accounting for Stock-Based Compensationwhich permits, but does not require, a fair value based method of accounting for stock-based employee compensation. Alternatively, SFAS No. 123 allows companies to continue applying the provisions of Accounting Principles Board (APB) Opinion No. 25,Accounting for Stock Issued to Employees, however, such companies are required to disclose pro forma net income and earnings per share as if the fair value based method had been applied. We have elected to apply the provisions of APB Opinion No. 25 for purposes of computing compensation expense. Consistent with the provisions of SFAS No. 123, the effect on the Company’s net loss would not be materially different from amounts reported.
F-32
Table of Contents
Sheffield Steel Corporation and Subsidiary
Notes to Consolidated Financial Statements-(continued)
For the three month period ended August 13, 2002
(in thousands)
(m) Segment and Product Revenue Information
We provide steel products and services to the steel manufacturing and fabricating industry and therefore believe that all of our business activities from which we earn revenues and incur expenses are from a single segment. The products produced, production processes, customers and methods of distribution are of a similar nature throughout the company. Our chief operating decision maker does not make decisions that affect the company based on discrete financial information with respect to products or production facilities. In the three and one-half months ended August 13, 2002 we had sales of $42,055, of which $41,651 were sales in the United States and $404 were sales in outside the United States. We sell our products in the United States and internationally through our own sales force, and to a limited extent, through sales agencies. Our assets are all located in the United States. We have one customer that accounted for approximately 11% of sales in the three and one-half months ended August 13, 2002.
The following table sets forth the Company’s revenues by product line for the three and one-half months ended August 13, 2002:
Billets | $ | 625 | |
Mill Bars (1) | 32,417 | ||
Fabricated Products | 8,621 | ||
Total Product Revenues | $ | 41,663 | |
| (1) | Consists of hot rolled bars and rebar. |
The table above does not include revenues of the Railway, which were $392.
(n) Planned Maintenance Activities
Annually, we shut down the plant for major planned maintenance activities. We accrue for these certain planned major maintenance activities costs throughout the year. These costs include estimated costs for material, labor, supplies and contractor assistance for (i) repairs to furnace refractories, (ii) maintenance on transformers and (iii) work on other electrical equipment.
The costs associated with the major maintenance activities for the three and one-half months ended August 13, 2002 were accrued as follows:
Accruals | ||||
Beginning Balance | $ | — | ||
Accrued Planned Maintenance Costs | 268 | |||
Planned Maintenance Costs Paid | (268 | ) | ||
Ending Balance | $ | — | ||
(o) New Accounting Pronouncements
During 2001 the Financial Accounting Standards Board issued Statement No. 144,Accounting for the Impairment or Disposal of Long-Lived Assets. This Statement establishes a single accounting approach for measuring impairment of long-lived assets, including a segment of a business accounted for as a discontinued operation whether sold or disposed of by other means. Sheffield adopted this Statement on January 1, 2002, and it had no financial impact.
(3) Fair Value of Financial Instruments
We define the fair value of a financial instrument as the amount at which the instrument could be exchanged in a current transaction between willing parties. The carrying value of cash and cash equivalents, trade accounts receivable and trade accounts payable approximates the fair value because of the short maturity of those instruments. The carrying amounts of notes payable to banks and an equipment
F-33
Table of Contents
Sheffield Steel Corporation and Subsidiary
Notes to Consolidated Financial Statements-(continued)
For the three month period ended August 13, 2002
(in thousands)
financing companies approximates the fair value due to these debt instruments having variable interest rates similar to those that are currently available to us.
(4) Income Taxes
Income taxes for the three and one-half months ended August 13, 2002 attributable to operations differed from the amounts computed by applying the U.S. federal income tax rate of 34% as a result of the following:
Computed “expected” tax benefit | $ | 1,120 | ||
State income taxes, net of federal benefit | 132 | |||
Change in valuation allowance | (1,252 | ) | ||
Other, net | — | |||
| $ | — | |||
A valuation allowance is required when it is more likely than not that all or a portion of the deferred tax assets will not be realized. The ultimate realization of the deferred tax assets is dependent upon future profitability. The Company has incurred losses in four of the last six years. Considering these losses and the events discussed at Note 1 — Reorganization Under Chapter 11, the Company has established a valuation allowance of $29,516 related to the deferred tax assets at April 30, 2002.
(5) Operating Leases
We are obligated under various noncancelable operating leases for certain machinery and equipment and land and buildings. These leases generally contain inflationary rent escalations and require us to pay all executory costs such as maintenance and insurance. Rental expense for operating leases (except those with lease terms of a month or less that were not renewed) was $268 for the three and one-half months ended August 13, 2002. Future minimum lease payments under noncancelable operating leases (with initial or remaining lease terms in excess of one year) for the years ending April 30, are as follows:
2003 | $ | 2,083 | |
2004 | 1,884 | ||
2005 | 1,776 | ||
2006 | 1,819 | ||
2007 | 1,764 | ||
Later Years | 2,058 | ||
| $ | 11,384 | ||
(6) Commitments and Contingencies
We are partially self-insured for certain risks consisting primarily of employee health insurance programs and workers’ compensation. Probable losses and claims are accrued as they become estimable. We maintain letters of credit totaling approximately $2,200 in accordance with workers’ compensation arrangements. We maintain stop loss insurance policies which limit our exposure under our self insured programs to $175 per person per year for health insurance programs and $500 per incident for workers’ compensation.
We are involved in claims and legal actions arising in the ordinary course of business. We believe that the ultimate disposition of these matters will not have a material adverse effect on our financial position, results of operations, or liquidity.
(7) Concentration of Credit Risk
Our standard credit terms are net 30 days. Management evaluates the creditworthiness of all customers quarterly and evaluates the creditworthiness of our top ten customers monthly. If management determines that a customer’s credit has deteriorated, management will put the customer on credit hold and
F-34
Table of Contents
Sheffield Steel Corporation and Subsidiary
Notes to Consolidated Financial Statements-(continued)
For the three month period ended August 13, 2002
(in thousands)
require that the customer prepay for all future purchases. We do not have a policy for requiring collateral from customers for sales.
Approximately 34% of our sales were derived from our top ten customers for the three and one-half months ended August 13, 2002. These same ten customers accounted for approximately $6,700 or 36% of outstanding accounts receivable, as of August 13, 2002. Historically, sales to these customers consisted of rebar. However, we have diversified the product mix sold to these customers, which now includes flats, squares and dowels. These customers have historically paid within the payments terms established by our credit policy and management does not believe these customers pose a significant credit risk.
F-35
Table of Contents
INDEX TO EXHIBITS
The exhibits below are included, either by being filed herewith or by incorporation by reference, as part of this annual report on Form 10-K. Exhibits are identified according to the number assigned to them in Item 601 of Regulation S-K. Documents that are incorporated by reference are identified by their exhibit number as set forth in the registrant’s filing from which they are incorporated by reference.
| Exhibit Number | Description of Exhibit | |
| 2.1 | Second Amended and Restated Joint Plan of Reorganization of Sheffield Steel Corporation, Waddell’s Rebar Fabricators, Inc. and Wellington Industries, Inc., dated June 7, 2002 (incorporated by reference from exhibit 2.1 to Registration Statement on Form S-4 (File No. 333-121176) filed on March 7, 2005). | |
| 2.2 | First Amendment to Second Amended and Restated Joint Plan of Reorganization of Sheffield Steel Corporation, Waddell’s Rebar Fabricators, Inc. and Wellington Industries, Inc., dated June 22, 2002 (incorporated by reference from exhibit 2.2 to Registration Statement on Form S-4 (File No. 333-121176) filed on March 7, 2005). | |
| 3.1 | Restated Certificate of Incorporation of Sheffield Steel Corporation (incorporated by reference from exhibit 3.1 to Registration Statement on Form S-4 (File No. 333-121176) filed on March 7, 2005). | |
| 3.2 | Amended and Restated Certificate of Incorporation of Sand Springs Railway Company (incorporated by reference from exhibit 3.2 to Registration Statement on Form S-4 (File No. 333-121176) filed on March 7, 2005). | |
| 3.3 | Amended and Restated Bylaws of Sheffield Steel Corporation (incorporated by reference from exhibit 3.3 to Registration Statement on Form S-4 (File No. 333-121176) filed on March 7, 2005). | |
| 3.4 | Bylaws of Sand Springs Railway Company (incorporated by reference from exhibit 3.4 Registration Statement on Form S-4 (File No. 333-121176) filed on March 7, 2005). | |
| 4.1 | Indenture, dated as of August 12, 2004, among Sheffield Steel Corporation, the Subsidiary Guarantors named therein and U.S. Bank National Association, as Trustee and Collateral Agent (incorporated by reference from exhibit 4.1 to Registration Statement on Form S-4 (File No. 333-121176) filed on March 7, 2005). | |
| 4.2 | First Supplemental Indenture, dated October 8, 2004, to Indenture, dated as of August 12, 2004, among Sheffield Steel Corporation, the Subsidiary Guarantors named therein and U.S. Bank National Association, as Trustee and Collateral Agent (incorporated by reference from exhibit 4.2 to Registration Statement on Form S-4 (File No. 333-121176) filed on March 7, 2005). | |
| 4.3 | Second Supplemental Indenture, dated March 31, 2005, to Indenture, dated as of August 12, 2004, among Sheffield Steel Corporation, the Subsidiary Guarantors named therein and U.S. Bank National Association, as Trustee and Collateral Agent (incorporated by reference from exhibit 99.1 to Current Report on Form 8-K filed on April 4, 2005). | |
| 4.4 | Security Agreement, dated August 12, 2004, among Sheffield Steel Corporation, the Guarantor named therein and U.S. Bank National Trust Association, as collateral agent (incorporated by reference from exhibit 4.4 to Registration Statement on Form S-4 (File No. 333-121176) filed on March 7, 2005). | |
| 4.5 | Intercreditor Collateral Subordination Agreement, dated August 12, 2004, among Sheffield Steel Corporation, Sand Springs Railway Company, The CIT Group/Business Credit Inc., as financing agent, and U.S. Bank National Trust Association, as collateral agent (incorporated by reference from exhibit 4.5 to Registration Statement on Form S-4 (File No. 333-121176) filed on March 7, 2005). | |
| 10.1* | Employment Agreement, dated August 13, 2004, among Sheffield Steel Corporation and James P. Nolan (incorporated by reference from exhibit 10.1 to Registration Statement on Form S-4 (File No. 333-121176) filed on March 7, 2005). | |
| 10.2* | Employment Agreement, dated August 13, 2004, among Sheffield Steel Corporation and James E. Dionisio (incorporated by reference from exhibit 10.1 to Registration Statement on Form S-4 (File No. 333-121176) filed on March 7, 2005). | |
Table of Contents
| Exhibit Number | Description of Exhibit | |
| 10.3* | Employment Agreement, dated August 13, 2004, among Sheffield Steel Corporation and Stephen R. Johnson (incorporated by reference from exhibit 10.1 to Registration Statement on Form S-4 (File No. 333-121176) filed on March 7, 2005). | |
| 10.4* | Employment Agreement, dated August 13, 2004, among Sheffield Steel Corporation and Richard Howard (incorporated by reference from exhibit 10.1 to Registration Statement on Form S-4 (File No. 333-121176) filed on March 7, 2005). | |
| 10.5 | Amended and Restated Financing Agreement, dated August 12, 2004, among Sheffield Steel Corporation, Sand Springs Railway Company, The CIT Group/Business Credit Inc. and the Lenders party thereto (incorporated by reference from exhibit 10.5 to Registration Statement on Form S-4 (File No. 333-121176) filed on March 7, 2005). | |
| 10.6 | Amended and Restated Pledge and Security Agreement, dated August 12, 2004, between Sheffield Steel Corporation and The CIT Group/Business Credit Inc., as agent (incorporated by reference from exhibit 10.6 to Registration Statement on Form S-4 (File No. 333-121176) filed on March 7, 2005). | |
| 10.7 | Pledge and Security Agreement, dated August 12, 2004, between Sands Springs Railway Company and The CIT Group/Business Credit Inc., as agent (incorporated by reference from exhibit 10.7 to Registration Statement on Form S-4 (File No. 333-121176) filed on March 7, 2005). | |
| 12** | Statement regarding Computation of Ratios. | |
| 21 | Subsidiaries of Sheffield Steel Corporation (incorporated by reference from exhibit 21.1 to Registration Statement on Form S-4 (File No. 333-121176) filed on March 7, 2005). | |
| 31.1 | Certification of Chief Executive Officer pursuant to Section 302 of the Sarbanes-Oxley Act of 2002. | |
| 31.2 | Certification of Chief Financial Officer pursuant to Section 302 of the Sarbanes-Oxley Act of 2002. | |
| 32 | Certifications pursuant to 18 U.S.C. Section 1350. | |
| * | Management contracts and compensatory plans and arrangements required to be filed as exhibits to this Form 10-K pursuant to Item 15(c). |
| ** | Filed previously. |