    As filed with the Securities and Exchange Commission on April 13, 2015
                                                            FILE NO. 333-

================================================================================

                      SECURITIES AND EXCHANGE COMMISSION
                            WASHINGTON, D.C. 20549

                               -----------------

                                   FORM S-1

                            REGISTRATION STATEMENT
                                     UNDER
                          THE SECURITIES ACT OF 1933

                               -----------------

                         LINCOLN BENEFIT LIFE COMPANY
                          (Exact Name of Registrant)

                               -----------------

         Nebraska                    6300                   470221457
     (State or Other          (Primary Standard          (I.R.S Employer
     Jurisdiction of              Industrial          Identification Number)
      Organization)          Classification Code
                                   Number)

               1221 N Street, Suite 200, Lincoln, Nebraska 68508
                                (800) 525-9287
     (Address and Phone Number of Registrant's Principal Executive Office)

                               -----------------

                                  ROBYN WYATT
                         LINCOLN BENEFIT LIFE COMPANY
                           1221 N Street, Suite 200
                               Lincoln, NE 68508
                                1-800-525-9287
                          (Name of Agent for Service)

                               -----------------

Approximate date of commencement of proposed sale to the Public: As soon as
practicable after the effective date of this registration statement.

If any of the securities being registered on this Form are to be offered on a
delayed or continuous basis pursuant to Rule 415 under the Securities Act of
1933, check the following box. [X]

If this Form is filed to register additional securities for an offering
pursuant to Rule 462(b) under the Securities Act, please check the following
box and list the Securities Act registration statement number of the earlier
effective registration statement for the same offering. [_]

If this Form is a post-effective amendment filed pursuant to Rule 462(c) under
the Securities Act, check the following box and list the Securities Act
registration statement number of the earlier effective registration statement
for the same offering. [_]

If this Form is a post-effective amendment filed pursuant to Rule 462(d) under
the Securities Act, check the following box and list the Securities Act
registration statement number of the earlier effective registration statement
for the same offering. [_]

Indicate by checkmark whether the registrant is a large accelerated filer, an
accelerated filer, a non-accelerated filer, or a smaller reporting company. See
definitions of "large accelerated filer," "accelerated filer" and "smaller
reporting company" in Rule 12b-2 of the Exchange Act.

Large accelerated filer  [_]                                                Accelerated filer          [_]

Non-accelerated filer    [X] (Do not check if a smaller reporting company)  Smaller reporting company  [_]

                               -----------------

Table of Contents

                        CALCULATION OF REGISTRATION FEE

-------------------------------------------------------------------------------------------------------------------
----------------------------------------------------------------------------------------------------------------------
                                                                       Proposed        Proposed
                                                          Amount        maximum         maximum
                                                           to be     offering price    aggregate        Amount of
         Title of securities being registered           registered    per unit(1)    offering Price  registration fee
----------------------------------------------------------------------------------------------------------------------
Deferred annuity interests and participating interests
  therein.............................................. $12,500,000      $1.00        $12,500,000          $0
-------------------------------------------------------------------------------------------------------------------
-------------------------------------------------------------------------------------------------------------------
(1)The Contract does not provide for a predetermined amount or number of units.

                               -----------------

This filing is being made under the Securities Act of 1933 to register
$12,500,000 of deferred annuity interests and participating interests therein.
The interests being registered herein are being carried over, as unsold
securities, from an existing Form S-1 registration statement of the same issuer
(#333-180374) filed on March 27, 2012. Because a filing fee of $1,433
previously was paid with respect to those securities, there is no filing fee
under this registration statement. In accordance with Rule 415(a)(6), the
offering of securities on the earlier registration statement will be deemed
terminated as of the effective date of this registration statement.

Registrant hereby amends this Registration Statement on such date or dates as
may be necessary to delay its effective date until the Registrant shall file a
further amendment which specifically states that this Registration Statement
shall thereafter become effective in accordance with Section 8(a) of the
Securities Act of 1933 or until the Registration Statement shall become
effective on such date as the Commission, acting pursuant to Section 8(a), may
determine.

Neither the Securities and Exchange Commission nor any State securities
commission has approved or disapproved of these securities or passed upon the
adequacy or accuracy of this prospectus. Any representation to the contrary is
a criminal offense.

Allstate Distributors, L.L.C. ("ADLLC") serves as distributor of the securities
registered herein. The securities offered herein are sold on a continuous
basis, and there is no specific end date for the offering. ADLLC is a
registered broker dealer under the Securities and Exchange Act of 1934, as
amended, and is a member of the Financial Industry Regulatory Authority. ADLLC
is not required to sell any specific number or dollar amount of securities, but
will use its best efforts to sell the securities offered. Commissions earned by
ADLLC are described in the notes to the insurer financial statements, under the
heading "Broker-Dealer Agreements." The prospectuses, dated as of the date
indicated therein, by which the securities registered in this Form S-1 are
described, are included in this registration statement.

================================================================================
LINCOLN BENEFIT LIFE COMPANY
Supplement Dated May 1, 2015
To the following Prospectuses, as supplemented
CONSULTANT SOLUTIONS (CLASSIC, PLUS, ELITE, SELECT) PROSPECTUS DATED MAY 1, 2015
CONSULTANT I PROSPECTUS DATED MAY 1, 2015
LBL ADVANTAGE PROSPECTUS DATED MAY 1, 2004
CONSULTANT II PROSPECTUS DATED MAY 1, 2004
PREMIER PLANNER PROSPECTUS DATED MAY 1, 2004
The following information supplements the prospectus for your variable annuity contract issued by Lincoln Benefit Life Company.
SUPPLEMENTAL INFORMATION
ABOUT LINCOLN BENEFIT LIFE COMPANY
INDEX
LINCOLN BENEFIT LIFE RISK FACTORS
This document contains “forward-looking statements” that anticipate results based on our estimates, assumptions and plans that are subject to uncertainty. These statements are made subject to the safe-harbor provisions of the Private Securities Litigation Reform Act of 1995. We assume no obligation to update any forward-looking statements as a result of new information or future events or developments.
These forward-looking statements do not relate strictly to historical or current facts and may be identified by their use of words like “plans,” “seeks,” “expects,” “will,” “should,” “anticipates,” “estimates,” “intends,” “believes,” “likely,” “targets” and other words with similar meanings. These statements may address, among other things, our strategy for growth, product development, investment results, regulatory approvals, market position, expenses, financial results, litigation and reserves. We believe that these statements are based on reasonable estimates, assumptions and plans. However, if the estimates, assumptions or plans underlying the forward-looking statements prove inaccurate or if other risks or uncertainties arise, actual results could differ materially from those communicated in these forward-looking statements.
1
In addition to the normal risks of business, we are subject to significant risks and uncertainties, including those listed below, which apply to us as an insurer and a provider of other products and financial services. These risks constitute our cautionary statements under the Private Securities Litigation Reform Act of 1995 and readers should carefully review such cautionary statements as they identify certain important factors that could cause actual results to differ materially from those in the forward-looking statements and historical trends. These cautionary statements are not exclusive and are in addition to other factors discussed elsewhere in this document, in our filings with the SEC or in materials incorporated therein by reference.
Changes in actual experience could materially affect the profitability of our business
Our product pricing includes long-term assumptions regarding investment returns, mortality, morbidity, persistency and operating costs and expenses of our business. We establish target returns for each product based upon these factors and the average amount of capital that we must hold to support in-force contracts taking into account rating agencies and regulatory requirements. Profitability emerges over a period of years depending on the nature and life of the product and is subject to variability as actual results may differ from pricing assumptions. Additionally, many of our products have fixed or guaranteed terms that limit our ability to increase revenues or reduce benefits, including credited interest, once the product has been issued.
Our profitability depends on the adequacy of investment spreads, the management of market and credit risks associated with investments, the sufficiency of premiums and contract charges to cover mortality and morbidity benefits, the persistency of policies, and the management of operating costs and expenses within anticipated pricing allowances. Legislation and regulation of the insurance marketplace and products could also affect the profitability of our business.
Changes in reserve estimates may adversely affect our operating results
The reserve for life-contingent contract benefits is computed on the basis of long-term actuarial assumptions of future investment yields, mortality, morbidity, persistency and expenses. We periodically review the adequacy of these reserves on an aggregate basis and if future experience differs significantly from assumptions, adjustments to reserves may be required which could have a material effect on our operating results.
Changes in market interest rates may lead to a significant decrease in the profitability of our spread-based products
Our ability to manage our fixed annuities is dependent upon maintaining profitable spreads between investment yields and interest crediting rates. When market interest rates decrease or remain at relatively low levels, proceeds from investments that have matured or have been prepaid or sold may be reinvested at lower yields, reducing investment spread. Lowering interest crediting rates on some products in such an environment can partially offset decreases in investment yield. However, these changes could be limited by market conditions, regulatory minimum rates or contractual minimum rate guarantees on many contracts and may not match the timing or magnitude of changes in investment yields. Decreases in the interest crediting rates offered on products could make those products less attractive, leading to changes in the level of policy loans, surrenders and withdrawals. Non-parallel shifts in interest rates, such as increases in short-term rates without accompanying increases in medium- and long-term rates, can influence customer demand for fixed annuities, which could impact the level and profitability of new customer deposits. Increases in market interest rates can also have negative effects on our business, for example by increasing the attractiveness of other investments to our customers, which can lead to increased surrenders at a time when our fixed income investment asset values are lower as a result of the increase in interest rates. This could lead to the sale of fixed income securities at a loss. For certain products, principally fixed annuity and interest-sensitive life products, the earned rate on assets could lag behind rising market yields. We may react to market conditions by increasing crediting rates, which could narrow spreads and reduce profitability on our business.
2
Changes in estimates of profitability on interest-sensitive life, fixed annuities and other investment products may adversely affect our profitability and financial condition through the amortization of Value of Business Acquired (“VOBA”)
VOBA related to interest-sensitive life, fixed annuities and other investment contracts is amortized in proportion to actual historical gross profits and estimated future gross profits (“EGP”) over the estimated lives of the contracts. The principal assumptions for determining the amount of EGP are mortality, persistency, expenses, investment returns, including capital gains and losses on assets supporting contract liabilities, interest crediting rates to contractholders, and the effects of any hedges. Updates to these assumptions (commonly referred to as “VOBA unlocking”) could adversely affect our profitability and financial condition.
We may not be able to mitigate the capital impact associated with statutory reserving requirements, potentially resulting in a return on equity below priced levels
To support statutory reserves for certain term and universal life insurance products with secondary guarantees, we currently utilize reinsurance and capital markets solutions for financing a portion of our statutory reserve requirements deemed to be non-economic. If we are not able to maintain sufficient financing as a result of market conditions or otherwise, this could result in a return on equity below priced levels.
Changes in tax laws may decrease the profitability of our products
Under current federal and state income tax law, certain of our products, primarily life insurance and annuities, receive favorable tax treatment. This favorable treatment may give certain of our products a competitive advantage over noninsurance products. Congress and various state legislatures from time to time consider legislation that would reduce or eliminate the favorable policyholder tax treatment currently applicable to life insurance and annuities. Congress and various state legislatures also consider proposals to reduce the taxation of certain products or investments that may compete with life insurance or annuities. Legislation that increases the taxation on insurance products or reduces the taxation on competing products could lessen the advantage or create a disadvantage for certain of our products making them less competitive. Such proposals, if adopted, could have a material effect on our profitability and financial condition and could result in the surrender of some existing contracts and policies. In addition, changes in the federal estate tax laws could negatively affect the demand for the types of life insurance used in estate planning.
Changes to tax law or interpretations of existing tax law could adversely affect the Company
Under the Internal Revenue Code of 1986, as amended (the “Code”), income tax payable by policyholders on investment earnings is deferred during the accumulation period of certain life insurance and annuity products. This favorable tax treatment may give certain of our products a competitive advantage over other non-insurance products. To the extent that the Code is revised to reduce the tax-deferred status of life insurance and annuity products or to increase the tax-deferred status of competing products, all life insurance companies, including us, would be adversely affected with respect to their ability to retain policyholders who have acquired such products. Depending upon grandfathering provisions, life insurance companies would be affected by the surrenders of existing annuity contracts and life insurance policies. Changes in tax law, which have reduced the federal income tax rates on corporate dividends in certain circumstances, could make the tax advantages of investing in certain life insurance or annuity products less attractive. Additionally, changes in tax law based on proposals to establish new tax-advantaged retirement and life savings plans, if enacted, could reduce the tax advantage of investing in certain life insurance or annuity products. We cannot predict what changes to tax law or interpretations of existing tax law may ultimately be enacted or whether such changes could adversely affect us.
Further acquisitions by Resolution Life, Inc. could be disruptive to our operations
On April 1, 2014, Resolution Life, Inc. acquired all of our outstanding common stock from Allstate Life Insurance Company (“ALIC”). Resolution Life, Inc. intends to acquire additional runoff books of business
3
from unrelated insurers and may seek to combine portions of the related operations with ours to recognize efficiencies. The risks and uncertainties related to these transactions include, but are not limited to:
| | • | | unanticipated difficulties and expenditures resulting from the transactions; |
| | • | | disruption of current plans and operations caused by the closing of the transactions and the transition to new management and service providers over time; |
| | • | | diversion of management time and focus from operating our business to addressing transaction integration challenges; and |
| | • | | the response of customers, agents and competitors to the closing of the transactions. |
Our failure to address these risks could cause us to incur unanticipated liabilities, impose harmful disruptions to our customer service operations and harm our business generally.
Risks Relating to Investments
We are subject to market risk and declines in credit quality which may adversely affect investment income and cause realized and unrealized losses
We are subject to the risk that we will incur losses due to adverse changes in interest rates or credit spreads. Adverse changes to these rates and spreads may occur due to changes in fiscal policy and the economic climate, the liquidity of a market or market segment, insolvency or financial distress of key market makers or participants, or changes in market perceptions of credit worthiness and/or risk tolerance.
We are subject to risks associated with potential declines in credit quality related to specific issuers or specific industries and a general weakening in the economy, which are typically reflected through credit spreads. Credit spread is the additional yield on fixed income securities above the risk-free rate (typically referenced as the yield on U.S. Treasury securities) that market participants require to compensate them for assuming credit, liquidity and/or prepayment risks. Credit spreads vary (i.e. increase or decrease) in response to the market’s perception of risk and liquidity in a specific issuer or specific sector and are influenced by the credit ratings, and the reliability of those ratings, published by external rating agencies. A decline in the quality of our investment portfolio as a result of adverse economic conditions or otherwise could cause additional realized and unrealized losses on securities.
A decline in market interest rates or credit spreads could have an adverse effect on our investment income as we invest cash in new investments that may earn less than the portfolio’s average yield. In a declining interest rate environment, borrowers may prepay or redeem securities more quickly than expected as they seek to refinance at lower rates. An increase in market interest rates or credit spreads could have an adverse effect on the value of our investment portfolio by decreasing the fair values of the fixed income securities that comprise a substantial majority of our investment portfolio.
Concentration of our investment portfolio in any particular segment of the economy may have adverse effects on our operating results and financial condition
The concentration of our investment portfolio in any particular industry, collateral type, group of related industries, geographic sector or risk type could have an adverse effect on our investment portfolio and consequently on our results of operations and financial condition. Events or developments that have a negative impact on any particular industry, group of related industries or geographic region may have a greater adverse effect on the investment portfolio to the extent that the portfolio is concentrated rather than diversified.
4
The determination of the amount of realized capital losses recorded for impairments of our investments is subjective and could materially impact our operating results and financial condition
The determination of the amount of realized capital losses recorded for impairments varies by investment type and is based on our ongoing evaluation and assessment of known and inherent risks associated with the respective asset class. Such evaluations and assessments are revised as conditions change and new information becomes available. We update our evaluations regularly and reflect changes in other-than-temporary impairments in our results of operations. The assessment of whether other-than-temporary impairments have occurred is based on our case-by-case evaluation of the underlying reasons for the decline in fair value. Our conclusions on such assessments are judgmental and include assumptions and projections of future cash flows which may ultimately prove to be incorrect as assumptions, facts and circumstances change. Furthermore, historical trends may not be indicative of future impairments and additional impairments may need to be recorded in the future.
Deteriorating financial performance impacting commercial mortgage loans, securities collateralized by residential and commercial mortgage loans, and collateralized corporate loans may lead to write-downs and impact our results of operations and financial condition
Changes in residential or commercial mortgage delinquencies, loss severities or recovery rates, declining residential or commercial real estate prices, corporate loan delinquencies or recovery rates, changes in credit or bond insurer strength ratings and the quality of service provided by service providers on securities in our portfolio could lead us to determine that write-downs are necessary in the future.
Our investment strategies may be adversely affected by developments in the financial markets
Our investment management strategies may be adversely affected by unexpected developments in the financial markets. For example, derivative contracts may result in coverage that is not as effective as intended, thereby leading to the recognition of losses without the recognition of gains expected to mitigate the losses.
The determination of the fair value of our fixed income securities is subjective and could materially impact our operating results and financial condition
In determining fair values we principally use the market approach which utilizes market transaction data for the same or similar instruments. The degree of management judgment involved in determining fair values is inversely related to the availability of market observable information. The fair value of assets may differ from the actual amount received upon sale of an asset in an orderly transaction between market participants at the measurement date. Moreover, the use of different valuation assumptions may have a material effect on the assets’ fair values. The difference between amortized cost or cost and fair value, net of deferred income taxes, certain VOBA, and certain reserves for life-contingent contract benefits, is reflected as a component of accumulated other comprehensive income in shareholder’s equity. Changing market conditions could materially affect the determination of the fair value of securities and unrealized net capital gains and losses could vary significantly.
Risks Relating to the Insurance Industry
Difficult conditions in the global economy and capital markets generally could adversely affect our business and operating results
Although the U.S. economy has recently showed signs of improvement, consumer spending and gross domestic product growth have been less robust than expected and unemployment remains historically high. Some local governments have been experiencing financial difficulties. Debates over the federal debt ceiling and the direction and long-term effects of the Federal Reserve’s quantitative easing (and the tapering of that program) continue to cause uncertainty in financial markets and the economy more broadly. In addition, concerns about the performance of international economies, especially in Europe and emerging markets, and economic conditions in
5
Asia, particularly the economies of China and Taiwan, can impact the economy and financial markets here in the United States. Concerns about the economy have also resulted in decreased lending by financial institutions to their customers and to each other.
General economic conditions could adversely affect us in the form of consumer behavior and pressure investment results. Holders of some of our interest-sensitive life insurance and annuity products may engage in an elevated level of discretionary withdrawals of contractholder funds. Our investment results could be adversely affected as deteriorating financial and business conditions affect the issuers of the securities in our investment portfolio.
Losses from legal and regulatory actions may be material to our operating results or cash flows
We are involved in various legal actions, some of which involve claims for substantial or indeterminate amounts. We are also involved in various regulatory actions and inquiries, including market conduct exams by state insurance regulatory agencies. In the event of an unfavorable outcome in one or more of these matters, the ultimate liability may be in excess of amounts currently accrued and may be material to our operating results or cash flows for a particular annual period.
We are subject to extensive regulation and potential further restrictive regulation may increase our operating costs
As an insurance company with separate accounts that are regulated as investment companies, we are subject to extensive laws and regulations. These laws and regulations are complex and subject to change. Changes may sometimes lead to additional expenses and increased legal exposure. Moreover, laws and regulations are administered and enforced by a number of different governmental authorities, each of which exercises a degree of interpretive latitude, including state insurance regulators; state securities administrators; state attorneys general; and federal agencies including the SEC, the FINRA and the U.S. Department of Justice. Consequently, we are subject to the risk that compliance with any particular regulator’s or enforcement authority’s interpretation of a legal issue may not result in compliance with another’s interpretation of the same issue, particularly when compliance is judged in hindsight. In addition, there is risk that any particular regulator’s or enforcement authority’s interpretation of a legal issue may change over time to our detriment, or that changes in the overall legal environment may, even absent any particular regulator’s or enforcement authority’s interpretation of a legal issue changing, cause us to change our views regarding the actions we need to take from a legal risk management perspective, thus necessitating changes to our practices that may, in some cases, limit our ability to grow or to improve the profitability of our business. Furthermore, in some cases, these laws and regulations are designed to protect or benefit the interests of a specific constituency rather than a range of constituencies. For example, state insurance laws and regulations are generally intended to protect or benefit purchasers or users of insurance products. In many respects, these laws and regulations limit our ability to maintain the profitability of our business.
Regulatory reforms, and the more stringent application of existing regulations, may make it more expensive for us to conduct our business
The federal government has enacted comprehensive regulatory reforms for financial services entities. As part of a larger effort to strengthen the regulation of the financial services market, certain reforms are applicable to the insurance industry, including the Federal Insurance Office (“FIO”) established within the Treasury Department.
In recent years, the state insurance regulatory framework has come under public scrutiny, members of Congress have discussed proposals to provide for federal chartering of insurance companies, and the FIO and Financial Stability Oversight Council were established. We can make no assurances regarding the potential impact of state or federal measures that may change the nature or scope of insurance and financial regulation.
6
These regulatory reforms and any additional legislative change or regulatory requirements imposed upon us in connection with the federal government’s regulatory reform of the financial services industry, and any more stringent enforcement of existing regulations by federal authorities, may make it more expensive for us to conduct our business, or limit our ability to grow.
Reinsurance may be unavailable at current levels and prices
Market conditions beyond our control impact the availability and cost of the reinsurance we may purchase. No assurances can be made that reinsurance will remain continuously available to us to the same extent and on the same terms and rates as is currently available. If we were unable to purchase reinsurance protection in amounts that we consider sufficient and at prices that we consider acceptable, we may have to accept an increase in risk exposure or seek other alternatives.
Reinsurance subjects us to the credit risk of our reinsurers and may not be adequate to protect us against losses arising from ceded insurance, which could have a material effect on our operating results
The collectability of reinsurance recoverables is subject to uncertainty arising from a number of factors, including changes in market conditions, whether insured losses meet the qualifying conditions of the reinsurance contract and whether reinsurers, or their affiliates, have the financial capacity and willingness to make payments under the terms of a reinsurance treaty or contract. Our ceded insurance risks include all new business generated in the thirty months following the closing of our acquisition by Resolution Life, Inc., which business will be entirely ceded to Allstate Life Insurance Company. Our inability to collect a material recovery from a reinsurer could have a material effect on our operating results.
Adverse capital and credit market conditions may significantly affect our ability to meet liquidity needs or our ability to obtain credit on acceptable terms
In periods of extreme volatility and disruption in the capital and credit markets, liquidity and credit capacity may be severely restricted. In such circumstances, our ability to obtain capital to fund operating expenses, financing costs, capital expenditures or acquisitions may be limited, and the cost of any such capital may be significant. Our access to additional financing will depend on a variety of factors such as market conditions, the general availability of credit, the overall availability of credit to our industry, our credit ratings and credit capacity, as well as lenders’ perception of our long- or short-term financial prospects. Similarly, our access to funds may be impaired if regulatory authorities or rating agencies take negative actions against us. If a combination of these factors were to occur, our internal sources of liquidity may prove to be insufficient and in such case, we may not be able to successfully obtain additional financing on favorable terms.
A large scale pandemic, the continued threat of terrorism or military actions may have an adverse effect on the level of claim losses we incur, the value of our investment portfolio, our competitive position, marketability of product offerings, liquidity and operating results
A large scale pandemic, the continued threat of terrorism, within the United States and abroad, or military and other actions, and heightened security measures in response to these types of threats, may cause significant volatility and losses in our investment portfolio from interest rate changes, and result in loss of life, disruptions to commerce and reduced economic activity. Some of the assets in our investment portfolio may be adversely affected by reduced economic activity caused by a large scale pandemic or the continued threat of terrorism. Additionally, a large scale pandemic or terrorist act could have a material effect on the sales, profitability, competitiveness, marketability of product offerings, liquidity, and operating results.
Changes in accounting standards issued by the Financial Accounting Standards Board or other standard-setting bodies may adversely affect our results of operations and financial condition
Our financial statements are subject to the application of generally accepted accounting principles, which are periodically revised, interpreted and/or expanded. Accordingly, we are required to adopt new guidance
7
or interpretations, or could be subject to existing guidance as we enter into new transactions, which may have a material effect on our results of operations and financial condition that is either unexpected or has a greater impact than expected. For a description of changes in accounting standards that are currently pending and, if known, our estimates of their expected impact, see Note 2 of the financial statements.
The occurrence of events unanticipated in our disaster recovery systems and management continuity planning or a support failure from external providers during a disaster could impair our ability to conduct business effectively
The occurrence of a disaster such as a natural catastrophe, an industrial accident, a terrorist attack or war, cyber attack, events unanticipated in our disaster recovery systems, or a support failure from external providers, could have an adverse effect on our ability to conduct business and on our results of operations and financial condition, particularly if those events affect our computer-based data processing, transmission, storage, and retrieval systems or destroy data. If a significant number of our managers were unavailable in the event of a disaster, our ability to effectively conduct our business could be severely compromised.
We depend heavily upon computer systems to perform necessary business functions. Despite our implementation of a variety of security measures, our computer systems could be subject to cyber attacks and unauthorized access, such as physical and electronic break-ins or unauthorized tampering. Like other companies, we have experienced threats to our data and systems, including malware and computer virus attacks, unauthorized access, system failures and disruptions. If one or more of these events occurs, it could potentially jeopardize the confidential, proprietary and other information processed and stored in, and transmitted through, our computer systems and networks, or otherwise cause interruptions or malfunctions in our operations, which could result in damage to our reputation, financial losses, litigation, increased costs, regulatory penalties and/or customer dissatisfaction or loss.
Loss of key vendor relationships or failure of a vendor to protect personal information of our customers, claimants or employees could affect our operations
We rely on services and products provided by many vendors in the United States and abroad. These include, for example, third party administrators of our policies, vendors of computer hardware and software. In the event that one or more of our vendors suffers a bankruptcy or otherwise becomes unable to continue to provide products or services, or fails to protect personal information of our customers, claimants or employees, we may suffer operational impairments and financial losses.
We may not be able to protect our intellectual property and may be subject to infringement claims
We rely on a combination of contractual rights and copyright, trademark, patent and trade secret laws to establish and protect our intellectual property. Although we use a broad range of measures to protect our intellectual property rights, third parties may infringe or misappropriate our intellectual property. We may have to litigate to enforce and protect our intellectual property and to determine its scope, validity or enforceability, which could divert significant resources and prove unsuccessful. An inability to protect our intellectual property could have a material effect on our business.
We may be subject to claims by third parties for patent, trademark or copyright infringement or breach of usage rights. Any such claims and any resulting litigation could result in significant expense and liability. If our third party providers or we are found to have infringed a third-party intellectual property right, either of us could be enjoined from providing certain products or services or from utilizing and benefiting from certain methods, processes, copyrights, trademarks, trade secrets or licenses. Alternatively, we could be required to enter into costly licensing arrangements with third parties or implement a costly work around. Any of these scenarios could have a material effect on our business and results of our operations.
8
| Item 11(a). | Description of Business |
Lincoln Benefit Life Company (referred to in this document as “we,” “Lincoln Benefit,” “our,” “us” or the “Company”) was incorporated under the laws of the State of Nebraska in 1938. Lincoln Benefit is a wholly-owned subsidiary of Resolution Life, Inc., a Delaware corporation, which is a wholly-owned, indirect subsidiary of Resolution Life L.P. (the “Limited Partnership”), a Bermuda limited partnership, and Resolution Life (Parallel) Partnership, a Bermuda-based partnership.
On April 1, 2014, Resolution Life, Inc. acquired all the outstanding capital stock in Lincoln Benefit (the “Acquisition”) from Allstate Life Insurance Company (“ALIC”). Immediately prior to the closing of the transaction, Lincoln Benefit commuted certain business previously reinsured to ALIC, including (a) all of the fixed deferred annuity, value adjusted deferred annuity and indexed deferred annuity business written by the Company that was previously reinsured to ALIC, (b) all of the life insurance business written by the Company through independent producers that was previously reinsured to ALIC, other than certain specified life business, and (c) all of the net liability of the Company with respect to the accident and health and long-term care insurance business written by the Company that was previously reinsured to ALIC ((a), (b) and (c) collectively, the “Recaptured Business”). ALIC continues to service the Recaptured Business until the servicing transitions to third party administration companies. In connection with the closing, Lincoln Benefit and ALIC entered into an Amended and Restated Reinsurance Agreement (the “ARRA”), pursuant to which ALIC continues to reinsure business that was ceded by Lincoln Benefit to ALIC before the closing, with the exception of the Recaptured Business (the “ALIC Reinsured Business”). The business reinsured under the ARRA is administered by ALIC pursuant to a new Administrative Services Agreement entered into between Lincoln Benefit and ALIC in connection with the closing (the “ASA”).
ALIC continues to reinsure all life insurance business written by Lincoln Benefit through the Allstate Financial Sales channel, all immediate annuities written by Lincoln Benefit prior to closing of the Acquisition, and certain term life policies written by Lincoln Benefit. This business will continue to be administered by ALIC under an existing administrative services agreement between Lincoln Benefit and ALIC. The Allstate Financial sales channel will continue to sell Lincoln Benefit products until they are transitioned to a new Allstate company beginning in the first quarter of 2015.
Lincoln Benefit’s variable annuity business is reinsured by ALIC under an existing reinsurance agreement between Lincoln Benefit and ALIC. In 2006, ALIC disposed of substantially all of its variable annuity business through reinsurance agreements with The Prudential Insurance Company of America, a subsidiary of Prudential Financial, Inc. and therefore mitigated this aspect of ALIC’s risk. The Company was not a direct participant of this agreement and its reinsurance agreement with ALIC remains unchanged.
We provide interest-sensitive, traditional and variable life insurance products through exclusive financial specialists. Prior to July 18, 2013, we sold interest-sensitive traditional and variable life insurance and fixed annuities, including deferred and immediate, through independent master brokerage agencies. Effective January 1, 2014, we no longer offer fixed annuities such as deferred and immediate annuities, however, we continue to accept deposits on existing policies.
We have reinsurance agreements whereby certain premiums, contract charges, interest credited to contractholder funds, contract benefits and expenses are ceded to ALIC, Lincoln Benefit Reinsurance Company (“LB Re”) and other non-affiliated reinsurers.
In our reports, we occasionally refer to statutory financial information. All domestic United States insurance companies are required to prepare statutory-basis financial statements. As a result, industry data is available that enables comparisons between insurance companies, including competitors that are not subject to the requirement to prepare financial statements in conformity with accounting principles generally accepted in the United States of America. We frequently use industry publications containing statutory financial information to assess our competitive position.
9
Lincoln Benefit is subject to extensive regulation, primarily at the state level. The method, extent and substance of such regulation varies by state but generally has its source in statutes that establish standards and requirements for conducting the business of insurance and that delegate regulatory authority to a state agency. These rules have a substantial effect on our business and relate to a wide variety of matters, including insurer solvency, reserve adequacy, insurance company licensing and examination, agent licensing, policy forms, rate setting, the nature and amount of investments, claims practices, participation in guaranty funds, transactions with affiliates, the payment of dividends, underwriting standards, statutory accounting methods, trade practices, and corporate governance.
In recent years, the state insurance regulatory framework has come under increased federal scrutiny. As part of an effort to strengthen the regulation of the financial services market, the Dodd-Frank Wall Street Reform and Consumer Protection Act (“Dodd-Frank”) was enacted in 2010. Many regulations required pursuant to this law must still be finalized, and we cannot predict what the final regulations will require but do not expect a material impact on Lincoln Benefit’s operations. Dodd-Frank also created the Federal Insurance Office (“FIO”) within the Treasury Department. The FIO monitors the insurance industry, provides advice to the Financial Stability Oversight Council, represents the U.S. on international insurance matters and studies the current regulatory system. In addition, state legislators and insurance regulators continue to examine the appropriate nature and scope of state insurance regulation. We cannot predict whether any specific state or federal measures will be adopted to change the nature or scope of the regulation of insurance or what effect any such measures would have on Lincoln Benefit.
| Item 11(b). | Description of Property |
Lincoln Benefit occupies leased office space in Lincoln, Nebraska and Rosemont, Illinois.
| Item 11(c). | Legal Proceedings |
There are no pending legal proceedings affecting the variable business. Lincoln Benefit is engaged in routine lawsuits, which, in management’s judgment, are not of material importance to its total assets or business prospects.
10
| Item 11(e). | Financial Statements and Notes to Financial Statements |
Lincoln Benefit Life Company
(A Wholly-Owned subsidiary of Resolution Life, Inc.)
Index
December 31, 2014
11
REPORT OF INDEPENDENT REGISTERED PUBLIC ACCOUNTING FIRM
To the Board of Directors and Shareholder of Lincoln Benefit Life Company:
In our opinion, the accompanying consolidated balance sheet and the related consolidated statements of operations and comprehensive income, of shareholder’s equity and of cash flows present fairly, in all material respects, the financial position of Lincoln Benefit Life Company and its subsidiary at December 31, 2014, and the results of their operations and their cash flows for the period from April 1, 2014 through December 31, 2014 in conformity with accounting principles generally accepted in the United States of America. In addition, in our opinion, Schedule I — Summary of Investments — Other than Investments in Related Parties and Schedule IV — Reinsurance (the “financial statement schedules”) present fairly, in all material respects, the information set forth therein when read in conjunction with the related consolidated financial statements. These financial statements and financial statement schedules are the responsibility of the Company’s management. Our responsibility is to express an opinion on these financial statements and financial statement schedules based on our audit. We conducted our audit of these statements in accordance with the standards of the Public Company Accounting Oversight Board (United States). Those standards require that we plan and perform the audit to obtain reasonable assurance about whether the financial statements are free of material misstatement. An audit includes examining, on a test basis, evidence supporting the amounts and disclosures in the financial statements, assessing the accounting principles used and significant estimates made by management, and evaluating the overall financial statement presentation. We believe that our audit provides a reasonable basis for our opinion.
/s/ PricewaterhouseCoopers LLP
Chicago, Illinois
April 13, 2015
12
REPORT OF INDEPENDENT REGISTERED PUBLIC ACCOUNTING FIRM
To the Board of Directors and Shareholder of
Lincoln Benefit Life Company
Lincoln, Nebraska
We have audited the accompanying Balance Sheet of Lincoln Benefit Life Company (the “Company”), an affiliate of The Allstate Corporation, as of December 31, 2013 (Predecessor’s Basis), and the related Statements of Operations and Comprehensive Income, Shareholder’s Equity, and Cash Flows for each of the two years in the period ended December 31, 2013 (Predecessor’s Basis) and for the period from January 1, 2014 through March 31, 2014 (Predecessor’s Basis). Our audits also included Schedule IV —Reinsurance for each of the two years in the period ended December 31, 2013 (Predecessor’s Basis) and for the period from January 1, 2014 through March 31, 2014 (Predecessor’s Basis). These financial statements and financial statement schedule are the responsibility of the Company’s management. Our responsibility is to express an opinion on these financial statements and financial statement schedule based on our audits.
We conducted our audits in accordance with the standards of the Public Company Accounting Oversight Board (United States). Those standards require that we plan and perform the audit to obtain reasonable assurance about whether the financial statements are free of material misstatement. The Company is not required to have, nor were we engaged to perform, an audit of its internal control over financial reporting. Our audits included consideration of internal control over financial reporting as a basis for designing audit procedures that are appropriate in the circumstances, but not for the purpose of expressing an opinion on the effectiveness of the Company’s internal control over financial reporting. Accordingly, we express no such opinion. An audit also includes examining, on a test basis, evidence supporting the amounts and disclosures in the financial statements, assessing the accounting principles used and significant estimates made by management, as well as evaluating the overall financial statement presentation. We believe that our audits provide a reasonable basis for our opinion.
In our opinion, such financial statements present fairly, in all material respects, the Balance Sheet of Lincoln Benefit Life Company as of December 31, 2013 (Predecessor’s Basis), and the results of its operations and its cash flows for each of the two years in the period ended December 31, 2013 (Predecessor’s Basis) and for the period from January 1, 2014 through March 31, 2014 (Predecessor’s Basis), in conformity with accounting principles generally accepted in the United States of America. Also, in our opinion, Schedule IV —Reinsurance for each of the two years in the period ended December 31, 2013 (Predecessor’s Basis) and for the period from January 1, 2014 through March 31, 2014 (Predecessor’s Basis), when considered in relation to the basic financial statements taken as a whole, present fairly in all material respects the information set forth therein.
/s/ Deloitte & Touche, LLP
Chicago, Illinois
April 13, 2015
13
Lincoln Benefit Life Company
(A Wholly-Owned Subsidiary of Resolution Life, Inc.)
Consolidated Balance Sheet (Successor) and Balance Sheet (Predecessor)
December 31, 2014 and December 31, 2013
($ in thousands, except par value data and share amounts)
| | | | | | | | | | |
| | | Successor
12/31/2014 | | | | | Predecessor
12/31/2013 | |
ASSETS | | | | | | | | | | |
Fixed maturities, available-for-sale, at fair value (amortized cost $9,231,856 and $284,928) | | $ | 9,390,647 | | | | | $ | 290,882 | |
Commercial mortgage loans | | | 1,115,167 | | | | | | — | |
Policy loans | | | 194,385 | | | | | | — | |
Short-term investments | | | 361,369 | | | | | | 55,959 | |
Other invested assets | | | 26,897 | | | | | | — | |
| | | | | | | | | | |
Total Investments | | | 11,088,465 | | | | | | 346,841 | |
Cash | | | 49,730 | | | | | | 5,100 | |
Accrued investment income | | | 96,408 | | | | | | — | |
Reinsurance recoverables — nonaffiliates | | | 5,694,965 | | | | | | 2,190,417 | |
Reinsurance recoverables — affiliates | | | — | | | | | | 14,518,174 | |
Valuation of business acquired | | | 231,521 | | | | | | — | |
Deposit receivable | | | 1,383,388 | | | | | | — | |
Other assets | | | 592,202 | | | | | | 83,735 | |
Separate account assets | | | 1,573,865 | | | | | | 1,700,566 | |
| | | | | | | | | | |
Total Assets | | $ | 20,710,544 | | | | | $ | 18,844,833 | |
| | | | | | | | | | |
LIABILITIES | | | | | | | | | | |
Future policy benefits and other policyholder liabilities | | $ | 6,463,964 | | | | | $ | 3,557,411 | |
Policyholders’ account balances | | | 9,829,337 | | | | | | 13,124,115 | |
Accrued expenses and other liabilities | | | 188,616 | | | | | | 112,576 | |
Modified coinsurance payable | | | 1,383,388 | | | | | | — | |
Current income tax | | | — | | | | | | 3,906 | |
Deferred income tax, net | | | 40,732 | | | | | | 2,564 | |
Other long-term debt — affiliate | | | 551,600 | | | | | | — | |
Separate account liabilities | | | 1,573,865 | | | | | | 1,700,566 | |
| | | | | | | | | | |
Total Liabilities | | $ | 20,031,502 | | | | | $ | 18,501,138 | |
| | | | | | | | | | |
Commitments and Contingent Liabilities (Note 12) | | | | | | | | | | |
SHAREHOLDER’S EQUITY | | | | | | | | | | |
Common stock, $100 par value, 30,000 shares authorized, 25,000 shares issued and outstanding | | $ | 2,500 | | | | | $ | 2,500 | |
Additional paid-in capital | | | 593,558 | | | | | | 180,000 | |
Accumulated other comprehensive income | | | 85,498 | | | | | | 3,870 | |
Retained earnings | | | (2,514 | ) | | | | | 157,325 | |
| | | | | | | | | | |
Total Shareholder’s Equity | | | 679,042 | | | | | | 343,695 | |
| | | | | | | | | | |
Total Liabilities and Shareholder’s Equity | | $ | 20,710,544 | | | | | $ | 18,844,833 | |
| | | | | | | | | | |
See Notes to the Consolidated Financial Statements
14
Lincoln Benefit Life Company
(A Wholly-Owned Subsidiary of Resolution Life, Inc.)
Consolidated Statement of Operations and Comprehensive Income (Loss) (Successor) and Statements of Operations and Comprehensive Income (Loss)(Predecessor)
For the Period from April 1, 2014 through December 31, 2014, the Period from January 1, 2014 through March 31, 2014 and the Years Ended December 31, 2013 and December 31, 2012
($ in thousands)
| | | | | | | | | | | | | | | | | | | | |
| | | Successor | | | | | | | Predecessor | |
| | | For the Period from
April 1, 2014
through December 31,
2014 | | | | | | | For the Period from
January 1, 2014
through March 31,
2014 | | | For the Year
Ended December 31,
2013 | | | For the Year
Ended December 31,
2012 | |
Revenues | | | | | | | | | | | | | | | | | | | | |
Premiums earned | | $ | 20,384 | | | | | | | $ | — | | | $ | — | | | $ | — | |
Fee income from policyholders | | | 259,169 | | | | | | | | — | | | | — | | | | — | |
Net investment income | | | 288,571 | | | | | | | | 2,350 | | | | 10,935 | | | | 11,590 | |
Realized investment gains, net | | | 46,092 | | | | | | | | 285 | | | | — | | | | 626 | |
| | | | | | | | | | | | | | | | | | | | |
Total revenues | | $ | 614,216 | | | | | | | $ | 2,635 | | | $ | 10,935 | | | $ | 12,216 | |
| | | | | | | | | | | | | | | | | | | | |
Expenses | | | | | | | | | | | | | | | | | | | | |
Policyholder benefits | | $ | 216,543 | | | | | | | $ | — | | | $ | — | | | $ | — | |
Return credited to policyholders’ account balances | | | 256,703 | | | | | | | | — | | | | — | | | | — | |
Operating and acquisition expenses | | | 96,050 | | | | | | | | — | | | | — | | | | — | |
| | | | | | | | | | | | | | | | | | | | |
Total expenses | | $ | 569,296 | | | | | | | $ | — | | | $ | — | | | $ | — | |
| | | | | | | | | | | | | | | | | | | | |
Income Before Federal Income Tax | | $ | 44,920 | | | | | | | $ | 2,635 | | | $ | 10,935 | | | $ | 12,216 | |
Federal Income Tax Expense (Benefit) | | | | | | | | | | | | | | | | | | | | |
Current | | | — | | | | | | | | 914 | | | | 3,902 | | | | 4,145 | |
Deferred | | | 14,234 | | | | | | | | 8 | | | | (77 | ) | | | 128 | |
| | | | | | | | | | | | | | | | | | | | |
Total income tax expense (benefit) | | | 14,234 | | | | | | | | 922 | | | | 3,825 | | | | 4,273 | |
| | | | | | | | | | | | | | | | | | | | |
NET INCOME | | $ | 30,686 | | | | | | | $ | 1,713 | | | $ | 7,110 | | | $ | 7,943 | |
| | | | | | | | | | | | | | | | | | | | |
Other comprehensive (loss) income, before tax | | | | | | | | | | | | | | | | | | | | |
Net unrealized investment gains (losses): | | | | | | | | | | | | | | | | | | | | |
Unrealized investment gains (losses) for the period | | $ | 131,433 | | | | | | | $ | 2,364 | | | $ | (15,281 | ) | | $ | 977 | |
Reclassification adjustment for (gains) losses included in net income | | | — | | | | | | | | 285 | | | | 1 | | | | 596 | |
| | | | | | | | | | | | | | | | | | | | |
Net unrealized investment gains (losses) | | | 131,433 | | | | | | | | 2,079 | | | | (15,282 | ) | | | 381 | |
| | | | | | | | | | | | | | | | | | | | |
Other comprehensive (loss) income, before tax | | | | | | | | | | | | | | | | | | | | |
Less: Income tax (benefit) related to: | | | | | | | | | | | | | | | | | | | | |
Unrealized investment gains (losses) for the period | | | (45,935 | ) | | | | | | | (828 | ) | | | 5,349 | | | | (343 | ) |
Reclassification adjustment for (gains) losses included in net income | | | — | | | | | | | | (100 | ) | | | — | | | | (209 | ) |
| | | | | | | | | | | | | | | | | | | | |
Net unrealized investment gains (losses) | | | (45,935 | ) | | | | | | | (728 | ) | | | 5,349 | | | | (134 | ) |
| | | | | | | | | | | | | | | | | | | | |
Other comprehensive (loss) income | | | 85,498 | | | | | | | | 1,351 | | | | (9,933 | ) | | | 247 | |
| | | | | | | | | | | | | | | | | | | | |
Comprehensive (loss) income | | $ | 116,184 | | | | | | | $ | 3,064 | | | $ | (2,823 | ) | | $ | 8,190 | |
| | | | | | | | | | | | | | | | | | | | |
See Notes to the Consolidated Financial Statements
15
Lincoln Benefit Life Company
Consolidated Statement of Shareholder’s Equity(Successor) and Statement of Shareholder’s Equity (Predecessor)
For the Period from April 1, 2014 through December 31, 2014, the Period from January 1, 2014 through March 31, 2014, and the Years Ended December 31, 2013 and December 31, 2012
($ in thousands, except par value data and share amounts)
| | | | | | | | | | | | | | | | | | | | | | | | |
| | | Common Stock | | | Additional
Paid-In
Capital | | | Retained
Earnings | | | Accumulated Other
Other Comprehensive
Income (Loss) | | | Total
Shareholder’s Equity | |
| | | | | | |
| | | | | | |
Predecessor | | Shares | | | Amount | | | | | |
Balance, December 31, 2011 | | | 25,000 | | | $ | 2,500 | | | $ | 180,000 | | | $ | 142,272 | | | $ | 13,556 | | | $ | 338,328 | |
Comprehensive income (loss) | | | | | | | | | | | | | | | | | | | | | | | | |
Net income (loss) | | | — | | | | — | | | | — | | | | 7,943 | | | | — | | | | 7,943 | |
Other comprehensive income (loss), net of tax | | | — | | | | — | | | | — | | | | — | | | | 247 | | | | 247 | |
| | | | | | | | | | | | | | | | | | | | | | | | |
Total comprehensive income (loss) | | | | | | | | | | | | | | | | | | | | | | | 8,190 | |
| | | | | | | | | | | | | | | | | | | | | | | | |
Balance, December 31, 2012 | | | 25,000 | | | $ | 2,500 | | | $ | 180,000 | | | $ | 150,215 | | | $ | 13,803 | | | $ | 346,518 | |
Comprehensive income (loss) | | | | | | | | | | | | | | | | | | | | | | | | |
Net income (loss) | | | — | | | | — | | | | — | | | | 7,110 | | | | — | | | | 7,110 | |
Other comprehensive income (loss), net of tax | | | — | | | | — | | | | — | | | | — | | | | (9,933 | ) | | | (9,933 | ) |
| | | | | | | | | | | | | | | | | | | | | | | | |
Total comprehensive income (loss) | | | | | | | | | | | | | | | | | | | | | | | (2,823 | ) |
| | | | | | | | | | | | | | | | | | | | | | | | |
Balance, December 31, 2013 | | | 25,000 | | | $ | 2,500 | | | $ | 180,000 | | | $ | 157,325 | | | $ | 3,870 | | | $ | 343,695 | |
Comprehensive income (loss) | | | | | | | | | | | | | | | | | | | | | | | | |
Net income (loss) | | | — | | | | — | | | | — | | | | 1,713 | | | | — | | | | 1,713 | |
Other comprehensive income (loss), net of tax | | | — | | | | — | | | | — | | | | — | | | | 1,351 | | | | 1,351 | |
| | | | | | | | | | | | | | | | | | | | | | | | |
Total comprehensive income (loss) | | | | | | | | | | | | | | | | | | | | | | | 3,064 | |
| | | | | | | | | | | | | | | | | | | | | | | | |
Balance, March 31, 2014 (Note 1) | | | 25,000 | | | $ | 2,500 | | | $ | 180,000 | | | $ | 159,038 | | | $ | 5,221 | | | $ | 346,759 | |
| | | | | | | | | | | | | | | | | | | | | | | | | |
| | | | | | |
Successor | | | | | | | | | | | | | | | | | | |
Balance, April 1, 2014 (Note 1) | | | 25,000 | | | $ | 2,500 | | | $ | 593,308 | | | $ | — | | | $ | — | | | $ | 595,808 | |
Dividends to shareholder | | | — | | | | — | | | | — | | | | (33,200 | ) | | | — | | | | (33,200 | ) |
Capital contribution | | | — | | | | — | | | | 250 | | | | — | | | | — | | | | 250 | |
Comprehensive income | | | | | | | | | | | | | | | | | | | | | | | | |
Net income | | | — | | | | — | | | | — | | | | 30,686 | | | | — | | | | 30,686 | |
Other comprehensive income, net of tax | | | — | | | | — | | | | — | | | | — | | | | 85,498 | | | | 85,498 | |
| | | | | | | | | | | | | | | | | | | | | | | | |
Total comprehensive income | | | | | | | | | | | | | | | | | | | — | | | | 116,184 | |
| | | | | | | | | | | | | | | | | | | | | | | | |
Balance, December 31, 2014 | | | 25,000 | | | $ | 2,500 | | | $ | 593,558 | | | $ | (2,514 | ) | | $ | 85,498 | | | $ | 679,042 | |
| | | | | | | | | | | | | | | | | | | | | | | | |
See Notes to the Consolidated Financial Statements
16
Lincoln Benefit Life Company
(A Wholly-Owned Subsidiary of Resolution Life, Inc.)
Consolidated Statement of Cash Flows (Successor) and Statements of Cash Flows (Predecessor)
For the Period from April 1, 2014 through December 31, 2014, the Period from January 1, 2014 through March 31, 2014 and the Years Ended December 31, 2013 and December 31, 2012
($ in thousands)
| | | | | | | | | | | | | | | | | | |
| | | Successor | | | | | Predecessor | |
| | | For the Period from
April 1, 2014 through
December 31, 2014 | | | | | For the Period
from January 1, 2014
through
March 31, 2014 | | | For the Year
Ended
December 31,
2013 | | | For the Year
Ended
December 31,
2012 | |
Cash flows from operating activities: | | | | | | | | | | | | | | | | | | |
Net income | | $ | 30,686 | | | | | $ | 1,713 | | | $ | 7,110 | | | $ | 7,943 | |
Adjustments to reconcile net loss to net cash: | | | | | | | | | | | | | | | | | | |
Policy charges and fee income | | | (259,169 | ) | | | | | — | | | | — | | | | — | |
Return credited to policyholders’ account balances | | | 256,703 | | | | | | — | | | | — | | | | — | |
Realized Investment gains, net | | | (46,092 | ) | | | | | (285 | ) | | | — | | | | (626 | ) |
Amortization/accretion of bond premium, net | | | 44,112 | | | | | | 94 | | | | 630 | | | | 781 | |
Amortization of value of business acquired | | | 38,987 | | | | | | — | | | | — | | | | — | |
Changes in assets and liabilities: | | | | | | | | | | | | | | | | | | |
Decrease (increase) in insurance related liabilities and policy-related balances | | | (21,964 | ) | | | | | 6,402 | | | | (6,147 | ) | | | 14,398 | |
Decrease (increase) in receivable from/payable to affiliate | | | — | | | | | | 24,358 | | | | (17,255 | ) | | | 25,752 | |
Deferred income tax expense (benefit) | | | 14,234 | | | | | | 921 | | | | (329 | ) | | | (516 | ) |
Decrease (increase) in accrued investment income | | | 6,838 | | | | | | | | | | | | | | | |
Decrease (increase) in other assets and liabilities | | | 31,780 | | | | | | (23,192 | ) | | | 16,007 | | | | (32,761 | ) |
| | | | | | | | | | | | | | | | | | |
Net cash provided by (used in) operating activities | | | 96,115 | | | | | | 10,011 | | | | 16 | | | | 14,971 | |
| | | | | | | | | | | | | | | | | | |
Cash flows from investing activities: | | | | | | | | | | | | | | | | | | |
Fixed maturities, available for sale | | | | | | | | | | | | | | | | | | |
Proceeds from sales and maturities | | | 1,844,344 | | | | | | 21,341 | | | | 62,645 | | | | 54,521 | |
Purchases | | | (1,898,874 | ) | | | | | — | | | | (38,896 | ) | | | (51,209 | ) |
Proceeds from sales and maturities of commercial mortgage loans | | | 150,849 | | | | | | — | | | | — | | | | — | |
Net purchases, sales, maturities of derivatives | | | (8,636 | ) | | | | | — | | | | — | | | | — | |
Net purchases, sales, maturities of other investments | | | 620,425 | | | | | | 55,924 | | | | (31,738 | ) | | | (11,216 | ) |
| | | | | | | | | | | | | | | | | | |
Net cash provided by (used in) investing activities | | | 708,108 | | | | | | 77,265 | | | | (7,989 | ) | | | (7,904 | ) |
| | | | | | | | | | | | | | | | | | |
Cash flows from financing activities: | | | | | | | | | | | | | | | | | | |
Policyholders’ account deposits | | | 340,128 | | | | | | — | | | | — | | | | — | |
Policyholders’ account withdrawals | | | (1,141,289 | ) | | | | | — | | | | — | | | | — | |
Dividends paid to shareholder | | | (33,200 | ) | | | | | — | | | | — | | | | — | |
Change in overdrafts | | | 39,089 | | | | | | — | | | | — | | | | — | |
Capital contribution | | | 250 | | | | | | — | | | | — | | | | — | |
| | | | | | | | | | | | | | | | | | |
Net cash provided by (used in) financing activities | | | (795,022 | ) | | | | | — | | | | — | | | | — | |
| | | | | | | | | | | | | | | | | | |
Net increase (decrease) in cash | | | 9,201 | | | | | | 87,276 | | | | (7,973 | ) | | | 7,067 | |
Cash, beginning of period | | | 40,529 | | | | | | 5,100 | | | | 13,073 | | | | 6,006 | |
| | | | | | | | | | | | | | | | | | |
Cash, end of period | | $ | 49,730 | | | | | $ | 92,376 | | | $ | 5,100 | | | $ | 13,073 | |
| | | | | | | | | | | | | | | | | | |
Supplemental schedule of cash flow information: | | | | | | | | | | | | | | | | | | |
Cash paid during the year: | | | | | | | | | | | | | | | | | | |
Income taxes paid | | $ | — | | | | | $ | — | | | $ | 4,200 | | | $ | 4,800 | |
Interest paid | | $ | 4,585 | | | | | $ | — | | | $ | — | | | $ | — | |
Commutation Agreement proceeds (see Note 1): | | | | | | | | | | | | | | | | | | |
Cash received on April 1, 2014 | | $ | — | | | | | $ | 143,348 | | | $ | — | | | $ | — | |
Cash received subsequent to April 1, 2014 | | $ | — | | | | | $ | 5,946 | | | $ | — | | | $ | — | |
Invested assets transferred | | $ | — | | | | | $ | 11,482,637 | | | $ | — | | | $ | — | |
Noncash activities | | | | | | | | | | | | | | | | | | |
Issuance of vehicle note | | $ | 513,000 | | | | | $ | — | | | $ | — | | | $ | — | |
Issuance of other long-term debt | | $ | 513,000 | | | | | $ | — | | | $ | — | | | $ | — | |
Interest income on vehicle note | | $ | 15,711 | | | | | $ | — | | | $ | — | | | $ | — | |
Interest expense on other long-term debt | | $ | 15,711 | | | | | $ | — | | | $ | — | | | $ | — | |
Increase in vehicle note and other long-term debt | | $ | 38,600 | | | | | $ | — | | | $ | — | | | $ | — | |
Increase in modified coinsurance payable and deposit receivable | | $ | 166,963 | | | | | $ | — | | | $ | — | | | $ | — | |
See Notes to the Consolidated Financial Statements
17
Lincoln Benefit Life Company
(A Wholly-Owned Subsidiary of Resolution Life, Inc.)
Notes to Consolidated Financial Statements
Lincoln Benefit Life Company (the “Company” or “Lincoln Benefit”) is a stock insurance company domiciled in the State of Nebraska. It is a wholly owned subsidiary of Resolution Life, Inc. (“Resolution”), which in turn is a wholly owned subsidiary of Resolution Life Holdings, Inc. (“Holdings”). Resolution was formed on July 2, 2013 under the General Corporation Law of the State of Delaware.
On April 1, 2014, Lancaster Re Captive Insurance Company (“Lancaster Re”), a Nebraska domiciled captive insurance company, became a wholly owned subsidiary of Lincoln Benefit when it was contributed to Lincoln Benefit by Resolution.
The Company became a wholly owned subsidiary of Resolution on April 1, 2014 after receiving all required regulatory approvals. Prior to this date, it was a wholly owned subsidiary of Allstate Life Insurance Company (“ALIC”). On July 17, 2013, Holdings executed a Stock Purchase Agreement (the “Acquisition”) to acquire 100% of the Company from ALIC. In November 2013, Holdings assigned the right to acquire all of Lincoln Benefit’s outstanding capital stock to Resolution pursuant to an Assignment Agreement. The purchase price was $595.8 million.
The Company is authorized to sell life insurance and retirement products in all states except New York, as well as in the District of Columbia, the U.S. Virgin Islands and Guam. Prior to July 18, 2013, the Company sold interest-sensitive, traditional and variable life insurance products through both exclusive agencies (“Allstate Financial Sales channel”) and independent master brokerage agencies. Effective July 17, 2013, sales through the independent master brokerage agencies ceased, and sales through the Allstate Financial sales channel will continue for a period up to 30 months after the closing date of Acquisition. We operate as a single segment entity, based on the manner in which we use financial information to evaluate business performance and to determine the allocation of resources.
On April 1, 2014, immediately prior to the Acquisition (Predecessor Period), the Company, pursuant to a Partial Commutation Agreement, recaptured all deferred annuity, long-term care, accident and health and life business sold through Lincoln Benefit’s independent master brokerage agencies, other than specified life business, previously reinsured by ALIC. The primary impacts of the Partial Commutation Agreement with ALIC were the receipt of investments, the reduction of the related reinsurance recoverable and the reestablishment of deferred acquisition costs. The Company’s assets and liabilities increased by $1.33 billion and $0.19 billion, respectively. Since the Partial Commutation Agreement occurred between entities under common control, the excess of assets received and liabilities assumed was recorded as a capital contribution through additional paid-in capital.
Additionally, Lincoln Benefit and ALIC entered into an Amended and Restated Reinsurance Agreement where ALIC continues to reinsure all life insurance business written by Lincoln Benefit through the Allstate Financial Sales channel, all immediate annuities written by Lincoln Benefit prior to closing of the Acquisition, and certain term life policies written by Lincoln Benefit. Lincoln Benefit’s variable annuity business will remain reinsured by ALIC under an existing reinsurance agreement between Lincoln Benefit and ALIC. This business will continue to be administered by ALIC under an existing administrative services agreement between Lincoln Benefit and ALIC.
18
Lincoln Benefit Life Company
(A Wholly-Owned Subsidiary of Resolution Life, Inc.)
Notes to Consolidated Financial Statements
Under the acquisition method of accounting, the assets acquired and liabilities assumed are recorded at fair value at the date of acquisition. The following table summarizes the fair values of assets acquired and liabilities assumed as of April 1, 2014:
| | | | |
($ in thousands) | |
Assets | | | | |
Fixed maturities | | $ | 9,194,903 | |
Commercial mortgage loans | | | 1,263,902 | |
Policy loans | | | 196,451 | |
Short-term investments | | | 979,728 | |
Other invested assets | | | 1,104 | |
Cash | | | 40,529 | |
Accrued investment income | | | 103,246 | |
Reinsurance recoverable | | | 5,606,879 | |
Value of business acquired | | | 290,795 | |
Deposit receivable | | | 1,550,351 | |
Intangibles | | | 5,200 | |
Other assets | | | 554,176 | |
Separate account assets | | | 1,661,007 | |
| | | | |
Total assets acquired | | | 21,448,271 | |
| | | | |
Liabilities | | | | |
Future policy benefits and other policyholder liabilities | | | 6,682,833 | |
Policyholders’ account balances | | | 10,367,246 | |
Accrued expenses and other liabilities | | | 78,026 | |
Modified coinsurance payable | | | 1,550,351 | |
Other long-term debt — affiliate | | | 513,000 | |
Separate account liabilities | | | 1,661,007 | |
| | | | |
Total liabilities assumed | | | 20,852,463 | |
| | | | |
Net assets acquired | | $ | 595,808 | |
| | | | |
Included in the assets acquired is the value of business acquired (“VOBA”), which reflects the estimated fair value of in-force contracts acquired and represents the portion of the purchase price that is allocated to the future profits embedded in the acquired contracts at the acquisition date. See Note 11 for further explanation of VOBA. The assessment of fair value in accordance with ASC 805-20-25 included the establishment of intangible assets for VOBA and various state licenses.
Basis of Presentation
The Company’s financial statements have been prepared in accordance with generally accepted accounting principles in the United States (“GAAP”). The financial statements are presented for Successor and Predecessor periods, which relate to the accounting periods after and before April 1, 2014, respectively, the date of the closing of the Acquisition. For periods after April 1, 2014, the accompanying financial statements comprise the consolidated financial statements of the Company, which include the accounts of the Company and its subsidiary. Due to the Acquisition and the application of push-down accounting, different bases of accounting have been used to prepare the Predecessor and Successor financial statements. A black line separates the Predecessor and Successor financial statements to highlight the lack of comparability between these two periods. The principal accounting policies applied in the preparation of these financial statements are set out below and in Note 2.
19
Lincoln Benefit Life Company
(A Wholly-Owned Subsidiary of Resolution Life, Inc.)
Notes to Consolidated Financial Statements
Consolidation
The accompanying consolidated financial statements of the Successor include the accounts of Lincoln Benefit and its subsidiary, Lancaster Re. All significant intercompany balances and transactions have been eliminated on consolidation.
Use of Estimates
The preparation of financial statements in conformity with GAAP requires management to make estimates and assumptions that affect the amounts reported in the financial statements and accompanying notes. Actual results could differ from those estimates.
| 2. | Significant Accounting Policies |
Cash
Cash includes cash on hand, amounts due from banks, money market securities, highly liquid overnight deposits, discount notes and commercial paper held in the ordinary course of business amounts due from banks, certain money market investments and other debt instruments with maturities of three months or less when purchased.
Investments
Fixed maturities include bonds, asset-backed securities (“ABS”) residential mortgage-backed securities (“RMBS”) and commercial mortgage-backed securities (“CMBS”). Fixed maturities, which may be sold prior to their contractual maturity, are designated as available-for-sale (“AFS”) and are carried at fair value. The difference between amortized cost and fair value, net of deferred income taxes, is reflected as a component of accumulated other comprehensive income. Cash received from calls, principal payments and make-whole payments and cash received from maturities and pay-downs are reflected as a component of proceeds from sales and maturities within the Consolidated Statement of Cash Flows — Successor and Statement of Cash Flows — Predecessor.
The Company recognizes other-than-temporary impairments (“OTTI”) for securities classified as AFS in accordance with ASC 320, Investments-Debt and Equity Securities. At least quarterly, management reviews impaired securities for OTTI. The Company considers several factors when determining if a security is OTTI, including but not limited to: its intent and ability to hold the impaired security until an anticipated recovery in value, the issuer’s ability to meet current and future principal and interest obligations for fixed maturity securities, the length and severity of the impairment, the financial condition and near term and long term prospects for the issuer. In making these evaluations, the Company exercises considerable judgment.
If the Company intends to sell or if it is more likely than not that it will be required to sell an impaired security prior to recovery of its cost basis, then the Company recognizes a charge to earnings for the full amount of the impairment (the difference between the amortized cost and fair value of the security). For fixed maturity securities that are considered OTTI and that the Company does not intend to sell and will not be required to sell, the Company separates the impairment into two components: credit loss and noncredit loss. Credit losses are charged to net realized investment losses and noncredit losses are charged to other comprehensive income. The credit loss component is the difference between the security’s amortized cost and the present value of its expected future cash flows discounted at the current effective rate. The remaining difference between the security’s fair value and the present value of its expected future cash flows is the non-credit loss. For corporate bonds, historical default (by rating) data is used as a proxy for the probability of default, and loss given default
20
Lincoln Benefit Life Company
(A Wholly-Owned Subsidiary of Resolution Life, Inc.)
Notes to Consolidated Financial Statements
(by issuer) projections are applied to the par amount of the bond. Potential losses incurred on structured securities are based on expected loss models rather than incurred loss models. Expected cash flows include assumptions about key systematic risks (e.g. unemployment rates, housing prices) and loan-specific information (e.g. delinquency rates, loan-to-value ratios). Estimating future cash flows is a quantitative and qualitative process that incorporates information received from third parties, along with assumptions and judgments about the future performance of the underlying collateral.
Commercial mortgage loans (“CMLs”) acquired at fair value are carried at amortized cost using the effective interest rate method. CMLs held by the Company are diversified by property type and geographic area throughout the U.S. CMLs are considered impaired when it is probable that the Company will not collect amounts due according to the terms of the original loan agreement. The Company assesses the impairment of loans individually for all loans in the portfolio. The Company estimates the fair value of the underlying collateral using internal valuations generally based on discounted cash flow analyses. The Company estimates an allowance for loan and lease losses (“ALLL”) representing potential credit losses embedded in the CML portfolio. The estimate is based on a consistently applied analysis of the loan portfolio and takes into consideration all available information, including industry, geographical, economic and political factors.
Policy loans represent loans the Company issues to policyholders. Policy loans are carried at unpaid principal balances. Interest income on such loans is recognized as earned using the contractually agreed upon interest rate and reflected in Net investment income in the Consolidated Statement of Operations and Comprehensive Income (Loss). Generally, interest is capitalized on the associated policy’s anniversary date.
Short-term investments include securities and other investments with remaining maturities of one year or less, but greater than three months, at the time of purchase and are stated at estimated fair value or amortized cost, which approximates fair value.
Derivatives
As part of the Company’s overall risk management policy, the Company uses listed options and exchange traded futures to economically hedge its obligation under certain fixed indexed annuity and universal life contracts. Derivative financial instruments utilized by the Company in the period from April 1, 2014 through December 31, 2014 (the “Successor Period”) included index option contracts and futures contracts. Derivatives are carried in the Company’s Consolidated Balance Sheet either as assets within Other invested assets or as liabilities within Accrued expenses and other liabilities at estimated fair value. The Company offsets the fair value amounts recognized for derivatives executed with the same counterparty under the same master netting agreement. Accruals on derivatives are generally recorded in accrued investment income or within other liabilities. However, accruals that are not scheduled to settle within one year are included with the derivatives carrying value in other invested assets or other liabilities. If a derivative is not designated as an accounting hedge or its use in managing risk does not qualify for hedge accounting, changes in the estimated fair value of the derivative are reported in realized investment gains, net in the Consolidated Statement of Operations and Comprehensive Income (Loss). The notional amounts specified in the contracts are used to calculate contractual payments under the agreements and are generally not representative of the potential for gain or loss on these contracts. Futures contracts are defined as commitments to buy or sell designated financial instruments based on specified prices, yields or indexes. Futures contracts provide returns at specified or optional dates based upon a specified index or interest rate applied to a notional amount. The Company uses futures to hedge exposures in indexed annuity and life contracts. Daily cash settlement of variation margins is required for futures contracts and is based on the changes in daily prices. The final settlement of futures contracts is in cash. Index option contracts provide returns at specified or optional dates based on a specified equity index applied to the option’s notional amount. The Company purchases and writes (sells) option contracts primarily to reduce market risk
21
Lincoln Benefit Life Company
(A Wholly-Owned Subsidiary of Resolution Life, Inc.)
Notes to Consolidated Financial Statements
associated with certain annuity and life contracts. When the Company purchases/sells option contracts at specific prices, it is required to pay/receive a premium to/from the counterparties. The amount of premium paid/received is based on the number of contracts purchased/sold, the specified price and the maturity date of the contract. The Company receives/pays cash equal to the premium of written/purchased options when the contract is established. If the option is exercised, the Company receives/pays cash equal to the product of the number of contracts and the specified price in the contract in exchange for the equity upon which the option is written/purchased. If the options are not exercised, then no additional cash is exchanged when the contract expires. Premiums paid are reported as a derivative asset and premiums received are reported as a derivative liability. Purchased put and call index option contracts are cash settled upon exercise and the gain or loss on the settlement is reported in net investment income. If the purchased option contract expires without being exercised, the premiums paid are reported as net investment income and the corresponding asset previously recorded is reversed. The change in the fair value of written option contracts is reported in Realized investment gains, net, with an adjustment to a corresponding liability. Written call index option contracts are cash settled upon exercise and the gain or loss on settlement is reported in Realized investment gains, net.
The Company has derivatives embedded in non-derivative host contracts that are required to be separated from the host contracts and accounted for at fair value. The Company’s embedded derivatives are equity options in life and annuity product contracts, which provide equity returns to contractholders, guaranteed minimum accumulation and withdrawal benefits in variable annuity contracts. The Company has reinsurance agreements to transfer all the risk related to guarantee minimum income, accumulation and withdrawal benefits in variable annuity contracts to third party reinsurers. None of these derivatives are designated as accounting hedging instruments and all are gross liabilities reported in policyholder account balances or future policy benefits and other policyholder liabilities.
Investment Income and Realized Gains and Losses
Investment income primarily consists of interest and is recognized on an accrual basis using the effective yield method. Interest income for RMBS and CMBS is determined considering estimated pay-downs, including prepayments, obtained from third party data sources and internal estimates. Actual prepayment experience is periodically reviewed and effective yields are recalculated when differences arise between the prepayments originally anticipated and the actual prepayments received and currently anticipated. For RMBS and CMBS of high credit quality with fixed interest rates, the effective yield is recalculated on a retrospective basis. For all others, the effective yield is recalculated on a prospective basis. Accrual of income is suspended for other-than-temporarily impaired fixed maturities when the timing and amount of cash flows expected to be received is not reasonably estimable. It is the Company’s policy to cease to carry accrued interest on commercial mortgage loans that are over 90 days delinquent. The Company held no non-income producing investments as of December 31, 2014.
Realized capital gains and losses include gains and losses on investment sales and write-downs in value due to other-than-temporary declines in fair value. Realized capital gains and losses on investment sales, including principal payments, are determined on a specific identification basis.
Recognition of Premium Revenues and Fees, and Related Policyholders’ Benefits and Interest Credited
Prior to April 1, 2014 or the periods prior to April 1, 2014 (the “Predecessor Periods”), the Company had reinsurance agreements whereby all premiums, fee income from policyholders and returns credited to policyholders, policyholder benefits and substantially all expenses were ceded to ALIC and other reinsurers. Amounts reflected in the Statements of Operations and Comprehensive Income (Loss) are presented net of reinsurance.
22
Lincoln Benefit Life Company
(A Wholly-Owned Subsidiary of Resolution Life, Inc.)
Notes to Consolidated Financial Statements
Traditional life insurance products consist principally of products with fixed and guaranteed premiums and benefits, primarily term and whole life insurance products. Premiums from these products are recognized as revenue when due from policyholders. Surrender values on traditional life and death benefits are reflected in policyholder benefits.
Immediate annuities with life contingencies provide insurance protection over a period that extends beyond the period during which premiums are collected. Premiums from these products are recognized as revenue when received at the inception of the contract. Benefits and expenses are recognized in relation to premiums. As of April 1, 2014, the Company has reinsurance agreements to transfer all the risk related to immediate annuities.
Interest-sensitive life contracts, such as universal life and single premium life, are insurance contracts whose terms are not fixed or guaranteed. The terms that may be changed include premiums paid by the policyholder, interest credited to the policyholder account balance and contract charges assessed against the policyholder account balance. Premiums from these contracts are reported as policyholder account balances. Fee income from policyholders consist of fees assessed against the policyholder account balance for the cost of insurance (mortality risk), contract administration and surrender of the policy prior to contractually specified dates. These charges are recognized as revenue when assessed against the policyholder account balance. Policyholder benefits include life-contingent benefit payments in excess of the policyholder account balance.
Contracts that do not subject the Company to significant risk arising from mortality or morbidity are referred to as investment contracts. Fixed annuities, including market value adjusted annuities, equity-indexed annuities and immediate annuities without life contingencies, are considered investment contracts. Consideration received for such contracts is reported as policyholder account balance deposits. Policy fees for investment contracts consist of fees assessed against the contractholder account balance for maintenance, administration and surrender of the contract prior to contractually specified dates, and are recognized when assessed against the policyholder account balance.
Return credited to policyholder funds represents interest accrued or paid on interest-sensitive life and investment contracts. Crediting rates for certain fixed annuities and interest-sensitive life contracts are adjusted periodically by the Company to reflect current market conditions subject to contractually guaranteed minimum rates. Crediting rates for indexed life and annuities are generally based on an equity index, such as the Standard & Poor’s (“S&P”) 500 Index.
Policy charges for variable life and variable annuity products consist of fees assessed against the policyholder account balances for contract maintenance, administration, mortality, expense and surrender of the contract prior to contractually specified dates. Policy benefits incurred for variable annuity products include guaranteed minimum death, income, withdrawal and accumulation benefits.
The Company incurs significant costs in connection with renewal insurance business. All acquisition-related costs, including commissions, those related to general advertising, agent training, as well as all indirect costs, are expensed as incurred and reported in Operating and acquisition expenses on the Consolidated Statement of Operations and Comprehensive Income (Loss) for the period from April 1, 2014 through December 31, 2014. The Company also receives expense allowances on reinsurance ceded. These amounts are recognized when earned and reported in Operating expenses and acquisition expenses on the Consolidated Statement of Operations and Comprehensive Income (Loss) for the period from April 1, 2014 through December 31, 2014.
Reinsurance
Reinsurance accounting is applied for ceded and assumed transactions when the risk transfer provisions of ASC 944-40, Accounting and Reporting for Reinsurance of Short-Duration and Long-Duration Contracts, have
23
Lincoln Benefit Life Company
(A Wholly-Owned Subsidiary of Resolution Life, Inc.)
Notes to Consolidated Financial Statements
been met. To meet risk transfer requirements, a long-duration reinsurance contract must transfer mortality or morbidity risks, and subject the reinsurer to a reasonable possibility of a significant loss. Those contracts that do not meet risk transfer requirements are accounted for using deposit accounting. For short duration contracts, to meet risk transfer requirements the reinsurer must assume significant insurance risk and have a reasonable possibility of experiencing significant loss.
With respect to ceded reinsurance, the Company values reinsurance recoverables on reported claims at the time the underlying claim is recognized in accordance with contract terms. For future policy benefits, the Company estimates the amount of reinsurance recoverables based on the terms of the reinsurance contracts and historical reinsurance recovery information. The reinsurance recoverables are based on what the Company believes are reasonable estimates and the balance is reported as an asset in the Consolidated Balance Sheet (Successor) and Balance Sheets (Predecessor). However, the ultimate amount of the reinsurance recoverable is not known until all claims are settled. Reinsurance contracts do not relieve the Company from its obligations to policyholders, and failure of reinsurers to honor their obligations could result in losses to the Company, consequently, allowances are established for amounts deemed uncollectible.
In the Predecessor periods, or the periods prior to April 1, 2014, the Company had reinsurance agreements whereby all insurance risks represented by premiums, fee income from policyholders, returns credited to policyholder account balances, policyholder benefits and substantially all expenses were ceded to ALIC and other reinsurers. Additionally, investment income earned on the assets that supported policyholder account balances and future policy benefits and other policyholder funds were not included in the Company’s financial statements as those assets were owned and managed by ALIC and other reinsurers under the terms of the reinsurance agreements.
Value of Business Acquired (“VOBA”)
For interest sensitive life products, VOBA is amortized over the life of the policies in relation to the emergence of estimated gross profits (“EGP’s”) from margins on mortality, interest, expenses, and surrenders, all of which are net of reinsurance and include actual realized gains and losses on investments. For non-interest sensitive life products, such as term life insurance, VOBA is amortized in relation to premium. VOBA is reviewed periodically for loss recognition to ensure that the unamortized balance is recoverable from future earnings from the business. The carrying amount of VOBA is adjusted for the effects of realized and unrealized gains and losses on debt securities classified as AFS.
Separate Accounts
Separate Accounts assets are carried at fair value. The assets of the Separate Accounts are legally segregated and available only to settle separate account contract obligations. Separate Account liabilities represent the contractholders’ claims to the related assets and are carried at an amount equal to the Separate Account assets. Investment income and realized capital gains and losses of the separate accounts accrue directly to the contractholders and therefore are not included in the Company’s Consolidated Statement of Operations and Comprehensive Income (Successor) or Statements of Operations and Comprehensive Income (Predecessor). Deposits to and surrenders and withdrawals from the Separate Accounts are reflected in Separate Accounts liabilities and are not included in cash flows.
Absent any contract provision wherein the Company provides a guarantee, variable annuity and variable life insurance contractholders bear the investment risk that the Separate Accounts’ funds may not meet their stated investment objectives.
24
Lincoln Benefit Life Company
(A Wholly-Owned Subsidiary of Resolution Life, Inc.)
Notes to Consolidated Financial Statements
Future Policy Benefits and Other Policyholder Liabilities — Successor
Policy liabilities are established for future policy benefits on certain annuity, life, and long term care policies. Such liabilities are established in amounts adequate to meet the estimated future obligations of policies in-force. Changes in policy and contract claims are recorded in policyholder benefits in the Consolidated Statement of Operations and Comprehensive Income (Loss).
For ASC 944-20 products, benefit reserves are computed using the net level premium method for individual life and annuity policies, and are based upon estimates as to future investment yield, mortality and lapse that include provisions for adverse deviation. Mortality, morbidity and lapse assumptions for all policies are based on the Company’s own experience and industry standards.
Liabilities for outstanding claims and claims adjustment expenses are estimates of payments to be made on life and health insurance contracts for reported claims and claims adjustment expenses. A liability is also held for claims adjustment expenses incurred but not reported as of the balance sheet date. These liabilities are determined using case basis evaluations and statistical analyses and represent estimates of the ultimate cost of all claims incurred but not paid. These estimates are continually reviewed and adjusted as necessary; such adjustments are reflected in current operations.
Future policy benefit reserves for the portion of fixed indexed annuity policies with returns linked to the performance of a specified market index are equal to the sum of the fair value of the embedded derivatives and the host (or guaranteed) component of the contracts. The change in the fair value of the embedded derivative is linked to the performance of the equity option. The host value is established as of the date of acquisition and is equal to the account value for which returns are linked to an equity index, plus the value of the unexpired options at the date of acquisition, less the embedded derivative, and accreted over the policy’s life at a constant rate of interest. Future policy benefits reserves for the portion of fixed indexed annuities earning a fixed rate of interest, and other deferred annuity products are computed under a retrospective deposit method and represent policy account balances before applicable surrender charges.
The Company holds additional liabilities for its no lapse guarantees (associated with universal life) and guaranteed minimum withdrawal benefits (associated with fixed indexed annuities). These are accounted for in accordance with ASC 944-20,Financial Services — Insurance Activities.
Policy liabilities and accruals are based on the various estimates discussed above. Although the adequacy of these amounts cannot be assured, the Company believes that policy liabilities and accruals will be sufficient to meet future obligations of policies in-force. The amount of liabilities and accruals, however, could be revised if the estimates discussed above are revised.
Future Policy Benefit and Other Policyholder Liabilities – Predecessor
Future policy benefit and other policyholder liabilities consist of the reserve for life-contingent contract benefits payable under insurance policies, including traditional life insurance and life-contingent immediate annuities, and is computed on the basis of long-term actuarial assumptions of future investment yields, mortality, morbidity, policy terminations and expenses. These assumptions, which for traditional life insurance are applied using the net level premium method, include provisions for adverse deviation and generally vary by characteristics such as type of coverage, year of issue and policy duration.
25
Lincoln Benefit Life Company
(A Wholly-Owned Subsidiary of Resolution Life, Inc.)
Notes to Consolidated Financial Statements
Policyholders’ Account Balances — Successor
Policyholder account balances represent interest-bearing liabilities arising from the sale of products such as interest-sensitive life insurance and fixed annuities. Policyholder funds primarily comprise cumulative deposits received and interest credited to the contractholder less cumulative contract benefits, surrenders, withdrawals and contract charges for mortality or administrative expenses.
The Company holds additional liabilities for guaranteed minimum income benefits (“GMIB”) associated with variable annuities, which are accounted for in accordance with ASC 944-20, Financial Services — Insurance Activities. The reserves for certain living benefit features, including guaranteed minimum accumulation benefits (“GMAB”) and guaranteed minimum withdrawal benefits (“GMWB”) are accounted for as embedded derivatives, with fair values calculated as the present value of expected future benefit payments to contractholders less the present value of assessed rider fees attributable to the embedded derivative feature. This methodology could result in either a liability or contra-liability balance, given changing capital market conditions and various actuarial assumptions. The Company’s GMIB, GMAB and GMWB reserves are ceded to external reinsurers. For additional information regarding the valuation of these optional living benefit features, see Note 10.
Policyholders’ Account Balances — Predecessor
Policyholder account balances represent interest-bearing liabilities arising from the sale of products such as interest-sensitive life insurance and fixed annuities. Policyholder account balances primarily comprise cumulative deposits received and interest credited to the contractholder less cumulative contract benefits, surrenders, withdrawals and contract charges for mortality or administrative expenses. Policyholder account balances also include reserves for secondary guarantees on interest-sensitive life insurance and certain fixed annuity contracts and reserves for certain guarantees on variable annuity contracts.
Income Taxes — Successor
Income taxes are provided for using the asset and liability method under which deferred tax assets and liabilities are recognized for temporary differences between the financial statement and income tax bases of assets and liabilities. The effect on deferred tax assets and liabilities of a change in tax rates is recognized in income in the period that includes the enactment date. The realizability of deferred tax assets is assessed at each reporting date. Tax positions are assessed under a two-step approach, which requires the assessment of recognition and measurement. The Company reports interest expense related to income tax matters and tax penalties in other operating expenses in the Consolidated Statement of Operations and Comprehensive Income (Loss).
Income Taxes — Predecessor
The income tax provision is calculated under the liability method. Deferred tax assets and liabilities are recorded based on the difference between the financial statement and tax bases of assets and liabilities at the enacted tax rates. The principal assets and liabilities giving rise to such differences are unrealized capital gains and losses, accrued expenses and reinsurance recoverables. A deferred tax asset valuation allowance is established when there is uncertainty that such assets will be realized.
Other Long-Term Debt
Effective April 1, 2014, and with Nebraska Department of Insurance (the “NE DOI” or the “Department of Insurance”) approval, Lancaster Re issued a variable funding Surplus Note (the “Surplus Note”) to its affiliate, Lanis, LLC. for $513,000,000 and acquired from Lanis a Vehicle Note (the “Vehicle Note”) for $513,000,000.
26
Lincoln Benefit Life Company
(A Wholly-Owned Subsidiary of Resolution Life, Inc.)
Notes to Consolidated Financial Statements
The Vehicle Note is held to support a portion of Lancaster Re’s reinsurance obligations and has been authorized as an acceptable form of reinsurance collateral pursuant to Nebraska Rev. Stat. §44-8216(8)(c)(i) which allows a special purpose financial captive insurer to establish any method of security that the Department deems acceptable. The scheduled maturity date of the Vehicle Note is April 1, 2034, and the scheduled maturity date of the Surplus Note is April 1, 2039, although each may be cancelled earlier or extended under certain conditions. The Surplus Note does not repay principal prior to maturity and principal payment at maturity is subject to the prior approval of the Department of Insurance. With pre-approval, the Surplus Note is increased each quarter with a corresponding increase in the Vehicle Note. With Department pre-approval, interest on the Surplus Note for the prior quarter is paid on the first day of each subsequent quarter at a rate consistent with the rate received on the Vehicle Note of 4%. The Surplus Note and Vehicle Note increased by $38,600,000 and interest expense of $15,711,000 was recognized in the Successor Period from April 1, 2014 through December 31, 2014. The Surplus Note is unsecured and subordinated to all present and future indebtedness, policy claims and other creditor claims of Lancaster Re.
Other Assets and Accrued Expenses and Other Liabilities
Other assets consist primarily of premiums due, intangible assets, the Vehicle Note, receivables resulting from sales of securities that had not yet settled at the balance sheet date. Other liabilities consist primarily of accrued expenses, technical overdrafts, derivatives, and payables resulting from purchases of securities that had not yet been settled at the balance sheet date.
Adoption of New Accounting Pronouncements
In February 2013, the Financial Accounting Standards Board issued guidance requiring expanded disclosures about the amounts reclassified out of accumulated other comprehensive income by component. The guidance requires the presentation of significant amounts reclassified out of accumulated other comprehensive income by income statement line item but only if the amount reclassified is required under accounting principles generally accepted in the United States of America (“GAAP”) to be reclassified to net income in its entirety in the same reporting period. For other amounts that are not required under GAAP to be reclassified in their entirety to net income, cross-reference to other disclosures that provide additional detail about those amounts is required. The Company adopted the new guidance in 2013. The new guidance affects disclosures only and therefore had no impact on the Company’s results of operations or financial position.
Effective November 18, 2014, the Company adopted new guidance on when, if ever, the cost of acquiring an entity should be used to establish a new accounting basis (“pushdown”) in the acquired entity’s separate financial statements. The guidance provides an acquired entity and its subsidiaries with an irrevocable option to apply pushdown accounting in its separate financial statements upon occurrence of an event in which an acquirer obtains control of the acquired entity. If a reporting entity elects to apply pushdown accounting, its stand-alone financial statements would reflect the acquirer’s new basis in the acquired entity’s assets and liabilities. The election to apply pushdown accounting should be determined by an acquired entity for each individual change-in-control event in which an acquirer obtains control of the acquired entity; however, an entity that does not elect to apply pushdown accounting in the period of a change-in-control can later elect to retrospectively apply pushdown accounting to the most recent change-in-control transaction as a change in accounting principle. The Company has applied pushdown accounting as a result of the Acquisition in the Successor Period, as disclosed in Note 1.
In February 2015, the FASB issued updated guidance regarding consolidation. The pronouncement eliminates specialized guidance for limited partnerships and similar legal entities, and removes the indefinite deferral for certain investment funds. The new guidance is effective for annual periods and interim periods within
27
Lincoln Benefit Life Company
(A Wholly-Owned Subsidiary of Resolution Life, Inc.)
Notes to Consolidated Financial Statements
those annual periods beginning after December 15, 2015, with early adoption permitted. This guidance is not expected to have a significant effect on the Company’s consolidated financial position, results of operations or financial statement disclosures.
In January 2014, the FASB issued updated guidance regarding investments in flow-through limited liability entities that manage or invest in affordable housing projects that qualify for the low-income housing tax credit. Under the guidance, an entity is permitted to make an accounting policy election to amortize the initial cost of its investment in proportion to the tax credits and other tax benefits received and recognize the net investment performance in the Statement of Operations and Comprehensive Income (Loss) as a component of Income tax expense (benefit) if certain conditions are met. The new guidance is effective for annual periods and interim reporting periods within those annual periods, beginning after December 15, 2014, and should be applied retrospectively to all periods presented. This guidance is not expected to have a significant effect on the Company’s consolidated financial position, results of operations or financial statement disclosures.
In January 2014, the FASB issued updated guidance for troubled debt restructurings clarifying when an in substance repossession or foreclosure occurs, and when a creditor is considered to have received physical possession of residential real estate property collateralizing a consumer mortgage loan. The new guidance is effective for annual periods and interim periods within those annual periods, beginning after December 15, 2014. This guidance can be elected for prospective adoption or by using a modified retrospective transition method. This guidance is not expected to have a significant effect on the Company’s consolidated financial position, results of operations or financial statement disclosures.
In May 2014, the FASB issued updated guidance on accounting for revenue recognition. The guidance is based on the core principle that revenue is recognized to depict the transfer of goods or services to customers in an amount that reflects the consideration to which the entity expects to be entitled in exchange for those goods and services. The guidance also requires additional disclosures about the nature, amount, timing and uncertainty of revenue and cash flows arising from customer contracts, including significant judgments and changes in judgments and assets recognized from cost incurred to obtain or fulfill a contract. Revenue recognition for insurance contracts is explicitly scoped out of the guidance. The new guidance is effective for annual periods and interim periods within those annual periods, beginning after December 15, 2016 and must be applied using one of two retrospective application methods. Early adoption is not permitted. The Company is currently assessing the impact of the guidance on the Company’s consolidated financial position, results of operations and financial statement disclosures.
In August 2014, the FASB issued guidance requiring that mortgage loans be derecognized and that a separate other receivable be recognized upon foreclosure if certain conditions are met. Upon foreclosure, the separate other receivable should be measured based on the amount of the loan balance (principal and interest) expected to be recovered from the guarantor. The new guidance is effective for annual periods and interim periods within those annual periods, beginning after December 15, 2014, with early adoption permitted. This guidance can be adopted using either a prospective transition method or a modified retrospective transition method. This guidance is not expected to have a significant impact on the Company’s consolidated financial position, results of operations or financial statement disclosures.
28
Lincoln Benefit Life Company
(A Wholly-Owned Subsidiary of Resolution Life, Inc.)
Notes to Consolidated Financial Statements
The amortized cost, gross unrealized gains and losses and fair value for fixed maturities as of December 31, 2014 and 2013 were as follows:
| | | | | | | | | | | | | | | | |
December 31, 2014 — Successor ($ in thousands) | | Amortized
Cost | | | Gross
Unrealized
Gains | | | Gross
Unrealized
Losses | | | Fair Value | |
Fixed maturities | | | | | | | | | | | | | | | | |
U.S. Treasury Securities and Obligations of U.S. Government Authority and Agencies | | $ | 810,057 | | | $ | 47,859 | | | $ | (590 | ) | | $ | 857,326 | |
Obligations of U.S. States and Political Subdivisions | | | 250,008 | | | | 5,638 | | | | (437 | ) | | | 255,209 | |
All other corporate securities | | | 7,279,391 | | | | 132,480 | | | | (34,126 | ) | | | 7,377,745 | |
ABS | | | 373,304 | | | | 6,107 | | | | (2,408 | ) | | | 377,003 | |
CMBS | | | 331,041 | | | | 3,507 | | | | (1,065 | ) | | | 333,483 | |
RMBS | | | 188,055 | | | | 2,849 | | | | (1,023 | ) | | | 189,881 | |
| | | | | | | | | | | | | | | | |
Total fixed maturities | | $ | 9,231,856 | | | $ | 198,440 | | | $ | (39,649 | ) | | $ | 9,390,647 | |
| | | | | | | | | | | | | | | | |
| | | | |
| | | | | | | | | | | | | |
| | | | |
December 31, 2013 — Predecessor ($ in thousands) | | Amortized
Cost | | | Gross
Unrealized
Gains | | | Gross
Unrealized
Losses | | | Fair Value | |
Fixed maturities | | | | | | | | | | | | | | | | |
U.S. government and agenciies | | $ | 70,790 | | | $ | 3,113 | | | $ | (57 | ) | | $ | 73,846 | |
Municipal | | | 2,499 | | | | 270 | | | | — | | | | 2,769 | |
Corporate | | | 190,186 | | | | 5,784 | | | | (3,993 | ) | | | 191,977 | |
Foreign government | | | 4,999 | | | | 165 | | | | — | | | | 5,164 | |
CMBS | | | 2,588 | | | | 88 | | | | — | | | | 2,676 | |
RMBS | | | 13,866 | | | | 584 | | | | — | | | | 14,450 | |
| | | | | | | | | | | | | | | | |
Total fixed maturities | | $ | 284,928 | | | $ | 10,004 | | | $ | (4,050 | ) | | $ | 290,882 | |
| | | | | | | | | | | | | | | | |
Scheduled Maturities — Successor
The scheduled maturities for fixed maturities are as follows as of December 31, 2014:
| | | | | | | | |
($ in thousands) | | Amortized
Cost | | | Fair Value | |
Due in one year or less | | $ | 425,248 | | | $ | 425,238 | |
Due after one year through five years | | | 1,775,910 | | | | 1,779,194 | |
Due after five years through ten years | | | 4,001,723 | | | | 4,060,017 | |
Due after ten years | | | 2,136,575 | | | | 2,225,831 | |
| | | | | | | | |
Total before asset and mortgage-backed securities | | | 8,339,456 | | | | 8,490,280 | |
Asset and mortgage-backed securities | | | 892,400 | | | | 900,367 | |
| | | | | | | | |
Total fixed maturities | | $ | 9,231,856 | | | $ | 9,390,647 | |
| | | | | | | | |
Actual maturities may differ from those scheduled as a result of calls and make-whole payments by the issuers. Asset and mortgage-backed securities are shown separately because of the potential for prepayment of principal prior to contractual maturity dates.
29
Lincoln Benefit Life Company
(A Wholly-Owned Subsidiary of Resolution Life, Inc.)
Notes to Consolidated Financial Statements
Commercial Mortgage Loans — Successor
The Company diversifies its commercial mortgage loan portfolio by geographical region to reduce concentration risk. The following table presents the Company’s commercial mortgage loan portfolio by geographical region as of December 31, 2014:
| | | | |
($ in thousands) | | Carrying
Value | |
Alabama | | $ | 1,720 | |
Arizona | | | 35,481 | |
California | | | 255,563 | |
Colorado | | | 22,381 | |
Florida | | | 20,779 | |
Georgia | | | 27,502 | |
Hawaii | | | 8,125 | |
Illinois | | | 53,174 | |
Iowa | | | 1,490 | |
Kentucky | | | 8,260 | |
Maine | | | 4,114 | |
Maryland | | | 35,536 | |
Massachusetts | | | 92,963 | |
Minnesota | | | 52,496 | |
Missouri | | | 9,324 | |
Nevada | | | 14,705 | |
New Jersey | | | 84,007 | |
New York | | | 72,625 | |
North Carolina | | | 31,111 | |
Ohio | | | 38,400 | |
Oklahoma | | | 10,835 | |
Pennsylvania | | | 37,688 | |
South Carolina | | | 3,130 | |
Tennessee | | | 5,719 | |
Texas | | | 103,778 | |
Utah | | | 45,914 | |
Virginia | | | 18,572 | |
Washington | | | 13,138 | |
Wisconsin | | | 6,637 | |
General allowance for loan loss | | | — | |
| | | | |
Total commercial mortgage loans | | $ | 1,115,167 | |
| | | | |
30
Lincoln Benefit Life Company
(A Wholly-Owned Subsidiary of Resolution Life, Inc.)
Notes to Consolidated Financial Statements
Credit Quality of Commercial Mortgage Loans
The credit quality of commercial mortgage loans held-for-investment were as follows at December 31, 2014:
| | | | | | | | | | | | | | | | | | | | | | | | | | | | |
| | | Recorded Investment | | | | | | | |
| | | Debt Service Coverage Ratios | | | | | | | | | | | | | |
($ in thousands) | | > 1.20x | | | 1.00x - 1.20x | | | < 1.00x | | | Total | | | % of Total | | | Estimated Fair
Value | | | % of Total | |
Loan-to-value ratios: | | | | | | | | | | | | | | | | | | | | | | | | | | | | |
Less than 65% | | $ | 930,592 | | | $ | 151,700 | | | $ | 29,460 | | | $ | 1,111,752 | | | | 98 | % | | $ | 1,146,030 | | | | 98 | % |
65% to 75% | | | 16,591 | | | | 10,537 | | | | — | | | | 27,128 | | | | 2 | | | | 28,275 | | | | 2 | |
76% to 80% | | | — | | | | — | | | | — | | | | — | | | | — | | | | — | | | | — | |
Greater than 80% | | | — | | | | — | | | | — | | | | — | | | | — | | | | — | | | | — | |
| | | | | | | | | | | | | | | | | | | | | | | | | | | | |
Total | | $ | 947,183 | | | $ | 162,237 | | | $ | 29,460 | | | $ | 1,138,880 | | | | 100 | % | | $ | 1,174,305 | | | | 100 | % |
| | | | | | | | | | | | | | | | | | | | | | | | | | | | |
As of December 31, 2014, the Company had no allowance for credit losses for commercial mortgage loans. As of December 31, 2014, $1,139 million of commercial mortgage loans were in current status and no commercial mortgage and other loans were classified as past due. The Company defines current in its aging of past due commercial mortgage and other loans as less than 30 days past due.
Impaired loans include those loans for which it is probable that all amounts due will not be collected according to the contractual terms of the loan agreement. As of December 31, 2014, the Company held no impaired commercial mortgage loans.
The Company’s commercial mortgage and other loans may occasionally be involved in a troubled debt restructuring. As of December 31, 2014, the Company had no significant commitments to fund borrowers that have been involved in a troubled debt restructuring. For the period from April 1, 2014 through December 31, 2014, there were no new troubled debt restructurings related to commercial mortgage and other loans, and no payment defaults on commercial mortgages.
Other Invested Assets — Successor
The following table sets forth the composition of “Other invested assets” at December 31, 2014:
| | | | |
| | | Successor | |
($ in thousands) | | December 31, 2014 | |
Low income housing tax credit properties | | $ | 896 | |
Derivatives | | | 26,001 | |
| | | | |
| | $ | 26,897 | |
| | | | |
31
Lincoln Benefit Life Company
(A Wholly-Owned Subsidiary of Resolution Life, Inc.)
Notes to Consolidated Financial Statements
Net Investment Income
Net investment income for the Successor Period from April 1, 2014 through December 31, 2014 and Predecessor Periods for the period from January 1, 2014 through March 31, 2014 and years ended December 31, 2013 and 2012 were as follows:
| | | | | | | | | | | | | | | | |
| | | Successor | | | Predecessor | |
($ in thousands) | | For the Period
from April 1, 2014
through
December 31,
2014 | | | For the Period
from January 1,
2014
through March 31,
2014 | | | For the Year
Ended
December 31,
2013 | | | For the Year
Ended
December 31,
2012 | |
Fixed maturities | | $ | 231,972 | | | $ | 2,461 | | | $ | 11,545 | | | $ | 12,138 | |
Commercial mortgage loans | | | 49,417 | | | | — | | | | — | | | | — | |
Cash and short-term investments | | | 4,786 | | | | 16 | | | | 23 | | | | 20 | |
Other investment (loss) income | | | 7,353 | | | | — | | | | — | | | | — | |
| | | | | | | | | | | | | | | | |
Gross investment income | | | 293,528 | | | | 2,477 | | | | 11,568 | | | | 12,158 | |
Investment expenses | | | 4,957 | | | | 127 | | | | 633 | | | | 568 | |
| | | | | | | | | | | | | | | | |
Net investment income | | $ | 288,571 | | | $ | 2,350 | | | $ | 10,935 | | | $ | 11,590 | |
| | | | | | | | | | | | | | | | |
Realized Investment Gains and Losses
Realized investment gains and losses for the Successor Period from April 1, 2014 through December 31, 2014 and Predecessor Periods for the period from January 1, 2014 through March 31, 2014 and years ended December 31, 2013 and 2012 were as follows:
| | | | | | | | | | | | | | | | |
| | | Successor | | | Predecessor | |
($ in thousands) | | For the Period
from April 1, 2014
through
December 31,
2014 | | | For the Period
from January 1,
2014
through March 31,
2014 | | | For the Year
Ended
December 31,
2013 | | | For the Year
Ended
December 31,
2012 | |
Realized investment gains, net | | | | | | | | | | | | | | | | |
Fixed maturities | | $ | 25,795 | | | $ | 285 | | | $ | — | | | $ | 626 | |
Commercial mortgage loans | | | 2,880 | | | | — | | | | — | | | | — | |
Derivatives | | | 17,417 | | | | — | | | | — | | | | — | |
Other | | | — | | | | — | | | | — | | | | — | |
| | | | | | | | | | | | | | | | |
Net realized gains | | $ | 46,092 | | | $ | 285 | | | $ | — | | | $ | 626 | |
| | | | | | | | | | | | | | | | |
There were no other-than-temporary impairment losses recorded in the Successor Period from April 1, 2014 through December 31, 2014.
There were no other-than-temporary impairment losses recorded in the Predecessor Period from January 1, 2014 through March 31, 2014. Realized capital gains and losses in the Predecessor years ended December 31, 2013 and 2012 included $2 thousand and $19 thousand, respectively, of other-than-temporary impairment losses related to RMBS, none of which were included in other comprehensive income. No other-than-temporary impairment losses were included in accumulated other comprehensive income as of December 31, 2014 and 2013.
32
Lincoln Benefit Life Company
(A Wholly-Owned Subsidiary of Resolution Life, Inc.)
Notes to Consolidated Financial Statements
Proceeds from sales of fixed maturities and gross realized investment gains and losses for the Successor Period from April 1, 2014 through December 31, 2014 and Predecessor Periods for the period from January 1, 2014 through March 31, 2014 and years ended December 31, 2013 and 2012 were as follows:
| | | | | | | | | | | | | | | | | | |
| | | Successor | | | | | Predecessor | |
($ in thousands) | | For the Period
from April 1, 2014
through
December 31,
2014 | | | | | For the
Period from
January 1,
2014
through
March 31,
2014 | | | For the Year
Ended
December 31,
2013 | | | For the Year
Ended
December 31,
2012 | |
Fixed maturities, available-for-sale | | | | | | | | | | | | | | | | | | |
Proceeds from sales | | $ | 1,429,177 | | | | | $ | 5,277 | | | $ | 9,170 | | | $ | 25,367 | |
Gross investment gains from sales | | | 30,403 | | | | | | 317 | | | | 3 | | | | 645 | |
Gross investment losses from sales | | | (4,608 | ) | | | | | (32 | ) | | | (1 | ) | | | — | |
Unrealized Investment Gains and Losses
The following table summarizes the gross unrealized losses and fair value of fixed maturities by the length of time that individual securities have been in a continuous unrealized loss position as of December 31, 2014 and 2013:
| | | | | | | | | | | | | | | | | | | | | | | | |
| Successor | | Less than 12 months | | | Greater than 12 months | | | | | | | |
December 31, 2014 ($ in thousands) | | Fair Value | | | Gross
Unrealized
Losses | | | Fair
Value | | | Gross
Unrealized
Losses | | | Fair Value | | | Gross
Unrealized
Losses | |
Fixed maturities | | | | | | | | | | | | | | | | | | | | | | | | |
U.S. Treasury Securities and Obligations of U.S. Government Authority and Agencies | | $ | 71,766 | | | $ | (590 | ) | | $ | — | | | $ | — | | | $ | 71,766 | | | $ | (590 | ) |
Obligations of U.S. States and Political Subdivisions | | | 37,543 | | | | (437 | ) | | | — | | | | — | | | | 37,543 | | | | (437 | ) |
All other corporate securities | | | 1,683,185 | | | | (34,126 | ) | | | — | | | | — | | | | 1,683,185 | | | | (34,126 | ) |
ABS | | | 115,568 | | | | (2,408 | ) | | | — | | | | — | | | | 115,568 | | | | (2,408 | ) |
CMBS | | | 135,203 | | | | (1,065 | ) | | | — | | | | — | | | | 135,203 | | | | (1,065 | ) |
RMBS | | | 92,804 | | | | (1,023 | ) | | | — | | | | — | | | | 92,804 | | | | (1,023 | ) |
| | | | | | | | | | | | | | | | | | | | | | | | |
Total fixed income securities | | $ | 2,136,069 | | | $ | (39,649 | ) | | $ | — | | | $ | — | | | $ | 2,136,069 | | | $ | (39,649 | ) |
| | | | | | | | | | | | | | | | | | | | | | | | |
| | | | | | |
| | | | | | | | | | | | | | | | | | | |
| | | | |
| Predecessor | | Less than 12 months | | | Greater than 12 months | | | | | | | |
December 31, 2013 ($ in thousands) | | Fair Value | | | Gross
Unrealized
Losses | | | Fair
Value | | | Gross
Unrealized
Losses | | | Fair Value | | | Gross
Unrealized
Losses | |
Fixed maturities | | | | | | | | | | | | | | | | | | | | | | | | |
U.S. government agencies | | $ | 4,942 | | | $ | (57 | ) | | $ | — | | | $ | — | | | $ | 4,942 | | | $ | (57 | ) |
Corporate | | | 75,754 | | | | (3,795 | ) | | | 1,770 | | | | (198 | ) | | | 77,524 | | | | (3,993 | ) |
| | | | | | | | | | | | | | | | | | | | | | | | |
Total fixed income securities | | $ | 80,696 | | | $ | (3,852 | ) | | $ | 1,770 | | | $ | (198 | ) | | $ | 82,466 | | | $ | (4,050 | ) |
| | | | | | | | | | | | | | | | | | | | | | | | |
33
Lincoln Benefit Life Company
(A Wholly-Owned Subsidiary of Resolution Life, Inc.)
Notes to Consolidated Financial Statements
Portfolio Monitoring
The Company has a comprehensive portfolio monitoring process to identify and evaluate each fixed maturity security whose carrying value may be other-than-temporarily impaired.
For each fixed maturity security in an unrealized loss position, the Company assesses whether management with the appropriate authority has made the decision to sell or whether it is more likely than not the Company will be required to sell the security before recovery of the amortized cost basis for reasons such as liquidity, contractual or regulatory purposes. If a security meets either of these criteria, the security’s decline in fair value is considered other than temporary and is recorded in earnings.
If the Company has not made the decision to sell the fixed maturity security and it is not more likely than not the Company will be required to sell the fixed maturity security before recovery of its amortized cost basis, the Company evaluates whether it expects to receive cash flows sufficient to recover the entire amortized cost basis of the security. The Company calculates the estimated recovery value by discounting the best estimate of future cash flows at the security’s original or current effective rate, as appropriate, and compares this to the amortized cost of the security. If the Company does not expect to receive cash flows sufficient to recover the entire amortized cost basis of the fixed maturity security, the credit loss component of the impairment is recorded in earnings, with the remaining amount of the unrealized loss related to other factors recognized in other comprehensive income.
The Company’s portfolio monitoring process includes a quarterly review of all securities to identify instances where the fair value of a security compared to its amortized cost is below established thresholds. The process also includes the monitoring of other impairment indicators such as ratings, ratings downgrades and payment defaults. The securities identified, in addition to other securities for which the Company may have a concern, are evaluated for potential other-than-temporary impairment using all reasonably available information relevant to the collectability or recovery of the security. Inherent in the Company’s evaluation of other-than-temporary impairment for these fixed maturity securities are assumptions and estimates about the financial condition and future earnings potential of the issue or issuer. Some of the factors that may be considered in evaluating whether a decline in fair value is other than temporary are: 1) the financial condition, near-term and long-term prospects of the issue or issuer, including relevant industry specific market conditions and trends, geographic location and implications of rating agency actions and offering prices; 2) the specific reasons that a security is in an unrealized loss position, including overall market conditions which could affect liquidity; and 3) the length of time and extent to which the fair value has been less than amortized cost.
34
Lincoln Benefit Life Company
(A Wholly-Owned Subsidiary of Resolution Life, Inc.)
Notes to Consolidated Financial Statements
Net Unrealized Investment Gains and Losses in Accumulated Other Comprehensive Income
| | | | | | | | | | | | | | | | | | | | |
($ in thousands) Predecessor | | Net Unrealized
Gain (Losses) on
Investments | | | VOBA | | | Future Policy
Benefits and
Policyholders’
Account Balances | | | Deferred
Income Tax
(Liability)
Asset | | | Accumulated Other
Comprehensive
Income (Loss)
Related to Net
Unrealized
Investment Gains
(Losses) | |
Balance, December 31, 2011 | | $ | 20,855 | | | $ | — | | | $ | — | | | $ | (7,299 | ) | | $ | 13,556 | |
Net investment gains and losses on investments arising during the period | | | 977 | | | | — | | | | — | | | | (343 | ) | | | 634 | |
Reclassification adjustment for gains and losses included in net income | | | 596 | | | | — | | | | — | | | | (209 | ) | | | 387 | |
| | | | | | | | | | | | | | | | | | | | |
Balance, December 31, 2012 | | $ | 21,236 | | | $ | — | | | $ | — | | | $ | (7,433 | ) | | $ | 13,803 | |
Net investment gains and losses on investments arising during the period | | | (15,281 | ) | | | — | | | | — | | | | 5,349 | | | | (9,932 | ) |
Reclassification adjustment for gains and losses included in net income | | | 1 | | | | — | | | | — | | | | — | | | | 1 | |
| | | | | | | | | | | | | | | | | | | | |
Balance, December 31, 2013 | | $ | 5,954 | | | $ | — | | | $ | — | | | $ | (2,084 | ) | | $ | 3,870 | |
Net investment gains and losses on investments arising during the period | | | 2,364 | | | | — | | | | — | | | | (828 | ) | | | 1,536 | |
Reclassification adjustment for gains and losses included in net income | | | 285 | | | | — | | | | — | | | | (100 | ) | | | 185 | |
| | | | | | | | | | | | | | | | | | | | |
Balance, March 31, 2014 | | $ | 8,033 | | | $ | — | | | $ | — | | | $ | (2,812 | ) | | $ | 5,221 | |
| | | | | |
| | | | | | | | | | | | | | | | |
| | | | | |
Successor | | | | | | | | | | | | | | | |
Balance, April 1, 2014 | | $ | — | | | $ | — | | | $ | — | | | $ | — | | | $ | — | |
Net investment gains and losses on investments arising during the period | | | 159,261 | | | | — | | | | — | | | | (55,674 | ) | | | 103,587 | |
Reclassification adjustment for gains and losses included in net income | | | — | | | | — | | | | — | | | | — | | | | — | |
Impact of net unrealized investment gains and losses on VOBA | | | — | | | | (20,287 | ) | | | — | | | | 7,100 | | | | (13,187 | ) |
Impact of net unrealized investment gains and losses on future policy benefits and policyholders’ account balances | | | — | | | | — | | | | (7,541 | ) | | | 2,639 | | | | (4,902 | ) |
| | | | | | | | | | | | | | | | | | | | |
Balance, December 31, 2014 | | $ | 159,261 | | | $ | (20,287 | ) | | $ | (7,541 | ) | | $ | (45,935 | ) | | $ | 85,498 | |
| | | | | | | | | | | | | | | | | | | | |
35
Lincoln Benefit Life Company
(A Wholly-Owned Subsidiary of Resolution Life, Inc.)
Notes to Consolidated Financial Statements
| 4. | Derivative Financial Instruments |
See Note 2 for a description of the Company’s accounting policies for derivatives and Note 5 for information about the fair value hierarchy for derivatives.
The following table provides a summary of the notional and fair value positions of derivative financial instruments as of December 31, 2014 and 2013:
| | | | | | | | | | | | |
($ in thousands) | | Succesor | |
| | | December 31, 2014 | |
| | | | | | Gross Fair Value | |
Primary Underlying | | Notional | | | Assets | | | Liabilities | |
Assets | | | | | | | | | | | | |
Equity options | | $ | 624 | | | $ | 68,776 | | | $ | (43,104 | ) |
Futures | | | 10 | | | | 329 | | | | — | |
Liabilities | | | | | | | | | | | | |
Policyholders account balances | | | | | | | | | | | | |
Derivatives embedded in life and annuity contracts | | | | | | | | | | | | |
Equity-indexed annuity contracts(3) | | $ | 1,734,264 | | | $ | — | | | $ | (63,660 | ) |
Equity-indexed life contracts(3) | | | 347,610 | | | | — | | | | (18,720 | ) |
Guaranteed accumulation benefits(1) | | | 120,714 | | | | — | | | | (6,367 | ) |
Guaranteed withdrawal benefits(1) | | | 17,102 | | | | — | | | | (366 | ) |
| | | | | | | | | | | | | |
| |
($ in thousands) | | Predecessor | |
| | | December 31, 2013 | |
| | | | | | Gross Fair Value | |
Primary Underlying | | Notional | | | Assets | | | Liabilities | |
Liabilities | | | | | | | | | | | | |
Policyholders account balances | | | | | | | | | | | | |
Derivatives embedded in life and annuity contracts | | | | | | | | | | | | |
Equity-indexed and forward starting options in life and annuity product contracts(2) | | | 2,591,090 | | | | — | | | | (258,415 | ) |
Guaranteed accumulation benefits(2) | | | 152,936 | | | | — | | | | (8,970 | ) |
Guaranteed withdrawal benefits(2) | | | 22,199 | | | | — | | | | (474 | ) |
| (1) | As of April 1, 2014, these amounts were ceded in accordance with the Company’s reinsurance agreements. |
| (2) | Prior to April 1, 2014, these amounts were ceded to ALIC or in accordance with the Company’s reinsurance agreements. |
| (3) | Amount represents account value of equity indexed contracts. |
The standardized ISDA Master Agreement under which the Company’s derivative transactions includes provisions for payment netting. In the normal course of business activities, if there is more than one derivative transaction with a single counterparty, the Company will set-off the cash flows of those derivatives into a single amount to be exchanged in settlement of the resulting net payable or receivable with that counterparty. The Company nets the fair value of all derivative financial instruments with counterparties for which an ISDA Master Agreement and related CSA have been executed. At December 31, 2014, the Company held $6.4 million in cash and securities collateral delivered by trade counterparties. This unrestricted cash collateral is reported in Cash on the Consolidated Balance Sheet.
36
Lincoln Benefit Life Company
(A Wholly-Owned Subsidiary of Resolution Life, Inc.)
Notes to Consolidated Financial Statements
The following table presents the amount and location of gains (losses) recognized in income, net of reinsurance, for derivatives that were not designated or qualifying as hedging instruments for the Successor Period from April 1, 2014 through December 31, 2014:
| | | | | | | | |
| | | Successor | |
($ in thousands) | | For the Period from April 1, 2014
through December 31, 2014 | |
| | Realized
Investment Gains
(Losses) | | | Policyholder
Benefits | |
Assets | | | | | | | | |
Equity Options | | $ | 15,230 | | | $ | — | |
Futures | | $ | 2,187 | | | $ | — | |
Liabilities | | | | | | | | |
Policyholders’ account balances | | | | | | | | |
Equity-indexed annuity contracts | | $ | — | | | $ | (5,622 | ) |
Equity-indexed life contracts | | | | | | | 90 | |
The following table presents the amount and location of gains (losses) recognized in income for derivatives that were not designated or qualifying as hedging instruments for the Predecessor Periods from January 1, 2014 through March 31, 2014 and for the years ended December 31, 2013 and December 31, 2013:
| | | | | | | | | | | | | | | | | | | | | | | | |
($ in thousands) | | Predecessor | |
| | For the Period from January 1,
2014 through March 31, 2014 | | | For the Year Ended
December 31, 2013 | | | For the Year Ended
December 31, 2012 | |
| | Interest Credited(1) | | | Policyholder
Benefits (1) | | | Interest
Credited(1) | | | Policyholder
Benefits (1) | | | Interest
Credited(1) | | | Policyholder
Benefits (1) | |
Liabilities | | | | | | | | | | | | | | | | | | | | | | | | |
Policyholders’ account balances | | | | | | | | | | | | | | | | | | | | | | | | |
Derivatives embedded in life and annuity contracts | | $ | 16,427 | | | $ | 946 | | | $ | 36,890 | | | $ | 10,177 | | | $ | 186,625 | | | $ | 5,126 | |
| (1) | Prior to April 1, 2014, these amounts were ceded in accordance with the Company’s reinsurance agreements. |
37
Lincoln Benefit Life Company
(A Wholly-Owned Subsidiary of Resolution Life, Inc.)
Notes to Consolidated Financial Statements
Fair value is defined as the price that would be received to sell an asset or paid to transfer a liability in an orderly transaction between market participants at the measurement date. The hierarchy for inputs used in determining fair value maximizes the use of observable inputs and minimizes the use of unobservable inputs by requiring that observable inputs be used when available. Assets and liabilities recorded on the Consolidated Balance Sheet (Successor) and Balance Sheet (Predecessor) at fair value are categorized in the fair value hierarchy based on the observability of inputs to the valuation techniques as follows:
| | |
Level 1 | | Assets and liabilities whose values are based on unadjusted quoted prices for identical assets or liabilities in an active market that the Company can access. |
| |
| Level 2 | | Assets and liabilities whose values are based on the following: |
| |
| | (a) Quoted prices for similar assets or liabilities in active markets; |
| |
| | (b) Quoted prices for identical or similar assets or liabilities in markets that are not active; or |
| |
| | (c) Valuation models whose inputs are observable, directly or indirectly, for substantially the full term of the asset or liability. |
| |
Level 3 | | Assets and liabilities whose values are based on prices or valuation techniques that require inputs that are both unobservable and significant to the overall fair value measurement. Unobservable inputs reflect the Company’s estimates of the assumptions that market participants would use in valuing the assets and liabilities. |
The availability of observable inputs varies by instrument. In situations where fair value is based on internally developed pricing models or inputs that are unobservable in the market, the determination of fair value requires more judgment. The degree of judgment exercised by the Company in determining fair value is typically greatest for instruments categorized in Level 3. In many instances, valuation inputs used to measure fair value fall into different levels of the fair value hierarchy. The category level in the fair value hierarchy is determined based on the lowest level input that is significant to the fair value measurement in its entirety. The Company uses prices and inputs that are current as of the measurement date, including during periods of market disruption. In periods of market disruption, the ability to observe prices and inputs may be reduced for many instruments.
The Company is responsible for the determination of fair value and the supporting assumptions and methodologies. The Company gains assurance that assets and liabilities are appropriately valued through the execution of various processes and controls designed to ensure the overall reasonableness and consistent application of valuation methodologies, including inputs and assumptions, and compliance with accounting standards. For fair values received from third parties or internally estimated, the Company’s processes and controls are designed to ensure that the valuation methodologies are appropriate and consistently applied, the inputs and assumptions are reasonable and consistent with the objective of determining fair value, and the fair values are accurately recorded. For example, on a continuing basis, the Company assesses the reasonableness of individual fair values that have stale security prices or that exceed certain thresholds as compared to previous fair values received from valuation service providers or brokers or derived from internal models. The Company performs procedures to understand and assess the methodologies, processes and controls of valuation service providers. In addition, the Company may validate the reasonableness of fair values by comparing information obtained from valuation service providers or brokers to other third party valuation sources for selected securities. The Company performs ongoing price validation procedures such as back-testing of actual sales, which corroborate the various inputs used in internal models to market observable data. When fair value determinations are expected to be more variable, the Company validates them through reviews by members of management who have relevant expertise and who are independent of those charged with executing investment transactions.
38
Lincoln Benefit Life Company
(A Wholly-Owned Subsidiary of Resolution Life, Inc.)
Notes to Consolidated Financial Statements
Successor
The following table summarizes the Company’s assets and liabilities measured at fair value on a recurring basis as of December 31, 2014. There are no assets or liabilities measured at fair value on a nonrecurring basis as of December 31, 2014.
| | | | | | | | | | | | | | | | |
| ($ in thousands) | | | | | | | | | | | | |
Description for Each Class of Asset or Liability | | Level 1 | | | Level 2 | | | Level 3 | | | Total | |
Assets at fair value | | | | | | | | | | | | | | | | |
Fixed maturities | | | | | | | | | | | | | | | | |
U.S Treasury Securities and Obligations of U.S. Government Authority and Agencies | | $ | — | | | $ | 857,326 | | | $ | — | | | $ | 857,326 | |
Obligations of U.S. States and Political Subdivisions | | | — | | | | 255,209 | | | | — | | | | 255,209 | |
All Other Corporate Securities | | | — | | | | 7,370,409 | | | | 7,336 | | | | 7,377,745 | |
ABS | | | — | | | | 371,753 | | | | 5,250 | | | | 377,003 | |
CMBS | | | — | | | | 330,790 | | | | 2,693 | | | | 333,483 | |
RMBS | | | — | | | | 189,881 | | | | — | | | | 189,881 | |
Short term investments | | | 191,979 | | | | 145,676 | | | | 23,713 | | | | 361,368 | |
Other invested assets | | | | | | | | | | | | | | | | |
Equity Options | | | 25,672 | | | | — | | | | — | | | | 25,672 | |
Futures | | | 329 | | | | — | | | | — | | | | 329 | |
Separate accounts assets | | | 1,573,865 | | | | — | | | | — | | | | 1,573,865 | |
| | | | | | | | | | | | | | | | |
Total assets at fair value | | $ | 1,791,845 | | | $ | 9,521,044 | | | $ | 38,992 | | | $ | 11,351,881 | |
| | | | | | | | | | | | | | | | |
Liabilities at fair value | | | | | | | | | | | | | | | | |
Policyholders’ account balances | | | | | | | | | | | | | | | | |
Equity indexed annuity contracts | | $ | — | | | $ | — | | | $ | (63,660 | ) | | $ | (63,660 | ) |
Equity indexed life contracts | | | — | | | | (18,720 | ) | | | — | | | | (18,720 | ) |
Guaranteed minimum accumulation benefits | | | — | | | | — | | | | (6,367 | ) | | | (6,367 | ) |
Guaranteed minimum withdrawal benefits | | | | | | | | | | | (366 | ) | | | (366 | ) |
Separate accounts liabilities | | | (1,573,865 | ) | | | — | | | | — | | | | (1,573,865 | ) |
| | | | | | | | | | | | | | | | |
Total liabilites at fair value | | $ | (1,573,865 | ) | | $ | (18,720 | ) | | $ | (70,393 | ) | | $ | (1,662,978 | ) |
| | | | | | | | | | | | | | | | |
There were no transfers between Level 1 and Level 2 from the period from April 1, 2014 through December 31, 2014.
Summary of significant valuation techniques for assets and liabilities measured at fair value on a recurring basis
Fixed Maturities
The fair values of the Company’s public fixed maturity securities are generally based on prices obtained from independent pricing services. Prices for each security are generally sourced from multiple pricing vendors, and a vendor hierarchy is maintained by asset type based on historical pricing experience and vendor expertise. The Company ultimately uses the price from the pricing service highest in the vendor hierarchy based on the respective asset type. The pricing hierarchy is updated for new financial products and recent pricing experience with various vendors. Consistent with the fair value hierarchy described above, securities with validated quotes from pricing services are generally reflected within Level 2, as they are primarily based on observable pricing for similar assets and/or other market observable inputs. Typical inputs used by these pricing services include but are not limited to reported trades, benchmark yields, issuer spreads, bids, offers, and/or estimated cash flow,
39
Lincoln Benefit Life Company
(A Wholly-Owned Subsidiary of Resolution Life, Inc.)
Notes to Consolidated Financial Statements
prepayment speeds, and default rates. If the pricing information received from third party pricing services is deemed not reflective of market activity or other inputs observable in the market, the Company may challenge the price through a formal process with the pricing service or classify the securities as Level 3. If the pricing service updates the price to be more consistent with the presented market observations, the security remains within Level 2.
Indicative broker quotes are also used to determine fair value in circumstances where vendor pricing is not available, or where the Company ultimately concludes that pricing information received from independent pricing services is not reflective of market activity. If the Company concludes the values from both pricing services and brokers are not reflective of market activity, it may override the information with an internally-developed valuation. Pricing service overrides, internally-developed valuations and indicative broker quotes are generally included in Level 3 in the fair value hierarchy.
The fair value of private fixed maturities, which are comprised of investments in private placement securities are primarily determined using discounted cash flow models. These models primarily use observable inputs that include Treasury or similar base rates plus estimated credit spreads to value each security. The credit spreads are obtained through a survey of private market intermediaries who are active in both primary and secondary transactions, and consider, among other factors, the credit quality and industry sector of the issuer and the reduced liquidity associated with private placements. Since most private placements are valued using standard market observable inputs and inputs derived from, or corroborated by, market observable data including observed prices and spreads for similar publicly traded or privately traded issues, they have been reflected within Level 2. For certain private fixed maturities, the discounted cash flow model may incorporate significant unobservable inputs, which reflect the Company’s own assumptions about the inputs that market participants would use in pricing the asset. To the extent management determines that such unobservable inputs are significant to the price of a security, a Level 3 classification is made. No private placement securities were classified as Level 3 as of December 31, 2014.
Short-term Investments
Short-term investments include money market instruments, highly liquid debt instruments and certain other investments. Certain money market instruments are valued using unadjusted quoted prices in active markets that are accessible for identical assets and are primarily classified as Level 1. The remaining instruments in this category are generally fair valued based on market observable inputs and these investments have primarily been classified within Level 2. Short-term investments classified within Level 3 primarily consist of commercial mortgage loans. The fair value of commercial mortgage loans is equal to unpaid principal.
Other Invested Assets
The estimated fair value of derivatives is determined through the use of quoted market prices for exchange-traded derivatives.
Separate Account Assets and Liabilities
Separate account assets and liabilities consist principally of investments in mutual fund shares. The fair values are based on quoted market prices in active markets for identical assets and are classified within Level 1 in the fair value hierarchy.
40
Lincoln Benefit Life Company
(A Wholly-Owned Subsidiary of Resolution Life, Inc.)
Notes to Consolidated Financial Statements
Policyholders’ Account Balances
The liabilities for guarantees primarily associated with the optional living benefit features of certain variable annuity contracts and equity indexed life and annuity contracts are calculated as the present value of future expected benefit payments to contractholders less the present value of assessed rider fees attributable to the optional living benefit feature. This methodology could result in either a liability or contra-liability balance, given changing capital market conditions and various actuarial assumptions. Since there is no observable active market for the transfer of these obligations, the valuations are calculated using internally developed models with option pricing techniques. The models are based on a risk neutral valuation framework and incorporate premiums for risks inherent in valuation techniques, inputs, and the general uncertainty around the timing and amount of future cash flows. The determination of these risk premiums requires the use of management judgment.
The significant inputs to the valuation models for these embedded derivatives include capital market assumptions, such as interest rate levels and volatility assumptions, as well as actuarially determined assumptions, including contractholder behavior, such as lapse rates, benefit utilization rates, withdrawal rates, and mortality rates. Since many of these assumptions are unobservable and are considered to be significant inputs to the liability valuation, the liability included in future policy benefits has been reflected within Level 3 in the fair value hierarchy.
Actuarial assumptions, including contractholder behavior and mortality, are reviewed at least annually, and updated based upon emerging experience, future expectations and other data, including any observable market data. These assumptions are generally updated annually unless a material change that the Company feels is indicative of a long term trend is observed in an interim period.
Level 3 Fair Value Measurements
The following table summarizes quantitative information about the significant unobservable inputs used in Level 3 fair value measurements.
| | | | | | | | | | | | |
($ in thousands) | | Fair
Value | | | Valuation
Technique | | Unobservable
Input | | Range | | Weighted
Average |
Equity indexed annuity contracts | | $ | (63,660 | ) | | Option Pricing Technique | | Projected option cost | | 1.40% - 1.93% | | 1.50% |
Excluded from the table above at December 31, 2014 are approximately $15 million of Level 3 fair value measurements of investments for which the underlying quantitative inputs are not developed by the Company and are not reasonably available. These investments primarily consist of certain public debt securities with limited trading activity, including asset-backed instruments, and their fair values generally reflect unadjusted prices obtained from independent valuation service providers and indicative, non-binding quotes obtained from third-party broker-dealers recognized as market participants. Significant increases or decreases in the fair value amounts received from these pricing sources may result in the Company’s reporting significantly higher or lower fair value measurements for these Level 3 investments.
The table above also excludes underlying quantitative inputs related to liabilities held for the Company’s guaranteed minimum accumulation benefits and guaranteed withdrawal benefits. These liabilities are not developed by the Company as they are 100% ceded to external reinsurers. The development of these liabilities generally involve actuarially determined models and could result in the Company reporting significantly higher or lower fair value measurements for these Level 3 investments.
41
Lincoln Benefit Life Company
(A Wholly-Owned Subsidiary of Resolution Life, Inc.)
Notes to Consolidated Financial Statements
The following table presents the rollforward of Level 3 assets and liabilities held at fair value on a recurring basis from the period from April 1, 2014 through December 31, 2014:
| | | | | | | | | | | | | | | | | | | | | | | | | | | | | | | | | | | | | | | | |
| ($ in thousands) | | Balance
as of
April 1,
2014 | | | Net
income
(loss) | | | OCI | | | Transfers
to Level 3 | | | Transfers
out of
Level 3 | | | Purchases | | | Sales | | | Issues | | | Settlements | | | Balance,
December 31,
2014 | |
Assets | | | | | | | | | | | | | | | | | | | | | | | | | | | | | | | | | | | | | | | | |
Fixed income securities | | | | | | | | | | | | | | | | | | | | | | | | | | | | | | | | | | | | | | | | |
All other corporate securities | | $ | 400,527 | | | $ | 6,693 | | | $ | (7,841 | ) | | $ | — | | | $
| (291,802
| )
| | $ | 4,930 | | | $ | (97,228 | ) | | $ | — | | | $ | — | | | $ | 15,279 | |
Short-term investments | | $ | 24,095 | | | $ | 29 | | | $ | — | | | $ | — | | | $ | — | | | $ | — | | | $ | (411 | ) | | $ | — | | | $ | — | | | $ | 23,713 | |
Liabilities | | | | | | | | | | | | | | | | | | | | | | | | | | | | | | | | | | | | | | | | |
Equity indexed annuity contracts | | $ | (58,038 | ) | | $ | (5,622 | ) | | $ | — | | | $ | — | | | $ | — | | | $ | — | | | $ | — | | | $ | — | | | $ | — | | | $ | (63,660 | ) |
Equity indexed life contracts | | $ | (15,691 | ) | | $ | (3,029 | ) | | $ | — | | | $ | — | | | $ | — | | | $ | — | | | $ | — | | | $ | — | | | $ | — | | | $ | (18,720 | ) |
Guaranteed minimium accumulation benefits and guaranteed minimum withdrawal benefits(1) | | $ | (8,499 | ) | | $ | 1,766 | | | $ | — | | | $ | — | | | $ | — | | | $ | — | | | $ | — | | | $ | — | | | $ | — | | | $ | (6,733 | ) |
| (1) | These amount are 100% ceded in accordance with the Company’s reinsurance agreements. |
Transfers into Level 3 are generally the result of unobservable inputs utilized within the valuation methodologies and the use of indicative broker quotes for assets that were previously valued using observable inputs. Transfers out of Level 3 are generally due to the use of observable inputs in valuation methodologies as well as the availability of pricing service information for certain assets that the Company is able to validate.
The following table presents the carrying amount and fair value by fair value hierarchy level of certain financial instruments that are not reported at fair value. The financial instruments presented below are reported at carrying value on the Company’s Consolidated Balance Sheet; however, in some cases, as described below, the carrying amount equals or approximates fair value as of December 31, 2014.
| | | | | | | | | | | | | | | | |
| ($ in thousands) | | | | | | | | | | | | |
Description for Each Class of Asset or Liability | | Level 1 | | | Level 2 | | | Level 3 | | | Total | |
Assets | | | | | | | | | | | | | | | | |
Commercial mortgage loans | | $ | — | | | $ | — | | | $ | 1,150,510 | | | $ | 1,150,510 | |
Policy loans | | | — | | | | — | | | | 194,385 | | | | 194,385 | |
Cash | | | 49,730 | | | | — | | | | — | | | | 49,730 | |
Vehicle note | | | — | | | | — | | | | 551,600 | | | | 551,600 | |
| | | | | | | | | | | | | | | | |
Total assets at fair value | | $ | 49,730 | | | $ | — | | | $ | 1,896,495 | | | $ | 1,946,225 | |
| | | | | | | | | | | | | | | | |
Liabilities at fair value | | | | | | | | | | | | | | | | |
Policyholders’ account balances — investment contracts | | $ | — | | | $ | — | | | $ | 6,609,253 | | | $ | 6,609,253 | |
Other long-term debt | | | — | | | | — | | | | 551,600 | | | | 551,600 | |
| | | | | | | | | | | | | | | | |
| | $ | — | | | $ | — | | | $ | 7,160,853 | | | $ | 7,160,853 | |
| | | | | | | | | | | | | | | | |
The fair values presented above have been determined by using available market information and by applying market valuation methodologies, as described in more detail below.
42
Lincoln Benefit Life Company
(A Wholly-Owned Subsidiary of Resolution Life, Inc.)
Notes to Consolidated Financial Statements
Commercial Mortgage Loans
The fair value of most commercial mortgage loans is based upon the present value of the expected future cash flows discounted at the appropriate U.S. Treasury rate plus an appropriate credit spread for similar quality loans.
Policy Loans
The fair value of policy loans was determined by discounting expected cash flows at the current loan coupon rate. As a result, the carrying value of the policy loans approximates the fair value.
Cash
The Company believes that due to the short-term nature of certain assets, the carrying value approximates fair value.
Vehicle Note and Other Long-Term Debt
The carrying value of the Vehicle Note and Other long-term debt approximates fair value.
Policyholders’ Account Balances — Investment Contracts
Only the portion of policyholders’ account balances related to products that are investment contracts (those without significant mortality or morbidity risk) are reflected in the table above. For fixed deferred annuities fair values are derived using discounted projected cash flows based on interest rates that are representative of the Company’s financial strength ratings, and hence reflect the Company’s own nonperformance risk. For those balances that can be withdrawn by the customer at any time without prior notice or penalty, the fair value is the amount estimated to be payable to the customer as of the reporting date, which is generally the carrying value.
Predecessor
Summary of significant valuation techniques for assets and liabilities measured at fair value on a recurring basis
Level 1 Measurements
| | • | | Fixed maturities: Comprise certain U.S. Treasuries. Valuation is based on unadjusted quoted prices for identical assets in active markets that the Company can access. |
| | • | | Short-term: Comprise actively traded money market funds that have daily quoted net asset values for identical assets that the Company can access. |
| | • | | Separate account assets: Comprise actively traded mutual funds that have daily quoted net asset values for identical assets that the Company can access. Net asset values for the actively traded mutual funds in which the separate account assets are invested are obtained daily from the fund managers. |
Level 2 Measurements
U.S. government and agencies: The primary inputs to the valuation include quoted prices for identical or similar assets in markets that are not active, contractual cash flows, benchmark yields and credit spreads.
43
Lincoln Benefit Life Company
(A Wholly-Owned Subsidiary of Resolution Life, Inc.)
Notes to Consolidated Financial Statements
Municipal: The primary inputs to the valuation include quoted prices for identical or similar assets in markets that are not active, contractual cash flows, benchmark yields and credit spreads.
Corporate, including privately placed: The primary inputs to the valuation include quoted prices for identical or similar assets in markets that are not active, contractual cash flows, benchmark yields and credit spreads. Also included are privately placed securities valued using a discounted cash flow model that is widely accepted in the financial services industry and uses market observable inputs and inputs derived principally from, or corroborated by, observable market data. The primary inputs to the discounted cash flow model include an interest rate yield curve, as well as published credit spreads for similar assets in markets that are not active that incorporate the credit quality and industry sector of the issuer.
Foreign government: The primary inputs to the valuation include quoted prices for identical or similar assets in markets that are not active, contractual cash flows, benchmark yields and credit spreads.
RMBS: The primary inputs to the valuation include quoted prices for identical or similar assets in markets that are not active, contractual cash flows, benchmark yields, prepayment speeds, collateral performance and credit spreads.
CMBS: The primary inputs to the valuation include quoted prices for identical or similar assets in markets that are not active, contractual cash flows, benchmark yields, collateral performance and credit spreads.
| | • | | Short-term: The primary inputs to the valuation include quoted prices for identical or similar assets in markets that are not active, contractual cash flows, benchmark yields and credit spreads. For certain short-term investments, amortized cost is used as the best estimate of fair value. |
Level 3 Measurements
| | • | | Policyholder account balances — Successor; contract holder funds Predessor: Derivatives embedded in certain life and annuity contracts are valued internally using models widely accepted in the financial services industry that determine a single best estimate of fair value for the embedded derivatives within a block of contractholder liabilities. The models primarily use stochastically determined cash flows based on the contractual elements of embedded derivatives, projected option cost and applicable market data, such as interest rate yield curves and equity index volatility assumptions. These are categorized as Level 3 as a result of the significance of nonmarket observable inputs. |
44
Lincoln Benefit Life Company
(A Wholly-Owned Subsidiary of Resolution Life, Inc.)
Notes to Consolidated Financial Statements
The following table summarizes the Company’s assets and liabilities measured at fair value on a recurring basis as of December 31, 2013. There were no assets or liabilities measured at fair value on a non-recurring basis as of December 31, 2013.
| | | | | | | | | | | | | | | | |
($ in thousands) | | Quoted
prices in
active
markets for
identical
assets
(Level 1) | | | Significant
other
observable
inputs
(Level 2) | | | Significant
unobservable
inputs
(Level 3) | | | Balance as of
December 31,
2013 | |
Assets: | | | | | | | | | | | | | | | | |
Fixed maturities: | | | | | | | | | | | | | | | | |
U.S. government and agencies | | $ | 27,520 | | | $ | 46,326 | | | $ | — | | | $ | 73,846 | |
Municipal | | | — | | | | 2,769 | | | | — | | | | 2,769 | |
Corporate | | | — | | | | 191,977 | | | | — | | | | 191,977 | |
Foreign government | | | — | | | | 5,164 | | | | — | | | | 5,164 | |
RMBS | | | — | | | | 14,450 | | | | — | | | | 14,450 | |
CMBS | | | — | | | | 2,676 | | | | — | | | | 2,676 | |
| | | | | | | | | | | | | | | | |
Total fixed maturities | | | 27,520 | | | | 263,362 | | | | — | | | | 290,882 | |
Short-term investments | | | 20,764 | | | | 35,195 | | | | — | | | | 55,959 | |
Separate account assets | | | 1,700,566 | | | | — | | | | — | | | | 1,700,566 | |
| | | | | | | | | | | | | | | | |
Total assets at fair value | | $ | 1,748,850 | | | $ | 298,557 | | | $ | — | | | $ | 2,047,407 | |
| | | | | | | | | | | | | | | | |
% of total assets at fair value | | | 85.4 | % | | | 14.6 | % | | | — | % | | | 100.0 | % |
Liabilities: | | | | | | | | | | | | | | | | |
Policyholders’ account balances: Derivatives embedded in life and annuity contracts | | $ | — | | | $ | — | | | $ | (267,859 | ) | | $ | (267,859 | ) |
| | | | | | | | | | | | | | | | |
Total liabilities at fair value | | $ | — | | | $ | — | | | $ | (267,859 | ) | | $ | (267,859 | ) |
| | | | | | | | | | | | | | | | |
% of total liabilities at fair value | | | — | % | | | — | % | | | 100.0 | % | | | 100.0 | % |
45
Lincoln Benefit Life Company
(A Wholly-Owned Subsidiary of Resolution Life, Inc.)
Notes to Consolidated Financial Statements
The following table summarizes quantitative information about the significant unobservable inputs used in Level 3 fair value measurements as of December 31, 2013:
| | | | | | | | | | | | |
($ in thousands) | | Fair Value | | | Valuation
Technique | | Unobservable
Input | | Range | | Weighted
Average |
Derivatives embedded in life and annuity contracts — Equity-indexed and forward starting options | | $ | (258,415 | ) | | Stochastic cash
flow model | | Projected option
cost | | 1.0 - 2.0% | | 1.91% |
If the projected option cost increased (decreased), it would result in a higher (lower) liability fair value.
The following table presents the rollforward of Level 3 assets and liabilities held at fair value on a recurring basis during the period from January 1, 2014 through March 31, 2014.
| | | | | | | | | | | | | | | | | | | | |
($ in thousands) | | | | | Total gains (losses)
included in: | | | | | | | |
| | Balance as
of December 31,
2013 | | | Net
income(1) | | | OCI | | | Transfers
into
Level 3 | | | Transfers
out of
Level 3 | |
Liabilities | | | | | | | | | | | | |
Policyholders’ account balances: | | | | | | | | | | | | | | | | | | | | |
Derivatives embedded in life and annuity contracts | | $ | (267,859 | ) | | $ | 18,525 | | | $ | — | | | $ | — | | | $ | — | |
| | | | | | | | | | | | | | | | | | | | |
Total recurring Level 3 liabilities | | $ | (267,859 | ) | | $ | 18,525 | | | $ | — | | | $ | — | | | $ | — | |
| | | | | | | | | | | | | | | | | | | | |
| | | | | |
| | | Purchases | | | Sales | | | Issues | | | Settlements | | | Balance as
of March 31,
2014 | |
Liabilities | | | | | | | | | | | | |
Policyholders’ account balances: | | | | | | | | | | | | | | | | | | | | |
Derivatives embedded in life and annuity contracts | | $ | — | | | $ | — | | | $ | (3,764 | ) | | $ | 2,612 | | | $ | (250,486 | ) |
| | | | | | | | | | | | | | | | | | | | |
Total recurring Level 3 liabilities | | $ | — | | | $ | — | | | $ | (3,764 | ) | | $ | 2,612 | | | $ | (250,486 | ) |
| | | | | | | | | | | | | | | | | | | | |
| (1) | The amount attributable to derivatives embedded in life and annuity contracts was reported as follows: $17.6 million in interest credited to contractholder funds and $946 thousand in contract benefits. These amounts were ceded in accordance with the Company’s reinsurance agreements. |
46
Lincoln Benefit Life Company
(A Wholly-Owned Subsidiary of Resolution Life, Inc.)
Notes to Consolidated Financial Statements
The following table presents the rollforward of Level 3 assets and liabilities held at fair value on a recurring basis during the year ended December 31, 2013.
| | | | | | | | | | | | | | | | | | | | |
($ in thousands) | | | | | Total gains (losses)
included in: | | | | | | | |
| | Balance as
of December 31,
2012 | | | Net
income(1) | | | OCI | | | Transfers
into
Level 3 | | | Transfers
out of
Level 3 | |
Assets | | | | | | | | | | | | | | | | | | | | |
Fixed maturities: | | | | | | | | | | | | | | | | | | | | |
Corporate | | $ | 312 | | | $ | — | | | $ | — | | | $ | — | | | $ | — | |
| | | | | | | | | | | | | | | | | | | | |
Total recurring Level 3 assets | | $ | 312 | | | $ | — | | | $ | — | | | $ | — | | | $ | — | |
| | | | | | | | | | | | | | | | | | | | |
Liabilities | | | | | | | | | | | | | | | | | | | | |
Policyholders’ account balances: | | | | | | | | | | | | | | | | | | | | |
Derivatives embedded in life and annuity contracts | | $ | (314,926 | ) | | $ | 43,244 | | | $ | — | | | $ | — | | | $ | — | |
| | | | | | | | | | | | | | | | | | | | |
Total recurring Level 3 liabilities | | $ | (314,926 | ) | | $ | 43,244 | | | $ | — | | | $ | — | | | $ | — | |
| | | | | | | | | | | | | | | | | | | | |
| | | | | | | | | | | | | | | | | | | | |
| | | Purchases | | | Sales | | | Issues | | | Settlements | | | Balance as
of December 31,
2013 | |
Assets | | | | | | | | | | | | | | | | | | | | |
Fixed maturities: | | | | | | | | | | | | | | | | | | | | |
Corporate | | $ | — | | | $ | — | | | $ | — | | | $ | (312 | ) | | $ | — | |
| | | | | | | | | | | | | | | | | | | | |
Total recurring Level 3 assets | | $ | — | | | $ | — | | | $ | — | | | $ | (312 | ) | | $ | — | |
| | | | | | | | | | | | | | | | | | | | |
Liabilities | | | | | | | | | | | | | | | | | | | | |
Policyholders’ account balances: | | | | | | | | | | | | | | | | | | | | |
Derivatives embedded in life and annuity contracts | | $ | — | | | $ | — | | | $ | (6,621 | ) | | $ | 10,444 | | | $ | (267,859 | ) |
| | | | | | | | | | | | | | | | | | | | |
Total recurring Level 3 liabilities | | $ | — | | | $ | — | | | $ | (6,621 | ) | | $ | 10,444 | | | $ | (267,859 | ) |
| | | | | | | | | | | | | | | | | | | | |
| (1) | The amount attributable to derivatives embedded in life and annuity contracts was reported as follows: $33.0 million in interest credited to contractholder funds and $10.2 million in contract benefits. These amounts were ceded in accordance with the Company’s reinsurance agreements. |
47
Lincoln Benefit Life Company
(A Wholly-Owned Subsidiary of Resolution Life, Inc.)
Notes to Consolidated Financial Statements
The following table presents the rollforward of Level 3 assets and liabilities held at fair value on a recurring basis during the year ended December 31, 2012.
| | | | | | | | | | | | | | | | | | | | |
($ in thousands) | | | | | Total gains (losses)
included in: | | | | | | | |
| | Balance as
of December 31,
2011 | | | Net
income(1) | | | OCI | | | Transfers
into
Level 3 | | | Transfers
out of
Level 3 | |
Assets | | | | | | | | | | | | | | | | | | | | |
Fixed maturities: | | | | | | | | | | | | | | | | | | | | |
Corporate | | $ | 598 | | | $ | — | | | $ | — | | | $ | — | | | $ | — | |
RMBS | | | 2,321 | | | | — | | | | — | | | | — | | | | (2,321 | ) |
| | | | | | | | | | | | | | | | | | | | |
Total recurring Level 3 assets | | $ | 2,919 | | | $ | — | | | $ | — | | | $ | — | | | $ | (2,321 | ) |
| | | | | | | | | | | | | | | | | | | | |
Liabilities | | | | | | | | | | | | | | | | | | | | |
Policyholders’ account balances: | | | | | | | | | | | | | | | | | | | | |
Derivatives embedded in life and annuity contracts | | $ | (506,678 | ) | | $ | 131,054 | | | $ | — | | | $ | — | | | $ | — | |
| | | | | | | | | | | | | | | | | | | | |
Total recurring Level 3 liabilities | | $ | (506,678 | ) | | $ | 131,054 | | | $ | — | | | $ | — | | | $ | — | |
| | | | | | | | | | | | | | | | | | | | |
| | | | | |
| | | Purchases | | | Sales | | | Issues | | | Settlements | | | Balance as
of December 31,
2012 | |
Assets | | | | | | | | | | | | | | | | | | | | |
Fixed maturities: | | | | | | | | | | | | | | | | | | | | |
Corporate | | $ | — | | | $ | — | | | $ | — | | | $ | (286 | ) | | $ | 312 | |
RMBS | | | — | | | | — | | | | — | | | | — | | | | — | |
| | | | | | | | | | | | | | | | | | | | |
Total recurring Level 3 assets | | $ | — | | | $ | — | | | $ | — | | | $ | (286 | ) | | $ | 312 | |
| | | | | | | | | | | | | | | | | | | | |
Liabilities | | | | | | | | | | | | | | | | | | | | |
Policyholders’ account balances: | | | | | | | | | | | | | | | | | | | | |
Derivatives embedded in life and annuity contracts | | $ | — | | | $ | — | | | $ | (11,024 | ) | | $ | 71,722 | | | $ | (314,926 | ) |
| | | | | | | | | | | | | | | | | | | | |
Total recurring Level 3 liabilities | | $ | — | | | $ | — | | | $ | (11,024 | ) | | $ | 71,722 | | | $ | (314,926 | ) |
| | | | | | | | | | | | | | | | | | | | |
| (1) | The amount attributable to derivatives embedded in life and annuity contracts was reported as follows: $125.9 million in interest credited to contractholder funds and $5.1 million in contract benefits. These amounts were ceded in accordance with the Company’s reinsurance agreements. |
Transfers between level categorizations may occur due to changes in the availability of market observable inputs, which generally are caused by changes in market conditions such as liquidity, trading volume or bid-ask spreads. Transfers between level categorizations may also occur due to changes in the valuation source. For example, in situations where a fair value quote is not provided by the Company’s independent third-party valuation service provider and as a result the price is stale or has been replaced with a broker quote whose inputs have not been corroborated to be market observable, the security is transferred into Level 3. Transfers in and out of level categorizations are reported as having occurred at the beginning of the quarter in which the transfer occurred. Therefore, for all transfers into Level 3, all realized and changes in unrealized gains and losses in the quarter of transfer are reflected in the Level 3 rollforward table.
48
Lincoln Benefit Life Company
(A Wholly-Owned Subsidiary of Resolution Life, Inc.)
Notes to Consolidated Financial Statements
There were no transfers between Level 1 and Level 2 during the period from January 1, 2014 through March 31, 2014, 2013 or 2012.
Transfers out of Level 3 during 2012 included situations where a broker quote was used in the prior period and a fair value quote became available from the Company’s independent third-party valuation service provider in the current period. A quote utilizing the new pricing source was not available as of the prior period, and any gains or losses related to the change in valuation source for individual securities were not significant.
The following table provides the change in unrealized gains and losses included in net income for Level 3 assets and liabilities.
| | | | | | | | | | | | |
($ in thousands) | | Period from
January 1,
2014 through
March 31,
2014 | | | As of
December 31, 2013 | | | As of
December 31, 2012 | |
Liabilities | | | | | | | | | | | | |
Policyholders’ account balances: | | | | | | | | | | | | |
Derivatives embedded in life and annuity contracts | | $ | 18,525 | | | $ | 43,244 | | | $ | 131,054 | |
| | | | | | | | | | | | |
Total recurring Level 3 liabilities | | $ | 18,525 | | | $ | 43,244 | | | $ | 131,054 | |
| | | | | | | | | | | | |
The amounts in the table above represent the change in unrealized gains and losses included in net income for the period of time that the asset or liability was determined to be in Level 3. The amount attributable to derivatives embedded in life and annuity contracts is reported as follows: $17.6 million in interest credited to contractholder funds and $946 thousand in contract benefits in the period from January 1, 2014 through March 31, 2014, $33.0 million in interest credited to contractholder funds and $10.2 million in contract benefits in 2013, and $125.9 million in interest credited to contractholder funds and $5.1 million in contract benefits in 2012. These amounts are ceded in accordance with the Company’s reinsurance agreements.
As of December 31, 2013, financial instruments not carried at fair value included contractholder funds on investment contracts. The carrying value and fair value of contractholder funds on investment contracts were $7.76 billion and $7.66 billion, respectively, as of December 31, 2013. The fair value of contractholder funds on investment contracts is based on the terms of the underlying contracts utilizing prevailing market rates for similar contracts adjusted for the Company’s own credit risk. Deferred annuities included in contractholder funds are valued using discounted cash flow models which incorporate market value margins, which are based on the cost of holding economic capital, and the Company’s own credit risk. Immediate annuities without life contingencies are valued at the present value of future benefits using market implied interest rates which include the Company’s own credit risk. The fair value measurements for contractholder funds on investment contracts are categorized as Level 3.
Successor
The Company has agreements that provide for reinsurance of certain policy-related risks. Under the agreements, premiums, contract charges, interest credited to policyholder funds, policy benefits and substantially all expenses are reinsured. The Company purchases reinsurance to limit aggregate and single losses on large risks. The Company cedes a portion of the mortality risk on certain life policies under coinsurance agreements to a pool of twelve non-affiliated reinsurers. As of December 31, 2014, approximately 99.8% of the Company’s reinsurance recoverables are due from companies rated A- or better by S&P. ALIC represents over 65% of the Company’s reinsurance recoverable as of December 31, 2014.
49
Lincoln Benefit Life Company
(A Wholly-Owned Subsidiary of Resolution Life, Inc.)
Notes to Consolidated Financial Statements
On April 1, 2014, the Company entered into an experience rated modified coinsurance and monthly renewal term reinsurance arrangement with an external reinsurer. No portion of the assets constituting the consideration has been transferred to the reinsurer. This agreement was structured to finance reserves on certain universal life and fixed annuity products, in exchange for a fee based on those reserves. The profit to the reinsurer expected on the modified coinsurance and monthly renewable term portions is returned through an experience refund. The Company has determined that this agreement does not fulfill the requirements of risk transfer under generally accepted accounting principles and is accounted for on a deposit method of accounting. As of December 31, 2014, the Company had a deposit receivable and a modified coinsurance payable of $1,383 million related to this agreement.
The effects of reinsurance on premiums earned and fee income from policyholders for the Successor Period for the period April 1, 2014 through December 31, 2014 were as follows:
| | | | |
($ in thousands) | | For the Period from
April 1, 2014
Through December 31,
2014 | |
Direct | | $ | 921,444 | |
Assumed | | | 5,258 | |
Ceded | | | (702,833 | ) |
| | | | |
Premiums and fee income, net of reinsurance | | $ | 223,869 | |
| | | | |
|
The effects of reinsurance on return credited to policyholders’ account balances, policyholder benefits, and other expenses for the Successor Period for the period April 1, 2014 through December 31, 2014 were as follows: |
| | | | |
($ in thousands) | | For the Period from
April 1, 2014
Through December 31,
2014 | |
Direct | | $ | 1,104,420 | |
Assumed | | | 4,713 | |
Ceded | | | (635,887 | ) |
| | | | |
Return credited to policyholders’ account balances and policyholder benefits, net of reinsurance | | $ | 473,246 | |
| | | | |
Predecessor
Prior to April 1, 2014, the Company had reinsurance agreements under which it reinsured all of its business to ALIC, Lincoln Benefit Re (“LB Re”) or non-affiliated reinsurers. Under the agreements, premiums, contract charges, interest credited to policyholders account balances, contract benefits and substantially all expenses were reinsured. The Company purchased reinsurance to limit aggregate and single losses on large risks. The Company ceded a portion of the mortality risk on certain life policies under coinsurance agreements to a pool of twelve non-affiliated reinsurers.
As of December 31, 2013, 86.9% of the total reinsurance recoverables were related to ALIC and 13.1% were related to non-affiliated reinsurers. As of December 31, 2013, 95% of the Company’s non-affiliated reinsurance recoverables are due from companies rated A- or better by S&P.
50
Lincoln Benefit Life Company
(A Wholly-Owned Subsidiary of Resolution Life, Inc.)
Notes to Consolidated Financial Statements
The effects of reinsurance on premiums and contract charges are as follows:
| | | | | | | | | | | | |
($ in thousands) | | Period from January 1, 2014
through March 31, 2014 | | | 2013 | | | 2012 | |
Direct | | $ | 331,899 | | | $ | 1,331,597 | | | $ | 1,298,864 | |
Assumed | | | 1,581 | | | | 6,830 | | | | 6,784 | |
Ceded: | | | | | | | | | | | | |
Affiliate | | | (244,797 | ) | | | (962,576 | ) | | | (908,459 | ) |
Non-affiliate | | | (88,683 | ) | | | (375,851 | ) | | | (397,189 | ) |
| | | | | | | | | | | | |
Premiums and fee income, net of reinsurance | | $ | — | | | $ | — | | | $ | — | |
| | | | | | | | | | | | |
The effects of reinsurance on return credited to policyholders’ account balances, policyholder benefits and other expenses are as follows:
| | | | | | | | | | | | |
($ in thousands) | | Period from January 1, 2014
through March 31, 2014 | | | 2013 | | | 2012 | |
Direct | | $ | 450,041 | | | $ | 1,938,015 | | | $ | 1,882,714 | |
Assumed | | | 2,606 | | | | 8,180 | | | | 9,167 | |
Ceded: | | | | | | | | | | | | |
Affiliate | | | (336,122 | ) | | | (1,505,010 | ) | | | (1,369,305 | ) |
Non-affiliate | | | (116,525 | ) | | | (441,185 | ) | | | (522,576 | ) |
| | | | | | | | | | | | |
Return credited to policyholders, contract benefits and expenses, net of reinsurance | | $ | — | | | $ | — | | | $ | — | |
| | | | | | | | | | | | |
Successor
In connection with the Acquisition as defined in Note 1, ALIC made an election under Treasury Regulation Section 1.1502-36(d) to reduce the tax basis of certain of the Company’s assets immediately prior to the Acquisition. The reduced tax bases were used to determine the deferred tax impact under the acquisition method of accounting as discussed in Note 1.
The Company is party to a federal income tax allocation agreement (the “Tax Allocation Agreement”) with Lancaster Re. The Company and Lancaster Re will file a separate consolidated federal income tax return for the period April 1, 2014 to December 31, 2014 and will continue to do so in future tax years under Internal Revenue Code Section 1504 (c)(1).
Following the Acquisition, the Company exited The Allstate Corporation’s consolidated federal income tax return and is no longer a party to the tax allocation agreement with its former affiliates. Final tax settlements were agreed to with The Allstate Corporation and no future tax allocations are expected to occur with The Allstate Corporation.
As part of the Acquisition, although the Company remains jointly and severally liable for consolidated tax liabilities for years prior to the Acquisition, the Company is held harmless by ALIC in accordance with the Acquisition agreement and believes the possibility of a tax liability for the pre-sale tax years is remote. Additionally, the Company does not believe it has any uncertain tax positions for its federal income tax return that would be
51
Lincoln Benefit Life Company
(A Wholly-Owned Subsidiary of Resolution Life, Inc.)
Notes to Consolidated Financial Statements
material to its financial condition, results of income, or cash flows. Therefore, the Company did not record a liability for unrecognized tax contingencies/benefits at December 31, 2014. As of December 31, 2014, there were no uncertain tax positions for which management believes it is reasonably possible that the total amounts of tax contingencies will significantly increase within 12 months of the reporting date. No amounts have been accrued for interest or penalties.
The components of the deferred income tax assets and liabilities as of December 31, 2014 are as follows:
| | | | |
($ in thousands) | | December 31, 2014 | |
Deferred tax assets | | | | |
Policyholder reserves | | $ | 2,057,627 | |
Deferred acquisition costs | | | 24,850 | |
Premiums receivable | | | 8,197 | |
Net operating loss carryforward | | | 7,500 | |
Other assets | | | 38 | |
| | | | |
Total deferred tax assets | | $ | 2,098,212 | |
| | | | |
Deferred tax liabilities | | | | |
Value of business acquired | | $ | (81,032 | ) |
Amounts recoverable from reinsurers | | | (2,010,157 | ) |
Investments | | | (45,935 | ) |
Intangibles | | | (1,820 | ) |
| | | | |
Total deferred tax liabilities | | $ | (2,138,944 | ) |
| | | | |
Net deferred tax liability | | $ | (40,732 | ) |
| | | | |
The Company evaluates the recoverability of deferred tax assets and establishes a valuation allowance if necessary to reduce the deferred tax asset to an amount that is more likely than not expected to be realized. Considerable judgment is required in determining whether a valuation allowance is necessary, and if so, the amount of such valuation allowance. In evaluating the need for a valuation allowance the Company considers many factors, including: (1) the nature of the deferred tax assets and liabilities; (2) whether they are ordinary or capital; (3) in which tax jurisdictions they were generated and the timing of their reversal; (4) taxable income in prior carryback years as well as projected taxable earnings exclusive of reversing temporary differences and carryforwards; (5) the length of time that any tax attribute carryovers can be utilized in the various taxing jurisdictions; (6) any unique tax rules that would impact the utilization of the deferred tax assets; and (7) prudent and feasible tax planning strategies that the Company would employ to avoid a tax benefit from expiring
unused. Although realization is not assured, management believes it is more likely than not that the deferred tax assets will be realized. The Company had no valuation allowance as of December 31, 2014. Management believes the Company will produce sufficient taxable income in the future to realize its deferred tax assets. Adjustments to the valuation allowance will be made if there is a change in management’s assessment of the amount of deferred tax asset that is realizable.
The Company has a net operating loss carryforward as of December 31, 2014 of approximately $21.5 million that will expire in the year 2029, if unused.
52
Lincoln Benefit Life Company
(A Wholly-Owned Subsidiary of Resolution Life, Inc.)
Notes to Consolidated Financial Statements
A reconciliation of the statutory federal income tax rate to the effective income tax rate on income from operations for the Successor Period from April 1, 2014 through December 31, 2014 were as follows:
| | | | |
($ in thousands) | | For the Period from
April 1, 2014
Through December 31,
2014 | |
Expected federal income tax expense | | $ | 15,722 | |
Dividends received deduction | | | (1,470 | ) |
Other | | | (18 | ) |
| | | | |
Total income tax expense | | $ | 14,234 | |
| | | | |
The dividends received deduction (“DRD”) reduces the amount of dividend income subject to U.S. tax and is the primary component of the non-taxable investment income, and, as such, is a significant component of the difference between the Company’s effective tax rate and the federal statutory tax rate of 35%. The actual current year DRD can vary from the estimate based on factors such as, but not limited to, changes in the amount of dividends received that are eligible for the DRD, changes in the amount of distributions received from mutual fund investments, changes in the account balances of variable life and annuity contracts, and the Company’s taxable income before the DRD.
There remains the possibility that the IRS and the U.S. Treasury will address, through subsequent guidance, issues related to the calculation of the DRD. For the last several years, the revenue provisions included in the Obama Administration’s budgets included a proposal that would change the method used to determine the amount of the DRD. A change in the DRD, including the possible retroactive or prospective elimination of this deduction through guidance or legislation, could increase actual tax expense and reduce the Company’s consolidated net income.
Predecessor
Prior to April 1, 2014, the Company joined The Allstate Corporation and its other subsidiaries (the “Allstate Group”) in the filing of a consolidated federal income tax return and was party to a federal income tax allocation agreement (the “Allstate Tax Sharing Agreement”). Under the Allstate Tax Sharing Agreement, the Company paid to or received from The Allstate Corporation the amount, if any, by which the Allstate Group’s federal income tax liability was affected by virtue of inclusion of the Company in the consolidated federal income tax return. The Company also had a supplemental tax sharing agreement with respect to reinsurance ceded to ALIC to allocate the tax benefits and costs related to such reinsurance. Effectively, these agreements resulted in the Company’s annual income tax provision being computed, with adjustments, as if the Company filed a separate return, adjusted for the reinsurance ceded to ALIC.
The IRS is currently examining the Allstate Group’s 2011 and 2012 federal income tax returns. The IRS has completed its examination of the Allstate Group’s 2009 and 2010 federal income tax returns and a final settlement related to the examination was approved by the IRS Appeals Division on September 19, 2014. The Allstate Group’s tax years prior to 2009 have been examined by the IRS and the statute of limitations has expired on those years. Any adjustments that may result from IRS examinations of tax returns are not expected to have a material effect on the results of operations, cash flows or financial position of the Company.
The Company had no liability for unrecognized tax benefits as of December 31, 2013.
53
Lincoln Benefit Life Company
(A Wholly-Owned Subsidiary of Resolution Life, Inc.)
Notes to Consolidated Financial Statements
The components of the deferred income tax assets and liabilities as of December 31 are as follows:
| | | | |
($ in thousands) | | 2013 | |
Deferred assets | | | | |
Reinsurance recoverables | | $ | 497 | |
Other assets | | | 4 | |
| | | | |
Total deferred assets | | | 501 | |
| | | | |
Deferred liabilities | | | | |
Unrealized net capital gains | | | (2,084 | ) |
Accrued expenses | | | (981 | ) |
Other liabilities | | | — | |
| | | | |
Total deferred liabilities | | | (3,065 | ) |
| | | | |
Net deferred liability | | $ | (2,564 | ) |
| | | | |
The components of income tax expense are as follows:
| | | | | | | | | | | | |
($ in thousands) | | Period from January 1, 2014
through March 31, 2014 | | | 2013 | | | 2012 | |
Current | | $ | 914 | | | $ | 3,902 | | | $ | 4,145 | |
Deferred | | | 8 | | | | (77 | ) | | | 128 | |
| | | | | | | | | | | | |
Total income tax expense | | $ | 922 | | | $ | 3,825 | | | $ | 4,273 | |
| | | | | | | | | | | | |
The Company paid no income taxes in the period from January 1, 2014 through March 31, 2014. The Company paid income taxes of $4.2 million and $4.8 million in 2013 and 2012, respectively.
A reconciliation of the statutory federal income tax rate to the effective income tax rate on income from operations is as follows:
| | | | | | | | | | | | |
| | | Period from January 1, 2014
through March 31, 2014 | | | 2013 | | | 2012 | |
Statutory federal income tax rate | | | 35.0 | % | | | 35.0 | % | | | 35.0 | % |
Other | | | — | | | | — | | | | — | |
| | | | | | | | | | | | |
Effective income tax rate | | | 35.0 | % | | | 35.0 | % | | | 35.0 | % |
| | | | | | | | | | | | |
| 8. | Future Policy Benefits and Other Policyholder Liabilities |
Life insurance liabilities include reserves for death benefits and other policy benefits. As of December 31, 2014 and 2013, future policy benefits and other policyholder liabilities consisted of the following:
| | | | | | | | | | |
| | | Successor | | | | | Predecessor | |
($ in thousands) | | December 31, 2014 | | | | | December 31, 2013 | |
Traditional life insurance | | $ | 1,492,438 | | | | | $ | 1,548,134 | |
Immediate fixed annuities | | | 635,858 | | | | | | 676,565 | |
Accident and health insurance | | | 1,462,110 | | | | | | 1,324,268 | |
Equity indexed annuities | | | 1,895,889 | | | | | | — | |
Other | | | 977,669 | | | | | | 8,444 | |
| | | | | | | | | | |
Total | | $ | 6,463,964 | | | | | $ | 3,557,411 | |
| | | | | | | | | | |
54
Lincoln Benefit Life Company
(A Wholly-Owned Subsidiary of Resolution Life, Inc.)
Notes to Consolidated Financial Statements
Successor
Future policy benefits are generally equal to the present value of future benefit payments and related expenses, less the present value of future net premiums. Assumptions as to mortality, morbidity and persistency are based on the Company’s experience, industry data, and/or other factors, when the basis of the reserve is established. Interest rates used in the determination of present values range from 2.5% to 6.0% for setting reserves.
Predecessor
The following table highlights the key assumptions generally used in calculating the reserve for life-contingent contract benefits as of December 31, 2013:
| | | | | | |
Product | | Mortality | | Interest rate | | Estimation method |
| Traditional life insurance | | Actual company experience plus loading | | Interest rate assumptions range from 2.5% to 8.0% | | Net level premium reserve method using the Company’s withdrawal experience rates; includes reserves for unpaid claims |
| | | |
| Immediate fixed annuities | | 1983 individual annuity mortality table with internal modifications; 1983 individual annuity mortality table; Annuity 2000 mortality table with internal modifications | | Interest rate assumptions range from 0% to 8.8% | | Present value of expected future benefits based on historical experience |
| | | |
| Accident and health insurance | | Actual company experience plus loading | | Interest rate assumptions range from 4.0% to 5.3% | | Unearned premium; additional contract reserves for mortality risk and unpaid claims |
| | | |
Other:
Variable annuity guaranteed minimum death benefits | | Annuity 2000 mortality table with internal modifications | | Interest rate assumptions range from 4.0% to 5.8% | | Projected benefit ratio applied to cumulative assessments |
| 9. | Policyholder Account Balances |
As of December 31, 2014 and 2013, policyholders’ account balances consisted of the following:
| | | | | | | | | | |
| | | Successor | | | | | Predecessor | |
($ in thousands) | | December 31, 2014 | | | | | December 31, 2013 | |
Interest-sensitive life contracts | | $ | 5,008,094 | | | | | $ | 5,020,265 | |
Individual annuities | | | 4,806,270 | | | | | | 7,803,892 | |
Other | | | 14,973 | | | | | | 299,958 | |
| | | | | | | | | | |
Total policyholders’ account balances | | $ | 9,829,337 | | | | | $ | 13,124,115 | |
| | | | | | | | | | |
Successor
Policyholders’ account balances represent an accumulation of account deposits plus credited interest less withdrawals, expenses and mortality charges, if applicable. These policyholders’ account balances also include provisions for benefits under non-life contingent payout annuities. Interest crediting rates range from 0.4% to 6.0% for interest sensitive contracts. Interest crediting rates for individual annuities range from 0.0% to 6.0%.
55
Lincoln Benefit Life Company
(A Wholly-Owned Subsidiary of Resolution Life, Inc.)
Notes to Consolidated Financial Statements
Predecessor
The following table highlights the key contract provisions relating to policyholders’ account balances:
| | | | |
Product | | Interest rate | | Withdrawal/surrender charges |
| Interest-sensitive life insurance | | Interest rates credited range from 0% to 10.0% for equity-indexed life (whose returns are indexed to the S&P 500) and 2.6% to 6.0% for all other products | | Either a percentage of account balance or dollar amount grading off generally over 20 years |
| | |
Fixed annuities | | Interest rates credited range from 0% to 8.8% for immediate annuities; 0% to 7.0% for equity-indexed annuities (whose returns are indexed to the S&P 500); and 1.0% to 6.0% for all other products | | Either a declining or a level percentage charge generally over ten years or less. Additionally, approximately 18.7% of fixed annuities are subject to market value adjustment for discretionary withdrawals. |
| | |
Other investment contracts: Guaranteed minimum income, accumulation and withdrawal benefits on variable and fixed annuities and secondary guarantees on interest-sensitive life and fixed annuities | | Interest rates used in establishing reserves range from 1.7% to 10.3% | | Withdrawal and surrender charges are based on the terms of the related interest-sensitive life insurance or fixed annuity contract |
| 10. | Certain Nontraditional Long-Duration Contracts |
The Company offered traditional variable annuity contracts through its separate accounts for which investment income and investment gains and losses accrue directly to, and investment risk is borne by, the contractholder. The Company also offered variable annuity contracts with general and separate account options where the Company contractually guarantees to the contractholder a return of no less than total deposits made to the contract less any partial withdrawals (“return of net deposits”). In certain of these variable annuity contracts, the Company also contractually guarantees to the contractholder a return of no less than (1) total deposits made to the contract less any partial withdrawals plus a minimum return (“minimum return”), and/or (2) the highest contract value on a specified date adjusted for any withdrawals (“contract value”). These guarantees include benefits that are payable in the event of death, annuitization or at specified dates during the accumulation period and withdrawal and income benefits payable during specified periods. The Company also issues annuity contracts with market value adjusted investment options (“MVAs”), which provide for a return of principal plus a fixed rate of return if held to maturity, or, alternatively, a “market adjusted value” if surrendered prior to maturity or if funds are allocated to other investment options. The market value adjustment may result in a gain or loss to the Company, depending on crediting rates or an indexed rate at surrender, as applicable. The Company also issues fixed deferred annuity contracts without MVA that have a guaranteed credited rate and annuity benefit. All of the risks associated with the Company’s variable annuity contracts are reinsured with external reinsurers.
In addition, the Company issues certain variable life, variable universal life and universal life contracts where the Company contractually guarantees to the contractholder a death benefit even when there is insufficient value to cover monthly mortality and expense charges, whereas otherwise the contract would typically lapse (“no lapse guarantee”). Variable life and variable universal life contracts are offered with general and separate account options similar to variable annuities.
56
Lincoln Benefit Life Company
(A Wholly-Owned Subsidiary of Resolution Life, Inc.)
Notes to Consolidated Financial Statements
The assets supporting the variable portion of both traditional variable annuities and certain variable contracts with guarantees are carried at fair value and reported as Separate Account assets with an equivalent amount reported as Separate Account liabilities. Amounts assessed against the contractholders for mortality, administration, and other services are included within revenue in fee income from policyholders and changes in liabilities for minimum guarantees are generally included in policyholder benefits in the Consolidated Statement of Operations and Comprehensive Income (Loss) (Successor) and Statements of Operations and Comprehensive Income (Predecessor).
For those guarantees of benefits that are payable in the event of death, the net amount at risk is generally defined as the current guaranteed minimum death benefit in excess of the current account balance at the balance sheet date. The Company’s primary risk exposures for these contracts relates to actual deviations from, or changes to, the assumptions used in the original pricing of these products, including fixed income and equity market returns, contract lapses and contractholder mortality.
For guarantees of benefits that are payable at annuitization, the net amount at risk is generally defined as the present value of the minimum guaranteed annuity payments available to the contractholder determined in accordance with the terms of the contract in excess of the current account balance. The Company’s primary risk exposures for these contracts relates to actual deviations from, or changes to, the assumptions used in the original pricing of these products, including fixed income and equity market returns, benefit utilization, timing of annuitization, contract lapses and contractholder mortality.
For guarantees of benefits that are payable at withdrawal, the net amount at risk is generally defined as the present value of the minimum guaranteed withdrawal payments available to the contractholder determined in accordance with the terms of the contract in excess of the current account balance. For guarantees of accumulation balances, the net amount at risk is generally defined as the guaranteed minimum accumulation balance minus the current account balance. The Company’s primary risk exposures for these contracts relates to actual deviations from, or changes to, the assumptions used in the original pricing of these products, including equity market returns, interest rates, market volatility or contractholder behavior used in the original pricing of these products.
57
Lincoln Benefit Life Company
(A Wholly-Owned Subsidiary of Resolution Life, Inc.)
Notes to Consolidated Financial Statements
The Company’s contracts with guarantees may offer more than one type of guarantee in each contract; therefore, the amounts listed may not be mutually exclusive. The liabilities related to the net amount at risk are reflected within Future policy benefits and other policyholder liabilities or Policyholders’ account balances. As of December 31, 2014, the Company had the following guarantees associated with these contracts, by product and guarantee type:
| | | | | | | | | | | | | | | | |
| | | Successor | |
| | | December 31, 2014 | |
($ in millions) | | In the Event of
Death | | | At
Annuitization/
Accumulation(1) | | | For Cumulative
Periodic Withdrawals | | | Accumulation
at Specified
Dates | |
Variable Annuity Contracts | | | | | | | | | | | | | | | | |
Separate Account value | | $ | 742.7 | | | $ | 151.9 | | | $ | 16.6 | | | $ | 118.4 | |
Net amount at risk | | $ | 57.2 | | | $ | 15.2 | | | $ | 0.1 | | | $ | 6.2 | |
Average attained age of contractholders | | | 60 years | | | | N/A | | | | N/A | | | | N/A | |
Weighted average waiting period until guarantee date | | | N/A | | | | None | | | | N/A | | | | 6 years | |
Variable Life, Variable Universal Life and Universal Life Contracts | | | | | | | | | | | | | | | | |
No Lapse Guarantees: | | | | | | | | | | | | | | | | |
Separate Account value | | $ | 325.1 | | | | | | | | | | | | | |
General account value | | $ | 31518.3 | | | | | | | | | | | | | |
Net amount at risk | | $ | 89,942.8 | | | | | | | | | | | | | |
Average attained age of contractholders | | | 51 years | | | | | | | | | | | | | |
As of December 31, 2013, the Company had the following guarantees associated with these contracts, by product and guarantee type:
| | | | | | | | | | | | | | | | |
| | | Predecessor | |
| | | December 31, 2013 | |
($ in millions) | | In the Event of
Death | | | At
Annuitization/
Accumulation(1) | | | For Cumulative
Periodic Withdrawals | | | Accumulation
at Specified
Dates | |
Variable Annuity Contracts | | | | | | | | | | | | | | | | |
Separate Account value | | $ | 877.0 | | | $ | 170.5 | | | $ | 21.8 | | | $ | 151.1 | |
Net amount at risk | | $ | 63.2 | | | $ | 16.6 | | | $ | 0.1 | | | $ | 7.3 | |
Average attained age of contractholders | | | 59 years | | | | N/A | | | | N/A | | | | N/A | |
Weighted average waiting period until guarantee date | | | N/A | | | | None | | | | N/A | | | | 6 years | |
58
Lincoln Benefit Life Company
(A Wholly-Owned Subsidiary of Resolution Life, Inc.)
Notes to Consolidated Financial Statements
Liabilities for Guarantee Benefits
The table below summarizes the changes in general account liabilities for guarantees on variable contracts. The liabilities for guaranteed minimum death benefits (“GMDB”) and secondary guarantees on interest-sensitive life and fixed annuities are included in Future policy benefits and other policyholder liabilities on the Consolidated Balance Sheet (Successor) and the related changes in the liabilities are included in policyholder benefits in the Consolidated Statement of Operations and Comprehensive Income (Loss) for the Successor Period from April 1, 2014 through December 31, 2014. In the Predecessor Period, secondary guarantees oninterest-sensitive life and fixed annuities are included in policyholders’ account balances. Guaranteed minimum income benefits (“GMIB”), guaranteed minimum withdrawal benefits (“GMWB”) and guaranteed minimum accumulation benefits (“GMAB”) features are accounted for as bifurcated embedded derivatives and are recorded at fair value within Policyholders’ account balances on the Consolidated Balance Sheet (Successor).
| | | | | | | | | | | | | | | | | | | | |
| | | GMDB | | | GMIB | | | GMWB/
GMAB | | | Secondary
Guarantees | | | | |
($ in thousands) | | Variable
Annuity | | | Variable
Annuity | | | Variable
Annuity | | | Interest-
Sensitive
Life and
Fixed
Annuities | | | Total | |
Predecessor | | | | | | | | | | | | | | | | | | | | |
Balance as of December 21, 2012 | | $ | 9,390 | | | $ | 19,484 | | | $ | 19,621 | | | $ | 200,688 | | | $ | 249,183 | |
Less: reinsurance recoverable | | | 9,390 | | | | 19,484 | | | | 19,621 | | | | 200,688 | | | | 249,183 | |
| | | | | | | | | | | | | | | | | | | | |
Net balance as of December 31, 2012 | | | — | | | | — | | | | — | | | | — | | | | — | |
Incurred guarantee benefits | | | — | | | | — | | | | — | | | | — | | | | — | |
Paid guarantee benefits | | | — | | | | — | | | | — | | | | — | | | | — | |
| | | | | | | | | | | | | | | | | | | | |
Net change | | | — | | | | — | | | | — | | | | — | | | | — | |
Net balance as of December 31, 2013 | | | — | | | | — | | | | — | | | | — | | | | — | |
Plus reinsurance recoverable | | | 8,444 | | | | 8,743 | | | | 9,444 | | | | 281,771 | | | | 308,402 | |
| | | | | | | | | | | | | | | | | | | | |
Balance as of December 31, 2013 | | $ | 8,444 | | | $ | 8,743 | | | $ | 9,444 | | | $ | 281,771 | | | $ | 308,402 | |
| | | | | | | | | | | | | | | | | | | | |
Less: reinsurance recoverable | | | 8,444 | | | | 8,743 | | | | 9,444 | | | | 281,771 | | | | 308,402 | |
Net balance as of December 31, 2013 | | | — | | | | — | | | | — | | | | — | | | | — | |
Incurred guarantee benefits | | | — | | | | — | | | | — | | | | — | | | | — | |
Paid guarantee benefits | | | — | | | | — | | | | — | | | | — | | | | — | |
| | | | | | | | | | | | | | | | | | | | |
Net change | | | — | | | | — | | | | — | | | | — | | | | — | |
Net balance as of March 31, 2014 | | | — | | | | — | | | | — | | | | — | | | | — | |
Plus reinsurance recoverable | | | 8,057 | | | | 7,122 | | | | 8,499 | | | | 293,704 | | | | 317,382 | |
| | | | | | | | | | | | | | | | | | | | |
Balance as of March 31, 2014 | | $ | 8,057 | | | $ | 7,122 | | | $ | 8,499 | | | $ | 293,704 | | | $ | 317,382 | |
| | | | | | | | | | | | | | | | | | | | |
| | | | | | | | | | | | | | | | |
| | | | | |
Successor | | | | | | | | | | | | | | | | | | | | |
Balance as of April 1, 2014 | | $ | 8,057 | | | $ | 7,122 | | | $ | 8,499 | | | $ | 552,163 | | | $ | 575,841 | |
Less: reinsurance recoverable | | | 8,057 | | | | 7,122 | | | | 8,499 | | | | 67,288 | | | | 90,966 | |
| | | | | | | | | | | | | | | | | | | | |
Net balance as of April 1, 2014 | | | — | | | | — | | | | — | | | | 484,875 | | | | 484,875 | |
Incurred guarantee benefits | | | — | | | | — | | | | — | | | | 159,104 | | | | 159,104 | |
Paid guarantee benefits | | | — | | | | — | | | | — | | | | (108,252 | ) | | | (108,252 | ) |
| | | | | | | | | | | | | | | | | | | | |
Net change | | | — | | | | — | | | | — | | | | 50,852 | | | | 50,852 | |
Net balance as of December 31, 2014 | | | — | | | | — | | | | — | | | | 535,727 | | | | 535,727 | |
Plus reinsurance recoverable | | | 8,358 | | | | 8,240 | | | | 6,733 | | | | 83,733 | | | | 107,064 | |
| | | | | | | | | | | | | | | | | | | | |
Balance as of December 31, 2014 | | $ | 8,358 | | | $ | 8,240 | | | $ | 6,733 | | | $ | 619,460 | | | $ | 642,791 | |
| | | | | | | | | | | | | | | | | | | | |
59
Lincoln Benefit Life Company
(A Wholly-Owned Subsidiary of Resolution Life, Inc.)
Notes to Consolidated Financial Statements
| 11. | Value of Business Acquired |
The following reflects the changes to the VOBA asset:
| | | | |
($ in thousands) | | For the Period from
April 1, 2014
Through December 31,
2014 | |
Balance at beginning of period | | $ | 290,795 | |
Business acquired | | | — | |
Amortized to expense during the year(1) | | | (38,987 | ) |
Adjustment for unrealized investment gains during the year | | | (20,287 | ) |
| | | | |
Balance at end of year | | $ | 231,521 | |
| | | | |
| (1) | Amount is included in Other Expenses on the Consolidated Statement of Operations and Other Comprehensive Income (Loss) |
The following table provides estimated percentage of the VOBA balance to be amortized for the years indicated:
| | | | |
| | | VOBA
Amortization | |
2015 | | | 14 | % |
2016 | | | 12 | % |
2017 | | | 11 | % |
2018 | | | 9 | % |
2019 and thereafter | | | 54 | % |
| 12. | Commitments and Contingencies |
Regulation and Compliance
The Company is subject to changing social, economic and regulatory conditions. From time to time, regulatory authorities or legislative bodies seek to impose additional regulations regarding agent and broker compensation, regulate the nature of and amount of investments, and otherwise expand overall regulation of insurance products and the insurance industry. The Company has established procedures and policies to facilitate compliance with laws and regulations, to foster prudent business operations, and to support financial reporting. The Company routinely reviews its practices to validate compliance with laws and regulations and with internal procedures and policies. As a result of these reviews, from time to time the Company may decide to modify some of its procedures and policies. Such modifications, and the reviews that led to them, may be accompanied by payments being made and costs being incurred. The ultimate changes and eventual effects of these actions on the Company’s business, if any, are uncertain.
The Company is currently being examined by certain states for compliance with unclaimed property laws. It is possible that this examination may result in additional payments of abandoned funds to states and to changes in the Company’s practices and procedures for the identification of escheatable funds, which could impact benefit payments and reserves, among other consequences; however, it is not likely to have a material effect on the financial statements of the Company.
60
Lincoln Benefit Life Company
(A Wholly-Owned Subsidiary of Resolution Life, Inc.)
Notes to Consolidated Financial Statements
The Company is assessed amounts by the state guaranty funds to cover losses to policyholders of insolvent or rehabilitated insurance companies. Those mandatory assessments may be partially recovered through a reduction in future premium taxes in certain states. At December 31, 2014, the Company accrued $6.7 million for guaranty fund assessments which is expected to be offset by estimated future premium tax deductions of $11.2 million.
Litigation
The Company is involved from time to time in judicial, regulatory and arbitration proceedings concerning matters arising in connection with the conduct of its business. As part of the Acquisition, ALIC has agreed to indemnify the Company for certain matters. ALIC has also agreed to indemnify the Company for certain litigation, regulatory matters and other liabilities related to the pre-closing activities of the transferred business. Management believes, based on currently available information, that the results of such proceedings, in the aggregate, will not have a material adverse effect on the Company’s financial condition. Given the inherent difficulty of predicting the outcome of the Company’s litigation and regulatory matters, particularly in cases or proceedings in which substantial or indeterminate damages or fines are sought, the Company cannot estimate losses or ranges of losses for cases or proceedings where there is only a reasonable possibility that a loss may be incurred. However, the Company believes that at the present time there are no pending or threatened lawsuits that are reasonably likely to have a material adverse effect on the consolidated financial position or results of operations.
In the normal course of its business, the Company has entered into agreements that include indemnities in favor of third parties, such as contracts with advisors and consultants, outsourcing agreements, information technology agreements and service agreements. The Company has also agreed to indemnify its directors, officers and employees in accordance with the Company’s by-laws. The Company believes any potential liability under these agreements is neither probable nor estimable. Therefore, the Company has not recorded any associated liability.
Pledged or Restricted Assets
The Company had the following restricted assets:
| | • | | Certain bonds were on deposit with governmental authorities as required by law of $8.9 million and $9.4 million at December 31, 2014 and December 31, 2013, respectively. |
| | • | | Derivative cash collateral received was reported as cash equivalents of $6.4 million at December 31, 2014. The Company had no derivative cash collateral as of December 31, 2013. |
| 13. | Regulatory Capital and Dividends |
The Company prepares its statutory-basis financial statements in conformity with accounting practices prescribed or permitted by the State of Nebraska. Prescribed statutory accounting practices include a variety of publications of the National Association of Insurance Commissioners (“NAIC”), as well as state laws, regulations and general administrative rules. Permitted statutory accounting practices encompass all accounting practices not so prescribed.
The State of Nebraska requires insurance companies domiciled in its state to prepare statutory-basis financial statements in conformity with the NAIC Accounting Practices and Procedures Manual, subject to any deviations prescribed or permitted by the State of Nebraska Insurance Commissioner. Statutory accounting practices differ from GAAP primarily since they require establishing life insurance reserves based on different actuarial assumptions, and valuing certain investments at amortized cost.
61
Lincoln Benefit Life Company
(A Wholly-Owned Subsidiary of Resolution Life, Inc.)
Notes to Consolidated Financial Statements
Statutory net income was $226 million and $7.7 million for the years ended December 31, 2014 and December 31, 2013. Statutory capital and surplus was $719 million and $332.5 million as of December 31, 2014 and December 31, 2013, respectively.
Dividend Limitations
The ability of the Company to pay dividends is dependent on business conditions, income, cash requirements and other relevant factors. The payment of shareholder dividends by the Company without the prior approval of the Department of Insurance is limited to formula amounts based on net income and capital and surplus, determined in conformity with statutory accounting practices, as well as, the timing and amount of dividends paid in the preceding twelve months. In connection with the Acquisition, prior approval of the Nebraska Director of Insurance is required for the Company for any dividend or distribution for five years subsequent to the Acquisition.
Other
Without the prior approval of the Nebraska Director of Insurance, the Company may not:
| 1. | Acquire or enter into an agreement or understanding to acquire control of any insurer, assumptively acquire policies, or bulk reinsure business during the period of three years after the Acquisition. |
| 2. | Provide or propose to provide directly or indirectly any loans, advances, guarantees, pledges, or other financial assistance (excluding policy loans or investment portfolio transactions) during the period of three years after the Acquisition. |
| 3. | Engage in any material transaction during the period of three years after the Acquisition. “Material transaction” shall mean any transfer or encumbrance of assets that, together with all other transfers or encumbrances made within the preceding twelve months, exceeds in value the greater of five percent of Lincoln Benefit’s surplus as of the December 31st of the last preceding, or the net gain from operations of Lincoln Benefit for the twelve-month period ending the December 31st of the last preceding. For the purposes of this clause, “Material Transaction” shall exclude (i) investment portfolio transactions (ii) settlement of balances due to policyholders, agents or third party reinsurers under existing reinsurance agreements or (iii) settlement of ordinary course payables including but not limited to taxes, third party administrators, suppliers or other ordinary course creditors, and intercompany payables arising under any approved intercompany services agreement |
Under state insurance laws, insurance companies are required to maintain paid up capital of not less than the minimum capital requirement applicable to the types of insurance they are authorized to write. Insurance companies are also subject to risk-based capital (“RBC”) requirements adopted by state insurance regulators. A company’s “authorized control level RBC” is calculated using various factors applied to certain financial balances and activity. Companies that do not maintain statutory capital and surplus at a level in excess of the company action level RBC, which is two times authorized control level RBC, are required to take specified actions. Company action level RBC is significantly in excess of the minimum capital requirements.
In December 2014, the Company entered into a lease agreement, effective February 2015, to lease office space under a non-cancellable operating lease agreement that expires in January 31, 2026. For the period from April 1, 2014 through December 31, 2014, the Company made no payments pursuant to this operating lease.
62
Lincoln Benefit Life Company
(A Wholly-Owned Subsidiary of Resolution Life, Inc.)
Notes to Consolidated Financial Statements
The minimum aggregate rental commitments as of December 31, 2014 were as follows:
| | | | |
(in thousands) | | | |
2015 | | $ | 97 | |
2016 | | | 194 | |
2017 | | | 207 | |
2018 | | | 212 | |
2019 | | | 217 | |
All future years | | | 1,712 | |
| | | | |
Aggregate total | | $ | 2,639 | |
| | | | |
The Company did not have any lease obligations at December 31, 2013.
Successor
On April 1, 2014, the Company entered into a management services agreement with Resolution. Under this agreement, Resolution and Lincoln Benefit provide services to each other including but not limited to compliance, legal, risk management, accounting and reporting, treasury, tax and other management related services. Services are provided at cost. Resolution provided $21.1 million in services to Lincoln Benefit for the period from April 1, 2014 through December 31, 2014.
Effective April 1, 2014, the Company entered into a Fee Letter (the “Fee Letter”) with Lanis LLC (“Lanis”) pursuant to which the Company will pay Lanis the risk spread due on the Vehicle Note issued by Lanis to Lancaster Re. The total expense related to this risk spread for the period from April 1, 2014 through December 31, 2014 was approximately $4.6 million.
The Company reported the following receivables/ (payables) to affiliates as of December 31, 2014:
| | | | |
Resolution | | $ | (4,509,447 | ) |
Lanis | | $ | (1,563,783 | ) |
Intercompany receivable and payable balances are evaluated on an individual company basis. Intercompany balances are generally settled quarterly.
The Company’s stock is pledged as collateral on Resolution’s term loan agreement with a syndicate of lenders (“Term Loan”). The maturity date of the loan is June 15, 2018. The Term Loan was funded on April 1, 2014.
On April 1, 2014, the Company and Resolution entered into a Letter Agreement whereby from and after the fifth anniversary of the date of the agreement, if the Company makes any payment pursuant to the Fee Letter, within ten Business Days of such payment by the Company, Resolution shall reimburse the Company in cash in an amount equal to such payment by the Company.
Predecessor
All intercompany balances were settled prior to the Acquisition.
63
Lincoln Benefit Life Company
(A Wholly-Owned Subsidiary of Resolution Life, Inc.)
Notes to Consolidated Financial Statements
Business operations
Prior to April 1, 2014, the Company used services performed by its affiliates, Allstate Insurance Company (“AIC”), ALIC and Allstate Investments LLC, and business facilities owned or leased and operated by AIC in conducting its business activities. In addition, the Company shared the services of employees with AIC. The Company reimbursed its affiliates for the operating expenses incurred on behalf of the Company. The Company was charged for the cost of these operating expenses based on the level of services provided. Operating expenses allocated to the Company were $50.1 million, $249.7 million and, $241.8 million in the period from January 1, 2014 through March 31, 2014, for the years ended December 31, 2013 and, 2012, respectively. Of these costs, the Company retained investment related expenses on the invested assets that were not transferred under the reinsurance agreements. All other costs were ceded to ALIC under the reinsurance agreements.
Broker-Dealer agreements
Prior to April 1, 2014, the Company had a service agreement with Allstate Distributors, L.L.C. (“ADLLC”), a broker-dealer company owned by ALIC, whereby ADLLC promoted and marketed products sold by the Company. In return for these services, the Company recorded expense of $12 thousand, $71 thousand and $80 thousand in the period from January 1, 2014 through March 31, 2014, for the years ended December 31, 2013 and 2012, respectively, that was ceded to ALIC under the terms of the reinsurance agreements.
Prior to April 1, 2014, the Company received distribution services from Allstate Financial Services, LLC, an affiliated broker-dealer company, for certain annuity and variable life insurance contracts sold by Allstate exclusive agencies. For these services, the Company incurred commission and other distribution expenses of $2.2 million, $7.7 million and $6.4 million in the period from January 1, 2014 through March 31, 2014, for the years ended December 31, 2013 and 2012, respectively, that were ceded to ALIC.
Reinsurance
The following table summarizes amounts that were ceded to ALIC under reinsurance agreements and reported net in the Statements of Operations and Comprehensive Income.
| | | | | | | | | | | | |
($ in thousands) | | Period from January 1, 2014
through March 31, 2014 | | | 2013 | | | 2012 | |
Premiums and contract charges | | $ | 244,797 | | | $ | 962,576 | | | $ | 908,459 | |
Interest credited to contractholder funds, contract benefits and expenses | | | 336,122 | | | | 1,505,010 | | | | 1,369,305 | |
Reinsurance recoverables due from ALIC totaled $14.5 billion as of December 31, 2013.
In September 2012, the Company entered into a coinsurance reinsurance agreement with LB Re to cede certain interest-sensitive life insurance policies to LB Re. Reinsurance recoverables due from LB Re totaled $1.9 million as of December 31, 2013.
Income taxes
Prior to April 1, 2014, the Company was a party to a federal income tax allocation agreement with The Allstate Corporation (see Note 7).
Intercompany loan agreement
Prior to April 1, 2014, the Company had an intercompany loan agreement with The Allstate Corporation. The Company had no amounts outstanding under the intercompany loan agreement as of December 31, 2013.
64
Lincoln Benefit Life Company
(A Wholly Owned Subsidiary of Resolution Life, Inc.)
Schedule I Consolidated Summary of Investments Other Than Investments in Related Parties
December 31, 2014
| | | | | | | | | | | | |
($ in thousands) | | Amortized
Cost | | | Fair Value | | | Amount at which
shown in the
Consolidated
Balance Sheet | |
Type of Investment | | | | | | | | | | | | |
Fixed maturities: | | | | | | | | | | | | |
Bonds: | | | | | | | | | | | | |
United States Government, Government Agencies and Authorities | | $ | 1,060,065 | | | $ | 1,112,535 | | | $ | 1,112,535 | |
States, municipalities and political subdivisions | | | — | | | | — | | | | — | |
Foreign governments | | | — | | | | — | | | | — | |
Public utilities | | | — | | | | — | | | | — | |
All other corporate bonds | | | 7,279,391 | | | | 7,377,745 | | | | 7,377,745 | |
Residential mortgage-backed securities | | | 188,055 | | | | 189,881 | | | | 189,881 | |
Commercial mortgage-backed securities | | | 331,041 | | | | 333,483 | | | | 333,483 | |
Asset-backed securities | | | 373,304 | | | | 377,003 | | | | 377,003 | |
| | | | | | | | | | | | |
Total fixed maturities | | | 9,231,856 | | | | 9,390,647 | | | | 9,390,647 | |
| | | | | | | | | | | | |
Other securities: | | | | | | | | | | | | |
Mortgage loans | | | 1,115,167 | | | | | | | | 1,115,167 | |
Policy loans | | | 194,385 | | | | | | | | 194,385 | |
Derivatives | | | 26,001 | | | | | | | | 26,001 | |
Other long-term assets | | | 896 | | | | | | | | 896 | |
Short-term investments | | | 361,369 | | | | | | | | 361,369 | |
| | | | | | | | | | | | |
Total other securities | | | 1,697,818 | | | | | | | | 1,697,818 | |
| | | | | | | | | | | | |
Total investments | | $ | 10,929,674 | | | $ | 9,390,647 | | | $ | 11,088,465 | |
| | | | | | | | | | | | |
65
Lincoln Benefit Life Company
(A Wholly-Owned Subsidiary of Resolution Life, Inc.)
Schedule IV — Consolidated Reinsurance
| | | | | | | | | | | | | | | | | | | | |
($ in thousands) | | Gross Amount | | | Ceded to Other
Companies | | | Assumed from
Other Companies | | | Net Amount | | | Percentage of
Amount
Assumed to Net | |
Successor | | | | | | | | | | | | | | | | | | | | |
Period from April 1, 2014 through December 31, 2014 | | | | | | | | | | | | | | | | | | | | |
Life insurance in force | | $ | 395,385,878 | | | $ | 388,790,881 | | | $ | 5,106,566 | | | $ | 11,701,563 | | | | 43.6 | % |
| | | | | | | | | | | | | | | | | | | | |
Premiums and contract charges: | | | | | | | | | | | | | | | | | | | | |
Life and annuities | | $ | 869,472 | | | $ | (669,382 | ) | | $ | 5,258 | | | $ | 205,348 | | | | 2.6 | % |
Accident and health insurance | | | 51,972 | | | | (33,451 | ) | | | — | | | | 18,521 | | | | 0.0 | % |
| | | | | | | | | | | | | | | | | | | | |
| | $ | 921,444 | | | $ | (702,833 | ) | | $ | 5,258 | | | $ | 223,869 | | | | 2.3 | % |
| | | | | | | | | | | | | | | | | | | | |
|
| |
| | | | | |
Predecessor | | | | | | | | | | | | | | | | | | | | |
Period from January 1, 2014 through March 31, 2014 | | | | | | | | | | | | | | | | | | | | |
Premiums and contract charges: | | | | | | | | | | | | | | | | | | | | |
Life and annuities | | $ | 313,410 | | | $ | (314,991 | ) | | $ | 1,581 | | | $ | — | | | | 0.0 | % |
Accident and health insurance | | | 18,489 | | | | (18,489 | ) | | | — | | | | — | | | | 0.0 | % |
| | | | | | | | | | | | | | | | | | | | |
| | $ | 331,899 | | | $ | (333,480 | ) | | $ | 1,581 | | | $ | — | | | | 0.0 | % |
| | | | | | | | | | | | | | | | | | | | |
Year ended December 31, 2013 | | | | | | | | | | | | | | | | | | | | |
Life insurance in force | | $ | 389,941,404 | | | $ | 395,421,202 | | | $ | 5,479,798 | | | $ | — | | | | 0.0 | % |
| | | | | | | | | | | | | | | | | | | | |
Premiums and contract charges: | | | | | | | | | | | | | | | | | | | | |
Life and annuities | | $ | 1,250,623 | | | $ | (1,257,453 | ) | | $ | 6,830 | | | $ | — | | | | 0.0 | % |
Accident and health insurance | | | 80,974 | | | | (80,974 | ) | | | — | | | | — | | | | 0.0 | % |
| | | | | | | | | | | | | | | | | | | | |
| | $ | 1,331,597 | | | $ | (1,338,427 | ) | | $ | 6,830 | | | $ | — | | | | 0.0 | % |
| | | | | | | | | | | | | | | | | | | | |
Year ended December 31, 2012 | | | | | | | | | | | | | | | | | | | | |
Life insurance in force | | $ | 378,467,115 | | | $ | 384,205,939 | | | $ | 5,738,824 | | | $ | — | | | | 0.0 | % |
| | | | | | | | | | | | | | | | | | | | |
Premiums and contract charges: | | | | | | | | | | | | | | | | | | | | |
Life and annuities | | $ | 1,201,592 | | | $ | (1,208,376 | ) | | $ | 6,784 | | | $ | — | | | | 0.0 | % |
Accident and health insurance | | | 97,272 | | | | (97,272 | ) | | | — | | | | — | | | | 0.0 | % |
| | | | | | | | | | | | | | | | | | | | |
| | $ | 1,298,864 | | | $ | (1,305,648 | ) | | $ | 6,784 | | | $ | — | | | | 0.0 | % |
| | | | | | | | | | | | | | | | | | | | |
No reinsurance or coinsurance income was netted against premiums ceded in the period from April 1, 2014 through December 31, 2014, the period from January 1, 2014 to March 31, 2014, the year ended December 31, 2013 or the year ended December 31, 2012.
66
| Item 11(f). | Selected Financial Data |
| | | | | | | | | | | | | | | | | | | | | | | | |
| | | 5-YEAR SUMMARY OF SELECTED FINANCIAL DATA | |
| | | Successor Period | | | Predecessor Period | |
| ($ in thousands) | | April 1, 2014 to
December 31, 2014 | | | January 1, 2014 to
March 31, 2014 | | | 2013 | | | 2012 | | | 2011 | | | 2010 | |
Operating results | | | | | | | | | | | | | | | | | | | | | | | | |
Net investment income | | $ | 288,571 | | | $ | 2,350 | | | $ | 10,935 | | | $ | 11,590 | | | $ | 11,836 | | | $ | 12,067 | |
Realized capital gains and losses | | | 46,092 | | | | 285 | | | | — | | | | 626 | | | | 2,075 | | | | 694 | |
Total revenues | | | 614,216 | | | | 2,635 | | | | 10,935 | | | | 12,216 | | | | 13,911 | | | | 12,761 | |
Net income | | | 30,686 | | | | 1,713 | | | | 7,110 | | | | 7,943 | | | | 9,050 | | | | 8,310 | |
Financial position | | | | | | | | | | | | | | | | | | | | | | | | |
Investments | | $ | 11,088,465 | | | | | | | $ | 346,841 | | | $ | 354,762 | | | $ | 346,614 | | | $ | 332,049 | |
Total assets | | | 20,710,544 | | | | | | | | 18,844,833 | | | | 19,781,989 | | | | 20,863,567 | | | | 22,729,575 | |
Reserve for life-contingent contract benefits and contractholder funds | | | 16,293,301 | | | | | | | | 16,681,526 | | | | 17,680,523 | | | | 18,689,114 | | | | 20,258,388 | |
Shareholder’s equity | | | 679,042 | | | | | | | | 343,695 | | | | 346,518 | | | | 338,328 | | | | 325,867 | |
| Item 11(h). | Management’s Discussion and Analysis of Financial Condition and Results of Operations |
OVERVIEW
The following discussion highlights significant factors influencing the financial position and results of operations of Lincoln Benefit. It should be read in conjunction with the financial statements and related notes found under Item 11(e) contained herein. We operate as a single segment entity, based on the manner in which we use financial information to evaluate business performance and to determine the allocation of resources.
The most important factors we monitor to evaluate the financial condition and performance of our company include:
| | • | | For operations: premiums, benefits paid and contract charges ceded to reinsurers, including ALIC, and invested assets. |
| | • | | For investments: exposure to market risk, credit quality/experience, net investment income, cash flows, realized capital gains and losses, unrealized capital gains and losses, stability of long-term returns, and asset duration. |
| | • | | For financial condition: financial strength ratings and capital position. |
APPLICATION OF CRITICAL ACCOUNTING ESTIMATES
The preparation of financial statements in conformity with accounting principles generally accepted in the United States of America (“GAAP”) requires the application of accounting policies that often involve a significant degree of judgment. Management, on an ongoing basis, reviews estimates and assumptions used in the preparation of financial statements. If management determines that modifications in assumptions and estimates are appropriate given current facts and circumstances, the Company’s results of operations and financial position as reported in the Consolidated Financial Statements could change significantly.
Management believes the critical accounting policies relating to the following areas are most dependent on the application of estimates, assumptions and judgments:
| | • | | Future policy benefits and other policyholder liabilities |
67
| | • | | Value of business acquired (“VOBA”) |
| | • | | Investments — Impairments and Fair Value Measurements |
| | • | | Reserves for Contingencies |
Future Policy Benefits and Other Policyholder Liabilities
Policy liabilities are established for future policy benefits on certain annuity, life, and long term care policies. Such liabilities are established in amounts adequate to meet the estimated future obligations of policies in-force. Changes in policy and contract claims are recorded in policyholder benefits, in the Consolidated Statement of Operations and Comprehensive Income (Loss).
For ASC 944-20 products, benefit reserves are computed using the net level premium method for individual life and annuity policies, and are based upon estimates as to future investment yield, mortality and lapse that include provisions for adverse deviation. Mortality, morbidity and lapse assumptions for all policies are based on the Company’s own experience and industry standards.
Liabilities for outstanding claims and claims adjustment expenses are estimates of payments to be made on life and health insurance contracts for reported claims and claims adjustment expenses. A liability is also held for claims adjustment expenses incurred but not reported as of the balance sheet date. These liabilities are determined using case basis evaluations and statistical analyses and represent estimates of the ultimate cost of all claims incurred but not paid. These estimates are continually reviewed and adjusted as necessary; such adjustments are reflected in current operations.
Future policy benefit reserves for fixed indexed annuity policies with returns linked to the performance of a specified market index are equal to the sum of the fair value of the embedded derivatives and the host (or guaranteed) component of the contracts. The change in the fair value of the embedded derivative is linked to the performance of the equity option. The host value is established as of the date of acquisition and is equal to the total account value, plus the value of the unexpired options at the date of acquisition, less the embedded derivative, and accreted over the policy’s life at a constant rate of interest. Future policy benefits reserves for the portion of fixed indexed annuities earning a fixed rate of interest and other deferred annuity products are computed under a retrospective deposit method and represent policy account balances before applicable surrender charges.
The Company holds additional liabilities for its no lapse guarantees (associated with universal life policies) and guaranteed minimum withdrawal benefits (“GMWB”) associated with fixed annuities, which are accounted for in accordance with ASC 944-20, Financial Services — Insurance Activities. The Company’s reserves related to guaranteed minimum income benefits, guaranteed minimum accumulation benefits, and guaranteed minimum withdrawal benefits associated with variable annuities are ceded to external reinsurers.
Policy liabilities and accruals are based on the various estimates discussed above. Although the adequacy of these amounts cannot be assured, the Company believes that policy liabilities and accruals will be sufficient to meet future obligations of policies in-force. The amount of liabilities and accruals, however, could be revised if the estimates discussed above are revised.
Sensitivity for Future Policy Benefit Reserves
The Company’s liability for future policy benefits also includes reserves based on the present value of estimated future payments to or on behalf of contractholders, where the timing and amount of payment depends on policyholder mortality. Expected mortality is generally based on the Company’s experience, industry data, and/or other factors. Interest rate assumptions are based on factors such as market conditions and expected investment returns. After the initial establishment of reserves, premium deficiency and loss recognition tests are performed
68
using best estimate assumptions as of the testing date without provisions for adverse deviation. When the liabilities for future policy benefits plus the present value of expected future gross premiums for the aggregate product group are insufficient to provide for expected future policy benefits and expenses for that line of business (i.e., reserves net of any VOBA asset), VOBA would first be written off and thereafter, if required, a premium deficiency reserve would be established by a charge to earnings.
Value of Business Acquired
In conjunction with the acquisition of a block of insurance policies or investment contracts, a portion of the purchase price is allocated to the right to receive future gross profits from the acquired insurance policies or investment contracts. This intangible asset, called value of business acquired, represents the actuarially estimated present value of future cash flows from the acquired policies. The estimated present value of future cash flows is based on certain assumptions, including mortality, persistency, expenses, and interest rates that the Company expects to experience in future years. For interest sensitive products, VOBA is amortized over the life of the policies in relation to the emergence of estimated gross profits from margins on mortality, interest, expenses, and surrenders, all of which are net of reinsurance and include actual realized gains and losses on investments. For non-interest sensitive products, such as term life insurance, VOBA is amortized in relation to premium. VOBA is reviewed periodically for loss recognition to ensure that the unamortized balance is recoverable from future earnings from the business. The carrying amount of VOBA is adjusted for the effects of realized and unrealized gains and losses on debt securities classified as available-for-sale. We also periodically evaluate the recoverability of our VOBA. For certain contracts, this evaluation is performed as part of our premium deficiency testing.
Annual assumptions review and quarterly adjustments
Annually, we perform a comprehensive review of the assumptions used in estimating gross profits for future periods. Beginning in 2015, we will perform our annual review of assumptions during the second quarter. Updates to assumptions may cause significant variability in amortization expense in the future. The impact on our results of operations of changes in lapse experience, mortality and revisions to expected future rates of return on investments can be offsetting and therefore we are unable to predict their movement or offsetting impact over time.
The quarterly adjustments for current period experience reflect the impact of differences between actual gross profits for a given period and the previously estimated expected gross profits for that period. To the extent each period’s actual experience differs from the previous estimate for that period, the assumed level of total gross profits may change. In these cases, we recognize a cumulative adjustment to all previous periods’ amortization, also referred to as an experience true-up adjustment.
VOBA Sensitivities
For our equity-indexed annuity, variable and universal life policies, a significant portion of our gross profits is derived from interest and mortality margins. As a result, our estimates of future gross profits are significantly influenced by our interest and mortality assumptions. Our mortality assumptions are used to estimate future death claims over the life of these policies and may be developed based on Company experience, industry experience and other factors. Unless a material change in mortality experience that we feel is indicative of a long term trend is observed in an interim period, we generally update our mortality assumptions annually. Updates to our mortality assumptions in future periods could have a significant adverse or favorable effect on our results of operations.
69
The following table provides a demonstration of the sensitivity of the VOBA balance relative to our future interest and mortality assumptions by quantifying the adjustments that would be required, assuming both an increase and decrease in our future interest and mortality margin by 10%. The information below is for illustrative purposes only and reflects only the direct effect of changes in our interest and mortality margin on the VOBA balance with no changes in any other assumptions such as persistency or expenses included in our evaluation of VOBA.
| | | | |
| | | December 31, 2014
Increase/(Decrease) in
VOBA | |
| | | (in millions) | |
Decrease in future interest and mortality margin by 10% | | $ | (2.4 | ) |
Increase in future interest and mortality margin by 10% | | $ | 2.1 | |
In addition to the impacts of interest and mortality experience relative to our assumptions, other factors may also drive variability in amortization expense, particularly when our annual assumption updates are performed. As noted above, however, the impact on our results of operations of changes in these assumptions can be offsetting and we are unable to predict their movement or offsetting impact over time.
Valuation of Investments, Including Derivatives, and the Recognition of Other-than-Temporary Impairments
Our investment portfolio consists of public and private fixed maturity securities, commercial mortgage and other loans, other invested assets and derivative financial instruments. Derivatives are financial instruments whose values are derived from interest rates, financial indices or the values of securities. The derivative financial instruments we generally use are futures and options. Management believes the following accounting policies related to investments, including derivatives, are most dependent on the application of estimates and assumptions. Each of these policies is discussed further within other relevant disclosures related to the investments and derivatives, as referenced below.
| | • | | Valuation of investments, including derivatives; |
| | • | | Recognition of other-than-temporary impairments; and |
| | • | | Determination of the valuation allowance for losses on commercial mortgage and other loans. |
We present at fair value in the statements of financial position our investments classified as available-for-sale, including fixed maturities, derivatives, and embedded derivatives. For additional information regarding the key estimates and assumptions surrounding the determination of fair value of fixed maturity and equity securities, as well as derivative instruments, embedded derivatives and other investments, see Notes 2 and 5 to the Consolidated Financial Statements.
For our investments classified as available-for-sale, the impact of changes in fair value is recorded as an unrealized gain or loss in Accumulated other comprehensive income (loss), net (“AOCI”), a separate component of equity. For a discussion of our policies regarding other-than-temporary declines in investment value and the related methodology for recording other-than-temporary impairments of fixed maturity and equity securities, see Note 2 to the Consolidated Financial Statements.
Commercial mortgage loans (“CMLs”) acquired at fair value as a result of the Acquisition are carried at amortized cost using the effective interest rate method. CMLs held by the Company are diversified by property type and geographic area throughout the U.S. CMLs are considered impaired when it is probable that the Company will not collect amounts due according to the terms of the original loan agreement. The Company assesses the impairment of loans individually for all loans in the portfolio. The Company estimates the fair value of the underlying collateral using internal valuations generally based on discounted cash flow analyses. The Company estimates an
70
allowance for loan losses (“ALL”) representing potential credit losses embedded in the CML portfolio. The estimate is based on a consistently applied analysis of the loan portfolio and takes into consideration all available information, including industry, geographical, economic and political factors.
Income Taxes
Income taxes represent the net amount of income taxes that the Company expects to pay to or receive from various taxing jurisdictions in connection with its operations. The Company provides for Federal and state income taxes currently payable, as well as those deferred due to temporary differences between the financial reporting and tax bases of assets and liabilities. Deferred tax assets and liabilities are measured at the balance sheet date using enacted tax rates expected to apply to taxable income in the years the temporary differences are expected to reverse. The realization of deferred tax assets depends upon the existence of sufficient taxable income within the carryforward periods under the tax law in the applicable jurisdiction. Valuation allowances are established when management determines, based on available information, that it is more likely than not that deferred tax assets will not be realized. Management considers all available evidence including past operating results, the existence of cumulative losses in the most recent years, forecasted earnings, future taxable income and prudent and feasible tax planning strategies. The Company’s accounting for income taxes represents management’s best estimate of the tax consequences of various events and transactions.
Significant management judgment is required in determining the provision for income taxes and deferred tax assets and liabilities, and in evaluating the Company’s tax positions including evaluating uncertainties under the guidance for Accounting for Uncertainty in Income taxes. Under the guidance, the Company determines whether it is more likely than not that a tax position will be sustained upon examination by the appropriate taxing authorities before any part of the benefit can be recorded in the financial statements. The Company’s liability for income taxes includes the liability for unrecognized tax benefits and interest that relate to tax years still subject to review by the Internal Revenue Service (“IRS”) or other taxing authorities. We do not anticipate any significant changes within the next 12 months to our total unrecognized tax benefits related to tax years for which the statute of limitations has not expired.
Reserves for contingencies
A contingency is an existing condition that involves a degree of uncertainty that will ultimately be resolved upon the occurrence of future events. Under GAAP, reserves for contingencies are required to be established when the future event is probable and its impact can be reasonably estimated, such as in connection with an unresolved legal matter. The initial reserve reflects management’s best estimate of the probable cost of ultimate resolution of the matter and is revised accordingly as facts and circumstances change and, ultimately, when the matter is brought to closure.
OPERATIONS
Overview and strategy. We provide interest-sensitive, traditional and variable life insurance products through exclusive financial specialists. Prior to July 18, 2013, we sold interest-sensitive, traditional and variable life insurance, and fixed annuities including deferred and immediate through independent master brokerage agencies. Effective January 1, 2014, we no longer offer fixed annuities such as deferred and immediate annuities, however we continue to receive deposits on existing policies.
On April 1, 2014, all of the capital stock in Lincoln Benefit was acquired by Resolution Life, Inc. Immediately prior to that closing, Lincoln Benefit signed a Partial Commutation Agreement with ALIC (the “Partial Commutation”), whereby we commuted certain business previously reinsured to ALIC, including (a) all of the fixed deferred annuity, value adjusted deferred annuity and indexed deferred annuity business written by the Company that was previously reinsured to ALIC, (b) all of the life insurance business written by the Company through independent producers that was previously reinsured to ALIC, other than certain specified life business, and (c) all of the net liability of the Company with respect to the accident and health and long-term care insurance business written by the Company that was previously reinsured to ALIC.
71
Immediately after the announcement of the execution of the Purchase Agreement in July 2013, we ceased soliciting and selling new policies through our independent agent channel. We continued to sell new policies provided through the Allstate exclusive agency channel for a transitional period following the execution of the Purchase Agreement until they are transitioned to a new Allstate company beginning in the first quarter of 2015. ALIC continues to reinsure the ALIC Reinsured Business pursuant to the ARRA or certain existing reinsurance agreements. In addition, ALIC continues to administer the ALIC Reinsured Business pursuant to the ASA or certain existing administrative service agreements.
In connection with the Acquisition, Resolution Life, Inc. and ALIC entered into a Transition Services Agreement (the “TSA”), pursuant to which ALIC will continue to provide certain administrative services for the Recaptured Business for a period of twelve to twenty-four months after the closing. Following termination of the TSA, we plan to outsource the administration of the Recaptured Business to third-party administrators. In particular, the administration of our deferred annuity business has been outsourced to se2, LLC, an unaffiliated third-party service provider, effective February 23, 2015. The remaining administration will be outsourced to Alliance–One Services, Inc., an unaffiliated third-party service provider, later this year.
At the closing, Lincoln Benefit entered into two transactions with Hannover Re. The first transaction provided financing for a portion of our statutory reserves associated with our universal life business with no-lapse guarantees and our level premium term life business (the “AXXX/XXX Financing”). The second transaction involved a reinsurance agreement with Hannover Re, structured on a combined modified coinsurance and monthly renewable term reinsurance basis.
Our parent company, Resolution Life, Inc., is focused on the management of in-force policies of life insurance companies. Pursuant to this strategy, Resolution Life, Inc. intends to acquire additional life insurance companies or runoff blocks of business from unrelated insurers. Resolution Life, Inc. may seek to combine portions of its acquired businesses in order to recognize efficiencies.
Presentation of Financial Information
The financial statements are presented for Successor and Predecessor Periods, which relate to the accounting periods after and before April 1, 2014, respectively, the date of the closing of the Acquisition. For periods after April 1, 2014, the accompanying financial statements comprise the consolidated financial statements of the Company, which include the accounts of the Company and its subsidiary. Due to the Acquisition and the application of push-down accounting, different bases of accounting have been used to prepare the Predecessor and Successor financial statements. A black line separates the Predecessor and Successor financial statements to highlight the lack of comparability between these two periods.
Diminished Comparability of Pre- and Post-Acquisition Financial Information
As a result of the Acquisition and Partial Commutation effective April 1, 2014, comparison of the financial condition and results of operations for the pre- and post-acquisition periods is not meaningful. For purposes of the Management Discussion and Analysis, the Company has provided comparative analysis of the Balance Sheet as of December 31, 2014 compared to December 31, 2013. For the Results of Operations, the Company has provided summary level information for the Successor and Predecessor Periods, but has provided more detail analysis of the components of operations for the Successor Period only from April 1, 2014 to December 31, 2014.
72
Financial Position
The following table outlines amounts reported in the Company’s Balance Sheet for the year ended December 31, 2014 as compared to the year ended December 31, 2013 (in millions):
| | | | | | | | |
| | | 12/31/14 | | | 12/31/13 | |
Assets | | | | | | | | |
Cash & invested assets | | $ | 11,138.2 | | | $ | 351.9 | |
Reinsurance recoverables | | | 5,695.0 | | | | 16,708.6 | |
Valuation of business acquired (VOBA) | | | 231.5 | | | | — | |
Deposit receivable | | | 1,383.4 | | | | — | |
Other assets | | | 688.5 | | | | 83.7 | |
Separate account assets | | | 1,573.9 | | | | 1,700.6 | |
| | | | | | | | |
Total Assets | | $ | 20,710.5 | | | $ | 18,844.8 | |
| | | | | | | | |
Liabilities | | | | | | | | |
Future policy benefits | | $ | 6,464.0 | | | $ | 3,557.4 | |
Policyholders’ account balances | | | 9,829.3 | | | | 13,124.1 | |
ModCo payable | | | 1,383.4 | | | | — | |
Long-term debt | | | 551.6 | | | | — | |
Other liabilities | | | 229.3 | | | | 119.0 | |
Separate account liabilities | | | 1,573.9 | | | | 1,700.6 | |
| | | | | | | | |
Total Liabilities | | | 20,031.5 | | | | 18,501.1 | |
| | | | | | | | |
Shareholder’s Equity | | | | | | | | |
Common stock | | $ | 2.5 | | | $ | 2.5 | |
Additional paid-in capital | | | 593.6 | | | | 180.0 | |
Accumulated other comprehensive income | | | 85.4 | | | | 3.9 | |
Retained earnings | | | (2.5 | ) | | | 157.3 | |
| | | | | | | | |
Total Shareholder’s Equity | | $ | 679.0 | | | | 343.7 | |
| | | | | | | | |
Total Liabilities and Shareholder’s Equity | | $ | 20,710.5 | | | $ | 18,844.8 | |
| | | | | | | | |
December 31, 2014 vs. December 31, 2013
Assets
Total assets increased by $1.9 billion, from $18.8 billion at December 31, 2013 to $20.7 billion at December 31, 2014. While the total increase in assets was more modest, the components changed significantly as a result of the Partial Commutation on April 1, 2014 as noted above. Significant variances are as follows:
Cash and invested assets increased by $10.8 billion, from $351.9 million at December 31, 2013 to $11.1 billion at December 31, 2014. The significant increase in cash invested assets relates to the Partial Commutation on April 1, 2014 as discussed earlier in this document. At that date, the Company assumed a proportionate ‘slice’ of the ALIC portfolio and the composition of the assets has remained relatively consistent since the Partial Commutation on April 1, 2014. During the second quarter, the Company repositioned the portfolio to lessen the interest rate risk inherent in the short duration ALM position while also providing for incremental yield by year-end 2014. As the Company’s retained business is in run-off, the asset portfolio will decline as policy liabilities expire or surrender.
The Company’s fixed income bond portfolio was $9.4 billion at December 31, 2014 and is comprised approximately 75% of publicly traded securities and approximately 25% in privately placed issuances.
73
Mortgage loans were $1.1 billion at December 31, 2014 and comprise 11% of the invested asset portfolio. During third quarter, the Company extended a mandate to its third party asset managers to provide origination capabilities for high quality mortgage loans to replace maturing mortgages, better match liability profiles and improve yield.
Policy loans were $194.4 million at December 31, 2014 and are comprised of loans to policyholders pursuant to the terms of the policies issued. These balances are expected to continue to decline over time.
Derivatives were $26.0 million at December 31, 2014 and are comprised primarily of options and futures that are used to hedge the market risk inherent in the Company’s equity-indexed annuity products. These assets are carried at fair value with changes in fair value recognized as realized investment gains for GAAP reporting purposes. None of the derivatives are reported as accounting hedges for GAAP.
Short-term investments were $361.4 million at December 31, 2014. The amount invested in short-term investments fluctuates based on liquidly needs and the timing of investment decisions.
Reinsurance recoverablesarise under GAAP because reinsurance contracts do not relieve the ceding company of legal liability to contractholders, and therefore the ceding company is required to report reinsurance recoverables arising from these contracts separately as assets. The liabilities to policyholders for the contracts are reported as future policyholder benefits or policyholder account balances. In 2013 and prior to the Acquisition of the Company by Resolution Life, Inc. on April 1, 2014, the Company had reinsurance agreements under which it reinsured all of its business to ALIC, LB Re or non-affiliated reinsurers. Under the agreements, premiums, contract charges, interest credited to policyholders’ account balances, contract benefits and substantially all expenses were reinsured.
Reinsurance recoverables declined by $11.0 billion from $16.7 billion as of December 31, 2013 to $5.7 billion as of December 31, 2014. This decline reflects the Partial Commutation noted above, whereby the reinsurance recoverables from ALIC and other Allstate affiliates on the acquired business were settled, partially offset by the transaction that the Company entered into with Hannover Re.
The Company maintains reinsurance to limit aggregate and single losses on large risks. The Company ceded a portion of the mortality risk on certain life policies under coinsurance agreements to a pool of twelve non-affiliated reinsurers.
Valuation of Business Acquired (“VOBA”)arises because at the Acquisition date, the assets acquired and liabilities assumed generally are required to be measured at fair value. Fair value for financial reporting purposes is defined in ASC 820(“Fair Value Measurements and Disclosures”). ASC 820 emphasizes that fair value is a market participant-based exit price measurement, and not an entity-specific measurement.
Once it has been determined that an asset exists, the VOBA as of the Acquisition date is a part of the business combination, and this asset is measured at fair value in accordance with ASC 820 (i.e., the price that would be received to sell the asset in an ordinary transaction between market participants).
The actuarial appraisal method was used to determine the VOBA by lines of business and resulted in a total VOBA of $290.8 million. This was determined by projecting the present value of after tax statutory profits, discounted at a risk discount rate (“RDR”) of 12% and adjusted by projected cost of capital. This was compared to a fair deal RDR between 10% and 16% and determined to create a collar of reasonable values around this central value. This statutory value is then converted to VOBA by adjusting for GAAP to statutory accounting differences.
Deposit receivable and ModCo Payablewere each $1,383.4 million at December 31, 2014 and arise due to the modified coinsurance/monthly renewable term reinsurance agreement entered into with Hannover Re. For GAAP reporting purposes, a reinsurance transaction must pass significant risk to the reinsurer for a company to record a
74
credit for liabilities ceded. The Company has determined that the reinsurance transaction with Hannover Re does not pass GAAP risk transfer requirements and therefore must account for the transaction using Deposit Accounting principles. Under Deposit Accounting, the Company is required to establish a Deposit Receivable asset on the balance sheet that represents the reinsurance recoverable with an offsetting ModCo Liability for the same amount.
Other assetsprimarily consist of an intercompany loan, or “Vehicle Note” that the Company entered into on April 1, 2014 with its affiliate Lanis LLC (“Lanis”) in the amount of $513.0 million. The Vehicle Note balance was $551.6 million at December 31, 2014. Please see the discussion on the related Surplus Note in the Long-Term Debt section below.
Separate Account assets and liabilities decreased by $126.7 million from $1,700.6 million at December 31, 2013 to $1,573.9 million at December 31, 2014. This decrease was primarily driven by surrenders and benefits during the year, partially offset by investment income.
The assets of Separate Accounts are carried at fair value for GAAP. Separate Accounts liabilities represent the contractholders’ claims to the related assets and are carried at the fair value of the assets. In the event the asset values of certain contractholder accounts are projected to be below the value guaranteed by the Company, a liability is established through a charge to earnings.
As of December 31, 2014 and 2013, we had Separate Account assets related to variable annuity and variable life contracts totaling $1.6 billion and $1.7 billion, respectively. Lincoln Benefit’s variable annuity business is reinsured by ALIC under an existing reinsurance agreement between Lincoln Benefit and ALIC. As of December 31, 2014 and 2013, all assets of the Separate Accounts that support the variable annuity and variable life business were legally insulated.
Prior to April 1, 2014, the Company had been recording the sale of certain Market Value Adjusted Annuities (“MVAAs”) as part of the Separate Accounts, and then reinsuring these risks to ALIC. As part of the Partial Commutation with ALIC, effective April 1, 2014, the Company retained these MVAAs with assets and liabilities of $1.3 billion. In conjunction with the Partial Commutation and with Nebraska Department of Insurance (the “Department of Insurance”) approval, the Company reclassified these MVAAs to General Account liabilities and are reflected in Policyholders’ Account Balances.
Liabilities
Total liabilities increased by $1.5 billion, from $18.5 billion at December 31, 2013 to $20.0 billion at December 31, 2014. The increase primarily relates mainly to Policy Liabilities.
Policy liabilities increased by $2.9 billion, from $3.6 billion at December 31, 2013 to $6.5 billion at December 31, 2014 as a result of the Partial Commutation noted above. Policy liabilities are established for future policy benefits on annuity, life, and long term care policies. Such liabilities are established in amounts adequate to meet the estimated future obligations of policies in-force. Changes in policy and contract claims are recorded in policy benefits.
Policyholders’ Account Balances decreased by $3.3 billion, from $13.1 billion at December 31, 2013 to $9.8 billion at December 31, 2014 as a result of the Partial Commutation noted above. Policyholders’ account balances represent interest-bearing liabilities arising from the sale of products such as interest-sensitive life insurance and fixed annuities. Policyholder funds primarily comprise cumulative deposits received and interest credited to the contractholder less cumulative contract benefits, surrenders, withdrawals and contract charges for mortality or administrative expenses.
75
The Company holds additional liabilities for guaranteed minimum income benefits (“GMIB”) associated with variable annuities, which are accounted for in accordance with ASC 944-20,Financial Services — Insurance Activities. The reserves for certain living benefit features, including guaranteed minimum accumulation benefits (“GMAB”) and guaranteed minimum withdrawal benefits (“GMWB”) are accounted for as embedded derivatives, with fair values calculated as the present value of expected future benefit payments to contractholders less the present value of assessed rider fees attributable to the embedded derivative feature. This methodology could result in either a liability or contra-liability balance, given changing capital market conditions and various actuarial assumptions. The Company’s GMIB, GMAB and GMWB reserves are ceded to external reinsurers. For additional information regarding the valuation of these optional living benefit features, see Note 10 to the Consolidated Financial Statements.
Long-Term Debt of $551.6 million represents a surplus note that was initially issued on April 1, 2014 in the amount of $513.0 million. Effective April 1, 2014, and with Department of Insurance approval, Lancaster Re Captive Insurance Company, a Nebraska special purpose financial captive insurer (“Lancaster Re”) and a subsidiary of the Company, issued a variable funding Surplus Note (the “Surplus Note”) to its affiliate, Lanis, for $513.0 million and acquired from Lanis a Vehicle Note (the “Vehicle Note”) for $513.0 million. The Vehicle Note is held to support a portion of Lancaster Re’s reinsurance obligations and has been authorized as an acceptable form of reinsurance collateral pursuant to Nebraska Statutes.
With Department of Insurance pre-approval, (i) the Surplus Note is increased each quarter with a corresponding increase in the Vehicle Note, and (ii) interest on the Surplus Note for the prior quarter is paid on the first day of each subsequent quarter at a rate consistent with the rate received on the Vehicle Note of 4%. The Surplus Note and Vehicle Note increased by $38.6 million and was recognized in the Successor Period from April 1, 2014 through December 31, 2014. The Surplus Note is unsecured and subordinated to all present and future indebtedness, policy claims and other creditor claims of Lancaster Re.
Deferred income taxes increased by $38.1 million, from a liability of $2.6 million at December 31, 2013 to a liability of $40.7 million at December 31, 2014. The net Deferred Income Tax liability of $40.7 million at December 31, 2014 consisted of $2,098.2 million of deferred tax assets, primarily related to policyholder reserves less $2,138.9 million of deferred tax liabilities, primarily related to amounts recoverable from reinsurers.
Results of Operations
The following table outlines amounts reported in Net Income for the Predecessor period from January 1, 2014 to March 31, 2014 and Successor period from April 1, 2014 for the year ended December 31, 2014 as compared to the Predecessor year ended December 31, 2013 ($ in millions):
| | | | | | | | | | | | |
| | | Successor Period | | | Predecessor Period | |
| | | For the period from
April 1, 2014
to December 31, 2014 | | | For the period from
January 1, 2014
March 31, 2014 | | | For the year ended
December 31, 2013 | |
Income Before Federal Income Taxes | | $ | 44.9 | | | $ | 2.6 | | | $ | 10.9 | |
Federal Income Taxes | | | 14.2 | | | | 0.9 | | | | 3.8 | |
| | | | | | | | | | | | |
Net Income | | $ | 30.7 | | | $ | 1.7 | | | $ | 7.1 | |
| | | | | | | | | | | | |
Other Comprehensive Income (OCI) | | | 85.5 | | | | 1.4 | | | | (9.9 | ) |
| | | | | | | | | | | | |
Comprehensive Income (Loss) | | $ | 116.2 | | | $ | 3.1 | | | $ | (2.8 | ) |
| | | | | | | | | | | | |
76
December 31, 2014 vs. December 31, 2013
Net Income of $30.7 million for 9 months of the Successor period from April 1, 2014 to December 31, 2014 increased significantly compared to the Predecessor periods as a result of the Partial Commutation on April 1, 2014 and was driven by realized capital gains (net of changes in future policy benefits and VOBA) and release of product margins.
Other comprehensive income for the 9 months from April 1, 2014 to December 31, 2014 was primarily driven by unrealized gains on fixed maturities of $159.2 million as interest rates declined, partially offset by shadow adjustments related to VOBA and SOP 03-01 liabilities of $27.8 million.
A discussion of the significant components of income in the Successor period is summarized below.
Results of Operations in Successor Period
| | | | |
| | | Successor Period | |
| ($ in millions) | | For the period from
April 1, 2014
to December 31, 2014 | |
Revenues | | | | |
Premiums earned | | $ | 20.4 | |
Fee income from policyholders | | | 259.2 | |
Net investment income | | | 288.6 | |
Realized investment gains | | | 46.0 | |
| | | | |
Total revenues | | $ | 614.2 | |
| |
Expenses | | | | |
Policyholder benefits | | $ | 216.6 | |
Interest credited to policyholders | | | 256.7 | |
Other operating expenses | | | 57.0 | |
Amortization of VOBA | | | 39.0 | |
| | | | |
Total Expenses | | $ | 569.3 | |
| | | | |
| |
Net Income before Federal Income Taxes | | $ | 44.9 | |
| | | | |
Premiums Earned and Fee Income
Prior to April 1, 2014 (the “Predecessor Periods”), the Company had reinsurance agreements whereby all premiums, fee income from policyholders and returns credited to policyholders, policyholder benefits and substantially all expenses were ceded to ALIC and other reinsurers.
Premiums earnedfor the Successor Period were $20.4 million. The premiums of $20.4 million recognized in the Successor Period relate primarily to traditional life and health insurance products and immediate annuities. Premiums from these products are recognized as revenue when received at the inception of the contract. Premiums earned are net of reinsurance premiums paid on the ceded business.
Contracts that do not subject the Company to significant risk arising from mortality or morbidity are referred to as investment contracts. These products include fixed annuities, including market value adjusted annuities, equity-indexed annuities. Consideration received for such contracts is reported as policyholder account balances.
Additionally, interest-sensitive life contracts, such as universal life and single premium life, are insurance contracts whose terms are not fixed and guaranteed. The terms that may be changed include premiums paid by the policyholder, interest credited to the policyholder account balance and contract charges assessed against the policyholder account balance. Premiums from these contracts are credited to policyholder account balances.
77
Fee income from policyholdersfor the Successor Period was $259.2 million. The fee income from policyholders consists of fees assessed against the policyholder account balance for the cost of insurance (mortality risk), contract administration and surrender of the policy prior to contractually specified dates. These charges are recognized as revenue when assessed against the policyholder account balance. Policyholder benefits include life-contingent benefit payments in excess of the policyholder account balance.
Net investment income for the Successor Period was $288.6 million and was attributable to the following asset types (in millions):
| | | | |
Fixed income securities | | $ | 232.0 | |
Commercial mortgage loans | | | 49.4 | |
Cash & short-term investments | | | 4.8 | |
Other | | | 7.4 | |
| | | | |
Gross investment income | | $ | 293.6 | |
Investment expenses | | | 5.0 | |
| | | | |
Net investment income | | $ | 288.6 | |
| | | | |
Realized investment gains for the Successor Period were $46.0 million, primarily from the sale of fixed income securities and unrealized gains on derivatives that are used to economically hedge certain market-related risk on equity indexed annuity products. This amount also includes unrealized gains on derivatives.
Policyholder benefitsfor the Successor Period were $216.5 million and include both incurred claims and the change in liability for future policy benefits. Liabilities for future policy benefits on annuity, life and long-term care policies are established in amounts adequate to meet the estimated future obligations of policies in-force. Liabilities for outstanding claims and claims adjustment expenses are estimates of payments to be made on life and health insurance contracts for reported losses and claims adjustment expenses. Changes in policy and contract claims are recorded in policy benefits.
Interest credited to policyholdersfor the Successor Period were $256.7 million and represent interest-bearing liabilities arising from the sale of products such as interest-sensitive life insurance and fixed annuities. Policyholder funds primarily comprise cumulative deposits received and interest credited to the contractholder less cumulative contract benefits, surrenders, withdrawals and contract charges for mortality or administrative expenses.
Operating and acquisition expenses for the Successor Period were $96.0 million and were comprised of primarily of general operating expenses, premium taxes and other fees associated with reinsurance of $57.0 million. This is reduced for allowances received on reinsurance ceded.Amortization of VOBAof $39.0 million, reducing the initial balance to $251.8 million (prior to shadow adjustments) from an initial balance at April 1, 2014 of $290.8 million. The VOBA relates primarily to interest sensitive life products and is amortized over the life of the policies in relation to the emergence of estimated gross profits from margins on mortality, interest, expenses, and surrenders, all of which are net of reinsurance and include actual realized gains and losses on investments. For non-interest sensitive life products, such as term life insurance, VOBA is amortized in relation to premium.
78
Other Information Related to Successor Period
The following table presents surrender and withdrawal amounts and rates for major insurance product lines for the period from April 1, 2014 through December 31, 2014:
| | | | | | | | |
| | | Amounts ($ in thousands) | | | Rate | |
Annuities | | $ | 866,216.1 | | | | 16.7 | % |
Variable and interest-senstive life | | $ | 111,974.3 | | | | 4.2 | % |
| (1) | Surrender rates are based on the average surrenderable future policy benefits and/or policyholders’ account balances for the related policies and contracts in force during the period from April 1, 2014 through December 31, 2014. |
79
General Account Investment Portfolio
The General Account Investment Assets (“GAIA”) portfolio consists of a well-diversified portfolio of public and private fixed maturities, commercial mortgages and other loans and other invested assets. The General Account portfolios and investment results support the insurance liabilities of Lincoln Benefit’s business operations. The following table reconciles the balance sheet asset amounts to GAIA.
| | | | |
| ($ in thousands) | | | |
Fixed maturities, available-for-sale, at fair value | | $ | 9,390,647 | |
Commercial mortgage loans | | | 1,115,167 | |
Policy loans | | | 194,385 | |
Short-term investments | | | 361,369 | |
Other invested assets | | | 26,897 | |
| | | | |
Total Investments | | $ | 11,088,465 | |
| | | | |
| (1) | Assets listed in the “Other” category principally consist of derivative assets and liabilities |
Investment Results of General Account Investment Assets
The following table summarizes investment results by asset category for the period from April 1, 2014 through December 31, 2014:
| | | | | | | | |
| | | For the Period from April 1, 2014
through December 31, 2014 | |
| (in thousands) | | Amount | | | Yield | |
Fixed income securities | | $ | 231,972 | | | | 3.48 | % |
Commercial mortgage loans | | | 49,417 | | | | 3.14 | % |
Cash and short-term investments | | | 4,786 | | | | 0.36 | % |
Other investment (loss) income | | | 7,353 | | | | | |
| | | | | | | | |
Gross investment income | | $ | 293,528 | | | | | |
| | | | | | | | |
Fixed Maturities
The fixed maturity portfolio consists largely of investment grade corporate debt securities and includes significant amounts of U.S. government and agency obligations. At December 31, 2014, GAIA held CMBS with an amortized cost of $331 million. The General Account had $149 million of direct exposure to the sovereign debt of Italy, Greece, Portugal, Spain and the Republic of Ireland.
80
Fixed Maturities By Industry
The General Account fixed maturities portfolios include publicly-traded and privately-placed corporate debt securities across an array of industry categories. The following table sets forth these fixed maturities by industry category as of December 31, 2014 along with their associated gross unrealized gains and losses:
| | | | | | | | | | | | | | | | |
(in thousands) | | Amortized
Cost | | | Gross
Unrealized
Gains | | | Gross
Unrealized
Losses | | | Fair Value | |
Fixed maturities | | | | | | | | | | | | | | | | |
U.S. Treasury Securities and Obligations of U.S. Government Authority and Agencies | | $ | 810,057 | | | $ | 47,859 | | | $ | (590 | ) | | $ | 857,326 | |
Obligations of U.S. States and Political Subdivisions | | | 250,008 | | | | 5,638 | | | | (437 | ) | | | 255,209 | |
Corporate securities | | | | | | | | | | | | | | | | |
Basic Materials | | | 558,562 | | | | 9,014 | | | | (4,078 | ) | | | 563,498 | |
Communications | | | 567,023 | | | | 11,117 | | | | (2,356 | ) | | | 575,784 | |
Consumer, Cyclical | | | 470,091 | | | | 9,026 | | | | (1,001 | ) | | | 478,116 | |
Consumer, Non-cyclical | | | 1,156,942 | | | | 29,779 | | | | (809 | ) | | | 1,185,912 | |
Diversified | | | 17,240 | | | | 232 | | | | — | | | | 17,472 | |
Energy | | | 923,204 | | | | 6,778 | | | | (19,103 | ) | | | 910,879 | |
Financial | | | 1,028,659 | | | | 19,090 | | | | (1,124 | ) | | | 1,046,625 | |
Industrial | | | 1,668,357 | | | | 30,248 | | | | (3,406 | ) | | | 1,695,199 | |
Technology | | | 208,423 | | | | 2,762 | | | | (346 | ) | | | 210,839 | |
Utilities | | | 680,890 | | | | 14,434 | | | | (1,903 | ) | | | 693,421 | |
ABS | | | 373,304 | | | | 6,107 | | | | (2,408 | ) | | | 377,003 | |
CMBS | | | 331,041 | | | | 3,507 | | | | (1,065 | ) | | | 333,483 | |
RMBS | | | 188,055 | | | | 2,849 | | | | (1,023 | ) | | | 189,881 | |
| | | | | | | | | | | | | | | | |
Total fixed maturities | | $ | 9,231,856 | | | $ | 198,440 | | | $ | (39,649 | ) | | $ | 9,390,647 | |
| | | | | | | | | | | | | | | | |
Fixed Maturities Credit Quality
The Securities Valuation Office (“SVO”) of the National Association of Insurance Commissioners (“NAIC”), evaluates the investments of insurers for regulatory reporting purposes and assigns fixed maturity securities to one of six categories (“NAIC Designations”). NAIC designations of “1” or “2” include fixed maturities considered investment grade, which include securities rated Baa3 or higher by Moody’s or BBB- or higher by Standard & Poor’s. NAIC Designations of “3” through “6” are referred to as below investment grade, which include securities rated Ba1 or lower by Moody’s and BB+ or lower by Standard & Poor’s. As a result of time lags between the funding of investments, the finalization of legal documents and the completion of the SVO filing process, the fixed maturity portfolio generally includes securities that have not yet been rated by the SVO as of each balance sheet date. Pending receipt of SVO ratings, the categorization of these securities by NAIC designation is based on the expected ratings indicated by internal analysis.
81
Below investment grade fixed maturities represented 27.6% of the gross unrealized losses at December 31, 2014. The following table sets forth the General Accounts’ fixed maturities by NAIC rating at the dates indicated.
| | | | | | | | | | | | | | | | | | |
($ \in thousands) | | | | Amortized
Cost | | | Gross
Unrealized
Gains | | | Gross
Unrealized
Losses | | | Fair Value | |
| NAIC Rating | | | | | | | | | | | | | | | | | | |
| 1 | | Aaa, Aa, A | | $ | 5,101,074 | | | $ | 135,987 | | | $ | (8,311 | ) | | $ | 5,228,750 | |
| 2 | | Baa | | | 3,623,723 | | | | 58,229 | | | | (20,403 | ) | | | 3,661,549 | |
| | | | | | | | | | | | | | | | | | |
| | Investment grade | | | 8,724,797 | | | | 194,216 | | | | (28,714 | ) | | | 8,890,299 | |
| 3 | | Ba | | | 423,403 | | | | 2,781 | | | | (9,403 | ) | | | 416,781 | |
| 4 | | B | | | 75,619 | | | | 1,443 | | | | (1,071 | ) | | | 75,991 | |
| 5 | | C and lower | | | 5,031 | | | | — | | | | (148 | ) | | | 4,883 | |
| 6 | | In or near default | | | 3,006 | | | | — | | | | (313 | ) | | | 2,693 | |
| | | | | | | | | | | | | | | | | | |
| | Below investment grade | | | 507,059 | | | | 4,224 | | | | (10,935 | ) | | | 500,348 | |
| | | | | | | | | | | | | | | | | | |
| | Total fixed maturities | | $ | 9,231,856 | | | $ | 198,440 | | | $ | (39,649 | ) | | $ | 9,390,647 | |
| | | | | | | | | | | | | | | | | | |
Commercial Mortgage Loans
At December 31, 2014, approximately 10.3% of GAIA were in commercial mortgage loans. At December 31, 2014, the carrying value of commercial mortgage loans was $1,115.2 million.
The investment strategy for the mortgage loan portfolio emphasizes diversification by property type and geographic location with a primary focus on asset quality. The table below shows the breakdown of the amortized cost of the General Accounts investments in mortgage loans by geographic region as of December 31, 2014:
| | | | |
($ in thousands) | | Carrying
Value | |
Alabama | | $ | 1,720 | |
Arizona | | | 35,481 | |
California | | | 255,563 | |
Colorado | | | 22,381 | |
Florida | | | 20,779 | |
Georgia | | | 27,502 | |
Hawaii | | | 8,125 | |
Illinois | | | 53,174 | |
Iowa | | | 1,490 | |
Kentucky | | | 8,260 | |
Maine | | | 4,114 | |
Maryland | | | 35,536 | |
Massachusetts | | | 92,963 | |
Minnesota | | | 52,496 | |
Missouri | | | 9,324 | |
Nevada | | | 14,705 | |
New Jersey | | | 84,007 | |
New York | | | 72,625 | |
North Carolina | | | 31,111 | |
Ohio | | | 38,400 | |
Oklahoma | | | 10,835 | |
Pennsylvania | | | 37,688 | |
South Carolina | | | 3,130 | |
Tennessee | | | 5,719 | |
Texas | | | 103,778 | |
Utah | | | 45,914 | |
Virginia | | | 18,572 | |
Washington | | | 13,138 | |
Wisconsin | | | 6,637 | |
General allowance for loan loss | | | — | |
| | | | |
Total commercial mortgage loans | | $ | 1,115,167 | |
| | | | |
82
Commercial Mortgage Loan Credit Quality
The values used in these ratio calculations were developed as part of the periodic review of the commercial mortgage loan portfolio, which includes an evaluation of the underlying collateral value.
| | | | | | | | | | | | | | | | | | | | | | | | | | | | |
| | | Recorded Investment | | | | | | | |
| | | Debt Service Coverage Ratios | | | | | | | | | | | | | |
($ in thousands) | | > 1.20x | | | 1.00x - 1.20x | | | < 1.00x | | | Total | | | % of Total | | | Estimated Fair Value | | | % of Total | |
Loan-to-value ratios: | | | | | | | | | | | | | | | | | | | | | | | | | | | | |
Less than 65% | | $ | 930,592 | | | $ | 151,700 | | | $ | 29,460 | | | $ | 1,111,752 | | | | 98 | % | | $ | 1,146,030 | | | | 98 | % |
65% to 75% | | | 16,591 | | | | 10,537 | | | | — | | | | 27,128 | | | | 2 | % | | | 28,275 | | | | 2 | % |
76% to 80% | | | — | | | | — | | | | — | | | | — | | | | 0 | % | | | — | | | | 0 | % |
Greater than 80% | | | — | | | | — | | | | — | | | | — | | | | 0 | % | | | — | | | | 0 | % |
| | | | | | | | | | | | | | | | | | | | | | | | | | | | |
Total | | $ | 947,183 | | | $ | 162,237 | | | $ | 29,460 | | | $ | 1,138,880 | | | | 100 | % | | $ | 1,174,305 | | | | 100 | % |
| | | | | | | | | | | | | | | | | | | | | | | | | | | | |
At December 31, 2014, there were no mortgage loans classified as problem loans or considered a troubled debt restructuring.
Results of Operations Predecessor Period
Net income Net income for the period January 1, 2014 through March 31, 2014 and for the years ended December 31, 2013 and 2012 is presented in the following table.
| | | | | | | | | | | | |
| ($ in thousands) | | For the
period
January 1,
2014
through
March 31,
2014 | | | 2013 | | | 2012 | |
Net investment income | | $ | 2,350 | | | $ | 10,935 | | | $ | 11,590 | |
Realized capital gains and losses | | | 285 | | | | — | | | | 626 | |
Income tax expense | | | (922 | ) | | | (3,825 | ) | | | (4,273 | ) |
| | | | | | | | | | | | |
Net income | | $ | 1,713 | | | $ | 7,110 | | | $ | 7,943 | |
| | | | | | | | | | | | |
Under reinsurance agreements all premiums, contract charges, interest credited to policyholders’ account balances, contract benefits and substantially all expenses were ceded to ALIC, Lincoln Benefit Reinsurance Company (“LB Re”, an affiliate of Lincoln Benefit) and other non-affiliated reinsurers, and were reflected net of such reinsurance in the Statements of Operations and Comprehensive Income. Results of operations included net investment income and realized capital gains and losses recognized in connection with the assets that were not transferred under the reinsurance agreements.
Net income in the ninety day period ended March 31, 2014 was $1.7 million including net investment income and realized capital gains. Net income decreased 10.5% in 2013 compared to 2012 due to lower net investment income and the absence of net realized capital gains in 2013.
83
Net investment income The following table presents net investment income for the period January 1, 2014 through March 31, 2014 and for the years ended December 31, 2013 and 2012.
| | | | | | | | | | | | |
| ($ in thousands) | | For the
period
January 1,
2014
through
March 31,
2014 | | | 2013 | | | 2012 | |
Fixed maturities | | $ | 2,461 | | | $ | 11,545 | | | $ | 12,138 | |
Short-term investments | | | 16 | | | | 23 | | | | 20 | |
| | | | | | | | | | | | |
Investment income, before expense | | | 2,477 | | | | 11,568 | | | | 12,158 | |
Investment expense | | | (127 | ) | | | (633 | ) | | | (568 | ) |
| | | | | | | | | | | | |
Net investment income | | $ | 2,350 | | | $ | 10,935 | | | $ | 11,590 | |
| | | | | | | | | | | | |
Net investment income was $2.4 million for the ninety day period. Net investment income decreased 5.7% or $655 thousand in 2013 compared to 2012. Both periods were impacted by lower yields.
Realized capital gains and losses Realized capital gains and losses were $.3 million in the 90 day period, primarily related to sales of investments and netted to zero in 2013 with gains from sales offsetting impairment write-downs. Realized capital gains of $626 thousand were recognized in 2012, primarily related to sales of investments.
MARKET RISK
Market risk is the risk that we will incur losses due to adverse changes in interest rates or credit spreads. We also have certain exposures to changes in equity prices in our equity-indexed annuities and separate accounts liabilities.
Overview. In formulating and implementing guidelines for investing funds, we seek to earn returns that contribute to stable profits while also meeting the future cash flow requirements of our liabilities.
We use quantitative and qualitative market-based approaches to measure, monitor and manage market risk. We evaluate our exposure to market risk through the use of multiple measures including but not limited to duration, earnings- and capital-at-risk, scenario analysis and sensitivity analysis. Duration measures the price sensitivity of assets or liabilities to changes in interest rates. For example, if interest rates increase 100 basis points, the fair value of an asset with a duration of 5 is expected to decrease in value by 5%. Earnings- and capital-at-risk are estimates of the change in earnings or capital that might be expected to emerge over a given time horizon in various defined stress tests. Scenario analysis estimates the potential changes in the value of various financial parameters that could occur under different hypothetical market conditions defined by changes to the market risk factors of interest rates and credit spreads. Sensitivity analysis estimates the potential changes in the value of various financial parameters that could occur under different hypothetical shocks to a market risk factor. In general, we establish investment portfolio asset allocation and market risk limits based upon a combination of duration, earnings- and capital-at-risk, scenario analysis and sensitivity analysis as well as a consideration of liquidity and diversification. The asset allocation limits place restrictions on the total funds that may be invested within an asset class. Comprehensive day-to-day management of market risk within defined tolerance ranges occurs as portfolio managers buy and sell within their respective markets based upon the acceptable boundaries established by investment and other risk policies.
Interest rate risk is the risk that we will incur a loss due to adverse changes in interest rates. This risk arises when our investments are not fully matched to our liabilities, or when characteristics of the assets or liabilities change. Interest rate risk includes risks related to changes in U.S. Treasury yields and other key risk-free reference yields.
One of the measures used to quantify interest rate exposure is duration. To estimate asset durations, we project asset cash flows and calculate their net present value using a risk-free market interest rate adjusted for credit quality, sector attributes, liquidity and other specific risks. Duration is calculated by revaluing these cash
83.1
flows at alternative interest rates and determining the percentage change in aggregate value. The asset projections include assumptions (based upon historical market experience and our experience) that are intended to reflect the effect of changing interest rates on the prepayment, leverage and/or option features of instruments, where applicable. The preceding assumptions relate primarily to mortgage-backed securities, and municipal and corporate obligations. Our asset duration was 5.5 as of December 31, 2014 (excluding assets in respect of business ceded to our wholly-owned subsidiary, Lancaster Re).
The difference between asset and liability duration is called the duration gap and is a measure of the mismatch between asset and liabilities. At the current time, because our asset durations are shorter than our liability durations, lower interest rate environments will in general result in more adverse financial outcomes than higher interest rate environments.
Based upon the information and assumptions used in the duration calculation, and interest rates in effect as of December 31, 2014, we estimate that a 100 basis point immediate, parallel fall in interest rates (“rate shock”) would increase the net fair value of the assets by $460 million, compared to $11.2 million as of December 31, 2013. The increase is due to an increase in the amount and mix of invested assets since the Partial Commutation and Acquisition by Resolution Life. The selection of a 100 basis point immediate, parallel change in interest rates should not be construed as our prediction of future market events, but only as an illustration of the potential effect of such an event.
To the extent that conditions differ from the assumptions we used in these calculations, duration and rate shock measures could be significantly impacted. Additionally, our calculations assume that the current relationship between short-term and long-term interest rates (the term structure of interest rates) will remain constant over time. As a result, these calculations may not fully capture the effect of non-parallel changes in the term structure of interest rates and/or large changes in interest rates.
Credit spread risk is the risk that we will incur a loss due to adverse changes in credit spreads (“spreads”). This risk arises from our investment in spread-sensitive fixed income assets.
We manage the spread risk in our assets. One of the measures used to quantify this exposure is spread duration. Spread duration measures the price sensitivity of the assets to changes in spreads. For example, if spreads increase 100 basis points, the fair value of an asset exhibiting a spread duration of 5 is expected to decrease in value by 5%. A mismatch of spread duration relative to liability duration could result in financial losses over time.
Spread duration is calculated similarly to interest rate duration. For our portfolio, spread duration is close to the asset duration, and thus has a similar sensitivity. As of December 31, 2014, the spread duration of assets was 5.6 years, compared to 4.0 as of December 31, 2013. Based upon the information and assumptions we use in this spread duration calculation, and spreads in effect as of December 31, 2014, we estimate that a 100 basis point immediate, parallel increase in spreads across all asset classes, industry sectors and credit ratings (“spread shock”) would decrease the net fair value of the assets by $470 million, compared to $10.6 million as of December 31, 2013. The increase is due to an increase in the amount and mix of invested assets since the Partial Commutation and Acquisition by Resolution Life. The selection of a 100 basis point immediate parallel change in spreads should not be construed as our prediction of future market events, but only as an illustration of the potential effect of such an event.
Equity price risk is the risk that we will incur losses due to adverse changes in the general levels of the equity markets. Equity risk exists for contract charges based on account balances as well as for guarantees for living, death and/or income benefits provided by our variable and equity indexed products.
Our variable life products are partially reinsured to ALIC. For the products that are retained, there is equity exposure to contract charges and fees that are based on separate account values, but there is only small exposure to guarantees.
84
All variable annuity contract charges and fees, liabilities and benefits, including guarantees for death and/or income benefits, are ceded to ALIC in accordance with the reinsurance agreements, thereby limiting our equity risk exposure. In 2006, ALIC disposed of substantially all of its variable annuity business through reinsurance agreements with The Prudential Insurance Company of America, a subsidiary of Prudential Financial, Inc. and therefore mitigated this aspect of ALIC’s risk. The Company was not a direct participant of this agreement and its reinsurance agreements with ALIC remain unchanged. As of December 31, 2014 and 2013, we had Separate Accounts assets related to variable annuity and variable life contracts totaling $1.6 billion and $1.7 billion, respectively.
As of December 31, 2014 we had $1.8 billion in equity-indexed life and annuity liabilities that were not reinsured that provide customers with interest crediting rates based on the performance of the S&P 500. We maintain a hedging program that aims to offset the impact of equity market performance on the value of these guarantees. As of December 31, 2014 we had $26 million in market value of S&P 500 options under the hedging program.
Counterparty credit risk relates to the Company’s potential loss if a counterparty fails to perform under the terms of a contract. The Company manages its exposure to counterparty credit risk by utilizing highly rated counterparties, establishing risk control limits, executing legally enforceable master agreements and obtaining collateral where appropriate.
Lincoln Benefit’s counterparty risk consists of the following two types of exposures: (1) Derivative counterparty risk: The Company only holds future contracts and option contracts which are traded on organized exchanges, which require margin deposits and guarantee the execution of trades, thereby mitigating potential credit risk. Exchanges serve as a marketplace for the buyer and the seller. The associated clearing house sits between the two sides of the trade. The Company has not incurred any losses on derivative financial instruments due to counterparty nonperformance in 2014; and (2) Reinsurance counterparty risk. The reinsurance counterparty risk is the risk of the reinsurance counterparty failing to pay reinsurance recoveries in full to Lincoln Benefit in a timely manner (i.e. unwillingness to pay, not paying them in full or inability to pay.) We attempt to mitigate this risk by diversifying the risk with multiple reinsurers and monitoring their credit ratings.
CAPITAL RESOURCES AND LIQUIDITY
Capital resources consist of shareholder’s equity. The following table summarizes our capital resources as of December 31.
| | | | | | | | | | | | |
($ in thousands) | | 2014 | | | 2013 | | | 2012 | |
Common stock, retained earnings and additional capital paid-in | | $ | 593,544 | | | $ | 339,825 | | | $ | 332,715 | |
Accumulated other comprehensive income | | | 85,498 | | | | 3,870 | | | | 13,803 | |
| | | | | | | | | | | | |
Total shareholder’s equity | | $ | 679,042 | | | $ | 343,695 | | | $ | 346,518 | |
| | | | | | | | | | | | |
Shareholder’s equity increased in 2014 primarily due to additional paid-in capital resulting from the Acquisition increased unrealized net capital gains partially offset by the dividend to parent. Shareholder’s equity decreased in 2013 due to decreased unrealized net capital gains partially offset by net income.
Financial strength ratings. Our financial strength ratings as of December 31, 2014 are A- from A.M. Best Company, Inc. and BBB+ from Standard & Poor’s Ratings Services, both with a stable outlook. These ratings reflect the rating agencies’ opinions of our relative financial strength and are not a recommendation to buy or hold any investment. Ratings may be revised or revoked at any time at the sole discretion of the issuing rating agency.
85
The NAIC has developed a set of financial relationships or tests known as the Insurance Regulatory Information System to assist state regulators in monitoring the financial condition of insurance companies and identifying companies that require special attention or actions by insurance regulatory authorities. The NAIC analyzes financial data provided by insurance companies using prescribed ratios, each with defined “usual ranges”. Generally, regulators will begin to monitor an insurance company if its ratios fall outside the usual ranges for four or more of the ratios. If an insurance company has insufficient capital, regulators may act to reduce the amount of insurance it can issue. Our ratios are within these ranges.
Liquidity sources and uses. Our potential sources of funds principally include the following.
| | • | | Receipt of insurance premiums |
| | • | | Contractholder fund deposits |
| | • | | Receipts of principal and interest on investments |
Our potential uses of funds principally include the following.
| | • | | Payment of contract benefits, surrenders and withdrawals |
| | • | | Reinsurance cessions and payments |
| | • | | Operating costs and expenses |
| | • | | Purchase of investments |
| | • | | Repayment of intercompany loans |
| | • | | Tax payments/settlements |
Cash flows. As reflected in our Statements of Cash Flows, net cash provided by operating activities was $106 million, $16 thousand and $15.0 million in 2014, 2013 and 2012, respectively. Fluctuations in net cash provided by operating activities primarily occur as a result of changes in net investment income and differences in the timing of reinsurance payments to and from our affiliated and non-affiliated reinsurers as well as cash contributions resulting from the Acquisition. Prior to 2014, fluctuations in net cash provided by operating activities primarily occurred as a result of changes in net investment income and differences in the timing of reinsurance payments to and from ALIC and payments to Allstate affiliates.
Prior to our acquisition by Resolution Life, under the terms of reinsurance agreements, all premiums and deposits, excluding variable annuity and life contract deposits allocated to separate accounts and those reinsured to non-affiliated reinsurers, were transferred to ALIC, which maintained the investment portfolios supporting our products. Payments of contractholder claims, benefits, contract surrenders and withdrawals and certain operating costs (excluding investment-related expenses), were reimbursed by ALIC, under the terms of the reinsurance agreements. Notwithstanding any reinsurance arrangements, we continue to have primary liability as a direct insurer for risks reinsured. Our ability to meet liquidity demands is dependent on reinsurers’ ability to meet those obligations under the reinsurance programs.
Our ability to pay dividends is dependent on business conditions, income, cash requirements and other relevant factors. The payment of shareholder dividends without the prior approval of the state insurance regulator is limited by Nebraska law to formula amounts based on net income and capital and surplus, determined in conformity with statutory accounting practices, as well as the timing and amount of dividends paid in the preceding twelve months. In addition, in connection with its approval of our acquisition by Resolution Life, the
86
Department of Insurance order requires prior approval to pay any dividend for five years following the Acquisition. In December 2014, after receiving approval from the Department of Insurance, the Company paid dividends of $33.2 million. No dividends were paid in 2013.
Contractual obligations. Due to the reinsurance agreements that we have in place, certain contractual obligations are ceded to ALIC, LB Re, Hannover Re and other non-affiliated reinsurers.
REGULATION AND LEGAL PROCEEDINGS
We are subject to extensive regulation and we are involved in various legal and regulatory actions, all of which have an effect on specific aspects of our business. For a detailed discussion of the legal and regulatory actions in which we are involved, see Note 12 of the financial statements.
PENDING ACCOUNTING STANDARDS
There are pending accounting standards that we have not implemented because the implementation date has not yet occurred. For a discussion of these pending standards, see Note 2 in the consolidated financial statements. The effect of implementing certain accounting standards on our financial results and financial condition is often based in part on market conditions at the time of implementation of the standard and other factors we are unable to determine prior to implementation. For this reason, we are sometimes unable to estimate the effect of certain pending accounting standards until the relevant authoritative body finalizes these standards or until we implement them.
| Item 11(i). | Changes in or Disagreements with Accountants |
After conducting a ‘request for proposal’ process with three major accounting firms for the annual independent audit of Resolution and its subsidiaries, and after completing our 2014 filing which included our 2013 financial statements Lincoln Benefit’s Board dismissed Deloitte & Touche LLP (“Deloitte”) as our independent registered public accounting firm. The decision to change accountants was recommended by the Audit Committee to the Board, and approved by the Board, on August 13, 2014. On the same day, the Audit Committee recommended appointment to the Board, and the Board appointed, PricewaterhouseCoopers LLP (“PwC”) as our new independent registered public accounting firm to audit Lincoln Benefit’s financial statements for the period beginning April 1, 2014. Deloitte was also reengaged on March 17, 2015 to audit Lincoln Benefit’s financial statements for the three months ended March 31, 2014.
The reports of Deloitte on Lincoln Benefit’s financial statements for each of the two fiscal years ended December 31, 2013 and the three months ended March 31, 2014 did not contain any adverse opinion or a disclaimer of opinion and were not qualified or modified as to uncertainty, audit scope or accounting principles.
During the two years ended December 31, 2013 and through the date of Deloitte’s report on Lincoln Benefit’s financial statements for the three months ended March 31, 2014, there were: (i) no disagreements between Lincoln Benefit and Deloitte on any matter of accounting principles or practices, financial statement disclosure, or auditing scope or procedures, which disagreements, if not resolved to the satisfaction of Deloitte, would have caused Deloitte to make reference to the subject matter of the disagreements in connection with its report, and (ii) no reportable events within the meaning set forth in Item 304(a)(1)(v) of Regulation S-K.
Lincoln Benefit provided Deloitte with a copy of this disclosure before its filing with the SEC and requested that Deloitte provide us with a letter addressed to the SEC stating whether or not it agrees with the above statements. A copy of this letter, dated April 10, 2015, is filed as Exhibit 16 to this registration form onForm S-1.
During the two years ended December 31, 2013 and through the date of PwC’s engagement, we did not consult with PwC regarding (1) the application of accounting principles to a specified transaction, either completed or proposed, or the type of audit opinion that might be rendered on Lincoln Benefit’s financial
87
statements, and PwC did not provide either a written report or oral advice to Lincoln Benefit that was an important factor considered by Lincoln Benefit in reaching a decision as to any accounting, auditing, or financial reporting issue, or (2) any matter that was either the subject of a disagreement (as defined in Item 304(a)(1)(iv) of Regulation S-K and the related instructions) or a reportable event (as defined in Item 304(a)(1)(v) of Regulation S-K).
| Item 11(j). | Quantitative and Qualitative Disclosures About Market Risk |
Information required for Item 11(j) is incorporated by reference to the material under the caption “Market Risk” in Item 11(h) of this report.
| Item 11(k). | Directors and Executive Officers |
The biographies of each of the directors and executive officers as of April 13, 2015 are included below.
Clive Cowdery, 51, has been a director since April 2014. Mr. Cowdery is also a director and President of both Resolution Life GP Ltd. and Resolution Life (Parallel) GP Ltd., and a director of both Resolution Life Holdings, Inc. and Resolution Life, Inc. He is the Founder and Chairman of The Resolution Group. Before founding Resolution in 2003, Mr. Cowdery served as Chairman and Chief Executive of GE Insurance Holdings. Mr. Cowdery currently serves as a director of Prospect Publishing Limited, and he is the Founder and Chairman of the Resolution Foundation, a charitable organization dedicated to improving living standards for the 15 million people in Britain on low and middle incomes.
Jon Hack, 47, has been a director since April 2014. Mr. Hack is also a director of Resolution Life Holdings, Inc. and a director of Resolution Life, Inc. He currently serves as the Managing Partner for The Resolution Group. Prior to joining Resolution in 2009, Mr. Hack was a Managing Director and Head of European Financial Institutions Group for Lazard. Mr. Hack qualified as a chartered accountant in 1992 and is a member of The Institute of Chartered Accountants in England & Wales.
Ann Frohman, 51, has been a director since April 2014. Ms. Frohman is also a director of Resolution Life Holdings, Inc. and a director of Resolution Life, Inc. Ms. Frohman is currently self-employed at Frohman Law Office LLC, a law and government relations firm. From December 2010 to March 2012, Ms. Frohman served as Senior Vice President, Government and Industry for Physicians Mutual and Physicians Life Insurance Companies. Prior to that, Ms. Frohman held a number of leadership positions with the Nebraska Department of Insurance, including Director. Ms. Frohman is a licensed attorney with the Nebraska State Bar Association. Ms. Frohman has advised Resolution on issues of Nebraska law from time to time and expects to do so in the future.
Robert Stein, 66, has been a director since April 2014. Mr. Stein is also a director of Resolution Life Holdings, Inc. and a director of Resolution Life, Inc. From November 1976 to September 2011, Mr. Stein held various positions at Ernst & Young, including Partner. He currently serves on the boards of directors of Assurant, Inc. and Aviva plc. Mr. Stein is an actuary and a Certified Public Accountant. He is a Fellow of the Society of Actuaries and a member of the American Institute of Certified Public Accountants and the New York State Society of Certified Public Accountants.
Grace Vandecruze, 51, has been a director since April 2014. Ms. Vandecruze is also a director of Resolution Life Holdings, Inc. and Resolution Life, Inc. Since 2006, Ms. Vandecruze has been employed with Grace Global Capital LLC, where she currently serves as Managing Director. Prior to that, she served as Managing Director at Fox-Pitt, Kelton and Vice President at Head & Company LLC. Ms. Vandecruze is a Certified Public Accountant and a member of the American Institute of Certified Public Accountants.
Richard Carbone, 67, has been a director since April 2014. Mr. Carbone is also a director of Resolution Life Holdings, Inc. and a director of Resolution Life, Inc. Prior to joining Lincoln Benefit, Mr. Carbone served as Executive Vice President and Chief Financial Officer at Prudential Financial, Inc. and The
88
Prudential Insurance Company of America. He also served as Senior Vice President and Chief Financial Officer of Prudential Financial, Inc. from November 2001 to January 2008 and Senior Vice President and Chief Financial Officer of The Prudential Insurance Company of America from July 1997 to January 2008. Prior to that, Mr. Carbone held various leadership roles at Salomon, Inc., Bankers Trust New York Corporation and Bankers Trust Company. Mr. Carbone is a member of the board of directors for E*Trade Financial Corporation. Mr. Carbone is a Certified Public Accountant (inactive).
Stephen Campbell, 48, has been a director since May 2014. Mr. Campbell is also a director of Resolution Life Holdings, Inc. and a director of Resolution Life, Inc. Since July 2013, Mr. Campbell has been self-employed as a consultant and investor. Prior to that, he was as an Investment Banker with Lazard Freres & Co. from 2002 to July 2013. Mr. Campbell currently serves as a member of the board of directors for Hardscuffle, Inc., American Life & Accident Insurance Company of Kentucky and Confluent Health
W. Weldon Wilson, 54, has been a director and Chief Executive Officer since April 2014. Mr. Wilson also serves as a director and Chief Executive Officer for Resolution Life Holdings, Inc. and Resolution Life, Inc. From 2010 to 2013, he was self-employed as a consultant. From July 1991 to December 2009, Mr. Wilson held various positions at Swiss Reinsurance Company, including Chief Executive Officer, President and Director of Swiss Re Life & Health America, Inc. He is a licensed attorney with the State Bar of Texas.
Robyn Wyatt, 50, has been Executive Vice President, Chief Financial Officer and Treasurer since April 2014. Ms. Wyatt also serves as Executive Vice President, Chief Financial Officer and Treasurer of both Resolution Life Holdings, Inc. and Resolution Life, Inc. From March 2002 to September 2013, Ms. Wyatt held positions with various affiliates of Swiss Reinsurance Company, including Managing Director and Chief Financial Officer of Swiss Re Life & Health America Inc. Prior to that, she served as Vice President and Chief Accountant of Manulife Financial Corporation. Ms. Wyatt is a member of Chartered Accountants Australia and New Zealand and The Canadian Institute of Chartered Accountants.
Keith Gubbay, 60, has been President and Chief Actuarial Officer since April 2014. Mr. Gubbay also serves as President and Chief Actuarial Officer of both Resolution Life Holdings, Inc. and Resolution Life, Inc. From 2004 until he joined Resolution Life, Mr. Gubbay held various leadership positions in Sun Life Financial U.S., including Senior Vice-President and Chief Financial Officer. Prior to that, he served as in various senior executive roles at ING Americas. Mr. Gubbay is a Member of the American Academy of Actuaries and a Fellow in the Society of Actuaries.
Simon Packer, 50, has been Chief Transformation Officer since April 2014. Mr. Packer also serves as Chief Transformation Officer of both Resolution Life Holdings, Inc. and Resolution Life, Inc. Prior to joining Resolution in May 2006, Mr. Packer held leadership positions at a variety of U.K. life insurance companies, including Programme Manager at Clerical Medical Investment Group from August 2003 to April 2006 and Programme Manager at AXA Tech Ltd from April 2002 to January 2003.
Leigh McKegney, 31, has been Chief Legal Officer, Vice President and Secretary since May 2014. Ms. McKegney also serves as Chief Legal Officer, Vice President and Secretary of Resolution Life Holdings, Inc. and Resolution Life, Inc. From November 2010 to April 2014, Ms. McKegney was a corporate associate at Debevoise & Plimpton LLP. Ms. McKegney is a licensed attorney in the State of New York.
| Item 11(l). | Executive Compensation |
89
COMPENSATION DISCUSSIONAND ANALYSIS
On April 1, 2014, Resolution Life, Inc. (“Resolution Life”) acquired all of the outstanding capital stock of Lincoln Benefit from Allstate Life Insurance Company. From January 1, 2014 through March 31, 2014, the executive officers of Lincoln Benefit were employees of an Allstate subsidiary. From April 1, 2014 through December 31, 2014, the executive officers of Lincoln Benefit were employees of Resolution Life’s parent, Resolution Life Holdings, Inc. (“Resolution”) or one of its subsidiaries. This Compensation Discussion and Analysis is separated into two sections for ease of reading, with the first section covering Lincoln Benefit’s compensation practices from April 1, 2014 through December 31, 2014, and the second section covering Lincoln Benefit’s compensation practices from January 1, 2014 through March 31, 2014.
Compensation Practices for the Period from April 1, 2014 through December 31, 2014
Following the acquisition of all of the outstanding capital stock of Lincoln Benefit from Allstate Life Insurance Company, executive officers of Lincoln Benefit also served as officers of Resolution and other subsidiaries of Resolution and these executive officers received no compensation directly from Lincoln Benefit. They were employees of Resolution or a subsidiary. Allocations were made for each named executive based on the amount of the named executive’s compensation allocated to Lincoln Benefit under the Services Agreement by and between Resolution Life and Lincoln Benefit, effective as of April 1, 2014 (the “Services Agreement”). Those allocations are reflected in theSummary Compensation Table set forth below and in this Compensation Discussion and Analysis disclosure. The named executive officers may have received additional compensation for services rendered to Resolution or other Resolution subsidiaries, including Resolution Life, and those amounts are not reported.
Named Executives
This portion of the Compensation Discussion and Analysis describes Resolution’s executive compensation program and specifically describes, for the following named executive officers (“NEOs”) of Lincoln Benefit below, the total 2014 compensation attributable to services rendered to Lincoln Benefit:
W. Weldon Wilson— Chairman and Chief Executive Officer (“CEO”)
Robyn Wyatt — Chief Financial Officer (“CFO”), Executive Vice President and Treasurer
Keith Gubbay— President and Chief Actuary
Simon Packer— Chief Transformation Officer
Karl Chappell— Managing Director, Investments and Mergers and Acquisitions
2014 Compensation Philosophy
The objectives of Resolution’s executive compensation program for 2014 were to (i) create a link between pay and performance, (ii) attract, motivate and retain talented employees, (iii) align the interests of executives and other employees with the interests of Resolution’s shareholders and (iv) foster compliance and support sensible, but not excessive, risk taking. Resolution has designed the elements of its executive compensation program in order to meet these objectives.
Elements of the 2014 Compensation Program Design
All compensation and benefits paid to our officers is determined and paid or provided by Resolution. Resolution pays its executives, including the NEOs, base salary and bonus as set forth in each executive’s employment agreement. In addition, the executives, including NEOs, receive employee benefits on the same terms as other similarly situated executives of Resolution and its subsidiaries. The elements of compensation for
90
the NEOs are determined pursuant to the terms of their individual employment agreements with Resolution. In 2015, Resolution established a compensation committee of its board of directors to oversee executive compensation matters, including advising on Resolution’s compensation policies and reviewing and approving the determination of annual bonus payments earned by the executives. Neither Resolution nor its compensation committee has engaged the services of a compensation consultant or engaged in any compensation benchmarking analysis. Mr. Wilson assists the compensation committee in setting compensation for the other Resolution executives.
Employment Agreements
Each of Messrs. Wilson, Gubbay, Packer and Chappell and Ms. Wyatt is party to an employment agreement with Resolution, the parent of Resolution Life. Resolution negotiated each employment agreement at the time the officer became employed by Resolution in 2013 or 2014, prior to its acquisition of Lincoln Benefit. The terms of each agreement, including salary and target bonus opportunities, were determined based on an evaluation of appropriate compensation levels in the insurance industry and the level of compensation, benefits and other entitlements that Resolution considered necessary to attract and retain the executives. The employment agreements set each executive’s base salary and provide for an annual bonus opportunity expressed as a percentage of base salary, and employee benefits on the same terms as similarly situated executives of Resolution. Mr. Wilson’s, Mr. Gubbay’s and Ms. Wyatt’s target annual bonus opportunity is 60%; and Mr. Chappell’s and Mr. Packer’s target annual bonus opportunity is 50%. The employment agreements of Messrs. Chappell and Packer also provide for reimbursement of certain relocation expenses. Mr. Gubbay’s and Ms. Wyatt’s employment agreement each provide for deferred sign-on bonuses payable in three equal amounts on the first through third anniversaries of the effective date of such employment agreement. Mr. Chappell’s agreement also provides for a one-time signing bonus, payable within 60 days following the effective date of his employment agreement. The amount of each of these elements of compensation that is attributable to Lincoln Benefit is as set forth in theSummary Compensation Table.
Base Salary
For 2014, each NEO received the base salary set forth in his or her individual employment agreement. The amount of each such NEO’s base salary for 2014 that is attributable to Lincoln Benefit is as set forth in theSummary Compensation Table. In 2015, the compensation committee of the board of directors of Resolution approved a merit-based salary increase of 16.7% for Ms. Wyatt.
Annual Bonus Payments
Variable cash compensation in the form of annual bonuses is provided to reward executives for results based on the past performance year. Each NEO’s employment agreement provides for an annualperformance-based bonus opportunity, with the target annual bonus amount expressed as a percentage of such NEO’s base salary. The compensation committee of the board of directors of Resolution determines the annual bonus amount that has been earned by each NEO after considering a variety of individual- and Resolution-related performance factors. In determining the annual bonus payments for 2014, the compensation committee considered the objectives of Resolution’s compensation philosophy, and considered the fact that 2014 was a foundational year given the company’s recent formation in 2013. For 2014, the compensation committee determined that each NEO had earned his or her annual performance-based bonus at the target performance level based on achievement of operational performance goals relating to building the Resolution business, including attraction of key talent, completion of the acquisition and transition of Lincoln Benefit from Allstate, implementing core computational systems, developing a governance and risk framework, designing and developing processes and controls in the areas of finance, accounting and operations, designing and developing projection models, having a successful outcome on the initial rating agency process and establishing certain key relationships. The amount of each such NEO’s annual bonus that is attributable to Lincoln Benefit is as set forth in theSummary Compensation Table.
91
Long-Term Incentive Compensation
Each of Messrs. Wilson, Gubbay, Packer and Chappell and Ms. Wyatt participate in Resolution’s long-term incentive compensation program, but have not received any long-term or equity-based compensation for their services to Lincoln Benefit. Grants under Resolution’s long-term incentive compensation program were made to our NEOs prior to the acquisition of Lincoln Benefit, and are subject to satisfaction of vesting criteria based on continued service to Resolution. As such equity was awarded prior to the acquisition of Lincoln Benefit and no expense related to such equity is allocated to Lincoln Benefit under the Services Agreement, such compensation is not included in theSummary Compensation Tablesor other tables below.
Other Benefits
The NEOs’ participate in the benefit programs available to other employees of Resolution Life. These benefits include health and welfare coverage and participation in a Resolution 401(k) plan. Resolution matches employee contributions up to 6% of eligible pay.
Compensation Practices for the Period from January 1, 2014 through March 31, 2014
Prior to the acquisition of all of the outstanding capital stock of Lincoln Benefit from Allstate Life Insurance Company by Resolution Life, executive officers of Lincoln Benefit also served as officers of other subsidiaries of Allstate and received no compensation directly from Lincoln Benefit. They were employees of an Allstate subsidiary. Allocations were made for each named executive based on the amount of the named executive’s compensation allocated to Lincoln Benefit under the Amended and Restated Service and Expense Agreement among Allstate Insurance Company, Allstate, and certain affiliates, as amended effective January 1, 2009 (the “Service and Expense Agreement”). Those allocations are reflected in theSummary Compensation Table set forth below and in this disclosure, except where noted. The named executives may have received additional compensation for services rendered to other Allstate subsidiaries, and those amounts are not reported.
Named Executives
This portion of the Compensation Discussion and Analysis describes Allstate’s executive compensation program and specifically describes total 2014 compensation for the following named executives of Lincoln Benefit, who are listed below with their titles as of March 31, 2014:
Don Civgin— Chairman, President and Chief Executive Officer (“CEO”)
Jesse E. Merten — Senior Vice President and Chief Financial Officer (“CFO”)
92
Elements of 2014 Executive Compensation Program Design
The following table lists the elements of target direct compensation for Allstate’s 2014 executive compensation program. The program uses a mix of fixed and variable compensation elements and provides alignment with bothshort- andlong-term business goals through annual andlong-term incentives. Allstate’s incentives are designed to drive overall corporate performance, specific business unit strategies, and individual performance using measures that correlate to stockholder value and align with Allstate’s long-term strategic vision and operating priorities. The Compensation and Succession Committee (the “Committee”) of the Allstate Board of Directors (the “Allstate Board”) establishes the performance measures and ranges of performance for the variable compensation elements for overall Allstate incentive compensation awards. An individual’s realized pay is based onmarket-based compensation levels and actual performance.
| | | | | | | | | | |
| | | Fixed | | Variable |
| | | Base Salary | | Annual Cash Incentive
Awards | | Restricted Stock
Units (“RSUs”) | | Performance Stock
Awards (“PSAs”) | | Stock Options |
Key
Characteristics | | • Fixed compensation component payable in cash. • Reviewed annually and adjusted when appropriate. | | • Variable compensation component
payable
annually in
cash. • Actual performance against
annually established
goals
determines
overall
corporate pool which
is allocated
based on individual performance. | | • RSUs vest on the third
anniversary of
the grant date.(1) • See page 98 for the retention requirements for RSUs. | | • Equity award based on achieving performance goals. • PSAs vest on the third anniversary of the grant date based on actual performance against goals established at the beginning of the performance period. • See page 98 for the
retention requirements for PSAs. | | • Options to purchase shares at the market price when awarded. Vest ratably over three years.(2) • Nonqualified stock options that expire in ten years. • See page 98 for the retention requirements for stock options. |
| Why Allstate Pays This Element | | • Provide a base level of competitive cash compensation for executive talent. | | • Motivate and reward executives for performance on key strategic, operational, and financial measures during the year, and on key metrics to drive Allstate’s long-term strategy in the areas of segmentation, analytics and advanced technology. | | • Align the interests of executives with long-term stockholder value and serve to retain executive talent. | | • Motivate and reward executives for performance on key long-term measures. • Align the interests of executives with long-term stockholder value and serve to retain executive talent. | | • Align the interests of executives with long-term stockholder value and serve to retain executive talent. |
93
| | | | | | | | | | |
| | | Fixed | | Variable |
| | | Base Salary | | Annual Cash Incentive
Awards | | Restricted Stock
Units (“RSUs”) | | Performance Stock
Awards (“PSAs”) | | Stock Options |
| | | | | |
| How Allstate Determines Amount | | • Experience, job scope, market data, and individual performance. | | • A corporate-wide funding pool is based on performance on three measures: • Adjusted Operating Income(3) • Total Premiums(3) • Net Investment Income(3) • Individual awards are based on job scope, market data, and individual performance. | | • Individual awards are based on job scope, market data, and individual performance. | | • Target awards based on job scope, market data, and individual performance. • Earned awards based on Allstate performance on Annual Adjusted Operating Income Return on Equity(3) with a requirement of positive Net Income for any payout above target. | | • Individual awards are based on job scope, market data, and individual performance. |
| (1) | RSUs granted prior to February 18, 2014 vested over four years with 50% exercisable on the second anniversary of the grant date, and 25% exercisable on each of the third and fourth anniversary dates. Beginning in 2014, RSUs vest on the third anniversary of the grant date. This change was made to reflect current market practice. |
| (2) | Stock options granted prior to February 18, 2014 vested over four years with 50% exercisable on the second anniversary of the grant date and 25% exercisable on each of the third and fourth anniversary dates. The change to a three-year vesting schedule with one-third exercisable on each anniversary was made in 2014 to reflect current market practice. |
| (3) | For a description of how these measures are calculated, see pages 120-123. |
Executive Compensation — Design
Compensation Structure and Goal-Setting
Salary
| • | | The salary of Mr. Civgin is set by the Allstate Board based on the Committee’s recommendations. The salary of Mr. Merten is set by Allstate management. In recommending executive salary levels, Allstate uses the 50th percentile of its peer insurance companies as a guideline for Mr. Civgin and the 50th percentile of insurance and general industry data as a guideline for Mr. Merten, which supports Allstate’s ability to compete effectively for and retain executive talent. Annual merit increases for Messrs. Civgin and Merten are based on evaluations of their performance using the enterprise-wide merit increase budget as a guideline. |
Annual Cash Incentive Awards
| • | | For 2014, executives earned an annual cash incentive award based on Allstate’s achievement of performance measures and assessments of individual performance. |
| • | | The Committee sets performance measure goals based on Allstate’s operating plan after extensive review. Target performance is equal to operating plan, while decisions on threshold and maximum are informed by probability testing and operational performance scenarios. |
94
| • | | Actual performance on three performance measures determines the overall funding level of the corporate pool and the aggregate total award budget for eligible employees. |
| • | | In the event of a net loss, the corporate pool funding is reduced by 50% of actual performance for Allstate senior executives. For example, if performance measures ordinarily would fund the corporate pool at 60%and there was a net loss, then the corporate pool would be funded at 30% for Allstate senior executives. This mechanism ensures alignment of pay and performance in the event of a natural catastrophe or extreme financial market conditions. |
| • | | Target annual incentive compensation percentages for Allstate senior executives are based on market data pay levels of peer insurance companies and Allstate’s benchmark target for total direct compensation at the 50th percentile. |
| • | | For Mr. Civgin, the maximum award that could be earned was an amount equal to 15% of the 162(m) pool (but in no event greater than the $10 million maximum set forth in the Annual Executive Incentive Plan). The Committee retained complete discretion to pay less than this maximum amount. Mr. Merten did not participate in the 162(m) pool. |
| • | | Individual awards are based on individual performance in comparison toposition-specific compensation targets and overall Allstate performance. Each Allstate executive’s performance is evaluated against goals established at the beginning of the year that are specifically developed to support Allstate’s annual operating priorities and long-term strategy based on segmentation, analytics, and advanced technology. Allstate paid the 2014 cash incentive awards in March 2015. |
95
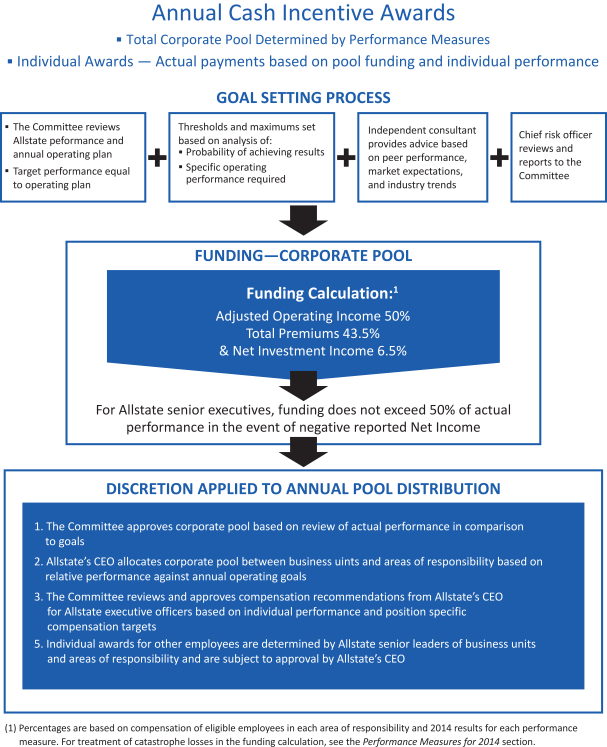
96
Performance Stock Awards (“PSAs”), Restricted Stock Units (“RSUs”), and Stock Options
| • | | Allstate grants equity awards to executives based on scope of responsibility, consistent with its philosophy that a significant amount of compensation should be in the form of equity. Additionally, from time to time, equity awards are granted to attract new executives and to retain existing executives. |
| • | | The mix of equity incentives for Mr. Civgin is generally 50% PSAs and 50% stock options. Allstate believes both PSAs and stock options are forms ofperformance-based incentive compensation because PSAs are earned based on achieving established performance goals and stock options require stock price appreciation to deliver value to an executive. |
| • | | Other employees eligible for equity incentive awards, including Mr. Merten, had the choice of receiving the value of their February equity incentive awards in the following proportions between stock options and RSUs: |
| | • | | 25% stock options and 75% RSUs; |
| | • | | 50% stock options and 50% RSUs; or |
| | • | | 75% stock options and 25% RSUs. |
The elections are reflected in theGrants of Plan-Based Awards at Fiscal Year-End 2014 table.
| • | | In March 2012, February 2013, and February 2014, Mr. Civgin was awarded a target number of PSAs. The PSAs have athree-year performance cycle. For the 2012 and 2013 awards, the number of PSAs that become earned and vested at the end of the performance cycle depends on an annual adjusted operating income return on equity measure (Adjusted Operating Income ROE) attained during each year of the performance cycle. For the 2014 award, the number of PSAs that become earned and vested depends on the three-year average Adjusted Operating Income ROE. Adjusted Operating Income ROE is defined on page 122. Adjusted Operating Income for PSAs includes a minimum or maximum amount ofafter-tax catastrophe losses if actual catastrophe losses are less than or exceed those amounts, respectively, which serves to decrease volatility and stabilize the measure by limiting the impact of catastrophe losses. The Committee selected Adjusted Operating Income ROE as the performance measure because it: |
| | • | | Measures performance in a way that is tracked and understood by investors. |
| | • | | Captures both income and balance sheet impacts, including capital management actions. |
| | • | | Provides a useful gauge of overall performance while limiting the effects of factors management cannot influence, such as extreme weather conditions. |
| | • | | Correlates to changes inlong-term stockholder value. |
| • | | For the2012-2014 and2013-2015 performance cycles, performance is measured in three separateone-year periods, but all of these goals were established at the beginning of the three-year performance cycle. For the 2014-2016 performance cycle, performance is measured in a single three-year measurement period. The actual number of PSAs earned for the award’s measurement period varies from 0% to 200% of that period’s target PSAs based on Adjusted Operating Income ROE for the measurement period. |
| • | | The Committee requires positive net income in order for executives to earn PSAs based on Adjusted Operating Income ROE above target. If Allstate has a net loss in a measurement period, the number of PSAs earned would not exceed target, regardless of the Adjusted Operating Income ROE. This hurdle is included to prevent misalignment between Allstate reported net income and the PSAs earned based on the Adjusted Operating Income ROE result. This situation could occur if, for example, catastrophe losses or capital losses that are not included in Adjusted Operating Income ROE caused Allstate to report a net loss for the period. |
| • | | At the end of each measurement period, the Committee certifies the level of Allstate’s Adjusted Operating Income ROE achievement, as well as the resulting number of PSAs earned by Mr. Civgin for that measurement period. The Committee does not have the discretion to adjust the performance achievement for |
97
| | any measurement period. PSAs earned will vest following the end of thethree-year performance cycle, subject to continued employment (other than in the event of death, disability, retirement, or a qualifying termination following achange-in-control). |
Equity Ownership and Retention Requirements
Instituted in 1996, stock ownership guidelines require each of Messrs. Civgin and Merten to own Allstate common stock worth a multiple of base salary to link management and stockholders’ interests. The following charts show the salary multiple guidelines and the equity holdings that count towards the requirement. The current stock ownership guidelines apply to 88 of 183 Allstate officers as of December 31, 2014, and require these executives to hold 75% of netafter-tax shares received as a result of equity compensation awards until their salary multiple guidelines are met.
Stock Ownership as Multiple of Base Salary as of December 31, 2014
| | | | |
| Named Executive | | Guideline | | Status |
Mr. Civgin | | 3x salary | | ü Meets guideline |
Mr. Merten | | 2x salary | | ü Meets guideline |
| | |
| What Counts Toward the Guideline | | What Does Not Count Toward the Guideline |
• Allstate shares owned personally | | • Unexercised stock options |
| |
• Shares held in the Allstate 401(k) Savings Plan | | • PSAs |
| |
• RSUs | | |
Beginning with awards granted in 2014, Allstate added a requirement that, regardless of a senior executive’s stock ownership level, Allstate senior executives must retain at least 75% of netafter-tax shares. In the case of PSAs, Allstate senior executives must retain 75% of net after-tax PSA shares, after the three-year vesting period, for one year. In the case of stock options, Allstate senior executives must retain 75% of net shares acquired on exercise for one year. This retention requirement applies to Allstate senior executives who receive both PSAs and stock options, or approximately 9% of Allstate officers.
Policies on Hedging and Pledging Securities
Allstate has a policy that prohibits all officers, directors, and employees from engaging in transactions in securities issued by Allstate or any of its subsidiaries that might be considered speculative or hedging, such as selling short or buying or selling options. A new policy was instituted in 2014 that prohibits Allstate senior executives and directors from pledging Allstate securities as collateral for a loan or holding such securities in a margin account, except when an exception is granted by Allstate’s chairman or the lead director of the Allstate Board.
Timing of Equity Awards and Grant Practices
Typically, the Committee approves grants of equity awards during a meeting in the first fiscal quarter. The timing allows the Committee to align awards with Allstate’s annual performance and business goals.
Throughout the year, the Committee may grant equity incentive awards to newly hired or promoted executives. The grant date for these awards is fixed as the first business day of a month following the later of Committee action or the date of hire or promotion.
98
Peer Benchmarking
Allstate monitors performance toward goals throughout the year and reviews executive compensation program design and executive pay levels annually. As part of that evaluation, Allstate considers available data regarding compensation paid to similarly-situated executives at companies against which it competes for executive talent. With respect to the 2014 compensation program, for Mr. Civgin, the Committee considered compensation data for the peer companies listed below as well as compensation information from certain S&P 100 companies with fiscal year 2013 revenues of between $25 billion and $50 billion with which Allstate competes for executive talent. The Committee reviews the composition of the peer group annually with the assistance of its independent compensation consultant, Compensation Advisory Partners. The following table reflects the peer group used for 2014 compensation benchmarking.
PEER INSURANCE COMPANIES(1)
| | | | | | | | | | | | | | | | | | | | | | | | |
| Company Name | | Revenue
($ in billions) | | | Market Cap
($ in billions) | | | Assets
($ in billions) | | | Premiums
($ in billions) | | | Property and
Casualty
Insurance
Products | | | Life Insurance
and Financial
Products | |
ACE Ltd. | | | 19.3 | | | | 37.8 | | | | 98.2 | | | | 17.4 | �� | | ü | | | | | | |
AFLAC Inc. | | | 22.7 | | | | 27.0 | | | | 119.8 | | | | 19.1 | | | | | | | ü | | |
American International Group, Inc. | | | 64.4 | | | | 77.1 | | | | 515.6 | | | | 39.9 | | | ü | | | | ü | | |
The Chubb Corporation | | | 14.0 | | | | 24.0 | | | | 51.3 | | | | 12.3 | | | ü | | | | | | |
The Hartford Financial Services Group, Inc. | | | 18.6 | | | | 17.7 | | | | 245.0 | | | | 14.6 | | | ü | | | | ü | | |
Manulife Financial Corporation | | | 41.6 | | | | 30.8 | | | | 432.1 | | | | 14.0 | | | | | | | ü | | |
MetLife, Inc. | | | 73.3 | | | | 61.2 | | | | 902.3 | | | | 49.0 | | | ü | | | | ü | | |
The Progressive Corporation | | | 19.4 | | | | 15.9 | | | | 25.8 | | | | 18.4 | | | ü | | | | | | |
Prudential Financial, Inc. | | | 54.1 | | | | 41.1 | | | | 766.7 | | | | 35.5 | | | | | | | ü | | |
The Travelers Companies, Inc. | | | 27.2 | | | | 34.1 | | | | 103.1 | | | | 23.7 | | | ü | | | | | | |
Allstate | | | 35.2 | | | | 29.4 | | | | 108.5 | | | | 31.1 | | | ü | | | | ü | | |
Allstate Ranking Relative to Peers: | | | | | | | | | | | | | | | | | | | | | | | | |
- Property and Casualty Insurance | | | 3 of 8 | | | | 5 of 8 | | | | 4 of 8 | | | | 3 of 8 | | | | | | | | | |
- Life Insurance and Financial Products | | | 5 of 7 | | | | 5 of 7 | | | | 7 of 7 | | | | 4 of 7 | | | | | | | | | |
- All Peer Insurance Companies | | | 5 of 11 | | | | 7 of 11 | | | | 7 of 11 | | | | 4 of 11 | | | | | | | | | |
| (1) | Information as of year-end 2014. |
With respect to Mr. Merten, Allstate management considered a compensation survey — Towers Watson Diversified Insurance Survey — that provided information on insurance companies of a similar size and business mix as Allstate. The Towers Watson Diversified Insurance Survey includes insurance companies with assets greater than $125 billion.
The Committee uses the 50th percentile of Allstate’s peer group as a guideline in setting the target total direct compensation of Allstate’s executives. Within the guideline, the Committee balances the various elements of compensation based on individual experience, job scope and responsibilities, performance, and market practices.
99
Other Elements of Compensation
To remain competitive with other employers and to attract, retain, and motivate highly talented executives and other employees, Allstate offers the benefits listed in the following table.
| | | | | | | | | | | | |
| Benefit or Perquisite | | Named Executives | | | Other
Officers
and Certain
Managers | | | All Full-time
and Regular
Part-time
Employees | |
401(k)(1) and defined benefit pension | | | — | | | | — | | | | — | |
Supplemental retirement benefit | | | — | | | | — | | | | | |
Health and welfare benefits(2) | | | — | | | | — | | | | — | |
Supplementallong-term disability | | | — | | | | — | | | | | |
Deferred compensation | | | — | | | | — | | | | | |
Tax preparation and financial planning services | | | — | | | | — | (3) | | | | |
Personal use of aircraft, ground transportation, and mobile devices(4) | | | — | | | | — | | | | | |
| (1) | Allstate contributed $0.80 for every dollar of matchablepre-tax deposits made in 2014 (up to 5% of eligible pay). |
| (2) | Including medical, dental, vision, life, accidental death and dismemberment,long-term disability, and group legal insurance. |
| (3) | All officers are eligible for tax preparation services. Financial planning services were available only to Allstate senior executives. Mr. Civgin did not use financial planning services in 2014. |
| (4) | In limited circumstances approved by Allstate’s CEO, Mr. Civgin is permitted to use Allstate’s corporate aircraft for personal purposes. Mr. Civgin did not use the corporate aircraft for personal purposes in 2014. Ground transportation is available to Mr. Civgin. Mobile devices are available to Allstate’s senior executives, other officers, and certain managers and employees depending on their job responsibilities. |
Retirement Benefits
Each of Messrs. Civgin and Merten participates in two different defined benefit pension plans. The Allstate Retirement Plan (“ARP”) is a tax qualified defined benefit pension plan available to all of Allstate’s regularfull-time and regularpart-time employees who meet certain age and service requirements. The ARP provides an assured retirement income based on an employee’s level of compensation and length of service at no cost to the employee. As the ARP is a tax qualified plan, federal tax law limits (1) the amount of an individual’s compensation that can be used to calculate plan benefits and (2) the total amount of benefits payable to a plan participant on an annual basis. For certain employees, these limits may result in a lower benefit under the ARP than would have been payable otherwise. Therefore, the Supplemental Retirement Income Plan (“SRIP”) is used to provideARP-eligible employees whose compensation or benefit amount exceeds the federal limits with an additional defined benefit in an amount equal to what would have been payable under the ARP if the federal limits did not exist.
Change-in-Control and Post-Termination Benefits
Consistent with Allstate’s compensation objectives, Allstate offers these benefits to attract, motivate, and retain executives. A change-in-control of Allstate could have a disruptive impact on both Allstate and its executives. Change-in-control benefits and post-termination benefits are designed to mitigate that impact and to maintain alignment between the interests of Allstate’s executives and Allstate’s stockholders.
Mr. Civgin is a participant in Allstate’s change-in-control severance plan (the “CIC Plan”). Mr. Merten is not a participant in the CIC Plan.
100
The change-in-control and post-termination arrangements which are described in thePotential Payments as a Result of Termination or Change-in-Control section are not provided exclusively to Messrs. Civgin and Merten. A larger group of management employees is eligible to receive many of the post-termination benefits described in that section.
Clawback of Compensation
Awards made to Allstate’s executive officers after May 19, 2009, under short- and long-term incentive compensation plans, are subject to clawback in the event of certain financial restatements. Annual cash incentive and equity awards granted after May 19, 2009, are also subject to cancellation or recovery in certain circumstances if the recipient violates non-solicitation covenants. Equity awards granted after February 21, 2012, are subject to cancellation or recovery in certain circumstances if the recipient violates non-competition covenants.
Executive Compensation — Earned Awards
Salary
The base salaries for each of Messrs. Civgin and Merten were reviewed in February of 2014. Mr. Civgin’s salary was not adjusted. Allstate established a new base salary for Mr. Merten based on individual performance and in line with the enterprise-wide merit increase.
Annual Cash Incentive Awards
In 2014, Allstate’s total corporate pool was calculated based on three measures: Adjusted Operating Income, Total Premiums, and Net Investment Income. The 2014 annual incentive plan targets for Adjusted Operating Income and Net Investment Income were lower than actual 2013 performance to account for economic trends or certain items that are not indicative of Allstate’s underlying insurance business. As an example, the targets for those measures were set at amounts to take into account Allstate’s sale of Lincoln Benefit during 2014, and Net Investment Income targets reflect the impact of historically low interest rates. Also in 2014, the ranges between target and maximum were widened to reflect the fact that Allstate’s business has been operating well and the plan had paid near maximum levels in the prior two years. For a description of how these measures are calculated, see pages 120-123. The ranges of performance and 2014 actual results are shown in the following table.
| | | | | | | | | | | | | | | | |
| 2014 Annual Cash Incentive Award Ranges of Performance | |
| Measure | | Threshold | | | Target | | | Maximum | | | Actual Results | |
Adjusted Operating Income(in millions) | | $ | 1,800 | | | $ | 2,200 | | | $ | 2,700 | | | $ | 2,350 | |
Total Premiums(in millions) | | $ | 31,225 | | | $ | 31,725 | | | $ | 32,225 | | | $ | 31,685 | |
Net Investment Income(in millions) | | $ | 2,835 | | | $ | 3,085 | | | $ | 3,335 | | | $ | 3,303 | |
Payout Percentages | | | | | | | | | | | | | | | | |
Named Executives(1) | | | 50%(2) | | | | 100% | | | | 200%(3) | | | | 118.9% | |
| (1) | Payout percentages reflect contribution to incentive compensation pool. Actual awards are fully discretionary and vary depending on individual performance. |
| (2) | For Mr. Civgin, actual performance below threshold results in a 0% payout. |
| (3) | The maximum pool funding for Messrs. Civgin and Merten was lowered from 250% to 200% of target beginning with the 2014 award. |
101
Performance Stock Awards
Adjusted Operating Income ROE is the performance measure used for PSAs. For a description of how this measure is calculated for each performance cycle, see page 122. The measurement periods and levels of Adjusted Operating Income ROE needed to earn the threshold, target and maximum number of PSAs for the measurement period, as well as actual results, are set forth in the table below.
| | | | | | | | | | | | | | | | |
| Performance Stock Awards Ranges of Performance |
| | | Adjusted Operating Income Return on Equity |
| | | Threshold | | Target | | | | | | Maximum | | Actual Results |
2012-2014 PSA Performance Cycle | | | | | | | | | | | | | | | | |
2012 Measurement Period | | 4.0% | | 10.0% | | | | | | 11.5% | | 12.3% |
2013 Measurement Period | | 4.5% | | 10.5% | | | | | | 12.25% | | 13.1% |
2014 Measurement Period | | 5.0% | | 11.0% | | | | | | 13.0% | | 12.8% |
2013-2015 PSA Performance Cycle | | | | | | | | | | | | | | | | |
2013 Measurement Period | | 6.0% | | 11.0% | | | | | | 12.5% | | 13.4% |
2014 Measurement Period | | 6.0% | | 12.0% | | | | | | 13.5% | | 13.2% |
2015 Measurement Period | | 6.0% | | 13.0% | | | | | | 14.5% | | To be determined in 2016 |
2014-2016 PSA Performance Cycle | | | | | | | | | | | | | | | | |
(One Measurement Period) | | 6.0% | | 13.0% | | | | | | 14.5% | | To be determined in 2017 |
Payout | | 0% | | 100% | | | | | | 200% | | |
| | | | | | | | | | | | | | | | |
| | | | | | | | | | | | | | | | |
| | | | | | Subject to
positive net income hurdle | | | | |
The following tables show the target number of PSAs granted to each of Messrs. Civgin and Merten for the 2012-2014, 2013-2015, and 2014-2016 performance cycles, and the number of PSAs earned based on achievement of the performance measure.
| | | | | | | | | | | | | | | | | | | | | | | | | | | | |
| 2012-2014 Performance Cycle(1) | |
| | | | | | 2012 Measurement Period | | | 2013 Measurement Period | | | 2014 Measurement Period | |
Named Executive | | Target
Number of
PSAs for
2012-2014
Performance
Cycle | | | Target
Number of
PSAs | | | Number of
PSAs
Earned(2) | | | Target
Number of
PSAs | | | Number of
PSAs
Earned(2) | | | Target
Number of
PSAs | | | Number of
PSAs
Earned(2) | |
Mr. Civgin | | | 1,878 | | | | 626 | | | | 1,252 | | | | 626 | | | | 1,252 | | | | 626 | | | | 1,189 | |
Mr. Merten | | | N/A | | | | | | | | | | | | | | | | | | | | | | | | | |
| (1) | The actual number of PSAs to be earned for each measurement period varies from 0% to 200% of the target PSAs based on Adjusted Operating Income ROE for such measurement period. |
| (2) | For the 2012 and 2013 measurement periods, Mr. Civgin earned PSAs equal to the maximum, or 200%, of the target number for that measurement period. For the 2014 measurement period, Mr. Civgin earned PSAs equal to 190% of the target number for that measurement period. |
102
| | | | | | | | | | | | | | | | | | | | | | | | | | |
| 2013-2015 Performance Cycle(1) |
| | | | | | 2013 Measurement | | | 2014 Measurement | | | 2015 Measurement |
Named
Executive | | Target Number
of PSAs for
2013-2015
Performance
Cycle | | | Target
Number of
PSAs | | | Number of
PSAs
Earned(2) | | | Target
Number of
PSAs | | | Number of
PSAs
Earned(2) | | | Target
Number of
PSAs | | | Number of
PSAs
Earned |
Mr. Civgin | | | 1,410 | | | | 470 | | | | 940 | | | | 470 | | | | 846 | | | | 470 | | | To be determined
in 2016. |
Mr. Merten | | | N/A | | | | | | | | | | | | | | | | | | | | | | | |
| (1) | The actual number of PSAs to be earned for each measurement period varies from 0% to 200% of the target PSAs based on Adjusted Operating Income ROE for such measurement period. |
| (2) | For the 2013 measurement period, Mr. Civgin earned PSAs equal to the maximum, or 200%, of the target number for that measurement period. For the 2014 measurement period, Mr. Civgin earned PSAs equal to 180% of the target number for that measurement period. |
| | | | |
| 2014-2016 Performance Cycle(1) |
| | | One Measurement Period | | |
Named
Executive | | Target Number of PSAs
for 2014-2016
Performance Cycle | | Number of
PSAs
Earned |
Mr. Civgin | | 1,234 | | To be determined in 2017. |
Mr. Merten | | N/A | | |
| (1) | The actual number of PSAs that will vest will vary from 0% to 200% of the target PSAs based on Adjusted Operating Income ROE for the measurement period. |
103
Summary Compensation Table
The following table summarizes the compensation of our named executive officers for all services rendered to Lincoln Benefit for the last three fiscal years, in a manner consistent with the allocation of compensation under the Services Agreement or the Service and Expense Agreement, as applicable.
| | | | | | | | | | | | | | | | | | | | | | | | | | | | | | | | | | | | |
Name and Principal
Position(1) | | Year | | | Salary
($) | | | Bonus
($)(2) | | | Stock
Awards
($)(3) | | | Option
Awards
($)(4) | | | Non-Equity
Incentive Plan
Compensation
($) | | | Change in
Pension Value
and
Nonqualified
Deferred
Compensation
Earnings
($)(5) | | | All Other
Compensation
($) | | | Total
($) | |
W. Weldon Wilson | | | | | | | | | | | | | | | | | | | | | | | | | | | | | | | | | | | | |
Chairman of the Board and | | | 2014 | | | | 487,500 | | | | 292,500 | | | | — | | | | — | | | | — | | | | — | | | | 5,850 | | | | 785,850 | |
Chief Executive Officer | | | | | | | | | | | | | | | | | | | | | | | | | | | | | | | | | | | | |
Robyn Wyatt | | | | | | | | | | | | | | | | | | | | | | | | | | | | | | | | | | | | |
Executive Vice President, | | | 2014 | | | | 270,000 | | | | 356,850 | | | | — | | | | — | | | | — | | | | — | | | | 7,020 | | | | 633,870 | |
Chief Financial Officer and | | | | | | | | | | | | | | | | | | | | | | | | | | | | | | | | | | | | |
Treasurer | | | | | | | | | | | | | | | | | | | | | | | | | | | | | | | | | | | | |
Keith Gubbay | | | | | | | | | | | | | | | | | | | | | | | | | | | | | | | | | | | | |
| President and Chief Actuary | | | 2014 | | | | 262,500 | | | | 357,375 | | | | — | | | | — | | | | — | | | | — | | | | 5,850 | | | | 625,725 | |
Simon Packer | | | | | | | | | | | | | | | | | | | | | | | | | | | | | | | | | | | | |
| Chief Transformation Officer | | | 2014 | | | | 297,000 | | | | 148,500 | | | | — | | | | — | | | | — | | | | — | | | | 43,277 | (6) | | | 488,777 | |
Karl Chappell | | | | | | | | | | | | | | | | | | | | | | | | | | | | | | | | | | | | |
Managing Director, | | | 2014 | | | | 240,165 | | | | 195,600 | | | | — | | | | — | | | | — | | | | — | | | | 4,629 | | | | 440,394 | |
| Investments and Mergers andAcquisitions | | | | | | | | | | | | | | | | | | | | | | | | | | | | | | | | | | | | |
Don Civgin | | | | | | | | | | | | | | | | | | | | | | | | | | | | | | | | | | | | |
Chairman of the Board, | | | 2014 | | | | 42,910 | | | | — | | | | 64,390 | | | | 64,367 | | | | 61,300 | | | | 8,330 | | | | 1,629 | (7) | | | 242,926 | |
President and Chief | | | 2013 | | | | 186,200 | | | | — | | | | 279,316 | | | | 279,296 | | | | 532,000 | | | | 18,466 | | | | 7,422 | | | | 1,302,700 | |
Executive Officer | | | 2012 | | | | 143,520 | | | | — | | | | 197,594 | | | | 197,598 | | | | 416,000 | | | | 10,105 | | | | 5,887 | | | | 970,704 | |
Jesse E. Merten | | | | | | | | | | | | | | | | | | | | | | | | | | | | | | | | | | | | |
Senior Vice President | | | 2014 | | | | 35,239 | | | | — | | | | 28,542 | | | | 9,512 | | | | 30,732 | | | | 4,370 | | | | 2,611 | (7) | | | 111,006 | |
and Chief Financial | | | 2013 | | | | 138,303 | | | | — | | | | 62,577 | | | | 62,555 | | | | 338,800 | | | | 7,926 | | | | 9,358 | | | | 619,519 | |
Officer | | | 2012 | | | | 77,526 | | | | — | | | | 35,032 | | | | 35,018 | | | | 96,695 | | | | — | | | | 14,188 | | | | 258,459 | |
| (1) | Messrs. Civgin and Merten served as the Chief Executive Officer and Chief Financial Officer, respectively, from January 1, 2014 through March 31, 2014. Mr. Wilson and Ms. Wyatt commenced service as the Chief Executive Officer and Chief Financial Officer, respectively, and each of the other Resolution officers served as an officer of Lincoln Benefit, commencing on April 1, 2014. |
| (2) | Amounts in this column for each of Ms. Wyatt and Messrs. Wilson, Gubbay, Packer and Chappell represent the portion of the NEO’s annual performance-based bonus for 2014 that is attributable to services rendered to Lincoln Benefit, plus, (a) in the case of Ms. Wyatt and Mr. Gubbay, the portion of the 2014 payment of the deferred sign-on bonus attributable to services rendered to Lincoln Benefit or, (b) in the case of Mr. Chappell, the portion of the one-time sign-on bonus attributable to services rendered to Lincoln Benefit. |
| (3) | The aggregate grant date fair value of PSAs and RSUs granted in 2014, 2013, and 2012 are computed in accordance with Financial Accounting Standards Board (“FASB”) Accounting Standards Codification Topic 718 (ASC 718). The fair value of PSAs and RSUs is based on the final closing price of Allstate’s common stock on the grant date, which in part reflects the payment of expected future dividends. (See |
104
| | note 18 to Allstate’s audited financial statements for 2014.) This amount reflects an accounting expense and does not correspond to actual value that will be realized by Messrs. Civgin and Merten. The value of PSAs is based on the probable satisfaction of the performance conditions. The number of PSAs granted in 2014 to Mr. Civgin is provided in theGrants of Plan-Based Awards table on page 110. The value of the PSAs granted in 2014 to Mr. Civgin at grant date share price if maximum corporate performance were to be achieved is $128,780. |
| (4) | The aggregate grant date fair value of option awards is computed in accordance with FASB ASC 718. The fair value of each option award is estimated on the grant date using a binomial lattice model and the assumptions (see note 18 to Allstate’s audited financial statements for 2014) as set forth in the following table: |
| | | | | | |
| | | 2014 | | 2013 | | 2012 |
Weighted average expected term | | 6.5 years | | 8.2 years | | 9.0 years |
Expected volatility | | 16.8 - 42.2% | | 19.1 - 48.1% | | 20.2 - 53.9% |
Weighted average volatility | | 28.3% | | 31.0% | | 34.6% |
Expected dividends | | 1.7 - 2.2% | | 1.9 - 2.2% | | 2.2 - 3.0% |
Weighted average expected dividends | | 2.1% | | 2.2% | | 2.8% |
Risk-free rate | | 0.0 - 3.0% | | 0.0 - 2.9% | | 0.0 - 2.2% |
This amount reflects an accounting expense and does not correspond to actual value that will be realized by Messrs. Civgin and Merten. The number of options granted in 2014 to each of Messrs. Civgin and Merten is provided in theGrants of Plan-Based Awards table on page 110.
| (5) | Amounts reflect the aggregate increase in actuarial value of the pension benefits as set forth in thePension Benefits table, accrued during 2014, 2013, and 2012. These are benefits under the Allstate Retirement Plan (“ARP”) and the Supplemental Retirement Income Plan (“SRIP”). Non-qualified deferred compensation earnings are not reflected since Allstate’s Deferred Compensation Plan does not provideabove-market earnings. The pension plan measurement date is December 31. (See note 17 to Allstate’s audited financial statements for 2014.) Beginning in 2014, all eligible employees earn pension benefits under a new cash balance formula only. |
The following table reflects the respective change in the actuarial value of the benefits provided to Messrs. Civgin and Merten in 2014:
| | | | | | | | |
| Name | | ARP ($) | | | SRIP ($) | |
Mr. Civgin | | | 879 | | | | 7,451 | |
Mr. Merten | | | 1,201 | | | | 3,169 | |
| (6) | Consists of $34,367 in relocation benefits (including a $12,342.85 tax gross-up payment related to such benefits) and $8,910 in 401(k) matching contributions. |
105
| (7) | The following table describes the incremental cost of other benefits provided in 2014 that are included in the “All Other Compensation” column for Messrs. Civgin and Merten. |
All Other Compensation for 2014 — Supplemental Table for Messrs. Civgin and Merten
| | | | | | | | | | | | |
| Name | | 401(k) Match(1) ($) | | | Other(2) ($) | | | Total
All Other
Compensation ($) | |
Mr. Civgin | | | 638 | | | | 991 | | | | 1,629 | |
Mr. Merten | | | 1,222 | | | | 1,389 | | | | 2,611 | |
(1) Each of Messrs. Civgin and Merten participated in Allstate’s 401(k) plan during 2014. The amount shown is the amount allocated to their accounts as employer matching contributions. Mr. Merten was not vested in the employer matching contribution in 2014, but he became vested on January 3, 2015.
(2) “Other” consists of premiums for group life insurance and personal benefits and perquisites consisting of mobile devices, tax preparation services, financial planning, ground transportation, and supplemental long-term disability coverage. There was no incremental cost for the use of mobile devices. Allstate provides supplemental long-term disability coverage to all regular full- and part-time employees who participate in the long-term disability plan and whose annual earnings exceed the level which produces the maximum monthly benefit provided by the long-term disability plan. This coverage is self-insured (funded and paid for by Allstate when obligations are incurred). No obligations for Messrs. Civgin and Merten were incurred in 2014, and therefore, no incremental cost is reflected in the table. In limited circumstances approved by Allstate’s CEO, Mr. Civgin was permitted to use Allstate’s corporate aircraft for personal purposes. Mr. Civgin did not use the corporate aircraft for personal purposes in 2014.
106
Other Compensation Information
The compensation information set forth below is separated into two sections for ease of reading, with the first section covering compensation granted to our NEOs with respect to their services to Lincoln Benefit from April 1, 2014 through December 31, 2014 following Resolution Life’s acquisition of Lincoln Benefit from Allstate on April 1, 2014, and the second section covering compensation granted to Messrs. Civgin and Merten with respect to their services to Lincoln Benefit prior to April 1, 2014.
Compensation Related to Services from April 1, 2014 through December 31, 2014
Potential Payments as a Result of Termination or Change in Control (CIC)
Each of the NEOs is party to an employment agreement with Resolution that provides for severance and/or other payments on certain terminations of employment. If Messrs. Gubbay’s, Packer’s or Chappell’s or Ms. Wyatt’s employment is terminated by mutual agreement between Resolution and the NEO, by Resolution without “cause” or by the NEO with “good reason” (such terminations, “qualifying terminations”), the NEO is entitled to the severance benefit described in the paragraph below; a pro-rated bonus for the year of termination, based on actual Resolution performance; and continued medical coverage at the same premium rate paid by active employees for the period during which the NEO receives the severance benefit. Mr. Gubbay and Ms. Wyatt are also entitled to payment of any unpaid portion of their deferred sign-on bonuses on such a qualifying termination or on a termination due to his or her death or disability. If Mr. Wilson’s employment is terminated in a qualifying termination, he is entitled to a pro-rated bonus for the year of termination and continued medical coverage for twelve months at the same premium rate paid by active employees. Mr. Wilson’s employment agreement does not provide for other severance payments.
If Mr. Gubbay’s or Ms. Wyatt’s employment is terminated in a qualifying termination prior to the second anniversary of his or her employment agreement, such NEO’s severance benefit is equal to (a) one twelfth of the sum of the NEO’s annual base salary and target bonus, (b) multiplied by the number of whole months remaining until the third anniversary of the effective date of the NEO’s employment agreement. On a qualifying termination of Ms. Wyatt’s or Mr. Gubbay’s employment following the second anniversary of the effective date of such NEO’s employment agreement, the NEO’s severance benefit is equal to one year of base salary plus target bonus. If Mr. Chappell’s or Mr. Packer’s employment is terminated in a qualifying termination prior to the first anniversary of the effective date of his employment agreement, his severance benefit is equal to (a) one twelfth of the sum of his base salary plus target bonus, (b) multiplied by the number of whole months remaining until the second anniversary of the effective date of his employment agreement. On a qualifying termination of Mr. Chappell’s or Mr. Packer’s employment following the first anniversary of the effective date of his employment agreement, he is entitled to an amount equal to one-half of the sum his annual base salary plus target bonus.
For these purposes, “cause” means (i) fraudulent statements or acts of the NEO with respect to the performance of his or her duties under the employment agreement, (ii) the NEO’s conviction of, or plea of guilty or nolo contendere to, any crime that constitutes a felony or any crime that constitutes a misdemeanor involving moral turpitude, deceit, dishonesty or fraud and that results in material harm to Resolution, (iii) willful misconduct by the NEO with respect to Resolution or any of its subsidiaries, or (iv) a material breach by the NEO of his or her employment agreement. “Good reason” for these purposes means (a) a reduction in the NEO’s base salary, annual bonus percentage, long-term incentive compensation percentage, for Mr. Gubbay and Ms. Wyatt only, deferred compensation, or Resolution’s refusal to pay the NEO any compensation or benefits due, (b) a material diminution in the NEO’s position, authority, duties or responsibilities, excluding any isolated, insubstantial and inadvertent action, (c) any willful breach by Resolution of a material term of the NEO’s employment agreement, (d) Resolution requiring the NEO to engage in any unlawful or criminal act or (e) the bankruptcy of Resolution. For Mr. Gubbay, “good reason” also includes a termination of employment by Mr. Gubbay if (X) Resolution requests that he relocate his residence from the Boston, Massachusetts area prior to the second anniversary of the effective date of his agreement, (Y) he declines such request to relocateand (Z) he
107
continues to perform his duties from the Boston, Massachusetts area for six months following his decline of the request to relocate (or such shorter period as agreed by Resolution). In order to terminate his or her employment for “good reason,” an NEO must give Resolution written notice and Resolution shall have 30 days to cure.
An NEO’s severance payments are subject to such NEO signing a general release of claims. In addition, the NEOs are subject to covenants not to compete and not to solicit for one year following the date of termination (two years for Mr. Wilson), a non-disparagement covenant for three years following the date of termination, and an indefinite non-disclosure covenant.
Estimate of Potential Payments upon Termination of Employment or Change of Control
The following table summarizes estimated payments and benefits that would be provided to our NEOs pursuant to their employment agreements in connection with a termination of employment under various scenarios or a change in control and that are attributable to service to Lincoln Benefit and reimbursable under the Services Agreement, assuming such event occurred on December 31, 2014.
| | | | | | | | | | | | | | |
Name | | Event(1) | | Base Salary; Bonus
and Deferred Sign-
On Bonus($)(2) | | | Health &
Welfare ($) | | | Total Payments
($) | |
W. Weldon Wilson | | Qualifying Termination | | | 292,500 | | | | 6,915 | | | | 299,415 | |
| | Death or Disability | | | 0 | | | | 0 | | | | 0 | |
| | Resignation | | | 0 | | | | 0 | | | | 0 | |
| | Change in Control | | | 0 | | | | 0 | | | | 0 | |
| | | | |
Robyn Wyatt | | Qualifying Termination | | | 1,271,700 | | | | 7,770 | | | | 1,279,470 | |
| | Death or Disability | | | 389,700 | | | | 0 | | | | 389,700 | |
| | Resignation | | | 0 | | | | 0 | | | | 0 | |
| | Change in Control | | | 0 | | | | 0 | | | | 0 | |
| | | | |
Keith Gubbay | | Qualifying Termination | | | 1,257,250 | | | | 10,963 | | | | 1,268,213 | |
| | Death or Disability | | | 399,750 | | | | 0 | | | | 399,750 | |
| | Resignation | | | 0 | | | | 0 | | | | 0 | |
| | Change in Control | | | 0 | | | | 0 | | | | 0 | |
| | | | |
Simon Packer | | Qualifying Termination | | | 668,250 | | | | 5,854 | | | | 674,104 | |
| | Death or Disability | | | 0 | | | | 0 | | | | 0 | |
| | Resignation | | | 0 | | | | 0 | | | | 0 | |
| | Change in Control | | | 0 | | | | 0 | | | | 0 | |
| | | | |
Karl Chappell | | Qualifying Termination | | | 540,000 | | | | 9,130 | | | | 549,130 | |
| | Death or Disability | | | 0 | | | | 0 | | | | 0 | |
| | Resignation | | | 0 | | | | 0 | | | | 0 | |
| | Change in Control | | | 0 | | | | 0 | | | | 0 | |
| (1) | For Messrs. Wilson, Gubbay, Packer and Chappell and Ms. Wyatt, a “qualifying termination” is a termination by mutual agreement between Resolution and the executive, by the executive with “good reason” or by Resolution without “cause.” The amount included in the table is calculated based on the percentage of the executive’s time that would be allocated to Lincoln Benefit under the Services Agreement in the event of a qualifying termination on December 31, 2014. |
| (2) | Because the termination of employment is deemed to occur on December 31, 2014, the pro-rated portion of any 2014 bonus payable as a result of termination would be 100%. |
Risk Management and Compensation
Resolution has performed a review of compensation policies and practices for all of its employees who provide services to Lincoln Benefit and has concluded that its compensation policies and practices are not reasonably likely to have a material adverse impact on Lincoln Benefit.
108
Director compensation
Our independent directors receive an annual cash retainer fee for their services on the boards of directors of Resolution and its subsidiaries, including Lincoln Benefit, a portion of which is allocated to Lincoln Benefit pursuant to the Services Agreement. The portion of the annual retainer allocated to Lincoln Benefit for 2014 is set forth in the table below. A non-employee director may also elect to defer receipt of all or a portion of his or her annual retainer fee into deferred stock units of Resolution. The elected percentage of the Board retainer for a calendar year of service is converted into stock units when the year-end valuation of Resolution’s common stock for the immediately prior year is available. The stock units will be unvested until December 31st of the relevant year of service, and, as a general rule, if the director’s Board service ends before December 31st, unvested stock units will be forfeited except that, in the case of a qualifying termination, a pro rata portion of the director’s unvested stock units will vest. If Resolution pays a dividend on its common stock, the electing director will be paid, on a current basis, the same cash amount on the stock units (both vested and unvested) held by such director as of the record date of the dividend. Vested stock units will be settled in cash on the first to occur of (1) a change in control of Resolution and (2) 120 days following the end of the year in which the director’s board service ends.
The following table summarizes the allocation of compensation of each of Lincoln Benefit’s independent directors during 2014 for his or her services as a member of the Board of Directors of Lincoln Benefit and its committees in a manner consistent with the allocation of compensation under the Services Agreement. Directors who are officers or employees of Resolution and its subsidiaries and other non-independent directors do not receive any additional compensation for their services as a director of Lincoln Benefit.
| | | | | | | | | | | | |
| Name of Non-Employee Director | | Fees Earned
or Paid in Cash(1)
($) | | | All Other
Compensation(2)
($) | | | Total
($) | |
Stephen Campbell | | $ | 98,438 | | | | — | | | $ | 98,438 | |
Richard Carbone | | $ | 98,438 | | | | — | | | $ | 98,438 | |
Ann Frohman | | $ | 98,438 | | | $ | 33,750 | | | $ | 132,188 | |
Robert Stein | | $ | 98,438 | | | | — | | | $ | 98,438 | |
Grace Vandecruze | | $ | 98,438 | | | | — | | | $ | 98,438 | |
| | (1) | Includes the portion of the cash retainer paid in the form of Resolution deferred stock units at the election of the director. The following table sets forth, by grant date, the allocation of the number of Resolution deferred stock units credited to each director, the grant date fair value of each award and the number of such units held at December 31, 2014 with respect to service as a Lincoln Benefit director in 2014 in a manner consistent with the allocation of compensation under the Services Agreement. All deferred stock units vested on December 31, 2014. |
| | | | | | | | | | | | | | | | |
| Name of Non-Employee Director | | Grant Date | | | Number of
Units
(#) | | | Grant Date
Fair Value
($) | | | Number of
Units held
at
December 31,
2014 | |
Richard Carbone | | | September 5, 2014 | | | | 92.81 | | | $ | 42,086 | | | | 92.81 | |
Robert Stein | | | September 5, 2014 | | | | 92.81 | | | | 42,086 | | | | 92.81 | |
Grace Vandecruze | | | September 5, 2014 | | | | 54.27 | | | | 24,609 | | | | 54.27 | |
| | (2) | Reflects the portion of a legal fee retainer paid to Ms. Frohman for services as regulatory counsel with respect to Lincoln Benefit in 2014 in a manner consistent with the allocation of compensation under the Services Agreement. |
109
Compensation Related to Services prior to April 1, 2014
GRANTS OF PLAN-BASED AWARDS AT FISCAL YEAR-END 2014
The following table provides information aboutnon-equity incentive plan awards and equity awards granted to Messrs. Civgin and Merten during fiscal year 2014 to the extent the expense was allocated to Lincoln Benefit under the Service and Expense Agreement.
| | | | | | | | | | | | | | | | | | | | | | | | | | | | | | | | | | | | | | | | | | | | | | | | | | | | |
| | | | | | | | Estimated Future Payouts
Under Non-Equity Incentive
Plan Awards(2) | | | | | Estimated Future Payouts
Under Equity Incentive Plan
Awards(3) | | | All Other
Stock
Awards:
Number of
Shares of
Stock or
Units (#) | | | All Other
Option
Awards:
Number of
Securities
Underlying
Options
(#) | | | Exercise
or Base
Price of
Option
Awards
($/Shr)(4) | | | Grant Date
Fair Value ($)(5) | |
| Name | | Grant Date | | | Plan Awards(1) | | Threshold
($) | | | Target
($) | | | Maximum
($) | | | | | Threshold
(#) | | | Target
(#) | | | Maximum
(#) | | | | | | Stock
Awards | | | Option
Awards | |
Mr. Civgin | | | — | | | Annual cash incentive | | | 26,819 | | | | 53,638 | | | | 344,445 | | | | | | | | | | | | | | | | | | | | | | | | | | | | | | | | | | | |
| | | 02/18/2014 | | | PSAs | | | | | | | | | | | | | | | | | 0 | | | | 1,234 | | | | 2,468 | | | | | | | | | | | | | | | | 64,390 | | | | | |
| | | | 02/18/2014 | | | Stock options | | | | | | | | | | | | | | | | | | | | | | | | | | | | | | | | | 5,170 | | | | 52.18 | | | | | | | | 64,367 | |
Mr. Merten | | | — | | | Annual cash incentive | | | 8,813 | | | | 17,627 | | | | 35,254 | | | | | | | | | | | | | | | | | | | | | | | | | | | | | | | | | | | |
| | | 02/18/2014 | | | RSUs | | | | | | | | | | | | | | | | | | | | | | | | | | | | | 547 | | | | | | | | | | | | 28,542 | | | | | |
| | | | 02/18/2014 | | | Stock options | | | | | | | | | | | | | | | | | | | | | | | | | | | | | | | | | 764 | | | | 52.18 | | | | | | | | 9,512 | |
| (1) | Awards under Allstate’s annual incentive plans and 2013 Equity Incentive Plan. |
| (2) | The amounts in these columns consist of the threshold, target, and maximum annual cash incentive awards for Messrs. Civgin and Merten. The threshold amount for each of Messrs. Civgin and Merten is 50% of target, as the minimum amount payable (subject to individual performance) if threshold performance is achieved. For Mr. Civgin, if the threshold is not achieved, the payment would be zero. The target amount is based upon achievement of the performance measures listed under theAnnual Cash Incentive Awards caption on page 101. The maximum amount payable to Mr. Civgin is the lesser of a stockholder approved maximum of $10 million under the Annual Executive Incentive Plan or a percentage of the 162(m) award pool. The award pool is equal to 1.0% of Adjusted Operating Income with award opportunities capped at 15% of the pool. Mr. Merten did not participate in the adjusted underlying operating income pool. Adjusted Operating Income is defined on page 121. |
| (3) | The amounts shown in these columns reflect the threshold, target, and maximum PSAs for the named executives who were awarded Allstate PSAs. The threshold amount is 0% payout. The target and maximum amounts are based upon achievement of the performance measures listed under thePerformance Stock Awards caption on page 102. |
| (4) | The exercise price of each option is equal to Allstate’s closing sale price on the New York Stock Exchange on the grant date or, if there was no such sale on the grant date, then on the last previous day on which there was a sale. |
| (5) | The aggregate grant date fair value of the February 18, 2014, PSAs and RSUs was $52.18 and stock option awards was $12.45, computed in accordance with FASB ASC 718 based on the probable satisfaction of the performance conditions. The assumptions used in the valuation are discussed in footnotes 1 and 2 to theSummary Compensation Table on page 104. |
110
Allstate Performance Stock Awards
PSAs represent Allstate’s promise to transfer shares of common stock in the future if certain performance measures are met. Each PSA represents Allstate’s promise to transfer one fully vested share in the future for each PSA that vests. Earned PSAs will vest following the end of the three-year performance cycle, subject to continued employment (other than in the event of death, disability, retirement, or a qualifying termination following a change-in-control). Vested PSAs will be converted into shares of Allstate common stock and dividend equivalents accrued on these shares will be paid in cash. No dividend equivalents will be paid prior to vesting. PSAs were granted to Mr. Civgin.
Allstate Restricted Stock Units
Mr. Merten received an award of RSUs in 2014. Each RSU represents Allstate’s promise to transfer one fully vested share of stock in the future if and when the restrictions expire (when the unit “vests”). Because RSUs are based on and payable in stock, they reinforce the alignment of interests of Allstate’s executives and Allstate’s stockholders. In addition, RSUs provide a retention incentive because they have a real, current value that is forfeited in most circumstances if an executive terminates employment before the RSUs vest. Under the terms of the RSU awards, the executives have only the rights of general unsecured creditors of Allstate and no rights as stockholders until delivery of the underlying shares. The RSUs granted to Mr. Merten in 2014 vest on the third anniversary of the grant date, except in certain change-in-control situations or under other special circumstances approved by the Committee. The RSUs granted to Mr. Merten in 2014 include the right to receive previously accrued dividend equivalents when the underlying RSU vests.
Allstate Stock Options
Stock options represent an opportunity to buy shares of Allstate’s stock at a fixed exercise price at a future date. Allstate uses them to align the interests of its executives with long-term stockholder value, as the stock price must appreciate from the grant date for the executives to profit.
Under Allstate’s stockholder-approved equity incentive plan, the exercise price cannot be less than the closing price of a share on the grant date or, if there was no such sale on the grant date, then on the last previous day on which there was a sale. Stock option repricing is not permitted. In other words, without an event such as a stock split, if the Committee cancels an award and substitutes a new award, the exercise price of the new award cannot be less than the exercise price of the cancelled award.
All stock option awards have been made in the form of non-qualified stock options. The options granted to Messrs. Civgin and Merten in 2014 become exercisable over three years.One-third of the stock options will become exercisable on the anniversary of the grant date for each of the three years. The options granted to Messrs. Civgin and Merten prior to 2014 become exercisable over four years: 50% on the second anniversary of the grant date and 25% on each of the third and fourth anniversary dates. The change to the vesting schedule in 2014 was made to reflect current market practice. All of the options expire in ten years.
OUTSTANDING EQUITY AWARDS AT FISCALYEAR-END 2014
The following table summarizes the outstanding equity awards of Messrs. Civgin and Merten as of December 31, 2014, allocated in a manner consistent with the allocation of compensation expenses to Lincoln Benefit under the Service and Expense Agreement for 2014. The percentage of each equity award actually allocated to Lincoln Benefit has varied over the years, during which these awards were granted depending on the extent of services rendered by such executive to Lincoln Benefit and the arrangements in place at the time of such equity awards between Lincoln Benefit and the executive’s Allstate-affiliated employer. Because the aggregate amount of such equity awards attributable to services rendered to Lincoln Benefit by each of Messrs.
111
Civgin and Merten cannot be calculated without unreasonable effort, the allocated amount of each equity award provided for each of Messrs. Civgin and Merten in the following table is the amount determined by multiplying each of Messrs. Civgin and Merten’s equity award for services rendered to Allstate and all of its affiliates by the percentage used for allocating such named executive’s compensation to Lincoln Benefit for 2014 under the Service and Expense Agreement.
| | | | | | | | | | | | | | | | | | | | | | | | | | | | | | | | | | | | | | | | |
| | | Option Awards(1) | | | Stock Awards | |
| Name | | Option
Grant
Date | | | Number of
Securities
Underlying
Unexercised
Options (#)
Exercisable(2) | | | Number of
Securities
Underlying
Unexercised
Options (#)
Unexercisable(2) | | | Option
Exercise
Price ($) | | | Option
Expiration
Date | | | Stock
Award
Grant
Date | | | Number
of
Shares
or Units
of Stock
That
Have
Not
Vested
(#)(3) | | | Market
Value of
Shares or
Units of
Stock
That
Have Not
Vested
($)(4) | | | Equity
Incentive
Plan
Awards:
Number
of
Unearned
Shares,
Units, or
Other
Rights
that Have
Not
Vested
(#)(5) | | | Equity
Incentive
Plan
Awards
Market or
Payout
Value of
Unearned
Shares,
Units, or
Other
Rights
that Have
Not
Vested
($)(4) | |
Mr. Civgin | | | 09/08/2008 | | | | 3,985 | | | | 0 | | | | 46.48 | | | | 09/08/2018 | | | | | | | | | | | | | | | | | | | | | |
| | | 02/22/2010 | | | | 6,862 | | | | 0 | | | | 31.41 | | | | 02/22/2020 | | | | | | | | | | | | | | | | | | | | | |
| | | 02/22/2011 | | | | 5,303 | | | | 1,768 | | | | 31.74 | | | | 02/22/2021 | | | | 02/22/2011 | | | | 287 | | | | 20,162 | | | | | | | | | |
| | | 02/21/2012 | | | | 3,358 | | | | 3,358 | | | | 31.56 | | | | 02/21/2022 | | | | 03/06/2012 | | | | 3,693 | | | | 259,433 | | | | | | | | | |
| | | 02/12/2013 | | | | 0 | | | | 5,377 | | | | 45.61 | | | | 02/12/2023 | | | | 02/12/2013 | | | | 1,786 | | | | 125,467 | | | | 470 | | | | 33,018 | |
| | | | 02/18/2014 | | | | 0 | | | | 5,170 | | | | 52.18 | | | | 02/18/2024 | | | | 02/18/2014 | | | | | | | | | | | | 1,234 | | | | 86,689 | |
Mr. Merten | | | 02/21/2012 | | | | 838 | | | | 839 | | | | 31.56 | | | | 02/21/2022 | | | | 02/21/2012 | | | | 230 | | | | 16,158 | | | | | | | | | |
| | | 02/12/2013 | | | | 0 | | | | 1,269 | | | | 45.61 | | | | 02/12/2023 | | | | 02/12/2013 | | | | 333 | | | | 23,393 | | | | | | | | | |
| | | 02/18/2014 | | | | 0 | | | | 764 | | | | 52.18 | | | | 02/18/2024 | | | | 02/18/2014 | | | | 547 | | | | 38,427 | | | | | | | | | |
| (1) | The options granted in 2014 vest over three years: one-third will become exercisable on the anniversary of the grant date for each of the three years. The options granted in 2013, 2012, 2011, and 2010 vest over four years: 50% on the second anniversary date and 25% on each of the third and fourth anniversary dates. The other options vest in four installments of 25% on each of the first four anniversaries of the grant date. The exercise price of each option is equal to the final closing price of Allstate’s common stock on the grant date. If there was no sale on the grant date, the exercise price is calculated as of the last previous day on which there was a sale. |
| (2) | The aggregate value and aggregate number of exercisable and unexercisable in-the-money options as of December 31, 2014, for each of Messrs. Civgin and Merten are as follows: |
| | | | | | | | | | | | | | | | |
| | | Exercisable | | | Unexercisable | |
| Name | | Aggregate
Number (#) | | | Aggregate
Value ($) | | | Aggregate
Number (#) | | | Aggregate
Value ($) | |
Mr. Civgin | | | 19,508 | | | | 695,383 | | | | 15,673 | | | | 423,918 | |
Mr. Merten | | | 838 | | | | 32,422 | | | | 2,872 | | | | 77,535 | |
| (3) | The RSU awards granted in 2013, 2012, and 2011 vest over four years: 50% on the second anniversary of the grant date and 25% on each of the third and fourth anniversary dates. The RSUs granted in 2014 and the PSAs vest in one installment on the third anniversary of the grant date. |
| (4) | Amount is based on the closing price of Allstate’s common stock of $70.25 on December 31, 2014. |
| (5) | The PSAs vest in one installment on the third anniversary of the grant date. The number of shares that ultimately vest may range from 0 to 200% of the target depending on actual performance during the three-year performance period. For a description of the PSA program and the performance measures used, see pages 102-103. The number of PSAs reflected in this column for the 2013 and 2014 awards are the number of shares that would be earned if the target level of performance is achieved. Final payouts under the PSAs will not be known until the respective performance period is completed. |
112
OPTION EXERCISES AND STOCK VESTED AT FISCALYEAR-END 2014
The following table summarizes the Allstate options exercised by Messrs. Civgin and Merten during 2014 and the Allstate RSU awards that vested during 2014, allocated in a manner consistent with the allocation of compensation expenses to Lincoln Benefit under the Service and Expense Agreement for 2014.
| | | | | | | | | | | | | | | | |
| | | Option Awards | | | Stock Awards | |
| Name | | Number of
Shares Acquired
on Exercise
(#) | | | Value
Realized
on Exercise
($) | | | Number of
Shares
Acquired
on Vesting
(#) | | | Value
Realized
on Vesting
($) | |
Mr. Civgin | | | 0 | | | | 0 | | | | 578 | | | | 31,131 | |
Mr. Merten | | | 0 | | | | 0 | | | | 230 | | | | 12,298 | |
Allstate Retirement Benefits
The following table provides information about the pension plans in which Messrs. Civgin and Merten participate. Each of Messrs. Civgin and Merten participates in the Allstate Retirement Plan (“ARP”) and the Supplemental Retirement Income Plan (“SRIP”). Pension expense for each of Messrs. Civgin and Merten under these plans has been accrued annually over the course of the executive’s career with Allstate. The aggregate amount of the annual accrual specifically allocated to Lincoln Benefit over that period of time has varied depending on the extent of services rendered by such executive to Lincoln Benefit and the arrangements in place at the time of accrual between Lincoln Benefit and the executive’s Allstate affiliated employer. Because the aggregate amount of such annual accruals earned prior to 2014 attributable to services rendered to Lincoln Benefit by each of Messrs. Civgin and Merten cannot be calculated without unreasonable effort, the present value of accumulated benefit provided for each of Messrs. Civgin and Merten in the following table is the amount determined by multiplying the present value of such named executive’s accumulated pension benefit for services rendered to Allstate and all of its affiliates over the course of such named executive’s career with Allstate by the percentage used for allocating such named executive’s compensation to Lincoln Benefit for 2014 under the Service and Expense Agreement.
PENSION BENEFITS
| | | | | | | | | | | | | | | | |
| Name | | Plan Name | | | Number of
Years
Credited Service
(#) | | | Present Value of
Accumulated
Benefit(1)(2)
($) | | | Payments
During Last
Fiscal Year
($) | |
Mr. Civgin | | | ARP | | | | 6.33 | | | | 2,546 | | | | 0 | |
| | | | SRIP | | | | 6.33 | | | | 16,484 | | | | 0 | |
Mr. Merten(3) | | | ARP | | | | 3.00 | | | | 1,987 | | | | 0 | |
| | | | SRIP | | | | 3.00 | | | | 4,307 | | | | 0 | |
| (1) | These amounts are estimates and do not necessarily reflect the actual amounts that will be paid to Messrs. Civgin and Merten, which will be known only at the time they become eligible for payment. The present value of the accumulated benefit was determined using the same measurement date (December 31, 2014) and material assumptions that Allstate uses for year-end financial reporting purposes, except that no assumptions were made for early termination, disability, or pre-retirement mortality. Other assumptions include the following: |
| | • | | Retirement at the normal retirement age as defined in the plans (age 65). |
| | • | | Discount rate of 4.10%. |
| | • | | For cash balance formula, 100% paid as a lump sum. |
113
See note 17 to Allstate’s audited financial statements for 2014 for additional information.
| (2) | The following table shows the lump sum present value of thenon-qualified pension benefits for each of Messrs. Civgin and Merten earned through December 31, 2014, if such named executives’ employment terminated on that date. |
| | | | | | | | |
| Name | | Plan
Name | | | Lump Sum
Amount
($) | |
Mr. Civgin | | | SRIP | | | | 15,780 | |
Mr. Merten | | | SRIP | | | | 3,921 | |
The amount shown is account balance as of December 31, 2014.
| (3) | As of December 31, 2014, Mr. Merten was not vested in the Allstate Retirement Plan or the Supplemental Retirement Plan. |
Allstate Retirement Plan (“ARP”)
Contributions to the ARP are made entirely by Allstate and are paid into a trust fund from which benefits are paid.
Cash Balance Formula
Each of Messrs. Civgin and Merten earned benefits under the cash balance formula in 2014. Under this formula, participants receive pay credits while employed at Allstate, based on a percentage of eligible annual compensation and years of service, plus interest credits. Pay credits are allocated to a hypothetical account in an amount equal to 3% to 5% of eligible annual compensation, depending on years of vesting service. Interest credits are allocated to the hypothetical account based on the interest crediting rate in effect for that plan year as published by the Internal Revenue Service. The interest crediting rate is set annually and is currently based on the average yield for30-year U.S. Treasury securities for August of the prior year. Prior to 2014, Messrs. Civgin and Merten earned cash balance credits equal to 2.5% of eligible annual compensation after they completed one year of vesting service based on the prior cash balance formula.
Allstate Supplemental Retirement Income Plan (“SRIP”)
SRIP benefits are generally determined using atwo-step process: (1) determine the amount that would be payable under the ARP formula if Internal Revenue Code limits did not apply, then (2) reduce the amount described in (1) by the amount actually payable under the ARP formula. The normal retirement date under the SRIP is age 65. If eligible for early retirement under the ARP, the employee also is eligible for early retirement under the SRIP. SRIP benefits are not funded and are paid out of Allstate’s general assets.
Credited Service; Other Aspects of the Allstate Pension Plans
No additional service credit beyond service with Allstate or its predecessors is granted under the ARP or the SRIP to Messrs. Civgin or Merten.
Under both the ARP and SRIP, eligible compensation consists of salary, annual cash incentive awards, and certain other forms of compensation, but does not includelong-term cash incentive awards or income related to equity awards. Compensation used to determine benefits under the ARP is limited in accordance with the Internal Revenue Code.
Payment options under the ARP include a lump sum, straight life annuity, and various survivor annuity options. The lump sum payment under the cash balance benefit is generally equal to a participant’s cash balance account balance. Payments from the SRIP are paid in the form of a lump sum.
114
Timing of Payments
Eligible employees are vested in the normal ARP and SRIP retirement benefits on the earlier of the completion of three years of service or upon reaching age 65.
A participant earning cash balance benefits who terminates employment with at least three years of vesting service is entitled to a lump sum benefit equal to his or her cash balance account balance.
The following SRIP payment dates assume a retirement or termination date of December 31, 2014:
| | • | | Mr. Civgin’s SRIP benefit would be paid on January 1, 2017, or following death. |
| | • | | Mr. Merten’s SRIP benefit is not currently vested, but would become payable following death. |
NON-QUALIFIED DEFERRED COMPENSATION AT FISCALYEAR-END 2014
The following table summarizes thenon-qualified deferred compensation contributions, earnings, and account balances of Messrs. Civgin and Merten in 2014. All amounts relate to The Allstate Corporation Deferred Compensation Plan.
The aggregate amount of the annual accrual specifically allocated to Lincoln Benefit over each of Messrs. Civgin and Merten’s career with Allstate has varied depending on the extent of services rendered by such executive to Lincoln Benefit and the arrangements in place at the time of accrual between Lincoln Benefit and the executive’s Allstate affiliated employer. Because the aggregate earnings and balance attributable to services rendered to Lincoln Benefit by each of Messrs. Civgin and Merten cannot be calculated without unreasonable effort, the aggregate earnings and aggregate balance provided for each of Messrs. Civgin and Merten in the following table is the amount determined by multiplying the value of such named executive’s non-qualified deferred compensation benefit for services rendered to Allstate and all of its affiliates over the course of such named executive’s career with Allstate by the percentage used for allocating such named executive’s compensation to Lincoln Benefit for 2014 under the Service and Expense Agreement.
| | | | | | | | | | | | | | | | | | | | |
| Name | | Executive
Contributions
in Last FY
($) | | | Registrant
Contributions
in Last FY
($) | | | Aggregate
Earnings
in Last FY
($)(1) | | | Aggregate
Withdrawals/ Distributions in Last FY
($) | | | Aggregate
Balance
at Last FYE
($)(2) | |
Mr. Civgin | | | 0 | | | | 0 | | | | 0 | | | | 0 | | | | 0 | |
Mr. Merten | | | 0 | | | | 0 | | | | 0 | | | | 0 | | | | 0 | |
| (1) | Aggregate earnings were not included in Messrs. Civgin’s and Merten’s compensation in the last completed fiscal year in theSummary Compensation Table. |
| (2) | There are no amounts reported in theAggregate Balance at Last FYE column that previously were reported as compensation in theSummary Compensation Table. |
In order to remain competitive with other employers, Allstate allows Messrs. Civgin and Merten and other employees whose annual compensation exceeds the amount specified in the Internal Revenue Code ($260,000 in 2014), to defer under the Deferred Compensation Plan up to 80% of their salary and/or up to 100% of their annual cash incentive award that exceeds the Internal Revenue Code limit. Allstate does not match participant deferrals and does not guarantee a stated rate of return.
Deferrals under the Deferred Compensation Plan are credited with earnings or debited for losses based on the results of the notional investment option or options selected by the participants. The notional investment options available in 2014 under the Deferred Compensation Plan are: stable value, S&P 500, international equity, Russell 2000,mid-cap, and bond funds. Under the Deferred Compensation Plan, deferrals are not actually
115
invested in these funds, but instead are credited with earnings or debited for losses based on the funds’ investment returns. Because the rate of return is based on actual investment measures in Allstate’s 401(k) plan, noabove-market earnings are credited or recorded. Allstate’s Deferred Compensation Plan and 401(k) plan allow participants to change their investment elections daily.
The Deferred Compensation Plan is unfunded. This means that Allstate does not set aside funds for the plan in a trust or otherwise. Participants have only the rights of general unsecured creditors and may lose their balances in the event of the company’s bankruptcy. Account balances are 100% vested at all times.
An irrevocable distribution election is required before making any deferrals into the plan. Generally, a plan participant may elect to begin receiving a distribution of his or her account balance immediately upon separation from service or in one of the first through fifth years after separation from service. The earliest distribution date for deferrals on or after January 1, 2005, and earnings and losses on these amounts, is six months following separation from service. The plan participant may elect to receive payment in a lump sum or in annual cash installment payments over a period of two to ten years. In addition, a plan participant may elect anin-service withdrawal of his or her entire balance earned and vested prior to January 1, 2005, and earnings and losses on these amounts, subject to forfeiture of 10% of such balance. Upon proof of an unforeseen emergency, a plan participant may be allowed to access certain funds in a deferred compensation account earlier than the dates specified above.
Potential Payments as a Result of Termination or Change in Control (“CIC”)
The following table lists the compensation and benefits that Allstate would provide to Messrs. Civgin and Merten in various scenarios involving a termination of employment, other than compensation and benefits generally available to salaried employees. The table describes equity granting practices for the 2014 equity incentive awards. Relevant prior practices are described in the footnotes.
| | | | | | | | | | |
| | | Termination Scenarios |
Compensation
Elements | | Termination(1) | | Retirement | | Termination due to
Change-in-Control(2) | | Death | | Disability |
| Base Salary | | Ceases immediately | | Ceases immediately | | Ceases immediately | | Ceases immediately | | Ceases immediately |
| Severance Pay | | None | | None | | Lump sum equal to two times salary and annual incentive at target(3) | | None | | None |
| Annual Incentive(4) | | Forfeited except for certain reductions in force (prorated for the year and subject to discretionary adjustments) | | Prorated for the year and subject to discretionary adjustments(5) | | Prorated at target (reduced by any amounts actually paid) | | Prorated for the year and subject to discretionary adjustments | | Prorated for the
year and subject to
discretionary
adjustments |
| Stock Options(4)(6) | | Unvested are forfeited, vested expire at the earlier of three months or normal expiration | | Awards continue to vest if granted more than 12 months before, and pro rata portion of award granted within 12 months of retirement. All expire at earlier of five years or normal expiration(7) | | Awards vest upon qualifying termination after a CIC(8) | | Awards vest immediately and expire at earlier of two years or normal expiration | | Awards vest
immediately and
expire at earlier of
two years or
normal expiration |
116
| | | | | | | | | | |
| | | Termination Scenarios |
Compensation
Elements | | Termination(1) | | Retirement | | Termination due to
Change-in-Control(2) | | Death | | Disability |
| Restricted Stock Units(4)(6) | | Forfeited | | Awards continue to vest if granted more than 12 months before, and pro rata portion of award granted within 12 months of retirement(7) | | Awards vest upon qualifying termination after a CIC(8) | | Awards vest immediately | | Awards vest
immediately |
| Performance Stock Awards(4)(6) | | Forfeited | | Awards continue to vest and are paid out based on actual performance if granted more than 12 months before, and pro rata portion of awards granted within 12 months of retirement(7) | | Awards vest based on performance upon a qualifying termination after a CIC(9) | | Awards vest and are payable immediately(10) | | Awards vest and
are payable
immediately(10) |
| Non-Qualified Pension Benefits(11) | | Distributions commence per plan | | Distributions commence per plan | | Immediately payable upon a CIC | | Distributions commence per plan | | Participant may
request payment if
age 50 or older |
| Deferred Compensation(12) | | Distributions commence per participant election | | Distributions commence per participant election | | Immediately payable upon a CIC | | Payable within 90 days | | Distributions
commence per
participant election |
| Health, Welfare and Other Benefits | | None | | None | | Outplacement services provided; lump sum payment equal to additional cost of welfare benefits continuation coverage for 18 months(13) | | None | | Supplemental Long
Term Disability
benefits if enrolled
in basic long term
disability plan |
| (1) | Includes both voluntary and involuntary termination. Examples of involuntary termination independent of achange-in-control includeperformance-related terminations; terminations for employee dishonesty and violation of Allstate rules, regulations, or policies; and terminations resulting from lack of work, rearrangement of work, or reduction in force. |
| (2) | In general, achange-in-control is one or more of the following events: (1) any person acquires 30% or more of the combined voting power of Allstate common stock within a12-month period; (2) any person acquires more than 50% of the combined voting power of Allstate common stock; (3) certain changes are made to the composition of the Allstate Board; or (4) the consummation of a merger, reorganization, or similar transaction. These triggers were selected because any of these could cause a substantial change in management in a widely held company the size of Allstate. Mr. Civgin is a participant in Allstate’s CIC Plan. Mr. Merten is not a party to the CIC Plan. Effective upon achange-in-control, Mr. Civgin becomes subject to covenants prohibiting solicitation of employees, customers, and suppliers until one year after termination of employment. If Mr. Civgin incurs legal fees or other expenses in an effort to enforce the CIC Plan, Allstate will reimburse him for these expenses unless it is established by a court that he had no reasonable basis for the claim or acted in bad faith. |
| (3) | For those named executives subject to the CIC Plan, severance benefits would be payable if a named executive’s employment is terminated either by Allstate without cause or by the executive for good reason as defined in the plan during the two years following thechange-in-control. Cause means the named executive has been convicted of a felony or other crime involving fraud or dishonesty, has willfully or intentionally breached the restrictive covenants in the CIC Plan, has habitually neglected his or her duties, or has engaged in willful or reckless material misconduct in the performance of his or her duties. Good reason includes a material diminution in a named executive’s base compensation, authority, duties, or responsibilities, or a material change in the geographic location where the named executive performs services. |
117
| (4) | Named executives who receive an equity award or an annual cash incentive award under the Annual Executive Incentive Plan after May 19, 2009, are subject to anon-solicitation covenant while they are employed and for theone-year period following termination of employment. If a named executive violates thenon-solicitation covenant, the Allstate Board or a committee of the Allstate Board, to the extent permitted by applicable law, may recover compensation provided to the named executive, including cancellation of outstanding awards or recovery of all or a portion of any gain realized upon vesting, settlement, or exercise of an award or recovery of all or a portion of any proceeds resulting from any disposition of shares received pursuant to an award if the vesting, settlement, or exercise of the award or the receipt of the sale proceeds occurred during the12-month period prior to the violation. If Mr. Merten’s employment were to be terminated as a result of a reduction in force, he would be eligible for a prorated annual incentive award subject to discretionary adjustments. Mr. Civgin is not eligible for an annual incentive payment upon termination or retirement. |
| (5) | Retirement for purposes of the Annual Executive Incentive Plan is defined as voluntary termination on or after the date the named executive attains age 55 with at least 10 years of service or age 60 with five years of service. |
| (6) | Named executives who receive an equity award on or after May 21, 2013, that remains subject to a period of restriction or other performance or vesting condition, are subject to anon-compete provision while they are employed and for theone-year period following termination of employment. Named executives who received equity awards granted between February 21, 2012, and May 20, 2013, are subject to anon-compete provision while they are employed and for thetwo-year period following termination of employment. If a named executive violates thenon-competition covenant, the Allstate Board or a committee of the Allstate Board may, to the extent permitted by applicable law, cancel any or all of the named executive’s outstanding awards that remain subject to a period of restriction or other performance or vesting condition as of the date on which the named executive first violated thenon-competition provision. |
| (7) | Historical and current retirement definitions and treatment for purposes of stock options, RSUs, and PSAs are as follows: |
| | | | | | | | |
| | | | | Date of award prior to February 22, 2011 | | Date of award
on or after February 22, 2011
and before February 21, 2012 | | Date of award on or after February 21, 2012 |
Early Retirement: | | | | | | |
| | Definition | | Age 55 with 20 years of service | | Age 55 with 10 years of service | | Age 55 with 10 years of service |
| | | Treatment | | Unvested awards are forfeited. Vested stock options expire at the earlier of five years from the date of retirement or the expiration date of the option. | | Prorated portion of unvested awards continue to vest. Vested stock options expire at the earlier of five years from the date of retirement or the expiration date of the option. | | • Unvested awards not granted within 12 months of retirement continue to vest. • Prorated portion of unvested awards granted within 12 months of the retirement date continue to vest. • Vested stock options expire at the earlier of five years from the date of retirement or the expiration date of the option. |
118
| | | | | | | | |
| | | | | Date of award prior to February 22, 2011 | | Date of award
on or after February 22, 2011
and before February 21, 2012 | | Date of award on or after February 21, 2012 |
Normal Retirement: | | | | |
| | Definition | | Age 60 with at least one year of service | | Age 60 with at least one year of service | | Age 60 with at least five years of service |
| | | | |
| | | Treatment | | Unvested awards continue to vest and stock options expire at the earlier of five years from the date of retirement or the expiration date of the option. | | • Unvested awards not granted within 12 months of retirement continue to vest. • Prorated portion of unvested awards granted within 12 months of the retirement date continue to vest. • Vested stock options expire at the earlier of five years from the date of retirement or the expiration date of the option. | | • Unvested awards not granted within 12 months of retirement continue to vest. • Prorated portion of unvested awards granted within 12 months of the retirement date continue to vest. • Vested stock options expire at the earlier of five years from the date of retirement or the expiration date of the option. |
| (8) | This description is the treatment of equity awards granted on or after December 30, 2011. Awards granted prior to December 30, 2011, vest on the date of achange-in-control. |
| (9) | For completed measurement periods with results certified by the Committee, the earned amount continues to vest. For open cycles, the Committee will determine the number of PSAs that continue to vest based on actual performance up to thechange-in-control. |
| (10) | For completed measurement periods with results certified by the Committee, the earned amount is paid. For open cycles, the payout is based on the target number of PSAs. |
| (11) | See theRetirement Benefits section for further detail onnon-qualified pension benefits and timing of payments. |
| (12) | See theNon-Qualified Deferred Compensation section for additional information on the Deferred Compensation Plan and distribution options available. |
| (13) | For those named executives subject to the CIC Plan, if their employment is terminated due to death during the two years after the date of achange-in-control, the named executive’s estate or beneficiary will be entitled to survivor and other benefits, including retiree medical coverage, if eligible, that are not less favorable than the most favorable benefits available to the estates or surviving families of peer executives of Allstate. In the event of termination due to disability during the two years after the date of achange-in-control, Allstate will pay disability and other benefits, including supplementallong-term disability benefits and retiree medical coverage, if eligible, that are not less favorable than the most favorable benefits available to disabled peer executives. |
Estimate of Potential Payments upon Termination of Employment or Change of Control
Messrs. Civgin and Merten did not receive any termination or change in control payments or benefits that have been or will be reimbursed by Lincoln Benefit under the Service and Expense Agreement as a result of their termination of service to Lincoln Benefit at the time of Resolution Life’s acquisition of all of the outstanding capital stock of Lincoln Benefit from Allstate Life Insurance Company on April 1, 2014.
119
Allstate Risk Management and Compensation
A review and assessment of potentialcompensation-related risks is conducted by Allstate’s chief risk officer. Allstate believes that its compensation policies and practices are appropriately structured and do not provide incentives for employees to take unnecessary and excessive risks.
The Allstate Board and its risk and return committee both play an important role in risk management oversight, including reviewing how Allstate management measures, evaluates, and manages Allstate’s exposure to risks posed by a wide variety of events and conditions. In addition, the compensation and succession committee employs an independent compensation consultant each year to review and assess Allstate’s executive pay levels, practices, and overall program design.
Allstate Performance Measures for 2014
The following are descriptions of the performance measures used by Allstate for executive incentive compensation. These measures are not GAAP measures. They were developed uniquely for incentive compensation purposes and are not reported items in Allstate’s financial statements. The Committee has approved the use ofnon-GAAP measures when appropriate to drive executive focus on particular strategic, operational, or financial factors, or to exclude factors over which executives have little influence or control. The Committee monitors compensation estimates during the year based on actual performance on these measures, and the internal audit department reviews the final results.
120
Adjusted Operating Income: This measure is calculated differently for annual cash incentive awards, the 162(m) pool, and each PSA performance cycle. For each plan, Adjusted Operating Income is equal to net income available to common shareholders as reported in Allstate’s annual report on Form 10-K adjusted for theafter-tax effect of the items indicated below:
| | | | | | | | | | | | | | | | | | | | |
| | | | | | | | | PSAs | |
| üIndicates adjustments to Net Income | | Annual Cash
Incentive
Awards | | | 162(m) Pool | | | 2012-2014
Performance
Cycle | | | 2013-2015
Performance
Cycle | | | 2014-2016 Performance Cycle | |
Net income available to common shareholders, excluding: | | | | | | | | | | | | | | | | | | | | |
– Realized capital gains and losses (which includes the related effect on amortization of deferred acquisition and deferred sales inducement costs) except for periodic settlements and accruals on certainnon-hedge derivative instruments | | ü | | | | ü | | | | ü | | | | ü | | | | ü | | |
– Valuation changes on embedded derivatives that are not hedged (which includes the related effect on amortization of deferred acquisition and deferred sales inducement costs) | | ü | | | | ü | | | | ü | | | | ü | | | | ü | | |
– Business combination expenses and amortization of purchased intangible assets | | ü | | | | ü | | | | ü | | | | ü | | | | ü | | |
– (Loss) gain on disposition of operations | | ü | | | | ü | | | | ü | | | | ü | | | | ü | | |
– Restructuring or related charges | | ü | | | | ü | | | | | | | | ü | | | | ü | | |
– Underwriting results of Discontinued Lines and Coverages segment | | ü | | | | ü | | | | ü | | | | ü | | | | ü | | |
– Loss on extinguishment of debt(1) | | | | | | | | | | ü | | | | ü | | | | | | |
– Post-retirement benefits curtailment gain(1) | | | | | | | | | | ü | | | | ü | | | | | | |
– Effects of acquiring and selling businesses | | ü | | | | ü | | | | ü | | | | ü | | | | ü | | |
| Adjustments to be consistent with financial reporting used in establishing the measure | | ü | | | | ü | | | | ü | | | | ü | | | | ü | | |
| | | | | | | | | | | | | | | | | | | | | |
Adjusted Operating Income before catastrophe adjustment | | | | | | | | | | | | | | | | | | | | |
| Adjustment forafter-tax catastrophe losses | | Include
planned
amount | | | Exclude
actual
amount | | | Adjusted to
include a
minimum or
maximum
amount | | | Adjusted to
include a
minimum or
maximum
amount | | | Average
adjusted to
include a
minimum or
maximum
amount | |
| | | | | | | | | | | | | | | | | | | | | |
Adjusted Operating Income | | | | | | | | | | | | | | | | | | | | |
Allstate Annual Cash Incentive Award Performance Measures for 2014
Adjusted Operating Income: This measure is used to assess financial performance. For a description of how this measure is determined, see above.
The impact of catastrophe losses on annual cash incentive awards is recognized through a modifier to the Adjusted Operating Income performance measure payout percentage.
121
| | |
ActualAfter-Tax
Catastrophe Losses | | Impact to Adjusted Operating
Income Payout Percentage |
Within 10% of planned catastrophe losses | | None |
Lower than planned catastrophe losses by more than 10% | | Increases payout by up to 20% |
Higher than planned catastrophe losses by more than 10% | | Decreases payout by up to 20% |
In 2014, actualafter-tax catastrophe losses were within 10% of planned catastrophe losses and as a result, no adjustment was required.
Net Investment Income: This measure is used to assess the financial operating performance provided from investments. It is equal to net investment income as reported in the consolidated statement of operations. Net investment income is subject to adjustments to be consistent with the financial reporting used in establishing the measure and to exclude the effects of acquiring and selling businesses and was adjusted accordingly in 2014.
Total Premiums: This measure is used to assess growth within the Allstate Protection and Allstate Financial businesses. It is equal to the sum of Allstate Protection premiums written and Allstate Financial premiums and contract charges as described below.
Allstate Protection premiums written is equal to the Allstate Protection net premiums written as reported in management’s discussion and analysis in Allstate’s annual report on Form10-K.
Allstate Financial premiums and contract charges are equal to life and annuity premiums and contract charges reported in the consolidated statement of operations.
Total Premiums is subject to adjustments to be consistent with the financial reporting used in establishing the measure and to exclude the effects of acquiring and selling businesses and was adjusted accordingly in 2014.
Performance Stock Award Performance Measures for the2012-2014 Performance Cycle and the2013-2015 Performance Cycle
Annual Adjusted Operating Income Return on Equity: This measure is used to assess financial performance. It is calculated as the ratio of annual Adjusted Operating Income for the applicable PSA performance cycle divided by the average of common shareholders’ equity excluding the effects of unrealized net capital gains and losses at the beginning and at the end of the year. For a description of how Adjusted Operating Income is determined, see page 121.
Adjusted Operating Income is adjusted to include a minimum or maximum amount of after-tax catastrophe losses if actual catastrophe losses are less than or exceed those amounts, respectively. In 2013, Adjusted Operating Income was adjusted to include a minimum amount of catastrophe losses, thus lowering the actual performance. In 2012 and 2014, no such adjustment was made.
Average common shareholders’ equity is subject to adjustments to be consistent with the financial reporting used in establishing the measure and to exclude the effects of acquiring and selling businesses and was adjusted accordingly in 2014.
Performance Stock Award Performance Measures for the2014-2016 Performance Cycle
Three Year Average Adjusted Operating Income Return on Equity: This measure is used to assess financial performance. It is calculated as the ratio of average Adjusted Operating Income divided by the average of common shareholders’ equity, excluding the effects of unrealized net capital gains and losses, at December 31,
122
2013 and at the end of each year in the three year cycle. For a description of how Adjusted Operating Income is determined, see page 121.
Average Adjusted Operating Income is adjusted to include a minimum or maximum amount of after-tax catastrophe losses if the average of actual catastrophe losses in the three year cycle are less than or exceed those amounts, respectively.
Average common shareholders’ equity is subject to adjustments to be consistent with the financial reporting used in establishing the measure and to exclude the effects of acquiring and selling businesses.
Compensation Committee Interlocks and Insider Participation
For the Period Prior to April 1, 2014
Prior to the transaction with Resolution, the Board of Directors of Lincoln Benefit did not have a compensation committee. All compensation decisions were made by The Allstate Corporation, as the ultimate parent company of Lincoln Benefit. No executive officer of Lincoln Benefit served as a member of the compensation committee of another entity for which any executive officer served as a director for Lincoln Benefit.
For the Period Beginning April 1, 2014
In February 2015, the Board of Directors of Resolution Life Holdings, Inc. established a compensation committee, whose primary function is to assist the Board with its oversight role with respect to the compensation of Resolution Life Holdings, Inc.’s and its subsidiaries’ executive officers and other employees. No executive officer of Lincoln Benefit serves as a member of the compensation committee of another entity for which any executive officer served as a director for Lincoln Benefit.
Item 11(m). Security Ownership of Certain Beneficial Owners and Management
Security Ownership of Certain Beneficial Owners
The following table shows the number of Lincoln Benefit shares owned by any beneficial owner who owns more than five percent of any class of Lincoln Benefit’s voting securities.
| | | | | | |
Title of Class
(a) | | Name and Address of
Beneficial Owner
(b) | | Amount and Nature of
Beneficial Ownership
(c) | | Percent of
Class
(d) |
Capital Stock | | Resolution Life, Inc. One Station Place Metro Center, 7th Fl. Stamford, CT 06902 | | 25,000 | | 100% |
| | | |
N/A | | Resolution Life Holdings, Inc. One Station Place Metro Center, 7th Fl. Stamford, CT 06902 | | Indirect voting and investment power of shares owned by Resolution Life, Inc. | | N/A |
| | | |
N/A | | Resolution Life L.P. Canon’s Court 22 Victoria Street Hamilton, HM 12 Bermuda | | Indirect voting and investment power of shares owned by Resolution Life, Inc. | | N/A |
123
| | | | | | |
Title of Class
(a) | | Name and Address of
Beneficial Owner
(b) | | Amount and Nature of
Beneficial Ownership
(c) | | Percent of
Class
(d) |
N/A | | Resolution Life GP, Ltd. Canon’s Court 22 Victoria Street Hamilton, HM 12 Bermuda | | Indirect voting and investment power of shares owned by Resolution Life, Inc. | | N/A |
| | | |
N/A | | Resolution Capital Limited 25 Sackville Street London W1S 3AX United Kingdom | | Indirect voting and investment power of shares owned by Resolution Life, Inc. | | N/A |
| | | |
N/A | | Clive Cowdery 25 Sackville Street London W1S 3AX United Kingdom | | Indirect voting and investment power of shares owned by Resolution Life, Inc. | | N/A |
124
Security Ownership of Directors and Executive Officers
The following table shows the number of shares of stock in Lincoln Benefit or its parents beneficially owned by each director and named executive officer of Lincoln Benefit individually, and by all executive officers and directors of Lincoln Benefit as a group. Shares reported as beneficially owned include certain shares held indirectly, as well as shares subject to stock options exercisable on or prior to April 13, 2015 and restricted stock units for which restrictions expire on or prior to April 13, 2015. The following share amounts are as of April 13, 2015.
| | | | | | |
Entity | | Title of Class of Equity
Securities | | Number of
Shares | | Statement Concerning Beneficial
Ownership* |
| Lincoln Benefit Life, Resolution Life, Inc., Resolution Life Holdings, Inc., Resolution Life L.P., Resolution Life GP Ltd., Resolution Life (Parallel) Partnership, Resolution Life (Parallel) GP Ltd. | | n/a | | n/a | | Lincoln Benefit Life is an indirect wholly-owned subsidiary of (i) Resolution Life L.P., which is controlled by its general partner Resolution Life GP Ltd. and (ii) Resolution Life (Parallel) Partnership, which is controlled by its managing partners, which includes Resolution Life (Parallel) GP Ltd. Resolution Life (Parallel) GP Ltd. is wholly-owned by Resolution Life GP Ltd. Resolution Life GP Ltd. is wholly-owned by Resolution Capital Limited, which is wholly-owned by Clive Cowdery. |
| Resolution Life L.P. | | n/a | | n/a | | Clive Cowdery has made an indirect commitment of $19.84 million to Resolution Life LP, which currently accounts for 1.8% of the current total $1.1 billion of aggregate commitment of Resolution Life L.P and Resolution Life (Parallel) Partnership. |
Changes in Control
On December 31, 2013, Resolution Life Holdings, Inc. and Resolution Life, Inc. entered into a Credit Agreement with Royal Bank of Canada (“RBC”), The Royal Bank of Scotland, PLC, RBC Capital Markets, RBS Securities Inc. and Lloyds Securities Inc. (the “Credit Agreement”). On April 1, 2014, Resolution Life Holdings, Inc. and Resolution Life, Inc. entered into a Guarantee and Collateral Agreement with Royal Bank of Canada (the “Guarantee and Collateral Agreement”). Pursuant to the Guarantee and Collateral Agreement, Resolution Life Holdings, Inc. pledged the securities of Resolution Life, Inc. to the Secured Parties (as defined in the Guarantee and Collateral Agreement) in order to secure a term loan to Resolution Life, Inc. for the acquisition of Lincoln Benefit. Pursuant to the Credit Agreement and the Guarantee and Collateral Agreement, Resolution Life, Inc. also pledged the securities of Lincoln Benefit to the Secured Parties (as defined in the Guarantee and Collateral Agreement).
If Resolution Life, Inc. defaults on its obligations under the Credit Agreement, RBC (as collateral agent), will have the option to receive all of the Resolution Life, Inc. and Lincoln Benefit stock pledged the Credit Agreement and Guarantee and Collateral Agreement, including all voting and corporate rights to such stock.
125
| Item 11(n). | Transactions with Related Persons, Promoters and Certain Control Persons |
On April 1, 2014, all of the capital stock in Lincoln Benefit was acquired by Resolution Life, Inc. Prior to this transaction, Lincoln Benefit was a wholly-owned subsidiary of ALIC.
Transactions with Related Persons
Prior to the acquisition of Lincoln Benefit from Allstate Life Insurance Company by Resolution Life, Inc., Lincoln Benefit was a party to certain intercompany agreements involving amounts greater than $120,000 between Lincoln Benefit and the following companies:
| • | | Allstate Life Insurance Company (“ALIC”), the former direct parent of Lincoln Benefit; |
| • | | Allstate Insurance Company (“AIC”), a former indirect parent of Lincoln Benefit; |
| • | | Allstate Insurance Holdings, LLC (“AIH”), a former indirect parent of Lincoln Benefit; and |
| • | | The Allstate Corporation (“AllCorp”), the former ultimate indirect parent of Lincoln Benefit. |
| | | | | | | | | | | | | | | | | | | | | | | | |
| Transaction Description | | Approximate dollar
value of the amount
involved in the
transaction, per
fiscal year | | | Related Person(s) involved in the transaction1 and the
approximate dollar value of the
Related Person’s interest in the transaction
($) | |
| | | | | | ($) | | | ALIC | | | AIC | | | AIH | | | AllCorp | |
| Amended and Restated Service and Expense Agreement between Allstate Insurance Company, The Allstate Corporation and certain affiliates effective January 1, 2004, as amended by Amendment No. 1 effective January 1, 2009, and as supplemented by New York Insurer Supplement to Amended and Restated Service and Expense Agreement between Allstate Insurance Company, The Allstate Corporation, Allstate Life Insurance Company of New York and Intramerica Life Insurance Company, effective March 5, 2005. | | | 2012 2013 2014 | | | | 4,010,414,793 4,594,114,658 4,351,172,343 | 2 2 2 | | | 206,609,277 219,150,824 157,557,526 | 2 2 2 | | | 1,675,534,870 1,783,214,605 1,451,026,309 | 2 2 2 | | | 0 0 0 | | | | 10,233,063 12,439,714 10,193,363 | 2 2 2 |
Tax Sharing Agreement among The Allstate Corporation and certain affiliates dated as of November 12, 1996, as supplemented by Supplemental Intercompany Tax Sharing Agreement between Allstate Life Insurance Company and Lincoln Benefit Life Company effective December 21, 2000. | | | 2012 2013 2014 | | | | 261,856,736 403,752,626 991,183,410 | 3 3 3 | | | (51,081,452 (28,599,632 (118,361,063 | ) ) ) | | | 402,335,848 805,259,656 822,197,758 | | | | 0 0 0 | | | | (133,557,504 (361,417,973 16,223,615 | ) ) |
126
| | | | | | | | | | | | | | | | | | | | | | | | |
| Transaction Description | | Approximate dollar
value of the amount
involved in the
transaction, per
fiscal year | | | Related Person(s) involved in the transaction1 and the
approximate dollar value of the
Related Person’s interest in the transaction
($) | |
| | | | | | ($) | | | ALIC | | | AIC | | | AIH | | | AllCorp | |
| | | | | | | |
| Agreement for the Settlement of State and Local Tax Credits among Allstate Insurance Company and certain affiliates effective January 1, 2007. | | | 2012 2013 2014 | | | | 0 0 3,024,265 | 4 | | | 0 0 287,214 | 4 | | | 0 0 2,645,462 | 4 | | | N/A | | | | N/A | |
| | | | | | | |
| Assignment and Delegation of Administrative Services Agreements, Underwriting Agreements, and Selling Agreements entered into as of September 1, 2011 between ALFS, Inc., Allstate Life Insurance Company, Allstate Life Insurance Company of New York, Allstate Distributors, LLC, Charter National Life Insurance Company, Intramerica Life Insurance Company, Allstate Financial Services, LLC, and Lincoln Benefit Life Company. | | | 2012 2013 2014 | | | | 10,741,767 12,927,091 4,119,257 | 5 5 5 | | | (4,042,532 (4,938,625 (140,501 | ) ) ) | | | N/A | | | | N/A | | | | N/A | |
| | | | | | | |
| Investment Management Agreement among Allstate Investments, LLC, Allstate Insurance Company, The Allstate Corporation and certain affiliates effective January 1, 2007. | | | 2012 2013 2014 | | | | 172,138,967 174,642,625 129,435,627 | 2 2 2 | | | 85,874,525 82,062,732 49,913,891 | 2 2 2 | | | 73,118,384 79,465,291 68,450,895 | 2 2 2 | | | N/A | | | | 67,330 0 0 | 2 |
| Reinsurance Agreements between Lincoln Benefit Life Company and Allstate Life Insurance Company: Coinsurance Agreement effective December 31, 2001; Modified Coinsurance Agreement effective December 31, 2001; Modified Coinsurance Agreement effective December 31, 2001. | | | 2012 2013 2014 | | | | 447,340,588 528,831,836 (97,926,475 | 6 6 )7 | | | 447,340,588 (528,831,836 (97,926,475 | 6 )6 )7 | | | N/A | | | | N/A | | | | N/A | |
| | | | | | | |
| Reinsurance Agreement between Lincoln Benefit Life Company and Lincoln Benefit Reinsurance Company effective September 30, 2012. | | | 2012 2013 2014 | | | | 0 201,639 (99,556 | 6 )7 | | | N/A | | | | N/A | | | | N/A | | | | N/A | |
| | | | | | | |
| Administrative Services Agreement by and between Lincoln Benefit Life Company and Allstate Life Insurance Company, dated April 1, 2014. | | | 2014 | | | | 8,459,377 | 8 | | | 8,459,377 | 8 | | | N/A | | | | N/A | | | | N/A | |
127
| | | | | | | | | | | | | | | | | | | | | | | | |
| Transaction Description | | Approximate dollar
value of the amount
involved in the
transaction, per
fiscal year | | | Related Person(s) involved in the transaction1 and the
approximate dollar value of the
Related Person’s interest in the transaction
($) | |
| | | | | | ($) | | | ALIC | | | AIC | | | AIH | | | AllCorp | |
| | | | | | | |
| Amended and Restated Reinsurance Agreement by and between Lincoln Benefit Life Company and Allstate Life Insurance Company, effective April 1, 2014. | | | 2014 | | | | 83,830,677 | 6 | | | 83,830,677 | 6 | | | N/A | | | | N/A | | | | N/A | |
| (1) | Each identified Related Person is a Party to the transaction. |
| (2) | Gross amount of expense received under the transaction. |
| (3) | Total amounts paid to the Internal Revenue Service. |
| (4) | Value of transfer transactions. |
| (5) | Gross amount of the transaction. |
| (6) | Net reinsurance income. |
| (7) | Net reinsurance expense. |
| (8) | Gross amount of the transaction. |
After Lincoln Benefit was acquired by Resolution Life, Inc., Lincoln Benefit is a party to certain intercompany agreements involving amounts greater than $120,000 between Lincoln Benefit and the following companies:
| | • | | Resolution Life, Inc. (���RLI”), the direct parent of Lincoln Benefit. |
| | • | | Resolution Life Holdings, Inc. (“RLH”), an indirect parent of Lincoln Benefit. |
| | • | | Lancaster Re Captive Insurance Company (“Lancaster Re”), a direct subsidiary of Lincoln Benefit |
| | • | | Lanis LLC, an affiliate of Lincoln Benefit |
| | | | | | | | | | | | | | | | | | | | |
| Transaction Description | | Approximate dollar
value of the amount
involved in the
transaction, per
fiscal year | | | Approximate dollar value of the amount
involved in the
transaction, per
fiscal year | |
| | | | | | ($) | | | RLH | | | RLI | | | Lanis LLC | |
| Services Agreement between Resolution Life, Inc. and Lincoln Benefit Life Company effective April 1, 2014 | |
| 2014
|
| |
| (21,087,752
| )¹
| | | N/A | | | | 21,087,752¹ | | |
| N/A
|
|
| | | | | | |
| Surplus Note Purchase Agreement between Lancaster Re Captive Insurance Company and Lanis LLC effective April 1, 2014 | | | 2014 | | | | 15,711,000 | | | | N/A | | | | N/A | | | | 15,711,000² | |
| | | | | | |
| Vehicle Note Purchase Agreement between Lancaster Re Captive Insurance Company and Lanis LLC effective April 1, 2014 | | | 2014 | | | | 15,711,000 | | | | N/A | | | | N/A | | | | (15,711,000 | )² |
| | | | | | |
| Fee Letter between Lincoln Benefit Life Company and Lanis LLC effective April 1, 2014 | | | 2014 | | | | (4,584,514 | )3 | | | N/A | | | | N/A | | | | 4,584,514 | 3 |
128
| 1 | Total expense amount reimbursed / (paid) under the transaction |
| 2 | Surplus/Vehicle Note Interest received (paid) |
| 3 | Payment of risk spread fee |
The agreements listed in the table immediately above relate to a transaction that Resolution Life, Inc., Resolution Life Holdings, Inc., Lancaster Re Captive Insurance Company, Lannis LLC and Lincoln Benefit Life Company have entered into with Hannover Life Reassurance Company of America, an unrelated party, in order to finance a portion of the insurance reserves held by Lincoln Benefit with respect to universal life insurance policies with secondary guarantees written by Lincoln Benefit.
Review and Approval of Related Person Transactions
For the Period Prior to April 1, 2014
Prior to the acquisition of Lincoln Benefit from Allstate Life Insurance Company by Resolution Life, Inc., all intercompany agreements to which Lincoln Benefit was a party were approved by Lincoln Benefit’s Board of Directors as well as by the board of any other affiliate of The Allstate Corporation that was a party to the agreement. When required, intercompany agreements were submitted for approval to the Nebraska Department of Insurance, Lincoln Benefit’s domestic regulator, and any additional states in which Lincoln Benefit might be commercially domiciled pursuant to the applicable state’s insurance holding company systems act. This process was documented in an internal procedure that captured the review and approval process of all intercompany agreements. All approvals were maintained in Lincoln Benefit’s corporate records.
Prior to the transaction with Resolution, while there was no formal process for the review and approval of related person transactions between unaffiliated entities specific to Lincoln Benefit, all directors and executive officers of Lincoln Benefit were subject to the Allstate Code of Ethics (“Allstate Code”). The Allstate Code includes a written conflict of interest policy that was adopted by the Board of Directors of the Allstate Corporation, the former ultimate parent company of Lincoln Benefit. Any potential relationship or activity that could impair independent thinking and judgment, including holding a financial interest in a business venture that is similar to Allstate, or in a business that has a relationship with Allstate, was required to be disclosed to Human Resources. Human Resources worked with representatives from the Law Department, including Enterprise Business Conduct, to determine whether an actual conflict of interest existed. Each director and executive officer was required to sign a Code of Ethics certification annually.
For the Period Beginning April 1, 2014
All intercompany agreements to which Lincoln Benefit is a part are approved by Lincoln Benefit’s Board of Directors as well as by the board of any other affiliate of Lincoln Benefit that is a party to the agreement. When required, intercompany agreements are submitted for approval to the Nebraska Department of Insurance, Lincoln Benefit’s domestic regulator, and any additional states in which Lincoln Benefit might be commercially domiciled pursuant to the applicable state’s insurance holding company systems act. This process is documented in an internal procedure that captures the review and approval process of all intercompany agreements. All approvals are maintained in Lincoln Benefit’s corporate records.
Subsequent to the acquisition by Resolution Life, Inc., while there is no formal process for the review and approval of related person transactions between unaffiliated entities specific to Lincoln Benefit, all directors, officers and employees of Lincoln Benefit are subject to Resolution Life’s Code of Conduct and its Conflict of Interest Guideline. The Resolution Code of Conduct includes a written conflict of interest policy that was adopted by the Board of Directors of Resolution Life, the parent company of Lincoln Benefit, and the Board of Directors of Lincoln Benefit. Any potential relationship or activity that could impair independent thinking and judgment, including holding a financial interest in a business venture that is similar to Lincoln Benefit and/or Resolution Life, or in a business that has a relationship with either entity, is required to be disclosed to Human
129
Resources and Compliance. Human Resources works with representatives from the Law Department, including Compliance, and the Audit Committee, if necessary, to determine whether an actual conflict of interest existed. All directors, officers and employees are required to sign a Code of Conduct certification and complete a Conflict of Interest Questionnaire annually.
Independence Standards for Directors
Although not subject to the independence standards of the New York Stock Exchange, for purposes of this registration statement, Lincoln Benefit has applied the independence standards required for listed companies of the New York Stock Exchange to the Board of Directors. Applying these standards, Lincoln Benefit has determined that five of its directors are independent: Stephen Campbell, Richard Carbone, Ann Frohman, Robert Stein and Grace Vandecruze.
OTHER INFORMATION
A section entitled “Experts” is added to your prospectus as follows:
EXPERTS
The financial statements as of and for each of the two years in the period ended December 31, 2013 and for the period from January 1, 2014 through March 31, 2014 of Lincoln Benefit Life Company included in this Prospectus and the related financial statement schedule included elsewhere in the Registration Statement, have been audited by Deloitte & Touche LLP, an independent registered public accounting firm, as stated in their report appearing herein and elsewhere in the Registration Statement. Such financial statements and financial statement schedule are included in reliance upon the report of such firm given upon their authority as experts in accounting and auditing.
The financial statements as of December 31, 2014 and for the period from April 1, 2014 through December 31, 2014 of Lincoln Benefit Life Company included in this Prospectus have been so included in reliance on the report of PricewaterhouseCoopers LLP, an independent registered public accounting firm, given on the authority of said firm as experts in auditing and accounting.
The following change is made to the prospectuses for the LBL Advantage, Consultant II and Premier Planner:
Under the “More Information” section, the subsection entitled “Legal Matters” is deleted and replaced with the following:
LEGAL MATTERS
Certain matters of Nebraska law pertaining to the Contract, including the validity of the Contract and our right to issue the Contract under Nebraska law, have been passed upon by Lamson Dugan & Murray LLP, Omaha, Nebraska.
PRINCIPAL UNDERWRITER
Allstate Distributors, L.L.C. (“ADLLC”) serves as distributor of the securities registered herein. The securities offered herein are sold on a continuous basis, and there is no specific end date for the offering. ADLLC is a registered broker dealer under the Securities and Exchange Act of 1934, as amended, and is a member of the Financial Industry Regulatory Authority. ADLLC is not required to sell any specific number or dollar amount of securities, but will use its best efforts to sell the securities offered.
130
ADMINISTRATION
We have primary responsibility for all administration of the Contracts and the Variable Account. We entered into an administrative services agreement with Allstate Life Insurance Company (“ALIC”). ALIC has entered into an administrative services agreement with The Prudential Insurance Company of America (“PICA”), pursuant to which PICA or an affiliate provides administrative services to the Variable Account and the Contracts on our behalf. In addition, PICA entered into a master services agreement with se2, LLC, of 5801 SW 6th Avenue, Topeka, Kansas 66636, whereby se2, LLC provides certain business process outsourcing services with respect to the Contracts. se2, LLC may engage other service providers to provide certain administrative functions. These service providers may change over time, and as of December 31, 2014, consisted of the following: NTT DATA Process Services, LLC (administrative services) located at PO Box 4201, Boston, MA 02211; RR Donnelley Global Investment Markets (compliance printing and mailing) located at 111 South Wacker Drive, Chicago, IL 60606; Jayhawk File Express, LLC (file storage and document destruction) located at 601 E. 5th Street, Topeka, KS 66601-2596; Co-Sentry.net, LLC (back-up printing and disaster recovery) located at 9394 West Dodge Rd, Suite 100, Omaha, NE 68114; Convey Compliance Systems, Inc. (withholding calculations and tax statement mailing) located at 3650 Annapolis Lane, Suite 190, Plymouth, MN 55447; Spangler Graphics, LLC (compliance mailings) located at 29305 44th Street, Kansas City, KS 66106; Veritas Document Solutions, LLC (compliance mailings) located at 913 Commerce Ct, Buffalo Grove, IL 60089; Records Center of Topeka, a division of Underground Vaults & Storage, Inc. (back-up tapes storage) located at 1540 NW Gage Blvd. #6, Topeka, KS 66618; Venio LLC, d/b/a Keane (lost shareholder search) located at PO Box 1508, Southeastern, PA 19399-1508; DST Systems, Inc. (FAN mail, positions, prices) located at 333 West 11 Street, 5th Floor, Kansas City, MO 64105.
In administering the Contracts, the following services are provided, among others:
| • | | maintenance of Contract Owner records; |
| • | | Contract Owner services; |
| • | | calculation of unit values; |
| • | | maintenance of the Variable Account; and |
| • | | preparation of Contract Owner reports. |
In connection with Resolution Life’s acquisition of Lincoln Benefit, Resolution Life, Inc. and Allstate Life entered into a Transition Services Agreement (the “TSA”), pursuant to which Allstate Life will continue to provide certain administrative services for the Recaptured Business for a period of twelve to twenty-four months after the closing. Following termination of the TSA, we plan to outsource the administration of the Recaptured Business to third-party administrators. In particular, the administration of our deferred annuity business was outsourced to se2, LLC, an unaffiliated third-party service provider, effective February 23, 2015. The remaining administration will be outsourced to Alliance–One Services, Inc., an unaffiliated third-party service provider, later this year.
131
                    Supplement dated April 1, 2015, to the
                     Prospectus for your Variable Annuity
                                   Issued by

                         LINCOLN BENEFIT LIFE COMPANY

This supplement amends certain disclosure contained in the prospectus for your
Variable Annuity contract issued by Lincoln Benefit Life Company.

Effective April 13, 2015 (the Closure Date), the following variable sub-account
available in your Variable Annuity will be closed to all contract owners except
those contract owners who have contract value invested in the variable
sub-account as of the Closure Date:

      Janus Aspen Series Perkins Mid Cap Value Portfolio - Service Shares

Contract owners who have contract value invested in the variable sub-account as
of the Closure Date may continue to submit additional investments into the
variable sub-account thereafter, although they will not be permitted to invest
in the variable sub-account if they withdraw or otherwise transfer their entire
contract value from the variable sub-account following the Closure Date.
Contract owners who do not have contract value invested in the variable
sub-account as of the Closure Date will not be permitted to invest in the
variable sub-account thereafter.

Dollar cost averaging, category models and/or auto-rebalancing programs, if
elected by a Contract owner prior to the Closure Date, will not be affected by
the closure unless a contract owner withdraws or otherwise transfers his entire
Account Value from the sub-account.

If you have any questions, please contact your financial representative or our
Variable Annuities Service Center at (800) 457-7617. Our representatives are
available to assist you Monday through Friday between 7:30 a.m. and 5:00 p.m.
Central time.

   Please keep this supplement for future reference together with your
prospectus. No other action is required of you.
                   Supplement dated January 3, 2014, to the
                     Prospectus for your Variable Annuity
                                   Issued by

                         LINCOLN BENEFIT LIFE COMPANY

This supplement amends certain disclosure contained in the prospectus for your
Variable Annuity contract issued by Lincoln Benefit Life Company.

Effective as of January 31, 2014 (the Closure Date), the following variable
sub-accounts available in your Variable Annuity will be closed to all contract
owners except those contract owners who have contract value invested in the
variable sub-accounts as of the Closure Date:

   Alger Mid Cap Growth -- Class S
   Alger Mid Cap Growth -- Class I-2

Contract owners who have contract value invested in these variable sub-accounts
as of the Closure Date may continue to submit additional investments into the
variable sub-accounts thereafter, although they will not be permitted to invest
in the variable sub-accounts if they withdraw or otherwise transfer their
entire contract value from the variable sub-accounts following the Closure
Date. Contract owners who do not have contract value invested in the variable
sub-accounts as of the Closure Date will not be permitted to invest in these
variable sub-accounts thereafter.

If you have any questions, please contact your financial representative or our
Variable Annuities Service Center at (800) 457-7617. Our representatives are
available to assist you Monday through Friday between 7:30 a.m. and 5:00 p.m.
Central time.

Dollar cost averaging and/or auto-rebalancing, if elected by a contract owner
prior to the Closure Date, will not be affected by the closure.


      Please keep this supplement for future reference together with your
                prospectus. No other action is required of you.
                         LINCOLN BENEFIT LIFE COMPANY

                      Supplement Dated September 30, 2013
                To the following Prospectuses, as supplemented

CONSULTANT SOLUTIONS (CLASSIC, PLUS, ELITE, SELECT) PROSPECTUS DATED MAY 1, 2013
                   CONSULTANT I PROSPECTUS DATED MAY 1, 2013
                  LBL ADVANTAGE PROSPECTUS DATED MAY 1, 2004
                  CONSULTANT II PROSPECTUS DATED MAY 1, 2004
                 PREMIER PLANNER PROSPECTUS DATED MAY 1, 2004
                INVESTOR'S SELECT PROSPECTUS DATED MAY 1, 2007

The following information supplements the prospectus for your variable annuity
contract issued by Lincoln Benefit Life Company.

The following paragraphs are added to the "Lincoln Benefit Life Company"
provision under the "More Information" section or the "Description of Lincoln
Benefit Life Company and the Separate Account" section of your prospectus:

On July 17, 2013, Allstate Life entered into an agreement with Resolution Life
Holdings, Inc. ("Resolution"), a Delaware corporation established by Resolution
Life L.P., pursuant to which Allstate Life agreed to sell Lincoln Benefit to
Resolution or a wholly-owned subsidiary of Resolution (the "Transaction"). The
Prudential Insurance Company of America or an affiliate will continue to
reinsure and administer the Variable Account and the Contracts. The benefits
and provisions of the Contracts will not be changed by the Transaction. Also,
the Transaction will not change the fact that Lincoln Benefit is the named
insurer under your Contract. Following the Transaction, Lincoln Benefit will no
longer be an affiliate of Allstate Life.

The Transaction and certain related agreements are subject to required
regulatory approvals. Subject to the receipt of such regulatory approvals, the
Transaction is targeted to close in the 4 th quarter of 2013.

Upon receipt of regulatory approvals, Lincoln Benefit will amend and restate
its existing reinsurance arrangements with Allstate Life. Lincoln Benefit will
recapture, and Allstate Life no longer will reinsure: (i) all fixed deferred
annuity, value adjusted deferred annuity and indexed deferred annuity business
written by Lincoln Benefit, (ii) all of the life insurance business written by
Lincoln Benefit through independent life insurance producers other than certain
specified life insurance policies and (iii) all of the net liability of Lincoln
Benefit with respect to the accident and health and long-term care insurance
business written by Lincoln Benefit (the "Recapture"). The benefits and
provisions of the Contracts will not be changed by the Recapture, and the
Recapture will not change the fact that Lincoln Benefit is the named insurer
under your Contract.

Pursuant to the Recapture, Allstate Life will transfer to Lincoln Benefit, for
inclusion in its general account reserves, cash and specified assets with an
aggregate statutory book value equal to net statutory general account reserves
attributable to the recaptured business, adjusted for the final settlement
amount under the applicable existing reinsurance agreements between Lincoln
Benefit and Allstate Life that are being amended and restated in connection
with the Transaction.

If you have any questions, please contact your financial representative or our
Variable Annuity Service Center at (800) 457-7617. Our representatives are
available to assist you from 7:30 a.m. to 5 p.m. Central time.

Please read the prospectus supplement carefully and then file it with your
important papers. No other action is required of you.
THE CONSULTANT SOLUTIONS VARIABLE ANNUITIES
(CLASSIC, PLUS, ELITE, SELECT)

LINCOLN BENEFIT LIFE COMPANY
STREET ADDRESS: 5801 SW 6TH AVE. TOPEKA, KS 66606-0001
MAILING ADDRESS: P.O. BOX 758561, TOPEKA, KS 66675-8561
TELEPHONE NUMBER: 800-457-7617 / FAX NUMBER: 1-785-228-4584
1940 ACT FILE NUMBER: 811-07924
1933 ACT FILE NUMBER: 333-109688

<R>
                                                   PROSPECTUS DATED MAY 1, 2015
</R>

Lincoln Benefit Life Company ("LINCOLN BENEFIT") is the issuer of the following
individual and group flexible premium deferred variable annuity contracts
(each, a "CONTRACT"):

    .  Consultant Solutions Classic

    .  Consultant Solutions Plus

    .  Consultant Solutions Elite

    .  Consultant Solutions Select

EFFECTIVE NOVEMBER 30, 2006, THIS PRODUCT IS NO LONGER BEING OFFERED FOR SALE.

This prospectus contains information about each Contract that you should know
before investing. Please keep it for future reference. Not all Contracts may be
available in all states or through your sales representative. Please check with
your sales representative for details.

Each Contract currently offers several investment alternatives ("INVESTMENT
ALTERNATIVES"). The Investment Alternatives include up to 2 fixed account
options ("FIXED ACCOUNT OPTIONS"), depending on the Contract, and include 46*
variable sub-accounts ("VARIABLE SUB-ACCOUNTS") of the Lincoln Benefit Life
Variable Annuity Account ("VARIABLE ACCOUNT"). Each Variable Sub-account
invests exclusively in shares of the following underlying funds ("FUNDS"):

<R>
INVESCO VARIABLE INSURANCE FUNDS           MFS(R) VARIABLE INSURANCE TRUST II
THE ALGER PORTFOLIOS                       OPPENHEIMER VARIABLE ACCOUNT FUNDS
FIDELITY(R) VARIABLE INSURANCE PRODUCTS    PIMCO VARIABLE INSURANCE TRUST
GOLDMAN SACHS VARIABLE INSURANCE TRUST     THE RYDEX VARIABLE TRUST
JANUS ASPEN SERIES                         T. ROWE PRICE EQUITY SERIES, INC.
LEGG MASON PARTNERS VARIABLE EQUITY TRUST  VAN ECK VIP TRUST
LEGG MASON PARTNERS VARIABLE INCOME TRUST  THE UNIVERSAL INSTITUTIONAL FUNDS, INC.
MFS(R) VARIABLE INSURANCE TRUST/(SM)/
</R>

*  Certain Variable Sub-Accounts are closed to Contract owners not invested in
   the specified Variable Sub-Accounts by a designated date. Please see pages
   34-36 for more information.

Each Fund has multiple investment Portfolios ("PORTFOLIOS"). Not all of the
Funds and/or Portfolios, however, may be available with your Contract. You
should check with your sales representative for further information on the
availability of the Funds and/or Portfolios. Your annuity application will list
all available Portfolios.

For CONSULTANT SOLUTIONS PLUS CONTRACTS, each time you make a purchase payment,
we will add to your Contract value ("CONTRACT VALUE") a credit enhancement
("CREDIT ENHANCEMENT") of up to 5% (depending on the issue age and your total
purchase payments) of such purchase payment. Expenses for this Contract may be
higher than a Contract without the Credit Enhancement. Over time, the amount of
the Credit Enhancement may be more than offset by the fees associated with the
Credit Enhancement.

<R>
WE (Lincoln Benefit) have filed a Statement of Additional Information, dated
May 1, 2015, with the Securities and Exchange Commission ("SEC"). It contains
more information about each Contract and is incorporated herein by reference,
which means that it is legally a part of this prospectus. Its table of contents
appears on page 76 of this prospectus. For a free copy, please write or call us
at the address or telephone number above, or go to the SEC's Web site
(http://www.sec.gov). You can find other information and documents about us,
including documents that are legally part of this prospectus, at the SEC's Web
site.
</R>

           THE SECURITIES AND EXCHANGE COMMISSION HAS NOT APPROVED OR
           DISAPPROVED THE SECURITIES DESCRIBED IN THIS PROSPECTUS, NOR HAS IT
           PASSED ON THE ACCURACY OR THE ADEQUACY OF THIS PROSPECTUS. ANYONE
           WHO TELLS YOU OTHERWISE IS COMMITTING A FEDERAL CRIME.

IMPORTANT  THE CONTRACTS MAY BE DISTRIBUTED THROUGH BROKER-DEALERS THAT HAVE
 NOTICES   RELATIONSHIPS WITH BANKS OR OTHER FINANCIAL INSTITUTIONS OR BY
           EMPLOYEES OF SUCH BANKS. HOWEVER, THE CONTRACTS ARE NOT DEPOSITS
           IN, OR OBLIGATIONS OF, OR GUARANTEED OR ENDORSED BY, SUCH
           INSTITUTIONS OR ANY FEDERAL REGULATORY AGENCY. INVESTMENT IN THE
           CONTRACTS INVOLVES INVESTMENT RISKS, INCLUDING POSSIBLE LOSS OF
           PRINCIPAL.

           THE CONTRACTS ARE NOT FDIC INSURED.
TABLE OF CONTENTS

<R>
                                                                           PAGE
                                                                           ----
OVERVIEW
   Important Terms........................................................   1
   Overview of Contracts..................................................   3
   The Contracts at a Glance..............................................   4
   How the Contracts Work.................................................   8
   Expense Tables.........................................................   9
   Financial Information..................................................  12
CONTRACT FEATURES
   The Contracts..........................................................  12
   Purchases..............................................................  14
   Contract Loans for 403(b) Contracts....................................  16
   Contract Value.........................................................  17
   Investment Alternatives................................................  32
       The Variable Sub-accounts..........................................  32
       The Fixed Account Options..........................................  36
       Transfers..........................................................  41
   Expenses...............................................................  44
   Access to Your Money...................................................  49
   Income Payments........................................................  50
   Death Benefits.........................................................  56
OTHER INFORMATION
   More Information.......................................................  63
   Taxes..................................................................  67
   About Lincoln Benefit Life Company.....................................  75
STATEMENT OF ADDITIONAL INFORMATION TABLE OF CONTENTS                       76
APPENDIX A - CONTRACT COMPARISON CHART                                     A-1
APPENDIX B - MARKET VALUE ADJUSTMENT                                       B-1
APPENDIX C - EXAMPLE OF CALCULATION OF INCOME PROTECTION BENEFIT           C-1
APPENDIX D - WITHDRAWAL ADJUSTMENT EXAMPLE - DEATH BENEFITS                D-1
APPENDIX E - CALCULATION OF ENHANCED EARNINGS DEATH BENEFIT                E-1
APPENDIX F - WITHDRAWAL ADJUSTMENT EXAMPLE - ACCUMULATION BENEFIT          F-1
APPENDIX G - SUREINCOME WITHDRAWAL BENEFIT OPTION CALCULATION EXAMPLES     G-1
APPENDIX H - ACCUMULATION UNIT VALUES                                      H-1
</R>

                                      (i)
IMPORTANT TERMS

This prospectus uses a number of important terms that you may not be familiar
with. The index below identifies the page that describes each term.

<R>
                                                                          PAGE
                                                                          -----
AB Factor................................................................    19
Accumulation Benefit.....................................................    18
TrueReturn Accumulation Benefit Option...................................    18
Accumulation Phase.......................................................     8
Accumulation Unit........................................................    17
Accumulation Unit Value..................................................    17
Annual Increase Death Benefit Option.....................................     5
Annuitant................................................................    13
Automatic Additions Program..............................................    14
Automatic Portfolio Rebalancing Program..................................    43
Beneficiary..............................................................    13
Benefit Base.............................................................    19
Benefit Payment..........................................................    27
Benefit Payment Remaining................................................    27
Benefit Year.............................................................    26
Co-Annuitant.............................................................    13
*Contract................................................................    12
Contract Anniversary.....................................................     5
Contract Owner ("You")...................................................    18
Contract Value...........................................................    28
Contract Year............................................................     5
Credit Enhancement.......................................................    15
Dollar Cost Averaging Program............................................    43
Due Proof of Death.......................................................    56
Enhanced Earnings Death Benefit Option...................................    58
Excess of Earnings Withdrawal............................................    59
Fixed Account Options....................................................    36
Free Withdrawal Amount...................................................    46
Funds.................................................................... Cover
Guarantee Period Account.................................................    37
Guarantee Options........................................................    18
Income Plan..............................................................    50
Income Protection Benefit Option.........................................    53
In-Force Earnings........................................................    58
In-Force Premium.........................................................    58
</R>

                                      1
<R>
                                                                           PAGE
                                                                          ------
Investment Alternatives..................................................     32
IRA Contract.............................................................      5
Issue Date...............................................................      8
Lincoln Benefit ("We")...................................................     63
Market Value Adjustment..................................................     38
Maximum Anniversary Value (MAV) Death Benefit Option.....................     57
Payout Phase.............................................................      8
Payout Start Date........................................................      8
Payout Withdrawal........................................................     52
Portfolios...............................................................     64
Qualified Contracts......................................................     61
Return of Premium ("ROP") Death Benefit..................................     56
Rider Application Date...................................................      5
Rider Anniversary........................................................     18
Rider Date...............................................................     18
Rider Fee................................................................      5
Rider Maturity Date......................................................     18
Rider Period.............................................................     18
Rider Trade-In Option.................................................... 25, 31
Right to Cancel..........................................................     15
SEC......................................................................  Cover
Settlement Value.........................................................     56
Spousal Protection Benefit (Co-Annuitant) Option.........................     45
Standard Fixed Account Option............................................ 36, 37
SureIncome Withdrawal Benefit Option.....................................     26
Systematic Withdrawal Program............................................     49
Tax Qualified Contracts..................................................     70
Transfer Period Account..................................................     35
Trial Examination Period.................................................     15
TrueBalance/SM/ Asset Allocation Program.................................     35
Withdrawal Benefit Factor................................................     27
Withdrawal Benefit Payout Phase..........................................     28
Valuation Date...........................................................     15
Variable Account.........................................................     63
Variable Sub-account.....................................................     32
</R>

*  In certain states a Contract may be available only as a group Contract. If
   you purchase a group Contract, we will issue you a certificate that
   represents your ownership and that summarizes the provisions of the group
   Contract. References to "Contract" in this prospectus include certificates,
   unless the context requires otherwise. References to "Contract" also include
   all four Contracts listed on the cover page of this prospectus, unless
   otherwise noted. However, we administer each Contract separately.

                                      2
OVERVIEW OF CONTRACTS

The Contracts offer many of the same basic features and benefits. They differ
primarily with respect to the charges imposed, as follows:

..  The CONSULTANT SOLUTIONS CLASSIC CONTRACT has a mortality and expense risk
   charge of 1.25%, an administrative expense charge of 0.10%*, and a
   withdrawal charge of up to 7% with a 7-year withdrawal charge period;

..  The CONSULTANT SOLUTIONS PLUS CONTRACT offers a Credit Enhancement of up to
   5% on purchase payments, a mortality and expense risk charge of 1.45%, an
   administrative expense charge of 0.10%*, and a withdrawal charge of up to
   8.5% with an 8-year withdrawal charge period;

..  The CONSULTANT SOLUTIONS ELITE CONTRACT has a mortality and expense risk
   charge of 1.60%, an administrative expense charge of 0.10%*, and a
   withdrawal charge of up to 7% with a 3-year withdrawal charge period; and

..  The CONSULTANT SOLUTIONS SELECT CONTRACT has a mortality and expense risk
   charge of 1.70%, an administrative expense charge of 0.10%*, and no
   withdrawal charges.

Other differences among the Contracts relate to available Fixed Account
Options. For a side-by-side comparison of these differences, please refer to
Appendix A of this prospectus.

*  The administrative expense charge may be increased, but will never exceed
   0.25%. Once your Contract is issued, we will not increase the administrative
   expense charge for your Contract.

                                      3
THE CONTRACTS AT A GLANCE

<R>
The following is a snapshot of the Contracts. Please read the remainder of this
prospectus for more information. Please note that these Contracts are no longer
available for new sales. The information provided in this section is for
informational purposes only.
</R>

FLEXIBLE PAYMENTS         WE ARE NO LONGER OFFERING NEW CONTRACTS. You can add
                          to your Contract as often and as much as you like,
                          but each subsequent payment must be at least $1,000
                          ($100 for automatic payments).

                          We reserve the right to accept a lesser initial
                          purchase payment amount for each Contract. We may
                          limit the cumulative amount of purchase payments to
                          a maximum of $1,000,000 in any Contract. You must
                          maintain a minimum Contract Value of $1,000.

                          For CONSULTANT SOLUTIONS PLUS CONTRACTS, each time
                          you make a purchase payment, we will add to your
                          Contract Value a Credit Enhancement of up to 5% of
                          such purchase payment.

TRIAL EXAMINATION PERIOD  You may cancel your Contract within 20 days of
                          receipt or any longer period as your state may
                          require ("TRIAL EXAMINATION PERIOD"). Upon
                          cancellation, we will return your purchase payments
                          adjusted, to the extent federal or state law
                          permits, to reflect the investment experience of any
                          amounts allocated to the Variable Account, including
                          the deduction of mortality and expense risk charges
                          and administrative expense charges. If you cancel
                          your Contract during the Trial Examination Period,
                          the amount we refund to you will not include any
                          Credit Enhancement. The amount you receive will be
                          less applicable federal and state income tax
                          withholding. See "Trial Examination Period" for
                          details.

EXPENSES                  Each Portfolio pays expenses that you will bear
                          indirectly if you invest in a Variable Sub-account.
                          You also will bear the following expenses:

                          CONSULTANT SOLUTIONS CLASSIC CONTRACTS

                          .  Annual mortality and expense risk charge equal to
                             1.25% of average daily net assets.

                          .  Withdrawal charges ranging from 0% to 7% of
                             purchase payments withdrawn.

                          CONSULTANT SOLUTIONS PLUS CONTRACTS

                          .  Annual mortality and expense risk charge equal to
                             1.45% of average daily net assets.

                          .  Withdrawal charges ranging from 0% to 8.5% of
                             purchase payments withdrawn.

                          CONSULTANT SOLUTIONS ELITE CONTRACTS

                          .  Annual mortality and expense risk charge equal to
                             1.60% of average daily net assets.

                          .  Withdrawal charges ranging from 0% to 7% of
                             purchase payments withdrawn.

                          CONSULTANT SOLUTIONS SELECT CONTRACTS

                          .  Annual mortality and expense risk charge equal to
                             1.70% of average daily net assets.

                          .  No withdrawal charges.

                          ALL CONTRACTS

                          .  Annual administrative expense charge of 0.10%
                             average daily net assets (up to 0.25% for future
                             Contracts).

                          .  Annual contract maintenance charge of $40
                             (reduced to $30 if Contract Value is at least
                             $2000, and waived in certain cases).

                          .  If you select the MAXIMUM ANNIVERSARY VALUE (MAV)
                             ENHANCED DEATH BENEFIT OPTION ("MAV DEATH BENEFIT
                             OPTION") you will pay an additional mortality and
                             expense risk charge of 0.20% (up to 0.50% for
                             Options added in the future).

                                      4
<R>

                         .  If you select the Annual Increase Enhanced Death
                            Benefit Option ("ANNUAL INCREASE DEATH BENEFIT
                            OPTION"), you will pay an additional mortality and
                            expense risk charge of 0.30% (up to 0.50% for
                            options added in the future).

                         .  If you select the ENHANCED EARNINGS DEATH BENEFIT
                            OPTION you will pay an additional mortality and
                            expense risk charge of 0.25% or 0.40% (up to 0.35%
                            or 0.50% for Options added in the future)
                            depending on the age of the oldest Owner, the
                            Co-Annuitant, and/or oldest Annuitant on the date
                            we receive the completed application or request to
                            add the benefit, whichever is later ("RIDER
                            APPLICATION DATE").

                         .  If you select the TRUERETURN ACCUMULATION BENEFIT
                            OPTION you would pay an additional annual fee
                            ("RIDER FEE") of 0.50% (up to 1.25% for Options
                            added in the future) of the BENEFIT BASE in effect
                            on each Contract anniversary ("CONTRACT
                            ANNIVERSARY") during the Rider Period. You may not
                            select the TrueReturn Accumulation Benefit Option
                            together with the SureIncome Withdrawal Benefit
                            Option.

                         .  If you select the SUREINCOME WITHDRAWAL BENEFIT
                            OPTION ("SUREINCOME OPTION") you would pay an
                            additional annual fee ("SUREINCOME OPTION FEE") of
                            0.50% (up to 1.25% for Options added in the
                            future) of the BENEFIT BASE on each Contract
                            Anniversary (See the SureIncome Option Fee
                            section). You may not select the SureIncome Option
                            together with the TrueReturn Accumulation Benefit
                            Option.

                         .  If you select the INCOME PROTECTION BENEFIT OPTION
                            you will pay an additional mortality and expense
                            risk charge of 0.50% (up to 0.75% for Options
                            added in the future) during the Payout Phase of
                            your Contract.

                         .  If you select the SPOUSAL PROTECTION BENEFIT
                            (CO-ANNUITANT) OPTION you would pay an additional
                            annual fee ("RIDER FEE") of 0.10% (up to 0.15% for
                            Options added in the future) of the Contract Value
                            ("CONTRACT VALUE") on each Contract Anniversary.
                            This Option is available only for Individual
                            Retirement Annuity ("IRA") Contracts qualified
                            under Section 408 of the Internal Revenue Code.
                            For Contracts purchased on or after May 1, 2005,
                            we may discontinue offering the Spousal Protection
                            Benefit (Co-Annuitant) Option at any time. NO
                            RIDER FEE IS CHARGED FOR THE SPOUSAL PROTECTION
                            BENEFIT (CO-ANNUITANT) OPTION FOR CONTRACT OWNERS
                            WHO ADDED THE OPTION PRIOR TO MAY 1, 2005.

                         .  Transfer fee equal to 1.00% (subject to increase
                            to up to 2.00%) of the amount transferred after
                            the 12/th/ transfer in any Contract Year
                            ("CONTRACT YEAR"), but not more than $25. A
                            Contract Year is measured from the date we issue
                            your Contract or a Contract Anniversary.

                         .  State premium tax (if your state imposes one)

                         .  NOT ALL OPTIONS ARE AVAILABLE IN ALL STATES

                         .  WE MAY DISCONTINUE OFFERING ANY OF THESE OPTIONS
                            AT ANY TIME.

INVESTMENT ALTERNATIVES  Each Contract offers several investment alternatives
                         including:

                         .  up to 2 Fixed Account Options that credit interest
                            at rates we guarantee, and

                         .  46 Variable Sub-accounts investing in Portfolios
                            offering professional money management by these
                            investment advisers:

                             .  Invesco Advisers, Inc.

                             .  Fred Alger Management, Inc.

                             .  Fidelity Management & Research Company

                             .  Goldman Sachs Asset Management, L.P.

                             .  Janus Capital Management LLC

                             .  MFS(TM) Investment Management
</R>

                                      5
                      .  OppenheimerFunds, Inc.

                      .  Pacific Investment Management Company LLC

                      .  Guggenheim Investments

                      .  Legg Mason Partners Fund Advisor, LLC

                      .  T. Rowe Price Associates, Inc.

                      .  Van Eck Associates Corporation

                      .  Morgan Stanley Investment Management Inc.

                  Not all Fixed Account Options are available in all states or
                  with all Contracts.

                  To find out current rates being paid on the Fixed Account
                  Option(s), or to find out how the Variable Sub-accounts have
                  performed, please call us at 800-457-7617.

SPECIAL SERVICES  For your convenience, we offer these special services:

                  .  AUTOMATIC PORTFOLIO REBALANCING PROGRAM

                  .  AUTOMATIC ADDITIONS PROGRAM

                  .  DOLLAR COST AVERAGING PROGRAM

                  .  SYSTEMATIC WITHDRAWAL PROGRAM

                  .  TRUEBALANCE/SM/ ASSET ALLOCATION PROGRAM

INCOME PAYMENTS   You can choose fixed income payments, variable income
                  payments, or a combination of the two. You can receive your
                  income payments in one of the following ways (you may select
                  more than one income plan):

                  .  life income with guaranteed number of payments

                  .  joint and survivor life income with guaranteed number of
                     payments

                  .  guaranteed number of payments for a specified period

                  .  life income with cash refund

                  .  joint life income with cash refund

                  .  life income with installment refund

                  .  joint life income with installment refund

                  In addition, we offer an Income Protection Benefit Option
                  that guarantees that your variable income payments will not
                  fall below a certain level.

                                      6
 DEATH BENEFITS  If you die before the Payout Start Date, we will pay a death
                 benefit subject to the conditions described in the Contract.
                 In addition to the death benefit included in your Contract
                 ("ROP DEATH BENEFIT"), the death benefit options we currently
                 offer include:

                 .  MAV DEATH BENEFIT OPTION;

                 .  ANNUAL INCREASE DEATH BENEFIT OPTION; AND

                 .  ENHANCED EARNINGS DEATH BENEFIT OPTION.

 TRANSFERS       Before the Payout Start Date, you may transfer your Contract
                 Value among the investment alternatives, with certain
                 restrictions. The minimum amount you may transfer is $100 or
                 the amount remaining in the investment alternative, if less.
                 The minimum amount that can be transferred into the Standard
                 Fixed Account or Market Value Adjusted Account Options is
                 $100.

                 A charge may apply after the 12/th/ transfer in each Contract
                 Year.

 WITHDRAWALS     You may withdraw some or all of your Contract Value at any
                 time during the Accumulation Phase and during the Payout
                 Phase in certain cases. In general, you must withdraw at
                 least $50 at a time. If any withdrawal reduces your Contract
                 Value to less than $1,000, we will treat the request as a
                 withdrawal of the entire Contract Value, unless the
                 SureIncome Withdrawal Benefit Option is in effect under your
                 Contract. Withdrawals taken prior to annuitization (referred
                 to in this prospectus as the Payout Phase) are generally
                 considered to come from the earnings in the Contract first.
                 If the Contract is tax-qualified, generally all withdrawals
                 are treated as distributions of earnings. Withdrawals of
                 earnings are taxed as ordinary income and, if taken prior to
                 age 59 1/2, may be subject to an additional 10% federal tax
                 penalty. A withdrawal charge and a MARKET VALUE ADJUSTMENT
                 may also apply.

                                      7
HOW THE CONTRACTS WORK

Each Contract basically works in two ways.

First, each Contract can help you (we assume you are the "CONTRACT OWNER") save
for retirement because you can invest in your Contract's investment
alternatives and generally pay no federal income taxes on any earnings until
you withdraw them. You do this during what we call the "ACCUMULATION PHASE" of
the Contract. The Accumulation Phase begins on the date we issue your Contract
(we call that date the "ISSUE DATE") and continues until the Payout Start Date,
which is the date we apply your money to provide income payments. During the
Accumulation Phase, you may allocate your purchase payments to any combination
of the Variable Sub-Accounts and/or Fixed Account Options. If you invest in a
Fixed Account Option, you will earn a fixed rate of interest that we declare
periodically. If you invest in any of the Variable Sub-Accounts, your
investment return will vary up or down depending on the performance of the
corresponding Portfolios.

<R>
Second, each Contract can help you plan for retirement because you can use it
to receive retirement income for life and/or for a pre-set number of years, by
selecting one of the income payment options (we call these "INCOME PLANS")
described on page 50-51. You receive income payments during what we call the
"PAYOUT PHASE" of the Contract, which begins on the Payout Start Date and
continues until we make the last payment required by the Income Plan you
select. During the Payout Phase, if you select a fixed income payment option,
we guarantee the amount of your payments, which will remain fixed. If you
select a variable income payment option, based on one or more of the Variable
Sub-Accounts, the amount of your payments will vary up or down depending on the
performance of the corresponding Portfolios. The amount of money you accumulate
under your Contract during the Accumulation Phase and apply to an Income Plan
will determine the amount of your income payments during the Payout Phase.
</R>

The timeline below illustrates how you might use your Contract.

                            [GRAPHIC APPEARS HERE]

Other income payment options are also available. See "INCOME PAYMENTS."

As the Contract Owner, you exercise all of the rights and privileges provided
by the Contract. If you die, any surviving Contract Owner or, if there is none,
the BENEFICIARY will exercise the rights and privileges provided by the
Contract. SEE "The Contracts." In addition, if you die before the Payout Start
Date, we will pay a death benefit to any surviving Contract Owner or, if there
is none, to your Beneficiary. SEE "Death Benefits."

Please call us at 800-457-7617 if you have any question about how the Contracts
work.

                                      8
EXPENSE TABLES

THE TABLE BELOW LISTS THE EXPENSES THAT YOU WILL BEAR DIRECTLY OR INDIRECTLY
WHEN YOU BUY A CONTRACT. THE TABLE AND THE EXAMPLES THAT FOLLOW DO NOT REFLECT
PREMIUM TAXES THAT MAY BE IMPOSED BY THE STATE WHERE YOU RESIDE. FOR MORE
INFORMATION ABOUT VARIABLE ACCOUNT EXPENSES, SEE "EXPENSES," BELOW. FOR MORE
INFORMATION ABOUT PORTFOLIO EXPENSES, PLEASE REFER TO THE PROSPECTUSES FOR THE
PORTFOLIOS.

CONTRACT OWNER TRANSACTION EXPENSES

Withdrawal Charge (as a percentage of purchase payments withdrawn)*

                                         Number of Complete Years Since We Received the Purchase Payment
                                                       Being Withdrawn/Applicable Charge:
                                         --------------------------------------------------------------
Contract:...............................   0       1       2       3       4      5    6       7    8+
Consultant Solutions Classic............   7%      7%      6%      5%      4%     3%   2%      0%    0%
Consultant Solutions Plus............... 8.5%    8.5%    8.5%    7.5%    6.5%   5.5%   4%    2.5%    0%
Consultant Solutions Elite:.............   7%      6%      5%      0%      0%     0%   0%      0%    0%
Consultant Solutions Select:............                             None

All Contracts:
Annual Contract Maintenance Charge......                             $40**
Transfer Fee............................ up to 2.00% of the amount transferred, but not more than $25***
Premium Taxes...........................                 0% to 4.00% of Purchase Payment****
Loan Interest Rate......................                           7.25%*****

*      Each Contract Year, you may withdraw a portion of your purchase payments
       (and/or your earnings, in the case of Charitable Remainder Trusts)
       without incurring a withdrawal charge ("Free Withdrawal Amount"). See
       "Withdrawal Charges" for more information.
**     Reduced to $30 if Contract Value is not less than $2000, and waived in
       certain cases. See "Expenses."
***    Applies solely to the 13th and subsequent transfers within a Contract
       Year, excluding transfers due to dollar cost averaging and automatic
       portfolio rebalancing. We are currently assessing a transfer fee of
       1.00% of the amount transferred, however, we reserve the right to raise
       the transfer fee to up to 2.00% of the amount transferred. The transfer
       fee will never be greater than $25.
****   Some States charge premium taxes that generally range from 0 to 4%. We
       are responsible for paying these taxes, and will deduct them from your
       Contract Value. Our current practice is to not charge for these taxes
       until the Payout Start Date or surrender of the Contract. See "Premium
       Taxes" for more information.
*****  For more information, see "Contract Loans for 403(b) Contracts." The
       loan interest rate is subject to change.

VARIABLE ACCOUNT ANNUAL EXPENSES (AS A PERCENTAGE OF AVERAGE DAILY NET ASSET
VALUE DEDUCTED FROM EACH VARIABLE SUB-ACCOUNT)

If you select the basic Contract without any optional benefits, your Variable
Account expenses would be as follows:

                                              Mortality and Expense Administrative  Total Variable Account
Basic Contract (without any optional benefit)      Risk Charge      Expense Charge*     Annual Expense
--------------------------------------------- --------------------- --------------- ----------------------
Consultant Solutions Classic.................         1.25%              0.10%               1.35%
Consultant Solutions Plus....................         1.45%              0.10%               1.55%
Consultant Solutions Elite...................         1.60%              0.10%               1.70%
Consultant Solutions Select..................         1.70%              0.10%               1.80%

*  We reserve the right to raise the administrative expense charge to 0.25%. If
   we increase this charge, we will amend the prospectus, accordingly. However,
   we will not increase the charge once we issue your Contract.

Each Contract also offers optional riders that may be added to the Contract.
For each optional rider you select, you would pay the following additional
mortality and expense risk charge associated with each rider.

MAV Death Benefit Option                 Currently 0.20%, up to a maximum of
                                         0.50% for Options added in the future *
Annual Increase Death Benefit Option     Currently 0.30%, up to a maximum of
                                         0.50% for Options added in the future *
Enhanced Earnings Death Benefit Option   Currently 0.25%, up to a maximum of
(issue age 0-70)                         0.35% for Options added in the future *
Enhanced Earnings Death Benefit Option   Currently 0.40%, up to a maximum of
(issue age 71-79)                        0.50% for Options added in the future *

If you select the Options with the highest possible combination of mortality
and expense risk charges during the Accumulation Phase, your Variable Account
expenses would be as follows, assuming current expenses:

Contract with the MAV Death Benefit Option,
Annual Increase Death Benefit Option, and                Mortality and Expense Administrative  Total Variable Account
Enhanced Earnings Death Benefit Option (issue age 71-79)     Risk Charge*      Expense Charge*     Annual Expense
-------------------------------------------------------- --------------------- --------------- ----------------------
Consultant Solutions Classic............................         2.15%              0.10%               2.25%
Consultant Solutions Plus...............................         2.35%              0.10%               2.45%
Consultant Solutions Elite..............................         2.50%              0.10%               2.60%
Consultant Solutions Select.............................         2.60%              0.10%               2.70%

*  As described above the administrative expense charge and the mortality and
   expense charge for certain Options may be higher in the future if you add
   this Option to your Contract. However, we will not increase the
   administrative expense charge once we issue your Contract, and we will not
   increase the charge for an Option once we add the Option to your Contract.
   If we increase any of these charges, we will amend the prospectus,
   accordingly.

                                      9
TRUERETURN ACCUMULATION BENEFIT OPTION ANNUAL FEE
(ANNUAL RATE AS A PERCENTAGE OF BENEFIT BASE ON A CONTRACT ANNIVERSARY)

TrueReturn Accumulation Benefit Option                   Currently 0.50%, up to
                                                             a maximum of 1.25%
                                                           for Options added in
                                                                  the future. *

*  If we increase this charge, we will amend the prospectus, accordingly. See
   "TrueReturn Accumulation Benefit Option" for details.

SPOUSAL PROTECTION BENEFIT (CO-ANNUITANT) OPTION ANNUAL FEE
(ANNUAL RATE AS A PERCENTAGE OF CONTRACT VALUE ON A CONTRACT ANNIVERSARY)

Spousal Protection Benefit (Co-Annuitant) Option         Currently 0.10%, up to
                                                             a maximum of 0.15%
                                                           for Options added in
                                                                   the future *

*  For Options added on or after 5/1/2005. If we increase this charge, we will
   amend the prospectus, accordingly. See "Spousal Protection Benefit
   (Co-Annuitant) Option" for details.

SUREINCOME OPTION FEE
(ANNUAL RATE AS A PERCENTAGE OF BENEFIT BASE ON A CONTRACT ANNIVERSARY)

SureIncome Withdrawal Benefit Option                     Currently 0.50%, up to
                                                             a maximum of 1.25%
                                                                 for SureIncome
                                                           Options added in the
                                                                       future *

*  If we increase this charge, we will amend the prospectus, accordingly. See
   "SureIncome Withdrawal Benefit Option" for details.

INCOME PROTECTION BENEFIT OPTION FEE (PAYOUT PHASE ONLY)*
(AS A PERCENTAGE OF AVERAGE DAILY NET ASSETS)

Income Protection Benefit Option                         Currently 0.50%, up to
                                                             a maximum of 1.25%
                                                           for Options added in
                                                                    the future*

*  See "Income Payments - Income Protection Benefit Option," below, for a
   description of the Income Protection Benefit Option. You may add this Option
   when you elect to receive annuity benefits. We begin to deduct the charge
   for this Option on the Payout Start Date. Currently, the charge for this
   Option is 0.50% of the average daily net Variable Account assets supporting
   the variable income payments to which the Income Protection Benefit Option
   applies. We will charge you the Option charge in effect when you choose to
   apply this Option to your Contract. We reserve the right to raise the Income
   Protection Benefit Option charge to up to 0.75%. If we increase this charge,
   we will amend the prospectus accordingly. Once your Income Protection
   Benefit Option is in effect, however, we will not change the option charge
   you will pay for this Option. See "Expenses - Mortality and Expense Risk
   Charge," below, for details.

PORTFOLIO ANNUAL EXPENSES - MINIMUM AND MAXIMUM

The next table shows the minimum and maximum total operating expenses charged
by the Portfolios that you may pay periodically during the time that you own
the Contract. Advisors and/or other service providers of certain Portfolios may
have agreed to waive their fees and/or reimburse Portfolio expenses in order to
keep the Portfolios' expenses below specified limits. The range of expenses
shown in this table does not show the effect of any such fee waiver or expense
reimbursement. More detail concerning each Portfolio's fees and expenses
appears in the second table below and in the prospectus for each Portfolio.

<R>
                                                                                                             Minimum Maximum
                                                                                                             ------- -------
Total Annual Portfolio Operating Expenses/(1)/ (expenses that are deducted from Portfolio assets, which may
  include management fees, distribution and/or services (12b-1) fees, and other expenses)...................  0.32%   4.33%
</R>

<R>
(1)Expenses are shown as a percentage of Portfolio average daily net assets
   (before any waiver or reimbursement) as of December 31, 2014.
</R>

EXAMPLE 1

This Example is intended to help you compare the cost of investing in the
Contracts with the cost of investing in other variable annuity contracts. These
costs include Contract owner transaction expenses, Contract fees, Variable
Account annual expenses, and Portfolio fees and expenses.

The example shows the dollar amount of expenses that you would bear directly or
indirectly if you:

..  invested $10,000 in the Contract for the time periods indicated;

..  earned a 5% annual return on your investment;

..  surrendered your Contract, or you began receiving income payments for a
   specified period of less than 120 months, at the end of each time period;

                                      10
..  elected the MAV Death Benefit Option and the Annual Increase Death Benefit
   Option;

..  elected the Enhanced Earnings Death Benefit Option (assuming issue age
   71-79);

..  elected the Spousal Protection Benefit (Co-Annuitant) Option; and

..  elected the TrueReturn Accumulation Benefit Option or SureIncome Withdrawal
   Benefit Option.

THE EXAMPLE DOES NOT INCLUDE ANY TAXES OR TAX PENALTIES YOU MAY BE REQUIRED TO
PAY IF YOU SURRENDER YOUR CONTRACT.

The first line of the example assumes that the maximum fees and expenses of any
of the Portfolios are charged. The second line of the example assumes that the
minimum fees and expenses of any of the Portfolios are charged. Your actual
expenses may be higher or lower than those shown below.

<R>
                                Consultant Solutions Classic      Consultant Solutions Plus
                               1 Year 3 Years 5 Years 10 Years 1 Year 3 Years 5 Years 10 Years
                               ------ ------- ------- -------- ------ ------- ------- --------
Costs Based on Maximum Annual
  Portfolio Expenses.......... $1,433 $2,969  $4,349   $7,599  $1,577 $3,226  $4,628   $7,690
                               ------ ------  ------   ------  ------ ------  ------   ------
Costs Based on Minimum Annual
  Portfolio Expenses.......... $1,057 $1,918  $2,725   $4,969  $1,202 $2,182  $3,020   $5,116
                               ------ ------  ------   ------  ------ ------  ------   ------
</R>

<R>
                                 Consultant Solutions Elite      Consultant Solutions Select
                               1 Year 3 Years 5 Years 10 Years 1 Year 3 Years 5 Years 10 Years
                               ------ ------- ------- -------- ------ ------- ------- --------
Costs Based on Maximum Annual
  Portfolio Expenses.......... $1,464 $2,967  $4,132   $7,772   $878  $2,566  $4,168   $7,823
                               ------ ------  ------   ------   ----  ------  ------   ------
Costs Based on Minimum Annual
  Portfolio Expenses.......... $1,090 $1,928  $2,538   $5,242   $505  $1,531  $2,583   $5,321
                               ------ ------  ------   ------   ----  ------  ------   ------
</R>

EXAMPLE 2

This Example uses the same assumptions as Example 1 above, except that it
assumes you decided not to surrender your Contract, or you began receiving
income payments for a specified period of at least 120 months, at the end of
each time period.

<R>
                                Consultant Solutions Classic      Consultant Solutions Plus
                               1 Year 3 Years 5 Years 10 Years 1 Year 3 Years 5 Years 10 Years
                               ------ ------- ------- -------- ------ ------- ------- --------
Costs Based on Maximum Annual
  Portfolio Expenses..........  $838  $2,459  $4,009   $7,599   $855  $2,503  $4,075   $7,690
                                ----  ------  ------   ------   ----  ------  ------   ------
Costs Based on Minimum Annual
  Portfolio Expenses..........  $462  $1,408  $2,385   $4,969   $480  $1,459  $2,467   $5,116
                                ----  ------  ------   ------   ----  ------  ------   ------
</R>

<R>
                                Consultant Solutions Elite    Consultant Solutions Select
                                1                             1
                               Year 3 Years 5 Years 10 Years Year 3 Years 5 Years 10 Years
                               ---- ------- ------- -------- ---- ------- ------- --------
Costs Based on Maximum Annual
  Portfolio Expenses.......... $869 $2,542  $4,132   $7,772  $878 $2,566  $4,168   $7,823
                               ---- ------  ------   ------  ---- ------  ------   ------
Costs Based on Minimum Annual
  Portfolio Expenses.......... $495 $1,503  $2,538   $5,242  $505 $1,531  $2,583   $5,321
                               ---- ------  ------   ------  ---- ------  ------   ------
</R>

PLEASE REMEMBER THAT YOU ARE LOOKING AT EXAMPLES AND NOT A REPRESENTATION OF
PAST OR FUTURE EXPENSES. YOUR RATE OF RETURN MAY BE HIGHER OR LOWER THAN 5%,
WHICH IS NOT GUARANTEED. THE EXAMPLES DO NOT ASSUME THAT ANY PORTFOLIO EXPENSE
WAIVERS OR REIMBURSEMENT ARRANGEMENTS ARE IN EFFECT FOR THE PERIODS PRESENTED.
THE EXAMPLES REFLECT THE FREE WITHDRAWAL AMOUNTS, IF APPLICABLE, AND THE
DEDUCTION OF THE ANNUAL CONTRACT MAINTENANCE CHARGE OF $30 EACH YEAR. THE ABOVE
EXAMPLES ASSUME YOU HAVE SELECTED THE MAV DEATH BENEFIT OPTION, THE ANNUAL
INCREASE DEATH BENEFIT OPTION, THE ENHANCED EARNINGS DEATH BENEFIT OPTION
(ASSUMING THE OLDEST CONTRACT OWNER AND CO-ANNUITANT, OR, IF THE CONTRACT OWNER
IS A NON-LIVING PERSON, THE OLDEST ANNUITANT, ARE AGE 71 OR OLDER, AND ALL ARE
AGE 79 OR YOUNGER ON THE RIDER APPLICATION DATE), THE SPOUSAL PROTECTION
BENEFIT (CO-ANNUITANT) OPTION, AND THE TRUERETURN ACCUMULATION BENEFIT OPTION
OR SUREINCOME WITHDRAWAL BENEFIT OPTION. IF ANY OR ALL OF THESE FEATURES WERE
NOT ELECTED, THE EXPENSE FIGURES SHOWN ABOVE WOULD BE SLIGHTLY LOWER.

                                      11
FINANCIAL INFORMATION

To measure the value of your investment in the Variable Sub-Accounts during the
Accumulation Phase, we use a unit of measure we call the "ACCUMULATION UNIT."
Each Variable Sub-Account has a separate value for its Accumulation Units we
call "ACCUMULATION UNIT VALUE." Accumulation Unit Value is analogous to, but
not the same as, the share price of a mutual fund.

Accumulation Unit Values for the lowest and highest available combinations of
Contract charges that affect Accumulation Unit Values for each Contract are
shown in Appendix H of this prospectus. The Statement of Additional Information
contains the Accumulation Unit Values for all other available combinations of
Contract charges that affect Accumulation Unit Values for each Contract. The
financial statements of Lincoln Benefit and the financial statements of the
Variable Account, which are comprised of the financial statements of the
underlying sub-accounts, appear in the Statement of Additional Information.

THE CONTRACTS

<R>
Please note that these Contracts are no longer available for new sales. The
information provided in this section is for informational purposes only.
</R>

CONTRACT OWNER

Each CONTRACT is an agreement between you, the Contract Owner, and Lincoln
Benefit, a life insurance company. As the Contract Owner, you may exercise all
of the rights and privileges provided to you by the Contract. That means it is
up to you to select or change (to the extent permitted):

..  the investment alternatives during the Accumulation and Payout Phases,

..  the amount and timing of your purchase payments and withdrawals,

..  the programs you want to use to invest or withdraw money,

..  the income payment plan(s) you want to use to receive retirement income,

..  the Annuitant (either yourself or someone else) on whose life the income
   payments will be based,

..  the Beneficiary or Beneficiaries who will receive the benefits that the
   Contract provides when the last surviving Contract Owner dies, or, if the
   Contract Owner is a non-living person, an Annuitant dies, and

..  any other rights that the Contract provides, including restricting income
   payments to Beneficiaries.

If you die prior to the Payout Start Date, any surviving joint Contract Owner,
or, if none, the Beneficiary, may exercise the rights and privileges provided
to them by the Contract. If the sole surviving Contract Owner dies after the
Payout Start Date, the Primary Beneficiary will receive any guaranteed income
payments scheduled to continue.

If the Annuitant dies prior to the Payout Start Date and the Contract Owner is
a non-living person, we will pay the death benefit to the current Contract
Owner.

The Contract cannot be jointly owned by both a living and a non-living person.
The CONSULTANT SOLUTIONS SELECT is not available for purchase by non-living
persons. The maximum age of any Contract Owner on the date we receive the
completed application for each Contract is 90.

If you select the MAV Death Benefit Option, the Annual Increase Death Benefit
Option, or the Enhanced Earnings Death Benefit Option, the maximum age of any
Contract Owner on the Rider Application Date is currently 79. If you select the
Spousal Protection Benefit (Co-Annuitant) Option, the maximum age of any
Contract Owner on the Rider Application Date is currently age 90. If you select
the SureIncome Withdrawal Benefit Option, the maximum age of any Contract Owner
on the Rider Application Date is currently age 85.

The Contract can also be purchased as an IRA or TSA (also known as a 403(b)).
The endorsements required to qualify these annuities under the Code may limit
or modify your rights and privileges under the Contract. We use the term
"QUALIFIED CONTRACT" to refer to a Contract issued as an IRA, 403(b), or with a
Qualified Plan.

Except for certain Qualified Contracts, you may change the Contract Owner at
any time by written notice in a form satisfactory to us. Until we receive your
written notice to change the Contract Owner, we are entitled to rely on the
most recent information in our files. We will provide a change of ownership
form to be signed by you and filed with us. Once we accept the change, the
change will take effect as of the date you signed the request. We will not be
liable for any payment or settlement made prior to accepting the change.
Accordingly, if you wish to change the Contract Owner, you should deliver your
written notice to us promptly. Each change is subject to any payment we make or
other action we take before we accept it. Changing ownership of this Contract
may cause adverse tax consequences and may not be allowed under Qualified
Contracts. Please consult with a competent tax advisor prior to making a
request for a change of Contract Owner.

                                      12
ANNUITANT

The ANNUITANT is the individual whose age determines the latest Payout Start
Date and whose life determines the amount and duration of income payments
(other than under Income Plan 3). If the Contract is a Non-Qualified Contract,
you also may designate a joint Annuitant, who is a second person on whose life
income payments depend. Additional restrictions may apply in the case of
Qualified Plans. The maximum age of the Annuitant on the date we receive the
completed application for each Contract is 90.

If the Owner is a living person, the Owner may change the Annuitant before the
Payout Start Date by written request in a form satisfactory to us. Once we
accept a change, it takes effect on the date you signed the request. Each
change is subject to any payment we make or other action we take before we
accept it.

If you select the MAV Death Benefit Option, Annual Increase Death Benefit
Option, or Enhanced Earnings Death Benefit Option, the maximum age of any
Annuitant on the Rider Application Date is 79.

If you select the Spousal Protection Benefit (Co-Annuitant) Option, the maximum
age of any Annuitant on the Rider Application date is age 90. If you select the
Income Protection Benefit Option, the oldest Annuitant and joint Annuitant (if
applicable) must be age 75 or younger on the Payout Start Date. If you select
the SureIncome Withdrawal Benefit Option, the maximum age of any Annuitant on
the Rider Application Date is currently age 85.

If you select an Income Plan that depends on the Annuitant or a joint
Annuitant's life, we may require proof of age and sex before income payments
begin and proof that the Annuitant or joint Annuitant is still alive before we
make each payment.

CO-ANNUITANT

Contract Owners of IRA Contracts that meet the following conditions and that
elect the Spousal Protection Benefit Option must name their spouse as a
CO-ANNUITANT:

..  the individually owned Contract must be either a traditional, Roth or
   Simplified Employee Pension IRA;

..  the Contract Owner must be age 90 or younger on the Rider Application Date;

..  and the Co-Annuitant must be age 79 or younger on the Rider Application
   Date; and

..  the Co-Annuitant must be the sole Primary Beneficiary under the Contract.

Under the Spousal Protection Benefit Option, the Co-Annuitant will be
considered to be an Annuitant during the Accumulation Phase, except the
Co-Annuitant will not be considered to be an Annuitant for purposes of
determining the Payout Start Date and the "Death of Annuitant" provision of
your Contract does not apply upon the death of the Co-Annuitant. If you are
single when you purchase this Contract, and are married later, you may add the
Spousal Protection Benefit Option within six months of your marriage only if
you provide proof of marriage in a form satisfactory to us. You may change the
Co-Annuitant to a new spouse within six months of re-marriage only if you
provide proof of remarriage in a form satisfactory to us. At any time, there
may only be one Co-Annuitant under your Contract. The Co-Annuitant will be
considered an Owner for the purposes of determining the age or birthday of the
Owners under the MAV Death Benefit Option, the Annual Increase Death Benefit
Option and the Enhanced Earnings Death Benefit Option. See "Spousal Protection
Benefit Option and Death of Co-Annuitant" for more information.

BENEFICIARY

You may name one or more Primary and Contingent Beneficiaries when you apply
for a Contract. The Primary Beneficiary is the person who may, in accordance
with the terms of the Contract, elect to receive the death settlement ("DEATH
PROCEEDS") or become the new Contract Owner pursuant to the Contract if the
sole surviving Contract Owner dies before the Payout Start Date. If the sole
surviving Contract Owner dies after the Payout Start Date, the Beneficiary will
receive any guaranteed income payments scheduled to continue. A Contingent
Beneficiary is the person selected by the Contract Owner who will exercise the
rights of the Primary Beneficiary if all named Primary Beneficiaries die before
the death of the sole surviving Contract Owner.

You may change or add Beneficiaries at any time, unless you have designated an
irrevocable Beneficiary. We will provide a change of Beneficiary form to be
signed by you and filed with us. After we accept the form, the change of
Beneficiary will be effective as of the date you signed the form. Until we
accept your written notice to change a Beneficiary, we are entitled to rely on
the most recent Beneficiary information in our files. We will not be liable for
any payment or settlement made prior to accepting the change. Accordingly, if
you wish to change your Beneficiary, you should deliver your written notice to
us promptly. Each Beneficiary change is subject to any payment made by us or
any other action we take before we accept the change.

You may restrict income payments to Beneficiaries. We will provide a form to be
signed by you and filed with us. Once we accept the form, the restriction will
take effect as of the date you signed the request. Any restriction is subject
to any payment made by us or any other action we take before we accept the
request.

If you did not name a Beneficiary or, unless otherwise provided in the
Beneficiary designation, if a named Beneficiary is no longer living and there
are no other surviving Primary or Contingent Beneficiaries when the sole
surviving Contract Owner dies, the new Beneficiary will be:

..  your spouse or, if he or she is no longer living,

..  your surviving children equally, or if you have no surviving children,

..  your estate.

                                      13
If more than one Beneficiary survives you, we will divide the death benefit
among the surviving Beneficiaries according to your most recent written
instructions. If you have not given us written instructions in a form
satisfactory to us, we will pay the death benefit in equal amounts to the
surviving Beneficiaries. If there is more than one Beneficiary in a class
(e.g., more than one Primary Beneficiary) and one of the Beneficiaries
predeceases the Contract Owner (the Annuitant if the Contract owner is not a
living person), the remaining Beneficiaries in that class will divide the
deceased Beneficiary's share in proportion to the original share of the
remaining Beneficiaries.

For purposes of this Contract, in determining whether a living person,
including a Contract Owner, Primary Beneficiary, Contingent Beneficiary, or
Annuitant ("Living Person A") has survived another living person, including a
Contract Owner, Primary Beneficiary, Contingent Beneficiary, or Annuitant
("Living Person B"), Living Person A must survive Living Person B by at least
24 hours. Otherwise, Living Person A will be conclusively deemed to have
predeceased Living Person B.

Where there are multiple Beneficiaries, we will only value the death proceeds
at the time the first Beneficiary submits the necessary documentation in good
order. Any death proceed amounts attributable to any Beneficiary which remain
in the Variable Sub-accounts are subject to investment risk. If there is more
than one Beneficiary taking shares of the death proceeds, each Beneficiary will
be treated as a separate and independent owner of his or her respective share
of the death proceeds. Each Beneficiary will exercise all rights related to his
or her share of the death proceeds, including the sole right to select a death
settlement option, subject to any restrictions previously placed upon the
Beneficiary. Each Beneficiary may designate a Beneficiary(ies) for his or her
respective share, but that designated Beneficiary(ies) will be restricted to
the death settlement option chosen by the original Beneficiary.

If there is more than one Beneficiary and one of the Beneficiaries is a
corporation, trust or other non-living person, all Beneficiaries will be
considered to be non-living persons.

MODIFICATION OF THE CONTRACT

Only a Lincoln Benefit officer may approve a change in or waive any provision
of the Contract. Any change or waiver must be in writing. None of our agents
has the authority to change or waive the provisions of the Contract. We may not
change the terms of the Contract without your consent, except to conform the
Contract to applicable law or changes in the law. If a provision of the
Contract is inconsistent with state law, we will follow state law.

ASSIGNMENT

You may not assign an interest in this Contract as collateral or security for a
loan. However, you may assign periodic income payments under this Contract
prior to the Payout Start Date. No Beneficiary may assign benefits under the
Contract until they are due. We will not be bound by any assignment until the
assignor signs it and files it with us. We are not responsible for the validity
of any assignment. Federal law prohibits or restricts the assignment of
benefits under many types of retirement plans and the terms of such plans may
themselves contain restrictions on assignments. An assignment may also result
in taxes or tax penalties. YOU SHOULD CONSULT WITH AN ATTORNEY BEFORE TRYING TO
ASSIGN PERIODIC INCOME PAYMENTS UNDER YOUR CONTRACT.

PURCHASES

MINIMUM PURCHASE PAYMENTS

The minimum initial purchase payment for Classic Contracts is $1,200 (Qualified
or Non-Qualified Contracts); the minimum initial purchase payment for all other
Non-Qualified Contracts is $10,000, ($2,000 for Qualified Contracts). All
subsequent purchase payments under a Contract must be $1,000 or more ($100 for
automatic payments). For CONSULTANT SOLUTIONS PLUS CONTRACTS, purchase payments
do not include any Credit Enhancements. You may make purchase payments at any
time prior to the Payout Start Date; however, any additional payments after the
initial purchase payment may be limited in some states. Please consult with
your representative for details. The total amount of purchase payments we will
accept for each Contract without our prior approval is $1,000,000. We reserve
the right to accept a lesser initial purchase payment amount or lesser
subsequent purchase payment amounts. We reserve the right to limit the
availability of the investment alternatives for additional investments. We also
reserve the right to reject any application. We may apply certain limitations,
restrictions, and/or underwriting standards as a condition of our issuance of a
Contract and/or acceptance of purchase payments.

AUTOMATIC ADDITIONS PROGRAM

You may make subsequent purchase payments of $100 or more per month by
automatically transferring money from your bank account. Please consult with
your sales representative for detailed information. The AUTOMATIC ADDITIONS
PROGRAM is not available for making purchase payments into the Dollar Cost
Averaging Fixed Account Option.

ALLOCATION OF PURCHASE PAYMENTS

At the time you apply for a Contract, you must decide how to allocate your
purchase payment among the investment alternatives. The allocation you specify
on your application will be effective immediately. All allocations must be in
whole percents that total 100% or in whole dollars. You can change your
allocations by calling 1-800-457-7617.

                                      14
We will allocate your purchase payments to the investment alternatives
according to your most recent instructions on file with us. Unless you notify
us otherwise, we will allocate subsequent purchase payments according to the
allocation for the previous purchase payment. We will effect any change in
allocation instructions at the time we receive written notice of the change in
good order.

<R>
For CONSULTANT SOLUTIONS SELECT CONTRACTS, the maximum amount that can be
allocated during any single day to certain selected funds is $25,000. Please
see the current list of funds affected by this restriction on page 41.
</R>

We will credit the initial purchase payment that accompanies your completed
application to your Contract within 2 business days after we receive the
payment at our home office. If your application is incomplete, we will ask you
to complete your application within 5 business days. If you do so, we will
credit your initial purchase payment to your Contract within that 5 business
day period. If you do not, we will return your purchase payment at the end of
the 5 business day period unless you expressly allow us to hold it until you
complete the application. We will credit subsequent purchase payments to the
Contract at the close of the business day on which we receive the purchase
payment at our home office.

We use the term "business day" to refer to each day Monday through Friday that
the New York Stock Exchange is open for business. We also refer to these days
as "VALUATION DATES." Our business day closes when the New York Stock Exchange
closes for regular trading, usually 4:00 p.m. Eastern Time (3:00 p.m. Central
Time). If we receive your purchase payment after 3:00 p.m. Central Time on any
Valuation Date, we will credit your purchase payment using the Accumulation
Unit Values computed for the next Valuation Date.

There may be circumstances where the New York Stock Exchange is open, however,
due to inclement weather, natural disaster or other circumstances beyond our
control, our offices may be closed or our business processing capabilities may
be restricted. Under those circumstances, your Contract Value may fluctuate
based on changes in the Accumulation Unit Values, but you may not be able to
transfer Contract Value, or make a purchase or redemption request.

With respect to both your initial purchase payment and any subsequent purchase
payment that is pending investment in our Variable Account, we may hold the
amount temporarily in a suspense account and may earn interest on amounts held
in that suspense account. You will not be credited with any interest on amounts
held in that suspense account.

CREDIT ENHANCEMENT

For CONSULTANT SOLUTIONS PLUS CONTRACTS, each time you make a purchase payment,
we will add to your Contract Value a Credit Enhancement equal to 4% of the
purchase payment if the oldest Contract Owner, or, if the Contract Owner is a
non-living person, the oldest Annuitant, is age 85 or younger on the date we
receive the completed application for the Contract ("Application Date"). If the
oldest Contract Owner or, if the Owner is a non-living person, the oldest
Annuitant is age 86 or older and 90 or younger on the Application Date, we will
add to your Contract Value a Credit Enhancement equal to 2% of the purchase
payment. The thresholds apply individually to each CONSULTANT SOLUTIONS PLUS
CONTRACT you own. The additional Credit Enhancements and their corresponding
thresholds are as follows:

                  ADDITIONAL CREDIT                      CUMULATIVE PURCHASE
                ENHANCEMENT FOR LARGE                  PAYMENTS LESS CUMULATIVE
                      CONTRACTS                        WITHDRAWALS MUST EXCEED:
0.50% of the purchase payment......................... $                500,000
1.00% of the purchase payment......................... $              1,000,000

If, during the first Contract Year only, the cumulative purchase payments less
cumulative withdrawals exceed the thresholds, the additional credit enhancement
will apply to prior purchase payments, less cumulative withdrawals, and will be
added to the Contract Value as of the date of the most recent purchase payment.
The additional credit enhancement will be applied only once to any given
purchase payment, current or prior.

If you exercise your right to cancel the Contract during the Trial Examination
Period, the amount we refund to you will not include any Credit Enhancement.
See "TRIAL EXAMINATION PERIOD" below for details. The CONSULTANT SOLUTIONS PLUS
CONTRACT may not be available in all states.

We will allocate any Credit Enhancements to the investment alternatives
according to the allocation instructions you have on file with us at the time
we receive your purchase payment. We will allocate each Credit Enhancement
among the investment alternatives in the same proportions as the most recent
purchase payment. We do not consider Credit Enhancements to be investments in
the Contract for income tax purposes.

We use a portion of the withdrawal charge and mortality and expense risk charge
to help recover the cost of providing the Credit Enhancement under the
Contract. See "EXPENSES." Under certain circumstances (such as a period of poor
market performance) the cost associated with the Credit Enhancement may exceed
the sum of the Credit Enhancement and any related earnings. You should consider
this possibility before purchasing the Contract.

TRIAL EXAMINATION PERIOD

You may cancel your Contract by providing us with written notice within the
Trial Examination Period, which is the 20 day period after you receive the
Contract, or such longer period that your state may require. If you exercise
this "RIGHT TO CANCEL," the Contract terminates and we will pay you the full
amount of your purchase payments allocated to the Fixed Account. We also will
return your

                                      15
purchase payments allocated to the Variable Account adjusted, to the extent
federal or state law permits, to reflect investment gain or loss, including the
deduction of mortality and expense risk charges and administrative expense
charges, that occurred from the date of allocation through the date of
cancellation. If your Contract is qualified under Code Section 408(b), we will
refund the greater of any purchase payments or the Contract Value. The amount
you receive will be less applicable federal and state income tax withholding.

For CONSULTANT SOLUTIONS PLUS CONTRACTS, we have received regulatory relief to
enable us to recover the amount of any Credit Enhancement applied to Contracts
that are cancelled during the Trial Examination Period. The amount we return to
you upon exercise of this Right to Cancel will not include any Credit
Enhancement. In states where required, we will return the amount of your
purchase payments. In other states, we will return the amount of your purchase
payments, reduced by the amount of any mortality and expense risk charges and
administrative expense charges deducted prior to cancellation, and adjusted by
any investment gain or loss associated with:

..  your Variable Account purchase payments; and

..  any portion of the Credit Enhancement assigned to the Variable Sub-accounts.

We reserve the right to allocate your purchase payments to the PIMCO Money
Market - Administrative Shares Sub-Account during the Trial Examination Period.
For Contracts purchased in California by persons age 60 and older, you may
elect to defer until the end of the Trial Examination Period allocation of your
purchase payment to the Variable Sub-accounts. Unless you instruct otherwise,
upon making this election, your purchase payment will be allocated to the PIMCO
Money Market - Administrative Shares Sub-Account. On the next Valuation Date 40
day after the issue date, your Contract Value will then be reallocated in
accordance with your most recent investment allocation instructions.

State laws vary and may require a different period, other variations or
adjustments. Please refer to your Contract for any state specific information.

CONTRACT LOANS FOR 403(B) CONTRACTS

Subject to the restrictions described below, we will make loans to the Contract
Owner of a Contract used in connection with a Tax Sheltered Annuity Plan ("TSA
Plan") under Section 403(b) of the Internal Revenue Code. Such loans may not be
available in all states. Loans are not available under non-qualified Contracts.
We will only make loans after the right to cancel period and before the Payout
Start Date. All loans are subject to the terms of the Contract, the relevant
qualified plan, and the Internal Revenue Code, which impose restrictions on
loans. Loans may not be available with all rider options.

We will not make a loan to you if the total of the requested loan and your
unpaid outstanding loans will be greater than the amount available for full
withdrawal, including any applicable Market Value Adjustment, under your
Contract on the date of the loan. In addition, you may not borrow a loan if the
total of the requested loan and all of your loans under TSA Plans with the same
employer is more than the lesser of (a) or (b) where:

(a)  equals $50,000 minus the excess of the highest outstanding loan balance
     during the prior 12 months over the current outstanding loan balance; and

(b)  equals the greater of $10,000 or half of the amount available for full
     withdrawal.

The minimum loan amount is $1,000.

To request a Contract loan, write to us at the address given on the first page
of the prospectus. You alone are responsible for ensuring that your loan and
repayments comply with tax requirements. Some of these requirements are stated
in Section 72 of the Internal Revenue Code. Please seek advice from your plan
administrator or tax advisor.

When we make a loan, we will transfer an amount equal to the loan amount from
the Variable Account and/or the Fixed Account Options to the Loan Account as
collateral for the loan. The Loan Account is an account established for amounts
transferred from the Variable Sub-accounts or Fixed Account Options as security
for an outstanding Contract loan. We will transfer to the Loan Account amounts
from each Variable Sub-account in proportion to the total assets in all
Variable Sub-accounts. If your loan amount is greater than your Contract Value
in the Variable Sub-accounts, we will transfer the remaining required
collateral from the Market Value Adjusted or Standard Fixed Account Option. If
your loan amount is greater than your contract value in the Variable
Sub-accounts and the Market Value Adjusted or Standard Fixed Account Option, we
will transfer the remaining required collateral from the Dollar Cost Averaging
Fixed Account Options.

We will not charge a Withdrawal Charge on the loan or on the transfer from the
Variable Sub-accounts or any of the Fixed Account Options. We may, however,
apply a Market Value Adjustment to a transfer from the Market Value Adjusted
Fixed Account to the Loan Account. If we do, we will increase or decrease the
amount remaining in the Market Value Adjusted Fixed Account by the amount of
the Market Value Adjustment, so that the net amount transferred to the Loan
Account will equal the desired loan amount. We will charge a Withdrawal Charge
and apply a Market Value Adjustment, if applicable, on a distribution to repay
the loan in full, in the event of loan default.

                                      16
We will credit interest to the amounts in the Loan Account. The annual interest
rate credited to the Loan Account will be the greater of: (a) an annual
effective rate of 3%; or (b) the loan interest rate minus 2.25%. The value of
the amounts in the Loan Account are not affected by the changes in the value of
the Variable Sub-accounts.

When you take out a loan, we will set the loan interest rate. That rate will
apply to your loan until it is repaid. From time to time, we may change the
loan interest rate applicable to new loans. We also reserve the right to change
the terms of new loans.

We will subtract the outstanding Contract loan balance, including accrued but
unpaid interest, from:

(1)  the Death Proceeds;

(2)  full withdrawal proceeds;

(3)  the amount available for partial withdrawal; and

(4)  the amount applied on the Payout Start Date to provide income payments.

If a New Owner elects to continue the Contract under Death of Owner Option D,
the new Contract Value will be reduced by the amount of the loan outstanding
plus accrued interest and the loan will be canceled.

Usually you must repay a Contract loan within five years of the date the loan
is made. Scheduled payments must be level, amortized over the repayment period,
and made at least quarterly. We may permit a repayment period of 15 or 30 years
if the loan proceeds are used to acquire your principal residence. We may also
permit other repayment periods.

You must mark your loan repayments as such. We will assume that any payment
received from you is a Purchase Payment, unless you tell us otherwise.
Generally, loan payments are allocated to the Variable Sub-account(s) in the
proportion that you have selected for your most recent Purchase Payment.
Allocations of loan payments are not permitted to the Fixed Accounts (Standard
Fixed Account, Market Value Adjusted Account, and Dollar Cost Averaging Fixed
Account Option). If your Purchase Payment allocation includes any of the Fixed
Accounts, the percentages allocated to the Fixed Accounts will be allocated
instead to the PIMCO Money Market Sub-account.

If you do not make a loan payment when due, we will continue to charge interest
on your loan. We also will declare the entire loan in default. We will subtract
the defaulted loan balance plus accrued interest from any future distribution
under the Contract and keep it in payment of your loan. Any defaulted amount
plus interest will be treated as a distribution for tax purposes (as permitted
by law). As a result, you may be required to pay taxes on the defaulted amount
and incur the early withdrawal tax penalty. Until we are permitted by law to
extinguish a defaulted loan, we will continue to charge interest and add unpaid
interest to your outstanding loan balance.

If the total loan balance exceeds the amount available for full withdrawal, we
will mail written notice to your last known address. The notice will state the
amount needed to maintain the Contract in force. If we do not receive payment
of this amount within 31 days after we mail this notice, we will terminate your
Contract.

We may defer making any loan for 6 months after you ask us for a loan, unless
the loan is to pay a premium to us.

CONTRACT VALUE

On the Issue Date, the CONTRACT VALUE is equal to your initial purchase payment
(for CONSULTANT SOLUTIONS PLUS CONTRACTS, your initial purchase payment plus
the Credit Enhancement).

Thereafter, your Contract Value at any time during the Accumulation Phase is
equal to the sum of the value of your Accumulation Units in the Variable
Sub-accounts you have selected, plus your value in the Fixed Account Option(s)
offered by your Contract.

ACCUMULATION UNITS

To determine the number of Accumulation Units of each Variable Sub-account to
allocate to your Contract, we divide (i) the amount of the purchase payment or
transfer you have allocated to a Variable Sub-account by (ii) the Accumulation
Unit Value of that Variable Sub-account next computed after we receive your
payment or transfer. For example, if we receive a $10,000 purchase payment
allocated to a Variable Sub-account when the Accumulation Unit Value for the
Sub-account is $10, we would credit 1,000 Accumulation Units of that Variable
Sub-account to your Contract. For CONSULTANT SOLUTIONS PLUS CONTRACTS, we would
credit your Contract additional Accumulation Units of the Variable Sub-account
to reflect the Credit Enhancement paid on your purchase payment. See "Credit
Enhancement." Withdrawals and transfers from a Variable Sub-account would, of
course, reduce the number of Accumulation Units of that Sub-account allocated
to your Contract.

ACCUMULATION UNIT VALUE

As a general matter, the Accumulation Unit Value for each Variable Sub-Account
for each Contract will rise or fall to reflect:

..  changes in the share price of the Portfolio in which the Variable
   Sub-Account invests, and

..  the deduction of amounts reflecting the mortality and expense risk charge,
   administrative expense charge, and any provision for taxes that have accrued
   since we last calculated the Accumulation Unit Value.

                                      17
We determine any applicable withdrawal charges, Rider Fees (if applicable),
transfer fees, and contract maintenance charges separately for each Contract.
They do not affect the Accumulation Unit Value. Instead, we obtain payment of
those charges and fees by redeeming Accumulation Units. For details on how we
compute Accumulation Unit Values, please refer to the Statement of Additional
Information.

We determine a separate Accumulation Unit Value for each Variable Sub-Account
for each Contract on each Valuation Date. We also determine a separate set of
Accumulation Unit Values that reflect the cost of each optional benefit, or
available combination thereof, offered under the Contract.

YOU SHOULD REFER TO THE PROSPECTUSES FOR THE FUNDS FOR A DESCRIPTION OF HOW THE
ASSETS OF EACH PORTFOLIO ARE VALUED, SINCE THAT DETERMINATION DIRECTLY BEARS ON
THE ACCUMULATION UNIT VALUE OF THE CORRESPONDING VARIABLE SUB-ACCOUNT AND,
THEREFORE, YOUR CONTRACT VALUE.

TRUERETURN ACCUMULATION BENEFIT OPTION

We offer the TRUERETURN ACCUMULATION BENEFIT OPTION, which is available for an
additional fee. The TrueReturn Accumulation Benefit Option guarantees a minimum
Contract Value on the "RIDER MATURITY DATE." The Rider Maturity Date is
determined by the length of the Rider Period which you select. The Option
provides no minimum Contract Value if the Option terminates before the Rider
Maturity Date. See "Termination of the TrueReturn Accumulation Benefit Option"
below for details on termination.

The TrueReturn Accumulation Benefit Option is available at time of application
for the Contract, or the date we receive a written request to add the option,
whichever is later, subject to availability and issue requirements. Currently,
you may not add the TrueReturn Option to your Contract after Contract issue
without prior approval if your Contract Value is greater than $1,000,000 at the
time you try to add the TrueReturn Option. Currently, you may have only one
TrueReturn Accumulation Benefit Option in effect on your Contract at one time.
You may have only either the TrueReturn Accumulation Benefit Option or the
SureIncome Option in effect on your Contract at one time. The TrueReturn
Accumulation Benefit Option has no maximum issue age, however the Rider
Maturity Date must occur before the latest Payout Start Date, which is the
later of the youngest Annuitant's 99th birthday or the 10th Contract
Anniversary. Once added to your Contract, the TrueReturn Accumulation Benefit
Option may be cancelled at any time on or after the 5th Rider Anniversary by:

..  notifying us in writing in a form satisfactory to us; or

..  changing your investment allocations or making other changes so that that
   the allocation of investment alternatives no longer adheres to the
   investment requirements for the TrueReturn Accumulation Benefit Option. For
   more information regarding investment requirements for this Option, see the
   "Investment Requirements" section below.

The "RIDER ANNIVERSARY" is the anniversary of the Rider Date. We reserve the
right to extend the date on which the TrueReturn Accumulation Benefit Option
may be cancelled to up to the 10th Rider Anniversary at any time in our sole
discretion. Any change we make will not apply to a TrueReturn Accumulation
Benefit Option that was added to your Contract prior to the implementation date
of the change.

When you add the TrueReturn Accumulation Benefit Option to your Contract, you
must select a Rider Period and a Guarantee Option. The Rider Period and
Guarantee Option you select determine the AB Factor, which is used to determine
the Accumulation Benefit, described below. The "RIDER PERIOD" begins on the
Rider Date and ends on the Rider Maturity Date. The "RIDER DATE" is the date
the TrueReturn Accumulation Benefit Option was made a part of your Contract. We
currently offer Rider Periods ranging from 8 to 20 years depending on the
Guarantee Option you select. You may select any Rider Period from among those
we currently offer, provided the Rider Maturity Date occurs prior to the latest
Payout Start Date. We reserve the right to offer additional Rider Periods in
the future, and to discontinue offering any of the Rider Periods at any time.
We currently offer two "GUARANTEE OPTIONS," Guarantee Option 1 and Guarantee
Option 2. The Guarantee Option you select has specific investment requirements,
which are described in the "Investment Requirements" section below and may
depend upon the Rider Date. We reserve the right to offer additional Guarantee
Options in the future, and to discontinue offering any of the Guarantee Options
at any time. After the Rider Date, the Rider Period and Guarantee Option may
not be changed.

The TrueReturn Accumulation Benefit Option may not be available in all states.
We may discontinue offering the TrueReturn Accumulation Benefit Option at any
time.

ACCUMULATION BENEFIT.

On the Rider Maturity Date, if the Accumulation Benefit is greater than the
Contract Value, the Contract Value will be increased to equal the Accumulation
Benefit. The excess amount of any such increase will be allocated to the PIMCO
Money Market Variable Sub-account. You may transfer the excess amount out of
the PIMCO Money Market Variable Sub-account and into another investment
alternative at any time thereafter. However, each transfer you make will count
against the 12 transfers you can make each Contract Year without paying a
transfer fee. Prior to the Rider Maturity Date, the Accumulation Benefit will
not be available as a Contract Value, Settlement Value, or Death Proceeds.
Additionally, we will not pay an Accumulation Benefit if the TrueReturn
Accumulation Benefit Option is terminated for any reason prior to the Rider
Maturity Date. After the Rider Maturity Date, the TrueReturn Accumulation
Benefit Option provides no additional benefit.

                                      18
The "ACCUMULATION BENEFIT" is equal to the Benefit Base multiplied by the AB
Factor. The "AB FACTOR" is determined by the Rider Period and Guarantee Option
you selected as of the Rider Date. The following table shows the AB Factors
available for the Rider Periods and Guarantee Options we currently offer.

                                  AB FACTORS
       RIDER PERIOD                GUARANTEE                  GUARANTEE
    (NUMBER OF YEARS)               OPTION 1                   OPTION 2
 ------------------------   ------------------------   ------------------------
            8                                 100.0%                         NA
            9                                 112.5%                         NA
            10                                125.0%                     100.0%
            11                                137.5%                     110.0%
            12                                150.0%                     120.0%
            13                                162.5%                     130.0%
            14                                175.0%                     140.0%
            15                                187.5%                     150.0%
            16                                200.0%                     160.0%
            17                                212.5%                     170.0%
            18                                225.0%                     180.0%
            19                                237.5%                     190.0%
            20                                250.0%                     200.0%

The following examples illustrate the Accumulation Benefit calculations under
Guarantee Options 1 and 2 on the Rider Maturity Date. For the purpose of
illustrating the Accumulation Benefit calculation, the examples assume the
Benefit Base is the same on the Rider Date and the Rider Maturity Date.

Example 1: Guarantee Option 1

Guarantee Option:.....................................................       1
Rider Period:.........................................................      15
AB Factor:............................................................   187.5%
Rider Date:...........................................................  1/2/04
Rider Maturity Date:..................................................  1/2/19
Benefit Base on Rider Date:........................................... $50,000
Benefit Base on rider Maturity Date:.................................. $50,000

On the Rider Maturity Date (1/2/19):
Accumulation Benefit  = Benefit Base on Rider Maturity Date X AB Factor
                      = $50,000 X 187.5%
                      = $93,750

Example 2: Guarantee Option 2

Guarantee Option:.....................................................       2
Rider Period:.........................................................      15
AB Factor:............................................................   150.0%
Rider Date:...........................................................  1/2/04
Rider Maturity Date:..................................................  1/2/19
Benefit Base on Rider Date:........................................... $50,000
Benefit Base on rider Maturity Date:.................................. $50,000

On the Rider Maturity Date (1/2/19):
Accumulation Benefit  = Benefit Base on Rider Maturity Date X AB Factor
                      = $50,000 X 150.0%
                      = $75,000

Guarantee Option 1 offers a higher AB Factor and more rider periods than
Guarantee Option 2. Guarantee Option 1 and Guarantee Option 2 have different
investment restrictions. See "Investment Requirements" below for more
information.

BENEFIT BASE.

The Benefit Base is used solely for purposes of determining the Rider Fee and
the Accumulation Benefit. The Benefit Base is not available as a Contract
Value, Settlement Value, or Death Proceeds. On the Rider Date, the "Benefit
Base" is equal to the Contract Value. After the Rider Date, the Benefit Base
will be recalculated for purchase payments and withdrawals as follows:

..  The Benefit Base will be increased by purchase payments (and Credit
   Enhancements for CONSULTANT SOLUTIONS PLUS CONTRACTS) made prior to or on
   the first Contract Anniversary following the Rider Date. Subject to the
   terms and conditions of your Contract, you may add purchase payments after
   this date, but they will not be included in the calculation of the Benefit
   Base. THEREFORE, IF YOU PLAN TO MAKE PURCHASE PAYMENTS AFTER THE FIRST
   CONTRACT ANNIVERSARY FOLLOWING THE RIDER DATE, YOU SHOULD CONSIDER CAREFULLY
   WHETHER THIS OPTION IS APPROPRIATE FOR YOUR NEEDS.

                                      19
..  The Benefit Base will be decreased by a Withdrawal Adjustment for each
   withdrawal you make. The Withdrawal Adjustment is equal to (a) divided by
   (b), with the result multiplied by (c), where:

   (a) = the withdrawal amount;

   (b) = the Contract Value immediately prior to the withdrawal; and

   (c) = the Benefit Base immediately prior to the withdrawal.

Withdrawals taken prior to annuitization (referred to in this prospectus as the
Payout Phase) are generally considered to come from the earnings in the
Contract first. If the Contract is tax-qualified, generally all withdrawals are
treated as distributions of earnings. Withdrawals of earnings are taxed as
ordinary income and, if taken prior to age 59 1/2, may be subject to an
additional 10% federal tax penalty. A withdrawal charge also may apply. See
Appendix G for numerical examples that illustrate how the Withdrawal Adjustment
is applied.

The Benefit Base will never be less than zero.

INVESTMENT REQUIREMENTS.

If you add the TrueReturn Option to your Contract, you must adhere to certain
requirements related to the investment alternatives in which you may invest
during the Rider Period. The specific requirements will depend on the model
portfolio option ("Model Portfolio Option") you have selected and the effective
date of your TrueReturn Option. These requirements are described below in more
detail. These requirements may include, but are not limited to, maximum
investment limits on certain Variable Sub-accounts or on certain Fixed Account
Options, exclusion of certain Variable Sub-accounts or of certain Fixed Account
Options, required minimum allocations to certain Variable Sub-accounts, and
restrictions on transfers to or from certain investment alternatives.

We may also require that you use the Automatic Portfolio Rebalancing Program.
We may change the specific requirements that are applicable to a Guarantee
Option or a Model Portfolio Option available under a Guarantee Option at any
time in our sole discretion. Any changes we make will not apply to a TrueReturn
Option that was made part of your Contract prior to the implementation date of
the change, except for changes made due to a change in investment alternatives
available under the Contract. Any changes we make will not apply to a new
TrueReturn Option elected subsequent to the change pursuant to the Rider
Trade-In Option.

If you have an outstanding loan balance, you may not elect the TrueReturn
Option until the outstanding balance has been repaid. If you elect the
TrueReturn Option, we will not make a policy loan to you until the TrueReturn
Option matures or is cancelled.

When you add the TrueReturn Option to your Contract, you must allocate your
entire Contract Value as follows:

1) to a model portfolio option ("Model Portfolio Option") available with the
   Guarantee Option you selected, as defined below; or

2) to the DCA Fixed Account Option and then transfer all purchase payments (and
   Credit Enhancements for CONSULTANT SOLUTIONS PLUS Contracts) and interest
   according to a Model Portfolio Option available for use with the Guarantee
   Option you selected; or

3) to a combination of (1) and (2) above.

For (2) and (3) above, the requirements for the DCA Fixed Account Option must
be met. See the "Dollar Cost Averaging Fixed Account Option" section of this
prospectus for more information.

On the Rider Date, you must select only one of the Model Portfolio Options in
which to allocate your Contract Value. After the Rider Date, you may transfer
your entire Contract Value to any of the other Model Portfolio Options
available with your Guarantee Option. We currently offer several Model
Portfolio Options with each of the available Guarantee Options. The Model
Portfolio Options that are available under Guarantee Options may differ
depending upon the effective date of your TrueReturn Option. Please refer to
the Model Portfolio Option 1, Model Portfolio Option 2 and TrueBalance/SM/
Model Portfolio Options sections below for more details. We may add other Model
Portfolio Options in the future. We also may remove Model Portfolio Options in
the future anytime prior to the date you select such Model Portfolio Option. In
addition, if the investment alternatives available under the Contract change,
we may revise the Model Portfolio Options. The following table summarizes the
Model Portfolio Options currently available for use with each Guarantee Option
under the TrueReturn Option:

                    GUARANTEE OPTION 1                                           GUARANTEE OPTION 2
------------------------------------------------------------ ------------------------------------------------------------
* Model Portfolio Option 1                                   * Model Portfolio Option 2
* TrueBalance Conservative Model Portfolio Option            * TrueBalance Conservative Model Portfolio Option
* TrueBalance Moderately Conservative Model Portfolio Option * TrueBalance Moderately Conservative Model Portfolio Option
                                                             * TrueBalance Moderate Model Portfolio Option
                                                             * TrueBalance Moderately Aggressive Model Portfolio Option
                                                             * TrueBalance Aggressive Model Portfolio Option

You may not allocate any of your Contract Value to the Standard Fixed Account
Option or to the MVA Fixed Account Option. You must transfer any portion of
your Contract Value that is allocated to the Standard Fixed Account Option or
to the MVA Fixed Account Option to the Variable Sub-accounts prior to adding
the TrueReturn Option to your Contract. Transfers from the MVA Fixed Account
Option may be subject to a Market Value Adjustment. You may allocate any
portion of your purchase payments (and Credit Enhancements for CONSULTANT
SOLUTIONS PLUS CONTRACTS) to the DCA Fixed Account Option on the Rider Date,
provided the DCA Fixed Account Option is available with your Contract and in
your state. See the "Dollar Cost Averaging Fixed Account Option"

                                      20
section of this prospectus for more information. We use the term "Transfer
Period Account" to refer to each purchase payment allocation made to the DCA
Fixed Account Option for a specified term length. At the expiration of a
Transfer Period Account any remaining amounts in the Transfer Period Account
will be transferred to the Variable Sub-Accounts according to the percentage
allocations for the Model Portfolio Option you selected.

Any subsequent purchase payments (and Credit Enhancements for CONSULTANT
SOLUTIONS PLUS CONTRACTS) made to your Contract will be allocated to the
Variable Sub-Accounts according to your most recent instructions on file with
us. You must comply with any required percentage allocations for the Model
Portfolio Option you have selected. You may also request that purchase payments
(and Credit Enhancement for CONSULTANT SOLUTIONS PLUS CONTRACTS) be allocated
to the DCA Fixed Account Option.

MODEL PORTFOLIO OPTION 1.

If you choose Model Portfolio Option 1 or transfer your entire Contract Value
into Model Portfolio Option 1, you must allocate a certain percentage of your
Contract Value into each of three asset categories. Please note that certain
investment alternatives are not available under Model Portfolio Option 1. You
may choose the Variable Sub-Accounts in which you want to invest, provided you
maintain the percentage allocation requirements for each category. You may also
make transfers among the Variable Sub-Accounts within each category at any
time, provided you maintain the percentage allocation requirements for each
category. However, each transfer you make will count against the 12 transfers
you can make each Contract Year without paying a transfer fee.

Effective May 1, 2005, certain Variable Sub-Accounts under Model Portfolio 1
have been reclassified into different asset categories. These changes apply to
TrueReturn Accumulation Benefit Options effective both PRIOR TO and ON OR AFTER
May 1, 2005. The following table describes the percentage allocation
requirements for Model Portfolio Option 1 and Variable Sub-Accounts available
under each category:

                           MODEL PORTFOLIO OPTION 1
                                20% Category A
                                50% Category B
                                30% Category C
                                 0% Category D

CATEGORY A

Fidelity(R) VIP Money Market - Service Class 2 Sub-Account
PIMCO Money Market - Administrative Shares Sub-Account

CATEGORY B

Fidelity(R) VIP Investment Grade Bond - Service Class 2 Sub-Account
Western Asset Variable Global High Yield Bond - Class II Sub-Account
<R>
MFS High Yield - Service Class Sub-Account
</R>
PIMCO Foreign Bond (U.S. Dollar-Hedged) - Administrative Shares Sub-Account
PIMCO Real Return - Administrative Shares Sub-Account
<R>
PIMCO Total Return - Administrative Shares Sub-Account/(5)/
</R>
UIF U.S. Real Estate, Class II Sub-Account
Invesco V.I. Government Securities, Series II Sub-Account

CATEGORY C

Invesco V.I. Value Opportunities - Series II Sub-Account/(2)/
Invesco V.I. Core Equity - Series II Sub-Account
Invesco V.I. Mid Cap Core Equity - Series II Sub-Account
Fidelity(R) VIP Contrafund(R) - Service Class 2 Sub-Account
Fidelity(R) VIP Equity-Income - Service Class 2 Sub-Account
Fidelity(R) VIP Index 500 - Service Class 2 Sub-Account
Fidelity(R) VIP Overseas - Service Class 2 Sub-Account
Fidelity(R) VIP Asset Manager/(SM)/ - Service Class 2 Sub-Account
Janus Aspen Series Overseas - Service Shares Sub-Account
Janus Aspen Series Forty - Service Shares Sub-Account
<R>
Janus Aspen Series Perkins Mid Cap Value - Service Shares Sub-Account/(6)/
</R>
Janus Aspen Series Balanced - Service Shares Sub-Account
ClearBridge Variable Fundamental All Cap Value Portfolio - Class I Sub-Account
ClearBridge Variable Large Cap Value - Class I Sub-Account
MFS Investors Trust - Service Class Sub-Account
MFS Total Return - Service Class Sub-Account
<R>
MFS(R) MA Investors Growth Stock - Service Class Sub-Account/(4)/
  (FORMERLY, MFS INVESTORS GROWTH STOCK - SERVICE CLASS SUB-ACCOUNT)
</R>
MFS Value - Service Class Sub-Account
Oppenheimer Discovery Mid Cap Growth/VA - Class 2 Shares Sub-Account/(1)/
Oppenheimer Main Street Small Cap Fund/VA - Class 2 Shares Sub-Account
<R>
Guggenheim VIF Long Short Equity Sub-Account
</R>
T. Rowe Price Equity Income - II Sub-Account
T. Rowe Price Blue Chip Growth - II Sub-Account
Van Eck VIP Multi-Manager Alternatives Sub-Account
Invesco Van Kampen V.I. Growth and Income, Series II Sub-Account

CATEGORY D (VARIABLE SUB-ACCOUNTS NOT AVAILABLE UNDER MODEL PORTFOLIO OPTION 1)

Invesco V.I. American Franchise - Series II Sub-Account
Alger Large Cap Growth - Class S Sub-Account
Alger Capital Appreciation - Class S Sub-Account
<R>
Alger Mid Cap Growth - Class S Sub-Account/(3)/
</R>
Fidelity(R) VIP Growth - Service Class 2 Sub-Account
MFS New Discovery - Service Class Sub-Account

                                      21
Oppenheimer Global/VA - Class 2 Shares Sub-Account
UIF Growth, Class II Sub-Account
Van Eck VIP Emerging Markets Sub-Account
Van Eck VIP Global Hard Assets Sub-Account
Invesco V.I. Mid Cap Growth - Series II Sub-Account

(1)Effective as of August 30, 2010, the following Variable Sub-Account closed
   to all Contract Owners except those Contract Owners who had contract value
   invested in the Variable Sub-Account as of the closure date:

   Oppenheimer Discovery Mid Cap Growth/VA - Class 2 Shares Sub-Account

   Contract Owners who had contract value invested in this Variable Sub-Account
   as of the closure date may continue to submit additional investments into
   the Variable Sub-Account thereafter, although they will not be permitted to
   invest in the Variable Sub-Account if they withdraw or otherwise transfer
   their entire contract value from the Variable Sub-Account following the
   closure date. Contract Owners who did not have contract value invested in
   this Variable Sub-Account as of the specified closure date may not invest in
   the Variable Sub-Account.

(2)Effective August 19, 2011, the Invesco V.I. Value Opportunities - Series II
   Sub-Account closed to all Contract Owners EXCEPT those Contract Owners who
   had contract value invested in the Variable Sub-Account as of the closure
   date. Contract Owners who had contract value invested in the Variable
   Sub-Account as of the closure date may continue to submit additional
   investments into the Variable Sub-Account thereafter, although they will not
   be permitted to invest in the Variable Sub-Account if they withdraw or
   otherwise transfer their entire contract value from the Variable Sub-Account
   following the closure date. Contract Owners who did not have contract value
   invested in the Variable Sub-Account as of the closure date may not invest
   in the Variable Sub-Account.
<R>
(3)Effective as of January 31, 2014, the Alger Mid-Cap Growth - Class S
   Sub-Account was closed to all Contract Owners EXCEPT those Contract Owners
   who had contract value invested in the Variable Sub-Account as of the
   closure date. Contract Owners who had contract value invested in the
   Variable Sub-Account as of the closure date may continue to submit
   additional investments into the Variable Sub-Account thereafter, although
   they will not be permitted to invest in the Variable Sub-Account if they
   withdrew or otherwise transferred their entire contract value from the
   Variable Sub-Account following the closure date. Contract Owners who did not
   have contract value invested in the Variable Sub-Account as of the closure
   date will not be permitted to invest in the Variable Sub-Account.
(4)On or about March 27, 2015, the MFS(R) MA Investors Growth Stock Portfolio -
   Service Class, a portfolio of MFS(R) Variable Insurance Trust II, acquired
   the MFS(R) Investors Growth Stock Series - Service Class, a series of MFS(R)
   Variable Insurance Trust.
(5)Effective May 1, 2015, the PIMCO Total Return - Administrative Shares
   sub-account is closed to all contract owners except those contract owners
   who have contract value invested in the variable sub-account as of the
   closure date. Contract owners who have contract value invested in the
   variable sub-account as of the closure date may continue to submit
   additional investments into the variable sub-account thereafter, although
   they will not be permitted to invest in the variable sub-account if they
   withdraw or otherwise transfer their entire contract value from the variable
   sub-account following the closure date. Contract owners who do not have
   contract value invested in the variable sub-account as of the closure date
   will not be permitted to invest in the variable sub-account thereafter.
(6)Effective April 13, 2015, the Janus Aspen Series Perkins Mid Cap Value -
   Service Shares sub-account was closed to all contract owners except those
   contract owners who have contract value invested in the variable sub-account
   as of the closure date. Contract owners who have contract value invested in
   the variable sub-account as of the closure date may continue to submit
   additional investments into the variable sub-account thereafter, although
   they will not be permitted to invest in the variable sub-account if they
   withdraw or otherwise transfer their entire contract value from the variable
   sub-account following the closure date. Contract owners who do not have
   contract value invested in the variable sub-account as of the closure date
   will not be permitted to invest in the variable sub-account thereafter.
</R>

EACH CALENDAR QUARTER, WE WILL USE THE AUTOMATIC PORTFOLIO REBALANCING PROGRAM
TO AUTOMATICALLY REBALANCE YOUR CONTRACT VALUE IN EACH VARIABLE SUB-ACCOUNT AND
RETURN IT TO THE PERCENTAGE ALLOCATION REQUIREMENTS FOR MODEL PORTFOLIO
OPTION 1. WE WILL USE THE PERCENTAGE ALLOCATIONS AS OF YOUR MOST RECENT
INSTRUCTIONS.

MODEL PORTFOLIO OPTION 2.

The investment requirements under Model Portfolio Option 2 depend on the
effective date of your TrueReturn Accumulation Benefit Option.

RIDER DATE PRIOR TO MAY 1, 2005

If your TrueReturn Accumulation Benefit Option Rider Date is prior to May 1,
2005, and you choose Model Portfolio Option 2 or transfer your entire Contract
Value into Model Portfolio Option 2 under Guarantee Option 2, you must allocate
your Contract Value among four asset categories in accordance with the
percentage allocation requirements set out in the table below. You may choose
the Variable Sub-Accounts in which you want to invest, provided you maintain
the percentage allocation requirements for each category. You may also make
transfers among the Variable Sub-Accounts within each category at any time,
provided you maintain the percentage allocation requirements for each category.
However, each transfer you make will count against the 12 transfers you can
make each Contract Year without paying a transfer fee.

The following table describes the percentage allocation requirements for Model
Portfolio Option 2 (Rider Date prior to May 1, 2005) and the Variable
Sub-Accounts available under each category:

                           MODEL PORTFOLIO OPTION 2
                       (RIDER DATE PRIOR TO MAY 1, 2005)
                                10% Category A
                                20% Category B
                                50% Category C
                                20% Category D

CATEGORY A

Fidelity(R) VIP Money Market - Service Class 2 Sub-Account
PIMCO Money Market - Administrative Shares Sub-Account

CATEGORY B

Fidelity(R) VIP Investment Grade Bond - Service Class 2 Sub-Account
Western Asset Variable Global High Yield Bond - Class II Sub-Account
<R>
MFS High Yield - Service Class Sub-Account
</R>
PIMCO Foreign Bond (U.S. Dollar-Hedged) - Administrative Shares Sub-Account
PIMCO Real Return - Administrative Shares Sub-Account

                                      22
<R>
PIMCO Total Return - Administrative Shares Sub-Account/(4)/
</R>
UIF U.S. Real Estate, Class II Sub-Account
Invesco V.I. Government Securities, Series II Sub-Account

CATEGORY C

Invesco V.I. Basic Value - Series II Sub-Account
Invesco V.I. Mid Cap Core Equity - Series II Sub-Account
Fidelity(R) VIP Equity-Income - Service Class 2 Sub-Account
Fidelity(R) VIP Index 500 - Service Class 2 Sub-Account
Fidelity(R) VIP Asset Manager/(SM)/ - Service Class 2 Sub-Account
<R>
Janus Aspen Series Perkins Mid Cap Value - Service Shares Sub-Account/(5)/
</R>
Janus Aspen Series Balanced - Service Shares Sub-Account
ClearBridge Variable Large Cap Value - Class I Sub-Account
MFS Investors Trust - Service Class Sub-Account
MFS Total Return - Service Class Sub-Account
MFS Value - Service Class Sub-Account
Oppenheimer Discovery Mid Cap Growth Fund/VA - Class 2 Shares Sub-Account/(1)/
Premier VIT OpCap Balanced Sub-Account
T. Rowe Price Equity Income - II Sub-Account
Van Eck VIP Multi-Manager Alternatives Sub-Account
Invesco V.I. Growth and Income, Series II Sub-Account

CATEGORY D

Invesco V.I. American Franchise - Series II Sub-Account
Invesco V.I. Core Equity - Series II Sub-Account
Alger Large Cap Growth - Class S Sub-Account
Alger Capital Appreciation - Class S Sub-Account
<R>
Alger Mid Cap Growth - Class S Sub-Account/(2)/
</R>
Fidelity(R) VIP Contrafund(R) - Service Class 2 Sub-Account
Fidelity(R) VIP Growth - Service Class 2 Sub-Account
Fidelity(R) VIP Overseas - Service Class 2 Sub-Account
Janus Aspen Series Overseas - Service Shares Sub-Account
Janus Aspen Series Forty - Service Shares Sub-Account
ClearBridge Variable Fundamental All Cap Value Portfolio - Class I Sub-Account
MFS New Discovery - Service Class Sub-Account
<R>
MFS(R) MA Investors Growth Stock - Service Class Sub-Account/(3)/
  (FORMERLY, MFS INVESTORS GROWTH STOCK - SERVICE CLASS SUB-ACCOUNT)
</R>
Oppenheimer Global Fund/VA - Class 2 Shares
Oppenheimer Main Street Small Cap Fund - Class 2 Shares
<R>
Guggenheim VIF Long Short Equity Sub-Account
</R>
T. Rowe Price Blue Chip Growth - II Sub-Account
UIF Growth, Class II Sub-Account
Van Eck VIP Emerging Markets Sub-Account
Van Eck VIP Global Hard Assets Sub-Account
Invesco V.I. Mid Cap Growth, Series II Sub-Account

(1)Effective as of August 30, 2010, the following Variable Sub-Account closed
   to all Contract Owners except those Contract Owners who had contract value
   invested in the Variable Sub-Account as of the closure date:

   Oppenheimer Discovery Mid Cap Growth/VA - Class 2 Shares Sub-Account

   Contract Owners who had contract value invested in this Variable Sub-Account
   as of the closure date may continue to submit additional investments into
   the Variable Sub-Account thereafter, although they will not be permitted to
   invest in the Variable Sub-Account if they withdraw or otherwise transfer
   their entire contract value from the Variable Sub-Account following the
   closure date. Contract Owners who did not have contract value invested in
   this Variable Sub-Account as of the specified closure date may not invest in
   the Variable Sub-Account.

<R>
(2)Effective as of January 31, 2014, the Alger Mid-Cap Growth - Class S
   Sub-Account was closed to all Contract Owners EXCEPT those Contract Owners
   who had contract value invested in the Variable Sub-Account as of the
   closure date. Contract Owners who had contract value invested in the
   Variable Sub-Account as of the closure date may continue to submit
   additional investments into the Variable Sub-Account thereafter, although
   they will not be permitted to invest in the Variable Sub-Account if they
   withdrew or otherwise transferred their entire contract value from the
   Variable Sub-Account following the closure date. Contract Owners who did not
   have contract value invested in the Variable Sub-Account as of the closure
   date will not be permitted to invest in the Variable Sub-Account.

(3)On or about March 27, 2015, the MFS(R) MA Investors Growth Stock Portfolio -
   Service Class, a portfolio of MFS(R) Variable Insurance Trust II, acquired
   the MFS(R) Investors Growth Stock Series - Service Class, a series of MFS(R)
   Variable Insurance Trust.

(4)Effective May 1, 2015, the PIMCO Total Return - Administrative Shares
   sub-account is closed to all contract owners except those contract owners
   who have contract value invested in the variable sub-account as of the
   closure date. Contract owners who have contract value invested in the
   variable sub-account as of the closure date may continue to submit
   additional investments into the variable sub-account thereafter, although
   they will not be permitted to invest in the variable sub-account if they
   withdraw or otherwise transfer their entire contract value from the variable
   sub-account following the closure date. Contract owners who do not have
   contract value invested in the variable sub-account as of the closure date
   will not be permitted to invest in the variable sub-account thereafter.

(5)Effective April 13, 2015, the Janus Aspen Series Perkins Mid Cap Value -
   Service Shares sub-account was closed to all contract owners except those
   contract owners who have contract value invested in the variable sub-account
   as of the closure date. Contract owners who have contract value invested in
   the variable sub-account as of the closure date may continue to submit
   additional investments into the variable sub-account thereafter, although
   they will not be permitted to invest in the variable sub-account if they
   withdraw or otherwise transfer their entire contract value from the variable
   sub-account following the closure date. Contract owners who do not have
   contract value invested in the variable sub-account as of the closure date
   will not be permitted to invest in the variable sub-account thereafter.
</R>

EACH CALENDAR QUARTER, WE WILL USE THE AUTOMATIC PORTFOLIO REBALANCING PROGRAM
TO AUTOMATICALLY REBALANCE YOUR CONTRACT VALUE IN EACH VARIABLE SUB-ACCOUNT AND
RETURN IT TO THE PERCENTAGE ALLOCATION REQUIREMENTS FOR MODEL PORTFOLIO OPTION
2 (RIDER DATE PRIOR TO MAY 1, 2005). WE WILL USE THE PERCENTAGE ALLOCATIONS AS
OF YOUR MOST RECENT INSTRUCTIONS.

RIDER DATE ON OR AFTER MAY 1, 2005

If your TrueReturn Accumulation Benefit Option Rider Date is on or after May 1,
2005, and you choose Model Portfolio Option 2 or transfer your entire Contract
Value into Model Portfolio Option 2 under Guarantee Option 2, you may allocate
your Contract Value

                                      23
among any of a selected group of available Variable Sub-Accounts listed below.
However, you may not allocate your Contract Value among any of the excluded
Variable Sub-Accounts listed below. You may choose to invest in or transfer
among any of the available Variable Sub-Accounts, however, each transfer you
make will count against the 12 transfers you can make each Contract Year
without paying a transfer fee.

The following table lists the available and excluded Variable Sub-Accounts
under Model Portfolio Option 2 (Rider Date on or after May 1, 2005):

                           MODEL PORTFOLIO OPTION 2
                     (RIDER DATE ON OR AFTER MAY 1, 2005)
                                   Available

Invesco V.I. Value Opportunities - Series II Sub-Account/(2)/
Invesco V.I. Core Equity - Series II Sub-Account
Invesco V.I. Mid Cap Core Equity - Series II Sub-Account
Fidelity(R) VIP Contrafund(R) - Service Class 2 Sub-Account
Fidelity(R) VIP Equity-Income - Service Class 2 Sub-Account
Fidelity(R) VIP Index 500 - Service Class 2 Sub-Account
Fidelity(R) VIP Investment Grade Bond - Service Class 2 Sub-Account
Fidelity(R) VIP Overseas - Service Class 2 Sub-Account
Fidelity(R) VIP Asset Manager/(SM)/ - Service Class 2 Sub-Account
Fidelity(R) VIP Money Market - Service Class 2 Sub-Account
Janus Aspen Series Overseas - Service Shares Sub-Account
Janus Aspen Series Forty - Service Shares Sub-Account
<R>
Janus Aspen Series Perkins Mid Cap Value - Service Shares Sub-Account/(5)/
</R>
Janus Aspen Series Balanced - Service Shares Sub-Account
ClearBridge Variable Fundamental All Cap Value Portfolio - Class I Sub-Account
Western Asset Variable Global High Yield Bond - Class II Sub-Account
ClearBridge Variable Large Cap Value - Class I Sub-Account
MFS Investors Trust - Service Class Sub-Account
<R>
MFS High Yield - Service Class Sub-Account
MFS(R) MA Investors Growth Stock - Service Class Sub-Account/(4)/
  (FORMERLY, MFS INVESTORS GROWTH STOCK - SERVICE CLASS SUB-ACCOUNT)
</R>
MFS Total Return - Service Class Sub-Account
MFS Value - Service Class Sub-Account
PIMCO Foreign Bond (U.S. Dollar-Hedged) - Administrative Shares Sub-Account
PIMCO Money Market - Administrative Shares Sub-Account
PIMCO Real Return - Administrative Shares Sub-Account
<R>
PIMCO Total Return - Administrative Shares Sub-Account/(6)/
</R>
Oppenheimer Discovery Mid Cap Growth Fund/VA - Class 2 Shares Sub-Account/(1)/
Oppenheimer Main Street Small Cap Fund - Class 2 Shares
<R>
Guggenheim VIF Long Short Equity Sub-Account
</R>
T. Rowe Price Equity Income - II Sub-Account
T. Rowe Price Blue Chip Growth - II Sub-Account
UIF U.S. Real Estate, Class II Sub-Account
Van Eck VIP Multi-Manager Alternatives Sub-Account
Invesco V.I. Growth and Income, Series II Sub-Account
Invesco V.I. Government Securities, Series II Sub-Account

                           MODEL PORTFOLIO OPTION 2
                     (RIDER DATE ON OR AFTER MAY 1, 2005)
                                   Excluded

Invesco V.I. American Franchise - Series II Sub-Account
Alger Large Cap Growth - Class S Sub-Account
Alger Capital Appreciation - Class S Sub-Account
<R>
Alger Mid Cap Growth - Class S Sub-Account/ (3)/
</R>
Fidelity(R) VIP Growth - Service Class 2 Sub-Account
MFS New Discovery - Service Class Sub-Account
Oppenheimer Global Fund/VA - Class 2 Shares Sub-Account
UIF Growth Class II Sub-Account
Van Eck VIP Emerging Markets Sub-Account
Van Eck VIP Global Hard Assets Sub-Account
Invesco V.I. Mid Cap Growth, Series II Sub-Account

(1)Effective as of August 30, 2010, the following Variable Sub-Account closed
   to all Contract Owners except those Contract Owners who had contract value
   invested in the Variable Sub-Account as of the closure date:

   Oppenheimer Discovery Mid Cap Growth/VA - Class 2 Shares Sub-Account

   Contract Owners who had contract value invested in this Variable Sub-Account
   as of the closure date may continue to submit additional investments into
   the Variable Sub-Account thereafter, although they will not be permitted to
   invest in the Variable Sub-Account if they withdraw or otherwise transfer
   their entire contract value from the Variable Sub-Account following the
   closure date. Contract Owners who did not have contract value invested in
   this Variable Sub-Account as of the specified closure date may not invest in
   the Variable Sub-Account.

(2)Effective August 19, 2011, the Invesco V.I. Value Opportunities - Series II
   Sub-Account closed to all Contract Owners EXCEPT those Contract Owners who
   had contract value invested in the Variable Sub-Account as of the closure
   date. Contract Owners who had contract value invested in the Variable
   Sub-Account as of the closure date may continue to submit additional
   investments into the Variable Sub-Account thereafter, although they will not
   be permitted to invest in the Variable Sub-Account if they withdraw or
   otherwise transfer their entire contract value from the Variable Sub-Account
   following the closure date. Contract Owners who did not have contract value
   invested in the Variable Sub-Account as of the closure date may not invest
   in the Variable Sub-Account.

                                      24
<R>
(3)Effective as of January 31, 2014, the Alger Mid-Cap Growth - Class S
   Sub-Account was closed to all Contract Owners EXCEPT those Contract Owners
   who had contract value invested in the Variable Sub-Account as of the
   closure date. Contract Owners who had contract value invested in the
   Variable Sub-Account as of the closure date may continue to submit
   additional investments into the Variable Sub-Account thereafter, although
   they will not be permitted to invest in the Variable Sub-Account if they
   withdrew or otherwise transferred their entire contract value from the
   Variable Sub-Account following the closure date. Contract Owners who did not
   have contract value invested in the Variable Sub-Account as of the closure
   date will not be permitted to invest in the Variable Sub-Account.
(4)On or about March 27, 2015, the MFS(R) MA Investors Growth Stock Portfolio -
   Service Class, a portfolio of MFS(R) Variable Insurance Trust II, acquired
   the MFS(R) Investors Growth Stock Series - Service Class, a series of MFS(R)
   Variable Insurance Trust.
(5)Effective April 13, 2015, the Janus Aspen Series Perkins Mid Cap Value -
   Service Shares sub-account was closed to all contract owners except those
   contract owners who have contract value invested in the variable sub-account
   as of the closure date. Contract owners who have contract value invested in
   the variable sub-account as of the closure date may continue to submit
   additional investments into the variable sub-account thereafter, although
   they will not be permitted to invest in the variable sub-account if they
   withdraw or otherwise transfer their entire contract value from the variable
   sub-account following the closure date. Contract owners who do not have
   contract value invested in the variable sub-account as of the closure date
   will not be permitted to invest in the variable sub-account thereafter.
(6)Effective May 1, 2015, the PIMCO Total Return - Administrative Shares
   sub-account is closed to all contract owners except those contract owners
   who have contract value invested in the variable sub-account as of the
   closure date. Contract owners who have contract value invested in the
   variable sub-account as of the closure date may continue to submit
   additional investments into the variable sub-account thereafter, although
   they will not be permitted to invest in the variable sub-account if they
   withdraw or otherwise transfer their entire contract value from the variable
   sub-account following the closure date. Contract owners who do not have
   contract value invested in the variable sub-account as of the closure date
   will not be permitted to invest in the variable sub-account thereafter.
</R>

TRUEBALANCE/SM/ MODEL PORTFOLIO OPTIONS.

If you choose one of the TrueBalance/SM/ Model Portfolio Options or transfer
your entire Contract Value into one of the TrueBalance/SM/ Model Portfolio
Options, you may not choose the Variable Sub-Accounts or make transfers among
the Variable Sub-Accounts in the TrueBalance Model Portfolio Option. Each
TrueBalance Model Portfolio involves an allocation of assets among a group of
pre-selected Variable Sub-Accounts. You cannot make transfers among the
Variable Sub-Accounts nor vary the Variable Sub-Accounts that comprise a
TrueBalance Model Portfolio Option. If you choose a TrueBalance Model Portfolio
Option, we will invest and periodically reallocate your Contract Value
according to the allocation percentages and requirements for the TrueBalance
Model Portfolio Option you have selected currently. For more information
regarding the TrueBalance program, see the "TrueBalance/SM/ Asset Allocation
Program" section of this prospectus. However, note that the restrictions
described in this section, specifically the restrictions on transfers and the
requirement that all of your Contract Value be allocated to a TrueBalance Model
Portfolio Option, apply to the TrueBalance program only if you have added the
TrueReturn Option to your Contract.

PLEASE NOTE ONLY CERTAIN TRUEBALANCE MODEL PORTFOLIO OPTIONS ARE AVAILABLE WITH
YOUR TRUERETURN OPTION AS SUMMARIZED IN THE TABLE UNDER INVESTMENT REQUIREMENTS
ABOVE.

CANCELLATION OF THE TRUERETURN OPTION.

You may not cancel the TrueReturn Option or make transfers, changes to your
investment allocations, or changes to the Automatic Portfolio Rebalancing
Program that are inconsistent with the investment restrictions applicable to
your Guarantee Option and/or Model Portfolio Option prior to the 5th Rider
Anniversary. Failure to comply with the investment requirements for any reason
may result in the cancellation of the TrueReturn Option. On or after the 5th
Rider Anniversary, we will cancel the TrueReturn Option if you make transfers,
changes to your investment allocations, or changes to the Automatic Portfolio
Rebalancing Program that are inconsistent with the investment requirements
applicable to your Guarantee Option and/or Model Portfolio Option. We will not
cancel the TrueReturn Option or make any changes to your investment allocations
or to the Automatic Portfolio Rebalancing Program that are inconsistent with
the investment restrictions applicable to your Guarantee Option until we
receive notice from you that you wish to cancel the TrueReturn Option. No
Accumulation Benefit will be paid if you cancel the Option prior to the Rider
Maturity Date.

DEATH OF OWNER OR ANNUITANT.

<R>
If the Contract Owner or Annuitant dies before the Rider Maturity Date and the
Contract is continued under Option D of the Death of Owner or Death of
Annuitant provision as described on page 60 of this prospectus, then the
TrueReturn Option will continue, unless the new Contract Owner elects to cancel
this Option. If the TrueReturn Option is continued, it will remain in effect
until terminated. If the Contract is not continued under Option D, then the
TrueReturn Option will terminate on the date we receive a Complete Request for
Settlement of the Death Proceeds.
</R>

If an Annuitant dies before the Payout Start Date, and the Contract is
continued under Category 1 of the Death of Annuitant provision of the Contract,
the TrueReturn Accumulation Benefit Option will remain in effect until
terminated. If the Contract is not continued under Category 1, then the
TrueReturn Accumulation Benefit Option will terminate on the date we receive a
complete request for settlement of the Death Proceeds.

RIDER TRADE-IN OPTION.

We offer a "Rider Trade-In Option" that allows you to cancel your TrueReturn
Accumulation Benefit Option and immediately add a new TrueReturn Accumulation
Benefit Option ("NEW OPTION"), provided all of the following conditions are met:

..  The trade-in must occur on or after the 5th Rider Anniversary and prior to
   the Rider Maturity Date.

..  The New Option will be made a part of your Contract on the date the existing
   TrueReturn Accumulation Benefit Option is cancelled, provided it is
   cancelled for reasons other than the termination of your Contract.

..  The New Option must be a TrueReturn Accumulation Benefit Option that we make
   available for use with the Rider Trade-In Option.

                                      25
..  The issue requirements and terms and conditions of the New Option must be
   met as of the date the New Option is made a part of your Contract.

For example, if you trade-in your TrueReturn Accumulation Benefit Option:

..  the new Rider Fee will be based on the Rider Fee percentage applicable to a
   new TrueReturn Accumulation Benefit Option at the time of trade-in;

..  the Benefit Base for the New Option will be based on the Contract Value as
   of the new Rider Date;

..  the AB Factor will be determined by the Rider Periods and Guarantee Options
   available with the New Option;

..  the Model Portfolio Options will be determined by the Model Portfolio
   Options offered with the Guarantee Options available with the New Option;

..  any waiting period for canceling the New Option will start again on the new
   Rider Date;

..  any waiting period for exercising the Rider Trade-In Option will start again
   on the new Rider Date; and

..  the terms and conditions of the Rider Trade-In Option will be according to
   the requirements of the New Option.

Currently, we are also making the SureIncome Option available at the time of
your first utilization of this TrueReturn Accumulation Benefit Option Rider
Trade-In Option. We may discontinue offering the SureIncome Option under the
Rider Trade-In Option for new TrueReturn Accumulation Benefit Options added in
the future at anytime at our discretion. If we do so, TrueReturn Options issued
prior to this time will continue to have the SureIncome Option available at the
time of the first utilization of this TrueReturn Rider Trade-In Option. You may
cancel your TrueReturn Accumulation Benefit Option and immediately add a new
SureIncome Option, provided all of the following conditions are met:

..  The trade-in must occur on or after the 5th Rider Anniversary and prior to
   the Rider Maturity Date. We reserve the right to extend the date at which
   time the trade-in may occur to up to the 10th anniversary of the Rider Date
   at any time in our sole discretion. Any change we make will not apply to a
   TrueReturn Accumulation Benefit Option that was added to your Contract prior
   to the implementation date of the change.

..  The new SureIncome Option will be made a part of your Contract on the date
   the existing TrueReturn Accumulation Benefit Option is cancelled, provided
   it is cancelled for reasons other than the termination of your Contract.

..  The new SureIncome Option must be a SureIncome Option that we make available
   for use with this Rider Trade-In Option.

..  The issue requirements and terms and conditions of the new SureIncome Option
   must be met as of the date the new SureIncome Option is made a part of your
   Contract.

You should consult with your sales representative before trading in your
TrueReturn Accumulation Benefit Option.

TERMINATION OF THE TRUERETURN OPTION.

The TrueReturn Option will terminate on the earliest of the following to occur:

..  on the Rider Maturity Date;

..  on the Payout Start Date;

..  on the date your Contract is terminated;

..  on the date the Option is cancelled;

..  on the date we receive a Complete Request for Settlement of the Death
   Proceeds; or

..  on the date the Option is replaced with a New Option under the Rider
   Trade-In Option.

We will not pay an Accumulation Benefit if the TrueReturn Option is terminated
for any reason prior to the Rider Maturity Date.

SUREINCOME WITHDRAWAL BENEFIT OPTION

We offer the SureIncome Withdrawal Benefit Option, which is available for an
additional fee. The SureIncome Option provides a guaranteed withdrawal benefit
that gives you the right to take limited partial withdrawals that total an
amount equal to your purchase payments plus any applicable credit enhancements
(subject to certain restrictions). Therefore, regardless of the subsequent
fluctuations in the value of your Contract Value, you are entitled to a Benefit
Payment each Benefit Year until your Benefit Base is exhausted (terms defined
below).

The SureIncome Option guarantees an amount up to the "BENEFIT PAYMENT
REMAINING" which will be available for withdrawal from the Contract each
"BENEFIT YEAR" until the "BENEFIT BASE" (defined below) is reduced to zero. If
the Contract Value is reduced to zero and the Benefit Base is still greater
than zero, we will distribute an amount equal to the Benefit Base to the
Contract Owner as described below under the "WITHDRAWAL BENEFIT PAYOUT PHASE".

For purposes of the SureIncome Option, "withdrawal" means the gross amount of a
withdrawal before any applicable charges such as withdrawal charges, fees,
taxes or adjustments including any applicable Market Value Adjustments and
surrender charges. Under the

                                      26
SureIncome Option, we currently do not treat a withdrawal that reduces the
Contract Value to less than $1,000 as a withdrawal of the entire Contract Value.

The "RIDER DATE" is the date the SureIncome Option was made a part of your
Contract. The initial Benefit Year is the period between the Rider Date and the
first Contract Anniversary after the Rider Date. Each subsequent Benefit Year
will coincide with (the same as) the Contract Year.

The SureIncome Option is available at issue of the Contract, or may be added
later, subject to availability and issue requirements. You may not add the
SureIncome Option to your Contract after Contract issue without our prior
approval if your Contract Value is greater than $1,000,000 at the time you try
to add the SureIncome Option. You may have only one SureIncome Option in effect
on your Contract at one time. You may only have either the TrueReturn
Accumulation Benefit Option, or the SureIncome Option in effect on your
Contract at the same time. The SureIncome Option is only available if the
oldest Contract Owner and oldest Annuitant are age 85 or younger on the
effective date of the Rider (the "Rider Application Date") (The maximum age may
depend on your state). The SureIncome Option is not available to be added to a
Contract categorized as a Tax Sheltered Annuity as defined under Internal
Revenue Code Section 403(b) at this time. We reserve the right to make the
SureIncome Option available to such Contracts on a nondiscriminatory basis in
the future at our discretion. Once added to your Contract, the SureIncome
Option may be cancelled at any time on or after the 5th calendar year
anniversary of the Rider Date by notifying us in writing in a form satisfactory
to us.

The SureIncome Option may not be available in all states. We may discontinue
offering the SureIncome Option at any time to new Contract Owners and to
existing Contract Owners who did not elect the SureIncome Option prior to the
date of discontinuance.

WITHDRAWAL BENEFIT FACTOR

The "WITHDRAWAL BENEFIT FACTOR" is used to determine the "BENEFIT PAYMENT" and
Benefit Payment Remaining. We currently offer a Withdrawal Benefit Factor equal
to 8%. We reserve the right to make other Withdrawal Benefit Factors available
in the future for new SureIncome Options and/or to eliminate the current
Withdrawal Benefit Factor. Once a Withdrawal Benefit Factor has been
established for a SureIncome Option, it cannot be changed after the Rider Date
unless that SureIncome Option is terminated.

BENEFIT PAYMENT AND BENEFIT PAYMENT REMAINING

The Benefit Payment is the amount available at the beginning of each Benefit
Year that you may withdraw during that Benefit Year. The Withdrawal Benefit
Factor and the Benefit Base are used to determine your Benefit Payment. The
Benefit Payment Remaining is the amount remaining after any previous
withdrawals in a Benefit Year that you may withdraw without reducing your
Benefit Base by more than the amount of the withdrawal and without reducing
your Benefit Payment available in future Benefit Years. Please note that any
premiums or withdrawals made on a Contract Anniversary would be applied to the
Benefit Year that just ended on that Contract Anniversary.

At the beginning of each Benefit Year, the Benefit Payment Remaining is equal
to the Benefit Payment.

During each Benefit Year the Benefit Payment Remaining will be increased by
purchase payments (and Credit Enhancements for CONSULTANT SOLUTIONS PLUS
CONTRACTS) multiplied by the Withdrawal Benefit Factor (currently 8% for new
SureIncome Options) and reduced by the amount of each withdrawal. The Benefit
Payment Remaining will never be less than zero.

On the Rider Date, the Benefit Payment is equal to the greater of:

..  The Contract Value multiplied by the Withdrawal Benefit Factor (currently 8%
   for new SureIncome Options); or

..  The value of the Benefit Payment of the previous Withdrawal Benefit Option
   (attached to your Contract) that is being terminated under a rider trade-in
   option (see "Rider Trade-In Option" below for more information), if
   applicable.

After the Rider Date, the Benefit Payment will be increased by purchase
payments (and Credit Enhancements for CONSULTANT SOLUTIONS PLUS CONTRACTS)
multiplied by the Withdrawal Benefit Factor and affected by withdrawals as
follows:

..  If the withdrawal is less than or equal to the Benefit Payment Remaining in
   effect immediately prior to the withdrawal, the Benefit Payment is unchanged.

..  If the withdrawal is greater than the Benefit Payment Remaining in effect
   immediately prior to the withdrawal, the Benefit Payment will be the lesser
   of:

    .  The Benefit Payment immediately prior to the withdrawal; or

    .  The Contract Value immediately prior to withdrawal less the amount of
       the withdrawal, multiplied by the Withdrawal Benefit Factor.

At our discretion, the Benefit Payment available during a Benefit Year may be
increased on a nondiscriminatory basis and without prior notice in order to
satisfy IRS minimum distribution requirements on the Contract under which this
Option has been elected. We are currently not increasing the Benefit Payment
available to satisfy IRS minimum distribution requirements, which may result in
a withdrawal greater than the Benefit Payment Remaining.

                                      27
BENEFIT BASE

The Benefit Base is not available as a Contract Value or Settlement Value. The
Benefit Base is used solely to help calculate the Rider Fee, the amount that
may be withdrawn and payments that may be received under the SureIncome Option.
On the Rider Date, the Benefit Base is equal to the Contract Value. After the
Rider Date, the Benefit Base will be increased by purchase payments (and Credit
Enhancements for CONSULTANT SOLUTIONS PLUS CONTRACTS) and decreased by
withdrawals as follows:

..  If the withdrawal is less than or equal to the Benefit Payment Remaining in
   effect immediately prior to the withdrawal, the Benefit Base will be reduced
   by the amount of the withdrawal.

If the withdrawal is greater than the Benefit Payment Remaining in effect
immediately prior to the withdrawal, the Benefit Base will be the lesser of:

..  The Contract Value immediately prior to withdrawal less the amount of the
   withdrawal; or

..  The Benefit Base immediately prior to withdrawal less the amount of the
   withdrawal.

The Benefit Base may also be reduced in other situations as detailed in the
"Owner and Assignment of Payments or Interest" section below.

IF THE BENEFIT BASE IS REDUCED TO ZERO, THIS SUREINCOME OPTION WILL TERMINATE.

For numerical examples that illustrate how the values defined under the
SureIncome Option are calculated, see Appendix G.

CONTRACT OWNER AND ASSIGNMENT OF PAYMENTS OR INTEREST

If you change the Contract Owner or assign any payments or interest under this
Contract, as allowed, to any living or non-living person other than your spouse
on or after the first calendar year anniversary of the Rider Date, the Benefit
Base will be recalculated to be the lesser of the Contract Value and the
Benefit Base at the time of assignment.

CONTRACT VALUE

If your Contract Value is reduced to zero due to fees or withdrawals and your
Benefit Base is still greater than zero, your Contract will immediately enter
the Withdrawal Benefit Payout Phase. Under the SureIncome Option, we currently
do not treat a withdrawal that reduces the Contract Value to less than $1,000
as a withdrawal of the entire Contract Value. We reserve the right to change
this at any time.

WITHDRAWAL BENEFIT PAYOUT PHASE

Under the Withdrawal Benefit Payout Phase, the Accumulation Phase of the
Contract ends and the Contract enters the Payout Phase subject to the following:

..  The "WITHDRAWAL BENEFIT PAYOUT START DATE" is the date the Withdrawal
   Benefit Payout Phase is entered and the Accumulation Phase of the Contract
   ends.

..  No further withdrawals, purchase payments or any other actions associated
   with the Accumulation Phase can be made after the Withdrawal Benefit Payout
   Start Date.

..  The Payout Start Date is the first day of the next Benefit Year after the
   Withdrawal Benefit Payout Start Date. We reserve the right to allow other
   Payout Start Dates to be requested on a nondiscriminatory basis without
   prior notice.

..  During the Withdrawal Benefit Payout Phase, we will make scheduled fixed
   income payments to the Owner (or new Contract Owner) at the end of each
   month starting one month after the Payout Start Date. The amount of each
   payment will be equal to the Benefit Payment divided by 12, unless a payment
   frequency other than monthly is requested in a form acceptable to us and
   received by us before the first payment is made (the amount of each payment
   will be adjusted accordingly; i.e. if the payment frequency requested is
   quarterly, the amount of each payment will be equal to the Benefit Payment
   divided by 4). Payments will be made over a period certain such that total
   payments made will equal the Benefit Base on the Payout Start Date;
   therefore, the final payment may be reduced. If your Contract is a qualified
   contract, meaning an individual retirement annuity qualified as defined
   under Internal Revenue Code Section 408(b) or a Tax Sheltered Annuity as
   defined under Internal Revenue Code Section 403(b), the period certain
   cannot exceed that which is required by Internal Revenue Code
   Section 401(a)(9) and regulations promulgated thereunder. Therefore, the
   amount of each payment under this Option may be larger so that the sum of
   the payments made over this period equals the Benefit Base on the Payout
   Start Date. Additionally, if your Contract is a qualified contract, we will
   not permit a change in the payment frequency or level.

..  If your Contract is a non-qualified contract, we reserve the right to allow
   other payment frequencies or levels to be requested on a nondiscriminatory
   basis without prior notice. In no event will we allow more than one change
   in the payment frequency or level during a Contract Year.

..  If the Contract Owner dies before all payments have been made, the remaining
   payments will continue to be made to the new Contract Owner as scheduled.

..  Once all scheduled payments have been paid, the Contract will terminate.

                                      28
Generally, you may not make withdrawals, purchase payments or any other actions
associated with the Accumulation Phase after the Withdrawal Benefit Payout
Start Date.

EXAMPLE

BEGINNING OF BENEFIT YEAR 1*

Contract Value = $100,000

Benefit Base = $100,000

Benefit Payment = $8,000

Benefit Payment Remaining = $8,000

In this example, you can take a Benefit Payment of up to $8,000 in Benefit Year
1. If a withdrawal of $6,000 is taken then the following values would apply:

Contract Value = $94,000 (Assuming that your Contract Value has not been
affected by any other factors)

Benefit Base = $94,000

Benefit Payment = $8,000

Benefit Payment Remaining = $2,000

BEGINNING OF BENEFIT YEAR 2

Contract Value = $70,000 (Assuming that your contract value has declined due to
poor performance)

Benefit Base = $94,000

Benefit Payment = $8,000

Benefit Payment Remaining = $8,000 (resets at the beginning of each Benefit
Year)

In Benefit Year 2 you have the right to a Benefit Payment of $8,000 and since
you have not taken any withdrawals yet in Benefit Year 2, the Benefit Payment
Remaining would also be $8,000 at the beginning of Benefit Year 2.

*  THIS EXAMPLE ASSUMES AN INITIAL CONTRACT VALUE OF $100,000, NO ADDITIONAL
   PURCHASE PAYMENTS, A WITHDRAWAL BENEFIT FACTOR OF 8% AND DOES NOT TAKE INTO
   ACCOUNT FEES OR CHARGES.

INVESTMENT REQUIREMENTS

If you add the SureIncome Option to your Contract, you must adhere to certain
requirements related to the investment alternatives in which you may invest.
The specific requirements are described below in more detail and will depend on
your currently selected Model Portfolio Option and your Withdrawal Benefit
Factor. These requirements may include, but are not limited to, maximum
investment limits on certain Variable Sub-Accounts or on certain Fixed Account
Options, exclusion of certain Variable Sub-Accounts or of certain Fixed Account
Options, required minimum allocations to certain Variable Sub-Accounts, and
restrictions on transfers to or from certain investment alternatives. We may
also require that you use the Automatic Portfolio Rebalancing Program. We may
change the specific requirements that are applicable at any time in our sole
discretion. Any changes we make will not apply to a SureIncome Option that was
made a part of your Contract prior to the implementation date of the change,
except for changes made due to a change in investment alternatives available
under the Contract. This restriction does not apply to a new Option elected
pursuant to the Rider Trade-In Option. We reserve the right to have
requirements unique to specific Withdrawal Benefit Factors if we make other
Withdrawal Benefit Factors available in the future, including specific model
portfolio options ("Model Portfolio Options") as described below, available
only to certain Withdrawal Benefit Factors.

When you add the SureIncome Option to your Contract, you must allocate your
entire Contract Value as follows:

1) to a MODEL PORTFOLIO OPTION available as described below;

2) to the DCA Fixed Account Option and then transfer all purchase payments (and
   Credit Enhancements for Consultant Solutions Plus Contracts) and interest to
   the Variable Sub-Accounts; or

3) to a combination of (1) and (2) above.

For (2) and (3) above, the requirements for the DCA Fixed Account Option must
be met. See the "Dollar Cost Averaging Fixed Account Option" section of this
prospectus for more information.

On the Rider Date, you must select only one of the Model Portfolio Options in
which to allocate your Contract Value. After the Rider Date, you may transfer
your entire Contract Value to any of the other available Model Portfolio
Options. We currently offer several Model Portfolio Options. The Model
Portfolio Options that are available may differ depending upon the effective
date of your Withdrawal Benefit Option and your Withdrawal Benefit Factor.
Please refer to the Model Portfolio Option and TrueBalance/SM/ Model Portfolio
Options sections for more details. We may add other Model Portfolio Options in
the future. We also may remove Model Portfolio Options in the future anytime
prior to the date you select such Model Portfolio Option. In addition, if the
investment

                                      29
alternatives available under the Contract change, we may revise the Model
Portfolio Options. The following table summarizes the Model Portfolio Options
currently available for use:

                           *MODEL PORTFOLIO OPTION 1

*  TrueBalance Conservative Model Portfolio Option
*  TrueBalance Moderately Conservative Model Portfolio Option
*  TrueBalance Moderate Model Portfolio Option
*  TrueBalance Moderately Aggressive Model Portfolio Option
*  TrueBalance Aggressive Model Portfolio Option

You may not allocate any of your Contract Value to the Standard Fixed Account
Option or to the Market Value Adjusted Fixed Account Option. You must transfer
any portion of your Contract Value that is allocated to the Standard Fixed
Account Option or to the Market Value Adjusted Fixed Account Option to the
Variable Sub-Accounts prior to adding the SureIncome Option to your Contract.
Transfers from the Market Value Adjusted Fixed Account Option may be subject to
a Market Value Adjustment. You may allocate any portion of your purchase
payments (and Credit Enhancements for CONSULTANT SOLUTIONS PLUS CONTRACTS) to
the DCA Fixed Account Option on the Rider Date, provided the DCA Fixed Account
Option is available with your Contract and in your state. See the "Dollar Cost
Averaging Fixed Account Option" section of this prospectus for more
information. We use the term "TRANSFER PERIOD ACCOUNT" to refer to each
purchase payment allocation made to the DCA Fixed Account Option for a
specified term length. At the expiration of a Transfer Period Account any
remaining amounts in the Transfer Period Account will be transferred to the
Variable Sub-Accounts according to your most recent percentage allocation
selections.

Any subsequent purchase payments (and Credit Enhancements for CONSULTANT
SOLUTIONS PLUS CONTRACTS) made to your Contract will be allocated to the
Variable Sub-Accounts according to your specific instructions or your
allocation for the previous purchase payment, unless you request that the
purchase payment (and Credit Enhancement for CONSULTANT SOLUTIONS PLUS
CONTRACTS) be allocated to the DCA Fixed Account Option. Purchase payments
allocated to the DCA Fixed Account Option must be $500 or more. Any withdrawals
you request will reduce your Contract Value invested in each of the investment
alternatives on a pro rata basis in the proportion that your Contract Value in
each bears to your total Contract Value in all Variable Sub-Accounts, unless
you request otherwise.

MODEL PORTFOLIO OPTION 1.

If you choose Model Portfolio Option 1 or transfer your entire Contract Value
into Model Portfolio Option 1, you currently may allocate up to 100% of your
Contract Value in any manner you choose to the Available Variable Sub-Accounts
shown in the table below. You may not allocate ANY PORTION of your Contract
Value to the Excluded Variable Sub-Accounts. You may make transfers among any
of the Available Variable Sub-Accounts. However, each transfer you make will
count against the 12 transfers you can make each Contract Year without paying a
transfer fee.

Currently the Available Variable Sub-Accounts and the Excluded Variable
Sub-Accounts are as follows:

                                   Available

Invesco V.I. Value Opportunities - Series II Sub-Account/(2)/
Invesco V.I. Core Equity - Series II Sub-Account
Invesco V.I. Mid Cap Core Equity - Series II Sub-Account
Fidelity(R) VIP Contrafund(R) - Service Class 2 Sub-Account
Fidelity(R) VIP Equity-Income - Service Class 2 Sub-Account
Fidelity(R) VIP Index 500 - Service Class 2 Sub-Account
Fidelity(R) VIP Investment Grade Bond - Service Class 2 Sub-Account
Fidelity(R) VIP Overseas - Service Class 2 Sub-Account
Fidelity(R) VIP Asset Manager/(SM)/ - Service Class 2 Sub-Account
Fidelity(R) VIP Money Market - Service Class 2 Sub-Account
Janus Aspen Series Overseas - Service Shares Sub-Account
Janus Aspen Series Forty - Service Shares Sub-Account
<R>
Janus Aspen Series Perkins Mid Cap Value - Service Shares Sub-Account/(5)/
</R>
Janus Aspen Series Balanced - Service Shares Sub-Account
ClearBridge Variable Fundamental All Cap Value Portfolio - Class I Sub-Account
Western Asset Variable Global High Yield Bond - Class II Sub-Acount
ClearBridge Variable Large Cap Value - Class I Sub-Account
MFS Investors Trust - Service Class Sub-Account
<R>
MFS High Yield - Service Class Sub-Account
MFS(R) MA Investors Growth Stock - Service Class Sub-Account/(4)/
  (FORMERLY, MFS INVESTORS GROWTH STOCK - SERVICE CLASS SUB-ACCOUNT)
</R>
MFS Total Return - Service Class Sub-Account
MFS Value - Service Class Sub-Account
<R>
Oppenheimer Discovery Mid Cap Growth Fund/VA - Class 2 Shares Sub-Account/(1)/
</R>
Oppenheimer Main Street Small Cap Fund - Class 2 Shares Sub-Account
PIMCO Foreign Bond (U.S. Dollar-Hedged) - Administrative Shares Sub-Account
PIMCO Money Market - Administrative Shares Sub-Account
PIMCO Real Return - Administrative Shares Sub-Account
<R>
PIMCO Total Return - Administrative Shares Sub-Account/(6)/
Guggenheim VIF Long Short Equity Sub-Account
</R>
T. Rowe Price Equity Income - II Sub-Account
T. Rowe Price Blue Chip Growth - II Sub-Account
UIF U.S. Real Estate, Class II Sub-Account

                                      30
Van Eck VIP Multi-Manager Alternatives Sub-Account
Invesco V.I. Growth and Income, Series II Sub-Account
Invesco V.I. Government Securities, Series II Sub-Account

                                   Excluded

Invesco V.I. American Franchise - Series II Sub-Account
Alger Large Cap Growth - Class S Sub-Account
Alger Capital Appreciation - Class S Sub-Account
<R>
Alger Mid Cap Growth - Class S Sub-Account/(3)/
</R>
Fidelity(R) VIP Growth - Service Class 2 Sub-Account
MFS New Discovery - Service Class Sub-Account
Oppenheimer Global Fund/VA - Class 2 Shares
UIF Growth, Class II Sub-Account
Van Eck VIP Emerging Markets Sub-Account
Van Eck VIP Global Hard Assets Sub-Account
Invesco V.I. Mid Cap Growth, Series II Sub-Account

(1)Effective as of August 30, 2010, the following Variable Sub-Account closed
   to all Contract Owners except those Contract Owners who had contract value
   invested in the Variable Sub-Account as of the closure date:

   Oppenheimer Discovery Mid Cap Growth Fund/VA - Class 2 Shares Sub-Account

   Contract Owners who had contract value invested in this Variable Sub-Account
   as of the closure date may continue to submit additional investments into
   the Variable Sub-Account thereafter, although they will not be permitted to
   invest in the Variable Sub-Account if they withdraw or otherwise transfer
   their entire contract value from the Variable Sub-Account following the
   closure date. Contract Owners who did not have contract value invested in
   this Variable Sub-Account as of the specified closure date may not invest in
   the Variable Sub-Account.

(2)Effective August 19, 2011, the Invesco V.I. Value Opportunities - Series II
   Sub-Account closed to all Contract Owners EXCEPT those Contract Owners who
   had contract value invested in the Variable Sub-Account as of the closure
   date. Contract Owners who had contract value invested in the Variable
   Sub-Account as of the closure date may continue to submit additional
   investments into the Variable Sub-Account thereafter, although they will not
   be permitted to invest in the Variable Sub-Account if they withdraw or
   otherwise transfer their entire contract value from the Variable Sub-Account
   following the closure date. Contract Owners who did not have contract value
   invested in the Variable Sub-Account as of the closure date may not invest
   in the Variable Sub-Account.
<R>
(3)Effective as of January 31, 2014, the Alger Mid-Cap Growth - Class S
   Sub-Account was closed to all Contract Owners EXCEPT those Contract Owners
   who had contract value invested in the Variable Sub-Account as of the
   closure date. Contract Owners who had contract value invested in the
   Variable Sub-Account as of the closure date may continue to submit
   additional investments into the Variable Sub-Account thereafter, although
   they will not be permitted to invest in the Variable Sub-Account if they
   withdrew or otherwise transferred their entire contract value from the
   Variable Sub-Account following the closure date. Contract Owners who did not
   have contract value invested in the Variable Sub-Account as of the closure
   date will not be permitted to invest in the Variable Sub-Account.
(4)On or about March 27, 2015, the MFS(R) MA Investors Growth Stock Portfolio -
   Service Class, a portfolio of MFS(R) Variable Insurance Trust II, acquired
   the MFS(R) Investors Growth Stock Series - Service Class, a series of MFS(R)
   Variable Insurance Trust.
(5)Effective April 13, 2015, the Janus Aspen Series Perkins Mid Cap Value -
   Service Shares sub-account was closed to all contract owners except those
   contract owners who have contract value invested in the variable sub-account
   as of the closure date. Contract owners who have contract value invested in
   the variable sub-account as of the closure date may continue to submit
   additional investments into the variable sub-account thereafter, although
   they will not be permitted to invest in the variable sub-account if they
   withdraw or otherwise transfer their entire contract value from the variable
   sub-account following the closure date. Contract owners who do not have
   contract value invested in the variable sub-account as of the closure date
   will not be permitted to invest in the variable sub-account thereafter.
(6)Effective May 1, 2015, the PIMCO Total Return - Administrative Shares
   sub-account is closed to all contract owners except those contract owners
   who have contract value invested in the variable sub-account as of the
   closure date. Contract owners who have contract value invested in the
   variable sub-account as of the closure date may continue to submit
   additional investments into the variable sub-account thereafter, although
   they will not be permitted to invest in the variable sub-account if they
   withdraw or otherwise transfer their entire contract value from the variable
   sub-account following the closure date. Contract owners who do not have
   contract value invested in the variable sub-account as of the closure date
   will not be permitted to invest in the variable sub-account thereafter
</R>

TRUEBALANCE/SM/ MODEL PORTFOLIO OPTIONS.

If you choose one of the TrueBalance/SM/ Model Portfolio Options or transfer
your entire Contract Value into one of the TrueBalance/SM/ Model Portfolio
Options, you may not choose the Variable Sub-Accounts or make transfers among
the Variable Sub-Accounts in the TrueBalance Model Portfolio Option. Each
TrueBalance Model Portfolio involves an allocation of assets among a group of
pre-selected Variable Sub-Accounts. You cannot make transfers among the
Variable Sub-Accounts nor vary the Variable Sub-Accounts that comprise a
TrueBalance Model Portfolio Option. If you choose a TrueBalance Model Portfolio
Option, we will invest and periodically reallocate your Contract Value
according to the allocation percentages and requirements for the TrueBalance
Model Portfolio Option you have selected currently. For more information
regarding the TrueBalance program, see the "TrueBalance/SM/ Asset Allocation
Program" section of this prospectus. However, note that the restrictions
described in this section, specifically the restrictions on transfers and the
requirement that all of your Contract Value be allocated to a TrueBalance Model
Portfolio Option, apply to the TrueBalance program only if you have added the
SureIncome Option to your Contract.

CANCELLATION OF THE SUREINCOME OPTION

You may not cancel the SureIncome Option prior to the 5th calendar year
anniversary of the Rider Date. On or after the 5th calendar year anniversary of
the Rider Date you may cancel the rider by notifying us in writing in a form
satisfactory to us. We reserve the right to extend the date at which time the
cancellation may occur to up to the 10th calendar year anniversary of the Rider
Date at any time in our sole discretion. Any change we make will not apply to a
SureIncome Option that was added to your Contract prior to the implementation
date of the change.

RIDER TRADE-IN OPTION

We offer a "RIDER TRADE-IN OPTION" that allows you to cancel your SureIncome
Option and immediately add a new Withdrawal Benefit Option ("New SureIncome
Option"). We may also offer other Options ("Other New Options") under the Rider
Trade-In Option. However, you may only select one Option under this Rider
Trade-In Option at the time you cancel your SureIncome Option.

                                      31
Currently, we are also making the TrueReturn Accumulation Benefit Option
available at the time of your first utilization of this Rider Trade-In Option
so that you have the ability to switch from the SureIncome Option to the
TrueReturn Accumulation Benefit Option. We may discontinue offering the
TrueReturn Option under the Rider Trade-In Option for New SureIncome Options
added in the future at anytime at our discretion.

This Rider Trade-in Option is available provided all of the following
conditions are met:

..  The trade-in must occur on or after the 5th calendar year anniversary of the
   Rider Date. We reserve the right to extend the date at which time the
   trade-in may occur to up to the 10th calendar year anniversary of the Rider
   Date at any time in our sole discretion. Any change we make will not apply
   to a SureIncome Option that was added to your Contract prior to the
   implementation date of the change.

..  The New Option will be made a part of your Contract on the date the existing
   Option is cancelled, provided it is cancelled for reasons other than the
   termination of your Contract.

..  The New Option must be an Option that we make available for use with this
   Rider Trade-In Option.

..  The issue requirements and terms and conditions of the New Option must be
   met as of the date the New Option is made a part of your Contract.

If the New Option is a SureIncome Option, the New Option must provide that the
new Benefit Payment be greater than or equal to your current Benefit Payment as
of the date the Rider Trade-In Option is exercised, if applicable.

You should consult with your sales representative before trading in your
SureIncome Option.

DEATH OF OWNER OR ANNUITANT.

<R>
If the Contract Owner dies before the Rider Maturity Date and the Contract is
continued under Option D of the Death of Owner provision of your Contract, as
described on page 60 of your prospectus, then the SureIncome Option will
continue, unless the new Contract Owner elects to cancel this Option. If the
SureIncome Option is continued, it will remain in effect until terminated. If
the Contract is not continued under Option D, then the SureIncome Option will
terminate on the date we receive a Complete Request for Settlement of the Death
Proceeds.
</R>

If an Annuitant dies before the Payout Start Date, and the Contract is
continued under Category 1 of the Death of Annuitant provision of the Contract,
the SureIncome Option will remain in effect until terminated. If the Contract
is not continued under Category 1, then the SureIncome Option will terminate on
the date we receive a complete request for settlement of the Death Proceeds.

TERMINATION OF THE SUREINCOME OPTION

This SureIncome Option will terminate on the earliest of the following to occur:

..  The Benefit Base is reduced to zero;

..  On the Payout Start Date (except if the Contract enters the Withdrawal
   Benefit Payout Phase as defined under the Withdrawal Benefit Payout Phase
   section);

    .  On the date the Contract is terminated;

    .  On the date the SureIncome Option is cancelled;

    .  On the date we receive a Complete Request for Settlement of the Death
       Proceeds; or

    .  On the date the SureIncome Option is replaced with a New Option under
       the Rider Trade-In Option.
<R>
</R>

INVESTMENT ALTERNATIVES: THE VARIABLE SUB-ACCOUNTS

You may allocate your purchase payments to up to 46 Variable Sub-accounts. Each
Variable Sub-account invests in the shares of a corresponding Portfolio. Each
Portfolio has its own investment objective(s) and policies. We briefly describe
the Portfolios below.

For more complete information about each Portfolio, including expenses and
risks associated with each Portfolio, please refer to the prospectuses for the
Funds. We will mail to you a prospectus for each Portfolio related to the
Variable Sub-Accounts to which you allocate your purchase payment.

YOU SHOULD CAREFULLY CONSIDER THE INVESTMENT OBJECTIVES, RISKS, CHARGES AND
EXPENSES OF THE INVESTMENT ALTERNATIVES WHEN MAKING AN ALLOCATION TO THE
VARIABLE SUB-ACCOUNTS. TO OBTAIN ANY OR ALL OF THE UNDERLYING PORTFOLIO
PROSPECTUSES, PLEASE CONTACT US AT 800-457-7617.

PORTFOLIO                     INVESTMENT OBJECTIVE        INVESTMENT ADVISER
-------------------------- ---------------------------- -----------------------
INVESCO VARIABLE INSURANCE FUNDS

Invesco V.I. Value         Long-term growth of capital  INVESCO ADVISERS, INC.
Opportunities Fund -
Series II/(2)/

Invesco V.I. American      Capital appreciation
Franchise Fund - Series II

                                      32
<R>

PORTFOLIO                      INVESTMENT OBJECTIVE        INVESTMENT ADVISER
------------------------ --------------------------------- --------------------
Invesco V.I. Core        Long-term growth of capital
Equity Fund - Series II

Invesco V.I. Mid Cap     Long-term growth of capital
Core Equity Fund -
Series II

Invesco V.I. Mid Cap     Capital growth
Growth Portfolio,
Series II

Invesco V.I. Government  Total return, comprised of
Securities, Series II    current income and capital
                         appreciation

Invesco V.I. Growth and  Long-term growth of capital
Income Portfolio,        and income.
Series II

THE ALGER PORTFOLIOS

Alger Large Cap Growth   Long-term capital appreciation
Portfolio - Class S

Alger Capital            Long-term capital appreciation    FRED ALGER
Appreciation Portfolio                                     MANAGEMENT, INC.
- Class S

Alger Mid Cap Growth     Long-term capital appreciation
Portfolio - Class S/(3)/

FIDELITY(R) VARIABLE INSURANCE PRODUCTS

Fidelity(R) VIP Asset    High total return with reduced
Manager/(SM)/ Portfolio  risk over the long term by
- Service Class 2        allocating its assets among
                         stocks, bonds, and short-term
                         instruments.

Fidelity(R) VIP          Long-term capital appreciation
Contrafund(R) Portfolio
- Service Class 2

Fidelity(R) VIP          Reasonable income. The fund       FIDELITY
Equity-Income Portfolio  will also consider the potential  MANAGEMENT &
- Service Class 2        for capital appreciation. The     RESEARCH COMPANY
                         fund's goal is to achieve a
                         yield which exceeds the
                         composite yield on the
                         securities comprising the
                         Standard & Poor's 500/(SM)/
                         Index (S&P 500(R)).

Fidelity(R) VIP Growth   To achieve capital
Portfolio - Service      appreciation
Class 2

Fidelity(R) VIP Index    Investment results that
500 Portfolio - Service  correspond to the total return
Class 2                  of common stocks publicly
                         traded in the United States as
                         represented by the Standard &
                         Poor's 500/(SM)/ Index (S&P
                         500(R))

Fidelity(R) VIP          As high a level of current
Investment Grade Bond    income as is consistent with
Portfolio - Service      the preservation of capital
Class 2

Fidelity(R) VIP Money    As high a level of current
Market Portfolio -       income as is consistent with
Service Class 2          preservation of capital and
                         liquidity.

Fidelity(R) VIP          Long-term growth of capital
Overseas Portfolio -
Service Class 2

GOLDMAN SACHS VARIABLE INSURANCE TRUST

Goldman Sachs VIT Mid    Long-term capital appreciation    GOLDMAN SACHS
Cap Value Fund                                             ASSET MANAGEMENT,
                                                           L.P.

PORTFOLIO                      INVESTMENT OBJECTIVE        INVESTMENT ADVISER
------------------------ --------------------------------- --------------------
JANUS ASPEN SERIES

Janus Aspen Series       Long-term capital growth,         JANUS CAPITAL
Balanced Portfolio -     consistent with preservation of   MANAGEMENT LLC
Service Shares           capital and balanced by
                         current income.

Janus Aspen Series       Maximum total return,
Flexible Bond Portfolio  consistent with preservation of
- Institutional Shares   capital

Janus Aspen Series       Long-term growth of capital.
Overseas Portfolio -
Service Shares

Janus Aspen Series       Long-term growth of capital
Forty Portfolio -
Service Shares

Janus Aspen Series       Capital appreciation.             SUBADVISER: PERKINS
Perkins Mid Cap Value                                      INVESTMENT
Portfolio - Service                                        MANAGEMENT LLC
Shares/(5)/

LEGG MASON PARTNERS VARIABLE EQUITY TRUST

ClearBridge Variable     Long-term growth of capital.      LEGG MASON
Large Cap Value          Current income is a secondary     PARTNERS FUND
Portfolio - Class I      objective                         ADVISOR, LLC

Legg Mason Partners
Variable Income Trust

Western Asset Variable   Maximum total return              LEGG MASON
Global High Yield Bond                                     PARTNERS FUND
Portfolio - Class II                                       ADVISOR, LLC

MFS(R) VARIABLE INSURANCE TRUST/(SM)/ II

MFS(R) High Yield        Total return with an emphasis     MFS(TM) INVESTMENT
Series--Service Class    on high current income, but       MANAGEMENT
                         also considering capital
                         appreciation

MFS(R) Investors Trust   Capital appreciation
Series--Service Class

MFS(R) New Discovery     Capital appreciation
Series--Service Class

MFS(R) Total Return      Total return
Series--Service Class

MFS(R) Value             Capital appreciation
Series--Service Class

MFS(R) VARIABLE INSURANCE TRUST II

MFS(R) MA Investors      Capital appreciation
Growth Stock - Service
Class Sub-Account/(4)/
(formerly, MFS
Investors Growth Stock
Series--Service Class
Sub-Account)

OPPENHEIMER VARIABLE ACCOUNT FUNDS

Oppenheimer Global       Capital appreciation              OPPENHEIMERFUNDS,
Fund/VA - Class 2 Shares                                   INC.

Oppenheimer Main Street  Capital appreciation.
Small Cap Fund(R)/VA -
Class 2 Shares

Oppenheimer Discovery    Capital appreciation.
Mid Cap Growth Fund/VA
- Class 2 Shares/(1)/

PIMCO VARIABLE INSURANCE TRUST

PIMCO Foreign Bond       Maximum total return,             PACIFIC INVESTMENT
Portfolio (U.S.          consistent with preservation of   MANAGEMENT
Dollar-Hedged) -         capital and prudent investment    COMPANY LLC
Administrative Shares    management.

PIMCO Money Market       Maximum current income,
Portfolio -              consistent with preservation of
Administrative Shares    capital and daily liquidity

PIMCO Real Return        Maximum real return,
Portfolio -              consistent with preservation of
Administrative Shares    real capital and prudent
                         investment management
</R>

                                      33
<R>

                                                                   INVESTMENT
PORTFOLIO                             INVESTMENT OBJECTIVE           ADVISER
------------------------------  ---------------------------------- ------------
PIMCO Total Return Portfolio -  Maximum total return,
Administrative Shares/(6)/      consistent with preservation of
                                capital and prudent investment
                                management.

THE RYDEX VARIABLE TRUST

Guggenheim VIF Long Short       Long-term capital appreciation.    GUGGENHEIM
Equity Fund                                                        INVESTMENTS

T. Rowe Price Equity Series,
Inc.

T. Rowe Price Blue Chip Growth  Long-term capital growth.          T. ROWE
Portfolio - II                  Income is a secondary              PRICE
                                objective.                         ASSOCIATES,
                                                                   INC.

T. Rowe Price Equity Income     High level of dividend income
Portfolio - II                  and long-term capital growth
                                primarily through investments
                                in stocks.

                                                                   INVESTMENT
PORTFOLIO                             INVESTMENT OBJECTIVE           ADVISER
------------------------------  ---------------------------------- ------------
THE UNIVERSAL INSTITUTIONAL
FUNDS, INC.

UIF Growth Portfolio, Class II  Long-term capital appreciation     MORGAN
                                by investing primarily in          STANLEY
                                growth-oriented equity             INVESTMENT
                                securities of large                MANAGEMENT
                                capitalization companies.          INC.

UIF U.S. Real Estate            Above average current income
Portfolio, Class II             and long-term capital
                                appreciation by investing
                                primarily in equity securities of
                                companies in the U.S. real
                                estate industry, including real
                                estate investment trusts.

VAN ECK VIP TRUST

Van Eck VIP Multi-Manager       Consistent absolute (positive)     VAN ECK
Alternatives Fund               returns in various market          ASSOCIATES
                                cycles                             CORPORATION

Van Eck VIP Emerging Markets    Long-term capital appreciation
Fund                            by investing primarily in
                                equity securities in emerging
                                markets around the world

Van Eck VIP Global Hard Assets  Long-term capital appreciation
Fund                            by investing primarily in hard
                                asset securities. Income is a
                                secondary consideration
</R>

(1)Effective as of August 30, 2010, the following Variable Sub-Account closed
   to all Contract Owners except those Contract Owners who had contract value
   invested in the Variable Sub-Account as of the closure date:

   Oppenheimer Discovery Mid Cap Growth Fund/VA - Class 2 Shares Sub-Account

   Contract Owners who had contract value invested in this Variable Sub-Account
   as of the closure date may continue to submit additional investments into
   the Variable Sub-Account thereafter, although they will not be permitted to
   invest in the Variable Sub-Account if they withdraw or otherwise transfer
   their entire contract value from the Variable Sub-Account following the
   closure date. Contract Owners who did not have contract value invested in
   this Variable Sub-Account as of the specified closure date may not invest in
   the Variable Sub-Account.

(2)Effective August 19, 2011, the Invesco V.I. Value Opportunities - Series II
   Sub-Account closed to all Contract Owners EXCEPT those Contract Owners who
   had contract value invested in the Variable Sub-Account as of the closure
   date. Contract Owners who had contract value invested in the Variable
   Sub-Account as of the closure date may continue to submit additional
   investments into the Variable Sub-Account thereafter, although they will not
   be permitted to invest in the Variable Sub-Account if they withdraw or
   otherwise transfer their entire contract value from the Variable Sub-Account
   following the closure date. Contract Owners who did not have contract value
   invested in the Variable Sub-Account as of the closure date may not invest
   in the Variable Sub-Account.
(3)Effective as of January 31, 2014, the Alger Mid-Cap Growth - Class S
   Sub-Account was closed to all Contract Owners EXCEPT those Contract Owners
   who had contract value invested in the Variable Sub-Account as of the
   closure date. Contract Owners who had contract value invested in the
   Variable Sub-Account as of the closure date may continue to submit
   additional investments into the Variable Sub-Account thereafter, although
   they will not be permitted to invest in the Variable Sub-Account if they
   withdrew or otherwise transferred their entire contract value from the
   Variable Sub-Account following the closure date. Contract Owners who did not
   have contract value invested in the Variable Sub-Account as of the closure
   date will not be permitted to invest in the Variable Sub-Account.
<R>
(4)On or about March 27, 2015, the MFS(R) MA Investors Growth Stock Portfolio -
   Service Class, a portfolio of MFS(R) Variable Insurance Trust II, acquired
   the MFS(R) Investors Growth Stock Series - Service Class, a series of MFS(R)
   Variable Insurance Trust.
(5)Effective April 13, 2015, the Janus Aspen Series Perkins Mid Cap Value -
   Service Shares sub-account was closed to all contract owners except those
   contract owners who have contract value invested in the variable sub-account
   as of the closure date. Contract owners who have contract value invested in
   the variable sub-account as of the closure date may continue to submit
   additional investments into the variable sub-account thereafter, although
   they will not be permitted to invest in the variable sub-account if they
   withdraw or otherwise transfer their entire contract value from the variable
   sub-account following the closure date. Contract owners who do not have
   contract value invested in the variable sub-account as of the closure date
   will not be permitted to invest in the variable sub-account thereafter.
(6)Effective May 1, 2015, the PIMCO Total Return - Administrative Shares
   sub-account is closed to all contract owners except those contract owners
   who have contract value invested in the variable sub-account as of the
   closure date. Contract owners who have contract value invested in the
   variable sub-account as of the closure date may continue to submit
   additional investments into the variable sub-account thereafter, although
   they will not be permitted to invest in the variable sub-account if they
   withdraw or otherwise transfer their entire contract value from the variable
   sub-account following the closure date. Contract owners who do not have
   contract value invested in the variable sub-account as of the closure date
   will not be permitted to invest in the variable sub-account thereafter
</R>

AMOUNTS YOU ALLOCATE TO VARIABLE SUB-ACCOUNTS MAY GROW IN VALUE, DECLINE IN
VALUE, OR GROW LESS THAN YOU EXPECT, DEPENDING ON THE INVESTMENT PERFORMANCE OF
THE PORTFOLIOS IN WHICH THOSE VARIABLE SUB-ACCOUNTS INVEST. YOU BEAR THE
INVESTMENT RISK THAT THE PORTFOLIOS MIGHT NOT MEET THEIR INVESTMENT OBJECTIVES.
SHARES OF THE PORTFOLIOS ARE NOT DEPOSITS IN, OR OBLIGATIONS OF, OR GUARANTEED
OR ENDORSED BY, ANY BANK AND ARE NOT INSURED BY THE FEDERAL DEPOSIT INSURANCE
CORPORATION, THE FEDERAL RESERVE BOARD, OR ANY OTHER AGENCY.

                                      34
TRUEBALANCE/SM/ ASSET ALLOCATION PROGRAM

THE TRUEBALANCE ASSET ALLOCATION PROGRAM ("TRUEBALANCE PROGRAM") IS NO LONGER
OFFERED FOR NEW ENROLLMENTS. IF YOU ENROLLED IN THE TRUEBALANCE PROGRAM PRIOR
TO JANUARY 31, 2008, YOU MAY REMAIN IN THE PROGRAM. IF YOU TERMINATE YOUR
ENROLLMENT OR OTHERWISE TRANSFER YOUR CONTRACT VALUE OUT OF THE PROGRAM, YOU
MAY NOT RE-ENROLL.

There is no additional charge for the TrueBalance program. Participation in the
TrueBalance program may be limited if you have elected certain Contract Options
that impose restrictions on the investment alternatives which you may invest,
such as the Income Protection Benefit Option, the TrueReturn Accumulation
Benefit Option or a Withdrawal Benefit Option. See the sections of this
prospectus discussing these Options for more information.

Asset allocation is the process by which your Contract Value is invested in
different asset classes in a way that matches your risk tolerance, time
horizon, and investment goals. Theoretically, different asset classes tend to
behave differently under various economic and market conditions. By spreading
your Contract Value across a range of asset classes, you may, over time, be
able to reduce the risk of investment volatility and potentially enhance
returns. Asset allocation does not guarantee a profit or protect against loss
in a declining market.

Your sales representative helps you determine whether participating in an asset
allocation program is appropriate for you. You complete a questionnaire to
identify your investment style. Based on your investment style, you select one
asset allocation model portfolio among the available model portfolios which may
range from conservative to aggressive. Your Contract Value is allocated among
the Variable Sub-Accounts according to your selected model portfolio. Not all
Variable Sub-Accounts are available in any one model portfolio, and you must
only allocate your Contract Value to the limited number of Variable
Sub-Accounts available in the model portfolio you select. You should not select
a model portfolio without first consulting with your sales representative.

Lincoln Benefit and the principal underwriter of the Contracts, Allstate
Distributors, L.L.C., Inc., do not intend to provide any personalized
investment advice in connection with the TrueBalance program and you should not
rely on this program as providing individualized investment recommendations to
you.

Lincoln Benefit retained an independent investment management firm ("investment
management firm") to construct the TrueBalance model portfolios. The investment
management firm does not provide advice to Lincoln Benefit's Contract Owners.
Neither Lincoln Benefit nor the investment management firm is acting for any
Contract Owner as a "fiduciary" or as an "investment manager," as such terms
are defined under applicable laws and regulations relating to the Employee
Retirement Income Security Act of 1974 (ERISA).

The investment management firm does not take into account any information about
any Contract Owner or any Contract Owner's assets when creating, providing or
maintaining any TrueBalance model portfolio. Individual Contract Owners should
ultimately rely on their own judgment and/or the judgment of a financial
advisor in making their investment decisions. Neither Lincoln Benefit nor the
investment management firm is responsible for determining the suitability of
the TrueBalance model portfolios for the Contract Owners' purposes.

Each of the five model portfolios specifies an allocation among a mix of
Variable Sub-Accounts that considers the investment goals of the applicable
investment style. On the business day we accept your participation in the
TrueBalance program, we will automatically reallocate any existing Contract
Value in the Variable Sub-Accounts according to the model portfolio you
selected. If any portion of your existing Contract Value is allocated to the
Standard Fixed Account or MVA Fixed Account Options and you wish to allocate
any portion of it to the model portfolio, you must transfer that portion to the
Variable Sub-Accounts. In addition, as long as you participate in the
TrueBalance program, you must allocate all of your purchase payments (and
Credit Enhancements for CONSULTANT SOLUTIONS PLUS CONTRACTS) to the Fixed
Account Options and/or the Variable Sub-Accounts currently offered in your
model portfolio. Any purchase payments (and Credit Enhancements for CONSULTANT
SOLUTIONS PLUS CONTRACTS) you allocate to the DCA Fixed Account Option will be
automatically transferred, along with interest, in equal monthly installments
to the Variable Sub-Accounts according to the model portfolio you selected.

We use the term "Transfer Period Account" to refer to each purchase payment
allocation made to the DCA Fixed Account Option for a specified term length. At
the expiration of a Transfer Period Account any remaining amounts in the
Transfer Period Account will be transferred to the Variable Sub-Account
according to the percentage allocation for the model portfolio you selected.

Lincoln Benefit may offer new or revised TrueBalance model portfolios at any
time, and may retain a different investment management firm to create any such
new or revised TrueBalance model portfolios. Lincoln Benefit will not
automatically reallocate your Contract Value allocated to the Variable
Sub-Accounts to match any new or revised model portfolios that are offered. If
you are invested in the TrueBalance model portfolio, your registered
representative or the selling broker-dealer will notify you of any new or
revised TrueBalance model portfolios that may be made available. If you wish to
invest in accordance with a new or revised TrueBalance model portfolio, you
must submit a transfer request to transfer your Contract Value in your existing
TrueBalance model portfolio to the new TrueBalance model portfolio. If you do
not request a transfer to a new TrueBalance model portfolio, we will continue
to rebalance your Contract Value in accordance with your existing TrueBalance
model portfolio. At any given time, you may only elect a TrueBalance model
portfolio that is available at the time of election.

You may select only one model portfolio at a time. However, you may change your
selection of model portfolio at any time, provided you select only a currently
available model portfolio. Each change you make in your model portfolio
selection will count against the

                                      35
12 transfers you can make each Contract Year without paying a transfer fee. You
should consult with your sales representative before making a change to your
model portfolio selection to determine whether the new model portfolio is
appropriate for your needs.

Since the performance of each Variable Sub-Account may cause a shift in the
percentage allocated to each Variable Sub-Account, at least once every calendar
quarter we will automatically rebalance all of your Contract Value in the
Variable Sub-Accounts according to your currently selected model portfolio.

Unless you notify us otherwise, any purchase payments you make after electing
the TrueBalance program will be allocated to your model portfolio and/or to the
Fixed Account Options according to your most recent instructions on file with
us. Once you elect to participate in the TrueBalance program, you may allocate
subsequent purchase payments to any of the Fixed Account Options available with
your Contract and/or to any of the Variable Sub-Accounts included in your model
portfolio, but only according to the allocation specifications of that model
portfolio. You may not allocate subsequent purchase payments to a Variable
Sub-Account that is not included in your model portfolio. Subsequent purchase
payments allocated to the Variable Sub-Accounts will be automatically
rebalanced at the end of the next calendar quarter according to the allocation
percentages for your currently selected model portfolio.

You may not make transfers from the Variable Sub-Accounts to any of the other
Variable Sub-Accounts. You may make transfers, as allowed under the contract,
from the Fixed Account Options to other Fixed Account Options or to the
Variable Sub-Accounts included in your model portfolio, but only according to
the allocation specifications of that model portfolio. You may make transfers
from the Variable Sub-Accounts to any of the Fixed Account Options, except the
DCA Fixed Account Option. Transfers to Fixed Account Options may be
inconsistent with the investment style you selected and with the purpose of the
TrueBalance program. However, all of your Contract Value in the Variable
Sub-Accounts will be automatically rebalanced at the end of the next calendar
quarter according to the percentage allocations for your currently selected
model portfolio. You should consult with your sales representative before
making transfers.

If you own the TrueReturn Accumulation Benefit Option, on the Rider Maturity
Date the Contract Value may be increased due to the TrueReturn Accumulation
Benefit Option. Any increase will be allocated to the PIMCO Money Market -
Administrative Shares Sub-Account. You may make transfers from this Variable
Sub-Account to the Fixed Account Options (as allowed) or the Variable
Sub-Accounts included in your model portfolio, but only according to the
allocation specification of that model portfolio. All of your Contract Value in
the Variable Sub-Accounts will be automatically rebalanced at the end of the
next calendar quarter according to the percentage allocations for your
currently selected model portfolio.

If you make a partial withdrawal from any of the Variable Sub-Accounts, your
remaining Contract Value in the Variable Sub-Accounts will be automatically
rebalanced at the end of the next calendar quarter according to the percentage
allocations for your currently selected model portfolio. If you are
participating in the Systematic Withdrawal Program when you add the TrueBalance
program or change your selection of model portfolios, you may need to update
your withdrawal instructions. If you have any questions, please consult your
sales representative.

Your participation in the TrueBalance program is subject to the program's terms
and conditions, and you may change model portfolios or terminate your
participation in the TrueBalance program at any time by notifying us in a form
satisfactory to us. We reserve the right to modify or terminate the TrueBalance
program at any time.
<R>
</R>

INVESTMENT ALTERNATIVES: THE FIXED ACCOUNT OPTIONS

You may allocate all or a portion of your purchase payments (and Credit
Enhancements for CONSULTANT SOLUTIONS PLUS CONTRACTS) to the FIXED ACCOUNT
OPTIONS. The Fixed Account Options we offer include the DOLLAR COST AVERAGING
FIXED ACCOUNT OPTION, the STANDARD FIXED ACCOUNT OPTION, and the MARKET VALUE
ADJUSTED FIXED ACCOUNT OPTION. We may offer additional Fixed Account Options in
the future. Some Options are not available in all states. In addition, Lincoln
Benefit may limit the availability of some Fixed Account Options. Please
consult with your representative for current information. The Fixed Account
supports our insurance and annuity obligations. The Fixed Account consists of
our general assets other than those in segregated asset accounts. We have sole
discretion to invest the assets of the Fixed Account, subject to applicable
law. Any money you allocate to the Fixed Account does not entitle you to share
in the investment experience of the Fixed Account.

DOLLAR COST AVERAGING FIXED ACCOUNT OPTION

<R>
The Dollar Cost Averaging Fixed Account Option ("DCA Fixed Account Option") is
one of the investment alternatives that you can use to establish a Dollar Cost
Averaging Program, as described on page 43.
</R>

This option allows you to allocate purchase payments (and Credit Enhancements
for CONSULTANT SOLUTIONS PLUS CONTRACTS) to the Fixed Account that will then
automatically be transferred, along with interest, in equal monthly
installments to the investment alternatives that you have selected. In the
future, we may offer other installment frequencies in our discretion. Each
purchase payment allocated to the DCA Fixed Account Option must be at least
$100.

At the time you allocate a purchase payment to the DCA Fixed Account Option,
you must specify the term length over which the transfers are to take place. We
use the term "Transfer Period Account" to refer to each purchase payment
allocation made to the DCA

                                      36
Fixed Account Option for a specified term length. You establish a new Transfer
Period Account each time you allocate a purchase payment to the DCA Fixed
Account Option. We currently offer term lengths from which you may select for
your Transfer Period Account(s), ranging from 3 to 12 months. We may modify or
eliminate the term lengths we offer in the future. Refer to Appendix A for more
information.

Your purchase payments (and Credit Enhancements for CONSULTANT SOLUTIONS PLUS
CONTRACTS) will earn interest while in the DCA Fixed Account Option at the
interest rate in effect at the time of the allocation, depending on the term
length chosen for the Transfer Period Account and the type of Contract you
have. The interest rates may also differ from those available for other Fixed
Account Options. The minimum interest rate associated with the DCA Fixed
Account Option is based upon state requirements and the date an application to
purchase a Contract is signed. This minimum interest rate will not change after
Contract issue.

<R>
You must transfer all of your money, plus accumulated interest, out of a
Transfer Period Account to other investment alternatives in equal monthly
installments during the term of the Transfer Period Account. We reserve the
right to restrict the investment alternatives available for transfers from any
Transfer Period Account. You may not transfer money from the Transfer Period
Accounts to any of the Fixed Account Options available under your Contract. The
first transfer will occur on the 25th day after you establish a Transfer Period
Account and monthly thereafter. If we do not receive an allocation instruction
from you when we receive the purchase payment, we will transfer each
installment to the money market Variable Sub-account until we receive a
different allocation instruction. At the expiration of a Transfer Period
Account any remaining amounts in the Transfer Period Account will be
transferred to the PIMCO Money Market - Administrative Shares Sub-Account
unless you request a different investment alternative. Transferring Contract
Value to the PIMCO Money Market - Administrative Shares Sub-Account in this
manner may not be consistent with the theory of dollar cost averaging described
on page 43.
</R>

If you discontinue the DCA Fixed Account Option before the expiration of a
Transfer Period Account, we will transfer any remaining amount in the Transfer
Period Account to the PIMCO Money Market - Administrative Shares Sub-Account
unless you request a different investment alternative.

If you have a TrueReturn Option or SureIncome Option, at the expiration of a
Transfer Period Account or if you discontinue the DCA Fixed Account Option any
amounts remaining in the Transfer Period Account will be transferred according
to the investment requirements applicable to the Option you selected.

You may not transfer money into the DCA Fixed Account Option or add to an
existing Transfer Period Account. You may not use the Automatic Additions
Program to allocate purchase payments to the DCA Fixed Account Option.

The DCA Fixed Account Option currently is not available if you have selected
the CONSULTANT SOLUTIONS SELECT CONTRACT.

The DCA Fixed Account Option may not be available in your state. Please check
with your representative for availability.

STANDARD FIXED ACCOUNT OPTION

If you have selected the CONSULTANT SOLUTIONS CLASSIC CONTRACT, you may
allocate purchase payments or transfer amounts into the Standard Fixed Account
Option. Each such allocation establishes a "GUARANTEE PERIOD ACCOUNT" within
the Standard Fixed Account Option ("Standard Fixed Guarantee Period Account"),
which is defined by the date of the allocation. You may not allocate a purchase
payment or transfer to any existing Guarantee Period Account. Each purchase
payment or transfer allocated to a Standard Fixed Guarantee Period Account must
be at least $100.

The Standard Fixed Account Option is not available in all states.

At the time you allocate a purchase payment or transfer amount to the Standard
Fixed Account Option, you must select the Guarantee Period for that allocation
from among the available Standard Fixed Guarantee Periods. We currently offer
Standard Fixed Guarantee Periods of 1 year in length for CONSULTANT SOLUTIONS
CLASSIC. For CONSULTANT SOLUTIONS PLUS, SELECT and ELITE CONTRACTS, we
currently are not offering the Standard Fixed Account Option. Refer to Appendix
A for more information. We may offer other Guarantee Periods in the future. If
you allocate a purchase payment to the Standard Fixed Account Option, but do
not select a Standard Fixed Guarantee Period for the new Standard Fixed
Guarantee Period Account, we will allocate the purchase payment or transfer to
a new Standard Fixed Guarantee Period Account with the same Standard Fixed
Guarantee Period as the Standard Fixed Guarantee Period Account of your most
recent purchase payment or transfer. If we no longer offer that Standard Fixed
Guarantee Period, then we will allocate the purchase payment or transfer to a
new Standard Fixed Guarantee Period Account with the next shortest term
currently offered. If you have not made a prior allocation to a Guarantee
Period Account, then we will allocate the purchase payment or transfer to a new
Standard Fixed Guarantee Period Account of the shortest Standard Fixed
Guarantee Period we are offering at that time.

Some Standard Fixed Guarantee Periods are not available in all states. Please
check with your representative for availability.

The amount you allocate to a Standard Fixed Guarantee Period Account will earn
interest at the interest rate in effect for that Standard Fixed Guarantee
Period at the time of the allocation. Interest rates may differ depending on
the type of Contract you have and may also differ from those available for
other Fixed Account Options. The minimum interest rate associated with the
Standard Fixed Account Option is based upon state requirements and the date an
application to purchase a Contract is signed. This minimum interest rate will
not change after Contract issue.

                                      37
In any Contract Year, the combined amount of withdrawals and transfers from a
Standard Fixed Guarantee Period Account may not exceed 30% of the amount used
to establish that Standard Fixed Guarantee Period Account. This limitation is
waived if you withdraw your entire Contract Value. It is also waived for
amounts in a Standard Fixed Guarantee Period Account during the 30 days
following its renewal date ("30-DAY WINDOW"), described below, and for a single
withdrawal made by your surviving spouse within one year of continuing the
Contract after your death.

Amounts under the 30% limit that are not withdrawn in a Contract Year do not
carry over to subsequent Contract Years.

At the end of a Standard Fixed Guarantee Period and each year thereafter, we
will declare a renewal interest rate that will be guaranteed for 1 year.
Subsequent renewal dates will be on the anniversaries of the first renewal
date. Prior to a renewal date, we will send you a notice that will outline the
options available to you. During the 30-Day Window following the expiration of
a Standard Fixed Guarantee Period Account, the 30% limit for transfers and
withdrawals from that Guarantee Period Account is waived and you may elect to:

..  transfer all or part of the money from the Standard Fixed Guarantee Period
   Account to establish a new Guarantee Period Account within the Standard
   Fixed Account Option; or

..  transfer all or part of the money from the Standard Fixed Guarantee Period
   Account to other investment alternatives available at the time; or

..  withdraw all or part of the money from the Standard Fixed Guarantee Period
   Account. Withdrawal charges and taxes may apply.

Withdrawals taken to satisfy IRS minimum distribution rules will count against
the 30% limit. The 30% limit will be waived for a Contract Year to the extent
that:

..  you have already exceeded the 30% limit and you must still make a withdrawal
   during that Contract Year to satisfy IRS minimum distribution rules; or

..  you have not yet exceeded the 30% limit but you must make a withdrawal
   during that Contract Year to satisfy IRS minimum distribution rules, and
   such withdrawal will put you over the 30% limit.

The money in the Standard Fixed Guarantee Period Account will earn interest at
the declared renewal rate from the renewal date until the date we receive
notification of your election. If we receive notification of your election to
make a transfer or withdrawal from a renewing Standard Fixed Guarantee Period
Account on or before the renewal date, the transfer or withdrawal will be
deemed to have occurred on the renewal date. If we receive notification of your
election to make a transfer or withdrawal from the renewing Standard Fixed
Guarantee Period Account after the renewal date, but before the expiration of
the 30-Day Window, the transfer or withdrawal will be deemed to have occurred
on the day we receive such notice. Any remaining balance not withdrawn or
transferred from the renewing Standard Fixed Guarantee Period Account will
continue to earn interest until the next renewal date at the declared renewal
rate. If we do not receive notification from you within the 30-Day Window, we
will assume that you have elected to renew the Standard Fixed Guarantee Period
Account and the amount in the renewing Standard Fixed Guarantee Period Account
will continue to earn interest at the declared renewal rate until the next
renewal date, and will be subject to all restrictions of the Standard Fixed
Account Option.

The Standard Fixed Account Option currently is available only with the
CONSULTANT SOLUTIONS CLASSIC CONTRACT.

MARKET VALUE ADJUSTED FIXED ACCOUNT OPTION

You may allocate purchase payments or transfer amounts into the Market Value
Adjusted Fixed Account Option. Each such allocation establishes a Guarantee
Period Account within the Market Value Adjusted Fixed Account Option ("Market
Value Adjusted Fixed Guarantee Period Account"), which is defined by the date
of the allocation and the length of the initial interest rate guarantee period
("MARKET VALUE ADJUSTED FIXED GUARANTEE PERIOD"). You may not allocate a
purchase payment or transfer to any existing Guarantee Period Account. Each
purchase payment or transfer allocated to a Market Value Adjusted Fixed
Guarantee Period Account must be at least $100.

At the time you allocate a purchase payment or transfer amount to the Market
Value Adjusted Fixed Account Option, you must select the Guarantee Period for
that allocation from among the Guarantee Periods available for the Market Value
Adjusted Fixed Account Option. We currently offer Market Value Adjusted Fixed
Guarantee Periods of 1, 3, 5, 7, and 10 years. Refer to Appendix A for more
information. We may offer other Guarantee Periods in the future. If you
allocate a purchase payment to the Market Value Adjusted Fixed Account Option,
but do not select a Market Value Adjusted Fixed Guarantee Period for the new
Market Value Adjusted Fixed Guarantee Period Account, we will allocate the
purchase payment or transfer to a new Market Value Adjusted Fixed Guarantee
Period Account with the same Market Value Adjusted Fixed Guarantee Period as
the Market Value Adjusted Fixed Guarantee Period Account of your most recent
purchase payment or transfer. If we no longer offer that Market Value Adjusted
Fixed Guarantee Period, then we will allocate the purchase payment or transfer
to a new Market Value Adjusted Fixed Guarantee Period Account with the next
shortest term currently offered. If you have not made a prior allocation to a
Market Value Adjusted Fixed Guarantee Period Account, then we will allocate the
purchase payment or transfer to a new Market Value Adjusted Fixed Guarantee
Period Account of the shortest Market Value Adjusted Fixed Guarantee Period we
are offering at that time. The Market Value Adjusted Fixed Account Option is
not available in all states. Please check with your representative for
availability.

                                      38
The amount you allocate to a Market Value Adjusted Fixed Guarantee Period
Account will earn interest at the interest rate in effect for that Market Value
Adjusted Fixed Guarantee Period at the time of the allocation. Interest rates
may differ depending on the type of Contract you have and may also differ from
those available for other Fixed Account Options.

Withdrawals and transfers from a Market Value Adjusted Fixed Guarantee Period
Account may be subject to a Market Value Adjustment. A Market Value Adjustment
may also apply to amounts in the Market Value Adjusted Fixed Account Option if
we pay Death Proceeds or if the Payout Start Date begins on a day other than
during the 30-day period after such Market Value Adjusted Fixed Guarantee
Period Account expires ("30-Day MVA Window"). We will not make a Market Value
Adjustment if you make a transfer or withdrawal during the 30-Day MVA Window.

We apply a Market Value Adjustment to reflect changes in interest rates from
the time you first allocate money to a Market Value Adjusted Fixed Guarantee
Period Account to the time the money is taken out of that Market Value Adjusted
Fixed Guarantee Period Account under the circumstances described above. We use
the U.S. Treasury Note Constant Maturity Yield as reported in Federal Reserve
Statistical Release H.15 ("Treasury Rate") to calculate the Market Value
Adjustment. We do so by comparing the Treasury Rate for a maturity equal to the
Market Value Adjusted Fixed Guarantee Period at the time the Market Value
Adjusted Fixed Guarantee Period Account is established with the Treasury Rate
for the same maturity at the time the money is taken from the Market Value
Adjusted Fixed Guarantee Period Account.

The Market Value Adjustment may be positive or negative, depending on changes
in interest rates. As such, you bear the investment risk associated with
changes in interest rates. If interest rates have increased since the
establishment of a Market Value Adjusted Fixed Guarantee Period Account, the
Market Value Adjustment, together with any applicable withdrawal charges,
premium taxes, and income tax withholdings could reduce the amount you receive
upon full withdrawal from a Market Value Adjusted Fixed Guarantee Period
Account to an amount less than the purchase payment used to establish that
Market Value Adjusted Fixed Guarantee Period Account.

Generally, if at the time you establish a Market Value Adjusted Fixed Guarantee
Period Account, the Treasury Rate for a maturity equal to that Market Value
Adjusted Fixed Guarantee Period is higher than the applicable Treasury Rate at
the time money is to be taken from the Market Value Adjusted Fixed Guarantee
Period Account, the Market Value Adjustment will be positive. Conversely, if at
the time you establish a Market Value Adjusted Fixed Guarantee Period Account,
the applicable Treasury Rate is lower than the applicable Treasury Rate at the
time the money is to be taken from the Market Value Adjusted Fixed Guarantee
Period Account, the Market Value Adjustment will be negative.

For example, assume that you purchase a Contract and allocate part of the
initial purchase payment (and Credit Enhancements for CONSULTANT SOLUTIONS PLUS
CONTRACTS) to the Market Value Adjusted Fixed Account Option to establish a
5-year Market Value Adjusted Fixed Guarantee Period Account. Assume that the
5-year Treasury Rate at that time is 4.50%. Next, assume that at the end of the
3rd year, you withdraw money from the Market Value Adjusted Fixed Guarantee
Period Account. If, at that time, the 5-year Treasury Rate is 4.20%, then the
Market Value Adjustment will be positive. Conversely, if the 5-year Treasury
Rate at that time is 4.80%, then the Market Value Adjustment will be negative.

The formula used to calculate the Market Value Adjustment and numerical
examples illustrating its application are shown in Appendix B of this
prospectus.

At the end of a Market Value Adjusted Fixed Guarantee Period, the Market Value
Adjusted Fixed Guarantee Period Account expires and we will automatically
transfer the money from such Guarantee Period Account to establish a new Market
Value Adjusted Fixed Guarantee Period Account with the same Market Value
Adjusted Fixed Guarantee Period, unless you notify us otherwise. The new Market
Value Adjusted Fixed Guarantee Period Account will be established as of the day
immediately following the expiration date of the expiring Market Value Adjusted
Guarantee Period Account ("New Account Start Date.") If the Market Value
Adjusted Fixed Guarantee Period is no longer being offered, we will establish a
new Market Value Adjusted Fixed Guarantee Period Account with the next shortest
Market Value Adjusted Fixed Guarantee Period available. Prior to the expiration
date, we will send you a notice, which will outline the options available to
you. During the 30-Day MVA Window a Market Value Adjustment will not be applied
to transfers and withdrawals from the expiring Market Value Adjusted Fixed
Guarantee Period Account and you may elect to:

    .  transfer all or part of the money from the Market Value Adjusted Fixed
       Guarantee Period Account to establish a new Guarantee Period Account
       within the Market Value Adjusted Fixed Account Option; or

    .  transfer all or part of the money from the Market Value Adjusted Fixed
       Guarantee Period Account to other investment alternatives available at
       the time; or

    .  withdraw all or part of the money from the Market Value Adjusted Fixed
       Guarantee Period Account. Withdrawal charges and taxes may apply.

The money in the Market Value Adjusted Fixed Guarantee Period Account will earn
interest at the interest rate declared for the new Market Value Adjusted Fixed
Guarantee Period Account from the New Account Start Date until the date we
receive notification of your election. If we receive notification of your
election to make a transfer or withdrawal from an expiring Market Value
Adjusted Fixed Guarantee Period Account on or before the New Account Start
Date, the transfer or withdrawal will be deemed to have occurred on the New
Account Start Date. If we receive notification of your election to make a
transfer or withdrawal from the expiring Market Value Adjusted Fixed Guarantee
Period Account after the New Account Start Date, but before the expiration of
the 30-Day MVA

                                      39
Window, the transfer or withdrawal will be deemed to have occurred on the day
we receive such notice. Any remaining balance not withdrawn or transferred will
earn interest for the term of the new Market Value Adjusted Fixed Guarantee
Period Account, at the interest rate declared for such Account. If we do not
receive notification from you within the 30-Day Window, we will assume that you
have elected to transfer the amount in the expiring Market Value Adjusted Fixed
Guarantee Period Account to establish a new Market Value Adjusted Fixed
Guarantee Period Account with the same Market Value Adjusted Fixed Guarantee
Period, and the amount in the new Market Value Adjusted Fixed Guarantee Period
Account will continue to earn interest at the interest rate declared for the
new Market Value Adjusted Fixed Guarantee Period Account, and will be subject
to all restrictions of the Market Value Adjusted Fixed Account Option. If we no
longer offer that Market Value Adjusted Fixed Guarantee Period, the Market
Value Adjusted Fixed Guarantee Period for the new Market Value Adjusted Fixed
Guarantee Period Account will be the next shortest term length we offer for the
Market Value Adjusted Fixed Account Option at that time, and the interest rate
will be the rate declared by us at that time for such term.

                                      40
INVESTMENT ALTERNATIVES: TRANSFERS

TRANSFERS DURING THE ACCUMULATION PHASE

During the Accumulation Phase, you may transfer Contract Value among the
investment alternatives. You may not transfer Contract Value to the DCA Fixed
Account Option or add to an existing Transfer Period Account. You may request
transfers in writing on a form that we provided or by telephone according to
the procedure described below.

You may make up to 12 transfers per Contract Year without charge. Currently, a
transfer fee equal to 1.00% of the amount transferred applies to each transfer
after the 12th transfer in any Contract Year. This fee may be changed, but in
no event will it exceed 2.00% of the amount transferred. Multiple transfers on
a single Valuation Date are considered a single transfer for purposes of
assessing the transfer fee. If you added the TrueReturn Accumulation Benefit
Option or SureIncome Option to your Contract, certain restrictions on transfers
apply. See the "TrueReturn Accumulation Benefit Option" and "SureIncome
Withdrawal Benefit Option" sections of this prospectus for more information. In
any event, the transfer fee will never be greater than $25.

The minimum amount that you may transfer from the Standard Fixed Account
Option, Market Value Adjusted Fixed Account Option or a Variable Sub-account is
$100 or the total remaining balance in the Standard Fixed Account Option,
Market Value Adjusted Fixed Account Option or the Variable Sub-account, if
less. These limitations do not apply to the DCA Fixed Account Option. The total
amount that you may transfer or withdraw from a Standard Fixed Guarantee Period
Account in a Contract Year is 30% of the amount used to establish that
Guarantee Period Account. See "Standard Fixed Account Option". The minimum
amount that can be transferred to the Standard Fixed Account Option and the
Market Value Adjusted Fixed Account Option is $100.

We will process transfer requests that we receive before 3:00 p.m. Central Time
on any Valuation Date using the Accumulation Unit Values for that Date. We will
process requests completed after 3:00 p.m. on any Valuation Date using the
Accumulation Unit Values for the next Valuation Date. The Contract permits us
to defer transfers from the Fixed Account Options for up to 6 months from the
date we receive your request. If we decide to postpone transfers from any Fixed
Account Option for 30 days or more, we will pay interest as required by
applicable law. Any interest would be payable from the date we receive the
transfer request to the date we make the transfer.

For CONSULTANT SOLUTIONS SELECT CONTRACTS, the maximum amount that may be
allocated during any single day to certain selected funds by telephone, fax,
Internet, overnight or express mail services, same day messenger, or in person
is $25,000. All trades exceeding this daily limit must be made by first class
US Mail. The funds currently affected by this restriction are:

Fidelity VIP Overseas - Service Class 2 Sub-Account
Janus Aspen Series Overseas - Service Shares Sub-Account
Oppenheimer Global Fund/VA - Class 2 Shares Sub-Account
Van Eck VIP Emerging Markets Sub-Account
MFS High Income - Service Class Sub-Account
Western Asset Variable Global High Yield Bond - Class II Sub-Account

We reserve the right to waive any transfer restrictions.

TRANSFERS DURING THE PAYOUT PHASE

During the Payout Phase, you may make transfers among the Variable Sub-Accounts
so as to change the relative weighting of the Variable Sub-Accounts on which
your variable income payments will be based. You may make up to 12 transfers
per Contract Year within each Income Plan. You may not convert any portion of
your fixed income payments into variable income payments. You may not make
transfers among Income Plans. You may make transfers from the variable income
payments to the fixed income payments to increase the proportion of your income
payments consisting of fixed income payments, unless you have selected the
Income Protection Benefit Option.

TELEPHONE OR ELECTRONIC TRANSFERS

You may make transfers by telephone by calling 800-457-7617. The cut-off time
for telephone transfer requests is 3:00 p.m. Central Time. In the event that
the New York Stock Exchange closes early, I.E., before 3:00 p.m. Central Time,
or in the event that the Exchange closes early for a period of time but then
reopens for trading on the same day, we will process telephone transfer
requests as of the close of the Exchange on that particular day. We will not
accept telephone requests received from you at any telephone number other than
the number that appears in this paragraph or received after the close of
trading on the Exchange. If you own the Contract with a joint Contract Owner,
unless we receive contrary instructions, we will accept instructions from
either you or the other Contract Owner.

We may suspend, modify or terminate the telephone transfer privilege, as well
as any other electronic or automated means we previously approved, at any time
without notice.

We use procedures that we believe provide reasonable assurance that the
telephone transfers are genuine. For example, we tape telephone conversations
with persons purporting to authorize transfers and request identifying
information. Accordingly, we disclaim any liability for losses resulting from
allegedly unauthorized telephone transfers. However, if we do not take
reasonable steps to help ensure that a telephone authorization is valid, we may
be liable for such losses.

                                      41
MARKET TIMING & EXCESSIVE TRADING

The Contracts are intended for long-term investment. Market timing and
excessive trading can potentially dilute the value of Variable Sub-Accounts and
can disrupt management of a Portfolio and raise its expenses, which can impair
Portfolio performance and adversely affect your Contract Value. Our policy is
not to accept knowingly any money intended for the purpose of market timing or
excessive trading. Accordingly, you should not invest in the Contract if your
purpose is to engage in market timing or excessive trading, and you should
refrain from such practices if you currently own a Contract.

We seek to detect market timing or excessive trading activity by reviewing
trading activities. Portfolios also may report suspected market-timing or
excessive trading activity to us. If, in our judgment, we determine that the
transfers are part of a market timing strategy or are otherwise harmful to the
underlying Portfolio, we will impose the trading limitations as described below
under "Trading Limitations." Because there is no universally accepted
definition of what constitutes market timing or excessive trading, we will use
our reasonable judgment based on all of the circumstances.

While we seek to deter market timing and excessive trading in Variable
Sub-Accounts, because our procedures involve the exercise of reasonable
judgment, we may not identify or prevent some market timing or excessive
trading. Moreover, imposition of trading limitations is triggered by the
detection of market timing or excessive trading activity, and the trading
limitations are not applied prior to detection of such trading activity.
Therefore, our policies and procedures do not prevent such trading activity
before it is detected. As a result, some investors may be able to engage in
market timing and excessive trading, while others are prohibited, and the
Portfolio may experience the adverse effects of market timing and excessive
trading described above.

TRADING LIMITATIONS

We reserve the right to limit transfers among the investment alternatives in
any Contract year, require that all future transfer requests be submitted
through U.S. Postal Service First Class Mail thereby refusing to accept
transfer requests via telephone, facsimile, Internet, or overnight delivery, or
to refuse any transfer request, if:

..  we believe, in our sole discretion, that certain trading practices, such as
   excessive trading, by, or on behalf of, one or more Contract Owners, or a
   specific transfer request or group of transfer requests, may have a
   detrimental effect on the Accumulation Unit Values of any Variable
   Sub-Account or on the share prices of the corresponding Portfolio or
   otherwise would be to the disadvantage of other Contract Owners; or

..  we are informed by one or more of the Portfolios that they intend to
   restrict the purchase, exchange, or redemption of Portfolio shares because
   of excessive trading or because they believe that a specific transfer or
   group of transfers would have a detrimental effect on the prices of
   Portfolio shares.

In making the determination that trading activity constitutes market timing or
excessive trading, we will consider, among other things:

..  the total dollar amount being transferred, both in the aggregate and in the
   transfer request;

..  the number of transfers you make over a period of time and/or the period of
   time between transfers (note: one set of transfers to and from a Variable
   Sub-Account in a short period of time can constitute market timing);

..  whether your transfers follow a pattern that appears designed to take
   advantage of short term market fluctuations, particularly within certain
   Variable Sub-Account underlying Portfolios that we have identified as being
   susceptible to market timing activities (E.G., International, High Yield,
   and Small Cap Variable Sub-Accounts);

..  whether the manager of the underlying Portfolio has indicated that the
   transfers interfere with Portfolio management or otherwise adversely impact
   the Portfolio; and

..  the investment objectives and/or size of the Variable Sub-Account underlying
   Portfolio.

We seek to apply these trading limitations uniformly. However, because these
determinations involve the exercise of discretion, it is possible that we may
not detect some market timing or excessive trading activity. As a result, it is
possible that some investors may be able to engage in market timing or
excessive trading activity, while others are prohibited, and the Portfolio may
experience the adverse effects of market timing and excessive trading described
above.

If we determine that a Contract Owner has engaged in market timing or excessive
trading activity, we will require that all future transfer requests be
submitted through U.S. Postal Service First Class Mail thereby refusing to
accept transfer requests via telephone, facsimile, Internet, or overnight
delivery. If we determine that a Contract Owner continues to engage in a
pattern of market timing or excessive trading activity we will restrict that
Contract Owner from making future additions or transfers into the impacted
Variable Sub-Account(s) or will restrict that Contract Owner from making future
additions or transfers into the class of Variable Sub-Account(s) if the
Variable Sub-Accounts(s) involved are vulnerable to arbitrage market timing
trading activity (E.G., International, High Yield, and Small Cap Variable
Sub-Accounts).

In our sole discretion, we may revise our Trading Limitations at any time as
necessary to better deter or minimize market timing and excessive trading or to
comply with regulatory requirements.

SHORT TERM TRADING FEES

The underlying Portfolios are authorized by SEC regulation to adopt and impose
redemption fees if a Portfolio's Board of Directors determines that such fees
are necessary to minimize or eliminate short-term transfer activity that can
reduce or dilute the value of outstanding shares issued by the Portfolio. The
Portfolio will set the parameters relating to the redemption fee and such
parameters

                                      42
may vary by Portfolio. If a Portfolio elects to adopt and charge redemption
fees, these fees will be passed on to the Contract Owner(s) responsible for the
short-term transfer activity generating the fee.

We will administer and collect redemption fees in connection with transfers
between the Variable Sub-Accounts and forward these fees to the Portfolio.
Please consult the Portfolio's prospectus for more complete information
regarding the fees and charges associated with each Portfolio.

DOLLAR COST AVERAGING PROGRAM

Through our Dollar Cost Averaging Program, you may automatically transfer a
fixed dollar amount on a regular basis from any Variable Sub-Account or any
Fixed Account Option to any of the other Variable Sub-Accounts. You may not use
the Dollar Cost Averaging Program to transfer amounts to the Fixed Account
Options. This program is available only during the Accumulation Phase.

We will not charge a transfer fee for transfers made under this Program, nor
will such transfers count against the 12 transfers you can make each Contract
Year without paying a transfer fee.

By investing amounts on a regular basis instead of investing the total amount
at one time, Dollar Cost Averaging may decrease the effect of market
fluctuations on the investment of your Purchase Payment. This may result in a
lower average cost of units over time. However, there is no guarantee that
Dollar Cost Averaging will result in a profit or protect against a loss in a
declining market. We do not deduct a charge for participating in a Dollar Cost
Averaging program. Call or write us for instructions on how to enroll.

AUTOMATIC PORTFOLIO REBALANCING PROGRAM

Once you have allocated your money among the Variable Sub-Accounts, the
performance of each Sub-Account may cause a shift in the percentage you
allocated to each Sub-Account. If you select our Automatic Portfolio
Rebalancing Program, we will automatically rebalance the Contract Value in each
Variable Sub-Account and return it to the desired percentage allocations. Money
you allocate to the Fixed Account will not be included in the rebalancing.

We will rebalance your account quarterly, semi-annually, or annually. We will
measure these periods according to your instructions. We will transfer amounts
among the Variable Sub-Accounts to achieve the percentage allocations you
specify. You can change your allocations at any time by contacting us in
writing or by telephone. The new allocation will be effective with the first
rebalancing that occurs after we receive your written or telephone request. We
are not responsible for rebalancing that occurs prior to receipt of proper
notice of your request.

Example:

   Assume that you want your initial purchase payment split among 2 Variable
   Sub-accounts. You want 40% to be in the PIMCO Foreign Bond (U.S.
   Dollar-Hedged) - Administrative Shares Sub-Account Variable Sub-account and
   60% to be in the Fidelity VIP Index 500 - Service Class 2 Sub-Account
   Variable Sub-account. Over the next 2 months the bond market does very well
   while the stock market performs poorly. At the end of the first quarter, the
   PIMCO Foreign Bond (U.S. Dollar-Hedged) - Administrative Shares Sub-Account
   Variable Sub-account now represents 50% of your holdings because of its
   increase in value. If you choose to have your holdings in a Contract or
   Contracts rebalanced quarterly, on the first day of the next quarter we
   would sell some of your units in the PIMCO Foreign Bond (U.S. Dollar-Hedged)
   - Administrative Shares Sub-Account Variable Sub-account for the appropriate
   Contract(s) and use the money to buy more units in the Fidelity VIP Index
   500 - Service Class 2 Sub-Account Variable Sub-account so that the
   percentage allocations would again be 40% and 60% respectively.

The transfers made under the program do not count towards the 12 transfers you
can make without paying a transfer fee, and are not subject to a transfer fee.

Portfolio rebalancing is consistent with maintaining your allocation of
investments among market segments, although it is accomplished by reducing your
Contract Value allocated to the Variable Sub-Accounts that performed better
during the previous time period.

                                      43
EXPENSES

As a Contract Owner, you will bear, directly or indirectly, the charges and
expenses described below.

CONTRACT MAINTENANCE CHARGE

During the Accumulation Phase, on each Contract Anniversary, we will deduct a
$40 contract maintenance charge from your assets invested in the PIMCO Money
Market Variable Sub-account ($30 if the Contract value is equal to or greater
than $2,000.) If there are insufficient assets in that Variable Sub-account, we
will deduct the balance of the charge proportionally from the other Variable
Sub-accounts. We also will deduct this charge if you withdraw your entire
Contract Value, unless your Contract qualifies for a waiver. During the Payout
Phase, we will deduct the charge proportionately from each income payment.

The charge is to compensate us for the cost of administering the Contracts and
the Variable Account. Maintenance costs include expenses we incur in billing
and collecting purchase payments; keeping records; processing death claims,
cash withdrawals, and policy changes; proxy statements; calculating
Accumulation Unit Values and income payments; and issuing reports to Contract
Owners and regulatory agencies. We cannot increase the charge. We will waive
this charge for a Contract Anniversary if, on that date:

    .  your Contract Value is equal to or greater than $50,000; or

    .  your entire Contract Value is allocated to the Fixed Account Options or,
       after the Payout Start Date, if all income payments are fixed income
       payments.

We also reserve the right to waive this charge if you own more than one
Contract and the Contracts meet certain minimum dollar amount requirements. In
addition, we reserve the right to waive this charge for all Contracts.

ADMINISTRATIVE EXPENSE CHARGE

We currently deduct an administrative expense charge daily at an annual rate of
0.10% of the average daily net assets you have invested in the Variable
Sub-accounts. We intend this charge to cover actual administrative expenses
that exceed the revenues from the contract maintenance charge. There is no
necessary relationship between the amount of administrative charge imposed on a
given Contract and the amount of expenses that may be attributed to that
Contract. We assess this charge each day during the Accumulation Phase and the
Payout Phase. We may increase this charge for Contracts issued in the future,
but in no event will it exceed 0.25%. We guarantee that after your Contract is
issued we will not increase this charge for your Contract.

MORTALITY AND EXPENSE RISK CHARGE

We deduct a mortality and expense risk charge daily from the net assets you
have invested in the Variable Sub-Accounts. We assess mortality and expense
risk charges during the Accumulation and Payout Phases of the Contract, except
as noted below. The annual mortality and expense risk charge for the Contracts
without any optional benefit are as follows:

Consultant Solutions Classic............................................. 1.25%
Consultant Solutions Plus................................................ 1.45%
Consultant Solutions Elite............................................... 1.60%
Consultant Solutions Select.............................................. 1.70%

The mortality and expense risk charge is for all the insurance benefits
available with your Contract (including our guarantee of annuity rates and the
death benefits), for certain expenses of the Contract, and for assuming the
risk (expense risk) that the current charges will not be sufficient in the
future to cover the cost of administering the Contract. The mortality and
expense risk charge also helps pay for the cost of the Credit Enhancement under
the CONSULTANT SOLUTIONS PLUS CONTRACT. If the charges under the Contract are
not sufficient, then we will bear the loss. We charge an additional amount for
the optional benefits to compensate us for the additional risk that we accept
by providing these options.

You will pay additional mortality and expense risk charges if you add any
optional benefits to your Contract. The additional mortality and expense risk
charge you pay will depend upon which of the options you select:

..  MAV Death Benefit Option: The current mortality and expense risk charge for
   this option is 0.20%. This charge may be increased, but will never exceed
   0.50%. We guarantee that we will not increase the mortality and expense risk
   charge for this option after you have added it to your Contract. We deduct
   the charge for this option only during the Accumulation Phase.

..  Annual Increase Death Benefit Option: The current mortality and expense risk
   charge for this option is 0.30%. This charge may be increased, but will
   never exceed 0.50%. We guarantee that we will not increase the mortality and
   expense risk charge for this option after you have added it to your
   Contract. We deduct the charge for this option only during the Accumulation
   Phase.

..  Enhanced Earnings Death Benefit Option: The current mortality and expense
   risk charge for this option is:

    .  0.25% (maximum of 0.35%) if the oldest Contract Owner and Co-Annuitant,
       or, if the Contract is owned by a non-living person, the oldest
       Annuitant, are age 70 or younger on the Rider Application Date;

    .  0.40% (maximum of 0.50%) if the oldest Contract Owner or, if older, the
       Co-Annuitant, or, if the Contract is owned by a non-living person, the
       oldest Annuitant, is age 71 or older and age 79 or younger on the Rider
       Application Date.

                                      44
    .  The charges may be increased but they will never exceed the maximum
       charges shown above. We guarantee that we will not increase the
       mortality and expense risk charge for this option after you have added
       it to your Contract. However, if your spouse elects to continue the
       Contract in the event of your death and if he or she elects to continue
       the Enhanced Earnings Death Benefit Option, the charge will be based on
       the age of the new Contract Owner at the time the Contract is continued.
       Refer to the Death Benefit Payments provision in this prospectus for
       more information. We deduct the charge for this option only during the
       Accumulation Phase.

..  Income Protection Benefit Option: The current mortality and expense risk
   charge for this option is 0.50%. This charge may be increased, but will
   never exceed 0.75%. We guarantee that we will not increase the mortality and
   expense risk for this option after you have added it to your Contract. This
   option may be added to your Contract on the Payout Start Date. The charge
   will be deducted only during the Payout Phase.

TRUERETURN ACCUMULATION BENEFIT OPTION FEE

We charge a separate annual Rider Fee for the TrueReturn Accumulation Benefit
Option. The current annual Rider Fee is 0.50% of the Benefit Base. We deduct
the Rider Fee on each Contract Anniversary during the Rider Period or until you
terminate the Option, if earlier. We reserve the right to increase the Rider
Fee to up to 1.25%. We currently charge the same Rider Fee regardless of the
Rider Period and Guarantee Option you select, however we reserve the right to
charge different fees for different Rider Periods and Guarantee Options in the
future. However, once we issue your Option, we cannot change the Rider Fee that
applies to your Contract. If you elect to exercise the Rider Trade-In Option,
the new Rider Fee will be based on the Rider Fee percentage applicable to a new
TrueReturn Accumulation Benefit Option at the time of trade-in.

The Rider Fee is deducted only from the Variable Sub-account(s) on a pro rata
basis in the proportion that your value in each Variable Sub-account bears to
your total value in all Variable Sub-accounts. Rider Fees will decrease the
number of Accumulation Units in each Variable Sub-account. If you terminate the
Option, or terminate the Contract by a total withdrawal, prior to the Rider
Maturity Date on a date other than the Contract Anniversary, we will deduct a
Rider Fee that is prorated based on the number of full months between the
Contract Anniversary immediately prior to the termination and the date of the
termination. However, if the Option is terminated due to death of the Contract
Owner or Annuitant, we will not charge a Rider Fee unless the date we receive a
Complete Request for Settlement of the Death Proceeds is also a Contract
Anniversary. If the Option is terminated on the Payout Start Date, we will not
charge a Rider Fee unless the Payout Start Date is also a Contract Anniversary.
Additionally, if you elect to exercise the Rider Trade-In Option and cancel the
Option on a date other than a Contract Anniversary, we will not deduct a Rider
Fee on the date the Option is terminated. Refer to the "TrueReturn Accumulation
Benefit Option" section of this prospectus for more information.

SPOUSAL PROTECTION BENEFIT (CO-ANNUITANT) OPTION FEE

We charge a separate annual Rider Fee for the Spousal Protection Benefit
(Co-Annuitant) Option. The current annual Rider Fee is 0.10% of the Contract
Value. This fee applies to Options added on or after May 1, 2005. For Options
added prior to May 1, 2005, there is no charge associated with the Options. We
deduct the Rider Fee on each Contract Anniversary and in certain circumstances
on the date you terminate the Option. We reserve the right to increase the
annual Rider Fee on newly issued Options to up to 0.15% of the Contract Value.
We also reserve the right to charge different Rider Fees for new Spousal
Protection Benefit (Co-Annuitant) Options we offer in the future. However, once
we issue your Option, we cannot change the Rider Fee that applies to your
Contract.

The Rider Fee is deducted only from the Variable Sub-Account(s) on a pro-rata
basis in the proportion that your value in each Variable Sub-Account bears to
your total value in all Variable Sub-Accounts. Rider Fees will decrease the
number of Accumulation Units in each Variable Sub-Account. If, at the time the
Rider Fee is deducted, the Rider Fee exceeds the total value in all Variable
Sub-Accounts, the excess of the Rider Fee over the total value in all Variable
Sub-Accounts will be waived.

The first Rider Fee will be deducted on the first Contract Anniversary
following the Rider Date. A Rider Fee will be deducted on each subsequent
Contract Anniversary while the Rider is in force.

For the first Contract Anniversary following the Rider Date, the Rider Fee is
equal to the number of full months from the Rider Date to the first Contract
Anniversary, divided by twelve, multiplied by 0.10%, with the result multiplied
by the Contract Value as of the first Contract Anniversary. For subsequent
Contract Anniversaries, the Rider Fee is equal to 0.10% multiplied by the
Contract Value as of that Contract Anniversary.

If the Rider is terminated for any reason on a Contract Anniversary, we will
deduct a full Rider Fee. If the Option is terminated on a date other than a
Contract Anniversary, we will deduct a pro rata Rider Fee, except we will not
charge any Rider Fee if the Option is terminated on the Payout Start Date or
due to the death of the Contract Owner or Annuitant. If we charge a Rider Fee
on the termination of the Option, the Rider Fee will be reduced pro rata, so
that you are only charged for the number of full months this Option was in
effect.

SUREINCOME WITHDRAWAL BENEFIT OPTION FEE

We charge a separate annual Rider Fee for the SureIncome Option ("SureIncome
Option Fee" or "Rider Fee"). The current annual Rider Fee is 0.50% of the
Benefit Base. We deduct the Rider Fee on each Contract Anniversary up to and
including the date you terminate the Option. We reserve the right to increase
the Rider Fee to up to 1.25% of the Benefit Base. We also reserve the right to
charge different Rider Fees for different Withdrawal Benefit Factors we may
offer in the future. However, once we issue your SureIncome Option, we cannot
change the Rider Fee that applies to your Option. If you elect to exercise the
Rider Trade-In Option, the new Rider Fee will be based on the Rider Fee
percentage applicable to a new SureIncome Option at the time of trade-in.

                                      45
The Rider Fee is deducted only from the Variable Sub-Account(s) on a pro-rata
basis in the proportion that your Contract Value in each Variable Sub-Account
bears to your total Contract Value in all Variable Sub-Accounts. Rider Fees
will decrease the number of Accumulation Units in each Variable Sub-Account.
If, at the time the Rider Fee is deducted, the Rider Fee exceeds the total
Contract Value in all Variable Sub-Accounts, the excess of the Rider Fee over
the total Contract Value in all Variable Sub-Accounts will be waived.

The first Rider Fee will be deducted on the first Contract Anniversary
following the Rider Date. A Rider Fee will be deducted on each subsequent
Contract Anniversary the SureIncome Option is in force.

For the first Contract Anniversary following the Rider Date, the Rider Fee is
equal to the number of full months from the Rider Date to the first Contract
Anniversary, divided by twelve, multiplied by 0.50%, with the result multiplied
by the Benefit Base as of the first Contract Anniversary. For subsequent
Contract Anniversaries, the Rider Fee is equal to the 0.50% multiplied by the
Benefit Base as of that Contract Anniversary.

If the SureIncome Option is terminated for any reason on a Contract
Anniversary, we will deduct a full Rider Fee. If the SureIncome Option is
terminated on a date other than a Contract Anniversary, we will deduct a pro
rata Rider Fee, except we will not charge any Rider Fee if the SureIncome
Option is terminated on the Payout Start Date or due to the death of the
Contract Owner or Annuitant. If we charge a Rider Fee on the termination of the
SureIncome Option, the Rider Fee will be reduced pro rata, so that you are only
charged for the number of full months the SureIncome Option was in effect.

TRANSFER FEE

We impose a fee upon transfers in excess of 12 during any Contract Year. The
current fee is equal to 1.00% of the dollar amount transferred. This fee may be
increased, but in no event will it exceed 2.00% of the dollar amount
transferred. In any event, the transfer fee will never be greater than $25. We
will not charge a transfer fee on transfers that are part of a Dollar Cost
Averaging Program or Automatic Portfolio Rebalancing Program.

WITHDRAWAL CHARGE

<R>
For all of the contracts except the CONSULTANT SOLUTIONS SELECT, we may assess
a withdrawal charge from the purchase payment(s) you withdraw. The amount of
the charge will depend on the number of years that have elapsed since we
received the purchase payment being withdrawn. A schedule showing the
withdrawal charges applicable to each Contract appears on page 9. If you make a
withdrawal before the Payout Start Date, we will apply the withdrawal charge
percentage in effect on the date of the withdrawal, or the withdrawal charge
percentage in effect on the following day, whichever is lower.
</R>

Withdrawals also may be subject to tax penalties or income tax. You should
consult with your tax counsel or other tax advisor regarding any withdrawals.

<R>
Withdrawals from the Market Value Adjusted Fixed Account Option may be subject
to a market value adjustment. Refer to page 38 for more information on market
value adjustments.
</R>

FREE WITHDRAWAL AMOUNT

You can withdraw up to the Free Withdrawal Amount each Contract Year without
paying the withdrawal charge. The Free Withdrawal Amount for a Contract Year is
equal to 15% of all purchase payments (excluding Credit Enhancements for
CONSULTANT SOLUTIONS PLUS CONTRACTS) that are subject to a withdrawal charge as
of the beginning of that Contract Year, plus 15% of the purchase payments added
to the Contract during the Contract Year. The withdrawal charge applicable to
Contracts owned by Charitable Remainder Trusts is described below.

Purchase payments no longer subject to a withdrawal charge will not be used to
determine the Free Withdrawal Amount for a Contract Year, nor will they be
assessed a withdrawal charge, if withdrawn. The Free Withdrawal Amount is not
available in the Payout Phase.

You may withdraw up to the Free Withdrawal Amount in each Contract Year it is
available without paying a withdrawal charge; however, the amount withdrawn may
be subject to a Market Value Adjustment or applicable taxes. If you do not
withdraw the entire Free Withdrawal Amount in a Contract Year, any remaining
portion may not be carried forward to increase the Free Withdrawal Amount in a
later Contract Year.

For purposes of assessing the withdrawal charge, we will treat withdrawals as
coming from the oldest purchase payments first as follows:

1) Purchase payments that no longer are subject to withdrawal charges;

2) Free Withdrawal Amount (if available);

3) Remaining purchase payments subject to withdrawal charges, beginning with
   the oldest purchase payment;

4) Any earnings not previously withdrawn.

However, for federal income tax purposes, earnings are considered to come out
first, which means that you will pay taxes on the earnings portion of your
withdrawal.

If the Contract Owner is a Charitable Remainder Trust, the Free Withdrawal
Amount in a Contract Year is equal to the greater of:

..  The Free Withdrawal Amount described above; or

                                      46
..  Earnings as of the beginning of the Contract Year that have not been
   previously withdrawn.

For purposes of assessing the withdrawal charge for a Charitable Remainder
Trust-Owned Contract, we will treat withdrawals as coming from the earnings
first and then the oldest purchase payments as follows:

1) Earnings not previously withdrawn;

2) Purchase payments that are no longer subject to withdrawal charges;

3) Free Withdrawal Amount in excess of earnings;

4) Purchase payments subject to withdrawal charges, beginning with the oldest
   purchase payment.

If you have selected the CONSULTANT SOLUTIONS SELECT CONTRACT, there are no
withdrawal charges applicable and, therefore, no Free Withdrawal Amount.
Amounts withdrawn may be subject to a Market Value Adjustment or applicable
taxes.

ALL CONTRACTS

We do not apply a withdrawal charge in the following situations:

..  the death of the Contract Owner or Annuitant (unless the Settlement Value is
   used);

..  withdrawals taken to satisfy IRS minimum distribution rules for the
   Contract; or

..  withdrawals that qualify for one of the waivers described below.

We use the amounts obtained from the withdrawal charge to pay sales commissions
and other promotional or distribution expenses associated with marketing the
Contracts, and to help defray the cost of the Credit Enhancement for the
CONSULTANT SOLUTIONS PLUS CONTRACTS. To the extent that the withdrawal charge
does not cover all sales commissions and other promotional or distribution
expenses, or the cost of the Credit Enhancement, we may use any of our
corporate assets, including potential profit which may arise from the mortality
and expense risk charge or any other charges or fee described above, to make up
any difference.

Withdrawals taken prior to annuitization (referred to in this prospectus as the
Payout Phase) are generally considered to come from the earnings in the
Contract first. If the Contract is tax-qualified, generally all withdrawals are
treated as distributions of earnings. Withdrawals of earnings are taxed as
ordinary income and, if taken prior to age 59 1/2, may be subject to an
additional 10% federal tax penalty. You should consult your own tax counsel or
other tax advisers regarding any withdrawals.

<R>
CONFINEMENT WAIVER. We will waive the withdrawal charge on all withdrawals
taken under your Contract if the following conditions are satisfied:

1. you, or, if the Contract Owner is not a living person, the Annuitant, are
   first confined to a long term care facility or a hospital for at least 90
   consecutive days. You or the Annuitant must first enter the long term care
   facility or hospital at least 30 days after the Issue Date,

2. we receive your request for withdrawal and written proof of the stay no
   later than 90 days following the end of your or the Annuitant's stay at the
   long term care facility or hospital, and

3. Due proof of confinement is received by us prior to or at the time of, a
   request for a withdrawal.
</R>

"DUE PROOF" includes, but is not limited to, a letter signed by a physician
stating the dates the Owner or Annuitant was confined, the name and location of
the Long Term Care Facility or Hospital, a statement that the confinement was
medically necessary, and, if released, the date the Owner or Annuitant was
released from the Long Term Care Facility or Hospital.

TERMINAL ILLNESS WAIVER. We will waive the withdrawal charge on all withdrawals
under your Contract if:

<R>
1. you or the Annuitant, if the Contract Owner is not a living person, are
   diagnosed by a physician as having a terminal illness (as defined in the
   Contract) at least 30 days after the Issue Date, and
</R>

2. you provide Due Proof of diagnosis to us before or at the time you request
   the withdrawal.

"DUE PROOF" includes, but is not limited to, a letter signed by a physician
stating that the Owner or Annuitant has a Terminal Illness and the date the
Terminal Illness was first diagnosed.

UNEMPLOYMENT WAIVER. We will waive the withdrawal charge on one partial or a
full withdrawal taken under your Contract, if you meet the following
requirements:

<R>
1. you or the Annuitant, if the Contract Owner is not a living person, become
   unemployed at least one year after the Issue Date,

2. you or the Annuitant receive unemployment compensation (as defined in the
   Contract) for at least 30 days as a result of that unemployment, and

3. you or the Annuitant claim this benefit within 180 days of your or the
   Annuitant's initial receipt of unemployment compensation, and we receive due
   proof that you are or have been unemployed and that unemployment
   compensation has been received for at least thirty consecutive days prior to
   or at the time of the request for withdrawal.
</R>

                                      47
"UNEMPLOYMENT COMPENSATION" means unemployment compensation received from a
unit of state or federal government in the U.S. "DUE PROOF" includes, but is
not limited to, a legible photocopy of an unemployment compensation payment
that meets the above described criteria with regard to dates and a signed
letter from you stating that you or the Annuitant meet the above described
criteria.

You may exercise this benefit once over the term of the Contract. Amounts
withdrawn may be subject to Market Value Adjustments.

These waivers do not apply under the CONSULTANT SOLUTIONS SELECT.

Please refer to your Contract for more detailed information about the terms and
conditions of these waivers.

The laws of your state may limit the availability of these waivers and may also
change certain terms and/or benefits available under the waivers. You should
consult your Contract for further details on these variations. Also, even if
you do not pay a withdrawal charge because of these waivers, a Market Value
Adjustment may apply and you still may be required to pay taxes or tax
penalties on the amount withdrawn. You should consult your tax advisor to
determine the effect of a withdrawal on your taxes.

PREMIUM TAXES

Some states and other governmental entities (E.G., municipalities) charge
premium taxes or similar taxes. We are responsible for paying these taxes and
will deduct them from your Contract Value. Some of these taxes are due when the
Contract is issued, others are due when income payments begin or upon
surrender. Our current practice is not to charge anyone for these taxes until
income payments begin or when a total withdrawal occurs including payment upon
death. We may some time in the future discontinue this practice and deduct
premium taxes from the purchase payments. Premium taxes generally range from 0%
to 4%, depending on the state.

At the Payout Start Date, we deduct the charge for premium taxes from each
investment alternative in the proportion that the Contract Value in the
investment alternative bears to the total Contract Value.

DEDUCTION FOR VARIABLE ACCOUNT INCOME TAXES

We are not currently maintaining a provision for taxes. In the future, however,
we may establish a provision for taxes if we determine, in our sole discretion,
that we will incur a tax as a result of the operation of the Variable Account.
We will deduct for any taxes we incur as a result of the operation of the
Variable Account, whether or not we previously made a provision for taxes and
whether or not it was sufficient. Our status under the Internal Revenue Code is
briefly described in the "Taxes" section of this prospectus.

OTHER EXPENSES

<R>
Each Portfolio deducts management fees and other expenses from its assets. You
indirectly bear the charges and expenses of the Portfolios whose shares are
held by the Variable Sub-accounts. These fees and expenses are described in the
prospectuses for the Portfolios. For a summary of Portfolio annual expenses,
see page 10. We receive compensation from the investment advisers,
administrators or distributors, or their affiliates, of the Portfolios in
connection with the administrative services we provide to the Portfolios. We
collect this compensation under agreement between us and the Portfolio's
investment adviser, administrators or distributors, and is calculated based on
a percentage of the average assets allocated to the Portfolio.
</R>

                                      48
ACCESS TO YOUR MONEY
<R>
</R>

WITHDRAWALS

<R>
You can withdraw some or all of your Contract Value at any time prior to the
Payout Start Date. Withdrawals also are available under limited circumstances
on or after the Payout Start Date. See "Income Plans" on page 50.
</R>

The amount payable upon withdrawal is the Contract Value (or portion thereof)
next computed after we receive the request for a withdrawal at our home office,
adjusted by any applicable Market Value Adjustment, less any applicable
withdrawal charges, income tax withholding, penalty tax, contract maintenance
charge, Rider Fee, and any premium taxes. We will pay withdrawals from the
Variable Account within 7 days of receipt of the request, subject to
postponement in certain circumstances. You can withdraw money from the Variable
Account or the Fixed Account Option(s) available under your Contract. To
complete a partial withdrawal from the Variable Account, we will cancel
Accumulation Units in an amount equal to the withdrawal and any applicable
charges, fees and taxes.

You must name the investment alternative from which you are taking the
withdrawal. If none is named, then the withdrawal request is incomplete and
cannot be honored.

In general, you must withdraw at least $50 at a time.

<R>
Withdrawals from the Standard Fixed Account Option may be subject to a
restriction. See "Standard Fixed Account Option" on page 37.

Withdrawals taken prior to the Payout Start Date are generally considered to
come from the earnings in the Contract first. If the Contract is tax-qualified,
generally all withdrawals are treated as distributions of earnings. Withdrawals
of earnings are taxed as ordinary income and, if taken prior to age
59/ 1//\\2\\, may be subject to an additional 10% federal penalty tax. If any
withdrawal reduces your Contract Value to less than $1,000, we will treat the
request as a withdrawal of the entire Contract Value, unless the SureIncome
Withdrawal Benefit Option is currently attached to your Contract. If you
request a total withdrawal, we may require that you return your Contract to us.
Your Contract will terminate if you withdraw all of your Contract Value,
subject to certain exceptions if the SureIncome Withdrawal Benefit Option is
currently attached to your Contract. See "SureIncome Withdrawal Benefit Option"
for more details. We will, however, ask you to confirm your withdrawal request
before terminating your Contract. If we terminate your Contract, we will
distribute to you its Contract Value, adjusted by any applicable Market Value
Adjustment, less withdrawal and other charges and taxes.
</R>

WRITTEN REQUESTS AND FORMS IN GOOD ORDER. Written requests must include
sufficient information and/or documentation, and be sufficiently clear, to
enable us to complete your request without the need to exercise discretion on
our part to carry it out. You may contact our Customer Service Center to learn
what information we require for your particular request to be in "good order."
Additionally, we may require that you submit your request on our form. We
reserve the right to determine whether any particular request is in good order,
and to change or waive any good order requirements at any time.

POSTPONEMENT OF PAYMENTS

We may postpone the payment of any amounts due from the Variable Account under
the Contract if:

<R>
1. The New York Stock Exchange is closed for other than usual weekends or
   holidays, or trading on the Exchange is otherwise restricted,

2. An emergency exists as defined by the SEC, or

3. The SEC permits delay for your protection.
</R>

We may delay payments or transfers from the Fixed Account Option(s) available
under your Contract for up to 6 months or shorter period if required by law. If
we delay payment or transfer for 30 days or more, we will pay interest as
required by law.

SYSTEMATIC WITHDRAWAL PROGRAM

You may choose to receive systematic withdrawal payments on a monthly,
quarterly, semi-annual, or annual basis at any time prior to the Payout Start
Date. Please consult your sales representative or call us at 800-457-7617 for
more information.

Depending on fluctuations in the value of the Variable Sub-Accounts and the
value of the Fixed Account Options, systematic withdrawals may reduce or even
exhaust the Contract Value. Income taxes may apply to systematic withdrawals.
Please consult your tax advisor before taking any withdrawal.

We will make systematic withdrawal payments to you or your designated payee. At
our discretion, we may modify or suspend the Systematic Withdrawal Program and
charge a processing fee for the service. If we modify or suspend the Systematic
Withdrawal Program, existing systematic withdrawal payments will not be
affected.

MINIMUM CONTRACT VALUE

If your request for a partial withdrawal would reduce your Contract Value to
less than $1,000, we may treat it as a request to withdraw your entire Contract
Value, unless the SureIncome Withdrawal Benefit Option is currently attached to
your Contract. Your Contract will terminate if you withdraw all of your
Contract Value. We will, however, ask you to confirm your withdrawal request
before

                                      49
terminating your Contract. If we terminate your Contract, we will distribute to
you its Contract Value, adjusted by any applicable Market Value Adjustment,
less withdrawal and other charges and applicable taxes.

INCOME PAYMENTS

PAYOUT START DATE

The Payout Start Date is the day that we apply your Contract Value, adjusted by
any applicable Market Value Adjustment and less applicable taxes, to an Income
Plan. The first income payment may occur no sooner than 30 days after the Issue
Date. The Payout Start Date must occur on or before the later of:

    .  the youngest Annuitant's 99th birthday, or

    .  the 10th Contract Anniversary.

You may change the Payout Start Date at any time by notifying us in writing of
the change at least 30 days before the scheduled Payout Start Date. Absent a
change, we will use the Payout Start Date stated in your Contract.

INCOME PLANS

An "Income Plan" is a series of payments made on a scheduled basis to you or to
another person designated by you. You may select more than one Income Plan. If
you choose more than one Income Plan, you must specify what proportions of your
Contract Value, adjusted by any Market Value Adjustment and less any applicable
taxes, should be allocated to each such Income Plan. For tax reporting
purposes, your cost basis and any gain on the Contract will be allocated
proportionally to each Income Plan you select based on the proportion of your
Contract Value applied to each such Income Plan. We reserve the right to limit
the number of Income Plans that you may select. If you choose to add the Income
Protection Benefit Option, certain restrictions may apply as described under
"Income Protection Benefit Option," below.

If you do not select an Income Plan, we will make income payments in accordance
with Income Plan 1 with a Guaranteed Payment Period of 10 years. On the Payout
Start Date, the portion of the Contract Value in any Fixed Account Option,
adjusted by any applicable Market Value Adjustment and less any applicable
taxes, will be used to derive fixed income payments; the portion of the
Contract Value in any Variable Sub-account, less any applicable taxes, will be
used to derive variable income payments.

If any Contract Owner dies during the Payout Phase, the new Contract Owner will
be the surviving Contract Owner. If there is no surviving Contract Owner, the
new Contract Owner will be the Beneficiary(ies) as described in the
"Beneficiary" section of this prospectus. Any remaining income payments will be
paid to the new Contract Owner as scheduled. Income payments to Beneficiaries
may be subject to restrictions established by the Contract Owner. After the
Payout Start Date, you may not make withdrawals (except as described below) or
change your choice of Income Plan.

Currently seven Income Plans are available. Depending on the Income Plan(s) you
choose, you may receive:

    .  fixed income payments;

    .  variable income payments; or

    .  a combination of the two.

Partial annuitizations are not allowed. Your total Contract Value, adjusted by
any applicable Market Value Adjustment, and less any applicable taxes, must be
applied to your Income Plan(s) on the Payout Start Date.

A portion of each payment will be considered taxable and the remaining portion
will be a non-taxable return of your investment in the Contract, which is also
called the "basis". Once the basis in the Contract is depleted, all remaining
payments will be fully taxable. If the Contract is tax-qualified, generally,
all payments will be fully taxable. Taxable payments taken prior to age 59 1/2
may be subject to an additional 10% federal tax penalty.

The seven Income Plans are:

INCOME PLAN 1 - LIFE INCOME WITH GUARANTEED NUMBER OF PAYMENTS. Under this
plan, we make periodic income payments for at least as long as the Annuitant
lives. If the Annuitant dies in the Payout Phase, we will continue to pay
income payments until the guaranteed number of payments has been paid. The
number of months guaranteed ("Guaranteed Payment Period") may be 0 months, or
range from 60 to 360 months. If the Annuitant is age 90 or older as of the
Payout Start Date, the Guaranteed Payment Period may range from 60 to 360
months.

INCOME PLAN 2 - JOINT AND SURVIVOR LIFE INCOME WITH GUARANTEED NUMBER OF
PAYMENTS. Under this plan, we make periodic income payments for at least as
long as either the Annuitant or the joint Annuitant, named at the time the
Income Plan was selected, lives. If both the Annuitant and joint Annuitant die
in the Payout Phase, we will continue to pay the income payments until the
guaranteed number of payments has been paid. The Guaranteed Payment Period may
be 0 months, or range from 60 to 360 months. If either the Annuitant or joint
Annuitant is age 90 or older as of the Payout Start Date, the Guaranteed
Payment Period may range from 60 to 360 months. You may elect a reduced
survivor plan of 50%, 66% or 75% of the payment amount. If you do not elect a
reduced survivor amount, the payments will remain at 100%. If you elect a
reduced survivor payment plan, the amount of each income

                                      50
payment initially will be higher but a reduction will take place at the later
of 1) the death of an Annuitant; or 2) at the end of the guaranteed payment
period.

INCOME PLAN 3 - GUARANTEED NUMBER OF PAYMENTS. Under this plan, we make
periodic income payments for the period you have chosen. These payments do not
depend on the Annuitant's life. The shortest number of months guaranteed is 60
(120 if the Payout Start Date occurs prior to the third Contract Anniversary).
The longest number of months guaranteed is 360 or the number of months between
the Payout Start Date and the date that the Annuitant reaches age 100, if
greater. In no event may the number of months guaranteed exceed 600. We will
deduct the mortality and expense risk charge from the assets of the Variable
Sub-account supporting this Income Plan even though we may not bear any
mortality risk. You may make withdrawals, change the length of the guaranteed
payment period, or change the frequency of income payments under Income Plan 3.
See "Modifying Payments" and "Payout Withdrawals" below for more details.

INCOME PLAN 4 - LIFE INCOME WITH CASH REFUND. Under this plan, we make periodic
income payments until the death of the Annuitant. If the death of the Annuitant
occurs before the total amount applied to an Income Plan is paid out, we will
pay a lump sum payment of the remaining amount. Payments under this plan are
available only as fixed income payments.

INCOME PLAN 5 - JOINT LIFE INCOME WITH CASH REFUND. Under this plan, we make
periodic income payments until the deaths of both the Annuitant and joint
Annuitant. If the deaths of both the Annuitant and joint Annuitant occur before
the total amount applied to an Income Plan is paid out, we will pay a lump sum
payment of the remaining amount. Currently, a reduced survivor plan is not
available. Payments under this plan are available only as fixed income payments.

INCOME PLAN 6 - LIFE INCOME WITH INSTALLMENT REFUND. Under this plan, we make
periodic income payments until the later of (1) the death of the Annuitant, or
(2) the total amount paid out under the annuity is equal to the total amount
applied to the Income Plan. If the death of the Annuitant occurs before the
total amount applied to an Income Plan is paid out, we will continue to make
payments in the same manner until any remaining payments are paid out. Payments
under this plan are available only as fixed income payments.

INCOME PLAN 7 - JOINT LIFE INCOME WITH INSTALLMENT REFUND. Under this plan, we
make periodic income payments until the later of (1) the deaths of both the
Annuitant and joint Annuitant, or (2) the total amount paid out under the
annuity is equal to the total amount applied to the Income Plan. If the deaths
of both the Annuitant and joint Annuitant occur before the total amount applied
to an Income Plan is paid out, we will continue to make payments in the same
manner until any remaining payments are paid out. Currently, a reduced survivor
plan is not available. Payments under this plan are available only as fixed
income payments.

If you choose an Income Plan with payments that continue for the life of the
Annuitant or joint Annuitant, we may require proof of age and sex of the
Annuitant or joint Annuitant before starting income payments, and proof that
the Annuitant or joint Annuitant is alive before we make each payment. Please
note that under Income Plans 1 and 2, if you do not select a Guaranteed Payment
Period, it is possible that the payee could receive only one income payment if
the Annuitant and any joint Annuitant both die before the second income
payment, or only two income payments if they die before the third income
payment, and so on.

The length of any Guaranteed Payment Period under your selected Income Plan
generally will affect the dollar amounts of each income payment. As a general
rule, longer Guarantee Payment Periods result in lower income payments, all
other things being equal. For example, if you choose an Income Plan with
payments that depend on the life of the Annuitant but with no guaranteed
payments, the income payments generally will be greater than the income
payments made under the same Income Plan with a specified Guaranteed Payment
Period.

MODIFYING PAYMENTS

After the Payout Start Date, you may make the following changes under Income
Plan 3:

    .  You may request to modify the length of the Guaranteed Payment Period.
       Currently, we allow you to make this change once each Contract Year. We
       reserve the right to change this practice at any time without prior
       notice. If you elect to change the length of the Guaranteed Payment
       Period, the new Guaranteed Payment Period must be within the original
       minimum and maximum period you would have been permitted to select on
       the Payout Start Date. However, the maximum payment period permitted
       will be shortened by the period elapsed since the original Guaranteed
       Payment Period began. If you change the length of your Guaranteed
       Payment Period, we will compute the present value of your remaining
       payments, using the same assumptions we would use if you were
       terminating the income payments, as described in Payout Withdrawal. We
       will then adjust the remaining payments to equal what that value would
       support based on those same assumptions and based on the revised
       Guaranteed Payment Period.

    .  You may request to change the frequency of your payments. We currently
       allow you to make this change once each Contract Year. We reserve the
       right to change this practice at any time without prior notice. Changes
       to either the frequency of payments or length of the Guaranteed Payment
       Period will result in a change to the payment amount and may change the
       amount of each payment that is taxable to you.

Modifying payments of this Contract may not be allowed under Qualified
Contracts. In order to satisfy required minimum distributions ("RMD") under
current Treasury regulations, once income payments have begun over a Guaranteed
Payment Period, the Guaranteed Payment Period cannot be changed even if the new
period is shorter than the maximum permitted. Please consult with a competent
tax advisor prior to making a request to modify payments if your Contract is
subject to RMD requirements.

                                      51
Any change to either the frequency of payments or length of a Guaranteed
Payment Period will take effect on the next payment date after we accept the
requested change.

PAYOUT WITHDRAWAL

You may terminate all or a portion of the income payments being made under
Income Plan 3 at any time and withdraw their present value ("Withdrawal
Value"), subject to a Payout Withdrawal Charge, by requesting a withdrawal
("Payout Withdrawal") in writing. For variable income payments, the withdrawal
value is equal to the present value of the variable income payments being
terminated, calculated using a discount rate equal to the assumed investment
rate that was used in determining the initial variable payment. For fixed
income payments, the withdrawal value is equal to the present value of the
fixed income payments being terminated, calculated using a discount rate equal
to the applicable current interest rate (this may be the initial interest rate
in some states.) The applicable current interest rate is the rate we are using
on the date we receive your Payout Withdrawal request to determine income
payments for a new annuitization with a payment period equal to the remaining
payment period of the income payments being terminated.

A Payout Withdrawal must be a least $50. If any Payout Withdrawal reduces the
value of the remaining income payments to an amount not sufficient to provide
an initial payment of at least $20, we reserve the right to terminate the
Contract and pay you the present value of the remaining income payments in a
lump sum. If you withdraw the entire value of the remaining income payments,
the Contract will terminate.

You must specify the Investment Alternative(s) from which you wish to make a
Payout Withdrawal. If you withdraw a portion of the value of your remaining
income payments, the payment period will remain unchanged and your remaining
payment amounts will be reduced proportionately.

PAYOUT WITHDRAWAL CHARGE

To determine the Payout Withdrawal Charge, we assume that purchase payments are
withdrawn first, beginning with the oldest payment. When an amount equal to all
purchase payments have been withdrawn, additional withdrawals will not be
assessed a Payout Withdrawal Charge.

Payout Withdrawals will be subject to a Payout Withdrawal Charge for each
Contract as follows:

                                     Number of Complete Years Since We Received the Purchase
                                           Payment Being Withdrawn/Applicable Charge:
Contract:                              0      1      2     3     4     5    6      7    8+
---------                             ---    ---   ---   ---   ---   ---   ---   ---   ---
Consultant Solutions Classic........   7%     7%     6%    5%    4%    3%    2%    0%    0%
Consultant Solutions Plus........... 8.5%   8.5%   8.5%  7.5%  6.5%  5.5%    4%  2.5%    0%
Consultant Solutions Elite..........   7%     6%     5%    0%    0%    0%    0%    0%    0%
Consultant Solutions Select.........                                        None

ADDITIONAL INFORMATION. We may make other Income Plans available. You may
obtain information about them by writing or calling us. On the Payout Start
Date, you must specify the portion of the Contract Value to be applied to
variable income payments and the portion to be applied to fixed income
payments. For the portion of your Contract Value to be applied to variable
income payments, you must also specify the Variable Sub-Accounts on which to
base the variable income payments as well as the allocation among those
Variable Sub-Accounts. If you do not tell us how to allocate your Contract
Value among fixed and variable income payments, we will apply your Contract
Value in the Variable Account to variable income payments and your Contract
Value in the Fixed Account to fixed income payments.

We will apply your Contract Value, adjusted by any applicable Market Value
Adjustment, less applicable taxes to your Income Plan(s) on the Payout Start
Date. We can make income payments in monthly, quarterly, semi-annual or annual
installments, as you select. If the Contract Value is less than $2,000 or not
enough to provide an initial payment of at least $20, and state law permits, we
may:

..  terminate the Contract and pay you the Contract Value, adjusted by any
   applicable Market Value Adjustment and less any applicable taxes, in a lump
   sum instead of the periodic payments you have chosen, or

..  reduce the frequency of your payments so that each payment will be at least
   $20.

VARIABLE INCOME PAYMENTS

The amount of your variable income payments depends upon the investment results
of the Variable Sub-accounts you select, the premium taxes you pay, the age and
sex of the Annuitant, and the Income Plan you choose. We guarantee that the
payments will not be affected by (a) company mortality experience or (b) the
amount of our administration expenses.

We cannot predict the total amount of your variable income payments, which may
be more or less than your total purchase payments because (a) variable income
payments vary with the investment results of the underlying Portfolios; and
(b) under some of the Income Plans, we make income payments only so long as an
Annuitant is alive or any applicable Guaranteed Payment Period has not yet
expired.

In calculating the amount of the periodic payments in the annuity tables in the
Contracts, we used an assumed investment rate ("AIR", also known as benchmark
rate) of 3%. Currently, you may choose either a 6%, 5%, or 3% AIR per year. If
you select the Income Protection Benefit Option, however, the 3% AIR must
apply. The 6% and 5% AIR may not be available in all states (check with your

                                      52
representative for availability). Currently, if you do not choose one, the 3%
AIR will automatically apply. We reserve the right to offer other assumed
investment rates. If the actual net investment return of the Variable
Sub-accounts you choose is less than the AIR, then the dollar amount of your
variable income payments will decrease. The dollar amount of your variable
income payments will increase, however, if the actual net investment return
exceeds the AIR. The dollar amount of the variable income payments stays level
if the net investment return equals the AIR. With a higher AIR, your initial
income payment will be larger than with a lower AIR. While income payments
continue to be made, however, this disparity will become smaller and, if the
payments have continued long enough, each payment will be smaller than if you
had initially chosen a lower AIR.

Please refer to the Statement of Additional Information for more detailed
information as to how we determine variable income payments.

You may also elect a variable income payment stream consisting of level
monthly, quarterly or semi-annual payments. If you elect to receive level
monthly, quarterly or semi-annual payments, the payments must be recalculated
annually. You may only elect to receive level payments at or before the Payout
Start Date. If you have elected level payments for an Income Plan(s), you may
not make any variable to fixed payment transfers within such Income Plan(s). We
will determine the amount of each annual payment as described above, place this
amount in our general account, and then distribute it in level monthly,
quarterly or semi-annual payments. The sum of the level payments will exceed
the annual calculated amount because of an interest rate factor we use, which
may vary from year to year, but will not be less than 2% per year. If the
Annuitant dies while you are receiving level payments, you will not be entitled
to receive any remaining level payments for that year (unless the Annuitant
dies before the end of the Guaranteed Payment Period). For example, if you have
selected Income Plan 1 with no Guaranteed Payment Period and the Annuitant dies
during the year, the Beneficiary will not be entitled to receive the remaining
level payments for that year.

INCOME PROTECTION BENEFIT OPTION

We offer an Income Protection Benefit Option, which may be added to your
Contract on the Payout Start Date for an additional mortality and expense risk
charge if you have selected variable income payments subject to the following
conditions:

..  The Annuitant and joint Annuitant, if applicable, must be age 75 or younger
   on the Payout Start Date.

..  You must choose Income Plan 1 or 2 and the Guaranteed Payment Period must be
   for at least 120 months, unless the Internal Revenue Service requires a
   different payment period.

..  You may apply the Income Protection Benefit Option to more than one Income
   Plan.

..  The AIR must be 3% for the Income Plan(s) that you wish to apply this
   benefit to.

..  You may only add the Income Protection Benefit Option on the Payout Start
   Date and, once added, the option cannot be cancelled.

..  You may not add the Income Protection Benefit Option without our prior
   approval if your Contract Value is greater than $1,000,000 at the time you
   choose to add the Income Protection Benefit Option.

..  You may not convert variable income payments to fixed income payments.

If you select the Income Protection Benefit Option, we guarantee that your
variable income payments under each of the Income Plans to which the option is
applied will never be less that 85% of the initial variable amount income value
("Income Protection Benefit"), as calculated on the Payout Start Date under
such Income Plans, unless you have elected a reduced survivor payment plan
under Income Plan 2. If you have elected a reduced survivor payment plan, we
guarantee that your variable income payments to which the option is applied
will never be less than 85% of the initial variable amount income value prior
to the later of 1) the death of an Annuitant; or 2) the end of the guaranteed
payment period. On or after the later of these events, we guarantee that your
variable income payments will never be less than 85% of the initial variable
amount income value multiplied by the percentage you elected for your reduced
survivor plan. See Appendix C for numerical examples that illustrate how the
Income Protection Benefit is calculated.

If you add the Income Protection Benefit Option to your Contract, the mortality
and expense risk charge during the Payout Phase will be increased. Currently,
the charge for this option is 0.50%. We may change the amount we charge, but it
will not exceed 0.75%. Once the option is issued, we will not increase what we
charge you for the benefit.

INVESTMENT REQUIREMENTS.

If you add the Income Protection Benefit Option to your Contract, you must
adhere to certain requirements related to the investment alternatives in which
you may invest during the Payout Phase with respect to the assets supporting
the variable income payments to which the Income Protection Benefit Option
applies. These requirements may include, but are not limited to, maximum
investment limits on certain Variable Sub-accounts, exclusion of certain
Variable Sub-accounts, required minimum allocations to certain Variable
Sub-accounts, and restrictions on transfers to or from certain investment
alternatives. We may also require that you use the Automatic Portfolio
Rebalancing Program. We may change the specific requirements that are
applicable at any time in our sole discretion. Any changes we make will not
apply to the Income Protection Benefit Option if it was added to your Contract
prior to the implementation date of the change, except for changes made due to
a change in Variable Sub-accounts available under the Contract.

When you add the Income Protection Benefit Option to your Contract, you must
allocate to a model portfolio option the entire portion of your Contract Value
allocated to the Variable Sub-accounts.

                                      53
We currently offer one Model Portfolio Option; however, we may add more Model
Portfolio Options in the future. Transfers made for purposes of adhering to
your Model Portfolio Option will not count towards the number of free transfers
you may make each Contract Year.

THE FOLLOWING TABLE SUMMARIZES THE MODEL PORTFOLIO OPTION CURRENTLY AVAILABLE
FOR USE WITH THE INCOME PROTECTION BENEFIT OPTION:

* Model Portfolio Option 1

Each calendar quarter, we will use the Automatic Portfolio Rebalancing Program
to automatically rebalance your Contract Value in each Variable Sub-account and
return it to the percentage allocations for your Model Portfolio Option, using
the percentage allocations as of your most recent instructions.

MODEL PORTFOLIO OPTION 1

You must allocate a certain percentage of the portion of your Contract Value
allocated to the Variable Sub-accounts into each of three asset categories. You
may choose the Variable Sub-accounts in which you want to invest, provided you
maintain the percentage allocation requirements for each category. You may also
make transfers among the Variable Sub-accounts within each category at any
time, provided you maintain the percentage allocation requirements for each
category. However, each transfer you make will count against the 12 transfers
you can make each Contract Year without paying a transfer fee.

The following table describes the percentage allocation requirements for Model
Portfolio Options 1 and Variable Sub-accounts available under each category:

                           MODEL PORTFOLIO OPTION 1
                                20% Category A
                                50% Category B
                                30% Category C

CATEGORY A

Fidelity(R) VIP Money Market - Service Class 2 Sub-Account
PIMCO Money Market - Administrative Shares Sub-Account

                           MODEL PORTFOLIO OPTION 1

CATEGORY B

Fidelity(R) VIP Investment Grade Bond - Service Class 2 Sub-Account
Legg Mason Western Asset Variable Global High Yield Bond - Class II Sub-Account
<R>
MFS High Yield - Service Class Sub-Account
</R>
PIMCO Foreign Bond (U.S. Dollar-Hedged) - Administrative Shares Sub-Account
PIMCO Real Return - Administrative Shares Sub-Account
<R>
PIMCO Total Return - Administrative Shares Sub-Account/(3)/
</R>
UIF U.S. Real Estate, Class II Sub-Account
Invesco V.I. Government Securities, Series II Sub-Account

CATEGORY C

<R>
Invesco Van Kampen V.I. Value Opportunities - Series II Sub-Account
</R>
Invesco V.I. Core Equity - Series II Sub-Account
Invesco V.I. Mid Cap Core Equity - Series II Sub-Account
Fidelity(R) VIP Contrafund(R) - Service Class 2 Sub-Account
Fidelity(R) VIP Equity-Income - Service Class 2 Sub-Account
Fidelity(R) VIP Index 500 - Service Class 2 Sub-Account
Fidelity(R) VIP Overseas - Service Class 2 Sub-Account
Fidelity(R) VIP Asset Manager/(SM)/ - Service Class 2 Sub-Account
Janus Aspen Series Overseas - Service Shares Sub-Account
Janus Aspen Series Forty - Service Shares Sub-Account
<R>
Janus Aspen Series Perkins Mid Cap Value - Service Shares Sub-Account/(4)/
</R>
Janus Aspen Series Balanced - Service Shares Sub-Account
Legg Mason ClearBridge Variable Fundamental All Cap Value - Class II Sub-Account
Legg Mason ClearBridge Variable Large Cap Value - Class II Sub-Account
MFS Investors Trust - Service Class Sub-Account
<R>
MFS(R) MA Investors Growth Stock - Service Class Sub-Account/(2)/
  (FORMERLY, MFS INVESTORS GROWTH STOCK - SERVICE CLASS SUB-ACCOUNT)
</R>
MFS Total Return - Service Class Sub-Account
MFS Value - Service Class Sub-Account
Oppenheimer Small- & Mid-Cap Growth/VA - Service Shares Sub-Account/(1)/
Oppenheimer Main Street Small Cap(R)/VA - Service Shares Sub-Account
<R>
Guggenheim VIF Long Short Equity Sub-Account
</R>
T. Rowe Price Equity Income - II Sub-Account
T. Rowe Price Blue Chip Growth - II Sub-Account
Van Eck VIP Multi-Manager Alternatives Sub-Account
Invesco Van Kampen V.I. Growth and Income, Series II Sub-Account

    (1)Effective as of August 30, 2010, the following Variable Sub-Account
       closed to all Contract Owners except those Contract Owners who had
       contract value invested in the Variable Sub-Account as of the closure
       date:

       Oppenheimer Small- & Mid-Cap Growth/VA - Service Shares Sub-Account

       Contract Owners who had contract value invested in this Variable
       Sub-Account as of the closure date may continue to submit additional
       investments into the Variable Sub-Account thereafter, although they will
       not be permitted to invest in the Variable Sub-Account if they withdraw
       or otherwise transfer their entire contract value from the

                                      54
       Variable Sub-Account following the closure date. Contract Owners who did
       not have contract value invested in this Variable Sub-Account as of the
       specified closure date may not invest in the Variable Sub-Account.

<R>
    (2)On or about March 27, 2015, the MFS(R) MA Investors Growth Stock
       Portfolio
    -  Service Class, a portfolio of MFS(R) Variable Insurance Trust II,
       acquired the MFS(R) Investors Growth Stock Series - Service Class, a
       series of MFS(R) Variable Insurance Trust.
    (3)Effective May 1, 2015, the PIMCO Total Return - Administrative Shares
       sub-account is closed to all contract owners except those contract
       owners who have contract value invested in the variable sub-account as
       of the closure date. Contract owners who have contract value invested in
       the variable sub-account as of the closure date may continue to submit
       additional investments into the variable sub-account thereafter,
       although they will not be permitted to invest in the variable
       sub-account if they withdraw or otherwise transfer their entire contract
       value from the variable sub-account following the closure date. Contract
       owners who do not have contract value invested in the variable
       sub-account as of the closure date will not be permitted to invest in
       the variable sub-account thereafter
    (4)Effective April 13, 2015, the Janus Aspen Series Perkins Mid Cap Value -
       Service Shares sub-account was closed to all contract owners except
       those contract owners who have contract value invested in the variable
       sub-account as of the closure date. Contract owners who have contract
       value invested in the variable sub-account as of the closure date may
       continue to submit additional investments into the variable sub-account
       thereafter, although they will not be permitted to invest in the
       variable sub-account if they withdraw or otherwise transfer their entire
       contract value from the variable sub-account following the closure date.
       Contract owners who do not have contract value invested in the variable
       sub-account as of the closure date will not be permitted to invest in
       the variable sub-account thereafter.
</R>

FIXED INCOME PAYMENTS

We guarantee income payment amounts derived from any Fixed Account Option for
the duration of the Income Plan. The guaranteed income payment amounts will
change if the frequency of payments or the length of the payment period changes.

We calculate the fixed income payments by:

    .  adjusting the portion of the Contract Value in any Fixed Account Option
       on the Payout Start Date by any applicable Market Value Adjustment;

    .  deducting any applicable taxes; and

    .  applying the resulting amount to the greater of: (a) the appropriate
       income payment factor for the selected Income Plan from the Income
       Payment Table in your Contract; or (b) such other income payment factor
       as we are offering on the Payout Start Date.

We may defer your request to make a withdrawal from fixed income payments for a
period of up to 6 months or whatever shorter time state law may require. If we
defer payments for 30 days or more, we will pay interest as required by law
from the date we receive the withdrawal request to the date we make payment.

CERTAIN EMPLOYEE BENEFIT PLANS

<R>
The Contracts covered by this prospectus contain income payment tables that
provide for different payments to men and women of the same age, except in
states that require unisex tables. We reserve the right to use income payment
tables that do not distinguish on the basis of sex to the extent permitted by
applicable law. In certain employment-related situations, employers are
required by law to use the same income payment tables for men and women.
Accordingly, if the Contract is used in connection with an employment-related
retirement or benefit plan and we do not offer unisex annuity tables in your
state, you should consult with legal counsel as to whether the Contract is
appropriate.
</R>

                                      55
DEATH BENEFITS

DEATH PROCEEDS

<R>
Under certain conditions, described below, we will pay a death settlement
("DEATH PROCEEDS") for this Contract on the death of the Contract Owner,
Annuitant, or Co-Annuitant if the death occurs prior to the Payout Start Date.
The Death Proceeds will not exceed the Contract Value plus $1 million. If the
Owner or Annuitant dies after the Payout Start Date, we will pay remaining
income payments as described in the "Payout Phase" section of your Contract.
See "Income Payments" on page 50 for more information.
</R>

We will determine the value of the Death Proceeds as of the end of the
Valuation Date during which we receive the first Complete Request for
Settlement (the next Valuation Date, if we receive the request after 3:00 p.m.
Central Time). In order to be considered a "COMPLETE REQUEST FOR SETTLEMENT," a
claim for distribution of the Death Proceeds must include "DUE PROOF OF DEATH"
in any of the following forms of documentation:

..  A certified copy of the death certificate;

..  A certified copy of a decree of a court of competent jurisdiction as to the
   finding of death; or

..  Any other proof acceptable to us.

"DEATH PROCEEDS" are determined based on when we receive a Complete Request for
Settlement:

..  If we receive a Complete Request for Settlement within 180 days of the death
   of the Contract Owner, Annuitant, or Co-Annuitant, as applicable, the Death
   Proceeds are equal to the "DEATH BENEFIT."

..  If we receive a Complete Request for Settlement more than 180 days after the
   death of the Contract Owner, Annuitant, or Co-Annuitant, as applicable, the
   Death Proceeds are equal to the greater of the Contract Value or Settlement
   Value. We reserve the right to waive or extend, in a nondiscriminatory
   manner, the 180-day period in which the Death Proceeds will equal the Death
   Benefit.

Where there are multiple Beneficiaries, we will only value the Death Proceeds
at the time the first Beneficiary submits the necessary documentation in good
order. Any Death Proceeds amounts attributable to any Beneficiary which remain
in the Variable Sub-accounts are subject to investment risk.

DEATH BENEFIT OPTIONS

In addition to the ROP Death Benefit included in your Contract, we offer the
following death benefit options which may be added to your Contract:

..  MAV Death Benefit Option

..  Annual Increase Death Benefit Option

..  Enhanced Earnings Death Benefit Option

The amount of the Death Benefit depends on which death benefit option(s) you
select. Not all death benefit options are available in all states.

You may select any combination of death benefit options on the issue date of
your Contract or at a later date, subject to state availability and issue age
restrictions. You may not add any of the death benefit options to your Contract
after Contract issue without our prior approval if your Contract Value is
greater than $1,000,000 at the time you want to add an option.

The "DEATH BENEFIT" is equal to the Enhanced Earnings Death Benefit (if
selected) plus the greatest of:

..  The Contract Value;

..  The Settlement Value;

..  The ROP Death Benefit;

..  The MAV Death Benefit Option (if selected); or

..  The Annual Increase Death Benefit Option (if selected).

The "SETTLEMENT VALUE" is the amount that would be paid in the event of a full
withdrawal of the Contract Value.

The "ROP DEATH BENEFIT" is equal to the sum of all purchase payments (and
Credit Enhancements for CONSULTANT SOLUTIONS PLUS CONTRACTS), reduced by a
proportional withdrawal adjustment for each withdrawal. The withdrawal
adjustment is equal to the withdrawal amount divided by the Contract Value
immediately prior to the withdrawal, and the result is multiplied by:

   The sum of all purchase payments (and Credit Enhancements for CONSULTANT
   SOLUTIONS PLUS CONTRACTS) made prior to the withdrawal, less any prior
   withdrawal adjustments.

                                      56
MAXIMUM ANNIVERSARY VALUE DEATH BENEFIT OPTION.

The MAV Death Benefit Option is available only if the oldest Contract Owner and
Co-Annuitant, or, if the Contract is owned by a non-living person, the oldest
Annuitant, are age 79 or younger on the Rider Application Date. There is an
additional mortality and expense risk charge for this death benefit option,
currently equal to 0.20%. We may change what we charge for this death benefit
option, but it will never exceed 0.50%. Once added to your Contract, we
guarantee that we will not increase the mortality and expense risk charge you
pay for this death benefit option.

On the date we issue the rider for this benefit ("Rider Date"), the MAV DEATH
BENEFIT is equal to the Contract Value. After the Rider Date and prior to the
date we determine the Death Proceeds (see "Death Proceeds" on page 56), the MAV
Death Benefit is recalculated each time a purchase payment or withdrawal is
made as well as on each Contract Anniversary as follows:

..  Each time a purchase payment is made, the MAV Death Benefit is increased by
   the amount of the purchase payment (and Credit Enhancement for CONSULTANT
   SOLUTIONS PLUS CONTRACTS).

..  Each time a withdrawal is made, the MAV Death Benefit is reduced by a
   proportional withdrawal adjustment, defined as the withdrawal amount divided
   by the Contract Value immediately prior to the withdrawal, and the result
   multiplied by the most recently calculated MAV Death Benefit.

..  On each Contract Anniversary until the first Contract Anniversary following
   the 80th birthday of the oldest Contract Owner or Co-Annuitant, whichever
   occurs first, or, if the Contract is owned by a non-living person, the
   oldest Annuitant, the MAV Death Benefit is recalculated as the greater of
   the Contract Value on that date or the most recently calculated MAV Death
   Benefit.

<R>
If no purchase payments or withdrawals are made after the Rider Date, the MAV
Death Benefit will be equal to the greatest of the Contract Value on the Rider
Date and the Contract Values on each subsequent Contract Anniversary after the
Rider Date through the first Contract Anniversary following the 80th birthday
of the oldest Contract Owner or Co-Annuitant, whichever occurs first, or, if
the Contract is owned by a non-living person, the oldest Annuitant, but before
the date we determine the Death Proceeds. If, upon death of the Contract Owner,
the Contract is continued under Option D as described on page 60, and if the
New Contract Owner is age 80 or younger on the date we determine the Death
Proceeds, then the MAV Death Benefit Option will continue. The MAV Death
Benefit will continue to be recalculated for purchase payments (and Credit
Enhancements for CONSULTANT SOLUTIONS PLUS CONTRACTS), withdrawals, and on each
Contract Anniversary after the date we determine the Death Proceeds until the
earlier of:
</R>

..  The first Contract Anniversary following the 80th birthday of either the
   oldest Contract Owner or the Co-Annuitant, whichever is earlier, or, if the
   Contract is owned by a non-living person, the oldest Annuitant. (After the
   80th birthday of either the oldest Contract Owner or the Co-Annuitant,
   whichever is earlier, or, if the Contract is owned by a non-living person,
   the oldest Annuitant, the MAV Death Benefit will be recalculated only for
   purchase payments (and Credit Enhancements for CONSULTANT SOLUTIONS PLUS
   CONTRACTS) and withdrawals); or

..  The date we next determine the Death Proceeds.

ANNUAL INCREASE DEATH BENEFIT OPTION.

The Annual Increase Death Benefit Option is only available if the oldest
Contract Owner and Co-Annuitant, or, if the Contract is owned by a non-living
person, the oldest Annuitant, are age 79 or younger on the Rider Application
Date. There is an additional mortality and expense risk charge for this death
benefit option, currently equal to 0.30%. We may change what we charge for this
death benefit option, but it will never exceed 0.50%. Once added to your
Contract, we guarantee that we will not increase the mortality and expense risk
charge you pay for this death benefit option.

On the date we issue the rider for this benefit ("Rider Date"), the Annual
Increase Death Benefit is equal to the Contract Value. The Annual Increase
Death Benefit, plus purchase payments (and Credit Enhancements for CONSULTANT
SOLUTIONS PLUS CONTRACTS) made after the Rider Date and less withdrawal
adjustments for withdrawals made after the Rider Date, will accumulate interest
on a daily basis at a rate equivalent to 5% per year (may be 3% in certain
states), subject to the "Cap" defined below. This accumulation will continue
until the earlier of:

   (a) the first Contract Anniversary following the 80th birthday of the oldest
Contract Owner or Co-Annuitant, whichever occurs first, or, if the Contract is
owned by a non-living person, the oldest Annuitant; or

   (b) the date we determine the Death Proceeds.

After the 5% interest accumulation (may be 3% in certain states) ends, the
Annual Increase Death Benefit will continue to be increased by purchase
payments (and Credit Enhancements for CONSULTANT SOLUTIONS PLUS CONTRACTS) and
reduced by withdrawal adjustments for withdrawals until the death benefit
option terminates. The withdrawal adjustment is a proportional adjustment,
defined as the withdrawal amount divided by the Contract Value immediately
prior to the withdrawal, and the result multiplied by the amount of the Annual
Increase Death Benefit immediately prior to the withdrawal.

The Annual Increase Death Benefit Cap is equal to:

..  200% of the Contract Value as of the Rider Date; PLUS

                                      57
..  200% of purchase payments (and Credit Enhancements for CONSULTANT SOLUTIONS
   PLUS CONTRACTS) made after the Rider Date, but excluding any purchase
   payments (and Credit Enhancements for CONSULTANT SOLUTIONS PLUS CONTRACTS)
   made in the 12-month period immediately prior to the death of a Contract
   Owner or the Co-Annuitant, or, if the Contract is owned by a non-living
   person, an Annuitant; MINUS

..  Withdrawal adjustments for any withdrawals made after the Rider Date. Refer
   to Appendix E for withdrawal adjustment examples.

<R>
If, upon death of the Contract Owner, the Contract is continued under Option D
as described on page 60, and if the New Contract Owner is age 80 or younger on
the date we determine the Death Proceeds, then the Annual Increase Death
Benefit Option will continue. The amount of the Annual Increase Death Benefit
as of the date we determine the Death Proceeds, plus subsequent purchase
payments (and Credit Enhancements for CONSULTANT SOLUTIONS PLUS CONTRACTS),
less withdrawal adjustments for any subsequent withdrawals, will accumulate
daily at a rate equivalent to 5% per year (may be 3% in certain states) from
the date we determine the Death Proceeds, until the earlier of:
</R>

..  The first Contract Anniversary following the 80th birthday of either the
   oldest Contract Owner or the Co-Annuitant, whichever is earlier, or, if the
   Contract is owned by a non-living person, the oldest Annuitant. (After the
   80th birthday of either the oldest Contract Owner or the Co-Annuitant,
   whichever is earlier, or, if the Contract is owned by a non-living person,
   the oldest Annuitant, the Annual Increase Death Benefit will be recalculated
   only for purchase payments and withdrawals (and Credit Enhancements for
   CONSULTANT SOLUTIONS PLUS CONTRACTS)); or

..  The date we next determine the Death Proceeds.

ENHANCED EARNINGS DEATH BENEFIT OPTION.

The "ENHANCED EARNINGS DEATH BENEFIT OPTION" is only available if the oldest
Contract Owner and Co-Annuitant, or, if the Contract is owned by a non-living
person, the oldest Annuitant, are age 79 or younger on the Rider Application
Date. There is an additional mortality and expense risk charge for this death
benefit option, currently equal to:

..  0.25%, if the oldest Contract Owner and Co-Annuitant, or, if the Contract is
   owned by a non-living person, the oldest Annuitant, are age 70 or younger on
   the Rider Application Date; and

..  0.40%, if the oldest Contract Owner or, if older, the Co-Annuitant, or, if
   the Contract is owned by a non-living person, the oldest Annuitant, is age
   71 or older and age 79 or younger on the Rider Application Date.

We may change what we charge for this death benefit option, but it will never
exceed 0.35% for issue ages 0-70 and 0.50% for issue ages 71-79. Once added to
your Contract, we guarantee that we will not increase the mortality and expense
risk charge you pay for this death benefit option. However, if your spouse
elects to continue the Contract in the event of your death and if he or she
elects to continue the Enhanced Earnings Death Benefit Option, the mortality
and expense risk charge for the death benefit option will be based on the ages
of the oldest new Contract Owner and the Co-Annuitant, or, if the Contract is
owned by a non-living person, the oldest Annuitant, at the time the Contract is
continued.

If the oldest Contract Owner and Co-Annuitant, or, if the Contract is owned by
a non-living person, the oldest Annuitant, are age 70 or younger on the Rider
Application Date, the Enhanced Earnings Death Benefit is equal to the lesser of:

..  100% of "IN-FORCE PREMIUM" (excluding purchase payments (and Credit
   Enhancements for CONSULTANT SOLUTIONS PLUS CONTRACTS) made after the date we
   issue the rider for this benefit ("Rider Date") and during the twelve-month
   period immediately prior to the death of a Contract Owner or Co-Annuitant,
   or, if the Contract is owned by a non-living person, an Annuitant); or

..  40% of "IN-FORCE EARNINGS"

calculated as of the date we determine the Death Proceeds.

If the oldest Contract Owner or, if older, the Co-Annuitant, or, if the
Contract is owned by a non-living person, the oldest Annuitant, is age 71 or
older and age 79 or younger on the Rider Application Date, the Enhanced
Earnings Death Benefit is equal to the lesser of:

..  50% of "In-Force Premium" (excluding purchase payments (and Credit
   Enhancements for CONSULTANT SOLUTIONS PLUS CONTRACTS) made after the Rider
   Date and during the twelve-month period immediately prior to the death of a
   Contract Owner or Co-Annuitant, or, if the Contract is owned by a non-living
   person, an Annuitant); or

..  25% of "In-Force Earnings"

calculated as of the date we determine the Death Proceeds.

In-Force Earnings are equal to the current Contract Value less In-Force
Premium. If this quantity is negative, then In-Force Earnings are equal to zero.

In-Force Premium is equal to the Contract Value on the Rider Date, plus the sum
of all purchase payments, including any associated credit enhancements, made
after the Rider Date, less the sum of all "EXCESS-OF-EARNINGS WITHDRAWALS" made
after the Rider Date.

                                      58
An EXCESS-OF-EARNINGS WITHDRAWAL is equal to the excess, if any, of the amount
of the withdrawal over the amount of the In-Force Earnings immediately prior to
the withdrawal.

Refer to Appendix E for numerical examples that illustrate how the Enhanced
Earnings Death Benefit Option is calculated.

<R>
If, upon death of the Contract Owner, the Contract is continued under Option D
as described on page 60, and if the New Contract Owner is younger than age 80
on the date we determine the Death Proceeds, then this death benefit option
will continue unless the New Contract Owner elects to terminate the death
benefit option. If the death benefit option is continued, the following will
apply as of the date we determine the Death Proceeds upon continuation:
</R>

..  The Rider Date will be changed to the date we determine the Death Proceeds;

..  The In-Force Premium is equal to the Contract Value as of the new Rider Date
   plus all purchase payments, including any associated credit enhancements,
   made after the Rider Date, less the sum of all the Excess-of-Earnings
   Withdrawals made after the Rider Date;

..  The Enhanced Earnings Death Benefit after the new Rider Date will be
   determined as described above, but using the ages of the oldest Contract
   Owner and Co-Annuitant, or, if the Contract is owned by a non-living person,
   the oldest Annuitant, as of the new Rider Date.

..  The mortality and expense risk charge, for this rider, will be determined as
   described above, but using the ages of the oldest Contract Owner and
   Co-Annuitant, or, if the Contract is owned by a non-living person, the
   oldest Annuitant, as of the new Rider Date.

If the Contract Owner's, Co-Annuitant's or Annuitant's age is misstated, the
Enhanced Earnings Death Benefit and the mortality and expense risk charge for
this death benefit option will be calculated according to the corrected age as
of the Rider Date. Your Contract Value will be adjusted to reflect the
mortality and expense risk charge for this death benefit option that should
have been assessed based on the corrected age.

ALL OPTIONS.

WE RESERVE THE RIGHT TO IMPOSE LIMITATIONS ON THE INVESTMENT ALTERNATIVES IN
WHICH YOU MAY INVEST AS A CONDITION OF THESE OPTIONS. THESE RESTRICTIONS MAY
INCLUDE, BUT ARE NOT LIMITED TO, MAXIMUM INVESTMENT LIMITS ON CERTAIN
INVESTMENT ALTERNATIVES, EXCLUSION OF CERTAIN INVESTMENT ALTERNATIVES, REQUIRED
MINIMUM ALLOCATIONS TO CERTAIN INVESTMENT ALTERNATIVES, RESTRICTIONS ON
TRANSFERS TO AND FROM CERTAIN INVESTMENT ALTERNATIVES, AND/OR THE REQUIRED USE
OF AUTOMATIC PORTFOLIO REBALANCING. CURRENTLY, NO SUCH RESTRICTIONS ARE BEING
IMPOSED.

These death benefit options will terminate and the corresponding Rider Fee will
cease on the earliest of the following to occur:

..  the date the Contract is terminated;

<R>
..  if, upon the death of the Contract Owner, the Contract is continued under
   Option D as described in the Death of Owner section on page 60, and the New
   Owner is older than age 80 (age 80 or older for the Enhanced Earnings Death
   Benefit Option) on the date we determine the Death Proceeds. The death
   benefit option will terminate on the date we determine the Death Proceeds;
</R>

..  if the Contract is not continued in the Accumulation Phase under either the
   Death of Owner or Death of Annuitant provisions of the Contract. The death
   benefit option will terminate on the date we determine the Death Proceeds;

..  on the date the Contract Owner (if the current Contract Owner is a living
   person) is changed for any reason other than death unless the New Contract
   Owner is a trust and the Annuitant is a current Contract Owner;

..  on the date the Contract Owner (if the current Contract Owner is a
   non-living person) is changed for any reason unless the New Contract Owner
   is a non-living person or is a current Annuitant; or

..  the Payout Start Date.

Notwithstanding the preceding, in the event of the Contract Owner's death, if
the Contract Owner's spouse elects to continue the Contract (as permitted in
the Death of Owner provision below) he or she may terminate the Enhanced
Earnings Death Benefit at that time.

DEATH BENEFIT PAYMENTS

DEATH OF CONTRACT OWNER

If a Contract Owner dies prior to the Payout Start Date, then the surviving
Contract Owners will be the "New Contract Owners". If there are no surviving
Contract Owners, then subject to any restrictions previously placed upon them,
the Beneficiaries will be the New Contract Owners.

If there is more than one New Contract Owner taking a share of the Death
Proceeds, each New Contract Owner will be treated as a separate and independent
Contract Owner of his or her respective share of the Death Proceeds. Each New
Contract Owner will exercise all rights related to his or her share of the
Death Proceeds, including the sole right to elect one of the Option(s) below,
subject to any restrictions previously placed upon the New Contract Owner. Each
New Contract Owner may designate a Beneficiary(ies) for his or her respective
share, but that designated Beneficiary(ies) will be restricted to the Option
chosen by the original New Contract Owner.

                                      59
The Options available to each New Contract Owner will be determined by the
applicable following Category in which the New Contract Owner is defined. An
Option will be deemed to have been chosen on the day we receive written
notification in a form satisfactory to us.

NEW CONTRACT OWNER CATEGORIES

CATEGORY 1. If your spouse (or Annuitant's spouse in the case of a grantor
trust-owned Contract) is the sole New Contract Owner of the entire Contract,
your spouse must choose from among the death settlement Options A, B, C, D, or
E described below. If he or she does not choose one of these Options, then
Option D will apply.

CATEGORY 2. If the New Contract Owner is a living person who is not your spouse
(or Annuitant's spouse in the case of a grantor trust-owned Contract), or there
is more than one New Contract Owner, all of whom are living persons, each New
Contract Owner must choose from among the death settlement Options A, B, C, or
E described below. If a New Contract Owner does not choose one of these
Options, then Option C will apply for that New Contract Owner.

CATEGORY 3. If there are one or more New Contract Owner(s) and at least one of
the New Contract Owners is a non-living person such as a corporation or a
trust, all New Contract Owners are considered to be non-living persons for
purposes of the death settlement options. Each New Contract Owner must choose
death settlement Option A or C described below. If a New Contract Owner does
not choose one of these Options, then Option C will apply for that New Contract
Owner.

The death settlement options we currently offer are:

OPTION A. The New Contract Owner may elect to receive the Death Proceeds in a
lump sum.

OPTION B. The New Contract Owner may elect to apply the Death Proceeds to one
of the Income Plans described above. Such income payments must begin within one
year of the date of death and must be payable:

..  Over the life of the New Contract Owner; or

..  For a guaranteed payment period of at least 5 years (60 months), but not to
   exceed the life expectancy of the New Contract Owner; or

..  Over the life of the New Contract Owner with a guaranteed payment period of
   at least 5 years (60 months), but not to exceed the life expectancy of the
   New Contract Owner.

OPTION C. The New Contract Owner may elect to receive the Contract Value
payable within 5 years of the date of death. The Contract Value, as of the date
we receive the first Complete Request for Settlement, will be reset to equal
the Death Proceeds as of that date. Any excess amount of the Death Proceeds
over the Contract Value on that date will be allocated to the PIMCO Money
Market Variable Sub-account unless the New Contract Owner provides other
allocation instructions.

The New Contract Owner may not make any additional purchase payments under this
option. Withdrawal charges will be waived for any withdrawals made during the
5-year period after the date of death; however, amounts withdrawn may be
subject to Market Value Adjustments. The New Contract Owner may exercise all
rights set forth in the Transfers provision.

If the New Contract Owner dies before the Contract Value is completely
withdrawn, the New Contract Owner's Beneficiary(ies) will receive the greater
of the remaining Settlement Value or the remaining Contract Value within 5
years of the date of the original Contract Owner's death.

OPTION D. The New Contract Owner may elect to continue the Contract in the
Accumulation Phase. If the Contract Owner was also the Annuitant, then the New
Contract Owner will be the new Annuitant. This Option may only be exercised
once per Contract. The Contract Value, as of the date we receive the first
Complete Request for Settlement, will be reset to equal the Death Proceeds as
of that date.

Unless otherwise instructed by the continuing spouse, the excess, if any, of
the Death Proceeds over the Contract Value will be allocated to the
Sub-accounts of the Variable Account. This excess will be allocated in
proportion to your Contract Value in those Sub-accounts as of the end of the
Valuation Date that we receive the complete request for settlement except that
any portion of this excess attributable to the Fixed Account Options will be
allocated to the PIMCO Money Market Variable Sub-account.

Within 30 days after the date we determine the Death Proceeds, the New Contract
Owner may transfer all or a portion of the excess of the Death Proceeds, if
any, into any combination of Variable Sub-accounts, the Standard Fixed Account
and the Market Value Adjusted Fixed Account without incurring a transfer fee.
Any such transfer does not count as one of the free transfers allowed each
Contract Year and is subject to any minimum allocation amount specified in this
Contract.

The New Contract Owner may make a single withdrawal of any amount within one
year of the date of your death without incurring a Withdrawal Charge; however,
the amount withdrawn may be subject to a Market Value Adjustment and a 10% tax
penalty if the New Contract Owner is under age 59 1/2.

OPTION E. For Nonqualified Contracts, the New Contract Owner may elect to make
withdrawals at least annually of amounts equal to the "ANNUAL REQUIRED
DISTRIBUTION" calculated for each calendar year. The first such withdrawal must
occur within:

..  One year of the date of death;

..  The same calendar year as the date we receive the first Complete Request for
   Settlement; and

                                      60
..  One withdrawal frequency.

The New Contract Owner must select the withdrawal frequency (monthly,
quarterly, semi-annual, or annual). Once this option is elected and frequency
of withdrawals is chosen, they cannot be changed by the New Contract Owner and
become irrevocable.

In the calendar year in which the Death Proceeds are determined, the ANNUAL
REQUIRED DISTRIBUTION is equal to the Contract Value on the date of the first
distribution divided by the "Life Expectancy" of the New Contract Owner and the
result multiplied by a fraction that represents the portion of the calendar
year remaining after the date of the first distribution. (The Contract Value,
as of the date we receive the Complete Request for Settlement, will be reset to
equal the Death Proceeds as of that date. The Contract Value on the date of the
first distribution may be more or less than the Contract Value as of the date
we receive the Complete Request for Settlement.) The Life Expectancy in that
calendar year is equal to the life expectancy value from IRS Tables based on
the age of the New Contract Owner as of his or her birthday in the same
calendar year.

In any subsequent calendar year, the Annual Required Distribution is equal to
the Contract Value as of December 31 of the prior year divided by the remaining
Life Expectancy of the New Contract Owner. In each calendar year after the
calendar year in which the first distribution occurred, the Life Expectancy of
the New Contract Owner is the Life Expectancy calculated in the previous
calendar year minus one (1) year. If the Life Expectancy is less than one (1),
the Annual Required Distribution is equal to the Contract Value.

If the New Contract Owner dies before the Contract Value is completely
withdrawn, the scheduled withdrawals will continue to be paid to the New
Contract Owner's Beneficiary(ies). The Contract Value invested in the Variable
Sub-Accounts will be subject to investment risk until it is withdrawn.

We reserve the right to offer additional death settlement options.

DEATH OF ANNUITANT

If the Annuitant dies prior to the Payout Start Date, then the surviving
Contract Owners will have the Options available to the New Contract Owner,
determined by the applicable following category in which the New Contract Owner
is defined, unless:

..  The Annuitant was also the Contract Owner, in which case the Death of Owner
   provisions above apply; or

..  The Contract Owner is a grantor trust established by a living person, in
   which case the Beneficiary(ies) will be deemed the New Contract Owners and
   the Death of Contract Owner provisions above will apply.

SURVIVING CONTRACT OWNER CATEGORIES

CATEGORY 1. If the Owner is a living person, the Contract will continue in the
Accumulation Phase with a new Annuitant. The Contract Value will not be
increased by any excess of the Death Proceeds over the Contract Value as of the
date that we determine the value of the Death Proceeds.

The new Annuitant will be:

..  A person you name by written request, subject to the conditions described in
   the Annuitant section of this Contract; otherwise,

..  The youngest Owner; otherwise,

..  The youngest Beneficiary.

CATEGORY 2. If the Owner is a corporation, trust, or other non-living person,
the Owner must choose between the following two options:

OPTION A. The Owner may elect to receive the Death Proceeds in a lump sum.

OPTION B. The Owner may elect to receive the Contract Value payable within 5
years of the Annuitant's date of death. Under this Option, the excess, if any,
of the Death Proceeds over the Contract Value, as of the date that we determine
the value of the Death Proceeds, will be added to the Contract Value. Unless
otherwise instructed by the Owner, this excess will be allocated to the PIMCO
Money Market Variable Sub-account. During the 5 year period that follows the
Annuitant's date of death, the Owner may exercise all rights as set forth in
the Transfers section. Withdrawal Charges will be waived for any withdrawals
made during this 5 year period, however, the amount withdrawal may be subject
to a Market Value Adjustment.

No additional purchase payments may be added to the Contract under this
section. Withdrawal Charges will be waived for any withdrawals made during this
5 year period.

We reserve the right to offer additional death settlement options.

QUALIFIED CONTRACTS

The death settlement options for Qualified Plans, including IRAs, may be
different to conform with the individual tax requirements of each type of
Qualified Plan. Please refer to your Endorsement for IRA plans, if applicable,
for additional information on your death settlement options. In the case of
certain qualified plans, the terms of the plans may govern the right to
benefits, regardless of the terms of the Contract.

                                      61
SPOUSAL PROTECTION BENEFIT (CO-ANNUITANT) OPTION AND DEATH OF CO-ANNUITANT

We offer a Spousal Protection Benefit (Co-Annuitant) Option that may be added
to your Contract subject to the following conditions:

..  The individually owned Contract must be either a traditional, Roth, or
   Simplified Employee Pension IRA.

..  The Contract Owner's spouse must be the sole Primary Beneficiary of the
   Contract and will be the named Co-Annuitant.

..  The Contract Owner must be age 90 or younger on the Rider Application Date;
   and the Co-Annuitant must be age 79 or younger on the Rider Application Date.

..  The option may only be added when we issue the Contract or within 6 months
   of the Contract Owner's marriage. We may require proof of marriage in a form
   satisfactory to us. Currently, you may not add the option to your Contract
   without our prior approval if your Contract Value is greater than $1,000,000
   at the time you choose to add the Option.

Under the Spousal Protection Benefit Option, the Co-Annuitant will be
considered to be an Annuitant under the Contract during the Accumulation Phase
except that the Co-Annuitant will not be considered to be an Annuitant for
purposes of determining the Payout Start Date and the "Death of Annuitant"
provision of your Contract does not apply on the death of the Co-Annuitant.

You may change the Co-Annuitant to a new spouse only if you provide proof of
remarriage in a form satisfactory to us. Once we accept a change, the change
will take effect on the date you signed the request. Each change is subject to
any payment we make or other action we take before we accept it. At any time,
there may only be one Co-Annuitant under your Contract.

There is an annual Rider Fee of 0.10% of the Contract Value for Options added
on or after May 1, 2005. For Options added prior to this date, there is no
charge for this Option. We reserve the right to assess an annual Rider Fee not
to exceed 0.15% for Options added in the future. Once this Option is added to
your Contract, we guarantee that we will not increase what we charge you for
this Option. For Contracts purchased on or after May 1, 2005, we may
discontinue offering the Spousal Protection Benefit (Co-Annuitant) Option at
any time.

The option will terminate upon the date your written termination request is
accepted by us or will terminate on the earliest of the following occurrences:

    .  upon the death of the Co-Annuitant (as of the date we determine the
       Death Proceeds);

    .  upon the death of the Contract Owner (as of the date we determine the
       Death Proceeds);

    .  on the date the Contract is terminated;

    .  on the Payout Start Date; or

    .  on the date you change the beneficiary of the Contract and the change is
       accepted by us;

    .  for options added on or after May 1, 2005, the Contract Owner may
       terminate the option upon the divorce of the Contract Owner and the
       Co-Annuitant by providing written notice and proof of divorce in a form
       satisfactory to us;

    .  for options added prior to May 1, 2005, the Owner may terminate this
       option at anytime by written notice in a form satisfactory to us.

Once the Option is terminated, a new Spousal Protection Benefit (Co-Annuitant)
Option cannot be added to the Contract unless the last Option attached to the
Contract was terminated due to divorce or a change of beneficiary.

DEATH OF CO-ANNUITANT. If the Co-Annuitant dies prior to the Payout Start Date,
subject to the following conditions, the Contract will be continued according
to Option D under the "Death of Owner" provision of your Contract:

    .  The Co-Annuitant must have been your legal spouse on the date of his or
       her death; and

    .  Option D of the "Death of Owner" provision of your Contract has not
       previously been exercised.

The Contract may only be continued once under Option D under the "Death of
Owner" provision. For a description of Option D, see the "Death of Owner"
section of this prospectus.

                                      62
MORE INFORMATION

LINCOLN BENEFIT LIFE COMPANY

<R>
Lincoln Benefit is a stock life insurance company organized under the laws of
the state of Nebraska in 1938. Our legal domicile and principal business
address is 1221 N Street, Suite 200, Lincoln, NE 68508. Lincoln Benefit is a
wholly-owned subsidiary of Resolution Life, Inc., a Delaware corporation, which
is a wholly-owned, indirect subsidiary of Resolution Life L.P. (the "Limited
Partnership"), a Bermuda limited partnership and Resolution Life (Parallel)
Partnership, a Bermuda-based partnership.

We are authorized to conduct life insurance and annuity business in the
District of Columbia, Guam, U.S. Virgin Islands and all states except New York.
We will market the Contract everywhere we conduct variable annuity business.
The Contracts covered by this prospectus are issued by us and will be funded in
the Variable Account and/or the Fixed Account.
</R>

The Company has reinsurance agreements whereby certain premiums, contract
charges, interest credited to contractholder funds, benefits and expenses are
ceded to Allstate Life Insurance Company ("Allstate Life"), Lincoln Benefit
Reinsurance Company and other non-affiliated reinsurers.

<R>
Under our prior reinsurance agreement with Allstate Life, in effect through the
date of the Company's acquisition by Resolution Life, Inc., substantially all
contract related transactions were transferred through reinsurance agreements
to Allstate Life or other third party reinsurers, and substantially all of the
invested assets backing our liabilities reinsured with Allstate Life were owned
by Allstate Life. Accordingly, the results of operations for the historical
periods prior to April 1, 2014 with respect to applications received and
contracts issued by Lincoln Benefit are reflected net of the reinsurance in
Lincoln Benefit's statement of operations. The amounts reflected in our
statement of operations for the historical periods prior to April 1, 2014
relate only to the investment of those assets of Lincoln Benefit that were
owned by Lincoln Benefit and not assets of Allstate Life acquired with funds
received under the reinsurance agreement. These assets represented our general
account and were invested and managed by Allstate Life prior to the
acquisition. While the reinsurance agreement provided us with financial backing
from Allstate Life, it did not create a direct contractual relationship between
Allstate Life and you.

On April 1, 2014, all of the capital stock in Lincoln Benefit was acquired by
Resolution Life, Inc., pursuant to a Stock Purchase Agreement by and among
Allstate Life, Resolution Life Holdings, Inc. ("Resolution Holdings") and the
Limited Partnership. Immediately prior to that closing, Lincoln Benefit signed
a Partial Commutation Agreement with Allstate Life (the "Partial Commutation
Agreement''), whereby we commuted certain business previously reinsured to
Allstate Life as noted above, including (a) all of the fixed deferred annuity,
value adjusted deferred annuity and indexed deferred annuity business written
by the Company that was previously reinsured to Allstate Life, (b) all of the
life insurance business written by the Company through independent producers
that was previously reinsured to Allstate Life, other than certain specified
life business, and (c) all of the net liability of the Company with respect to
the accident and health and long-term care insurance business written by the
Company that was previously reinsured to Allstate Life. Effective April 1,
2014, the Company entered into a reinsurance agreement with a third party
whereby risks associated with certain universal life and annuity policies were
transferred, and in addition, also effective April 1, 2014, the Company entered
into a reinsurance agreement with Lancaster Re Captive Insurance Company, a
wholly-owned subsidiary of the Company, whereby risks associated with certain
term and universal life policies were transferred. The benefits and provisions
of the Contracts have not been changed by these transactions and agreements.
None of the transactions or agreements have changed the fact that we are
primarily liable to you for your Contract.
</R>

VARIABLE ACCOUNT

Lincoln Benefit Life Variable Annuity Account was originally established in
1992, as a segregated asset account of Lincoln Benefit. The Variable Account
meets the definition of a "separate account" under the federal securities laws
and is registered with the SEC as a unit investment trust under the Investment
Company Act of 1940. The SEC does not supervise the management of the Variable
Account or Lincoln Benefit.

<R>
We own the assets of the Variable Account, but we hold them separate from our
other assets. To the extent that these assets are attributable to the Contract
Value of the Contracts covered by this prospectus, these assets are not
chargeable with liabilities arising out of any other business we may conduct.
Income, gains, and losses, whether or not realized, from assets allocated to
the Variable Account are credited to or charged against the Variable Account
without regard to our other income, gains, or losses. Our obligations arising
under the Contracts are general corporate obligations of Lincoln Benefit.
</R>

The Variable Account is divided into Sub-accounts. The assets of each
Sub-account are invested in the shares of one of the Portfolios. We do not
guarantee the investment performance of the Variable Account, its Sub-accounts
or the Portfolios. Values allocated to the Variable Account and the amount of
Variable Annuity payments will rise and fall with the values of shares of the
Portfolios and are also reduced by Contract charges. We may also use the
Variable Account to fund our other annuity contracts. We will account
separately for each type of annuity contract funded by the Variable Account.

We have included additional information about the Variable Account in the
Statement of Additional Information. You may obtain a copy of the Statement of
Additional Information by writing to us or calling us at 1-800-457-7617. We
have reproduced the Table of Contents of the Statement of Additional
Information on page 76.

                                      63
THE PORTFOLIOS

<R>
DIVIDENDS AND CAPITAL GAIN DISTRIBUTIONS. We automatically reinvest all
dividends and capital gains distributions from the Portfolios in shares of the
distributing Portfolios at their net asset value.
</R>

                                      64
VOTING PRIVILEGES. As a general matter, you do not have a direct right to vote
the shares of the Portfolios held by the Variable Sub-Accounts to which you
have allocated your Contract Value. Under current law, however, you are
entitled to give us instructions on how to vote those shares on certain
matters. Based on our present view of the law, we will vote the shares of the
Portfolios that we hold directly or indirectly through the Variable Account in
accordance with instructions that we receive from Contract Owners entitled to
give such instructions.

As a general rule, before the Payout Start Date, the Contract Owner or anyone
with a voting interest is the person entitled to give voting instructions. The
number of shares that a person has a right to instruct will be determined by
dividing the Contract Value allocated to the applicable Variable Sub-Account by
the net asset value per share of the corresponding Portfolio as of the record
date of the meeting. After the Payout Start Date the person receiving income
payments has the voting interest. The payee's number of votes will be
determined by dividing the reserve for such Contract allocated to the
applicable Sub-Account by the net asset value per share of the corresponding
Portfolio. The votes decrease as income payments are made and as the reserves
for the Contract decrease.

We will vote shares attributable to Contracts for which we have not received
instructions, as well as shares attributable to us, in the same proportion as
we vote shares for which we have received instructions, unless we determine
that we may vote such shares in our own discretion. We will apply voting
instructions to abstain on any item to be voted upon on a pro-rata basis to
reduce the votes eligible to be cast.

We reserve the right to vote Portfolio shares as we see fit without regard to
voting instructions to the extent permitted by law. If we disregard voting
instructions, we will include a summary of that action and our reasons for that
action in the next semi-annual financial report we send to you.

CHANGES IN PORTFOLIOS. If the shares of any of the Portfolios are no longer
available for investment by the Variable Account or if, in our judgment,
further investment in such shares is no longer desirable in view of the
purposes of the Contract, we may eliminate that Portfolio and substitute shares
of another eligible investment fund. Any substitution of securities will comply
with the requirements of the Investment Company Act of 1940. We also may add
new Variable Sub-Accounts that invest in additional underlying funds. We will
notify you in advance of any change.

CONFLICTS OF INTEREST. Certain of the Portfolios sell their shares to separate
accounts underlying both variable life insurance and variable annuity
contracts. It is conceivable that in the future it may be unfavorable for
variable life insurance separate accounts and variable annuity separate
accounts to invest in the same Portfolio. The board of directors/trustees of
these Portfolios monitors for possible conflicts among separate accounts buying
shares of the Portfolios. Conflicts could develop for a variety of reasons. For
example, differences in treatment under tax and other laws or the failure by a
separate account to comply with such laws could cause a conflict. To eliminate
a conflict, the Portfolio's board of directors/trustees may require a separate
account to withdraw its participation in a Portfolio. A Portfolio's net asset
value could decrease if it had to sell investment securities to pay redemption
proceeds to a separate account withdrawing because of a conflict.

THE CONTRACTS

DISTRIBUTION. Allstate Distributors, LLC ("ADLLC"), located at 3100 Sanders
Road, Northbrook, IL 60062-7154 serves as distributor of the Contracts. ADLLC
is a wholly owned subsidiary of Allstate Life Insurance Company. ADLLC is
registered as a broker-dealer under the Securities Exchange Act of 1934, as
amended, and is a member of the Financial Industry Regulatory Authority
("FINRA").

ADLLC does not sell Contracts directly to purchasers. ADLLC enters into selling
agreements with affiliated and unaffiliated broker-dealers and banks to sell
the Contracts through their registered representatives. The broker-dealers are
registered with the SEC and are FINRA member firms. Their registered
representatives are licensed as insurance agents by applicable state insurance
authorities and appointed as agents of Lincoln Benefit in order to sell the
Contracts. Contracts also may be sold by representatives or employees of banks
that may be acting as broker-dealers without separate registration under the
Exchange Act, pursuant to legal and regulatory exceptions.

We will pay commissions to broker-dealers and banks which sell the Contracts.
Commissions paid vary, but we may pay up to a maximum sales commission of 7.5%
of total purchase payments. In addition, we may pay ongoing annual compensation
of up to 1.25% of Contract Value. Individual representatives receive a portion
of compensation paid to the broker-dealer or bank with which they are
associated in accordance with the broker-dealer's or bank's practices. We
estimate that commissions and annual compensation, when combined, will not
exceed 8.5% of total purchase payments. However, commissions and annual
compensation could exceed that amount because ongoing annual compensation is
related to Contract Value and the number of years the Contract is held.

From time to time, we pay asset-based compensation and/or marketing allowances
to banks and broker-dealers. These payments vary among individual banks and
broker dealers, and the asset-based payments may be up to 0.25% of Contract
Value annually. These payments are intended to contribute to the promotion and
marketing of the Contracts, and they vary among banks and broker-dealers. The
marketing and distribution support services include but are not limited to:
(1) placement of the Contracts on a list of preferred or recommended products
in the bank's or broker-dealer's distribution system; (2) sales promotions with
regard to the Contracts; (3) participation in sales conferences; and
(4) helping to defray the costs of sales conferences and educational seminars
for the bank or broker-dealer's registered representatives. A list of
broker-dealers and banks that ADLLC paid pursuant to such arrangements is

                                      65
provided in the Statement of Additional Information, which is available upon
request. For a free copy, please write or call us at the address or telephone
number listed on the front page of this prospectus, or go to the SEC's Web site
(http://www.sec.gov).

To the extent permitted by FINRA rules and other applicable laws and
regulations, we may pay or allow other promotional incentives or payments in
the form of cash or non-cash compensation. We may not offer the arrangements to
all broker-dealers and banks and the terms of the arrangement may differ among
broker-dealers and banks.

Individual registered representatives, broker-dealers, banks, and branch
managers within some broker-dealers and banks participating in one of these
compensation arrangements may receive greater compensation for selling the
contract than for selling a different contact that is not eligible for the
compensation arrangement. While we take the compensation into account when
establishing contract charges, any such compensation will be paid by us or
ADLLC and will not result in any additional charge to you. Your registered
representative can provide you with more information about the compensation
arrangements that apply to the sale of the contract.

Lincoln Benefit does not pay ADLLC a commission for distribution of the
Contracts. ADLLC compensates its representatives who act as wholesalers, and
their sales management personnel, for Contract sales. This compensation is
based on a percentage of premium payments and/or a percentage of Contract
values. The underwriting agreement with ADLLC provides that we will reimburse
ADLLC for expenses incurred in distributing the Contracts, including any
liability to Contract Owners arising out of services rendered or Contracts
issued.

Lincoln Benefit and ADLLC have also entered into wholesaling agreements with
certain independent contractors and their broker-dealers. Under these
agreements, compensation based on a percentage of premium payments and/or
Contract values is paid to the wholesaling broker-dealer for the wholesaling
activities of their registered representative.

<R>
ADMINISTRATION. We have primary responsibility for all administration of the
Contracts and the Variable Account. We entered into an administrative services
agreement with Allstate Life Insurance Company ("ALIC"). ALIC has entered into
an administrative services agreement with The Prudential Insurance Company of
America ("PICA"), pursuant to which PICA or an affiliate provides
administrative services to the Variable Account and the Contracts on our
behalf. In addition, PICA entered into a master services agreement with se/2/,
LLC, of 5801 SW 6th Avenue, Topeka, Kansas 66636, whereby se/2/, LLC provides
certain business process outsourcing services with respect to the Contracts.
se/2/, LLC may engage other service providers to provide certain administrative
functions. These service providers may change over time, and as of December 31,
2014, consisted of the following: NTT DATA Process Services, LLC
(administrative services) located at PO Box 4201, Boston, MA 02211;
RR Donnelley Global Investment Markets (compliance printing and mailing)
located at 111 South Wacker Drive, Chicago, IL 60606; Jayhawk File Express, LLC
(file storage and document destruction) located at 601 E. 5th Street, Topeka,
KS 66601-2596; Co-Sentry.net, LLC (back-up printing and disaster recovery)
located at 9394 West Dodge Rd, Suite 100, Omaha, NE 68114; Convey Compliance
Systems, Inc. (withholding calculations and tax statement mailing) located at
3650 Annapolis Lane, Suite 190, Plymouth, MN 55447; Spangler Graphics, LLC
(compliance mailings) located at 29305 44th Street, Kansas City, KS 66106;
Veritas Document Solutions, LLC (compliance mailings) located at 913 Commerce
Ct, Buffalo Grove, IL 60089; Records Center of Topeka, a division of
Underground Vaults & Storage, Inc. (back-up tapes storage) located at 1540 NW
Gage Blvd. #6, Topeka, KS 66618; Venio LLC, d/b/a Keane (lost shareholder
search) located at PO Box 1508, Southeastern, PA 19399-1508; DST Systems, Inc.
(FAN mail, positions, prices) located at 333 West 11 Street, 5th Floor, Kansas
City, MO 64105.
</R>

In administering the Contracts, the following services are provided, among
others:

..  maintenance of Contract Owner records;

..  Contract Owner services;

..  calculation of unit values;

..  maintenance of the Variable Account; and

..  preparation of Contract Owner reports.

We will send you Contract statements at least annually. We will also send you
transaction confirmations. You should notify us promptly in writing of any
address change. You should read your statements and confirmations carefully and
verify their accuracy. You should contact us promptly if you have a question
about a periodic statement or a confirmation. We will investigate all
complaints and make any necessary adjustments retroactively, but you must
notify us of a potential error within a reasonable time after the date of the
questioned statement. If you wait too long, we will make the adjustment as of
the date that we receive notice of the potential error.

We will also provide you with additional periodic and other reports,
information and prospectuses as may be required by federal securities laws.

<R>
We provide information about cyber security risks associated with this Contract
in the Statement of Additional Information.

In connection with Resolution Life's acquisition of Lincoln Benefit, Resolution
Life, Inc. and Allstate Life entered into a Transition Services Agreement (the
"TSA"), pursuant to which Allstate Life will continue to provide certain
administrative services for the Recaptured Business for a period of twelve to
twenty-four months after the closing. Following termination of the TSA, we plan
to outsource the administration of the Recaptured Business to third-party
administrators. In particular, the administration of our deferred annuity
business was outsourced to se/2/, LLC, an unaffiliated third-party service
provider, effective February 23, 2015. The remaining administration will be
outsourced to Alliance-One Services, Inc., an unaffiliated third-party service
provider, later this year.
</R>

                                      66
ANNUITIES HELD WITHIN A QUALIFIED PLAN

If you use the Contract within an employer sponsored qualified retirement plan,
the plan may impose different or additional conditions or limitations on
withdrawals, waivers of withdrawal charges, death benefits, Payout Start Dates,
income payments, and other Contract features. In addition, adverse tax
consequences may result if Qualified Plan limits on distributions and other
conditions are not met. Please consult your Qualified Plan administrator for
more information. Lincoln Benefit no longer issues deferred annuities to
employer sponsored qualified retirement plans.

LEGAL PROCEEDINGS

There are no pending legal proceedings affecting the Variable Account. Lincoln
Benefit is engaged in routine lawsuits which, in our management's judgment, are
not of material importance to the respective total assets or material with
respect to the Variable Account.

LEGAL MATTERS

<R>
Certain matters of Nebraska law pertaining to the Contract, including the
validity of the Contract and Lincoln Benefit's right to issue the Contract
under Nebraska law, have been passed upon by Lamson Dugan & Murray LLP, Omaha,
Nebraska.
</R>

TAXES

THE FOLLOWING DISCUSSION IS GENERAL AND IS NOT INTENDED AS TAX ADVICE. LINCOLN
BENEFIT MAKES NO GUARANTEE REGARDING THE TAX TREATMENT OF ANY CONTRACT OR
TRANSACTION INVOLVING A CONTRACT.

Federal, state, local and other tax consequences of ownership or receipt of
distributions under an annuity contract depend on your individual
circumstances. If you are concerned about any tax consequences with regard to
your individual circumstances, you should consult a competent tax adviser.

TAXATION OF LINCOLN BENEFIT LIFE COMPANY

Lincoln Benefit is taxed as a life insurance company under Part I of Subchapter
L of the Code. Since the Variable Account is not an entity separate from
Lincoln Benefit, and its operations form a part of Lincoln Benefit, it will not
be taxed separately. Investment income and realized capital gains of the
Variable Account are automatically applied to increase reserves under the
Contract. Under existing federal income tax law, Lincoln Benefit believes that
the Variable Account investment income and capital gains will not be taxed to
the extent that such income and gains are applied to increase the reserves
under the Contract. Accordingly, Lincoln Benefit does not anticipate that it
will incur any federal income tax liability attributable to the Variable
Account, and therefore Lincoln Benefit does not intend to make provisions for
any such taxes. If Lincoln Benefit is taxed on investment income or capital
gains of the Variable Account, then Lincoln Benefit may impose a charge against
the Variable Account in order to make provision for such taxes.

TAXATION OF VARIABLE ANNUITIES IN GENERAL

TAX DEFERRAL. Generally, you are not taxed on increases in the Contract Value
until a distribution occurs. This rule applies only where:

    .  the Contract Owner is a natural person,

    .  the investments of the Variable Account are "adequately diversified"
       according to Treasury Department regulations, and

    .  Lincoln Benefit is considered the owner of the Variable Account assets
       for federal income tax purposes.

NON-NATURAL OWNERS. Non-natural owners are also referred to as Non Living
Owners in this prospectus. As a general rule, annuity contracts owned by
non-natural persons such as corporations, trusts, or other entities are not
treated as annuity contracts for federal income tax purposes. The income on
such contracts does not enjoy tax deferral and is taxed as ordinary income
received or accrued by the non-natural owner during the taxable year.

EXCEPTIONS TO THE NON-NATURAL OWNER RULE. There are several exceptions to the
general rule that annuity contracts held by a non-natural owner are not treated
as annuity contracts for federal income tax purposes. Contracts will generally
be treated as held by a natural person if the nominal owner is a trust or other
entity which holds the contract as agent for a natural person. However, this
special exception will not apply in the case of an employer who is the nominal
owner of an annuity contract under a non-Qualified deferred compensation
arrangement for its employees. Other exceptions to the non-natural owner rule
are: (1) contracts acquired by an estate of a decedent by reason of the death
of the decedent; (2) certain qualified contracts; (3) contracts purchased by
employers upon the termination of certain Qualified Plans; (4) certain
contracts used in connection with structured settlement agreements; and
(5) immediate annuity contracts, purchased with a single premium, when the
annuity starting date is no later than a year from purchase of the annuity and
substantially equal periodic payments are made, not less frequently than
annually, during the annuity period.

                                      67
GRANTOR TRUST OWNED ANNUITY. Contracts owned by a grantor trust are considered
owned by a non-natural owner. Grantor trust owned contracts receive tax
deferral as described in the Exceptions to the Non-Natural Owner Rule section.
In accordance with the Code, upon the death of the annuitant, the death benefit
must be paid. According to your Contract, the Death Benefit is paid to the
beneficiary. A trust named beneficiary, including a grantor trust, has two
options for receiving any death benefits: 1) a lump sum payment, or 2) payment
deferred up to five years from date of death.

DIVERSIFICATION REQUIREMENTS. For a Contract to be treated as an annuity for
federal income tax purposes, the investments in the Variable Account must be
"adequately diversified" consistent with standards under Treasury Department
regulations. If the investments in the Variable Account are not adequately
diversified, the Contract will not be treated as an annuity contract for
federal income tax purposes. As a result, the income on the Contract will be
taxed as ordinary income received or accrued by the Contract owner during the
taxable year. Although Lincoln Benefit does not have control over the
Portfolios or their investments, we expect the Portfolios to meet the
diversification requirements.

OWNERSHIP TREATMENT. The IRS has stated that a contract owner will be
considered the owner of separate account assets if he possesses incidents of
ownership in those assets, such as the ability to exercise investment control
over the assets. At the time the diversification regulations were issued, the
Treasury Department announced that the regulations do not provide guidance
concerning circumstances in which investor control of the separate account
investments may cause a Contract owner to be treated as the owner of the
separate account. The Treasury Department also stated that future guidance
would be issued regarding the extent that owners could direct sub-account
investments without being treated as owners of the underlying assets of the
separate account.

Your rights under the Contract are different than those described by the IRS in
private and published rulings in which it found that Contract owners were not
owners of separate account assets. For example, if your contract offers more
than twenty (20) investment alternatives you have the choice to allocate
premiums and contract values among a broader selection of investment
alternatives than described in such rulings. You may be able to transfer among
investment alternatives more frequently than in such rulings. These differences
could result in you being treated as the owner of the Variable Account. If this
occurs, income and gain from the Variable Account assets would be includible in
your gross income. Lincoln Benefit does not know what standards will be set
forth in any regulations or rulings which the Treasury Department may issue. It
is possible that future standards announced by the Treasury Department could
adversely affect the tax treatment of your Contract. We reserve the right to
modify the Contract as necessary to attempt to prevent you from being
considered the federal tax owner of the assets of the Variable Account.
However, we make no guarantee that such modification to the Contract will be
successful.

TAXATION OF PARTIAL AND FULL WITHDRAWALS. If you make a partial withdrawal
under a Non-Qualified Contract, amounts received are taxable to the extent the
Contract Value, without regard to surrender charges, exceeds the investment in
the Contract. The investment in the Contract is the gross premium paid for the
contract minus any amounts previously received from the Contract if such
amounts were properly excluded from your gross income. If you make a full
withdrawal under a Non-Qualified Contract, the amount received will be taxable
only to the extent it exceeds the investment in the Contract.

TAXATION OF ANNUITY PAYMENTS. Generally, the rule for income taxation of
annuity payments received from a Non-Qualified Contract provides for the return
of your investment in the Contract in equal tax-free amounts over the payment
period. The balance of each payment received is taxable. For fixed annuity
payments, the amount excluded from income is determined by multiplying the
payment by the ratio of the investment in the Contract (adjusted for any refund
feature or period certain) to the total expected value of annuity payments for
the term of the Contract. If you elect variable annuity payments, the amount
excluded from taxable income is determined by dividing the investment in the
Contract by the total number of expected payments. The annuity payments will be
fully taxable after the total amount of the investment in the Contract is
excluded using these ratios. If any variable payment is less than the
excludable amount you should contact a competent tax advisor to determine how
to report any unrecovered investment. The federal tax treatment of annuity
payments is unclear in some respects. As a result, if the IRS should provide
further guidance, it is possible that the amount we calculate and report to the
IRS as taxable could be different. If you die, and annuity payments cease
before the total amount of the investment in the Contract is recovered, the
unrecovered amount will be allowed as a deduction for your last taxable year.

PARTIAL ANNUITIZATION

Effective January 1, 2011, an individual may partially annuitize their
non-qualified annuity if the contract so permits. The Small Business Jobs Act
of 2010 included a provision which allows for a portion of a non-qualified
annuity, endowment or life insurance contract to be annuitized while the
balance is not annuitized. The annuitized portion must be paid out over 10 or
more years or over the lives of one or more individuals. The annuitized portion
of the contract is treated as a separate contract for purposes of determining
taxability of the payments under IRC section 72. We do not currently permit
partial annuitization.

TAXATION OF LEVEL MONTHLY VARIABLE ANNUITY PAYMENTS. You may have an option to
elect a variable income payment stream consisting of level monthly payments
that are recalculated annually. Although we will report your levelized payments
to the IRS in the year distributed, it is possible the IRS could determine that
receipt of the first monthly payout of each annual amount is constructive
receipt of the entire annual amount. If the IRS were to take this position, the
taxable amount of your levelized payments would be accelerated to the time of
the first monthly payout and reported in the tax year in which the first
monthly payout is received.

                                      68
WITHDRAWALS AFTER THE PAYOUT START DATE. Federal tax law is unclear regarding
the taxation of any additional withdrawal received after the Payout Start Date.
It is possible that a greater or lesser portion of such a payment could be
taxable than the amount we determine.

DISTRIBUTION AT DEATH RULES. In order to be considered an annuity contract for
federal income tax purposes, the Contract must provide:

..  if any Contract Owner dies on or after the Payout Start Date but before the
   entire interest in the Contract has been distributed, the remaining portion
   of such interest must be distributed at least as rapidly as under the method
   of distribution being used as of the date of the Contract Owner's death;

..  if any Contract Owner dies prior to the Payout Start Date, the entire
   interest in the Contract will be distributed within 5 years after the date
   of the Contract Owner's death. These requirements are satisfied if any
   portion of the Contract Owner's interest that is payable to (or for the
   benefit of) a designated Beneficiary is distributed over the life of such
   Beneficiary (or over a period not extending beyond the life expectancy of
   the Beneficiary) and the distributions begin within 1 year of the Contract
   Owner's death. If the Contract Owner's designated Beneficiary is the
   surviving spouse of the Contract Owner, the Contract may be continued with
   the surviving spouse as the new Contract Owner;

..  if the Contract Owner is a non-natural person, then the Annuitant will be
   treated as the Contract Owner for purposes of applying the distribution at
   death rules. In addition, a change in the Annuitant on a Contract owned by a
   non-natural person will be treated as the death of the Contract Owner.

Prior to a recent Supreme Court decision, and consistent with Section 3 of the
federal Defense of Marriage Act ("DOMA"), same sex marriages under state law
were not recognized as same sex marriages for purposes of federal law. However,
in UNITED STATES V. WINDSOR, the U.S. Supreme Court struck down Section 3 of
DOMA as unconstitutional, thereby recognizing for federal law purposes a valid
same sex marriage. The WINDSOR decision means that the favorable tax benefits
afforded by the federal tax law to an opposite sex spouse under the Internal
Revenue Code (IRC) are now available to a same sex spouse.

On August 29, 2013, the Internal Revenue Service ("IRS") issued guidance on its
position regarding same sex marriages for federal tax purposes. If a couple is
married in a jurisdiction (including a foreign country) that recognizes same
sex marriages, that marriage will be recognized for all federal tax purposes
regardless of the law in the jurisdiction where they reside. However, the IRS
did not recognize civil unions and registered domestic partnerships as
marriages for federal tax purposes. Currently, if a state does not recognize a
civil union or a registered domestic partnership as a marriage, it is not a
marriage for federal tax purposes.

<R>
Currently, a case is pending with the U.S. Supreme Court that may address
several unanswered questions regarding the application of federal and state tax
law to same sex marriages, civil unions and domestic partnerships. Absent
further guidance from a state to the contrary, we will tax report and withhold
at the state level consistent with the characterization of a given transaction
under federal tax law (for example, a tax free rollover).
</R>

Please consult with your tax or legal advisor before electing the Spousal
Benefit for a same sex spouse or civil union partner.

TAXATION OF ANNUITY DEATH BENEFITS. Death Benefit amounts are included in
income as follows:

..  if distributed in a lump sum, the amounts are taxed in the same manner as a
   total withdrawal, or

..  if distributed under an Income Plan, the amounts are taxed in the same
   manner as annuity payments.

<R>
MEDICARE TAX ON NET INVESTMENT INCOME. The Patient Protection and Affordable
Care Act, enacted in 2010, included a Medicare tax on investment income. This
tax assesses a 3.8% surtax on the lesser of (1) net investment income or
(2) the excess of "modified adjusted gross income" over a threshold amount. The
"threshold amount" is $250,000 for married taxpayers filing jointly, $125,000
for married taxpayers filing separately, $200,000 for single taxpayers, and
approximately $12,300 for trusts. The taxable portion of payments received as a
withdrawal, surrender, annuity payment, death benefit payment or any other
actual or deemed distribution under the contract will be considered investment
income for purposes of this surtax.
</R>

PENALTY TAX ON PREMATURE DISTRIBUTIONS. A 10% penalty tax applies to the
taxable amount of any premature distribution from a non-Qualified Contract. The
penalty tax generally applies to any distribution made prior to the date you
attain age 59 1/2. However, no penalty tax is incurred on distributions:

..  made on or after the date the Contract Owner attains age 59 1/2,

..  made as a result of the Contract Owner's death or becoming totally disabled,

..  made in substantially equal periodic payments (as defined by the Code) over
   the Contract Owner's life or life expectancy, or over the joint lives or
   joint life expectancies of the Contract Owner and the Beneficiary,

..  made under an immediate annuity, or

..  attributable to investment in the Contract before August 14, 1982.

You should consult a competent tax advisor to determine how these exceptions
may apply to your situation.

                                      69
SUBSTANTIALLY EQUAL PERIODIC PAYMENTS. With respect to non-Qualified Contracts
using substantially equal periodic payments or immediate annuity payments as an
exception to the penalty tax on premature distributions, any additional
withdrawal or other material modification of the payment stream would violate
the requirement that payments must be substantially equal. Failure to meet this
requirement would mean that the income portion of each payment received prior
to the later of 5 years or the Contract Owner's attaining age 59 1/2 would be
subject to a 10% penalty tax unless another exception to the penalty tax
applied. The tax for the year of the modification is increased by the penalty
tax that would have been imposed without the exception, plus interest for the
years in which the exception was used. A material modification does not include
permitted changes described in published IRS rulings. You should consult a
competent tax advisor prior to creating or modifying a substantially equal
periodic payment stream.

<R>
TAX FREE EXCHANGES UNDER INTERNAL REVENUE CODE SECTION 1035. A 1035 exchange is
a tax-free exchange of a non-Qualified life insurance contract, endowment
contract or annuity contract into a non-Qualified annuity contract. The
contract owner(s) must be the same on the old and new contract. Basis from the
old contract carries over to the new contract so long as we receive that
information from the relinquishing company. If basis information is never
received, we will assume that all exchanged funds represent earnings and will
allocate no cost basis to them. After you elect an Income Plan, as described in
the Income Payments section earlier in the prospectus, you are not eligible for
a tax-free exchange under Section 1035.
</R>

PARTIAL EXCHANGES. The IRS has issued rulings that permit partial exchanges of
annuity contracts. Effective for exchanges on or after October 24, 2011, where
there is a surrender or distribution from either the initial annuity contract
or receiving annuity contract within 180 days of the date on which the partial
exchange was completed, the IRS will apply general tax rules to determine the
substance and treatment of the original transfer.

If a partial exchange is retroactively negated, the amount originally
transferred to the recipient contract is treated as a withdrawal from the
source contract, taxable to the extent of any gain in that contract on the date
of the exchange. An additional 10% tax penalty may also apply if the Contract
Owner is under age 59 1/2. Your Contract may not permit partial exchanges.

TAXATION OF OWNERSHIP CHANGES. If you transfer a non-Qualified Contract without
full and adequate consideration to a person other than your spouse (or to a
former spouse incident to a divorce), you will be taxed on the difference
between the Contract Value and the investment in the Contract at the time of
transfer. Any assignment or pledge (or agreement to assign or pledge) of the
Contract Value is taxed as a withdrawal of such amount or portion and may also
incur the 10% penalty tax.

AGGREGATION OF ANNUITY CONTRACTS. The Code requires that all non-Qualified
deferred annuity contracts issued by Lincoln Benefit (or its affiliates) to the
same Contract Owner during any calendar year be aggregated and treated as one
annuity contract for purposes of determining the taxable amount of a
distribution.

INCOME TAX WITHHOLDING

Generally, Lincoln Benefit is required to withhold federal income tax at a rate
of 10% from all non-annuitized distributions. The customer may elect out of
withholding by completing and signing a withholding election form. If no
election is made or no U.S. taxpayer identification number is provided we will
automatically withhold the required 10% of the taxable amount. In certain
states, if there is federal withholding, then state withholding is also
mandatory.

Lincoln Benefit is required to withhold federal income tax using the wage
withholding rates for all annuitized distributions. The customer may elect out
of withholding by completing and signing a withholding election form. If no
election is made, we will automatically withhold using married with three
exemptions as the default. If no U.S. taxpayer identification number is
provided, we will automatically withhold using single with zero exemptions as
the default. In certain states, if there is federal withholding, then state
withholding is also mandatory.

Election out of withholding is valid only if the customer provides a U.S.
residence address and taxpayer identification number.

Generally, Code Section 1441 provides that Lincoln Benefit as a withholding
agent must withhold 30% of the taxable amounts paid to a non-resident alien. A
non-resident alien is someone other than a U.S. citizen or resident alien. We
require an original IRS Form W-8BEN at issue to certify the owners' foreign
status. Withholding may be reduced or eliminated if covered by an income tax
treaty between the U.S. and the non-resident alien's country of residence if
the payee provides a U.S. taxpayer identification number on a fully completed
Form W-8BEN. A U.S. taxpayer identification number is a social security number
or an individual taxpayer identification number ("ITIN"). ITINs are issued by
the IRS to non-resident alien individuals who are not eligible to obtain a
social security number. The U.S. does not have a tax treaty with all countries
nor do all tax treaties provide an exclusion or lower withholding rate for
annuities.

TAX QUALIFIED CONTRACTS
The income on tax sheltered annuity (TSA) and IRA investments is tax deferred,
and the income from annuities held by such plans does not receive any
additional tax deferral. You should review the annuity features, including all
benefits and expenses, prior to purchasing an annuity as a TSA or IRA. Tax
Qualified Contracts are contracts purchased as or in connection with:

..  Individual Retirement Annuities (IRAs) under Code Section 408(b);

..  Roth IRAs under Code Section 408A;

..  Simplified Employee Pension (SEP IRA) under Code Section 408(k);

..  Savings Incentive Match Plans for Employees (SIMPLE IRA) under Code
   Section 408(p);

                                      70
..  Tax Sheltered Annuities under Code Section 403(b);

..  Corporate and Self Employed Pension and Profit Sharing Plans under Code
   Section 401; and

..  State and Local Government and Tax-Exempt Organization Deferred Compensation
   Plans under Code Section 457.

Lincoln Benefit reserves the right to limit the availability of the Contract
for use with any of the retirement plans listed above or to modify the Contract
to conform with tax requirements. If you use the Contract within an employer
sponsored qualified retirement plan, the plan may impose different or
additional conditions or limitations on withdrawals, waiver of charges, death
benefits, Payout Start Dates, income payments, and other Contract features. In
addition, adverse tax consequences may result if Qualified Plan limits on
distributions and other conditions are not met. Please consult your Qualified
Plan administrator for more information. Lincoln Benefit no longer issues
deferred annuities to employer sponsored qualified retirement plans.

<R>
The tax rules applicable to participants with tax qualified annuities vary
according to the type of contract and the terms and conditions of the
endorsement. Adverse tax consequences may result from certain transactions such
as excess contributions, premature distributions, and, distributions that do
not conform to specified commencement and minimum distribution rules. Lincoln
Benefit can issue an individual retirement annuity on a rollover or transfer of
proceeds from a decedent's IRA, TSA, or employer sponsored retirement plan
under which the decedent's surviving spouse is the beneficiary. Lincoln Benefit
does not offer an individual retirement annuity that can accept a transfer of
funds for any other, non-spousal, beneficiary of a decedent's IRA, TSA, or
employer sponsored qualified retirement plan. Note that in 2014, the U.S.
Supreme Court ruled that Inherited IRAs, other than IRAs inherited by the
owner's spouse, do not qualify as retirement assets for purposes of protection
under the federal bankruptcy laws.
</R>

Please refer to your Endorsement for IRAs or 403(b) plans, if applicable, for
additional information on your death settlement options. In the case of certain
Qualified Plans, the terms of the Qualified Plan Endorsement and the plans may
govern the right to benefits, regardless of the terms of the Contract.

TAXATION OF WITHDRAWALS FROM AN INDIVIDUALLY OWNED TAX QUALIFIED CONTRACT. If
you make a partial withdrawal under a Tax Qualified Contract other than a Roth
IRA, the portion of the payment that bears the same ratio to the total payment
that the investment in the Contract (i.e., nondeductible IRA contributions)
bears to the Contract Value, is excluded from your income. We do not keep track
of nondeductible contributions, and generally all tax reporting of
distributions from Tax Qualified Contracts other than Roth IRAs will indicate
that the distribution is fully taxable.

"Qualified distributions" from Roth IRAs are not included in gross income.
"Qualified distributions" are any distributions made more than five taxable
years after the taxable year of the first contribution to any Roth IRA and
which are:

..  made on or after the date the Contract Owner attains age 59 1/2,

..  made to a beneficiary after the Contract Owner's death,

..  attributable to the Contract Owner being disabled, or

..  made for a first time home purchase (first time home purchases are subject
   to a lifetime limit of $10,000).

"Nonqualified distributions" from Roth IRAs are treated as made from
contributions first and are included in gross income only to the extent that
distributions exceed contributions.

REQUIRED MINIMUM DISTRIBUTIONS. Generally, Tax Qualified Contracts (excluding
Roth IRAs) require minimum distributions upon reaching age 70 1/2. Failure to
withdraw the required minimum distribution will result in a 50% tax penalty on
the shortfall not withdrawn from the Contract. Effective December 31, 2005, the
IRS requires annuity contracts to include the actuarial present value of other
benefits for purposes of calculating the required minimum distribution amount.
These other benefits may include accumulation, income, or death benefits. Not
all income plans offered under the Contract satisfy the requirements for
minimum distributions. Because these distributions are required under the Code
and the method of calculation is complex, please see a competent tax advisor.

THE DEATH BENEFIT AND TAX QUALIFIED CONTRACTS. Pursuant to the Code and IRS
regulations, an IRA (e.g., traditional IRA, Roth IRA, SEP IRA and SIMPLE IRA)
may not invest in life insurance contracts. However, an IRA may provide a death
benefit that equals the greater of the purchase payments or the Contract Value.
The Contract offers a death benefit that in certain circumstances may exceed
the greater of the purchase payments or the Contract Value. We believe that the
Death Benefits offered by your Contract do not constitute life insurance under
these regulations.

It is also possible that certain death benefits that offer enhanced earnings
could be characterized as an incidental death benefit. If the death benefit
were so characterized, this could result in current taxable income to a
Contract Owner. In addition, there are limitations on the amount of incidental
death benefits that may be provided under Qualified Plans, such as in
connection with a TSA or employer sponsored qualified retirement plan.

Lincoln Benefit reserves the right to limit the availability of the Contract
for use with any of the Qualified Plans listed above.

PENALTY TAX ON PREMATURE DISTRIBUTIONS FROM TAX QUALIFIED CONTRACTS. A 10%
penalty tax applies to the taxable amount of any premature distribution from a
Tax Qualified Contract. The penalty tax generally applies to any distribution
made prior to the date you attain age 59 1/2. However, no penalty tax is
incurred on distributions:

..  made on or after the date the Contract Owner attains age 59 1/2,

                                      71
..  made as a result of the Contract Owner's death or total disability,

..  made in substantially equal periodic payments (as defined by the Code) over
   the Contract Owner's life or life expectancy, or over the joint lives or
   joint life expectancies of the Contract Owner and the Beneficiary,

..  made after separation from service after age 55 (does not apply to IRAs),

..  made pursuant to an IRS levy,

..  made for certain medical expenses,

..  made to pay for health insurance premiums while unemployed (applies only for
   IRAs),

..  made for qualified higher education expenses (applies only for IRAs)

..  made for a first time home purchase (up to a $10,000 lifetime limit and
   applies only for IRAs), and

..  from an IRA or attributable to elective deferrals under a 401(k) plan,
   403(b) annuity, or certain similar arrangements made to individuals who
   (because of their being members of a reserve component) are ordered or
   called to active duty after Sept. 11, 2001, for a period of more than 179
   days or for an indefinite period; and made during the period beginning on
   the date of the order or call to duty and ending at the close of the active
   duty period.

During the first 2 years of the individual's participation in a SIMPLE IRA,
distributions that are otherwise subject to the premature distribution penalty,
will be subject to a 25% penalty tax.

You should consult a competent tax advisor to determine how these exceptions
may apply to your situation.

SUBSTANTIALLY EQUAL PERIODIC PAYMENTS ON TAX QUALIFIED CONTRACTS. With respect
to Tax Qualified Contracts using substantially equal periodic payments as an
exception to the penalty tax on premature distributions, any additional
withdrawal or other material modification of the payment stream would violate
the requirement that payments must be substantially equal. Failure to meet this
requirement would mean that the income portion of each payment received prior
to the later of 5 years or the taxpayer's attaining age 59 1/2 would be subject
to a 10% penalty tax unless another exception to the penalty tax applied. The
tax for the year of the modification is increased by the penalty tax that would
have been imposed without the exception, plus interest for the years in which
the exception was used. A material modification does not include permitted
changes described in published IRS rulings. You should consult a competent tax
advisor prior to creating or modifying a substantially equal periodic payment
stream.

INCOME TAX WITHHOLDING ON TAX QUALIFIED CONTRACTS. Generally, Lincoln Benefit
is required to withhold federal income tax at a rate of 10% from all
non-annuitized distributions that are not considered "eligible rollover
distributions." The customer may elect out of withholding by completing and
signing a withholding election form. If no election is made or if no U.S.
taxpayer identification number is provided, we will automatically withhold the
required 10% from the taxable amount. In certain states, if there is federal
withholding, then state withholding is also mandatory. Lincoln Benefit is
required to withhold federal income tax at a rate of 20% on all "eligible
rollover distributions" unless you elect to make a "direct rollover" of such
amounts to an IRA or eligible retirement plan. Eligible rollover distributions
generally include all distributions from Tax Qualified Contracts, including
TSAs but excluding IRAs, with the exception of:

..  required minimum distributions, or,

..  a series of substantially equal periodic payments made over a period of at
   least 10 years, or,

..  a series of substantially equal periodic payments made over the life (joint
   lives) of the participant (and beneficiary), or,

..  hardship distributions.

With respect to any Contract held under a Section 457 plan or by the trustee of
a Section 401 Pension or Profit Sharing Plan, we will not issue payments
directly to a plan participant or beneficiary. Consequently, the obligation to
comply with the withholding requirements described above will be the
responsibility of the plan.

For all annuitized distributions that are not subject to the 20% withholding
requirement, Lincoln Benefit is required to withhold federal income tax using
the wage withholding rates. The customer may elect out of withholding by
completing and signing a withholding election form. If no election is made, we
will automatically withhold using married with three exemptions as the default.
If no U.S. taxpayer identification number is provided, we will automatically
withhold using single with zero exemptions as the default. In certain states,
if there is federal withholding, then state withholding is also mandatory.

Election out of withholding is valid only if the customer provides a U.S.
residence address and taxpayer identification number.

Generally, Code Section 1441 provides that Lincoln Benefit as a withholding
agent must withhold 30% of the taxable amounts paid to a non-resident alien. A
non-resident alien is someone other than a U.S. citizen or resident alien. We
require an original IRS Form W-8BEN at issue to certify the owners' foreign
status. Withholding may be reduced or eliminated if covered by an income tax
treaty between the U.S. and the non-resident alien's country of residence if
the payee provides a U.S. taxpayer identification number on a fully completed
Form W-8BEN. A U.S. taxpayer identification number is a social security number
or an individual taxpayer identification number ("ITIN"). ITINs are issued by
the IRS to non-resident alien individuals who are not eligible to obtain a
social security number. The U.S. does not have a tax treaty with all countries
nor do all tax treaties provide an exclusion or lower withholding rate for
annuities.

                                      72
<R>
CHARITABLE IRA DISTRIBUTIONS. Prior law provided a charitable giving incentive
permitting tax-free IRA distributions for charitable purposes. As of the
beginning of 2015, this provision has expired and has not been extended. It is
possible that Congress will extend this provision retroactively to include some
or all of 2015.

For distributions in tax years beginning after 2005 and before 2015, these
rules provided an exclusion from gross income, up to $100,000 for otherwise
taxable IRA distributions from a traditional or Roth IRA that are qualified
charitable distributions. To constitute a qualified charitable distribution,
the distribution must be made (1) directly by the IRA trustee to certain
qualified charitable organizations and (2) on or after the date the IRA owner
attains age 70 1/2. Distributions that are excluded from income under this
provision are not taken into account in determining the individual's
deductions, if any, for charitable contributions.
</R>

The IRS has indicated that an IRA trustee is not responsible for determining
whether a distribution to a charity is one that satisfies the requirements of
the charitable giving incentive. Per IRS instructions, we report these
distributions as normal IRA distributions on Form 1099-R. Individuals are
responsible for reflecting the distributions as charitable IRA distributions on
their personal tax returns.

<R>
INDIVIDUAL RETIREMENT ANNUITIES. Code Section 408(b) permits eligible
individuals to contribute to an individual retirement program known as an
Individual Retirement Annuity (IRA). Individual Retirement Annuities are
subject to limitations on the amount that can be contributed and on the time
when distributions may commence. Certain distributions from other types of
qualified retirement plans may be "rolled over" on a tax-deferred basis into an
Individual Retirement Annuity. For IRA rollovers, an individual can only make
an IRA to IRA rollover if the individual has not made a rollover involving any
IRAs owned by the individual in the prior 12 months. An IRA transfer is a
tax-free trustee-to-trustee "transfer" from one IRA account to another. IRA
transfers are not subject to this 12 month rule.
</R>

ROTH INDIVIDUAL RETIREMENT ANNUITIES. Code Section 408A permits eligible
individuals to make nondeductible contributions to an individual retirement
program known as a Roth Individual Retirement Annuity. Roth Individual
Retirement Annuities are subject to limitations on the amount that can be
contributed and on the time when distributions may commence.

A traditional Individual Retirement Account or Annuity may be converted or
"rolled over" to a Roth Individual Retirement Annuity. For distributions after
2007, the Pension Protection Act of 2006 allows distributions from qualified
retirement plans including tax sheltered annuities and governmental Section 457
plans to be rolled over directly into a Roth IRA, subject to the usual rules
that apply to conversions from a traditional IRA into a Roth IRA. The income
portion of a conversion or rollover distribution is taxable currently, but is
exempted from the 10% penalty tax on premature distributions. Prior to
January 1, 2010, income and filing status limitations applied to rollovers from
non-Roth accounts to a Roth IRA. Effective January 1, 2005, the IRS requires
conversions of annuity contracts to include the actuarial present value of
other benefits for purposes of valuing the taxable amount of the conversion.

ANNUITIES HELD BY INDIVIDUAL RETIREMENT ACCOUNTS (COMMONLY KNOWN AS CUSTODIAL
IRAS). Code Section 408 permits a custodian or trustee of an Individual
Retirement Account to purchase an annuity as an investment of the Individual
Retirement Account. If an annuity is purchased inside of an Individual
Retirement Account, then the Annuitant must be the same person as the
beneficial owner of the Individual Retirement Account.

If you have a contract issued as an IRA under Code Section 408(b) and request
to change the ownership to an IRA custodian permitted under Section 408, we
will treat a request to change ownership from an individual to a custodian as
an indirect rollover. We will send a Form 1099R to report the distribution and
the custodian should issue a Form 5498 for the contract value contribution.

Generally, the death benefit of an annuity held in an Individual Retirement
Account must be paid upon the death of the Annuitant. However, in most states,
the Contract permits the custodian or trustee of the Individual Retirement
Account to continue the Contract in the accumulation phase, with the
Annuitant's surviving spouse as the new Annuitant, if the following conditions
are met:

1) The custodian or trustee of the Individual Retirement Account is the owner
   of the annuity and has the right to the death proceeds otherwise payable
   under the Contract;

2) The deceased Annuitant was the beneficial owner of the Individual Retirement
   Account;

3) We receive a complete request for settlement for the death of the Annuitant;
   and

4) The custodian or trustee of the Individual Retirement Account provides us
   with a signed certification of the following:

   (a) The Annuitant's surviving spouse is the sole beneficiary of the
   Individual Retirement Account;

   (b) The Annuitant's surviving spouse has elected to continue the Individual
   Retirement Account as his or her own Individual Retirement Account; and

   (c) The custodian or trustee of the Individual Retirement Account has
   continued the Individual Retirement Account pursuant to the surviving
   spouse's election.

SIMPLIFIED EMPLOYEE PENSION IRA (SEP IRA). Code Section 408(k) allows eligible
employers to establish simplified employee pension plans for their employees
using individual retirement annuities. These employers may, within specified
limits, make deductible contributions on behalf of the employees to the
individual retirement annuities. Employers intending to use the Contract in
connection with such plans should seek competent tax advice.

SAVINGS INCENTIVE MATCH PLANS FOR EMPLOYEES (SIMPLE IRA). Code Section 408(p)
allows eligible employers with 100 or fewer employees to establish SIMPLE
retirement plans for their employees using individual retirement annuities. In
general, a SIMPLE IRA

                                      73
<R>
consists of a salary deferral program for eligible employees and matching or
non-elective contributions made by employers. Employers intending to purchase
the Contract as a SIMPLE IRA should seek competent tax and legal advice. SIMPLE
IRA plans must include the provisions of the Economic Growth and Tax Relief
Reconciliation Act of 2007 (EGTRRA) to avoid adverse tax consequences. If your
current SIMPLE IRA plan uses IRS Model Form 5304-SIMPLE with a revision date of
March 2012 or later, then your plan is up to date. If your plan has a revision
date prior to March 2012, please consult with your tax or legal advisor to
determine the action you need to take in order to comply with this requirement.
</R>

TO DETERMINE IF YOU ARE ELIGIBLE TO CONTRIBUTE TO ANY OF THE ABOVE LISTED IRAS
(TRADITIONAL, ROTH, SEP, OR SIMPLE), PLEASE REFER TO IRS PUBLICATION 590 AND
YOUR COMPETENT TAX ADVISOR.

TAX SHELTERED ANNUITIES. Code Section 403(b) provides tax-deferred retirement
savings plans for employees of certain non-profit and educational
organizations. Under Section 403(b), any contract used for a 403(b) plan must
provide that distributions attributable to salary reduction contributions made
after 12/31/88, and all earnings on salary reduction contributions, may be made
only on or after the date the employee:

..  attains age 59 1/2,

..  severs employment,

..  dies,

..  becomes disabled, or

..  incurs a hardship (earnings on salary reduction contributions may not be
   distributed on account of hardship).

These limitations do not apply to withdrawals where Lincoln Benefit is directed
to transfer some or all of the Contract Value to another 403(b) plan.
Generally, we do not accept funds in 403(b) contracts that are subject to the
Employee Retirement Income Security Act of 1974 (ERISA).

CAUTION: Under IRS regulations we can accept contributions, transfers and
rollovers only if we have entered into an information-sharing agreement, or its
functional equivalent, with the applicable employer or its plan administrator.
Unless your contract is grandfathered from certain provisions in these
regulations, we will only process certain transactions (e.g, transfers,
withdrawals, hardship distributions and, if applicable, loans) with employer
approval. This means that if you request one of these transactions we will not
consider your request to be in good order, and will not therefore process the
transaction, until we receive the employer's approval in written or electronic
form.

CORPORATE AND SELF-EMPLOYED PENSION AND PROFIT SHARING PLANS.

Section 401(a) of the Code permits corporate employers to establish various
types of tax favored retirement plans for employees. Self-employed individuals
may establish tax favored retirement plans for themselves and their employees
(commonly referred to as "H.R.10" or "Keogh"). Such retirement plans may permit
the purchase of annuity contracts. Lincoln Benefit no longer issues annuity
contracts to employer sponsored qualified retirement plans.

There are two owner types for contracts intended to qualify under
Section 401(a): a qualified plan fiduciary or an annuitant owner.

..  A qualified plan fiduciary exists when a qualified plan trust that is
   intended to qualify under Section 401(a) of the Code is the owner. The
   qualified plan trust must have its own tax identification number and a named
   trustee acting as a fiduciary on behalf of the plan. The annuitant should be
   the person for whose benefit the contract was purchased.

..  An annuitant owner exists when the tax identification number of the owner
   and annuitant are the same, or the annuity contract is not owned by a
   qualified plan trust. The annuitant should be the person for whose benefit
   the contract was purchased.

If a qualified plan fiduciary is the owner of the contract, the qualified plan
must be the beneficiary so that death benefits from the annuity are distributed
in accordance with the terms of the qualified plan. Annuitant owned contracts
require that the beneficiary be the annuitant's spouse (if applicable), which
is consistent with the required IRS language for qualified plans under
Section 401(a). A completed Annuitant Owned Qualified Plan Designation of
Beneficiary form is required in order to change the beneficiary of an annuitant
owned Qualified Plan contract.

STATE AND LOCAL GOVERNMENT AND TAX-EXEMPT ORGANIZATION DEFERRED COMPENSATION
PLANS. Section 457 of the Code permits employees of state and local governments
and tax-exempt organizations to defer a portion of their compensation without
paying current taxes. The employees must be participants in an eligible
deferred compensation plan. In eligible governmental plans, all assets and
income must be held in a trust/custodial account/annuity contract for the
exclusive benefit of the participants and their beneficiaries. To the extent
the Contracts are used in connection with a non-governmental eligible plan,
employees are considered general creditors of the employer and the employer as
owner of the Contract has the sole right to the proceeds of the Contract. Under
eligible 457 plans, contributions made for the benefit of the employees will
not be includible in the employees' gross income until distributed from the
plan. Lincoln Benefit no longer issues annuity contracts to 457 plans.

                                      74
ABOUT LINCOLN BENEFIT LIFE COMPANY

Rule 12h-7 under the Securities Exchange Act of 1934, as amended (the "Exchange
Act") exempts an insurance company from filing reports under the Exchange Act
when the insurance company issues certain types of insurance products that are
registered under the Securities Act of 1933 and such products are regulated
under state law. The variable annuities described in this prospectus fall
within the exemption provided under rule 12h-7. We rely on the exemption
provided under rule 12h-7 and do not file reports under the Exchange Act.

                                      75
STATEMENT OF ADDITIONAL INFORMATION

TABLE OF CONTENTS

ADDITIONS, DELETIONS, OR SUBSTITUTIONS OF INVESTMENTS
THE CONTRACTS
CALCULATION OF ACCUMULATION UNIT VALUES
CALCULATION OF VARIABLE INCOME PAYMENTS
GENERAL MATTERS
EXPERTS
FINANCIAL STATEMENTS
ACCUMULATION UNIT VALUES

THIS PROSPECTUS DOES NOT CONSTITUTE AN OFFERING IN ANY JURISDICTION IN WHICH
SUCH OFFERING MAY NOT LAWFULLY BE MADE. WE DO NOT AUTHORIZE ANYONE TO PROVIDE
ANY INFORMATION OR REPRESENTATIONS REGARDING THE OFFERING DESCRIBED IN THIS
PROSPECTUS OTHER THAN AS CONTAINED IN THIS PROSPECTUS.

                                      76
APPENDIX A

CONTRACT COMPARISON CHART

Feature            Classic           Plus           Elite           Select
-------         --------------  --------------  --------------  --------------
                                   up to 5%
                                 depending on
                                issue age and
                                  amount of
Credit                             purchase
Enhancement          None          payments          None            None
Mortality and
Expense
Risk Charge
(Base Contract)     1.25%           1.45%           1.60%           1.70%
Withdrawal
Charge                          8.5/ 8.5/ 8.5/
(% of purchase  7/ 7/ 6/ 5/ 4/  7.5/ 6.5/ 5.5/
payment)             3/ 2           4/2.5          7/ 6/ 5           None
Withdrawal       Confinement,    Confinement,    Confinement,
Charge             Terminal        Terminal        Terminal
Waivers            Illness,        Illness,        Illness,
                 Unemployment    Unemployment    Unemployment        N/A

The Fixed Account Options available depend on the type of Contract you have
purchased and the state in which your Contract was issued. The following tables
summarize the availability of the Fixed Account Options in general. Please
check with your representative for specific details for your state.

                           DCA Fixed Account Option*
                            -------------------------
                     Classic           Plus           Elite           Select
                  --------------  --------------  --------------  --------------
Transfer Periods     6-month         6-month         6-month           N/A
                     12-month        12-month        12-month          N/A

         Standard Fixed Account Option (not available in all states)**
          -------------------------------------------------------------
                     Classic           Plus           Elite           Select
                  --------------  --------------  --------------  --------------
Guarantee Periods     1-year           N/A             N/A             N/A
                       N/A             N/A             N/A             N/A
                       N/A             N/A             N/A             N/A
                       N/A             N/A             N/A             N/A

           MVA Fixed Account Option (not available in all states)***
            ---------------------------------------------------------
                     Classic           Plus           Elite           Select
                  --------------  --------------  --------------  --------------
Guarantee Periods     1-year          1-year          1-year          1-year
                      3-year          3-year          3-year          3-year
                      5-year          5-year          5-year          5-year
                      7-year          7-year          7-year          7-year
                     10-year         10-year         10-year         10-year

*  At the time you allocate a purchase payment to the DCA Fixed Account Option,
   if you do not specify the term length over which the transfers are to take
   place, the default transfer period will be 6 months for the 6-month option
   and 12 months for the 12 month option.
** May be available only in states where the MVA Fixed Account Option is not
   offered.
***Not available in states where the Standard Fixed Account Options are offered.

                                      A-1
APPENDIX B - MARKET VALUE ADJUSTMENT

The Market Value Adjustment is based on the following:

I  = the Treasury Rate for a maturity equal to the term length of the Guarantee
   Period for the week preceding the establishment of the Market Value Adjusted
   Fixed Guarantee Period Account;

J  = the Treasury Rate for a maturity equal to the term length of the Market
   Value Adjusted Fixed Guarantee Period Account for the week preceding the
   date amounts are transferred or withdrawn from the Market Value Adjusted
   Fixed Guarantee Period Account, the date we determine the Death Proceeds, or
   the Payout Start Date, as the case may be ("Market Value Adjustment Date").

N  = the number of whole and partial years from the Market Value Adjustment
   Date to the expiration of the term length of the Market Value Adjusted Fixed
   Guarantee Period Account.

Treasury Rate means the U.S. Treasury Note Constant Maturity yield as reported
in Federal Reserve Board Statistical Release H.15. If such yields cease to be
available in Federal Reserve Board Statistical Release H.15, then we will use
an alternate source for such information in our discretion.

The Market Value Adjustment factor is determined from the following formula:

                           .9 X [I-(J + .0025)] X N

The denominator of the MVA formula includes a factor, currently equal to 0.0025
or 25 basis points. The factor is an adjustment that is applied when an MVA is
assessed (regardless of whether the MVA is positive or negative) and, relative
to when no factor is applied, will reduce the amount being surrendered or
transferred from the MVA Fixed Guarantee Period Account.

To determine the Market Value Adjustment, we will multiply the Market Value
Adjustment factor by the amount transferred, withdrawn, paid as Death Proceeds,
or applied to an Income Plan from a Market Value Adjusted Fixed Guarantee
Period Account at any time other than during the 30 day period after such
Guarantee Period Account expires. NOTE: These examples assume that premium
taxes are not applicable.

                     EXAMPLES OF MARKET VALUE ADJUSTMENT

Purchase Payment:  $10,000 allocated to a Market Value Adjusted Fixed
                   Guarantee Period Account
Guarantee Period:  5 years
Interest Rate:     4.50%
Full Withdrawal:   End of Contract Year 3
Contract:          Consultant Solutions Classic*

                EXAMPLE 1: (ASSUMES DECLINING INTEREST RATES)

Step 1: Calculate Contract       = $10,000.00 X (1.045)/3/ = $11,411.66
Value at End of Contract Year 3:
Step 2: Calculate the Free       = .15 X $10,000 = $1,500
Withdrawal Amount:
Step 3: Calculate the            = .06 X ($10,000 - $1,500) = $510
Withdrawal Charge:
Step 4: Calculate the Market     I = 4.50%
Value Adjustment:
                                 J = 4.20%
                                     730 DAYS
                                 N = ________ = 2
                                     365 DAYS
                                 Market Value Adjustment Factor: .9 X [I - (J
                                 + .0025)] X N
                                 = .9 X [.045 - (.042 + .0025)] X 2 = .0009
                                 Market Value Adjustment = Market Value
                                 Adjustment Factor X Amount Subject To Market
                                 Value Adjustment:
                                 = .0009 X $11,411.66 = $10.27
Step 5: Calculate the amount     = $11,411.66 - $510 + $10.27 = $10,911.93
received by Contract owner as a
result of full withdrawal at
the end of Contract Year 3:

                  EXAMPLE 2: (ASSUMES RISING INTEREST RATES)

Step 1: Calculate Contract       = $10,000.00 X (1.045)/3/ = $11,411.66
Value at End of Contract Year 3:
Step 2: Calculate the Free       = .15 X $10,000 = $1,500
Withdrawal Amount:
Step 3: Calculate the            = .06 X ($10,000 - $1,500) = $510
Withdrawal Charge:
Step 4: Calculate the Market     I = 4.50%
Value Adjustment:
                                 J = 4.80%
                                     730 DAYS
                                 N = ________ = 2
                                     365 DAYS
                                 Market Value Adjustment Factor: .9 X [I - (J
                                 + .0025)] X N
                                 = .9 X [(.045 - (.048 + .0025)] X (2) = -.0099
                                 Market Value Adjustment = Market Value
                                 Adjustment Factor X Amount
                                 Subject To Market Value Adjustment:
                                 = -.0099 X $11,411.66 = - ($112.98)
Step 5: Calculate the amount     = $11,411.66 - $510 - $112.98 = $10,788.68
received by Contract owner as a
result of full withdrawal at
the end of Contract Year 3:

*  These examples assume the election of the CONSULTANT SOLUTIONS CLASSIC
   CONTRACT for the purpose of illustrating the Market Value Adjustment
   calculation. The amounts would be different under CONSULTANT SOLUTIONS PLUS,
   CONSULTANT SOLUTIONS ELITE CONTRACTS, and CONSULTANT SOLUTIONS SELECT
   CONTRACTS which have different expenses and withdrawal charges.

                                      B-1
APPENDIX C

EXAMPLE OF CALCULATION OF INCOME PROTECTION BENEFIT

Appendix C illustrates how we calculate the amount guaranteed under the Income
Protection Benefit Option. Please remember that you are looking at an example
only. Please also remember that the Income Protection Benefit Option may only
be added to Income Plans 1 and/or 2, and only to those Income Plans for which
you have selected variable income payments.

To illustrate the calculation of the amount guaranteed under the Income
Protection Benefit Option, we assume the following:

 Adjusted age of Annuitant on the Payout Start Date:                65
 ---------------------------------------------------                -----------
 Sex of Annuitant:................................................. male
 Income Plan selected:............................................. 1
 Payment frequency:................................................ monthly
 Amount applied to variable income payments under the Income Plan:. $100,000.00

The example assumes that the withdrawal charge period has expired for all
purchase payments. In accordance with the terms of the Contract, the following
additional assumptions apply:

 Assumed investment rate:            3%
 ------------------------            ------------------------------------------
 Guaranteed minimum variable income  85% of the initial variable amount income
   payment:......................... value

STEP 1 - CALCULATION OF THE INITIAL VARIABLE AMOUNT INCOME VALUE:

Using the assumptions stated above, the initial monthly income payment is $5.49
per $1,000 applied to variable income payments under Income Plan 1. Therefore,
the initial variable amount income value = $100,000 X $5.49/1000 = $549.00.

STEP 2 - CALCULATION OF THE AMOUNT GUARANTEED UNDER THE INCOME PROTECTION
BENEFIT OPTION:

guaranteed minimum variable income payment = 85% X initial variable amount
income value = 85% X $549.00 = $466.65.

STEP 3 - ILLUSTRATION OF THE EFFECT OF THE MINIMUM PAYMENT GUARANTEE UNDER THE
INCOME PROTECTION BENEFIT OPTION:

If in any month your variable income payments would fall below the amount
guaranteed under the Income Protection Benefit Option, your payment for that
month will equal the guaranteed minimum variable income payment. For example,
you would receive $466.65 even if the amount of your monthly income payment
would have been less than that as a result of declining investment experience.
On the other hand, if your monthly income payment is greater than the minimum
guaranteed $466.65, you would receive the greater amount.

                                      C-1
APPENDIX D

WITHDRAWAL ADJUSTMENT EXAMPLE - DEATH BENEFITS*

Issue Date: January 1, 2005

Initial Purchase Payment: $50,000 (For CONSULTANT SOLUTIONS PLUS CONTRACTS,
assume a $2,000 Credit Enhancement would apply assuming issue age 85 or younger
(a $1,000 Credit Enhancement would apply assuming issue age 86-90)).

                                                                              Death Benefit Amount
                                                                  ---------------------------------------------
                                                                                                    Annual
                                                                     ROP Value                 Increase Value**
                                                                  ----------------             ----------------
                                                                  Classic,                     Classic,
                                Beginning              Contract    Elite             Maximum    Elite
                 Type of        Contract  Transaction Value After   And            Anniversary   And
Date            Occurrence        Value     Amount    Occurrence   Select   Plus      Value     Select   Plus
----       -------------------- --------- ----------- ----------- -------- ------- ----------- -------- -------
1/1/06.... Contract Anniversary  $55,000         --     $55,000   $50,000  $52,000   $55,000   $52,500  $54,600
7/1/06....   Partial Withdrawal  $60,000    $15,000     $45,000   $37,500  $39,000   $41,250   $40,339  $41,953

The following shows how we compute the adjusted death benefits in the example
above. Please note that the withdrawal reduces the Purchase Payment Value, the
Maximum Anniversary Value, and the Enhanced Beneficiary Value by the same
proportion as the withdrawal reduces the Contract Value.

                                                                 Classic, Elite and Select  Plus
                                                                 ------------------------- -------
ROP DEATH BENEFIT
Partial Withdrawal Amount.........................      (a)               $15,000          $15,000
Contract Value Immediately Prior to Partial
  Withdrawal......................................      (b)               $60,000          $60,000
Value of Death Benefit Amount Immediately Prior
  to Partial Withdrawal...........................      (c)               $50,000          $52,000
Withdrawal Adjustment............................. [(a)/(b)]*(c)          $12,500          $13,000
Adjusted Death Benefit............................                        $37,500          $39,000
MAV DEATH BENEFIT
Partial Withdrawal Amount.........................      (a)               $15,000          $15,000
Contract Value Immediately Prior to Partial
  Withdrawal......................................      (b)               $60,000          $60,000
Value of Death Benefit Amount Immediately Prior
  to Partial Withdrawal...........................      (c)               $55,000          $55,000
Withdrawal Adjustment............................. [(a)/(b)]*(c)          $13,750          $13,750
Adjusted Death Benefit............................                        $41,250          $41,250
ANNUAL INCREASE DEATH BENEFIT**
Partial Withdrawal Amount.........................      (a)               $15,000          $15,000
Contract Value Immediately Prior to Partial
  Withdrawal......................................      (b)               $60,000          $60,000
Value of Death Benefit Amount Immediately Prior
  to Partial Withdrawal (assumes 181 days worth
  of interest on $52,500 and $54,600,
  respectively)...................................      (c)               $53,786          $55,937
Withdrawal Adjustment............................. [(a)/(b)]*(c)          $13,446          $13,984
Adjusted Death Benefit............................                        $40,339          $41,953

*  For purpose of illustrating the withdrawal adjustment calculation, the
   example assumes the same hypothetical Contract Values and Maximum
   Anniversary Value for all Contracts, net of applicable fees and charges.
   Actual death benefit amounts will differ due to the different fees and
   charges under each Contract and the Credit Enhancement available under the
   CONSULTANT SOLUTIONS PLUS CONTRACT. Please remember that you are looking at
   an example and that your investment performance may be greater or lower than
   the figures shown.
** Calculations for the Annual Increase Death Benefit assume that interest
   accumulates on a daily basis at a rate equivalent to 5% per year. There may
   be certain states in which the Benefit provides for interest that
   accumulates at a rate of 3% per year. If calculations assumed an interest
   rate of 3% per year, the adjusted death benefit would be lower.

                                      D-1
APPENDIX E
CALCULATION OF ENHANCED EARNINGS DEATH BENEFIT*

The following are examples of the Enhanced Earnings Death Benefit Option. For
illustrative purposes, the examples assume Earnings in each case. Please
remember that you are looking at examples and that your investment performance
may be greater or lower than the figures shown.

EXAMPLE 1: ELECTED WHEN CONTRACT WAS ISSUED WITHOUT ANY SUBSEQUENT ADDITIONS OR
WITHDRAWALS

In this example, assume that the oldest Contract Owner is age 55 on the Rider
Application Date and elects the Enhanced Earnings Death Benefit Option when the
Contract is issued. The Contract Owner makes an initial purchase payment of
$100,000. After four years, the Contract Owner dies. On the date Lincoln
Benefit receives a Complete Request for Settlement, the Contract Value is
$125,000. Prior to his death, the Contract Owner did not make any additional
purchase payments or take any withdrawals.

Excess of Earnings Withdrawals                     =  $0
Purchase Payments in the 12 months prior to death  =  $0
In-Force Premium                                   =  $100,000
                                                      ($100,000 + $0 - $0)
In-Force Earnings                                  =  $25,000
                                                      ($125,000 - $100,000)
ENHANCED EARNINGS DEATH BENEFIT**                  =  40%*$25,000 = $10,000

Since In-Force Earnings are less than 100% of the In-Force Premium (excluding
purchase payments in the 12 months prior to death), the In-Force Earnings are
used to compute the Enhanced Earnings Death Benefit amount.

*  For purposes of illustrating the calculation of Enhanced Earnings Death
   Benefit Option, the example assumes the same hypothetical Contract Values
   for all Contracts, net of applicable fees and charges. Actual death benefit
   amounts will differ due to the different fees and charges under each
   Contract and the Credit Enhancement available under the CONSULTANT SOLUTIONS
   PLUS CONTRACT.

** If the oldest Contract Owner or Co-Annuitant had been over age 70, and both
   were age 79 or younger on the Rider Application Date, the Enhanced Earnings
   Death Benefit would be 25% of the In-Force Earnings ($6,250.00).

EXAMPLE 2: ELECTED WHEN CONTRACT WAS ISSUED WITH SUBSEQUENT WITHDRAWALS

In this example, assume the same facts as above, except that the Contract Owner
has taken a withdrawal of $10,000 during the second year of the Contract.
Immediately prior to the withdrawal, the Contract Value is $105,000. Here,
$5,000 of the withdrawal is in excess of the In-Force Earnings at the time of
the withdrawal. The Contract Value on the date Lincoln Benefit receives a
Complete Request for Settlement will be assumed to be $114,000.

Excess of Earnings Withdrawals                     =  $5,000
                                                      ($10,000 - $5,000)
Purchase Payments in the 12 months prior to death  =  $0
In-Force Premium                                   =  $95,000
                                                      ($100,000 + $0 - $5,000)
In-Force Earnings                                  =  $19,000
                                                      ($114,000 - $95,000)
ENHANCED EARNINGS DEATH BENEFIT**                  =  40%*$19,000 = $7,600

Since In-Force Earnings are less than 100% of the In-Force Premium (excluding
purchase payments in the 12 months prior to death), the In-Force Earnings are
used to compute the Enhanced Earnings Death Benefit amount.

*  For purposes of illustrating the calculation of Enhanced Earnings Death
   Benefit Option, the example assumes the same hypothetical Contract Values
   for all Contracts, net of applicable fees and charges. Actual death benefit
   amounts will differ due to the different fees and charges under each
   Contract and the Credit Enhancement available under the CONSULTANT SOLUTIONS
   PLUS CONTRACT.

** If the oldest Contract Owner or Co-Annuitant had been over age 70, and both
   were age 79 or younger on the Rider Application Date, the Enhanced Earnings
   Death Benefit would be 25% of the In-Force Earnings ($4,750.00).

EXAMPLE 3: ELECTED AFTER CONTRACT WAS ISSUED WITH SUBSEQUENT ADDITIONS AND
WITHDRAWALS

This example is intended to illustrate the effect of adding the Enhanced
Earnings Death Benefit Option after the Contract has been issued and the effect
of later purchase payments. In this example, assume there is no Co-Annuitant
and that the oldest Contract Owner is age 72 on the Rider Application Date. At
the time the Contract is issued, the Contract Owner makes a purchase payment of
$100,000. After two years pass, the Contract Owner elects to add the Enhanced
Earnings Death Benefit Option. On the date this Rider is added, the Contract
Value is $110,000. Two years later, the Contract Owner withdraws $50,000.
Immediately prior to the withdrawal, the Contract Value is $130,000. Another
two years later, the Contract Owner makes an additional purchase payment of
$40,000. Immediately after the additional purchase payment, the Contract Value
is $130,000. Two years later, the Contract Owner dies with a Contract Value of
$140,000 on the date Lincoln Benefit receives a Complete Request for Settlement.

                                      E-1
Excess of Earnings Withdrawals      =  $30,000
                                       ($50,000 - $20,000)
Purchase Payments in the 12 months  =  $0
prior to death
In-Force Premium                    =  $120,000
                                       ($110,000 + $40,000 - $30,000)
In-Force Earnings                   =  $20,000
                                       ($140,000 - $120,000)
ENHANCED EARNINGS DEATH             =  25%*$20,000 = $5,000
BENEFIT**

In this example, In-Force Premium is equal to the Contract Value on Rider
Application Date plus the additional purchase payment and minus the
Excess-of-Earnings Withdrawal.

Since In-Force Earnings are less than 50% of the In-Force Premium (excluding
purchase payments in the 12 months prior to death), the In-Force Earnings are
used to compute the Enhanced Earnings Death Benefit amount.

*  For purposes of illustrating the calculation of Enhanced Earnings Death
   Benefit Option, the example assumes the same hypothetical Contract Values
   for all Contracts, net of applicable fees and charges. Actual death benefit
   amounts will differ due to the different fees and charges under each
   Contract and the Credit Enhancement available under the CONSULTANT SOLUTIONS
   PLUS CONTRACT.

** If the oldest Contract Owner had been age 70 or younger on the Rider
   Application Date, the Enhanced Earnings Death Benefit would be 40% of the
   In-Force Earnings ($8,000.00).

EXAMPLE 4: SPOUSAL CONTINUATION:

This example is intended to illustrate the effect of a surviving spouse
electing to continue the Contract upon the death of the Contract Owner on a
Contract with the Enhanced Earnings Death Benefit Option and MAV Death Benefit
Option. In this example, assume that there is no Co-Annuitant and that the
oldest Contract Owner is age 60 at the time the Contract is purchased (with the
Enhanced Earnings Death Benefit Option but without any other option) with a
$100,000 purchase payment. Five years later the Contract Owner dies and the
surviving spouse elects to continue the Contract. The Contract Value and
Maximum Anniversary Value at this time are $150,000 and $160,000, respectively.

Excess of Earnings Withdrawals                     =  $0
Purchase Payments in the 12 months prior to death  =  $0
In-Force Premium                                   =  $100,000
                                                      ($100,000 + $0 - $0)
In-Force Earnings                                  =  $50,000
                                                      ($150,000 - $100,000)
ENHANCED EARNINGS DEATH BENEFIT**                  =  40%*$50,000 = $20,000
Contract Value                                     =  $150,000
Death Benefit                                      =  $160,000
Enhanced Earnings Death Benefit                    =  $20,000
Continuing Contract Value                          =  $180,000
                                                      ($160,000 + $20,000)

Since In-Force Earnings are less than 100% of the In-Force Premium (excluding
purchase payments in the 12 months prior to death), the In-Force Earnings are
used to compute the Enhanced Earnings Death Benefit amount.

Assume the surviving spouse is age 72 when the Contract is continued. At this
time, the surviving spouse has the option to continue the Enhanced Earnings
Death Benefit Option at an additional mortality and expense risk charge of
0.40% and with an In-Force Premium amount equal to the Contract Value and the
Rider Date reset to the date the Contract is continued. If this selection is
made, the Enhanced Earnings Death Benefit will be equal to the lesser of 25% of
the In-Force Earnings and 50% of In-Force Premium. Otherwise, the surviving
spouse may elect to terminate the Enhanced Earnings Death Benefit Option at the
time of continuation.

*  For purposes of illustrating the calculation of Enhanced Earnings Death
   Benefit Option, the example assumes the same hypothetical Contract Values
   and Maximum Anniversary Values for all Contracts, net of applicable fees and
   charges. Actual death benefit amounts will differ due to the different fees
   and charges under each Contract and the Credit Enhancement available under
   the CONSULTANT SOLUTIONS PLUS CONTRACT.

** If the oldest Contract Owner had been over age 70 , and both were age 79 or
   younger on the Rider Application Date, the Enhanced Earnings Death Benefit
   would be 25% of the In-Force Earnings ($12,500.00).

                                      E-2
APPENDIX F
WITHDRAWAL ADJUSTMENT EXAMPLE - ACCUMULATION BENEFIT*

Rider Date: January 1, 2007

Initial Purchase Payment: $50,000 (For CONSULTANT SOLUTIONS PLUS CONTRACTS,
assume a $2,000 Credit Enhancement would apply assuming issue age 85 or younger
(a $1,000 Credit Enhancement would apply assuming issue age 86-90))

Initial Benefit Base: $50,000 for CONSULTANT SOLUTIONS CLASSIC, ELITE AND
SELECT CONTRACTS, $52,000 for CONSULTANT SOLUTIONS PLUS CONTRACTS (assuming
issue age 85 or younger)

                                                                                      Benefit Base
                                                                                 ----------------------
                                       Beginning    Transaction  Contract Value  Classic, Elite
Date             Type of Occurrence  Contract Value   Amount    After Occurrence   and Select    Plus
----            -------------------- -------------- ----------- ---------------- -------------- -------
1/1/2008....... Contract Anniversary    $55,000            --       $55,000         $50,000     $52,000
7/1/2008.......  Partial Withdrawal     $60,000       $15,000       $45,000         $37,500     $39,000

The following shows how we compute the adjusted Benefit Bases in the example
above. Please note the withdrawal reduces the Benefit Base by the same
proportion as the withdrawal reduces the Contract Value.

                                                                                 Classic, Elite and Select  Plus
                                                                                 ------------------------- -------
BENEFIT BASE
Partial Withdrawal Amount........................................      (a)                $15,000          $15,000
Contract Value Immediately Prior to Partial Withdrawal...........      (b)                $60,000          $60,000
Value of Benefit Base Immediately Prior to Partial Withdrawal....      (c)                $50,000          $52,000
Withdrawal Adjustment............................................ [(a)/(b)]*(c)           $12,500          $13,000
Adjusted Benefit Base............................................                         $37,500          $39,000

*  For the purpose of illustrating the withdrawal adjustment calculation, the
   example assumes the same hypothetical Contract Values, net of applicable
   fees and charges. Actual Contract Values will differ due to the different
   fees and charges under each Contract and the Credit Enhancement available
   under CONSULTANT SOLUTIONS PLUS CONTRACTS. Please remember that you are
   looking at an example and that your investment performance may be greater or
   lower than the figures shown.

                                      F-1
APPENDIX G - SUREINCOME WITHDRAWAL BENEFIT OPTION CALCULATION EXAMPLES

Example 1: Assume you purchase a Consultant Solutions contract with a $100,000
initial purchase payment and add the SureIncome Option at issue.

Your Benefit Base is $100,000, which is your initial purchase payment of
$100,000.

Your Benefit Payment is $8,000, which is 8% of your initial purchase payment.

Your Benefit Payment Remaining for this Benefit Year is $8,000, which is equal
to your Benefit Payment at the beginning of this Benefit Year.

Example 2: Assume Example 1 is continued and an additional purchase payment of
$40,000 is made in the first Benefit Year.

The Benefit Base is increased to $140,000, which is your prior Benefit Base
($100,000) plus your additional purchase payment ($40,000).

The Benefit Payment is increased to $11,200, which is your prior Benefit
Payment ($8,000) plus 8% of your additional purchase payment ($40,000).

The Benefit Payment Remaining is increased to $11,200, which is your Benefit
Payment Remaining prior to your additional purchase payment ($8,000) plus 8% of
your additional purchase payment ($40,000).

Example 3: Assume Example 1 is continued and a withdrawal of $8,000 is made
during the first Benefit Year.

The Benefit Base is reduced to $92,000, which is your prior Benefit Base
($100,000) less your withdrawal ($8,000).

The Benefit Payment is unchanged and remains $8,000.

The Benefit Payment Remaining in the first Benefit Year is $0, which is your
Benefit Payment Remaining prior to your withdrawal ($8,000) less your
withdrawal ($8,000).

Example 4: Assume example 1 is continued and a withdrawal of $25,000 is made
during the first Benefit Year. Assume the Contract Value prior to the
withdrawal was $130,000. Because the $25,000 withdrawal is larger than the
Benefit Payment Remaining, the Benefit Base and Benefit Payment will be
recalculated according to applicable formulas.

The Benefit Base is reduced to $75,000, determined by the following
calculation: the lesser of ($130,000 - $25,000) and ($100,000 - $25,000) =
$75,000.

The Benefit Payment remains $8,000, determined by the following calculation:
the lesser of ($8,000) and (8% x ($130,000 - $25,000)) = $8,000.

There is no Benefit Payment Remaining because the withdrawal has reduced it to
$0.

Example 5: Assume example 3 is continued and an additional withdrawal of $5,000
is taken in the same year (the first Benefit Year). Assume the Contract Value
prior to the additional withdrawal was $60,000. Because the $5,000 withdrawal
is larger than the Benefit Payment Remaining ($0), the Benefit Base and Benefit
Payment will be recalculated according to applicable formulas.

The Benefit Base is reduced to $55,000, determined by the following
calculation: the lesser of ($60,000 - $5,000) and ($92,000 - $5,000) = $55,000.

The Benefit Payment is reduced to $4,400, determined by the following formula:
the lesser of ($8,000) and ((8% x ($60,000 - $5,000)) = $4,400.

The Benefit Payment Remaining is unchanged at $0.

Example 6: Assume example 5 is continued and an additional Purchase Payment of
$40,000 is made in the same year (the first Benefit Year).

The Benefit Base is increased to $95,000, which is your prior Benefit Base
($55,000) plus your additional purchase payment ($40,000).

The Benefit Payment is increased to $7,600, which is your prior Benefit Payment
($4,400) plus 8% of your additional purchase payment ($40,000).

The Benefit Payment Remaining is increased to $3,200, which is your Benefit
Payment Remaining prior to your additional purchase payment ($0) plus 8% of
your additional purchase payment ($40,000).

Example 7: Assume example 6 is continued and an additional withdrawal of $3,200
is taken in the same year (the first Benefit Year).

The Benefit Base is reduced to $91,800, which is your prior Benefit Base
($95,000) less your withdrawal ($3,200).

The Benefit Payment is unchanged and remains $7,600.

The Benefit Payment Remaining is reduced to $0, which is your Benefit Payment
Remaining prior to your withdrawal ($3,200) less your withdrawal ($3,200).

                                      G-1
<R>
                     APPENDIX H - ACCUMULATION UNIT VALUES
</R>

 Appendix H presents the Accumulation Unit Values and number of Accumulation
 Units outstanding for each Variable Sub-Account since the Variable
 Sub-Accounts were first offered under the Contracts. This Appendix includes
 Accumulation Unit Values representing the highest and lowest available
 combinations of Contract charges that affect Accumulation Unit Values for each
 Contract. The Statement of Additional Information, which is available upon
 request without charge, contains the Accumulation Unit Values for all other
 available combinations of Contract charges that affect Accumulation Unit
 values for each Contract. Please contract us at 800-457-7617 to obtain a copy
 of the Statement of Additional Information.

 The LBL Consultant Solutions Classic, Elite, Plus and Select Contracts and all
 of the Variable Sub-Accounts shown below were first offered under the
 Contracts on February 2, 2004, except for the Premier VIT OpCap Balanced
 Sub-Account which was first offered under the Contracts on April 30, 2004; and
 the Janus Aspen Perkins Small Company Value Portfolio - Service Shares
 Sub-Account and Oppenheimer Small- & Mid-Cap Growth Fund/VA - Service Shares
 Sub-Account which were first offered under the Contracts on May 1, 2005; and
 the Invesco V.I. Core Equity - Series II Sub-Account which was first offered
 under the Contracts on May 1, 2006; and the Legg Mason ClearBridge Variable
 Fundamental All Cap Value Portfolio - Class I Shares Sub-Account and Legg
 Mason ClearBridge Variable Large Cap Value Portfolio - Class I Shares
 Sub-Account which were first offered under the Contracts on April 27, 2007;
 and the Janus Aspen Overseas Portfolio - Service Share Sub-Account which was
 first offered under the Contracts on April 30, 2008; and the Invesco V.I.
 Government Securities Fund - Series II Sub-Account which was first offered
 under the Contracts on April 29, 2011; and the Invesco Van Kampen V.I.
 American Franchise Fund - Series II Sub-Account which was first offered under
 the Contracts on April 27, 2012.

<R>
 The names of the following Sub-Accounts changed since December 31, 2014. The
 names shown in the tables of Accumulation Units correspond to the name of the
 Sub-Account as of December 31, 2014:
</R>

<R>
  Sub-Account Name as of December 31,
                 2014
  (as appears in the following tables
     of Accumulation Unit Values)       Sub-Account Name on/about May 1, 2015
 -----------------------------------------------------------------------------
 MFS Investors Growth Stock Series -    MFS MA Investors Growth Stock
  Service Class                          Portfolio - Service Class
 -----------------------------------------------------------------------------
</R>

                                      H-1
<R>
</R>
<R>
    CONSULTANT SOLUTIONS VARIABLE ANNUITIES: LBL Consultant Solution Classic
                                  Contracts -
                                   PROSPECTUS

 ACCUMULATION UNIT VALUE AND NUMBER OF ACCUMULATION UNITS OUTSTANDING FOR EACH
                             VARIABLE SUB-ACCOUNT*

                                      Low

                           Mortality & Expense = 1.25
</R>

<R>
                                                                                                            Number of
                                                                                 Accumulation Accumulation    Units
                                                                    For the Year  Unit Value   Unit Value  Outstanding
                                                                       Ending    at Beginning    at End      at End
Sub-Accounts                                                        December 31   of Period    of Period    of Period
----------------------------------------------------------------------------------------------------------------------
Alger Capital Appreciation Portfolio - Class S
                                                                        2005       $10.219      $11.509       74,712
                                                                        2006       $11.509      $13.506      132,966
                                                                        2007       $13.506      $17.746      141,537
                                                                        2008       $17.746       $9.582      106,723
                                                                        2009        $9.582      $14.244      103,782
                                                                        2010       $14.244      $15.967       81,615
                                                                        2011       $15.967      $15.653       71,835
                                                                        2012       $15.653      $18.204       91,871
                                                                        2013       $18.204      $24.205       40,645
                                                                        2014       $24.205      $27.089       41,065
----------------------------------------------------------------------------------------------------------------------
Alger Large Cap Growth Portfolio - Class S
                                                                        2005       $10.103      $11.134      212,340
                                                                        2006       $11.134      $11.523      222,959
                                                                        2007       $11.523      $13.598      210,459
                                                                        2008       $13.598       $7.204      237,432
                                                                        2009        $7.204      $10.465      192,485
                                                                        2010       $10.465      $11.656      149,608
                                                                        2011       $11.656      $11.411      129,818
                                                                        2012       $11.411      $12.313      101,373
                                                                        2013       $12.313      $16.346       79,784
                                                                        2014       $16.346      $17.828      164,785
----------------------------------------------------------------------------------------------------------------------
Alger Mid Cap Growth Portfolio - Class S
                                                                        2005       $10.628      $11.485      210,380
                                                                        2006       $11.485      $12.450      308,342
                                                                        2007       $12.450      $16.122      291,878
                                                                        2008       $16.122       $6.605      291,655
                                                                        2009        $6.605       $9.859      287,119
                                                                        2010        $9.859      $11.562      207,809
                                                                        2011       $11.562      $10.427      178,217
                                                                        2012       $10.427      $11.900      145,851
                                                                        2013       $11.900      $15.895      114,252
                                                                        2014       $15.895      $16.869       94,587
----------------------------------------------------------------------------------------------------------------------
ClearBridge Variable Fundamental All Cap Value Portfolio - Class I
                                                                        2007       $10.000       $9.509       48,073
                                                                        2008        $9.509       $5.949       43,169
                                                                        2009        $5.949       $7.592       39,260
                                                                        2010        $7.592       $8.733       32,930
                                                                        2011        $8.733       $8.081       27,368
                                                                        2012        $8.081       $9.166       26,563
                                                                        2013        $9.166      $11.951       21,828
                                                                        2014       $11.951      $12.883            0
</R>

                                      H-2
<R>
                                                                                                  Number of
                                                                       Accumulation Accumulation    Units
                                                          For the Year  Unit Value   Unit Value  Outstanding
                                                             Ending    at Beginning    at End      at End
Sub-Accounts                                              December 31   of Period    of Period    of Period
------------------------------------------------------------------------------------------------------------
ClearBridge Variable Large Cap Value Portfolio - Class I
                                                              2007       $10.000       $9.749       96,362
                                                              2008        $9.749       $6.191       93,685
                                                              2009        $6.191       $7.604       79,400
                                                              2010        $7.604       $8.211       60,894
                                                              2011        $8.211       $8.502       48,053
                                                              2012        $8.502       $9.771       43,691
                                                              2013        $9.771      $12.759       23,351
                                                              2014       $12.759      $14.061       37,777
------------------------------------------------------------------------------------------------------------
Fidelity VIP Asset Manager Portfolio - Service Class 2
                                                              2005       $10.217      $10.460      111,219
                                                              2006       $10.460      $11.056      134,814
                                                              2007       $11.056      $12.561      148,955
                                                              2008       $12.561       $8.809      146,295
                                                              2009        $8.809      $11.190      119,875
                                                              2010       $11.190      $12.580      112,596
                                                              2011       $12.580      $12.061       77,639
                                                              2012       $12.061      $13.354       57,021
                                                              2013       $13.354      $15.194       50,790
                                                              2014       $15.194      $15.819       46,043
------------------------------------------------------------------------------------------------------------
Fidelity VIP Contrafund(R) Portfolio - Service Class 2
                                                              2005       $11.389      $13.106      523,173
                                                              2006       $13.106      $14.408      891,858
                                                              2007       $14.408      $16.672      862,174
                                                              2008       $16.672       $9.425      782,708
                                                              2009        $9.425      $12.596      702,455
                                                              2010       $12.596      $14.529      608,058
                                                              2011       $14.529      $13.934      502,184
                                                              2012       $13.934      $15.965      366,709
                                                              2013       $15.965      $20.624      282,865
                                                              2014       $20.624      $22.717      232,099
------------------------------------------------------------------------------------------------------------
Fidelity VIP Equity-Income Portfolio - Service Class 2
                                                              2005       $10.840      $11.290      457,976
                                                              2006       $11.290      $13.358      699,045
                                                              2007       $13.358      $13.344      675,449
                                                              2008       $13.344       $7.528      651,012
                                                              2009        $7.528       $9.646      556,829
                                                              2010        $9.646      $10.935      507,555
                                                              2011       $10.935      $10.858      393,828
                                                              2012       $10.858      $12.538      304,289
                                                              2013       $12.538      $15.811      211,218
                                                              2014       $15.811      $16.920      158,397
------------------------------------------------------------------------------------------------------------
Fidelity VIP Growth Portfolio - Service Class 2
                                                              2005        $9.809      $10.209      307,319
                                                              2006       $10.209      $10.734      362,183
                                                              2007       $10.734      $13.411      341,543
                                                              2008       $13.411       $6.971      316,734
                                                              2009        $6.971       $8.800      268,644
                                                              2010        $8.800      $10.752      234,521
                                                              2011       $10.752      $10.604      183,811
                                                              2012       $10.604      $11.967      111,743
                                                              2013       $11.967      $16.056       87,560
                                                              2014       $16.056      $17.584       67,893
</R>

                                      H-3
<R>
                                                                                                        Number of
                                                                             Accumulation Accumulation    Units
                                                                For the Year  Unit Value   Unit Value  Outstanding
                                                                   Ending    at Beginning    at End      at End
Sub-Accounts                                                    December 31   of Period    of Period    of Period
------------------------------------------------------------------------------------------------------------------
Fidelity VIP Index 500 Portfolio - Service Class 2
                                                                    2005       $10.668      $11.004       812,899
                                                                    2006       $11.004      $12.532     1,175,182
                                                                    2007       $12.532      $13.002     1,100,162
                                                                    2008       $13.002       $8.060     1,084,831
                                                                    2009        $8.060      $10.043       981,330
                                                                    2010       $10.043      $11.366       794,035
                                                                    2011       $11.366      $11.413       670,286
                                                                    2012       $11.413      $13.019       525,991
                                                                    2013       $13.019      $16.941       379,644
                                                                    2014       $16.941      $18.933       326,211
------------------------------------------------------------------------------------------------------------------
Fidelity VIP Investment Grade Bond Portfolio - Service Class 2
                                                                    2005       $10.215      $10.269       496,639
                                                                    2006       $10.269      $10.549       806,750
                                                                    2007       $10.549      $10.831       811,904
                                                                    2008       $10.831      $10.315       588,837
                                                                    2009       $10.315      $11.750       550,819
                                                                    2010       $11.750      $12.466       526,200
                                                                    2011       $12.466      $13.164       567,827
                                                                    2012       $13.164      $13.713       328,111
                                                                    2013       $13.713      $13.249       239,889
                                                                    2014       $13.249      $13.804       196,159
------------------------------------------------------------------------------------------------------------------
Fidelity VIP Money Market Portfolio - Service Class 2
                                                                    2005        $9.965      $10.104       913,007
                                                                    2006       $10.104      $10.429     1,383,659
                                                                    2007       $10.429      $10.797     1,358,656
                                                                    2008       $10.797      $10.946     1,573,766
                                                                    2009       $10.946      $10.850     1,408,990
                                                                    2010       $10.850      $10.711     1,056,049
                                                                    2011       $10.711      $10.568       995,591
                                                                    2012       $10.568      $10.426       767,257
                                                                    2013       $10.426      $10.286       618,987
                                                                    2014       $10.286      $10.148       472,894
------------------------------------------------------------------------------------------------------------------
Fidelity VIP Overseas Portfolio - Service Class 2
                                                                    2005       $10.931      $12.810       311,381
                                                                    2006       $12.810      $14.883       762,307
                                                                    2007       $14.883      $17.185       776,150
                                                                    2008       $17.185       $9.500       781,458
                                                                    2009        $9.500      $11.829       694,356
                                                                    2010       $11.829      $13.167       617,998
                                                                    2011       $13.167      $10.737       562,383
                                                                    2012       $10.737      $12.750       414,825
                                                                    2013       $12.750      $16.372       309,349
                                                                    2014       $16.372      $14.811       266,449
------------------------------------------------------------------------------------------------------------------
Guggenheim VIF Long Short Equity Fund
                                                                    2005       $10.599      $11.890        56,294
                                                                    2006       $11.890      $13.065        91,432
                                                                    2007       $13.065      $15.819        78,479
                                                                    2008       $15.819       $9.249        92,524
                                                                    2009        $9.249      $11.614        80,586
                                                                    2010       $11.614      $12.741        74,184
                                                                    2011       $12.741      $11.745        56,732
                                                                    2012       $11.745      $12.099        44,489
                                                                    2013       $12.099      $14.020        32,853
                                                                    2014       $14.020      $14.217        25,371
------------------------------------------------------------------------------------------------------------------
Invesco V.I. American Franchise Fund - Series II
                                                                    2012       $10.000       $9.785        16,939
                                                                    2013        $9.785      $13.494        13,297
                                                                    2014       $13.494      $14.400        11,516
</R>

                                      H-4
<R>
                                                                                             Number of
                                                                  Accumulation Accumulation    Units
                                                     For the Year  Unit Value   Unit Value  Outstanding
                                                        Ending    at Beginning    at End      at End
Sub-Accounts                                         December 31   of Period    of Period    of Period
-------------------------------------------------------------------------------------------------------
Invesco V.I. Capital Appreciation - Series II
                                                         2005       $10.303      $11.036       50,990
                                                         2006       $11.036      $11.547       61,199
                                                         2007       $11.547      $12.727       56,382
                                                         2008       $12.727       $7.203       52,348
                                                         2009        $7.203       $8.578       42,532
                                                         2010        $8.578       $9.749       34,260
                                                         2011        $9.749       $8.837       25,164
                                                         2012        $8.837      $10.148            0
-------------------------------------------------------------------------------------------------------
Invesco V.I. Core Equity Fund - Series II
                                                         2006       $10.000      $10.800      173,314
                                                         2007       $10.800      $11.493      185,437
                                                         2008       $11.493       $7.900      185,880
                                                         2009        $7.900       $9.974      159,397
                                                         2010        $9.974      $10.749      157,890
                                                         2011       $10.749      $10.573      133,055
                                                         2012       $10.573      $11.850      110,594
                                                         2013       $11.850      $15.073       82,642
                                                         2014       $15.073      $16.036       61,238
-------------------------------------------------------------------------------------------------------
Invesco V.I. Government Securities Fund - Series II
                                                         2011       $10.000      $12.215      114,080
                                                         2012       $12.215      $12.317       80,890
                                                         2013       $12.317      $11.804       54,619
                                                         2014       $11.804      $12.096       45,371
-------------------------------------------------------------------------------------------------------
Invesco V.I. Growth and Income Fund - Series II
                                                         2005       $11.083      $11.996      493,860
                                                         2006       $11.996      $13.725      824,335
                                                         2007       $13.725      $13.881      783,069
                                                         2008       $13.881       $9.283      680,370
                                                         2009        $9.283      $11.365      614,322
                                                         2010       $11.365      $12.579      526,375
                                                         2011       $12.579      $12.129      417,385
                                                         2012       $12.129      $13.681      302,328
                                                         2013       $13.681      $18.054      207,226
                                                         2014       $18.054      $19.585      155,774
-------------------------------------------------------------------------------------------------------
Invesco V.I. Mid Cap Core Equity Fund - Series II
                                                         2005       $10.989      $11.629      253,522
                                                         2006       $11.629      $12.732      405,969
                                                         2007       $12.732      $13.725      387,292
                                                         2008       $13.725       $9.656      323,756
                                                         2009        $9.656      $12.370      277,636
                                                         2010       $12.370      $13.885      245,585
                                                         2011       $13.885      $12.807      221,182
                                                         2012       $12.807      $13.975      166,828
                                                         2013       $13.975      $17.710      121,224
                                                         2014       $17.710      $18.200       98,489
-------------------------------------------------------------------------------------------------------
Invesco V.I. Mid Cap Growth Fund - Series II
                                                         2005       $11.112      $12.180       47,131
                                                         2006       $12.180      $12.608       54,285
                                                         2007       $12.608      $14.626       48,758
                                                         2008       $14.626       $7.671       44,989
                                                         2009        $7.671      $11.833       35,133
                                                         2010       $11.833      $14.857       45,521
                                                         2011       $14.857      $13.285       26,213
                                                         2012       $13.285      $14.629       19,233
                                                         2013       $14.629      $19.714       16,890
                                                         2014       $19.714      $20.943       15,348
</R>

                                      H-5
<R>
                                                                                                            Number of
                                                                                 Accumulation Accumulation    Units
                                                                    For the Year  Unit Value   Unit Value  Outstanding
                                                                       Ending    at Beginning    at End      at End
Sub-Accounts                                                        December 31   of Period    of Period    of Period
----------------------------------------------------------------------------------------------------------------------
Invesco V.I. Value Opportunities Fund - Series II
                                                                        2005       $10.745      $11.176      223,522
                                                                        2006       $11.176      $12.452      287,925
                                                                        2007       $12.452      $12.451      280,725
                                                                        2008       $12.451       $5.907      303,579
                                                                        2009        $5.907       $8.610      262,919
                                                                        2010        $8.610       $9.083      213,414
                                                                        2011        $9.083       $8.657      168,059
                                                                        2012        $8.657      $10.047      118,174
                                                                        2013       $10.047      $13.209       86,832
                                                                        2014       $13.209      $13.863       72,668
----------------------------------------------------------------------------------------------------------------------
Invesco Van Kampen V.I. Government Fund - Series II
                                                                        2005       $10.187      $10.379      164,577
                                                                        2006       $10.379      $10.558      182,914
                                                                        2007       $10.558      $11.145      211,170
                                                                        2008       $11.145      $11.161      357,895
                                                                        2009       $11.161      $11.105      185,515
                                                                        2010       $11.105      $11.491      165,810
                                                                        2011       $11.491      $11.561            0
----------------------------------------------------------------------------------------------------------------------
Janus Aspen Overseas Portfolio - Service Shares
                                                                        2008       $10.000       $7.074      105,650
                                                                        2009        $7.074      $12.496      123,025
                                                                        2010       $12.496      $15.411      123,784
                                                                        2011       $15.411      $10.287       94,045
                                                                        2012       $10.287      $11.485       77,594
                                                                        2013       $11.485      $12.948       55,546
                                                                        2014       $12.948      $11.228       47,677
----------------------------------------------------------------------------------------------------------------------
Janus Aspen Perkins Mid Cap Value Portfolio - Service Shares
                                                                        2005       $11.303      $12.266      356,713
                                                                        2006       $12.266      $13.924      564,227
                                                                        2007       $13.924      $14.720      539,843
                                                                        2008       $14.720      $10.470      471,189
                                                                        2009       $10.470      $13.729      408,012
                                                                        2010       $13.729      $15.625      316,553
                                                                        2011       $15.625      $14.955      265,915
                                                                        2012       $14.955      $16.344      197,499
                                                                        2013       $16.344      $20.285      136,482
                                                                        2014       $20.285      $21.700      111,102
----------------------------------------------------------------------------------------------------------------------
Janus Aspen Perkins Small Company Value Portfolio - Service Shares
                                                                        2005       $10.000      $10.974       77,386
                                                                        2006       $10.974      $13.193      178,295
                                                                        2007       $13.193      $12.219      196,175
                                                                        2008       $12.219       $7.724      180,098
                                                                        2009        $7.724       $7.321            0
----------------------------------------------------------------------------------------------------------------------
Janus Aspen Series Balanced Portfolio - Service Shares
                                                                        2005       $10.625      $11.285      153,996
                                                                        2006       $11.285      $12.292      242,446
                                                                        2007       $12.292      $13.373      234,531
                                                                        2008       $13.373      $11.074      193,608
                                                                        2009       $11.074      $13.719      209,853
                                                                        2010       $13.719      $14.633      179,215
                                                                        2011       $14.633      $14.631      148,727
                                                                        2012       $14.631      $16.364      109,677
                                                                        2013       $16.364      $19.339       88,822
                                                                        2014       $19.339      $20.650       73,363
</R>

                                      H-6
<R>
                                                                                                         Number of
                                                                              Accumulation Accumulation    Units
                                                                 For the Year  Unit Value   Unit Value  Outstanding
                                                                    Ending    at Beginning    at End      at End
Sub-Accounts                                                     December 31   of Period    of Period    of Period
-------------------------------------------------------------------------------------------------------------------
Janus Aspen Series Foreign Stock Portfolio - Service Shares
                                                                     2005       $11.317      $11.861      115,107
                                                                     2006       $11.861      $13.814      165,929
                                                                     2007       $13.814      $16.114      179,041
                                                                     2008       $16.114      $15.166            0
-------------------------------------------------------------------------------------------------------------------
Janus Aspen Series Forty Portfolio - Service Shares
                                                                     2005       $11.491      $12.759       76,819
                                                                     2006       $12.759      $13.735      168,017
                                                                     2007       $13.735      $18.512      143,770
                                                                     2008       $18.512      $10.170      144,900
                                                                     2009       $10.170      $14.650      134,229
                                                                     2010       $14.650      $15.388      118,575
                                                                     2011       $15.388      $14.127      100,834
                                                                     2012       $14.127      $17.261       67,165
                                                                     2013       $17.261      $22.287       48,189
                                                                     2014       $22.287      $23.848       32,440
-------------------------------------------------------------------------------------------------------------------
Janus Aspen Series INTECH Risk-Managed Core Portfolio - Service
 Shares
                                                                     2005       $11.339      $12.407      125,616
                                                                     2006       $12.407      $13.558      164,908
                                                                     2007       $13.558      $14.194      134,550
                                                                     2008       $14.194       $8.928      125,288
                                                                     2009        $8.928      $10.793      103,124
                                                                     2010       $10.793      $11.587            0
-------------------------------------------------------------------------------------------------------------------
MFS VIT II High Yield - Service Class
                                                                     2013       $10.000      $16.079       64,391
                                                                     2014       $16.079      $16.264       51,344
-------------------------------------------------------------------------------------------------------------------
MFS(R) High Income Series - Service Class
                                                                     2005       $10.652      $10.724      209,209
                                                                     2006       $10.724      $11.637      238,258
                                                                     2007       $11.637      $11.655      216,819
                                                                     2008       $11.655       $8.202      178,367
                                                                     2009        $8.202      $11.751      144,690
                                                                     2010       $11.751      $13.261      136,106
                                                                     2011       $13.261      $13.587      113,107
                                                                     2012       $13.587      $15.337       80,632
                                                                     2013       $15.337      $15.563            0
-------------------------------------------------------------------------------------------------------------------
MFS(R) Investors Growth Stock Series - Service Class
                                                                     2005       $10.471      $10.767      229,340
                                                                     2006       $10.767      $11.398      467,604
                                                                     2007       $11.398      $12.483      434,299
                                                                     2008       $12.483       $7.760      408,811
                                                                     2009        $7.760      $10.648      318,596
                                                                     2010       $10.648      $11.781      265,360
                                                                     2011       $11.781      $11.666      228,670
                                                                     2012       $11.666      $13.428      156,807
                                                                     2013       $13.428      $17.227      103,739
                                                                     2014       $17.227      $18.884       82,937
-------------------------------------------------------------------------------------------------------------------
MFS(R) Investors Trust Series - Service Class
                                                                     2005       $10.810      $11.413       32,676
                                                                     2006       $11.413      $12.689       38,786
                                                                     2007       $12.689      $13.772       40,966
                                                                     2008       $13.772       $9.068       32,809
                                                                     2009        $9.068      $11.322       33,920
                                                                     2010       $11.322      $12.384       28,628
                                                                     2011       $12.384      $11.922       27,057
                                                                     2012       $11.922      $13.975       16,900
                                                                     2013       $13.975      $18.162        9,109
                                                                     2014       $18.162      $19.836        8,924
</R>

                                      H-7
<R>
                                                                                                       Number of
                                                                            Accumulation Accumulation    Units
                                                               For the Year  Unit Value   Unit Value  Outstanding
                                                                  Ending    at Beginning    at End      at End
Sub-Accounts                                                   December 31   of Period    of Period    of Period
-----------------------------------------------------------------------------------------------------------------
MFS(R) New Discovery Series - Service Class
                                                                   2005        $9.945      $10.304       92,908
                                                                   2006       $10.304      $11.480      113,307
                                                                   2007       $11.480      $11.579      100,633
                                                                   2008       $11.579       $6.908       87,061
                                                                   2009        $6.908      $11.103       91,123
                                                                   2010       $11.103      $14.890      131,452
                                                                   2011       $14.890      $13.148       57,960
                                                                   2012       $13.148      $15.681       41,545
                                                                   2013       $15.681      $21.845       28,411
                                                                   2014       $21.845      $19.935       22,594
-----------------------------------------------------------------------------------------------------------------
MFS(R) Total Return Series - Service Class
                                                                   2005       $10.783      $10.914      326,074
                                                                   2006       $10.914      $12.019      375,040
                                                                   2007       $12.019      $12.323      335,392
                                                                   2008       $12.323       $9.443      283,876
                                                                   2009        $9.443      $10.966      279,887
                                                                   2010       $10.966      $11.860      248,952
                                                                   2011       $11.860      $11.886      198,071
                                                                   2012       $11.886      $13.007      127,302
                                                                   2013       $13.007      $15.236      104,395
                                                                   2014       $15.236      $16.269       66,440
-----------------------------------------------------------------------------------------------------------------
MFS(R) Value Series - Service Class
                                                                   2005       $11.175      $11.737      129,930
                                                                   2006       $11.737      $13.954      194,233
                                                                   2007       $13.954      $14.810      188,327
                                                                   2008       $14.810       $9.826      163,225
                                                                   2009        $9.826      $11.869      120,920
                                                                   2010       $11.869      $13.023       95,563
                                                                   2011       $13.023      $12.787       91,183
                                                                   2012       $12.787      $14.618       46,801
                                                                   2013       $14.618      $19.554       32,771
                                                                   2014       $19.554      $21.258       26,177
-----------------------------------------------------------------------------------------------------------------
Oppenheimer Discovery Mid Cap Growth Fund/VA - Service Shares
                                                                   2005       $10.000      $11.723       26,917
                                                                   2006       $11.723      $11.877       87,641
                                                                   2007       $11.877      $12.423       90,045
                                                                   2008       $12.423       $6.224       86,645
                                                                   2009        $6.224       $8.121       82,002
                                                                   2010        $8.121      $10.188       73,066
                                                                   2011       $10.188      $10.134       64,612
                                                                   2012       $10.134      $11.613       51,998
                                                                   2013       $11.613      $15.538       41,735
                                                                   2014       $15.538      $16.175       28,501
-----------------------------------------------------------------------------------------------------------------
Oppenheimer Global Fund/VA - Service Shares
                                                                   2005       $11.390      $12.817      340,222
                                                                   2006       $12.817      $14.840      463,678
                                                                   2007       $14.840      $15.529      425,468
                                                                   2008       $15.529       $9.141      339,967
                                                                   2009        $9.141      $12.566      318,882
                                                                   2010       $12.566      $14.343      214,515
                                                                   2011       $14.343      $12.943      179,849
                                                                   2012       $12.943      $15.443      146,194
                                                                   2013       $15.443      $19.347      109,747
                                                                   2014       $19.347      $19.478       89,230
</R>

                                      H-8
<R>
                                                                                                            Number of
                                                                                 Accumulation Accumulation    Units
                                                                    For the Year  Unit Value   Unit Value  Outstanding
                                                                       Ending    at Beginning    at End      at End
Sub-Accounts                                                        December 31   of Period    of Period    of Period
----------------------------------------------------------------------------------------------------------------------
Oppenheimer Main Street Small Cap Fund/VA - Service Shares
                                                                        2005       $11.324      $12.256       457,975
                                                                        2006       $12.256      $13.864       760,414
                                                                        2007       $13.864      $13.485       690,006
                                                                        2008       $13.485       $8.247       595,786
                                                                        2009        $8.247      $11.137       488,782
                                                                        2010       $11.137      $13.520       394,097
                                                                        2011       $13.520      $13.020       328,526
                                                                        2012       $13.020      $15.113       241,866
                                                                        2013       $15.113      $20.965       166,716
                                                                        2014       $20.965      $23.093       143,307
----------------------------------------------------------------------------------------------------------------------
PIMCO Foreign Bond Portfolio (U.S. Dollar-Hedged) - Administrative
 Shares
                                                                        2005       $10.382      $10.769       276,055
                                                                        2006       $10.769      $10.857       508,415
                                                                        2007       $10.857      $11.099       482,258
                                                                        2008       $11.099      $10.688       356,974
                                                                        2009       $10.688      $12.192       328,033
                                                                        2010       $12.192      $13.050       307,466
                                                                        2011       $13.050      $13.745       255,082
                                                                        2012       $13.745      $15.030       198,826
                                                                        2013       $15.030      $14.901       151,236
                                                                        2014       $14.901      $16.340       115,842
----------------------------------------------------------------------------------------------------------------------
PIMCO Money Market Portfolio - Administrative Shares
                                                                        2005        $9.959      $10.096       325,748
                                                                        2006       $10.096      $10.420       459,580
                                                                        2007       $10.420      $10.781       401,905
                                                                        2008       $10.781      $10.875       447,414
                                                                        2009       $10.875      $10.740       560,031
                                                                        2010       $10.740      $10.600       537,780
                                                                        2011       $10.600      $10.464       392,314
                                                                        2012       $10.464      $10.329       323,462
                                                                        2013       $10.329      $10.196       276,731
                                                                        2014       $10.196      $10.059       223,502
----------------------------------------------------------------------------------------------------------------------
PIMCO Real Return Portfolio - Administrative Shares
                                                                        2005       $10.596      $10.671       648,012
                                                                        2006       $10.671      $10.602       937,569
                                                                        2007       $10.602      $11.576       902,299
                                                                        2008       $11.576      $10.615       928,688
                                                                        2009       $10.615      $12.398       713,734
                                                                        2010       $12.398      $13.223       615,212
                                                                        2011       $13.223      $14.568       496,281
                                                                        2012       $14.568      $15.629       375,351
                                                                        2013       $15.629      $13.997       273,276
                                                                        2014       $13.997      $14.234       227,624
----------------------------------------------------------------------------------------------------------------------
PIMCO Total Return Portfolio - Administrative Shares
                                                                        2005       $10.283      $10.392       653,328
                                                                        2006       $10.392      $10.647     1,083,265
                                                                        2007       $10.647      $11.424     1,062,806
                                                                        2008       $11.424      $11.812       823,099
                                                                        2009       $11.812      $13.293       875,022
                                                                        2010       $13.293      $14.178       871,323
                                                                        2011       $14.178      $14.492       710,717
                                                                        2012       $14.492      $15.667       565,502
                                                                        2013       $15.667      $15.152       385,565
                                                                        2014       $15.152      $15.587       296,643
</R>

                                      H-9
<R>
                                                                                       Number of
                                                            Accumulation Accumulation    Units
                                               For the Year  Unit Value   Unit Value  Outstanding
                                                  Ending    at Beginning    at End      at End
Sub-Accounts                                   December 31   of Period    of Period    of Period
-------------------------------------------------------------------------------------------------
Premier VIT OpCap Balanced Portfolio
                                                   2005       $10.805      $10.951        61,072
                                                   2006       $10.951      $11.970        86,922
                                                   2007       $11.970      $11.284        76,705
                                                   2008       $11.284       $7.661        66,388
                                                   2009        $7.661       $7.391             0
-------------------------------------------------------------------------------------------------
Premier VIT OpCap Renaissance Portfolio
                                                   2005       $11.229      $10.576       203,935
                                                   2006       $10.576      $11.620       218,567
                                                   2007       $11.620      $12.187       170,119
                                                   2008       $12.187      $11.013             0
-------------------------------------------------------------------------------------------------
T. Rowe Price Blue Chip Growth Portfolio - II
                                                   2005       $10.490      $10.932       438,125
                                                   2006       $10.932      $11.791       846,349
                                                   2007       $11.791      $13.084       814,281
                                                   2008       $13.084       $7.402       830,392
                                                   2009        $7.402      $10.354       670,845
                                                   2010       $10.354      $11.848       550,687
                                                   2011       $11.848      $11.848       447,857
                                                   2012       $11.848      $13.780       419,459
                                                   2013       $13.780      $19.148       299,644
                                                   2014       $19.148      $20.559       163,215
-------------------------------------------------------------------------------------------------
T. Rowe Price Equity Income Portfolio - II
                                                   2005       $11.106      $11.361       948,390
                                                   2006       $11.361      $13.299     1,402,991
                                                   2007       $13.299      $13.516     1,333,577
                                                   2008       $13.516       $8.498     1,156,148
                                                   2009        $8.498      $10.500       989,299
                                                   2010       $10.500      $11.885       793,746
                                                   2011       $11.885      $11.605       637,701
                                                   2012       $11.605      $13.386       445,276
                                                   2013       $13.386      $17.088       356,536
                                                   2014       $17.088      $18.055       256,724
-------------------------------------------------------------------------------------------------
UIF Growth Portfolio, Class II
                                                   2005       $10.383      $11.829        58,864
                                                   2006       $11.829      $12.114        88,585
                                                   2007       $12.114      $14.539        86,678
                                                   2008       $14.539       $7.265        87,977
                                                   2009        $7.265      $11.835        73,057
                                                   2010       $11.835      $14.316        71,085
                                                   2011       $14.316      $13.693        54,754
                                                   2012       $13.693      $15.406        33,571
                                                   2013       $15.406      $22.452        27,571
                                                   2014       $22.452      $23.497        56,127
-------------------------------------------------------------------------------------------------
UIF U.S. Real Estate Portfolio, Class II
                                                   2005       $12.853      $14.804       448,864
                                                   2006       $14.804      $20.106       695,926
                                                   2007       $20.106      $16.407       515,759
                                                   2008       $16.407      $10.026       445,861
                                                   2009       $10.026      $12.709       374,792
                                                   2010       $12.709      $16.239       303,954
                                                   2011       $16.239      $16.927       247,891
                                                   2012       $16.927      $19.307       189,555
                                                   2013       $19.307      $19.380       156,289
                                                   2014       $19.380      $24.744       122,056
</R>

                                     H-10
<R>
                                                                                                            Number of
                                                                                 Accumulation Accumulation    Units
                                                                    For the Year  Unit Value   Unit Value  Outstanding
                                                                       Ending    at Beginning    at End      at End
Sub-Accounts                                                        December 31   of Period    of Period    of Period
----------------------------------------------------------------------------------------------------------------------
Van Eck VIP Emerging Markets Fund - Initial Class
                                                                        2005       $12.106      $15.764       76,101
                                                                        2006       $15.764      $21.694      140,010
                                                                        2007       $21.694      $29.449      151,951
                                                                        2008       $29.449      $10.231       88,994
                                                                        2009       $10.231      $21.517      153,256
                                                                        2010       $21.517      $26.924      141,498
                                                                        2011       $26.924      $19.725       66,474
                                                                        2012       $19.725      $25.258       48,444
                                                                        2013       $25.258      $27.912       35,404
                                                                        2014       $27.912      $27.421       29,680
----------------------------------------------------------------------------------------------------------------------
Van Eck VIP Global Hard Assets Fund - Initial Class
                                                                        2005       $12.455      $18.637       98,493
                                                                        2006       $18.637      $22.889      151,158
                                                                        2007       $22.889      $32.819      197,678
                                                                        2008       $32.819      $17.442       80,392
                                                                        2009       $17.442      $27.106      126,577
                                                                        2010       $27.106      $34.558       69,632
                                                                        2011       $34.558      $28.484       56,911
                                                                        2012       $28.484      $29.050       40,084
                                                                        2013       $29.050      $31.677       30,113
                                                                        2014       $31.677      $25.279       25,664
----------------------------------------------------------------------------------------------------------------------
Van Eck VIP Multi-Manager Alternative - Initial Class
                                                                        2005        $9.917       $9.804       58,131
                                                                        2006        $9.804      $10.509       63,097
                                                                        2007       $10.509      $10.787       68,791
                                                                        2008       $10.787       $9.247      106,076
                                                                        2009        $9.247      $10.387      101,362
                                                                        2010       $10.387      $10.757       99,575
                                                                        2011       $10.757      $10.371       72,358
                                                                        2012       $10.371      $10.367       38,505
                                                                        2013       $10.367      $10.743       27,201
                                                                        2014       $10.743      $10.485       21,796
----------------------------------------------------------------------------------------------------------------------
Western Asset Variable Global High Yield Bond Portfolio - Class II
                                                                        2005       $10.871      $11.105      465,661
                                                                        2006       $11.105      $12.089      703,308
                                                                        2007       $12.089      $11.885      698,823
                                                                        2008       $11.885       $8.104      589,498
                                                                        2009        $8.104      $12.379      454,032
                                                                        2010       $12.379      $14.007      377,768
                                                                        2011       $14.007      $13.994      305,012
                                                                        2012       $13.994      $16.299      243,475
                                                                        2013       $16.299      $17.053      169,399
                                                                        2014       $17.053      $16.569      150,676
</R>

<R>
 *  The Accumulation Unit Values in this table reflect a mortality and expense
    risk charge of 1.25% and an administrative expense charge of 0.10%.
</R>

                                     H-11
<R>
    CONSULTANT SOLUTIONS VARIABLE ANNUITIES: LBL Consultant Solution Classic
                                  Contracts -
                                   PROSPECTUS

    ACCUMULATION UNIT VALUE AND NUMBER OF ACCUMULATION UNITS OUTSTANDING FOR
                           EACH VARIABLE SUB-ACCOUNT*

                                      High

                           Mortality & Expense = 2.15
</R>

<R>
                                                                                                            Number of
                                                                                 Accumulation Accumulation    Units
                                                                    For the Year  Unit Value   Unit Value  Outstanding
                                                                       Ending    at Beginning    at End      at End
Sub-Accounts                                                        December 31   of Period    of Period    of Period
----------------------------------------------------------------------------------------------------------------------
Alger Capital Appreciation Portfolio - Class S
                                                                        2005       $10.134      $11.309           0
                                                                        2006       $11.309      $13.152           0
                                                                        2007       $13.152      $17.121           0
                                                                        2008       $17.121       $9.160           0
                                                                        2009        $9.160      $13.493           0
                                                                        2010       $13.493      $14.987           0
                                                                        2011       $14.987      $14.558           0
                                                                        2012       $14.558      $16.776           0
                                                                        2013       $16.776      $22.104           0
                                                                        2014       $22.104      $24.512           0
----------------------------------------------------------------------------------------------------------------------
Alger Large Cap Growth Portfolio - Class S
                                                                        2005       $10.019      $10.942           0
                                                                        2006       $10.942      $11.220           0
                                                                        2007       $11.220      $13.120           0
                                                                        2008       $13.120       $6.887           0
                                                                        2009        $6.887       $9.913           0
                                                                        2010        $9.913      $10.941           0
                                                                        2011       $10.941      $10.614           0
                                                                        2012       $10.614      $11.347           0
                                                                        2013       $11.347      $14.927           0
                                                                        2014       $14.927      $16.132           0
----------------------------------------------------------------------------------------------------------------------
Alger Mid Cap Growth Portfolio - Class S
                                                                        2005       $10.539      $11.286           0
                                                                        2006       $11.286      $12.123           0
                                                                        2007       $12.123      $15.555           0
                                                                        2008       $15.555       $6.314      18,946
                                                                        2009        $6.314       $9.339      18,946
                                                                        2010        $9.339      $10.853           0
                                                                        2011       $10.853       $9.697           0
                                                                        2012        $9.697      $10.966           0
                                                                        2013       $10.966      $14.515           0
                                                                        2014       $14.515      $15.264           0
----------------------------------------------------------------------------------------------------------------------
ClearBridge Variable Fundamental All Cap Value Portfolio - Class I
                                                                        2007       $10.000       $9.450           0
                                                                        2008        $9.450       $5.858       2,596
                                                                        2009        $5.858       $7.407       2,582
                                                                        2010        $7.407       $8.443       2,570
                                                                        2011        $8.443       $7.742           0
                                                                        2012        $7.742       $8.701           0
                                                                        2013        $8.701      $11.241           0
                                                                        2014       $11.241      $12.015           0
</R>

                                     H-12
<R>
                                                                                                  Number of
                                                                       Accumulation Accumulation    Units
                                                          For the Year  Unit Value   Unit Value  Outstanding
                                                             Ending    at Beginning    at End      at End
Sub-Accounts                                              December 31   of Period    of Period    of Period
------------------------------------------------------------------------------------------------------------
ClearBridge Variable Large Cap Value Portfolio - Class I
                                                              2007       $10.000       $9.688           0
                                                              2008        $9.688       $6.096           0
                                                              2009        $6.096       $7.419           0
                                                              2010        $7.419       $7.939           0
                                                              2011        $7.939       $8.145           0
                                                              2012        $8.145       $9.275           0
                                                              2013        $9.275      $12.001           0
                                                              2014       $12.001      $13.105           0
------------------------------------------------------------------------------------------------------------
Fidelity VIP Asset Manager Portfolio - Service Class 2
                                                              2005       $10.132      $10.279           0
                                                              2006       $10.279      $10.765           0
                                                              2007       $10.765      $12.119           0
                                                              2008       $12.119       $8.421         109
                                                              2009        $8.421      $10.600         109
                                                              2010       $10.600      $11.808         108
                                                              2011       $11.808      $11.218         109
                                                              2012       $11.218      $12.307         113
                                                              2013       $12.307      $13.875         123
                                                              2014       $13.875      $14.314         124
------------------------------------------------------------------------------------------------------------
Fidelity VIP Contrafund(R) Portfolio - Service Class 2
                                                              2005       $11.295      $12.880         303
                                                              2006       $12.880      $14.030         292
                                                              2007       $14.030      $16.085         280
                                                              2008       $16.085       $9.010       1,763
                                                              2009        $9.010      $11.932       1,704
                                                              2010       $11.932      $13.638       1,549
                                                              2011       $13.638      $12.960       1,428
                                                              2012       $12.960      $14.713       1,134
                                                              2013       $14.713      $18.833       1,057
                                                              2014       $18.833      $20.555         993
------------------------------------------------------------------------------------------------------------
Fidelity VIP Equity-Income Portfolio - Service Class 2
                                                              2005       $10.750      $11.095           0
                                                              2006       $11.095      $13.007           0
                                                              2007       $13.007      $12.875           0
                                                              2008       $12.875       $7.197       8,417
                                                              2009        $7.197       $9.137       8,329
                                                              2010        $9.137      $10.264       7,490
                                                              2011       $10.264      $10.099       5,648
                                                              2012       $10.099      $11.555       5,322
                                                              2013       $11.555      $14.438       4,931
                                                              2014       $14.438      $15.310       4,672
------------------------------------------------------------------------------------------------------------
Fidelity VIP Growth Portfolio - Service Class 2
                                                              2005        $9.727      $10.032           0
                                                              2006       $10.032      $10.452           0
                                                              2007       $10.452      $12.939           0
                                                              2008       $12.939       $6.664           0
                                                              2009        $6.664       $8.336           0
                                                              2010        $8.336      $10.092           0
                                                              2011       $10.092       $9.863           0
                                                              2012        $9.863      $11.029           0
                                                              2013       $11.029      $14.662           0
                                                              2014       $14.662      $15.910           0
</R>

                                     H-13
<R>
                                                                                                        Number of
                                                                             Accumulation Accumulation    Units
                                                                For the Year  Unit Value   Unit Value  Outstanding
                                                                   Ending    at Beginning    at End      at End
Sub-Accounts                                                    December 31   of Period    of Period    of Period
------------------------------------------------------------------------------------------------------------------
Fidelity VIP Index 500 Portfolio - Service Class 2
                                                                    2005       $10.579      $10.813           0
                                                                    2006       $10.813      $12.202           0
                                                                    2007       $12.202      $12.544           0
                                                                    2008       $12.544       $7.705       1,127
                                                                    2009        $7.705       $9.513       1,113
                                                                    2010        $9.513      $10.669       1,102
                                                                    2011       $10.669      $10.615         136
                                                                    2012       $10.615      $11.998         130
                                                                    2013       $11.998      $15.470         105
                                                                    2014       $15.470      $17.132          97
------------------------------------------------------------------------------------------------------------------
Fidelity VIP Investment Grade Bond Portfolio - Service Class 2
                                                                    2005       $10.130      $10.091           0
                                                                    2006       $10.091      $10.272           0
                                                                    2007       $10.272      $10.450           0
                                                                    2008       $10.450       $9.861       2,057
                                                                    2009        $9.861      $11.131       2,068
                                                                    2010       $11.131      $11.702       1,842
                                                                    2011       $11.702      $12.244       1,833
                                                                    2012       $12.244      $12.638         246
                                                                    2013       $12.638      $12.098         268
                                                                    2014       $12.098      $12.491         268
------------------------------------------------------------------------------------------------------------------
Fidelity VIP Money Market Portfolio - Service Class 2
                                                                    2005        $9.882       $9.929           0
                                                                    2006        $9.929      $10.155           0
                                                                    2007       $10.155      $10.417           0
                                                                    2008       $10.417      $10.465       3,763
                                                                    2009       $10.465      $10.278       4,430
                                                                    2010       $10.278      $10.054       4,467
                                                                    2011       $10.054       $9.829       2,972
                                                                    2012        $9.829       $9.608       3,233
                                                                    2013        $9.608       $9.393       3,670
                                                                    2014        $9.393       $9.183       3,799
------------------------------------------------------------------------------------------------------------------
Fidelity VIP Overseas Portfolio - Service Class 2
                                                                    2005       $10.840      $12.588           0
                                                                    2006       $12.588      $14.492           0
                                                                    2007       $14.492      $16.580           0
                                                                    2008       $16.580       $9.082       1,097
                                                                    2009        $9.082      $11.205       1,129
                                                                    2010       $11.205      $12.359       1,004
                                                                    2011       $12.359       $9.986       1,039
                                                                    2012        $9.986      $11.750         946
                                                                    2013       $11.750      $14.951         854
                                                                    2014       $14.951      $13.402         956
------------------------------------------------------------------------------------------------------------------
Guggenheim VIF Long Short Equity Fund
                                                                    2005       $10.511      $11.684           0
                                                                    2006       $11.684      $12.722           0
                                                                    2007       $12.722      $15.263           0
                                                                    2008       $15.263       $8.841         804
                                                                    2009        $8.841      $11.001         799
                                                                    2010       $11.001      $11.959         796
                                                                    2011       $11.959      $10.924           0
                                                                    2012       $10.924      $11.150           0
                                                                    2013       $11.150      $12.803           0
                                                                    2014       $12.803      $12.864           0
</R>

                                     H-14
<R>
                                                                                             Number of
                                                                  Accumulation Accumulation    Units
                                                     For the Year  Unit Value   Unit Value  Outstanding
                                                        Ending    at Beginning    at End      at End
Sub-Accounts                                         December 31   of Period    of Period    of Period
-------------------------------------------------------------------------------------------------------
Invesco V.I. American Franchise Fund - Series II
                                                         2012       $10.000       $9.018           0
                                                         2013        $9.018      $12.323           0
                                                         2014       $12.323      $13.029           0
-------------------------------------------------------------------------------------------------------
Invesco V.I. Capital Appreciation - Series II
                                                         2005       $10.217      $10.845           0
                                                         2006       $10.845      $11.244           0
                                                         2007       $11.244      $12.279           0
                                                         2008       $12.279       $6.886           0
                                                         2009        $6.886       $8.126           0
                                                         2010        $8.126       $9.151           0
                                                         2011        $9.151       $8.219           0
                                                         2012        $8.219       $9.410           0
-------------------------------------------------------------------------------------------------------
Invesco V.I. Core Equity Fund - Series II
                                                         2006       $10.000      $10.734           0
                                                         2007       $10.734      $11.317           0
                                                         2008       $11.317       $7.708           0
                                                         2009        $7.708       $9.643           0
                                                         2010        $9.643      $10.298           0
                                                         2011       $10.298      $10.037           0
                                                         2012       $10.037      $11.147           0
                                                         2013       $11.147      $14.049           0
                                                         2014       $14.049      $14.810           0
-------------------------------------------------------------------------------------------------------
Invesco V.I. Government Securities Fund - Series II
                                                         2011       $10.000      $11.361         267
                                                         2012       $11.361      $11.351         267
                                                         2013       $11.351      $10.779         267
                                                         2014       $10.779      $10.945         267
-------------------------------------------------------------------------------------------------------
Invesco V.I. Growth and Income Fund - Series II
                                                         2005       $10.991      $11.789           0
                                                         2006       $11.789      $13.365           0
                                                         2007       $13.365      $13.392           0
                                                         2008       $13.392       $8.874       6,338
                                                         2009        $8.874      $10.766       6,552
                                                         2010       $10.766      $11.807       5,971
                                                         2011       $11.807      $11.281       5,332
                                                         2012       $11.281      $12.608       5,132
                                                         2013       $12.608      $16.486       4,569
                                                         2014       $16.486      $17.721       4,279
-------------------------------------------------------------------------------------------------------
Invesco V.I. Mid Cap Core Equity Fund - Series II
                                                         2005       $10.897      $11.427           0
                                                         2006       $11.427      $12.398           0
                                                         2007       $12.398      $13.242           0
                                                         2008       $13.242       $9.231       1,270
                                                         2009        $9.231      $11.718       1,268
                                                         2010       $11.718      $13.032       1,264
                                                         2011       $13.032      $11.911         350
                                                         2012       $11.911      $12.879         357
                                                         2013       $12.879      $16.173         352
                                                         2014       $16.173      $16.468         356
</R>

                                     H-15
<R>
                                                                                                            Number of
                                                                                 Accumulation Accumulation    Units
                                                                    For the Year  Unit Value   Unit Value  Outstanding
                                                                       Ending    at Beginning    at End      at End
Sub-Accounts                                                        December 31   of Period    of Period    of Period
----------------------------------------------------------------------------------------------------------------------
Invesco V.I. Mid Cap Growth Fund - Series II
                                                                        2005       $11.019      $11.969           0
                                                                        2006       $11.969      $12.277           0
                                                                        2007       $12.277      $14.111           0
                                                                        2008       $14.111       $7.333           0
                                                                        2009        $7.333      $11.209           0
                                                                        2010       $11.209      $13.945           0
                                                                        2011       $13.945      $12.356           0
                                                                        2012       $12.356      $13.481           0
                                                                        2013       $13.481      $18.002           0
                                                                        2014       $18.002      $18.950           0
----------------------------------------------------------------------------------------------------------------------
Invesco V.I. Value Opportunities Fund - Series II
                                                                        2005       $10.656      $10.982           0
                                                                        2006       $10.982      $12.125           0
                                                                        2007       $12.125      $12.013           0
                                                                        2008       $12.013       $5.647       1,098
                                                                        2009        $5.647       $8.155       1,086
                                                                        2010        $8.155       $8.526       1,087
                                                                        2011        $8.526       $8.051          80
                                                                        2012        $8.051       $9.259          75
                                                                        2013        $9.259      $12.062          73
                                                                        2014       $12.062      $12.544          72
----------------------------------------------------------------------------------------------------------------------
Invesco Van Kampen V.I. Government Fund - Series II
                                                                        2005       $10.103      $10.200           0
                                                                        2006       $10.200      $10.281           0
                                                                        2007       $10.281      $10.753           0
                                                                        2008       $10.753      $10.670         267
                                                                        2009       $10.670      $10.520         267
                                                                        2010       $10.520      $10.786         267
                                                                        2011       $10.786      $10.819           0
----------------------------------------------------------------------------------------------------------------------
Janus Aspen Overseas Portfolio - Service Shares
                                                                        2008       $10.000       $6.762           0
                                                                        2009        $6.762      $11.837           0
                                                                        2010       $11.837      $14.465           0
                                                                        2011       $14.465       $9.568           0
                                                                        2012        $9.568      $10.584           0
                                                                        2013       $10.584      $11.824           0
                                                                        2014       $11.824      $10.159           0
----------------------------------------------------------------------------------------------------------------------
Janus Aspen Perkins Mid Cap Value Portfolio - Service Shares
                                                                        2005       $11.209      $12.053         577
                                                                        2006       $12.053      $13.558         565
                                                                        2007       $13.558      $14.202         531
                                                                        2008       $14.202      $10.009         547
                                                                        2009       $10.009      $13.005         521
                                                                        2010       $13.005      $14.666         506
                                                                        2011       $14.666      $13.909         509
                                                                        2012       $13.909      $15.063         259
                                                                        2013       $15.063      $18.524         223
                                                                        2014       $18.524      $19.635         228
----------------------------------------------------------------------------------------------------------------------
Janus Aspen Perkins Small Company Value Portfolio - Service Shares
                                                                        2005       $10.000      $10.906           0
                                                                        2006       $10.906      $12.993           0
                                                                        2007       $12.993      $11.923           0
                                                                        2008       $11.923       $7.468           0
                                                                        2009        $7.468       $7.057           0
</R>

                                     H-16
<R>
                                                                                                         Number of
                                                                              Accumulation Accumulation    Units
                                                                 For the Year  Unit Value   Unit Value  Outstanding
                                                                    Ending    at Beginning    at End      at End
Sub-Accounts                                                     December 31   of Period    of Period    of Period
-------------------------------------------------------------------------------------------------------------------
Janus Aspen Series Balanced Portfolio - Service Shares
                                                                     2005       $10.537      $11.089           0
                                                                     2006       $11.089      $11.970           0
                                                                     2007       $11.970      $12.902           0
                                                                     2008       $12.902      $10.586           0
                                                                     2009       $10.586      $12.996           0
                                                                     2010       $12.996      $13.735           0
                                                                     2011       $13.735      $13.608           0
                                                                     2012       $13.608      $15.081           0
                                                                     2013       $15.081      $17.661           0
                                                                     2014       $17.661      $18.686           0
-------------------------------------------------------------------------------------------------------------------
Janus Aspen Series Foreign Stock Portfolio - Service Shares
                                                                     2005       $11.223      $11.655           0
                                                                     2006       $11.655      $13.452           0
                                                                     2007       $13.452      $15.547           0
                                                                     2008       $15.547      $14.589           0
-------------------------------------------------------------------------------------------------------------------
Janus Aspen Series Forty Portfolio - Service Shares
                                                                     2005       $11.395      $12.539           0
                                                                     2006       $12.539      $13.375           0
                                                                     2007       $13.375      $17.861           0
                                                                     2008       $17.861       $9.723           0
                                                                     2009        $9.723      $13.877           0
                                                                     2010       $13.877      $14.444           0
                                                                     2011       $14.444      $13.139           0
                                                                     2012       $13.139      $15.907           0
                                                                     2013       $15.907      $20.352           0
                                                                     2014       $20.352      $21.579           0
-------------------------------------------------------------------------------------------------------------------
Janus Aspen Series INTECH Risk-Managed Core Portfolio - Service
 Shares
                                                                     2005       $11.245      $12.192           0
                                                                     2006       $12.192      $13.202           0
                                                                     2007       $13.202      $13.695           0
                                                                     2008       $13.695       $8.535           0
                                                                     2009        $8.535      $10.224           0
                                                                     2010       $10.224      $10.943           0
-------------------------------------------------------------------------------------------------------------------
MFS VIT II High Yield - Service Class
                                                                     2013       $10.000      $14.683       2,048
                                                                     2014       $14.683      $14.717       2,064
-------------------------------------------------------------------------------------------------------------------
MFS(R) High Income Series - Service Class
                                                                     2005       $10.563      $10.538           0
                                                                     2006       $10.538      $11.331           0
                                                                     2007       $11.331      $11.245           0
                                                                     2008       $11.245       $7.842       3,928
                                                                     2009        $7.842      $11.132       3,672
                                                                     2010       $11.132      $12.448       3,380
                                                                     2011       $12.448      $12.637       1,952
                                                                     2012       $12.637      $14.135       1,882
                                                                     2013       $14.135      $14.261           0
-------------------------------------------------------------------------------------------------------------------
MFS(R) Investors Growth Stock Series - Service Class
                                                                     2005       $10.384      $10.580           0
                                                                     2006       $10.580      $11.098           0
                                                                     2007       $12.125      $12.013           0
                                                                     2008       $12.013       $7.419         155
                                                                     2009        $7.419      $10.087         132
                                                                     2010       $10.087      $11.058         129
                                                                     2011       $11.058      $10.850         133
                                                                     2012       $10.850      $12.375         126
                                                                     2013       $12.375      $15.732         103
                                                                     2014       $15.732      $17.087          97
</R>

                                     H-17
<R>
                                                                                                       Number of
                                                                            Accumulation Accumulation    Units
                                                               For the Year  Unit Value   Unit Value  Outstanding
                                                                  Ending    at Beginning    at End      at End
Sub-Accounts                                                   December 31   of Period    of Period    of Period
-----------------------------------------------------------------------------------------------------------------
MFS(R) Investors Trust Series - Service Class
                                                                   2005       $10.720      $11.215           0
                                                                   2006       $11.215      $12.355           0
                                                                   2007       $11.098      $12.043           0
                                                                   2008       $12.043       $8.669         923
                                                                   2009        $8.669      $10.725         918
                                                                   2010       $10.725      $11.624         914
                                                                   2011       $11.624      $11.088           0
                                                                   2012       $11.088      $12.879           0
                                                                   2013       $12.879      $16.585           0
                                                                   2014       $16.585      $17.949           0
-----------------------------------------------------------------------------------------------------------------
MFS(R) New Discovery Series - Service Class
                                                                   2005        $9.862      $10.126           0
                                                                   2006       $10.126      $11.178           0
                                                                   2007       $11.178      $11.171           0
                                                                   2008       $11.171       $6.604       1,098
                                                                   2009        $6.604      $10.518       1,092
                                                                   2010       $10.518      $13.976       1,087
                                                                   2011       $13.976      $12.229           0
                                                                   2012       $12.229      $14.451           0
                                                                   2013       $14.451      $19.948           0
                                                                   2014       $19.948      $18.038           0
-----------------------------------------------------------------------------------------------------------------
MFS(R) Total Return Series - Service Class
                                                                   2005       $10.694      $10.725         326
                                                                   2006       $10.725      $11.703         314
                                                                   2007       $11.703      $11.889         301
                                                                   2008       $11.889       $9.027       2,083
                                                                   2009        $9.027      $10.388       2,077
                                                                   2010       $10.388      $11.133       2,061
                                                                   2011       $11.133      $11.055       1,027
                                                                   2012       $11.055      $11.987         763
                                                                   2013       $11.987      $13.914         763
                                                                   2014       $13.914      $14.721         763
-----------------------------------------------------------------------------------------------------------------
MFS(R) Value Series - Service Class
                                                                   2005       $11.082      $11.534           0
                                                                   2006       $11.534      $13.587           0
                                                                   2007       $13.587      $14.288           0
                                                                   2008       $14.288       $9.393         858
                                                                   2009        $9.393      $11.244         854
                                                                   2010       $11.244      $12.224         850
                                                                   2011       $12.224      $11.893           0
                                                                   2012       $11.893      $13.472           0
                                                                   2013       $13.472      $17.856           0
                                                                   2014       $17.856      $19.235           0
-----------------------------------------------------------------------------------------------------------------
Oppenheimer Discovery Mid Cap Growth Fund/VA - Service Shares
                                                                   2005       $10.000      $11.651           0
                                                                   2006       $11.651      $11.697           0
                                                                   2007       $11.697      $12.123           0
                                                                   2008       $12.123       $6.018           0
                                                                   2009        $6.018       $7.780           0
                                                                   2010        $7.780       $9.671           0
                                                                   2011        $9.671       $9.533           0
                                                                   2012        $9.533      $10.824           0
                                                                   2013       $10.824      $14.350           0
                                                                   2014       $14.350      $14.802           0
</R>

                                     H-18
<R>
                                                                                                            Number of
                                                                                 Accumulation Accumulation    Units
                                                                    For the Year  Unit Value   Unit Value  Outstanding
                                                                       Ending    at Beginning    at End      at End
Sub-Accounts                                                        December 31   of Period    of Period    of Period
----------------------------------------------------------------------------------------------------------------------
Oppenheimer Global Fund/VA - Service Shares
                                                                        2005       $11.296      $12.595           0
                                                                        2006       $12.595      $14.450           0
                                                                        2007       $14.450      $14.982           0
                                                                        2008       $14.982       $8.738      18,728
                                                                        2009        $8.738      $11.903      18,643
                                                                        2010       $11.903      $13.463       1,017
                                                                        2011       $13.463      $12.038         961
                                                                        2012       $12.038      $14.232         885
                                                                        2013       $14.232      $17.667         819
                                                                        2014       $17.667      $17.624         826
----------------------------------------------------------------------------------------------------------------------
Oppenheimer Main Street Small Cap Fund/VA - Service Shares
                                                                        2005       $11.230      $12.044           0
                                                                        2006       $12.044      $13.500           0
                                                                        2007       $13.500      $13.011           0
                                                                        2008       $13.011       $7.884       2,247
                                                                        2009        $7.884      $10.549       2,138
                                                                        2010       $10.549      $12.690       1,809
                                                                        2011       $12.690      $12.109       1,696
                                                                        2012       $12.109      $13.928         850
                                                                        2013       $13.928      $19.145         713
                                                                        2014       $19.145      $20.895         657
----------------------------------------------------------------------------------------------------------------------
PIMCO Foreign Bond Portfolio (U.S. Dollar-Hedged) - Administrative
 Shares
                                                                        2005       $10.296      $10.583         511
                                                                        2006       $10.583      $10.572         574
                                                                        2007       $10.572      $10.708         546
                                                                        2008       $10.708      $10.218       4,709
                                                                        2009       $10.218      $11.549       4,792
                                                                        2010       $11.549      $12.249       4,688
                                                                        2011       $12.249      $12.784       3,110
                                                                        2012       $12.784      $13.851         806
                                                                        2013       $13.851      $13.608         862
                                                                        2014       $13.608      $14.786         850
----------------------------------------------------------------------------------------------------------------------
PIMCO Money Market Portfolio - Administrative Shares
                                                                        2005        $9.876       $9.922         602
                                                                        2006        $9.922      $10.147         635
                                                                        2007       $10.147      $10.401         596
                                                                        2008       $10.401      $10.396       3,790
                                                                        2009       $10.396      $10.174       3,856
                                                                        2010       $10.174       $9.950       3,891
                                                                        2011        $9.950       $9.732       1,674
                                                                        2012        $9.732       $9.519       1,607
                                                                        2013        $9.519       $9.310       1,650
                                                                        2014        $9.310       $9.102       1,723
----------------------------------------------------------------------------------------------------------------------
PIMCO Real Return Portfolio - Administrative Shares
                                                                        2005       $10.508      $10.487         495
                                                                        2006       $10.487      $10.324         477
                                                                        2007       $10.324      $11.168         458
                                                                        2008       $11.168      $10.148         918
                                                                        2009       $10.148      $11.745         923
                                                                        2010       $11.745      $12.412         908
                                                                        2011       $12.412      $13.550         872
                                                                        2012       $13.550      $14.404         473
                                                                        2013       $14.404      $12.782         510
                                                                        2014       $12.782      $12.880         518
</R>

                                     H-19
<R>
                                                                                              Number of
                                                                   Accumulation Accumulation    Units
                                                      For the Year  Unit Value   Unit Value  Outstanding
                                                         Ending    at Beginning    at End      at End
Sub-Accounts                                          December 31   of Period    of Period    of Period
--------------------------------------------------------------------------------------------------------
PIMCO Total Return Portfolio - Administrative Shares
                                                          2005       $10.197      $10.212           0
                                                          2006       $10.212      $10.368           0
                                                          2007       $10.368      $11.022           0
                                                          2008       $11.022      $11.293       6,237
                                                          2009       $11.293      $12.592       6,277
                                                          2010       $12.592      $13.308       5,926
                                                          2011       $13.308      $13.479       4,412
                                                          2012       $13.479      $14.439         529
                                                          2013       $14.439      $13.837         558
                                                          2014       $13.837      $14.104         564
--------------------------------------------------------------------------------------------------------
Premier VIT OpCap Balanced Portfolio
                                                          2005       $10.739      $10.785           0
                                                          2006       $10.785      $11.682           0
                                                          2007       $11.682      $10.911           0
                                                          2008       $10.911       $7.340           0
                                                          2009        $7.340       $7.061           0
--------------------------------------------------------------------------------------------------------
Premier VIT OpCap Renaissance Portfolio
                                                          2005       $11.136      $10.393           0
                                                          2006       $10.393      $11.315           0
                                                          2007       $11.315      $11.758           0
                                                          2008       $11.758      $10.620           0
--------------------------------------------------------------------------------------------------------
T. Rowe Price Blue Chip Growth Portfolio - II
                                                          2005       $10.403      $10.743         348
                                                          2006       $10.743      $11.481         335
                                                          2007       $11.481      $12.623         321
                                                          2008       $12.623       $7.076       2,407
                                                          2009        $7.076       $9.808       2,378
                                                          2010        $9.808      $11.121       2,128
                                                          2011       $11.121      $11.019       2,111
                                                          2012       $11.019      $12.700         231
                                                          2013       $12.700      $17.485         198
                                                          2014       $17.485      $18.603         189
--------------------------------------------------------------------------------------------------------
T. Rowe Price Equity Income Portfolio - II
                                                          2005       $11.014      $11.165         764
                                                          2006       $11.165      $12.949         737
                                                          2007       $12.949      $13.040         706
                                                          2008       $13.040       $8.124      18,755
                                                          2009        $8.124       $9.946      18,736
                                                          2010        $9.946      $11.156       2,148
                                                          2011       $11.156      $10.794       1,218
                                                          2012       $10.794      $12.336         802
                                                          2013       $12.336      $15.604         728
                                                          2014       $15.604      $16.337         735
--------------------------------------------------------------------------------------------------------
UIF Growth Portfolio, Class II
                                                          2005       $10.297      $11.624           0
                                                          2006       $11.624      $11.796           0
                                                          2007       $11.796      $14.027           0
                                                          2008       $14.027       $6.945         336
                                                          2009        $6.945      $11.211         331
                                                          2010       $11.211      $13.437         327
                                                          2011       $13.437      $12.736         324
                                                          2012       $12.736      $14.198         327
                                                          2013       $14.198      $20.502         322
                                                          2014       $20.502      $21.262         320
</R>

                                     H-20
<R>
Number of
Accumulation Accumulation Units
For the Year Unit Value Unit Value Outstanding
Ending at Beginning at End at End
Sub-Accounts December 31 of Period of Period of Period
----------------------------------------------------------------------------------------------------------------------
UIF U.S. Real Estate Portfolio, Class II
2005 $12.746 $14.547 654
2006 $14.547 $19.578 582
2007 $19.578 $15.830 630
2008 $15.830 $9.584 29,447
2009 $9.584 $12.038 29,312
2010 $12.038 $15.242 4,699
2011 $15.242 $15.744 3,609
2012 $15.744 $17.793 1,615
2013 $17.793 $17.697 1,815
2014 $17.697 $22.389 1,463
----------------------------------------------------------------------------------------------------------------------
Van Eck VIP Emerging Markets Fund - Initial Class
2005 $12.005 $15.491 135
2006 $15.491 $21.124 130
2007 $21.124 $28.413 124
2008 $28.413 $9.781 119
2009 $9.781 $20.382 119
2010 $20.382 $25.272 114
2011 $25.272 $18.346 109
2012 $18.346 $23.277 0
2013 $23.277 $25.489 0
2014 $25.489 $24.812 0
----------------------------------------------------------------------------------------------------------------------
Van Eck VIP Global Hard Assets Fund - Initial Class
2005 $12.352 $18.314 0
2006 $18.314 $22.288 0
2007 $22.288 $31.665 0
2008 $31.665 $16.674 818
2009 $16.674 $25.677 789
2010 $25.677 $32.438 756
2011 $32.438 $26.492 641
2012 $26.492 $26.772 950
2013 $26.772 $28.926 65
2014 $28.926 $22.873 63
----------------------------------------------------------------------------------------------------------------------
Van Eck VIP Multi-Manager Alternative - Initial Class
2005 $9.835 $9.634 0
2006 $9.634 $10.233 0
2007 $10.233 $10.407 0
2008 $10.407 $8.840 1,179
2009 $8.840 $9.840 1,172
2010 $9.840 $10.097 1,167
2011 $10.097 $9.646 0
2012 $9.646 $9.554 0
2013 $9.554 $9.811 0
2014 $9.811 $9.488 0
----------------------------------------------------------------------------------------------------------------------
Western Asset Variable Global High Yield Bond Portfolio - Class II
2005 $10.781 $10.912 322
2006 $10.912 $11.771 310
2007 $11.771 $11.467 298
2008 $11.467 $7.747 1,488
2009 $7.747 $11.727 1,421
2010 $11.727 $13.147 1,283
2011 $13.147 $13.016 1,276
2012 $13.016 $15.022 207
2013 $15.022 $15.573 209
2014 $15.573 $14.993 223
</R>
<R>
* The Accumulation Unit Values in this table reflect a mortality and expense
risk charge of 2.15% and an administrative expense charge of 0.10%.
</R>
H-21
     CONSULTANT SOLUTIONS VARIABLE ANNUITIES: LBL Consultant Solution Elite
                                  Contracts -
                                   PROSPECTUS

<R>
   ACCUMULATION UNIT VALUE AND NUMBER OF ACCUMULATION UNITS OUTSTANDING FOR
                           EACH VARIABLE SUB-ACCOUNT*

                                      Low

                           Mortality & Expense = 1.6
</R>

<R>
                                                                                                            Number of
                                                                                 Accumulation Accumulation    Units
                                                                    For the Year  Unit Value   Unit Value  Outstanding
                                                                       Ending    at Beginning    at End      at End
Sub-Accounts                                                        December 31   of Period    of Period    of Period
----------------------------------------------------------------------------------------------------------------------
Alger Capital Appreciation Portfolio - Class S
                                                                        2005       $10.186      $11.431       5,217
                                                                        2006       $11.431      $13.368      10,380
                                                                        2007       $13.368      $17.501      11,158
                                                                        2008       $17.501       $9.416      23,230
                                                                        2009        $9.416      $13.948      13,955
                                                                        2010       $13.948      $15.579       5,543
                                                                        2011       $15.579      $15.219       4,559
                                                                        2012       $15.219      $17.636       3,457
                                                                        2013       $17.636      $23.368       2,983
                                                                        2014       $23.368      $26.059       1,401
----------------------------------------------------------------------------------------------------------------------
Alger Large Cap Growth Portfolio - Class S
                                                                        2005       $10.070      $11.059       4,438
                                                                        2006       $11.059      $11.405       4,747
                                                                        2007       $11.405      $13.411       3,856
                                                                        2008       $13.411       $7.079       4,663
                                                                        2009        $7.079      $10.247       4,047
                                                                        2010       $10.247      $11.373       2,041
                                                                        2011       $11.373      $11.095       1,764
                                                                        2012       $11.095      $11.929         793
                                                                        2013       $11.929      $15.780         674
                                                                        2014       $15.780      $17.150       1,654
----------------------------------------------------------------------------------------------------------------------
Alger Mid Cap Growth Portfolio - Class S
                                                                        2005       $10.593      $11.407      22,184
                                                                        2006       $11.407      $12.323      32,839
                                                                        2007       $12.323      $15.900      22,247
                                                                        2008       $15.900       $6.490      21,572
                                                                        2009        $6.490       $9.654      11,236
                                                                        2010        $9.654      $11.282       7,031
                                                                        2011       $11.282      $10.138       5,317
                                                                        2012       $10.138      $11.529       4,294
                                                                        2013       $11.529      $15.345       4,016
                                                                        2014       $15.345      $16.228       2,552
----------------------------------------------------------------------------------------------------------------------
ClearBridge Variable Fundamental All Cap Value Portfolio - Class I
                                                                        2007       $10.000       $9.486       4,256
                                                                        2008        $9.486       $5.914       1,123
                                                                        2009        $5.914       $7.520       1,578
                                                                        2010        $7.520       $8.619       1,081
                                                                        2011        $8.619       $7.948         320
                                                                        2012        $7.948       $8.983         320
                                                                        2013        $8.983      $11.671       1,327
                                                                        2014       $11.671      $12.539           0
</R>

                                     H-22
<R>
                                                                                                  Number of
                                                                       Accumulation Accumulation    Units
                                                          For the Year  Unit Value   Unit Value  Outstanding
                                                             Ending    at Beginning    at End      at End
Sub-Accounts                                              December 31   of Period    of Period    of Period
------------------------------------------------------------------------------------------------------------
ClearBridge Variable Large Cap Value Portfolio - Class I
                                                              2007       $10.000       $9.725      16,715
                                                              2008        $9.725       $6.154      14,358
                                                              2009        $6.154       $7.532      11,945
                                                              2010        $7.532       $8.104       3,027
                                                              2011        $8.104       $8.362       1,134
                                                              2012        $8.362       $9.576       3,170
                                                              2013        $9.576      $12.460         356
                                                              2014       $12.460      $13.682          89
------------------------------------------------------------------------------------------------------------
Fidelity VIP Asset Manager Portfolio - Service Class 2
                                                              2005       $10.184      $10.390      16,830
                                                              2006       $10.390      $10.942      20,152
                                                              2007       $10.942      $12.387      18,915
                                                              2008       $12.387       $8.657      20,457
                                                              2009        $8.657      $10.957      12,979
                                                              2010       $10.957      $12.275       7,846
                                                              2011       $12.275      $11.727       4,966
                                                              2012       $11.727      $12.937       1,499
                                                              2013       $12.937      $14.668       1,420
                                                              2014       $14.668      $15.217       1,295
------------------------------------------------------------------------------------------------------------
Fidelity VIP Contrafund(R) Portfolio - Service Class 2
                                                              2005       $11.353      $13.018      50,412
                                                              2006       $13.018      $14.260      98,161
                                                              2007       $14.260      $16.442      98,587
                                                              2008       $16.442       $9.262      69,273
                                                              2009        $9.262      $12.334      49,531
                                                              2010       $12.334      $14.177      23,726
                                                              2011       $14.177      $13.548      21,964
                                                              2012       $13.548      $15.467      13,387
                                                              2013       $15.467      $19.910      10,269
                                                              2014       $19.910      $21.853       7,943
------------------------------------------------------------------------------------------------------------
Fidelity VIP Equity-Income Portfolio - Service Class 2
                                                              2005       $10.805      $11.214      25,309
                                                              2006       $11.214      $13.221      52,728
                                                              2007       $13.221      $13.160      47,153
                                                              2008       $13.160       $7.398      28,570
                                                              2009        $7.398       $9.445      20,770
                                                              2010        $9.445      $10.670       8,880
                                                              2011       $10.670      $10.557       5,135
                                                              2012       $10.557      $12.147       6,612
                                                              2013       $12.147      $15.264       9,562
                                                              2014       $15.264      $16.277       6,728
------------------------------------------------------------------------------------------------------------
Fidelity VIP Growth Portfolio - Service Class 2
                                                              2005        $9.777      $10.140       6,853
                                                              2006       $10.140      $10.623       8,255
                                                              2007       $10.623      $13.226       7,221
                                                              2008       $13.226       $6.850       5,106
                                                              2009        $6.850       $8.617       3,946
                                                              2010        $8.617      $10.492       2,279
                                                              2011       $10.492      $10.310       6,878
                                                              2012       $10.310      $11.594         840
                                                              2013       $11.594      $15.500         796
                                                              2014       $15.500      $16.915         750
</R>

                                     H-23
<R>
                                                                                                        Number of
                                                                             Accumulation Accumulation    Units
                                                                For the Year  Unit Value   Unit Value  Outstanding
                                                                   Ending    at Beginning    at End      at End
Sub-Accounts                                                    December 31   of Period    of Period    of Period
------------------------------------------------------------------------------------------------------------------
Fidelity VIP Index 500 Portfolio - Service Class 2
                                                                    2005       $10.634      $10.930       38,047
                                                                    2006       $10.930      $12.403       65,217
                                                                    2007       $12.403      $12.823       59,035
                                                                    2008       $12.823       $7.921       48,787
                                                                    2009        $7.921       $9.834       31,067
                                                                    2010        $9.834      $11.091       25,140
                                                                    2011       $11.091      $11.097       17,231
                                                                    2012       $11.097      $12.613       16,671
                                                                    2013       $12.613      $16.355       13,008
                                                                    2014       $16.355      $18.213       10,144
------------------------------------------------------------------------------------------------------------------
Fidelity VIP Investment Grade Bond Portfolio - Service Class 2
                                                                    2005       $10.182      $10.199       49,266
                                                                    2006       $10.199      $10.441       73,225
                                                                    2007       $10.441      $10.682       66,985
                                                                    2008       $10.682      $10.137       32,315
                                                                    2009       $10.137      $11.506       24,417
                                                                    2010       $11.506      $12.164       23,917
                                                                    2011       $12.164      $12.799       15,817
                                                                    2012       $12.799      $13.286       10,933
                                                                    2013       $13.286      $12.790       10,989
                                                                    2014       $12.790      $13.279        9,449
------------------------------------------------------------------------------------------------------------------
Fidelity VIP Money Market Portfolio - Service Class 2
                                                                    2005        $9.933      $10.036       68,484
                                                                    2006       $10.036      $10.322      161,389
                                                                    2007       $10.322      $10.648      125,834
                                                                    2008       $10.648      $10.757      157,527
                                                                    2009       $10.757      $10.624       92,275
                                                                    2010       $10.624      $10.451       95,672
                                                                    2011       $10.451      $10.275       48,128
                                                                    2012       $10.275      $10.101       30,696
                                                                    2013       $10.101       $9.930       17,599
                                                                    2014        $9.930       $9.762       19,898
------------------------------------------------------------------------------------------------------------------
Fidelity VIP Overseas Portfolio - Service Class 2
                                                                    2005       $10.896      $12.723       16,347
                                                                    2006       $12.723      $14.730       67,797
                                                                    2007       $14.730      $16.948       84,726
                                                                    2008       $16.948       $9.336       62,637
                                                                    2009        $9.336      $11.583       48,389
                                                                    2010       $11.583      $12.847       18,960
                                                                    2011       $12.847      $10.439        9,501
                                                                    2012       $10.439      $12.352        8,360
                                                                    2013       $12.352      $15.806       12,069
                                                                    2014       $15.806      $14.248        8,840
------------------------------------------------------------------------------------------------------------------
Guggenheim VIF Long Short Equity Fund
                                                                    2005       $10.565      $11.810          295
                                                                    2006       $11.810      $12.931        8,282
                                                                    2007       $12.931      $15.601        6,921
                                                                    2008       $15.601       $9.088        5,207
                                                                    2009        $9.088      $11.372        5,103
                                                                    2010       $11.372      $12.432        3,286
                                                                    2011       $12.432      $11.419        1,218
                                                                    2012       $11.419      $11.722          723
                                                                    2013       $11.722      $13.535          387
                                                                    2014       $13.535      $13.676          414
</R>

                                     H-24
<R>
                                                                                             Number of
                                                                  Accumulation Accumulation    Units
                                                     For the Year  Unit Value   Unit Value  Outstanding
                                                        Ending    at Beginning    at End      at End
Sub-Accounts                                         December 31   of Period    of Period    of Period
-------------------------------------------------------------------------------------------------------
Invesco V.I. American Franchise Fund - Series II
                                                         2012       $10.000       $9.480         410
                                                         2013        $9.480      $13.027         530
                                                         2014       $13.027      $13.852         557
-------------------------------------------------------------------------------------------------------
Invesco V.I. Capital Appreciation - Series II
                                                         2005       $10.270      $10.962         648
                                                         2006       $10.962      $11.429       1,382
                                                         2007       $11.429      $12.551       1,120
                                                         2008       $12.551       $7.078         840
                                                         2009        $7.078       $8.400         647
                                                         2010        $8.400       $9.513         927
                                                         2011        $9.513       $8.592         384
                                                         2012        $8.592       $9.855           0
-------------------------------------------------------------------------------------------------------
Invesco V.I. Core Equity Fund - Series II
                                                         2006       $10.000      $10.774      15,396
                                                         2007       $10.774      $11.424      18,197
                                                         2008       $11.424       $7.825      13,767
                                                         2009        $7.825       $9.844      15,508
                                                         2010        $9.844      $10.572       7,904
                                                         2011       $10.572      $10.362       6,374
                                                         2012       $10.362      $11.572       4,343
                                                         2013       $11.572      $14.667       3,742
                                                         2014       $14.667      $15.549       3,638
-------------------------------------------------------------------------------------------------------
Invesco V.I. Government Securities Fund - Series II
                                                         2011       $10.000      $11.876         889
                                                         2012       $11.876      $11.933         888
                                                         2013       $11.933      $11.395         898
                                                         2014       $11.395      $11.636         802
-------------------------------------------------------------------------------------------------------
Invesco V.I. Growth and Income Fund - Series II
                                                         2005       $11.047      $11.915      42,450
                                                         2006       $11.915      $13.585      65,009
                                                         2007       $13.585      $13.689      61,062
                                                         2008       $13.689       $9.122      42,540
                                                         2009        $9.122      $11.129      24,464
                                                         2010       $11.129      $12.273      12,069
                                                         2011       $12.273      $11.792       6,451
                                                         2012       $11.792      $13.255       5,229
                                                         2013       $13.255      $17.429       4,397
                                                         2014       $17.429      $18.840       2,923
-------------------------------------------------------------------------------------------------------
Invesco V.I. Mid Cap Core Equity Fund - Series II
                                                         2005       $10.953      $11.550       9,987
                                                         2006       $11.550      $12.601      25,207
                                                         2007       $12.601      $13.536      25,250
                                                         2008       $13.536       $9.489      10,026
                                                         2009        $9.489      $12.113       7,481
                                                         2010       $12.113      $13.548       7,476
                                                         2011       $13.548      $12.452       3,890
                                                         2012       $12.452      $13.539       3,050
                                                         2013       $13.539      $17.097       7,749
                                                         2014       $17.097      $17.508       6,973
</R>

                                     H-25
<R>
                                                                                                            Number of
                                                                                 Accumulation Accumulation    Units
                                                                    For the Year  Unit Value   Unit Value  Outstanding
                                                                       Ending    at Beginning    at End      at End
Sub-Accounts                                                        December 31   of Period    of Period    of Period
----------------------------------------------------------------------------------------------------------------------
Invesco V.I. Mid Cap Growth Fund - Series II
                                                                        2005       $11.076      $12.098       1,444
                                                                        2006       $12.098      $12.478       1,436
                                                                        2007       $12.478      $14.424         713
                                                                        2008       $14.424       $7.538         715
                                                                        2009        $7.538      $11.587         659
                                                                        2010       $11.587      $14.496         750
                                                                        2011       $14.496      $12.917         617
                                                                        2012       $12.917      $14.173         478
                                                                        2013       $14.173      $19.031         420
                                                                        2014       $19.031      $20.147         373
----------------------------------------------------------------------------------------------------------------------
Invesco V.I. Value Opportunities Fund - Series II
                                                                        2005       $10.710      $11.100      26,910
                                                                        2006       $11.100      $12.324      26,039
                                                                        2007       $12.324      $12.279      15,073
                                                                        2008       $12.279       $5.805       4,867
                                                                        2009        $5.805       $8.431       2,549
                                                                        2010        $8.431       $8.863       1,587
                                                                        2011        $8.863       $8.417       1,390
                                                                        2012        $8.417       $9.734       1,353
                                                                        2013        $9.734      $12.752       1,319
                                                                        2014       $12.752      $13.336       1,305
----------------------------------------------------------------------------------------------------------------------
Invesco Van Kampen V.I. Government Fund - Series II
                                                                        2005       $10.155      $10.309       3,666
                                                                        2006       $10.309      $10.449       6,825
                                                                        2007       $10.449      $10.992       5,828
                                                                        2008       $10.992      $10.968       4,131
                                                                        2009       $10.968      $10.875       2,469
                                                                        2010       $10.875      $11.212       1,400
                                                                        2011       $11.212      $11.267           0
----------------------------------------------------------------------------------------------------------------------
Janus Aspen Overseas Portfolio - Service Shares
                                                                        2008       $10.000       $6.951       5,243
                                                                        2009        $6.951      $12.236       3,147
                                                                        2010       $12.236      $15.037       4,829
                                                                        2011       $15.037      $10.002         580
                                                                        2012       $10.002      $11.127         398
                                                                        2013       $11.127      $12.500         372
                                                                        2014       $12.500      $10.801         371
----------------------------------------------------------------------------------------------------------------------
Janus Aspen Perkins Mid Cap Value Portfolio - Service Shares
                                                                        2005       $11.266      $12.183      48,976
                                                                        2006       $12.183      $13.781      59,842
                                                                        2007       $13.781      $14.517      53,518
                                                                        2008       $14.517      $10.289      34,104
                                                                        2009       $10.289      $13.444      24,911
                                                                        2010       $13.444      $15.246      13,338
                                                                        2011       $15.246      $14.540       8,153
                                                                        2012       $14.540      $15.835       2,351
                                                                        2013       $15.835      $19.583       1,124
                                                                        2014       $19.583      $20.875         853
----------------------------------------------------------------------------------------------------------------------
Janus Aspen Perkins Small Company Value Portfolio - Service Shares
                                                                        2005       $10.000      $10.947      17,047
                                                                        2006       $10.947      $13.116      20,417
                                                                        2007       $13.116      $12.103      23,686
                                                                        2008       $12.103       $7.624      18,835
                                                                        2009        $7.624       $7.217           0
</R>

                                     H-26
<R>
                                                                                                     Number of
                                                                          Accumulation Accumulation    Units
                                                             For the Year  Unit Value   Unit Value  Outstanding
                                                                Ending    at Beginning    at End      at End
Sub-Accounts                                                 December 31   of Period    of Period    of Period
---------------------------------------------------------------------------------------------------------------
Janus Aspen Series Balanced Portfolio - Service Shares
                                                                 2005       $10.591      $11.209      24,673
                                                                 2006       $11.209      $12.166      20,866
                                                                 2007       $12.166      $13.188      19,377
                                                                 2008       $13.188      $10.882      23,268
                                                                 2009       $10.882      $13.434      15,495
                                                                 2010       $13.434      $14.278      12,291
                                                                 2011       $14.278      $14.226      10,648
                                                                 2012       $14.226      $15.854       6,237
                                                                 2013       $15.854      $18.670       5,750
                                                                 2014       $18.670      $19.865       5,459
---------------------------------------------------------------------------------------------------------------
Janus Aspen Series Foreign Stock Portfolio - Service Shares
                                                                 2005       $11.280      $11.781       1,583
                                                                 2006       $11.781      $13.672       5,830
                                                                 2007       $13.672      $15.892       7,627
                                                                 2008       $15.892      $14.940           0
---------------------------------------------------------------------------------------------------------------
Janus Aspen Series Forty Portfolio - Service Shares
                                                                 2005       $11.454      $12.673       5,639
                                                                 2006       $12.673      $13.594      14,144
                                                                 2007       $13.594      $18.257      18,465
                                                                 2008       $18.257       $9.994      10,342
                                                                 2009        $9.994      $14.345      10,515
                                                                 2010       $14.345      $15.015       3,195
                                                                 2011       $15.015      $13.736       2,150
                                                                 2012       $13.736      $16.723       1,689
                                                                 2013       $16.723      $21.516       1,355
                                                                 2014       $21.516      $22.941       1,181
---------------------------------------------------------------------------------------------------------------
Janus Aspen Series INTECH Risk-Managed Core Portfolio -
 Service Shares
                                                                 2005       $11.302      $12.323      16,649
                                                                 2006       $12.323      $13.419      21,808
                                                                 2007       $13.419      $13.998      20,140
                                                                 2008       $13.998       $8.773      14,493
                                                                 2009        $8.773      $10.569       9,316
                                                                 2010       $10.569      $11.333           0
---------------------------------------------------------------------------------------------------------------
MFS VIT II High Yield - Service Class
                                                                 2013       $10.000      $15.523       6,542
                                                                 2014       $15.523      $15.646       3,773
---------------------------------------------------------------------------------------------------------------
MFS(R) High Income Series - Service Class
                                                                 2005       $10.617      $10.651       8,859
                                                                 2006       $10.651      $11.517       9,006
                                                                 2007       $11.517      $11.495       8,010
                                                                 2008       $11.495       $8.061       5,959
                                                                 2009        $8.061      $11.507       4,547
                                                                 2010       $11.507      $12.940       3,042
                                                                 2011       $12.940      $13.210       1,990
                                                                 2012       $13.210      $14.859       1,450
                                                                 2013       $14.859      $15.045           0
---------------------------------------------------------------------------------------------------------------
MFS(R) Investors Growth Stock Series - Service Class
                                                                 2005       $10.437      $10.694      20,459
                                                                 2006       $10.694      $11.281      40,226
                                                                 2007       $11.281      $12.310      35,303
                                                                 2008       $12.310       $7.626      25,945
                                                                 2009        $7.626      $10.427      17,812
                                                                 2010       $10.427      $11.495       5,120
                                                                 2011       $11.495      $11.342       5,750
                                                                 2012       $11.342      $13.009       1,691
                                                                 2013       $13.009      $16.631       1,408
                                                                 2014       $16.631      $18.165         642
</R>

                                     H-27
<R>
                                                                                                       Number of
                                                                            Accumulation Accumulation    Units
                                                               For the Year  Unit Value   Unit Value  Outstanding
                                                                  Ending    at Beginning    at End      at End
Sub-Accounts                                                   December 31   of Period    of Period    of Period
-----------------------------------------------------------------------------------------------------------------
MFS(R) Investors Trust Series - Service Class
                                                                   2005       $10.775      $11.336       2,187
                                                                   2006       $11.336      $12.558       2,311
                                                                   2007       $12.558      $13.582       2,327
                                                                   2008       $13.582       $8.911       2,892
                                                                   2009        $8.911      $11.086       3,394
                                                                   2010       $11.086      $12.084       1,009
                                                                   2011       $12.084      $11.591         845
                                                                   2012       $11.591      $13.540       3,469
                                                                   2013       $13.540      $17.534       1,277
                                                                   2014       $17.534      $19.082       1,997
-----------------------------------------------------------------------------------------------------------------
MFS(R) New Discovery Series - Service Class
                                                                   2005        $9.912      $10.235       1,241
                                                                   2006       $10.235      $11.362       2,619
                                                                   2007       $11.362      $11.419       2,212
                                                                   2008       $11.419       $6.789         512
                                                                   2009        $6.789      $10.872         580
                                                                   2010       $10.872      $14.529       2,245
                                                                   2011       $14.529      $12.784         206
                                                                   2012       $12.784      $15.192           0
                                                                   2013       $15.192      $21.089          82
                                                                   2014       $21.089      $19.177          82
-----------------------------------------------------------------------------------------------------------------
MFS(R) Total Return Series - Service Class
                                                                   2005       $10.748      $10.841      43,498
                                                                   2006       $10.841      $11.896      48,499
                                                                   2007       $11.896      $12.153      36,646
                                                                   2008       $12.153       $9.279      30,804
                                                                   2009        $9.279      $10.738      24,445
                                                                   2010       $10.738      $11.573       4,986
                                                                   2011       $11.573      $11.557       4,481
                                                                   2012       $11.557      $12.602       3,966
                                                                   2013       $12.602      $14.709       3,453
                                                                   2014       $14.709      $15.650       2,086
-----------------------------------------------------------------------------------------------------------------
MFS(R) Value Series - Service Class
                                                                   2005       $11.139      $11.658       7,507
                                                                   2006       $11.658      $13.810      10,015
                                                                   2007       $13.810      $14.605      11,214
                                                                   2008       $14.605       $9.656      15,987
                                                                   2009        $9.656      $11.623       5,318
                                                                   2010       $11.623      $12.707       1,869
                                                                   2011       $12.707      $12.433         874
                                                                   2012       $12.433      $14.162         615
                                                                   2013       $14.162      $18.877         744
                                                                   2014       $18.877      $20.449         300
-----------------------------------------------------------------------------------------------------------------
Oppenheimer Discovery Mid Cap Growth Fund/VA - Service Shares
                                                                   2005       $10.000      $11.695       2,405
                                                                   2006       $11.695      $11.807      10,770
                                                                   2007       $11.807      $12.306      10,772
                                                                   2008       $12.306       $6.143      10,137
                                                                   2009        $6.143       $7.987       8,923
                                                                   2010        $7.987       $9.984      12,682
                                                                   2011        $9.984       $9.897       3,274
                                                                   2012        $9.897      $11.301         332
                                                                   2013       $11.301      $15.066       2,349
                                                                   2014       $15.066      $15.628       3,121
</R>

                                     H-28
<R>
                                                                                                    Number of
                                                                         Accumulation Accumulation    Units
                                                            For the Year  Unit Value   Unit Value  Outstanding
                                                               Ending    at Beginning    at End      at End
Sub-Accounts                                                December 31   of Period    of Period    of Period
--------------------------------------------------------------------------------------------------------------
Oppenheimer Global Fund/VA - Service Shares
                                                                2005       $11.354      $12.730       23,494
                                                                2006       $12.730      $14.688       32,798
                                                                2007       $14.688      $15.315       24,924
                                                                2008       $15.315       $8.982       23,059
                                                                2009        $8.982      $12.305       10,881
                                                                2010       $12.305      $13.995        9,555
                                                                2011       $13.995      $12.584        8,198
                                                                2012       $12.584      $14.962        5,690
                                                                2013       $14.962      $18.677        5,164
                                                                2014       $18.677      $18.737        3,744
--------------------------------------------------------------------------------------------------------------
Oppenheimer Main Street Small Cap Fund/VA - Service Shares
                                                                2005       $11.287      $12.174       27,646
                                                                2006       $12.174      $13.721       40,614
                                                                2007       $13.721      $13.299       39,454
                                                                2008       $13.299       $8.105       24,375
                                                                2009        $8.105      $10.905       13,961
                                                                2010       $10.905      $13.191        7,439
                                                                2011       $13.191      $12.659        3,339
                                                                2012       $12.659      $14.642        3,301
                                                                2013       $14.642      $20.240        4,131
                                                                2014       $20.240      $22.215        2,771
--------------------------------------------------------------------------------------------------------------
PIMCO Foreign Bond Portfolio (U.S. Dollar-Hedged) -
 Administrative Shares
                                                                2005       $10.348      $10.696       28,950
                                                                2006       $10.696      $10.745       45,056
                                                                2007       $10.745      $10.946       43,735
                                                                2008       $10.946      $10.503       23,896
                                                                2009       $10.503      $11.939       12,188
                                                                2010       $11.939      $12.733       10,058
                                                                2011       $12.733      $13.364        5,594
                                                                2012       $13.364      $14.561        7,941
                                                                2013       $14.561      $14.386        7,699
                                                                2014       $14.386      $15.719        1,868
--------------------------------------------------------------------------------------------------------------
PIMCO Money Market Portfolio - Administrative Shares
                                                                2005        $9.927      $10.028       17,626
                                                                2006       $10.028      $10.313      110,294
                                                                2007       $10.313      $10.632       72,629
                                                                2008       $10.632      $10.687       73,225
                                                                2009       $10.687      $10.517       32,253
                                                                2010       $10.517      $10.343       20,402
                                                                2011       $10.343      $10.174       15,383
                                                                2012       $10.174      $10.007       11,760
                                                                2013       $10.007       $9.843       16,236
                                                                2014        $9.843       $9.676        8,548
--------------------------------------------------------------------------------------------------------------
PIMCO Real Return Portfolio - Administrative Shares
                                                                2005       $10.562      $10.599       77,486
                                                                2006       $10.599      $10.493       72,477
                                                                2007       $10.493      $11.416       60,196
                                                                2008       $11.416      $10.432       34,791
                                                                2009       $10.432      $12.141       21,242
                                                                2010       $12.141      $12.902       14,123
                                                                2011       $12.902      $14.164       21,288
                                                                2012       $14.164      $15.142       18,459
                                                                2013       $15.142      $13.512        4,211
                                                                2014       $13.512      $13.693        1,539
</R>

                                     H-29
<R>
                                                                                              Number of
                                                                   Accumulation Accumulation    Units
                                                      For the Year  Unit Value   Unit Value  Outstanding
                                                         Ending    at Beginning    at End      at End
Sub-Accounts                                          December 31   of Period    of Period    of Period
--------------------------------------------------------------------------------------------------------
PIMCO Total Return Portfolio - Administrative Shares
                                                          2005       $10.250      $10.322       47,858
                                                          2006       $10.322      $10.538       83,160
                                                          2007       $10.538      $11.266       81,848
                                                          2008       $11.266      $11.608       60,359
                                                          2009       $11.608      $13.017       40,000
                                                          2010       $13.017      $13.834       33,201
                                                          2011       $13.834      $14.090       22,858
                                                          2012       $14.090      $15.179       18,280
                                                          2013       $15.179      $14.628       17,046
                                                          2014       $14.628      $14.994       13,014
--------------------------------------------------------------------------------------------------------
Premier VIT OpCap Balanced Portfolio
                                                          2005       $10.779      $10.887        5,953
                                                          2006       $10.887      $11.858        5,951
                                                          2007       $11.858      $11.138        5,481
                                                          2008       $11.138       $7.535        3,960
                                                          2009        $7.535       $7.261            0
--------------------------------------------------------------------------------------------------------
Premier VIT OpCap Renaissance Portfolio
                                                          2005       $11.193      $10.505       19,478
                                                          2006       $10.505      $11.501       22,405
                                                          2007       $11.501      $12.019       16,051
                                                          2008       $12.019      $10.859            0
--------------------------------------------------------------------------------------------------------
T. Rowe Price Blue Chip Growth Portfolio - II
                                                          2005       $10.456      $10.858       40,786
                                                          2006       $10.858      $11.670       75,772
                                                          2007       $11.670      $12.903       81,626
                                                          2008       $12.903       $7.274       62,701
                                                          2009        $7.274      $10.138       40,435
                                                          2010       $10.138      $11.561       17,197
                                                          2011       $11.561      $11.519       10,165
                                                          2012       $11.519      $13.351        6,390
                                                          2013       $13.351      $18.485        7,235
                                                          2014       $18.485      $19.777        7,923
--------------------------------------------------------------------------------------------------------
T. Rowe Price Equity Income Portfolio - II
                                                          2005       $11.070      $11.285       92,669
                                                          2006       $11.285      $13.162      137,043
                                                          2007       $13.162      $13.329      129,012
                                                          2008       $13.329       $8.351       99,308
                                                          2009        $8.351      $10.281       73,212
                                                          2010       $10.281      $11.597       25,536
                                                          2011       $11.597      $11.284       12,800
                                                          2012       $11.284      $12.968       12,131
                                                          2013       $12.968      $16.497        8,812
                                                          2014       $16.497      $17.368        7,183
--------------------------------------------------------------------------------------------------------
UIF Growth Portfolio, Class II
                                                          2005       $10.349      $11.749       18,729
                                                          2006       $11.749      $11.990       17,724
                                                          2007       $11.990      $14.338        6,708
                                                          2008       $14.338       $7.139        4,442
                                                          2009        $7.139      $11.589        2,932
                                                          2010       $11.589      $13.968          450
                                                          2011       $13.968      $13.314          293
                                                          2012       $13.314      $14.926          228
                                                          2013       $14.926      $21.675          189
                                                          2014       $21.675      $22.604          189
</R>

                                     H-30
<R>
                                                                                                            Number of
                                                                                 Accumulation Accumulation    Units
                                                                    For the Year  Unit Value   Unit Value  Outstanding
                                                                       Ending    at Beginning    at End      at End
Sub-Accounts                                                        December 31   of Period    of Period    of Period
----------------------------------------------------------------------------------------------------------------------
UIF U.S. Real Estate Portfolio, Class II
                                                                        2005       $12.811      $14.704      41,284
                                                                        2006       $14.704      $19.900      69,224
                                                                        2007       $19.900      $16.181      49,043
                                                                        2008       $16.181       $9.852      38,054
                                                                        2009        $9.852      $12.444      33,843
                                                                        2010       $12.444      $15.845      19,381
                                                                        2011       $15.845      $16.458       8,481
                                                                        2012       $16.458      $18.705       7,027
                                                                        2013       $18.705      $18.709       3,220
                                                                        2014       $18.709      $23.803       1,651
----------------------------------------------------------------------------------------------------------------------
Van Eck VIP Emerging Markets Fund - Initial Class
                                                                        2005       $12.067      $15.658      12,064
                                                                        2006       $15.658      $21.471      13,500
                                                                        2007       $21.471      $29.043      16,859
                                                                        2008       $29.043      $10.054      11,964
                                                                        2009       $10.054      $21.070      11,191
                                                                        2010       $21.070      $26.271       2,198
                                                                        2011       $26.271      $19.178       1,130
                                                                        2012       $19.178      $24.471         998
                                                                        2013       $24.471      $26.946       1,020
                                                                        2014       $26.946      $26.378       1,254
----------------------------------------------------------------------------------------------------------------------
Van Eck VIP Global Hard Assets Fund - Initial Class
                                                                        2005       $12.415      $18.511      27,980
                                                                        2006       $18.511      $22.654      38,120
                                                                        2007       $22.654      $32.366      35,969
                                                                        2008       $32.366      $17.140      19,035
                                                                        2009       $17.140      $26.543      17,279
                                                                        2010       $26.543      $33.720       8,793
                                                                        2011       $33.720      $27.694       8,168
                                                                        2012       $27.694      $28.144       8,014
                                                                        2013       $28.144      $30.580       4,622
                                                                        2014       $30.580      $24.317       3,471
----------------------------------------------------------------------------------------------------------------------
Van Eck VIP Multi-Manager Alternative - Initial Class
                                                                        2005        $9.885       $9.738       1,220
                                                                        2006        $9.738      $10.401       1,929
                                                                        2007       $10.401      $10.638       1,607
                                                                        2008       $10.638       $9.087       2,544
                                                                        2009        $9.087      $10.171       2,363
                                                                        2010       $10.171      $10.496         574
                                                                        2011       $10.496      $10.084         518
                                                                        2012       $10.084      $10.044         556
                                                                        2013       $10.044      $10.372         585
                                                                        2014       $10.372      $10.087         395
----------------------------------------------------------------------------------------------------------------------
Western Asset Variable Global High Yield Bond Portfolio - Class II
                                                                        2005       $10.836      $11.030      43,334
                                                                        2006       $11.030      $11.964      67,099
                                                                        2007       $11.964      $11.721      64,359
                                                                        2008       $11.721       $7.963      43,788
                                                                        2009        $7.963      $12.122      22,070
                                                                        2010       $12.122      $13.667      14,823
                                                                        2011       $13.667      $13.606      12,099
                                                                        2012       $13.606      $15.792       5,568
                                                                        2013       $15.792      $16.463       4,878
                                                                        2014       $16.463      $15.939       3,953
</R>

<R>
 *  The Accumulation Unit Values in this table reflect a mortality and expense
    risk charge of 1.60% and an administrative expense charge of 0.10%.
</R>

                                     H-31
<R>
     CONSULTANT SOLUTIONS VARIABLE ANNUITIES: LBL Consultant Solution Elite
                                  Contracts -
                                   PROSPECTUS

   ACCUMULATION UNIT VALUE AND NUMBER OF ACCUMULATION UNITS OUTSTANDING FOR
                           EACH VARIABLE SUB-ACCOUNT*

                                      High

                           Mortality & Expense = 2.5
</R>

<R>
                                                                                                            Number of
                                                                                 Accumulation Accumulation    Units
                                                                    For the Year  Unit Value   Unit Value  Outstanding
                                                                       Ending    at Beginning    at End      at End
Sub-Accounts                                                        December 31   of Period    of Period    of Period
----------------------------------------------------------------------------------------------------------------------
Alger Capital Appreciation Portfolio - Class S
                                                                        2005       $10.101      $11.232         0
                                                                        2006       $11.232      $13.015         0
                                                                        2007       $13.015      $16.883         0
                                                                        2008       $16.883       $9.000         0
                                                                        2009        $9.000      $13.210         0
                                                                        2010       $13.210      $14.620         0
                                                                        2011       $14.620      $14.151         0
                                                                        2012       $14.151      $16.249         0
                                                                        2013       $16.249      $21.332         0
                                                                        2014       $21.332      $23.572         0
----------------------------------------------------------------------------------------------------------------------
Alger Large Cap Growth Portfolio - Class S
                                                                        2005        $9.986      $10.867         0
                                                                        2006       $10.867      $11.104         0
                                                                        2007       $11.104      $12.937         0
                                                                        2008       $12.937       $6.767         0
                                                                        2009        $6.767       $9.705         0
                                                                        2010        $9.705      $10.673         0
                                                                        2011       $10.673      $10.317         0
                                                                        2012       $10.317      $10.990         0
                                                                        2013       $10.990      $14.406         0
                                                                        2014       $14.406      $15.513         0
----------------------------------------------------------------------------------------------------------------------
Alger Mid Cap Growth Portfolio - Class S
                                                                        2005       $10.505      $11.209         0
                                                                        2006       $11.209      $11.998         0
                                                                        2007       $11.998      $15.338         0
                                                                        2008       $15.338       $6.204         0
                                                                        2009        $6.204       $9.143         0
                                                                        2010        $9.143      $10.587         0
                                                                        2011       $10.587       $9.426         0
                                                                        2012        $9.426      $10.621         0
                                                                        2013       $10.621      $14.008         0
                                                                        2014       $14.008      $14.678         0
----------------------------------------------------------------------------------------------------------------------
ClearBridge Variable Fundamental All Cap Value Portfolio - Class I
                                                                        2007       $10.000       $9.427         0
                                                                        2008        $9.427       $5.823         0
                                                                        2009        $5.823       $7.337         0
                                                                        2010        $7.337       $8.332         0
                                                                        2011        $8.332       $7.613         0
                                                                        2012        $7.613       $8.526         0
                                                                        2013        $8.526      $10.975         0
                                                                        2014       $10.975      $11.691         0
</R>

                                     H-32
<R>
                                                                                                  Number of
                                                                       Accumulation Accumulation    Units
                                                          For the Year  Unit Value   Unit Value  Outstanding
                                                             Ending    at Beginning    at End      at End
Sub-Accounts                                              December 31   of Period    of Period    of Period
------------------------------------------------------------------------------------------------------------
ClearBridge Variable Large Cap Value Portfolio - Class I
                                                              2007       $10.000       $9.665         0
                                                              2008        $9.665       $6.060         0
                                                              2009        $6.060       $7.348         0
                                                              2010        $7.348       $7.835         0
                                                              2011        $7.835       $8.009         0
                                                              2012        $8.009       $9.088         0
                                                              2013        $9.088      $11.717         0
                                                              2014       $11.717      $12.749         0
------------------------------------------------------------------------------------------------------------
Fidelity VIP Asset Manager Portfolio - Service Class 2
                                                              2005       $10.099      $10.209         0
                                                              2006       $10.209      $10.654         0
                                                              2007       $10.654      $11.950         0
                                                              2008       $11.950       $8.274         0
                                                              2009        $8.274      $10.377         0
                                                              2010       $10.377      $11.519         0
                                                              2011       $11.519      $10.904         0
                                                              2012       $10.904      $11.919         0
                                                              2013       $11.919      $13.390         0
                                                              2014       $13.390      $13.765         0
------------------------------------------------------------------------------------------------------------
Fidelity VIP Contrafund(R) Portfolio - Service Class 2
                                                              2005       $11.258      $12.792         0
                                                              2006       $12.792      $13.885         0
                                                              2007       $13.885      $15.861         0
                                                              2008       $15.861       $8.853         0
                                                              2009        $8.853      $11.681         0
                                                              2010       $11.681      $13.304         0
                                                              2011       $13.304      $12.598         0
                                                              2012       $12.598      $14.250         0
                                                              2013       $14.250      $18.176         0
                                                              2014       $18.176      $19.767         0
------------------------------------------------------------------------------------------------------------
Fidelity VIP Equity-Income Portfolio - Service Class 2
                                                              2005       $10.715      $11.019         0
                                                              2006       $11.019      $12.872         0
                                                              2007       $12.872      $12.695         0
                                                              2008       $12.695       $7.071         0
                                                              2009        $7.071       $8.945         0
                                                              2010        $8.945      $10.012         0
                                                              2011       $10.012       $9.817         0
                                                              2012        $9.817      $11.191         0
                                                              2013       $11.191      $13.934         0
                                                              2014       $13.934      $14.722         0
------------------------------------------------------------------------------------------------------------
Fidelity VIP Growth Portfolio - Service Class 2
                                                              2005        $9.695       $9.964         0
                                                              2006        $9.964      $10.343         0
                                                              2007       $10.343      $12.759         0
                                                              2008       $12.759       $6.547         0
                                                              2009        $6.547       $8.161         0
                                                              2010        $8.161       $9.845         0
                                                              2011        $9.845       $9.587         0
                                                              2012        $9.587      $10.682         0
                                                              2013       $10.682      $14.150         0
                                                              2014       $14.150      $15.300         0
</R>

                                     H-33
<R>
Number of
Accumulation Accumulation Units
For the Year Unit Value Unit Value Outstanding
Ending at Beginning at End at End
Sub-Accounts December 31 of Period of Period of Period
------------------------------------------------------------------------------------------------------------------
Fidelity VIP Index 500 Portfolio - Service Class 2
2005 $10.545 $10.740 0
2006 $10.740 $12.076 0
2007 $12.076 $12.370 0
2008 $12.370 $7.571 0
2009 $7.571 $9.313 0
2010 $9.313 $10.408 0
2011 $10.408 $10.318 0
2012 $10.318 $11.620 0
2013 $11.620 $14.930 0
2014 $14.930 $16.474 0
------------------------------------------------------------------------------------------------------------------
Fidelity VIP Investment Grade Bond Portfolio - Service Class 2
2005 $10.097 $10.022 0
2006 $10.022 $10.166 0
2007 $10.166 $10.305 0
2008 $10.305 $9.689 0
2009 $9.689 $10.897 0
2010 $10.897 $11.415 0
2011 $11.415 $11.902 0
2012 $11.902 $12.241 0
2013 $12.241 $11.676 0
2014 $11.676 $12.011 0
------------------------------------------------------------------------------------------------------------------
Fidelity VIP Money Market Portfolio - Service Class 2
2005 $9.850 $9.861 0
2006 $9.861 $10.049 0
2007 $10.049 $10.272 0
2008 $10.272 $10.282 0
2009 $10.282 $10.062 0
2010 $10.062 $9.808 0
2011 $9.808 $9.554 0
2012 $9.554 $9.306 0
2013 $9.306 $9.065 0
2014 $9.065 $8.830 0
------------------------------------------------------------------------------------------------------------------
Fidelity VIP Overseas Portfolio - Service Class 2
2005 $10.805 $12.502 0
2006 $12.502 $14.342 0
2007 $14.342 $16.349 0
2008 $16.349 $8.923 0
2009 $8.923 $10.970 0
2010 $10.970 $12.056 0
2011 $12.056 $9.707 0
2012 $9.707 $11.380 0
2013 $11.380 $14.429 0
2014 $14.429 $12.887 0
------------------------------------------------------------------------------------------------------------------
Guggenheim VIF Long Short Equity Fund
2005 $10.477 $11.604 0
2006 $11.604 $12.590 0
2007 $12.590 $15.050 0
2008 $15.050 $8.687 0
2009 $8.687 $10.771 0
2010 $10.771 $11.667 0
2011 $11.667 $10.618 0
2012 $10.618 $10.800 0
2013 $10.800 $12.355 0
2014 $12.355 $12.370 0
------------------------------------------------------------------------------------------------------------------
Invesco V.I. American Franchise Fund - Series II
2012 $10.000 $8.734 0
2013 $8.734 $11.892 0
2014 $11.892 $12.529 0
</R>
H-34
<R>
                                                                                             Number of
                                                                  Accumulation Accumulation    Units
                                                     For the Year  Unit Value   Unit Value  Outstanding
                                                        Ending    at Beginning    at End      at End
Sub-Accounts                                         December 31   of Period    of Period    of Period
-------------------------------------------------------------------------------------------------------
Invesco V.I. Capital Appreciation - Series II
                                                         2005       $10.184      $10.771         0
                                                         2006       $10.771      $11.127         0
                                                         2007       $11.127      $12.108         0
                                                         2008       $12.108       $6.766         0
                                                         2009        $6.766       $7.955         0
                                                         2010        $7.955       $8.927         0
                                                         2011        $8.927       $7.989         0
                                                         2012        $7.989       $9.136         0
-------------------------------------------------------------------------------------------------------
Invesco V.I. Core Equity Fund - Series II
                                                         2006       $10.000      $10.708         0
                                                         2007       $10.708      $11.250         0
                                                         2008       $11.250       $7.634         0
                                                         2009        $7.634       $9.517         0
                                                         2010        $9.517      $10.127         0
                                                         2011       $10.127       $9.835         0
                                                         2012        $9.835      $10.883         0
                                                         2013       $10.883      $13.667         0
                                                         2014       $13.667      $14.356         0
-------------------------------------------------------------------------------------------------------
Invesco V.I. Government Securities Fund - Series II
                                                         2011       $10.000      $11.043         0
                                                         2012       $11.043      $10.994         0
                                                         2013       $10.994      $10.403         0
                                                         2014       $10.403      $10.525         0
-------------------------------------------------------------------------------------------------------
Invesco V.I. Growth and Income Fund - Series II
                                                         2005       $10.955      $11.708         0
                                                         2006       $11.708      $13.227         0
                                                         2007       $13.227      $13.206         0
                                                         2008       $13.206       $8.719         0
                                                         2009        $8.719      $10.540         0
                                                         2010       $10.540      $11.518         0
                                                         2011       $11.518      $10.965         0
                                                         2012       $10.965      $12.212         0
                                                         2013       $12.212      $15.911         0
                                                         2014       $15.911      $17.041         0
-------------------------------------------------------------------------------------------------------
Invesco V.I. Mid Cap Core Equity Fund - Series II
                                                         2005       $10.862      $11.349         0
                                                         2006       $11.349      $12.269         0
                                                         2007       $12.269      $13.058         0
                                                         2008       $13.058       $9.070         0
                                                         2009        $9.070      $11.472         0
                                                         2010       $11.472      $12.713         0
                                                         2011       $12.713      $11.578         0
                                                         2012       $11.578      $12.474         0
                                                         2013       $12.474      $15.608         0
                                                         2014       $15.608      $15.836         0
-------------------------------------------------------------------------------------------------------
Invesco V.I. Mid Cap Growth Fund - Series II
                                                         2005       $10.984      $11.888         0
                                                         2006       $11.888      $12.149         0
                                                         2007       $12.149      $13.914         0
                                                         2008       $13.914       $7.205         0
                                                         2009        $7.205      $10.974         0
                                                         2010       $10.974      $13.604         0
                                                         2011       $13.604      $12.010         0
                                                         2012       $12.010      $13.057         0
                                                         2013       $13.057      $17.373         0
                                                         2014       $17.373      $18.223         0
</R>

                                     H-35
<R>
                                                                                                            Number of
                                                                                 Accumulation Accumulation    Units
                                                                    For the Year  Unit Value   Unit Value  Outstanding
                                                                       Ending    at Beginning    at End      at End
Sub-Accounts                                                        December 31   of Period    of Period    of Period
----------------------------------------------------------------------------------------------------------------------
Invesco V.I. Value Opportunities Fund - Series II
                                                                        2005       $10.621      $10.907         0
                                                                        2006       $10.907      $12.000         0
                                                                        2007       $12.000      $11.845         0
                                                                        2008       $11.845       $5.549         0
                                                                        2009        $5.549       $7.984         0
                                                                        2010        $7.984       $8.317         0
                                                                        2011        $8.317       $7.826         0
                                                                        2012        $7.826       $8.968         0
                                                                        2013        $8.968      $11.641         0
                                                                        2014       $11.641      $12.062         0
----------------------------------------------------------------------------------------------------------------------
Invesco Van Kampen V.I. Government Fund - Series II
                                                                        2005       $10.070      $10.130         0
                                                                        2006       $10.130      $10.174         0
                                                                        2007       $10.174      $10.603         0
                                                                        2008       $10.603      $10.484         0
                                                                        2009       $10.484      $10.299         0
                                                                        2010       $10.299      $10.522         0
                                                                        2011       $10.522      $10.542         0
----------------------------------------------------------------------------------------------------------------------
Janus Aspen Overseas Portfolio - Service Shares
                                                                        2008       $10.000       $6.644         0
                                                                        2009        $6.644      $11.588         0
                                                                        2010       $11.588      $14.111         0
                                                                        2011       $14.111       $9.300         0
                                                                        2012        $9.300      $10.251         0
                                                                        2013       $10.251      $11.411         0
                                                                        2014       $11.411       $9.769         0
----------------------------------------------------------------------------------------------------------------------
Janus Aspen Perkins Mid Cap Value Portfolio - Service Shares
                                                                        2005       $11.172      $11.971         0
                                                                        2006       $11.971      $13.418         0
                                                                        2007       $13.418      $14.004         0
                                                                        2008       $14.004       $9.835         0
                                                                        2009        $9.835      $12.732         0
                                                                        2010       $12.732      $14.307         0
                                                                        2011       $14.307      $13.520         0
                                                                        2012       $13.520      $14.589         0
                                                                        2013       $14.589      $17.877         0
                                                                        2014       $17.877      $18.882         0
----------------------------------------------------------------------------------------------------------------------
Janus Aspen Perkins Small Company Value Portfolio - Service Shares
                                                                        2005       $10.000      $10.880         0
                                                                        2006       $10.880      $12.916         0
                                                                        2007       $12.916      $11.809         0
                                                                        2008       $11.809       $7.371         0
                                                                        2009        $7.371       $6.956         0
----------------------------------------------------------------------------------------------------------------------
Janus Aspen Series Balanced Portfolio - Service Shares
                                                                        2005       $10.502      $11.014         0
                                                                        2006       $11.014      $11.846         0
                                                                        2007       $11.846      $12.723         0
                                                                        2008       $12.723      $10.402         0
                                                                        2009       $10.402      $12.723         0
                                                                        2010       $12.723      $13.399         0
                                                                        2011       $13.399      $13.228         0
                                                                        2012       $13.228      $14.606         0
                                                                        2013       $14.606      $17.044         0
                                                                        2014       $17.044      $17.969         0
</R>

                                     H-36
<R>
                                                                                                     Number of
                                                                          Accumulation Accumulation    Units
                                                             For the Year  Unit Value   Unit Value  Outstanding
                                                                Ending    at Beginning    at End      at End
Sub-Accounts                                                 December 31   of Period    of Period    of Period
---------------------------------------------------------------------------------------------------------------
Janus Aspen Series Foreign Stock Portfolio - Service Shares
                                                                 2005       $11.186      $11.576         0
                                                                 2006       $11.576      $13.312         0
                                                                 2007       $13.312      $15.331         0
                                                                 2008       $15.331      $14.368         0
---------------------------------------------------------------------------------------------------------------
Janus Aspen Series Forty Portfolio - Service Shares
                                                                 2005       $11.358      $12.453         0
                                                                 2006       $12.453      $13.236         0
                                                                 2007       $13.236      $17.612         0
                                                                 2008       $17.612       $9.553         0
                                                                 2009        $9.553      $13.586         0
                                                                 2010       $13.586      $14.090         0
                                                                 2011       $14.090      $12.772         0
                                                                 2012       $12.772      $15.407         0
                                                                 2013       $15.407      $19.642         0
                                                                 2014       $19.642      $20.751         0
---------------------------------------------------------------------------------------------------------------
Janus Aspen Series INTECH Risk-Managed Core Portfolio -
 Service Shares
                                                                 2005       $11.208      $12.109         0
                                                                 2006       $12.109      $13.065         0
                                                                 2007       $13.065      $13.504         0
                                                                 2008       $13.504       $8.386         0
                                                                 2009        $8.386      $10.010         0
                                                                 2010       $10.010      $10.701         0
---------------------------------------------------------------------------------------------------------------
MFS VIT II High Yield - Service Class
                                                                 2013       $10.000      $14.171         0
                                                                 2014       $14.171      $14.152         0
---------------------------------------------------------------------------------------------------------------
MFS(R) High Income Series - Service Class
                                                                 2005       $10.529      $10.466         0
                                                                 2006       $10.466      $11.214         0
                                                                 2007       $11.214      $11.089         0
                                                                 2008       $11.089       $7.705         0
                                                                 2009        $7.705      $10.898         0
                                                                 2010       $10.898      $12.143         0
                                                                 2011       $12.143      $12.284         0
                                                                 2012       $12.284      $13.691         0
                                                                 2013       $13.691      $13.782         0
---------------------------------------------------------------------------------------------------------------
MFS(R) Investors Growth Stock Series - Service Class
                                                                 2005       $10.350      $10.508         0
                                                                 2006       $10.508      $10.983         0
                                                                 2007       $12.000      $11.845         0
                                                                 2008       $11.845       $7.289         0
                                                                 2009        $7.289       $9.875         0
                                                                 2010        $9.875      $10.788         0
                                                                 2011       $10.788      $10.546         0
                                                                 2012       $10.546      $11.985         0
                                                                 2013       $11.985      $15.182         0
                                                                 2014       $15.182      $16.431         0
---------------------------------------------------------------------------------------------------------------
MFS(R) Investors Trust Series - Service Class
                                                                 2005       $10.685      $11.139         0
                                                                 2006       $11.139      $12.227         0
                                                                 2007       $10.983      $11.876         0
                                                                 2008       $11.876       $8.518         0
                                                                 2009        $8.518      $10.500         0
                                                                 2010       $10.500      $11.339         0
                                                                 2011       $11.339      $10.778         0
                                                                 2012       $10.778      $12.474         0
                                                                 2013       $12.474      $16.006         0
                                                                 2014       $16.006      $17.260         0
</R>

                                     H-37
<R>
                                                                                                       Number of
                                                                            Accumulation Accumulation    Units
                                                               For the Year  Unit Value   Unit Value  Outstanding
                                                                  Ending    at Beginning    at End      at End
Sub-Accounts                                                   December 31   of Period    of Period    of Period
-----------------------------------------------------------------------------------------------------------------
MFS(R) New Discovery Series - Service Class
                                                                   2005        $9.830      $10.057         0
                                                                   2006       $10.057      $11.063         0
                                                                   2007       $11.063      $11.016         0
                                                                   2008       $11.016       $6.489         0
                                                                   2009        $6.489      $10.297         0
                                                                   2010       $10.297      $13.634         0
                                                                   2011       $13.634      $11.886         0
                                                                   2012       $11.886      $13.996         0
                                                                   2013       $13.996      $19.252         0
                                                                   2014       $19.252      $17.345         0
-----------------------------------------------------------------------------------------------------------------
MFS(R) Total Return Series - Service Class
                                                                   2005       $10.659      $10.652         0
                                                                   2006       $10.652      $11.582         0
                                                                   2007       $11.582      $11.723         0
                                                                   2008       $11.723       $8.870         0
                                                                   2009        $8.870      $10.170         0
                                                                   2010       $10.170      $10.860         0
                                                                   2011       $10.860      $10.746         0
                                                                   2012       $10.746      $11.610         0
                                                                   2013       $11.610      $13.428         0
                                                                   2014       $13.428      $14.156         0
-----------------------------------------------------------------------------------------------------------------
MFS(R) Value Series - Service Class
                                                                   2005       $11.046      $11.455         0
                                                                   2006       $11.455      $13.447         0
                                                                   2007       $13.447      $14.090         0
                                                                   2008       $14.090       $9.229         0
                                                                   2009        $9.229      $11.008         0
                                                                   2010       $11.008      $11.924         0
                                                                   2011       $11.924      $11.561         0
                                                                   2012       $11.561      $13.048         0
                                                                   2013       $13.048      $17.233         0
                                                                   2014       $17.233      $18.497         0
-----------------------------------------------------------------------------------------------------------------
Oppenheimer Discovery Mid Cap Growth Fund/VA - Service Shares
                                                                   2005       $10.000      $11.623         0
                                                                   2006       $11.623      $11.627         0
                                                                   2007       $11.627      $12.007         0
                                                                   2008       $12.007       $5.939         0
                                                                   2009        $5.939       $7.651         0
                                                                   2010        $7.651       $9.476         0
                                                                   2011        $9.476       $9.308         0
                                                                   2012        $9.308      $10.530         0
                                                                   2013       $10.530      $13.911         0
                                                                   2014       $13.911      $14.298         0
-----------------------------------------------------------------------------------------------------------------
Oppenheimer Global Fund/VA - Service Shares
                                                                   2005       $11.259      $12.509         0
                                                                   2006       $12.509      $14.301         0
                                                                   2007       $14.301      $14.774         0
                                                                   2008       $14.774       $8.586         0
                                                                   2009        $8.586      $11.653         0
                                                                   2010       $11.653      $13.133         0
                                                                   2011       $13.133      $11.701         0
                                                                   2012       $11.701      $13.784         0
                                                                   2013       $13.784      $17.050         0
                                                                   2014       $17.050      $16.948         0
</R>

                                     H-38
<R>
                                                                                                    Number of
                                                                         Accumulation Accumulation    Units
                                                            For the Year  Unit Value   Unit Value  Outstanding
                                                               Ending    at Beginning    at End      at End
Sub-Accounts                                                December 31   of Period    of Period    of Period
--------------------------------------------------------------------------------------------------------------
Oppenheimer Main Street Small Cap Fund/VA - Service Shares
                                                                2005       $11.193      $11.962         0
                                                                2006       $11.962      $13.360         0
                                                                2007       $13.360      $12.830         0
                                                                2008       $12.830       $7.747         0
                                                                2009        $7.747      $10.328         0
                                                                2010       $10.328      $12.379         0
                                                                2011       $12.379      $11.770         0
                                                                2012       $11.770      $13.489         0
                                                                2013       $13.489      $18.476         0
                                                                2014       $18.476      $20.093         0
--------------------------------------------------------------------------------------------------------------
PIMCO Foreign Bond Portfolio (U.S. Dollar-Hedged) -
 Administrative Shares
                                                                2005       $10.262      $10.511         0
                                                                2006       $10.511      $10.462         0
                                                                2007       $10.462      $10.559         0
                                                                2008       $10.559      $10.039         0
                                                                2009       $10.039      $11.307         0
                                                                2010       $11.307      $11.949         0
                                                                2011       $11.949      $12.427         0
                                                                2012       $12.427      $13.416         0
                                                                2013       $13.416      $13.133         0
                                                                2014       $13.133      $14.219         0
--------------------------------------------------------------------------------------------------------------
PIMCO Money Market Portfolio - Administrative Shares
                                                                2005        $9.844       $9.854         0
                                                                2006        $9.854      $10.042         0
                                                                2007       $10.042      $10.257         0
                                                                2008       $10.257      $10.215         0
                                                                2009       $10.215       $9.961         0
                                                                2010        $9.961       $9.706         0
                                                                2011        $9.706       $9.460         0
                                                                2012        $9.460       $9.219         0
                                                                2013        $9.219       $8.985         0
                                                                2014        $8.985       $8.752         0
--------------------------------------------------------------------------------------------------------------
PIMCO Real Return Portfolio - Administrative Shares
                                                                2005       $10.474      $10.415         0
                                                                2006       $10.415      $10.217         0
                                                                2007       $10.217      $11.013         0
                                                                2008       $11.013       $9.971         0
                                                                2009        $9.971      $11.498         0
                                                                2010       $11.498      $12.108         0
                                                                2011       $12.108      $13.171         0
                                                                2012       $13.171      $13.951         0
                                                                2013       $13.951      $12.335         0
                                                                2014       $12.335      $12.386         0
--------------------------------------------------------------------------------------------------------------
PIMCO Total Return Portfolio - Administrative Shares
                                                                2005       $10.164      $10.142         0
                                                                2006       $10.142      $10.260         0
                                                                2007       $10.260      $10.868         0
                                                                2008       $10.868      $11.096         0
                                                                2009       $11.096      $12.328         0
                                                                2010       $12.328      $12.982         0
                                                                2011       $12.982      $13.102         0
                                                                2012       $13.102      $13.985         0
                                                                2013       $13.985      $13.354         0
                                                                2014       $13.354      $13.563         0
</R>

                                     H-39
<R>
                                                                                       Number of
                                                            Accumulation Accumulation    Units
                                               For the Year  Unit Value   Unit Value  Outstanding
                                                  Ending    at Beginning    at End      at End
Sub-Accounts                                   December 31   of Period    of Period    of Period
-------------------------------------------------------------------------------------------------
Premier VIT OpCap Balanced Portfolio
                                                   2005       $10.713      $10.721         0
                                                   2006       $10.721      $11.571         0
                                                   2007       $11.571      $10.768         0
                                                   2008       $10.768       $7.218         0
                                                   2009        $7.218       $6.936         0
-------------------------------------------------------------------------------------------------
Premier VIT OpCap Renaissance Portfolio
                                                   2005       $11.099      $10.322         0
                                                   2006       $10.322      $11.198         0
                                                   2007       $11.198      $11.595         0
                                                   2008       $11.595      $10.470         0
-------------------------------------------------------------------------------------------------
T. Rowe Price Blue Chip Growth Portfolio - II
                                                   2005       $10.369      $10.670         0
                                                   2006       $10.670      $11.362         0
                                                   2007       $11.362      $12.447         0
                                                   2008       $12.447       $6.953         0
                                                   2009        $6.953       $9.602         0
                                                   2010        $9.602      $10.849         0
                                                   2011       $10.849      $10.711         0
                                                   2012       $10.711      $12.300         0
                                                   2013       $12.300      $16.875         0
                                                   2014       $16.875      $17.889         0
-------------------------------------------------------------------------------------------------
T. Rowe Price Equity Income Portfolio - II
                                                   2005       $10.978      $11.089         0
                                                   2006       $11.089      $12.815         0
                                                   2007       $12.815      $12.858         0
                                                   2008       $12.858       $7.982         0
                                                   2009        $7.982       $9.737         0
                                                   2010        $9.737      $10.882         0
                                                   2011       $10.882      $10.492         0
                                                   2012       $10.492      $11.948         0
                                                   2013       $11.948      $15.059         0
                                                   2014       $15.059      $15.710         0
-------------------------------------------------------------------------------------------------
UIF Growth Portfolio, Class II
                                                   2005       $10.263      $11.545         0
                                                   2006       $11.545      $11.674         0
                                                   2007       $11.674      $13.832         0
                                                   2008       $13.832       $6.824         0
                                                   2009        $6.824      $10.976         0
                                                   2010       $10.976      $13.108         0
                                                   2011       $13.108      $12.380         0
                                                   2012       $12.380      $13.752         0
                                                   2013       $13.752      $19.787         0
                                                   2014       $19.787      $20.446         0
-------------------------------------------------------------------------------------------------
UIF U.S. Real Estate Portfolio, Class II
                                                   2005       $12.705      $14.448         0
                                                   2006       $14.448      $19.375         0
                                                   2007       $19.375      $15.610         0
                                                   2008       $15.610       $9.417         0
                                                   2009        $9.417      $11.785         0
                                                   2010       $11.785      $14.869         0
                                                   2011       $14.869      $15.303         0
                                                   2012       $15.303      $17.233         0
                                                   2013       $17.233      $17.079         0
                                                   2014       $17.079      $21.530         0
</R>

                                     H-40
<R>
                                                                                                            Number of
                                                                                 Accumulation Accumulation    Units
                                                                    For the Year  Unit Value   Unit Value  Outstanding
                                                                       Ending    at Beginning    at End      at End
Sub-Accounts                                                        December 31   of Period    of Period    of Period
----------------------------------------------------------------------------------------------------------------------
Van Eck VIP Emerging Markets Fund - Initial Class
                                                                        2005       $11.966      $15.386         0
                                                                        2006       $15.386      $20.905         0
                                                                        2007       $20.905      $28.017         0
                                                                        2008       $28.017       $9.610         0
                                                                        2009        $9.610      $19.955         0
                                                                        2010       $19.955      $24.654         0
                                                                        2011       $24.654      $17.833         0
                                                                        2012       $17.833      $22.545         0
                                                                        2013       $22.545      $24.599         0
                                                                        2014       $24.599      $23.859         0
----------------------------------------------------------------------------------------------------------------------
Van Eck VIP Global Hard Assets Fund - Initial Class
                                                                        2005       $12.311      $18.189         0
                                                                        2006       $18.189      $22.057         0
                                                                        2007       $22.057      $31.224         0
                                                                        2008       $31.224      $16.383         0
                                                                        2009       $16.383      $25.138         0
                                                                        2010       $25.138      $31.644         0
                                                                        2011       $31.644      $25.752         0
                                                                        2012       $25.752      $25.930         0
                                                                        2013       $25.930      $27.916         0
                                                                        2014       $27.916      $21.995         0
----------------------------------------------------------------------------------------------------------------------
Van Eck VIP Multi-Manager Alternative - Initial Class
                                                                        2005        $9.803       $9.568         0
                                                                        2006        $9.568      $10.127         0
                                                                        2007       $10.127      $10.262         0
                                                                        2008       $10.262       $8.686         0
                                                                        2009        $8.686       $9.633         0
                                                                        2010        $9.633       $9.850         0
                                                                        2011        $9.850       $9.376         0
                                                                        2012        $9.376       $9.253         0
                                                                        2013        $9.253       $9.468         0
                                                                        2014        $9.468       $9.124         0
----------------------------------------------------------------------------------------------------------------------
Western Asset Variable Global High Yield Bond Portfolio - Class II
                                                                        2005       $10.746      $10.838         0
                                                                        2006       $10.838      $11.649         0
                                                                        2007       $11.649      $11.307         0
                                                                        2008       $11.307       $7.612         0
                                                                        2009        $7.612      $11.481         0
                                                                        2010       $11.481      $12.826         0
                                                                        2011       $12.826      $12.652         0
                                                                        2012       $12.652      $14.549         0
                                                                        2013       $14.549      $15.029         0
                                                                        2014       $15.029      $14.418         0
</R>

<R>
 *  The Accumulation Unit Values in this table reflect a mortality and expense
    risk charge of 2.50% and an administrative expense charge of 0.10%.
</R>

                                     H-41
<R>
     CONSULTANT SOLUTIONS VARIABLE ANNUITIES: LBL Consultant Solution Plus
                                  Contracts -
                                   PROSPECTUS

 ACCUMULATION UNIT VALUE AND NUMBER OF ACCUMULATION UNITS OUTSTANDING FOR EACH
                             VARIABLE SUB-ACCOUNT*

                                      Low

                           Mortality & Expense = 1.45
</R>

<R>
                                                                                                            Number of
                                                                                 Accumulation Accumulation    Units
                                                                    For the Year  Unit Value   Unit Value  Outstanding
                                                                       Ending    at Beginning    at End      at End
Sub-Accounts                                                        December 31   of Period    of Period    of Period
----------------------------------------------------------------------------------------------------------------------
Alger Capital Appreciation Portfolio - Class S
                                                                        2005       $10.200      $11.464       85,491
                                                                        2006       $11.464      $13.427      127,011
                                                                        2007       $13.427      $17.606      140,144
                                                                        2008       $17.606       $9.487      131,667
                                                                        2009        $9.487      $14.074      104,489
                                                                        2010       $14.074      $15.744      103,711
                                                                        2011       $15.744      $15.404       88,456
                                                                        2012       $15.404      $17.877       81,631
                                                                        2013       $17.877      $23.724       54,094
                                                                        2014       $23.724      $26.496       47,231
----------------------------------------------------------------------------------------------------------------------
Alger Large Cap Growth Portfolio - Class S
                                                                        2005       $10.084      $11.091      310,193
                                                                        2006       $11.091      $11.455      291,942
                                                                        2007       $11.455      $13.491      242,972
                                                                        2008       $13.491       $7.133      252,657
                                                                        2009        $7.133      $10.340      217,489
                                                                        2010       $10.340      $11.494      189,088
                                                                        2011       $11.494      $11.230      139,411
                                                                        2012       $11.230      $12.092       96,100
                                                                        2013       $12.092      $16.021       67,839
                                                                        2014       $16.021      $17.438       54,369
----------------------------------------------------------------------------------------------------------------------
Alger Mid Cap Growth Portfolio - Class S
                                                                        2005       $10.608      $11.441      327,548
                                                                        2006       $11.441      $12.377      436,382
                                                                        2007       $12.377      $15.995      397,229
                                                                        2008       $15.995       $6.539      448,194
                                                                        2009        $6.539       $9.741      382,540
                                                                        2010        $9.741      $11.401      312,036
                                                                        2011       $11.401      $10.261      265,823
                                                                        2012       $10.261      $11.686      212,330
                                                                        2013       $11.686      $15.578      166,426
                                                                        2014       $15.578      $16.500      131,872
----------------------------------------------------------------------------------------------------------------------
ClearBridge Variable Fundamental All Cap Value Portfolio - Class I
                                                                        2007       $10.000       $9.496       77,930
                                                                        2008        $9.496       $5.929       78,084
                                                                        2009        $5.929       $7.551       64,493
                                                                        2010        $7.551       $8.668       54,410
                                                                        2011        $8.668       $8.005       41,829
                                                                        2012        $8.005       $9.061       35,482
                                                                        2013        $9.061      $11.790       29,999
                                                                        2014       $11.790      $12.685            0
</R>

                                     H-42
<R>
                                                                                                  Number of
                                                                       Accumulation Accumulation    Units
                                                          For the Year  Unit Value   Unit Value  Outstanding
                                                             Ending    at Beginning    at End      at End
Sub-Accounts                                              December 31   of Period    of Period    of Period
------------------------------------------------------------------------------------------------------------
ClearBridge Variable Large Cap Value Portfolio - Class I
                                                              2007       $10.000       $9.735       115,189
                                                              2008        $9.735       $6.170        84,142
                                                              2009        $6.170       $7.563        69,529
                                                              2010        $7.563       $8.150        65,270
                                                              2011        $8.150       $8.421        57,030
                                                              2012        $8.421       $9.659        42,202
                                                              2013        $9.659      $12.587        36,017
                                                              2014       $12.587      $13.843        44,069
------------------------------------------------------------------------------------------------------------
Fidelity VIP Asset Manager Portfolio - Service Class 2
                                                              2005       $10.198      $10.420       153,559
                                                              2006       $10.420      $10.991       196,893
                                                              2007       $10.991      $12.461       181,005
                                                              2008       $12.461       $8.722       200,576
                                                              2009        $8.722      $11.056       174,938
                                                              2010       $11.056      $12.405       162,655
                                                              2011       $12.405      $11.869       131,291
                                                              2012       $11.869      $13.114        97,344
                                                              2013       $13.114      $14.892        74,318
                                                              2014       $14.892      $15.473        46,037
------------------------------------------------------------------------------------------------------------
Fidelity VIP Contrafund(R) Portfolio - Service Class 2
                                                              2005       $11.368      $13.056       636,774
                                                              2006       $13.056      $14.324     1,038,503
                                                              2007       $14.324      $16.540       915,580
                                                              2008       $16.540       $9.332     1,036,462
                                                              2009        $9.332      $12.446       860,886
                                                              2010       $12.446      $14.327       791,650
                                                              2011       $14.327      $13.713       685,524
                                                              2012       $13.713      $15.679       547,018
                                                              2013       $15.679      $20.213       419,146
                                                              2014       $20.213      $22.219       326,693
------------------------------------------------------------------------------------------------------------
Fidelity VIP Equity-Income Portfolio - Service Class 2
                                                              2005       $10.820      $11.246       642,154
                                                              2006       $11.246      $13.279       914,542
                                                              2007       $13.279      $13.239       882,993
                                                              2008       $13.239       $7.453       958,622
                                                              2009        $7.453       $9.531       838,502
                                                              2010        $9.531      $10.783       770,594
                                                              2011       $10.783      $10.685       663,554
                                                              2012       $10.685      $12.314       562,960
                                                              2013       $12.314      $15.496       416,246
                                                              2014       $15.496      $16.550       326,978
------------------------------------------------------------------------------------------------------------
Fidelity VIP Growth Portfolio - Service Class 2
                                                              2005        $9.791      $10.170       162,979
                                                              2006       $10.170      $10.671       179,143
                                                              2007       $10.671      $13.305       176,462
                                                              2008       $13.305       $6.902       239,711
                                                              2009        $6.902       $8.695       226,398
                                                              2010        $8.695      $10.603       196,977
                                                              2011       $10.603      $10.435       163,363
                                                              2012       $10.435      $11.753       121,700
                                                              2013       $11.753      $15.736        95,517
                                                              2014       $15.736      $17.199        82,906
</R>

                                     H-43
<R>
                                                                                                        Number of
                                                                             Accumulation Accumulation    Units
                                                                For the Year  Unit Value   Unit Value  Outstanding
                                                                   Ending    at Beginning    at End      at End
Sub-Accounts                                                    December 31   of Period    of Period    of Period
------------------------------------------------------------------------------------------------------------------
Fidelity VIP Index 500 Portfolio - Service Class 2
                                                                    2005       $10.648      $10.961     1,013,570
                                                                    2006       $10.961      $12.458     1,364,532
                                                                    2007       $12.458      $12.899     1,221,783
                                                                    2008       $12.899       $7.980     1,372,538
                                                                    2009        $7.980       $9.923     1,179,069
                                                                    2010        $9.923      $11.208     1,056,165
                                                                    2011       $11.208      $11.232       897,385
                                                                    2012       $11.232      $12.785       718,378
                                                                    2013       $12.785      $16.604       526,001
                                                                    2014       $16.604      $18.519       391,701
------------------------------------------------------------------------------------------------------------------
Fidelity VIP Investment Grade Bond Portfolio - Service Class 2
                                                                    2005       $10.196      $10.229       877,078
                                                                    2006       $10.229      $10.487     1,278,546
                                                                    2007       $10.487      $10.746     1,490,496
                                                                    2008       $10.746      $10.213     1,404,977
                                                                    2009       $10.213      $11.610     1,239,977
                                                                    2010       $11.610      $12.293     1,143,680
                                                                    2011       $12.293      $12.954       962,082
                                                                    2012       $12.954      $13.468       788,124
                                                                    2013       $13.468      $12.985       587,576
                                                                    2014       $12.985      $13.502       410,110
------------------------------------------------------------------------------------------------------------------
Fidelity VIP Money Market Portfolio - Service Class 2
                                                                    2005        $9.947      $10.065     1,298,309
                                                                    2006       $10.065      $10.367     1,929,547
                                                                    2007       $10.367      $10.712     1,860,555
                                                                    2008       $10.712      $10.838     2,312,870
                                                                    2009       $10.838      $10.720     1,916,252
                                                                    2010       $10.720      $10.562     1,575,490
                                                                    2011       $10.562      $10.400     1,456,478
                                                                    2012       $10.400      $10.239     1,250,130
                                                                    2013       $10.239      $10.081     1,052,425
                                                                    2014       $10.081       $9.926       785,582
------------------------------------------------------------------------------------------------------------------
Fidelity VIP Overseas Portfolio - Service Class 2
                                                                    2005       $10.911      $12.760       307,437
                                                                    2006       $12.760      $14.796       827,908
                                                                    2007       $14.796      $17.049       807,662
                                                                    2008       $17.049       $9.406       916,161
                                                                    2009        $9.406      $11.688       807,903
                                                                    2010       $11.688      $12.983       685,772
                                                                    2011       $12.983      $10.566       691,059
                                                                    2012       $10.566      $12.521       571,559
                                                                    2013       $12.521      $16.046       450,554
                                                                    2014       $16.046      $14.487       370,578
------------------------------------------------------------------------------------------------------------------
Guggenheim VIF Long Short Equity Fund
                                                                    2005       $10.579      $11.844        42,301
                                                                    2006       $11.844      $12.989        96,320
                                                                    2007       $12.989      $15.694       104,063
                                                                    2008       $15.694       $9.157       117,641
                                                                    2009        $9.157      $11.475       103,531
                                                                    2010       $11.475      $12.564        89,854
                                                                    2011       $12.564      $11.558        85,709
                                                                    2012       $11.558      $11.882        72,991
                                                                    2013       $11.882      $13.741        58,754
                                                                    2014       $13.741      $13.906        30,656
------------------------------------------------------------------------------------------------------------------
Invesco V.I. American Franchise Fund - Series II
                                                                    2012       $10.000       $9.610        70,498
                                                                    2013        $9.610      $13.226        48,636
                                                                    2014       $13.226      $14.084        36,426
</R>

                                     H-44
<R>
                                                                                             Number of
                                                                  Accumulation Accumulation    Units
                                                     For the Year  Unit Value   Unit Value  Outstanding
                                                        Ending    at Beginning    at End      at End
Sub-Accounts                                         December 31   of Period    of Period    of Period
-------------------------------------------------------------------------------------------------------
Invesco V.I. Capital Appreciation - Series II
                                                         2005       $10.284      $10.994       74,461
                                                         2006       $10.994      $11.479      125,960
                                                         2007       $11.479      $12.626      110,380
                                                         2008       $12.626       $7.132      125,423
                                                         2009        $7.132       $8.476      104,680
                                                         2010        $8.476       $9.613       90,374
                                                         2011        $9.613       $8.697       82,747
                                                         2012        $8.697       $9.980            0
-------------------------------------------------------------------------------------------------------
Invesco V.I. Core Equity Fund - Series II
                                                         2006       $10.000      $10.785      274,689
                                                         2007       $10.785      $11.454      276,101
                                                         2008       $11.454       $7.857      288,185
                                                         2009        $7.857       $9.900      241,788
                                                         2010        $9.900      $10.648      206,986
                                                         2011       $10.648      $10.452      176,338
                                                         2012       $10.452      $11.691      158,457
                                                         2013       $11.691      $14.840      130,436
                                                         2014       $14.840      $15.756       88,838
-------------------------------------------------------------------------------------------------------
Invesco V.I. Government Securities Fund - Series II
                                                         2011       $10.000      $12.020      316,576
                                                         2012       $12.020      $12.096      290,657
                                                         2013       $12.096      $11.569      202,678
                                                         2014       $11.569      $11.831      183,808
-------------------------------------------------------------------------------------------------------
Invesco V.I. Growth and Income Fund - Series II
                                                         2005       $11.063      $11.950      597,525
                                                         2006       $11.950      $13.645      965,056
                                                         2007       $13.645      $13.771      913,686
                                                         2008       $13.771       $9.191      900,825
                                                         2009        $9.191      $11.230      788,311
                                                         2010       $11.230      $12.403      688,083
                                                         2011       $12.403      $11.935      595,214
                                                         2012       $11.935      $13.436      476,292
                                                         2013       $13.436      $17.694      331,949
                                                         2014       $17.694      $19.156      246,664
-------------------------------------------------------------------------------------------------------
Invesco V.I. Mid Cap Core Equity Fund - Series II
                                                         2005       $10.968      $11.584      295,988
                                                         2006       $11.584      $12.657      442,279
                                                         2007       $12.657      $13.617      404,724
                                                         2008       $13.617       $9.561      420,218
                                                         2009        $9.561      $12.223      365,382
                                                         2010       $12.223      $13.691      354,072
                                                         2011       $13.691      $12.603      317,651
                                                         2012       $12.603      $13.724      237,613
                                                         2013       $13.724      $17.358      169,959
                                                         2014       $17.358      $17.801      134,490
-------------------------------------------------------------------------------------------------------
Invesco V.I. Mid Cap Growth Fund - Series II
                                                         2005       $11.091      $12.133       28,367
                                                         2006       $12.133      $12.534       38,306
                                                         2007       $12.534      $14.510       38,611
                                                         2008       $14.510       $7.594       49,182
                                                         2009        $7.594      $11.692       81,540
                                                         2010       $11.692      $14.650       83,826
                                                         2011       $14.650      $13.073       74,716
                                                         2012       $13.073      $14.367       43,857
                                                         2013       $14.367      $19.321       29,770
                                                         2014       $19.321      $20.485       25,435
</R>

                                     H-45
<R>
                                                                                                            Number of
                                                                                 Accumulation Accumulation    Units
                                                                    For the Year  Unit Value   Unit Value  Outstanding
                                                                       Ending    at Beginning    at End      at End
Sub-Accounts                                                        December 31   of Period    of Period    of Period
----------------------------------------------------------------------------------------------------------------------
Invesco V.I. Value Opportunities Fund - Series II
                                                                        2005       $10.725      $11.133      344,954
                                                                        2006       $11.133      $12.379      418,263
                                                                        2007       $12.379      $12.352      293,495
                                                                        2008       $12.352       $5.849      426,442
                                                                        2009        $5.849       $8.507      343,201
                                                                        2010        $8.507       $8.957      319,363
                                                                        2011        $8.957       $8.519      281,990
                                                                        2012        $8.519       $9.867      201,378
                                                                        2013        $9.867      $12.946      126,948
                                                                        2014       $12.946      $13.560       84,104
----------------------------------------------------------------------------------------------------------------------
Invesco Van Kampen V.I. Government Fund - Series II
                                                                        2005       $10.169      $10.339      330,133
                                                                        2006       $10.339      $10.496      394,113
                                                                        2007       $10.496      $11.057      382,399
                                                                        2008       $11.057      $11.051      541,227
                                                                        2009       $11.051      $10.973      477,547
                                                                        2010       $10.973      $11.331      471,942
                                                                        2011       $11.331      $11.392            0
----------------------------------------------------------------------------------------------------------------------
Janus Aspen Overseas Portfolio - Service Shares
                                                                        2008       $10.000       $7.003      153,801
                                                                        2009        $7.003      $12.347      149,089
                                                                        2010       $12.347      $15.197      152,251
                                                                        2011       $15.197      $10.123      158,712
                                                                        2012       $10.123      $11.279      100,717
                                                                        2013       $11.279      $12.691       73,848
                                                                        2014       $12.691      $10.982       55,277
----------------------------------------------------------------------------------------------------------------------
Janus Aspen Perkins Mid Cap Value Portfolio - Service Shares
                                                                        2005       $11.282      $12.219      435,715
                                                                        2006       $12.219      $13.842      636,948
                                                                        2007       $13.842      $14.604      603,783
                                                                        2008       $14.604      $10.366      628,536
                                                                        2009       $10.366      $13.565      498,879
                                                                        2010       $13.565      $15.407      458,370
                                                                        2011       $15.407      $14.716      389,734
                                                                        2012       $14.716      $16.051      290,229
                                                                        2013       $16.051      $19.881      234,824
                                                                        2014       $19.881      $21.225      182,034
----------------------------------------------------------------------------------------------------------------------
Janus Aspen Perkins Small Company Value Portfolio - Service Shares
                                                                        2005       $10.000      $10.959       52,116
                                                                        2006       $10.959      $13.149      208,907
                                                                        2007       $13.149      $12.153      204,185
                                                                        2008       $12.153       $7.667      200,043
                                                                        2009        $7.667       $7.261            0
----------------------------------------------------------------------------------------------------------------------
Janus Aspen Series Balanced Portfolio - Service Shares
                                                                        2005       $10.605      $11.241      317,819
                                                                        2006       $11.241      $12.220      474,671
                                                                        2007       $12.220      $13.267      419,411
                                                                        2008       $13.267      $10.964      387,556
                                                                        2009       $10.964      $13.555      378,329
                                                                        2010       $13.555      $14.429      330,052
                                                                        2011       $14.429      $14.398      275,246
                                                                        2012       $14.398      $16.070      226,957
                                                                        2013       $16.070      $18.954      172,344
                                                                        2014       $18.954      $20.198      136,802
</R>

                                     H-46
<R>
                                                                                                     Number of
                                                                          Accumulation Accumulation    Units
                                                             For the Year  Unit Value   Unit Value  Outstanding
                                                                Ending    at Beginning    at End      at End
Sub-Accounts                                                 December 31   of Period    of Period    of Period
---------------------------------------------------------------------------------------------------------------
Janus Aspen Series Foreign Stock Portfolio - Service Shares
                                                                 2005       $11.296      $11.815       78,760
                                                                 2006       $11.815      $13.733      125,898
                                                                 2007       $13.733      $15.987      130,612
                                                                 2008       $15.987      $15.037            0
---------------------------------------------------------------------------------------------------------------
Janus Aspen Series Forty Portfolio - Service Shares
                                                                 2005       $11.470      $12.710      109,414
                                                                 2006       $12.710      $13.654      160,923
                                                                 2007       $13.654      $18.366      194,043
                                                                 2008       $18.366      $10.069      230,987
                                                                 2009       $10.069      $14.475      199,558
                                                                 2010       $14.475      $15.174      172,341
                                                                 2011       $15.174      $13.902      146,080
                                                                 2012       $13.902      $16.952      118,380
                                                                 2013       $16.952      $21.844       70,817
                                                                 2014       $21.844      $23.326       50,625
---------------------------------------------------------------------------------------------------------------
Janus Aspen Series INTECH Risk-Managed Core Portfolio -
 Service Shares
                                                                 2005       $11.318      $12.359      136,370
                                                                 2006       $12.359      $13.478      168,301
                                                                 2007       $13.478      $14.082      157,185
                                                                 2008       $14.082       $8.839      156,723
                                                                 2009        $8.839      $10.665      133,212
---------------------------------------------------------------------------------------------------------------
MFS VIT II High Yield - Service Class
                                                                 2013       $10.000      $15.759      158,197
                                                                 2014       $15.759      $15.908      118,084
---------------------------------------------------------------------------------------------------------------
MFS(R) High Income Series - Service Class
                                                                 2005       $10.632      $10.682      363,031
                                                                 2006       $10.682      $11.568      409,143
                                                                 2007       $11.568      $11.563      406,241
                                                                 2008       $11.563       $8.121      391,449
                                                                 2009        $8.121      $11.611      306,693
                                                                 2010       $11.611      $13.077      294,022
                                                                 2011       $13.077      $13.371      273,293
                                                                 2012       $13.371      $15.063      228,130
                                                                 2013       $15.063      $15.265            0
---------------------------------------------------------------------------------------------------------------
MFS(R) Investors Growth Stock Series - Service Class
                                                                 2005       $10.452      $10.725      288,901
                                                                 2006       $10.725      $11.331      530,447
                                                                 2007       $11.331      $12.384      487,942
                                                                 2008       $12.384       $7.683      536,714
                                                                 2009        $7.683      $10.521      428,012
                                                                 2010       $10.521      $11.617      388,447
                                                                 2011       $11.617      $11.480      336,778
                                                                 2012       $11.480      $13.187      273,676
                                                                 2013       $13.187      $16.884      204,575
                                                                 2014       $16.884      $18.470      148,779
---------------------------------------------------------------------------------------------------------------
MFS(R) Investors Trust Series - Service Class
                                                                 2005       $10.790      $11.369       69,837
                                                                 2006       $11.369      $12.614       75,414
                                                                 2007       $12.614      $13.663       71,252
                                                                 2008       $13.663       $8.978       89,673
                                                                 2009        $8.978      $11.187       85,026
                                                                 2010       $11.187      $12.212       69,448
                                                                 2011       $12.212      $11.732       62,992
                                                                 2012       $11.732      $13.725       52,324
                                                                 2013       $13.725      $17.801       35,957
                                                                 2014       $17.801      $19.402       26,032
</R>

                                     H-47
<R>
                                                                                                       Number of
                                                                            Accumulation Accumulation    Units
                                                               For the Year  Unit Value   Unit Value  Outstanding
                                                                  Ending    at Beginning    at End      at End
Sub-Accounts                                                   December 31   of Period    of Period    of Period
-----------------------------------------------------------------------------------------------------------------
MFS(R) New Discovery Series - Service Class
                                                                   2005        $9.926      $10.265      115,243
                                                                   2006       $10.265      $11.413      143,917
                                                                   2007       $11.413      $11.488      133,227
                                                                   2008       $11.488       $6.840      145,739
                                                                   2009        $6.840      $10.971      134,171
                                                                   2010       $10.971      $14.683      134,012
                                                                   2011       $14.683      $12.939      122,440
                                                                   2012       $12.939      $15.400       83,911
                                                                   2013       $15.400      $21.410       77,443
                                                                   2014       $21.410      $19.499       51,836
-----------------------------------------------------------------------------------------------------------------
MFS(R) Total Return Series - Service Class
                                                                   2005       $10.763      $10.872      649,848
                                                                   2006       $10.872      $11.948      786,417
                                                                   2007       $11.948      $12.225      733,113
                                                                   2008       $12.225       $9.349      623,702
                                                                   2009        $9.349      $10.836      575,285
                                                                   2010       $10.836      $11.695      513,670
                                                                   2011       $11.695      $11.697      443,345
                                                                   2012       $11.697      $12.774      341,459
                                                                   2013       $12.774      $14.933      288,713
                                                                   2014       $14.933      $15.912      185,627
-----------------------------------------------------------------------------------------------------------------
MFS(R) Value Series - Service Class
                                                                   2005       $11.154      $11.692      155,911
                                                                   2006       $11.692      $13.872      185,240
                                                                   2007       $13.872      $14.693      178,813
                                                                   2008       $14.693       $9.728      218,888
                                                                   2009        $9.728      $11.728      183,765
                                                                   2010       $11.728      $12.841      196,581
                                                                   2011       $12.841      $12.584      179,027
                                                                   2012       $12.584      $14.356      109,358
                                                                   2013       $14.356      $19.164       83,721
                                                                   2014       $19.164      $20.792       58,443
-----------------------------------------------------------------------------------------------------------------
Oppenheimer Discovery Mid Cap Growth Fund/VA - Service Shares
                                                                   2005       $10.000      $11.707       31,034
                                                                   2006       $11.707      $11.837       86,941
                                                                   2007       $11.837      $12.356       79,497
                                                                   2008       $12.356       $6.178       88,007
                                                                   2009        $6.178       $8.044       77,979
                                                                   2010        $8.044      $10.071       77,409
                                                                   2011       $10.071       $9.998       78,447
                                                                   2012        $9.998      $11.434       69,630
                                                                   2013       $11.434      $15.267       60,472
                                                                   2014       $15.267      $15.861       46,296
-----------------------------------------------------------------------------------------------------------------
Oppenheimer Global Fund/VA - Service Shares
                                                                   2005       $11.369      $12.767      311,510
                                                                   2006       $12.767      $14.753      416,951
                                                                   2007       $14.753      $15.406      390,850
                                                                   2008       $15.406       $9.050      394,574
                                                                   2009        $9.050      $12.416      321,152
                                                                   2010       $12.416      $14.143      280,674
                                                                   2011       $14.143      $12.737      253,922
                                                                   2012       $12.737      $15.166      203,828
                                                                   2013       $15.166      $18.961      154,977
                                                                   2014       $18.961      $19.051      112,800
</R>

                                     H-48
<R>
                                                                                                    Number of
                                                                         Accumulation Accumulation    Units
                                                            For the Year  Unit Value   Unit Value  Outstanding
                                                               Ending    at Beginning    at End      at End
Sub-Accounts                                                December 31   of Period    of Period    of Period
--------------------------------------------------------------------------------------------------------------
Oppenheimer Main Street Small Cap Fund/VA - Service Shares
                                                                2005       $11.303      $12.209       444,920
                                                                2006       $12.209      $13.782       658,435
                                                                2007       $13.782      $13.379       616,978
                                                                2008       $13.379       $8.165       662,016
                                                                2009        $8.165      $11.004       576,312
                                                                2010       $11.004      $13.331       470,789
                                                                2011       $13.331      $12.812       400,433
                                                                2012       $12.812      $14.842       329,397
                                                                2013       $14.842      $20.548       262,728
                                                                2014       $20.548      $22.587       196,508
--------------------------------------------------------------------------------------------------------------
PIMCO Foreign Bond Portfolio (U.S. Dollar-Hedged) -
 Administrative Shares
                                                                2005       $10.363      $10.728       336,138
                                                                2006       $10.728      $10.793       524,188
                                                                2007       $10.793      $11.011       473,852
                                                                2008       $11.011      $10.582       431,280
                                                                2009       $10.582      $12.047       415,232
                                                                2010       $12.047      $12.868       419,495
                                                                2011       $12.868      $13.526       346,787
                                                                2012       $13.526      $14.760       306,129
                                                                2013       $14.760      $14.605       250,415
                                                                2014       $14.605      $15.983       189,665
--------------------------------------------------------------------------------------------------------------
PIMCO Money Market Portfolio - Administrative Shares
                                                                2005        $9.941      $10.057       529,839
                                                                2006       $10.057      $10.359       727,162
                                                                2007       $10.359      $10.696       706,907
                                                                2008       $10.696      $10.767       859,497
                                                                2009       $10.767      $10.612       907,129
                                                                2010       $10.612      $10.453       852,225
                                                                2011       $10.453      $10.297       840,060
                                                                2012       $10.297      $10.144       627,157
                                                                2013       $10.144       $9.993       504,746
                                                                2014        $9.993       $9.838       339,164
--------------------------------------------------------------------------------------------------------------
PIMCO Real Return Portfolio - Administrative Shares
                                                                2005       $10.577      $10.630       855,244
                                                                2006       $10.630      $10.540     1,126,346
                                                                2007       $10.540      $11.484     1,038,569
                                                                2008       $11.484      $10.510     1,164,877
                                                                2009       $10.510      $12.250       983,651
                                                                2010       $12.250      $13.039       897,156
                                                                2011       $13.039      $14.336       786,960
                                                                2012       $14.336      $15.349       687,658
                                                                2013       $15.349      $13.718       465,157
                                                                2014       $13.718      $13.923       343,298
--------------------------------------------------------------------------------------------------------------
PIMCO Total Return Portfolio - Administrative Shares
                                                                2005       $10.264      $10.352       781,636
                                                                2006       $10.352      $10.585     1,399,499
                                                                2007       $10.585      $11.333     1,362,786
                                                                2008       $11.333      $11.695     1,498,179
                                                                2009       $11.695      $13.134     1,507,227
                                                                2010       $13.134      $13.980     1,377,334
                                                                2011       $13.980      $14.261     1,279,562
                                                                2012       $14.261      $15.386     1,062,330
                                                                2013       $15.386      $14.851       772,482
                                                                2014       $14.851      $15.246       494,725
</R>

                                     H-49
<R>
                                                                                       Number of
                                                            Accumulation Accumulation    Units
                                               For the Year  Unit Value   Unit Value  Outstanding
                                                  Ending    at Beginning    at End      at End
Sub-Accounts                                   December 31   of Period    of Period    of Period
-------------------------------------------------------------------------------------------------
Premier VIT OpCap Balanced Portfolio
                                                   2005       $10.790      $10.914        88,648
                                                   2006       $10.914      $11.906       102,842
                                                   2007       $11.906      $11.200       100,376
                                                   2008       $11.200       $7.589        91,560
                                                   2009        $7.589       $7.317             0
-------------------------------------------------------------------------------------------------
Premier VIT OpCap Renaissance Portfolio
                                                   2005       $11.208      $10.535       156,525
                                                   2006       $10.535      $11.552       181,544
                                                   2007       $11.552      $12.091       133,825
                                                   2008       $12.091      $10.924             0
-------------------------------------------------------------------------------------------------
T. Rowe Price Blue Chip Growth Portfolio - II
                                                   2005       $10.470      $10.890       568,834
                                                   2006       $10.890      $11.722     1,046,476
                                                   2007       $11.722      $12.980       921,017
                                                   2008       $12.980       $7.329     1,076,189
                                                   2009        $7.329      $10.230       850,454
                                                   2010       $10.230      $11.683       736,797
                                                   2011       $11.683      $11.659       644,527
                                                   2012       $11.659      $13.533       548,267
                                                   2013       $13.533      $18.767       405,540
                                                   2014       $18.767      $20.109       305,885
-------------------------------------------------------------------------------------------------
T. Rowe Price Equity Income Portfolio - II
                                                   2005       $11.086      $11.318     1,352,680
                                                   2006       $11.318      $13.221     1,710,177
                                                   2007       $13.221      $13.409     1,570,162
                                                   2008       $13.409       $8.413     1,608,523
                                                   2009        $8.413      $10.374     1,377,891
                                                   2010       $10.374      $11.719     1,195,528
                                                   2011       $11.719      $11.421     1,031,213
                                                   2012       $11.421      $13.146       823,514
                                                   2013       $13.146      $16.748       595,171
                                                   2014       $16.748      $17.659       458,609
-------------------------------------------------------------------------------------------------
UIF Growth Portfolio, Class II
                                                   2005       $10.364      $11.783       100,577
                                                   2006       $11.783      $12.043       118,076
                                                   2007       $12.043      $14.424       101,174
                                                   2008       $14.424       $7.193       110,041
                                                   2009        $7.193      $11.694        91,860
                                                   2010       $11.694      $14.116        75,917
                                                   2011       $14.116      $13.475        61,271
                                                   2012       $13.475      $15.130        43,733
                                                   2013       $15.130      $22.005        33,018
                                                   2014       $22.005      $22.983        21,144
-------------------------------------------------------------------------------------------------
UIF U.S. Real Estate Portfolio, Class II
                                                   2005       $12.829      $14.747       680,199
                                                   2006       $14.747      $19.988       844,038
                                                   2007       $19.988      $16.278       713,922
                                                   2008       $16.278       $9.926       725,507
                                                   2009        $9.926      $12.557       582,988
                                                   2010       $12.557      $16.013       449,938
                                                   2011       $16.013      $16.658       391,905
                                                   2012       $16.658      $18.961       306,501
                                                   2013       $18.961      $18.994       248,646
                                                   2014       $18.994      $24.202       174,211
</R>

                                     H-50
<R>
                                                                                                            Number of
                                                                                 Accumulation Accumulation    Units
                                                                    For the Year  Unit Value   Unit Value  Outstanding
                                                                       Ending    at Beginning    at End      at End
Sub-Accounts                                                        December 31   of Period    of Period    of Period
----------------------------------------------------------------------------------------------------------------------
Van Eck VIP Emerging Markets Fund - Initial Class
                                                                        2005       $12.083      $15.703       107,894
                                                                        2006       $15.703      $21.566       197,437
                                                                        2007       $21.566      $29.216       217,317
                                                                        2008       $29.216      $10.130       178,770
                                                                        2009       $10.130      $21.260       178,220
                                                                        2010       $21.260      $26.549       152,306
                                                                        2011       $26.549      $19.411       116,500
                                                                        2012       $19.411      $24.805        83,350
                                                                        2013       $24.805      $27.356        66,803
                                                                        2014       $27.356      $26.820        43,893
----------------------------------------------------------------------------------------------------------------------
Van Eck VIP Global Hard Assets Fund - Initial Class
                                                                        2005       $12.432      $18.565       144,710
                                                                        2006       $18.565      $22.754       196,815
                                                                        2007       $22.754      $32.560       208,194
                                                                        2008       $32.560      $17.269       189,943
                                                                        2009       $17.269      $26.783       172,839
                                                                        2010       $26.783      $34.077       146,787
                                                                        2011       $34.077      $28.030       117,868
                                                                        2012       $28.030      $28.529        92,607
                                                                        2013       $28.529      $31.046        66,782
                                                                        2014       $31.046      $24.725        46,420
----------------------------------------------------------------------------------------------------------------------
Van Eck VIP Multi-Manager Alternative - Initial Class
                                                                        2005        $9.899       $9.766        49,850
                                                                        2006        $9.766      $10.447        69,904
                                                                        2007       $10.447      $10.701        67,655
                                                                        2008       $10.701       $9.156        83,819
                                                                        2009        $9.156      $10.264        84,209
                                                                        2010       $10.264      $10.607        84,068
                                                                        2011       $10.607      $10.206        82,536
                                                                        2012       $10.206      $10.181        57,367
                                                                        2013       $10.181      $10.530        47,261
                                                                        2014       $10.530      $10.256        36,536
----------------------------------------------------------------------------------------------------------------------
Western Asset Variable Global High Yield Bond Portfolio - Class II
                                                                        2005       $10.851      $11.062       729,975
                                                                        2006       $11.062      $12.018     1,048,615
                                                                        2007       $12.018      $11.791     1,007,552
                                                                        2008       $11.791       $8.023       988,849
                                                                        2009        $8.023      $12.232       724,610
                                                                        2010       $12.232      $13.812       624,088
                                                                        2011       $13.812      $13.771       547,554
                                                                        2012       $13.771      $16.007       441,801
                                                                        2013       $16.007      $16.714       360,164
                                                                        2014       $16.714      $16.207       273,843
</R>

<R>
 *  The Accumulation Unit Values in this table reflect a mortality and expense
    risk charge of 1.45% and an administrative expense charge of 0.10%.
</R>

                                     H-51
<R>
     CONSULTANT SOLUTIONS VARIABLE ANNUITIES: LBL Consultant Solution Plus
                                  Contracts -
                                   PROSPECTUS

   ACCUMULATION UNIT VALUE AND NUMBER OF ACCUMULATION UNITS OUTSTANDING FOR
                           EACH VARIABLE SUB-ACCOUNT*

                                      High

                           Mortality & Expense = 2.35
</R>

<R>
                                                                                                            Number of
                                                                                 Accumulation Accumulation    Units
                                                                    For the Year  Unit Value   Unit Value  Outstanding
                                                                       Ending    at Beginning    at End      at End
Sub-Accounts                                                        December 31   of Period    of Period    of Period
----------------------------------------------------------------------------------------------------------------------
Alger Capital Appreciation Portfolio - Class S
                                                                        2005       $10.115      $11.265          0
                                                                        2006       $11.265      $13.074          0
                                                                        2007       $13.074      $16.985          0
                                                                        2008       $16.985       $9.069          0
                                                                        2009        $9.069      $13.331          0
                                                                        2010       $13.331      $14.776          0
                                                                        2011       $14.776      $14.325          0
                                                                        2012       $14.325      $16.473          0
                                                                        2013       $16.473      $21.660          0
                                                                        2014       $21.660      $23.971          0
----------------------------------------------------------------------------------------------------------------------
Alger Large Cap Growth Portfolio - Class S
                                                                        2005       $10.000      $10.899          0
                                                                        2006       $10.899      $11.154          0
                                                                        2007       $11.154      $13.015          0
                                                                        2008       $13.015       $6.818        626
                                                                        2009        $6.818       $9.794          0
                                                                        2010        $9.794      $10.787          0
                                                                        2011       $10.787      $10.443          0
                                                                        2012       $10.443      $11.142          0
                                                                        2013       $11.142      $14.627          0
                                                                        2014       $14.627      $15.775          0
----------------------------------------------------------------------------------------------------------------------
Alger Mid Cap Growth Portfolio - Class S
                                                                        2005       $10.520      $11.242          0
                                                                        2006       $11.242      $12.051          0
                                                                        2007       $12.051      $15.431          0
                                                                        2008       $15.431       $6.251          0
                                                                        2009        $6.251       $9.226          0
                                                                        2010        $9.226      $10.700          0
                                                                        2011       $10.700       $9.542          0
                                                                        2012        $9.542      $10.768          0
                                                                        2013       $10.768      $14.223          0
                                                                        2014       $14.223      $14.927          0
----------------------------------------------------------------------------------------------------------------------
ClearBridge Variable Fundamental All Cap Value Portfolio - Class I
                                                                        2007       $10.000       $9.436          0
                                                                        2008        $9.436       $5.838          0
                                                                        2009        $5.838       $7.367          0
                                                                        2010        $7.367       $8.380          0
                                                                        2011        $8.380       $7.668          0
                                                                        2012        $7.668       $8.600          0
                                                                        2013        $8.600      $11.088          0
                                                                        2014       $11.088      $11.829          0
</R>

                                     H-52
<R>
                                                                                                  Number of
                                                                       Accumulation Accumulation    Units
                                                          For the Year  Unit Value   Unit Value  Outstanding
                                                             Ending    at Beginning    at End      at End
Sub-Accounts                                              December 31   of Period    of Period    of Period
------------------------------------------------------------------------------------------------------------
ClearBridge Variable Large Cap Value Portfolio - Class I
                                                              2007       $10.000       $9.675           0
                                                              2008        $9.675       $6.075           0
                                                              2009        $6.075       $7.379           0
                                                              2010        $7.379       $7.879           0
                                                              2011        $7.879       $8.067           0
                                                              2012        $8.067       $9.168           0
                                                              2013        $9.168      $11.838           0
                                                              2014       $11.838      $12.900           0
------------------------------------------------------------------------------------------------------------
Fidelity VIP Asset Manager Portfolio - Service Class 2
                                                              2005       $10.113      $10.239           0
                                                              2006       $10.239      $10.702           0
                                                              2007       $10.702      $12.022           0
                                                              2008       $12.022       $8.337       1,129
                                                              2009        $8.337      $10.472       1,128
                                                              2010       $10.472      $11.642       1,127
                                                              2011       $11.642      $11.038       1,127
                                                              2012       $11.038      $12.084       1,078
                                                              2013       $12.084      $13.596       1,029
                                                              2014       $13.596      $13.998           0
------------------------------------------------------------------------------------------------------------
Fidelity VIP Contrafund(R) Portfolio - Service Class 2
                                                              2005       $11.274      $12.829           0
                                                              2006       $12.829      $13.947           0
                                                              2007       $13.947      $15.957           0
                                                              2008       $15.957       $8.920           0
                                                              2009        $8.920      $11.788           0
                                                              2010       $11.788      $13.446           0
                                                              2011       $13.446      $12.752           0
                                                              2012       $12.752      $14.447           0
                                                              2013       $14.447      $18.455           0
                                                              2014       $18.455      $20.101         706
------------------------------------------------------------------------------------------------------------
Fidelity VIP Equity-Income Portfolio - Service Class 2
                                                              2005       $10.730      $11.051           0
                                                              2006       $11.051      $12.930           0
                                                              2007       $12.930      $12.772           0
                                                              2008       $12.772       $7.125       1,122
                                                              2009        $7.125       $9.027       1,121
                                                              2010        $9.027      $10.120       1,120
                                                              2011       $10.120       $9.937       1,120
                                                              2012        $9.937      $11.346       1,071
                                                              2013       $11.346      $14.148       1,022
                                                              2014       $14.148      $14.972         936
------------------------------------------------------------------------------------------------------------
Fidelity VIP Growth Portfolio - Service Class 2
                                                              2005        $9.709       $9.993           0
                                                              2006        $9.993      $10.390           0
                                                              2007       $10.390      $12.836           0
                                                              2008       $12.836       $6.597           0
                                                              2009        $6.597       $8.235           0
                                                              2010        $8.235       $9.951           0
                                                              2011        $9.951       $9.704           0
                                                              2012        $9.704      $10.829           0
                                                              2013       $10.829      $14.367           0
                                                              2014       $14.367      $15.559           0
</R>

                                     H-53
<R>
Number of
Accumulation Accumulation Units
For the Year Unit Value Unit Value Outstanding
Ending at Beginning at End at End
Sub-Accounts December 31 of Period of Period of Period
------------------------------------------------------------------------------------------------------------------
Fidelity VIP Index 500 Portfolio - Service Class 2
2005 $10.560 $10.771 0
2006 $10.771 $12.130 0
2007 $12.130 $12.444 0
2008 $12.444 $7.628 0
2009 $7.628 $9.398 0
2010 $9.398 $10.519 0
2011 $10.519 $10.445 0
2012 $10.445 $11.781 0
2013 $11.781 $15.160 0
2014 $15.160 $16.753 0
------------------------------------------------------------------------------------------------------------------
Fidelity VIP Investment Grade Bond Portfolio - Service Class 2
2005 $10.112 $10.051 0
2006 $10.051 $10.211 0
2007 $10.211 $10.367 0
2008 $10.367 $9.763 0
2009 $9.763 $10.997 0
2010 $10.997 $11.537 0
2011 $11.537 $12.047 0
2012 $12.047 $12.410 0
2013 $12.410 $11.855 0
2014 $11.855 $12.215 0
------------------------------------------------------------------------------------------------------------------
Fidelity VIP Money Market Portfolio - Service Class 2
2005 $9.864 $9.890 0
2006 $9.890 $10.095 0
2007 $10.095 $10.334 0
2008 $10.334 $10.360 408
2009 $10.360 $10.154 0
2010 $10.154 $9.912 0
2011 $9.912 $9.671 0
2012 $9.671 $9.435 0
2013 $9.435 $9.204 0
2014 $9.204 $8.980 0
------------------------------------------------------------------------------------------------------------------
Fidelity VIP Overseas Portfolio - Service Class 2
2005 $10.820 $12.539 0
2006 $12.539 $14.406 0
2007 $14.406 $16.448 0
2008 $16.448 $8.991 925
2009 $8.991 $11.070 449
2010 $11.070 $12.185 448
2011 $12.185 $9.826 448
2012 $9.826 $11.537 429
2013 $11.537 $14.650 409
2014 $14.650 $13.106 0
------------------------------------------------------------------------------------------------------------------
Guggenheim VIF Long Short Equity Fund
2005 $10.491 $11.638 0
2006 $11.638 $12.647 0
2007 $12.647 $15.141 0
2008 $15.141 $8.753 0
2009 $8.753 $10.869 0
2010 $10.869 $11.791 0
2011 $11.791 $10.748 0
2012 $10.748 $10.949 0
2013 $10.949 $12.545 0
2014 $12.545 $12.580 0
------------------------------------------------------------------------------------------------------------------
Invesco V.I. American Franchise Fund - Series II
2012 $10.000 $8.854 0
2013 $8.854 $12.075 0
2014 $12.075 $12.741 0
</R>
H-54
<R>
                                                                                             Number of
                                                                  Accumulation Accumulation    Units
                                                     For the Year  Unit Value   Unit Value  Outstanding
                                                        Ending    at Beginning    at End      at End
Sub-Accounts                                         December 31   of Period    of Period    of Period
-------------------------------------------------------------------------------------------------------
Invesco V.I. Capital Appreciation - Series II
                                                         2005       $10.198      $10.803         0
                                                         2006       $10.803      $11.177         0
                                                         2007       $11.177      $12.181         0
                                                         2008       $12.181       $6.817         0
                                                         2009        $6.817       $8.028         0
                                                         2010        $8.028       $9.022         0
                                                         2011        $9.022       $8.087         0
                                                         2012        $8.087       $9.253         0
-------------------------------------------------------------------------------------------------------
Invesco V.I. Core Equity Fund - Series II
                                                         2006       $10.000      $10.719         0
                                                         2007       $10.719      $11.279         0
                                                         2008       $11.279       $7.666         0
                                                         2009        $7.666       $9.571         0
                                                         2010        $9.571      $10.200         0
                                                         2011       $10.200       $9.921         0
                                                         2012        $9.921      $10.995         0
                                                         2013       $10.995      $13.829         0
                                                         2014       $13.829      $14.549         0
-------------------------------------------------------------------------------------------------------
Invesco V.I. Government Securities Fund - Series II
                                                         2011       $10.000      $11.178         0
                                                         2012       $11.178      $11.146         0
                                                         2013       $11.146      $10.562         0
                                                         2014       $10.562      $10.704         0
-------------------------------------------------------------------------------------------------------
Invesco V.I. Growth and Income Fund - Series II
                                                         2005       $10.971      $11.743         0
                                                         2006       $11.743      $13.286         0
                                                         2007       $13.286      $13.286         0
                                                         2008       $13.286       $8.785         0
                                                         2009        $8.785      $10.636         0
                                                         2010       $10.636      $11.641         0
                                                         2011       $11.641      $11.099         0
                                                         2012       $11.099      $12.380         0
                                                         2013       $12.380      $16.155         0
                                                         2014       $16.155      $17.330         0
-------------------------------------------------------------------------------------------------------
Invesco V.I. Mid Cap Core Equity Fund - Series II
                                                         2005       $10.877      $11.383         0
                                                         2006       $11.383      $12.324         0
                                                         2007       $12.324      $13.137         0
                                                         2008       $13.137       $9.139         0
                                                         2009        $9.139      $11.577         0
                                                         2010       $11.577      $12.849         0
                                                         2011       $12.849      $11.720         0
                                                         2012       $11.720      $12.646         0
                                                         2013       $12.646      $15.848         0
                                                         2014       $15.848      $16.104         0
-------------------------------------------------------------------------------------------------------
Invesco V.I. Mid Cap Growth Fund - Series II
                                                         2005       $10.999      $11.923         0
                                                         2006       $11.923      $12.204         0
                                                         2007       $12.204      $13.998         0
                                                         2008       $13.998       $7.259         0
                                                         2009        $7.259      $11.074         0
                                                         2010       $11.074      $13.749         0
                                                         2011       $13.749      $12.157         0
                                                         2012       $12.157      $13.238         0
                                                         2013       $13.238      $17.640         0
                                                         2014       $17.640      $18.532         0
</R>

                                     H-55
<R>
                                                                                                            Number of
                                                                                 Accumulation Accumulation    Units
                                                                    For the Year  Unit Value   Unit Value  Outstanding
                                                                       Ending    at Beginning    at End      at End
Sub-Accounts                                                        December 31   of Period    of Period    of Period
----------------------------------------------------------------------------------------------------------------------
Invesco V.I. Value Opportunities Fund - Series II
                                                                        2005       $10.636      $10.939         0
                                                                        2006       $10.939      $12.053         0
                                                                        2007       $12.053      $11.917         0
                                                                        2008       $11.917       $5.591         0
                                                                        2009        $5.591       $8.057         0
                                                                        2010        $8.057       $8.406         0
                                                                        2011        $8.406       $7.922         0
                                                                        2012        $7.922       $9.092         0
                                                                        2013        $9.092      $11.820         0
                                                                        2014       $11.820      $12.266         0
----------------------------------------------------------------------------------------------------------------------
Invesco Van Kampen V.I. Government Fund - Series II
                                                                        2005       $10.084      $10.160         0
                                                                        2006       $10.160      $10.220         0
                                                                        2007       $10.220      $10.667         0
                                                                        2008       $10.667      $10.563         0
                                                                        2009       $10.563      $10.393         0
                                                                        2010       $10.393      $10.634         0
                                                                        2011       $10.634      $10.660         0
----------------------------------------------------------------------------------------------------------------------
Janus Aspen Overseas Portfolio - Service Shares
                                                                        2008       $10.000       $6.694         0
                                                                        2009        $6.694      $11.694         0
                                                                        2010       $11.694      $14.262         0
                                                                        2011       $14.262       $9.414         0
                                                                        2012        $9.414      $10.393         0
                                                                        2013       $10.393      $11.586         0
                                                                        2014       $11.586       $9.934         0
----------------------------------------------------------------------------------------------------------------------
Janus Aspen Perkins Mid Cap Value Portfolio - Service Shares
                                                                        2005       $11.188      $12.007         0
                                                                        2006       $12.007      $13.478         0
                                                                        2007       $13.478      $14.089         0
                                                                        2008       $14.089       $9.909         0
                                                                        2009        $9.909      $12.849         0
                                                                        2010       $12.849      $14.460         0
                                                                        2011       $14.460      $13.686         0
                                                                        2012       $13.686      $14.790         0
                                                                        2013       $14.790      $18.152         0
                                                                        2014       $18.152      $19.201         0
----------------------------------------------------------------------------------------------------------------------
Janus Aspen Perkins Small Company Value Portfolio - Service Shares
                                                                        2005       $10.000      $10.891         0
                                                                        2006       $10.891      $12.949         0
                                                                        2007       $12.949      $11.858         0
                                                                        2008       $11.858       $7.412         0
                                                                        2009        $7.412       $6.999         0
----------------------------------------------------------------------------------------------------------------------
Janus Aspen Series Balanced Portfolio - Service Shares
                                                                        2005       $10.517      $11.046         0
                                                                        2006       $11.046      $11.899         0
                                                                        2007       $11.899      $12.799         0
                                                                        2008       $12.799      $10.481         0
                                                                        2009       $10.481      $12.839         0
                                                                        2010       $12.839      $13.542         0
                                                                        2011       $13.542      $13.390         0
                                                                        2012       $13.390      $14.808         0
                                                                        2013       $14.808      $17.306         0
                                                                        2014       $17.306      $18.273         0
</R>

                                     H-56
<R>
                                                                                                     Number of
                                                                          Accumulation Accumulation    Units
                                                             For the Year  Unit Value   Unit Value  Outstanding
                                                                Ending    at Beginning    at End      at End
Sub-Accounts                                                 December 31   of Period    of Period    of Period
---------------------------------------------------------------------------------------------------------------
Janus Aspen Series Foreign Stock Portfolio - Service Shares
                                                                 2005       $11.202      $11.610         0
                                                                 2006       $11.610      $13.372         0
                                                                 2007       $13.372      $15.423         0
                                                                 2008       $15.423      $14.462         0
---------------------------------------------------------------------------------------------------------------
Janus Aspen Series Forty Portfolio - Service Shares
                                                                 2005       $11.374      $12.490         0
                                                                 2006       $12.490      $13.295         0
                                                                 2007       $13.295      $17.719         0
                                                                 2008       $17.719       $9.625         0
                                                                 2009        $9.625      $13.710         0
                                                                 2010       $13.710      $14.241         0
                                                                 2011       $14.241      $12.928         0
                                                                 2012       $12.928      $15.620         0
                                                                 2013       $15.620      $19.943         0
                                                                 2014       $19.943      $21.102         0
---------------------------------------------------------------------------------------------------------------
Janus Aspen Series INTECH Risk-Managed Core Portfolio -
 Service Shares
                                                                 2005       $11.224      $12.144         0
                                                                 2006       $12.144      $13.124         0
                                                                 2007       $13.124      $13.585         0
                                                                 2008       $13.585       $8.449         0
                                                                 2009        $8.449      $10.101         0
                                                                 2010       $10.101      $10.804         0
---------------------------------------------------------------------------------------------------------------
MFS VIT II High Yield - Service Class
                                                                 2013       $10.000      $14.388         0
                                                                 2014       $14.388      $14.392         0
---------------------------------------------------------------------------------------------------------------
MFS(R) High Income Series - Service Class
                                                                 2005       $10.544      $10.497         0
                                                                 2006       $10.497      $11.264         0
                                                                 2007       $11.264      $11.156         0
                                                                 2008       $11.156       $7.763         0
                                                                 2009        $7.763      $10.998         0
                                                                 2010       $10.998      $12.273         0
                                                                 2011       $12.273      $12.434         0
                                                                 2012       $12.434      $13.879         0
                                                                 2013       $13.879      $13.985         0
---------------------------------------------------------------------------------------------------------------
MFS(R) Investors Growth Stock Series - Service Class
                                                                 2005       $10.365      $10.539         0
                                                                 2006       $10.539      $11.033         0
                                                                 2007       $12.053      $11.917         0
                                                                 2008       $11.917       $7.344         0
                                                                 2009        $7.344       $9.965         0
                                                                 2010        $9.965      $10.903         0
                                                                 2011       $10.903      $10.676         0
                                                                 2012       $10.676      $12.151         0
                                                                 2013       $12.151      $15.416         0
                                                                 2014       $15.416      $16.709         0
---------------------------------------------------------------------------------------------------------------
MFS(R) Investors Trust Series - Service Class
                                                                 2005       $10.700      $11.172         0
                                                                 2006       $11.172      $12.282         0
                                                                 2007       $11.033      $11.947         0
                                                                 2008       $11.947       $8.582         0
                                                                 2009        $8.582      $10.596         0
                                                                 2010       $10.596      $11.461         0
                                                                 2011       $11.461      $10.910         0
                                                                 2012       $10.910      $12.646         0
                                                                 2013       $12.646      $16.252         0
                                                                 2014       $16.252      $17.552         0
</R>

                                     H-57
<R>
                                                                                                       Number of
                                                                            Accumulation Accumulation    Units
                                                               For the Year  Unit Value   Unit Value  Outstanding
                                                                  Ending    at Beginning    at End      at End
Sub-Accounts                                                   December 31   of Period    of Period    of Period
-----------------------------------------------------------------------------------------------------------------
MFS(R) New Discovery Series - Service Class
                                                                   2005        $9.844      $10.086           0
                                                                   2006       $10.086      $11.112           0
                                                                   2007       $11.112      $11.082           0
                                                                   2008       $11.082       $6.538           0
                                                                   2009        $6.538      $10.391           0
                                                                   2010       $10.391      $13.780           0
                                                                   2011       $13.780      $12.032           0
                                                                   2012       $12.032      $14.189           0
                                                                   2013       $14.189      $19.547           0
                                                                   2014       $19.547      $17.639           0
-----------------------------------------------------------------------------------------------------------------
MFS(R) Total Return Series - Service Class
                                                                   2005       $10.674      $10.684           0
                                                                   2006       $10.684      $11.634           0
                                                                   2007       $11.634      $11.794           0
                                                                   2008       $11.794       $8.937       2,314
                                                                   2009        $8.937      $10.263       1,124
                                                                   2010       $10.263      $10.976       1,123
                                                                   2011       $10.976      $10.878       1,123
                                                                   2012       $10.878      $11.771       1,074
                                                                   2013       $11.771      $13.634       1,025
                                                                   2014       $13.634      $14.395         779
-----------------------------------------------------------------------------------------------------------------
MFS(R) Value Series - Service Class
                                                                   2005       $11.061      $11.489           0
                                                                   2006       $11.489      $13.507           0
                                                                   2007       $13.507      $14.175           0
                                                                   2008       $14.175       $9.299           0
                                                                   2009        $9.299      $11.108           0
                                                                   2010       $11.108      $12.052           0
                                                                   2011       $12.052      $11.702           0
                                                                   2012       $11.702      $13.228           0
                                                                   2013       $13.228      $17.497           0
                                                                   2014       $17.497      $18.810           0
-----------------------------------------------------------------------------------------------------------------
Oppenheimer Discovery Mid Cap Growth Fund/VA - Service Shares
                                                                   2005       $10.000      $11.635           0
                                                                   2006       $11.635      $11.657           0
                                                                   2007       $11.657      $12.056           0
                                                                   2008       $12.056       $5.973           0
                                                                   2009        $5.973       $7.706           0
                                                                   2010        $7.706       $9.559           0
                                                                   2011        $9.559       $9.404           0
                                                                   2012        $9.404      $10.656           0
                                                                   2013       $10.656      $14.098           0
                                                                   2014       $14.098      $14.512           0
-----------------------------------------------------------------------------------------------------------------
Oppenheimer Global Fund/VA - Service Shares
                                                                   2005       $11.275      $12.546           0
                                                                   2006       $12.546      $14.365           0
                                                                   2007       $14.365      $14.863           0
                                                                   2008       $14.863       $8.651           0
                                                                   2009        $8.651      $11.760           0
                                                                   2010       $11.760      $13.274           0
                                                                   2011       $13.274      $11.845           0
                                                                   2012       $11.845      $13.975           0
                                                                   2013       $13.975      $17.312           0
                                                                   2014       $17.312      $17.235           0
</R>

                                     H-58
<R>
                                                                                                    Number of
                                                                         Accumulation Accumulation    Units
                                                            For the Year  Unit Value   Unit Value  Outstanding
                                                               Ending    at Beginning    at End      at End
Sub-Accounts                                                December 31   of Period    of Period    of Period
--------------------------------------------------------------------------------------------------------------
Oppenheimer Main Street Small Cap Fund/VA - Service Shares
                                                                2005       $11.209      $11.997           0
                                                                2006       $11.997      $13.420           0
                                                                2007       $13.420      $12.907           0
                                                                2008       $12.907       $7.805           0
                                                                2009        $7.805      $10.422           0
                                                                2010       $10.422      $12.511           0
                                                                2011       $12.511      $11.915           0
                                                                2012       $11.915      $13.676           0
                                                                2013       $13.676      $18.760           0
                                                                2014       $18.760      $20.434           0
--------------------------------------------------------------------------------------------------------------
PIMCO Foreign Bond Portfolio (U.S. Dollar-Hedged) -
 Administrative Shares
                                                                2005       $10.276      $10.541           0
                                                                2006       $10.541      $10.509           0
                                                                2007       $10.509      $10.623           0
                                                                2008       $10.623      $10.116           0
                                                                2009       $10.116      $11.410           0
                                                                2010       $11.410      $12.077           0
                                                                2011       $12.077      $12.579           0
                                                                2012       $12.579      $13.601           0
                                                                2013       $13.601      $13.334           0
                                                                2014       $13.334      $14.459           0
--------------------------------------------------------------------------------------------------------------
PIMCO Money Market Portfolio - Administrative Shares
                                                                2005        $9.858       $9.883           0
                                                                2006        $9.883      $10.087           0
                                                                2007       $10.087      $10.318           0
                                                                2008       $10.318      $10.292           0
                                                                2009       $10.292      $10.052           0
                                                                2010       $10.052       $9.810           0
                                                                2011        $9.810       $9.576           0
                                                                2012        $9.576       $9.347           0
                                                                2013        $9.347       $9.123           0
                                                                2014        $9.123       $8.901           0
--------------------------------------------------------------------------------------------------------------
PIMCO Real Return Portfolio - Administrative Shares
                                                                2005       $10.489      $10.446           0
                                                                2006       $10.446      $10.263           0
                                                                2007       $10.263      $11.079           0
                                                                2008       $11.079      $10.047           0
                                                                2009       $10.047      $11.603           0
                                                                2010       $11.603      $12.237           0
                                                                2011       $12.237      $13.332           0
                                                                2012       $13.332      $14.143           0
                                                                2013       $14.143      $12.525           0
                                                                2014       $12.525      $12.596           0
--------------------------------------------------------------------------------------------------------------
PIMCO Total Return Portfolio - Administrative Shares
                                                                2005       $10.178      $10.172           0
                                                                2006       $10.172      $10.306           0
                                                                2007       $10.306      $10.934           0
                                                                2008       $10.934      $11.180       1,432
                                                                2009       $11.180      $12.441         675
                                                                2010       $12.441      $13.121         674
                                                                2011       $13.121      $13.263         674
                                                                2012       $13.263      $14.178         645
                                                                2013       $14.178      $13.559         616
                                                                2014       $13.559      $13.793           0
</R>

                                     H-59
<R>
                                                                                       Number of
                                                            Accumulation Accumulation    Units
                                               For the Year  Unit Value   Unit Value  Outstanding
                                                  Ending    at Beginning    at End      at End
Sub-Accounts                                   December 31   of Period    of Period    of Period
-------------------------------------------------------------------------------------------------
Premier VIT OpCap Balanced Portfolio
                                                   2005       $10.724      $10.749           0
                                                   2006       $10.749      $11.618           0
                                                   2007       $11.618      $10.829           0
                                                   2008       $10.829       $7.270           0
                                                   2009        $7.270       $6.989           0
-------------------------------------------------------------------------------------------------
Premier VIT OpCap Renaissance Portfolio
                                                   2005       $11.115      $10.352           0
                                                   2006       $10.352      $11.248           0
                                                   2007       $11.248      $11.665           0
                                                   2008       $11.665      $10.534           0
-------------------------------------------------------------------------------------------------
T. Rowe Price Blue Chip Growth Portfolio - II
                                                   2005       $10.383      $10.701           0
                                                   2006       $10.701      $11.413           0
                                                   2007       $11.413      $12.523           0
                                                   2008       $12.523       $7.005           0
                                                   2009        $7.005       $9.690           0
                                                   2010        $9.690      $10.965           0
                                                   2011       $10.965      $10.842           0
                                                   2012       $10.842      $12.470           0
                                                   2013       $12.470      $17.134           0
                                                   2014       $17.134      $18.192         621
-------------------------------------------------------------------------------------------------
T. Rowe Price Equity Income Portfolio - II
                                                   2005       $10.993      $11.121           0
                                                   2006       $11.121      $12.873           0
                                                   2007       $12.873      $12.936           0
                                                   2008       $12.936       $8.042       1,333
                                                   2009        $8.042       $9.826           0
                                                   2010        $9.826      $10.999           0
                                                   2011       $10.999      $10.620           0
                                                   2012       $10.620      $12.113           0
                                                   2013       $12.113      $15.291           0
                                                   2014       $15.291      $15.976           0
-------------------------------------------------------------------------------------------------
UIF Growth Portfolio, Class II
                                                   2005       $10.278      $11.579           0
                                                   2006       $11.579      $11.726           0
                                                   2007       $11.726      $13.915           0
                                                   2008       $13.915       $6.875           0
                                                   2009        $6.875      $11.076           0
                                                   2010       $11.076      $13.248           0
                                                   2011       $13.248      $12.531           0
                                                   2012       $12.531      $13.941           0
                                                   2013       $13.941      $20.091           0
                                                   2014       $20.091      $20.792           0
-------------------------------------------------------------------------------------------------
UIF U.S. Real Estate Portfolio, Class II
                                                   2005       $12.722      $14.491           0
                                                   2006       $14.491      $19.462           0
                                                   2007       $19.462      $15.704           0
                                                   2008       $15.704       $9.488           0
                                                   2009        $9.488      $11.893           0
                                                   2010       $11.893      $15.028           0
                                                   2011       $15.028      $15.491           0
                                                   2012       $15.491      $17.471           0
                                                   2013       $17.471      $17.341           0
                                                   2014       $17.341      $21.895           0
</R>

                                     H-60
<R>
                                                                                                            Number of
                                                                                 Accumulation Accumulation    Units
                                                                    For the Year  Unit Value   Unit Value  Outstanding
                                                                       Ending    at Beginning    at End      at End
Sub-Accounts                                                        December 31   of Period    of Period    of Period
----------------------------------------------------------------------------------------------------------------------
Van Eck VIP Emerging Markets Fund - Initial Class
                                                                        2005       $11.983      $15.431          0
                                                                        2006       $15.431      $20.999          0
                                                                        2007       $20.999      $28.186          0
                                                                        2008       $28.186       $9.683          0
                                                                        2009        $9.683      $20.137          0
                                                                        2010       $20.137      $24.917          0
                                                                        2011       $24.917      $18.051          0
                                                                        2012       $18.051      $22.856          0
                                                                        2013       $22.856      $24.977          0
                                                                        2014       $24.977      $24.263        218
----------------------------------------------------------------------------------------------------------------------
Van Eck VIP Global Hard Assets Fund - Initial Class
                                                                        2005       $12.329      $18.243          0
                                                                        2006       $18.243      $22.156          0
                                                                        2007       $22.156      $31.412          0
                                                                        2008       $31.412      $16.508          0
                                                                        2009       $16.508      $25.368          0
                                                                        2010       $25.368      $31.982          0
                                                                        2011       $31.982      $26.067          0
                                                                        2012       $26.067      $26.288          0
                                                                        2013       $26.288      $28.345          0
                                                                        2014       $28.345      $22.367          0
----------------------------------------------------------------------------------------------------------------------
Van Eck VIP Multi-Manager Alternative - Initial Class
                                                                        2005        $9.817       $9.596          0
                                                                        2006        $9.596      $10.172          0
                                                                        2007       $10.172      $10.324          0
                                                                        2008       $10.324       $8.752          0
                                                                        2009        $8.752       $9.721          0
                                                                        2010        $9.721       $9.955          0
                                                                        2011        $9.955       $9.491          0
                                                                        2012        $9.491       $9.381          0
                                                                        2013        $9.381       $9.614          0
                                                                        2014        $9.614       $9.278          0
----------------------------------------------------------------------------------------------------------------------
Western Asset Variable Global High Yield Bond Portfolio - Class II
                                                                        2005       $10.761      $10.870          0
                                                                        2006       $10.870      $11.701          0
                                                                        2007       $11.701      $11.376          0
                                                                        2008       $11.376       $7.669          0
                                                                        2009        $7.669      $11.585          0
                                                                        2010       $11.585      $12.963          0
                                                                        2011       $12.963      $12.807          0
                                                                        2012       $12.807      $14.750          0
                                                                        2013       $14.750      $15.260          0
                                                                        2014       $15.260      $14.662          0
</R>

<R>
 *  The Accumulation Unit Values in this table reflect a mortality and expense
    risk charge of 2.35% and an administrative expense charge of 0.10%.
</R>

                                     H-61
<R>
    CONSULTANT SOLUTIONS VARIABLE ANNUITIES: LBL Consultant Solution Select
                                  Contracts -
                                   PROSPECTUS

   ACCUMULATION UNIT VALUE AND NUMBER OF ACCUMULATION UNITS OUTSTANDING FOR
                           EACH VARIABLE SUB-ACCOUNT*

                                      Low

                           Mortality & Expense = 1.7
</R>

<R>
                                                                                                            Number of
                                                                                 Accumulation Accumulation    Units
                                                                    For the Year  Unit Value   Unit Value  Outstanding
                                                                       Ending    at Beginning    at End      at End
Sub-Accounts                                                        December 31   of Period    of Period    of Period
----------------------------------------------------------------------------------------------------------------------
Alger Capital Appreciation Portfolio - Class S
                                                                        2005       $10.177      $11.409      39,056
                                                                        2006       $11.409      $13.328       4,489
                                                                        2007       $13.328      $17.432      18,890
                                                                        2008       $17.432       $9.369      12,250
                                                                        2009        $9.369      $13.864       8,797
                                                                        2010       $13.864      $15.470       4,945
                                                                        2011       $15.470      $15.097       2,846
                                                                        2012       $15.097      $17.477       2,301
                                                                        2013       $17.477      $23.133       1,926
                                                                        2014       $23.133      $25.772       1,300
----------------------------------------------------------------------------------------------------------------------
Alger Large Cap Growth Portfolio - Class S
                                                                        2005       $10.061      $11.038      13,863
                                                                        2006       $11.038      $11.371      10,863
                                                                        2007       $11.371      $13.357      10,486
                                                                        2008       $13.357       $7.044      20,165
                                                                        2009        $7.044      $10.186      15,504
                                                                        2010       $10.186      $11.294      14,306
                                                                        2011       $11.294      $11.006      13,568
                                                                        2012       $11.006      $11.821      12,190
                                                                        2013       $11.821      $15.622      10,963
                                                                        2014       $15.622      $16.961      10,450
----------------------------------------------------------------------------------------------------------------------
Alger Mid Cap Growth Portfolio - Class S
                                                                        2005       $10.584      $11.385      54,020
                                                                        2006       $11.385      $12.286       5,659
                                                                        2007       $12.286      $15.837      32,351
                                                                        2008       $15.837       $6.458      30,915
                                                                        2009        $6.458       $9.596      15,709
                                                                        2010        $9.596      $11.203      14,156
                                                                        2011       $11.203      $10.056      12,397
                                                                        2012       $10.056      $11.424       6,470
                                                                        2013       $11.424      $15.191       4,773
                                                                        2014       $15.191      $16.048       3,896
----------------------------------------------------------------------------------------------------------------------
ClearBridge Variable Fundamental All Cap Value Portfolio - Class I
                                                                        2007       $10.000       $9.479         553
                                                                        2008        $9.479       $5.904       8,461
                                                                        2009        $5.904       $7.499       6,476
                                                                        2010        $7.499       $8.587       6,522
                                                                        2011        $8.587       $7.910       7,429
                                                                        2012        $7.910       $8.931       7,479
                                                                        2013        $8.931      $11.592       2,349
                                                                        2014       $11.592      $12.442           0
</R>

                                     H-62
<R>
                                                                                                  Number of
                                                                       Accumulation Accumulation    Units
                                                          For the Year  Unit Value   Unit Value  Outstanding
                                                             Ending    at Beginning    at End      at End
Sub-Accounts                                              December 31   of Period    of Period    of Period
------------------------------------------------------------------------------------------------------------
ClearBridge Variable Large Cap Value Portfolio - Class I
                                                              2007       $10.000       $9.718       10,050
                                                              2008        $9.718       $6.144        8,585
                                                              2009        $6.144       $7.511        4,311
                                                              2010        $7.511       $8.074        3,403
                                                              2011        $8.074       $8.322        4,149
                                                              2012        $8.322       $9.520        3,911
                                                              2013        $9.520      $12.375        2,511
                                                              2014       $12.375      $13.576        2,540
------------------------------------------------------------------------------------------------------------
Fidelity VIP Asset Manager Portfolio - Service Class 2
                                                              2005       $10.174      $10.369       26,325
                                                              2006       $10.369      $10.910       19,985
                                                              2007       $10.910      $12.338       10,303
                                                              2008       $12.338       $8.614       15,530
                                                              2009        $8.614      $10.891       13,118
                                                              2010       $10.891      $12.189        8,427
                                                              2011       $12.189      $11.633        8,191
                                                              2012       $11.633      $12.821       10,063
                                                              2013       $12.821      $14.521        7,851
                                                              2014       $14.521      $15.049        6,124
------------------------------------------------------------------------------------------------------------
Fidelity VIP Contrafund(R) Portfolio - Service Class 2
                                                              2005       $11.342      $12.993      144,919
                                                              2006       $12.993      $14.218       32,667
                                                              2007       $14.218      $16.377       80,603
                                                              2008       $16.377       $9.216      102,855
                                                              2009        $9.216      $12.260       81,493
                                                              2010       $12.260      $14.077       53,895
                                                              2011       $14.077      $13.440       45,208
                                                              2012       $13.440      $15.327       37,230
                                                              2013       $15.327      $19.710       24,831
                                                              2014       $19.710      $21.611       23,735
------------------------------------------------------------------------------------------------------------
Fidelity VIP Equity-Income Portfolio - Service Class 2
                                                              2005       $10.795      $11.192       93,792
                                                              2006       $11.192      $13.182       19,478
                                                              2007       $13.182      $13.108       98,411
                                                              2008       $13.108       $7.361      102,049
                                                              2009        $7.361       $9.388       75,431
                                                              2010        $9.388      $10.595       78,583
                                                              2011       $10.595      $10.473       57,292
                                                              2012       $10.473      $12.038       60,518
                                                              2013       $12.038      $15.111       52,689
                                                              2014       $15.111      $16.097       45,304
------------------------------------------------------------------------------------------------------------
Fidelity VIP Growth Portfolio - Service Class 2
                                                              2005        $9.768      $10.120       55,605
                                                              2006       $10.120      $10.592       11,849
                                                              2007       $10.592      $13.173       75,363
                                                              2008       $13.173       $6.816       71,379
                                                              2009        $6.816       $8.565       57,607
                                                              2010        $8.565      $10.418       58,821
                                                              2011       $10.418      $10.228       39,731
                                                              2012       $10.228      $11.490       48,616
                                                              2013       $11.490      $15.345       38,482
                                                              2014       $15.345      $16.728       42,969
</R>

                                     H-63
<R>
                                                                                                        Number of
                                                                             Accumulation Accumulation    Units
                                                                For the Year  Unit Value   Unit Value  Outstanding
                                                                   Ending    at Beginning    at End      at End
Sub-Accounts                                                    December 31   of Period    of Period    of Period
------------------------------------------------------------------------------------------------------------------
Fidelity VIP Index 500 Portfolio - Service Class 2
                                                                    2005       $10.624      $10.908      263,983
                                                                    2006       $10.908      $12.366       43,696
                                                                    2007       $12.366      $12.772      211,816
                                                                    2008       $12.772       $7.881      225,131
                                                                    2009        $7.881       $9.775      188,699
                                                                    2010        $9.775      $11.013      186,215
                                                                    2011       $11.013      $11.008      112,062
                                                                    2012       $11.008      $12.499       96,761
                                                                    2013       $12.499      $16.191      101,931
                                                                    2014       $16.191      $18.012       85,546
------------------------------------------------------------------------------------------------------------------
Fidelity VIP Investment Grade Bond Portfolio - Service Class 2
                                                                    2005       $10.173      $10.180      101,437
                                                                    2006       $10.180      $10.410       31,813
                                                                    2007       $10.410      $10.639       90,643
                                                                    2008       $10.639      $10.086      138,607
                                                                    2009       $10.086      $11.437      109,299
                                                                    2010       $11.437      $12.079       73,245
                                                                    2011       $12.079      $12.697       52,851
                                                                    2012       $12.697      $13.166       43,691
                                                                    2013       $13.166      $12.662       32,645
                                                                    2014       $12.662      $13.132       22,768
------------------------------------------------------------------------------------------------------------------
Fidelity VIP Money Market Portfolio - Service Class 2
                                                                    2005        $9.924      $10.016      228,196
                                                                    2006       $10.016      $10.291       33,135
                                                                    2007       $10.291      $10.606      258,815
                                                                    2008       $10.606      $10.703      280,115
                                                                    2009       $10.703      $10.560      204,879
                                                                    2010       $10.560      $10.378      115,332
                                                                    2011       $10.378      $10.193      105,038
                                                                    2012       $10.193      $10.010       93,580
                                                                    2013       $10.010       $9.830       99,838
                                                                    2014        $9.830       $9.654       58,641
------------------------------------------------------------------------------------------------------------------
Fidelity VIP Overseas Portfolio - Service Class 2
                                                                    2005       $10.886      $12.698       49,873
                                                                    2006       $12.698      $14.687       16,491
                                                                    2007       $14.687      $16.880       84,356
                                                                    2008       $16.880       $9.289       71,734
                                                                    2009        $9.289      $11.514       59,741
                                                                    2010       $11.514      $12.757       48,418
                                                                    2011       $12.757      $10.355       44,346
                                                                    2012       $10.355      $12.241       53,374
                                                                    2013       $12.241      $15.647       46,559
                                                                    2014       $15.647      $14.090       44,726
------------------------------------------------------------------------------------------------------------------
Guggenheim VIF Long Short Equity Fund
                                                                    2005       $10.555      $11.787        4,603
                                                                    2006       $11.787      $12.893        5,562
                                                                    2007       $12.893      $15.539        6,080
                                                                    2008       $15.539       $9.043       13,735
                                                                    2009        $9.043      $11.304       13,289
                                                                    2010       $11.304      $12.345       12,260
                                                                    2011       $12.345      $11.328       12,101
                                                                    2012       $11.328      $11.616       11,965
                                                                    2013       $11.616      $13.399        1,459
                                                                    2014       $13.399      $13.525          864
------------------------------------------------------------------------------------------------------------------
Invesco V.I. American Franchise Fund - Series II
                                                                    2012       $10.000       $9.394        5,393
                                                                    2013        $9.394      $12.897        3,297
                                                                    2014       $12.897      $13.699        3,048
</R>

                                     H-64
<R>
                                                                                             Number of
                                                                  Accumulation Accumulation    Units
                                                     For the Year  Unit Value   Unit Value  Outstanding
                                                        Ending    at Beginning    at End      at End
Sub-Accounts                                         December 31   of Period    of Period    of Period
-------------------------------------------------------------------------------------------------------
Invesco V.I. Capital Appreciation - Series II
                                                         2005       $10.260      $10.940      18,497
                                                         2006       $10.940      $11.395       4,420
                                                         2007       $11.395      $12.501       9,752
                                                         2008       $12.501       $7.043      14,356
                                                         2009        $7.043       $8.349      12,418
                                                         2010        $8.349       $9.446       6,468
                                                         2011        $9.446       $8.523       6,151
                                                         2012        $8.523       $9.773           0
-------------------------------------------------------------------------------------------------------
Invesco V.I. Core Equity Fund - Series II
                                                         2006       $10.000      $10.767       3,608
                                                         2007       $10.767      $11.405      16,749
                                                         2008       $11.405       $7.804      23,452
                                                         2009        $7.804       $9.807      16,715
                                                         2010        $9.807      $10.522      14,055
                                                         2011       $10.522      $10.302      12,208
                                                         2012       $10.302      $11.494      11,510
                                                         2013       $11.494      $14.553       8,377
                                                         2014       $14.553      $15.412       8,069
-------------------------------------------------------------------------------------------------------
Invesco V.I. Government Securities Fund - Series II
                                                         2011       $10.000      $11.781      12,345
                                                         2012       $11.781      $11.825       7,815
                                                         2013       $11.825      $11.281       9,571
                                                         2014       $11.281      $11.508       7,672
-------------------------------------------------------------------------------------------------------
Invesco V.I. Growth and Income Fund - Series II
                                                         2005       $11.037      $11.892      31,692
                                                         2006       $11.892      $13.544      12,839
                                                         2007       $13.544      $13.635      34,015
                                                         2008       $13.635       $9.076      41,700
                                                         2009        $9.076      $11.062      31,070
                                                         2010       $11.062      $12.187      27,922
                                                         2011       $12.187      $11.698      24,168
                                                         2012       $11.698      $13.135      22,503
                                                         2013       $13.135      $17.254      19,862
                                                         2014       $17.254      $18.632      12,486
-------------------------------------------------------------------------------------------------------
Invesco V.I. Mid Cap Core Equity Fund - Series II
                                                         2005       $10.943      $11.528       3,174
                                                         2006       $11.528      $12.564      10,458
                                                         2007       $12.564      $13.482      12,802
                                                         2008       $13.482       $9.442      35,385
                                                         2009        $9.442      $12.040      23,028
                                                         2010       $12.040      $13.453      21,748
                                                         2011       $13.453      $12.352      22,611
                                                         2012       $12.352      $13.417      17,790
                                                         2013       $13.417      $16.926      16,032
                                                         2014       $16.926      $17.314      14,497
-------------------------------------------------------------------------------------------------------
Invesco V.I. Mid Cap Growth Fund - Series II
                                                         2005       $11.066      $12.075       3,009
                                                         2006       $12.075      $12.441       3,261
                                                         2007       $12.441      $14.367      10,156
                                                         2008       $14.367       $7.500       5,141
                                                         2009        $7.500      $11.517      10,158
                                                         2010       $11.517      $14.395       7,082
                                                         2011       $14.395      $12.813       6,034
                                                         2012       $12.813      $14.045       6,076
                                                         2013       $14.045      $18.840       4,784
                                                         2014       $18.840      $19.924       3,162
</R>

                                     H-65
<R>
                                                                                                            Number of
                                                                                 Accumulation Accumulation    Units
                                                                    For the Year  Unit Value   Unit Value  Outstanding
                                                                       Ending    at Beginning    at End      at End
Sub-Accounts                                                        December 31   of Period    of Period    of Period
----------------------------------------------------------------------------------------------------------------------
Invesco V.I. Value Opportunities Fund - Series II
                                                                        2005       $10.701      $11.079      24,729
                                                                        2006       $11.079      $12.288       8,519
                                                                        2007       $12.288      $12.230      26,372
                                                                        2008       $12.230       $5.776      28,022
                                                                        2009        $5.776       $8.380      17,395
                                                                        2010        $8.380       $8.801      15,645
                                                                        2011        $8.801       $8.349      12,474
                                                                        2012        $8.349       $9.646       7,102
                                                                        2013        $9.646      $12.624       6,070
                                                                        2014       $12.624      $13.188       4,517
----------------------------------------------------------------------------------------------------------------------
Invesco Van Kampen V.I. Government Fund - Series II
                                                                        2005       $10.145      $10.289      43,426
                                                                        2006       $10.289      $10.419       5,556
                                                                        2007       $10.419      $10.948      21,802
                                                                        2008       $10.948      $10.914      24,600
                                                                        2009       $10.914      $10.809      15,906
                                                                        2010       $10.809      $11.133      41,188
                                                                        2011       $11.133      $11.184           0
----------------------------------------------------------------------------------------------------------------------
Janus Aspen Overseas Portfolio - Service Shares
                                                                        2008       $10.000       $6.916       7,352
                                                                        2009        $6.916      $12.163       7,507
                                                                        2010       $12.163      $14.932       5,973
                                                                        2011       $14.932       $9.922       5,705
                                                                        2012        $9.922      $11.027       6,067
                                                                        2013       $11.027      $12.375       3,622
                                                                        2014       $12.375      $10.681       1,555
----------------------------------------------------------------------------------------------------------------------
Janus Aspen Perkins Mid Cap Value Portfolio - Service Shares
                                                                        2005       $11.256      $12.159      21,644
                                                                        2006       $12.159      $13.740      10,246
                                                                        2007       $13.740      $14.459      34,280
                                                                        2008       $14.459      $10.238      42,657
                                                                        2009       $10.238      $13.363      30,080
                                                                        2010       $13.363      $15.139      24,624
                                                                        2011       $15.139      $14.424      21,913
                                                                        2012       $14.424      $15.692      16,678
                                                                        2013       $15.692      $19.386      14,698
                                                                        2014       $19.386      $20.644       8,246
----------------------------------------------------------------------------------------------------------------------
Janus Aspen Perkins Small Company Value Portfolio - Service Shares
                                                                        2005       $10.000      $10.940       3,239
                                                                        2006       $10.940      $13.093       2,462
                                                                        2007       $13.093      $12.071      12,418
                                                                        2008       $12.071       $7.596      19,904
                                                                        2009        $7.596       $7.188           0
----------------------------------------------------------------------------------------------------------------------
Janus Aspen Series Balanced Portfolio - Service Shares
                                                                        2005       $10.581      $11.187      17,505
                                                                        2006       $11.187      $12.130       1,999
                                                                        2007       $12.130      $13.136      14,877
                                                                        2008       $13.136      $10.828      22,471
                                                                        2009       $10.828      $13.353      19,202
                                                                        2010       $13.353      $14.178      20,105
                                                                        2011       $14.178      $14.112      18,228
                                                                        2012       $14.112      $15.711      10,712
                                                                        2013       $15.711      $18.483       8,198
                                                                        2014       $18.483      $19.646       6,363
</R>

                                     H-66
<R>
                                                                                                     Number of
                                                                          Accumulation Accumulation    Units
                                                             For the Year  Unit Value   Unit Value  Outstanding
                                                                Ending    at Beginning    at End      at End
Sub-Accounts                                                 December 31   of Period    of Period    of Period
---------------------------------------------------------------------------------------------------------------
Janus Aspen Series Foreign Stock Portfolio - Service Shares
                                                                 2005       $11.270      $11.758       6,336
                                                                 2006       $11.758      $13.632       2,516
                                                                 2007       $13.632      $15.829       6,797
                                                                 2008       $15.829      $14.875           0
---------------------------------------------------------------------------------------------------------------
Janus Aspen Series Forty Portfolio - Service Shares
                                                                 2005       $11.443      $12.649      11,195
                                                                 2006       $12.649      $13.554       2,354
                                                                 2007       $13.554      $18.185      13,531
                                                                 2008       $18.185       $9.944      14,716
                                                                 2009        $9.944      $14.259      12,938
                                                                 2010       $14.259      $14.910      10,052
                                                                 2011       $14.910      $13.625       8,840
                                                                 2012       $13.625      $16.572       7,253
                                                                 2013       $16.572      $21.300       5,800
                                                                 2014       $21.300      $22.688       3,321
---------------------------------------------------------------------------------------------------------------
Janus Aspen Series INTECH Risk-Managed Core Portfolio -
 Service Shares
                                                                 2005       $11.292      $12.299      28,781
                                                                 2006       $12.299      $13.379         901
                                                                 2007       $13.379      $13.943      13,792
                                                                 2008       $13.943       $8.729      10,922
                                                                 2009        $8.729      $10.506       5,256
---------------------------------------------------------------------------------------------------------------
MFS VIT II High Yield - Service Class
                                                                 2013       $10.000      $15.367       4,159
                                                                 2014       $15.367      $15.473       4,685
---------------------------------------------------------------------------------------------------------------
MFS(R) High Income Series - Service Class
                                                                 2005       $10.608      $10.631      20,622
                                                                 2006       $10.631      $11.483       6,286
                                                                 2007       $11.483      $11.449      23,290
                                                                 2008       $11.449       $8.020      27,280
                                                                 2009        $8.020      $11.438      18,164
                                                                 2010       $11.438      $12.849      12,581
                                                                 2011       $12.849      $13.105      10,973
                                                                 2012       $13.105      $14.725       5,772
                                                                 2013       $14.725      $14.899           0
---------------------------------------------------------------------------------------------------------------
MFS(R) Investors Growth Stock Series - Service Class
                                                                 2005       $10.428      $10.673      14,429
                                                                 2006       $10.673      $11.248       7,739
                                                                 2007       $11.248      $12.262      18,306
                                                                 2008       $12.262       $7.588      22,364
                                                                 2009        $7.588      $10.365      18,949
                                                                 2010       $10.365      $11.415      15,205
                                                                 2011       $11.415      $11.251      12,320
                                                                 2012       $11.251      $12.892      10,941
                                                                 2013       $12.892      $16.464      10,784
                                                                 2014       $16.464      $17.965       6,946
---------------------------------------------------------------------------------------------------------------
MFS(R) Investors Trust Series - Service Class
                                                                 2005       $10.765      $11.314       5,472
                                                                 2006       $11.314      $12.521       1,693
                                                                 2007       $12.521      $13.528       3,450
                                                                 2008       $13.528       $8.867       5,345
                                                                 2009        $8.867      $11.020       3,217
                                                                 2010       $11.020      $11.999       1,719
                                                                 2011       $11.999      $11.498       3,714
                                                                 2012       $11.498      $13.417       3,388
                                                                 2013       $13.417      $17.358       3,108
                                                                 2014       $17.358      $18.871       2,607
</R>

                                     H-67
<R>
                                                                                                       Number of
                                                                            Accumulation Accumulation    Units
                                                               For the Year  Unit Value   Unit Value  Outstanding
                                                                  Ending    at Beginning    at End      at End
Sub-Accounts                                                   December 31   of Period    of Period    of Period
-----------------------------------------------------------------------------------------------------------------
MFS(R) New Discovery Series - Service Class
                                                                   2005        $9.903      $10.215        7,704
                                                                   2006       $10.215      $11.329        2,187
                                                                   2007       $11.329      $11.374       10,252
                                                                   2008       $11.374       $6.755       10,509
                                                                   2009        $6.755      $10.807       13,125
                                                                   2010       $10.807      $14.427        9,230
                                                                   2011       $14.427      $12.681        8,946
                                                                   2012       $12.681      $15.055        7,889
                                                                   2013       $15.055      $20.877        4,629
                                                                   2014       $20.877      $18.965        3,804
-----------------------------------------------------------------------------------------------------------------
MFS(R) Total Return Series - Service Class
                                                                   2005       $10.739      $10.820       51,781
                                                                   2006       $10.820      $11.861       18,099
                                                                   2007       $11.861      $12.104       20,247
                                                                   2008       $12.104       $9.233       26,900
                                                                   2009        $9.233      $10.674       20,112
                                                                   2010       $10.674      $11.492       13,332
                                                                   2011       $11.492      $11.464       13,081
                                                                   2012       $11.464      $12.488       11,293
                                                                   2013       $12.488      $14.561        9,152
                                                                   2014       $14.561      $15.477        7,803
-----------------------------------------------------------------------------------------------------------------
MFS(R) Value Series - Service Class
                                                                   2005       $11.128      $11.635        5,222
                                                                   2006       $11.635      $13.770        2,124
                                                                   2007       $13.770      $14.547        8,826
                                                                   2008       $14.547       $9.608        4,507
                                                                   2009        $9.608      $11.553        3,502
                                                                   2010       $11.553      $12.618        2,399
                                                                   2011       $12.618      $12.333        2,554
                                                                   2012       $12.333      $14.034        2,402
                                                                   2013       $14.034      $18.688        2,381
                                                                   2014       $18.688      $20.223        1,921
-----------------------------------------------------------------------------------------------------------------
Oppenheimer Discovery Mid Cap Growth Fund/VA - Service Shares
                                                                   2005       $10.000      $11.687        7,856
                                                                   2006       $11.687      $11.787        7,348
                                                                   2007       $11.787      $12.272        5,022
                                                                   2008       $12.272       $6.120        7,593
                                                                   2009        $6.120       $7.949        8,703
                                                                   2010        $7.949       $9.927        6,348
                                                                   2011        $9.927       $9.830        7,146
                                                                   2012        $9.830      $11.213        5,665
                                                                   2013       $11.213      $14.934        3,682
                                                                   2014       $14.934      $15.475        4,374
-----------------------------------------------------------------------------------------------------------------
Oppenheimer Global Fund/VA - Service Shares
                                                                   2005       $11.343      $12.706       86,497
                                                                   2006       $12.706      $14.644       10,134
                                                                   2007       $14.644      $15.254      111,096
                                                                   2008       $15.254       $8.938       64,672
                                                                   2009        $8.938      $12.231       44,368
                                                                   2010       $12.231      $13.897       41,921
                                                                   2011       $13.897      $12.483       32,097
                                                                   2012       $12.483      $14.826       36,198
                                                                   2013       $14.826      $18.489       32,092
                                                                   2014       $18.489      $18.530       30,546
</R>

                                     H-68
<R>
                                                                                                    Number of
                                                                         Accumulation Accumulation    Units
                                                            For the Year  Unit Value   Unit Value  Outstanding
                                                               Ending    at Beginning    at End      at End
Sub-Accounts                                                December 31   of Period    of Period    of Period
--------------------------------------------------------------------------------------------------------------
Oppenheimer Main Street Small Cap Fund/VA - Service Shares
                                                                2005       $11.277      $12.150       81,846
                                                                2006       $12.150      $13.681       11,584
                                                                2007       $13.681      $13.246       44,402
                                                                2008       $13.246       $8.064       43,930
                                                                2009        $8.064      $10.840       31,176
                                                                2010       $10.840      $13.099       26,227
                                                                2011       $13.099      $12.557       21,911
                                                                2012       $12.557      $14.509       23,005
                                                                2013       $14.509      $20.037       19,793
                                                                2014       $20.037      $21.969       18,283
--------------------------------------------------------------------------------------------------------------
PIMCO Foreign Bond Portfolio (U.S. Dollar-Hedged) -
 Administrative Shares
                                                                2005       $10.339      $10.676       47,366
                                                                2006       $10.676      $10.714        8,948
                                                                2007       $10.714      $10.902       33,647
                                                                2008       $10.902      $10.451       27,562
                                                                2009       $10.451      $11.867       25,316
                                                                2010       $11.867      $12.644       20,331
                                                                2011       $12.644      $13.257       16,521
                                                                2012       $13.257      $14.430       14,395
                                                                2013       $14.430      $14.241       12,784
                                                                2014       $14.241      $15.546        5,997
--------------------------------------------------------------------------------------------------------------
PIMCO Money Market Portfolio - Administrative Shares
                                                                2005        $9.918      $10.009      150,481
                                                                2006       $10.009      $10.283       27,607
                                                                2007       $10.283      $10.590       32,822
                                                                2008       $10.590      $10.634       91,586
                                                                2009       $10.634      $10.454       70,508
                                                                2010       $10.454      $10.271       58,599
                                                                2011       $10.271      $10.092       65,420
                                                                2012       $10.092       $9.916       35,580
                                                                2013        $9.916       $9.744       41,518
                                                                2014        $9.744       $9.569       31,288
--------------------------------------------------------------------------------------------------------------
PIMCO Real Return Portfolio - Administrative Shares
                                                                2005       $10.552      $10.579      122,346
                                                                2006       $10.579      $10.462       16,994
                                                                2007       $10.462      $11.371       42,156
                                                                2008       $11.371      $10.380       41,393
                                                                2009       $10.380      $12.068       32,397
                                                                2010       $12.068      $12.812       32,722
                                                                2011       $12.812      $14.051       20,871
                                                                2012       $14.051      $15.005       16,504
                                                                2013       $15.005      $13.377       14,113
                                                                2014       $13.377      $13.542        9,334
--------------------------------------------------------------------------------------------------------------
PIMCO Total Return Portfolio - Administrative Shares
                                                                2005       $10.240      $10.302       76,949
                                                                2006       $10.302      $10.507       28,759
                                                                2007       $10.507      $11.221       79,939
                                                                2008       $11.221      $11.550      109,474
                                                                2009       $11.550      $12.939       93,450
                                                                2010       $12.939      $13.737       84,488
                                                                2011       $13.737      $13.977      122,070
                                                                2012       $13.977      $15.042      111,189
                                                                2013       $15.042      $14.481       49,016
                                                                2014       $14.481      $14.829       28,408
</R>

                                     H-69
<R>
                                                                                       Number of
                                                            Accumulation Accumulation    Units
                                               For the Year  Unit Value   Unit Value  Outstanding
                                                  Ending    at Beginning    at End      at End
Sub-Accounts                                   December 31   of Period    of Period    of Period
-------------------------------------------------------------------------------------------------
Premier VIT OpCap Balanced Portfolio
                                                   2005       $10.772      $10.868        6,958
                                                   2006       $10.868      $11.826          560
                                                   2007       $11.826      $11.096        7,098
                                                   2008       $11.096       $7.499        9,792
                                                   2009        $7.499       $7.225            0
-------------------------------------------------------------------------------------------------
Premier VIT OpCap Renaissance Portfolio
                                                   2005       $11.182      $10.484       23,563
                                                   2006       $10.484      $11.467        6,181
                                                   2007       $11.467      $11.971       12,010
                                                   2008       $11.971      $10.815            0
-------------------------------------------------------------------------------------------------
T. Rowe Price Blue Chip Growth Portfolio - II
                                                   2005       $10.446      $10.837       57,136
                                                   2006       $10.837      $11.636       16,451
                                                   2007       $11.636      $12.852       54,684
                                                   2008       $12.852       $7.238       68,814
                                                   2009        $7.238      $10.078       50,583
                                                   2010       $10.078      $11.480       35,122
                                                   2011       $11.480      $11.427       29,928
                                                   2012       $11.427      $13.230       30,044
                                                   2013       $13.230      $18.300       22,612
                                                   2014       $18.300      $19.559       16,859
-------------------------------------------------------------------------------------------------
T. Rowe Price Equity Income Portfolio - II
                                                   2005       $11.060      $11.263      110,586
                                                   2006       $11.263      $13.123       28,044
                                                   2007       $13.123      $13.276       72,693
                                                   2008       $13.276       $8.309       93,184
                                                   2009        $8.309      $10.220       63,978
                                                   2010       $10.220      $11.515       56,769
                                                   2011       $11.515      $11.193       48,248
                                                   2012       $11.193      $12.851       37,818
                                                   2013       $12.851      $16.331       24,332
                                                   2014       $16.331      $17.176       14,093
-------------------------------------------------------------------------------------------------
UIF Growth Portfolio, Class II
                                                   2005       $10.340      $11.726        7,296
                                                   2006       $11.726      $11.954        1,579
                                                   2007       $11.954      $14.281        1,834
                                                   2008       $14.281       $7.103        3,770
                                                   2009        $7.103      $11.520        5,504
                                                   2010       $11.520      $13.870        4,539
                                                   2011       $13.870      $13.207        4,772
                                                   2012       $13.207      $14.791        4,328
                                                   2013       $14.791      $21.457        3,807
                                                   2014       $21.457      $22.354        3,003
-------------------------------------------------------------------------------------------------
UIF U.S. Real Estate Portfolio, Class II
                                                   2005       $12.799      $14.675       59,925
                                                   2006       $14.675      $19.841       23,273
                                                   2007       $19.841      $16.117       49,639
                                                   2008       $16.117       $9.803       52,161
                                                   2009        $9.803      $12.369       39,348
                                                   2010       $12.369      $15.734       29,572
                                                   2011       $15.734      $16.326       27,469
                                                   2012       $16.326      $18.536       24,708
                                                   2013       $18.536      $18.521       21,474
                                                   2014       $18.521      $23.540       15,395
</R>

                                     H-70
<R>
                                                                                                            Number of
                                                                                 Accumulation Accumulation    Units
                                                                    For the Year  Unit Value   Unit Value  Outstanding
                                                                       Ending    at Beginning    at End      at End
Sub-Accounts                                                        December 31   of Period    of Period    of Period
----------------------------------------------------------------------------------------------------------------------
Van Eck VIP Emerging Markets Fund - Initial Class
                                                                        2005       $12.055      $15.627      18,780
                                                                        2006       $15.627      $21.408       5,890
                                                                        2007       $21.408      $28.927      22,998
                                                                        2008       $28.927      $10.004      15,749
                                                                        2009       $10.004      $20.943      10,954
                                                                        2010       $20.943      $26.087       7,376
                                                                        2011       $26.087      $19.024       5,823
                                                                        2012       $19.024      $24.250       5,143
                                                                        2013       $24.250      $26.676       4,678
                                                                        2014       $26.676      $26.087       2,040
----------------------------------------------------------------------------------------------------------------------
Van Eck VIP Global Hard Assets Fund - Initial Class
                                                                        2005       $12.403      $18.475      31,637
                                                                        2006       $18.475      $22.587      59,022
                                                                        2007       $22.587      $32.238      35,164
                                                                        2008       $32.238      $17.055      36,260
                                                                        2009       $17.055      $26.383      36,520
                                                                        2010       $26.383      $33.484      30,164
                                                                        2011       $33.484      $27.472      22,360
                                                                        2012       $27.472      $27.890      21,376
                                                                        2013       $27.890      $30.273      19,427
                                                                        2014       $30.273      $24.049      17,441
----------------------------------------------------------------------------------------------------------------------
Van Eck VIP Multi-Manager Alternative - Initial Class
                                                                        2005        $9.876       $9.719       2,232
                                                                        2006        $9.719      $10.370       8,505
                                                                        2007       $10.370      $10.595       5,710
                                                                        2008       $10.595       $9.042       3,607
                                                                        2009        $9.042      $10.110       2,562
                                                                        2010       $10.110      $10.422       2,634
                                                                        2011       $10.422      $10.003       2,497
                                                                        2012       $10.003       $9.953       2,675
                                                                        2013        $9.953      $10.268       1,125
                                                                        2014       $10.268       $9.975         571
----------------------------------------------------------------------------------------------------------------------
Western Asset Variable Global High Yield Bond Portfolio - Class II
                                                                        2005       $10.826      $11.008      46,676
                                                                        2006       $11.008      $11.929      15,302
                                                                        2007       $11.929      $11.675      47,449
                                                                        2008       $11.675       $7.924      53,932
                                                                        2009        $7.924      $12.049      33,607
                                                                        2010       $12.049      $13.571      22,444
                                                                        2011       $13.571      $13.497      19,914
                                                                        2012       $13.497      $15.649      13,535
                                                                        2013       $15.649      $16.298      11,196
                                                                        2014       $16.298      $15.763       8,819
</R>

<R>
 *  The Accumulation Unit Values in this table reflect a mortality and expense
    risk charge of 1.70% and an administrative expense charge of 0.10%.
</R>

                                     H-71
<R>
    CONSULTANT SOLUTIONS VARIABLE ANNUITIES: LBL Consultant Solution Select
                                  Contracts -
                                   PROSPECTUS

   ACCUMULATION UNIT VALUE AND NUMBER OF ACCUMULATION UNITS OUTSTANDING FOR
                           EACH VARIABLE SUB-ACCOUNT*

                                      High

                           Mortality & Expense = 2.6
</R>

<R>
                                                                                                            Number of
                                                                                 Accumulation Accumulation    Units
                                                                    For the Year  Unit Value   Unit Value  Outstanding
                                                                       Ending    at Beginning    at End      at End
Sub-Accounts                                                        December 31   of Period    of Period    of Period
----------------------------------------------------------------------------------------------------------------------
Alger Capital Appreciation Portfolio - Class S
                                                                        2005       $10.092      $11.210         0
                                                                        2006       $11.210      $12.977         0
                                                                        2007       $12.977      $16.815         0
                                                                        2008       $16.815       $8.955         0
                                                                        2009        $8.955      $13.130         0
                                                                        2010       $13.130      $14.517         0
                                                                        2011       $14.517      $14.037         0
                                                                        2012       $14.037      $16.100         0
                                                                        2013       $16.100      $21.116         0
                                                                        2014       $21.116      $23.309         0
----------------------------------------------------------------------------------------------------------------------
Alger Large Cap Growth Portfolio - Class S
                                                                        2005        $9.977      $10.846         0
                                                                        2006       $10.846      $11.071         0
                                                                        2007       $11.071      $12.885         0
                                                                        2008       $12.885       $6.733         0
                                                                        2009        $6.733       $9.646         0
                                                                        2010        $9.646      $10.597         0
                                                                        2011       $10.597      $10.233         0
                                                                        2012       $10.233      $10.890         0
                                                                        2013       $10.890      $14.260         0
                                                                        2014       $14.260      $15.340         0
----------------------------------------------------------------------------------------------------------------------
Alger Mid Cap Growth Portfolio - Class S
                                                                        2005       $10.495      $11.187         0
                                                                        2006       $11.187      $11.962         0
                                                                        2007       $11.962      $15.277         0
                                                                        2008       $15.277       $6.172         0
                                                                        2009        $6.172       $9.087         0
                                                                        2010        $9.087      $10.512         0
                                                                        2011       $10.512       $9.350         0
                                                                        2012        $9.350      $10.524         0
                                                                        2013       $10.524      $13.866         0
                                                                        2014       $13.866      $14.514         0
----------------------------------------------------------------------------------------------------------------------
ClearBridge Variable Fundamental All Cap Value Portfolio - Class I
                                                                        2007       $10.000       $9.420         0
                                                                        2008        $9.420       $5.813         0
                                                                        2009        $5.813       $7.316         0
                                                                        2010        $7.316       $8.301         0
                                                                        2011        $8.301       $7.577         0
                                                                        2012        $7.577       $8.476         0
                                                                        2013        $8.476      $10.900         0
                                                                        2014       $10.900      $11.600         0
</R>

                                     H-72
<R>
                                                                                                  Number of
                                                                       Accumulation Accumulation    Units
                                                          For the Year  Unit Value   Unit Value  Outstanding
                                                             Ending    at Beginning    at End      at End
Sub-Accounts                                              December 31   of Period    of Period    of Period
------------------------------------------------------------------------------------------------------------
ClearBridge Variable Large Cap Value Portfolio - Class I
                                                              2007       $10.000       $9.658         0
                                                              2008        $9.658       $6.049         0
                                                              2009        $6.049       $7.328         0
                                                              2010        $7.328       $7.805         0
                                                              2011        $7.805       $7.971         0
                                                              2012        $7.971       $9.035         0
                                                              2013        $9.035      $11.637         0
                                                              2014       $11.637      $12.649         0
------------------------------------------------------------------------------------------------------------
Fidelity VIP Asset Manager Portfolio - Service Class 2
                                                              2005       $10.089      $10.189         0
                                                              2006       $10.189      $10.622         0
                                                              2007       $10.622      $11.902         0
                                                              2008       $11.902       $8.233         0
                                                              2009        $8.233      $10.314         0
                                                              2010       $10.314      $11.438         0
                                                              2011       $11.438      $10.816         0
                                                              2012       $10.816      $11.811         0
                                                              2013       $11.811      $13.255         0
                                                              2014       $13.255      $13.611         0
------------------------------------------------------------------------------------------------------------
Fidelity VIP Contrafund(R) Portfolio - Service Class 2
                                                              2005       $11.247      $12.767         0
                                                              2006       $12.767      $13.843         0
                                                              2007       $13.843      $15.798         0
                                                              2008       $15.798       $8.809         0
                                                              2009        $8.809      $11.611         0
                                                              2010       $11.611      $13.210         0
                                                              2011       $13.210      $12.496         0
                                                              2012       $12.496      $14.120         0
                                                              2013       $14.120      $17.992         0
                                                              2014       $17.992      $19.546         0
------------------------------------------------------------------------------------------------------------
Fidelity VIP Equity-Income Portfolio - Service Class 2
                                                              2005       $10.705      $10.997         0
                                                              2006       $10.997      $12.834         0
                                                              2007       $12.834      $12.644         0
                                                              2008       $12.644       $7.035         0
                                                              2009        $7.035       $8.891         0
                                                              2010        $8.891       $9.942         0
                                                              2011        $9.942       $9.737         0
                                                              2012        $9.737      $11.089         0
                                                              2013       $11.089      $13.793         0
                                                              2014       $13.793      $14.558         0
------------------------------------------------------------------------------------------------------------
Fidelity VIP Growth Portfolio - Service Class 2
                                                              2005        $9.686       $9.944         0
                                                              2006        $9.944      $10.313         0
                                                              2007       $10.313      $12.707         0
                                                              2008       $12.707       $6.514         0
                                                              2009        $6.514       $8.111         0
                                                              2010        $8.111       $9.776         0
                                                              2011        $9.776       $9.509         0
                                                              2012        $9.509      $10.584         0
                                                              2013       $10.584      $14.006         0
                                                              2014       $14.006      $15.129         0
</R>

                                     H-73
<R>
Number of
Accumulation Accumulation Units
For the Year Unit Value Unit Value Outstanding
Ending at Beginning at End at End
Sub-Accounts December 31 of Period of Period of Period
------------------------------------------------------------------------------------------------------------------
Fidelity VIP Index 500 Portfolio - Service Class 2
2005 $10.535 $10.719 0
2006 $10.719 $12.040 0
2007 $12.040 $12.320 0
2008 $12.320 $7.533 0
2009 $7.533 $9.257 0
2010 $9.257 $10.334 0
2011 $10.334 $10.235 0
2012 $10.235 $11.515 0
2013 $11.515 $14.779 0
2014 $14.779 $16.291 0
------------------------------------------------------------------------------------------------------------------
Fidelity VIP Investment Grade Bond Portfolio - Service Class 2
2005 $10.088 $10.002 0
2006 $10.002 $10.136 0
2007 $10.136 $10.263 0
2008 $10.263 $9.641 0
2009 $9.641 $10.831 0
2010 $10.831 $11.334 0
2011 $11.334 $11.805 0
2012 $11.805 $12.129 0
2013 $12.129 $11.558 0
2014 $11.558 $11.878 0
------------------------------------------------------------------------------------------------------------------
Fidelity VIP Money Market Portfolio - Service Class 2
2005 $9.841 $9.842 0
2006 $9.842 $10.020 0
2007 $10.020 $10.231 0
2008 $10.231 $10.230 0
2009 $10.230 $10.001 0
2010 $10.001 $9.738 0
2011 $9.738 $9.477 0
2012 $9.477 $9.221 0
2013 $9.221 $8.973 0
2014 $8.973 $8.732 0
------------------------------------------------------------------------------------------------------------------
Fidelity VIP Overseas Portfolio - Service Class 2
2005 $10.795 $12.477 0
2006 $12.477 $14.299 0
2007 $14.299 $16.284 0
2008 $16.284 $8.878 0
2009 $8.878 $10.904 0
2010 $10.904 $11.971 0
2011 $11.971 $9.628 0
2012 $9.628 $11.277 0
2013 $11.277 $14.282 0
2014 $14.282 $12.744 0
------------------------------------------------------------------------------------------------------------------
Guggenheim VIF Long Short Equity Fund
2005 $10.467 $11.582 0
2006 $11.582 $12.553 0
2007 $12.553 $14.990 0
2008 $14.990 $8.643 0
2009 $8.643 $10.705 0
2010 $10.705 $11.584 0
2011 $11.584 $10.532 0
2012 $10.532 $10.701 0
2013 $10.701 $12.230 0
2014 $12.230 $12.233 0
------------------------------------------------------------------------------------------------------------------
Invesco V.I. American Franchise Fund - Series II
2012 $10.000 $8.654 0
2013 $8.654 $11.772 0
2014 $11.772 $12.390 0
</R>
H-74
<R>
                                                                                             Number of
                                                                  Accumulation Accumulation    Units
                                                     For the Year  Unit Value   Unit Value  Outstanding
                                                        Ending    at Beginning    at End      at End
Sub-Accounts                                         December 31   of Period    of Period    of Period
-------------------------------------------------------------------------------------------------------
Invesco V.I. Capital Appreciation - Series II
                                                         2005       $10.175      $10.750         0
                                                         2006       $10.750      $11.094         0
                                                         2007       $11.094      $12.059         0
                                                         2008       $12.059       $6.732         0
                                                         2009        $6.732       $7.907         0
                                                         2010        $7.907       $8.864         0
                                                         2011        $8.864       $7.925         0
                                                         2012        $7.925       $9.059         0
-------------------------------------------------------------------------------------------------------
Invesco V.I. Core Equity Fund - Series II
                                                         2006       $10.000      $10.700         0
                                                         2007       $10.700      $11.230         0
                                                         2008       $11.230       $7.613         0
                                                         2009        $7.613       $9.481         0
                                                         2010        $9.481      $10.078         0
                                                         2011       $10.078       $9.778         0
                                                         2012        $9.778      $10.808         0
                                                         2013       $10.808      $13.560         0
                                                         2014       $13.560      $14.229         0
-------------------------------------------------------------------------------------------------------
Invesco V.I. Government Securities Fund - Series II
                                                         2011       $10.000      $10.954         0
                                                         2012       $10.954      $10.894         0
                                                         2013       $10.894      $10.297         0
                                                         2014       $10.297      $10.408         0
-------------------------------------------------------------------------------------------------------
Invesco V.I. Growth and Income Fund - Series II
                                                         2005       $10.945      $11.685         0
                                                         2006       $11.685      $13.187         0
                                                         2007       $13.187      $13.153         0
                                                         2008       $13.153       $8.675         0
                                                         2009        $8.675      $10.476         0
                                                         2010       $10.476      $11.436         0
                                                         2011       $11.436      $10.876         0
                                                         2012       $10.876      $12.100         0
                                                         2013       $12.100      $15.749         0
                                                         2014       $15.749      $16.851         0
-------------------------------------------------------------------------------------------------------
Invesco V.I. Mid Cap Core Equity Fund - Series II
                                                         2005       $10.852      $11.327         0
                                                         2006       $11.327      $12.233         0
                                                         2007       $12.233      $13.005         0
                                                         2008       $13.005       $9.025         0
                                                         2009        $9.025      $11.403         0
                                                         2010       $11.403      $12.624         0
                                                         2011       $12.624      $11.484         0
                                                         2012       $11.484      $12.360         0
                                                         2013       $12.360      $15.450         0
                                                         2014       $15.450      $15.660         0
-------------------------------------------------------------------------------------------------------
Invesco V.I. Mid Cap Growth Fund - Series II
                                                         2005       $10.973      $11.864         0
                                                         2006       $11.864      $12.113         0
                                                         2007       $12.113      $13.859         0
                                                         2008       $13.859       $7.169         0
                                                         2009        $7.169      $10.907         0
                                                         2010       $10.907      $13.507         0
                                                         2011       $13.507      $11.913         0
                                                         2012       $11.913      $12.938         0
                                                         2013       $12.938      $17.197         0
                                                         2014       $17.197      $18.020         0
</R>

                                     H-75
<R>
                                                                                                            Number of
                                                                                 Accumulation Accumulation    Units
                                                                    For the Year  Unit Value   Unit Value  Outstanding
                                                                       Ending    at Beginning    at End      at End
Sub-Accounts                                                        December 31   of Period    of Period    of Period
----------------------------------------------------------------------------------------------------------------------
Invesco V.I. Value Opportunities Fund - Series II
                                                                        2005       $10.611      $10.886         0
                                                                        2006       $10.886      $11.964         0
                                                                        2007       $11.964      $11.798         0
                                                                        2008       $11.798       $5.521         0
                                                                        2009        $5.521       $7.936         0
                                                                        2010        $7.936       $8.258         0
                                                                        2011        $8.258       $7.763         0
                                                                        2012        $7.763       $8.886         0
                                                                        2013        $8.886      $11.523         0
                                                                        2014       $11.523      $11.928         0
----------------------------------------------------------------------------------------------------------------------
Invesco Van Kampen V.I. Government Fund - Series II
                                                                        2005       $10.061      $10.110         0
                                                                        2006       $10.110      $10.144         0
                                                                        2007       $10.144      $10.561         0
                                                                        2008       $10.561      $10.431         0
                                                                        2009       $10.431      $10.237         0
                                                                        2010       $10.237      $10.447         0
                                                                        2011       $10.447      $10.464         0
----------------------------------------------------------------------------------------------------------------------
Janus Aspen Overseas Portfolio - Service Shares
                                                                        2008       $10.000       $6.611         0
                                                                        2009        $6.611      $11.518         0
                                                                        2010       $11.518      $14.012         0
                                                                        2011       $14.012       $9.225         0
                                                                        2012        $9.225      $10.158         0
                                                                        2013       $10.158      $11.295         0
                                                                        2014       $11.295       $9.660         0
----------------------------------------------------------------------------------------------------------------------
Janus Aspen Perkins Mid Cap Value Portfolio - Service Shares
                                                                        2005       $11.162      $11.948         0
                                                                        2006       $11.948      $13.378         0
                                                                        2007       $13.378      $13.948         0
                                                                        2008       $13.948       $9.785         0
                                                                        2009        $9.785      $12.655         0
                                                                        2010       $12.655      $14.206         0
                                                                        2011       $14.206      $13.411         0
                                                                        2012       $13.411      $14.456         0
                                                                        2013       $14.456      $17.696         0
                                                                        2014       $17.696      $18.671         0
----------------------------------------------------------------------------------------------------------------------
Janus Aspen Perkins Small Company Value Portfolio - Service Shares
                                                                        2005       $10.000      $10.873         0
                                                                        2006       $10.873      $12.894         0
                                                                        2007       $12.894      $11.777         0
                                                                        2008       $11.777       $7.343         0
                                                                        2009        $7.343       $6.927         0
----------------------------------------------------------------------------------------------------------------------
Janus Aspen Series Balanced Portfolio - Service Shares
                                                                        2005       $10.493      $10.992         0
                                                                        2006       $10.992      $11.810         0
                                                                        2007       $11.810      $12.672         0
                                                                        2008       $12.672      $10.349         0
                                                                        2009       $10.349      $12.646         0
                                                                        2010       $12.646      $13.304         0
                                                                        2011       $13.304      $13.121         0
                                                                        2012       $13.121      $14.473         0
                                                                        2013       $14.473      $16.872         0
                                                                        2014       $16.872      $17.768         0
</R>

                                     H-76
<R>
                                                                                                     Number of
                                                                          Accumulation Accumulation    Units
                                                             For the Year  Unit Value   Unit Value  Outstanding
                                                                Ending    at Beginning    at End      at End
Sub-Accounts                                                 December 31   of Period    of Period    of Period
---------------------------------------------------------------------------------------------------------------
Janus Aspen Series Foreign Stock Portfolio - Service Shares
                                                                 2005       $11.176      $11.553         0
                                                                 2006       $11.553      $13.273         0
                                                                 2007       $13.273      $15.270         0
                                                                 2008       $15.270      $14.306         0
---------------------------------------------------------------------------------------------------------------
Janus Aspen Series Forty Portfolio - Service Shares
                                                                 2005       $11.348      $12.429         0
                                                                 2006       $12.429      $13.197         0
                                                                 2007       $13.197      $17.542         0
                                                                 2008       $17.542       $9.505         0
                                                                 2009        $9.505      $13.504         0
                                                                 2010       $13.504      $13.991         0
                                                                 2011       $13.991      $12.669         0
                                                                 2012       $12.669      $15.267         0
                                                                 2013       $15.267      $19.443         0
                                                                 2014       $19.443      $20.520         0
---------------------------------------------------------------------------------------------------------------
Janus Aspen Series INTECH Risk-Managed Core Portfolio -
 Service Shares
                                                                 2005       $11.198      $12.085         0
                                                                 2006       $12.085      $13.026         0
                                                                 2007       $13.026      $13.450         0
                                                                 2008       $13.450       $8.343         0
                                                                 2009        $8.343       $9.949         0
                                                                 2010        $9.949      $10.633         0
---------------------------------------------------------------------------------------------------------------
MFS VIT II High Yield - Service Class
                                                                 2013       $10.000      $14.027         0
                                                                 2014       $14.027      $13.994         0
---------------------------------------------------------------------------------------------------------------
MFS(R) High Income Series - Service Class
                                                                 2005       $10.519      $10.446         0
                                                                 2006       $10.446      $11.180         0
                                                                 2007       $11.180      $11.044         0
                                                                 2008       $11.044       $7.666         0
                                                                 2009        $7.666      $10.832         0
                                                                 2010       $10.832      $12.057         0
                                                                 2011       $12.057      $12.185         0
                                                                 2012       $12.185      $13.566         0
                                                                 2013       $13.566      $13.647         0
---------------------------------------------------------------------------------------------------------------
MFS(R) Investors Growth Stock Series - Service Class
                                                                 2005       $10.341      $10.488         0
                                                                 2006       $10.488      $10.951         0
                                                                 2007       $11.964      $11.798         0
                                                                 2008       $11.798       $7.252         0
                                                                 2009        $7.252       $9.815         0
                                                                 2010        $9.815      $10.711         0
                                                                 2011       $10.711      $10.461         0
                                                                 2012       $10.461      $11.876         0
                                                                 2013       $11.876      $15.029         0
                                                                 2014       $15.029      $16.248         0
---------------------------------------------------------------------------------------------------------------
MFS(R) Investors Trust Series - Service Class
                                                                 2005       $10.675      $11.117         0
                                                                 2006       $11.117      $12.191         0
                                                                 2007       $10.951      $11.828         0
                                                                 2008       $11.828       $8.475         0
                                                                 2009        $8.475      $10.436         0
                                                                 2010       $10.436      $11.259         0
                                                                 2011       $11.259      $10.691         0
                                                                 2012       $10.691      $12.361         0
                                                                 2013       $12.361      $15.844         0
                                                                 2014       $15.844      $17.068         0
</R>

                                     H-77
<R>
                                                                                                       Number of
                                                                            Accumulation Accumulation    Units
                                                               For the Year  Unit Value   Unit Value  Outstanding
                                                                  Ending    at Beginning    at End      at End
Sub-Accounts                                                   December 31   of Period    of Period    of Period
-----------------------------------------------------------------------------------------------------------------
MFS(R) New Discovery Series - Service Class
                                                                   2005        $9.821      $10.037         0
                                                                   2006       $10.037      $11.030         0
                                                                   2007       $11.030      $10.972         0
                                                                   2008       $10.972       $6.456         0
                                                                   2009        $6.456      $10.234         0
                                                                   2010       $10.234      $13.538         0
                                                                   2011       $13.538      $11.790         0
                                                                   2012       $11.790      $13.869         0
                                                                   2013       $13.869      $19.057         0
                                                                   2014       $19.057      $17.152         0
-----------------------------------------------------------------------------------------------------------------
MFS(R) Total Return Series - Service Class
                                                                   2005       $10.649      $10.631         0
                                                                   2006       $10.631      $11.548         0
                                                                   2007       $11.548      $11.676         0
                                                                   2008       $11.676       $8.825         0
                                                                   2009        $8.825      $10.109         0
                                                                   2010       $10.109      $10.783         0
                                                                   2011       $10.783      $10.659         0
                                                                   2012       $10.659      $11.505         0
                                                                   2013       $11.505      $13.292         0
                                                                   2014       $13.292      $13.998         0
-----------------------------------------------------------------------------------------------------------------
MFS(R) Value Series - Service Class
                                                                   2005       $11.036      $11.433         0
                                                                   2006       $11.433      $13.407         0
                                                                   2007       $13.407      $14.033         0
                                                                   2008       $14.033       $9.183         0
                                                                   2009        $9.183      $10.941         0
                                                                   2010       $10.941      $11.840         0
                                                                   2011       $11.840      $11.467         0
                                                                   2012       $11.467      $12.929         0
                                                                   2013       $12.929      $17.058         0
                                                                   2014       $17.058      $18.291         0
-----------------------------------------------------------------------------------------------------------------
Oppenheimer Discovery Mid Cap Growth Fund/VA - Service Shares
                                                                   2005       $10.000      $11.615         0
                                                                   2006       $11.615      $11.607         0
                                                                   2007       $11.607      $11.974         0
                                                                   2008       $11.974       $5.917         0
                                                                   2009        $5.917       $7.614         0
                                                                   2010        $7.614       $9.421         0
                                                                   2011        $9.421       $9.244         0
                                                                   2012        $9.244      $10.448         0
                                                                   2013       $10.448      $13.787         0
                                                                   2014       $13.787      $14.156         0
-----------------------------------------------------------------------------------------------------------------
Oppenheimer Global Fund/VA - Service Shares
                                                                   2005       $11.249      $12.485         0
                                                                   2006       $12.485      $14.258         0
                                                                   2007       $14.258      $14.715         0
                                                                   2008       $14.715       $8.542         0
                                                                   2009        $8.542      $11.583         0
                                                                   2010       $11.583      $13.040         0
                                                                   2011       $13.040      $11.607         0
                                                                   2012       $11.607      $13.659         0
                                                                   2013       $13.659      $16.877         0
                                                                   2014       $16.877      $16.759         0
</R>

                                     H-78
<R>
                                                                                                    Number of
                                                                         Accumulation Accumulation    Units
                                                            For the Year  Unit Value   Unit Value  Outstanding
                                                               Ending    at Beginning    at End      at End
Sub-Accounts                                                December 31   of Period    of Period    of Period
--------------------------------------------------------------------------------------------------------------
Oppenheimer Main Street Small Cap Fund/VA - Service Shares
                                                                2005       $11.183      $11.939         0
                                                                2006       $11.939      $13.320         0
                                                                2007       $13.320      $12.778         0
                                                                2008       $12.778       $7.708         0
                                                                2009        $7.708      $10.265         0
                                                                2010       $10.265      $12.291         0
                                                                2011       $12.291      $11.675         0
                                                                2012       $11.675      $13.367         0
                                                                2013       $13.367      $18.289         0
                                                                2014       $18.289      $19.870         0
--------------------------------------------------------------------------------------------------------------
PIMCO Foreign Bond Portfolio (U.S. Dollar-Hedged) -
 Administrative Shares
                                                                2005       $10.252      $10.490         0
                                                                2006       $10.490      $10.431         0
                                                                2007       $10.431      $10.517         0
                                                                2008       $10.517       $9.989         0
                                                                2009        $9.989      $11.239         0
                                                                2010       $11.239      $11.865         0
                                                                2011       $11.865      $12.326         0
                                                                2012       $12.326      $13.294         0
                                                                2013       $13.294      $13.000         0
                                                                2014       $13.000      $14.060         0
--------------------------------------------------------------------------------------------------------------
PIMCO Money Market Portfolio - Administrative Shares
                                                                2005        $9.835       $9.835         0
                                                                2006        $9.835      $10.012         0
                                                                2007       $10.012      $10.215         0
                                                                2008       $10.215      $10.164         0
                                                                2009       $10.164       $9.900         0
                                                                2010        $9.900       $9.638         0
                                                                2011        $9.638       $9.384         0
                                                                2012        $9.384       $9.135         0
                                                                2013        $9.135       $8.894         0
                                                                2014        $8.894       $8.655         0
--------------------------------------------------------------------------------------------------------------
PIMCO Real Return Portfolio - Administrative Shares
                                                                2005       $10.464      $10.395         0
                                                                2006       $10.395      $10.186         0
                                                                2007       $10.186      $10.969         0
                                                                2008       $10.969       $9.921         0
                                                                2009        $9.921      $11.429         0
                                                                2010       $11.429      $12.022         0
                                                                2011       $12.022      $13.064         0
                                                                2012       $13.064      $13.824         0
                                                                2013       $13.824      $12.210         0
                                                                2014       $12.210      $12.248         0
--------------------------------------------------------------------------------------------------------------
PIMCO Total Return Portfolio - Administrative Shares
                                                                2005       $10.155      $10.122         0
                                                                2006       $10.122      $10.230         0
                                                                2007       $10.230      $10.824         0
                                                                2008       $10.824      $11.040         0
                                                                2009       $11.040      $12.254         0
                                                                2010       $12.254      $12.890         0
                                                                2011       $12.890      $12.996         0
                                                                2012       $12.996      $13.857         0
                                                                2013       $13.857      $13.219         0
                                                                2014       $13.219      $13.412         0
</R>

                                     H-79
<R>
                                                                                       Number of
                                                            Accumulation Accumulation    Units
                                               For the Year  Unit Value   Unit Value  Outstanding
                                                  Ending    at Beginning    at End      at End
Sub-Accounts                                   December 31   of Period    of Period    of Period
-------------------------------------------------------------------------------------------------
Premier VIT OpCap Balanced Portfolio
                                                   2005       $10.706      $10.703         0
                                                   2006       $10.703      $11.539         0
                                                   2007       $11.539      $10.728         0
                                                   2008       $10.728       $7.183         0
                                                   2009        $7.183       $6.901         0
-------------------------------------------------------------------------------------------------
Premier VIT OpCap Renaissance Portfolio
                                                   2005       $11.089      $10.302         0
                                                   2006       $10.302      $11.164         0
                                                   2007       $11.164      $11.548         0
                                                   2008       $11.548      $10.428         0
-------------------------------------------------------------------------------------------------
T. Rowe Price Blue Chip Growth Portfolio - II
                                                   2005       $10.359      $10.649         0
                                                   2006       $10.649      $11.329         0
                                                   2007       $11.329      $12.398         0
                                                   2008       $12.398       $6.918         0
                                                   2009        $6.918       $9.544         0
                                                   2010        $9.544      $10.772         0
                                                   2011       $10.772      $10.625         0
                                                   2012       $10.625      $12.188         0
                                                   2013       $12.188      $16.704         0
                                                   2014       $16.704      $17.690         0
-------------------------------------------------------------------------------------------------
T. Rowe Price Equity Income Portfolio - II
                                                   2005       $10.968      $11.067         0
                                                   2006       $11.067      $12.777         0
                                                   2007       $12.777      $12.807         0
                                                   2008       $12.807       $7.942         0
                                                   2009        $7.942       $9.678         0
                                                   2010        $9.678      $10.805         0
                                                   2011       $10.805      $10.407         0
                                                   2012       $10.407      $11.839         0
                                                   2013       $11.839      $14.907         0
                                                   2014       $14.907      $15.535         0
-------------------------------------------------------------------------------------------------
UIF Growth Portfolio, Class II
                                                   2005       $10.254      $11.522         0
                                                   2006       $11.522      $11.639         0
                                                   2007       $11.639      $13.776         0
                                                   2008       $13.776       $6.789         0
                                                   2009        $6.789      $10.909         0
                                                   2010       $10.909      $13.015         0
                                                   2011       $13.015      $12.280         0
                                                   2012       $12.280      $13.626         0
                                                   2013       $13.626      $19.586         0
                                                   2014       $19.586      $20.218         0
-------------------------------------------------------------------------------------------------
UIF U.S. Real Estate Portfolio, Class II
                                                   2005       $12.693      $14.420         0
                                                   2006       $14.420      $19.318         0
                                                   2007       $19.318      $15.547         0
                                                   2008       $15.547       $9.370         0
                                                   2009        $9.370      $11.714         0
                                                   2010       $11.714      $14.764         0
                                                   2011       $14.764      $15.179         0
                                                   2012       $15.179      $17.076         0
                                                   2013       $17.076      $16.906         0
                                                   2014       $16.906      $21.290         0
</R>

                                     H-80
<R>
                                                                                                            Number of
                                                                                 Accumulation Accumulation    Units
                                                                    For the Year  Unit Value   Unit Value  Outstanding
                                                                       Ending    at Beginning    at End      at End
Sub-Accounts                                                        December 31   of Period    of Period    of Period
----------------------------------------------------------------------------------------------------------------------
Van Eck VIP Emerging Markets Fund - Initial Class
                                                                        2005       $11.955      $15.355         0
                                                                        2006       $15.355      $20.843         0
                                                                        2007       $20.843      $27.905         0
                                                                        2008       $27.905       $9.562         0
                                                                        2009        $9.562      $19.834         0
                                                                        2010       $19.834      $24.479         0
                                                                        2011       $24.479      $17.688         0
                                                                        2012       $17.688      $22.340         0
                                                                        2013       $22.340      $24.349         0
                                                                        2014       $24.349      $23.594         0
----------------------------------------------------------------------------------------------------------------------
Van Eck VIP Global Hard Assets Fund - Initial Class
                                                                        2005       $12.300      $18.154         0
                                                                        2006       $18.154      $21.992         0
                                                                        2007       $21.992      $31.099         0
                                                                        2008       $31.099      $16.301         0
                                                                        2009       $16.301      $24.986         0
                                                                        2010       $24.986      $31.420         0
                                                                        2011       $31.420      $25.543         0
                                                                        2012       $25.543      $25.693         0
                                                                        2013       $25.693      $27.633         0
                                                                        2014       $27.633      $21.750         0
----------------------------------------------------------------------------------------------------------------------
Van Eck VIP Multi-Manager Alternative - Initial Class
                                                                        2005        $9.794       $9.549         0
                                                                        2006        $9.549      $10.097         0
                                                                        2007       $10.097      $10.221         0
                                                                        2008       $10.221       $8.642         0
                                                                        2009        $8.642       $9.575         0
                                                                        2010        $9.575       $9.780         0
                                                                        2011        $9.780       $9.300         0
                                                                        2012        $9.300       $9.169         0
                                                                        2013        $9.169       $9.372         0
                                                                        2014        $9.372       $9.022         0
----------------------------------------------------------------------------------------------------------------------
Western Asset Variable Global High Yield Bond Portfolio - Class II
                                                                        2005       $10.735      $10.817         0
                                                                        2006       $10.817      $11.614         0
                                                                        2007       $11.614      $11.262         0
                                                                        2008       $11.262       $7.573         0
                                                                        2009        $7.573      $11.411         0
                                                                        2010       $11.411      $12.735         0
                                                                        2011       $12.735      $12.549         0
                                                                        2012       $12.549      $14.417         0
                                                                        2013       $14.417      $14.877         0
                                                                        2014       $14.877      $14.257         0
</R>

<R>
 *  The Accumulation Unit Values in this table reflect a mortality and expense
    risk charge of 2.60% and an administrative expense charge of 0.10%.
</R>

                                     H-81
535-4

                            [GRAPHIC APPEARS HERE]
                                    PART II
                  INFORMATION NOT REQUIRED IN THE PROSPECTUS

ITEM 13. OTHER EXPENSES OF ISSUANCE AND DISTRIBUTION

Registrant anticipates that it will incur the following approximate expenses in
connection with the issuance and distribution of the securities to be
registered:

                   Registration fees.................. $    0
                   Cost of printing and engraving..... $1,900
                   Legal fees......................... $    0
                   Accounting fees.................... $    0
                   Mailing fees....................... $2,600

ITEM 14. INDEMNIFICATION OF DIRECTORS AND OFFICERS.

The Articles of Incorporation of Lincoln Benefit Life Company (Registrant)
provide for the indemnification of its directors and officers against expenses,
judgments, fines and amounts paid in settlement as incurred by such person, so
long as such person shall not have been adjudged to be liable for negligence or
misconduct in the performance of a duty to the Company. This right of indemnity
is not exclusive of other rights to which a director or officer may otherwise
be entitled.

Resolution Life, Inc. has obtained directors and officers liability insurance
which insures against certain liabilities that the directors and officers of
Resolution Life and its subsidiaries may, in such capacities, incur.

Insofar as indemnification for liability arising under the Securities Act of
1933 may be permitted to directors, officers and controlling persons of the
registrant pursuant to the foregoing provisions, or otherwise, the registrant
has been advised that in the opinion of the Securities and Exchange Commission
such indemnification is against public policy as expressed in the Act and is,
therefore, unenforceable. In the even that a claim for indemnification against
such liabilities (other than the payment by the registrant of expenses incurred
or paid by a director, officer or controlling person of the registrant in the
successful defense of any action, suit or proceeding) is asserted by such
director, officer or controlling person in connection with the securities being
registered, the registrant will, unless in the opinion of its counsel the
matter has settled by controlling precedent, submit to a court of appropriate
jurisdiction the question whether such indemnification by it is against public
policy as expressed in the Act and will be governed by final adjudication of
such issue.

ITEM 15. RECENT SALES OF UNREGISTERED SECURITIES

Not Applicable.

ITEM 16. EXHIBITS AND FINANCIAL STATEMENT SCHEDULES

16(a)
Exh. No. Description

1 Form of Principal Underwriting Agreement. Incorporated herein by reference to
Post-Effective Amendment to Form N-4 for Lincoln Benefit Life Variable Annuity
Account (File No. 333-50545, 811-07924) filed January 28, 1999.

1(a) Amended and Restated Principal Underwriting Agreement by and between
Lincoln Benefit Life Company and Allstate Distributors, LLC, effective April 1,
2014. Incorporated herein by reference to Lincoln Benefit Life Company's Form
S-1 Post-Effective Amendment No. 2 to Registration Statement filed on April 4,
2014. (SEC file No. 333-180374)

3(i) Amended and Restated Articles of Incorporation of Lincoln Benefit Life
Company dated September 26, 2000, as amended by the Articles of Amendment to
the Articles of Incorporation of Lincoln Benefit Life Company dated January 21,
2015. Filed herewith.

3(ii) Amended and Restated By-Laws of Lincoln Benefit Life Company effective
March 10, 2006. Incorporated herein by reference to Exhibit 3.2 to Lincoln
Benefit Life Company's Quarterly Report on Form 10-Q for the quarter ended
March 31, 2006. (SEC File No. 333-111553)

4(a) Form of Variable Annuity Contract. Incorporated herein by reference to
Registration Statement on Form N-4 for Lincoln Benefit Life Variable Annuity
Account (File No. 333-82427, 811-07924) filed July 8, 1999.
4(b) Form of Application. Incorporated herein by reference to Registration
Statement on Form N-4 for Lincoln Benefit Life Variable Annuity Account (File
No. 333-82427, 811-07924) filed July 8, 1999.

5(a) Opinion and Consent of Counsel regarding legality. Incorporated herein by
reference to Post-Effective Amendment to Form S-3 on Form S-1 for Lincoln
Benefit Life Variable Annuity Account (File No. 333-88045) filed April 6, 2000.

5(b) Opinion and Consent of Counsel regarding legality. Incorporated herein by
reference to Registrant's Form S-3 Registration Statement (File No. 333-158181)
dated March 24, 2009.

5(c) Opinion and Consent of Counsel regarding legality. (Incorporated by
reference to Registrant's Form S-1 Registration Statement (File No. 333-180371)
dated March 27, 2012).

5(d) Opinion and Consent of Counsel regarding legality. Filed herewith.

8 None

9 None

10 Material Contracts

10.1 Administrative Services Agreement between Lincoln Benefit Life Company and
Allstate Life Insurance Company effective June 1, 2006. Incorporated herein by
reference to Exhibit 10.1 to Lincoln Benefit Life Company's Quarterly Report on
Form 10-Q for the quarter ended June 30, 2006. (SEC File No. 333-111553)

10.2 Principal Underwriting Agreement by and among Lincoln Benefit Life Company
and Allstate Distributors, LLC (ALFS, Inc., merged with and into Allstate
Distributors, LLC effective September 1, 2011) effective November 25, 1998.
(Variable Universal Life Account). Incorporated herein by reference to
Exhibit 10.6 to Lincoln Benefit Life Company's Quarterly Report on Form 10-Q
for quarter ended June 30, 2002. (SEC File No. 333-66452)

10.3 Amended and Restated Principal Underwriting Agreement between Lincoln
Benefit Life Company and Allstate Distributors, LLC (ALFS, Inc. merged with and
into Allstate Distributors, LLC effective September 1, 2011) effective June 1,
2006. Incorporated herein by reference to Exhibit 10.1 to Lincoln Benefit Life
Company's Current Report on Form 8-K filed December 20, 2007. (SEC File
No. 333-111553)

10.4 Selling Agreement between Lincoln Benefit Life Company, Allstate
Distributors, LLC (ALFS, Inc., f/k/a Allstate Financial Services, Inc., merged
with and into Allstate Distributors, LLC effective September 1, 2011) and
Allstate Financial Services, LLC (f/k/a LSA Securities, Inc.) effective
August 2, 1999. Incorporated herein by reference to Exhibit 10.8 to Allstate
Life Insurance Company's Annual Report on Form 10-K for 2003. (SEC File
No. 000-31248)

10.5 Coinsurance Agreement between Allstate Life Insurance Company and Lincoln
Benefit Life Company, effective December 31, 2001. Incorporated herein by
reference to Exhibit 10.11 to Lincoln Benefit Life Company's Quarterly Report
on Form 10-Q for quarter ended June 30, 2002. (SEC File No. 333-66452)

10.6 Modified Coinsurance Agreement between Allstate Life Insurance Company and
Lincoln Benefit Life Company, effective December 31, 2001. Incorporated herein
by reference to Exhibit 10.12 to Lincoln Benefit Life Company's Quarterly
Report on Form 10-Q for quarter ended June 30, 2002. (SEC File No. 333-111553)

10.7 Modified Coinsurance Agreement between Allstate Life Insurance Company and
Lincoln Benefit Life Company, effective December 31, 2001. Incorporated herein
by reference to Exhibit 10.13 to Lincoln Benefit Life Company's Quarterly
Report on Form 10-Q for quarter ended June 30, 2002. (SEC File No. 333-66452)

10.8 Administrative Services Agreement between Allstate Distributors, LLC,
(ALFS, Inc., merged with and into Allstate Distributors, LLC effective
September 1, 2011) Allstate Life Insurance Company, Lincoln Benefit Life
Company and Charter National Life Insurance Company effective January 1, 2000.
Incorporated herein by reference to Exhibit 10.22 to Lincoln Benefit Life
Company's Annual Report on Form 10-K for the year ended December 31, 2008. (SEC
File No. 333-111553)

10.9 Assignment & Delegation of Administrative Services Agreements,
Underwriting Agreements, and Selling Agreements entered into as of September 1,
2011 between ALFS, Inc., Allstate Life Insurance Company, Allstate Life
Insurance Company of New York, Allstate Distributors, LLC, Charter National
Life Insurance Company, Intramerica Life Insurance Company, Allstate Financial
Services, LLC, and Lincoln Benefit Life Company. Incorporated herein by
reference to Exhibit 10.1 to Allstate Life Insurance Company's Current Report
on Form 8-K filed September 1, 2011. (SEC File No. 000-31248)

10.10 Reinsurance Agreement between Lincoln Benefit Life Company and Lincoln
Benefit Reinsurance Company effective September 30, 2012, Incorporated herein
by reference to Exhibit 10.1 to Allstate Life Insurance Company's Current
Report on Form 8-K filed October 3, 2012.(SEC File No. 000-31248)

10.11 Recapture Agreement between Allstate Life Insurance Company ("ALIC") and
Lincoln Benefit Life Company ("LBL"), effective September 30, 2012.
Incorporated herein by reference to Lincoln Benefit Life Company's Form S-1
Post-Effective Amendment No. 1 to Registration Statement filed on April 3,
2013. (SEC File No. 333-180374)

10.12 Voluntary Separation Agreement and Release by and between Allstate
Insurance Company and Anurag Chandra, dated October 17, 2013. Incorporated
herein by reference to Exhibit 10.22 of Lincoln Benefit Life Company's Form S-1
Post-Effective Amendment No. 2 to Registration Statement filed on April 4,
2014. (SEC file No. 333-180374)

10.13 Voluntary Separation Agreement and Release by and between Allstate
Insurance Company and Lawrence W. Dahl, dated August 1, 2013. Incorporated
herein by reference to Exhibit 10.23 of Lincoln Benefit Life Company's Form S-1
Post-Effective Amendment No. 2 to Registration Statement filed on April 4,
2014. (SEC file No. 333-180374)

10.14 Administrative Services Agreement by and between Lincoln Benefit Life
Company and Allstate Life Insurance Company, effective April 1, 2014.
Incorporated herein by reference to Exhibit 10.24 of Lincoln Benefit Life
Company's Form S-1 Post-Effective Amendment No. 2 to Registration Statement
filed on April 4, 2014. (SEC file No. 333-180374)

10.15 Amended and Restated Reinsurance Agreement by and between Lincoln Benefit
Life Company and Allstate Life Insurance Company, effective April 1, 2014.
Incorporated herein by reference to Exhibit 10.25 of Lincoln Benefit Life
Company's Form S-1 Post-Effective Amendment No. 2 to Registration Statement
filed on April 4, 2014. (SEC file No. 333-180374)

10.16 Partial Commutation Agreement by and between Allstate Life Insurance
Company and Lincoln Benefit Life Company, effective April 1, 2014. Incorporated
herein by reference to Exhibit 10.26 of Lincoln Benefit Life Company's Form S-1
Post-Effective Amendment No. 2 to Registration Statement filed on April 4,
2014. (SEC file No. 333-180374)

11 None

12 None

15 Not applicable.

16 Letter re: change in certifying accountant. File herewith.

21 Subsidiaries of the registrant. Filed herewith.

23 Consents of Independent Registered Public Accounting Firms. Filed herewith.

24 Powers of Attorney for Stephen Campbell, Richard Carbone, Clive Cowdery,
Ann Frohman, Jon Hack, Robert Stein and Grace Vandecruze. Filed herewith.

25 None

26 None

99 Experts. Filed herewith.

Exhibit List for XBRL Docs:

101.INS XBRL Instance Document
101.SCH XBRL Taxonomy Extension Schema

101.CAL XBRL Taxonomy Extension Calculation Linkbase

101.DEF XBRL Taxonomy Extension Definition Linkbase

101.LAB XBRL Taxonomy Extension Label Linkbase

101.PRE XBRL Taxonomy Extension Presentation Linkbase

16(b) Financial statement schedules required by Regulation S-X (17 CFR
Part 210) and Item 11(e) of Form S-1 are included in Part I.

ITEM 17. UNDERTAKINGS.

The undersigned registrant hereby undertakes:

(1) To file, during any period in which offers or sales are being made, a
post-effective amendment to the registration statement:

(i) To include any prospectus required by section 10(a)(3) of the Securities
Act of 1933;

(ii) To reflect in the prospectus any facts or events arising after the
effective date of the registration statement (or the most recent post-effective
amendment thereof) which, individually or in the aggregate, represent a
fundamental change in the information set forth in the registration statement.
Notwithstanding the foregoing, any increase or decrease in volume of securities
offered (if the total dollar value of securities offered would not exceed that
which was registered) and any deviation from the low or high end of the
estimated maximum offering range may be reflected in the form of prospectus
filed with the Commission pursuant to Rule 424(b) if, in the aggregate, the
changes in volume and price represent no more than 20 percent change in the
maximum aggregate offering price set forth in the "Calculation of Registration
Fee" table in the effective registration statement.

(iii) To include any material information with respect to the plan of
distribution not previously disclosed in the registration statement or any
material change to such information in the registration statement.

(2) That, for the purpose of determining any liability under the Securities Act
of 1933, each such post-effective amendment shall be deemed to be a new
registration statement relating to the securities offered therein, and the
offering of such securities at that time shall be deemed to be the initial bona
fide offering thereof;

(3) To remove from registration by means of a post-effective amendment any of
the securities being registered which remain unsold at the termination of the
offering.

(4) That, for the purpose of determining liability under the Securities Act of
1933 to any purchaser, each prospectus filed pursuant to Rule 424(b) as part of
a registration statement relating to an offering, other than registration
statements relying on Rule 430B or other than prospectuses filed in reliance on
Rule 430A, shall be deemed to be part of and included in the registration
statement as of the date it is first used after effectiveness. Provided,
however, that no statement made in a registration statement or prospectus that
is part of the registration statement or made in a document incorporated or
deemed incorporated by reference into the registration statement or prospectus
that is part of the registration statement will, as to a purchaser with a time
of contract of sale prior to such first use, supersede or modify any statement
that was made in the registration statement or prospectus that was part of the
registration statement or made in any such document immediately prior to such
date of first use.

(5) That, for the purpose of determining liability of the registrant under the
Securities Act of 1933 to any purchaser in the initial distribution of the
securities:

The undersigned registrant undertakes that in a primary offering of securities
of the undersigned registrant pursuant to this registration statement,
regardless of the underwriting method used to sell the securities to the
purchaser, if the securities are offered or sold to such purchaser by means of
any of the following communications, the undersigned registrant will be a
seller to the purchaser and will be considered to offer or sell such securities
to such purchaser:
(i) Any preliminary prospectus or prospectus of the undersigned registrant
relating to the offering required to be filed pursuant to Rule 424;

(ii) Any free writing prospectus relating to the offering prepared by or on
behalf of the undersigned registrant or used or referred to by the undersigned
registrant;

(iii) The portion of any other free writing prospectus relating to the offering
containing material information about the undersigned registrant or its
securities provided by or on behalf of the undersigned registrant; and

(iv) Any other communication that is an offer in the offering made by the
undersigned registrant to the purchaser.

Insofar as indemnification for liabilities arising under the Securities Act of
1933 may be permitted to directors, officers and controlling persons of the
registrant pursuant to the foregoing provisions, or otherwise, the registrant
has been advised that in the opinion of the Securities and Exchange Commission
such indemnification is against public policy as expressed in the Act and is,
therefore, unenforceable. In the event that a claim for indemnification against
such liabilities (other than the payment by registrant of expenses incurred or
paid by a director, officer or controlling person of the registrant in the
successful defense of any action, suit or proceeding) is asserted by such
director, officer or controlling person in connection with the securities being
registered, the registrant will, unless in the opinion of its counsel the
matter has been settled by controlling precedent, submit to a court of
appropriate jurisdiction the question whether such indemnification by it is
against public policy as expressed in the Securities Act and will be governed
by the final adjudication of such issue.
                                  SIGNATURES

Pursuant to the requirements of the Securities Act of 1933, the Registrant has
duly caused this Registration Statement to be signed on its behalf by the
undersigned, thereunto duly authorized, in the City of Stamford in the State of
Connecticut on April 13, 2015.

                                              LINCOLN BENEFIT LIFE COMPANY
                                                       (REGISTRANT)

                                          By: /s/ W. Weldon Wilson
                                             ----------------------------------
                                              W. Weldon Wilson
                                              Director and Chief Executive
                                              Officer

Pursuant to the Securities Act of 1933, this Registration Statement has been
signed below by the following directors and principal officers of Lincoln
Benefit Life Company in the capacity indicated on April 13, 2015.

SIGNATURE                              TITLE

*Richard Carbone                       Director
----------------------------------
Richard Carbone

*Clive Cowdery                         Director
----------------------------------
Clive Cowdery

*Ann Frohman                           Director
----------------------------------
Ann Frohman

*Jon Hack                              Director
----------------------------------
Jon Hack

*Robert Stein                          Director
----------------------------------
Robert Stein

*Grace Vandecruze                      Director
----------------------------------
Grace Vandecruze

*Stephen Campbell                      Director
----------------------------------
Stephen Campbell

                                       Director and Chief Executive Officer
/s/ W. Weldon Wilson                   (Principal Executive Officer)
----------------------------------
W. Weldon Wilson

                                       Chief Financial Officer, Treasurer and
                                       Executive Vice President
                                       (Principal Financial Officer and
/s/ Robyn Wyatt                        Principal Accounting Officer)
----------------------------------
Robyn Wyatt

* By: Robyn Wyatt, pursuant to Power of Attorney.
                                 EXHIBIT LIST

3(i) Amended and Restated Articles of Incorporation of Lincoln Benefit Life
Company dated September 26, 2000, as amended by the Articles of Amendment to
the Articles of Incorporation of Lincoln Benefit Life Company dated January 21,
2015.

5(d) Opinion and Consent of Counsel regarding legality.

16 Letter re: change in certifying accountant.

21 Subsidiaries of the registrant

23.1 Consent of Independent Registered Public Accounting Firm.

23.2 Consent of Independent Registered Public Accounting Firm

24 Powers of Attorney for Stephen Campbell, Richard Carbone, Clive Cowdery, Ann
Frohman, Jon Hack, Robert Stein and Grace Vandecruze.

99 Experts

101.INS XBRL Instance Document

101.SCH XBRL Taxonomy Extension Schema

101.CAL XBRL Taxonomy Extension Calculation Linkbase

101.DEF XBRL Taxonomy Extension Definition Linkbase

101.LAB XBRL Taxonomy Extension Label Linkbase

101.PRE XBRL Taxonomy Extension Presentation Linkbase