| Nebraska | 6300 | 470221457 | ||
(State or Other Jurisdiction of Organization) | (Primary Standard Industrial Classification Code Number) | (I.R.S. Employer Identification Number) | ||
| Large accelerated filer | ¨ | Accelerated filed | ¨ | |||
| Non-accelerated filer | x | Smaller reporting company | ¨ | |||
| Emerging growth company | ¨ | |||||
| Title of securities being registered | Amount to be registered (1) | Proposed maximum offering price per unit | Proposed maximum aggregate offering price (1) | Amount of registration fee (2) | |||||
| Deferred annuity interests and participating interests therein | $N/A | $(1) | $N/A | $N/A | |||||
| (1) | The Contract does not provide for a predetermined amount or number of units. | ||||||||
| (2) | By filing dated April 2, 2018, Lincoln Benefit Life Company registered $11,375,538 of deferred annuity interests and participating interests therein. Because a filing fee of $1,322 previously had been paid with respect to those interests, there was no filing fee due under that Registration Statement. Registrant continues that offering in this Post-Effective Amendment to that Registration Statement. | ||||||||
| This Registration Statement contains a combined prospectus under Rule 429 under the Securities Act of 1933 which relates to the Form S-1 registration statement (File Nos. 333-224100 and 333-203376), filed on April 2, 2018 and April 13, 2015, respectively, by Lincoln Benefit Life Company. Upon effectiveness, this Registration Statement will also act as a post-effective amendment to such earlier registration statement. | |||||||||
LINCOLN BENEFIT LIFE COMPANY
Supplement Dated April 27, 2020
To the following Prospectuses, as supplemented
CONSULTANT SOLUTIONS (CLASSIC, PLUS, ELITE, SELECT) PROSPECTUS DATED APRIL 29, 2019
CONSULTANT I PROSPECTUS DATED APRIL 29, 2019
LBL ADVANTAGE PROSPECTUS DATED MAY 1, 2004
CONSULTANT II PROSPECTUS DATED MAY 1, 2004
PREMIER PLANNER PROSPECTUS DATED MAY 1, 2004
The following information supplements the prospectus for your variable annuity contract issued by Lincoln Benefit Life Company.
SUPPLEMENTAL INFORMATION ABOUT
LINCOLN BENEFIT LIFE COMPANY
INDEX
| Page | ||||||
Item 3(c) | 2 | |||||
Item 11(a) | 14 | |||||
Item 11(b) | 14 | |||||
Item 11(c) | 14 | |||||
Item 11(e) | 15 | |||||
Item 11(f) | 74 | |||||
Item 11(h) | Management’s Discussion and Analysis of Financial Condition and Results of Operations | 74 | ||||
Item 11(i) | 91 | |||||
Item 11(j) | 91 | |||||
Item 11(k) | 91 | |||||
Item 11(l) | 93 | |||||
Item 11(m) | Security Ownership of Certain Beneficial Owners and Management | 94 | ||||
Item 11(n) | Transactions with Related Persons, Promoters and Certain Control Persons | 97 | ||||
| 99 | ||||||
1
| Item 3(c). | Risk Factors |
LINCOLN BENEFIT LIFE RISK FACTORS
This document contains “forward-looking statements” that anticipate results based on our estimates, assumptions and plans that are subject to uncertainty. These statements are made subject to the safe-harbor provisions of the Private Securities Litigation Reform Act of 1995. We assume no obligation to update any forward-looking statements as a result of new information or future events or developments.
These forward-looking statements do not relate strictly to historical or current facts and may be identified by their use of words like “plans,” “seeks,” “expects,” “will,” “should,” “anticipates,” “estimates,” “intends,” “believes,” “likely,” “targets” and other words with similar meanings. These statements may address, among other things, our strategy for growth, investment results, regulatory approvals, market position, expenses, financial results, litigation and reserves. We believe that these statements are based on reasonable estimates, assumptions and plans. However, if the estimates, assumptions or plans underlying the forward-looking statements prove inaccurate or if other risks or uncertainties arise, actual results could differ materially from those communicated in these forward-looking statements.
In addition to the normal risks of business, we are subject to significant risks and uncertainties, including those listed below, which apply to us as an insurer. These risks constitute our cautionary statements under the Private Securities Litigation Reform Act of 1995 and readers should carefully review such cautionary statements as they identify certain important factors that could cause actual results to differ materially from those in the forward-looking statements and historical trends. These cautionary statements are not exclusive and are in addition to other factors discussed elsewhere in this document, in our filings with the SEC or in materials incorporated therein by reference.
Changes in actual experience could materially and adversely affect the Company’s financial condition.
Our liability pricing includes long-term assumptions regarding investment returns, mortality, morbidity, persistency and operating costs and expenses of our business. We establish target returns based upon these factors and the average amount of capital that we must hold to supportin-force contracts taking into account rating agencies and regulatory requirements. Profitability emerges over a period of years depending on the nature and life of the product and is subject to variability as actual results may differ from pricing assumptions. Additionally, many of our products have fixed or guaranteed terms that limit our ability to increase revenues or reduce benefits, including credited interest, once the product has been issued.
Our financial condition depends in part on the adequacy of investment spreads, the management of market and credit risks associated with investments, the sufficiency of premiums and contract charges to cover mortality and morbidity benefits, the persistency of policies, and the management of operating costs and expenses within anticipated pricing allowances. We may face losses if there are significant deviations from our assumptions regarding the future persistency of our insurance policies and annuity contracts. The prices and expected future profitability of our life insurance, deferred annuity and long-term care products are based in part upon assumptions related to persistency. Economic and market dislocations may occur and future consumer persistency behaviors could vary materially from the past. The effect of persistency on profitability varies for different products. For example, continued activity in the viatical, stranger-owned, and/or life settlement industry could cause the Company’s level of lapses to differ from its assumptions, which could negatively impact the Company’s financial condition and cash flow. Assumptions and estimates involve judgment, and by their nature are imprecise and subject to changes and revisions over time. Accordingly, the Company’s results may be affected, positively or negatively, from time to time, by actual results differing from assumptions by changes in estimates, and by changes resulting from implementing new systems and procedures that facilitate the calculation of more precise estimates. Legislation and regulation of the insurance marketplace and products could also affect the profitability of our business, which in turn could adversely affect our financial condition.
2
Changes in reserve estimates may adversely affect our operating results.
We establish and hold reserves to pay future policy benefits and claims. The reserve for policy benefits is computed on a prescribed basis. Our reserves do not represent an exact calculation of liability, but rather are actuarial or statistical estimates based on data and models that include many assumptions and projections, which are inherently uncertain and involve the exercise of significant judgment. We periodically review the adequacy of these reserves and the underlying assumptions. We cannot, however, determine with precision the amounts that we will pay for, or the timing of payment of, actual benefits, claims and expenses or whether the assets supporting our policy liabilities, together with future premiums, will grow to the level assumed prior to the payment of benefits or claims. If actual experience differs significantly from assumptions or estimates, reserves may not be adequate. If we conclude that our reserves, together with future premiums, are insufficient to cover future policy benefits and claims, we would be required to increase our reserves and incur income statement charges for the period in which we make the determination, which could materially and adversely affect our cash flow, results of operations and financial condition.
Changes in market interest rates and/or credit spreads may lead to a significant decrease in the profitability of our spread-based products and may adversely impact investment income.
We are subject to the risk that we will incur losses due to adverse changes in interest rates or credit spreads. Adverse changes to these rates and spreads may occur due to changes in fiscal policy and the economic climate, the liquidity of a market or market segment, insolvency or financial distress of key market makers or participants, or changes in market perceptions of creditworthiness and/or risk tolerance. We are subject to risks associated with potential declines in credit quality related to specific issuers or specific industries and a general weakening in the economy, which are typically reflected through credit spreads. Credit spread is the additional yield on fixed income securities above the risk-free rate (typically referenced as the yield on U.S. Treasury securities) that market participants require to compensate them for assuming credit, liquidity and/or prepayment risks. Credit spreads vary (i.e., increase or decrease) in response to the market’s perception of risk and liquidity in a specific issuer or specific sector and are influenced by the credit ratings, and the reliability of those ratings, published by external rating agencies. A decline in the quality of our investment portfolio as a result of changes in market interest rates, adverse economic conditions or otherwise could cause additional realized and unrealized losses on securities in our investment portfolio. Similarly, a ratings downgrade affecting a security we hold could indicate the credit quality of that security has deteriorated and could increase the capital we must hold to support that security to maintain our risk-based capital levels. Levels of writedowns and impairments are impacted by intent to sell, or our assessment of the likelihood that we will be required to sell, fixed maturity securities. Realized losses or impairments on these securities may have a material adverse effect on our net income in a particular period, which in turn could materially and adversely affect our cash flow, results of operations and financial condition.
Our ability to manage our fixed annuities and interest-sensitive life products is dependent upon maintaining profitable spreads between investment yields and interest crediting rates. When market interest rates decrease or remain at relatively low levels, cash flows from renewal premium or investments that have matured or have been prepaid or sold may be reinvested at lower yields, reducing investment spread. Lowering interest crediting rates on some products in such an environment can partially offset decreases in investment yield. However, these changes could be limited by market conditions, regulatory minimum rates or contractual minimum rate guarantees on many contracts and may not match the timing or magnitude of changes in investment yields. Decreases in the interest crediting rates offered on products could make those products less attractive, leading to changes in the level of policy loans, surrenders and withdrawals. This process may lead to a flow of cash out of our business. These outflows may require investment assets to be sold at a time when the prices of those assets are lower because of the increase in market interest rates, which may result in realized investment losses. For certain products, principally fixed annuity and interest-sensitive life products, the earned rate on assets could lag behind rising market yields. We may react to market conditions by increasing crediting rates, which could narrow spreads and reduce profitability on our business. Additionally, an increase in market interest rates or credit spreads could have an adverse effect on the value of our investment portfolio by decreasing the fair values of the fixed income securities that comprise a substantial majority of our investment portfolio.
3
Guarantees within certain of our products may decrease our earnings, increase the volatility of our results, result in higher risk management costs and expose us to increased counterparty risk.
Certain of our products include guaranteed benefits. These guarantees are designed to protect contractholders against significant downturns in equity markets and interest rates. Any such periods of significant and sustained downturns in equity markets, increased equity volatility or reduced interest rates could result in an increase in the valuation of our liabilities associated with those products. An increase in these liabilities would result in a decrease in our net income. We use hedging and risk management strategies to mitigate the liability exposure and the volatility of net income associated with these liabilities. These strategies involve the use of reinsurance and derivatives, which may not be completely effective. In addition, hedging instruments may not effectively offset the costs of guarantees or may otherwise be insufficient in relation to our obligations. Furthermore, we are subject to the risk that changes in contractholder behavior or mortality, combined with adverse market events, produce economic losses not addressed by the risk management techniques employed. These, individually or collectively, may have a material adverse effect on our results of operations, including net income, cash flow, financial condition or liquidity.
We may not be able to mitigate the capital impact associated with statutory reinsurance reserving requirements, potentially adversely impacting the profitability of our business.
To support statutory reserves for certain term and universal life insurance products with secondary guarantees, we currently utilize reinsurance and capital markets solutions for financing a portion of our statutory reserve requirements deemed to benon-economic. If we are not able to maintain sufficient financing as a result of market conditions or otherwise, this could potentially adversely impact the profitability of our business, which could materially and adversely effect our financial condition, cash flow and results of operations.
Changes in tax laws and interpretations may decrease the profitability of our products and could adversely affect the Company.
On December 22, 2017, President Trump signed the Tax Cuts and Jobs Act into legislation, which made significant changes to federal income tax laws for life insurance companies. Many of the products that we have sold benefit from one or more forms oftax-favored status under current U.S. federal and state income tax regimes. For example, we have sold annuity contracts that allow the contractholders to defer the recognition of taxable income earned within the contract. Future changes in U.S. federal or state tax law could reduce or eliminate the attractiveness of such products, which could increase the expected lapse rate with respect to products that we have sold. Increases in lapse rates brought about by changes in U.S. tax law may result in a decrease in invested assets and therefore investment income and may have a material and adverse effect on our business, financial position, results of operations and cash flows.
Finally, it is possible that tax laws will be further changed either in a technical corrections bill or entirely new legislation. It remains difficult to predict whether or when there will be any tax law changes or further guidance by the authorities in the U.S., and any such changes or guidance may have a material adverse effect on our business, results of operations, cash flow, liquidity and financial condition.
Regulations defining fiduciary could cause some changes to the manner in which we deliver products and services, as well as changes in the nature and amount of compensation and fees.
The Department of Labor, the Securities and Exchange Commission and the National Association of Insurance Commissioners (“NAIC”) have announced proposals to develop fiduciary standards that would apply to recommendations made by certain financial advisors. Furthermore, several states have either issued their own fiduciary rules or are considering doing so and those rules may extend to certain types of products (e.g. insurance and annuities, financial planning, etc.) or may broadly cover all recommendations made by financial advisors. Additionally, self-regulatory bodies such as the Certified Financial Planner Board are developing a fiduciary standard that would apply to their members, such as financial advisors who hold a Certified Financial Planner designation.
4
Depending on the span and substance of any fiduciary rules and regulations and timing of their applicability, the scope of any implementation should not materially impact the way we compensate our advisors, particularly with respect to our closed block annuity business. However, compliance with prohibited transactions exemptions, when fully phased in, would likely require additional supervision with the possibility of overlapping or competing requirements from other regulators and increase litigation risk, all of which could adversely impact our business, results of operations and/or financial condition.
The Company is dependent on the performance of others.
The Company relies on third parties to provide various services that are important to our business operations. Certain of these third parties may act on behalf of the Company or represent the Company in various capacities, including but not limited to the administration of our contractholders’ activities or the management of our invested assets on aday-to-day basis. If a third party fails to perform its obligations or acts inappropriately with respect to the Company or its products, it could materially adversely affect the Company’s financial condition, results of operations and cash flows. Additionally, the Company’s operations are dependent on various technologies, some of which are provided and/or maintained by third parties. Any of the third parties that the Company depends upon may default on their services or obligations to the Company, including due to bankruptcy, insolvency, lack of liquidity, adverse economic conditions, operational failure, fraud or other reasons. Further, the Company may be held responsible for obligations that arise from the acts or omissions of these third parties. Such defaults could have a material adverse effect on the Company’s financial condition and results of operations.
If our internal controls are ineffective, our operating results could be adversely affected.
Our internal control over financial reporting may not prevent or detect misstatements because of its inherent limitations, including the possibility of human error, the circumvention or overriding of controls or fraud. Even effective internal controls can provide only reasonable assurance with respect to the preparation and fair presentation of financial statements. If we fail to maintain the adequacy of our internal controls, including any failure to implement required new or improved controls, or if we experience difficulties in their implementation, our business and operating results could be harmed and we could fail to meet our financial reporting obligations.
If our estimates or judgments relating to our critical accounting policies prove to be incorrect, our operating results could be adversely affected.
The preparation of financial statements in conformity with statutory accounting principles requires management to make estimates and assumptions that affect the amounts reported in the financial statements and accompanying notes. We base our estimates on historical experience and on various other assumptions that we believe to be reasonable under the circumstances, as provided in “Management’s Discussion and Analysis of Financial Condition and Results of Operations.” The results of these estimates form the basis for making judgments about the carrying values of assets, liabilities and equity, and the amount of revenue and expenses that are not readily apparent from other sources. Our operating results may be adversely affected if our assumptions change or if actual circumstances differ from those in our assumptions, which could cause our operating results to fall below our expectations.
The transition of the ownership and management of the Company may affect the Company’s operations.
On December 31, 2019, Guaranty Income Life Insurance Company (“GILICO”), an Iowa-domiciled insurance company, completed the indirect acquisition of all the outstanding stock of the Company. In connection with the change in ownership, certain new officers were appointed, including President, Chief Financial Officer and Secretary, and certain management functions were transitioned to GILICO and its parent company, Kuvare US Holdings, Inc. (“Kuvare”). During the transition period, management of the Company will
5
focus in part on the process of integrating the Company into the broader Kuvare enterprise. In addition, the Company cannot predict what response, if any, our contractholders and policyholders, agents, regulators, ratings agencies, reinsurance partners and other market participants will have to our change in ownership.
We may be unable to retain our highly qualified employees.
Our business depends on our ability to attract, motivate and retain highly skilled and often highly specialized technical, actuarial, managerial and executive personnel, and there is no assurance that we will be able to do so. We compete with other financial services companies for employees primarily on the basis of compensation and financial position. Our reputation, operations and internal controls could be materially adversely affected if we are unsuccessful in recruiting and retaining highly qualified employees.
Risks Relating to Investments
The determination of the fair value of our fixed income securities is subjective and could materially impact our operating results and financial condition.
In determining fair values, we principally use the market approach which utilizes market transaction data for the same or similar instruments. The degree of management judgment involved in determining fair values is inversely related to the availability of market observable information. The fair value of assets may differ from the actual amount received upon sale of an asset in an orderly transaction between market participants at the measurement date. Moreover, the use of different valuation assumptions may have a material effect on the assets’ fair values. Changing market conditions could materially affect the determination of the fair value of securities and unrealized net capital gains and losses could vary significantly, which could materially and adversely affect our cash flows.
Concentration of our investment portfolio in any particular segment of the economy may have adverse effects on our operating results and financial condition.
Our investment portfolio is and may in the future be concentrated in a certain industry, collateral type, group of related industries, geographic sector or risk type. See “Management’s Discussion and Analysis of Financial Condition and Results of Operations — Results of Operations — Debt securities by Industry” and “—Commercial Mortgage Loans.” Any such current or future concentrations could have an adverse effect on our investment portfolio and consequently on our results of operations and financial condition. Events or developments that have a negative impact on any particular industry, group of related industries or geographic region may have a greater adverse effect on the investment portfolio to the extent that the portfolio is concentrated, rather than diversified.
The determination of the amount of other-than-temporary-impairments of our investments is subjective and could materially impact our operating results and financial condition.
The determination of the amount of realized capital losses recorded for impairments varies by investment type and is based on our ongoing evaluation and assessment of known and inherent risks associated with the respective asset class. Such evaluations and assessments are revised as conditions change and new information becomes available. We update our evaluations regularly and reflect changes in other-than-temporary impairments in our results of operations. The assessment of whether other-than-temporary impairments have occurred is based on ourcase-by-case evaluation of the underlying reasons for the decline in fair value. We define fair value generally as the price that would be received to sell an asset or paid to transfer a liability. Our conclusions on such assessments are judgmental and include assumptions and projections of future cash flows which may ultimately prove to be incorrect as assumptions, facts and circumstances change. Furthermore, historical trends may not be indicative of future impairments and additional impairments may need to be recorded in the future.
6
Defaults or deteriorating credit of securities collateralized by residential and commercial mortgage loans, and collateralized corporate loans may lead to write-downs and impact our results of operations and financial condition.
Changes in residential or commercial mortgage delinquencies, loss severities or recovery rates, declining residential or commercial real estate prices, corporate loan delinquencies or recovery rates, changes in credit or bond insurer strength ratings and the quality of service provided by service providers on securities in our portfolio could lead us to determine that write-downs are necessary in the future, and could materially adversely affect our cash flow, results of operations and financial condition. See “Management’s Discussion and Analysis of Financial Condition and Results of Operations — Results of Operations — Commercial Mortgage Loans.”
Our investment strategies may not adequately protect against adverse developments in the financial markets.
While our investment management strategies are designed to protect asset value even in challenging market conditions, the Company cannot guarantee that such strategies would be successful, especially if there are unexpected developments in the financial markets. Slowing of global growth, tightening monetary policy in the U.S. and increasing political uncertainty remain key challenges for markets. There may be a limited market for certain investments we hold in our investment portfolio, making them relatively illiquid. These include corporate bonds, privately-placed fixed maturity securities, mortgage loans and policy loans. If we were forced to sell certain of our investments during periods of market volatility or disruption, market prices may be lower than our carrying value in such investments. Even in the absence of a market downturn, we are exposed to substantial risk of loss due to market volatility.
Risks Relating to the Insurance Industry
Difficult conditions in the global economy and capital markets generally could adversely affect our business and operating results.
Our business and results of operations are materially affected by conditions in the global capital markets and the economy generally. Stressed conditions, volatility and disruptions in global capital markets, particular markets, or financial asset classes can have an adverse effect on us, in part because we have a large investment portfolio and certain of our insurance liabilities are sensitive to changing market factors. Market factors, including interest rates, credit spreads, equity prices, real estate markets, consumer spending, business investment, government spending, the volatility and strength of the capital markets, deflation and inflation, all affect the business and economic environment and, ultimately, the amount and profitability of our business. Disruptions in one market or asset class can also spread to other markets or asset classes. Upheavals in the financial markets can also affect our business through their effects on general levels of economic activity, employment and customer behavior. Financial markets have also been affected periodically by concerns over U.S. fiscal policy. These issues could, on their own, or combined with the possible slowing of the global economy generally, have severe repercussions to the U.S. and global credit and financial markets, further exacerbate concerns over sovereign debt of other countries and disrupt economic activity in the U.S. and elsewhere.
General economic conditions could also adversely affect us in the form of consumer behavior and pressure investment results. Holders of some of our interest-sensitive life insurance and annuity products may engage in an elevated level of discretionary withdrawals of contractholder funds. Our contractholders may choose to defer paying insurance premium or stop paying insurance premiums altogether. Our investment results could be adversely affected as deteriorating financial and business conditions affect the issuers of the securities in our investment portfolio.
7
Losses from legal and regulatory actions may be material to our operating results or cash flows and may result in harm to our reputation.
We are involved in various legal actions in the ordinary course of business, the results of which we cannot predict with certainty. We are also subject to various regulatory actions and inquiries, such as information requests, market conduct examinations and books and record examinations from state and federal regulators and other authorities. A substantial legal liability or significant regulatory action against us, as well as regulatory inquiries or investigations, could harm our reputation, result in material fines or penalties, result in significant legal costs and otherwise have a material adverse effect on our business, financial condition and results of operations. Even if we ultimately prevail in the litigation, regulatory actions or investigation, our ability to retain our current contractholders and recruit and retain employees could be materially and adversely impacted.
We are subject to extensive regulation and potential further restrictive regulation may increase our operating costs.
As an insurance company, we are subject to extensive laws and regulations.
The extent of regulation varies, but generally the Company is governed by state statutes. These statutes delegate regulatory, supervisory and administrative authority to state insurance departments. This system of supervision and regulation covers, among other things, standards of minimum capital requirements and solvency, including risk-based capital measurements, restrictions on certain transactions, licensing status, reserving, payment of policy benefits, etc. State insurance regulators and the NAIC regularlyre-examine existing laws and regulations applicable to insurance companies and their products. Changes in these laws and regulations, or in interpretations thereof, sometimes lead to additional expense for the insurer and, thus, could have a material adverse effect on our financial condition and results of operations.
Regulatory authorities have relatively broad discretion to grant, renew or revoke licenses and approvals. If we do not have the requisite licenses and approvals or do not comply with applicable regulatory requirements, the insurance regulatory authorities could preclude or temporarily suspend us from carrying on some or all of our activities or impose substantial fines. Further, insurance regulatory authorities have relatively broad discretion to issue orders of supervision, which permit such authorities to supervise the business and operations of an insurance company. Moreover, as a result of the regulatory process related to GILICO’s acquisition of the Company, jurisdictions where the Company is licensed may perform various levels of review and require certain conditions to be met in order for the Company’s license in such jurisdiction to remain valid or be reauthorized. Failure of the Company to maintain its licenses in each jurisdiction could have a material adverse effect on our results of operations or financial condition.
As an insurance company with separate accounts that are regulated as investment companies, we are also subject to laws and regulations administered and enforced by a number of different governmental authorities, each of which exercises a degree of interpretive latitude, including state insurance regulators, state securities administrators, state attorneys general, and federal agencies including the SEC, the FINRA and the U.S. Department of Justice. Failure to comply with these laws and regulations could result in material fines or other penalties, as well as unexpected costs in remedying any such failure. In addition, we are subject to the risk that compliance with any particular regulator’s or enforcement authority’s interpretation of a legal issue may not result in compliance with another’s interpretation of the same issue. Further, there is risk that any particular regulator’s or enforcement authority’s interpretation of a legal issue may change over time to our detriment, or that changes in the overall legal environment may, even absent any particular regulator’s or enforcement authority’s interpretation of a legal issue, result in material fines or penalties or increased costs, which could in turn negatively impact our financial condition, cash flow and results of operations.
8
Regulatory reforms, and the more stringent application of existing regulations, may make it more expensive for us to conduct our business and increase our capital requirements.
Over the last decade, the federal government enacted comprehensive regulatory reforms for financial services entities. As part of a larger effort to strengthen the regulation of the financial services market, certain reforms are applicable to the insurance industry, including the Federal Insurance Office (“FIO”) established within the Treasury Department.
As the state insurance regulatory framework has come under public scrutiny, members of Congress have discussed proposals to provide for federal chartering of insurance companies, and the FIO and Financial Stability Oversight Council were established. We can make no assurances regarding the potential impact of state or federal measures that may change the nature or scope of insurance and financial regulation. Regulatory reforms and legislative change or regulatory requirements imposed upon us in connection with the federal government’s regulatory reform of the financial services industry, and any more stringent enforcement of existing regulations by federal authorities, may make it more expensive for us to conduct our business.
The Company is subject to insurance guaranty fund laws, rules and regulations that could adversely affect the Company’s financial condition or results of operations.
Under insurance guaranty fund laws in most states, insurance companies doing business therein can be assessed up to prescribed limits for contractholder or policyholder losses incurred by insolvent companies. From time to time, companies may be asked to contribute amounts beyond prescribed limits. It is possible that the Company could be assessed with respect to product lines not offered by the Company. In addition, legislation may be introduced in various states with respect to guaranty fund assessment laws related to insurance products, including long term care insurance and other specialty products, that alters future premium tax offsets received in connection with guaranty fund assessments. The Company cannot predict the amount, nature or timing of any future assessments or legislation, any of which could have a material and adverse impact on the Company’s financial condition or results of operations.
Reinsurance may be unavailable at current levels and prices.
Market conditions beyond our control impact the availability and cost of the reinsurance we secure to lessen our risk with respect to the contracts and policies we have issued. No assurances can be made that reinsurance will remain continuously available to us to the same extent and on the same terms and rates as is currently available. We review retention limits for continued appropriateness and they may be changed in the future. Prolonged or severe adverse mortality or morbidity experience could result in increased reinsurance costs or, ultimately, reinsurers unwilling to offer coverage. If we were unable to renew or purchase reinsurance protection in amounts that we consider sufficient and at prices that we consider acceptable, we may have to accept an increase in risk exposure, seek other alternatives, or accept reduced profitability.
Reinsurance subjects us to the credit risk of our reinsurers and may not be adequate to protect us against losses arising from ceded insurance, which could have a material effect on our operating results.
The collectability of reinsurance recoverables is subject to uncertainty arising from a number of factors, including changes in market conditions, whether insured losses meet the qualifying conditions of the reinsurance contract and whether reinsurers, or their affiliates, have the financial capacity and willingness to make payments under the terms of a reinsurance treaty or contract. While we aim to avoid overexposure by entering into reinsurance agreements with varied counterparties, the liabilities for certain products, including the Contracts, are reinsured exclusively to one or a small group of reinsurers. Our inability to collect a material recovery from one or more reinsurers could have a material adverse effect on our operating results, financial condition and cash flows.
9
Adverse capital and credit market conditions may significantly affect our ability to meet liquidity needs or our ability to obtain credit on acceptable terms.
In periods of extreme volatility and disruption in the capital and credit markets, liquidity and credit capacity may be severely restricted. In such circumstances, our ability to obtain capital to fund operating expenses, financing costs, satisfy statutory capital requirements and meet liquidity needs may be limited. Our access to additional financing will depend on a variety of factors such as market conditions, the general availability of credit, the overall availability of credit to our industry, our credit ratings and credit capacity, as well as lenders’ perception of our long- or short-term financial prospects. Similarly, our access to funds may be impaired if regulatory authorities or rating agencies take negative actions against us. If a combination of these factors were to occur, our internal sources of liquidity may prove to be insufficient, and in such case, we may not be able to successfully obtain additional financing on favorable terms. Our results of operations, financial condition, cash flows and statutory capital position could be materially adversely affected by disruptions in the capital markets.
A downgrade or a potential downgrade in our financial strength or credit rating could result in a loss of business and materially affect our financial condition and results of operations.
Financial strength ratings are published by various Nationally Recognized Statistical Rating Organizations (“NRSRO”) and similar entities not formally recognized as NRSROs. They indicate the NRSROs’ opinion regarding an insurance company’s ability to meet contractholder obligations, and can be important to maintaining public confidence in our products and our competitive position.
In view of the difficulties experienced by many financial institutions as a result of the financial crisis and ensuing global recession, including certain members in the insurance industry, NRSROs continue to implement changes to their internal models that have the effect of increasing or decreasing the amount of statutory capital we must hold in order to maintain our current ratings. Our ratings could be downgraded at any time and without notice by any NRSRO. In addition, these reforms may also increase our minimum capital requirements.
Downgrades in our financial strength ratings could have a material adverse effect on our financial condition and results of operations in many ways, including materially increasing the number or amount of policy surrenders and withdrawals by contractholders and adversely affecting our ability to obtain reinsurance at reasonable prices or at all.
The occurrence of a catastrophe, including a large scale pandemic, the continued threat of terrorism or military actions may have an adverse effect on the level of claim losses we incur, the value of our investment portfolio, our competitive position, liquidity, operating results and attractiveness of product offering.
Any catastrophic event, such as a large scale pandemic, the continued threat of terrorism within the United States and abroad, or military and other actions, and heightened security measures in response to these types of threats, may cause significant volatility and losses in our investment portfolio from changes, and result in loss of life, disruptions to commerce and reduced economic activity. Some of the assets in our investment portfolio may be adversely affected by reduced economic activity caused by the threat of a large scale pandemic such as COVID-19 (Coronavirus) or the continued threat of terrorism. Additionally, a large scale pandemic or terrorist act could have a material effect on renewal premium, profitability, competitiveness, liquidity, operating results and attractiveness of product offering.
Changes in accounting standards issued by standard-setting bodies may adversely affect our results of operations and financial condition.
Our financial statements are subject to the application of statutory accounting principles, which are periodically revised, interpreted and/or expanded. Accordingly, we may be required to adopt new guidance or interpretations, or could be subject to existing guidance as we enter into new transactions, which may have a material effect on our results of operations and financial condition that is either unexpected or has a greater impact than expected.
10
Any changes in the method of calculating reserves for our life insurance and annuity products under statutory accounting principles may result in increased or decreased reserve requirements. The NAIC has announced focused industry inquiries on certain matters that could have an impact on the Company’s financial condition and results of operations. Such inquiries concern, for example, insurer use of captive reinsurance companies, variable annuity reserves and capital treatment, reinsurance, cybersecurity practices and risk-based capital calculations. In addition, the NAIC continues to consider various initiatives to change and modernize its financial and solvency requirements and regulations. It has adopted principles-based reserving methodologies for life insurance and annuity reserves, but additional formulas and/or guidance relevant to the new standard are being developed. The NAIC is also considering changes to accounting regulations, governance practices of insurers and other items. The Company cannot currently estimate what impact these more focused inquiries or proposed changes, if they occur, will have on reserve and capital requirements, financial condition or results of operations.
For a description of changes in accounting standards that are currently pending and, if known, our estimates of their expected impact, see Note 2 to the financial statements.
The failure in cyber or other information security systems, as well as the occurrence of events unanticipated in our disaster recovery systems, management continuity planning or a support failure from external providers, could result in a loss or disclosure of confidential information, damage to our reputation and impairment of our ability to conduct business effectively.
Our business is highly dependent upon the effective operation of our computer systems to perform necessary business functions. We rely on these systems throughout our business for a variety of functions, including processing claims, providing information to customers and distributors, performing actuarial analyses and maintaining financial records. We also retain confidential and proprietary information on our computer systems and we rely on sophisticated technologies and our third party service providers to maintain the security of that information. Our computer systems have been, and will likely continue to be, subject to computer viruses or other malicious codes, unauthorized access, cyber-attacks or other computer-related penetrations. Despite our implementation of administrative and technical controls and other preventive actions to reduce the risk of cyber-incidents and protect our information technology, there can be no assurance that our computer systems and those of our unaffiliated service providers will not be vulnerable to physical and electronicbreak-ins, cyber-attacks or other security breaches to our computer systems. If one or more of these events occurs, it could potentially jeopardize the confidential, proprietary and other information processed and stored in, and transmitted through, our computer systems and networks, or otherwise cause interruptions or malfunctions in our operations, which could result in damage to our reputation, financial losses, litigation, increased costs, regulatory penalties and/or customer dissatisfaction or loss.
The occurrence of a disaster such as a natural catastrophe, epidemic, industrial accident, blackout, computer virus, terrorist attack or war, cyber-attack, events unanticipated in our disaster recovery systems or a support failure from external providers, could have an adverse effect on our ability to conduct business and on our results of operations and financial condition, particularly if those events affect our computer-based data processing, transmission, storage and retrieval systems or destroy data. If a significant number of our third party service providers were rendered unavailable in the event of a disaster, our ability to effectively conduct our business could be severely compromised. These interruptions also may interfere with our third party service providers’ ability to provide services and our employees’ ability to perform their job responsibilities.
The failure of our computer systems and/or our disaster recovery plans for any reason could cause significant interruptions in our operations and result in a failure to maintain the security, confidentiality or privacy of sensitive data, including personal information relating to our customers. Such a failure could harm our reputation, subject us to regulatory sanctions and legal claims, lead to a loss of customers and revenues and otherwise adversely affect our business and financial results.
11
Although we conduct due diligence, negotiate contractual provisions and, in most cases, conduct periodic reviews of our vendors, distributors and other third parties that provide operational or information technology services to us to confirm compliance with the Company’s information security standards, the failure of such third parties’ computer systems and/or their disaster recovery plans for any reason might cause significant interruptions in our operations and result in a failure to maintain the security, confidentiality or privacy of sensitive data, including personal information relating to our customers. Such a failure could harm our reputation, subject us to regulatory sanctions and legal claims, lead to a loss of contractholders and revenues and otherwise adversely affect our business and financial results. While we maintain cyber liability insurance, our insurance may not be sufficient to protect us against all losses.
We are subject to data security and privacy risks that could negatively affect our results, operations or reputation.
Hackers and data thieves are increasingly sophisticated and operate large-scale and complex automated attacks. Despite our efforts to ensure the integrity of our systems, it is possible that we may not be able to anticipate and implement effective preventative or detective measures against security breaches of all types because the techniques used change frequently or are not recognized until launched and because cyber-attacks can originate from a wide variety of sources or parties. Those parties may also attempt to fraudulently induce employees, contractholders or other users of our system to deliberately or inadvertently disclose sensitive information in order to gain access to our data or that of our contractholders. Any breach of our network may result in the loss of valuable business data, misappropriation of our consumers’ or employees’ personal information or a disruption of our business, which could give rise to unwanted media attention, materially damage our customer relationships and reputation and result in lost business, fines or lawsuits.
In addition, we must comply with increasingly complex and rigorous regulatory standards enacted to protect business and personal data. Cyber threats and related legal and regulatory standards applicable to our business are rapidly evolving and may subject the Company to heightened legal standards, new theories of liability and material claims and penalties that we cannot currently predict or anticipate. The NAIC has adopted the Insurance Data Security Model Law which established the standards for data security and investigation and notification of a breach of data security for insurance companies, and an increasing number of states require that affected persons be notified if a security breach results in the disclosure of their personally identifiable information. Any compromise of the security of our computer systems that results in the inappropriate disclosure of personally identifiable customer information could damage our reputation in the marketplace, subject us to significant civil and criminal liability and require us to incur significant technical, legal and other expenses.
As cyber threats and applicable legal standards continue to evolve, the Company may be required to expend significant additional resources to continue to modify or enhance our protective measures and computer systems, and to investigate and remediate any information security vulnerabilities. If the Company experiences security events or other technological failures, it may be subject to regulatory inquiries or proceedings, litigation or reputational damage or be required to pay claims, fines or penalties.
Failure of a vendor to protect personal information of our customers, claimants or employees could affect our operations.
We outsource certain information technology, policy administration, investment management and actuarial functions to third party service providers. In the event that one or more of our vendors fails to protect personal information of our customers, claimants or employees, we may suffer operational impairments and financial losses.
12
We may not be able to protect our intellectual property and may be subject to infringement claims.
We rely on a combination of contractual rights and copyright, trademark, patent and trade secret laws to establish and protect our intellectual property. Although we use a broad range of measures to protect our intellectual property rights, third parties may infringe or misappropriate our intellectual property. We may have to litigate to enforce and protect our intellectual property and to determine its scope, validity or enforceability, which could divert significant resources and prove unsuccessful. An inability to protect our intellectual property could have a material effect on our business.
We may be subject to claims by third parties for patent, trademark or copyright infringement or breach of usage rights. Any such claims and any resulting litigation could result in significant expense and liability. If our third party service providers or we are found to have infringed a third-party intellectual property right, either of us could be enjoined from providing certain products or services or from utilizing and benefiting from certain methods, processes, copyrights, trademarks, trade secrets or licenses. Alternatively, we could be required to enter into costly licensing arrangements with third parties or implement a costly work around. Any of these scenarios could have a material effect on our business and results of our operations.
Our risk management policies and procedures may leave us exposed to unidentified or unanticipated risk, which could negatively affect our business.
We have devoted significant resources to develop and periodically update our risk management policies and procedures to reflect ongoing review of our risks and expect to continue to do so in the future. Nonetheless, our policies and procedures may not be comprehensive and may not identify every risk to which we are exposed. Many of our methods for managing risk and exposures are based upon the use of observed historical market behavior or statistics based on historical models. As a result, these methods may not fully predict future exposures, which can be significantly greater than our historical measures indicate. Other risk management methods depend upon the evaluation of information regarding markets, clients, catastrophe occurrence or other matters that is publicly available or otherwise accessible to us. This information may not always be accurate, complete,up-to-date or properly evaluated. In addition, more extensive and perhaps different risk management policies and procedures might have to be implemented under pending regulations. Any such unforeseen risk, as well as the implementation of any additional risk management policies and procedures may result in material costs to the Company, which could materially adversely affect the Company’s financial condition, cash flow and results of operations.
The effectiveness of our actuarial and other financial models may adversely affect our financial results, capitalization and financial condition.
Actuarial and other financial models are used primarily to determine reserve levels for ourin-force block and to provide information to key internal stakeholders for planning, asset / liability management, and risk / stress testing analysis purposes. The models are subject to extensive internal controls which promote repeatability and sustainability, and are also subject to continual review regarding effectiveness, logic, assumptions and underlying product mechanics and refinements may be implemented based on these reviews. Refinements are subject to a rigorous change management process and are agreed upon with key internal stakeholders prior to implementation. While models are continually improving as a result of these refinements, there are still inherent limitations. First, no assurances can be given that all necessary refinements will be identified and/or implemented in our actuarial models. Also, due to the nature of the underlying risks and the uncertainty associated with prospective modeling techniques and the application of such techniques, these models may not accurately capture the evolution of thein-force block, as we cannot determine precisely the actual experience, policyholder behavior and investment income. Variations in any of the foregoing from estimates in our models may result in the need to post additional reserves, which could have a material adverse effect on the Company’s financial condition including by adversely affecting the Company’s capital adequacy ratios utilized by NRSROs to assign credit ratings.
13
| Item 11(a). | Description of Business |
Lincoln Benefit Life Company (referred to in this document as “we,” “Lincoln Benefit,” “our,” “us” or the “Company”) was incorporated under the laws of the State of Nebraska in 1938. Lincoln Benefit is a wholly-owned subsidiary of LBL HoldCo II, Inc., a Delaware corporation, which is a wholly-owned subsidiary of LBL HoldCo, Inc. (“HoldCo Parent”). HoldCo Parent is a wholly-owned subsidiary of GILICO. Prior to December 31, 2019, HoldCo Parent was a wholly-owned subsidiary of RL LP and RL (Parallel) Partnership.
Prior to July 18, 2013, we sold interest-sensitive, traditional and variable life insurance, and fixed annuities including deferred and immediate, through independent master brokerage agencies and the Allstate exclusive agency channel. In July 2013, we ceased soliciting and selling new policies through our independent agent channel. In 2017, we ceased soliciting and selling new policies through the Allstate exclusive agency channel.
In 2015, the administration of our retained deferred annuity and life business was outsourced to unaffiliated third-party service providers, SE2, LLC and Alliance–One Services, Inc. Allstate Life Insurance Company (“ALIC”) continues to reinsure and administer business sold through the Allstate exclusive agency channel and certain life, immediate and payout annuity contracts. LifeCare Assurance Company administers the Company’s long-term care business.
Lincoln Benefit’s variable annuity business is reinsured by ALIC under an existing reinsurance agreement between Lincoln Benefit and ALIC. In 2006, ALIC disposed of substantially all of its variable annuity business through reinsurance agreements with The Prudential Insurance Company of America, a subsidiary of Prudential Financial, Inc. The Company was not a direct party to this agreement and its reinsurance agreement with ALIC remains unchanged.
In our reports, we occasionally refer to statutory financial information. All domestic U.S. insurance companies are required to prepare statutory-basis financial statements. As a result, industry data is available that enables comparisons between insurance companies, including competitors that are not subject to the requirement to prepare financial statements in conformity with accounting principles generally accepted in the United States of America. We frequently use industry publications containing statutory financial information to assess our competitive position.
Lincoln Benefit is subject to extensive regulation, primarily at the state level. The method, extent and substance of such regulation varies by state but generally has its source in statutes that establish standards and requirements for conducting the business of insurance and that delegate regulatory authority to a state agency. These rules have a substantial effect on our business and relate to a wide variety of matters, including insurer solvency, reserve adequacy, insurance company licensing and examination, agent licensing, policy forms, rate setting, the nature and amount of investments, claims practices, participation in guaranty funds, transactions with affiliates, the payment of dividends, underwriting standards, statutory accounting methods, trade practices and corporate governance.
| Item 11(b). | Description of Property |
Lincoln Benefit occupies leased office space in Lincoln, Nebraska and Rosemont, Illinois.
| Item 11(c). | Legal Proceedings |
Lincoln Benefit is engaged in routine lawsuits, which, in management’s judgment, are not of material importance to its total assets or business prospects.
14
| Item 11(e) | Financial Statements and Notes to Financial Statements |
Lincoln Benefit Life Company
(A Wholly-Owned subsidiary of LBL HoldCo II, Inc.)
Index
December 31, 2019
| Page(s) | ||||
| REPORTS OF INDEPENDENT REGISTERED PUBLIC ACCOUNTING FIRMS | 16 | |||
| STATUTORY STATEMENTS OF ADMITTED ASSETS, LIABILITIES AND CAPITAL STOCK AND SURPLUS | 20 | |||
| STATUTORY STATEMENTS OF OPERATIONS | 21 | |||
| STATUTORY STATEMENTS OF CHANGES IN CAPITAL STOCK AND SURPLUS | 22 | |||
| STATUTORY STATEMENTS OF CASH FLOWS | 23 | |||
| NOTES TO STATUTORY STATEMENTS | 24 | |||
15
To the Shareholders and Board of Directors of
Lincoln Benefit Life Company
Rosemont, Illinois
We have audited the accompanying statutory financial statements of Lincoln Benefit Life Company (the “Company”), a wholly-owned subsidiary of LBL HoldCo II, Inc., which comprise the statutory statements of admitted assets, liabilities and capital stock and surplus as of December 31, 2019 and 2018, and the related statutory statements of operations, changes in capital stock and surplus, and cash flows for the years then ended, and the related notes to the statutory financial statements (collectively referred to as the “statutory financial statements”).
Management’s Responsibility for the Statutory Financial Statements
Management is responsible for the preparation and fair presentation of these statutory financial statements in accordance with accounting practices prescribed or permitted by the Insurance Department of the State of Nebraska. Management is also responsible for the design, implementation, and maintenance of internal control relevant to the preparation and fair presentation of financial statements that are free from material misstatement, whether due to fraud or error.
Auditors’ Responsibility
Our responsibility is to express an opinion on these statutory financial statements based on our audits. We conducted our audits in accordance with auditing standards generally accepted in the United States of America. Those standards require that we plan and perform the audit to obtain reasonable assurance about whether the statutory financial statements are free from material misstatement.
An audit involves performing procedures to obtain audit evidence about the amounts and disclosures in the statutory financial statements. The procedures selected depend on the auditor’s judgment, including the assessment of the risks of material misstatement of the statutory financial statements, whether due to fraud or error. In making those risk assessments, the auditor considers internal control relevant to the Company’s preparation and fair presentation of the statutory financial statements in order to design audit procedures that are appropriate in the circumstances, but not for the purpose of expressing an opinion on the effectiveness of the Company’s internal control. Accordingly, we express no such opinion. An audit also includes evaluating the appropriateness of accounting policies used and the reasonableness of significant accounting estimates made by management, as well as evaluating the overall presentation of the statutory financial statements.
We believe that the audit evidence we have obtained is sufficient and appropriate to provide a basis for our audit opinions.
Basis for Adverse Opinion on Accounting Principles Generally Accepted in the United States of America
As described in Note 1 to the statutory financial statements, the statutory financial statements are prepared by Lincoln Benefit Life Company using the accounting practices prescribed or permitted by the Insurance Department of the State of Nebraska, which is a basis of accounting other than accounting principles generally accepted in the United States of America, to meet the requirements of the Insurance Department of the State of Nebraska.
The effects on the statutory financial statements of the variances between the statutory basis of accounting described in Note 1 to the statutory financial statements and accounting principles generally accepted in the United States of America although not reasonably determinable, are presumed to be material.
16
Adverse Opinion on Accounting Principles Generally Accepted in the United States of America
In our opinion, because of the significance of the matter described in the Basis for Adverse Opinion on Accounting Principles Generally Accepted in the United States of America paragraph, the statutory financial statements referred to above do not present fairly, in accordance with accounting principles generally accepted in the United States of America, the financial position of Lincoln Benefit Life Company as of December 31, 2019 and 2018, or the results of its operations or its cash flows for the years then ended.
Opinion on Statutory Basis of Accounting
In our opinion, the statutory financial statements referred to above present fairly, in all material respects, the admitted assets, liabilities and capital and surplus of Lincoln Benefit Life Company as of December 31, 2019 and 2018, and the results of its operations and its cash flows for the years then ended, in accordance with accounting practices prescribed or permitted by the Insurance Department of the State of Nebraska as described in Note 1 to the statutory financial statements.
/s/ DELOITTE & TOUCHE LLP
Chicago, Illinois
March 30, 2020
17
Report of Independent Auditors
To the Board of Directors of Lincoln Benefit Life Company:
We have audited the accompanying statutory financial statements of Lincoln Benefit Life Company, which comprise the statutory statement of admitted assets, liabilities, and capital stock and surplus as of December 31, 2017, and the related statutory statements of operations and changes in capital stock and surplus, and of cash flows for the year then ended.
Management’s Responsibility for the Financial Statements
Management is responsible for the preparation and fair presentation of the financial statements in accordance with the accounting practices prescribed or permitted by the Nebraska Department of Insurance. Management is also responsible for the design, implementation, and maintenance of internal control relevant to the preparation and fair presentation of financial statements that are free from material misstatement, whether due to fraud or error.
Auditors’ Responsibility
Our responsibility is to express an opinion on the financial statements based on our audit. We conducted our audit in accordance with auditing standards generally accepted in the United States of America. Those standards require that we plan and perform the audit to obtain reasonable assurance about whether the financial statements are free from material misstatement.
An audit involves performing procedures to obtain audit evidence about the amounts and disclosures in the financial statements. The procedures selected depend on our judgment, including the assessment of the risks of material misstatement of the financial statements, whether due to fraud or error. In making those risk assessments, we consider internal control relevant to the Company’s preparation and fair presentation of the financial statements in order to design audit procedures that are appropriate in the circumstances, but not for the purpose of expressing an opinion on the effectiveness of the Company’s internal control. Accordingly, we express no such opinion. An audit also includes evaluating the appropriateness of accounting policies used and the reasonableness of significant accounting estimates made by management, as well as evaluating the overall presentation of the financial statements. We believe that the audit evidence we have obtained is sufficient and appropriate to provide a basis for our audit opinion.
Basis for Adverse Opinion on U.S. Generally Accepted Accounting Principles
As described in Note 1 to the financial statements, the financial statements are prepared by the Company on the basis of the accounting practices prescribed or permitted by the Nebraska Department of Insurance, which is a basis of accounting other than accounting principles generally accepted in the United States of America.
The effects on the financial statements of the variances between the statutory basis of accounting described in Note 1 and accounting principles generally accepted in the United States of America are material.
Adverse Opinion on U.S. Generally Accepted Accounting Principles
In our opinion, because of the significance of the matter discussed in the “Basis for Adverse Opinion on U.S. Generally Accepted Accounting Principles” paragraph, the financial statements referred to above do not present fairly, in accordance with accounting principles generally accepted in the United States of America, the financial position of the Company as of December 31, 2017, or the results of its operations or its cash flows for the year then ended.
18
Opinion on Statutory Basis of Accounting
In our opinion, the financial statements referred to above present fairly, in all material respects, the admitted assets, liabilities and surplus of the Company as of December 31, 2017, and the results of its operations and its cash flows for the year then ended, in accordance with the accounting practices prescribed or permitted by the Nebraska Department of Insurance described in Note 1.
/s/ PricewaterhouseCoopers LLP
Chicago, Illinois
May 8, 2018
19
LINCOLN BENEFIT LIFE COMPANY
STATUTORY STATEMENTS OF ADMITTED ASSETS, LIABILITIES AND CAPITAL STOCK AND SURPLUS
DECEMBER 31, 2019 AND 2018
($’S IN THOUSANDS, EXCEPT SHARE AND PER SHARE AMOUNTS)
| December 31, 2019 | December 31, 2018 | |||||||
Admitted Assets | ||||||||
Bonds | $ | 6,361,622 | $ | 7,709,648 | ||||
Preferred stocks | 14,800 | 14,800 | ||||||
Common stocks | 8,479 | 6,988 | ||||||
Mortgage loans | 721,831 | 859,366 | ||||||
Contract loans | 33,622 | 134,465 | ||||||
Other investments | 84,792 | 50,377 | ||||||
Receivables for securities | 96 | 539 | ||||||
Cash, cash equivalents and short-term investments | 250,810 | 211,240 | ||||||
|
|
|
| |||||
Total Cash and Invested Assets | 7,476,052 | 8,987,423 | ||||||
Due and accrued investment income | 75,238 | 90,974 | ||||||
Current income tax recoverable | 26,066 | 28,937 | ||||||
Net deferred tax asset | 27,030 | 26,585 | ||||||
Deferred premium and other assets, net | 103,990 | 61,707 | ||||||
Separate account assets | 1,464,556 | 1,266,912 | ||||||
|
|
|
| |||||
Total Admitted Assets | 9,172,932 | $ | 10,462,538 | |||||
|
|
|
| |||||
Liabilities, Capital Stock and Surplus | ||||||||
Reserves for policy benefits | 4,357,355 | 6,001,555 | ||||||
Reinsurance payable | 48,333 | 979 | ||||||
Interest maintenance reserve | 35,675 | — | ||||||
Funds held under coinsurance | 2,776,976 | 2,709,129 | ||||||
Other liabilities | 137,427 | 104,033 | ||||||
Separate account liabilities | 1,464,556 | 1,266,912 | ||||||
|
|
|
| |||||
Total Liabilities | 8,820,322 | $ | 10,082,608 | |||||
|
|
|
| |||||
Capital Stock and Surplus | ||||||||
Common capital stock, $100 par value, 30,000 shares authorized and 25,000 shares outstanding | 2,500 | 2,500 | ||||||
Gross paid in and contributed surplus | 196,779 | 171,003 | ||||||
Unassigned funds | 153,331 | 206,427 | ||||||
|
|
|
| |||||
Total Capital Stock and Surplus | 352,610 | $ | 379,930 | |||||
|
|
|
| |||||
Total Liabilities, Capital Stock and Surplus | 9,172,932 | $ | 10,462,538 | |||||
|
|
|
| |||||
See Notes to the Statutory Financial Statements
20
LINCOLN BENEFIT LIFE COMPANY
STATUTORY STATEMENTS OF OPERATIONS
FOR THE YEARS ENDED DECEMBER 31, 2019, 2018 AND 2017
($’S IN THOUSANDS)
| 2019 | 2018 | 2017 | ||||||||||
Revenue | ||||||||||||
Premiums | $ | (913,357 | ) | $ | 80,113 | $ | 111,012 | |||||
Net investment income | 382,333 | 402,362 | 431,120 | |||||||||
Commissions and expense allowance | 84,423 | 64,286 | 69,041 | |||||||||
Reserve adjustments on reinsurance ceded | (686,158 | ) | (174,884 | ) | (196,905 | ) | ||||||
Other income | 34,628 | 24,927 | 25,371 | |||||||||
|
|
|
|
|
| |||||||
Total Revenue | (1,098,131 | ) | 396,804 | 439,639 | ||||||||
|
|
|
|
|
| |||||||
Benefits and Expenses | ||||||||||||
Benefit payments to policyholders and beneficiaries | $ | 389,734 | $ | 702,649 | $ | 722,790 | ||||||
Net change to policy benefit reserves | (1,707,830 | ) | (484,565 | ) | (488,877 | ) | ||||||
Net transfers from separate accounts | (63,167 | ) | (60,276 | ) | (70,296 | ) | ||||||
Commissions and operating expenses | 270,576 | 218,553 | 229,001 | |||||||||
|
|
|
|
|
| |||||||
Total benefits and expenses | (1,110,687 | ) | 376,361 | 392,618 | ||||||||
|
|
|
|
|
| |||||||
Gain from operations before dividends and taxes | 12,556 | 20,443 | 47,021 | |||||||||
Policyholder dividends | 31 | 34 | 34 | |||||||||
|
|
|
|
|
| |||||||
Gain from operations before taxes | 12,525 | 20,409 | 46,987 | |||||||||
Income tax expense (benefit) | — | (4,090 | ) | (8,296 | ) | |||||||
|
|
|
|
|
| |||||||
Net gain from operations | 12,525 | 24,499 | 55,283 | |||||||||
Net realized capital gains (losses) | 21,624 | 11,224 | 9,212 | |||||||||
|
|
|
|
|
| |||||||
Net Income | $ | 34,149 | $ | 35,723 | $ | 64,495 | ||||||
|
|
|
|
|
| |||||||
See Notes to the Statutory Financial Statements
21
LINCOLN BENEFIT LIFE COMPANY
STATUTORY STATEMENTS OF CHANGES IN CAPITAL STOCK AND SURPLUS
FOR THE YEARS ENDED DECEMBER 31, 2019, 2018 AND 2017
($’S IN THOUSANDS, EXCEPT SHARE AND PER SHARE AMOUNTS)
| Additional | Total | |||||||||||||||||||
| Paid-In | Unassigned | Capital Stock | ||||||||||||||||||
| Common Capital Stock | Capital | Funds | and Surplus | |||||||||||||||||
Balance, December 31, 2016 | 25,000 | $ | 2,500 | $ | 171,003 | $ | 386,032 | $ | 559,535 | |||||||||||
Net income | — | — | — | 64,495 | 64,495 | |||||||||||||||
Change in net unrealized capital gains (losses) | — | — | — | (10,092 | ) | (10,092 | ) | |||||||||||||
Change in net deferred income tax | — | — | — | (13,626 | ) | (13,626 | ) | |||||||||||||
Change in nonadmitted assets | — | — | — | (92,976 | ) | (92,976 | ) | |||||||||||||
Dividends to stockholder | — | — | — | (70,000 | ) | (70,000 | ) | |||||||||||||
Change in liability for reinsurance in unauthorized and certified companies | — | — | — | 2,212 | 2,212 | |||||||||||||||
Change in asset valuation reserve | — | — | — | 2,032 | 2,032 | |||||||||||||||
Deferral of ceding commission | — | — | — | (15,779 | ) | (15,779 | ) | |||||||||||||
|
|
|
|
|
|
|
|
|
| |||||||||||
Balance, December 31, 2017 | 25,000 | $ | 2,500 | $ | 171,003 | $ | 252,298 | $ | 425,801 | |||||||||||
Net income | — | — | — | 35,723 | 35,723 | |||||||||||||||
Change in net unrealized capital gains (losses) | — | — | — | (50,622 | ) | (50,622 | ) | |||||||||||||
Change in net deferred income tax | — | — | — | 12,913 | 12,913 | |||||||||||||||
Change in nonadmitted assets | — | — | — | (19,333 | ) | (19,333 | ) | |||||||||||||
Dividends to stockholder | — | — | — | (15,000 | ) | (15,000 | ) | |||||||||||||
Change in asset valuation reserve | — | — | — | 6,488 | 6,488 | |||||||||||||||
Deferral of ceding commission | — | — | — | (16,040 | ) | (16,040 | ) | |||||||||||||
|
|
|
|
|
|
|
|
|
| |||||||||||
Balance, December 31, 2018 | 25,000 | $ | 2,500 | $ | 171,003 | $ | 206,427 | $ | 379,930 | |||||||||||
|
|
|
|
|
|
|
|
|
| |||||||||||
Change inpaid-in capital | — | — | 25,776 | — | 25,776 | |||||||||||||||
Net income | — | — | — | 34,149 | 34,149 | |||||||||||||||
Change in net unrealized capital gains (losses) | — | — | — | (45,874 | ) | (45,874 | ) | |||||||||||||
Change in net deferred income tax | — | — | — | (5,802 | ) | (5,802 | ) | |||||||||||||
Change in nonadmitted assets | — | — | — | 19,704 | 19,704 | |||||||||||||||
Dividends to stockholder | — | — | — | (40,000 | ) | (40,000 | ) | |||||||||||||
Change in liability for reinsurance in unauthorized and certified companies | — | — | — | (4,606 | ) | (4,606 | ) | |||||||||||||
Change in asset valuation reserve | — | — | — | 5,397 | 5,397 | |||||||||||||||
Deferral of ceding commission | — | — | — | (16,064 | ) | (16,064 | ) | |||||||||||||
|
|
|
|
|
|
|
|
|
| |||||||||||
Balance, December 31, 2019 | 25,000 | $ | 2,500 | $ | 196,779 | $ | 153,331 | $ | 352,610 | |||||||||||
|
|
|
|
|
|
|
|
|
| |||||||||||
See Notes to the Statutory Financial Statements
22
LINCOLN BENEFIT LIFE COMPANY
STATUTORY STATEMENTS OF CASH FLOWS
FOR THE YEARS ENDED DECEMBER 31, 2019, 2018 AND 2017
($’S IN THOUSANDS)
| 2019 | 2018 | 2017 | ||||||||||
Cash Flows from Operating Activities: | ||||||||||||
Premiums and other income received | $ | 35,727 | $ | 154,825 | $ | 206,540 | ||||||
Investment income received | 430,113 | 452,609 | 452,678 | |||||||||
Benefit payments to policyholders and beneficiaries, including net transfers to separate accounts | (706,381 | ) | (791,653 | ) | (717,365 | ) | ||||||
Commissions, expenses and taxes paid | (200,532 | ) | (228,066 | ) | (234,171 | ) | ||||||
|
|
|
|
|
| |||||||
Net Cash Used in Operating Activities | (441,073 | ) | (412,285 | ) | (292,318 | ) | ||||||
|
|
|
|
|
| |||||||
Cash Flows from Investing Activities: | ||||||||||||
Proceeds from investments sold, matured, repaid or received | ||||||||||||
Bonds | $ | 1,176,624 | $ | 1,418,296 | $ | 2,048,999 | ||||||
Mortgage loans | 277,171 | 338,652 | 422,223 | |||||||||
Other investments | 48,813 | 14,348 | 24,668 | |||||||||
|
|
|
|
|
| |||||||
Subtotal Proceeds from Investments | 1,502,608 | 1,771,296 | 2,495,890 | |||||||||
Cost of Investments Acquired: | ||||||||||||
Bonds | 936,205 | 1,139,991 | 2,022,551 | |||||||||
Stocks | 51,519 | 50,110 | 117,852 | |||||||||
Mortgage loans | 141,078 | 147,702 | 5,325 | |||||||||
Other investments | 20,452 | 14,376 | 18,914 | |||||||||
|
|
|
|
|
| |||||||
Subtotal Investments Acquired | 1,149,254 | 1,352,179 | 2,164,642 | |||||||||
Net Decrease in Contract Loans | (7,694 | ) | (4,824 | ) | (2,334 | ) | ||||||
|
|
|
|
|
| |||||||
Net Cash Provided by Investing Activities | 361,048 | 423,941 | 333,582 | |||||||||
|
|
|
|
|
| |||||||
Cash Flows from Financing and Miscellaneous Sources: | ||||||||||||
Net inflows (outflows) on deposit-type contracts | $ | 80,479 | $ | (41,070 | ) | $ | 168,220 | |||||
Dividend to stockholders | (40,000 | ) | (15,000 | ) | (70,000 | ) | ||||||
Other cash provided (applied) | 79,116 | 61,476 | (53,141 | ) | ||||||||
|
|
|
|
|
| |||||||
Net Cash (Used in) Provided by Financing and Miscellaneous Sources | 119,595 | 5,406 | 45,079 | |||||||||
|
|
|
|
|
| |||||||
Net Increase (Decrease) in Cash and Short-term Investments | 39,570 | 17,062 | 86,343 | |||||||||
Cash, cash equivalents and Short-term investments, Beginning of Year | $ | 211,240 | $ | 194,178 | $ | 107,835 | ||||||
|
|
|
|
|
| |||||||
Cash, cash equivalents and Short-term Investments, End of Year | $ | 250,810 | $ | 211,240 | $ | 194,178 | ||||||
|
|
|
|
|
| |||||||
Supplemental Disclosures of Cash Flow Information forNon-cash Transactions: | ||||||||||||
Change of intercompany note payable and receivable | $ | (55,500 | ) | $ | (118,000 | ) | $ | 129,500 | ||||
Transfers to other invested assets | $ | — | $ | — | $ | 28,718 | ||||||
Bond exchanges and othernon-cash exchanges | $ | — | $ | 5,375 | $ | 10,959 | ||||||
Mortgage loan refinance | $ | — | $ | 45,712 | $ | 11,368 | ||||||
Bonds, policy loans and other non-cash assets remitted to settle reinsurance premium | $ | 1,444,046 | $ | — | $ | — | ||||||
Recapture of modified coinsurance | $ | 539,191 | $ | — | $ | — | ||||||
IMR cession | $ | 33,277 | $ | — | $ | — | ||||||
See Notes to the Statutory Financial Statements
23
LINCOLN BENEFIT LIFE COMPANY
DECEMBER 31, 2019
| 1. | DESCRIPTION OF BUSINESS AND SUMMARY OF SIGNIFICANT ACCOUNTING POLICIES |
GENERAL
Lincoln Benefit Life Company (the “Company” or “Lincoln Benefit”) is a stock insurance company domiciled in the State of Nebraska. It is a wholly-owned subsidiary of LBL HoldCo II, Inc. (“HoldCo”), which in turn is a wholly-owned subsidiary of LBL HoldCo, Inc. (“Holdings”).
On December 31, 2019, Guaranty Income Life Insurance Company (“GILICO”), an Iowa-domiciled insurance company, completed the acquisition (the “Transaction”) of Holdings and its subsidiaries (including the Company). Prior to December 31, 2019, Holdings was a wholly-owned subsidiary of RL LP (formerly Resolution Life LP) and RL Parallel LP (formerly Resolution Life (Parallel) LP).
Lancaster Re Captive Insurance Company (“Lancaster Re”), a Nebraska domiciled captive insurance company, became a wholly-owned subsidiary of Lincoln Benefit on April 1, 2014.
The Company is authorized to sell life insurance and retirement products in all states except New York, as well as, in the District of Columbia, the U.S. Virgin Islands and Guam. Prior to July 18, 2013, the Company sold interest-sensitive, traditional and variable life insurance products through both exclusive agencies (“Allstate Sales channel”) and independent master brokerage agencies. Effective July 17, 2013, sales through the independent master brokerage agencies ceased. Sales through the Allstate Sales channel ceased in 2017.
Allstate Life Insurance Company (“ALIC”) continues to administer and reinsure all life insurance business written by Lincoln Benefit through the Allstate Sales channel, all immediate annuities written by Lincoln Benefit prior to April 1, 2014, certain term life policies written by Lincoln Benefit, and Lincoln Benefit’s variable annuity business.
BASIS OF PRESENTATION
The accompanying statutory financial statements of the Company are presented on the basis of accounting principles prescribed or permitted by the Nebraska Department of Insurance (“NE DOI” or the “Department”). The NE DOI requires insurance companies domiciled in the State of Nebraska to prepare their statutory financial statements in accordance with the National Association of Insurance Commissioners (“NAIC”)Accounting Practices and Procedures Manual (“NAIC SAP”). Prescribed statutory accounting practices include a variety of publications of the NAIC, as well as state laws, regulations and general administrative rules. Permitted statutory accounting practices encompass all accounting practices not so prescribed. There are no deviations from NAIC SAP in the Company’s statutory financial statements as presented for December 31, 2019, 2018 or 2017.
DIFFERENCES BETWEEN NAIC SAP AND U.S. GAAP
Accounting principles and procedures of the NAIC as prescribed or permitted by the Department comprise a comprehensive basis of accounting other than accounting principles generally accepted in the United States of America (“U.S. GAAP”). NAIC SAP differs from U.S. GAAP in several respects, which causes differences in reported assets, liabilities, stockholder’s equity (statutory capital and surplus), net income, and cash flows. The principal differences between NAIC SAP and U.S. GAAP include:
| • | Investments in bonds are generally carried at amortized cost; under U.S. GAAP, investments in bonds, other than those classified as held-to-maturity, are carried at fair value. For bonds held as available-for-sale, changes in fair value are recorded in accumulated other comprehensive income. |
24
LINCOLN BENEFIT LIFE COMPANY
NOTES TO STATUTORY STATEMENTS
DECEMBER 31, 2019
| • | The changes in the unrealized gains or losses on certain investments are recorded as increases or decreases in statutory surplus; under U.S. GAAP, such unrealized gains and losses are recorded as a component of comprehensive income. |
| • | Investments in insurance subsidiaries are generally carried on a statutory equity basis with equity in the earnings of subsidiaries reflected in unassigned surplus; under U.S. GAAP, subsidiaries are consolidated and results of operations are included in net income. |
| • | Minority ownership interests in partnerships are generally carried on an equity method basis with changes in equity reflected in unassigned surplus; under U.S. GAAP, minority ownership interests in partnerships are subject to lower thresholds and are generally carried at cost. Larger ownership interests are carried on an equity method basis with changes in equity reflected in net income. Controlling interests may be considered affiliated and require consolidation. |
| • | Derivative instruments are recorded at fair value and the changes in fair value are recorded as unrealized gains and losses in statutory surplus. Under U.S. GAAP, derivatives are recorded at fair value and changes in fair value are recorded in net income. |
| • | Embedded derivatives are carried consistently with the host instruments. Under U.S. GAAP, the embedded derivatives that are not clearly and closely related to the host are bifurcated and accounted for like any other freestanding derivative. |
| • | Interest Maintenance Reserve (“IMR”) represents the deferral of interest-related realized gains and losses, net of tax, on primarily fixed maturity investments which are amortized into income over the remaining life of the investment sold. No such reserve is required under U.S. GAAP. |
| • | Asset Valuation Reserve (“AVR”) represents a contingency reserve for credit related risk on most invested assets of the Company and is charged to statutory surplus. No such reserve is required under U.S. GAAP, but mortgage loans are recorded net of allowances for estimated uncollectible amounts. |
| • | Certain assets, principally prepaid expenses, agents’ balances, and certain deferred tax assets have been designated as nonadmitted assets and excluded from assets by a charge to statutory surplus. Under U.S. GAAP, such amounts are carried with an appropriate valuation allowance, when necessary. |
| • | Intangible assets such as present value of future profits and other adjustments, resulting from the Company’s acquisitions, are not recorded for statutory purposes. Intangible assets such as goodwill are recorded for statutory purposes with limitations and amortized. Under U.S. GAAP, the present value of future profits is recorded and amortized and goodwill is recorded at cost and tested for impairment using a fair value methodology at least annually. |
| • | A provision is established for unsecured reinsurance recoverable balances from unauthorized reinsurers. The change in this provision is credited or charged to unassigned statutory surplus. Under U.S. GAAP, a provision is established for uncollectible reinsurance balances with any changes to this provision reflected in earnings for the period. |
| • | Aggregate reserves for a majority of life insurance and fixed annuity contracts are based on statutory mortality and interest requirements without consideration for anticipated withdrawals. Variable annuity contracts are reserved for using a prescribed principles-based approach. Under U.S. GAAP reserves for term life and fixed annuities are based on the present value of future benefits less the present value of future net premiums based on mortality, morbidity and other assumptions, which were appropriate at the time the policies were issued or acquired. Reserves for universal life and deferred annuities are recognized by establishing a liability equal to the current account value of the policyholders’ contracts, with an additional reserve for certain guaranteed benefits. |
25
LINCOLN BENEFIT LIFE COMPANY
NOTES TO STATUTORY STATEMENTS
DECEMBER 31, 2019
| • | Reserves are reported net of ceded reinsurance; under U.S. GAAP, reserves relating to business in which the ceding company is not legally relieved of its liability are reported gross with an offsetting reinsurance receivable. |
| • | Certain annuity contracts which do not pass through all investment gains to the contract holders are maintained in the separate accounts, whereas U.S. GAAP reports these contracts in the general account of the Company. |
| • | Policy acquisition costs are expensed as incurred; under U.S. GAAP, these costs are related to the successful acquisition of new and renewal insurance policies and investment contracts which are deferred and recognized over either the expected premium paying period or the expected gross profits. |
| • | The cumulative effect of changes in accounting principles are recorded as increases or decreases in statutory surplus; under U.S. GAAP, cumulative effects of changes in accounting principles generally affect equity and net income. |
| • | Premiums of universal life and deferred annuity contracts including policy charges are recorded as revenue when due. Under U.S. GAAP, policy charges are recorded as revenue when due, and the premiums are recorded as policyholder account balances. |
| • | Federal income taxes are provided for in the Company’s estimated current and deferred taxes. Income taxes incurred include current year estimates of Federal income taxes due or refundable, based on tax returns for the current year and all prior years to the extent not previously provided. Deferred taxes are provided for differences between the statutory financial statement basis and the tax basis of assets and liabilities. Changes in deferred tax assets (“DTAs”) and deferred tax liabilities (“DTLs”) are recognized as a separate component of gains and losses in statutory unassigned surplus, while under U.S. GAAP, these changes are included in income tax expense or benefit. Under U.S. GAAP and NAIC SAP, gross deferred tax assets are reduced by a valuation allowance if it is more likely than not that some portion or all of the assets will not be realized. The remaining adjusted gross deferred tax asset not meeting certain criteria outlined in Statement of Statutory Accounting Principle (“SSAP”) No. 101, “Income Taxes” (“SSAP No. 101”), are not admitted. |
| • | The Statutory Statements of Cash Flows differ in certain respects from the presentation required by U.S. GAAP, including the presentation of the changes in cash and short-term investments instead of cash and cash equivalents. Short-term investments include securities with maturities of one year or less at the time of acquisition. For statutory purposes, there is no reconciliation between net income and cash from operations. |
| • | NAIC SAP does not require the presentation of a Statement of Comprehensive Income; under U.S. GAAP such a statement is required. |
The effects on the Company’s financial statements attributable to the differences between NAIC SAP and U.S. GAAP are presumed to be material.
USE OF ESTIMATES
The preparation of financial statements in conformity with statutory accounting principles prescribed or permitted by the State of Nebraska requires management to make estimates and assumptions that affect the reported amounts of assets and liabilities. It also requires disclosure of contingent assets and liabilities at the date of the financial statements and the reported amounts of revenue and expenses during the period. Actual results could differ from those estimates. The most significant estimates are those used in determining the fair value of financial instruments, allowance for loan losses, aggregate reserves for life policies and
26
LINCOLN BENEFIT LIFE COMPANY
NOTES TO STATUTORY STATEMENTS
DECEMBER 31, 2019
contracts, deferred income taxes, provision for income taxes and other-than-temporary impairments (“OTTI”)of investments.
FINANCIAL INSTRUMENTS
In the normal course of business, the Company enters into transactions involving various types of financial instruments, including cash equivalents, short-term investments, debt and equity securities and mortgage loans. These instruments involve credit risk and also may be subject to risk of loss due to interest rate fluctuation. The Company evaluates and monitors each financial instrument individually and, when appropriate, obtains collateral or other security to minimize losses.
SIGNIFICANT ACCOUNTING POLICIES
The following is a summary of significant accounting policies followed by the Company in preparing the accompanying statutory-based financial statements:
INVESTMENTS
Cash, cash equivalents and Short-term Investments
Cash, cash equivalents and short-term investments are highly liquid securities. The Company’s cash equivalents primarily include cash, commercial paper and certain money market investments which have an original term to maturity of less than three months. Short-term investments include debt instruments with a term to maturity exceeding three months, but less than one year on the date of acquisition. Cash equivalents and short-term investments are carried at estimated fair value or amortized cost, which approximates fair value.
Bonds
Investments in debt securities including bonds, mortgage-backed securities (“MBS”) and asset-backed securities (“ABS”) are stated at amortized cost using the effective interest method. Where the NAIC rating has fallen to 6 and the fair value has fallen below amortized cost, they are stated at fair value. The ratings for certain residential mortgage-backed securities (“RMBS”) and commercial mortgage-backed securities (“CMBS”) were determined by comparing the insurer’s carrying value divided by remaining par value to price ranges modeled by a third-party vendor chosen by the NAIC that correspond to each NAIC designation. Comparisons were initially made to the model based on amortized cost. Where the resulting rating was a NAIC 6 per the model, further comparison based on fair value was required which, in some cases, resulted in a higher final NAIC rating.
Amortization of the premium or discount from the purchase of these securities considers the estimated timing and amount of prepayments of the underlying loans. Actual prepayment experience is periodically reviewed and effective yields are recalculated when differences arise between the prepayments originally anticipated and the actual prepayments received and currently anticipated. Prepayment assumptions for single-class and multi-class MBS and ABS are estimated by management using inputs obtained from third-party specialists and based on management’s knowledge of the current market. For prepayment-sensitive securities such as interest-only and principal-only strips, inverse floaters and credit-sensitive MBS and ABS securities, which represent beneficial interests in securitized financial assets that are not of high credit quality or that have been credit impaired, the effective yield is recalculated on a prospective basis. For all other MBS and ABS, the effective yield is recalculated on a retrospective basis. If the collection of all
27
LINCOLN BENEFIT LIFE COMPANY
NOTES TO STATUTORY STATEMENTS
DECEMBER 31, 2019
contractual cash flows is not probable, an OTTI may be indicated. The process of analyzing securities for an OTTI adjustment is further described in Note 3.
Common Stocks
Common stocks are solely comprised of Federal Home Loan Bank of Chicago (“FHLB”) stock and are carried at cost.
Preferred Stocks
Redeemable preferred stocks are carried at cost.
Investments in Subsidiaries
Investments in insurance subsidiaries are carried based on the underlying statutory equity of the subsidiary. The Company’s investment in Lancaster Re is fully nonadmitted as of December 31, 2019 and 2018. The Company’s book/carrying values and nonadmitted value of its investment in Lancaster Re were $156.8 million and $168.1 million as of December 31, 2019 and 2018, respectively.
Mortgage Loans
Mortgage loans are stated at unpaid principal balances, net of provisions for estimated losses. Mortgage loans acquired at a premium or discount are stated at amortized cost using the effective interest rate method, net of provisions for estimated losses. Purchases and sales of mortgage loans are recognized or derecognized in the Company’s Statutory Statements of Admitted Assets, Liabilities and Capital Stock on the loan’s settlement date, which is the date that the Company cash settles the purchase or sale of the loan. Transaction costs on mortgage loans are capitalized on initial recognition and are recognized in the Company’s Statutory Statements of Operations using the effective interest rate method. Mortgage loans, which primarily include commercial first lien mortgages, are diversified by property type and geographic area throughout the United States. Mortgage loans are collateralized by the related properties and generally are no more than 75% of the property’s value at the time that the original loan is made. The Company regularly assesses the value of the collateral.
A mortgage loan is considered impaired when it is probable that the principal or interest is not collectible in accordance with the contractual terms of the loan. When a mortgage loan is classified as impaired, allowances for credit losses are established to adjust the carrying value of the loan to its net recoverable amount.
The allowance for credit losses are estimated using the present value of expected cash flows discounted at the loan’s effective interest rate or the fair value of the collateral, if the loan is collateral dependent. A specific allowance for loan loss is established for an impaired loan if the present value of expected cash flows discounted at the loan’s effective interest rate, or the fair value of the collateral less cost to sell, is less than the recorded amount of the loan. The full extent of impairment in the mortgage portfolio cannot be assessed solely by reviewing these loans individually. A general allowance for loan loss is established based on an assessment of past loss experience on groups of loans with similar characteristics and current economic conditions. While management believes that it uses the best information available to establish the loan loss allowances, future adjustments may become necessary if economic conditions differ from the assumptions used in calculating them.
28
LINCOLN BENEFIT LIFE COMPANY
NOTES TO STATUTORY STATEMENTS
DECEMBER 31, 2019
It is the Company’s policy to cease to carry accrued interest on commercial mortgage loans in default if deemed uncollectible or over 180 days past due. The Company held no investments innon-accrual status as of December 31, 2019 or 2018. Interest income is recognized on impaired mortgage loans upon receipt.
Changes in allowances for losses are recorded as changes in unrealized gains and losses to surplus. Once the conditions causing impairment improve and future payments are reasonably assured, the mortgages are no longer classified as impaired and the Company resumes accrual of income. However, if the original terms of the contract have been changed resulting in the Company providing an economic concession to the borrower at below market rates, then the mortgage is reclassified as restructured.
If the conditions causing impairment do not improve and future payments remain unassured, the Company typically derecognizes the asset through disposition or foreclosure. Uncollectible collateral-dependent loans are written off through realized losses for any difference between the carrying value and amount received for the underlying property at the time of disposition or foreclosure.
Contract Loans
Contract loans are carried at the amount of outstanding principal balance. Contract loans are collateralized by the related insurance policy and do not exceed the net cash surrender value of such policy.
Other Investments
Other investments include investments in derivatives, surplus notes, a limited partnership and low income housing tax credits (“LIHTCs”). Investments in surplus notes that are rated NAIC 1 are carried at amortized cost. The minority interest in the partnership is carried using the equity method. LIHTCs are generally recorded at cost and amortized based on the utilization of tax credits and benefits. All of the Company’s investments in LIHTCs were sold in 2018 for a realized loss of $9 thousand.
Derivatives
Derivative instruments used in hedging transactions that meet the criteria of a highly effective hedge are valued and reported consistently with the hedged items. Derivative instruments used in hedging transactions that do not meet or no longer meet the criteria of an effective hedge are valued at fair value with the changes in fair value recorded as unrealized gains and losses in the Statutory Statements of Changes in Capital Stock and Surplus, Change in net unrealized capital gains (losses). Realized investment gains and losses from derivatives that qualify for hedge accounting are reduced by amounts transferred to IMR.
Derivative instruments acquired by the Company were used to manage risks with certain assets and liabilities arising from potential adverse impacts from changes in risk-free interest rates and equity markets related to the Company’s equity indexed annuity and life contracts. The Company does not use derivatives for speculative purposes. Derivatives may include index option contracts and futures and interest rate swaps and are included in Other investments on the Statutory Statements of Admitted Assets, Liabilities and Capital and Surplus. The notional amounts specified in the contracts are used to calculate contractual payments under the agreements and are generally not representative of the potential for gain or loss on these contracts.
The Company did not report any derivatives as accounting hedges as of December 31, 2019 and 2018.
ASSET VALUATION RESERVE AND INTEREST MAINTENANCE RESERVE
The AVR is established as a liability based upon a formula prescribed by the NAIC to offset potential credit-related investment losses on all invested assets, with changes in the AVR charged or credited directly
29
LINCOLN BENEFIT LIFE COMPANY
NOTES TO STATUTORY STATEMENTS
DECEMBER 31, 2019
to surplus. The IMR is established as a liability to capture realized gains and losses, net of income tax, on the sale of fixed income investments, principally bonds and mortgage loans, resulting from changes in the general level of interest rates, and is amortized into income over the remaining years to expected maturity of the assets sold. Should the deferral of realized losses, net of income tax, result in a debit balance IMR, that amount is presented as an asset and nonadmitted.
INVESTMENT INCOME DUE AND ACCRUED
Accrued investment income consists primarily of interest and dividends. Interest is recognized on an accrual basis and dividends are recorded as earned on theex-dividend date. Due and accrued income is not recorded on: (a) bonds in default, (b) bonds delinquent more than 90 days or where collection of interest is improbable and (c) mortgage loans in default if deemed uncollectible or over 180 days past due. As of December 31, 2019 and 2018, the Company’s nonadmitted investment income due and accrued was zero.
POLICY AND CONTRACT RESERVES
Policy reserves on annuity and supplementary contracts are calculated using the Commissioners’ Annuity Reserve Valuation Method, except variable annuities which use the Commissioners’ Annuity Reserve Valuation Method for Variable Annuities. The valuation interest assumptions follow the Standard Valuation Law and vary by the contracts’ characteristics and issue year.
Policy reserves on life contracts are based on statutory mortality and valuation interest rates using the Commissioner’s Reserve Valuation Method without consideration of withdrawals. The valuation interest and mortality assumptions follow the Standard Valuation Law and vary by the contracts’ characteristics and issue year.
Valuation methods provide, in the aggregate, reserves that are greater than or equal to the minimum of guaranteed policy cash values or the amount required by law.
Accident and health benefit reserves are developed by actuarial methods and are determined based on published tables using specified statutory interest rates and mortality. Morbidity and lapse assumptions are based on Company experience.
Liability for deposit-type contracts represents contracts without significant mortality or morbidity risk. Payments received from sales of deposit-type contracts are recognized by providing a liability equal to the current value of the policyholders’ contracts. Interest rates credited to these contracts are based on the applicable terms of the respective contract.
LIABILITY FOR POLICY AND CONTRACT CLAIMS
Liabilities for unpaid claims consist of the estimated amount payable for claims reported but not yet settled and an estimate of claims incurred but not reported. The amounts reported are based upon actual pending claim amounts and historical experience, adjusted for trends and current circumstances. Revisions of these estimates are included in the Company’s Statutory Statements of Operations in the year such adjustments are determined to be required.
INCOME TAXES
The Company accounts for current and deferred income taxes and recognizes reserves for income tax contingencies in accordance with SSAP No. 101. Under the applicable asset and liability method for recording deferred income taxes, deferred taxes are recognized when assets and liabilities have different
30
LINCOLN BENEFIT LIFE COMPANY
NOTES TO STATUTORY STATEMENTS
DECEMBER 31, 2019
values for financial statement and tax reporting purposes, using enacted tax rates in effect for the year in which the differences are expected to reverse. The effect of a change in tax rates on DTAs and DTLs is recognized in the period that includes the enactment date. Valuation allowances on DTAs are estimated based on the Company’s assessment of the realizability of such amounts. Refer to Note 13 of the Company’s financial statements for further discussion of the Company’s income taxes.
REINSURANCE
Policy and contract liabilities ceded have been reported as reductions of the related reserves. Premiums, commissions, expense reimbursement, claims, and claim adjustment expenses related to reinsured business are accounted for on a basis consistent with that used in accounting for the original policies issued and with the terms of the reinsurance contracts and are reported net of amounts ceded to other companies.
A liability has been provided for unsecured policy reserves on reinsurance ceded to companies not authorized to assume business in the state of domicile and is included in funds held under reinsurance treaties with unauthorized companies. Changes in this liability are reported directly in unassigned surplus.
EXPERIENCE REFUNDS
Experience refunds are calculated in accordance with the applicable reinsurance agreements. Experience refunds are primarily determined by claims experience on the ceded blocks, in addition to numerous factors that include profitability of the Company during the period covered by the refund and capitalization levels of the Company. Experience refunds are recorded directly in earned income.
GUARANTY ASSOCIATION ASSESSMENTS
The Company is required by law to participate in the guaranty associations of the various states in which it is licensed to do business. The state guaranty associations ensure payment of guaranteed benefits, with certain restrictions, to policyholders of impaired or insolvent insurance companies by assessing all other companies involved in similar lines of business. Certain guaranty fund assessments paid by the Company are recoverable through premium tax credits over time.
RECOGNITION OF REVENUE AND RELATED EXPENSES
Scheduled life, accident and health insurance premiums and annuity considerations are recognized as revenue when due. Premiums for universal life and single premium contracts are recognized as revenue when collected. Benefits, surrenders and withdrawals are expensed as incurred. All acquisition costs and maintenance expenses are charged to the Company’s Statutory Statements of Operations as incurred.
OTHER INCOME
Other income primarily consists of various insurance policy charges. In 2019, other income includes IMR ceded as part of the Company’s reinsurance program described in Note 8.
SEPARATE ACCOUNTS
The Company has established unitized Separate Accounts applicable to various classes of contracts providing for variable benefits. Contracts for which funds are invested in the variable Separate Accounts include individual and group life and annuity contracts.
31
LINCOLN BENEFIT LIFE COMPANY
NOTES TO STATUTORY STATEMENTS
DECEMBER 31, 2019
Net investment income, capital gains and losses, and changes in mutual fund asset values on the variable Separate Accounts are allocated to policyholders and therefore do not affect the operating results of the Company. Assets held in the variable Separate Accounts are carried at fair value. The investment risk of such securities is retained by the contractholder. The Company earns separate account fees for providing administrative services and bearing the mortality risks related to contracts for which funds are invested in variable Separate Accounts.
The activity of the variable Separate Accounts is not reflected in the Company’s financial statements except for the following:
| • | The fees that the Company receives, which are assessed periodically and recognized as revenue when assessed. |
| • | The activity related to the guaranteed minimum death benefit, guaranteed minimum accumulation benefit and guaranteed minimum withdrawal benefit with offsetting transfers to/from the variable Separate Accounts are reflected in the Company’s financial statements. |
| • | Premiums and withdrawals with offsetting transfers to/from the variable Separate Accounts are reflected in the Company’s Statutory Statements of Operations. |
| • | Transfers from the variable Separate Accounts due and accrued, which include accrued expense allowances receivable from the variable Separate Accounts. |
| • | The dividends-received-deduction (“DRD”), which is included in the Company’s income tax expense, is calculated based upon the variable Separate Accounts’ assets held in connection with variable contracts. |
The results of variable annuity contracts and certain variable life policies are reinsured to ALIC pursuant to a modified coinsurance agreement.
NONADMITTED ASSETS
Certain assets are designated as “nonadmitted” under NAIC SAP. Such assets, principally related to amounts advanced to or due from financial representatives, prepaid expenses, aged reinsurance recoverables, deferred tax assets in excess of statutory limits and the Company’s investment in Lancaster Re are excluded from assets and surplus in the Statutory Statements of Admitted Assets, Liabilities and Capital and Surplus as of December 31, 2019 and 2018. IMR is excluded from assets and surplus in the Statutory Statements of Admitted Assets, Liabilities and Capital and Surplus as of December 31, 2018.
RECLASSIFICATIONS
Certain prior year amounts have been reclassified to conform with the current year financial statement presentation.
ACCOUNTING PRONOUNCEMENTS
Effective January 2020 with early adoption permitted, the NAIC revised SSAP No. 22, “Leases” to SSAP No. 22R, “Leases - Revised” in order to update guidance on leases, including leveraged leases and sale-leaseback transactions. The substantive revisions to SSAP No. 22 were the result of U. S. GAAP based changes by the Financial Accounting Standards Board (“FASB”) through issuance of Accounting Standards Update (“ASU”)2016-02, “Leases (Topic 842)”. The adoption of these revisions is not expected to have an
32
LINCOLN BENEFIT LIFE COMPANY
NOTES TO STATUTORY STATEMENTS
DECEMBER 31, 2019
impact on the financial statements of the Company as the “operating lease” approach without recognition of aright-to-use asset or lease liability is still used under NAIC SAP for lessees.
Effective January 2020 with early adoption permitted, the NAIC revised SSAP No. 100R, “Fair Value”, as a result of the issuance of ASU2018-13, “Changes to the Disclosure Requirements for Fair Value Measurement”. This ASU was issued in August 2018 as part of a FASB project to improve the effectiveness of U.S. GAAP disclosures. The adoption of these revisions is not expected to have a significant impact on the financial statements of the Company and disclosures will be updated in Note 12.
Effective April 2019, the NAIC revised SSAP No. 100R, “Fair Value” as a result of the issuance of ASU2018-36, “Changes to the Disclosure Requirements for Fair Value Measurement”. This ASU was issued to update the timing for the application of ASU2018-13 for certain of the disclosures, i.e., deletion of the disclosures detailing transfers between Levels 1 and 2, policy for timing of transfers and valuation process for Level 3. The adoption of these revisions did not have a significant impact on the financial statements of the Company and disclosures were updated in Note 12.
Effective December 2019, the NAIC revised SSAP No. 43R “Loan-Backed and Structured Securities” to incorporate guidance for certain government sponsored enterprises credit risk transfer instruments known as mortgage-referenced securities (“MRS”) that meet the statutory classification of a structured note as the holder could lose principal with the performance of the referenced security, however, also encompass both the credit risk of the issuer (e.g., Fannie Mae or Freddie Mac), as well as the credit risk of mortgage loan borrowers. The adoption of these revisions did not have an impact on the financial statements of the Company as they continue to be admitted assets whereas the guidance for other types of structured notes was moved effective December 2019 to SSAP No. 86, “Derivatives” and the assets were nonadmitted.
Effective December 2019 with early adoption permitted, the NAIC revised SSAP No. 69. “Cash Flows”, as a result of the issuance of ASU 2016-18. “Statement of Cash Flows: Restricted Cash”. This ASU required restricted cash and restricted cash equivalents to be included with cash and cash equivalents when reconciling the beginning and ending balances shown on the Statutory Statements of Cash Flows. This revision is to be shown retrospectively, allowing for comparative cash flow statements. The adoption of this revision is included as a reclass between line items of the Statutory Statements of Admitted Assets, Liabilities and Capital and Surplus and related adjustments to the Statutory Statements of Cash Flows with an immaterial overall impact to the financial statements.
Effective March 2019 with early adoption permitted, the NAIC amended SSAP No. 43R, “Loan-backed and Structured Securities” to delete the modified filing exempt (“MFE”) guidance. Under the MFE process, the amortized cost basis is used in conjunction with the credit rating provider (“CRP”) rating to determine the final NAIC designation. When eliminated, securities that have a CRP rating that are not captured as financially modeled securities will use the equivalent NAIC designation without adjustment. The adoption of these revisions did not have an impact on the financial statements of the Company as no numeric ratings were changed as a result of early adoption.
Effective May 2018, in response to the enactment of the Tax Cuts and Jobs Act on December 22, 2017, the NAIC amended SSAP No. 101, “Income Taxes” to clarify the following: (1) the remeasurement of deferred tax assets and deferred tax liabilities due to the change in the tax rate to three components of surplus: change in net unrealized capital gain/loss, change in net deferred income tax and change in nonadmitted assets; and (2) the classification of life and nonlife entities for tax purposes and that the classification is based on how the entity is taxed. Minor revisions were also made to the question and answer guidance provided in SSAP No. 101. The adoption of these revisions did not have a significant impact on the financial statements of the Company.
33
LINCOLN BENEFIT LIFE COMPANY
NOTES TO STATUTORY STATEMENTS
DECEMBER 31, 2019
Effective January 2018, the NAIC amended SSAP No. 86, “Derivatives” to clarify the reporting for variation margin. Revisions clarify that variation margin changes shall not be recognized as settled until the derivative contract has terminated and/or otherwise expired. The adoption of these revisions did not have a significant impact on the financial statements of the Company as this is current practice.
| 2. | RELATED PARTY TRANSACTIONS |
The Company has significant transactions with affiliates. Intercompany revenues and expenses recognized under these agreements may not necessarily be indicative of costs that would be incurred if the Company operated on a stand-alone basis and if these transactions were with unrelated parties. Below is a summary of significant transactions with affiliates.
Capital Contributions and Dividends
On December 31, 2019, the Company received a capital contribution from GILICO for $20 million.
After receiving prior approval from the NE DOI, the Company paid extraordinary dividends of $40 million, $15 million and $70 million in 2019, 2018 and 2017, respectively.
During 2019, the Company contributed additional capital of $50 million to Lancaster Re. In 2018, the Company contributed additional capital and special surplus funds of $15 million and $35 million, respectively, to Lancaster Re. In 2017, the Company contributed additional capital and special surplus funds of $30 million and $70 million, respectively, to Lancaster Re.
Reinsurance Related Agreements
As more fully described in Note 8, the Company is party to reinsurance transactions with affiliates.
On December 31, 2019, the Company entered into a coinsurance agreement with GILICO, resulting in the transfer of certain life and annuity contracts. The Company ceded statutory reserves of $1,387 million in return for a ceding commission, which was recorded in the Statutory Statements of Operations. The Company had a net payable of $35 million due to GILICO under terms of the coinsurance agreement at December 31, 2019.
On April 1, 2014, the Company entered into an indemnity reinsurance agreement on a combination coinsurance and coinsurance funds withheld basis with Lancaster Re, resulting in the transfer of XXX and AXXX reserves associated with certain term and universal life policies. The Company ceded statutory reserves of $2,733 million in return for a ceding commission, which was deferred net of tax into unassigned surplus in accordance with NAIC SAP. Amortization of $16.1 million, $16.0 million and $15.8 million was recorded during the years ended December 31, 2019, 2018 and 2017, respectively, resulting in an unamortized balance in surplus at December 31, 2019, 2018 and 2017 of $230.5 million, $246.6 million and $262.6 million, respectively. The deferred ceding commission is amortized into income over the period under which earnings emerge from the business reinsured. The Company had a net reinsurance receivable from Lancaster Re of $35.6 million and $16.0 million at December 31, 2019 and 2018, respectively.
There is no reported risk-based capital or Primary Security shortfall associated with these agreements.
Administrative Service Agreements and Other
The Company and HoldCo have entered into a Services Agreement to provide certain administrative and other services to each other. Total expenses incurred under this agreement to HoldCo were $13.5 million, and $22.4 million and $18.8 million for the years ended December 31, 2019, 2018 and 2017, respectively.
34
LINCOLN BENEFIT LIFE COMPANY
NOTES TO STATUTORY STATEMENTS
DECEMBER 31, 2019
The Company and Lancaster Re have entered into a Services Agreement to provide certain administrative and other services to Lancaster Re. The Company and Lancaster Re also entered into an Investment Services Agreement pursuant to which the Company will provide investment management services with respect to assets of Lancaster Re. The Investment Services Agreement does not apply to the Funds Withheld Account held at Lincoln Benefit. Assets may be added to or withdrawn from the accounts at any time by Lancaster Re. Management and administrative fees are payable quarterly and totaled approximately $(8.6) million, $1.7 million and $1.9 million for the years ended December 31, 2019, 2018 and 2017, respectively.
Effective December 31, 2019, the Company entered into a Cost Sharing and Services Agreement with Kuvare US Holdings, Inc. (“Kuvare”) and Kuvare Insurance Services LP (“KIS”) whereby Kuvare and KIS have agreed to provide certain management and administrative services to Lincoln Benefit, including management, reinsurance, legal, audit, administration, financial planning and other services. Lincoln Benefit reimburses Kuvare and KIS at cost for services provided by Kuvare and KIS pursuant to this agreement. Total expenses incurred under this agreement to HoldCo were $0.3 million for the year ended December 31, 2019.
On December 31, 2019, Lincoln Benefit entered into an Investment Management Agreement with KIS, whereby KIS has agreed to provide certain investment advisory and management services to Lincoln Benefit. Pursuant to this agreement, KIS will receive a gross fee of approximately 0.30% per annum on all invested assets of Lincoln Benefit managed under this agreement. No expenses were incurred under this agreement during the year ended December 31, 2019.
The Company and Lancaster Re have entered into a federal income Tax Allocation Agreement. Refer to Note 13 for more information related to this agreement.
Effective April 1, 2014, the Company entered into a Fee Letter (the “Fee Letter”) with Lanis LLC (“Lanis”) pursuant to which the Company will pay Lanis the risk spread due on the Vehicle Note issued by Lanis to Lancaster Re. A reserve of $2.1 million had been established on the balance sheet for these payments as of December 31, 2018. This reserve was released in 2019 and the Company was reimbursed as described directly below.
On April 1, 2014, the Company and HoldCo entered into a Letter Agreement whereby from and after the fifth anniversary of the date of the agreement, if the Company makes any payment pursuant to the Fee Letter, within ten business days of such payment by the Company, HoldCo shall reimburse the Company in cash in an amount equal to such payment by the Company. For the year ended December 31, 2019, HoldCo contributed capital of $5.8 million to the Company under this agreement.
Effective November 4, 2016, the Company entered into an intercompany note receivable and note payable agreement with Lancaster Re in equal amounts (initially $100 million, and up to $500 million). The consideration for each note is offset, and interest is paid quarterly based on rates defined in the agreement. The gross amounts as of December 31, 2019 and 2018 were $211.0 million and $266.5 million, respectively.
The maturities of the outstanding intercompany note receivable and payable as of December 31, 2019 and 2018 were as follows:
| ($’s thousands) | December 31, 2019 | December 31, 2018 | ||||||
2019 | $ | — | $ | 55,500 | ||||
2020 | 105,500 | 105,500 | ||||||
2021 | 76,000 | 76,000 | ||||||
2022 | 29,500 | 29,500 | ||||||
|
|
|
| |||||
Total | $ | 211,000 | $ | 266,500 | ||||
|
|
|
| |||||
35
LINCOLN BENEFIT LIFE COMPANY
NOTES TO STATUTORY STATEMENTS
DECEMBER 31, 2019
Interest expense incurred on the note payable and interest income earned on the note receivable for the year ended December 31, 2019 were $10.6 million and $4.7 million, respectively. Interest expense incurred on the note payable and interest income earned on the note receivable for the year ended December 31, 2018 were $13.7 million and $5.6 million, respectively. Interest expense incurred on the note payable and interest income earned on the note receivable for the year ended December 31, 2017 were $16.6 million and $6.1 million, respectively.
Amounts Due To or From Affiliates
The Company reported the following receivables/ (payables) to affiliates as of December 31, 2019 and 2018 excluding amounts related to taxes (see Note 13) and reinsurance agreements:
| ($’s in thousands) | December 31, 2019 | December 31, 2018 | ||||||
Holdco | $ | (2,828 | ) | $ | (5,288 | ) | ||
Lancaster Re | (580 | ) | (1,273 | ) | ||||
Lanis | (1,956 | ) | (2,131 | ) | ||||
Kuvare | (300 | ) | — | |||||
Intercompany receivable and payable balances are evaluated on an individual company basis. Intercompany balances are generally settled quarterly.
| 3. | INVESTMENTS |
The statement value and fair value of the Company’s debt securities as of December 31, 2019 and 2018 were as follows:
December 31, 2019
| ($’s in thousands) | Statement Value | Gross Unrealized Gains | Gross Unrealized Losses | Fair Value | ||||||||||||
U.S. governments | $ | 58,548 | $ | 5,375 | $ | (86 | ) | $ | 63,837 | |||||||
All other governments | 12,807 | 190 | (578 | ) | 12,419 | |||||||||||
U.S. states, territories and possessions | 15,426 | 2,162 | — | 17,588 | ||||||||||||
U.S. political subdivisions | 64,496 | 2,826 | (63 | ) | 67,259 | |||||||||||
Special revenue | 875,549 | 68,577 | (894 | ) | 943,232 | |||||||||||
Industrial and miscellaneous | 5,232,882 | 407,791 | (14,019 | ) | 5,626,654 | |||||||||||
Hybrids | 101,914 | 7,277 | (423 | ) | 108,768 | |||||||||||
|
|
|
|
|
|
|
| |||||||||
Total bonds | $ | 6,361,622 | $ | 494,198 | $ | (16,063 | ) | $ | 6,839,757 | |||||||
|
|
|
|
|
|
|
| |||||||||
December 31, 2018
| ($’s in thousands) | Statement Value | Gross Unrealized Gains | Gross Unrealized Losses | Fair Value | ||||||||||||
U.S. governments | $ | 146,412 | $ | 2,382 | $ | (2,308 | ) | $ | 146,486 | |||||||
All other governments | 22,596 | 8 | (2,627 | ) | 19,977 | |||||||||||
U.S. states, territories and possessions | 15,565 | — | (49 | ) | 15,516 | |||||||||||
U.S. political subdivisions | 92,396 | 1,157 | (2,515 | ) | 91,038 | |||||||||||
Special revenue | 979,287 | 30,306 | (14,972 | ) | 994,621 | |||||||||||
Industrial and miscellaneous | 6,332,610 | 26,116 | (339,351 | ) | 6,019,375 | |||||||||||
Hybrids | 120,782 | 925 | (5,726 | ) | 115,981 | |||||||||||
|
|
|
|
|
|
|
| |||||||||
Total bonds | $ | 7,709,648 | $ | 60,894 | $ | (367,548 | ) | $ | 7,402,994 | |||||||
|
|
|
|
|
|
|
| |||||||||
36
LINCOLN BENEFIT LIFE COMPANY
NOTES TO STATUTORY STATEMENTS
DECEMBER 31, 2019
The statement value and estimated fair value as of December 31, 2019 by maturity periods for debt securities, other than ABS and MBS were as shown below:
December 31, 2019
| ($’s in thousands) | Statement Value | Fair Value | ||||||
Due in one year or less | $ | 136,742 | $ | 137,714 | ||||
Due after one through five years | 524,557 | 542,327 | ||||||
Due after five through ten years | 639,630 | 681,821 | ||||||
Due after ten years | 3,942,466 | 4,326,858 | ||||||
|
|
|
| |||||
Total before asset and mortgage-backed securities | 5,243,395 | 5,688,720 | ||||||
Asset and mortgage-backed securities | 1,118,227 | 1,151,037 | ||||||
|
|
|
| |||||
Total bonds | $ | 6,361,622 | $ | 6,839,757 | ||||
|
|
|
| |||||
Actual maturities may differ from contractual maturities on ABS and MBS because borrowers may have the right to call or prepay obligations with or without call or prepayment penalties; accordingly, the contractual maturities for those securities are not shown.
Proceeds from sales of investments in debt securities for the years ended December 31, 2019, 2018 and 2017 were $0.9 billion, $1.0 billion and $1.5 billion, respectively; gross gains for the years ended December 31, 2019, 2018 and 2017 were $47.4 million, $4.8 million and $30.0 million, respectively, and gross losses for the years ended December 31, 2019, 2018 and 2017 were $19.3 million, $47.0 million and $11.9 million, respectively. Investment grade debt securities were 98.7% and 98.3% of the Company’s total debt securities as of December 31, 2019 and 2018, respectively.
The Company held no 5* securities as of December 31, 2019 and December 31, 2018.
For securities sold, redeemed or otherwise disposed as a result of a callable feature (including make whole call provisions), the number of CUSIPs and amount of investment income for the years ended December 31, 2019, 2018 and and 2017 were as follows:
($’s in thousands, except # of securities) | ||||||||||||||||||||||||
| December 31, 2019 | December 31, 2018 | December 31, 2017 | ||||||||||||||||||||||
Type | General Account | Separate Account | General Account | Separate Account | General Account | Separate Account | ||||||||||||||||||
Number of CUSIPs | 22 | — | 13 | — | 12 | — | ||||||||||||||||||
Aggregate Amount of Investment Income | $ | 3,785 | $ | — | $ | 1,005 | $ | — | $ | 2,169 | $ | — | ||||||||||||
Pricing
Non-U.S. government fixed income holdings are valued on the basis of the quotes provided by pricing services, which are subject to pricing validation reviews and a pricing vendor challenge process. Valuations provided by vendors are generally based on the actual trade information as substantially all of the Company’snon-U.S. government holdings are traded in a transparent and liquid market.
Corporate debt securities mainly include investment grade positions, which are priced on the basis of quotes provided by third-party pricing vendors and first utilize valuation inputs from actively traded securities, such as bid prices, bid spreads to Treasury securities, Treasury curves, and same or comparable issuer curves and spreads. Issuer spreads are determined from actual quotes and traded prices and incorporate considerations of credit/default, sector composition, and liquidity and call features. Where market data is not
37
LINCOLN BENEFIT LIFE COMPANY
NOTES TO STATUTORY STATEMENTS
DECEMBER 31, 2019
available valuations are developed based on the modeling techniques that utilize observable inputs and option adjusted spreads and incorporate considerations of the security’s seniority, maturity and the issuer’s corporate structure.
Values of RMBS, CMBS and ABS are obtained from third-party pricing vendors and through quoted prices, some of which may be based on the prices of comparable securities with similar structural and collateral features. Pricing inputs for ABS, primarily debt securitized by credit card, student loan and auto receivables, focus on capturing, where relevant, collateral quality and performance, payment patterns, and delinquencies. Values of certain ABS for which there are no significant observable inputs are developed using benchmarks to similar transactions or indices.
For both CMBS and RMBS, cash flows are derived based on the transaction-specific information which incorporates priority in the capital structure and are generally adjusted to reflect benchmark yields, market prepayment data, collateral performance (default rates and loss severity) for specific vintage and geography, credit enhancements, and ratings. For certain RMBS and CMBS with low levels of market liquidity, judgments may be required to determine comparable securities based on the loan type and deal-specific performance. CMBS terms may also incorporatelock-out periods that restrict borrowers from prepaying the loans or provide disincentives to prepay and therefore reduce prepayment risk of these securities, as compared to RMBS. The factors specifically considered in valuation of CMBS include borrower-specific statistics in a specific region, such as debt service coverage andloan-to-value ratios, as well as the type of commercial property.
Other-than-temporary impairments
The Company recognizes and measures OTTI for ABS and MBS in accordance with SSAP No. 43R, “Loan-Backed and Structured Securities”. In accordance with SSAP No. 43R, if the fair value of a structured security is less than its amortized cost basis at the balance sheet date, the Company assesses whether the impairment is an OTTI. When an OTTI has occurred, the amount of OTTI recognized in earnings is the difference between the amortized cost basis of the security and the present value of its expected future cash flows discounted at the effective interest rate implicit in the security.
If the Company intends to sell the structured security, or it is more likely than not that it will be required to sell the security before recovery of its amortized cost basis, an OTTI is considered to have occurred. The amount of the OTTI recognized in earnings is the difference between the amortized cost basis and the fair value of the security.
If the Company does not intend to sell the structured security, or it is not more likely than not that it will be required to sell the security before recovery of its amortized cost basis, the Company performs cash flow testing to determine if the present value of its expected future cash flows discounted at the effective interest rate implicit in the security is less than its amortized cost basis.
Estimating future cash flows is a quantitative and qualitative process that incorporates information received from third parties, along with assumptions and judgments about the future performance of the underlying collateral. Losses incurred on the respective portfolios are based on loss models using assumptions about key systemic risks such as unemployment rates and housing prices and loan specific information such as delinquency rates andloan-to-value ratios.
If the fair value of a debt security, other than those subject to SSAP No. 43R, is less than its amortized cost basis at the balance sheet date, the Company assesses whether the impairment is an OTTI. When an OTTI has occurred, the amount of OTTI recognized in earnings is the difference between the amortized cost basis of the security and its fair value.
38
LINCOLN BENEFIT LIFE COMPANY
NOTES TO STATUTORY STATEMENTS
DECEMBER 31, 2019
If the Company intends to sell the debt security, or it is more likely than not that it will be required to sell the security before recovery of its amortized cost basis, an OTTI is considered to have occurred. If the Company does not intend to sell the debt security, or it is not more likely than not that it will be required to sell the security before recovery of its amortized cost basis, the Company employs a portfolio monitoring process to identify securities that are OTTI.
The Company has a Credit Committee comprised of investment and finance professionals which meets at least quarterly to review individual issues or issuers that may be of concern. In determining whether a security is OTTI, the Credit Committee considers the factors described below. The process involves a quarterly screening of all securities where fair value is less than the amortized cost basis. Discrete credit events, such as a ratings downgrade, are also used to identify securities that may be OTTI. The securities identified are then evaluated based on issuer-specific facts and circumstances, such as the issuer’s ability to meet current and future interest and principal payments, an evaluation of the issuer’s financial position and its near-term recovery prospects, difficulties being experienced by an issuer’s parent or affiliate, and management’s assessment of the outlook for the issuer’s sector.
As a supplement to the qualitative assessment, independent screenings are performed to help identify securities that should be carefully scrutinized for inclusion on the watchlist and in the proper category. These include things like market value to book value ratio, highest unrealized losses, length of time at an unrealized loss and stress test results for structured securities. In making these evaluations, the Credit Committee exercises considerable judgment. Based on this evaluation, issues or issuers are considered for inclusion on one of the Company’s following watchlists: Monitor, Concern, High Concern, or Default.
“Monitor List”- Management has concluded that the Company’s amortized cost will be recovered through timely collection of all contractually specified cash flows, but that changes in issuer-specific facts and circumstances require monitoring on a quarterly basis. The likelihood of futurenon-repayment is considered not probable. Forloan-backed and structured securities, a principal loss would be projected under a significant stress model scenario. No OTTI charge is recorded in the Company’s Statutory Statements of Operations for unrealized loss on securities related to these issuers.
“Concern List”- Management has concluded that the Company’s amortized cost will be recovered through timely collection of all contractually specified cash flows, but that changes in issuer-specific facts and circumstances require monitoring on a quarterly basis. The likelihood of futurenon-repayment is considered above average but not probable. Forloan-backed and structured securities, a principal loss would be projected under a stress model scenario. No OTTI charge is recorded in the Company’s Statutory Statements of Operations for unrealized loss on securities related to these issuers.
“High Concern”- Management has concluded that the Company’s amortized cost will be recovered through timely collection of all contractually specified cash flows, but that changes in issuer-specific facts and circumstances require continued monitoring. A security is moved from the Concern List to the High Concern List when changes in issuer-specific facts and circumstances increase the possibility that a security may become impaired. The likelihood of futurenon-repayment is considered probable. Forloan-backed and structured securities, a principal loss would be projected under a base case model scenario. No OTTI charge is recorded in the Company’s Statutory Statements of Operations for unrealized loss on securities related to these issuers.
“Default List”- A security that is not current with respect to principal and interest or was issued by a company that has entered bankruptcy subsequent to acquisition or experienced a significant credit downgrade. Management has concluded the amortized cost basis of the security may not be recovered due to expected delays or shortfalls in the contractually specified cash flows. For these investments, the amount of OTTI recognized in the Company’s Statutory Statements of Operations is the difference between the amortized cost basis of the security and its fair value or present value of discounted cash flows dependent on the length of time and degree of impairment.
39
LINCOLN BENEFIT LIFE COMPANY
NOTES TO STATUTORY STATEMENTS
DECEMBER 31, 2019
Should it be determined that a security is other than temporarily impaired, the Company records a loss through an appropriate adjustment in carrying value. During the year ended December 31, 2019, the Company incurred the following write-downs of debt securities, which were subject to SSAP No. 43R:
| ($’s in thousands) | ||||||||||||||||||||||||
CUSIP | Book/Adj Carrying value Amortized Cost Before Current Period OTTI | Present Value of Projected Cash Flows | Recognized OTTI | Amortized Cost After OTTI | Fair Value at Time of OTTI | Date of Financial Statement Where Reported | ||||||||||||||||||
50179MAH4 | $ | 4,982 | $ | 3,767 | $ | 1,215 | $ | 3,767 | $ | 3,767 | 6/30/2019 | |||||||||||||
50179MAH4 | 3,978 | 3,102 | 876 | 3,102 | 3,102 | 9/30/2019 | ||||||||||||||||||
50179MAH4 | 3,041 | 2,633 | 408 | 2,633 | 2,633 | 12/31/2019 | ||||||||||||||||||
|
|
|
|
|
|
|
|
|
| |||||||||||||||
Total | $ | 12,001 | $ | 9,502 | $ | 2,499 | $ | 9,502 | $ | 9,502 | ||||||||||||||
|
|
|
|
|
|
|
|
|
| |||||||||||||||
There are inherent risks and uncertainties in management’s evaluation of securities for OTTI. These risks and uncertainties include factors both external and internal to the Company, such as general economic conditions, an issuer’s financial condition or near-term recovery prospects, market interest rates, unforeseen events which affect one or more issuers or industry sectors, and portfolio management parameters, including asset mix, interest rate risk, portfolio diversification, duration matching, and greater than expected liquidity needs. All of these factors could impact management’s evaluation of securities for OTTI.
Temporary impairments
The gross unrealized losses and fair value of investments, which have been deemed temporarily impaired, aggregated by investment category, number of securities and length of time that securities have been in an unrealized loss position at December 31, 2019 and 2018 were as follows:
| December 31, 2019 | Less than 12 months | 12 months or more | Total | |||||||||||||||||||||||||||||||||
| ($’s in thousands, except # of securities) | # | Fair Value | Unrealized Losses | # | Fair Value | Unrealized Losses | # | Fair Value | Unrealized Losses | |||||||||||||||||||||||||||
U.S. governments | 4 | $ | 2,566 | $ | (76 | ) | 11 | $ | 217 | $ | (10 | ) | 15 | $ | 2,783 | $ | (86 | ) | ||||||||||||||||||
All other governments | — | — | — | 1 | 4,298 | (578 | ) | 1 | 4,298 | (578 | ) | |||||||||||||||||||||||||
U.S. political subdivisions | 1 | 7,072 | (63 | ) | — | — | — | 1 | 7,072 | (63 | ) | |||||||||||||||||||||||||
Special revenue | 34 | 204,463 | (883 | ) | 37 | 361 | (11 | ) | 71 | 204,824 | (894 | ) | ||||||||||||||||||||||||
Industrial and miscellaneous | 92 | 255,033 | (2,757 | ) | 71 | 233,548 | (11,262 | ) | 163 | 488,581 | (14,019 | ) | ||||||||||||||||||||||||
Hybrids | — | — | — | 2 | 9,578 | (423 | ) | 2 | 9,578 | (423 | ) | |||||||||||||||||||||||||
|
|
|
|
|
|
|
|
|
|
|
|
|
|
|
|
|
| |||||||||||||||||||
Total bonds | 131 | $ | 469,134 | $ | (3,779 | ) | 122 | $ | 248,002 | $ | (12,284 | ) | 253 | $ | 717,136 | $ | (16,063 | ) | ||||||||||||||||||
|
|
|
|
|
|
|
|
|
|
|
|
|
|
|
|
|
| |||||||||||||||||||
| December 31, 2018 | Less than 12 months | 12 months or more | Total | |||||||||||||||||||||||||||||||||
| ($’s in thousands, except # of securities) | # | Fair Value | Unrealized Losses | # | Fair Value | Unrealized Losses | # | Fair Value | Unrealized Losses | |||||||||||||||||||||||||||
U.S. governments | 25 | $ | 17,848 | $ | (708 | ) | 25 | $ | 38,398 | $ | (1,600 | ) | 50 | $ | 56,246 | $ | (2,308 | ) | ||||||||||||||||||
All other governments | 1 | 8,894 | (122 | ) | 4 | 10,573 | (2,505 | ) | 5 | 19,467 | (2,627 | ) | ||||||||||||||||||||||||
U.S. states, territories and possessions | 2 | 15,516 | (49 | ) | — | — | — | 2 | 15,516 | (49 | ) | |||||||||||||||||||||||||
U.S. political subdivisions | 6 | 14,765 | (352 | ) | 4 | 26,323 | (2,163 | ) | 10 | 41,088 | (2,515 | ) | ||||||||||||||||||||||||
Special revenue | 96 | 141,627 | (5,360 | ) | 168 | 161,355 | (9,612 | ) | 264 | 302,982 | (14,972 | ) | ||||||||||||||||||||||||
Industrial and miscellaneous | 1,206 | 3,814,020 | (220,946 | ) | 332 | 1,001,027 | (118,405 | ) | 1,538 | 4,815,047 | (339,351 | ) | ||||||||||||||||||||||||
Hybrids | 21 | 81,256 | (4,526 | ) | 2 | 8,800 | (1,200 | ) | 23 | 90,056 | (5,726 | ) | ||||||||||||||||||||||||
|
|
|
|
|
|
|
|
|
|
|
|
|
|
|
|
|
| |||||||||||||||||||
Total bonds | 1,357 | $ | 4,093,926 | $ | (232,063 | ) | 535 | $ | 1,246,476 | $ | (135,485 | ) | 1,892 | $ | 5,340,402 | $ | (367,548 | ) | ||||||||||||||||||
|
|
|
|
|
|
|
|
|
|
|
|
|
|
|
|
|
| |||||||||||||||||||
40
LINCOLN BENEFIT LIFE COMPANY
NOTES TO STATUTORY STATEMENTS
DECEMBER 31, 2019
Exposure to Subprime andAlt-A mortgages
Subprime mortgages are residential loans to borrowers with weak credit profiles.Alt-A mortgages are residential loans to borrowers who generally have credit profiles above subprime but do not conform to traditional (“prime”) mortgage underwriting guidelines. The Company has invested in certain mortgage-backed and structured securities that include exposure to subprime and other below-prime mortgage loans. These investments are included in bonds in the Statutory Statements of Admitted Assets and are generally reported at amortized cost.
The Company has a comprehensive portfolio monitoring process. No impairments were recorded in the subprime orAlt-A portfolio in 2019, 2018 or 2017. The Company’s practice for acquiring and monitoring subprime andAlt-A securities takes into consideration the quality of the originator, quality of the servicer, security credit rating, underlying characteristics of the mortgages, borrower characteristics, level of credit enhancement in the transaction, and bond insurer strength, where applicable. The originators and servicers of the underlying mortgage loans are primarily subsidiaries of large banks and brokers.
The Company had no indirect exposure to subprime andAlt-A loans as of December 31, 2019. The Company had indirect exposure to subprime andAlt-A loans with book adjusted carrying value of $58.6 million which was less than one percent of the Company’s total invested assets as of December 31, 2018, as shown below:
| ($’s in thousands) | ||||||||||||||||
| December 31, 2018 | ||||||||||||||||
Direct Exposure through Other Investments | Actual Cost | Book/Adjusted Carrying Value (excluding interest) | Fair Value | Other Than Temporary Impairment Losses Recognized | ||||||||||||
Residential mortgage backed securities | $ | 56,495 | $ | 58,639 | $ | 62,670 | $ | — | ||||||||
| 4. | MORTGAGE LOANS |
The Company invests in commercial first lien mortgage loans throughout the United States. Investments are diversified by property type and geographic area. The Company monitors the condition of the mortgage loans in its portfolio. In those cases where mortgages have been restructured, appropriate allowances for losses have been made. In those cases where, in management’s judgment, the mortgage loans’ values are impaired, appropriate losses are recorded.
The geographical distribution of the statement value of the mortgage loans portfolio as of December 31, 2019 and 2018 was as follows:
| ($’s in thousands) | December 31, 2019 | December 31, 2018 | ||||||
Alabama | $ | 569 | $ | 829 | ||||
Arizona | 36,032 | 36,758 | ||||||
California | 140,936 | 146,681 | ||||||
Colorado | 91,680 | 61,631 | ||||||
Florida | 24,305 | 54,630 | ||||||
Georgia | 29,631 | 20,562 | ||||||
Hawaii | 2,754 | 3,964 | ||||||
Illinois | 56,163 | 86,827 | ||||||
Iowa | 276 | 545 | ||||||
41
LINCOLN BENEFIT LIFE COMPANY
NOTES TO STATUTORY STATEMENTS
DECEMBER 31, 2019
| ($’s in thousands) | December 31, 2019 | December 31, 2018 | ||||||
Kansas | $ | — | $ | 9,200 | ||||
Massachusetts | 29,549 | 30,656 | ||||||
Minnesota | 22,624 | 23,837 | ||||||
Nevada | 9,308 | 80,931 | ||||||
New Jersey | 35,663 | 21,192 | ||||||
New York | 47,556 | 48,375 | ||||||
North Carolina | 3,817 | 33,483 | ||||||
Ohio | 12,110 | 12,325 | ||||||
Pennsylvania | 69,800 | 50,353 | ||||||
South Carolina | 24,384 | 24,791 | ||||||
Texas | 84,674 | 110,698 | ||||||
Virginia | — | 249 | ||||||
Wisconsin | — | 849 | ||||||
General Allowance | — | — | ||||||
|
|
|
| |||||
Total mortgage loans | $ | 721,831 | $ | 859,366 | ||||
|
|
|
| |||||
Outstanding commitments on certain mortgage loans held in the investment portfolio to finance property improvements on underlying real estate totaled $5.1 million and $4.8 million at December 31, 2019 and 2018, respectively.
During 2019, the maximum and minimum lending rates were 5.170% and 3.570%, respectively. The maximum and minimum lending rates for commercial mortgage loans during 2018 were 5.360% and 4.006%, respectively. During the years ended December 31, 2019 and 2018, the Company did not reduce interest rates on any outstanding mortgage loans. Mortgage loans are collateralized by the related properties and did not exceed 74% and 70% of the properties’ value at the time the original loan was made in 2019 and 2018, respectively.
A loan is considered impaired when it is probable that the principal or interest is not collectible in accordance with the contractual terms of the loan. The allowance for credit losses is estimated using the present value of expected cash flows discounted at the loan’s effective interest rate or the fair value of the collateral, if the loan is collateral dependent. A specific allowance for loan loss is established for an impaired loan if the present value of expected cash flows discounted at the loan’s effective interest rate, or the fair value of the loan collateral, less cost to sell, is less than the recorded amount of the loan. During the years ended December 31, 2019, 2018 and 2017, no loans were impaired or past due.
A general allowance for loan loss is established based on an assessment of past loss experience on groups of loans with similar characteristics and current economic conditions. While management believes that it uses the best information available to establish the allowances, future adjustments may become necessary if economic conditions differ from the assumptions used in calculating them. There was no general allowance for loan loss at December 31, 2019 or 2018.
As of December 31, 2019, and 2018, the Company held no restructured loans. Should the Company hold any troubled debt, the Company may modify the terms of a loan by adjusting the interest rate, extending the maturity date, or both.
The Company accrues interest income on impaired loans to the extent it is deemed collectible, assuming it is delinquent less than 180 days and the loan continues to perform under its original or restructured contractual terms. Interest income is recognized on impaired mortgage loans upon receipt.
42
LINCOLN BENEFIT LIFE COMPANY
NOTES TO STATUTORY STATEMENTS
DECEMBER 31, 2019
The credit quality indicator for the Company’s mortgage loans is a risk-rated measure based on the borrowers’ ability to pay and the value of the underlying collateral. The Commercial Mortgage Loan risk rating is related to an increasing likelihood of loss, with lower quality ratings representing the category in which losses may be expected. It is used in measuring relative risk for the AVR calculation. The statement value of the Company’s mortgage loans, net of allowances for credit losses, by credit quality indicator as of December 31, 2019 and 2018 was as follows:
| ($’s in thousands) | December 31, 2019 | December 31, 2018 | ||||||
CM1 - Highest Quality | $ | 443,931 | $ | 444,430 | ||||
CM2 - High Quality | 239,928 | 377,490 | ||||||
CM3 - Medium Quality | 37,972 | 37,446 | ||||||
|
|
|
| |||||
Total mortgage loans | $ | 721,831 | $ | 859,366 | ||||
|
|
|
| |||||
| 5. | INVESTMENT GAINS AND LOSSES |
Realized capital gains and losses on debt securities, mortgages and derivatives which relate to changes in levels of interest rates are charged or credited to the IMR, net of tax, and amortized into income over the remaining contractual life of the security sold. Realized gains and losses from the remaining investments are reported, net of tax, on the Statutory Statements of Operations, but are not included in the computation of net gain from operations. Realized capital gains and losses are recognized on a specific identification basis.
Net realized gains and losses recognized through the Statutory Statements of Operations for the years ended December 31, 2019, 2018 and 2017 were comprised of the following:
| ($’s in thousands) | 2019 | 2018 | 2017 | |||||||||
Debt securities | $ | 115,958 | $ | (50,282 | ) | $ | 11,256 | |||||
Mortgage loans | 474 | (104 | ) | 3,997 | ||||||||
Cash, cash equivalents and short-term investments | (1 | ) | 2 | — | ||||||||
Derivative instruments | 8,268 | 4,913 | 21,229 | |||||||||
Other invested assets | 267 | (9 | ) | (92 | ) | |||||||
|
|
|
|
|
| |||||||
Subtotal | 124,966 | (45,480 | ) | 36,390 | ||||||||
Capital gains tax expense | 344 | (20,649 | ) | 15,149 | ||||||||
|
|
|
|
|
| |||||||
Net realized gains (losses) | 124,622 | (24,831 | ) | 21,241 | ||||||||
Gains transferred to IMR (net of taxes) | (102,998 | ) | 36,055 | (12,029 | ) | |||||||
|
|
|
|
|
| |||||||
Total | $ | 21,624 | $ | 11,224 | $ | 9,212 | ||||||
|
|
|
|
|
| |||||||
Realized capital gains and losses included $3.1 million of other-than-temporary impairment losses related to debt securities for the year ended December 31, 2019. Realized capital gains and losses included $4.8 million of other-than-temporary impairment losses related to debt securities for the year ended December 31, 2018. Realized capital gains and losses included $4.3 million and $0.1 million of other-than-temporary impairment losses related to debt securities and LIHTCs, respectively, for the year ended December 31, 2017.
43
LINCOLN BENEFIT LIFE COMPANY
NOTES TO STATUTORY STATEMENTS
DECEMBER 31, 2019
Changes in unrealized gains and losses from investments are reported as a component of Capital and Surplus, net of deferred income taxes, and were as follows for the years ended December 31, 2019, 2018 and 2017:
| ($’s in thousands) | 2019 | 2018 | 2017 | |||||||||
Common stocks of affiliates | $ | (61,355 | ) | $ | (38,572 | ) | $ | (8,223 | ) | |||
Derivative instruments | 15,281 | (12,050 | ) | (1,869 | ) | |||||||
Other invested assets | 200 | — | — | |||||||||
|
|
|
|
|
| |||||||
Total | $ | (45,874 | ) | $ | (50,622 | ) | $ | (10,092 | ) | |||
|
|
|
|
|
| |||||||
There was no deferred tax netted in the above for the years ended December 31, 2019, 2018, or 2017.
| 6. | NET INVESTMENT INCOME |
Net investment income for the years ended December 31, 2019, 2018 and 2017 consisted of:
| ($’s in thousands) | 2019 | 2018 | 2017 | |||||||||
Debt securities | $ | 322,129 | $ | 329,729 | $ | 344,880 | ||||||
Mortgage loans | 37,239 | 41,310 | 48,837 | |||||||||
Contract loans | 6,245 | 6,710 | 6,776 | |||||||||
Cash, cash equivalents and short-terms | 4,041 | 3,867 | 1,693 | |||||||||
Other invested assets | 7,933 | 8,684 | 6,578 | |||||||||
|
|
|
|
|
| |||||||
Gross investment income | 377,587 | 390,300 | 408,764 | |||||||||
Interest expenses | 10,637 | 13,718 | 16,558 | |||||||||
Third party administration costs | 13,150 | 14,046 | 14,415 | |||||||||
Other investment expenses | 434 | 429 | 349 | |||||||||
|
|
|
|
|
| |||||||
Net investment income before IMR amortization | 353,366 | 362,107 | 377,442 | |||||||||
IMR amortization | 28,967 | 40,255 | 53,678 | |||||||||
|
|
|
|
|
| |||||||
Total net investment income | $ | 382,333 | $ | 402,362 | $ | 431,120 | ||||||
|
|
|
|
|
| |||||||
The Company’s policy is to exclude investment income due and accrued with amounts that are over 90 days past due for investments other than mortgage loans and over 180 days past due for mortgage loans or where the collection of interest is uncertain. No investment income due and accrued was excluded from surplus at December 31, 2019 or 2018.
| 7. | DERIVATIVES |
Derivative financial instruments utilized by the Company included index options, futures contracts and interest rate swaps. The notional amounts specified in the contracts are used to calculate contractual payments under the agreements and are generally not representative of the potential for gain or loss on these contracts.
Market risk is the risk that the Company will incur losses due to adverse changes in market prices or rates. Market risk exists for all of the derivative financial instruments the Company holds, so they may become less valuable due to adverse changes in market conditions. Changes in the fair value of the derivative financial instruments that the Company uses for risk management purposes are generally offset by the changes in the fair value or cash flows of the hedged risk of the related assets, liabilities or forecasted transactions. To limit the risk to the Company, the Company’s senior management has established risk control limits.
44
LINCOLN BENEFIT LIFE COMPANY
NOTES TO STATUTORY STATEMENTS
DECEMBER 31, 2019
Counterparty credit risk relates to the Company’s potential loss if counterparties concurrently fail to perform under the contractual terms of the contracts. The Company manages its exposure to counterparty credit risk by utilizing highly rated counterparties, establishing risk control limits, executing legally enforceable master agreements and obtaining collateral where appropriate. The Company has not incurred any losses on derivative financial instruments due to counterparty nonperformance. The above derivatives are traded on organized exchanges, which require margin deposits and guarantee the execution of trades, thereby mitigating potential credit risk. At December 31, 2019 and 2018, the Company had $0.3 million and $1.0 million, respectively, in cash collateral from counterparties related to organized exchanges.
The Company uses derivatives to manage risks with certain assets and liabilities arising from potential adverse impacts from changes in risk-free interest rates and equity markets. The Company does not use derivatives for speculative purposes.
The paragraphs below describe the derivatives the Company uses, including the objectives, cash requirements and accounting policies.
Futures
The Company utilizes equity index futures contracts. Futures contracts are defined as commitments to buy or sell designated financial instruments based on specified prices, yields or indexes. Futures contracts provide returns based upon a specified index or interest rate applied to a notional amount. The Company uses futures to hedge exposures in annuity and life contracts. Daily cash settlement of variation margins is required for futures contracts and is based on the changes in daily prices. The final settlement of futures contracts is in cash.
Options
The Company also uses equity index options. Index option contracts provide returns at specified or optional dates based on a specified index applied to the option’s notional amount. The Company purchases and writes (sells) option contracts primarily to reduce market risk associated with certain annuity and life contracts. When the Company purchases/sells option contracts at specific prices, it is required to pay/receive a premium to/from the counterparties. The amount of premium paid/received is based on the number of contracts purchased/sold, the specified price and the maturity date of the contract. The Company pays/receives cash equal to the premium of purchased/written options when the contract is established. Premiums paid are reported as a derivative asset and premiums received are reported as a derivative liability. The change in the fair value of option contracts is reported as change in surplus, with an adjustment to derivatives. If the option is exercised, the Company receives/pays cash equal to the product of the number of contracts and the specified price in the contract with the gain or loss on settlement reported in realized gain or loss. If the options are not exercised and the contracts expire, then no additional cash is exchanged and the remaining book value is offset to realized gain or loss.
Swaps
The Company employs interest rate swaps to hedge interest rate risk related to investments purchased to support annuity contracts. An interest rate swap is an agreement between two counterparties in which one stream of future interest payments is exchanged for another. Interest rate swaps usually involve the exchange of a fixed interest rate for a floating rate, or vice versa, to reduce or increase exposure to fluctuations in interest rates, or to obtain a marginally lower interest rate. Swaps provide returns at the reset dates based on respective interest rates applied to the notional amount with the net difference in resulting interest payments settled between the counterparties. The Company purchases/sells swap contracts at specific prices and pays/receives a premium to/from the counterparties. The amount of premium paid/received is based on the number of contracts purchased/sold and the specified price based on the interest rates used and other terms of the contract. The
45
LINCOLN BENEFIT LIFE COMPANY
NOTES TO STATUTORY STATEMENTS
DECEMBER 31, 2019
Company pays/receives cash equal to the premium of the purchased/written swap when the contract is established. Premiums paid are reported as a derivative asset and premiums received are reported as a derivative liability. The change in the fair value of the swap is reported as change in surplus, with an adjustment to derivatives. Cash flows received/paid at the reset dates are reported in net investment income and consist of any differences in the amounts of contractual interest calculated due to the respective counterparties based on changes in interest rates. Swaps usually terminate upon expiration and the remaining book value is offset to realized gain or loss. If terminated through sale, the difference between consideration received or paid and the remaining book value is recorded to realized gain or loss.
The Company did not report any derivatives as accounting hedges as of December 31, 2019 or 2018.
All derivative transactions are covered under standardized contractual agreements with counterparties, all of which include credit-related contingent features. Certain counterparty relationships also may include supplementary agreements with tailored terms, such as additional triggers for early terminations, acceptable practices related to cross-transaction netting, and minimum thresholds for determining collateral. Credit-related triggers include failure to pay or deliver on an obligation past certain grace periods, bankruptcy or the downgrade of credit ratings to below a stipulated level. These triggers apply to both the Company and its counterparty.
Derivatives are carried in accordance with SSAP No. 86, “Derivatives.” The Company’s underlying notional or principal amounts and gross fair values as of December 31, 2019 and 2018 were as follows:
| December 31, 2019 | December 31, 2018 | |||||||||||||||||||||||||||||||
| Notional | Gross Fair Value | Notional | Gross Fair Value | |||||||||||||||||||||||||||||
| ($’s in thousands) | Assets | Liabilities | Assets | Liabilities | Assets | Liabilities | Assets | Liabilities | ||||||||||||||||||||||||
Options | $ | 311,160 | $ | 288,913 | $ | 49,158 | $ | (30,770 | ) | $ | 338,470 | $ | 324,047 | $ | 5,099 | $ | (1,584 | ) | ||||||||||||||
Futures | — | — | — | — | — | 9,934 | — | (539 | ) | |||||||||||||||||||||||
| 8. | REINSURANCE |
Reinsurance ceded contracts do not relieve the Company from its obligations to policyholders. The Company remains liable to its policyholders for the portion reinsured to the extent that any reinsurer does not meet the obligations assumed under the reinsurance agreement. To minimize its exposure to significant losses from reinsurer insolvencies, the Company regularly evaluates the financial condition of its reinsurers and monitors concentrations of credit risk. Management believes that any liability arising from this contingency is unlikely. ALIC represents over 44% and 49%, of the Company’s ceded reserves as of December 31, 2019 and December 31, 2018, respectively.
The Company did not write off any uncollectible reinsurance balances due for the year ended December 31, 2019. The Company wrote off uncollectible reinsurance balances due of $4.9 million and $2.3 million for the years ended December 31, 2018 and 2017, respectively.
On March 6, 2019, Scottish Re was put into receivership by the Delaware Department of Insurance (the “Receiver”). The Receiver is expected to publish a plan later this year. Our reserve credit with respect to Scottish Re treaties is approximately $7.3 million as of December 31, 2019. The Company has not established an allowance or written off any amounts with respect to these treaties during 2019. A non-admitted asset of approximately $3.3 million has been recorded with regards to reinsurance recoverables as of December 31, 2019.
For the year ended December 31, 2019, the Company reported $539.2 million of premiums earned and $539.2 million of reserve adjustments on reinsurance ceded as a result of commutation/recapture of ceded reinsurance. For the year ended December 31, 2018, the Company reported $1.4 million of premiums earned and $1.5 million of reserve adjustments on reinsurance ceded as a result of commutation/recapture of ceded reinsurance. For the year ended December 31, 2017, the Company reported $1.7 million of premiums earned and $1.7 million of reserve adjustments on reinsurance ceded as a result of commutation/recapture of ceded reinsurance.
46
LINCOLN BENEFIT LIFE COMPANY
NOTES TO STATUTORY STATEMENTS
DECEMBER 31, 2019
The Company has agreements with several unrelated companies, which provide for reinsurance of portions of thenet-amount-at-risk under certain policies. These amounts are reinsured on either a yearly renewable term, coinsurance or modified coinsurance basis. The Company’s modified coinsurance reserves (general account only) were $0.4 billion and $1.0 billion as of December 31, 2019 and 2018, respectively.
The effects of reinsurance were as follows for the years ended December 31, 2019, 2018 and 2017:
| ($’s in thousands) | 2019 | 2018 | 2017 | |||||||||
Insurance and other individual policy benefits and claims*: | ||||||||||||
Direct | $ | 1,395,622 | $ | 1,257,583 | $ | 1,292,006 | ||||||
Assumed | 5,957 | 5,190 | 6,074 | |||||||||
Ceded | (1,285,691 | ) | (1,039,743 | ) | (1,067,171 | ) | ||||||
|
|
|
|
|
| |||||||
Net policy benefits and claims | $ | 115,888 | $ | 223,030 | $ | 230,909 | ||||||
|
|
|
|
|
| |||||||
| * | Excludes surrender benefits |
| ($’s in thousands) | 2019 | 2018 | 2017 | |||||||||
Premiums and annuity considerations: | ||||||||||||
Direct | $ | 1,256,891 | $ | 1,304,600 | $ | 1,372,143 | ||||||
Assumed | 4,949 | 5,118 | 4,768 | |||||||||
Ceded - affiliated | (1,423,211 | ) | 7,422 | (21,674 | ) | |||||||
Ceded - othernon-affiliated | (751,986 | ) | (1,237,027 | ) | (1,244,225 | ) | ||||||
|
|
|
|
|
| |||||||
Net premiums and annuity considerations | $ | (913,357 | ) | $ | 80,113 | $ | 111,012 | |||||
|
|
|
|
|
| |||||||
| 9. | RESERVES FOR LIFE CONTRACTS AND DEPOSIT TYPE CONTRACTS |
The reserves for life insurance and annuity contracts are computed in accordance with presently accepted actuarial standards, and are based on actuarial assumptions and methods (including use of published mortality tables and prescribed interest rates and methodologies) which produce reserves at least as great as those required by law and contract provisions.
Deduction of deferred fractional premiums upon death of the insured and return of any portion of the final premium for the period beyond the date of death are not applicable to the business of the Company. Surrender values are not promised in excess of reserves legally computed.
For traditional life contracts, the cost of additional mortality for each policy is assumed to equal the additional premium charged for that policy period and is reserved accordingly. Additional premiums are collected for policies issued on substandard lives. Reserves are held in a manner consistent with traditional policies. For interest-sensitive policies, substandard mortality is reflected in the cost of insurance charges.
As of December 31, 2019, 2018 and 2017, the Company had $4.7 billion, $5.4 billion and $6.3 billion of direct insurance in force for which gross premiums were less than the net premiums according to the standard of valuation required by the State of Nebraska, respectively. Deficiency reserves above base contract reserves as of December 31, 2019 and 2018 totaled $76.0 million and $85.0 million, respectively.
The Tabular Interest has been determined by formula as described in the NAIC instructions, except for some business for which the Tabular Interest is determined from basic policy data for reserving. The Tabular less
47
LINCOLN BENEFIT LIFE COMPANY
NOTES TO STATUTORY STATEMENTS
DECEMBER 31, 2019
Actual Reserve Released has been determined by formula as described in the NAIC instructions. The Tabular Cost has been determined by formula as described in the NAIC instructions, except for universal life products which use cost of insurance and some business which uses basic policy data for reserving. The Tabular Interest on funds not involving life contingencies was determined from the interest credited to the deposits, except for certain guaranteed interest contracts for which Tabular Interest on funds is determined by formula as described in the instructions.
The Company recorded an additional reserve of $1.1 million related to additional capital requirements for life business for the year ended December 31, 2019. The Company recorded an additional reserve of $19.4 million related to additional capital requirements for deferred annuities for the year ended December 31, 2018.
The Company recorded no premium deficiency reserves related to accident and health contracts for the year ended December 31, 2019. The Company recorded a premium deficiency reserve related to accident and health contracts of $6.0 million for the year ended December 31, 2018.
The withdrawal characteristics of general account and separate account life reserves and deposits as of December 31, 2019 and 2018 were as follows:
December 31, 2019
| General Account | Separate Accounts - Guaranteed and Nonguaranteed | |||||||||||||||||||||||
| ($’s in thousands) | Account Value | Cash Value | Reserve | Account Value | Cash Value | Reserve | ||||||||||||||||||
A. Subject to discretionary withdrawal, surrender values or policy loans: | ||||||||||||||||||||||||
1. Term policies with cash value | $ | — | $ | 12,033 | $ | 48,814 | $ | — | $ | — | $ | — | ||||||||||||
2. Universal life | 906,440 | 906,280 | 916,544 | — | — | — | ||||||||||||||||||
3. Universal life with secondary guarantees | 3,742,945 | 2,920,439 | 6,188,250 | — | — | — | ||||||||||||||||||
4. Indexed universal life | 59,125 | 48,909 | 56,571 | — | — | — | ||||||||||||||||||
5. Indexed universal life with secondary guarantees | 573,928 | 327,805 | 451,051 | — | — | — | ||||||||||||||||||
6. Indexed life | — | — | — | — | — | — | ||||||||||||||||||
7. Other permanent cash value life insurance | — | 5,945 | 8,331 | — | — | — | ||||||||||||||||||
8. Variable life | — | — | — | — | — | — | ||||||||||||||||||
9. Variable universal life | 100,615 | 83,450 | 111,697 | 986,047 | 977,591 | 978,930 | ||||||||||||||||||
10. Miscellaneous reserves | — | 28,904 | 107,335 | — | — | — | ||||||||||||||||||
B. Not subject to discretionary withdrawal or no cash values | ||||||||||||||||||||||||
1. Term policies without cash value | XXX | XXX | 3,529,402 | XXX | XXX | — | ||||||||||||||||||
2. Accidental death benefits | XXX | XXX | 119 | XXX | XXX | — | ||||||||||||||||||
3. Disability - active lives | XXX | XXX | 816 | XXX | XXX | — | ||||||||||||||||||
4. Disability - disabled lives | XXX | XXX | 25,560 | XXX | XXX | — | ||||||||||||||||||
5. Miscellaneous reserves | XXX | XXX | 59,181 | XXX | XXX | — | ||||||||||||||||||
|
|
|
|
|
|
|
|
|
|
|
| |||||||||||||
C. Total (gross: direct + assumed) | 5,383,053 | 4,333,765 | 11,503,671 | 986,047 | 977,591 | 978,930 | ||||||||||||||||||
D. Reinsurance ceded | 5,099,025 | 4,055,171 | 11,202,886 | — | — | — | ||||||||||||||||||
|
|
|
|
|
|
|
|
|
|
|
| |||||||||||||
E. Total (net) (C minus D) | $ | 284,028 | $ | 278,594 | $ | 300,785 | $ | 986,047 | $ | 977,591 | $ | 978,930 | ||||||||||||
|
|
|
|
|
|
|
|
|
|
|
| |||||||||||||
48
LINCOLN BENEFIT LIFE COMPANY
NOTES TO STATUTORY STATEMENTS
DECEMBER 31, 2019
December 31, 2018 | ||||||||||||||||||||||||
| General Account | Separate Accounts - Guaranteed and Nonguaranteed | |||||||||||||||||||||||
| ($’s in thousands) | Account Value | Cash Value | Reserve | Account Value | Cash Value | Reserve | ||||||||||||||||||
A. Subject to discretionary withdrawal, surrender values or policy loans: | ||||||||||||||||||||||||
1. Term policies with cash value | $ | — | $ | 9,396 | $ | 10,395 | $ | — | $ | — | $ | — | ||||||||||||
2. Universal life | 940,803 | 934,823 | 945,621 | — | — | — | ||||||||||||||||||
3. Universal life with secondary guarantees | 3,732,204 | 2,803,454 | 5,964,743 | — | — | — | ||||||||||||||||||
4. Indexed universal life | 60,156 | 47,100 | 53,333 | — | — | — | ||||||||||||||||||
5. Indexed universal life with secondary guarantees | 528,044 | 269,341 | 404,411 | — | — | — | ||||||||||||||||||
6. Indexed life | — | — | — | — | — | — | ||||||||||||||||||
7. Other permanent cash value life insurance | — | 5,806 | 7,788 | — | — | — | ||||||||||||||||||
8. Variable life | — | — | — | — | — | — | ||||||||||||||||||
9. Variable universal life | 93,749 | 90,726 | 104,413 | 819,939 | 792,350 | 811,306 | ||||||||||||||||||
10. Miscellaneous reserves | — | 23,713 | 109,479 | — | — | — | ||||||||||||||||||
B. Not subject to discretionary withdrawal or no cash values | ||||||||||||||||||||||||
1. Term policies without cash value | XXX | XXX | 3,579,013 | XXX | XXX | — | ||||||||||||||||||
2. Accidental death benefits | XXX | XXX | 119 | XXX | XXX | — | ||||||||||||||||||
3. Disability - active lives | XXX | XXX | 680 | XXX | XXX | — | ||||||||||||||||||
4. Disability - disabled lives | XXX | XXX | 23,883 | XXX | XXX | — | ||||||||||||||||||
5. Miscellaneous reserves | XXX | XXX | 88,978 | XXX | XXX | — | ||||||||||||||||||
|
|
|
|
|
|
|
|
|
|
|
| |||||||||||||
C. Total (gross: direct + assumed) | 5,354,956 | 4,184,359 | 11,292,856 | 819,939 | 792,350 | 811,306 | ||||||||||||||||||
D. Reinsurance ceded | 4,382,730 | 3,225,479 | 10,286,872 | — | — | — | ||||||||||||||||||
|
|
|
|
|
|
|
|
|
|
|
| |||||||||||||
E. Total (net) (C minus D) | $ | 972,226 | $ | 958,880 | $ | 1,005,984 | $ | 819,939 | $ | 792,350 | $ | 811,306 | ||||||||||||
|
|
|
|
|
|
|
|
|
|
|
| |||||||||||||
| 10. | WITHDRAWAL CHARACTERISTICS OF ANNUITY RESERVES AND DEPOSIT LIABILITIES |
The withdrawal characteristics of general account and separate account annuity reserves and deposits as of December 31, 2019 and 2018 were as follows:
December 31, 2019 ($’s in thousands) | ||||||||||||||||||||
| General Account | Separate Accounts with Guarantees | Separate Accounts Nonguaranteed | Total | % of Total | ||||||||||||||||
| A. INDIVIDUAL ANNUITIES: | ||||||||||||||||||||
1. Subject to discretionary withdrawal: | ||||||||||||||||||||
a. With market value adjustment | $ | 261,759 | $ | 34,221 | $ | — | $ | 295,980 | 6.8 | % | ||||||||||
b. At book value less current surrender charge of 5% or more | 47,407 | — | — | 47,407 | 1.1 | % | ||||||||||||||
c. At fair value | 24,155 | — | 445,888 | 470,043 | 10.8 | % | ||||||||||||||
|
|
|
|
|
|
|
|
|
| |||||||||||
49
LINCOLN BENEFIT LIFE COMPANY
NOTES TO STATUTORY STATEMENTS
DECEMBER 31, 2019
December 31, 2019 ($’s in thousands) | ||||||||||||||||||||
| General Account | Separate Accounts with Guarantees | Separate Accounts Nonguaranteed | Total | % of Total | ||||||||||||||||
d. Total with market value adjustment or at fair value (Total of a through c) | $ | 333,321 | $ | 34,221 | $ | 445,888 | $ | 813,430 | 18.7 | % | ||||||||||
e. At book value without adjustment (minimal or no charge or adjustment) | 3,035,371 | — | — | 3,035,371 | 69.7 | % | ||||||||||||||
2. Not subject to discretionary withdrawal | 501,894 | — | 4,307 | 506,201 | 11.6 | % | ||||||||||||||
|
|
|
|
|
|
|
|
|
| |||||||||||
3. Total (gross: direct + assumed) | 3,870,586 | 34,221 | 450,195 | 4,355,002 | 100.0 | % | ||||||||||||||
|
| |||||||||||||||||||
4. Reinsurance ceded | 952,311 | 34,221 | — | 986,532 | ||||||||||||||||
|
|
|
|
|
|
|
| |||||||||||||
5. Total (net) (line 3 minus 4) | $ | 2,918,275 | $ | — | $ | 450,195 | $ | 3,368,470 | ||||||||||||
|
|
|
|
|
|
|
| |||||||||||||
6. Amount included in A.1.b. above that will move to A.1.e. in the year after the statement date | $ | 12,756 | $ | — | $ | — | $ | 12,756 | ||||||||||||
|
|
|
|
|
|
|
| |||||||||||||
| General Account | Separate Accounts with Guarantees | Separate Accounts Nonguaranteed | Total | % of Total | ||||||||||||||||
B. GROUP ANNUITIES: | ||||||||||||||||||||
1. Subject to discretionary withdrawal: | ||||||||||||||||||||
a. With market value adjustment | $ | 232,235 | $ | 217 | $ | — | $ | 232,452 | 64.7 | % | ||||||||||
b. At book value less current surrender charge of 5% or more | 353 | — | — | 353 | 0.1 | % | ||||||||||||||
c. At fair value | — | — | 27,375 | 27,375 | 7.6 | % | ||||||||||||||
|
|
|
|
|
|
|
|
|
| |||||||||||
d. Total with market value adjustment or at fair value (Total of a through c) | 232,588 | 217 | 27,375 | 260,180 | 72.4 | % | ||||||||||||||
e. At book value without adjustment (minimal or no charge or adjustment) | 49,818 | — | — | 49,818 | 13.9 | % | ||||||||||||||
2. Not subject to discretionary withdrawal | 49,098 | — | 104 | 49,202 | 13.7 | % | ||||||||||||||
|
|
|
|
|
|
|
|
|
| |||||||||||
3. Total (gross: direct + assumed) | 331,504 | 217 | 27,479 | 359,200 | 100.0 | % | ||||||||||||||
|
| |||||||||||||||||||
4. Reinsurance ceded | 61,206 | 217 | — | 61,423 | ||||||||||||||||
|
|
|
|
|
|
|
| |||||||||||||
5. Total (net) (line 3 minus 4) | $ | 270,298 | $ | — | $ | 27,479 | $ | 297,777 | ||||||||||||
|
|
|
|
|
|
|
| |||||||||||||
6. Amount included in B.1.b. above that will move to B.1.e. in the year after the statement date | $ | — | $ | — | $ | — | $ | — | ||||||||||||
|
|
|
|
|
|
|
| |||||||||||||
50
LINCOLN BENEFIT LIFE COMPANY
NOTES TO STATUTORY STATEMENTS
DECEMBER 31, 2019
| General Account | Separate Accounts with Guarantees | Separate Accounts Nonguaranteed | Total | % of Total | ||||||||||||||||
C. DEPOSIT TYPE CONTRACTS | ||||||||||||||||||||
1. Subject to discretionary withdrawal: | ||||||||||||||||||||
a. With market value adjustment | $ | — | $ | — | $ | — | $ | — | 0.0 | % | ||||||||||
b. At book value less current surrender charge of 5% or more | — | — | — | — | 0.0 | % | ||||||||||||||
c. At fair value | 2,440 | — | — | 2,440 | 0.4 | % | ||||||||||||||
|
|
|
|
|
|
|
|
|
| |||||||||||
d. Total with market value adjustment or at fair value (Total of a through c) | 2,440 | — | — | 2,440 | 0.4 | % | ||||||||||||||
e. At book value without adjustment (minimal or no charge or adjustment) | 61,122 | — | — | 61,122 | 10.6 | % | ||||||||||||||
2. Not subject to discretionary withdrawal | 512,790 | — | — | 512,790 | 89.0 | % | ||||||||||||||
|
|
|
|
|
|
|
|
|
| |||||||||||
3. Total (gross: direct + assumed) | 576,352 | — | — | 576,352 | 100.0 | % | ||||||||||||||
|
| |||||||||||||||||||
4. Reinsurance ceded | 105,880 | — | — | 105,880 | ||||||||||||||||
|
|
|
|
|
|
|
| |||||||||||||
5. Total (net) (line 3 minus 4) | $ | 470,472 | $ | — | $ | — | $ | 470,472 | ||||||||||||
|
|
|
|
|
|
|
| |||||||||||||
6. Amount included in C.1.b. above that will move to C.1.e. in the year after the statement date | $ | — | $ | — | $ | — | $ | — | ||||||||||||
|
|
|
|
|
|
|
| |||||||||||||
| December 31, 2018 | ||||||||||||||||||||
| ($’s in thousands) | ||||||||||||||||||||
| General Account | Separate Accounts with Guarantees | Separate Accounts Nonguaranteed | Total | % of Total | ||||||||||||||||
A. INDIVIDUAL ANNUITIES: | ||||||||||||||||||||
1. Subject to discretionary withdrawal: | ||||||||||||||||||||
a. With market value adjustment | $ | 319,071 | $ | 33,142 | $ | — | $ | 352,213 | 7.4 | % | ||||||||||
b. At book value less current surrender charge of 5% or more | 91,039 | — | — | 91,039 | 1.9 | % | ||||||||||||||
c. At fair value | 27,234 | — | 418,506 | 445,740 | 9.4 | % | ||||||||||||||
|
|
|
|
|
|
|
|
|
| |||||||||||
d. Total with market value adjustment or at fair value (Total of a through c) | 437,344 | 33,142 | 418,506 | 888,992 | 18.7 | % | ||||||||||||||
e. At book value without adjustment (minimal or no charge or adjustment) | 3,308,973 | — | — | 3,308,973 | 69.5 | % | ||||||||||||||
2. Not subject to discretionary withdrawal | 558,332 | — | 3,538 | 561,870 | 11.8 | % | ||||||||||||||
|
|
|
|
|
|
|
|
|
| |||||||||||
3. Total (gross: direct + assumed) | 4,304,649 | 33,142 | 422,044 | 4,759,835 | 100 | % | ||||||||||||||
|
| |||||||||||||||||||
4. Reinsurance ceded | 452,669 | 33,142 | — | 485,811 | ||||||||||||||||
|
|
|
|
|
|
|
| |||||||||||||
5. Total (net) (line 3 minus 4) | $ | 3,851,980 | $ | — | $ | 422,044 | $ | 4,274,024 | ||||||||||||
|
|
|
|
|
|
|
| |||||||||||||
6. Amount included in A.1.b. above that will move to A.1.e. in the year after the statement date | $ | 16,891 | $ | — | $ | — | $ | 16,891 | ||||||||||||
|
|
|
|
|
|
|
| |||||||||||||
51
LINCOLN BENEFIT LIFE COMPANY
NOTES TO STATUTORY STATEMENTS
DECEMBER 31, 2019
| General Account | Separate Accounts with Guarantees | Separate Accounts Nonguaranteed | Total | % of Total | ||||||||||||||||
B. GROUP ANNUITIES: | ||||||||||||||||||||
1. Subject to discretionary withdrawal: | ||||||||||||||||||||
a. With market value adjustment | $ | 268,945 | $ | 208 | $ | — | $ | 269,153 | 66.9 | % | ||||||||||
b. At book value less current surrender charge of 5% or more | 1,514 | — | — | 1,514 | 0.4 | % | ||||||||||||||
c. At fair value | — | — | 23,865 | 23,865 | 5.9 | % | ||||||||||||||
|
|
|
|
|
|
|
|
|
| |||||||||||
d. Total with market value adjustment or at fair value (Total of a through c) | 270,459 | 208 | 23,865 | 294,532 | 73.2 | % | ||||||||||||||
e. At book value without adjustment (minimal or no charge or adjustment) | 56,126 | — | — | 56,126 | 14.0 | % | ||||||||||||||
2. Not subject to discretionary withdrawal | 51,702 | — | 15 | 51,717 | 12.9 | % | ||||||||||||||
|
|
|
|
|
|
|
|
|
| |||||||||||
3. Total (gross: direct + assumed) | 378,287 | 208 | 23,880 | 402,375 | 100.0 | % | ||||||||||||||
|
| |||||||||||||||||||
4. Reinsurance ceded | 27,645 | 208 | — | 27,853 | ||||||||||||||||
|
|
|
|
|
|
|
| |||||||||||||
5. Total (net) (line 3 minus 4) | $ | 350,642 | $ | — | $ | 23,880 | $ | 374,522 | ||||||||||||
|
|
|
|
|
|
|
| |||||||||||||
6. Amount included in B.1.b. above that will move to B.1.e. in the year after the statement date | $ | 167 | $ | — | $ | — | $ | 167 | ||||||||||||
|
|
|
|
|
|
|
| |||||||||||||
| General Account | Separate Accounts with Guarantees | Separate Accounts Nonguaranteed | Total | % of Total | ||||||||||||||||
C. DEPOSIT TYPE CONTRACTS | ||||||||||||||||||||
1. Subject to discretionary withdrawal: | ||||||||||||||||||||
a. With market value adjustment | $ | — | $ | — | $ | — | $ | — | 0.0 | % | ||||||||||
b. At book value less current surrender charge of 5% or more | — | — | — | — | 0.0 | % | ||||||||||||||
c. At fair value | 3,052 | — | — | 3,052 | 0.6 | % | ||||||||||||||
|
|
|
|
|
|
|
|
|
| |||||||||||
d. Total with market value adjustment or at fair value (Total of a through c) | 3,052 | — | — | 3,052 | 0.6 | % | ||||||||||||||
e. At book value without adjustment (minimal or no charge or adjustment) | 66,313 | — | — | 66,313 | 13.0 | % | ||||||||||||||
2. Not subject to discretionary withdrawal | 440,935 | — | — | 440,935 | 86.4 | % | ||||||||||||||
|
|
|
|
|
|
|
|
|
| |||||||||||
3. Total (gross: direct + assumed) | 510,300 | — | — | 510,300 | 100.0 | % | ||||||||||||||
|
| |||||||||||||||||||
4. Reinsurance ceded | 120,306 | — | — | 120,306 | ||||||||||||||||
|
|
|
|
|
|
|
| |||||||||||||
5. Total (net) (line 3 minus 4) | $ | 389,994 | $ | — | $ | — | $ | 389,994 | ||||||||||||
|
|
|
|
|
|
|
| |||||||||||||
6. Amount included in C.1.b. above that will move to C.1.e. in the year after the statement date | $ | — | $ | — | $ | — | $ | — | ||||||||||||
|
|
|
|
|
|
|
| |||||||||||||
52
LINCOLN BENEFIT LIFE COMPANY
NOTES TO STATUTORY STATEMENTS
DECEMBER 31, 2019
| 11. | SEPARATE ACCOUNTS |
The Company continues to have variable life policies and variable annuity contractsin-force, however, it stopped issuing new business on these products in 2017 and 2006, respectively. The assets and liabilities of variable life policies and variable annuity contracts are recorded as assets and liabilities of the Separate Accounts and are legally insulated from the General Account, excluding any purchase payments or transfers directed by the contract holder to earn a fixed rate of return which are included in the Company’s General Account assets. The legal insulation of the Separate Accounts assets prevents such assets from being generally available to satisfy claims resulting from the General Account. Separate Accounts which contain variable annuity and variable life business are unit investment trusts registered with the Securities and Exchange Commission (“SEC”). The results of the Separate Accounts related to variable annuity and certain variable life business are reinsured to ALIC pursuant to a modified coinsurance agreement.
The Separate Accounts allow the contract holder to accumulate funds within a variety of portfolios, at rates which depend upon the return achieved from the types of investments chosen. The net investment experience of the Separate Accounts is credited directly to the contract holder and can be favorable or unfavorable. The assets of each portfolio are held separately from the other portfolios and each has distinct investment objectives and policies. Absent any contract provision wherein the Company provides a guarantee, the contract holders of the variable annuity and variable life products bear the investment risk that Separate Accounts’ funds may not meet their stated investment objectives.
The assets legally insulated and not legally insulated from the general account as of December 31, 2019 and 2018 were attributed to the following products/transactions:
| ($’s in thousands) | December 31, 2019 | December 31, 2018 | ||||||||||||||
| Product/transaction | Legally insulated assets | Separate Account Assets (Not legally insulated) | Legally insulated assets | Separate Account Assets (Not legally insulated) | ||||||||||||
Variable annuity contracts | $ | 478,509 | $ | — | $ | 446,973 | $ | — | ||||||||
Variable life policies | 986,047 | — | 819,939 | — | ||||||||||||
|
|
|
|
|
|
|
| |||||||||
Total | $ | 1,464,556 | $ | — | $ | 1,266,912 | $ | — | ||||||||
|
|
|
|
|
|
|
| |||||||||
Some of the Separate Account liabilities are guaranteed by the General Account. To compensate the General Account for the risk taken on variable annuity products, the Separate Accounts paid risk charges of $1.1 million, $1.2 million and $1.2 million for the years ended December 31, 2019, 2018 and 2017, respectively. All such guarantees and the related risk charges are reinsured to ALIC. The risk charges related to variable life products are not explicit, but rather embedded within the cost of insurance.
The amounts paid by the General Account for Separate Account guarantees for the years ended December 31, 2019, 2018 and 2017 were $1.2 million, $2.1 million and $3.2 million, respectively. Certain of these guarantees and the related risk charges are reinsured to ALIC.
The Company did not have securities lending transactions within the Separate Accounts at December 31, 2019 or 2018.
53
LINCOLN BENEFIT LIFE COMPANY
NOTES TO STATUTORY STATEMENTS
DECEMBER 31, 2019
An analysis of the Separate Account reserves as of December 31, 2019 was as follows:
| ($’s in thousands) | Index | Nonindexed Guarantee Less Than/Equal to 4% | Nonindexed Guarantee More than 4% | Non-Guaranteed Separate Accounts | Total | |||||||||||||||
1. Premiums, considerations or deposits for the year ended 12/31/19 | $ | — | $ | — | $ | — | $ | 68,061 | $ | 68,061 | ||||||||||
|
|
|
|
|
|
|
|
|
| |||||||||||
Reserves at 12/31/19 | ||||||||||||||||||||
2. For accounts with assets at: | ||||||||||||||||||||
a. Fair value | — | — | — | 1,456,604 | 1,456,604 | |||||||||||||||
b. Amortized cost | — | — | — | — | — | |||||||||||||||
|
|
|
|
|
|
|
|
|
| |||||||||||
c. Total Reserves | $ | — | $ | — | $ | — | $ | 1,456,604 | $ | 1,456,604 | ||||||||||
|
|
|
|
|
|
|
|
|
| |||||||||||
3. By withdrawal characteristics: | ||||||||||||||||||||
a. Subject to discretionary withdrawal | $ | — | $ | — | $ | — | $ | — | $ | — | ||||||||||
b. With market value adjustment | — | — | — | — | — | |||||||||||||||
c. At book value without market value adjustment and with current surrender charge of 5% or more | — | — | — | — | — | |||||||||||||||
d. At fair value | — | — | — | 1,452,193 | 1,452,193 | |||||||||||||||
e. At book Value without market value adjustment and with current surrender charge less than 5% | — | — | — | — | — | |||||||||||||||
|
|
|
|
|
|
|
|
|
| |||||||||||
f. Subtotal | — | — | — | 1,452,193 | 1,452,193 | |||||||||||||||
g. Not subject to discretionary withdrawal | — | — | — | 4,411 | 4,411 | |||||||||||||||
|
|
|
|
|
|
|
|
|
| |||||||||||
h. Total Reserves | $ | — | $ | — | $ | — | $ | 1,456,604 | $ | 1,456,604 | ||||||||||
|
|
|
|
|
|
|
|
|
| |||||||||||
4. Reserves for Asset Default Risk in Lieu of AVR | $ | — | $ | — | $ | — | $ | — | $ | — | ||||||||||
|
|
|
|
|
|
|
|
|
| |||||||||||
An analysis of the Separate Account reserves as of December 31, 2018 was as follows:
| ($’s in thousands) | Index | Nonindexed Guarantee Less Than/Equal to 4% | Nonindexed Guarantee More than 4% | Non-Guaranteed Separate Accounts | Total | |||||||||||||||
1. Premiums, considerations or deposits for the year ended 12/31/18 | $ | — | $ | — | $ | — | $ | 72,926 | $ | 72,926 | ||||||||||
|
|
|
|
|
|
|
|
|
| |||||||||||
Reserves at 12/31/18 | ||||||||||||||||||||
2. For accounts with assets at: | ||||||||||||||||||||
a. Fair value | — | — | — | 1,257,230 | 1,257,230 | |||||||||||||||
b. Amortized cost | — | — | — | — | — | |||||||||||||||
|
|
|
|
|
|
|
|
|
| |||||||||||
c. Total Reserves | $ | — | $ | — | $ | — | $ | 1,257,230 | $ | 1,257,230 | ||||||||||
|
|
|
|
|
|
|
|
|
| |||||||||||
3. By withdrawal characteristics: | ||||||||||||||||||||
a. Subject to discretionary withdrawal | $ | — | $ | — | $ | — | $ | — | $ | — | ||||||||||
b. With market value adjustment | — | — | — | — | — | |||||||||||||||
54
LINCOLN BENEFIT LIFE COMPANY
NOTES TO STATUTORY STATEMENTS
DECEMBER 31, 2019
| ($’s in thousands) | Index | Nonindexed Guarantee Less Than/Equal to 4% | Nonindexed Guarantee More than 4% | Non-Guaranteed Separate Accounts | Total | |||||||||||||||
c. At book value without market value adjustment and with current surrender charge of 5% or more | $ | — | $ | — | $ | — | $ | — | $ | — | ||||||||||
d. At fair value | — | — | — | 1,253,677 | 1,253,677 | |||||||||||||||
e. At book Value without market value adjustment and with current surrender charge less than 5% | — | — | — | — | — | |||||||||||||||
|
|
|
|
|
|
|
|
|
| |||||||||||
f. Subtotal | — | — | — | 1,253,677 | 1,253,677 | |||||||||||||||
g. Not subject to discretionary withdrawal | — | — | — | 3,553 | 3,553 | |||||||||||||||
|
|
|
|
|
|
|
|
|
| |||||||||||
h. Total Reserves | $ | — | $ | — | $ | — | $ | 1,257,230 | $ | 1,257,230 | ||||||||||
|
|
|
|
|
|
|
|
|
| |||||||||||
4. Reserves for Asset Default Risk in Lieu of AVR | $ | — | $ | — | $ | — | $ | — | $ | — | ||||||||||
|
|
|
|
|
|
|
|
|
| |||||||||||
The reconciliation of Net Transfers from Separate Accounts (from) to the Statements of Operations of the Separate Account Statement to the Statutory Statements of Operations of the Company for the years ended December 31, 2019, 2018 and 2017 was as follows:
| ($’s in thousands) | 2019 | 2018 | 2017 | |||||||||
Transfers as reported in the Summary of Operations of the Separate Accounts Statements | ||||||||||||
Transfers to Separate Accounts | $ | 68,061 | $ | 72,926 | $ | 75,689 | ||||||
Transfers from Separate Accounts | (131,228 | ) | (133,202 | ) | (145,985 | ) | ||||||
|
|
|
|
|
| |||||||
Net transfers to or (from) Separate Accounts | $ | (63,167 | ) | $ | (60,276 | ) | $ | (70,296 | ) | |||
|
|
|
|
|
| |||||||
| 12. | FAIR VALUE OF FINANCIAL INSTRUMENTS |
Fair value is defined as the price that would be received to sell an asset or paid to transfer a liability in an orderly transaction between market participants at the measurement date. The hierarchy for inputs used in determining fair value maximizes the use of observable inputs and minimizes the use of unobservable inputs by requiring that observable inputs be used when available. Assets and liabilities recorded on the Statutory Statements of Admitted Assets, Liabilities, and Capital and Surplus at fair value are categorized in the fair value hierarchy based on the observability of inputs to the valuation techniques as follows:
Level 1 Assets and liabilities whose values are based on unadjusted quoted prices for identical assets or liabilities in an active market that the Company can access.
Level 2 Assets and liabilities whose values are based on the following:
| (a) | Quoted prices for similar assets or liabilities in active markets; |
| (b) | Quoted prices for identical or similar assets or liabilities in markets that are not active; or |
| (c) | Valuation models whose inputs are observable, directly or indirectly, for substantially the full term of the asset or liability. |
55
LINCOLN BENEFIT LIFE COMPANY
NOTES TO STATUTORY STATEMENTS
DECEMBER 31, 2019
Level 3 Assets and liabilities whose values are based on prices or valuation techniques that require inputs that are both unobservable and significant to the overall fair value measurement. Unobservable inputs reflect the Company’s estimates of the assumptions that market participants would use in valuing the assets and liabilities.
The availability of observable inputs varies by instrument. In situations where fair value is based on internally developed pricing models or inputs that are unobservable in the market, the determination of fair value requires more judgment. The degree of judgment exercised by the Company in determining fair value is typically greatest for instruments categorized in Level 3. In many instances, valuation inputs used to measure fair value fall into different levels of the fair value hierarchy. The category level in the fair value hierarchy is determined based on the lowest level input that is significant to the fair value measurement in its entirety. The Company uses prices and inputs that are current as of the measurement date, including during periods of market disruption. In periods of market disruption, the ability to observe prices and inputs may be reduced for many instruments.
The Company is responsible for the determination of fair value and the supporting assumptions and methodologies. The Company gains assurance that assets and liabilities are appropriately valued through the execution of various processes and controls designed to ensure the overall reasonableness and consistent application of valuation methodologies, including inputs and assumptions, and compliance with accounting standards. For fair values received from third parties or internally estimated, the Company’s processes and controls are designed to ensure that the valuation methodologies are appropriate and consistently applied, the inputs and assumptions are reasonable and consistent with the objective of determining fair value, and the fair values are accurately recorded. For example, on a continuing basis, the Company assesses the reasonableness of individual fair values that have stale security prices or that exceed certain thresholds as compared to previous fair values received from valuation service providers or brokers or derived from internal models.
The Company performs procedures to understand and assess the methodologies, processes and controls of valuation service providers. In addition, the Company may validate the reasonableness of fair values by comparing information obtained from valuation service providers or brokers to other third-party valuation sources for selected securities. The Company performs ongoing price validation procedures such as back-testing of actual sales, which corroborate the various inputs used in internal models to market observable data. When fair value determinations are expected to be more variable, the Company validates them through reviews by members of management who have relevant expertise and who are independent of those charged with executing investment transactions. There were no significant changes made in valuation techniques during 2019 or 2018.
The Company may reclassify assets reported at fair value between levels of the SSAP No. 100 fair value hierarchy if appropriate based on changes in the quality of valuation inputs available during a reporting period. The policy governing when these transfers are recognized did not change during 2019 or 2018. There are no transfers between Level 2 and Level 3 during 2019 or 2018.
The Company’s assets and liabilities by classification measured at fair value as of December 31, 2019 were as follows:
| ($’s in thousands) | Level 1 | Level 2 | Level 3 | Net Asset Value (NAV) | Total | |||||||||||||||
Assets at fair value: | ||||||||||||||||||||
Options | $ | 18,388 | $ | 0 | $ | 0 | $ | 0 | $ | 18,388 | ||||||||||
Separate account assets | 1,464,556 | 0 | 0 | 0 | 1,464,556 | |||||||||||||||
|
|
|
|
|
|
|
|
|
| |||||||||||
Total assets at fair value | $ | 1,482,944 | $ | 0 | $ | 0 | $ | 0 | $ | 1,482,944 | ||||||||||
|
|
|
|
|
|
|
|
|
| |||||||||||
56
LINCOLN BENEFIT LIFE COMPANY
NOTES TO STATUTORY STATEMENTS
DECEMBER 31, 2019
| ($’s in thousands) | Level 1 | Level 2 | Level 3 | Net Asset Value (NAV) | Total | |||||||||||||||
Liabilities at fair value: | ||||||||||||||||||||
Separate account liabilities | $ | 1,464,556 | $ | 0 | $ | 0 | $ | 0 | $ | 1,464,556 | ||||||||||
|
|
|
|
|
|
|
|
|
| |||||||||||
Total liabilities at fair value | $ | 1,464,556 | $ | 0 | $ | 0 | $ | 0 | $ | 1,464,556 | ||||||||||
|
|
|
|
|
|
|
|
|
| |||||||||||
The Company’s assets and liabilities by classification measured at fair value as of December 31, 2018 were as follows:
| ($’s in thousands) | Level 1 | Level 2 | Level 3 | Net Asset Value (NAV) | Total | |||||||||||||||
Assets at fair value: | ||||||||||||||||||||
Options | $ | 3,515 | $ | — | $ | — | $ | — | $ | 3,515 | ||||||||||
Separate account assets | 1,266,912 | — | — | — | 1,266,912 | |||||||||||||||
|
|
|
|
|
|
|
|
|
| |||||||||||
Total assets at fair value | $ | 1,270,427 | $ | — | $ | — | $ | — | $ | 1,270,427 | ||||||||||
|
|
|
|
|
|
|
|
|
| |||||||||||
Liabilities at fair value: | ||||||||||||||||||||
Futures | $ | 539 | $ | — | $ | — | $ | — | $ | 539 | ||||||||||
Separate account liabilities | 1,266,912 | — | — | — | 1,266,912 | |||||||||||||||
|
|
|
|
|
|
|
|
|
| |||||||||||
Total liabilities at fair value | $ | 1,267,451 | $ | — | $ | — | $ | — | $ | 1,267,451 | ||||||||||
|
|
|
|
|
|
|
|
|
| |||||||||||
The carrying amounts and estimated fair values of the Company’s financial instruments as of December 31, 2019 were as follows:
| ($’s in thousands) | Aggregate Fair Value | Admitted Assets | Level 1 | Level 2 | Level 3 | Net Asset Value (NAV) | Not Practicable (Carrying Value) | |||||||||||||||||||||
Assets at fair value: | ||||||||||||||||||||||||||||
Bonds | $ | 6,839,757 | $ | 6,361,622 | $ | 38,582 | $ | 6,788,028 | $ | 13,147 | $ | — | $ | — | ||||||||||||||
Preferred stocks | 14,800 | 14,800 | — | 14,800 | — | — | — | |||||||||||||||||||||
Common stocks | 8,479 | 8,479 | — | — | — | — | 8,479 | |||||||||||||||||||||
Mortgage loans | 735,948 | 721,831 | — | — | 735,948 | — | — | |||||||||||||||||||||
Contract loans | 33,622 | 33,622 | — | — | 33,622 | — | — | |||||||||||||||||||||
Derivative assets | 18,388 | 18,388 | 18,388 | — | — | — | — | |||||||||||||||||||||
Other invested assets | 50,753 | 45,752 | — | 50,753 | — | — | — | |||||||||||||||||||||
Cash and short-term investments | 250,510 | 250,510 | 250,510 | — | — | — | — | |||||||||||||||||||||
Derivatives collateral | 300 | 300 | 300 | — | — | — | — | |||||||||||||||||||||
Separate account assets | 1,464,556 | 1,464,556 | 1,464,556 | — | — | — | — | |||||||||||||||||||||
Liabilities at fair value: | ||||||||||||||||||||||||||||
Deposit liabilities | $ | 473,016 | $ | 470,472 | $ | — | $ | — | $ | 473,016 | $ | — | $ | — | ||||||||||||||
Separate account liabilities | 1,464,556 | 1,464,556 | 1,464,556 | — | — | — | — | |||||||||||||||||||||
57
LINCOLN BENEFIT LIFE COMPANY
NOTES TO STATUTORY STATEMENTS
DECEMBER 31, 2019
The carrying amounts and estimated fair values of the Company’s financial instruments as of December 31, 2018 was as follows:
| ($’s in thousands) | Aggregate Fair Value | Admitted Assets | Level 1 | Level 2 | Level 3 | Net Asset Value (NAV) | Not Practicable (Carrying Value) | |||||||||||||||||||||
Assets at fair value: | ||||||||||||||||||||||||||||
Bonds | $ | 7,402,994 | $ | 7,709,648 | $ | 91,310 | $ | 7,297,956 | $ | 13,728 | $ | — | $ | — | ||||||||||||||
Preferred stocks | 14,800 | 14,800 | — | 14,800 | — | — | — | |||||||||||||||||||||
Common stocks | 6,988 | 6,988 | — | — | — | — | 6,988 | |||||||||||||||||||||
Mortgage loans | 852,034 | 859,366 | — | — | 852,034 | — | — | |||||||||||||||||||||
Contract loans | 134,465 | 134,465 | — | — | 134,465 | — | — | |||||||||||||||||||||
Derivative assets | 2,976 | 2,976 | 2,976 | — | — | — | — | |||||||||||||||||||||
Other invested assets | 46,757 | 47,400 | — | 46,757 | — | — | — | |||||||||||||||||||||
Cash and short-term investments | 210,290 | 210,290 | 210,290 | — | — | — | — | |||||||||||||||||||||
Derivatives collateral | 950 | 950 | 950 | — | — | — | — | |||||||||||||||||||||
Separate account assets | 1,266,912 | 1,266,912 | 1,266,912 | — | — | — | — | |||||||||||||||||||||
Liabilities at fair value: | ||||||||||||||||||||||||||||
Deposit liabilities | $ | 383,854 | $ | 389,993 | $ | — | $ | — | $ | 383,854 | $ | — | $ | — | ||||||||||||||
Separate account liabilities | 1,266,912 | 1,266,912 | 1,266,912 | — | — | — | — | |||||||||||||||||||||
The methods and assumptions that the Company uses in determining the estimated fair value of its financial instruments are summarized below:
Cash and short-term investments – The Company believes that due to the short-term nature of certain assets, the carrying value approximates fair value. Cash and short-term investments include money market instruments, highly liquid debt instruments and certain other investments. Certain money market instruments are valued using unadjusted quoted prices in active markets that are accessible for identical assets and are primarily classified as Level 1. The remaining instruments in this category are generally fair valued based on market observable inputs and these investments have primarily been classified within Level 2.
Bonds and redeemable preferred stock – The fair values of the Company’s public fixed maturity securities are generally based on prices obtained from independent pricing services. Prices for each security are generally sourced from multiple pricing vendors, and a vendor hierarchy is maintained by asset type based on historical pricing experience and vendor expertise. The Company ultimately uses the price from the pricing service highest in the vendor hierarchy based on the respective asset type. The pricing hierarchy is updated for new financial products and recent pricing experience with various vendors. Consistent with the fair value hierarchy described above, securities with validated quotes from pricing services are generally reflected within Level 2, as they are primarily based on observable pricing for similar assets and/or other market observable inputs. Typical inputs used by these pricing services include but are not limited to reported trades, benchmark yields, issuer spreads, bids, offers, and/or estimated cash flow, market activity or other inputs observable in the market. The Company may challenge the price through a formal process with the pricing service or classify the securities as Level 3. If the pricing service updates the price to be more consistent with the presented market observations, the security remains within Level 2.
58
LINCOLN BENEFIT LIFE COMPANY
NOTES TO STATUTORY STATEMENTS
DECEMBER 31, 2019
Indicative broker quotes are also used to determine fair value in circumstances where vendor pricing is not available, or where the Company ultimately concludes that pricing information received from independent pricing services is not reflective of market activity. If the Company concludes the values from both pricing services and brokers are not reflective of market activity, pricing overrides may be used. Internally developed valuations and indicative broker quotes are generally included in Level 3 in the fair value hierarchy.
The fair value of private fixed maturities and redeemable preferred stock, which are comprised of investments in private placement securities are primarily determined using discounted cash flow models. These models primarily use observable inputs that include Treasury or similar base rates plus estimated credit spreads to value each security. The credit spreads are obtained through a survey of private market intermediaries who are active in both primary and secondary transactions, and consider, among other factors, the credit quality and industry sector of the issuer and the reduced liquidity associated with private placements. Since most private placements are valued using standard market observable inputs and inputs derived from, or corroborated by, market observable data including observed prices and spreads for similar publicly traded or privately traded issues, they have been reflected within Level 2. For certain private fixed maturities, the discounted cash flow model may incorporate significant unobservable inputs, which reflect the Company’s own assumptions about the inputs that market participants would use in pricing the asset. To the extent management determines that such unobservable inputs are significant to the price of a security, a Level 3 classification is made. No private placement securities were classified as Level 3 as of December 31, 2019 and 2018.
Common stocks –The Company’s investment in FHLB stock and the limited partnership are not practicable to measure fair value due to the redemption provisions. Therefore, carrying value approximates fair value.
Mortgage loans – The fair value of most commercial mortgage loans is based upon the present value of the expected future cash flows discounted at the appropriate U.S. Treasury rate plus an appropriate credit spread for similar quality loans.
Derivatives – The estimated fair value of derivatives is determined through the use of quoted market prices for exchange-traded derivatives.
Other invested assets –The Company’s other invested assets consist of investments in surplus notes. Investments in surplus notes are 144A institutionally traded private placements. Pricing is readily available from multiple pricing sources and therefore these are reflected in Level 2.
Contract loans – The fair value of contract loans was determined by discounting expected cash flows at the current loan coupon rate. As a result, the carrying value of the contract loans approximates the fair value.
Separate Accounts – Separate account assets and liabilities consist principally of investments in mutual fund shares. The fair values are based on quoted market prices in active markets for identical assets and are classified within Level 1 in the fair value hierarchy.
Deposit Liabilities –Only the portion of deposit liabilities with defined or contractual maturities are reflected in the table above. The fair value is based upon the present value of the expected future cash flows.
| 13. | FEDERAL INCOME TAXES |
The Company and Lancaster Re file a consolidated life insurance federal income tax return. The method of allocation among the companies is subject to a written agreement approved by the NE DOI and the Board of Directors (the “Tax Allocation Agreement”). The Company and Lancaster Re determine their respective
59
LINCOLN BENEFIT LIFE COMPANY
NOTES TO STATUTORY STATEMENTS
DECEMBER 31, 2019
income tax expense or benefit and related liability or recoverable as if they each filed separate company tax returns. Neither the Company nor Lancaster Re is required to make any payments with respect to the utilization of any losses or other tax attributes that reduce the overall consolidated tax liability until such time the member with such losses or tax attributes could have otherwise used its losses or tax attributes on a separate company basis. In this regard, any benefit of filing a consolidated tax return as compared to the sum of the tax liabilities computed on a separate entity basis shall reside at the Company until such time as payment is required under the Tax Allocation Agreement. The Company is also responsible for preparing the group’s tax returns and controlling tax audits. Intercompany tax balances are settled on a quarterly basis and a final true up is made after the filing of the federal income tax return, as prescribed by the terms of the Tax Allocation Agreement.
The Company does not believe it has any uncertain tax positions for its federal income tax return that would be material to its financial condition, results of income, or cash flows. Therefore, the Company did not record a liability for unrecognized tax contingencies/benefits at December 31, 2019 or 2018. As of December 31, 2019, there were no uncertain tax positions for which management believes it is reasonably possible that the total amounts of tax contingencies will significantly increase within 12 months of the reporting date. No amounts have been accrued for interest or penalties.
The application of SSAP No. 101 requires a company to evaluate the recoverability of DTAs and to establish a valuation allowance if necessary to reduce the DTAs to an amount which is more likely than not to be realized. Considerable judgment is required in determining whether a valuation allowance is necessary, and if so, the amount of such valuation allowance. In evaluating the need for a valuation allowance, the Company considers many factors including: (1) the nature of the DTAs and DTLs; (2) whether they are ordinary or capital; (3) the timing of their reversal; (4) taxable income in prior carryback years as well as projected taxable earnings exclusive of reversing temporary differences and carryforwards; (5) the length of time carryovers can be utilized; (6) unique tax rules that would impact the utilization of the DTAs and (7) any tax planning strategies that the Company would employ to avoid a tax benefit from expiring unused.
The components of the Company’s net DTAs and DTLs as of December 31, 2019 and 2018 were as follows:
| ($’s in thousands) | 12/31/2019 | 12/31/2018 | Change | |||||||||||||||||||||||||||||||||||
| (1) | (2) | (3) | (4) | (5) | (6) | (7) | (8) | (9) | ||||||||||||||||||||||||||||||
| Ordinary | Capital | (Col. 1 + 2) Total | Ordinary | Capital | (Col. 4 + 5) Total | (Col. 1 - 4) Ordinary | (Col. 2-5) Capital | (Col. 7 + 8) Total | ||||||||||||||||||||||||||||||
a. | Gross Deferred Tax Assets | $ | 75,931 | $ | 641 | $ | 76,572 | $ | 76,884 | $ | 723 | $ | 77,607 | $ | (953 | ) | $ | (82 | ) | $ | (1,035 | ) | ||||||||||||||||
b. | Statutory Valuation Allowance Adjustment | — | — | — | — | — | — | — | — | — | ||||||||||||||||||||||||||||
c. | Adjusted Gross Deferred Tax Assets (a - b) | 75,931 | 641 | 76,572 | 76,884 | 723 | 77,607 | (953 | ) | (82 | ) | (1,035 | ) | |||||||||||||||||||||||||
d. | Deferred Tax Assets Nonadmitted | 34,088 | — | 34,088 | 40,336 | — | 40,336 | (6,248 | ) | — | (6,248 | ) | ||||||||||||||||||||||||||
|
|
|
|
|
|
|
|
|
|
|
|
|
|
|
|
|
| |||||||||||||||||||||
e. | Subtotal Net Admitted Deferred Tax Asset (c - d) | 41,843 | 641 | 42,484 | 36,548 | 723 | 37,271 | 5,295 | (82 | ) | 5,213 | |||||||||||||||||||||||||||
f. | Deferred Tax Liabilities | (14,813 | ) | (641 | ) | (15,454 | ) | (9,963 | ) | (723 | ) | (10,686 | ) | (4,850 | ) | 82 | (4,768 | ) | ||||||||||||||||||||
|
|
|
|
|
|
|
|
|
|
|
|
|
|
|
|
|
| |||||||||||||||||||||
g. | Net Admitted Deferred Tax Asset/(Net Deferred Tax Liability) (e - f) | $ | 27,030 | $ | — | $ | 27,030 | $ | 26,585 | $ | — | $ | 26,585 | $ | 445 | $ | — | $ | 445 | |||||||||||||||||||
|
|
|
|
|
|
|
|
|
|
|
|
|
|
|
|
|
| |||||||||||||||||||||
60
LINCOLN BENEFIT LIFE COMPANY
NOTES TO STATUTORY STATEMENTS
DECEMBER 31, 2019
The component amounts of the Company’s net admitted DTAs by tax character as of December 31, 2019 and 2018 were as follows:
| ($’s in thousands) | December 31, 2019 | December 31, 2018 | Change | |||||||||||||||||||||||||||||||||||
| (1) | (2) | (3) | (4) | (5) | (6) | (7) | (8) | (9) | ||||||||||||||||||||||||||||||
| Ordinary | Capital | (Col. 1 + 2) Total | Ordinary | Capital | (Col. 4 + 5) Total | (Col. 1 - 4) Ordinary | (Col. 2-5) Capital | (Col. 7 + 8) Total | ||||||||||||||||||||||||||||||
| Admission Calculation Components SSAP No. 101 | ||||||||||||||||||||||||||||||||||||||
a. | Federal Income Taxes Paid in Prior Years Recoverable Through Loss Carrybacks | $ | — | $ | — | $ | — | $ | — | $ | — | $ | — | $ | — | $ | — | $ | — | |||||||||||||||||||
b. | Adjusted Gross Tax Assets Expected to Be Realized (Excluding the Amount of Deferred Tax Assets from a) above) After Application of the Threshold Limitation. (The Lesser of (b)1 and (b)2 Below) | 27,030 | — | 27,030 | 26,585 | — | 26,585 | 445 | — | 445 | ||||||||||||||||||||||||||||
| 1. Adjusted Gross Deferred Tax Assets Expected To Be Realized Following the Balance Sheet Date | 27,030 | — | 27,030 | 26,585 | — | 26,585 | 445 | — | 445 | |||||||||||||||||||||||||||||
| 2. Adjusted Gross Deferred Tax Assets Allowed per Limitation Threshold | xxx | xxx | 48,837 | xxx | xxx | 53,002 | xxx | xxx | (4,165 | ) | ||||||||||||||||||||||||||||
c. | Adjusted Gross Deferred Tax Assets (Excluding the Amount of Deferred Tax Assets from a) and b) above) Offset by Gross Deferred Tax Liabilities | 14,813 | 641 | 15,454 | 9,963 | 723 | 10,686 | 4,850 | (82 | ) | 4,768 | |||||||||||||||||||||||||||
|
|
|
|
|
|
|
|
|
|
|
|
|
|
|
|
|
| |||||||||||||||||||||
d | Total Admitted under 11a) through 11c) | $ | 41,843 | $ | 641 | $ | 42,484 | $ | 36,548 | $ | 723 | $ | 37,271 | $ | 5,295 | $ | (82 | ) | $ | 5,213 | ||||||||||||||||||
|
|
|
|
|
|
|
|
|
|
|
|
|
|
|
|
|
| |||||||||||||||||||||
The recovery period and threshold limitation information as of December 31, 2019 and December 31, 2018 were as follows:
| ($’s in thousands) | 2019 | 2018 | ||||||
Ratio Percentage Used to Determine Recovery Period and Threshold Amount Limitation | 689.5 | % | 627.9 | % | ||||
Amount of Adjusted Capital and Surplus Used to Determine Recovery Period and Threshold Limitation in (b)2 above. | $ | 378,449 | $ | 411,476 | ||||
The impact of tax planning strategies, as used in the Company’s SSAP No. 101 calculation, on adjusted gross and net admitted DTAs as of December 31, 2019 and 2018 were as follows:
| December 31, 2019 | December 31, 2018 | Change | ||||||||||||||||||||||
| (1) | (2) | (3) | (4) | (5) | (6) | |||||||||||||||||||
| ($’s in thousands) | Ordinary | Capital | Ordinary | Capital | (Col. 1 - 3) Ordinary | (Col. 2-4) Capital | ||||||||||||||||||
Impact of Tax Planning Strategies | ||||||||||||||||||||||||
Determination of adjusted gross deferred tax assets and net admitted deferred tax assets, by tax character as a percentage | ||||||||||||||||||||||||
1. Adjusted Gross DTAs Amount | $ | 75,931 | $ | 641 | $ | 76,884 | $ | 723 | $ | (953 | ) | $ | (82 | ) | ||||||||||
2. Percentage of Adjusted Gross DTAs by Tax Character Attributable to the Impact of Tax Planning Strategies | 0.00 | % | 0.00 | % | 0.00 | % | 0.00 | % | 0.00 | % | 0.00 | % | ||||||||||||
61
LINCOLN BENEFIT LIFE COMPANY
NOTES TO STATUTORY STATEMENTS
DECEMBER 31, 2019
| December 31, 2019 | December 31, 2018 | Change | ||||||||||||||||||||||
| (1) | (2) | (3) | (4) | (5) | (6) | |||||||||||||||||||
| ($’s in thousands) | Ordinary | Capital | Ordinary | Capital | (Col. 1 - 3) Ordinary | (Col. 2-4) Capital | ||||||||||||||||||
3. Net admitted Adjusted Gross DTAs amount | $ | 41,843 | $ | 641 | $ | 36,548 | $ | 723 | $ | 5,295 | $ | (82 | ) | |||||||||||
4. Percentage of Net Admitted Adjusted Gross DTAs by Tax Character Admitted Because of the Impact of Tax Planning Strategies | 0.00 | % | 0.00 | % | 0.00 | % | 0.00 | % | 0.00 | % | 0.00 | % | ||||||||||||
The Company did utilize tax planning strategies in the calculation of its adjusted gross DTAs and net admitted DTAs as of December 31, 2019 and 2018, but none of the tax planning strategies involved reinsurance.
The Company has an investment in Lancaster Re for which it has not recorded deferred taxes at this time. The amount of any deferred tax balance attributable to this investment has not yet been quantified. Aside from the Company’s investment in Lancaster Re, the Company has no temporary differences for which deferred taxes have not been established as of December 31, 2019 or 2018.
The Company’s significant components of income taxes incurred for the years ended December 31, 2019, 2018 and 2017 were as follows:
| ($’s in thousands) | 2019 | 2018 | 2017 | |||||||||
Current Income Tax | ||||||||||||
Federal income tax expense (benefit) from operations | $ | (31,140 | ) | $ | (4,090 | ) | $ | (8,296 | ) | |||
Federal income tax on net capital gains (losses) | 31,484 | (20,649 | ) | 15,149 | ||||||||
|
|
|
|
|
| |||||||
Federal and foreign income taxes incurred (benefit) | $ | 344 | $ | (24,739 | ) | $ | 6,853 | |||||
|
|
|
|
|
| |||||||
The Company’s significant components of the Company’s DTAs and DTLs as of December 31, 2019 and 2018 were as follows:
| ($’s in thousands) | December 31, 2019 | December 31, 2018 | Change | |||||||||
Deferred Tax Assets: | ||||||||||||
Ordinary: | ||||||||||||
Policyholder reserves | $ | 6,880 | $ | 11,629 | $ | (4,749) | ||||||
Investments | — | — | — | |||||||||
Deferred acquisition costs | 66,841 | 64,394 | 2,447 | |||||||||
Receivables — nonadmitted | 809 | 183 | 626 | |||||||||
Other (including items <5% of total ordinary tax assets) | 1,401 | 678 | 723 | |||||||||
|
|
|
|
|
| |||||||
Subtotal | 75,931 | 76,884 | (953) | |||||||||
Statutory valuation allowance adjustment | — | — | — | |||||||||
Nonadmitted | 34,088 | 40,336 | (6,248) | |||||||||
|
|
|
|
|
| |||||||
62
LINCOLN BENEFIT LIFE COMPANY
NOTES TO STATUTORY STATEMENTS
DECEMBER 31, 2019
| ($’s in thousands) | December 31, 2019 | December 31, 2018 | Change | |||||||||
Admitted ordinary deferred tax assets | $ | 41,843 | $ | 36,548 | $ | 5,295 | ||||||
Capital: | ||||||||||||
Investments | 641 | 723 | (82) | |||||||||
Other (unrealized gains) | — | — | — | |||||||||
|
|
|
|
|
| |||||||
Subtotal | 641 | 723 | (82) | |||||||||
Statutory valuation allowance adjustment | — | — | — | |||||||||
Nonadmitted | — | — | — | |||||||||
|
|
|
|
|
| |||||||
Admitted capital deferred tax assets | 641 | 723 | (82) | |||||||||
|
|
|
|
|
| |||||||
Admitted deferred tax assets | 42,484 | 37,271 | 5,213 | |||||||||
|
|
|
|
|
| |||||||
Deferred Tax Liabilities | ||||||||||||
Ordinary | ||||||||||||
Investments | (2,693) | (4,560) | 1,867 | |||||||||
Deferred and uncollected premium | (11,297) | (4,016) | (7,281) | |||||||||
|
|
|
|
|
| |||||||
Subtotal | (13,990) | (8,576) | (5,414) | |||||||||
Capital | ||||||||||||
Investments | (1,464) | (2,110) | 646 | |||||||||
Other (unrealized gains) | — | — | — | |||||||||
|
|
|
|
|
| |||||||
Subtotal | (1,464) | (2,110) | 646 | |||||||||
Deferred tax liabilities | (15,454) | (10,686) | (4,768) | |||||||||
|
|
|
|
|
| |||||||
Net deferred tax assets (liabilities) | $ | 27,030 | $ | 26,585 | $ | 445 | ||||||
|
|
|
|
|
| |||||||
The change in net deferred income taxes was comprised of the following:
| ($’s in thousands) | December 31, 2019 | December 31, 2018 | Change | |||||||||
Total deferred tax assets | $ | 76,572 | $ | 77,607 | $ | (1,035 | ) | |||||
Total deferred tax liabilities | (15,454 | ) | (10,686 | ) | (4,768 | ) | ||||||
|
|
|
|
|
| |||||||
Net deferred tax asset (liability) | $ | 61,118 | $ | 66,921 | (5,803 | ) | ||||||
|
|
|
| |||||||||
Tax effect of unrealized gains (losses) | — | |||||||||||
|
| |||||||||||
Change in net deferred income tax | $ | (5,803 | ) | |||||||||
Tax effect of nonadmitted assets | (625 | ) | ||||||||||
|
| |||||||||||
Change in net deferred income tax per rate reconciliation | $ | (6,428 | ) | |||||||||
|
| |||||||||||
63
LINCOLN BENEFIT LIFE COMPANY
NOTES TO STATUTORY STATEMENTS
DECEMBER 31, 2019
The provision for federal income taxes incurred is different from that which would be obtained by applying the statutory federal income tax rate of 21%, 21% and 35% to income before income taxes for 2019, 2018 and 2017, respectively. The significant items causing this difference for the years ended December 31, 2019, 2018 and 2017 were as follows:
| December 31, 2019 | December 31, 2018 | December 31, 2017 | ||||||||||||||||||||||
| ($’s in thousands) | Amount | Effective Tax Rate | Amount | Effective Tax Rate | Amount | Effective Tax Rate | ||||||||||||||||||
Provision computed at statutory rate | $ | 7,244 | 21.00 | % | $ | 2,307 | 21.00 | % | $ | 24,972 | 35.00 | % | ||||||||||||
IMR amortization | (6,083 | ) | -17.64 | % | (8,454 | ) | -76.97 | % | (18,787 | ) | -26.33 | % | ||||||||||||
Transfer of IMR | 21,630 | 62.71 | % | (7,572 | ) | -68.94 | % | 4,210 | 5.90 | % | ||||||||||||||
IMR ceded | (6,988 | ) | -20.26 | % | —�� | 0.00 | % | — | 0.00 | % | ||||||||||||||
Amortization of initial ceding commission | (3,374 | ) | -9.78 | % | (3,368 | ) | -30.67 | % | (5,523 | ) | -7.74 | % | ||||||||||||
Adjustment for tax allocation agreement | (7,919 | ) | -22.96 | % | (9,359 | ) | -85.21 | % | (15,558 | ) | -21.81 | % | ||||||||||||
Tax rate change | 343 | 1.00 | % | (8,917 | ) | -81.18 | % | 36,005 | 50.46 | % | ||||||||||||||
Change in DTA on nonadmitted assets | — | 0.00 | % | — | 0.00 | % | (2,626 | ) | -3.68 | % | ||||||||||||||
Other | 1,919 | 5.56 | % | (3,904 | ) | -35.55 | % | (2,214 | ) | -3.10 | % | |||||||||||||
|
|
|
|
|
|
|
|
|
|
|
| |||||||||||||
Total | $ | 6,772 | 19.63 | % | $ | (39,267 | ) | -357.52 | % | $ | 20,479 | 28.70 | % | |||||||||||
|
|
|
|
|
|
|
|
|
|
|
| |||||||||||||
Current income taxes incurred | 344 | (24,739 | ) | 6,853 | ||||||||||||||||||||
Change in net deferred income taxes | 6,428 | (14,528 | ) | 13,626 | ||||||||||||||||||||
|
|
|
|
|
| |||||||||||||||||||
Total statutory income taxes | $ | 6,772 | $ | (39,267 | ) | $ | 20,479 | |||||||||||||||||
|
|
|
|
|
| |||||||||||||||||||
For both years ended December 31, 2019 and 2018, the Company had no tax credit carryforwards and no net operating loss or capital loss carryforwards. The Company had approximately $6.5 million of income taxes paid in prior years available for recoupment in the event of future net capital losses at December 31, 2019. The Company did not have deposits admitted under Section 6603 of the Internal Revenue Code as of December 31, 2019. There was no repatriation transition tax owed under the Tax Cuts and Jobs Act as of December 31, 2019 or 2018. There was no alternative minimum tax credit as of December 31, 2019 or 2018.
| 14. | CAPITAL AND SURPLUS AND DIVIDEND RESTRICTIONS |
The Company had 30,000 common shares authorized and 25,000 shares issued and outstanding at December 31, 2019 and 2018. All shares had a par value of $100 per share.
The Company’s ability to pay dividends is subject to certain statutory restrictions. The State of Nebraska has enacted laws governing the payment of dividends to stockholders by domestic insurers. Pursuant to state statues, the maximum amount of dividends and other distributions that a domestic insurer may pay in any twelve-month period without the prior approval of the Nebraska Director of Insurance (the “NE DOI Director”) is limited to the greater of: (i) 10% of its statutory surplus as of the preceding December 31; or (ii) the Company’s statutory net gain from operations for the preceding calendar year. Prior approval of the NE DOI Director was required for the Company for any dividend or distribution before April 1, 2019. See Note 2 for more information related to the payment of dividends.
64
LINCOLN BENEFIT LIFE COMPANY
NOTES TO STATUTORY STATEMENTS
DECEMBER 31, 2019
| 15. | RISK-BASED CAPITAL |
Life and health insurance companies are subject to certain Risk-based Capital (“RBC”) requirements as specified by the NAIC. The RBC requirements provide a method for measuring the minimum acceptable amount of adjusted capital that a life insurer should have, as determined under NAIC SAP taking into account the risk characteristics of its investments and products. The Company has met the minimum RBC requirements at December 31, 2019.
| 16. | COMMITMENTS AND CONTINGENT LIABILITIES |
Regulation and Compliance
The Company is subject to changing social, economic and regulatory conditions. From time to time, regulatory authorities or legislative bodies seek to impose additional regulations regarding agent and broker compensation, regulate the nature of and amount of investments, and otherwise expand overall regulation of insurance products and the insurance industry. The Company has established procedures and policies to facilitate compliance with laws and regulations, to foster prudent business operations, and to support financial reporting. The Company routinely reviews its practices to validate compliance with laws and regulations and with internal procedures and policies. As a result of these reviews, from time to time the Company may decide to modify some of its procedures and policies. Such modifications, and the reviews that led to them, may be accompanied by payments being made and costs being incurred. The ultimate changes and eventual effects of these actions on the Company’s business, if any, are uncertain.
The Company is currently being examined by certain states for compliance with unclaimed property laws, premium tax filings and market conduct. It is possible that these examinations may result in additional payments to states and to changes in the Company’s practices and procedures, which could impact benefit payments, operating expenses and reserves, among other consequences; however, it is not likely to have a material effect on the financial statements of the Company.
The Company is assessed amounts by the state guaranty funds to cover losses to policyholders of insolvent or rehabilitated insurance companies. Those mandatory assessments may be partially recovered through a reduction in future premium taxes in certain states. For both years ended December 31, 2019 and 2018, the Company accrued $3.8 million for guaranty fund assessments which was expected to be offset by estimated future premium tax deductions of $3.4 million for both periods. The period over which these assessments are expected to be paid varies. Premium tax offsets are realized on a straight-line basis over the period allowed by each individual state once the guaranty fund assessment has been paid. The Company did not recognize an impairment loss on the premium tax offsets in 2019, 2018 or 2017. The liabilities or assets related to guaranty fund assessments arising from insolvencies of entities that wrote long-term care contracts were not material as of December 31, 2019 and 2018.
Liabilities and assets, discounted and undiscounted, related to guaranty fund assessments arising from insolvencies of entities that wrote long-term care contracts were as follows as of December 31, 2019 ($’s in thousands):
| Guaranty fund assessment | Related assets | |||||||||||||||
Name of Insolvency | Undiscounted | Discounted | Undiscounted | Discounted | ||||||||||||
American Network Insurance Company | $ | 19 | $ | 12 | $ | 18 | $ | 11 | ||||||||
Penn Treaty Network America Insurance Company | $ | 218 | $ | 122 | $ | 73 | $ | 29 | ||||||||
The discount rate applied as of December 31, 2019 was 4.25%.
65
LINCOLN BENEFIT LIFE COMPANY
NOTES TO STATUTORY STATEMENTS
DECEMBER 31, 2019
The number of jurisdictions, ranges of years used to discount and weighted average number of years of the discounting time period for payables and recoverables by insolvency in 2019 were as follows:
| Payables | Recoverables | |||||||||||||||||||||||
Name of Insolvency | Number of jurisdictions | Range of years | Weighted average number of years | Number of jurisdictions | Range of years | Weighted average number of years | ||||||||||||||||||
American Network Insurance Company | 25 | 14-59 | 50 | 22 | 14-59 | 50 | ||||||||||||||||||
Penn Treaty Network America Insurance Company | 9 | 42-55 | 53 | 7 | 42-55 | 50 | ||||||||||||||||||
Liabilities and assets, discounted and undiscounted, related to guaranty fund assessments arising from insolvencies of entities that wrote long-term care contracts were as follows as of December 31, 2018 ($’s in thousands):
| Guaranty fund assessment | Related assets | |||||||||||||||
Name of Insolvency | Undiscounted | Discounted | Undiscounted | Discounted | ||||||||||||
American Network Insurance Company | $ | 13 | $ | 9 | $ | 12 | $ | 8 | ||||||||
Penn Treaty Network America Insurance Company | $ | 93 | $ | 50 | $ | 87 | $ | 47 | ||||||||
The discount rate applied as of December 31, 2018 was 4.25%.
The number of jurisdictions, ranges of years used to discount and weighted average number of years of the discounting time period for payables and recoverables by insolvency in 2018 were as follows:
| Payables | Recoverables | |||||||||||||||||||||||
Name of Insolvency | Number of jurisdictions | Range of years | Weighted average number of years | Number of jurisdictions | Range of years | Weighted average number of years | ||||||||||||||||||
American Network Insurance Company | 25 | 22-56 | 55 | 22 | 22-56 | 55 | ||||||||||||||||||
Penn Treaty Network America Insurance Company | 10 | 52-62 | 59 | 9 | 52-62 | 59 | ||||||||||||||||||
Retained Assets
Effective April 1, 2014, the Company ceased offering Allstate Advantage Accounts (“Allstate Advantage”). Those retained asset accounts previously offered through the Allstate Advantage Account remain reinsured to ALIC. The Allstate Advantage accounts were offered to beneficiaries of certain life policies when the death benefit proceeds payable were $50,000 or greater, and for certain annuity contracts for proceeds of $10,000 or greater. The retained asset accounts are reported on a direct basis and fully reinsured. The Allstate Advantage accounts enabled beneficiaries to deposit benefit proceeds into an interest-bearing checking account in the beneficiaries’ name at the Northern Trust Company. The beneficiaries may draw upon these funds at their discretion, including an immediate withdrawal of the funds in full. During 2019, 2018 and 2017, the Allstate Advantage accounts earned interest at an average interest rate of 0.5%. These accounts are not FDIC insured.
66
LINCOLN BENEFIT LIFE COMPANY
NOTES TO STATUTORY STATEMENTS
DECEMBER 31, 2019
The Company also offers to beneficiaries of certain life policies the option to deposit proceeds into a deposit fund, which continues to credit interest in accordance with the terms of the original contract. The interest rate credited to these deposit funds ranged from 2.0% to 4.0% in 2019. The interest rate credited to these deposit funds ranged from 2.0% to 3.5% in 2018.
The Company had the following amount and number of assets retained in deposit funds as of December 31, 2019 and 2018:
| ($’s in thousands) | December 31, 2019 | December 31, 2018 | ||||||||||||||
| Number | Balance | Number | Balance | |||||||||||||
a. Up to and including 12 months | 10 | $ | 6,518 | 13 | $ | 431 | ||||||||||
b. 13 to 24 months | 8 | 649 | 10 | 943 | ||||||||||||
c. 25 to 36 months | 11 | 317 | — | — | ||||||||||||
d. 37 to 48 months | — | — | — | — | ||||||||||||
e. 49 to 60 months | — | — | — | — | ||||||||||||
f. Over 60 months | — | — | — | — | ||||||||||||
|
|
|
|
|
|
|
| |||||||||
g. Total | 29 | $ | 7,484 | 23 | $ | 1,374 | ||||||||||
|
|
|
|
|
|
|
| |||||||||
The activity in the Company’s assets retained in deposit funds for the years ended December 31, 2019, 2018 and 2017 was as follows:
| 2019 | 2018 | 2017 | ||||||||||||||||||||||
| Individual | Individual | Individual | ||||||||||||||||||||||
| ($’s in thousands) | Number | Balance | Number | Balance | Number | Balance | ||||||||||||||||||
Number/balance of retained asset accounts, beginning of year | 23 | $ | 1,374 | 19 | $ | 740 | — | $ | — | |||||||||||||||
Number/amount of retained asset accounts issued/added during the year | 10 | 7,289 | 13 | 1,152 | 19 | 943 | ||||||||||||||||||
Investment earnings credited to retained asset accounts during the year | N/A | 131 | N/A | 45 | N/A | 27 | ||||||||||||||||||
Fees and other charges assessed to retained asset accounts during the year | N/A | — | N/A | — | N/A | — | ||||||||||||||||||
Number/amount of retained asset accounts transferred to state unclaimed property funds during the year | — | — | — | — | — | — | ||||||||||||||||||
Number/amount of retained asset accounts closed/withdrawn during the year | (4 | ) | (1,310 | ) | (9 | ) | (563 | ) | — | (230 | ) | |||||||||||||
|
|
|
|
|
|
|
|
|
|
|
| |||||||||||||
Number/balance of retained asset accounts, end of year | 29 | $ | 7,484 | 23 | $ | 1,374 | 19 | $ | 740 | |||||||||||||||
|
|
|
|
|
|
|
|
|
|
|
| |||||||||||||
Leases
The Company leases office space under anon-cancellable operating lease agreement. The Company paid $0.2 million pursuant to this operating lease during each of the years ended December 31, 2019, 2018 and 2017.
67
LINCOLN BENEFIT LIFE COMPANY
NOTES TO STATUTORY STATEMENTS
DECEMBER 31, 2019
The minimum aggregate rental commitments as of December 31, 2019 and 2018 were as follows ($’s in thousands):
| December 31, 2019 | December 31, 2018 | |||||||
2019 | $ | — | $ | 230 | ||||
2020 | 218 | 218 | ||||||
2021 | 223 | 223 | ||||||
2022 | 229 | 229 | ||||||
2023 | 235 | 235 | ||||||
2024 | 241 | — | ||||||
All future years | 288 | 529 | ||||||
|
|
|
| |||||
Aggregate total | $ | 1,434 | $ | 1,664 | ||||
|
|
|
| |||||
Litigation and Other Matters
The Company is involved from time to time in judicial, regulatory and arbitration proceedings concerning matters arising in connection with the conduct of its business. Management believes, based on currently available information, that the results of such proceedings, in the aggregate, will not have a material adverse effect on the Company’s financial condition. Given the inherent difficulty of predicting the outcome of the Company’s litigation and regulatory matters, particularly in cases or proceedings in which substantial or indeterminate damages or fines are sought, the Company cannot estimate losses or ranges of losses for cases or proceedings where there is only a reasonable possibility that a loss may be incurred. However, the Company believes that at the present time there are no pending or threatened lawsuits that are reasonably likely to have a material adverse effect on the financial position or results of operations.
In the normal course of its business, the Company has entered into agreements that include indemnities in favor of third parties, such as contracts with advisors and consultants, outsourcing agreements, information technology agreements, and service agreements. The Company has also agreed to indemnify its directors, officers and employees in accordance with the Company’sby-laws. The Company believes any potential liability under these agreements is neither probable nor estimable. Therefore, the Company has not recorded any associated liability.
Pledged or Restricted Assets
The following were restricted assets (including pledged assets) as of December 31, 2019 ($’s in thousands):
| Gross (Admitted & Nonadmitted) Restricted | Current Year | |||||||||||||||||||||||||||||||||||||||||||||
| Current Year | Percentage | |||||||||||||||||||||||||||||||||||||||||||||
| 1 | 2 | 3 | 4 | 5 | 6 | 7 | 8 | 9 | 10 | 11 | ||||||||||||||||||||||||||||||||||||
Restricted | Total General Account (G/A) | G/A Supporting S/A Activity (a) | Total Separate Account (S/A) Restricted Assets | S/A Assets Supporting G/A Activity (b) | Total (1 plus 3) | Total From Prior Year | Increase / (Decrease) (5 minus 6) | Total Nonadmitted Restricted | Total Admitted Restricted (5 minus 8) | Gross (Admitted & Nonadmitted) Restricted to Total Assets (c) | Admitted Restricted to Total Admitted Assets (d) | |||||||||||||||||||||||||||||||||||
a. | Subject to contractual obligation for which liability is not shown | $ | — | $ | — | $ | — | $ | — | $ | — | $ | — | $ | — | $ | — | $ | — | 0.0 | % | 0.0 | % | |||||||||||||||||||||||
b. | Collateral held under security lending agreements | — | — | — | — | — | — | — | — | — | 0.0 | % | 0.0 | % | ||||||||||||||||||||||||||||||||
68
LINCOLN BENEFIT LIFE COMPANY
NOTES TO STATUTORY STATEMENTS
DECEMBER 31, 2019
| Gross (Admitted & Nonadmitted) Restricted | Current Year | |||||||||||||||||||||||||||||||||||||||||||||
| Current Year | Percentage | |||||||||||||||||||||||||||||||||||||||||||||
| 1 | 2 | 3 | 4 | 5 | 6 | 7 | 8 | 9 | 10 | 11 | ||||||||||||||||||||||||||||||||||||
Restricted | Total General Account (G/A) | G/A Supporting S/A Activity (a) | Total Separate Account (S/A) Restricted Assets | S/A Assets Supporting G/A Activity (b) | Total (1 plus 3) | Total From Prior Year | Increase / (Decrease) (5 minus 6) | Total Nonadmitted Restricted | Total Admitted Restricted (5 minus 8) | Gross (Admitted & Nonad mitted) Restricted to Total Assets (c) | Admitted Restricted to Total Admitted Assets (d) | |||||||||||||||||||||||||||||||||||
c. | Subject to repurchase agreements | $ | — | $ | — | $ | — | $ | — | $ | — | $ | — | $ | — | $ | — | $ | — | 0.0 | % | 0.0 | % | |||||||||||||||||||||||
d. | Subject to reverse repurchase agreement | — | — | — | — | — | — | — | — | — | 0.0 | % | 0.0 | % | ||||||||||||||||||||||||||||||||
e. | Subject to dollar repurchase agreements | — | — | — | — | — | — | — | — | — | 0.0 | % | 0.0 | % | ||||||||||||||||||||||||||||||||
f. | Subject to dollar reverse repurchase agreements | — | — | — | — | — | — | — | — | — | 0.0 | % | 0.0 | % | ||||||||||||||||||||||||||||||||
g. | Placed under option contracts | — | — | — | — | — | — | — | — | — | 0.0 | % | 0.0 | % | ||||||||||||||||||||||||||||||||
h. | Letter stock or securities restricted as to sale — excluding FHLB capital stock | — | — | — | — | — | — | — | — | — | 0.0 | % | 0.0 | % | ||||||||||||||||||||||||||||||||
i. | FHLB capital stock | 8,479 | — | — | — | 8,479 | 6,988 | 1,491 | — | 8,479 | 0.1 | % | 0.1 | % | ||||||||||||||||||||||||||||||||
j. | On deposit with states | 7,742 | — | — | — | 7,742 | 7,744 | (2 | ) | — | 7,742 | 0.1 | % | 0.1 | % | |||||||||||||||||||||||||||||||
k. | On deposit with other regulatory bodies | 590 | — | — | — | 590 | 590 | — | — | 590 | 0.0 | % | 0.0 | % | ||||||||||||||||||||||||||||||||
l. | Pledged as collateral to FHLB (including assets backing funding agreements) | 525,065 | — | — | — | 525,065 | 516,263 | 8,802 | — | 525,065 | 5.6 | % | 5.7 | % | ||||||||||||||||||||||||||||||||
m. | Pledged as collateral not captured in other categories | 300 | — | — | — | 300 | 950 | (650 | ) | — | 300 | 0.0 | % | 0.0 | % | |||||||||||||||||||||||||||||||
n. | Other restricted assets | — | — | — | — | — | — | — | — | — | 0.0 | % | 0.0 | % | ||||||||||||||||||||||||||||||||
o. | Total Restricted Assets | $ | 542,176 | $ | — | $ | — | $ | — | $ | 542,176 | $ | 532,535 | $ | 9,641 | $ | — | $ | 542,176 | 5.8 | % | 5.9 | % | |||||||||||||||||||||||
| (a) subset of column 1 | (c) Column 5 divided by Asset Page, Column 1, Line 28 | |||||
| (b) subset of column 3 | (d) Column 9 divided by Asset Page, Column 3, Line 28 |
69
LINCOLN BENEFIT LIFE COMPANY
NOTES TO STATUTORY STATEMENTS
DECEMBER 31, 2019
The following were assets pledged as collateral in other categories (contracts that share similar characteristics, such as reinsurance and derivatives, were reported in the aggregate) as of December 31, 2019 ($’s in thousands):
| Gross (Admitted and Nonadmitted) Restricted | Percentage | |||||||||||||||||||||||||||||||||||||||
Description of Assets | Current year | |||||||||||||||||||||||||||||||||||||||
| 1 | 2 | 3 | 4 | 5 | 6 | 7 | 8 | 9 | 10 | |||||||||||||||||||||||||||||||
| Total General Account (G/A) | G/A Supporting S/A Activity (a) | Total Separate Account (S/A) Restricted Assets | S/A Assets Supporting G/A Activity (b) | Total (1 plus 3) | Total From Prior Year | Increase/ (Decrease) (5 minus 6) | Total Current Year Admitted Restricted | Gross (Admitted and Nonadmitted) Restricted to Total Assets | Admitted Restricted to Total Admitted Assets | |||||||||||||||||||||||||||||||
Derivatives collateral | $ | 300 | $ | — | $ | — | $ | — | $ | 300 | $ | 950 | $ | (650 | ) | $ | 300 | 0.0 | % | 0.0 | % | |||||||||||||||||||
Total | $ | 300 | $ | — | $ | — | $ | — | $ | 300 | $ | 950 | $ | (650 | ) | $ | 300 | 0.0 | % | 0.0 | % | |||||||||||||||||||
(a) subset of column 1 |
| |||||||||||||||||||||||||||||||||||||||
(b) subset of column 3 |
| |||||||||||||||||||||||||||||||||||||||
The following were restricted assets (including pledged assets) as of December 31, 2018 ($’s in thousands):
| Gross (Admitted & Nonadmitted) Restricted | Current Year | |||||||||||||||||||||||||||||||||||||||||||||
| Current Year | Percentage | |||||||||||||||||||||||||||||||||||||||||||||
| 1 | 2 | 3 | 4 | 5 | 6 | 7 | 8 | 9 | 10 | 11 | ||||||||||||||||||||||||||||||||||||
Restricted | Total General Account (G/A) | G/A Supporting S/A Activity (a) | Total Separate Account (S/A) Restricted Assets | S/A Assets Supporting G/A Activity (b) | Total (1 plus 3) | Total From Prior Year | Increase / (Decrease) (5 minus 6) | Total Nonadmitted Restricted | Total Admitted Restricted (5 minus 8) | Gross (Admitted & Nonadmitted) Restricted to Total Assets (c) | Admitted Restricted to Total Admitted Assets (d) | |||||||||||||||||||||||||||||||||||
a. | Subject to contractual obligation for which liability is not shown | $ | — | $ | — | $ | — | $ | — | $ | — | $ | — | $ | — | $ | — | $ | — | 0.0 | % | 0.0 | % | |||||||||||||||||||||||
b. | Collateral held under security lending agreements | — | — | — | — | — | — | — | — | — | 0.0 | % | 0.0 | % | ||||||||||||||||||||||||||||||||
c. | Subject to repurchase agreements | — | — | — | — | — | — | — | — | — | 0.0 | % | 0.0 | % | ||||||||||||||||||||||||||||||||
d. | Subject to reverse repurchase agreement | — | — | — | — | — | — | — | — | — | 0.0 | % | 0.0 | % | ||||||||||||||||||||||||||||||||
e. | Subject to dollar repurchase agreements | — | — | — | — | — | — | — | — | — | 0.0 | % | 0.0 | % | ||||||||||||||||||||||||||||||||
f. | Subject to dollar reverse repurchase agreements | — | — | — | — | — | — | — | — | — | 0.0 | % | 0.0 | % | ||||||||||||||||||||||||||||||||
70
LINCOLN BENEFIT LIFE COMPANY
NOTES TO STATUTORY STATEMENTS
DECEMBER 31, 2019
| Gross (Admitted & Nonadmitted) Restricted | Current Year | |||||||||||||||||||||||||||||||||||||||||||||
| Current Year | Percentage | |||||||||||||||||||||||||||||||||||||||||||||
| 1 | 2 | 3 | 4 | 5 | 6 | 7 | 8 | 9 | 10 | 11 | ||||||||||||||||||||||||||||||||||||
Restricted | Total General Account (G/A) | G/A Supporting S/A Activity (a) | Total Separate Account (S/A) Restricted Assets | S/A Assets Supporting G/A Activity (b) | Total (1 plus 3) | Total From Prior Year | Increase / (Decrease) (5 minus 6) | Total Nonadmitted Restricted | Total Admitted Restricted (5 minus 8) | Gross (Admitted & Nonadmitted) Restricted to Total Assets (c) | Admitted Restricted to Total Admitted Assets (d) | |||||||||||||||||||||||||||||||||||
g. | Placed under option contracts | $ | — | $ | — | $ | — | $ | — | $ | — | $ | — | $ | — | $ | — | $ | — | 0.0 | % | 0.0 | % | |||||||||||||||||||||||
h. | Letter stock or securities restricted as to sale — excluding FHLB capital stock | — | — | — | — | — | — | — | — | — | 0.0 | % | 0.0 | % | ||||||||||||||||||||||||||||||||
i. | FHLB capital stock | 6,988 | — | — | — | 6,988 | 8,152 | (1,164 | ) | — | 6,988 | 0.1 | % | 0.1 | % | |||||||||||||||||||||||||||||||
j. | On deposit with states | 7,744 | — | — | — | 7,744 | 7,953 | (209 | ) | — | 7,744 | 0.1 | % | 0.1 | % | |||||||||||||||||||||||||||||||
k. | On deposit with other regulatory bodies | 590 | — | — | — | 590 | 605 | (14 | ) | — | 590 | 0.0 | % | 0.0 | % | |||||||||||||||||||||||||||||||
l. | Pledged as collateral to FHLB (including assets backing funding agreements) | 516,263 | — | — | — | 516,263 | 544,024 | (27,761 | ) | — | 516,263 | 4.8 | % | 4.9 | % | |||||||||||||||||||||||||||||||
m. | Pledged as collateral not captured in other categories | 950 | — | — | — | 950 | 250 | 700 | — | 950 | 0.0 | % | 0.0 | % | ||||||||||||||||||||||||||||||||
n. | Other restricted assets | — | — | — | — | — | — | — | — | — | 0.0 | % | 0.0 | % | ||||||||||||||||||||||||||||||||
o. | Total Restricted Assets | $ | 532,535 | $ | — | $ | — | $ | — | $ | 532,535 | $ | 560,984 | $ | (28,449 | ) | $ | — | $ | 532,535 | 5.0 | % | 5.1 | % | ||||||||||||||||||||||
| (a) subset of column 1 |
| (c) Column 5 divided by Asset Page, Column 1, Line 28 | ||||||||||||||||||||||||||||||||||||||||||||
| (b) subset of column 3 |
| (d) Column 9 divided by Asset Page, Column 3, Line 28 | ||||||||||||||||||||||||||||||||||||||||||||
71
LINCOLN BENEFIT LIFE COMPANY
NOTES TO STATUTORY STATEMENTS
DECEMBER 31, 2019
The following were assets pledged as collateral in other categories (contracts that share similar characteristics, such as reinsurance and derivatives, were reported in the aggregate) as of December 31, 2018 ($’s in thousands):
| Gross (Admitted and Nonadmitted) Restricted | Percentage | |||||||||||||||||||||||||||||||||||||||
| Current Year | ||||||||||||||||||||||||||||||||||||||||
| 1 | 2 | 3 | 4 | 5 | 6 | 7 | 8 | 9 | 10 | |||||||||||||||||||||||||||||||
Description | Total General Account (G/A) | G/A Supporting S/A Activity (a) | Total Separate Account (S/A) Restricted Assets | S/A Assets Supporting G/A Activity (b) | Total (1 plus 3) | Total From Prior Year | Increase/ (Decrease) (5 minus 6) | Total Current Year Admitted Restricted | Gross (Admitted and Nonadmitted) Restricted to Total Assets | Admitted Restricted to Total Admitted Assets | ||||||||||||||||||||||||||||||
Derivatives collateral | $ | 950 | $ | — | $ | — | $ | — | $ | 950 | $ | 250 | $ | 700 | $ | 950 | 0.0 | % | 0.0 | % | ||||||||||||||||||||
Total | $ | 950 | $ | — | $ | — | $ | — | $ | 950 | $ | 250 | $ | 700 | $ | 950 | 0.0 | % | 0.0 | % | ||||||||||||||||||||
(a) subset of column 1 |
| |||||||||||||||||||||||||||||||||||||||
(b) subset of column 3 |
| |||||||||||||||||||||||||||||||||||||||
| 17. | DIRECT PREMIUM WRITTEN/PRODUCED BY MANAGING GENERAL AGENTS/THIRD PARTY ADMINISTRATORS |
The aggregate amount of direct premiums written/produced by managing general agents (“MGA”)/third party administrators (“TPA”) was $865.3 million, $929.8 million and $978.0 million for the years ended December 31, 2019, 2018 and 2017, respectively, which exceeded 5% of the Company’s surplus for each year. All direct premiums written/produced by MGA/TPA were ceded to ALIC or other external reinsurers. Information for each MGA/TPA was as follows:
| ($’s in thousands) | 2019 | 2018 | 2017 | |||||||||||
Name of MGA/TPA | Types of Business Written | Total Direct Premiums Written/ Produced | Total Direct Premiums Written/Produced | Total Direct Premiums Written/Produced | ||||||||||
Allstate Life Insurance Company | Individual life, group life, variable life, variable annuities, group annuities | $ | 808,462 | $ | 872,588 | $ | 919,095 | |||||||
LifeCare Assurance Company | Long-term care, home health care | 56,811 | 57,217 | 58,891 | ||||||||||
|
|
|
|
|
| |||||||||
| $ | 865,273 | $ | 929,805 | $ | 977,986 | |||||||||
|
|
|
|
|
| |||||||||
| 18. | PREMIUM AND ANNUITY CONSIDERATIONS DEFERRED AND UNCOLLECTED |
Deferred and uncollected life insurance premiums and annuity considerations, net of reinsurance, at December 31, 2019 and 2018 were as follows:
| December 31, 2019 | December 31, 2018 | |||||||||||||||
| ($’s in thousands) | Gross | Net of Loading | Gross | Net of Loading | ||||||||||||
Ordinary new business | $ | 446 | $ | 359 | $ | 189 | $ | 164 | ||||||||
Ordinary renewal | 29,430 | 18,328 | (3,447 | ) | (2,261 | ) | ||||||||||
Group life | (23,298 | ) | (23,033 | ) | (1,074 | ) | (779 | ) | ||||||||
|
|
|
|
|
|
|
| |||||||||
Total | $ | 6,578 | $ | (4,346 | ) | $ | (4,332 | ) | $ | (2,876 | ) | |||||
|
|
|
|
|
|
|
| |||||||||
72
LINCOLN BENEFIT LIFE COMPANY
NOTES TO STATUTORY STATEMENTS
DECEMBER 31, 2019
| 19. | FEDERAL HOME LOAN BANK AGREEMENTS |
Through its FHLB membership, the Company has used proceeds received from the issuance of funding agreements to improve the risk profile on its universal life secondary guarantee products which are ultimately reinsured with Lancaster Re.
The amount of FHLB capital stock held as of December 31, 2019 and 2018 was as follows:
| ($’s in thousands) | December 31, 2019 | December 31, 2018 | ||||||
Membership Stock – Class A | $ | — | $ | — | ||||
Membership Stock – Class B | 10 | 10 | ||||||
Activity Stock | 8,199 | 6,978 | ||||||
Excess Stock | 270 | — | ||||||
|
|
|
| |||||
Total | $ | 8,479 | $ | 6,988 | ||||
|
|
|
| |||||
None of the Company’s membership stock held as of December 31, 2019 was eligible for redemption.
The Company reported aggregate funding agreements and deposit liabilities of $409.9 million and $349.4 million as of December 31, 2019 and 2018, respectively. These funding agreements are not subject to any prepayment obligations. The Company’s maximum aggregate borrowings from the FHLB at any time during the years ended December 31, 2019 and 2018 was $422.7 million and $407.6 million, respectively. The Company has determined that the actual or estimated maximum borrowing capacity as of December 31, 2019 and 2018 based on FHLB of Chicago regulatory and or FHLB specific borrowing limits was $3.6 billion and $3.9 billion, respectively.
The carrying value and fair value of collateral pledged as of December 31, 2019 and 2018 were as follows ($’s in thousands):
| December 31, 2019 | December 31, 2018 | |||||||
Carrying Value | $ | 525,065 | $ | 516,262 | ||||
Fair Value | 538,633 | 513,232 | ||||||
The carrying value and fair value of the maximum amounts of collateral pledged during the years ended December 31, 2019 and 2018 were as follows ($’s in thousands):
| December 31, 2019 | December 31, 2018 | |||||||
Carrying Value | $ | 575,082 | $ | 593,994 | ||||
Fair Value | 578,203 | 586,533 | ||||||
| 20. | SUBSEQUENT EVENTS |
The Company has evaluated subsequent events through March 30, 2020, the date that these financial statements were available to be issued. Effective February 2020, the Company entered into a capital maintenance agreement with Kuvare Holdings LP. Under this agreement, Kuvare Holdings LP has agreed to fund the Company to a minimum level of capital and surplus of not less than 325% of the company action level risk-based capital at the end of certain calendar quarters, up to an aggregate amount of $100 million.
*****
73
| Item 11(f). | Selected Financial Data |
| 5-YEAR SUMMARY OF SELECTED FINANCIAL DATA | ||||||||||||||||||||
| ($ in millions) | 2019 | 2018 | 2017 | 2016 | 2015 | |||||||||||||||
Operating results | ||||||||||||||||||||
Net investment income | $ | 382,333 | $ | 402,362 | $ | 431,120 | $ | 434,823 | $ | 446,385 | ||||||||||
Realized capital gains and (losses) | 21,624 | 11,224 | 9,212 | (12,647 | ) | 16,011 | ||||||||||||||
Total revenues | (1,098,131 | ) | 396,804 | 439,639 | 440,585 | 421,395 | ||||||||||||||
Net income | 34,149 | 35,723 | 64,495 | 51,530 | 74,129 | |||||||||||||||
Financial position | ||||||||||||||||||||
Cash and invested assets | $ | 7,476,052 | $ | 8,987,423 | $ | 9,601,190 | $ | 9,989,286 | $ | 10,138,819 | ||||||||||
Total admitted assets | 9,172,932 | 10,462,538 | 11,231,298 | 11,517,599 | 11,701,128 | |||||||||||||||
Reserves for policy benefits | 4,357,355 | 6,001,555 | 6,515,742 | 6,833,263 | 7,065,878 | |||||||||||||||
Separate Accounts | 1,464,556 | 1,266,912 | 1,460,380 | 1,342,220 | 1,395,141 | |||||||||||||||
Total capital stock and surplus | 352,610 | 379,930 | 425,801 | 559,535 | 555,229 | |||||||||||||||
| Item 11(h). | Management’s Discussion and Analysis of Financial Condition and Results of Operations |
OVERVIEW
The following discussion highlights significant factors influencing the financial position and results of operations of Lincoln Benefit. It should be read in conjunction with the financial statements and related notes found under Item 11(e) contained herein.
The most important factors we monitor to evaluate the financial condition and performance of our Company include:
| • | For operations: premiums, benefits paid, amounts ceded to reinsurers and return on investments including exposure to market risk, credit quality/experience, net investment income, cash flows, realized capital gains and losses, unrealized capital gains and losses, stability of long-term returns, and asset/liability duration (“asset duration”). |
| • | For financial condition: risk-based capital ratios and stress testing of overall capital position. |
APPLICATION OF CRITICAL ACCOUNTING ESTIMATES
The preparation of financial statements in conformity with accounting principles prescribed or permitted by the NE DOI requires the application of accounting policies that often involve a significant degree of judgment. Certain differences exist between NAIC SAP and U.S. GAAP, which are presumed to be material. For a summary of such differences, see Note 1 in the Notes to Statutory Statements. Management, on an ongoing basis, reviews estimates and assumptions used in the preparation of financial statements. If management determines that modifications in assumptions and estimates are appropriate given current facts and circumstances, the Company’s results of operations and financial position as reported in the Statutory Financial Statements could change significantly.
Management believes the critical accounting policies relating to the following areas are most dependent on the application of estimates, assumptions and judgments:
| • | Future policy benefits and other policyholder liabilities |
| • | Investments — Impairments and Fair Value Measurements |
| • | Income Taxes |
| • | Reserves for Contingencies |
74
Liability for Policy and Contract Reserves and Claims
Policy liabilities are established for future policy benefits on certain annuity, life, and long-term care policies. Such liabilities are established in amounts adequate to meet the estimated future obligations of policiesin-force. Changes in policy and contract reserves are recorded in Net change to policy benefit reserves and changes in policy and contract claims are recorded in Benefit payments to policyholders and beneficiaries in the Statutory Statements of Operations.
Policy reserves on annuity and supplementary contracts are calculated using the Commissioners’ Annuity Reserve Valuation Method, except variable annuities which use the Commissioners’ Annuity Reserve Valuation Method for Variable Annuities. The valuation interest assumptions follow the Standard Valuation Law and vary by the contracts’ characteristics and issue year. Policy reserves on life contracts are based on statutory mortality and valuation interest rates using the Commissioner’s Reserve Valuation Method without consideration of withdrawals. The valuation interest and mortality assumptions follow the Standard Valuation Law and vary by the contracts’ characteristics and issue year. Valuation methods provide, in the aggregate, reserves that are greater than or equal to the minimum of guaranteed policy cash values or the amount required by law. Accident and health benefit reserves are developed by actuarial methods and are determined based on published tables using specified statutory interest rates and mortality. Morbidity assumptions are based on Company experience.
Liability for deposit-type contracts represents contracts without significant mortality or morbidity risk. Payments received from sales of deposit-type contracts are recognized by providing a liability equal to the current value of the policyholders’ contracts. Interest rates credited to these contracts are based on the applicable terms of the respective contract.
Liabilities for outstanding claims and claims adjustment expenses are estimates of payments to be made on life and health insurance contracts for reported claims and claims adjustment expenses. A liability is also held for claims adjustment expenses incurred but not reported as of the balance sheet date. These liabilities are determined using case basis evaluations and statistical analyses and represent estimates of the ultimate cost of all claims incurred but not paid. These estimates are continually reviewed and adjusted as necessary with any adjustments reflected in current operations.
Policy liabilities and accruals are based on the various estimates discussed above. Although the adequacy of these amounts cannot be assured, the Company believes that policy liabilities and accruals will be sufficient to meet future obligations of policiesin-force. The amount of liabilities and accruals, however, could be revised if the estimates discussed above are revised.
Valuation of Investments, Including Derivatives, and the Recognition of Other-than-Temporary Impairments
Our investment portfolio consists of public and private debt securities, commercial mortgage and other loans, other invested assets and derivative financial instruments. Derivatives are financial instruments the values of which are derived from interest rates, financial indices or the values of securities. The derivative financial instruments we generally use are futures and options. Management believes the following accounting policies related to investments, including derivatives, are most dependent on the application of estimates and assumptions. Each of these policies is discussed further within other relevant disclosures related to the investments and derivatives, as referenced below:
| • | Valuation of investments, including derivatives; |
| • | Recognition of other-than-temporary impairments; and |
| • | Determination of the valuation allowance for losses on commercial mortgage and other loans. |
We provide fair value for our investments, including debt securities, derivatives and embedded derivatives. Embedded derivatives are carried consistently with the host instruments. For additional information regarding the
75
key estimates and assumptions surrounding the determination of fair value of debt and equity securities, as well as derivative instruments, embedded derivatives and other investments, see Note 12 in the Notes to the Statutory Statements.
For our investments held at fair value, the impact of changes in fair value is recorded as an unrealized gain or loss within surplus. For a discussion of our policies regarding other-than-temporary declines in investment value and the related methodology for recording other-than-temporary impairments of debt and equity securities, see Note 3 in the Notes to Statutory Statements.
Commercial mortgage loans (“CMLs”) are carried at amortized cost using the effective interest rate method. CMLs held by the Company are diversified by property type and geographic area throughout the U.S. CMLs are considered impaired when it is probable that the Company will not collect amounts due according to the terms of the original loan agreement. The Company assesses the impairment of loans individually for all loans in the portfolio. The Company estimates the fair value of the underlying collateral using internal valuations generally based on discounted cash flow analyses. The Company estimates an allowance for losses representing potential credit losses embedded in the CML portfolio. The estimate is based on a consistently applied analysis of the loan portfolio and takes into consideration all available information, including industry, geographical, economic and political factors.
Income Taxes
Income taxes represent the net amount of income taxes that the Company expects to pay to or receive from various taxing jurisdictions in connection with its operations. The Company provides for federal and state income taxes currently payable, as well as those deferred due to temporary differences between the financial reporting and tax bases of assets and liabilities.
Deferred tax assets and liabilities are measured at the balance sheet date using enacted tax rates expected to apply to taxable income in the years the temporary differences are expected to reverse. Deferred tax assets are limited to: (1) the amount of federal income taxes paid in prior years that can be recovered through capital loss carrybacks for existing temporary differences that reverse by the end of the subsequent calendar year; (2) the lesser of the amount of adjusted gross deferred tax assets expected to be realized within three years of the balance sheet date or 15% of capital and surplus, excluding any net deferred tax assets, electronic data equipment processing or operating software and any net positive goodwill, provided certain risk-based capital thresholds are met and (3) the amount of remaining gross deferred tax assets that can be offset against existing gross deferred tax liabilities after considering the character (i.e., ordinary vs. capital) of the deferred tax assets and liabilities. The remaining deferred tax assets are nonadmitted.
Valuation allowances are established when management determines, based on available information, that it is more likely than not that deferred tax assets will not be realized. Management considers all available evidence including past operating results, the existence of cumulative losses in the most recent years, forecasted earnings, future taxable income and prudent and feasible tax planning strategies. The Company’s accounting for income taxes represents management’s best estimate of the tax consequences of various events and transactions.
Significant management judgment is required in determining the provision for income taxes and deferred tax assets and liabilities, and in evaluating the Company’s tax positions including evaluating uncertainties under the relevant statutory guidance. The Company accounts for current and deferred income taxes and recognizes reserves for income tax contingencies in accordance with SSAP No. 101, “Income Taxes”. Under the guidance, the Company determines whether it is more likely than not that a tax position will be sustained upon examination by the appropriate taxing authorities before any part of the benefit can be recorded in the financial statements. The Company’s liability for income taxes includes the liability for unrecognized tax benefits and interest that relate to tax years still subject to review by the Internal Revenue Service or other taxing authorities. We do not anticipate any significant changes within the next 12 months to our total unrecognized tax benefits related to tax years for which the statute of limitations has not expired.
76
Reserves for Contingencies
A contingency is an existing condition that involves a degree of uncertainty that will ultimately be resolved upon the occurrence of future events. Under NAIC SAP, reserves for contingencies are required to be established when the future event is probable and its impact can be reasonably estimated, such as in connection with an unresolved legal matter. The initial reserve reflects management’s best estimate of the probable cost of ultimate resolution of the matter and is revised accordingly as facts and circumstances change and, ultimately, when the matter is resolved.
OPERATIONS
Overview and strategy. Prior to July 18, 2013, we sold interest-sensitive, traditional and variable life insurance, and fixed annuities including deferred and immediate, through independent master brokerage agencies. In July 2013, we ceased soliciting and selling new policies through our independent agent channel. In 2017, we ceased new policy issuances through the Allstate exclusive agency channel.
LBL HoldCo II, Inc. and ALIC entered into an Administration Services Agreement (“ASA”), pursuant to which ALIC continues to provide certain administrative services to the Company. In 2015, the administration of our deferred annuity and life business was outsourced to unaffiliated third-party service providers, SE2, LLC and Alliance–One Services, Inc. ALIC continues to administer business sold through the Allstate exclusive agency channel and business sold through this channel is fully reinsured with ALIC.
In April 2014, Lincoln Benefit entered into two transactions with Hannover Re. The first transaction provided financing for a portion of our statutory reserves associated with our universal life business withno-lapse guarantees and our level premium term life business. The second transaction involved a reinsurance agreement with Hannover Re, structured on a combined modified coinsurance and monthly renewable term reinsurance basis. In October of 2019, a portion of the modified coinsurance agreement was recaptured from Hannover Re (the “Hannover Recapture”).
On December 31, 2019, Lincoln Benefit entered into a coinsurance agreement with GILICO (the “GILICO Coinsurance Agreement”), resulting in the transfer of certain life and annuity contracts. The Company ceded assets of $1.1 billion and statutory reserves of $1.3 billion.
Financial Position
The Company’s total adjusted capital (“TAC”), as defined by the NAIC, decreased to $404.9 million as of December 31, 2019 from $437.6 million as of December 31, 2018.
The following table sets forth the calculation of the Company’s TAC:
| ($ in millions) | December 31, 2019 | December 31, 2018 | ||||||
Capital and surplus | $ | 352.6 | $ | 379.9 | ||||
Asset valuation reserve | 52.3 | 57.7 | ||||||
|
|
|
| |||||
Total adjusted capital | $ | 404.9 | $ | 437.6 | ||||
|
|
|
| |||||
77
The following table outlines amounts reported in the Company’s Balance Sheet as of December 31, 2019 and 2018:
| ($ in millions) | December 31, 2019 | December 31, 2018 | ||||||
Admitted Assets | ||||||||
Cash and invested assets | $ | 7,476.1 | $ | 8,987.4 | ||||
Due and accrued investment income | 75.2 | 91.0 | ||||||
Current income tax recoverable | 26.1 | 28.9 | ||||||
Net deferred tax asset | 27.0 | 26.6 | ||||||
Deferred premium and other assets, net | 103.9 | 61.7 | ||||||
Separate account assets | 1,464.6 | 1,266.9 | ||||||
|
|
|
| |||||
Total Admitted Assets | $ | 9,172.9 | $ | 10,462.5 | ||||
|
|
|
| |||||
Liabilities | ||||||||
Reserves for policy benefits | $ | 4,357.4 | $ | 6,001.6 | ||||
Reinsurance payable | 48.3 | 1.0 | ||||||
Interest maintenance reserve | 35.7 | — | ||||||
Funds held under coinsurance | 2,777.0 | 2,709.1 | ||||||
Other liabilities | 137.3 | 104.0 | ||||||
Separate account liabilities | 1,464.6 | 1,266.9 | ||||||
|
|
|
| |||||
Total Liabilities | $ | 8,820.3 | $ | 10,082.6 | ||||
|
|
|
| |||||
Shareholder’s Equity | ||||||||
Common stock | 2.5 | 2.5 | ||||||
Gross paid in and contributed surplus | 196.8 | 171.0 | ||||||
Unassigned funds | 153.3 | 206.4 | ||||||
|
|
|
| |||||
Total Capital Stock and Surplus | $ | 352.6 | $ | 379.9 | ||||
|
|
|
| |||||
Total Liabilities, Capital Stock and Surplus | $ | 9,172.9 | $ | 10,462.5 | ||||
|
|
|
| |||||
December 31, 2019 vs. December 31, 2018
Assets
Total admitted assets decreased by $1.3 billion, from $10.5 billion at December 31, 2018 to $9.2 billion at December 31, 2019. The decrease in total admitted assets primarily relates to the continued runoff of the blocks of business and the GILICO Coinsurance Agreement. Partially offsetting this decrease is an increase in separate account assets for current market appreciation.
Significant variances are as follows:
Cash and invested assets decreased by $1.5 billion from $9.0 billion at December 31, 2018 to $7.5 billion at December 31, 2019. The significant components of this balance and related decrease are described below.
The Company’s bond portfolio decreased by $1.3 billion from $7.7 billion at December 31, 2018 to $6.4 billion at December 31, 2019. The decrease reflects the continued runoff of the blocks of business and the cession of assets described above. The bond portfolio is comprised of approximately 74% publicly traded securities and approximately 26% privately placed issuances.
Mortgage loans decreased by $137.6 million from $859.4 million at December 31, 2018 to $721.8 million at December 31, 2019. The decrease is related to mortgage loans maturing, being paid down or paid off.
Contract loans decreased by $100.9 million from $134.5 million at December 31, 2018 to $33.6 million at December 31, 2019. The decrease in balances is primarily related to cessions under the GILICO Coinsurance Agreement discussed above.
78
Derivatives increased by $15.4 million from $3.0 million at December 31, 2018 to $18.4 million at December 31, 2019. These balances are comprised primarily of options that are used to economically hedge the market risk inherent in the Company’s equity-indexed products. These assets are carried at fair value with changes in fair value recognized as unrealized investment gains or losses included in unassigned surplus. The increase in these balances is primarily related to the equity market movement in 2019.
Cash and short-term investments increased by $39.6 million from $211.2 million at December 31, 2018 to $250.8 million at December 31, 2019. The amount invested in cash and short-term investments fluctuates based on liquidity needs and the timing of investment decisions. Overall, short-term investments and cash range from 1% to 3% of total invested assets. The increase in cash and short-term investments in 2019 is primarily a function of the timing of reinvestment activity.
Deferred premiums and other assets increased by $42.2 million from $61.7 million at December 31, 2018 to $103.9 million at December 31, 2019. This is mainly due to increases in reinsurance recoverables related to the timing and severity of losses received close to year end.
Separate Account assets and liabilities increased by $0.2 billion from $1.3 billion at December 31, 2018 to $1.5 billion at December 31, 2019. This increase is primarily driven by equity market appreciation in 2019.
The assets of Separate Accounts are carried at fair value for NAIC SAP. Separate Accounts liabilities represent the contractholders’ claims to the related assets and are carried at the fair value of the assets. In the event the asset values of certain contractholder accounts are projected to be below the value guaranteed by the Company, a liability is established through a charge to earnings.
Lincoln Benefit’s variable annuity business and a portion of the variable life business are reinsured by ALIC and GILICO. As of December 31, 2019 and 2018, all assets of the Separate Accounts that support the variable annuity and variable life business are legally insulated.
Liabilities
Total liabilities decreased by $1.3 billion, from $10.1 billion at December 31, 2018 to $8.8 billion at December 31, 2019. The decrease consists of the following components:
Reserves for policy benefits decreased by $1.6 billion from $6.0 billion at December 31, 2018 to $4.4 billion at December 31, 2019. Such liabilities are established to meet the estimated future obligations of policiesin-force. The decrease in Reserves for policy benefits mainly related to the continued runoff of the business and cession of reserves for the GILICO Coinsurance Agreement.
Interest maintenance reserve increased by $35.7 million from a nonadmitted asset balance at December 31, 2018 to a $35.7 million liability at December 31, 2019 primarily related to capital gains generated from the GILICO Coinsurance Agreement.
Funds held under coinsurance increased by $0.1 billion from $2.7 billion at December 31, 2018 to $2.8 billion at December 31, 2019. This item represents funds withheld in conjunction with the Company’s AXXX coinsurance funds withheld treaty with Lancaster Re. The AXXX treaty with Lancaster Re covers universal life secondary guarantee and term business. The growth in the funds withheld balance primarily related to an increase of the statutory reserve on these products. These balances are expected to continue to increase.
Other liabilitiesincreased by $33.3 million from $104.0 million at December 31, 2018 to $137.3 million at December 31, 2019. This balance principally consists of various policyholder related liabilities, other liability
79
balances related to general expenses and unsettled trades. The increase in this balance is mainly comprised of higher securities payable related to the timing of unsettled securities purchased and establishment of a liability for unauthorized reinsurance offset by a lower asset valuation reserve and lower expense and commission accruals.
Results of Operations
The following table outlines amounts reported in Net Income (Loss):
| ($ in millions) | 2019 | 2018 | 2017 | |||||||||
Gain from operations before taxes | $ | 12.5 | $ | 20.4 | $ | 47.0 | ||||||
Income tax expense (benefit) | — | (4.1 | ) | (8.3 | ) | |||||||
|
|
|
|
|
| |||||||
Net gain from operations | $ | 12.5 | $ | 24.5 | $ | 55.3 | ||||||
|
|
|
|
|
| |||||||
Net realized capital gains (losses) | 21.6 | 11.2 | 9.2 | |||||||||
|
|
|
|
|
| |||||||
Net income | $ | 34.1 | $ | 35.7 | $ | 64.5 | ||||||
|
|
|
|
|
| |||||||
Results of Operations
For the Year Ended December 31, 2019
Net income of $34.1 million is comprised of Gain from operations before taxes of $12.5 million and net realized capital gains of $21.6 million. Operating results reflect the loss on reinsurance to GILICO offset by lower operating expenses.
For the Year Ended December 31, 2018
Net income of $35.7 million is the result of the Gain from operations before taxes of $20.4 million and net realized gains of $11.2 million. In 2018, the Gain from operations decreased due to lower investment income consistent with business runoff and slightly higher reinsurance premium. This is offset by $11.2 million in realized capital gains resulting from asset-liability management initiatives.
For the Year Ended December 31, 2017
Net income of $64.5 million is primarily from the Gain from operations before taxes of $47.0 million. Improved results from prior year are primarily the result of favorable mortality.
80
The significant components of income are summarized below:
| ($ in millions) | 2019 | 2018 | 2017 | |||||||||
Revenue | ||||||||||||
Premiums | $ | (913.4 | ) | $ | 80.1 | $ | 111.0 | |||||
Net investment income | 382.3 | 402.4 | 431.1 | |||||||||
Reserve adjustments on reinsurance ceded | (686.2 | ) | (174.9 | ) | (196.9 | ) | ||||||
Other income | 119.2 | 89.2 | 94.4 | |||||||||
|
|
|
|
|
| |||||||
Total revenue | $ | (1,098.1 | ) | $ | 396.8 | $ | 439.6 | |||||
|
|
|
|
|
| |||||||
Benefits and expenses | ||||||||||||
Benefit payments to policyholders and beneficiaries | $ | 389.7 | $ | 702.6 | $ | 722.8 | ||||||
Net change to policy benefit reserves | (1,707.8 | ) | (484.6 | ) | (488.9 | ) | ||||||
Net transfers from separate accounts | (63.2 | ) | (60.3 | ) | (70.3 | ) | ||||||
Commissions and operating expenses | 270.7 | 218.7 | 229.0 | |||||||||
|
|
|
|
|
| |||||||
Total benefits and expenses | $ | (1,110.6 | ) | $ | 376.4 | $ | 392.6 | |||||
|
|
|
|
|
| |||||||
Gain from operations before taxes | $ | 12.5 | $ | 20.4 | $ | 47.0 | ||||||
|
|
|
|
|
| |||||||
Premiumsare $(913.4) million, $80.1 million and $111.0 million for the years ended December 31, 2019, 2018 and 2017, respectively. Premiums are net of reinsurance premiums paid on the ceded business. The decrease in premiums in 2019 mainly related to lower direct annuity premiums and higher premiums ceded under the GILICO Coinsurance Agreement offset by premiums from the Hannover Recapture. The decrease in premiums in 2018 is primarily related to lower life and annuity premiums and slightly higher reinsurance premiums.
Net investment incomeis $382.3 million, $402.4 million and $431.1 million for the years ended December 31, 2019, 2018 and 2017, respectively. Net investment income is attributable to the following asset types:
| ($ in millions) | 2019 | 2018 | 2017 | |||||||||
Debt securities | $ | 322.1 | $ | 329.7 | $ | 344.9 | ||||||
Mortgage loans | 37.2 | 41.3 | 48.8 | |||||||||
Other invested assets | 18.2 | 19.3 | 15.0 | |||||||||
|
|
|
|
|
| |||||||
Gross investment income | 377.5 | 390.3 | 408.7 | |||||||||
Investment expenses | 24.2 | 28.2 | 31.3 | |||||||||
|
|
|
|
|
| |||||||
Net investment income before IMR amortization | 353.3 | 362.1 | 377.4 | |||||||||
IMR amortization | 29.0 | 40.3 | 53.7 | |||||||||
|
|
|
|
|
| |||||||
Total net investment income | $ | 382.3 | $ | 402.4 | $ | 431.1 | ||||||
|
|
|
|
|
| |||||||
Overall, net investment income in 2019 is lower compared to 2018 and 2017. The main driver of this is lower average asset balances resulting from the continued runoff of the business. The decline in IMR amortization is also in line with expectations related to the runoff of the business.
Reserve adjustments on reinsurance ceded are $(686.2) million, $(174.9) million and $(196.9) million for the years ended December 31, 2019, 2018 and 2017. Reserve adjustments on reinsurance ceded include reserve changes related to the Company’s modified coinsurance agreements on its life and annuity business. The significant decrease in reserve adjustments on reinsurance ceded in 2019 is as a result of the Hannover Recapture. Reserve adjustments on reinsurance ceded decreased in 2018 primarily related to slowdown in the runoff of the variable annuity business and deferred annuity products.
Benefit payments to policyholders and beneficiaries are $389.7 million, $702.6 million and $722.8 million for the years ended December 31, 2019, 2018 and 2017, respectively. This line item represents benefit payments on
81
life insurance and annuity products. The decrease in 2019 is primarily related to the GILICO Coinsurance Agreement and lower surrenders on life and annuity business partially offset by higher claims from unfavorable mortality. Benefit payments to policyholders and beneficiaries decreased in 2018 due to a decrease in surrender and annuity benefits. Surrenders decreased primarily on market-value and equity-indexed annuities resulting from lower equity market performance.
Net changes to policy benefit reserves are $(1,707.8) million, $(484.6) million and $(488.9) million for the years ended December 31, 2019, 2018 and 2017, respectively. The decrease in 2019 is primarily the result of higher ceded reserves as result of the GILICO Coinsurance Agreement and lower annuity reserves.
Commissions and operating expenses are $270.7 million, $218.7 million and $229.0 million for the years ended December 31, 2019, 2018 and 2017, respectively. These expenses are comprised of general operating expenses, premium taxes and investment income ceded on reinsurance. The increase in 2019 is related to higher investment income ceded under the GILICO Coinsurance Agreement offset by lower commissions and operating expenses. The decline in 2018 is primarily as a result of lower direct life and annuity premiums and the continued runoff of the business while operating expenses decreased primarily as a function of lower third-party administrative expenses as well as lower compensation costs.
Realized investment gains (losses) are $21.6 million, $11.2 million and $9.2 million for the years ended December 31, 2019, 2018 and 2017, respectively. The net realized gains in 2019 are primarily related to capital gains generated from the GILICO Coinsurance Agreement and derivative gains offset by lower capital gains tax and credit related capital losses. The net realized gains in 2018 are related to asset-liability management initiatives to improve yields and better match assets and liabilities. The net realized gains in 2017 are primarily derivative related.
General Account Investment Portfolio
The General Account Investment Assets (“GAIA”) portfolio consists of a well-diversified portfolio of public and private debt securities, commercial mortgages and other loans and other invested assets. The General Account portfolios and investment results primarily support the insurance liabilities of Lincoln Benefit’s business operations. The following table reconciles the balance sheet asset amounts to GAIA:
| December 31, 2019 | December 31, 2018 | |||||||
| ($ in millions) | ||||||||
Bonds | $ | 6,361.6 | $ | 7,709.6 | ||||
Preferred stocks | 14.8 | 14.8 | ||||||
Common stocks | 8.5 | 7.0 | ||||||
Mortgage loans | 721.8 | 859.4 | ||||||
Contract loans | 33.6 | 134.5 | ||||||
Other investments | 84.9 | 50.4 | ||||||
Receivables for securities | 0.1 | 0.5 | ||||||
Cash and short-term investments | 250.8 | 211.2 | ||||||
|
|
|
| |||||
Total Cash and Invested Assets | $ | 7,476.1 | $ | 8,987.4 | ||||
|
|
|
| |||||
Assets listed in Other investments principally consist of surplus notes, a limited partnership and derivatives.
82
Investment Results of General Account Investment Assets
The following table summarizes investment results by asset category for the years ended December 31, 2019, 2018 and 2017:
| 2019 | 2018 | 2017 | ||||||||||||||||||||||
| ($ in millions) | Amount | Yield | Amount | Yield | Amount | Yield | ||||||||||||||||||
Debt securities | $ | 322.1 | 4.58 | % | $ | 329.7 | 4.17 | % | $ | 344.9 | 4.22 | % | ||||||||||||
Mortgage loans | 37.2 | 4.71 | % | 41.3 | 4.32 | % | 48.8 | 3.86 | % | |||||||||||||||
Cash, cash equivalents and short-terms | 4.0 | 1.75 | % | 3.9 | 1.91 | % | 1.7 | 1.12 | % | |||||||||||||||
Other invested assets | 14.2 | (a) | 15.4 | (a) | 13.3 | (a) | ||||||||||||||||||
|
|
|
|
|
|
|
|
|
|
|
| |||||||||||||
Gross investment income | $ | 377.5 | $ | 390.3 | $ | 408.7 | ||||||||||||||||||
|
|
|
|
|
| |||||||||||||||||||
Investment expenses | 24.2 | 28.2 | 31.3 | |||||||||||||||||||||
|
|
|
|
|
| |||||||||||||||||||
Net investment income before IMR amortization | $ | 353.3 | $ | 362.1 | $ | 377.4 | ||||||||||||||||||
|
|
|
|
|
| |||||||||||||||||||
| (a) | Primarily FHLB note interest and contract loans |
Debt Securities
The bond portfolio consists largely of investment grade corporate debt securities and includes significant amounts of U.S. government and agency obligations. More detail around the composition of debt securities as of December 31, 2019 and 2018 for GAIA is as shown below.
Debt Securities by Industry
The General Account debt securities portfolios include publicly-traded and privately-placed corporate debt securities across an array of industry categories. The following tables set forth these debt securities by industry category as of December 31, 2019 and 2018 along with their associated gross unrealized gains and losses:
| Amortized Cost | Gross Unrealized Gains | Gross Unrealized Losses | ||||||||||||||
December 31, 2019 ($ in millions) | ||||||||||||||||
| Fair Value | ||||||||||||||||
U.S. governments | $ | 38.2 | $ | 0.4 | $ | — | $ | 38.6 | ||||||||
All other governments | 5.7 | 0.1 | (0.6 | ) | 5.2 | |||||||||||
U.S. states, territories and possessions | 15.4 | 2.2 | — | 17.6 | ||||||||||||
U.S. political subdivisions | 64.5 | 2.8 | (0.1 | ) | 67.2 | |||||||||||
Special revenue | 556.8 | 56.5 | (0.3 | ) | 613.0 | |||||||||||
Industrial and miscellaneous | ||||||||||||||||
Basic materials | 217.5 | 18.8 | (0.8 | ) | 235.5 | |||||||||||
Communications | 470.6 | 52.0 | — | 522.6 | ||||||||||||
Consumer, cyclical | 338.9 | 20.3 | (1.6 | ) | 357.6 | |||||||||||
Consumer,non-cyclical | 479.4 | 37.0 | (1.1 | ) | 515.3 | |||||||||||
Diversified | 1.0 | — | — | 1.0 | ||||||||||||
Energy | 550.4 | 44.1 | (3.6 | ) | 590.9 | |||||||||||
Financial | 1,093.6 | 105.1 | (2.9 | ) | 1,195.8 | |||||||||||
Industrial | 389.4 | 24.3 | (1.8 | ) | 411.9 | |||||||||||
Technology | 238.7 | 33.4 | (0.2 | ) | 271.9 | |||||||||||
Utilities | 681.4 | 54.6 | (0.1 | ) | 735.9 | |||||||||||
Hybrids | 101.9 | 7.3 | (0.4 | ) | 108.8 | |||||||||||
ABS | 506.9 | 8.1 | (0.7 | ) | 514.3 | |||||||||||
CMBS | 261.3 | 10.2 | (1.0 | ) | 270.5 | |||||||||||
RMBS | 350.0 | 17.1 | (0.9 | ) | 366.2 | |||||||||||
|
|
|
|
|
|
|
| |||||||||
Total debt securities | $ | 6,361.6 | $ | 494.3 | $ | (16.1 | ) | $ | 6,839.8 | |||||||
|
|
|
|
|
|
|
| |||||||||
83
| Amortized Cost | Gross Unrealized Gains | Gross Unrealized Losses | ||||||||||||||
December 31, 2018 ($ in millions) | ||||||||||||||||
| Fair Value | ||||||||||||||||
U.S. governments | $ | 91.2 | $ | 0.2 | $ | (0.1 | ) | $ | 91.3 | |||||||
All other governments | 13.6 | — | (2.5 | ) | 11.1 | |||||||||||
U.S. states, territories and possessions | 15.6 | — | — | 15.6 | ||||||||||||
U.S. political subdivisions | 92.4 | 1.2 | (2.5 | ) | 91.1 | |||||||||||
Special revenue | 647.8 | 20.9 | (4.2 | ) | 664.5 | |||||||||||
Industrial and miscellaneous | ||||||||||||||||
Basic materials | 249.0 | 1.9 | (18.3 | ) | 232.6 | |||||||||||
Communications | 631.3 | 2.6 | (39.2 | ) | 594.7 | |||||||||||
Consumer, cyclical | 401.9 | 0.9 | (27.4 | ) | 375.4 | |||||||||||
Consumer,non-cyclical | 695.3 | 3.9 | (48.2 | ) | 651.0 | |||||||||||
Diversified | 1.0 | — | — | 1.0 | ||||||||||||
Energy | 715.1 | 1.7 | (44.7 | ) | 672.1 | |||||||||||
Financial | 1,416.1 | 2.7 | (65.5 | ) | 1,353.3 | |||||||||||
Industrial | 452.5 | 1.6 | (35.2 | ) | 418.9 | |||||||||||
Technology | 303.8 | 2.1 | (11.6 | ) | 294.3 | |||||||||||
Utilities | 678.0 | 2.6 | (26.9 | ) | 653.7 | |||||||||||
Hybrids | 120.8 | 0.9 | (5.7 | ) | 116.0 | |||||||||||
ABS | 410.5 | 0.3 | (14.1 | ) | 396.7 | |||||||||||
CMBS | 309.2 | 1.6 | (7.9 | ) | 302.9 | |||||||||||
RMBS | 464.5 | 15.8 | (13.5 | ) | 466.8 | |||||||||||
|
|
|
|
|
|
|
| |||||||||
Total debt securities | $ | 7,709.6 | $ | 60.9 | $ | (367.5 | ) | $ | 7,403.0 | |||||||
|
|
|
|
|
|
|
| |||||||||
Gross unrealized gains increased by $433.4 million from $60.9 million at December 31, 2018 to $494.3 million at December 31, 2019. The increase in unrealized gains is primarily due to a decrease in interest rates. The10-year treasury yield curve rates at December 31, 2019 and 2018 are 1.92% and 2.69%, respectively. There is also a decrease in gross unrealized losses of $351.4 million, for a net change in net unrealized gains of $784.8 million.
Debt Securities by Credit Quality
The Securities Valuation Office (“SVO”) of the NAIC has established credit ratings related to investments of insurers for regulatory reporting purposes and assigns debt securities to one of six categories (“NAIC Designations”) based on the equivalent ratings of an approved rating agency. NAIC Designations of “1” or “2” relate to debt securities considered investment grade, which include securities rated Baa3 or higher by Moody’s orBBB- or higher by Standard & Poor’s. NAIC Designations of “3” through “6” are referred to as below investment grade, which include securities rated Ba1 or lower by Moody’s and BB+ or lower by Standard & Poor’s. As a result of time lags between the funding of investments, the finalization of legal documents and the completion of the SVO filing process, the bond portfolio generally includes securities that have not yet been rated by the SVO as of each balance sheet date. Pending receipt of SVO ratings, the categorization of these securities by NAIC designation is based on the expected ratings indicated by internal analysis.
84
The following table sets forth the General Accounts’ debt securities by NAIC rating at the dates indicated:
December 31, 2019 ($ in millions) | Amortized Cost | Gross Unrealized Gains | Gross Unrealized Losses | Fair Value | ||||||||||||||
NAIC Rating | ||||||||||||||||||
1 | Aaa, Aa, A | $ | 2,520.8 | $ | 259.4 | $ | (0.5) | $ | 2,779.7 | |||||||||
2 | Baa | 2,637.5 | 197.9 | (8.5) | 2,826.9 | |||||||||||||
|
|
|
|
|
|
|
| |||||||||||
Investment grade | $ | 5,158.3 | $ | 457.3 | $ | (9.0) | $ | 5,606.6 | ||||||||||
3 | Ba | 85.1 | 1.6 | (4.5) | 82.2 | |||||||||||||
4 | B | — | — | — | — | |||||||||||||
5 | C and lower | — | — | — | — | |||||||||||||
6 | In or near default | — | — | — | — | |||||||||||||
|
|
|
|
|
|
|
| |||||||||||
Below investment grade | $ | 85.1 | $ | 1.6 | $ | (4.5) | $ | 82.2 | ||||||||||
|
|
|
|
|
|
|
| |||||||||||
Total before asset and mortgage-backed securities | $ | 5,243.4 | $ | 458.9 | $ | (13.5) | $ | 5,688.8 | ||||||||||
Asset and mortgage-backed securities | 1,118.2 | 35.4 | (2.6) | 1,151.0 | ||||||||||||||
|
|
|
|
|
|
|
| |||||||||||
Total fixed maturities | $ | 6,361.6 | $ | 494.3 | $ | (16.1) | $ | 6,839.8 | ||||||||||
|
|
|
|
|
|
|
| |||||||||||
December 31, 2018 ($ in millions) | Amortized Cost | Gross Unrealized Gains | Gross Unrealized Losses | Fair Value | ||||||||||||||
NAIC Rating | ||||||||||||||||||
1 | Aaa, Aa, A | $ | 3,282.5 | $ | 32.7 | $ | (111.5) | $ | 3,203.7 | |||||||||
2 | Baa | 3,131.0 | 10.4 | (196.4) | 2,945.0 | |||||||||||||
|
|
|
|
|
|
|
| |||||||||||
Investment grade | $6,413.5 | $ 43.1 | $(307.9) | $6,148.7 | ||||||||||||||
3 | Ba | 75.3 | 0.1 | (13.2) | 62.2 | |||||||||||||
4 | B | 22.3 | — | (5.2) | 17.1 | |||||||||||||
5 | C and lower | 14.3 | — | (5.7) | 8.6 | |||||||||||||
6 | In or near default | — | — | — | — | |||||||||||||
|
|
|
|
|
|
|
| |||||||||||
Below investment grade | $ | 111.9 | $ | 0.1 | $ | (24.1) | $ | 87.9 | ||||||||||
|
|
|
|
|
|
|
| |||||||||||
Total before asset and mortgage-backed securities | $ | 6,525.4 | $ | 43.2 | $ | (332.0) | $ | 6,236.6 | ||||||||||
Asset and mortgage-backed securities | 1,184.2 | 17.7 | (35.5) | 1,166.4 | ||||||||||||||
|
|
|
|
|
|
|
| |||||||||||
Total fixed maturities | $ | 7,709.6 | $ | 60.9 | $ | (367.5) | $ | 7,403.0 | ||||||||||
|
|
|
|
|
|
|
| |||||||||||
Below investment grade debt securities represented 1.3% and 1.5% of the gross unrealized losses at December 31, 2019 and 2018, respectively.
Equity Securities
Common stock of $8.5 million and $7.0 million as of December 31, 2019 and 2018, respectively, are entirely related to the ownership of FHLB stock. GAIA holds redeemable preferred stock of $14.8 million as of December 31, 2019 and 2018. GAIA also holds an investment in limited partnership on an equity method basis as of December 31, 2019 for $20.7 million.
85
Commercial Mortgage Loans
At December 31, 2019 and 2018, approximately 10% of GAIA are in commercial mortgage loans. At December 31, 2019 and 2018, the carrying value of commercial mortgage loans is $721.8 million and $859.4 million, respectively. The investment strategy for the mortgage loan portfolio emphasizes diversification by property type and geographic location with a primary focus on asset quality. The table below shows the breakdown of the amortized cost of the General Account’s investments in mortgage loans by geographic region as of December 31, 2019 and 2018:
| December 31, 2019 | December 31, 2018 | |||||||
| ($ in millions) | ||||||||
Alabama | $ | 0.6 | $ | 0.8 | ||||
Arizona | 36.0 | 36.8 | ||||||
California | 140.9 | 146.8 | ||||||
Colorado | 91.7 | 61.6 | ||||||
Florida | 24.3 | 54.6 | ||||||
Georgia | 29.6 | 20.6 | ||||||
Hawaii | 2.8 | 4.0 | ||||||
Illinois | 56.2 | 86.8 | ||||||
Iowa | 0.3 | 0.5 | ||||||
Kansas | — | 9.2 | ||||||
Massachusetts | 29.5 | 30.7 | ||||||
Minnesota | 22.6 | 23.8 | ||||||
Nevada | 9.3 | 80.9 | ||||||
New Jersey | 35.7 | 21.2 | ||||||
New York | 47.5 | 48.4 | ||||||
North Carolina | 3.8 | 33.5 | ||||||
Ohio | 12.1 | 12.3 | ||||||
Pennsylvania | 69.8 | 50.4 | ||||||
South Carolina | 24.4 | 24.8 | ||||||
Texas | 84.7 | 110.7 | ||||||
Virginia | — | 0.2 | ||||||
Wisconsin | — | 0.8 | ||||||
General allowance for loan loss | — | — | ||||||
|
|
|
| |||||
Total commercial mortgage loans | $ | 721.8 | $ | 859.4 | ||||
|
|
|
| |||||
Commercial Mortgage Loan by Credit Quality
The values used in these ratio calculations are part of the periodic review of the commercial mortgage loan portfolio, which includes an evaluation of the underlying collateral value as of December 31, 2019 and 2018.
| Recorded Investment | ||||||||||||||||||||||||||||
| Debt Service Coverage Ratios | ||||||||||||||||||||||||||||
| December 31, 2019 | ||||||||||||||||||||||||||||
| ($ in millions) | > 1.20x | 1.00x-1.20x | < 1.00x | Total | % of Total | Estimated Fair Value | % of Total | |||||||||||||||||||||
Loan-to-value ratios: | ||||||||||||||||||||||||||||
Less than 65% | $ | 532.0 | $ | 29.3 | $ | 38.0 | $ | 599.3 | 82.8 | % | $ | 607.3 | 82.3 | % | ||||||||||||||
65% to 75% | 102.9 | 21.9 | — | 124.8 | 17.2 | % | 130.9 | 17.7 | % | |||||||||||||||||||
76% to 80% | — | — | — | — | 0.0 | % | — | 0.0 | % | |||||||||||||||||||
Greater than 80% | — | — | — | — | 0.0 | % | — | 0.0 | % | |||||||||||||||||||
|
|
|
|
|
|
|
|
|
|
|
|
|
| |||||||||||||||
Total | $ | 634.9 | $ | 51.2 | $ | 38.0 | $ | 724.1 | 100.0 | % | $ | 738.2 | 100.0 | % | ||||||||||||||
|
|
|
|
|
|
|
|
|
|
|
|
|
| |||||||||||||||
86
| Recorded Investment | ||||||||||||||||||||||||||||
| Debt Service Coverage Ratios | ||||||||||||||||||||||||||||
| December 31, 2018 | ||||||||||||||||||||||||||||
| ($ in millions) | > 1.20x | 1.00x-1.20x | < 1.00x | Total | % of Total | Estimated Fair Value | % of Total | |||||||||||||||||||||
Loan-to-value ratios: | ||||||||||||||||||||||||||||
Less than 65% | $ | 636.4 | $ | 88.6 | $ | 37.5 | $ | 762.5 | 88.5 | % | $ | 754.8 | 88.3 | % | ||||||||||||||
65% to 75% | 50.2 | 49.1 | — | 99.3 | 11.5 | % | 99.7 | 11.7 | % | |||||||||||||||||||
76% to 80% | — | — | — | — | — | — | — | |||||||||||||||||||||
Greater than 80% | — | — | — | — | — | — | — | |||||||||||||||||||||
|
|
|
|
|
|
|
|
|
|
|
|
|
| |||||||||||||||
Total | $ | 686.6 | $ | 137.7 | $ | 37.5 | $ | 861.8 | 100.0 | % | $ | 854.5 | 100.0 | % | ||||||||||||||
|
|
|
|
|
|
|
|
|
|
|
|
|
| |||||||||||||||
All of our mortgage loans are performing under the original contractual loan terms at December 31, 2019. There is one mortgage loan that has a debt service coverage ratio of less than 1.0% at December 31, 2019. At December 31, 2019, there are no mortgage loans that are not current.
MARKET RISK
Market risk is the risk that we will incur losses due to adverse changes in interest rates or credit spreads. We also have certain exposures to changes in equity prices in our fixed indexed annuities and separate accounts liabilities.
Overview. In formulating and implementing guidelines for investing funds, we seek to earn returns that contribute to stable profits while also meeting the future cash flow requirements of our liabilities.
We use quantitative and qualitative market-based approaches to measure, monitor and manage market risk. We evaluate our exposure to market risk through the use of multiple measures including but not limited to duration, earnings- andcapital-at-risk, scenario analysis and sensitivity analysis. Duration measures the price sensitivity of assets or liabilities to changes in interest rates. For example, if interest rates increase 100 basis points, the fair value of an asset with a duration of 5 is expected to decrease in value by 5%. Earnings- andcapital-at-risk are estimates of the change in earnings or capital that might be expected to emerge over a given time horizon in various defined stress tests. Scenario analysis estimates the potential changes in the value of various financial parameters that could occur under different hypothetical market conditions defined by changes to the market risk factors of interest rates and credit spreads. Sensitivity analysis estimates the potential changes in the value of various financial parameters that could occur under different hypothetical shocks to a market risk factor. In general, we establish investment portfolio asset allocation and market risk limits based upon a combination of duration, earnings- andcapital-at-risk, scenario analysis and sensitivity analysis as well as a consideration of liquidity needs and prudent diversification. Our asset allocation limits place restrictions on the total funds that may be invested within an asset class. Comprehensiveday-to-day management of market risk within defined tolerance ranges occurs as our investment advisors buy and sell within their respective markets based upon the acceptable boundaries established by our investment and other risk policies, which are overseen by our board of directors, and our investment and asset-liability management team.
Interest rate riskis the risk that we will incur a loss due to adverse changes in interest rates. This risk arises when our investments are not fully matched to our liabilities, or when characteristics of the assets or liabilities change. Interest rate risk includes risks related to changes in U.S. Treasury yields and other key risk-free reference yields.
One of the measures used to quantify interest rate exposure is duration. To estimate asset durations, we project asset cash flows and calculate their net present value using a risk-free market interest rate adjusted for credit quality, sector attributes, liquidity and other specific risks. Duration is calculated by revaluing these cash flows at alternative interest rates and determining the percentage change in aggregate value. The asset projections
87
include assumptions (based upon historical market experience and our experience) that are intended to reflect the effect of changing interest rates on the prepayment, leverage and/or option features of instruments, where applicable. The preceding assumptions relate primarily to mortgage-backed securities, and municipal and corporate obligations. Our asset duration was 8.7 years and 8.5 years as of December 31, 2019 and December 31, 2018, respectively. Given the duration of our assets remains shorter than the duration of our liabilities, lower interest rates will result in lower investment income on assets purchased in the future. Conversely, higher interest rates will result in higher investment income on assets purchased in the future.
Based upon the information and assumptions used in the duration calculation, and interest rates in effect as of December 31, 2019, we estimate that a 100 basis point immediate, parallel fall in interest rates (“rate shock”) would increase the net fair value of the assets by $650 million, compared to $740 million as of December 31, 2018. While the duration extended slightly over the year, the impact as at December 31, 2019 is lower largely due to a lower asset base year over year from partial block run off and reinsurance of a portion of LBL’s fixed indexed annuities. The selection of a 100 basis point immediate, parallel change in interest rates should not be construed as our prediction of future market events, but only as an illustration of the potential effect of such an event.
To the extent that conditions differ from the assumptions we used in these calculations, duration and rate shock measures could be significantly impacted. Additionally, our calculations assume that the current relationship between short-term and long-term interest rates (the term structure of interest rates) will remain constant over time. As a result, these calculations may not fully capture the effect ofnon-parallel changes in the term structure of interest rates and/or large changes in interest rates.
Credit spread riskis the risk that we will incur a loss due to adverse changes in credit spreads (“spreads”). This risk arises from our investment in spread-sensitive fixed income assets.
We manage the spread risk in our assets by monitoring our spread duration. Spread duration measures the price sensitivity of the assets to changes in spreads. For example, if spreads increase 100 basis points, the fair value of an asset exhibiting a spread duration of 5 is expected to decrease in value by 5%. We manage this risk through a disciplined asset-liability management process that endeavors to align expected liability cashflows with assets of a similar profile. Losses due to credit spread duration result only if there is a requirement to sell assets (for example, to pay claims) prior to maturity at a time when the fair market value of assets is low due to higher credit spreads.
Spread duration is calculated similarly to interest rate duration. For our portfolio, spread duration is close to the asset duration, and thus has a similar sensitivity.
Credit default risk is the risk that we will incur a loss due tonon-payment of principal or interest by a borrower on a specific financial instrument we own. This risk arises primarily from our investments in fixed income securities (for example, corporate bonds) and commercial mortgage loans.
We manage credit default risk through monitoring of the creditworthiness of the underlying borrowers of the securities and loans we are invested in. We use diversification to reduce credit default risk by spreading the risk across different borrowers, different industries and different geographical locations. Furthermore, we constrain credit default risk through limits on the amount of securities and loans we own with specific credit ratings. Credit defaults may be recognized by the Company in income prior to an actual default by the underlying borrower.
A credit default loss of 100 basis points on the portfolio would result in a loss of $75 million as of December 31, 2019, compared to $91 million as of December 31, 2018. The decrease is due to lower invested asset balances year-over-year. The selection of 100 basis points should not be construed as our prediction of future market events, but as an illustration of the potential effect of such an event.
88
Equity price riskis the risk that we will incur losses due to adverse changes in the general levels of the equity markets. Equity risk exists for contract charges based on account balances as well as for guarantees for living, death and/or income benefits provided by our variable and fixed indexed products.
Our variable life products are substantially reinsured. For the liabilities that are retained, there is equity exposure to contract charges and fees that are based on separate account values, but there is only small exposure to guarantees. The present value of a 20% decrease in equity values would result in a decline in the present value of future contract charges and fees of approximately $1 million as of December 31, 2019, compared to a decline of $4 million as of December 31, 2018. The selection of 20% should not be construed as our prediction of future market events, but as an illustration of the potential effect of such an event. The year over year reduction in sensitivity is due to reinsurance effective on December 31, 2019.
All variable annuity contract charges and fees, liabilities and benefits, including guarantees for death and/or income benefits, are ceded to ALIC in accordance with the reinsurance agreements, thereby limiting our equity risk exposure. In 2006, ALIC disposed of substantially all of its variable annuity business through reinsurance agreements with The Prudential Insurance Company of America and therefore mitigated this aspect of ALIC’s risk. The Company was not a direct party to this agreement and its reinsurance agreements with ALIC remain unchanged. As of December 31, 2019 and 2018, we had Separate Accounts assets related to variable annuity and variable life contracts totaling $1.6 billion and $1.3 billion, respectively, before reinsurance.
As of December 31, 2019 and 2018, we had $620 million and $1.0 billion respectively in indexed universal life and fixed indexed annuity liabilities, net of reinsurance, that provide customers with interest crediting rates primarily based on the performance of the S&P 500. The decline in liabilities is partially due to run off of the block and partially due to new reinsurance effective on December 31, 2019. We maintain a hedging program that aims to offset the impact of equity market performance on the value of these guarantees. As of December 31, 2019 and December 31, 2018, we had $18.4 million and $3.0 million in market value of S&P 500 options and futures under the hedging program, respectively. The 2018 value of futures and options was lower than normal due to the dramatic decline in the S&P 500 in December 2018. The 2019 value is closer to a more normal level.
Counterparty credit riskrelates to the Company’s potential loss if a counterpartyfails to perform under the terms of a contract. The Company manages its exposure to counterparty credit risk by utilizing highly rated counterparties, establishing risk control limits, executing legally enforceable master agreements and obtaining collateral where appropriate.
Lincoln Benefit’s counterparty risk consists of the following two types of exposures: (1) Derivative counterparty risk: The Company only holds future contracts and option contracts which are traded on organized exchanges, which require margin deposits and guarantee the execution of trades, thereby mitigating potential credit risk. Exchanges serve as a marketplace for the buyer and the seller. The associated clearing house sits between the two sides of the trade. The Company did not incur any losses on derivative financial instruments due to counterparty nonperformance in 2019 or 2018; and (2) Reinsurance counterparty risk. The reinsurance counterparty risk is the risk of the reinsurance counterparty failing to pay reinsurance recoveries in full to Lincoln Benefit in a timely manner (i.e., unwillingness to pay, not paying in full or inability to pay.) We attempt to mitigate this risk by diversifying the risk with multiple reinsurers and monitoring their credit ratings.
89
CAPITAL RESOURCES AND LIQUIDITY
Capital resources consist of capital and surplus. The following table summarizes our capital resources as of December 31, 2019 and 2018:
| ($ in millions) | 2019 | 2018 | ||||||
Common stock, retained earnings and additionalpaid-in capital | $ | 352.6 | $ | 379.9 | ||||
|
|
|
| |||||
Capital and surplusdecreased in 2019 primarily due to capital contributions to Lancaster Re and payment of dividends offset by current year profits and current year capital contributions from GILICO. Capital and surplus decreased in 2018 primarily due to the capital contributions to Lancaster Re .
Financial strength ratings. Our financial strength ratings as of December 31, 2019 areA- with negative outlook from A.M. Best Company, Inc. (“AM Best”) and BBB with stable outlook from Standard & Poors Ratings Services (“S&P). Our financial strength ratings as of December 31, 2018 wereA- from AM Best and BBB from S&P, both with stable outlook. These ratings reflect the rating agencies’ opinions of our relative financial strength and are not a recommendation to buy or hold any investment. Ratings may be revised or revoked at any time at the sole discretion of the issuing rating agency.
The NAIC has developed a set of financial relationships or tests known as the Insurance Regulatory Information System to assist state regulators in monitoring the financial condition of insurance companies and identifying companies that require special attention or actions by insurance regulatory authorities. The NAIC analyzes financial data provided by insurance companies using prescribed ratios, each with defined “usual ranges.” Generally, regulators will begin to monitor an insurance company if its ratios fall outside the usual ranges for four or more of the ratios. If we have insufficient capital, our regulator may act to reduce the amount of or deny the payment of, dividends.
Liquidity sources and uses. Our potential sources of funds principally include the following:
| • | Receipt of insurance premiums |
| • | Contractholder fund deposits |
| • | Reinsurance recoveries |
| • | Receipts of principal and interest on investments |
| • | Maturity or sales of investments |
Our potential uses of funds principally include the following.
| • | Payment of contract benefits, surrenders and withdrawals |
| • | Reinsurance cessions and payments |
| • | Operating costs and expenses |
| • | Purchase of investments |
| • | Repayment of intercompany balances |
| • | Dividends to parent |
| • | Tax payments/settlements |
Cash flows. As reflected in our Statements of Cash Flows, net cash provided by/(used in) operating activities was $(441.1) million, $(412.3) million, and $(292.3) million for the years ended December 31, 2019, 2018 and 2017, respectively. Fluctuations in net cash provided by operating activities primarily occur as a result
90
of changes in net investment income, differences in the timing of reinsurance payments and other operating activities (e.g., tax payments, expenses, etc.)
Notwithstanding any reinsurance arrangements, we continue to have primary liability as a direct insurer for risks reinsured. Our ability to meet liquidity demands is dependent on reinsurers’ ability to meet those obligations under the reinsurance programs.
Our ability to pay dividends is dependent on business conditions, income, cash requirements and other relevant factors. The payment of shareholder dividends without the prior approval of the state insurance regulator is limited by Nebraska law to formula amounts based on net income and capital and surplus, determined in conformity with statutory accounting practices, as well as the timing and amount of dividends paid in the preceding twelve months. Prior approval of the Nebraska Director of Insurance is required for the Company for any dividend or distribution paid for five years subsequent to April 1, 2014. After receiving approval from the Department of Insurance, the Company paid dividends of $40.0 million, $15.0 million, and $70.0 million in the years ended December 31, 2019, 2018 and 2017, respectively.
Contractual obligations. Due to the reinsurance agreements that we have in place, certain contractual obligations are ceded to our affiliate, GILICO, as well as ALIC, Hannover and other non-affiliated reinsurers.
REGULATION AND LEGAL PROCEEDINGS
We are subject to extensive regulation and we are involved in various legal and regulatory actions, all of which have an effect on specific aspects of our business. For a detailed discussion of the legal and regulatory actions in which we are involved, see Note 12 to the financial statements.
PENDING ACCOUNTING STANDARDS
There are pending accounting standards that we have not implemented because the implementation date has not yet occurred. For a discussion of these pending standards, see Note 2 to the financial statements. The effect of implementing certain accounting standards on our financial results and financial condition is often based in part on market conditions at the time of implementation of the standard and other factors we are unable to determine prior to implementation. For this reason, we are sometimes unable to estimate the effect of certain pending accounting standards until the relevant authoritative body finalizes these standards or until we implement them.
| Item 11(i). | Changes in or Disagreements with Accountants |
None.
| Item 11(j). | Quantitative and Qualitative Disclosures About Market Risk |
Information required for Item 11(j) is incorporated by reference to the material under the caption “Market Risk” in Item 11(h) of this report.
| Item 11(k). | Directors and Executive Officers |
The biographies of each of the directors and executive officers as of March 30, 2020 are included below.
DhirenJhaveri, 45, has been Executive Chairman of the board of directors of the Company since December 31, 2019. Dhiren is the founder and has been Chief Executive Officer of Kuvare US Holdings, Inc. (“Kuvare”), the direct parent of GILICO, since 2014, and is the Executive Chairman of the boards of directors of GILICO and United Life Insurance Company (“United Life”), an Iowa-domiciled insurance company and wholly owned subsidiary of Kuvare. In addition, he serves as the President and Chief Executive Officer of Kuvare
91
Insurance Services LP, a Delaware limited partnership (“KIS”). Before founding Kuvare, Dhiren was a member of the executive committee of Sammons Financial Group, where he led corporate development and investment risk. Previously, he worked at McKinsey & Co. and Barclays. Dhiren is actively involved on various committees for the American Council of Life Insurers and is a designee of the LIMRA Life Insurance Fellows.
Bradley Rosenblatt, 45, has been a director of the Company since December 31, 2019, and Chief Revenue Officer of Kuvare since 2017, where he leads revenue and growth strategy. In addition, Brad is President and a director of United Life, and a director of GILICO. Brad has over 20 years of experience in sales, marketing and strategy. Prior to joining Kuvare, Brad served as Chief Distribution Officer for Sammons Financial Group leading the company’s growth strategy in new life insurance markets. While at Sammons Financial Group, Brad also led the company’s strategy and corporate development function and held various sales and marketing leadership roles. Previously, he worked at McKinsey & Co. in the insurance practice, serving life, property/casualty and health insurance carriers. Brad holds an MBA from Michigan Ross School of Business and a Bachelor of Arts in Economics from Northwestern University.
JosephWieser, 54, has been a director of the Company since December 31, 2019, and President and a director of GILICO since 2018. Joe has more than 28 years of leadership, strategy, operational and sales/marketing experience in the annuity, life and health insurance industry. He most recently served as Business Development Director for Anthem Blue Cross Blue Shield in Denver, Colorado and, prior to that, served five years as President of Dearborn National Life Insurance Company. During his career, he has held leadership roles overseeing all insurance company functions. Previously, his executive experience includes working at MassMutual, Colorado Bankers, Starmount Life and Anthem Blue Cross Blue Shield. Joe is a graduate of Metropolitan State University in Denver and holds his CLU, ChFC and FLMI financial/insurance professional designations.
Burke Harr, 48, has been a director of the Company since December 31, 2019. Burke served as a Nebraska state senator from 2011 to 2019, and has been an of counsel attorney at Houghton Bradford Whitted PC, LLO since 2011. Burke is a graduate of the University of St. Thomas and the Notre Dame Law School.
Carlos Sierra, 52, has been President and a director of the Company since December 31, 2019, and the Chief Operating Officer of Kuvare since 2016, where he leads overall operational strategy. He is a director of GILICO and of United Life. With over 30 years of operations experience, Carlos previously worked as a consultant for insurance companies and served as COO for the Americas at Aon Risk and Global COO for Combined Insurance where he led global operations, including Front Office (sales model; multichannel sales), Back Office (contact centers; order entry; claims; field operations) and Technology (Application Development and Infrastructure). Previously, Carlos worked at McKinsey & Co, where he served clients in the Financial Institutions Group and at FMC where he led Manufacturing Planning and Latin American Operations. Carlos earned engineering and masters degrees with honors from ITESM, Ohio State and Stanford.
David Goldberg, 51, has been Secretary of the Company since December 31, 2019, and General Counsel and Secretary of Kuvare since 2017, where he directs the legal, regulatory and corporate governance functions for the Kuvare businesses. He provides more than 20 years of broad commercial law and senior executive experience, having started his legal career in 1993 at the Sidley & Austin firm in Chicago. David has served in numerous corporate General Counsel roles, including insurance sector roles at Coregis Insurance, a specialty property and casualty company, as well as life and health companies Combined Insurance (and its worldwide affiliates) and Sterling Life Insurance Company. Most recently he served as an Illinois Assistant Attorney General and General Counsel to the Illinois State Toll Highway Authority. David is a graduate of the University of Michigan and Washington University School of Law.
Erik Braun,36, was appointed Chief Financial Officer and Treasurer of LBL HoldCo, Inc. and LBL HoldCo II, Inc. in March 2020. He has served as Treasurer and Controller of Kuvare US Holdings, Inc. since 2017. From 2013 to 2017, Erik was with Fidelity Life Association as the manager of accounting and finance and
92
the assistant corporate controller. Previously, he worked in public accounting within the assurance practice, where he served insurance industry clients across most commercial and personal lines. Erik is a Certified Public Accountant (inactive).
| Item 11(l). | Executive Compensation |
We do not have any employees, but rather are provided personnel, including our named executive officers, by our parent company, LBL HoldCo II, Inc. (“HoldCo”), pursuant to the Services Agreement between HoldCo and Lincoln Benefit effective April 1, 2014. Executive officers of Lincoln Benefit also serve as officers of our indirect parent, HoldCo Parent and other subsidiaries of HoldCo Parent. These executive officers received no compensation directly from Lincoln Benefit. As a result, we do not determine or pay any compensation to our named executive officers or additional personnel provided by HoldCo for our operations. HoldCo determines and pays the salaries, bonuses and other wages earned by our named executive officers and by additional personnel provided to us by HoldCo. HoldCo also determines whether and to what extent our named executive officers and additional personnel from HoldCo may participate in any employee benefit plans. We do not have any employment agreements with our named executive officers and do not provide pension or retirement benefits, perquisites or other personnel benefits to our named executive officers. We do not have arrangements to make payments to our named executive officers upon their termination or in the event of a change in control of the Company. See “Transactions with Related Parties” for more information about the Services Agreement between HoldCo and us.
Director compensation
Burke Harr, receives an annual cash retainer fee for his services on the board of directors of Lincoln Benefit.
No director who is also an employee of Kuvare and/or GILICO receives any additional compensation for serving as a director of the Company.
Compensation Related to Services prior to December 31, 2019
Our independent directors received an annual cash retainer fee for their services on the boards of directors of HoldCo Parent and its subsidiaries, including Lincoln Benefit, a portion of which is allocated to Lincoln Benefit pursuant to the Services Agreement. Anon-employee director also had the option to elect to defer receipt of all or a portion of his or her annual retainer fee into a notional percentage equity interest in RL LP and RL (Parallel) Partnership (together, the “Partnerships”). The elected percentage of the board retainer for a calendar year of service was converted into a notional percentage interest in the Partnerships when theyear-end valuation of the Partnerships for the immediately prior year was available. The notional interest was unvested until December 31st of the relevant year of service, and, as a general rule, if the director’s board service ended before December 31st, the unvested portion of the notional interest would be forfeit except that, in the case of a qualifying termination, a pro rata portion of the director’s unvested portion of the notional interest would vest. If a director was terminated,
93
this would be considered a qualifying termination and such director’s notional interest would vest. Vested portions of notional interests were settled in cash on termination of the director’s board service.
Compensation Committee Interlocks and Insider Participation
In February 2015, the Board of Directors of HoldCo Parent established a compensation committee, whose primary function is to assist the Board with its oversight role with respect to the compensation of HoldCo Parent’s and its subsidiaries’ executive officers and other employees. In February 2017, the HoldCo Parent compensation committee wasre-established at HoldCo, the entity with which the majority of the employees are employed. No executive officer of Lincoln Benefit serves as a member of the compensation committee of another entity for which any executive officer served as a director for Lincoln Benefit.
| Item 11(m). | Security Ownership of Certain Beneficial Owners and Management Security |
Ownership of Certain Beneficial Owners
The following table shows the number of Lincoln Benefit shares owned by any beneficial owner who owns more than five percent of any class of Lincoln Benefit’s voting securities.
Title of Class (a) | Name and Address of Beneficial Owner | Amount and Nature of | Percent of | |||
Capital Stock | LBL HoldCo II, Inc. 5600 N. River Road, Suite 300 Rosemont, IL 60018 | 25,000 | 100% | |||
N/A | LBL HoldCo, Inc. 5600 N. River Road, Suite 300 Rosemont, IL 60018 | Indirect voting and investment power of shares owned by LBL HoldCo II, Inc. | N/A | |||
N/A | Guaranty Income Life Insurance Company 118 Second Avenue SE Cedar Rapids, IA 52401 | Indirect voting and investment power of shares owned by LBL HoldCo II, Inc. | N/A | |||
N/A | Kuvare US Holdings, Inc. 55 West Monroe Street, Suite 1930 Chicago, IL 60603 | Indirect voting and investment power of shares owned by LBL HoldCo II, Inc. | N/A | |||
N/A | Kuvare UK Holdings Limited 5th Floor 6 St Andrew Street London, EC4A 3AE, United Kingdom | Indirect voting and investment power of shares owned by LBL HoldCo II, Inc. | N/A | |||
N/A | Kuvare Holdings LP P.O. Box 309 Ugland House George Town Grand CaymanKY1-1104, Cayman Islands | Indirect voting and investment power of shares owned by LBL HoldCo II, Inc. | N/A | |||
N/A | Kuvare GP Holdings LP P.O. Box 309 Ugland House George Town Grand CaymanKY1-1104, Cayman Islands | Indirect voting and investment power of shares owned by LBL HoldCo II, Inc. | N/A |
94
Title of Class (a) | Name and Address of Beneficial Owner | Amount and Nature of | Percent of | |||
N/A | Kuvare GP Holdings Ltd. P.O. Box 309 Ugland House George Town Grand CaymanKY1-1104, Cayman Islands | Indirect voting and investment power of shares owned by LBL HoldCo II, Inc. | N/A | |||
N/A | Access Holdings GP LP c/o Access Holdings 2 East Read Street, Suite 300 Baltimore, MD 21202 | Indirect voting and investment power of shares owned by LBL HoldCo II, Inc. | N/A | |||
N/A | Access Holdings GP Company c/o Access Holdings 2 East Read Street, Suite 300 Baltimore, MD 21202 | Indirect voting and investment power of shares owned by LBL HoldCo II, Inc. | N/A | |||
N/A | ACP LI Holdings, LP c/o Altamont Capital Partners 400 Hamilton Ave, Suite 230 Palo Alto, CA 94301 | Indirect voting and investment power of shares owned by LBL HoldCo II, Inc. | N/A | |||
N/A | ACP LI Holdings GP Ltd. c/o Altamont Capital Partners 400 Hamilton Ave, Suite 230 Palo Alto, CA 94301 | Indirect voting and investment power of shares owned by LBL HoldCo II, Inc. | N/A |
The following table shows the number of shares of stock in Lincoln Benefit or its parents beneficially owned by each director and named executive officer of Lincoln Benefit individually, and by all executive officers and directors of Lincoln Benefit as a group. Beneficial ownership for the purposes of the following table is determined in accordance with the rules and regulations of the SEC. These rules generally provide that a person is the beneficial owner of securities if such person has or shares the power to direct the voting thereof, or to dispose or direct the disposition thereof or has the right to acquire such powers within 60 days. The following share amounts are as of December 31, 2019. The address of each such director or officer is c/o Kuvare US Holdings, Inc., 55 W Monroe Street, Suite 1930, Chicago, Illinois, 60603.
Entity | Title of Class of Equity Securities | Number of Shares | Statement Concerning Beneficial | |||
| Lincoln Benefit, HoldCo, HoldCo Parent, GILICO, Kuvare, Kuvare UK Holdings Limited, Kuvare Holdings LP, Kuvare GP Holdings LP, Kuvare GP Holdings Ltd. | n/a | n/a | Lincoln Benefit is an indirect wholly owned subsidiary of Kuvare Holdings LP, which is controlled by its general partner, Kuvare GP Holdings LP. Kuvare GP Holdings LP is controlled by its general partner, Kuvare GP Holdings Ltd. Dhiren Jhaveri is the Chief Executive Officer and a director of Kuvare GP Holdings Ltd., and no officers or directors of the Company beneficially own any equity interests in Kuvare GP Holdings Ltd. |
95
Entity | Title of Class of Equity Securities | Number of Shares | Statement Concerning Beneficial | |||
| Kuvare Holdings LP(1) | n/a | n/a | GBIS Holdings, LLC owns less than 1% of the equity interests of Kuvare Holdings LP.(2) Dhiren Jhaveri is the member of GBIS Holdings, LLC. | |||
| Kuvare GP Holdings LP | n/a | n/a | GBIS Holdings, LLC owns 1% of the equity interests of Kuvare GP Holdings LP.(2)Dhiren Jhaveri is the member of GBIS Holdings, LLC. | |||
| (1) | Certain directors and officers of the Company may from time to time directly or indirectly own limited partner interests in Kuvare Holdings LP. Such directors and officers do not have the power to vote or dispose of any shares of the Company that may be held from time to time directly or indirectly by Kuvare Holdings LP and therefore are not deemed to beneficially own such shares. |
| (2) | Calculated on an aggregate basis including all outstanding classes of limited partner interests. |
96
Changes in Control
On December 31, 2019, GILICO, completed the indirect acquisition of Lincoln Benefit. The Company is a wholly owned subsidiary of HoldCo, which is a wholly owned subsidiary of HoldCo Parent, and HoldCo Parent is a wholly owned subsidiary of GILICO.
| Item 11(n). | Transactions with Related Persons, Promoters and Certain Control Persons |
Transactions with Related Persons
Lincoln Benefit is a party to certain intercompany agreements involving amounts greater than $120,000 between Lincoln Benefit and the following companies:
| • | HoldCo, the direct parent of Lincoln Benefit. |
| • | HoldCo Parent, an indirect parent of Lincoln Benefit. |
| • | Lancaster Re Captive Insurance Company (“Lancaster Re”), a direct subsidiary of Lincoln Benefit |
| • | Lanis LLC, an affiliate of Lincoln Benefit |
| • | GILICO, the direct parent of HoldCo Parent |
| • | Kuvare, the direct parent of GILICO |
| • | KIS, an affiliate of Lincoln Benefit |
97
In April 2014, Lincoln Benefit entered into a Services Agreement with HoldCo whereby HoldCo has agreed to provide certain management and administrative services. These include legal counsel, data processing, office
management and supply services, marketing, public relations, actuarial services, auditing and managerial services. Lincoln Benefit reimburses HoldCo at cost for services and facilities provided by HoldCo pursuant to this agreement.
On December 31, 2019, Lincoln Benefit entered into a Cost Sharing and Services Agreement with Kuvare and KIS whereby Kuvare and KIS have agreed to provide certain management and administrative services to Lincoln Benefit, including management, reinsurance, legal, audit, administration, financial planning and other services. Lincoln Benefit reimburses Kuvare and KIS at cost for services provided by Kuvare and KIS pursuant to this agreement.
On December 31, 2019, Lincoln Benefit entered into an Investment Management Agreement with KIS, whereby KIS has agreed to provide certain investment advisory and management services to Lincoln Benefit. Pursuant to this agreement, KIS will receive a gross fee of approximately 0.30% per annum on all investment assets of Lincoln Benefit managed under this agreement. Mr. Jhaveri, the chair of our board of directors, is the President and Chief Executive Officer and an indirect owner of KIS. In addition, affiliates of each of Access Holdings GP Company and ACP LI Holdings GP Ltd., each an indirect beneficial owner of greater than 5% of Lincoln Benefit’s voting securities, are indirect owners of KIS.
Transaction Description | Approximate dollar value of the amount involved in the transaction, per fiscal year | Approximate dollar value of the amount involved in the transaction, per fiscal year | ||||||||||||||||||
| ($) | HoldCo Parent | HoldCo | Lanis LLC | |||||||||||||||||
Services Agreement between LBL HoldCo II, Inc. and Lincoln Benefit effective April 1, 2014 | | 2017 2018 2019 |
| | (18,796,724 (22,366,496 (13,467,066 | )1 )1 )¹ | | N/A N/A N/A |
| | 18,796,724¹ 22,366,496¹ 13,467,066¹ |
| | N/A N/A N/A |
| |||||
Cost Sharing and Services Agreement among Kuvare, KIS and Lincoln Benefit effective December 31, 2019 | 2019 | (300,000 | ) | N/A | N/A | N/A | ||||||||||||||
| 1 | Total expense amount reimbursed / (paid) under the transaction |
The agreements listed in the table immediately below relate to a transaction that LBL HoldCo II, Inc., LBL HoldCo, Inc., Lancaster Re Captive Insurance Company, Lanis LLC and Lincoln Benefit have entered into with Hannover Life Reassurance Company of America, an unrelated party, in order to finance a portion of the insurance reserves held by Lincoln Benefit with respect to universal life insurance policies with secondary guarantees written by Lincoln Benefit.
98
Transaction Description | Approximate dollar value of the amount involved in the transaction, per fiscal year | Approximate dollar value of the amount involved in the transaction, per fiscal year | ||||||||||||||||||
| ($) | HoldCo Parent | HoldCo | Lanis LLC | |||||||||||||||||
Surplus Note Purchase Agreement between Lancaster Re Captive Insurance Company and Lanis LLC effective April 1, 2014 | 2017 | (26,875,000 | )² | N/A | N/A | 26,875,000² | ||||||||||||||
| 2018 | (28,407,000 | )² | N/A | N/A | 28,407,000 | 2 | ||||||||||||||
| 2019 | (30,047,000 | )² | N/A | N/A | 30,047,000 | 2 | ||||||||||||||
Vehicle Note Purchase Agreement between Lancaster Re Captive Insurance Company and Lanis LLC effective April 1, 2014 | 2017 | 26,875,000² | N/A | N/A | (26,875,000 | )² | ||||||||||||||
| 2018 | 28,407,000² | N/A | N/A | (28,407,000 | )2 | |||||||||||||||
| 2019 | 30,047,000 | 2 | N/A | N/A | (30,047,000 | )² | ||||||||||||||
Fee Letter between Lincoln Benefit Life Company and Lanis LLC effective April 1, 2014 | 2017 | (7,834,870 | )3 | N/A | N/A | 7,834,870 | 3 | |||||||||||||
| 2018 | (8,281,546 | )3 | N/A | N/A | 8,281,546 | 3 | ||||||||||||||
| 2019 | (7,893,219 | )3 | N/A | N/A | 7,893,219 | 3 | ||||||||||||||
| 2 | Surplus/Vehicle Note Interest received (paid) |
| 3 | Payment of risk spread fee |
Review and Approval of Related Person Transactions
As a regulated insurance company, material transactions with related persons are subject to review and approval by Lincoln Benefit’s applicable insurance regulatory authority to confirm, among other things, that the terms of such transactions are fair and reasonable, that charges or fees for services performed are reasonable, and that expenses incurred and payment received is allocated to Lincoln Benefit in conformity with customary insurance accounting practices consistently applied. All agreements with related persons are also reviewed by Kuvare’s Office of the General Counsel to determine whether an actual conflict of interest exists with respect to such agreements. This process is documented in an internal procedure that captures the review and approval process of all intercompany agreements.
While there is no formal process for the review and approval of related person transactions between unaffiliated entities specific to Lincoln Benefit, all directors, officers and employees of Lincoln Benefit are subject to LBL HoldCo, Inc.’s Code of Conduct and its Conflict of Interest Guideline. LBL HoldCo’s Code of Conduct includes a written conflict of interest policy that was adopted by the Board of Directors of LBL HoldCo, Inc., the indirect parent company of Lincoln Benefit, and applies to all subsidiaries, including Lincoln Benefit. Any potential relationship or activity that could impair independent thinking and judgment, including holding a financial interest in a business venture that is similar to Lincoln Benefit and/or LBL HoldCo, Inc., or in a business that has a relationship with either entity, is required to be disclosed to Human Resources and Compliance. Human Resources works with representatives from the Law Department, including Compliance, and the Audit Committee, if necessary, to determine whether an actual conflict of interest existed. All directors, officers and employees are required to sign a Code of Conduct certification and complete a Conflict of Interest Questionnaire annually.
A section entitled “Experts” is added to your prospectus as follows:
EXPERTS
The financial statements included in this Prospectus as of and for the year then ended December 31, 2019 of Lincoln Benefit Life Company, have been audited by Deloitte & Touche LLP, an independent registered public accounting firm, as stated in their report appearing herein and elsewhere in the Registration
99
Statement. Such financial statements are included in reliance upon the report of such firm given upon their authority as experts in accounting and auditing.
The financial statements of Lincoln Benefit Life Company for the year ended December 31, 2017 included in this Prospectus have been so included in reliance on the report of PricewaterhouseCoopers LLP, an independent registered public accounting firm, given on the authority of said firm as experts in auditing and accounting.
The following change is made to the prospectuses for the LBL Advantage, Consultant II and Premier Planner:
Under the “More Information” section, the subsection entitled “Legal Matters” is deleted and replaced with the following:
LEGAL MATTERS
Matters of Nebraska law pertaining to the Contract, including the validity of the Contract and our right to issue the Contract under Nebraska law, have been passed upon by Lamson Dugan & Murray LLP, Omaha, Nebraska.
PRINCIPAL UNDERWRITER
Allstate Distributors, L.L.C. (“ADLLC”) serves as distributor of the securities registered herein. The securities offered herein are sold on a continuous basis, and there is no specific end date for the offering. ADLLC is a registered broker dealer under the Securities and Exchange Act of 1934, as amended, and is a member of the Financial Industry Regulatory Authority. ADLLC is not required to sell any specific number or dollar amount of securities, but will use its best efforts to sell the securities offered.
ADMINISTRATION
We have primary responsibility for all administration of the Contracts and the Variable Account. We entered into an administrative services agreement with Allstate Life. Allstate Life entered into an administrative services agreement with The Prudential Insurance Company of America (“PICA”) pursuant to which PICA or an affiliate provides administrative services to the Variable Account and the Contracts on our behalf. In addition, PICA entered into a master services agreement with SE2, LLC, of 5801 SW 6th Avenue, Topeka, Kansas 66636, whereby SE2, LLC provides certain business process outsourcing services with respect to the Contracts. SE2, LLC may engage other service providers to provide certain administrative functions. These service providers may change over time, and as of December 31, 2019, consisted of the following: Donnelley Financial Solutions, formerly an RR Donnelley company (compliance printing and mailing) located at 35 West Wacker Drive, Chicago, IL 60601; Iron Mountain Information Management, LLC (file storage and document destruction) located at 1 Federal Street, Boston, MA 02110; TierPoint, LLC (disaster recovery) located at 9394 West Dodge Rd, Suite 100, Omaha, NE 68114; SOVOS Compliance (withholding calculations and tax statement mailing) located at 3650 Annapolis Lane, Suite 190, Plymouth, MN 55447; Records Center of Topeka, a division of Underground Vaults & Storage, Inc.(back-up tapes storage) located at 1540 NW Gage Blvd. #6, Topeka, KS 66618; Venio LLC, d/b/a Keane (lost shareholder search) located at PO Box 1508, Southeastern, PA 19399-1508; Broadridge Output Solutions, Inc. (printing and mailing anniversary statements, financial confirmations, automated letters and quarterly statements) located at 2600 Southwest Blvd., Kansas City, MO 64108.
100
In administering the Contracts, the following services are provided, among others:
| • | maintenance of Contract Owner records; |
| • | Contract Owner services; |
| • | calculation of unit values; |
| • | maintenance of the Variable Account; and |
| • | preparation of Contract Owner reports. |
We will send you Contract statements at least annually. We will also send you transaction confirmations. You should notify us promptly in writing of any address change. You should read your statements and confirmations carefully and verify their accuracy. You should contact us promptly if you have a question about a periodic statement or a confirmation. We will investigate all complaints and make any necessary adjustments retroactively, but you must notify us of a potential error within a reasonable time after the date of the questioned statement. If you wait too long, we will make the adjustment as of the date that we receive notice of the potential error. Correspondence you send by regular mail to our service center should be sent to P.O. Box 758566, Topeka, KS 66675-8566. Your correspondence will be picked up at this address and then delivered to our service center. Your correspondence is not considered received by us until it is received at our service center. Where this prospectus refers to the day when we receive a purchase payment, request, election, notice, transfer or any other transaction request from you, we mean the day on which that item (or the last requirement needed for us to process that item) arrives in complete and proper form at our service center or via the appropriate telephone or fax number if the item is a type we accept by those means. There are two main exceptions: if the item arrives at our service center (1) on a day that is not a business day, or (2) after the close of a business day, then, in each case, we are deemed to have received that item on the next business day.
We will also provide you with additional periodic and other reports, information and prospectuses as may be required by federal securities laws.
101
| Target Portfolio | Acquiring Portfolio |
| Invesco V.I. Mid Cap Growth Fund – Series I | Invesco Oppenheimer V.I. Discovery Mid Cap Growth Fund – Series I |
| Invesco V.I. Mid Cap Growth Fund – Series II | Invesco Oppenheimer V.I. Discovery Mid Cap Growth Fund – Series II |
| Title of Class (a) | Name and Address of Beneficial Owner (b) | Amount and Nature of Beneficial Ownership (c) | Percent of Class (d) |
Capital Stock | LBL HoldCo II, Inc. 5600 N. River Road, Suite 300 Rosemont, IL 60018 | 25,000 | 100% |
| N/A | LBL HoldCo, Inc. 5600 N. River Road, Suite 300 Rosemont, IL 60018 | Indirect voting and investment power of shares owned by LBL HoldCo II, Inc. | N/A |
| N/A | Guaranty Income Life Insurance Company 118 Second Avenue SE Cedar Rapids, IA 52401 | Indirect voting and investment power of shares owned by LBL HoldCo II, Inc. | N/A |
| N/A | Kuvare US Holdings, Inc. 55 West Monroe Street, Suite 1930 Chicago, IL 60603 | Indirect voting and investment power of shares owned by LBL HoldCo II, Inc. | N/A |
| N/A | Kuvare UK Holdings Limited 5th Floor 6 St Andrew Street London, EC4A 3AE, United Kingdom | Indirect voting and investment power of shares owned by LBL HoldCo II, Inc. | N/A |
| N/A | Kuvare Holdings LP P.O. Box 309 Ugland House George Town Grand Cayman KY1-1104, Cayman Islands | Indirect voting and investment power of shares owned by LBL HoldCo II, Inc. | N/A |
| N/A | Kuvare GP Holdings LP P.O. Box 309 Ugland House George Town Grand Cayman KY1-1104, Cayman Islands | Indirect voting and investment power of shares owned by LBL HoldCo II, Inc. | N/A |
| N/A | Kuvare GP Holdings Ltd. P.O. Box 309 Ugland House George Town Grand Cayman KY1-1104, Cayman Islands | Indirect voting and investment power of shares owned by LBL HoldCo II, Inc. | N/A |
| N/A | Access Holdings GP LP c/o Access Holdings 2 East Read Street, Suite 300 Baltimore, MD 21202 | Indirect voting and investment power of shares owned by LBL HoldCo II, Inc. | N/A |
| N/A | Access Holdings GP Company c/o Access Holdings 2 East Read Street, Suite 300 Baltimore, MD 21202 | Indirect voting and investment power of shares owned by LBL HoldCo II, Inc. | N/A |
| N/A | ACP LI Holdings, LP c/o Altamont Capital Partners 400 Hamilton Ave, Suite 230 Palo Alto, CA 94301 | Indirect voting and investment power of shares owned by LBL HoldCo II, Inc. | N/A |
| N/A | ACP LI Holdings GP Ltd. c/o Altamont Capital Partners 400 Hamilton Ave, Suite 230 Palo Alto, CA 94301 | Indirect voting and investment power of shares owned by LBL HoldCo II, Inc. | N/A |
| Entity | Title of Class of Equity Securities | Number of Shares | Statement Concerning Beneficial Ownership |
| Lincoln Benefit, HoldCo, HoldCo Parent, GILICO, Kuvare, Kuvare UK Holdings Limited, Kuvare Holdings LP, Kuvare GP Holdings LP, Kuvare GP Holdings Ltd. | n/a | n/a | Lincoln Benefit is an indirect wholly owned subsidiary of Kuvare Holdings LP, which is controlled by its general partner, Kuvare GP Holdings LP. Kuvare GP Holdings LP is controlled by its general partner, Kuvare GP Holdings Ltd. Dhiren Jhaveri is the Chief Executive Officer and a director of Kuvare GP Holdings Ltd., and no officers or directors of the Company beneficially own any equity interests in Kuvare GP Holdings Ltd. |
| Kuvare Holdings LP | n/a | n/a | GBIS Holdings, LLC owns less than 1% of the equity interests of Kuvare Holdings LP.(1) Dhiren Jhaveri is the member of GBIS Holdings, LLC. |
| Kuvare GP Holdings LP | n/a | n/a | GBIS Holdings, LLC owns 1% of the equity interests of Kuvare GP Holdings LP.(1) Dhiren Jhaveri is the member of GBIS Holdings, LLC. |
| (1) | Calculated on an aggregate basis including all outstanding classes of limited partner interests. |
This supplement amends certain disclosure contained in the prospectus for your Variable Annuity contract issued by Lincoln Benefit Life Company. Not all funds listed below are available as investment options on all contracts. Please refer to your prospectus to determine which information relates to funds available through your Variable Annuity contract.
| Oppenheimer VA Funds | Acquiring Funds |
| Oppenheimer Discovery Mid Cap Growth Fund/VA – Service | Invesco Oppenheimer V.I. Discovery Mid Cap Growth Fund – Series II |
| Oppenheimer Global Fund/VA – Service | Invesco Oppenheimer V.I. Global Fund – Series II |
| Oppenheimer International Growth Fund/VA – Service | Invesco Oppenheimer V.I. International Growth Fund – Series II |
| Oppenheimer Main Street Small Cap Fund – Service | Invesco Oppenheimer V.I. Main Street Small Cap Fund® – Series II |
| Portfolio | Investment Objective | Investment Advisor |
| Invesco Oppenheimer V.I. Discovery Mid Cap Growth Fund – Series II | The Fund seeks capital appreciation. | Invesco Advisers, Inc. |
| Invesco Oppenheimer V.I. Global Fund – Series II | The Fund seeks capital appreciation. | |
| Invesco Oppenheimer V.I. International Growth Fund – Series II | The Fund seeks capital appreciation. | |
| Invesco Oppenheimer V.I. Main Street Small Cap Fund® – Series II | The Fund seeks capital appreciation. | |
| • | Consultant Solutions Classic |
| • | Consultant Solutions Plus |
| • | Consultant Solutions Elite |
| • | Consultant Solutions Select |
AIM Variable Insurance Funds (Invesco Variable Insurance Funds) Fidelity® Variable Insurance Products Goldman Sachs Variable Insurance Trust Janus Aspen Series Legg Mason Partners Variable Equity Trust Legg Mason Partners Variable Income Trust MFS® Variable Insurance Trust MFS® Variable Insurance Trust II | Morgan Stanley Variable Insurance Fund, Inc. (VIF) Oppenheimer Variable Account Funds PIMCO Variable Insurance Trust Rydex Variable Trust T. Rowe Price Equity Series, Inc. The Alger Portfolios VanEck VIP Trust |
| * | Certain Variable Sub-Accounts are closed to Contract owners not invested in the specified Variable Sub-Accounts by a designated date. Please see the “Investment Alternatives: the Variable Accounts” section of this prospectus for more information. |
| IMPORTANT NOTICES | The SEC has not approved or disapproved the securities described in this prospectus, nor has it passed on the accuracy or the adequacy of this prospectus. Anyone who tells you otherwise is committing a federal crime. The Contracts may be distributed through broker-dealers that have relationships with banks or other financial institutions or by employees of such banks. However, the Contracts are not deposits in, or obligations of, or guaranteed or endorsed by, such institutions or any federal regulatory agency. Investment in the Contracts involves investment risks, including possible loss of principal. The Contracts are not FDIC insured. |
| Page | |
| Overview | |
| Glossary of Terms | |
| Overview of Contracts | |
| The Contracts at a Glance | |
| How the Contracts Work | |
| Expense Tables | |
| Financial Information | |
| Contract Features | |
| The Contracts | |
| Purchases | |
| Contract Loans for 403(b) Contracts | |
| Contract Value | |
| Investment Alternatives | |
| The Variable Sub-accounts | |
| The Fixed Account Options | |
| Transfers | |
| Expenses | |
| Access to Your Money | |
| Income Payments | |
| Death Benefits | |
| Other Information | |
| Description of Lincoln Benefit Life Company and the Variable Account | |
| Taxes | |
| About Lincoln Benefit Life Company | |
| Statement of Additional Information Table of Contents | |
| Appendix A – Contract Comparison Chart | A-1 |
| Appendix B – Market Value Adjustment | B-1 |
| Appendix C – Example of Calculation of Income Protection Benefit | C-1 |
| Appendix D – Withdrawal Adjustment Example – Death Benefits | D-1 |
| Appendix E – Calculation of Enhanced Earnings Death Benefit | E-1 |
| Appendix F – Withdrawal Adjustment Example – Accumulation Benefit | F-1 |
| Appendix G – SureIncome Withdrawal Benefit Option Calculation Examples | G-1 |
| Appendix H – Accumulation Unit Values | F-1 |
| • | Primary Beneficiary- the person who may, in accordance with the terms of the Contract, elect to receive the death settlement (“Death Proceeds”) or become the new Contract Owner pursuant to the Contract if the sole surviving Contract Owner dies before the Payout Start Date. If the sole surviving Contract Owner dies after the Payout Start Date, the Beneficiary will receive any guaranteed income payments scheduled to continue. |
| • | Contingent Beneficiary- the person selected by the Contract Owner who will exercise the rights of the Primary Beneficiary if all named Primary Beneficiaries die before the death of the sole surviving Contract Owner. |
| • | The Consultant Solutions Classic Contract has a mortality and expense risk charge of 1.25%, an administrative expense charge of 0.10%*, and a withdrawal charge of up to 7% with a 7-year withdrawal charge period; |
| • | The Consultant Solutions Plus Contract offers a Credit Enhancement of up to 5% on purchase payments, a mortality and expense risk charge of 1.45%, an administrative expense charge of 0.10%*, and a withdrawal charge of up to 8.5% with an 8-year withdrawal charge period; |
| • | The Consultant Solutions Elite Contract has a mortality and expense risk charge of 1.60%, an administrative expense charge of 0.10%*, and a withdrawal charge of up to 7% with a 3-year withdrawal charge period; and |
| • | The Consultant Solutions Select Contract has a mortality and expense risk charge of 1.70%, an administrative expense charge of 0.10%*, and no withdrawal charges. |
| * | The administrative expense charge may be increased, but will never exceed 0.25%. Once your Contract is issued, we will not increase the administrative expense charge for your Contract. |
| Flexible Payments | We are no longer offering new Contracts. You can add to your Contract as often and as much as you like, but each subsequent payment must be at least $1,000 ($100 for automatic payments). We reserve the right to accept a lesser initial purchase payment amount for each Contract. We may limit the cumulative amount of purchase payments to a maximum of $1,000,000 in any Contract. You must maintain a minimum Contract Value of $1,000. For Consultant Solutions Plus Contracts, each time you make a purchase payment, we will add to your Contract Value a Credit Enhancement of up to 5% of such purchase payment. |
| Trial Examination Period | You may cancel your Contract within 20 days of receipt or any longer period as your state may require (“Trial Examination Period”). Upon cancellation, we will return your purchase payments adjusted, to the extent federal or state law permits, to reflect the investment experience of any amounts allocated to the Variable Account, including the deduction of mortality and expense risk charges and administrative expense charges. If you cancel your Contract during the Trial Examination Period, the amount we refund to you will not include any Credit Enhancement. The amount you receive will be less applicable federal and state income tax withholding. See “Trial Examination Period” for details. |
| Expenses | Each Portfolio pays expenses that you will bear indirectly if you invest in a Variable Sub-account. You also will bear the following expenses: Consultant Solutions Classic Contracts • Annual mortality and expense risk charge equal to 1.25% of daily net assets. • Withdrawal charges ranging from 0% to 7% of purchase payments withdrawn. Consultant Solutions Plus Contracts • Annual mortality and expense risk charge equal to 1.45% of daily net assets. • Withdrawal charges ranging from 0% to 8.5% of purchase payments withdrawn. Consultant Solutions Elite Contracts • Annual mortality and expense risk charge equal to 1.60% of daily net assets. • Withdrawal charges ranging from 0% to 7% of purchase payments withdrawn. Consultant Solutions Select Contracts • Annual mortality and expense risk charge equal to 1.70% of daily net assets. • No withdrawal charges. |
All Contracts • Annual administrative expense charge of 0.10% daily net assets (up to 0.25% for future Contracts). • Annual contract maintenance charge of $40 (reduced to $30 if Contract Value is at least $2000 and waived in certain cases). • If you select the Maximum Anniversary Value (MAV) Enhanced Death Benefit Option (“MAV Death Benefit Option”), you will pay an additional mortality and expense risk charge of 0.20% (up to 0.50% for Options added in the future). • If you select the Annual Increase Enhanced Death Benefit Option (“Annual Increase Death Benefit Option”), you will pay an additional mortality and expense risk charge of 0.30% (up to 0.50% for options added in the future). • If you select the Enhanced Earnings Death Benefit Option, you will pay an additional mortality and expense risk charge of 0.25% or 0.40% (up to 0.35% or 0.50% for Options added in the future) depending on the age of the oldest Owner, the Co-Annuitant, and/or oldest Annuitant on the date we receive the completed application or request to add the benefit, whichever is later (“Rider Application Date”). • If you select the TrueReturn Accumulation Benefit Option, you would pay an additional annual fee (“Rider Fee”) of 0.50% (up to 1.25% for Options added in the future) of the Benefit Base in effect on each Contract anniversary (“Contract Anniversary”) during the Rider Period. You may not select the TrueReturn Accumulation Benefit Option together with the SureIncome Withdrawal Benefit Option. • If you select the SureIncome Withdrawal Benefit Option (“SureIncome Option”), you would pay an additional annual fee (“SureIncome Option Fee”) of 0.50% (up to 1.25% for Options added in the future) of the Benefit Base on each Contract Anniversary (See the SureIncome Option Fee section). You may not select the SureIncome Option together with the TrueReturn Accumulation Benefit Option. • If you select the Income Protection Benefit Option, you will pay an additional mortality and expense risk charge of 0.50% (up to 0.75% for Options added in the future) during the Payout Phase of your Contract. • If you select the Spousal Protection Benefit (Co-Annuitant) Option, you would pay an additional annual fee (“Rider Fee”) of 0.10% (up to 0.15% for Options added in the future) of the Contract Value (“Contract Value”) on each Contract Anniversary. This Option is available only for Individual Retirement Annuity (“IRA”) Contracts qualified under Section 408 of the Code. For Contracts purchased on or after May 1, 2005, we may discontinue offering the Spousal Protection Benefit (Co-Annuitant) Option at any time. No Rider Fee is charged for the Spousal Protection Benefit (Co-Annuitant) Option for Contract Owners who added the Option prior to May 1, 2005. • Transfer fee equal to 1.00% (subject to increase to up to 2.00%) of the amount transferred after the 12th transfer in any Contract Year (“Contract Year”), but not more than $25. A Contract Year is measured from the date we issue your Contract or a Contract Anniversary. • State premium tax (if your state imposes one) • Not all Options are available in all states • We may discontinue offering any of these Options at any time. | |
| Investment Alternatives | Each Contract offers several investment alternatives including: • Fixed Account Options that credit interest at rates we guarantee, and • Variable Sub-accounts investing in Portfolios offering professional money management by these investment advisers: • Fidelity® Management & Research Company (FMR) • Fred Alger Management, Inc. • Goldman Sachs Asset Management, L.P. • Guggenheim Investments • Invesco Advisers, Inc. • Janus Capital Management LLC • Legg Mason Partners Fund Advisor, LLC • MFS® Investment Management • Morgan Stanley Investment Management Inc. • OppenheimerFunds, Inc. • Pacific Investment Management Company LLC • T. Rowe Price Associates, Inc. • Van Eck Associates Corporation Not all Fixed Account Options are available in all states or with all Contracts. To find out current rates being paid on the Fixed Account Option(s), or to find out how the Variable Sub-accounts have performed, please call us at 800-457-7617. |
| Special Services | For your convenience, we offer these special services: • Automatic Portfolio Rebalancing Program • Automatic Additions Program • Dollar Cost Averaging Program • Systematic Withdrawal Program • TrueBalanceSM Asset Allocation Program |
| Income Payments | You can choose fixed income payments, variable income payments, or a combination of the two. You can receive your income payments in one of the following ways (you may select more than one income plan): • life income with guaranteed number of payments • joint and survivor life income with guaranteed number of payments • guaranteed number of payments for a specified period • life income with cash refund • joint life income with cash refund • life income with installment refund • joint life income with installment refund In addition, we offer an Income Protection Benefit Option that guarantees that your variable income payments will not fall below a certain level. |
| Death Benefits | If you die before the Payout Start Date, we will pay a death benefit subject to the conditions described in the Contract. In addition to the death benefit included in your Contract (“ROP Death Benefit”), the death benefit options we currently offer include: • MAV Death Benefit Option; • Annual Increase Death Benefit Option; and • Enhanced Earnings Death Benefit Option. |
| Transfers | Before the Payout Start Date, you may transfer your Contract Value among the investment alternatives, with certain restrictions. The minimum amount you may transfer is $100 or the amount remaining in the investment alternative, if less. The minimum amount that can be transferred into the Standard Fixed Account or Market Value Adjusted Account Options is $100. A charge may apply after the 12th transfer in each Contract Year. |
| Withdrawals | You may withdraw some or all of your Contract Value at any time during the Accumulation Phase and during the Payout Phase in certain cases. In general, you must withdraw at least $50 at a time. If any withdrawal reduces your Contract Value to less than $1,000, we will treat the request as a withdrawal of the entire Contract Value, unless the SureIncome Withdrawal Benefit Option is in effect under your Contract. Withdrawals taken prior to annuitization (referred to in this prospectus as the Payout Phase) are generally considered to come from the earnings in the Contract first. If the Contract is tax-qualified, generally all withdrawals are treated as distributions of earnings. Withdrawals of earnings are taxed as ordinary income and, if taken prior to age 59 1/2, may be subject to an additional 10% federal tax penalty. A withdrawal charge and a Market Value Adjustment may also apply. |
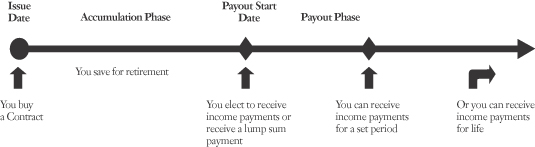
| Number of Complete Years Since We Received the Purchase Payment Being Withdrawn/Applicable Charge: | |||||||||
| Contract: | 0 | 1 | 2 | 3 | 4 | 5 | 6 | 7 | 8+ |
| Consultant Solutions Classic | 7% | 7% | 6% | 5% | 4% | 3% | 2% | 0% | 0% |
| Consultant Solutions Plus | 8.5% | 8.5% | 8.5% | 7.5% | 6.5% | 5.5% | 4% | 2.5% | 0% |
| Consultant Solutions Elite: | 7% | 6% | 5% | 0% | 0% | 0% | 0% | 0% | 0% |
| Consultant Solutions Select: | None | ||||||||
| All Contracts: | |||||||||
| Annual Contract Maintenance Charge | $40** | ||||||||
| Transfer Fee | up to 2.00% of the amount transferred, but not more than $25*** | ||||||||
| Premium Taxes | 0% to 3.50% of Purchase Payment**** | ||||||||
| Loan Interest Rate | 7.25%***** | ||||||||
| Basic Contract (without any optional benefit) | Mortality and Expense Risk Charge | Administrative Expense Charge* | Total Variable Account Annual Expense |
| Consultant Solutions Classic | 1.25% | 0.10% | 1.35% |
| Consultant Solutions Plus | 1.45% | 0.10% | 1.55% |
| Consultant Solutions Elite | 1.60% | 0.10% | 1.70% |
| Consultant Solutions Select | 1.70% | 0.10% | 1.80% |
| MAV Death Benefit Option | Currently 0.20%, up to a maximum of 0.50% for Options added in the future * |
| Annual Increase Death Benefit Option | Currently 0.30%, up to a maximum of 0.50% for Options added in the future * |
| Enhanced Earnings Death Benefit Option (issue age 0-70) | Currently 0.25%, up to a maximum of 0.35% for Options added in the future * |
| Enhanced Earnings Death Benefit Option (issue age 71-79) | Currently 0.40%, up to a maximum of 0.50% for Options added in the future * |
Contract with the MAV Death Benefit Option, Annual Increase Death Benefit Option, and Enhanced Earnings Death Benefit Option (issue age 71-79) | Mortality and Expense Risk Charge* | Administrative Expense Charge* | Total Variable Account Annual Expense |
| Consultant Solutions Classic | 2.15% | 0.10% | 2.25% |
| Consultant Solutions Plus | 2.35% | 0.10% | 2.45% |
| Consultant Solutions Elite | 2.50% | 0.10% | 2.60% |
| Consultant Solutions Select | 2.60% | 0.10% | 2.70% |
| TrueReturn Accumulation Benefit Option | Currently 0.50%, up to a maximum of 1.25% for Options added in the future. * |
| Spousal Protection Benefit (Co-Annuitant) Option | Currently 0.10%, up to a maximum of 0.15% for Options added in the future * |
| SureIncome Withdrawal Benefit Option | Currently 0.50%, up to a maximum of 1.25% for SureIncome Options added in the future * |
| Income Protection Benefit Option | Currently 0.50%, up to a maximum of 0.75% for Options added in the future* |
| Minimum | Maximum | |
| Total Annual Portfolio Operating Expenses(1) (expenses that are deducted from Portfolio assets, which may include management fees, distribution and/or services (12b-1) fees, and other expenses) | 0.35% | 1.62% |
| (1) | Expenses are shown as a percentage of Portfolio average daily net assets (before any waiver or reimbursement) as of December 31, 2018. |
| • | invested $10,000 in the Contract for the time periods indicated; |
| • | earned a 5% annual return on your investment; |
| • | allocate all of your Account Value to the sub-Account with the Maximum Total Annual Portfolio Operating Expenses as listed in the Expense Table, and these remain the same each year* |
| • | elected the MAV Death Benefit Option and the Annual Increase Death Benefit Option; the Enhanced Earnings Death Benefit Option (assuming issue age 71-79); the Spousal Protection Benefit (Co-Annuitant) Option; and the TrueReturn Accumulation Benefit Option or SureIncome Withdrawal Benefit Option.** |
| • | No tax charge applies. |
| • | For each charge, we deduct the maximum charge rather than current charge. |
| • | You make no transfers, or other transactions for which we charge a fee. |
| CONSULTANT SOLUTIONS CLASSIC | ||||
| Assuming Maximum Total Annual Portfolio Operating Expenses | ||||
| 1 Year | 3 Years | 5 Years | 10 Years | |
| If you surrender your annuity at the end of the applicable time period: | $1,324 | $2,454 | $3,458 | $5,956 |
If you annuitize your annuity at the end of the applicable time period: 1 | $624 | $1,854 | $3,058 | $5,956 |
If you do not surrender your annuity: | $624 | $1,854 | $3,058 | $5,956 |
| CONSULTANT SOLUTIONS PLUS | ||||
| Assuming Maximum Total Annual Portfolio Operating Expenses | ||||
| 1 Year | 3 Years | 5 Years | 10 Years | |
| If you surrender your annuity at the end of the applicable time period: | $1,494 | $2,760 | $3,796 | $6,102 |
If you annuitize your annuity at the end of the applicable time period: 1 | $644 | $1,910 | $3,146 | $6,102 |
If you do not surrender your annuity: | $644 | $1,910 | $3,146 | $6,102 |
| CONSULTANT SOLUTIONS ELITE | ||||
| Assuming Maximum Total Annual Portfolio Operating Expenses | ||||
| 1 Year | 3 Years | 5 Years | 10 Years | |
| If you surrender your annuity at the end of the applicable time period: | $1,359 | $2,453 | $3,211 | $6,209 |
If you annuitize your annuity at the end of the applicable time period: 1 | $659 | $1,953 | $3,211 | $6,209 |
If you do not surrender your annuity: | $659 | $1,953 | $3,211 | $6,209 |
| CONSULTANT SOLUTIONS SELECT | ||||
| Assuming Maximum Total Annual Portfolio Operating Expenses | ||||
| 1 Year | 3 Years | 5 Years | 10 Years | |
| If you surrender your annuity at the end of the applicable time period: | $670 | $1,981 | $3,255 | $6,280 |
If you annuitize your annuity at the end of the applicable time period: 1 | $670 | $1,981 | $3,255 | $6,280 |
If you do not surrender your annuity: | $670 | $1,981 | $3,255 | $6,280 |
| • | the investment alternatives during the Accumulation and Payout Phases, |
| • | the amount and timing of your purchase payments and withdrawals, |
| • | the programs you want to use to invest or withdraw money, |
| • | the income payment plan(s) you want to use to receive retirement income, |
| • | the Annuitant (either yourself or someone else) on whose life the income payments will be based, |
| • | the Beneficiary or Beneficiaries who will receive the benefits that the Contract provides when the last surviving Contract Owner dies, or, if the Contract Owner is a non-living person, an Annuitant dies, and |
| • | any other rights that the Contract provides, including restricting income payments to Beneficiaries. |
| • | the individually owned Contract must be either a traditional, Roth or Simplified Employee Pension IRA; |
| • | the Contract Owner must be age 90 or younger on the Rider Application Date; |
| • | and the Co-Annuitant must be age 79 or younger on the Rider Application Date; and |
| • | the Co-Annuitant must be the sole Primary Beneficiary under the Contract. |
| • | your spouse or, if he or she is no longer living, |
| • | your surviving children equally, or if you have no surviving children, |
| • | your estate. |
Additional Credit Enhancement for Large Contracts | Cumulative Purchase Payments less Cumulative Withdrawals must exceed: |
| 0.50% of the purchase payment | $500,000 |
| 1.00% of the purchase payment | $1,000,000 |
| • | your Variable Account purchase payments; and |
| • | any portion of the Credit Enhancement assigned to the Variable Sub-accounts. |
| (a) | equals $50,000 minus the excess of the highest outstanding loan balance during the prior 12 months over the current outstanding loan balance; and |
| (b) | equals the greater of $10,000 or half of the amount available for full withdrawal. |
| (1) | the Death Proceeds; |
| (2) | full withdrawal proceeds; |
| (3) | the amount available for partial withdrawal; and |
| (4) | the amount applied on the Payout Start Date to provide income payments. |
| • | changes in the share price of the Portfolio in which the Variable Sub-Account invests, and |
| • | the deduction of amounts reflecting the mortality and expense risk charge and, administrative expense charge, and the cost of each optional benefit since we last calculated the Accumulation Unit Value. |
| • | notifying us in writing in a form satisfactory to us; or |
| • | changing your investment allocations or making other changes so that that the allocation of investment alternatives no longer adheres to the investment requirements for the TrueReturn Accumulation Benefit Option. For more information regarding investment requirements for this Option, see the “Investment Requirements” section below. |
| AB Factors | ||
Rider Period (number of years) | Guarantee Option 1 | Guarantee Option 2 |
| 8 | 100.0% | NA |
| 9 | 112.5% | NA |
| 10 | 125.0% | 100.0% |
| 11 | 137.5% | 110.0% |
| 12 | 150.0% | 120.0% |
| 13 | 162.5% | 130.0% |
| 14 | 175.0% | 140.0% |
| 15 | 187.5% | 150.0% |
| 16 | 200.0% | 160.0% |
| 17 | 212.5% | 170.0% |
| 18 | 225.0% | 180.0% |
| 19 | 237.5% | 190.0% |
| 20 | 250.0% | 200.0% |
| Guarantee Option: | 1 |
| Rider Period: | 15 |
| AB Factor: | 187.5% |
| Rider Date: | 1/2/04 |
| Rider Maturity Date: | 1/2/19 |
| Benefit Base on Rider Date: | $50,000 |
| Benefit Base on rider Maturity Date: | $50,000 |
| On the Rider Maturity Date (1/2/19): | |
| Accumulation Benefit | = Benefit Base on Rider Maturity Date × AB Factor |
| = $50,000 × 187.5% | |
| = $93,750 | |
| Guarantee Option: | 2 |
| Rider Period: | 15 |
| AB Factor: | 150.0% |
| Rider Date: | 1/2/04 |
| Rider Maturity Date: | 1/2/19 |
| Benefit Base on Rider Date: | $50,000 |
| Benefit Base on rider Maturity Date: | $50,000 |
| On the Rider Maturity Date (1/2/19): | |
| Accumulation Benefit | = Benefit Base on Rider Maturity Date × AB Factor |
| = $50,000 × 150.0% | |
| = $75,000 | |
| • | The Benefit Base will be increased by purchase payments (and Credit Enhancements for Consultant Solutions Plus Contracts) made prior to or on the first Contract Anniversary following the Rider Date. Subject to the terms and conditions of your Contract, you may add purchase payments after this date, but they will not be included in the calculation of the Benefit Base. Therefore, if you plan to make purchase payments after the first Contract Anniversary following the Rider Date, you should consider carefully whether this Option is appropriate for your needs. |
| • | The Benefit Base will be decreased by a Withdrawal Adjustment for each withdrawal you make. The Withdrawal Adjustment is equal to (a) divided by (b), with the result multiplied by (c), where: |
| (a) | = the withdrawal amount; |
| (b) | = the Contract Value immediately prior to the withdrawal; and |
| (c) | = the Benefit Base immediately prior to the withdrawal. |
| 1) | to a model portfolio option (“Model Portfolio Option”) available with the Guarantee Option you selected, as defined below; or |
| 2) | to the DCA Fixed Account Option and then transfer all purchase payments (and Credit Enhancements for Consultant Solutions Plus Contracts) and interest according to a Model Portfolio Option available for use with the Guarantee Option you selected; or |
| 3) | to a combination of (1) and (2) above. |
| Guarantee Option 1 | Guarantee Option 2 |
* Model Portfolio Option 1 * TrueBalance Conservative Model Portfolio Option * TrueBalance Moderately Conservative Model Portfolio Option | * Model Portfolio Option 2 * TrueBalance Conservative Model Portfolio Option * TrueBalance Moderately Conservative Model Portfolio Option * TrueBalance Moderate Model Portfolio Option * TrueBalance Moderately Aggressive Model Portfolio Option * TrueBalance Aggressive Model Portfolio Option |
| Model Portfolio Option 1 |
| 20% Category A |
| 50% Category B |
| 30% Category C |
| 0% Category D |
| Category A |
Fidelity® VIP Government Money Market – Service Class 2 Sub-Account (10) |
| Category B |
Fidelity® VIP Investment Grade Bond – Service Class 2 Sub-Account |
| Western Asset Variable Global High Yield Bond Portfolio – Class II Sub-Account |
MFS® High Yield Portfolio – Service Class Sub-Account |
PIMCO International Bond Portfolio (U.S. Dollar-Hedged) – Administrative Shares Sub-Account (11) |
| PIMCO Real Return Portfolio – Administrative Shares Sub-Account |
PIMCO Total Return Portfolio - Administrative Shares Sub-Account (5) |
Morgan Stanley VIF U.S. Real Estate Portfolio, Class II Sub-Account (8) |
| Invesco V.I. Government Securities Fund, Series II Sub-Account |
| Category C |
Invesco V.I. Value Opportunities Fund – Series II Sub-Account (2) |
Invesco V.I. Core Equity Fund – Series II Sub-Account (9) |
Invesco V.I. Mid Cap Core Equity Fund – Series II Sub-Account (7) |
Fidelity® VIP ContrafundSM Portfolio – Service Class 2 Sub-Account |
Fidelity® VIP Equity-Income PortfolioSM – Service Class 2 Sub-Account |
| Fidelity® VIP Index 500 Portfolio – Service Class 2 Sub-Account |
| Fidelity® VIP Overseas Portfolio – Service Class 2 Sub-Account |
Fidelity® VIP Asset Manager Portfolio – Service Class 2 Sub-Account |
| Janus Henderson Overseas Portfolio – Service Shares Sub-Account |
| Janus Henderson Forty Portfolio – Service Shares Sub-Account |
Janus Henderson Mid Cap Value Portfolio – Service Shares Sub-Account (6) |
| Janus Henderson Balanced Portfolio – Service Shares Sub-Account |
| ClearBridge Variable Large Cap Value Portfolio – Class I Sub-Account |
MFS® Investors Trust Series – Service Class Sub-Account |
MFS® Total Return Series – Service Class Sub-Account |
MFS® Massachusetts Investors Growth Stock Portfolio – Service Class Sub-Account (4) |
MFS® Value Series – Service Class Sub-Account |
Oppenheimer Discovery Mid Cap Growth Fund/VA – Service Sub-Account (1) |
| Oppenheimer Main Street Small Cap Fund – Class 2 Shares Sub-Account |
| Guggenheim VIF Long Short Equity Sub-Account |
| T. Rowe Price Equity Income Portfolio – II Sub-Account |
| T. Rowe Price Blue Chip Growth Portfolio – II Sub-Account |
| Invesco V.I. Growth and Income Fund, Series II Sub-Account |
| Category D (Variable Sub-Accounts not available under Model Portfolio Option 1) |
| Invesco V.I. American Franchise Fund – Series II Sub-Account |
| Alger Large Cap Growth Portfolio – Class S Sub-Account |
| Alger Capital Appreciation Portfolio – Class S Sub-Account |
Alger Mid Cap Growth Portfolio – Class S Sub-Account (3) |
| Fidelity® VIP Growth Portfolio – Service Class 2 Sub-Account |
MFS® New Discovery Series – Service Class Sub-Account |
| Oppenheimer Global Fund/VA – Service Shares Sub-Account |
| Morgan Stanley VIF Growth Portfolio, Class II Sub-Account |
| VanEck VIP Emerging Markets Fund Sub-Account |
| VanEck VIP Global Hard Assets Fund Sub-Account |
| Invesco V.I. Mid Cap Growth Fund – Series II Sub-Account |
| 1) | Effective as of August 30, 2010, the following Variable Sub-Account closed to all Contract Owners except those Contract Owners who had contract value invested in the Variable Sub-Account as of the closure date: |
| 2) | Effective August 19, 2011, the Invesco V.I. Value Opportunities – Series II Sub-Account closed to all Contract Owners except those Contract Owners who had contract value invested in the Variable Sub-Account as of the closure date. Contract Owners who had contract value invested in the Variable Sub-Account as of the closure date may continue to submit additional investments into the Variable Sub-Account thereafter, although they will not be permitted to invest in the Variable Sub-Account if they withdraw or otherwise transfer their entire contract value from the Variable Sub-Account following the closure date. Contract Owners who did not have contract value invested in the Variable Sub-Account as of the closure date may not invest in the Variable Sub-Account. |
| 3) | Effective as of January 31, 2014, the Alger Mid-Cap Growth – Class S Sub-Account was closed to all Contract Owners except those Contract Owners who had contract value invested in the Variable Sub-Account as of the closure date. Contract Owners who had contract value invested in the Variable Sub-Account as of the closure date may continue to submit additional investments into the Variable Sub-Account thereafter, although they will not be permitted to invest in the Variable Sub-Account if they withdrew or otherwise transferred their entire contract value from the Variable Sub-Account following the closure date. Contract Owners who did not have contract value invested in the Variable Sub-Account as of the closure date will not be permitted to invest in the Variable Sub-Account. |
| 4) | On or about March 27, 2015, the MFS® Massachusetts Investors Growth Stock Portfolio – Service Class, a portfolio of MFS® Variable Insurance Trust II, acquired the MFS® Investors Growth Stock Series – Service Class, a series of MFS® Variable Insurance Trust. |
| 5) | We previously notified you that, effective May 1, 2015, the PIMCO Total Return - Administrative Shares sub-account was closed to all contract owners except those contract owners who had Account Value invested in the variable sub-account, and that we had intended to remove it as an investment option and substitute a new investment option under your Variable Annuity contract. However, we are no longer planning to remove this sub-account or substitute a new investment option. As a result, effective February 5, 2018, the PIMCO Total Return - Administrative Shares sub-account is available to all contract owners. |
| 6) | Effective April 13, 2015, the Janus Henderson Mid Cap Value Portfolio – Service Shares sub-account was closed to all contract owners except those contract owners who have contract value invested in the variable sub-account as of the closure date. Contract owners who have contract value invested in the variable sub-account as of the closure date may continue to submit additional investments into the variable sub-account thereafter, although they will not be permitted to invest in the variable sub-account if they withdraw or otherwise transfer their entire contract value from the variable sub-account following the closure date. Contract owners who do not have contract value invested in the variable sub-account as of the closure date will not be permitted to invest in the variable sub-account thereafter. |
| 7) | Effective September 1, 2015, the Invesco V.I. Mid Cap Core Equity Fund – Series II sub-account was closed to all contract owners except those contract owners who have contract value invested in the variable sub-account as of the closure date. Contract owners who have contract value invested in the variable sub-account as of the closure date may continue to submit additional investments into the variable sub-account thereafter, although they will not be permitted to invest in the variable sub-account if they withdraw or otherwise transfer their entire contract value from the variable sub-account following the closure date. Contract owners who do not have contract value invested in the variable sub-account as of the closure date will not be permitted to invest in the variable sub-account thereafter. |
| 8) | Effective February 23, 2016, the VIF U.S. Real Estate Portfolio, Class II sub-account was closed to all contract owners except those contract owners who have contract value invested in the variable sub-account as of the closure date. Contract owners who have contract value invested in the variable sub-account as of the closure date may continue to submit additional investments into the variable sub-account thereafter, although they will not be permitted to invest in the variable sub-account if they withdraw or otherwise transfer their entire contract value from the variable sub-account following the closure date. Contract owners who do not have contract value invested in the variable sub-account as of the closure date will not be permitted to invest in the variable sub-account thereafter. |
| 9) | Effective December 23, 2016, the Invesco V.I. Core Equity Series II sub-account was closed to all contract owners except those contract owners who have contract value invested in the variable sub-account as of the closure date. Contract owners who have contract value invested in the variable sub-account as of the closure date may continue to submit additional investments into the variable sub-account thereafter, although they will not be permitted to invest in the variable sub-account if they withdraw or otherwise transfer their entire contract value from the variable sub-account following the closure date. Contract owners who do not have contract value invested in the variable sub-account as of the closure date will not be permitted to invest in the variable sub-account thereafter. |
| 10) | Effective September 23, 2016, the PIMCO Money Market Portfolio - Administrative Shares sub-account was liquidated and any contract value remaining in the sub-account was transferred to the Fidelity® VIP Government Money Market Portfolio - Service Class 2. |
| 11) | Effective on or about July 30, 2018, the PIMCO Foreign Bond Portfolio (U.S. Dollar-Hedged) - Administrative Shares sub-account changed its name to the PIMCO International Bond Portfolio (U.S. Dollar-Hedged) - Administrative Shares. |
| Model Portfolio Option 2 |
| (Rider Date Prior to May 1, 2005) |
| 10% Category A |
| 20% Category B |
| 50% Category C |
| 20% Category D |
| Category A |
Fidelity® VIP Government Money Market – Service Class 2 Sub-Account (10) |
| Category B |
| Fidelity® VIP Investment Grade Bond – Service Class 2 Sub-Account |
| Western Asset Variable Global High Yield Bond Portfolio– Class II Sub-Account |
MFS® High Yield Portfolio– Service Class Sub-Account |
PIMCO International Bond Portfolio (U.S. Dollar-Hedged) – Administrative Shares Sub-Account (11) |
| PIMCO Real Return – Administrative Shares Sub-Account |
PIMCO Total Return - Administrative Shares Sub Account (4) |
Morgan Stanley VIF U.S. Real Estate Portfolio, Class II Sub-Account (7) |
| Invesco V.I. Government Securities Fund, Series II Sub-Account |
| Category C |
Invesco V.I. Value Opportunities Fund – Series II Sub-Account (9) |
Invesco V.I. Mid Cap Core Equity Fund – Series II Sub-Account (6) |
Fidelity® VIP Equity-Income PortfolioSM – Service Class 2 Sub-Account |
| Fidelity® VIP Index 500 Portfolio – Service Class 2 Sub-Account |
Fidelity® VIP Asset Manager Portfolio – Service Class 2 Sub-Account |
Janus Henderson Mid Cap Value Portfolio – Service Shares Sub-Account (5) |
| Janus Henderson Balanced Portfolio– Service Shares Sub-Account |
| ClearBridge Variable Large Cap Value Portfolio – Class I Sub-Account |
MFS® Investors Trust Series– Service Class Sub-Account |
MFS® Total Return Series – Service Class Sub-Account |
MFS® Value Series – Service Class Sub-Account |
Oppenheimer Discovery Mid Cap Growth Fund/VA – Service Sub-Account (1) |
| T. Rowe Price Equity Income Portfolio – II Sub-Account |
| Invesco V.I. Growth and Income Fund, Series II Sub-Account |
| Category D |
| Invesco V.I. American Franchise Fund – Series II Sub-Account |
Invesco V.I. Core Equity – Series II Sub-Account (8) |
| Alger Large Cap Growth Portfolio – Class S Sub-Account |
| Alger Capital Appreciation Portfolio– Class S Sub-Account |
Alger Mid Cap Growth Portfolio – Class S Sub-Account (2) |
Fidelity® VIP ContrafundSM Portfolio – Service Class 2 Sub-Account |
Fidelity® VIP Growth Portfolio– Service Class 2 Sub-Account |
Fidelity® VIP Overseas Portfolio– Service Class 2 Sub-Account |
| Janus Henderson Overseas Portfolio – Service Shares Sub-Account |
| Janus Henderson Forty Portfolio– Service Shares Sub-Account |
MFS® New Discovery Series– Service Class Sub-Account |
MFS® Massachusetts Investors Growth Stock Portfolio– Service Class Sub-Account (3) |
| Oppenheimer Global Fund/VA – Service Shares Sub-Account |
| Oppenheimer Main Street Small Cap Fund – Class 2 Shares Sub-Account |
| Guggenheim VIF Long Short Equity Sub-Account |
| T. Rowe Price Blue Chip Growth Portfolio – II Sub-Account |
| Morgan Stanley VIF Growth Portfolio, Class II Sub-Account |
| VanEck VIP Emerging Markets Sub-Account |
| VanEck VIP Global Hard Assets Sub-Account |
| Invesco V.I. Mid Cap Growth Fund, Series II Sub-Account |
| 1) | Effective as of August 30, 2010, the following Variable Sub-Account closed to all Contract Owners except those Contract Owners who had contract value invested in the Variable Sub-Account as of the closure date: |
| 2) | Effective as of January 31, 2014, the Alger Mid-Cap Growth – Class S Sub-Account was closed to all Contract Owners except those Contract Owners who had contract value invested in the Variable Sub-Account as of the closure date. Contract Owners who had contract value invested in the Variable Sub-Account as of the closure date may continue to submit additional investments into the Variable Sub-Account thereafter, although they will not be permitted to invest in the Variable Sub-Account if they withdrew or otherwise transferred their entire contract value from the Variable Sub-Account following the closure date. Contract Owners who did not have contract value invested in the Variable Sub-Account as of the closure date will not be permitted to invest in the Variable Sub-Account. |
| 3) | On or about March 27, 2015, the MFS® Massachusetts Investors Growth Stock Portfolio – Service Class, a portfolio of MFS® Variable Insurance Trust II, acquired the MFS® Investors Growth Stock Series – Service Class, a series of MFS® Variable Insurance Trust. |
| 4) | We previously notified you that, effective May 1, 2015, the PIMCO Total Return - Administrative Shares sub-account was closed to all contract owners except those contract owners who had Account Value invested in the variable sub-account, and that we had intended to remove it as an investment option and substitute a new investment option under your Variable Annuity contract. However, we are no longer planning to remove this sub-account or substitute a new investment option. As a result, effective February 5, 2018, the PIMCO Total Return - Administrative Shares sub-account is available to all contract owners. |
| 5) | Effective April 13, 2015, the Janus Henderson Mid Cap Value Portfolio– Service Shares sub-account was closed to all contract owners except those contract owners who have contract value invested in the variable sub-account as of the closure date. Contract owners who have contract value invested in the variable sub-account as of the closure date may continue to submit additional investments into the variable sub-account thereafter, although they will not be permitted to invest in the variable sub-account if they withdraw or otherwise transfer their entire contract value from the variable sub-account following the closure date. Contract owners who do not have contract value invested in the variable sub-account as of the closure date will not be permitted to invest in the variable sub-account thereafter. |
| 6) | Effective September 1, 2015, the Invesco V.I. Mid Cap Core Equity Fund – Series II sub-account was closed to all contract owners except those contract owners who have contract value invested in the variable sub-account as of the closure date. Contract owners who have contract value invested in the variable sub-account as of the closure date may continue to submit additional investments into the variable sub-account thereafter, although they will not be permitted to invest in the variable sub-account if they withdraw or otherwise transfer their entire contract value from the variable sub-account following the closure date. Contract owners who do not have contract value invested in the variable sub-account as of the closure date will not be permitted to invest in the variable sub-account thereafter. |
| 7) | Effective February 23, 2016, the VIF U.S. Real Estate Portfolio, Class II sub-account was closed to all contract owners except those contract owners who have contract value invested in the variable sub-account as of the closure date. Contract owners who have contract value invested in the variable sub-account as of the closure date may continue to submit additional investments into the variable sub-account thereafter, although they will not be permitted to invest in the variable sub-account if they withdraw or otherwise transfer their entire contract value from the variable sub-account following the closure date. Contract owners who do not have contract value invested in the variable sub-account as of the closure date will not be permitted to invest in the variable sub-account thereafter. |
| 8) | Effective December 23, 2016, the Invesco V.I. Core Equity Fund – Series II sub-account was closed to all contract owners except those contract owners who have contract value invested in the variable sub-account as of the closure date. Contract owners who have contract value invested in the variable sub-account as of the closure date may continue to submit additional investments into the variable sub-account thereafter, although they will not be permitted to invest in the variable sub-account if they withdraw or otherwise transfer their entire contract value from the variable sub-account following the closure date. Contract owners who do not have contract value invested in the variable sub-account as of the closure date will not be permitted to invest in the variable sub-account thereafter. |
| 9) | Effective August 19, 2011, the Invesco V.I. Value Opportunities – Series II Sub-Account closed to all Contract Owners except those Contract Owners who had contract value invested in the Variable Sub-Account as of the closure date. Contract Owners who had contract value invested in the Variable Sub-Account as of the closure date may continue to submit additional investments into the Variable Sub-Account thereafter, although they will not be permitted to invest in the Variable Sub-Account if they withdraw or otherwise transfer their entire contract value from the Variable Sub-Account following the closure date. Contract Owners who did not have contract value invested in the Variable Sub-Account as of the closure date may not invest in the Variable Sub-Account. |
| 10) | Effective September 23, 2016, the PIMCO Money Market Portfolio - Administrative Shares sub-account was liquidated and any contract value remaining in the sub-account was transferred to the Fidelity® VIP Government Money Market Portfolio - Service Class 2. |
| 11) | Effective on or about July 30, 2018, the PIMCO Foreign Bond Portfolio (U.S. Dollar-Hedged) - Administrative Shares sub-account changed its name to the PIMCO International Bond Portfolio (U.S. Dollar-Hedged) - Administrative Shares. |
| Model Portfolio Option 2 |
| (Rider Date on or after May 1, 2005) |
| Available |
Invesco V.I. Value Opportunities Fund – Series II Sub-Account (2) |
Invesco V.I. Core Equity – Series II Sub-Account (9) |
Invesco V.I. Mid Cap Core Equity Fund – Series II Sub-Account (7) |
Fidelity® VIP ContrafundSM Portfolio – Service Class 2 Sub-Account |
Fidelity® VIP Equity-Income PortfolioSM – Service Class 2 Sub-Account |
| Fidelity® VIP Index 500 Portfolio – Service Class 2 Sub-Account |
Fidelity® VIP Investment Grade Bond Portfolio – Service Class 2 Sub-Account |
| Fidelity® VIP Overseas Portfolio – Service Class 2 Sub-Account |
| Fidelity® VIP Asset Manager Portfolio – Service Class 2 Sub-Account |
Fidelity® VIP Government Money Market Portfolio – Service Class 2 Sub-Account (10) |
| Janus Henderson Overseas Portfolio – Service Shares Sub-Account |
| Janus Henderson Forty Portfolio– Service Shares Sub-Account |
Janus Henderson Mid Cap Value Portfolio – Service Shares Sub-Account (5) |
| Janus Henderson Balanced Portfolio– Service Shares Sub-Account |
| Western Asset Variable Global High Yield Bond – Class II Sub-Account |
| ClearBridge Variable Large Cap Value Portfolio– Class I Sub-Account |
MFS® Investors Trust Series– Service Class Sub-Account |
MFS® High Yield Portfolio– Service Class Sub-Account |
MFS® MA Investors Growth Stock Series – Service Class Sub-Account (4) |
MFS® Total Return Series – Service Class Sub-Account |
MFS® Value Series– Service Class Sub-Account |
PIMCO International Bond Portfolio (U.S. Dollar-Hedged) – Administrative Shares Sub-Account (11) |
| PIMCO Real Return – Administrative Shares Sub-Account |
PIMCO Total Return – Administrative Shares Sub Account (6) |
Oppenheimer Discovery Mid Cap Growth Fund/VA –Service Sub-Account (1) |
| Oppenheimer Main Street Small Cap Fund – Class 2 Shares |
| Guggenheim VIF Long Short Equity Sub-Account |
| T. Rowe Price Equity Income Portfolio – II Sub-Account |
| T. Rowe Price Blue Chip Growth Portfolio– II Sub-Account |
Morgan Stanley VIF U.S. Real Estate Portfolio, Class II Sub-Account (8) |
| Invesco V.I. Growth and Income Fund, Series II Sub-Account |
| Invesco V.I. Government Securities Fund, Series II Sub-Account |
| Model Portfolio Option 2 |
| (Rider Date on or after May 1, 2005) |
| Excluded |
| Invesco V.I. American Franchise Fund – Series II Sub-Account |
| Alger Large Cap Growth Portfolio – Class S Sub-Account |
| Alger Capital Appreciation Portfolio – Class S Sub-Account |
Alger Mid Cap Growth Portfolio– Class S Sub-Account (3) |
| Fidelity® VIP Growth Portfolio– Service Class 2 Sub-Account |
MFS® New Discovery – Service Class Sub-Account |
| Oppenheimer Global Fund/VA – Service Shares Sub-Account |
Morgan Stanley VIF U.S. Real Estate Portfolio, Class II Sub-Account (8) |
| VanEck VIP Emerging Markets Sub-Account |
| VanEck VIP Global Hard Assets Sub-Account |
| Invesco V.I. Mid Cap Growth Fund, Series II Sub-Account |
| (1) | Effective as of August 30, 2010, the following Variable Sub-Account closed to all Contract Owners except those Contract Owners who had contract value invested in the Variable Sub-Account as of the closure date: Oppenheimer Discovery Mid Cap Growth/VA – Service Sub-Account |
| (2) | Effective August 19, 2011, the Invesco V.I. Value Opportunities – Series II Sub-Account closed to all Contract Owners except those Contract Owners who had contract value invested in the Variable Sub-Account as of the closure date. Contract Owners who had contract value invested in the Variable Sub-Account as of the closure date may continue to submit additional investments into the Variable Sub-Account thereafter, although they will not be permitted to invest in the Variable Sub-Account if they withdraw or otherwise transfer their entire contract value from the Variable Sub-Account following the closure date. Contract Owners who did not have contract value invested in the Variable Sub-Account as of the closure date may not invest in the Variable Sub-Account. |
| (3) | Effective as of January 31, 2014, the Alger Mid-Cap Growth – Class S Sub-Account was closed to all Contract Owners except those Contract Owners who had contract value invested in the Variable Sub-Account as of the closure date. Contract Owners who had contract value invested in the Variable Sub-Account as of the closure date may continue to submit additional investments into the Variable Sub-Account thereafter, although they will not be permitted to invest in the Variable Sub-Account if they withdrew or otherwise transferred their entire contract value from the Variable Sub-Account following the closure date. Contract Owners who did not have contract value invested in the Variable Sub-Account as of the closure date will not be permitted to invest in the Variable Sub-Account. |
| (4) | On or about March 27, 2015, the MFS® Massachusetts Investors Growth Stock Portfolio – Service Class, a portfolio of MFS® Variable Insurance Trust II, acquired the MFS® Investors Growth Stock Series – Service Class, a series of MFS® Variable Insurance Trust. |
| (5) | Effective April 13, 2015, the Janus Henderson Mid Cap Value Portfolio – Service Shares sub-account was closed to all contract owners except those contract owners who have contract value invested in the variable sub-account as of the closure date. Contract owners who have contract value invested in the variable sub-account as of the closure date may continue to submit additional investments into the variable sub-account thereafter, although they will not be permitted to invest in the variable sub-account if they withdraw or otherwise transfer their entire contract value from the variable sub-account following the closure date. Contract owners who do not have contract value invested in the variable sub-account as of the closure date will not be permitted to invest in the variable sub-account thereafter. |
| (6) | We previously notified you that, effective May 1, 2015, the PIMCO Total Return - Administrative Shares sub-account was closed to all contract owners except those contract owners who had Account Value invested in the variable sub-account, and that we had intended to remove it as an investment option and substitute a new investment option under your Variable Annuity contract. However, we are no longer planning to remove this sub-account or substitute a new investment option. As a result, effective February 5, 2018, the PIMCO Total Return - Administrative Shares sub-account is available to all contract owners. |
| (7) | Effective September 1, 2015, the Invesco V.I. Mid Cap Core Equity Fund – Series II sub-account was closed to all contract owners except those contract owners who have contract value invested in the variable sub-account as of the closure date. Contract owners who have contract value invested in the variable sub-account as of the closure date may continue to submit additional investments into the variable sub-account thereafter, although they will not be permitted to invest in the variable sub-account if they withdraw or otherwise transfer their entire contract value from the variable sub-account following the closure date. Contract owners who do not have contract value invested in the variable sub-account as of the closure date will not be permitted to invest in the variable sub-account thereafter. |
| (8) | Effective February 23, 2016, the VIF U.S. Real Estate Portfolio, Class II sub-account was closed to all contract owners except those contract owners who have contract value invested in the variable sub-account as of the closure date. Contract owners who have contract value invested in the variable sub-account as of the closure date may continue to submit additional investments into the variable sub-account thereafter, although they will not be permitted to invest in the variable sub-account if they withdraw or otherwise transfer their entire contract value from the variable sub-account following the closure date. Contract owners who do not have contract value invested in the variable sub-account as of the closure date will not be permitted to invest in the variable sub-account thereafter. |
| (9) | Effective December 23, 2016, the Invesco V.I. Core Equity Series II sub-account was closed to all contract owners except those contract owners who have contract value invested in the variable sub-account as of the closure date. Contract owners who have contract value invested in the variable sub-account as of the closure date may continue to submit additional investments into the variable sub-account thereafter, although they will not be permitted to invest in the variable sub-account if they withdraw or otherwise transfer their entire contract value from the variable sub-account following the closure date. Contract owners who do not have contract value invested in the variable sub-account as of the closure date will not be permitted to invest in the variable sub-account thereafter. |
| (10) | Effective September 23, 2016, the PIMCO Money Market Portfolio - Administrative Shares sub-account was liquidated and any contract value remaining in the sub-account was transferred to the Fidelity® VIP Government Money Market Portfolio - Service Class 2. |
| (11) | Effective on or about July 30, 2018, the PIMCO Foreign Bond Portfolio (U.S. Dollar-Hedged) - Administrative Shares sub-account changed its name to the PIMCO International Bond Portfolio (U.S. Dollar-Hedged) - Administrative Shares. |
| • | The trade-in must occur on or after the 5th Rider Anniversary and prior to the Rider Maturity Date. |
| • | The New Option will be made a part of your Contract on the date the existing TrueReturn Accumulation Benefit Option is cancelled, provided it is cancelled for reasons other than the termination of your Contract. |
| • | The New Option must be a TrueReturn Accumulation Benefit Option that we make available for use with the Rider Trade-In Option. |
| • | The issue requirements and terms and conditions of the New Option must be met as of the date the New Option is made a part of your Contract. |
| • | the new Rider Fee will be based on the Rider Fee percentage applicable to a new TrueReturn Accumulation Benefit Option at the time of trade-in; |
| • | the Benefit Base for the New Option will be based on the Contract Value as of the new Rider Date; |
| • | the AB Factor will be determined by the Rider Periods and Guarantee Options available with the New Option; |
| • | the Model Portfolio Options will be determined by the Model Portfolio Options offered with the Guarantee Options available with the New Option; |
| • | any waiting period for canceling the New Option will start again on the new Rider Date; |
| • | any waiting period for exercising the Rider Trade-In Option will start again on the new Rider Date; and |
| • | the terms and conditions of the Rider Trade-In Option will be according to the requirements of the New Option. |
| • | The trade-in must occur on or after the 5th Rider Anniversary and prior to the Rider Maturity Date. We reserve the right to extend the date at which time the trade-in may occur to up to the 10th anniversary of the Rider Date at any time in our sole |
| • | The new SureIncome Option will be made a part of your Contract on the date the existing TrueReturn Accumulation Benefit Option is cancelled, provided it is cancelled for reasons other than the termination of your Contract. |
| • | The new SureIncome Option must be a SureIncome Option that we make available for use with this Rider Trade-In Option. |
| • | The issue requirements and terms and conditions of the new SureIncome Option must be met as of the date the new SureIncome Option is made a part of your Contract. |
| • | on the Rider Maturity Date; |
| • | on the Payout Start Date; |
| • | on the date your Contract is terminated; |
| • | on the date the Option is cancelled; |
| • | on the date we receive a Complete Request for Settlement of the Death Proceeds; or |
| • | on the date the Option is replaced with a New Option under the Rider Trade-In Option. |
| • | The Contract Value multiplied by the Withdrawal Benefit Factor (currently 8% for new SureIncome Options); or |
| • | The value of the Benefit Payment of the previous Withdrawal Benefit Option (attached to your Contract) that is being terminated under a rider trade-in option (see “Rider Trade-In Option” below for more information), if applicable. |
| • | If the withdrawal is less than or equal to the Benefit Payment Remaining in effect immediately prior to the withdrawal, the Benefit Payment is unchanged. |
| • | If the withdrawal is greater than the Benefit Payment Remaining in effect immediately prior to the withdrawal, the Benefit Payment will be the lesser of: |
| • | The Benefit Payment immediately prior to the withdrawal; or |
| • | The Contract Value immediately prior to withdrawal less the amount of the withdrawal, multiplied by the Withdrawal Benefit Factor. |
| • | If the withdrawal is less than or equal to the Benefit Payment Remaining in effect immediately prior to the withdrawal, the Benefit Base will be reduced by the amount of the withdrawal. |
| • | If the withdrawal is greater than the Benefit Payment Remaining in effect immediately prior to the withdrawal, the Benefit Base will be the lesser of: |
| • | The Contract Value immediately prior to withdrawal less the amount of the withdrawal; or |
| • | The Benefit Base immediately prior to withdrawal less the amount of the withdrawal. |
| • | The “Withdrawal Benefit Payout Start Date” is the date the Withdrawal Benefit Payout Phase is entered and the Accumulation Phase of the Contract ends. |
| • | No further withdrawals, purchase payments or any other actions associated with the Accumulation Phase can be made after the Withdrawal Benefit Payout Start Date. |
| • | The Payout Start Date is the first day of the next Benefit Year after the Withdrawal Benefit Payout Start Date. We reserve the right to allow other Payout Start Dates to be requested on a nondiscriminatory basis without prior notice. |
| • | During the Withdrawal Benefit Payout Phase, we will make scheduled fixed income payments to the Owner (or new Contract Owner) at the end of each month starting one month after the Payout Start Date. The amount of each payment will be equal to the Benefit Payment divided by 12, unless a payment frequency other than monthly is requested in a form acceptable to us and received by us before the first payment is made (the amount of each payment will be adjusted accordingly; i.e. if the payment frequency requested is quarterly, the amount of each payment will be equal to the Benefit Payment divided by 4). Payments will be made over a period certain such that total payments made will equal the Benefit Base on the Payout Start Date; therefore, the final payment may be reduced. If your Contract is a qualified contract, meaning an individual retirement annuity qualified as defined under Code Section 408(b) or a Tax-Sheltered Annuity as defined under Code Section 403(b), the period certain cannot exceed that which is required by Code Section 401(a)(9) and regulations promulgated thereunder. Therefore, the amount of each payment under this Option may be larger so that the sum of the payments made over this period equals the Benefit Base on the Payout Start Date. Additionally, if your Contract is a qualified contract, we will not permit a change in the payment frequency or level. |
| • | If your Contract is a non-qualified contract, we reserve the right to allow other payment frequencies or levels to be requested on a nondiscriminatory basis without prior notice. In no event will we allow more than one change in the payment frequency or level during a Contract Year. |
| • | If the Contract Owner dies before all payments have been made, the remaining payments will continue to be made to the new Contract Owner as scheduled. |
| • | Once all scheduled payments have been paid, the Contract will terminate. |
| 1) | to a Model Portfolio Option available as described below; |
| 2) | to the DCA Fixed Account Option and then transfer all purchase payments (and Credit Enhancements for Consultant Solutions Plus Contracts) and interest to the Variable Sub-Accounts; or |
| 3) | to a combination of (1) and (2) above. |
| *Model Portfolio Option 1 |
| *TrueBalance Conservative Model Portfolio Option |
| *TrueBalance Moderately Conservative Model Portfolio Option |
| *TrueBalance Moderate Model Portfolio Option |
| *TrueBalance Moderately Aggressive Model Portfolio Option |
| *TrueBalance Aggressive Model Portfolio Option |
| Available |
Invesco V.I. Value Opportunities Fund – Series II Sub-Account (2) |
Invesco V.I. Core Equity Fund – Series II Sub-Account (9) |
Invesco V.I. Mid Cap Core Equity Fund – Series II Sub-Account (7) |
Fidelity® VIP ContrafundSM Portfolio – Service Class 2 Sub-Account |
Fidelity® VIP Equity-Income PortfolioSM – Service Class 2 Sub-Account |
| Fidelity® VIP Index 500 Portfolio– Service Class 2 Sub-Account |
| Fidelity® VIP Investment Grade Bond Portfolio – Service Class 2 Sub-Account |
| Fidelity® VIP Overseas Portfolio – Service Class 2 Sub-Account |
Fidelity® VIP Asset Manager Portfolio – Service Class 2 Sub-Account |
Fidelity® VIP Government Money Market Portfolio – Service Class 2 Sub-Account (10) |
| Janus Henderson Overseas Portfolio – Service Shares Sub-Account |
| Janus Henderson Forty Portfolio – Service Shares Sub-Account |
Janus Henderson Mid Cap Value Portfolio – Service Shares Sub-Account (5) |
| Janus Henderson Balanced Portfolio – Service Shares Sub-Account |
| Western Asset Variable Global High Yield Bond – Class II Sub-Account |
| ClearBridge Variable Large Cap Value – Class I Sub-Account |
MFS® Investors Trust Series – Service Class Sub-Account |
MFS® High Yield Portfolio- Service Class Sub-Account |
MFS® Massachusetts Investors Growth Stock Portfolio – Service Class Sub-Account (4) |
MFS® Total Return Series – Service Class Sub-Account |
MFS® Value Series– Service Class Sub-Account |
Oppenheimer Discovery Mid Cap Growth Fund/VA – Service Sub-Account (1) |
| Oppenheimer Main Street Small Cap Fund – Class 2 Shares Sub-Account |
PIMCO International Bond Portfolio (U.S. Dollar-Hedged) – Administrative Shares Sub-Account (11) |
| Fidelity® VIP Government Money Market Portfolio – Service Class 2 Sub-Account |
| PIMCO Real Return – Administrative Shares Sub-Account |
PIMCO Total Return – Administrative Shares Sub Account (6) |
| Guggenheim VIF Long Short Equity Fund Sub-Account |
| T. Rowe Price Equity Income Portfolio – II Sub-Account |
| T. Rowe Price Blue Chip Growth Portfolio – II Sub-Account |
Morgan Stanley VIF U.S. Real Estate, Class II Sub-Account (8) |
| Invesco V.I. Growth and Income Fund, Series II Sub-Account |
| Invesco V.I. Government Securities Fund, Series II Sub-Account |
| Excluded |
| Invesco V.I. American Franchise Fund– Series II Sub-Account |
| Alger Large Cap Growth Portfolio – Class S Sub-Account |
| Alger Capital Appreciation Portfolio – Class S Sub-Account |
Alger Mid Cap Growth Portfolio – Class S Sub-Account (3) |
| Fidelity® VIP Growth Portfolio – Service Class 2 Sub-Account |
MFS® New Discovery Series – Service Class Sub-Account |
| Oppenheimer Global Fund/VA – Service Shares |
| Morgan Stanley VIF Growth Portfolio - Class II Sub-Account |
| VanEck VIP Emerging Markets Fund - Initial Class Sub-Account |
| VanEck VIP Global Hard Assets Fund - Initial Class Sub-Account |
| Invesco V.I. Mid Cap Growth Fund, Series II Sub-Account |
| (1) | Effective as of August 30, 2010, the following Variable Sub-Account closed to all Contract Owners except those Contract Owners who had contract value invested in the Variable Sub-Account as of the closure date: Oppenheimer Discovery Mid Cap Growth Fund/VA – Service Sub-Account |
| (2) | Effective August 19, 2011, the Invesco V.I. Value Opportunities – Series II Sub-Account closed to all Contract Owners except those Contract Owners who had contract value invested in the Variable Sub-Account as of the closure date. Contract Owners who had contract value invested in the Variable Sub-Account as of the closure date may continue to submit additional investments into the Variable Sub-Account thereafter, although they will not be permitted to invest in the Variable Sub-Account if they withdraw or otherwise transfer their entire contract value from the Variable Sub-Account following the closure date. Contract Owners who did not have contract value invested in the Variable Sub-Account as of the closure date may not invest in the Variable Sub-Account. |
| (3) | Effective as of January 31, 2014, the Alger Mid-Cap Growth – Class S Sub-Account was closed to all Contract Owners except those Contract Owners who had contract value invested in the Variable Sub-Account as of the closure date. Contract Owners who had contract value invested in the Variable Sub-Account as of the closure date may continue to submit additional investments into the Variable Sub-Account thereafter, although they will not be permitted to invest in the Variable Sub-Account if they withdrew or otherwise transferred their entire contract value from the Variable Sub-Account following the closure date. Contract Owners who did not have contract value invested in the Variable Sub-Account as of the closure date will not be permitted to invest in the Variable Sub-Account. |
| (4) | On or about March 27, 2015, the MFS® Massachusetts Investors Growth Stock Portfolio – Service Class, a portfolio of MFS® Variable Insurance Trust II, acquired the MFS® Investors Growth Stock Series – Service Class, a series of MFS® Variable Insurance Trust. |
| (5) | Effective April 13, 2015, the Janus Henderson Mid Cap Value Portfolio– Service Shares sub-account was closed to all contract owners except those contract owners who have contract value invested in the variable sub-account as of the closure date. Contract owners who have contract value invested in the variable sub-account as of the closure date may continue to submit additional investments into the variable sub-account thereafter, although they will not be permitted to invest in the variable sub-account if they withdraw or otherwise transfer their entire contract value from the variable sub-account following the closure date. Contract owners who do not have contract value invested in the variable sub-account as of the closure date will not be permitted to invest in the variable sub-account thereafter. |
| (6) | We previously notified you that, effective May 1, 2015, the PIMCO Total Return - Administrative Shares sub-account was closed to all contract owners except those contract owners who had Account Value invested in the variable sub-account, and that we had intended to remove it as an investment option and substitute a new investment option under your Variable Annuity contract. However, we are no longer planning to remove this sub-account or substitute a new investment option. As a result, effective February 5, 2018, the PIMCO Total Return - Administrative Shares sub-account is available to all contract owners. |
| (7) | Effective September 1, 2015, the Invesco V.I. Mid Cap Core Equity Fund – Series II sub-account was closed to all contract owners except those contract owners who have contract value invested in the variable sub-account as of the closure date. Contract owners who have contract value invested in the variable sub-account as of the closure date may continue to submit additional investments into the variable sub-account thereafter, although they will not be permitted to invest in the variable sub-account if they withdraw or otherwise transfer their entire contract value from the variable sub-account following the closure date. Contract owners who do not have contract value invested in the variable sub-account as of the closure date will not be permitted to invest in the variable sub-account thereafter. |
| (8) | Effective February 23, 2016, the VIF U.S. Real Estate Portfolio, Class II sub-account was closed to all contract owners except those contract owners who have contract value invested in the variable sub-account as of the closure date. Contract owners who have contract value invested in the variable sub-account as of the closure date may continue to submit additional investments into the variable sub-account thereafter, although they will not be permitted to invest in the variable sub-account if they withdraw or otherwise transfer their entire contract value from the variable sub-account following the closure date. Contract owners who do not have contract value invested in the variable sub-account as of the closure date will not be permitted to invest in the variable sub-account thereafter. |
| (9) | Effective December 23, 2016, the Invesco V.I. Core Equity Series II sub-account was closed to all contract owners except those contract owners who have contract value invested in the variable sub-account as of the closure date. Contract owners who have contract value invested in the variable sub-account as of the closure date may continue to submit additional investments into the variable sub-account thereafter, although they will not be permitted to invest in the variable sub-account if they withdraw or otherwise transfer their entire contract value from the variable sub-account following the closure date. Contract owners who do not have contract value invested in the variable sub-account as of the closure date will not be permitted to invest in the variable sub-account thereafter. |
| (10) | Effective September 23, 2016, the PIMCO Money Market Portfolio - Administrative Shares sub-account was liquidated and any contract value remaining in the sub-account was transferred to the Fidelity® VIP Government Money Market Portfolio - Service Class 2. |
| (11) | Effective on or about July 30, 2018, the PIMCO Foreign Bond Portfolio (U.S. Dollar-Hedged) - Administrative Shares sub-account changed its name to the PIMCO International Bond Portfolio (U.S. Dollar-Hedged) - Administrative Shares. |
| • | The trade-in must occur on or after the 5th calendar year anniversary of the Rider Date. We reserve the right to extend the date at which time the trade-in may occur to up to the 10th calendar year anniversary of the Rider Date at any time in our sole discretion. Any change we make will not apply to a SureIncome Option that was added to your Contract prior to the implementation date of the change. |
| • | The New Option will be made a part of your Contract on the date the existing Option is cancelled, provided it is cancelled for reasons other than the termination of your Contract. |
| • | The New Option must be an Option that we make available for use with this Rider Trade-In Option. |
| • | The issue requirements and terms and conditions of the New Option must be met as of the date the New Option is made a part of your Contract. |
| • | The Benefit Base is reduced to zero; |
| • | On the Payout Start Date (except if the Contract enters the Withdrawal Benefit Payout Phase as defined under the Withdrawal Benefit Payout Phase section); |
| • | On the date the Contract is terminated; |
| • | On the date the SureIncome Option is cancelled; |
| • | On the date we receive a Complete Request for Settlement of the Death Proceeds; or |
| • | On the date the SureIncome Option is replaced with a New Option under the Rider Trade-In Option. |
| Portfolio: | Investment Objective: | Investment Adviser: | |
| The Alger Portfolios | |||
| Alger Capital Appreciation Portfolio – Class S | Long-term capital appreciation. | Fred Alger Management, Inc. | |
| Alger Large Cap Growth Portfolio – Class S | Long-term capital appreciation. | ||
Alger Mid Cap Growth Portfolio – Class S(3) | Long-term capital appreciation. | ||
Fidelity® Variable Insurance Products | |||
Fidelity® VIP Asset Manager Portfolio – Service Class 2 | The fund seeks to obtain high total return with reduced risk over the long term by allocating its assets among stocks, bonds, and short-term instruments. | Fidelity® Management & Research Company (FMR) | |
Fidelity® VIP ContrafundSM Portfolio – Service Class 2 | The fund seeks long-term capital appreciation. | ||
Fidelity® VIP Equity-Income PortfolioSM – Service Class 2 | The fund seeks reasonable income. The fund will also consider the potential for capital appreciation. The fund's goal is to achieve a yield which exceeds the composite yield on the securities comprising the S&P 500® Index. | ||
Fidelity® VIP Government Money Market Portfolio – Service Class 2(10) | The fund seeks as high a level of current income as is consistent with preservation of capital and liquidity. | ||
| Fidelity® VIP Growth Portfolio – Service Class 2 | The fund seeks to achieve capital appreciation. | ||
| Fidelity® VIP Index 500 Portfolio – Service Class 2 | The fund seeks investment results that correspond to the total return of common stocks publicly traded in the United States, as represented by the S&P 500® Index. | ||
Fidelity® VIP Investment Grade Bond Portfolio – Service Class 2 | The fund seeks as high a level of current income as is consistent with the preservation of capital. | ||
| Fidelity® VIP Overseas Portfolio – Service Class 2 | The fund seeks long-term growth of capital. | ||
| Goldman Sachs Variable Insurance Trust | |||
Goldman Sachs VIT Mid Cap Value Fund – Institutional(12) | Seeks long-term capital appreciation. | Goldman Sachs Asset Management, L. P. | |
| AIM Variable Insurance Funds (Invesco Variable Insurance Funds) | |||
| Invesco V.I. American Franchise Fund – Series II | Seek capital growth | Invesco Advisers, Inc. | |
Invesco V.I. Core Equity Fund - Series II(9) | Long-term growth of capital | ||
| Invesco V.I. Government Securities Fund – Series II | Total return, comprised of current income and capital appreciation | ||
| Invesco V.I. Growth and Income Fund, Series II | Seek long-term growth of capital and income | ||
Invesco V.I. Mid Cap Core Equity Fund – Series II(7) | Long-term growth of capital | ||
| Invesco V.I. Mid Cap Growth Fund, Series II | To seek capital growth | ||
Invesco V.I. Value Opportunities Fund – Series II(2) | Long-term growth of capital | ||
| Janus Aspen Series | |||
| Janus Henderson Balanced Portfolio – Service Shares | Seeks long-term capital growth, consistent with preservation of capital and balanced by current income. | Janus Capital Management LLC | |
| Janus Henderson Forty Portfolio – Service Shares | Seeks long-term growth of capital. | ||
| Janus Henderson Overseas Portfolio – Service Shares | Seeks long-term growth of capital. | ||
Janus Henderson Mid Cap Value Portfolio – Service Shares(5) | Seeks capital appreciation. | ||
| Legg Mason Partners Variable Equity Trust | |||
| ClearBridge Variable Large Cap Value Portfolio – Class I | Long-term growth of capital as its primary objective. Current income is a secondary objective. | Legg Mason Partners Fund Advisor, LLC | |
| Legg Mason Partners Variable Income Trust | |||
| Western Asset Variable Global High Yield Bond Portfolio – Class II | Seeks to maximize total return. | Legg Mason Partners Fund Advisor, LLC | |
MFS® Variable Insurance Trust | |||
MFS® Investors Trust Series - Service Class | Seeks capital appreciation. | MFS® Investment Management | |
MFS® New Discovery Series - Service Class | Seeks capital appreciation. | ||
MFS® Total Return Series - Service Class | Seeks total return. | ||
MFS® Value Series - Service Class | Seeks capital appreciation. | ||
| Portfolio: | Investment Objective: | Investment Adviser: |
MFS® Variable Insurance Trust II | ||
MFS® High Yield Portfolio - Service Class | Seeks total return with an emphasis on high current income, but also considering capital appreciation. | MFS® Investment Management |
MFS® Massachusetts Investors Growth Stock Portfolio - Service Class(4) | Seeks capital appreciation. | |
| Morgan Stanley Variable Insurance Fund, Inc. (VIF) | ||
| Morgan Stanley VIF Growth Portfolio - Class II | The Fund seeks long-term capital appreciation by investing primarily in growth-oriented equity securities of large capitalization companies. | Morgan Stanley Investment Management Inc. |
Morgan Stanley VIF U.S. Real Estate Portfolio - Class II(8) | The Fund seeks to provide above average current income and long-term capital appreciation by investing primarily in equity securities of companies in the U.S. real estate industry, including real estate investment trusts. | |
| Oppenheimer Variable Account Funds | ||
Oppenheimer Discovery Mid Cap Growth Fund/VA – Service(1) | The fund seeks capital appreciation. | OppenheimerFunds, Inc. |
| Oppenheimer Global Fund/VA – Service | The fund seeks capital appreciation. | |
| Oppenheimer Main Street Small Cap Fund, Class 2 | The fund seeks capital appreciation. | |
| PIMCO Variable Insurance Trust | ||
PIMCO International Bond Portfolio (U.S. Dollar-Hedged) – Administrative Shares (formerly PIMCO Foreign Bond Portfolio (U.S. Dollar-Hedged) – Administrative Shares)(11) | The Portfolio seeks maximum total return, consistent with preservation of capital and prudent investment management. | Pacific Investment Management Company LLC |
| PIMCO Real Return Portfolio – Administrative Shares | The Portfolio seeks maximum real return, consistent with preservation of real capital and prudent investment management. | |
PIMCO Total Return Portfolio – Administrative Shares(6) | The Portfolio seeks maximum total return, consistent with preservation of capital and prudent investment management. | |
| Rydex Variable Trust | ||
| Guggenheim VIF Long Short Equity Fund | Seeks to provide long-term capital appreciation. | Guggenheim Investments |
| T. Rowe Price Equity Series, Inc. | ||
| T. Rowe Price Blue Chip Growth Portfolio – II | The fund seeks to provide long-term capital growth. Income is a secondary objective. | T. Rowe Price Associates, Inc. |
| T. Rowe Price Equity Income Portfolio – II | The fund seeks a high level of dividend income and long-term capital growth primarily through investments in stocks. | |
| VanEck VIP Trust | ||
| VanEck VIP Emerging Markets Fund – Initial Class | Seeks long-term capital appreciation by investing primarily in equity securities in emerging markets around the world. | Van Eck Associates Corporation |
| VanEck VIP Global Hard Assets Fund – Initial Class | Seeks long-term capital appreciation by investing primarily in hard asset securities. Income is a secondary consideration. | |
| (1) | Effective as of August 30, 2010, the following Variable Sub-Account closed to all Contract Owners except those Contract Owners who had contract value invested in the Variable Sub-Account as of the closure date: Oppenheimer Discovery Mid Cap Growth Fund/VA – Service Sub-Account |
| (2) | Effective August 19, 2011, the Invesco V.I. Value Opportunities – Series II Sub-Account closed to all Contract Owners except those Contract Owners who had contract value invested in the Variable Sub-Account as of the closure date. Contract Owners who had contract value invested in the Variable Sub-Account as of the closure date may continue to submit additional investments into the Variable Sub-Account thereafter, although they will not be permitted to invest in the Variable Sub-Account if they withdraw or otherwise transfer their entire contract value from the Variable Sub-Account following the closure date. Contract Owners who did not have contract value invested in the Variable Sub-Account as of the closure date may not invest in the Variable Sub-Account. |
| (3) | Effective as of January 31, 2014, the Alger Mid-Cap Growth – Class S Sub-Account was closed to all Contract Owners except those Contract Owners who had contract value invested in the Variable Sub-Account as of the closure date. Contract Owners who had contract value invested in the Variable Sub-Account as of the closure date may continue to submit additional investments into the Variable Sub-Account thereafter, although they will not be permitted to invest in the Variable Sub-Account if they withdrew or otherwise transferred their entire contract value from the Variable Sub-Account following the closure date. Contract Owners who did not have contract value invested in the Variable Sub-Account as of the closure date will not be permitted to invest in the Variable Sub-Account. |
| (4) | On or about March 27, 2015, the MFS® Massachusetts Investors Growth Stock Portfolio – Service Class, a portfolio of MFS® Variable Insurance Trust II, acquired the MFS® Investors Growth Stock Series – Service Class, a series of MFS® Variable Insurance Trust. |
| (5) | Effective April 13, 2015, the Janus Henderson Mid Cap Value Portfolio– Service Shares sub-account was closed to all contract owners except those contract owners who have contract value invested in the variable sub-account as of the closure date. Contract owners who have contract value invested in the variable sub-account as of the closure date may continue to submit additional investments into the variable sub-account thereafter, although they will not be permitted to invest in the variable sub-account if they withdraw or otherwise transfer their entire contract value from the variable sub-account following the closure date. Contract owners who do not have contract value invested in the variable sub-account as of the closure date will not be permitted to invest in the variable sub-account thereafter. |
| (6) | We previously notified you that, effective May 1, 2015, the PIMCO Total Return - Administrative Shares sub-account was closed to all contract owners except those contract owners who had Account Value invested in the variable sub-account, and that we had intended to remove it as an investment option and substitute a new investment option under your Variable Annuity contract. However, we are no longer planning to remove this sub-account or substitute a new investment option. As a result, effective February 5, 2018, the PIMCO Total Return - Administrative Shares sub-account is available to all contract owners. |
| (7) | Effective September 1, 2015, the Invesco V.I. Mid Cap Core Equity Fund – Series II sub-account was closed to all contract owners except those contract owners who have contract value invested in the variable sub-account as of the closure date. Contract owners who have contract value invested in the variable sub-account as of the closure date may continue to submit additional investments into the variable sub-account thereafter, although they will not be permitted to invest in the variable sub-account if they withdraw or otherwise transfer their entire contract value from the variable sub-account following the closure date. Contract owners who do not have contract value invested in the variable sub-account as of the closure date will not be permitted to invest in the variable sub-account thereafter. |
| (8) | Effective February 23, 2016, the VIF U.S. Real Estate Portfolio, Class II sub-account was closed to all contract owners except those contract owners who have contract value invested in the variable sub-account as of the closure date. Contract owners who have contract value invested in the variable sub-account as of the closure date may continue to submit additional investments into the variable sub-account thereafter, although they will not be permitted to invest in the variable sub-account if they withdraw or otherwise transfer their entire contract value from the variable sub-account following the closure date. Contract owners who do not have contract value invested in the variable sub-account as of the closure date will not be permitted to invest in the variable sub-account thereafter. |
| (9) | Effective December 23, 2016, the Invesco V.I. Core Equity Fund - Series I and Series II sub-accounts were was closed to all contract owners except those contract owners who have contract value invested in the variable sub-account as of the closure date. Contract owners who have contract value invested in the variable sub-account as of the closure date may continue to submit additional investments into the variable sub-account thereafter, although they will not be permitted to invest in the variable sub-account if they withdraw or otherwise transfer their entire contract value from the variable sub-account following the closure date. Contract owners who do not have contract value invested in the variable sub-account as of the closure date will not be permitted to invest in the variable sub-account thereafter. |
| (10) | Effective September 23, 2016, the PIMCO Money Market Portfolio - Administrative Shares sub-account was liquidated and any contract value remaining in the sub-account was transferred to the Fidelity® VIP Government Money Market Portfolio - Service Class 2. |
| (11) | Effective on or about July 30, 2018, the PIMCO Foreign Bond Portfolio (U.S. Dollar-Hedged) - Administrative Shares sub-account changed its name to the PIMCO International Bond Portfolio (U.S. Dollar-Hedged) - Administrative Shares. |
| (12) | Effective June 3, 2019, the Goldman Sachs VIT Mid Cap Value Fund - Institutional Sub-Account will be closed to all Contract Owners except those Contract Owners who have contract value invested in the Variable Sub-Account as of the closure date. Contract Owners who have contract value invested in the Variable Sub-Account as of the closure date may continue to submit additional investments into the Variable Sub-Account thereafter, although they will not be permitted to invest in the Variable Sub-Account if they withdraw or otherwise transfer their entire contract value from the Variable Sub-Account following the closure date. Contract Owners who do not have contract value invested in the Variable Sub-Account as of the closure date will not be permitted to invest in the Variable Sub-Account. |
| • | transfer all or part of the money from the Standard Fixed Guarantee Period Account to establish a new Guarantee Period Account within the Standard Fixed Account Option; or |
| • | transfer all or part of the money from the Standard Fixed Guarantee Period Account to other investment alternatives available at the time; or |
| • | withdraw all or part of the money from the Standard Fixed Guarantee Period Account. Withdrawal charges and taxes may apply. |
| • | you have already exceeded the 30% limit and you must still make a withdrawal during that Contract Year to satisfy IRS minimum distribution rules; or |
| • | you have not yet exceeded the 30% limit but you must make a withdrawal during that Contract Year to satisfy IRS minimum distribution rules, and such withdrawal will put you over the 30% limit. |
| • | transfer all or part of the money from the Market Value Adjusted Fixed Guarantee Period Account to establish a new Guarantee Period Account within the Market Value Adjusted Fixed Account Option; or |
| • | transfer all or part of the money from the Market Value Adjusted Fixed Guarantee Period Account to other investment alternatives available at the time; or |
| • | withdraw all or part of the money from the Market Value Adjusted Fixed Guarantee Period Account. Withdrawal charges and taxes may apply. |
| Fidelity® VIP Overseas – Service Class 2 Sub-Account |
| Janus Henderson Overseas Portfolio – Service Shares Sub-Account |
| Oppenheimer Global Fund/VA – Service Shares Sub-Account |
| VanEck VIP Emerging Markets Fund - Initial Class Sub-Account |
| Western Asset Variable Global High Yield Bond Portfolio – Class II Sub-Account |
| • | we believe, in our sole discretion, that certain trading practices, such as excessive trading, by, or on behalf of, one or more Contract Owners, or a specific transfer request or group of transfer requests, may have a detrimental effect on the Accumulation Unit Values of any Variable Sub-Account or on the share prices of the corresponding Portfolio or otherwise would be to the disadvantage of other Contract Owners; or |
| • | we are informed by one or more of the Portfolios that they intend to restrict the purchase, exchange, or redemption of Portfolio shares because of excessive trading or because they believe that a specific transfer or group of transfers would have a detrimental effect on the prices of Portfolio shares. |
| • | the total dollar amount being transferred, both in the aggregate and in the transfer request; |
| • | the number of transfers you make over a period of time and/or the period of time between transfers (note: one set of transfers to and from a Variable Sub-Account in a short period of time can constitute market timing); |
| • | whether your transfers follow a pattern that appears designed to take advantage of short term market fluctuations, particularly within certain Variable Sub-Account underlying Portfolios that we have identified as being susceptible to market timing activities (e.g., International, High Yield, and Small Cap Variable Sub-Accounts); |
| • | whether the manager of the underlying Portfolio has indicated that the transfers interfere with Portfolio management or otherwise adversely impact the Portfolio; and |
| • | the investment objectives and/or size of the Variable Sub-Account underlying Portfolio. |
| • | your Contract Value is equal to or greater than $50,000; or |
| • | your entire Contract Value is allocated to the Fixed Account Options or, after the Payout Start Date, if all income payments are fixed income payments. |
| Consultant Solutions Classic | 1.25% |
| Consultant Solutions Plus | 1.45% |
| Consultant Solutions Elite | 1.60% |
| Consultant Solutions Select | 1.70% |
| • | MAV Death Benefit Option: The current mortality and expense risk charge for this option is 0.20%. This charge may be increased but will never exceed 0.50%. We guarantee that we will not increase the mortality and expense risk charge for this option after you have added it to your Contract. We deduct the charge for this option only during the Accumulation Phase. |
| • | Annual Increase Death Benefit Option: The current mortality and expense risk charge for this option is 0.30%. This charge may be increased but will never exceed 0.50%. We guarantee that we will not increase the mortality and expense risk charge for this option after you have added it to your Contract. We deduct the charge for this option only during the Accumulation Phase. |
| • | Enhanced Earnings Death Benefit Option: The current mortality and expense risk charge for this option is: |
| • | 0.25% (maximum of 0.35%) if the oldest Contract Owner and Co-Annuitant, or, if the Contract is owned by a non-living person, the oldest Annuitant, are age 70 or younger on the Rider Application Date; or |
| • | 0.40% (maximum of 0.50%) if the oldest Contract Owner or, if older, the Co-Annuitant, or, if the Contract is owned by a non-living person, the oldest Annuitant, is age 71 or older and age 79 or younger on the Rider Application Date. |
| • | The charges may be increased but they will never exceed the maximum charges shown above. We guarantee that we will not increase the mortality and expense risk charge for this option after you have added it to your Contract. However, if your spouse elects to continue the Contract in the event of your death and if he or she elects to continue the Enhanced Earnings Death Benefit Option, the charge will be based on the age of the new Contract Owner at the time the Contract is continued. Refer to the Death Benefit Payments provision in this prospectus for more information. We deduct the charge for this option only during the Accumulation Phase. |
| • | Income Protection Benefit Option: The current mortality and expense risk charge for this option is 0.50%. This charge may be increased but will never exceed 0.75%. We guarantee that we will not increase the mortality and expense risk for this option after you have added it to your Contract. This option may be added to your Contract on the Payout Start Date. The charge will be deducted only during the Payout Phase. |
| 1) | Purchase payments that no longer are subject to withdrawal charges; |
| 2) | Free Withdrawal Amount (if available); |
| 3) | Remaining purchase payments subject to withdrawal charges, beginning with the oldest purchase payment; |
| 4) | Any earnings not previously withdrawn. |
| • | The Free Withdrawal Amount described above; or |
| • | Earnings as of the beginning of the Contract Year that have not been previously withdrawn. |
| 1) | Earnings not previously withdrawn; |
| 2) | Purchase payments that are no longer subject to withdrawal charges; |
| 3) | Free Withdrawal Amount in excess of earnings; |
| 4) | Purchase payments subject to withdrawal charges, beginning with the oldest purchase payment. |
| • | the death of the Contract Owner or Annuitant (unless the Settlement Value is used); |
| • | withdrawals taken to satisfy IRS minimum distribution rules for the Contract; or |
| • | withdrawals that qualify for one of the waivers described below. |
| 1. | you, or, if the Contract Owner is not a living person, the Annuitant, are first confined to a long term care facility or a hospital for at least 90 consecutive days. You or the Annuitant must first enter the long term care facility or hospital at least 30 days after the Issue Date, |
| 2. | we receive your request for withdrawal and written proof of the stay no later than 90 days following the end of your or the Annuitant’s stay at the long term care facility or hospital, and |
| 3. | Due proof of confinement is received by us prior to or at the time of, a request for a withdrawal. |
| 1. | you or the Annuitant, if the Contract Owner is not a living person, are diagnosed by a physician as having a terminal illness (as defined in the Contract) at least 30 days after the Issue Date, and |
| 2. | you provide Due Proof of diagnosis to us before or at the time you request the withdrawal. |
| 1. | you or the Annuitant, if the Contract Owner is not a living person, become unemployed at least one year after the Issue Date, |
| 2. | you or the Annuitant receive unemployment compensation (as defined in the Contract) for at least 30 days as a result of that unemployment, and |
| 3. | you or the Annuitant claim this benefit within 180 days of your or the Annuitant’s initial receipt of unemployment compensation, and we receive due proof that you are or have been unemployed and that unemployment compensation has been received for at least thirty consecutive days prior to or at the time of the request for withdrawal. |
| 1. | The New York Stock Exchange is closed for other than usual weekends or holidays, or trading on the Exchange is otherwise restricted, |
| 2. | An emergency exists as defined by the SEC, or |
| 3. | The SEC permits delay for your protection. |
| • | the youngest Annuitant’s 99th birthday, or |
| • | the 10th Contract Anniversary. |
| • | fixed income payments; or |
| • | variable income payments; |
| Number of Complete Years Since We Received the Purchase Payment Being Withdrawn/Applicable Charge: | ||||||||||||||||||
| Contract: | 0 | 1 | 2 | 3 | 4 | 5 | 6 | 7 | 8+ | |||||||||
| Consultant Solutions Classic | 7 | % | 7 | % | 6 | % | 5 | % | 4 | % | 3 | % | 2 | % | 0 | % | 0 | % |
| Consultant Solutions Plus | 8.5 | % | 8.5 | % | 8.5 | % | 7.5 | % | 6.5 | % | 5.5 | % | 4 | % | 2.5 | % | 0 | % |
| Consultant Solutions Elite | 7 | % | 6 | % | 5 | % | 0 | % | 0 | % | 0 | % | 0 | % | 0 | % | 0 | % |
| Consultant Solutions Select | None | |||||||||||||||||
| • | terminate the Contract and pay you the Contract Value, adjusted by any applicable Market Value Adjustment and less any applicable taxes, in a lump sum instead of the periodic payments you have chosen, or |
| • | reduce the frequency of your payments so that each payment will be at least $20. |
| • | The Annuitant and joint Annuitant, if applicable, must be age 75 or younger on the Payout Start Date. |
| • | You must choose Income Plan 1 or 2 and the Guaranteed Payment Period must be for at least 120 months, unless the Internal Revenue Service requires a different payment period. |
| • | You may apply the Income Protection Benefit Option |
| • | The AIR must be 3% for the Income Plan that you wish to apply this benefit to. |
| • | You may only add the Income Protection Benefit Option on the Payout Start Date and, once added, the option cannot be cancelled. |
| • | You may not add the Income Protection Benefit Option without our prior approval if your Contract Value is greater than $1,000,000 at the time you choose to add the Income Protection Benefit Option. |
| • | You may not convert variable income payments to fixed income payments. |
| * | Model Portfolio Option 1 |
| Model Portfolio Option 1 |
| 20% Category A |
| 50% Category B |
| 30% Category C |
| CATEGORY A |
Fidelity® VIP Government Money Market Portfolio – Service Class 2 Sub-Account(8) |
| Model Portfolio Option 1 |
| CATEGORY B |
| Fidelity® VIP Investment Grade Bond Portfolio – Service Class 2 Sub-Account |
| Western Asset Variable Global High Yield Bond Portfolio– Class II Sub-Account |
MFS® High Yield Portfolio- Service Class Sub-Account |
PIMCO International Bond Portfolio (U.S. Dollar-Hedged) – Administrative Shares Sub-Account (9) |
| PIMCO Real Return – Administrative Shares Sub-Account |
PIMCO Total Return – Administrative Shares Sub-Account(3) |
Morgan Stanley VIF U.S. Real Estate, Class II (6) |
| Invesco V.I. Government Securities Fund, Series II Sub-Account |
| CATEGORY C |
| Invesco V.I. Value Opportunities Fund – Series II Sub-Account |
Invesco V.I. Core Equity Fund– Series II Sub-Account(7) |
Invesco V.I. Mid Cap Core Equity Fund– Series II Sub-Account(5) |
Fidelity® VIP ContrafundSM Portfolio – Service Class 2 Sub-Account |
Fidelity® VIP Equity-Income PortfolioSM – Service Class 2 Sub-Account |
| Fidelity® VIP Index 500 Portfolio– Service Class 2 Sub-Account |
| Fidelity® VIP Overseas Portfolio– Service Class 2 Sub-Account |
| Fidelity® VIP Asset Manager Portfolio – Service Class 2 Sub-Account |
| Janus Henderson Overseas Portfolio – Service Shares Sub-Account |
| Janus Henderson Forty Portfolio– Service Shares Sub-Account |
Janus Henderson Mid Cap Value Portfolio – Service Shares Sub-Account(4) |
| Janus Henderson Balanced Portfolio– Service Shares Sub-Account |
| ClearBridge Variable Large Cap Value – Class II Sub-Account |
MFS® Investors Trust Portfolio – Service Class Sub-Account |
MFS® Massachusetts Investors Growth Stock Portfolio – Service Class Sub-Account(2) |
MFS® Total Return Portfolio – Service Class Sub-Account |
MFS® Value Portfolio – Service Class Sub-Account |
Oppenheimer Discovery Mid Cap Growth Fund/VA Service Sub-Account(1) |
| Oppenheimer Main Street Small Cap Fund/VA – Service Shares Sub-Account |
| Guggenheim VIF Long Short Equity Fund Sub-Account |
| T. Rowe Price Equity Income Portfolio – II Sub-Account |
| T. Rowe Price Blue Chip Growth Portfolio – II Sub-Account |
| Invesco V.I. Growth and Income Fund, Series II Sub-Account |
| (1) | Effective as of August 30, 2010, the following Variable Sub-Account closed to all Contract Owners except those Contract Owners who had contract value invested in the Variable Sub-Account as of the closure date: |
| (2) | On or about March 27, 2015, the MFS® Massachusetts Investors Growth Stock Portfolio – Service Class, a portfolio of MFS® Variable Insurance Trust II, acquired the MFS® Investors Growth Stock Series – Service Class, a series of MFS® Variable Insurance Trust. |
| (3) | We previously notified you that, effective May 1, 2015, the PIMCO Total Return - Administrative Shares sub-account was closed to all contract owners except those contract owners who had Account Value invested in the variable sub-account, and that we had intended to remove it as an investment option and substitute a new investment option under your Variable Annuity contract. However, we are no longer planning to remove this sub-account or substitute a new investment option. As a result, effective February 5, 2018, the PIMCO Total Return - Administrative Shares sub-account is available to all contract owners. |
| (4) | Effective April 13, 2015, the Janus Henderson Mid Cap Value Portfolio – Service Shares sub-account was closed to all contract owners except those contract owners who have contract value invested in the variable sub-account as of the closure date. Contract owners who have contract value invested in the variable sub-account as of the closure date may continue to submit additional investments into the variable sub-account thereafter, although they will not be permitted to invest in the variable sub-account if they withdraw or otherwise transfer their entire contract value from the variable sub-account following the closure date. Contract owners who do not have contract value invested in the variable sub-account as of the closure date will not be permitted to invest in the variable sub-account thereafter. |
| (5) | Effective September 1, 2015, the Invesco V.I. Mid Cap Core Equity Fund – Series II sub-account was closed to all contract owners except those contract owners who have contract value invested in the variable sub-account as of the closure date. Contract owners who have contract value invested in the variable sub-account as of the closure date may continue to submit additional investments into the variable sub-account thereafter, although they will not be permitted to invest in the variable sub-account if they withdraw or otherwise transfer their entire contract value from the variable sub-account following the closure date. Contract owners who do not have contract value invested in the variable sub-account as of the closure date will not be permitted to invest in the variable sub-account thereafter. |
| (6) | Effective February 23, 2016, the VIF U.S. Real Estate Portfolio, Class II sub-account was closed to all contract owners except those contract owners who have contract value invested in the variable sub-account as of the closure date. Contract owners who have contract value invested in the variable sub-account as of the closure date may continue to submit additional investments into the variable sub-account thereafter, although they will not be permitted to invest in the variable sub-account if they withdraw or otherwise transfer their entire contract value from the variable sub-account following the closure date. Contract owners who do not have contract value invested in the variable sub-account as of the closure date will not be permitted to invest in the variable sub-account thereafter. |
| (7) | Effective December 23, 2016, the Invesco V.I. Core Equity – Series II Sub-Account sub-account was closed to all contract owners except those contract owners who have contract value invested in the variable sub-account as of the closure date. Contract owners who have contract value invested in the variable sub-account as of the closure date may continue to submit additional investments into the variable sub-account thereafter, although they will not be permitted to invest in the variable sub-account if they withdraw or otherwise transfer their entire contract value from the variable sub-account following the closure date. Contract owners who do not have contract value invested in the variable sub-account as of the closure date will not be permitted to invest in the variable sub-account thereafter. |
| (8) | Effective September 23, 2016, the PIMCO Money Market Portfolio - Administrative Shares sub-account was liquidated and any contract value remaining in the sub-account was transferred to the Fidelity® VIP Government Money Market Portfolio - Service Class 2. |
| (9) | Effective on or about July 30, 2018, the PIMCO Foreign Bond Portfolio (U.S. Dollar-Hedged) - Administrative Shares sub-account changed its name to the PIMCO International Bond Portfolio (U.S. Dollar-Hedged) - Administrative Shares. |
| • | adjusting the portion of the Contract Value in any Fixed Account Option on the Payout Start Date by any applicable Market Value Adjustment; |
| • | deducting any applicable taxes; and |
| • | applying the resulting amount to the greater of: (a) the appropriate income payment factor for the selected Income Plan from the Income Payment Table in your Contract; or (b) such other income payment factor as we are offering on the Payout Start Date. |
| • | A certified copy of the death certificate; |
| • | A certified copy of a decree of a court of competent jurisdiction as to the finding of death; or |
| • | Any other proof acceptable to us. |
| • | If we receive a Complete Request for Settlement within 180 days of the death of the Contract Owner, Annuitant, or Co-Annuitant, as applicable, the Death Proceeds are equal to the “Death Benefit.” |
| • | If we receive a Complete Request for Settlement more than 180 days after the death of the Contract Owner, Annuitant, or Co-Annuitant, as applicable, the Death Proceeds are equal to the greater of the Contract Value or Settlement Value. We reserve the right to waive or extend, in a nondiscriminatory manner, the 180-day period in which the Death Proceeds will equal the Death Benefit. |
| • | MAV Death Benefit Option |
| • | Annual Increase Death Benefit Option |
| • | Enhanced Earnings Death Benefit Option |
| • | The Contract Value; |
| • | The Settlement Value; |
| • | The ROP Death Benefit; |
| • | The MAV Death Benefit Option (if selected); or |
| • | The Annual Increase Death Benefit Option (if selected). |
| • | Each time a purchase payment is made, the MAV Death Benefit is increased by the amount of the purchase payment (and Credit Enhancement for Consultant Solutions Plus Contracts). |
| • | Each time a withdrawal is made, the MAV Death Benefit is reduced by a proportional withdrawal adjustment, defined as the withdrawal amount divided by the Contract Value immediately prior to the withdrawal, and the result multiplied by the most recently calculated MAV Death Benefit. |
| • | On each Contract Anniversary until the first Contract Anniversary following the 80th birthday of the oldest Contract Owner or Co-Annuitant, whichever occurs first, or, if the Contract is owned by a non-living person, the oldest Annuitant, the MAV Death Benefit is recalculated as the greater of the Contract Value on that date or the most recently calculated MAV Death Benefit. |
| • | The first Contract Anniversary following the 80th birthday of either the oldest Contract Owner or the Co-Annuitant, whichever is earlier, or, if the Contract is owned by a non-living person, the oldest Annuitant. (After the 80th birthday of either the oldest Contract Owner or the Co-Annuitant, whichever is earlier, or, if the Contract is owned by a non-living person, the oldest Annuitant, the MAV Death Benefit will be recalculated only for purchase payments (and Credit Enhancements for Consultant Solutions Plus Contracts) and withdrawals); or |
| • | The date we next determine the Death Proceeds. |
| (a) | the first Contract Anniversary following the 80th birthday of the oldest Contract Owner or Co-Annuitant, whichever occurs first, or, if the Contract is owned by a non-living person, the oldest Annuitant; or |
| (b) | the date we determine the Death Proceeds. |
| • | 200% of the Contract Value as of the Rider Date; plus |
| • | 200% of purchase payments (and Credit Enhancements for Consultant Solutions Plus Contracts) made after the Rider Date, but excluding any purchase payments (and Credit Enhancements for Consultant Solutions Plus Contracts) made in the 12-month period immediately prior to the death of a Contract Owner or the Co-Annuitant, or, if the Contract is owned by a non-living person, an Annuitant; minus |
| • | Withdrawal adjustments for any withdrawals made after the Rider Date. Refer to Appendix E for withdrawal adjustment examples. |
| • | The first Contract Anniversary following the 80th birthday of either the oldest Contract Owner or the Co-Annuitant, whichever is earlier, or, if the Contract is owned by a non-living person, the oldest Annuitant. (After the 80th birthday of either the oldest Contract Owner or the Co-Annuitant, whichever is earlier, or, if the Contract is owned by a non-living person, the oldest Annuitant, the Annual Increase Death Benefit will be recalculated only for purchase payments and withdrawals (and Credit Enhancements for Consultant Solutions Plus Contracts)); or |
| • | The date we next determine the Death Proceeds. |
| • | 0.25%, if the oldest Contract Owner and Co-Annuitant, or, if the Contract is owned by a non-living person, the oldest Annuitant, are age 70 or younger on the Rider Application Date; and |
| • | 0.40%, if the oldest Contract Owner or, if older, the Co-Annuitant, or, if the Contract is owned by a non-living person, the oldest Annuitant, is age 71 or older and age 79 or younger on the Rider Application Date. |
| • | 100% of “In-Force Premium” (excluding purchase payments (and Credit Enhancements for Consultant Solutions Plus Contracts) made after the date we issue the rider for this benefit (“Rider Date”) and during the twelve-month period immediately prior to the death of a Contract Owner or Co-Annuitant, or, if the Contract is owned by a non-living person, an Annuitant); or |
| • | 40% of “In-Force Earnings” |
| • | 50% of “In-Force Premium” (excluding purchase payments (and Credit Enhancements for Consultant Solutions Plus Contracts) made after the Rider Date and during the twelve-month period immediately prior to the death of a Contract Owner or Co-Annuitant, or, if the Contract is owned by a non-living person, an Annuitant); or |
| • | 25% of “In-Force Earnings” |
| • | The Rider Date will be changed to the date we determine the Death Proceeds; |
| • | The In-Force Premium is equal to the Contract Value as of the new Rider Date plus all purchase payments, including any associated credit enhancements, made after the Rider Date, less the sum of all the Excess-of-Earnings Withdrawals made after the Rider Date; |
| • | The Enhanced Earnings Death Benefit after the new Rider Date will be determined as described above, but using the ages of the oldest Contract Owner and Co-Annuitant, or, if the Contract is owned by a non-living person, the oldest Annuitant, as of the new Rider Date. |
| • | The mortality and expense risk charge, for this rider, will be determined as described above, but using the ages of the oldest Contract Owner and Co-Annuitant, or, if the Contract is owned by a non-living person, the oldest Annuitant, as of the new Rider Date. |
| • | the date the Contract is terminated; |
| • | if, upon the death of the Contract Owner, the Contract is continued under Option D as described in the “Death Benefit Payments” section of this prospectus, and the New Owner is older than age 80 (age 80 or older for the Enhanced Earnings Death Benefit Option) on the date we determine the Death Proceeds. The death benefit option will terminate on the date we determine the Death Proceeds; |
| • | if the Contract is not continued in the Accumulation Phase under either the Death of Owner or Death of Annuitant provisions of the Contract. The death benefit option will terminate on the date we determine the Death Proceeds; |
| • | on the date the Contract Owner (if the current Contract Owner is a living person) is changed for any reason other than death unless the New Contract Owner is a trust and the Annuitant is a current Contract Owner; |
| • | on the date the Contract Owner (if the current Contract Owner is a non-living person) is changed for any reason unless the New Contract Owner is a non-living person or is a current Annuitant; or |
| • | the Payout Start Date. |
| • | Over the life of the New Contract Owner; or |
| • | For a guaranteed payment period of at least 5 years (60 months), but not to exceed the life expectancy of the New Contract Owner; or |
| • | Over the life of the New Contract Owner with a guaranteed payment period of at least 5 years (60 months), but not to exceed the life expectancy of the New Contract Owner. |
| • | One year of the date of death; |
| • | The same calendar year as the date we receive the first Complete Request for Settlement; and |
| • | One withdrawal frequency. |
| • | The Annuitant was also the Contract Owner, in which case the Death of Owner provisions above apply; or |
| • | The Contract Owner is a grantor trust established by a living person, in which case the Beneficiary(ies) will be deemed the New Contract Owners and the Death of Contract Owner provisions above will apply. |
| • | A person you name by written request, subject to the conditions described in the Annuitant section of this Contract; otherwise, |
| • | The youngest Owner; otherwise, |
| • | The youngest Beneficiary. |
| • | The individually owned Contract must be either a traditional, Roth, or Simplified Employee Pension IRA. |
| • | The Contract Owner’s spouse must be the sole Primary Beneficiary of the Contract and will be the named Co-Annuitant. |
| • | The Contract Owner must be age 90 or younger on the Rider Application Date; and the Co-Annuitant must be age 79 or younger on the Rider Application Date. |
| • | The option may only be added when we issue the Contract or within 6 months of the Contract Owner’s marriage. We may require proof of marriage in a form satisfactory to us. Currently, you may not add the option to your Contract without our prior approval if your Contract Value is greater than $1,000,000 at the time you choose to add the Option. |
| • | upon the death of the Co-Annuitant (as of the date we determine the Death Proceeds); |
| • | upon the death of the Contract Owner (as of the date we determine the Death Proceeds); |
| • | on the date the Contract is terminated; |
| • | on the Payout Start Date; or |
| • | on the date you change the beneficiary of the Contract and the change is accepted by us; |
| • | for options added on or after May 1, 2005, the Contract Owner may terminate the option upon the divorce of the Contract Owner and the Co-Annuitant by providing written notice and proof of divorce in a form satisfactory to us; |
| • | for options added prior to May 1, 2005, the Owner may terminate this option at any time by written notice in a form satisfactory to us. |
| • | The Co-Annuitant must have been your legal spouse on the date of his or her death; and |
| • | Option D of the “Death of Owner” provision of your Contract has not previously been exercised. |
| • | maintenance of Contract Owner records; |
| • | Contract Owner services; |
| • | calculation of unit values; |
| • | maintenance of the Variable Account; and |
| • | preparation of Contract Owner reports. |
| • | the Contract Owner is a natural person, |
| • | the investments of the Variable Account are “adequately diversified” according to Treasury Department regulations, and |
| • | Lincoln Benefit is considered the owner of the Variable Account assets for federal income tax purposes. |
| • | if any Contract Owner dies on or after the Payout Start Date but before the entire interest in the Contract has been distributed, the remaining portion of such interest must be distributed at least as rapidly as under the method of distribution being used as of the date of the Contract Owner’s death; |
| • | if any Contract Owner dies prior to the Payout Start Date, the entire interest in the Contract will be distributed within 5 years after the date of the Contract Owner’s death. These requirements are satisfied if any portion of the Contract Owner’s interest that is payable to (or for the benefit of) a designated Beneficiary is distributed over the life of such Beneficiary (or over a period not extending beyond the life expectancy of the Beneficiary) and the distributions begin within 1 year of the Contract Owner’s death. If the Contract Owner’s designated Beneficiary is the surviving spouse of the Contract Owner, the Contract may be continued with the surviving spouse as the new Contract Owner; |
| • | if the Contract Owner is a non-natural person, then the Annuitant will be treated as the Contract Owner for purposes of applying the distribution at death rules. In addition, a change in the Annuitant on a Contract owned by a non-natural person will be treated as the death of the Contract Owner. |
| • | if distributed in a lump sum, the amounts are taxed in the same manner as a total withdrawal, or |
| • | if distributed under an Income Plan, the amounts are taxed in the same manner as annuity payments. |
| • | made on or after the date the Contract Owner attains age 59 1/2, |
| • | made as a result of the Contract Owner’s death or becoming totally disabled, |
| • | made in substantially equal periodic payments (as defined by the Code) over the Contract Owner’s life or life expectancy, or over the joint lives or joint life expectancies of the Contract Owner and the Beneficiary, |
| • | made under an immediate annuity and the annuity start date is no more than one year from the date of purchase (the first annuity payment must commence within 13 months of the date of purchase), or |
| • | attributable to investment in the Contract before August 14, 1982. |
| • | Individual Retirement Annuities (IRAs) under Code Section 408(b); |
| • | Roth IRAs under Code Section 408A; |
| • | Simplified Employee Pension (SEP IRA) under Code Section 408(k); |
| • | Savings Incentive Match Plans for Employees (SIMPLE IRA) under Code Section 408(p); |
| • | Tax Sheltered Annuities under Code Section 403(b); |
| • | Corporate and Self-Employed Pension and Profit Sharing Plans under Code Section 401; and |
| • | State and Local Government and Tax-Exempt Organization Deferred Compensation Plans under Code Section 457. |
| • | made on or after the date the Contract Owner attains age 59 1/2, |
| • | made to a beneficiary after the Contract Owner’s death, |
| • | attributable to the Contract Owner being disabled, or |
| • | made for a first-time home purchase (first time home purchases are subject to a lifetime limit of $10,000). |
| • | made on or after the date the Contract Owner attains age 59 1/2, |
| • | made as a result of the Contract Owner’s death or total disability, |
| • | made in substantially equal periodic payments (as defined by the Code) over the Contract Owner’s life or life expectancy, or over the joint lives or joint life expectancies of the Contract Owner and the Beneficiary, |
| • | made after separation from service after age 55 (does not apply to IRAs), |
| • | made pursuant to an IRS levy, |
| • | made for certain medical expenses, |
| • | made to pay for health insurance premiums while unemployed (applies only for IRAs), |
| • | made for qualified higher education expenses (applies only for IRAs), |
| • | made for a first-time home purchase (up to a $10,000 lifetime limit and applies only for IRAs), and |
| • | from an IRA or attributable to elective deferrals under a 401(k) plan, 403(b) annuity, or certain similar arrangements made to individuals who (because of their being members of a reserve component) are ordered or called to active duty after Sept. 11, 2001, for a period of more than 179 days or for an indefinite period; and made during the period beginning on the date of the order or call to duty and ending at the close of the active duty period. |
| • | required minimum distributions, or, |
| • | a series of substantially equal periodic payments made over a period of at least 10 years, or, |
| • | a series of substantially equal periodic payments made over the life (joint lives) of the participant (and beneficiary), or, |
| • | hardship distributions. |
| 1) | The custodian or trustee of the Individual Retirement Account is the owner of the annuity and has the right to the death proceeds otherwise payable under the Contract; |
| 2) | The deceased Annuitant was the beneficial owner of the Individual Retirement Account; |
| 3) | We receive a complete request for settlement for the death of the Annuitant; and |
| 4) | The custodian or trustee of the Individual Retirement Account provides us with a signed certification of the following: |
| (a) | The Annuitant’s surviving spouse is the sole beneficiary of the Individual Retirement Account; |
| (b) | The Annuitant’s surviving spouse has elected to continue the Individual Retirement Account as his or her own Individual Retirement Account; and |
| (c) | The custodian or trustee of the Individual Retirement Account has continued the Individual Retirement Account pursuant to the surviving spouse’s election. |
| • | attains age 59 1/2, |
| • | severs employment, |
| • | dies, |
| • | becomes disabled, or |
| • | incurs a hardship (earnings on salary reduction contributions may not be distributed on account of hardship). |
| • | A qualified plan fiduciary exists when a qualified plan trust that is intended to qualify under Section 401(a) of the Code is the owner. The qualified plan trust must have its own tax identification number and a named trustee acting as a fiduciary on behalf of the plan. The annuitant should be the person for whose benefit the contract was purchased. |
| • | An annuitant owner exists when the tax identification number of the owner and annuitant are the same, or the annuity contract is not owned by a qualified plan trust. The annuitant should be the person for whose benefit the contract was purchased. |
Rule 12h-7 under the Securities Exchange Act of 1934, as amended (the “Exchange Act”) exempts an insurance company from filing reports under the Exchange Act when the insurance company issues certain types of insurance products that are registered under the Securities Act of 1933 and such products are regulated under state law. The variable annuities described in this prospectus fall within the exemption provided under rule 12h-7. We rely on the exemption provided under rule 12h-7 and do not file reports under the Exchange Act.
| Additions, Deletions, or Substitutions of Investments |
| The Contracts |
| Calculation of Accumulation Unit Values |
| Net Investment Factor |
| Calculation of Variable Income Payments |
| General Matters |
| Cyber Security Risk |
| Experts |
| Financial Statements |
| Accumulation Unit Values |
| Feature | Classic | Plus | Elite | Select |
| Credit Enhancement | None | up to 5% depending on issue age and amount of purchase payments | None | None |
Mortality and Expense Risk Charge (Base Contract) | 1.25% | 1.45% | 1.60% | 1.70% |
Withdrawal Charge (% of purchase payment) | 7/ 7/ 6/ 5/ 4/ 3/ 2 | 8.5/ 8.5/ 8.5/ 7.5/ 6.5/ 5.5/ 4/2.5 | 7/ 6/ 5 | None |
Withdrawal Charge Waivers | Confinement, Terminal Illness, Unemployment | Confinement, Terminal Illness, Unemployment | Confinement, Terminal Illness, Unemployment | N/A |
| DCA Fixed Account Option* | ||||
| Classic | Plus | Elite | Select | |
| Transfer Periods | 6-month | 6-month | 6-month | N/A |
| 12-month | 12-month | 12-month | N/A | |
| Standard Fixed Account Option (not available in all states)** | ||||
| Classic | Plus | Elite | Select | |
| Guarantee Periods | 1-year | N/A | N/A | N/A |
| N/A | N/A | N/A | N/A | |
| N/A | N/A | N/A | N/A | |
| N/A | N/A | N/A | N/A | |
| MVA Fixed Account Option (not available in all states)*** | ||||
| Classic | Plus | Elite | Select | |
| Guarantee Periods | 1-year | 1-year | 1-year | 1-year |
| 3-year | 3-year | 3-year | 3-year | |
| 5-year | 5-year | 5-year | 5-year | |
| 7-year | 7-year | 7-year | 7-year | |
| 10-year | 10-year | 10-year | 10-year | |
| I | = | the Treasury Rate for a maturity equal to the term length of the Guarantee Period for the week preceding the establishment of the Market Value Adjusted Fixed Guarantee Period Account; |
| J | = | the Treasury Rate for a maturity equal to the term length of the Market Value Adjusted Fixed Guarantee Period Account for the week preceding the date amounts are transferred or withdrawn from the Market Value Adjusted Fixed Guarantee Period Account, the date we determine the Death Proceeds, or the Payout Start Date, as the case may be (“Market Value Adjustment Date”). |
| N | = | the number of whole and partial years from the Market Value Adjustment Date to the expiration of the term length of the Market Value Adjusted Fixed Guarantee Period Account. |
| Examples of Market Value Adjustment | |
| Purchase Payment: | $10,000 allocated to a Market Value Adjusted Fixed Guarantee Period Account |
| Guarantee Period: | 5 years |
| Interest Rate: | 4.50% |
| Full Withdrawal: | End of Contract Year 3 |
| Contract: | Consultant Solutions Classic* |
| Example 1: (Assumes Declining Interest Rates) | ||||
| Step 1: Calculate Contract Value at End of Contract Year 3: | = | $10,000.00 × (1.045)3 = $11,411.66 | ||
| Step 2: Calculate the Free Withdrawal Amount: | = | .15 × $10,000 = $1,500 | ||
| Step 3: Calculate the Withdrawal Charge: | = | .06 × ($10,000 – $1,500) = $510 | ||
| Step 4: Calculate the Market Value Adjustment: | I | = | 4.50% | |
| J | = | 4.20% | ||
| N | = | 730 DAYS | = 2 | |
| 365 | ||||
| Market Value Adjustment Factor: .9 × [I – (J + .0025)] × N | ||||
| = | .9 × [.045 - (.042 + .0025)] × 2 = .0009 | |||
| Market Value Adjustment = Market Value Adjustment Factor × Amount Subject to Market Value Adjustment: | ||||
| = | .0009 × $11,411.66 = $10.27 | |||
| Step 5: Calculate the amount received by Contract owner as a result of full withdrawal at the end of Contract Year 3: | = | $11,411.66 - $510 + $10.27 = $10,911.93 | ||
| Example 2: (Assumes Rising Interest Rates) | ||||
| Step 1: Calculate Contract Value at End of Contract Year 3: | = | $10,000.00 × (1.045)3 = $11,411.66 | ||
| Step 2: Calculate the Free Withdrawal Amount: | = | .15 × $10,000 = $1,500 | ||
| Step 3: Calculate the Withdrawal Charge: | = | .06 × ($10,000 – $1,500) = $510 | ||
| Step 4: Calculate the Market Value Adjustment: | I | = | 4.50% | |
| J | = | 4.80% | ||
| N | = | 730 DAYS | = 2 | |
| 365 | ||||
| Market Value Adjustment Factor: .9 × [I – (J + .0025)] × N | ||||
| = | .9 × [(.045 - (.048 + .0025)] × (2) = –.0099 | |||
| Market Value Adjustment = Market Value Adjustment Factor × Amount Subject to Market Value Adjustment: | ||||
| = | –.0099 × $11,411.66 = –($112.98) | |||
| Step 5: Calculate the amount received by Contract owner as a result of full withdrawal at the end of Contract Year 3: | = | $11,411.66 - $510 – $112.98 = $10,788.68 | ||
| * | These examples assume the election of the Consultant Solutions Classic Contract for the purpose of illustrating the Market Value Adjustment calculation. The amounts would be different under Consultant Solutions Plus, Consultant Solutions Elite Contracts, and Consultant Solutions Select Contracts which have different expenses and withdrawal charges. |
| Adjusted age of Annuitant on the Payout Start Date: | 65 |
| Sex of Annuitant: | male |
| Income Plan selected: | 1 |
| Payment frequency: | monthly |
| Amount applied to variable income payments under the Income Plan: | $100,000.00 |
| Assumed investment rate: | 3% |
| Guaranteed minimum variable income payment: | 85% of the initial variable amount income value |
| Death Benefit Amount | |||||||||||||||||||||||||
| ROP Value | Annual Increase Value** | ||||||||||||||||||||||||
| Date | Type of Occurrence | Beginning Contract Value | Transaction Amount | Contract Value After Occurrence | Classic, Elite And Select | Plus | Maximum Anniversary Value | Classic, Elite And Select | Plus | ||||||||||||||||
| 1/1/06 | Contract Anniversary | $ | 55,000 | _ | $ | 55,000 | $ | 50,000 | $ | 52,000 | $ | 55,000 | $ | 52,500 | $ | 54,600 | |||||||||
| 7/1/06 | Partial Withdrawal | $ | 60,000 | $ | 15,000 | $ | 45,000 | $ | 37,500 | $ | 39,000 | $ | 41,250 | $ | 40,339 | $ | 41,953 | ||||||||
| Classic, Elite and Select | Plus | ||||||
| ROP Death Benefit | |||||||
| Partial Withdrawal Amount | (a) | $ | 15,000 | $ | 15,000 | ||
| Contract Value Immediately Prior to Partial Withdrawal | (b) | $ | 60,000 | $ | 60,000 | ||
| Value of Death Benefit Amount Immediately Prior to Partial Withdrawal | (c) | $ | 50,000 | $ | 52,000 | ||
| Withdrawal Adjustment | [(a)/(b)]*(c) | $ | 12,500 | $ | 13,000 | ||
| Adjusted Death Benefit | $ | 37,500 | $ | 39,000 | |||
| MAV Death Benefit | |||||||
| Partial Withdrawal Amount | (a) | $ | 15,000 | $ | 15,000 | ||
| Contract Value Immediately Prior to Partial Withdrawal | (b) | $ | 60,000 | $ | 60,000 | ||
| Value of Death Benefit Amount Immediately Prior to Partial Withdrawal | (c) | $ | 55,000 | $ | 55,000 | ||
| Withdrawal Adjustment | [(a)/(b)]*(c) | $ | 13,750 | $ | 13,750 | ||
| Adjusted Death Benefit | $ | 41,250 | $ | 41,250 | |||
| Annual Increase Death Benefit** | |||||||
| Partial Withdrawal Amount | (a) | $ | 15,000 | $ | 15,000 | ||
| Contract Value Immediately Prior to Partial Withdrawal | (b) | $ | 60,000 | $ | 60,000 | ||
| Value of Death Benefit Amount Immediately Prior to Partial Withdrawal (assumes 181 days worth of interest on $52,500 and $54,600, respectively) | (c) | $ | 53,786 | $ | 55,937 | ||
| Withdrawal Adjustment | [(a)/(b)]*(c) | $ | 13,446 | $ | 13,984 | ||
| Adjusted Death Benefit | $ | 40,339 | $ | 41,953 | |||
| * | For purpose of illustrating the withdrawal adjustment calculation, the example assumes the same hypothetical Contract Values and Maximum Anniversary Value for all Contracts, net of applicable fees and charges. Actual death benefit amounts will differ due to the different fees and charges under each Contract and the Credit Enhancement available under the Consultant Solutions Plus Contract. Please remember that you are looking at an example and that your investment performance may be greater or lower than the figures shown. |
| ** | Calculations for the Annual Increase Death Benefit assume that interest accumulates on a daily basis at a rate equivalent to 5% per year. There may be certain states in which the Benefit provides for interest that accumulates at a rate of 3% per year. If calculations assumed an interest rate of 3% per year, the adjusted death benefit would be lower. |
| Excess of Earnings Withdrawals | = | $0 |
| Purchase Payments in the 12 months prior to death | = | $0 |
| In-Force Premium | = | $100,000 ($100,000 + $0 - $0) |
| In-Force Earnings | = | $25,000 ($125,000 - $100,000) |
| Enhanced Earnings Death Benefit** | = | 40%*$25,000 = $10,000 |
| * | For purposes of illustrating the calculation of Enhanced Earnings Death Benefit Option, the example assumes the same hypothetical Contract Values for all Contracts, net of applicable fees and charges. Actual death benefit amounts will differ due to the different fees and charges under each Contract and the Credit Enhancement available under the Consultant Solutions Plus Contract. |
| ** | If the oldest Contract Owner or Co-Annuitant had been over age 70, and both were age 79 or younger on the Rider Application Date, the Enhanced Earnings Death Benefit would be 25% of the In-Force Earnings ($6,250.00). |
| Excess of Earnings Withdrawals | = | $5,000 ($10,000 - $5,000) |
| Purchase Payments in the 12 months prior to death | = | $0 |
| In-Force Premium | = | $95,000 ($100,000 + $0 - $5,000) |
| In-Force Earnings | = | $19,000 ($114,000 - $95,000) |
| Enhanced Earnings Death Benefit** | = | 40%*$19,000 = $7,600 |
| * | For purposes of illustrating the calculation of Enhanced Earnings Death Benefit Option, the example assumes the same hypothetical Contract Values for all Contracts, net of applicable fees and charges. Actual death benefit amounts will differ due to the different fees and charges under each Contract and the Credit Enhancement available under the Consultant Solutions Plus Contract. |
| ** | If the oldest Contract Owner or Co-Annuitant had been over age 70, and both were age 79 or younger on the Rider Application Date, the Enhanced Earnings Death Benefit would be 25% of the In-Force Earnings ($4,750.00). |
| Excess of Earnings Withdrawals | = | $30,000 ($50,000 - $20,000) |
| Purchase Payments in the 12 months prior to death | = | $0 |
| In-Force Premium | = | $120,000 ($110,000 + $40,000 - $30,000) |
| In-Force Earnings | = | $20,000 ($140,000 - $120,000) |
| Enhanced Earnings Death Benefit** | = | 25%*$20,000 = $5,000 |
| * | For purposes of illustrating the calculation of Enhanced Earnings Death Benefit Option, the example assumes the same hypothetical Contract Values for all Contracts, net of applicable fees and charges. Actual death benefit amounts will differ due to the different fees and charges under each Contract and the Credit Enhancement available under the Consultant Solutions Plus Contract. |
| ** | If the oldest Contract Owner had been age 70 or younger on the Rider Application Date, the Enhanced Earnings Death Benefit would be 40% of the In-Force Earnings ($8,000.00). |
| Excess of Earnings Withdrawals | = | $0 |
| Purchase Payments in the 12 months prior to death | = | $0 |
| In-Force Premium | = | $100,000 ($100,000 + $0 - $0) |
| In-Force Earnings | = | $50,000 ($150,000 - $100,000) |
| Enhanced Earnings Death Benefit** | = | 40%*$50,000 = $20,000 |
| Contract Value | = | $150,000 |
| Death Benefit | = | $160,000 |
| Enhanced Earnings Death Benefit | = | $20,000 |
| Continuing Contract Value | = | $180,000 ($160,000 + $20,000) |
| * | For purposes of illustrating the calculation of Enhanced Earnings Death Benefit Option, the example assumes the same hypothetical Contract Values and Maximum Anniversary Values for all Contracts, net of applicable fees and charges. Actual death benefit amounts will differ due to the different fees and charges under each Contract and the Credit Enhancement available under the Consultant Solutions Plus Contract. |
| ** | If the oldest Contract Owner had been over age 70 , and both were age 79 or younger on the Rider Application Date, the Enhanced Earnings Death Benefit would be 25% of the In-Force Earnings ($12,500.00). |
| Benefit Base | ||||||||||||||||
| Date | Type of Occurrence | Beginning Contract Value | Transaction Amount | Contract Value After Occurrence | Classic, Elite and Select | Plus | ||||||||||
| 1/1/2008 | Contract Anniversary | $ | 55,000 | — | $ | 55,000 | $ | 50,000 | $ | 52,000 | ||||||
| 7/1/2008 | Partial Withdrawal | $ | 60,000 | $ | 15,000 | $ | 45,000 | $ | 37,500 | $ | 39,000 | |||||
| Classic, Elite and Select | Plus | ||||||
| Benefit Base | |||||||
| Partial Withdrawal Amount | (a) | $ | 15,000 | $ | 15,000 | ||
| Contract Value Immediately Prior to Partial Withdrawal | (b) | $ | 60,000 | $ | 60,000 | ||
| Value of Benefit Base Immediately Prior to Partial Withdrawal | (c) | $ | 50,000 | $ | 52,000 | ||
| Withdrawal Adjustment | [(a)/(b)]*(c) | $ | 12,500 | $ | 13,000 | ||
| Adjusted Benefit Base | $ | 37,500 | $ | 39,000 | |||
| * | For the purpose of illustrating the withdrawal adjustment calculation, the example assumes the same hypothetical Contract Values, net of applicable fees and charges. Actual Contract Values will differ due to the different fees and charges under each Contract and the Credit Enhancement available under Consultant Solutions Plus Contracts. Please remember that you are looking at an example and that your investment performance may be greater or lower than the figures shown. |
| CONSULTANT SOLUTIONS VARIABLE ANNUITIES: LBL Consultant Solution Classic Contracts - PROSPECTUS | |||
| ACCUMULATION UNIT VALUE AND NUMBER OF ACCUMULATION UNITS OUTSTANDING FOR EACH VARIABLE | |||
| SUB-ACCOUNT* | |||
| Low | |||
| Mortality & Expense = 1.25 | |||
| For the Year | Accumulation Unit Value | Accumulation Unit Value | Number of Accumulation Units |
| Ending December 31 | At Beginning of Period | At End of Period | Outstanding at End of Period |
| Alger Capital Appreciation Portfolio - Class S | |||
| 2009 | $9.58198 | $14.24397 | 103,782 |
| 2010 | $14.24397 | $15.96659 | 81,615 |
| 2011 | $15.96659 | $15.65271 | 71,835 |
| 2012 | $15.65271 | $18.20353 | 91,871 |
| 2013 | $18.20353 | $24.20541 | 40,645 |
| 2014 | $24.20541 | $27.08944 | 41,065 |
| 2015 | $27.08944 | $28.30419 | 36,266 |
| 2016 | $28.30419 | $27.98472 | 32,713 |
| 2017 | $27.98472 | $36.09437 | 29,103 |
| 2018 | $36.09437 | $35.47344 | 24,234 |
| Alger Large Cap Growth Portfolio - Class S | |||
| 2009 | $7.20418 | $10.46492 | 192,485 |
| 2010 | $10.46492 | $11.65612 | 149,608 |
| 2011 | $11.65612 | $11.41139 | 129,818 |
| 2012 | $11.41139 | $12.31266 | 101,373 |
| 2013 | $12.31266 | $16.34620 | 79,784 |
| 2014 | $16.34620 | $17.82843 | 164,785 |
| 2015 | $17.82843 | $17.82571 | 155,888 |
| 2016 | $17.82571 | $17.37409 | 148,660 |
| 2017 | $17.37409 | $21.93202 | 41,315 |
| 2018 | $21.93202 | $22.00807 | 77,451 |
| Alger Mid Cap Growth Portfolio - Class S | |||
| 2009 | $6.60472 | $9.85888 | 287,119 |
| 2010 | $9.85888 | $11.56242 | 207,809 |
| 2011 | $11.56242 | $10.42672 | 178,217 |
| 2012 | $10.42672 | $11.89960 | 145,851 |
| 2013 | $11.89960 | $15.89496 | 114,252 |
| 2014 | $15.89496 | $16.86946 | 94,587 |
| 2015 | $16.86946 | $16.32650 | 81,563 |
| 2016 | $16.32650 | $16.18444 | 67,135 |
| 2017 | $16.18444 | $20.62623 | 56,365 |
| 2018 | $20.62623 | $18.76204 | 42,749 |
| ClearBridge Variable Large Cap Value Portfolio-Class I | |||
| 2009 | $6.19105 | $7.60383 | 79,400 |
| 2010 | $7.60383 | $8.21116 | 60,894 |
| 2011 | $8.21116 | $8.50172 | 48,053 |
| 2012 | $8.50172 | $9.77091 | 43,691 |
| 2013 | $9.77091 | $12.75917 | 23,351 |
| 2014 | $12.75917 | $14.06066 | 37,777 |
| 2015 | $14.06066 | $13.47305 | 25,876 |
| 2016 | $13.47305 | $15.01970 | 24,739 |
| 2017 | $15.01970 | $17.01598 | 23,640 |
| 2018 | $17.01598 | $15.29561 | 16,419 |
| For the Year | Accumulation Unit Value | Accumulation Unit Value | Number of Accumulation Units |
| Ending December 31 | At Beginning of Period | At End of Period | Outstanding at End of Period |
| Fidelity® VIP Asset Manager Portfolio - Service Class 2 | |||
| 2009 | $8.80910 | $11.18959 | 119,875 |
| 2010 | $11.18959 | $12.57995 | 112,596 |
| 2011 | $12.57995 | $12.06101 | 77,639 |
| 2012 | $12.06101 | $13.35356 | 57,021 |
| 2013 | $13.35356 | $15.19401 | 50,790 |
| 2014 | $15.19401 | $15.81905 | 46,043 |
| 2015 | $15.81905 | $15.59610 | 39,779 |
| 2016 | $15.59610 | $15.82303 | 35,856 |
| 2017 | $15.82303 | $17.75547 | 34,515 |
| 2018 | $17.75547 | $16.53130 | 34,325 |
| Fidelity® VIP Contrafund® Portfolio - Service Class 2 | |||
| 2009 | $9.42525 | $12.59585 | 702,455 |
| 2010 | $12.59585 | $14.52923 | 608,058 |
| 2011 | $14.52923 | $13.93442 | 502,184 |
| 2012 | $13.93442 | $15.96457 | 366,709 |
| 2013 | $15.96457 | $20.62396 | 282,865 |
| 2014 | $20.62396 | $22.71672 | 232,099 |
| 2015 | $22.71672 | $22.50314 | 186,712 |
| 2016 | $22.50314 | $23.91630 | 162,021 |
| 2017 | $23.91630 | $28.68806 | 143,215 |
| 2018 | $28.68806 | $26.41988 | 123,473 |
| Fidelity® VIP Equity-Income Portfolio - Service Class 2 | |||
| 2009 | $7.52800 | $9.64565 | 556,829 |
| 2010 | $9.64565 | $10.93498 | 507,555 |
| 2011 | $10.93498 | $10.85831 | 393,828 |
| 2012 | $10.85831 | $12.53823 | 304,289 |
| 2013 | $12.53823 | $15.81100 | 211,218 |
| 2014 | $15.81100 | $16.92017 | 158,397 |
| 2015 | $16.92017 | $15.98427 | 136,197 |
| 2016 | $15.98427 | $18.56166 | 111,803 |
| 2017 | $18.56166 | $20.62845 | 94,283 |
| 2018 | $20.62845 | $18.61141 | 75,778 |
| Fidelity® VIP Government Money Market Portfolio - Initial Class | |||
| 2016 | $10.00000 | $9.96382 | 164,902 |
| 2017 | $9.96382 | $9.89609 | 146,660 |
| 2018 | $9.89609 | $9.92315 | 123,695 |
| Fidelity® VIP Government Money Market Portfolio - Service Class 2 | |||
| 2009 | $10.94612 | $10.84959 | 1,408,990 |
| 2010 | $10.84959 | $10.71093 | 1,056,049 |
| 2011 | $10.71093 | $10.56779 | 995,591 |
| 2012 | $10.56779 | $10.42578 | 767,257 |
| 2013 | $10.42578 | $10.28606 | 618,987 |
| 2014 | $10.28606 | $10.14822 | 472,894 |
| 2015 | $10.14822 | $10.01222 | 381,361 |
| 2016 | $10.01222 | $9.87878 | 335,490 |
| 2017 | $9.87878 | $9.78727 | 300,760 |
| 2018 | $9.78727 | $9.78948 | 246,277 |
| For the Year | Accumulation Unit Value | Accumulation Unit Value | Number of Accumulation Units |
| Ending December 31 | At Beginning of Period | At End of Period | Outstanding at End of Period |
| Fidelity® VIP Growth Portfolio - Service Class 2 | |||
| 2009 | $6.97073 | $8.79969 | 268,644 |
| 2010 | $8.79969 | $10.75243 | 234,521 |
| 2011 | $10.75243 | $10.60413 | 183,811 |
| 2012 | $10.60413 | $11.96727 | 111,743 |
| 2013 | $11.96727 | $16.05591 | 87,560 |
| 2014 | $16.05591 | $17.58353 | 67,893 |
| 2015 | $17.58353 | $18.54379 | 51,691 |
| 2016 | $18.54379 | $18.39474 | 48,347 |
| 2017 | $18.39474 | $24.46560 | 85,247 |
| 2018 | $24.46560 | $24.02947 | 37,072 |
| Fidelity® VIP Index 500 Portfolio - Service Class 2 | |||
| 2009 | $8.06012 | $10.04258 | 981,330 |
| 2010 | $10.04258 | $11.36632 | 794,035 |
| 2011 | $11.36632 | $11.41325 | 670,286 |
| 2012 | $11.41325 | $13.01876 | 525,991 |
| 2013 | $13.01876 | $16.94117 | 379,644 |
| 2014 | $16.94117 | $18.93329 | 326,211 |
| 2015 | $18.93329 | $18.87987 | 265,767 |
| 2016 | $18.87987 | $20.78289 | 212,877 |
| 2017 | $20.78289 | $24.89248 | 186,411 |
| 2018 | $24.89248 | $23.39325 | 164,163 |
| Fidelity® VIP Investment Grade Bond Portfolio - Service Class 2 | |||
| 2009 | $10.31524 | $11.75015 | 550,819 |
| 2010 | $11.75015 | $12.46645 | 526,200 |
| 2011 | $12.46645 | $13.16385 | 567,827 |
| 2012 | $13.16385 | $13.71342 | 328,111 |
| 2013 | $13.71342 | $13.24855 | 239,889 |
| 2014 | $13.24855 | $13.80393 | 196,159 |
| 2015 | $13.80393 | $13.50187 | 175,007 |
| 2016 | $13.50187 | $13.91655 | 145,247 |
| 2017 | $13.91655 | $14.27737 | 135,683 |
| 2018 | $14.27737 | $13.97290 | 110,385 |
| Fidelity® VIP Overseas Portfolio - Service Class 2 | |||
| 2009 | $9.50003 | $11.82910 | 694,356 |
| 2010 | $11.82910 | $13.16664 | 617,998 |
| 2011 | $13.16664 | $10.73684 | 562,383 |
| 2012 | $10.73684 | $12.74996 | 414,825 |
| 2013 | $12.74996 | $16.37223 | 309,349 |
| 2014 | $16.37223 | $14.81114 | 266,449 |
| 2015 | $14.81114 | $15.09285 | 215,156 |
| 2016 | $15.09285 | $14.10521 | 198,292 |
| 2017 | $14.10521 | $18.08844 | 163,773 |
| 2018 | $18.08844 | $15.15641 | 122,175 |
| Goldman Sachs VIT Mid Cap Value Fund - Institutional | |||
| 2015 | $10.00000 | $8.73795 | 72,245 |
| 2016 | $8.73795 | $9.78670 | 60,245 |
| 2017 | $9.78670 | $10.72379 | 59,442 |
| 2018 | $10.72379 | $9.47195 | 48,617 |
| For the Year | Accumulation Unit Value | Accumulation Unit Value | Number of Accumulation Units |
| Ending December 31 | At Beginning of Period | At End of Period | Outstanding at End of Period |
| Guggenheim VIF Long Short Equity Fund | |||
| 2009 | $9.24851 | $11.61387 | 80,586 |
| 2010 | $11.61387 | $12.74135 | 74,184 |
| 2011 | $12.74135 | $11.74480 | 56,732 |
| 2012 | $11.74480 | $12.09927 | 44,489 |
| 2013 | $12.09927 | $14.01972 | 32,853 |
| 2014 | $14.01972 | $14.21700 | 25,371 |
| 2015 | $14.21700 | $14.20181 | 20,367 |
| 2016 | $14.20181 | $14.10238 | 11,730 |
| 2017 | $14.10238 | $15.97910 | 9,056 |
| 2018 | $15.97910 | $13.72338 | 6,919 |
| Invesco V.I. American Franchise Fund - Series II | |||
| 2012 | $10.00000 | $9.78497 | 16,939 |
| 2013 | $9.78497 | $13.49434 | 13,297 |
| 2014 | $13.49434 | $14.39958 | 11,516 |
| 2015 | $14.39958 | $14.87996 | 10,691 |
| 2016 | $14.87996 | $14.97570 | 10,340 |
| 2017 | $14.97570 | $18.76734 | 9,415 |
| 2018 | $18.76734 | $17.79259 | 6,799 |
| Invesco V.I. Core Equity Fund - Series II | |||
| 2009 | $7.89968 | $9.97372 | 159,397 |
| 2010 | $9.97372 | $10.74916 | 157,890 |
| 2011 | $10.74916 | $10.57322 | 133,055 |
| 2012 | $10.57322 | $11.85005 | 110,594 |
| 2013 | $11.85005 | $15.07274 | 82,642 |
| 2014 | $15.07274 | $16.03597 | 61,238 |
| 2015 | $16.03597 | $14.86986 | 56,069 |
| 2016 | $14.86986 | $16.13946 | 41,171 |
| 2017 | $16.13946 | $17.97264 | 39,295 |
| 2018 | $17.97264 | $16.02497 | 24,788 |
| Invesco V.I. Government Securities Fund - Series II | |||
| 2011 | $10.00000 | $12.21467 | 114,080 |
| 2012 | $12.21467 | $12.31671 | 80,890 |
| 2013 | $12.31671 | $11.80362 | 54,619 |
| 2014 | $11.80362 | $12.09623 | 45,371 |
| 2015 | $12.09623 | $11.94021 | 34,417 |
| 2016 | $11.94021 | $11.89747 | 30,264 |
| 2017 | $11.89747 | $11.93933 | 28,330 |
| 2018 | $11.93933 | $11.81213 | 27,228 |
| Invesco V.I. Growth and Income Fund - Series II | |||
| 2009 | $9.28261 | $11.36504 | 614,322 |
| 2010 | $11.36504 | $12.57861 | 526,375 |
| 2011 | $12.57861 | $12.12850 | 417,385 |
| 2012 | $12.12850 | $13.68102 | 302,328 |
| 2013 | $13.68102 | $18.05382 | 207,226 |
| 2014 | $18.05382 | $19.58492 | 155,774 |
| 2015 | $19.58492 | $18.68042 | 131,202 |
| 2016 | $18.68042 | $22.00962 | 107,954 |
| 2017 | $22.00962 | $24.76141 | 98,798 |
| 2018 | $24.76141 | $21.10570 | 80,082 |
| For the Year | Accumulation Unit Value | Accumulation Unit Value | Number of Accumulation Units |
| Ending December 31 | At Beginning of Period | At End of Period | Outstanding at End of Period |
| Invesco V.I. Mid Cap Core Equity Fund - Series II | |||
| 2009 | $9.65640 | $12.37005 | 277,636 |
| 2010 | $12.37005 | $13.88453 | 245,585 |
| 2011 | $13.88453 | $12.80655 | 221,182 |
| 2012 | $12.80655 | $13.97482 | 166,828 |
| 2013 | $13.97482 | $17.71034 | 121,224 |
| 2014 | $17.71034 | $18.19974 | 98,489 |
| 2015 | $18.19974 | $17.18549 | 87,914 |
| 2016 | $17.18549 | $19.18573 | 73,293 |
| 2017 | $19.18573 | $21.70112 | 63,897 |
| 2018 | $21.70112 | $18.92366 | 53,846 |
| Invesco V.I. Mid Cap Growth Fund - Series II | |||
| 2009 | $7.67057 | $11.83283 | 35,133 |
| 2010 | $11.83283 | $14.85694 | 45,521 |
| 2011 | $14.85694 | $13.28483 | 26,213 |
| 2012 | $13.28483 | $14.62877 | 19,233 |
| 2013 | $14.62877 | $19.71372 | 16,890 |
| 2014 | $19.71372 | $20.94345 | 15,348 |
| 2015 | $20.94345 | $20.87596 | 13,730 |
| 2016 | $20.87596 | $20.71278 | 12,813 |
| 2017 | $20.71278 | $24.95867 | 11,953 |
| 2018 | $24.95867 | $23.17389 | 7,499 |
| Invesco V.I. Value Opportunities Fund - Series II | |||
| 2009 | $5.90733 | $8.60962 | 262,919 |
| 2010 | $8.60962 | $9.08332 | 213,414 |
| 2011 | $9.08332 | $8.65670 | 168,059 |
| 2012 | $8.65670 | $10.04725 | 118,174 |
| 2013 | $10.04725 | $13.20940 | 86,832 |
| 2014 | $13.20940 | $13.86319 | 72,668 |
| 2015 | $13.86319 | $12.21877 | 64,268 |
| 2016 | $12.21877 | $14.21462 | 52,020 |
| 2017 | $14.21462 | $16.43945 | 43,320 |
| 2018 | $16.43945 | $13.07870 | 43,142 |
| Janus Henderson Balanced Portfolio - Service Shares | |||
| 2009 | $11.07366 | $13.71888 | 209,853 |
| 2010 | $13.71888 | $14.63263 | 179,215 |
| 2011 | $14.63263 | $14.63110 | 148,727 |
| 2012 | $14.63110 | $16.36356 | 109,677 |
| 2013 | $16.36356 | $19.33941 | 88,822 |
| 2014 | $19.33941 | $20.65007 | 73,363 |
| 2015 | $20.65007 | $20.45492 | 68,230 |
| 2016 | $20.45492 | $21.05202 | 50,815 |
| 2017 | $21.05202 | $24.53529 | 47,293 |
| 2018 | $24.53529 | $24.30697 | 41,102 |
| Janus Henderson Forty Portfolio - Service Shares | |||
| 2009 | $10.17016 | $14.64955 | 134,229 |
| 2010 | $14.64955 | $15.38828 | 118,575 |
| 2011 | $15.38828 | $14.12713 | 100,834 |
| 2012 | $14.12713 | $17.26091 | 67,165 |
| 2013 | $17.26091 | $22.28723 | 48,189 |
| 2014 | $22.28723 | $23.84812 | 32,440 |
| 2015 | $23.84812 | $26.33458 | 28,588 |
| 2016 | $26.33458 | $26.48469 | 17,175 |
| 2017 | $26.48469 | $33.96598 | 16,261 |
| 2018 | $33.96598 | $34.08121 | 13,925 |
| For the Year | Accumulation Unit Value | Accumulation Unit Value | Number of Accumulation Units |
| Ending December 31 | At Beginning of Period | At End of Period | Outstanding at End of Period |
| Janus Henderson Mid Cap Value Portfolio - Service Shares | |||
| 2009 | $10.47012 | $13.72901 | 408,012 |
| 2010 | $13.72901 | $15.62467 | 316,553 |
| 2011 | $15.62467 | $14.95452 | 265,915 |
| 2012 | $14.95452 | $16.34421 | 197,499 |
| 2013 | $16.34421 | $20.28500 | 136,482 |
| 2014 | $20.28500 | $21.69992 | 111,102 |
| 2015 | $21.69992 | $20.61700 | 71,663 |
| 2016 | $20.61700 | $24.15575 | 61,264 |
| 2017 | $24.15575 | $27.07934 | 48,114 |
| 2018 | $27.07934 | $23.02030 | 41,205 |
| Janus Henderson Overseas Portfolio - Service Shares | |||
| 2009 | $7.07357 | $12.49583 | 123,025 |
| 2010 | $12.49583 | $15.41127 | 123,784 |
| 2011 | $15.41127 | $10.28693 | 94,045 |
| 2012 | $10.28693 | $11.48529 | 77,594 |
| 2013 | $11.48529 | $12.94839 | 55,546 |
| 2014 | $12.94839 | $11.22776 | 47,677 |
| 2015 | $11.22776 | $10.10095 | 36,325 |
| 2016 | $10.10095 | $9.29654 | 30,617 |
| 2017 | $9.29654 | $11.99676 | 25,435 |
| 2018 | $11.99676 | $10.04275 | 18,536 |
| MFS® Investors Growth Stock Portfolio - Service Class | |||
| 2015 | $10.00000 | $18.55517 | 66,203 |
| 2016 | $18.55517 | $19.37473 | 58,233 |
| 2017 | $19.37473 | $24.48540 | 45,526 |
| 2018 | $24.48540 | $24.29242 | 35,686 |
| MFS® Investors Trust Series - Service Class | |||
| 2009 | $9.06821 | $11.32159 | 33,920 |
| 2010 | $11.32159 | $12.38400 | 28,628 |
| 2011 | $12.38400 | $11.92176 | 27,057 |
| 2012 | $11.92176 | $13.97525 | 16,900 |
| 2013 | $13.97525 | $18.16228 | 9,109 |
| 2014 | $18.16228 | $19.83614 | 8,924 |
| 2015 | $19.83614 | $19.55923 | 8,143 |
| 2016 | $19.55923 | $20.90043 | 7,657 |
| 2017 | $20.90043 | $25.36755 | 6,768 |
| 2018 | $25.36755 | $23.59521 | 7,126 |
| MFS® New Discovery Series - Service Class | |||
| 2009 | $6.90837 | $11.10331 | 91,123 |
| 2010 | $11.10331 | $14.89027 | 131,452 |
| 2011 | $14.89027 | $13.14807 | 57,960 |
| 2012 | $13.14807 | $15.68066 | 41,545 |
| 2013 | $15.68066 | $21.84518 | 28,411 |
| 2014 | $21.84518 | $19.93517 | 22,594 |
| 2015 | $19.93517 | $19.24405 | 20,627 |
| 2016 | $19.24405 | $20.65541 | 18,264 |
| 2017 | $20.65541 | $25.74341 | 15,577 |
| 2018 | $25.74341 | $24.95816 | 12,339 |
| For the Year | Accumulation Unit Value | Accumulation Unit Value | Number of Accumulation Units |
| Ending December 31 | At Beginning of Period | At End of Period | Outstanding at End of Period |
| MFS® Total Return Series - Service Class | |||
| 2009 | $9.44270 | $10.96631 | 279,887 |
| 2010 | $10.96631 | $11.86046 | 248,952 |
| 2011 | $11.86046 | $11.88614 | 198,071 |
| 2012 | $11.88614 | $13.00736 | 127,302 |
| 2013 | $13.00736 | $15.23625 | 104,395 |
| 2014 | $15.23625 | $16.26852 | 66,440 |
| 2015 | $16.26852 | $15.95589 | 56,973 |
| 2016 | $15.95589 | $17.12872 | 45,714 |
| 2017 | $17.12872 | $18.93037 | 39,186 |
| 2018 | $18.93037 | $17.57725 | 33,995 |
| MFS® Value Series - Service Class | |||
| 2009 | $9.82586 | $11.86945 | 120,920 |
| 2010 | $11.86945 | $13.02266 | 95,563 |
| 2011 | $13.02266 | $12.78730 | 91,183 |
| 2012 | $12.78730 | $14.61773 | 46,801 |
| 2013 | $14.61773 | $19.55355 | 32,771 |
| 2014 | $19.55355 | $21.25758 | 26,177 |
| 2015 | $21.25758 | $20.77473 | 24,701 |
| 2016 | $20.77473 | $23.31843 | 20,053 |
| 2017 | $23.31843 | $26.99571 | 17,696 |
| 2018 | $26.99571 | $23.87158 | 19,760 |
| MFS® VIT II High Yield - Service Class | |||
| 2013 | $10.00000 | $16.07913 | 64,391 |
| 2014 | $16.07913 | $16.26396 | 51,344 |
| 2015 | $16.26396 | $15.33493 | 45,480 |
| 2016 | $15.33493 | $17.19280 | 41,050 |
| 2017 | $17.19280 | $18.03172 | 38,203 |
| 2018 | $18.03172 | $17.21088 | 35,088 |
| Morgan Stanley VIF Growth Portfolio, Class II | |||
| 2009 | $7.26467 | $11.83532 | 73,057 |
| 2010 | $11.83532 | $14.31565 | 71,085 |
| 2011 | $14.31565 | $13.69336 | 54,754 |
| 2012 | $13.69336 | $15.40639 | 33,571 |
| 2013 | $15.40639 | $22.45175 | 27,571 |
| 2014 | $22.45175 | $23.49725 | 56,127 |
| 2015 | $23.49725 | $25.95427 | 45,347 |
| 2016 | $25.95427 | $25.11268 | 42,727 |
| 2017 | $25.11268 | $35.38387 | 12,210 |
| 2018 | $35.38387 | $37.45103 | 61,050 |
| Morgan Stanley VIF U.S. Real Estate Portfolio, Class II | |||
| 2009 | $10.02584 | $12.70854 | 374,792 |
| 2010 | $12.70854 | $16.23900 | 303,954 |
| 2011 | $16.23900 | $16.92728 | 247,891 |
| 2012 | $16.92728 | $19.30677 | 189,555 |
| 2013 | $19.30677 | $19.37981 | 156,289 |
| 2014 | $19.37981 | $24.74418 | 122,056 |
| 2015 | $24.74418 | $24.87939 | 97,327 |
| 2016 | $24.87939 | $26.15155 | 77,808 |
| 2017 | $26.15155 | $26.53996 | 68,501 |
| 2018 | $26.53996 | $24.09359 | 58,650 |
| For the Year | Accumulation Unit Value | Accumulation Unit Value | Number of Accumulation Units |
| Ending December 31 | At Beginning of Period | At End of Period | Outstanding at End of Period |
| Oppenheimer Discovery Mid Cap Growth Fund/VA - Service Shares | |||
| 2009 | $6.22421 | $8.12106 | 82,002 |
| 2010 | $8.12106 | $10.18758 | 73,066 |
| 2011 | $10.18758 | $10.13434 | 64,612 |
| 2012 | $10.13434 | $11.61326 | 51,998 |
| 2013 | $11.61326 | $15.53795 | 41,735 |
| 2014 | $15.53795 | $16.17498 | 28,501 |
| 2015 | $16.17498 | $16.96948 | 24,195 |
| 2016 | $16.96948 | $17.08909 | 20,600 |
| 2017 | $17.08909 | $21.65637 | 17,507 |
| 2018 | $21.65637 | $20.01584 | 20,878 |
| Oppenheimer Global Fund/VA - Service Shares | |||
| 2009 | $9.14056 | $12.56582 | 318,882 |
| 2010 | $12.56582 | $14.34289 | 214,515 |
| 2011 | $14.34289 | $12.94307 | 179,849 |
| 2012 | $12.94307 | $15.44294 | 146,194 |
| 2013 | $15.44294 | $19.34650 | 109,747 |
| 2014 | $19.34650 | $19.47772 | 89,230 |
| 2015 | $19.47772 | $19.92040 | 75,907 |
| 2016 | $19.92040 | $19.62133 | 65,188 |
| 2017 | $19.62133 | $26.38801 | 54,809 |
| 2018 | $26.38801 | $22.54375 | 54,184 |
| Oppenheimer Main Street Small Cap Fund/VA - Service Shares | |||
| 2009 | $8.24730 | $11.13672 | 488,782 |
| 2010 | $11.13672 | $13.51954 | 394,097 |
| 2011 | $13.51954 | $13.01957 | 328,526 |
| 2012 | $13.01957 | $15.11285 | 241,866 |
| 2013 | $15.11285 | $20.96540 | 166,716 |
| 2014 | $20.96540 | $23.09282 | 143,307 |
| 2015 | $23.09282 | $21.39283 | 118,088 |
| 2016 | $21.39283 | $24.83449 | 92,041 |
| 2017 | $24.83449 | $27.90852 | 77,860 |
| 2018 | $27.90852 | $24.62867 | 68,213 |
| PIMCO International Bond (U.S. Dollar-Hedged) - Administrative Shares | |||
| formerly,PIMCO Foreign Bond Portfolio (U.S. Dollar-Hedged) - Administrative Shares | |||
| 2009 | $10.68801 | $12.19186 | 328,033 |
| 2010 | $12.19186 | $13.04958 | 307,466 |
| 2011 | $13.04958 | $13.74480 | 255,082 |
| 2012 | $13.74480 | $15.02965 | 198,826 |
| 2013 | $15.02965 | $14.90111 | 151,236 |
| 2014 | $14.90111 | $16.34040 | 115,842 |
| 2015 | $16.34040 | $16.16688 | 79,864 |
| 2016 | $16.16688 | $16.98210 | 62,507 |
| 2017 | $16.98210 | $17.21655 | 58,232 |
| 2018 | $17.21655 | $17.34329 | 45,872 |
| PIMCO Real Return Portfolio - Administrative Shares | |||
| 2009 | $10.61521 | $12.39819 | 713,734 |
| 2010 | $12.39819 | $13.22289 | 615,212 |
| 2011 | $13.22289 | $14.56770 | 496,281 |
| 2012 | $14.56770 | $15.62871 | 375,351 |
| 2013 | $15.62871 | $13.99651 | 273,276 |
| 2014 | $13.99651 | $14.23440 | 227,624 |
| 2015 | $14.23440 | $13.66239 | 186,219 |
| 2016 | $13.66239 | $14.17866 | 153,666 |
| 2017 | $14.17866 | $14.49897 | 134,319 |
| 2018 | $14.49897 | $13.98649 | 120,263 |
| For the Year | Accumulation Unit Value | Accumulation Unit Value | Number of Accumulation Units |
| Ending December 31 | At Beginning of Period | At End of Period | Outstanding at End of Period |
| PIMCO Total Return Portfolio - Administrative Shares | |||
| 2009 | $11.81239 | $13.29279 | 875,022 |
| 2010 | $13.29279 | $14.17776 | 871,323 |
| 2011 | $14.17776 | $14.49187 | 710,717 |
| 2012 | $14.49187 | $15.66689 | 565,502 |
| 2013 | $15.66689 | $15.15224 | 385,565 |
| 2014 | $15.15224 | $15.58717 | 296,643 |
| 2015 | $15.58717 | $15.44572 | 242,117 |
| 2016 | $15.44572 | $15.64565 | 200,975 |
| 2017 | $15.64565 | $16.19377 | 187,310 |
| 2018 | $16.19377 | $15.88914 | 155,606 |
| T. Rowe Price Blue Chip Growth Portfolio - II | |||
| 2009 | $7.40196 | $10.35370 | 670,845 |
| 2010 | $10.35370 | $11.84832 | 550,687 |
| 2011 | $11.84832 | $11.84782 | 447,857 |
| 2012 | $11.84782 | $13.78024 | 419,459 |
| 2013 | $13.78024 | $19.14771 | 299,644 |
| 2014 | $19.14771 | $20.55922 | 163,215 |
| 2015 | $20.55922 | $22.47160 | 123,658 |
| 2016 | $22.47160 | $22.28800 | 114,597 |
| 2017 | $22.28800 | $29.86589 | 165,525 |
| 2018 | $29.86589 | $29.94688 | 74,857 |
| T. Rowe Price Equity Income Portfolio - II | |||
| 2009 | $8.49761 | $10.49967 | 989,299 |
| 2010 | $10.49967 | $11.88499 | 793,746 |
| 2011 | $11.88499 | $11.60533 | 637,701 |
| 2012 | $11.60533 | $13.38567 | 445,276 |
| 2013 | $13.38567 | $17.08811 | 356,536 |
| 2014 | $17.08811 | $18.05485 | 256,724 |
| 2015 | $18.05485 | $16.54554 | 220,062 |
| 2016 | $16.54554 | $19.40040 | 179,533 |
| 2017 | $19.40040 | $22.15009 | 151,716 |
| 2018 | $22.15009 | $19.73178 | 124,257 |
| VanEck VIP Emerging Markets Fund - Initial Class | |||
| 2009 | $10.23141 | $21.51690 | 153,256 |
| 2010 | $21.51690 | $26.92400 | 141,498 |
| 2011 | $26.92400 | $19.72467 | 66,474 |
| 2012 | $19.72467 | $25.25786 | 48,444 |
| 2013 | $25.25786 | $27.91198 | 35,404 |
| 2014 | $27.91198 | $27.42090 | 29,680 |
| 2015 | $27.42090 | $23.26555 | 21,679 |
| 2016 | $23.26555 | $22.97588 | 19,892 |
| 2017 | $22.97588 | $34.23496 | 16,713 |
| 2018 | $34.23496 | $25.83901 | 14,534 |
| VanEck VIP Global Hard Assets Fund - Initial Class | |||
| 2009 | $17.44194 | $27.10619 | 126,577 |
| 2010 | $27.10619 | $34.55830 | 69,632 |
| 2011 | $34.55830 | $28.48398 | 56,911 |
| 2012 | $28.48398 | $29.04996 | 40,084 |
| 2013 | $29.04996 | $31.67659 | 30,113 |
| 2014 | $31.67659 | $25.27895 | 25,664 |
| 2015 | $25.27895 | $16.59646 | 23,263 |
| 2016 | $16.59646 | $23.52971 | 19,224 |
| 2017 | $23.52971 | $22.81897 | 15,188 |
| 2018 | $22.81897 | $16.14427 | 14,515 |
| For the Year | Accumulation Unit Value | Accumulation Unit Value | Number of Accumulation Units |
| Ending December 31 | At Beginning of Period | At End of Period | Outstanding at End of Period |
| Western Asset Variable Global High Yield Bond Portfolio - Class II | |||
| 2009 | $8.10358 | $12.37908 | 454,032 |
| 2010 | $12.37908 | $14.00663 | 377,768 |
| 2011 | $14.00663 | $13.99361 | 305,012 |
| 2012 | $13.99361 | $16.29946 | 243,475 |
| 2013 | $16.29946 | $17.05341 | 169,399 |
| 2014 | $17.05341 | $16.56924 | 150,676 |
| 2015 | $16.56924 | $15.35198 | 125,882 |
| 2016 | $15.35198 | $17.47125 | 99,925 |
| 2017 | $17.47125 | $18.68868 | 86,157 |
| 2018 | $18.68868 | $17.66763 | 76,999 |
| * The Accumulation Unit Values in this table reflect a mortality and expense risk charge of 1.25% and an administrative expense charge of 0.10%. | |||
| CONSULTANT SOLUTIONS VARIABLE ANNUITIES: LBL Consultant Solution Classic Contracts - PROSPECTUS | |||
| ACCUMULATION UNIT VALUE AND NUMBER OF ACCUMULATION UNITS OUTSTANDING FOR EACH VARIABLE | |||
| SUB-ACCOUNT* | |||
| High | |||
| Mortality & Expense = 2.15 | |||
| For the Year | Accumulation Unit Value | Accumulation Unit Value | Number of Accumulation Units |
| Ending December 31 | At Beginning of Period | At End of Period | Outstanding at End of Period |
| Alger Capital Appreciation Portfolio - Class S | |||
| 2009 | $9.16024 | $13.49289 | 0 |
| 2010 | $13.49289 | $14.98684 | 0 |
| 2011 | $14.98684 | $14.55845 | 0 |
| 2012 | $14.55845 | $16.77618 | 0 |
| 2013 | $16.77618 | $22.10411 | 0 |
| 2014 | $22.10411 | $24.51214 | 0 |
| 2015 | $24.51214 | $25.37767 | 0 |
| 2016 | $25.37767 | $24.86296 | 0 |
| 2017 | $24.86296 | $31.77945 | 0 |
| 2018 | $31.77945 | $30.94996 | 0 |
| Alger Large Cap Growth Portfolio - Class S | |||
| 2009 | $6.88700 | $9.91300 | 0 |
| 2010 | $9.91300 | $10.94075 | 0 |
| 2011 | $10.94075 | $10.61352 | 0 |
| 2012 | $10.61352 | $11.34706 | 0 |
| 2013 | $11.34706 | $14.92693 | 0 |
| 2014 | $14.92693 | $16.13196 | 0 |
| 2015 | $16.13196 | $15.98232 | 0 |
| 2016 | $15.98232 | $15.43568 | 0 |
| 2017 | $15.43568 | $19.30973 | 0 |
| 2018 | $19.30973 | $19.20122 | 0 |
| Alger Mid Cap Growth Portfolio - Class S | |||
| 2009 | $6.31387 | $9.33876 | 18,946 |
| 2010 | $9.33876 | $10.85262 | 0 |
| 2011 | $10.85262 | $9.69747 | 0 |
| 2012 | $9.69747 | $10.96614 | 0 |
| 2013 | $10.96614 | $14.51454 | 0 |
| 2014 | $14.51454 | $15.26384 | 0 |
| 2015 | $15.26384 | $14.63774 | 0 |
| 2016 | $14.63774 | $14.37837 | 0 |
| 2017 | $14.37837 | $18.15961 | 0 |
| 2018 | $18.15961 | $16.36871 | 0 |
| ClearBridge Variable Large Cap Value Portfolio-Class I | |||
| 2009 | $6.09634 | $7.41921 | 0 |
| 2010 | $7.41921 | $7.93876 | 0 |
| 2011 | $7.93876 | $8.14487 | 0 |
| 2012 | $8.14487 | $9.27519 | 0 |
| 2013 | $9.27519 | $12.00145 | 0 |
| 2014 | $12.00145 | $13.10500 | 0 |
| 2015 | $13.10500 | $12.44274 | 0 |
| 2016 | $12.44274 | $13.74494 | 0 |
| 2017 | $13.74494 | $15.43165 | 0 |
| 2018 | $15.43165 | $13.74586 | 0 |
| For the Year | Accumulation Unit Value | Accumulation Unit Value | Number of Accumulation Units |
| Ending December 31 | At Beginning of Period | At End of Period | Outstanding at End of Period |
| Fidelity® VIP Asset Manager Portfolio - Service Class 2 | |||
| 2009 | $8.42141 | $10.59961 | 109 |
| 2010 | $10.59961 | $11.80805 | 108 |
| 2011 | $11.80805 | $11.21789 | 109 |
| 2012 | $11.21789 | $12.30651 | 113 |
| 2013 | $12.30651 | $13.87496 | 123 |
| 2014 | $13.87496 | $14.31394 | 124 |
| 2015 | $14.31394 | $13.98342 | 126 |
| 2016 | $13.98342 | $14.05781 | 130 |
| 2017 | $14.05781 | $15.63267 | 140 |
| 2018 | $15.63267 | $14.42310 | 144 |
| Fidelity® VIP Contrafund® Portfolio - Service Class 2 | |||
| 2009 | $9.01044 | $11.93165 | 1,704 |
| 2010 | $11.93165 | $13.63766 | 1,549 |
| 2011 | $13.63766 | $12.96025 | 1,428 |
| 2012 | $12.96025 | $14.71272 | 1,134 |
| 2013 | $14.71272 | $18.83349 | 1,057 |
| 2014 | $18.83349 | $20.55535 | 993 |
| 2015 | $20.55535 | $20.17630 | 928 |
| 2016 | $20.17630 | $21.24826 | 925 |
| 2017 | $21.24826 | $25.25834 | 815 |
| 2018 | $25.25834 | $23.05066 | 535 |
| Fidelity® VIP Equity-Income Portfolio - Service Class 2 | |||
| 2009 | $7.19659 | $9.13687 | 8,329 |
| 2010 | $9.13687 | $10.26378 | 7,490 |
| 2011 | $10.26378 | $10.09900 | 5,648 |
| 2012 | $10.09900 | $11.55485 | 5,322 |
| 2013 | $11.55485 | $14.43811 | 4,931 |
| 2014 | $14.43811 | $15.31001 | 4,672 |
| 2015 | $15.31001 | $14.33119 | 4,438 |
| 2016 | $14.33119 | $16.49066 | 4,088 |
| 2017 | $16.49066 | $18.16189 | 3,612 |
| 2018 | $18.16189 | $16.23763 | 2,890 |
| Fidelity® VIP Government Money Market Portfolio - Initial Class | |||
| 2016 | $10.00000 | $9.93393 | 1,547 |
| 2017 | $9.93393 | $9.77753 | 931 |
| 2018 | $9.77753 | $9.71555 | 0 |
| Fidelity® VIP Government Money Market Portfolio - Service Class 2 | |||
| 2009 | $10.46453 | $10.27762 | 4,430 |
| 2010 | $10.27762 | $10.05371 | 4,467 |
| 2011 | $10.05371 | $9.82910 | 2,972 |
| 2012 | $9.82910 | $9.60831 | 3,233 |
| 2013 | $9.60831 | $9.39306 | 3,670 |
| 2014 | $9.39306 | $9.18263 | 3,799 |
| 2015 | $9.18263 | $8.97691 | 2,795 |
| 2016 | $8.97691 | $8.77669 | 2,959 |
| 2017 | $8.77669 | $8.61708 | 2,885 |
| 2018 | $8.61708 | $8.54103 | 2,197 |
| For the Year | Accumulation Unit Value | Accumulation Unit Value | Number of Accumulation Units |
| Ending December 31 | At Beginning of Period | At End of Period | Outstanding at End of Period |
| Fidelity® VIP Growth Portfolio - Service Class 2 | |||
| 2009 | $6.66382 | $8.33551 | 0 |
| 2010 | $8.33551 | $10.09245 | 0 |
| 2011 | $10.09245 | $9.86264 | 0 |
| 2012 | $9.86264 | $11.02872 | 0 |
| 2013 | $11.02872 | $14.66184 | 0 |
| 2014 | $14.66184 | $15.91034 | 0 |
| 2015 | $15.91034 | $16.62616 | 0 |
| 2016 | $16.62616 | $16.34247 | 0 |
| 2017 | $16.34247 | $21.54050 | 0 |
| 2018 | $21.54050 | $20.96494 | 0 |
| Fidelity® VIP Index 500 Portfolio - Service Class 2 | |||
| 2009 | $7.70535 | $9.51294 | 1,113 |
| 2010 | $9.51294 | $10.66876 | 1,102 |
| 2011 | $10.66876 | $10.61529 | 136 |
| 2012 | $10.61529 | $11.99787 | 130 |
| 2013 | $11.99787 | $15.47036 | 105 |
| 2014 | $15.47036 | $17.13183 | 97 |
| 2015 | $17.13183 | $16.92765 | 0 |
| 2016 | $16.92765 | $18.46442 | 0 |
| 2017 | $18.46442 | $21.91652 | 0 |
| 2018 | $21.91652 | $20.41003 | 0 |
| Fidelity® VIP Investment Grade Bond Portfolio - Service Class 2 | |||
| 2009 | $9.86139 | $11.13074 | 2,068 |
| 2010 | $11.13074 | $11.70160 | 1,842 |
| 2011 | $11.70160 | $12.24381 | 1,833 |
| 2012 | $12.24381 | $12.63832 | 246 |
| 2013 | $12.63832 | $12.09849 | 268 |
| 2014 | $12.09849 | $12.49069 | 268 |
| 2015 | $12.49069 | $12.10588 | 0 |
| 2016 | $12.10588 | $12.36417 | 0 |
| 2017 | $12.36417 | $12.57053 | 0 |
| 2018 | $12.57053 | $12.19112 | 0 |
| Fidelity® VIP Overseas Portfolio - Service Class 2 | |||
| 2009 | $9.08192 | $11.20526 | 1,129 |
| 2010 | $11.20526 | $12.35861 | 1,004 |
| 2011 | $12.35861 | $9.98601 | 1,039 |
| 2012 | $9.98601 | $11.74997 | 946 |
| 2013 | $11.74997 | $14.95063 | 854 |
| 2014 | $14.95063 | $13.40165 | 956 |
| 2015 | $13.40165 | $13.53191 | 829 |
| 2016 | $13.53191 | $12.53135 | 941 |
| 2017 | $12.53135 | $15.92555 | 707 |
| 2018 | $15.92555 | $13.22324 | 710 |
| Goldman Sachs VIT Mid Cap Value Fund - Institutional | |||
| 2015 | $10.00000 | $8.68452 | 0 |
| 2016 | $8.68452 | $9.63838 | 0 |
| 2017 | $9.63838 | $10.46621 | 0 |
| 2018 | $10.46621 | $9.16070 | 0 |
| For the Year | Accumulation Unit Value | Accumulation Unit Value | Number of Accumulation Units |
| Ending December 31 | At Beginning of Period | At End of Period | Outstanding at End of Period |
| Guggenheim VIF Long Short Equity Fund | |||
| 2009 | $8.84144 | $11.00144 | 799 |
| 2010 | $11.00144 | $11.95948 | 796 |
| 2011 | $11.95948 | $10.92371 | 0 |
| 2012 | $10.92371 | $11.15047 | 0 |
| 2013 | $11.15047 | $12.80250 | 0 |
| 2014 | $12.80250 | $12.86420 | 0 |
| 2015 | $12.86420 | $12.73323 | 0 |
| 2016 | $12.73323 | $12.52906 | 0 |
| 2017 | $12.52906 | $14.06863 | 0 |
| 2018 | $14.06863 | $11.97320 | 0 |
| Invesco V.I. American Franchise Fund - Series II | |||
| 2012 | $10.00000 | $9.01757 | 0 |
| 2013 | $9.01757 | $12.32269 | 0 |
| 2014 | $12.32269 | $13.02939 | 0 |
| 2015 | $13.02939 | $13.34120 | 0 |
| 2016 | $13.34120 | $13.30490 | 0 |
| 2017 | $13.30490 | $16.52351 | 0 |
| 2018 | $16.52351 | $15.52343 | 0 |
| Invesco V.I. Core Equity Fund - Series II | |||
| 2009 | $7.70810 | $9.64307 | 0 |
| 2010 | $9.64307 | $10.29805 | 0 |
| 2011 | $10.29805 | $10.03728 | 0 |
| 2012 | $10.03728 | $11.14653 | 0 |
| 2013 | $11.14653 | $14.04864 | 0 |
| 2014 | $14.04864 | $14.81006 | 0 |
| 2015 | $14.81006 | $13.60777 | 0 |
| 2016 | $13.60777 | $14.63527 | 0 |
| 2017 | $14.63527 | $16.15090 | 0 |
| 2018 | $16.15090 | $14.27022 | 0 |
| Invesco V.I. Government Securities Fund - Series II | |||
| 2011 | $10.00000 | $11.36092 | 267 |
| 2012 | $11.36092 | $11.35105 | 267 |
| 2013 | $11.35105 | $10.77894 | 267 |
| 2014 | $10.77894 | $10.94538 | 267 |
| 2015 | $10.94538 | $10.70564 | 267 |
| 2016 | $10.70564 | $10.57027 | 267 |
| 2017 | $10.57027 | $10.51193 | 267 |
| 2018 | $10.51193 | $10.30582 | 0 |
| Invesco V.I. Growth and Income Fund - Series II | |||
| 2009 | $8.87405 | $10.76571 | 6,552 |
| 2010 | $10.76571 | $11.80667 | 5,971 |
| 2011 | $11.80667 | $11.28051 | 5,332 |
| 2012 | $11.28051 | $12.60814 | 5,132 |
| 2013 | $12.60814 | $16.48636 | 4,569 |
| 2014 | $16.48636 | $17.72137 | 4,279 |
| 2015 | $17.72137 | $16.74869 | 3,952 |
| 2016 | $16.74869 | $19.55413 | 3,610 |
| 2017 | $19.55413 | $21.80090 | 3,176 |
| 2018 | $21.80090 | $18.41398 | 2,650 |
| For the Year | Accumulation Unit Value | Accumulation Unit Value | Number of Accumulation Units |
| Ending December 31 | At Beginning of Period | At End of Period | Outstanding at End of Period |
| Invesco V.I. Mid Cap Core Equity Fund - Series II | |||
| 2009 | $9.23143 | $11.71776 | 1,268 |
| 2010 | $11.71776 | $13.03249 | 1,264 |
| 2011 | $13.03249 | $11.91119 | 350 |
| 2012 | $11.91119 | $12.87891 | 357 |
| 2013 | $12.87891 | $16.17270 | 352 |
| 2014 | $16.17270 | $16.46796 | 356 |
| 2015 | $16.46796 | $15.40830 | 356 |
| 2016 | $15.40830 | $17.04520 | 357 |
| 2017 | $17.04520 | $19.10641 | 361 |
| 2018 | $19.10641 | $16.51014 | 120 |
| Invesco V.I. Mid Cap Growth Fund - Series II | |||
| 2009 | $7.33288 | $11.20875 | 0 |
| 2010 | $11.20875 | $13.94515 | 0 |
| 2011 | $13.94515 | $12.35590 | 0 |
| 2012 | $12.35590 | $13.48143 | 0 |
| 2013 | $13.48143 | $18.00196 | 0 |
| 2014 | $18.00196 | $18.95037 | 0 |
| 2015 | $18.95037 | $18.71692 | 0 |
| 2016 | $18.71692 | $18.40164 | 0 |
| 2017 | $18.40164 | $21.97422 | 0 |
| 2018 | $21.97422 | $20.21805 | 0 |
| Invesco V.I. Value Opportunities Fund - Series II | |||
| 2009 | $5.64717 | $8.15535 | 1,086 |
| 2010 | $8.15535 | $8.52560 | 1,087 |
| 2011 | $8.52560 | $8.05117 | 80 |
| 2012 | $8.05117 | $9.25902 | 75 |
| 2013 | $9.25902 | $12.06214 | 73 |
| 2014 | $12.06214 | $12.54366 | 72 |
| 2015 | $12.54366 | $10.95484 | 79 |
| 2016 | $10.95484 | $12.62830 | 80 |
| 2017 | $12.62830 | $14.47338 | 76 |
| 2018 | $14.47338 | $11.41023 | 80 |
| Janus Henderson Balanced Portfolio - Service Shares | |||
| 2009 | $10.58642 | $12.99568 | 0 |
| 2010 | $12.99568 | $13.73490 | 0 |
| 2011 | $13.73490 | $13.60847 | 0 |
| 2012 | $13.60847 | $15.08068 | 0 |
| 2013 | $15.08068 | $17.66069 | 0 |
| 2014 | $17.66069 | $18.68558 | 0 |
| 2015 | $18.68558 | $18.34013 | 0 |
| 2016 | $18.34013 | $18.70378 | 0 |
| 2017 | $18.70378 | $21.60230 | 0 |
| 2018 | $21.60230 | $21.20755 | 0 |
| Janus Henderson Forty Portfolio - Service Shares | |||
| 2009 | $9.72253 | $13.87707 | 0 |
| 2010 | $13.87707 | $14.44395 | 0 |
| 2011 | $14.44395 | $13.13944 | 0 |
| 2012 | $13.13944 | $15.90743 | 0 |
| 2013 | $15.90743 | $20.35235 | 0 |
| 2014 | $20.35235 | $21.57907 | 0 |
| 2015 | $21.57907 | $23.61160 | 0 |
| 2016 | $23.61160 | $23.53014 | 0 |
| 2017 | $23.53014 | $29.90534 | 0 |
| 2018 | $29.90534 | $29.73512 | 0 |
| For the Year | Accumulation Unit Value | Accumulation Unit Value | Number of Accumulation Units |
| Ending December 31 | At Beginning of Period | At End of Period | Outstanding at End of Period |
| Janus Henderson Mid Cap Value Portfolio - Service Shares | |||
| 2009 | $10.00934 | $13.00506 | 521 |
| 2010 | $13.00506 | $14.66586 | 506 |
| 2011 | $14.66586 | $13.90902 | 509 |
| 2012 | $13.90902 | $15.06253 | 259 |
| 2013 | $15.06253 | $18.52385 | 223 |
| 2014 | $18.52385 | $19.63515 | 228 |
| 2015 | $19.63515 | $18.48504 | 233 |
| 2016 | $18.48504 | $21.46093 | 214 |
| 2017 | $21.46093 | $23.84182 | 0 |
| 2018 | $23.84182 | $20.08448 | 0 |
| Janus Henderson Overseas Portfolio - Service Shares | |||
| 2009 | $6.76216 | $11.83677 | 0 |
| 2010 | $11.83677 | $14.46547 | 0 |
| 2011 | $14.46547 | $9.56753 | 0 |
| 2012 | $9.56753 | $10.58437 | 0 |
| 2013 | $10.58437 | $11.82390 | 0 |
| 2014 | $11.82390 | $10.15906 | 0 |
| 2015 | $10.15906 | $9.05602 | 0 |
| 2016 | $9.05602 | $8.25897 | 0 |
| 2017 | $8.25897 | $10.56194 | 0 |
| 2018 | $10.56194 | $8.76153 | 0 |
| MFS® Investors Growth Stock Portfolio - Service Class | |||
| 2015 | $10.00000 | $16.63646 | 0 |
| 2016 | $16.63646 | $17.21324 | 0 |
| 2017 | $17.21324 | $21.55802 | 0 |
| 2018 | $21.55802 | $21.19445 | 0 |
| MFS® Investors Trust Series - Service Class | |||
| 2009 | $8.66908 | $10.72455 | 918 |
| 2010 | $10.72455 | $11.62401 | 914 |
| 2011 | $11.62401 | $11.08825 | 0 |
| 2012 | $11.08825 | $12.87936 | 0 |
| 2013 | $12.87936 | $16.58549 | 0 |
| 2014 | $16.58549 | $17.94882 | 0 |
| 2015 | $17.94882 | $17.53676 | 0 |
| 2016 | $17.53676 | $18.56881 | 0 |
| 2017 | $18.56881 | $22.33479 | 0 |
| 2018 | $22.33479 | $20.58621 | 0 |
| MFS® New Discovery Series - Service Class | |||
| 2009 | $6.60416 | $10.51758 | 1,092 |
| 2010 | $10.51758 | $13.97629 | 1,087 |
| 2011 | $13.97629 | $12.22859 | 0 |
| 2012 | $12.22859 | $14.45071 | 0 |
| 2013 | $14.45071 | $19.94824 | 0 |
| 2014 | $19.94824 | $18.03789 | 0 |
| 2015 | $18.03789 | $17.25364 | 0 |
| 2016 | $17.25364 | $18.35055 | 0 |
| 2017 | $18.35055 | $22.66498 | 0 |
| 2018 | $22.66498 | $21.77462 | 0 |
| For the Year | Accumulation Unit Value | Accumulation Unit Value | Number of Accumulation Units |
| Ending December 31 | At Beginning of Period | At End of Period | Outstanding at End of Period |
| MFS® Total Return Series - Service Class | |||
| 2009 | $9.02716 | $10.38809 | 2,077 |
| 2010 | $10.38809 | $11.13267 | 2,061 |
| 2011 | $11.13267 | $11.05523 | 1,027 |
| 2012 | $11.05523 | $11.98744 | 763 |
| 2013 | $11.98744 | $13.91353 | 763 |
| 2014 | $13.91353 | $14.72068 | 763 |
| 2015 | $14.72068 | $14.30608 | 763 |
| 2016 | $14.30608 | $15.21794 | 763 |
| 2017 | $15.21794 | $16.66721 | 763 |
| 2018 | $16.66721 | $15.33574 | 0 |
| MFS® Value Series - Service Class | |||
| 2009 | $9.39347 | $11.24362 | 854 |
| 2010 | $11.24362 | $12.22358 | 850 |
| 2011 | $12.22358 | $11.89338 | 0 |
| 2012 | $11.89338 | $13.47155 | 0 |
| 2013 | $13.47155 | $17.85612 | 0 |
| 2014 | $17.85612 | $19.23515 | 0 |
| 2015 | $19.23515 | $18.62674 | 0 |
| 2016 | $18.62674 | $20.71726 | 0 |
| 2017 | $20.71726 | $23.76850 | 0 |
| 2018 | $23.76850 | $20.82748 | 0 |
| MFS® VIT II High Yield - Service Class | |||
| 2013 | $10.00000 | $14.68342 | 2,048 |
| 2014 | $14.68342 | $14.71671 | 2,064 |
| 2015 | $14.71671 | $13.74941 | 1,972 |
| 2016 | $13.74941 | $15.27500 | 1,864 |
| 2017 | $15.27500 | $15.87608 | 1,746 |
| 2018 | $15.87608 | $15.01620 | 1,320 |
| Morgan Stanley VIF Growth Portfolio, Class II | |||
| 2009 | $6.94483 | $11.21110 | 331 |
| 2010 | $11.21110 | $13.43707 | 327 |
| 2011 | $13.43707 | $12.73597 | 324 |
| 2012 | $12.73597 | $14.19818 | 327 |
| 2013 | $14.19818 | $20.50249 | 322 |
| 2014 | $20.50249 | $21.26150 | 320 |
| 2015 | $21.26150 | $23.27053 | 318 |
| 2016 | $23.27053 | $22.31110 | 315 |
| 2017 | $22.31110 | $31.15373 | 314 |
| 2018 | $31.15373 | $32.67518 | 32 |
| Morgan Stanley VIF U.S. Real Estate Portfolio, Class II | |||
| 2009 | $9.58438 | $12.03799 | 29,312 |
| 2010 | $12.03799 | $15.24212 | 4,699 |
| 2011 | $15.24212 | $15.74356 | 3,609 |
| 2012 | $15.74356 | $17.79251 | 1,615 |
| 2013 | $17.79251 | $17.69685 | 1,815 |
| 2014 | $17.69685 | $22.38948 | 1,463 |
| 2015 | $22.38948 | $22.30647 | 1,329 |
| 2016 | $22.30647 | $23.23398 | 1,344 |
| 2017 | $23.23398 | $23.36679 | 964 |
| 2018 | $23.36679 | $21.02078 | 893 |
| For the Year | Accumulation Unit Value | Accumulation Unit Value | Number of Accumulation Units |
| Ending December 31 | At Beginning of Period | At End of Period | Outstanding at End of Period |
| Oppenheimer Discovery Mid Cap Growth Fund/VA - Service Shares | |||
| 2009 | $6.01794 | $7.78031 | 0 |
| 2010 | $7.78031 | $9.67120 | 0 |
| 2011 | $9.67120 | $9.53309 | 0 |
| 2012 | $9.53309 | $10.82437 | 0 |
| 2013 | $10.82437 | $14.35043 | 0 |
| 2014 | $14.35043 | $14.80246 | 0 |
| 2015 | $14.80246 | $15.38788 | 0 |
| 2016 | $15.38788 | $15.35536 | 0 |
| 2017 | $15.35536 | $19.28416 | 0 |
| 2018 | $19.28416 | $17.66191 | 0 |
| Oppenheimer Global Fund/VA - Service Shares | |||
| 2009 | $8.73827 | $11.90317 | 18,643 |
| 2010 | $11.90317 | $13.46275 | 1,017 |
| 2011 | $13.46275 | $12.03812 | 961 |
| 2012 | $12.03812 | $14.23191 | 885 |
| 2013 | $14.23191 | $17.66681 | 819 |
| 2014 | $17.66681 | $17.62435 | 826 |
| 2015 | $17.62435 | $17.86045 | 727 |
| 2016 | $17.86045 | $17.43223 | 782 |
| 2017 | $17.43223 | $23.23308 | 582 |
| 2018 | $23.23308 | $19.66860 | 578 |
| Oppenheimer Main Street Small Cap Fund/VA - Service Shares | |||
| 2009 | $7.88423 | $10.54929 | 2,138 |
| 2010 | $10.54929 | $12.68973 | 1,809 |
| 2011 | $12.68973 | $12.10916 | 1,696 |
| 2012 | $12.10916 | $13.92757 | 850 |
| 2013 | $13.92757 | $19.14506 | 713 |
| 2014 | $19.14506 | $20.89540 | 657 |
| 2015 | $20.89540 | $19.18052 | 630 |
| 2016 | $19.18052 | $22.06379 | 580 |
| 2017 | $22.06379 | $24.57164 | 502 |
| 2018 | $24.57164 | $21.48752 | 480 |
| PIMCO International Bond (U.S. Dollar-Hedged) - Administrative Shares | |||
| formerly,PIMCO Foreign Bond Portfolio (U.S. Dollar-Hedged) - Administrative Shares | |||
| 2009 | $10.21777 | $11.54918 | 4,792 |
| 2010 | $11.54918 | $12.24895 | 4,688 |
| 2011 | $12.24895 | $12.78417 | 3,110 |
| 2012 | $12.78417 | $13.85140 | 806 |
| 2013 | $13.85140 | $13.60764 | 862 |
| 2014 | $13.60764 | $14.78591 | 850 |
| 2015 | $14.78591 | $14.49542 | 501 |
| 2016 | $14.49542 | $15.08785 | 507 |
| 2017 | $15.08785 | $15.15840 | 0 |
| 2018 | $15.15840 | $15.13180 | 0 |
| PIMCO Real Return Portfolio - Administrative Shares | |||
| 2009 | $10.14815 | $11.74465 | 923 |
| 2010 | $11.74465 | $12.41163 | 908 |
| 2011 | $12.41163 | $13.54960 | 872 |
| 2012 | $13.54960 | $14.40354 | 473 |
| 2013 | $14.40354 | $12.78156 | 510 |
| 2014 | $12.78156 | $12.88023 | 518 |
| 2015 | $12.88023 | $12.24979 | 257 |
| 2016 | $12.24979 | $12.59702 | 257 |
| 2017 | $12.59702 | $12.76560 | 257 |
| 2018 | $12.76560 | $12.20292 | 0 |
| For the Year | Accumulation Unit Value | Accumulation Unit Value | Number of Accumulation Units |
| Ending December 31 | At Beginning of Period | At End of Period | Outstanding at End of Period |
| PIMCO Total Return Portfolio - Administrative Shares | |||
| 2009 | $11.29274 | $12.59216 | 6,277 |
| 2010 | $12.59216 | $13.30801 | 5,926 |
| 2011 | $13.30801 | $13.47911 | 4,412 |
| 2012 | $13.47911 | $14.43875 | 529 |
| 2013 | $14.43875 | $13.83703 | 558 |
| 2014 | $13.83703 | $14.10437 | 564 |
| 2015 | $14.10437 | $13.84887 | 329 |
| 2016 | $13.84887 | $13.90049 | 330 |
| 2017 | $13.90049 | $14.25792 | 340 |
| 2018 | $14.25792 | $13.86310 | 80 |
| T. Rowe Price Blue Chip Growth Portfolio - II | |||
| 2009 | $7.07608 | $9.80760 | 2,378 |
| 2010 | $9.80760 | $11.12111 | 2,128 |
| 2011 | $11.12111 | $11.01942 | 2,111 |
| 2012 | $11.01942 | $12.69957 | 231 |
| 2013 | $12.69957 | $17.48525 | 198 |
| 2014 | $17.48525 | $18.60295 | 189 |
| 2015 | $18.60295 | $20.14790 | 91 |
| 2016 | $20.14790 | $19.80148 | 92 |
| 2017 | $19.80148 | $26.29526 | 85 |
| 2018 | $26.29526 | $26.12786 | 78 |
| T. Rowe Price Equity Income Portfolio - II | |||
| 2009 | $8.12356 | $9.94589 | 18,736 |
| 2010 | $9.94589 | $11.15556 | 2,148 |
| 2011 | $11.15556 | $10.79387 | 1,218 |
| 2012 | $10.79387 | $12.33590 | 802 |
| 2013 | $12.33590 | $15.60441 | 728 |
| 2014 | $15.60441 | $16.33678 | 735 |
| 2015 | $16.33678 | $14.83445 | 657 |
| 2016 | $14.83445 | $17.23588 | 627 |
| 2017 | $17.23588 | $19.50166 | 361 |
| 2018 | $19.50166 | $17.21518 | 114 |
| VanEck VIP Emerging Markets Fund - Initial Class | |||
| 2009 | $9.78104 | $20.38246 | 119 |
| 2010 | $20.38246 | $25.27221 | 114 |
| 2011 | $25.27221 | $18.34570 | 109 |
| 2012 | $18.34570 | $23.27735 | 0 |
| 2013 | $23.27735 | $25.48874 | 0 |
| 2014 | $25.48874 | $24.81171 | 0 |
| 2015 | $24.81171 | $20.85947 | 0 |
| 2016 | $20.85947 | $20.41236 | 0 |
| 2017 | $20.41236 | $30.14175 | 0 |
| 2018 | $30.14175 | $22.54341 | 0 |
| VanEck VIP Global Hard Assets Fund - Initial Class | |||
| 2009 | $16.67440 | $25.67686 | 789 |
| 2010 | $25.67686 | $32.43773 | 756 |
| 2011 | $32.43773 | $26.49245 | 641 |
| 2012 | $26.49245 | $26.77168 | 950 |
| 2013 | $26.77168 | $28.92599 | 65 |
| 2014 | $28.92599 | $22.87283 | 63 |
| 2015 | $22.87283 | $14.87936 | 61 |
| 2016 | $14.87936 | $20.90345 | 59 |
| 2017 | $20.90345 | $20.08953 | 57 |
| 2018 | $20.08953 | $14.08437 | 54 |
| For the Year | Accumulation Unit Value | Accumulation Unit Value | Number of Accumulation Units |
| Ending December 31 | At Beginning of Period | At End of Period | Outstanding at End of Period |
| Western Asset Variable Global High Yield Bond Portfolio - Class II | |||
| 2009 | $7.74696 | $11.72651 | 1,421 |
| 2010 | $11.72651 | $13.14729 | 1,283 |
| 2011 | $13.14729 | $13.01555 | 1,276 |
| 2012 | $13.01555 | $15.02164 | 207 |
| 2013 | $15.02164 | $15.57312 | 209 |
| 2014 | $15.57312 | $14.99292 | 223 |
| 2015 | $14.99292 | $13.76467 | 0 |
| 2016 | $13.76467 | $15.52235 | 0 |
| 2017 | $15.52235 | $16.45450 | 0 |
| 2018 | $16.45450 | $15.41471 | 0 |
| * The Accumulation Unit Values in this table reflect a mortality and expense risk charge of 2.15% and an administrative expense charge of 0.10%. | |||
| CONSULTANT SOLUTIONS VARIABLE ANNUITIES: LBL Consultant Solution Elite Contracts - PROSPECTUS | |||
| ACCUMULATION UNIT VALUE AND NUMBER OF ACCUMULATION UNITS OUTSTANDING FOR EACH VARIABLE | |||
| SUB-ACCOUNT* | |||
| Low | |||
| Mortality & Expense = 1.60 | |||
| For the Year | Accumulation Unit Value | Accumulation Unit Value | Number of Accumulation Units |
| Ending December 31 | At Beginning of Period | At End of Period | Outstanding at End of Period |
| Alger Capital Appreciation Portfolio - Class S | |||
| 2009 | $9.41617 | $13.94786 | 13,955 |
| 2010 | $13.94786 | $15.57926 | 5,543 |
| 2011 | $15.57926 | $15.21892 | 4,559 |
| 2012 | $15.21892 | $17.63613 | 3,457 |
| 2013 | $17.63613 | $23.36781 | 2,983 |
| 2014 | $23.36781 | $26.05928 | 1,401 |
| 2015 | $26.05928 | $27.13122 | 1,136 |
| 2016 | $27.13122 | $26.73009 | 1,111 |
| 2017 | $26.73009 | $34.35554 | 856 |
| 2018 | $34.35554 | $33.64563 | 675 |
| Alger Large Cap Growth Portfolio - Class S | |||
| 2009 | $7.07948 | $10.24733 | 4,047 |
| 2010 | $10.24733 | $11.37332 | 2,041 |
| 2011 | $11.37332 | $11.09510 | 1,764 |
| 2012 | $11.09510 | $11.92882 | 793 |
| 2013 | $11.92882 | $15.78046 | 674 |
| 2014 | $15.78046 | $17.15033 | 1,654 |
| 2015 | $17.15033 | $17.08686 | 435 |
| 2016 | $17.08686 | $16.59504 | 433 |
| 2017 | $16.59504 | $20.87529 | 431 |
| 2018 | $20.87529 | $20.87389 | 384 |
| Alger Mid Cap Growth Portfolio - Class S | |||
| 2009 | $6.49038 | $9.65383 | 11,236 |
| 2010 | $9.65383 | $11.28182 | 7,031 |
| 2011 | $11.28182 | $10.13763 | 5,317 |
| 2012 | $10.13763 | $11.52853 | 4,294 |
| 2013 | $11.52853 | $15.34470 | 4,016 |
| 2014 | $15.34470 | $16.22767 | 2,552 |
| 2015 | $16.22767 | $15.64962 | 2,334 |
| 2016 | $15.64962 | $15.45857 | 2,290 |
| 2017 | $15.45857 | $19.63221 | 2,152 |
| 2018 | $19.63221 | $17.79495 | 1,815 |
| ClearBridge Variable Large Cap Value Portfolio-Class I | |||
| 2009 | $6.15415 | $7.53170 | 11,945 |
| 2010 | $7.53170 | $8.10444 | 3,027 |
| 2011 | $8.10444 | $8.36153 | 1,134 |
| 2012 | $8.36153 | $9.57562 | 3,170 |
| 2013 | $9.57562 | $12.45983 | 356 |
| 2014 | $12.45983 | $13.68208 | 89 |
| 2015 | $13.68208 | $13.06376 | 89 |
| 2016 | $13.06376 | $14.51191 | 89 |
| 2017 | $14.51191 | $16.38317 | 89 |
| 2018 | $16.38317 | $14.67494 | 89 |
| For the Year | Accumulation Unit Value | Accumulation Unit Value | Number of Accumulation Units |
| Ending December 31 | At Beginning of Period | At End of Period | Outstanding at End of Period |
| Fidelity® VIP Asset Manager Portfolio - Service Class 2 | |||
| 2009 | $8.65670 | $10.95701 | 12,979 |
| 2010 | $10.95701 | $12.27482 | 7,846 |
| 2011 | $12.27482 | $11.72681 | 4,966 |
| 2012 | $11.72681 | $12.93738 | 1,499 |
| 2013 | $12.93738 | $14.66826 | 1,420 |
| 2014 | $14.66826 | $15.21749 | 1,295 |
| 2015 | $15.21749 | $14.94977 | 629 |
| 2016 | $14.94977 | $15.11363 | 616 |
| 2017 | $15.11363 | $16.90006 | 431 |
| 2018 | $16.90006 | $15.67948 | 422 |
| Fidelity® VIP Contrafund® Portfolio - Service Class 2 | |||
| 2009 | $9.26217 | $12.33400 | 49,531 |
| 2010 | $12.33400 | $14.17677 | 23,726 |
| 2011 | $14.17677 | $13.54824 | 21,964 |
| 2012 | $13.54824 | $15.46693 | 13,387 |
| 2013 | $15.46693 | $19.91025 | 10,269 |
| 2014 | $19.91025 | $21.85279 | 7,943 |
| 2015 | $21.85279 | $21.57052 | 3,050 |
| 2016 | $21.57052 | $22.84400 | 2,917 |
| 2017 | $22.84400 | $27.30592 | 2,296 |
| 2018 | $27.30592 | $25.05845 | 1,857 |
| Fidelity® VIP Equity-Income Portfolio - Service Class 2 | |||
| 2009 | $7.39770 | $9.44506 | 20,770 |
| 2010 | $9.44506 | $10.66962 | 8,880 |
| 2011 | $10.66962 | $10.55729 | 5,135 |
| 2012 | $10.55729 | $12.14731 | 6,612 |
| 2013 | $12.14731 | $15.26374 | 9,562 |
| 2014 | $15.26374 | $16.27656 | 6,728 |
| 2015 | $16.27656 | $15.32170 | 3,677 |
| 2016 | $15.32170 | $17.72932 | 3,060 |
| 2017 | $17.72932 | $19.63446 | 3,049 |
| 2018 | $19.63446 | $17.65223 | 2,572 |
| Fidelity® VIP Government Money Market Portfolio - Initial Class | |||
| 2016 | $10.00000 | $9.95222 | 6,596 |
| 2017 | $9.95222 | $9.84994 | 6,535 |
| 2018 | $9.84994 | $9.84212 | 5,731 |
| Fidelity® VIP Government Money Market Portfolio - Service Class 2 | |||
| 2009 | $10.75676 | $10.62408 | 92,275 |
| 2010 | $10.62408 | $10.45110 | 95,672 |
| 2011 | $10.45110 | $10.27494 | 48,128 |
| 2012 | $10.27494 | $10.10080 | 30,696 |
| 2013 | $10.10080 | $9.93008 | 17,599 |
| 2014 | $9.93008 | $9.76225 | 19,898 |
| 2015 | $9.76225 | $9.59725 | 10,055 |
| 2016 | $9.59725 | $9.43584 | 4,123 |
| 2017 | $9.43584 | $9.31568 | 4,187 |
| 2018 | $9.31568 | $9.28500 | 3,563 |
| For the Year | Accumulation Unit Value | Accumulation Unit Value | Number of Accumulation Units |
| Ending December 31 | At Beginning of Period | At End of Period | Outstanding at End of Period |
| Fidelity® VIP Growth Portfolio - Service Class 2 | |||
| 2009 | $6.85006 | $8.61668 | 3,946 |
| 2010 | $8.61668 | $10.49151 | 2,279 |
| 2011 | $10.49151 | $10.31017 | 6,878 |
| 2012 | $10.31017 | $11.59417 | 840 |
| 2013 | $11.59417 | $15.50020 | 796 |
| 2014 | $15.50020 | $16.91474 | 750 |
| 2015 | $16.91474 | $17.77520 | 747 |
| 2016 | $17.77520 | $17.56994 | 693 |
| 2017 | $17.56994 | $23.28684 | 642 |
| 2018 | $23.28684 | $22.79118 | 566 |
| Fidelity® VIP Index 500 Portfolio - Service Class 2 | |||
| 2009 | $7.92064 | $9.83377 | 31,067 |
| 2010 | $9.83377 | $11.09054 | 25,140 |
| 2011 | $11.09054 | $11.09692 | 17,231 |
| 2012 | $11.09692 | $12.61294 | 16,671 |
| 2013 | $12.61294 | $16.35489 | 13,008 |
| 2014 | $16.35489 | $18.21323 | 10,144 |
| 2015 | $18.21323 | $18.09741 | 9,444 |
| 2016 | $18.09741 | $19.85111 | 8,459 |
| 2017 | $19.85111 | $23.69323 | 2,266 |
| 2018 | $23.69323 | $22.18783 | 1,756 |
| Fidelity® VIP Investment Grade Bond Portfolio - Service Class 2 | |||
| 2009 | $10.13683 | $11.50597 | 24,417 |
| 2010 | $11.50597 | $12.16409 | 23,917 |
| 2011 | $12.16409 | $12.79914 | 15,817 |
| 2012 | $12.79914 | $13.28606 | 10,933 |
| 2013 | $13.28606 | $12.79012 | 10,989 |
| 2014 | $12.79012 | $13.27901 | 9,449 |
| 2015 | $13.27901 | $12.94235 | 9,093 |
| 2016 | $12.94235 | $13.29266 | 8,895 |
| 2017 | $13.29266 | $13.58955 | 9,003 |
| 2018 | $13.58955 | $13.25294 | 8,132 |
| Fidelity® VIP Overseas Portfolio - Service Class 2 | |||
| 2009 | $9.33565 | $11.58314 | 48,389 |
| 2010 | $11.58314 | $12.84719 | 18,960 |
| 2011 | $12.84719 | $10.43919 | 9,501 |
| 2012 | $10.43919 | $12.35244 | 8,360 |
| 2013 | $12.35244 | $15.80555 | 12,069 |
| 2014 | $15.80555 | $14.24775 | 8,840 |
| 2015 | $14.24775 | $14.46721 | 5,585 |
| 2016 | $14.46721 | $13.47267 | 5,823 |
| 2017 | $13.47267 | $17.21683 | 5,245 |
| 2018 | $17.21683 | $14.37526 | 4,287 |
| Goldman Sachs VIT Mid Cap Value Fund - Institutional | |||
| 2015 | $10.00000 | $8.71719 | 35 |
| 2016 | $8.71719 | $9.72892 | 33 |
| 2017 | $9.72892 | $10.62317 | 36 |
| 2018 | $10.62317 | $9.35002 | 37 |
| For the Year | Accumulation Unit Value | Accumulation Unit Value | Number of Accumulation Units |
| Ending December 31 | At Beginning of Period | At End of Period | Outstanding at End of Period |
| Guggenheim VIF Long Short Equity Fund | |||
| 2009 | $9.08847 | $11.37243 | 5,103 |
| 2010 | $11.37243 | $12.43226 | 3,286 |
| 2011 | $12.43226 | $11.41931 | 1,218 |
| 2012 | $11.41931 | $11.72210 | 723 |
| 2013 | $11.72210 | $13.53452 | 387 |
| 2014 | $13.53452 | $13.67627 | 414 |
| 2015 | $13.67627 | $13.61319 | 345 |
| 2016 | $13.61319 | $13.47006 | 148 |
| 2017 | $13.47006 | $15.20922 | 0 |
| 2018 | $15.20922 | $13.01619 | 0 |
| Invesco V.I. American Franchise Fund - Series II | |||
| 2012 | $10.00000 | $9.47990 | 410 |
| 2013 | $9.47990 | $13.02729 | 530 |
| 2014 | $13.02729 | $13.85190 | 557 |
| 2015 | $13.85190 | $14.26320 | 582 |
| 2016 | $14.26320 | $14.30419 | 538 |
| 2017 | $14.30419 | $17.86309 | 494 |
| 2018 | $17.86309 | $16.87566 | 422 |
| Invesco V.I. Core Equity Fund - Series II | |||
| 2009 | $7.82483 | $9.84417 | 15,508 |
| 2010 | $9.84417 | $10.57191 | 7,904 |
| 2011 | $10.57191 | $10.36205 | 6,374 |
| 2012 | $10.36205 | $11.57209 | 4,343 |
| 2013 | $11.57209 | $14.66701 | 3,742 |
| 2014 | $14.66701 | $15.54895 | 3,638 |
| 2015 | $15.54895 | $14.36710 | 3,717 |
| 2016 | $14.36710 | $15.53861 | 3,486 |
| 2017 | $15.53861 | $17.24297 | 3,472 |
| 2018 | $17.24297 | $15.32023 | 2,871 |
| Invesco V.I. Government Securities Fund - Series II | |||
| 2011 | $10.00000 | $11.87624 | 889 |
| 2012 | $11.87624 | $11.93285 | 888 |
| 2013 | $11.93285 | $11.39517 | 898 |
| 2014 | $11.39517 | $11.63623 | 802 |
| 2015 | $11.63623 | $11.44539 | 670 |
| 2016 | $11.44539 | $11.36408 | 661 |
| 2017 | $11.36408 | $11.36411 | 652 |
| 2018 | $11.36411 | $11.20346 | 596 |
| Invesco V.I. Growth and Income Fund - Series II | |||
| 2009 | $9.12198 | $11.12875 | 24,464 |
| 2010 | $11.12875 | $12.27343 | 12,069 |
| 2011 | $12.27343 | $11.79233 | 6,451 |
| 2012 | $11.79233 | $13.25452 | 5,229 |
| 2013 | $13.25452 | $17.42900 | 4,397 |
| 2014 | $17.42900 | $18.84004 | 2,923 |
| 2015 | $18.84004 | $17.90618 | 2,684 |
| 2016 | $17.90618 | $21.02277 | 2,472 |
| 2017 | $21.02277 | $23.56839 | 2,435 |
| 2018 | $23.56839 | $20.01806 | 2,140 |
| For the Year | Accumulation Unit Value | Accumulation Unit Value | Number of Accumulation Units |
| Ending December 31 | At Beginning of Period | At End of Period | Outstanding at End of Period |
| Invesco V.I. Mid Cap Core Equity Fund - Series II | |||
| 2009 | $9.48931 | $12.11287 | 7,481 |
| 2010 | $12.11287 | $13.54768 | 7,476 |
| 2011 | $13.54768 | $12.45160 | 3,890 |
| 2012 | $12.45160 | $13.53917 | 3,050 |
| 2013 | $13.53917 | $17.09741 | 7,749 |
| 2014 | $17.09741 | $17.50752 | 6,973 |
| 2015 | $17.50752 | $16.47317 | 2,741 |
| 2016 | $16.47317 | $18.32545 | 2,252 |
| 2017 | $18.32545 | $20.65549 | 2,204 |
| 2018 | $20.65549 | $17.94841 | 1,817 |
| Invesco V.I. Mid Cap Growth Fund - Series II | |||
| 2009 | $7.53780 | $11.58679 | 659 |
| 2010 | $11.58679 | $14.49648 | 750 |
| 2011 | $14.49648 | $12.91658 | 617 |
| 2012 | $12.91658 | $14.17269 | 478 |
| 2013 | $14.17269 | $19.03140 | 420 |
| 2014 | $19.03140 | $20.14681 | 373 |
| 2015 | $20.14681 | $20.01062 | 371 |
| 2016 | $20.01062 | $19.78396 | 369 |
| 2017 | $19.78396 | $23.75602 | 367 |
| 2018 | $23.75602 | $21.97953 | 321 |
| Invesco V.I. Value Opportunities Fund - Series II | |||
| 2009 | $5.80505 | $8.43051 | 2,549 |
| 2010 | $8.43051 | $8.86283 | 1,587 |
| 2011 | $8.86283 | $8.41666 | 1,390 |
| 2012 | $8.41666 | $9.73392 | 1,353 |
| 2013 | $9.73392 | $12.75209 | 1,319 |
| 2014 | $12.75209 | $13.33577 | 1,305 |
| 2015 | $13.33577 | $11.71218 | 1,107 |
| 2016 | $11.71218 | $13.57709 | 534 |
| 2017 | $13.57709 | $15.64717 | 503 |
| 2018 | $15.64717 | $12.40453 | 465 |
| Janus Henderson Balanced Portfolio - Service Shares | |||
| 2009 | $10.88210 | $13.43375 | 15,495 |
| 2010 | $13.43375 | $14.27771 | 12,291 |
| 2011 | $14.27771 | $14.22570 | 10,648 |
| 2012 | $14.22570 | $15.85358 | 6,237 |
| 2013 | $15.85358 | $18.67023 | 5,750 |
| 2014 | $18.67023 | $19.86482 | 5,459 |
| 2015 | $19.86482 | $19.60728 | 4,323 |
| 2016 | $19.60728 | $20.10824 | 4,300 |
| 2017 | $20.10824 | $23.35331 | 4,277 |
| 2018 | $23.35331 | $23.05455 | 4,256 |
| Janus Henderson Forty Portfolio - Service Shares | |||
| 2009 | $9.99416 | $14.34499 | 10,515 |
| 2010 | $14.34499 | $15.01494 | 3,195 |
| 2011 | $15.01494 | $13.73557 | 2,150 |
| 2012 | $13.73557 | $16.72287 | 1,689 |
| 2013 | $16.72287 | $21.51596 | 1,355 |
| 2014 | $21.51596 | $22.94115 | 1,181 |
| 2015 | $22.94115 | $25.24318 | 1,083 |
| 2016 | $25.24318 | $25.29724 | 1,081 |
| 2017 | $25.29724 | $32.32960 | 744 |
| 2018 | $32.32960 | $32.32506 | 398 |
| For the Year | Accumulation Unit Value | Accumulation Unit Value | Number of Accumulation Units |
| Ending December 31 | At Beginning of Period | At End of Period | Outstanding at End of Period |
| Janus Henderson Mid Cap Value Portfolio - Service Shares | |||
| 2009 | $10.28896 | $13.44360 | 24,911 |
| 2010 | $13.44360 | $15.24562 | 13,338 |
| 2011 | $15.24562 | $14.54006 | 8,153 |
| 2012 | $14.54006 | $15.83471 | 2,351 |
| 2013 | $15.83471 | $19.58297 | 1,124 |
| 2014 | $19.58297 | $20.87460 | 853 |
| 2015 | $20.87460 | $19.76249 | 816 |
| 2016 | $19.76249 | $23.07270 | 658 |
| 2017 | $23.07270 | $25.77469 | 567 |
| 2018 | $25.77469 | $21.83402 | 567 |
| Janus Henderson Overseas Portfolio - Service Shares | |||
| 2009 | $6.95113 | $12.23598 | 3,147 |
| 2010 | $12.23598 | $15.03734 | 4,829 |
| 2011 | $15.03734 | $10.00172 | 580 |
| 2012 | $10.00172 | $11.12712 | 398 |
| 2013 | $11.12712 | $12.50011 | 372 |
| 2014 | $12.50011 | $10.80056 | 371 |
| 2015 | $10.80056 | $9.68210 | 73 |
| 2016 | $9.68210 | $8.87952 | 73 |
| 2017 | $8.87952 | $11.41851 | 72 |
| 2018 | $11.41851 | $9.52501 | 72 |
| MFS® Investors Growth Stock Portfolio - Service Class | |||
| 2015 | $10.00000 | $17.78612 | 529 |
| 2016 | $17.78612 | $18.50602 | 524 |
| 2017 | $18.50602 | $23.30571 | 475 |
| 2018 | $23.30571 | $23.04060 | 281 |
| MFS® Investors Trust Series - Service Class | |||
| 2009 | $8.91129 | $11.08621 | 3,394 |
| 2010 | $11.08621 | $12.08354 | 1,009 |
| 2011 | $12.08354 | $11.59132 | 845 |
| 2012 | $11.59132 | $13.53959 | 3,469 |
| 2013 | $13.53959 | $17.53374 | 1,277 |
| 2014 | $17.53374 | $19.08175 | 1,997 |
| 2015 | $19.08175 | $18.74860 | 1,629 |
| 2016 | $18.74860 | $19.96336 | 572 |
| 2017 | $19.96336 | $24.14540 | 571 |
| 2018 | $24.14540 | $22.37935 | 569 |
| MFS® New Discovery Series - Service Class | |||
| 2009 | $6.78876 | $10.87237 | 580 |
| 2010 | $10.87237 | $14.52892 | 2,245 |
| 2011 | $14.52892 | $12.78355 | 206 |
| 2012 | $12.78355 | $15.19172 | 0 |
| 2013 | $15.19172 | $21.08902 | 82 |
| 2014 | $21.08902 | $19.17679 | 82 |
| 2015 | $19.17679 | $18.44627 | 28 |
| 2016 | $18.44627 | $19.72907 | 28 |
| 2017 | $19.72907 | $24.50285 | 28 |
| 2018 | $24.50285 | $23.67176 | 28 |
| For the Year | Accumulation Unit Value | Accumulation Unit Value | Number of Accumulation Units |
| Ending December 31 | At Beginning of Period | At End of Period | Outstanding at End of Period |
| MFS® Total Return Series - Service Class | |||
| 2009 | $9.27932 | $10.73833 | 24,445 |
| 2010 | $10.73833 | $11.57271 | 4,986 |
| 2011 | $11.57271 | $11.55672 | 4,481 |
| 2012 | $11.55672 | $12.60190 | 3,966 |
| 2013 | $12.60190 | $14.70898 | 3,453 |
| 2014 | $14.70898 | $15.64981 | 2,086 |
| 2015 | $15.64981 | $15.29463 | 1,568 |
| 2016 | $15.29463 | $16.36077 | 1,288 |
| 2017 | $16.36077 | $18.01835 | 879 |
| 2018 | $18.01835 | $16.67151 | 483 |
| MFS® Value Series - Service Class | |||
| 2009 | $9.65586 | $11.62272 | 5,318 |
| 2010 | $11.62272 | $12.70675 | 1,869 |
| 2011 | $12.70675 | $12.43291 | 874 |
| 2012 | $12.43291 | $14.16209 | 615 |
| 2013 | $14.16209 | $18.87692 | 744 |
| 2014 | $18.87692 | $20.44918 | 300 |
| 2015 | $20.44918 | $19.91379 | 192 |
| 2016 | $19.91379 | $22.27301 | 79 |
| 2017 | $22.27301 | $25.69519 | 79 |
| 2018 | $25.69519 | $22.64153 | 78 |
| MFS® VIT II High Yield - Service Class | |||
| 2013 | $10.00000 | $15.52277 | 6,542 |
| 2014 | $15.52277 | $15.64551 | 3,773 |
| 2015 | $15.64551 | $14.69943 | 999 |
| 2016 | $14.69943 | $16.42204 | 869 |
| 2017 | $16.42204 | $17.16304 | 770 |
| 2018 | $17.16304 | $16.32406 | 639 |
| Morgan Stanley VIF Growth Portfolio, Class II | |||
| 2009 | $7.13893 | $11.58925 | 2,932 |
| 2010 | $11.58925 | $13.96834 | 450 |
| 2011 | $13.96834 | $13.31383 | 293 |
| 2012 | $13.31383 | $14.92611 | 228 |
| 2013 | $14.92611 | $21.67476 | 189 |
| 2014 | $21.67476 | $22.60361 | 189 |
| 2015 | $22.60361 | $24.87862 | 183 |
| 2016 | $24.87862 | $23.98674 | 176 |
| 2017 | $23.98674 | $33.67922 | 170 |
| 2018 | $33.67922 | $35.52127 | 455 |
| Morgan Stanley VIF U.S. Real Estate Portfolio, Class II | |||
| 2009 | $9.85227 | $12.44418 | 33,843 |
| 2010 | $12.44418 | $15.84490 | 19,381 |
| 2011 | $15.84490 | $16.45802 | 8,481 |
| 2012 | $16.45802 | $18.70482 | 7,027 |
| 2013 | $18.70482 | $18.70896 | 3,220 |
| 2014 | $18.70896 | $23.80298 | 1,651 |
| 2015 | $23.80298 | $23.84815 | 1,198 |
| 2016 | $23.84815 | $24.97899 | 919 |
| 2017 | $24.97899 | $25.26123 | 730 |
| 2018 | $25.26123 | $22.85195 | 558 |
| For the Year | Accumulation Unit Value | Accumulation Unit Value | Number of Accumulation Units |
| Ending December 31 | At Beginning of Period | At End of Period | Outstanding at End of Period |
| Oppenheimer Discovery Mid Cap Growth Fund/VA - Service Shares | |||
| 2009 | $6.14340 | $7.98717 | 8,923 |
| 2010 | $7.98717 | $9.98413 | 12,682 |
| 2011 | $9.98413 | $9.89680 | 3,274 |
| 2012 | $9.89680 | $11.30073 | 332 |
| 2013 | $11.30073 | $15.06619 | 2,349 |
| 2014 | $15.06619 | $15.62822 | 3,121 |
| 2015 | $15.62822 | $16.33770 | 1,493 |
| 2016 | $16.33770 | $16.39465 | 311 |
| 2017 | $16.39465 | $20.70361 | 310 |
| 2018 | $20.70361 | $19.06786 | 310 |
| Oppenheimer Global Fund/VA - Service Shares | |||
| 2009 | $8.98241 | $12.30459 | 10,881 |
| 2010 | $12.30459 | $13.99497 | 9,555 |
| 2011 | $13.99497 | $12.58435 | 8,198 |
| 2012 | $12.58435 | $14.96156 | 5,690 |
| 2013 | $14.96156 | $18.67698 | 5,164 |
| 2014 | $18.67698 | $18.73693 | 3,744 |
| 2015 | $18.73693 | $19.09479 | 3,043 |
| 2016 | $19.09479 | $18.74157 | 2,587 |
| 2017 | $18.74157 | $25.11669 | 2,197 |
| 2018 | $25.11669 | $21.38203 | 1,724 |
| Oppenheimer Main Street Small Cap Fund/VA - Service Shares | |||
| 2009 | $8.10455 | $10.90513 | 13,961 |
| 2010 | $10.90513 | $13.19149 | 7,439 |
| 2011 | $13.19149 | $12.65866 | 3,339 |
| 2012 | $12.65866 | $14.64169 | 3,301 |
| 2013 | $14.64169 | $20.23981 | 4,131 |
| 2014 | $20.23981 | $22.21451 | 2,771 |
| 2015 | $22.21451 | $20.50614 | 2,301 |
| 2016 | $20.50614 | $23.72097 | 1,572 |
| 2017 | $23.72097 | $26.56385 | 1,172 |
| 2018 | $26.56385 | $23.35944 | 631 |
| PIMCO International Bond (U.S. Dollar-Hedged) - Administrative Shares | |||
| formerly,PIMCO Foreign Bond Portfolio (U.S. Dollar-Hedged) - Administrative Shares | |||
| 2009 | $10.50316 | $11.93851 | 12,188 |
| 2010 | $11.93851 | $12.73308 | 10,058 |
| 2011 | $12.73308 | $13.36400 | 5,594 |
| 2012 | $13.36400 | $14.56130 | 7,941 |
| 2013 | $14.56130 | $14.38555 | 7,699 |
| 2014 | $14.38555 | $15.71909 | 1,868 |
| 2015 | $15.71909 | $15.49700 | 1,413 |
| 2016 | $15.49700 | $16.22085 | 1,352 |
| 2017 | $16.22085 | $16.38720 | 1,342 |
| 2018 | $16.38720 | $16.44973 | 948 |
| PIMCO Real Return Portfolio - Administrative Shares | |||
| 2009 | $10.43158 | $12.14054 | 21,242 |
| 2010 | $12.14054 | $12.90217 | 14,123 |
| 2011 | $12.90217 | $14.16410 | 21,288 |
| 2012 | $14.16410 | $15.14167 | 18,459 |
| 2013 | $15.14167 | $13.51220 | 4,211 |
| 2014 | $13.51220 | $13.69311 | 1,539 |
| 2015 | $13.69311 | $13.09621 | 1,298 |
| 2016 | $13.09621 | $13.54299 | 1,122 |
| 2017 | $13.54299 | $13.80045 | 1,040 |
| 2018 | $13.80045 | $13.26579 | 687 |
| For the Year | Accumulation Unit Value | Accumulation Unit Value | Number of Accumulation Units |
| Ending December 31 | At Beginning of Period | At End of Period | Outstanding at End of Period |
| PIMCO Total Return Portfolio - Administrative Shares | |||
| 2009 | $11.60809 | $13.01657 | 40,000 |
| 2010 | $13.01657 | $13.83391 | 33,201 |
| 2011 | $13.83391 | $14.09038 | 22,858 |
| 2012 | $14.09038 | $15.17867 | 18,280 |
| 2013 | $15.17867 | $14.62798 | 17,046 |
| 2014 | $14.62798 | $14.99447 | 13,014 |
| 2015 | $14.99447 | $14.80569 | 10,446 |
| 2016 | $14.80569 | $14.94426 | 9,621 |
| 2017 | $14.94426 | $15.41365 | 8,175 |
| 2018 | $15.41365 | $15.07046 | 6,610 |
| T. Rowe Price Blue Chip Growth Portfolio - II | |||
| 2009 | $7.27384 | $10.13840 | 40,435 |
| 2010 | $10.13840 | $11.56082 | 17,197 |
| 2011 | $11.56082 | $11.51941 | 10,165 |
| 2012 | $11.51941 | $13.35064 | 6,390 |
| 2013 | $13.35064 | $18.48502 | 7,235 |
| 2014 | $18.48502 | $19.77725 | 7,923 |
| 2015 | $19.77725 | $21.54022 | 7,026 |
| 2016 | $21.54022 | $21.28865 | 4,896 |
| 2017 | $21.28865 | $28.42695 | 4,569 |
| 2018 | $28.42695 | $28.40368 | 4,392 |
| T. Rowe Price Equity Income Portfolio - II | |||
| 2009 | $8.35055 | $10.28134 | 73,212 |
| 2010 | $10.28134 | $11.59662 | 25,536 |
| 2011 | $11.59662 | $11.28366 | 12,800 |
| 2012 | $11.28366 | $12.96838 | 12,131 |
| 2013 | $12.96838 | $16.49669 | 8,812 |
| 2014 | $16.49669 | $17.36812 | 7,183 |
| 2015 | $17.36812 | $15.85973 | 6,400 |
| 2016 | $15.85973 | $18.53050 | 5,555 |
| 2017 | $18.53050 | $21.08284 | 4,749 |
| 2018 | $21.08284 | $18.71491 | 3,653 |
| VanEck VIP Emerging Markets Fund - Initial Class | |||
| 2009 | $10.05434 | $21.06963 | 11,191 |
| 2010 | $21.06963 | $26.27097 | 2,198 |
| 2011 | $26.27097 | $19.17800 | 1,130 |
| 2012 | $19.17800 | $24.47056 | 998 |
| 2013 | $24.47056 | $26.94603 | 1,020 |
| 2014 | $26.94603 | $26.37797 | 1,254 |
| 2015 | $26.37797 | $22.30117 | 1,098 |
| 2016 | $22.30117 | $21.94560 | 985 |
| 2017 | $21.94560 | $32.58548 | 964 |
| 2018 | $32.58548 | $24.50735 | 528 |
| VanEck VIP Global Hard Assets Fund - Initial Class | |||
| 2009 | $17.14018 | $26.54270 | 17,279 |
| 2010 | $26.54270 | $33.71998 | 8,793 |
| 2011 | $33.71998 | $27.69449 | 8,168 |
| 2012 | $27.69449 | $28.14430 | 8,014 |
| 2013 | $28.14430 | $30.58017 | 4,622 |
| 2014 | $30.58017 | $24.31721 | 3,471 |
| 2015 | $24.31721 | $15.90823 | 3,014 |
| 2016 | $15.90823 | $22.47422 | 2,352 |
| 2017 | $22.47422 | $21.71905 | 2,165 |
| 2018 | $21.71905 | $15.31191 | 1,612 |
| For the Year | Accumulation Unit Value | Accumulation Unit Value | Number of Accumulation Units |
| Ending December 31 | At Beginning of Period | At End of Period | Outstanding at End of Period |
| Western Asset Variable Global High Yield Bond Portfolio - Class II | |||
| 2009 | $7.96337 | $12.12180 | 22,070 |
| 2010 | $12.12180 | $13.66690 | 14,823 |
| 2011 | $13.66690 | $13.60589 | 12,099 |
| 2012 | $13.60589 | $15.79151 | 5,568 |
| 2013 | $15.79151 | $16.46334 | 4,878 |
| 2014 | $16.46334 | $15.93917 | 3,953 |
| 2015 | $15.93917 | $14.71579 | 3,316 |
| 2016 | $14.71579 | $16.68800 | 3,237 |
| 2017 | $16.68800 | $17.78836 | 3,189 |
| 2018 | $17.78836 | $16.75729 | 3,065 |
| * The Accumulation Unit Values in this table reflect a mortality and expense risk charge of 1.60% and an administrative expense charge of 0.10%. | |||
| CONSULTANT SOLUTIONS VARIABLE ANNUITIES: LBL Consultant Solution Elite Contracts - PROSPECTUS | |||
| ACCUMULATION UNIT VALUE AND NUMBER OF ACCUMULATION UNITS OUTSTANDING FOR EACH VARIABLE | |||
| SUB-ACCOUNT* | |||
| High | |||
| Mortality & Expense = 2.50 | |||
| For the Year | Accumulation Unit Value | Accumulation Unit Value | Number of Accumulation Units |
| Ending December 31 | At Beginning of Period | At End of Period | Outstanding at End of Period |
| Alger Capital Appreciation Portfolio - Class S | |||
| 2009 | $9.00028 | $13.20984 | 0 |
| 2010 | $13.20984 | $14.61997 | 0 |
| 2011 | $14.61997 | $14.15132 | 0 |
| 2012 | $14.15132 | $16.24853 | 0 |
| 2013 | $16.24853 | $21.33229 | 0 |
| 2014 | $21.33229 | $23.57156 | 0 |
| 2015 | $23.57156 | $24.31650 | 0 |
| 2016 | $24.31650 | $23.73826 | 0 |
| 2017 | $23.73826 | $30.23474 | 0 |
| 2018 | $30.23474 | $29.34094 | 0 |
| Alger Large Cap Growth Portfolio - Class S | |||
| 2009 | $6.76671 | $9.70500 | 0 |
| 2010 | $9.70500 | $10.67286 | 0 |
| 2011 | $10.67286 | $10.31665 | 0 |
| 2012 | $10.31665 | $10.99010 | 0 |
| 2013 | $10.99010 | $14.40563 | 0 |
| 2014 | $14.40563 | $15.51282 | 0 |
| 2015 | $15.51282 | $15.31388 | 0 |
| 2016 | $15.31388 | $14.73729 | 0 |
| 2017 | $14.73729 | $18.37096 | 0 |
| 2018 | $18.37096 | $18.20281 | 0 |
| Alger Mid Cap Growth Portfolio - Class S | |||
| 2009 | $6.20357 | $9.14279 | 0 |
| 2010 | $9.14279 | $10.58687 | 0 |
| 2011 | $10.58687 | $9.42618 | 0 |
| 2012 | $9.42618 | $10.62110 | 0 |
| 2013 | $10.62110 | $14.00755 | 0 |
| 2014 | $14.00755 | $14.67793 | 0 |
| 2015 | $14.67793 | $14.02545 | 0 |
| 2016 | $14.02545 | $13.72773 | 0 |
| 2017 | $13.72773 | $17.27665 | 0 |
| 2018 | $17.27665 | $15.51746 | 0 |
| ClearBridge Variable Large Cap Value Portfolio-Class I | |||
| 2009 | $6.05967 | $7.34819 | 0 |
| 2010 | $7.34819 | $7.83464 | 0 |
| 2011 | $7.83464 | $8.00932 | 0 |
| 2012 | $8.00932 | $9.08811 | 0 |
| 2013 | $9.08811 | $11.71730 | 0 |
| 2014 | $11.71730 | $12.74891 | 0 |
| 2015 | $12.74891 | $12.06130 | 0 |
| 2016 | $12.06130 | $13.27601 | 0 |
| 2017 | $13.27601 | $14.85253 | 0 |
| 2018 | $14.85253 | $13.18300 | 0 |
| For the Year | Accumulation Unit Value | Accumulation Unit Value | Number of Accumulation Units |
| Ending December 31 | At Beginning of Period | At End of Period | Outstanding at End of Period |
| Fidelity® VIP Asset Manager Portfolio - Service Class 2 | |||
| 2009 | $8.27438 | $10.37727 | 0 |
| 2010 | $10.37727 | $11.51901 | 0 |
| 2011 | $11.51901 | $10.90420 | 0 |
| 2012 | $10.90420 | $11.91947 | 0 |
| 2013 | $11.91947 | $13.39048 | 0 |
| 2014 | $13.39048 | $13.76467 | 0 |
| 2015 | $13.76467 | $13.39869 | 0 |
| 2016 | $13.39869 | $13.42188 | 0 |
| 2017 | $13.42188 | $14.87277 | 0 |
| 2018 | $14.87277 | $13.67325 | 0 |
| Fidelity® VIP Contrafund® Portfolio - Service Class 2 | |||
| 2009 | $8.85310 | $11.68131 | 0 |
| 2010 | $11.68131 | $13.30378 | 0 |
| 2011 | $13.30378 | $12.59778 | 0 |
| 2012 | $12.59778 | $14.24993 | 0 |
| 2013 | $14.24993 | $18.17581 | 0 |
| 2014 | $18.17581 | $19.76653 | 0 |
| 2015 | $19.76653 | $19.33255 | 0 |
| 2016 | $19.33255 | $20.28699 | 0 |
| 2017 | $20.28699 | $24.03049 | 0 |
| 2018 | $24.03049 | $21.85220 | 0 |
| Fidelity® VIP Equity-Income Portfolio - Service Class 2 | |||
| 2009 | $7.07090 | $8.94513 | 0 |
| 2010 | $8.94513 | $10.01246 | 0 |
| 2011 | $10.01246 | $9.81651 | 0 |
| 2012 | $9.81651 | $11.19134 | 0 |
| 2013 | $11.19134 | $13.93386 | 0 |
| 2014 | $13.93386 | $14.72242 | 0 |
| 2015 | $14.72242 | $13.73181 | 0 |
| 2016 | $13.73181 | $15.74457 | 0 |
| 2017 | $15.74457 | $17.27895 | 0 |
| 2018 | $17.27895 | $15.39335 | 0 |
| Fidelity® VIP Government Money Market Portfolio - Initial Class | |||
| 2016 | $10.00000 | $9.92225 | 0 |
| 2017 | $9.92225 | $9.73152 | 0 |
| 2018 | $9.73152 | $9.63550 | 0 |
| Fidelity® VIP Government Money Market Portfolio - Service Class 2 | |||
| 2009 | $10.28189 | $10.06207 | 0 |
| 2010 | $10.06207 | $9.80762 | 0 |
| 2011 | $9.80762 | $9.55427 | 0 |
| 2012 | $9.55427 | $9.30612 | 0 |
| 2013 | $9.30612 | $9.06507 | 0 |
| 2014 | $9.06507 | $8.83026 | 0 |
| 2015 | $8.83026 | $8.60153 | 0 |
| 2016 | $8.60153 | $8.37965 | 0 |
| 2017 | $8.37965 | $8.19817 | 0 |
| 2018 | $8.19817 | $8.09696 | 0 |
| For the Year | Accumulation Unit Value | Accumulation Unit Value | Number of Accumulation Units |
| Ending December 31 | At Beginning of Period | At End of Period | Outstanding at End of Period |
| Fidelity® VIP Growth Portfolio - Service Class 2 | |||
| 2009 | $6.54743 | $8.16060 | 0 |
| 2010 | $8.16060 | $9.84534 | 0 |
| 2011 | $9.84534 | $9.58678 | 0 |
| 2012 | $9.58678 | $10.68179 | 0 |
| 2013 | $10.68179 | $14.14981 | 0 |
| 2014 | $14.14981 | $15.29974 | 0 |
| 2015 | $15.29974 | $15.93084 | 0 |
| 2016 | $15.93084 | $15.60311 | 0 |
| 2017 | $15.60311 | $20.49337 | 0 |
| 2018 | $20.49337 | $19.87493 | 0 |
| Fidelity® VIP Index 500 Portfolio - Service Class 2 | |||
| 2009 | $7.57079 | $9.31336 | 0 |
| 2010 | $9.31336 | $10.40757 | 0 |
| 2011 | $10.40757 | $10.31841 | 0 |
| 2012 | $10.31841 | $11.62047 | 0 |
| 2013 | $11.62047 | $14.93014 | 0 |
| 2014 | $14.93014 | $16.47440 | 0 |
| 2015 | $16.47440 | $16.21977 | 0 |
| 2016 | $16.21977 | $17.62912 | 0 |
| 2017 | $17.62912 | $20.85117 | 0 |
| 2018 | $20.85117 | $19.34893 | 0 |
| Fidelity® VIP Investment Grade Bond Portfolio - Service Class 2 | |||
| 2009 | $9.68927 | $10.89733 | 0 |
| 2010 | $10.89733 | $11.41521 | 0 |
| 2011 | $11.41521 | $11.90152 | 0 |
| 2012 | $11.90152 | $12.24091 | 0 |
| 2013 | $12.24091 | $11.67608 | 0 |
| 2014 | $11.67608 | $12.01141 | 0 |
| 2015 | $12.01141 | $11.59969 | 0 |
| 2016 | $11.59969 | $11.80488 | 0 |
| 2017 | $11.80488 | $11.95950 | 0 |
| 2018 | $11.95950 | $11.55733 | 0 |
| Fidelity® VIP Overseas Portfolio - Service Class 2 | |||
| 2009 | $8.92332 | $10.97016 | 0 |
| 2010 | $10.97016 | $12.05607 | 0 |
| 2011 | $12.05607 | $9.70669 | 0 |
| 2012 | $9.70669 | $11.38034 | 0 |
| 2013 | $11.38034 | $14.42853 | 0 |
| 2014 | $14.42853 | $12.88729 | 0 |
| 2015 | $12.88729 | $12.96594 | 0 |
| 2016 | $12.96594 | $11.96434 | 0 |
| 2017 | $11.96434 | $15.15126 | 0 |
| 2018 | $15.15126 | $12.53561 | 0 |
| Goldman Sachs VIT Mid Cap Value Fund - Institutional | |||
| 2015 | $10.00000 | $8.66370 | 0 |
| 2016 | $8.66370 | $9.58094 | 0 |
| 2017 | $9.58094 | $10.36708 | 0 |
| 2018 | $10.36708 | $9.04169 | 0 |
| For the Year | Accumulation Unit Value | Accumulation Unit Value | Number of Accumulation Units |
| Ending December 31 | At Beginning of Period | At End of Period | Outstanding at End of Period |
| Guggenheim VIF Long Short Equity Fund | |||
| 2009 | $8.68704 | $10.77061 | 0 |
| 2010 | $10.77061 | $11.66668 | 0 |
| 2011 | $11.66668 | $10.61819 | 0 |
| 2012 | $10.61819 | $10.79970 | 0 |
| 2013 | $10.79970 | $12.35538 | 0 |
| 2014 | $12.35538 | $12.37047 | 0 |
| 2015 | $12.37047 | $12.20069 | 0 |
| 2016 | $12.20069 | $11.96220 | 0 |
| 2017 | $11.96220 | $13.38467 | 0 |
| 2018 | $13.38467 | $11.35063 | 0 |
| Invesco V.I. American Franchise Fund - Series II | |||
| 2012 | $10.00000 | $8.73389 | 0 |
| 2013 | $8.73389 | $11.89233 | 0 |
| 2014 | $11.89233 | $12.52931 | 0 |
| 2015 | $12.52931 | $12.78322 | 0 |
| 2016 | $12.78322 | $12.70292 | 0 |
| 2017 | $12.70292 | $15.72018 | 0 |
| 2018 | $15.72018 | $14.71624 | 0 |
| Invesco V.I. Core Equity Fund - Series II | |||
| 2009 | $7.63440 | $9.51667 | 0 |
| 2010 | $9.51667 | $10.12670 | 0 |
| 2011 | $10.12670 | $9.83498 | 0 |
| 2012 | $9.83498 | $10.88268 | 0 |
| 2013 | $10.88268 | $13.66701 | 0 |
| 2014 | $13.66701 | $14.35616 | 0 |
| 2015 | $14.35616 | $13.14348 | 0 |
| 2016 | $13.14348 | $14.08545 | 0 |
| 2017 | $14.08545 | $15.48922 | 0 |
| 2018 | $15.48922 | $13.63696 | 0 |
| Invesco V.I. Government Securities Fund - Series II | |||
| 2011 | $10.00000 | $11.04328 | 0 |
| 2012 | $11.04328 | $10.99409 | 0 |
| 2013 | $10.99409 | $10.40258 | 0 |
| 2014 | $10.40258 | $10.52539 | 0 |
| 2015 | $10.52539 | $10.25798 | 0 |
| 2016 | $10.25798 | $10.09211 | 0 |
| 2017 | $10.09211 | $10.00094 | 0 |
| 2018 | $10.00094 | $9.77002 | 0 |
| Invesco V.I. Growth and Income Fund - Series II | |||
| 2009 | $8.71909 | $10.53984 | 0 |
| 2010 | $10.53984 | $11.51761 | 0 |
| 2011 | $11.51761 | $10.96500 | 0 |
| 2012 | $10.96500 | $12.21152 | 0 |
| 2013 | $12.21152 | $15.91060 | 0 |
| 2014 | $15.91060 | $17.04126 | 0 |
| 2015 | $17.04126 | $16.04821 | 0 |
| 2016 | $16.04821 | $18.66944 | 0 |
| 2017 | $18.66944 | $20.74104 | 0 |
| 2018 | $20.74104 | $17.45652 | 0 |
| For the Year | Accumulation Unit Value | Accumulation Unit Value | Number of Accumulation Units |
| Ending December 31 | At Beginning of Period | At End of Period | Outstanding at End of Period |
| Invesco V.I. Mid Cap Core Equity Fund - Series II | |||
| 2009 | $9.07026 | $11.47196 | 0 |
| 2010 | $11.47196 | $12.71347 | 0 |
| 2011 | $12.71347 | $11.57808 | 0 |
| 2012 | $11.57808 | $12.47382 | 0 |
| 2013 | $12.47382 | $15.60796 | 0 |
| 2014 | $15.60796 | $15.83598 | 0 |
| 2015 | $15.83598 | $14.76392 | 0 |
| 2016 | $14.76392 | $16.27408 | 0 |
| 2017 | $16.27408 | $18.17761 | 0 |
| 2018 | $18.17761 | $15.65172 | 0 |
| Invesco V.I. Mid Cap Growth Fund - Series II | |||
| 2009 | $7.20479 | $10.97356 | 0 |
| 2010 | $10.97356 | $13.60372 | 0 |
| 2011 | $13.60372 | $12.01028 | 0 |
| 2012 | $12.01028 | $13.05730 | 0 |
| 2013 | $13.05730 | $17.37324 | 0 |
| 2014 | $17.37324 | $18.22302 | 0 |
| 2015 | $18.22302 | $17.93408 | 0 |
| 2016 | $17.93408 | $17.56901 | 0 |
| 2017 | $17.56901 | $20.90584 | 0 |
| 2018 | $20.90584 | $19.16670 | 0 |
| Invesco V.I. Value Opportunities Fund - Series II | |||
| 2009 | $5.54850 | $7.98416 | 0 |
| 2010 | $7.98416 | $8.31678 | 0 |
| 2011 | $8.31678 | $7.82590 | 0 |
| 2012 | $7.82590 | $8.96766 | 0 |
| 2013 | $8.96766 | $11.64077 | 0 |
| 2014 | $11.64077 | $12.06211 | 0 |
| 2015 | $12.06211 | $10.49654 | 0 |
| 2016 | $10.49654 | $12.05680 | 0 |
| 2017 | $12.05680 | $13.76958 | 0 |
| 2018 | $13.76958 | $10.81679 | 0 |
| Janus Henderson Balanced Portfolio - Service Shares | |||
| 2009 | $10.40162 | $12.72312 | 0 |
| 2010 | $12.72312 | $13.39872 | 0 |
| 2011 | $13.39872 | $13.22797 | 0 |
| 2012 | $13.22797 | $14.60641 | 0 |
| 2013 | $14.60641 | $17.04407 | 0 |
| 2014 | $17.04407 | $17.96861 | 0 |
| 2015 | $17.96861 | $17.57326 | 0 |
| 2016 | $17.57326 | $17.85771 | 0 |
| 2017 | $17.85771 | $20.55228 | 0 |
| 2018 | $20.55228 | $20.10505 | 0 |
| Janus Henderson Forty Portfolio - Service Shares | |||
| 2009 | $9.55274 | $13.58593 | 0 |
| 2010 | $13.58593 | $14.09032 | 0 |
| 2011 | $14.09032 | $12.77194 | 0 |
| 2012 | $12.77194 | $15.40705 | 0 |
| 2013 | $15.40705 | $19.64162 | 0 |
| 2014 | $19.64162 | $20.75094 | 0 |
| 2015 | $20.75094 | $22.62419 | 0 |
| 2016 | $22.62419 | $22.46563 | 0 |
| 2017 | $22.46563 | $28.45159 | 0 |
| 2018 | $28.45159 | $28.18914 | 0 |
| For the Year | Accumulation Unit Value | Accumulation Unit Value | Number of Accumulation Units |
| Ending December 31 | At Beginning of Period | At End of Period | Outstanding at End of Period |
| Janus Henderson Mid Cap Value Portfolio - Service Shares | |||
| 2009 | $9.83457 | $12.73224 | 0 |
| 2010 | $12.73224 | $14.30683 | 0 |
| 2011 | $14.30683 | $13.52003 | 0 |
| 2012 | $13.52003 | $14.58874 | 0 |
| 2013 | $14.58874 | $17.87698 | 0 |
| 2014 | $17.87698 | $18.88162 | 0 |
| 2015 | $18.88162 | $17.71199 | 0 |
| 2016 | $17.71199 | $20.49005 | 0 |
| 2017 | $20.49005 | $22.68283 | 0 |
| 2018 | $22.68283 | $19.04022 | 0 |
| Janus Henderson Overseas Portfolio - Service Shares | |||
| 2009 | $6.64405 | $11.58842 | 0 |
| 2010 | $11.58842 | $14.11135 | 0 |
| 2011 | $14.11135 | $9.29989 | 0 |
| 2012 | $9.29989 | $10.25133 | 0 |
| 2013 | $10.25133 | $11.41087 | 0 |
| 2014 | $11.41087 | $9.76904 | 0 |
| 2015 | $9.76904 | $8.67713 | 0 |
| 2016 | $8.67713 | $7.88517 | 0 |
| 2017 | $7.88517 | $10.04831 | 0 |
| 2018 | $10.04831 | $8.30581 | 0 |
| MFS® Investors Growth Stock Portfolio - Service Class | |||
| 2015 | $10.00000 | $15.94070 | 0 |
| 2016 | $15.94070 | $16.43448 | 0 |
| 2017 | $16.43448 | $20.51002 | 0 |
| 2018 | $20.51002 | $20.09249 | 0 |
| MFS® Investors Trust Series - Service Class | |||
| 2009 | $8.51769 | $10.49953 | 0 |
| 2010 | $10.49953 | $11.33942 | 0 |
| 2011 | $11.33942 | $10.77810 | 0 |
| 2012 | $10.77810 | $12.47421 | 0 |
| 2013 | $12.47421 | $16.00629 | 0 |
| 2014 | $16.00629 | $17.26000 | 0 |
| 2015 | $17.26000 | $16.80337 | 0 |
| 2016 | $16.80337 | $17.72875 | 0 |
| 2017 | $17.72875 | $21.24904 | 0 |
| 2018 | $21.24904 | $19.51586 | 0 |
| MFS® New Discovery Series - Service Class | |||
| 2009 | $6.48878 | $10.29683 | 0 |
| 2010 | $10.29683 | $13.63405 | 0 |
| 2011 | $13.63405 | $11.88649 | 0 |
| 2012 | $11.88649 | $13.99605 | 0 |
| 2013 | $13.99605 | $19.25150 | 0 |
| 2014 | $19.25150 | $17.34548 | 0 |
| 2015 | $17.34548 | $16.53192 | 0 |
| 2016 | $16.53192 | $17.52019 | 0 |
| 2017 | $17.52019 | $21.56298 | 0 |
| 2018 | $21.56298 | $20.64226 | 0 |
| For the Year | Accumulation Unit Value | Accumulation Unit Value | Number of Accumulation Units |
| Ending December 31 | At Beginning of Period | At End of Period | Outstanding at End of Period |
| MFS® Total Return Series - Service Class | |||
| 2009 | $8.86955 | $10.17018 | 0 |
| 2010 | $10.17018 | $10.86014 | 0 |
| 2011 | $10.86014 | $10.74608 | 0 |
| 2012 | $10.74608 | $11.61041 | 0 |
| 2013 | $11.61041 | $13.42770 | 0 |
| 2014 | $13.42770 | $14.15580 | 0 |
| 2015 | $14.15580 | $13.70784 | 0 |
| 2016 | $13.70784 | $14.52952 | 0 |
| 2017 | $14.52952 | $15.85701 | 0 |
| 2018 | $15.85701 | $14.53842 | 0 |
| MFS® Value Series - Service Class | |||
| 2009 | $9.22946 | $11.00776 | 0 |
| 2010 | $11.00776 | $11.92434 | 0 |
| 2011 | $11.92434 | $11.56076 | 0 |
| 2012 | $11.56076 | $13.04781 | 0 |
| 2013 | $13.04781 | $17.23262 | 0 |
| 2014 | $17.23262 | $18.49703 | 0 |
| 2015 | $18.49703 | $17.84783 | 0 |
| 2016 | $17.84783 | $19.78009 | 0 |
| 2017 | $19.78009 | $22.61315 | 0 |
| 2018 | $22.61315 | $19.74467 | 0 |
| MFS® VIT II High Yield - Service Class | |||
| 2013 | $10.00000 | $14.17076 | 0 |
| 2014 | $14.17076 | $14.15205 | 0 |
| 2015 | $14.15205 | $13.17450 | 0 |
| 2016 | $13.17450 | $14.58407 | 0 |
| 2017 | $14.58407 | $15.10440 | 0 |
| 2018 | $15.10440 | $14.23557 | 0 |
| Morgan Stanley VIF Growth Portfolio, Class II | |||
| 2009 | $6.82353 | $10.97588 | 0 |
| 2010 | $10.97588 | $13.10812 | 0 |
| 2011 | $13.10812 | $12.37978 | 0 |
| 2012 | $12.37978 | $13.75157 | 0 |
| 2013 | $13.75157 | $19.78656 | 0 |
| 2014 | $19.78656 | $20.44561 | 0 |
| 2015 | $20.44561 | $22.29742 | 0 |
| 2016 | $22.29742 | $21.30180 | 0 |
| 2017 | $21.30180 | $29.63944 | 0 |
| 2018 | $29.63944 | $30.97648 | 0 |
| Morgan Stanley VIF U.S. Real Estate Portfolio, Class II | |||
| 2009 | $9.41694 | $11.78528 | 0 |
| 2010 | $11.78528 | $14.86881 | 0 |
| 2011 | $14.86881 | $15.30311 | 0 |
| 2012 | $15.30311 | $17.23270 | 0 |
| 2013 | $17.23270 | $17.07869 | 0 |
| 2014 | $17.07869 | $21.53013 | 0 |
| 2015 | $21.53013 | $21.37352 | 0 |
| 2016 | $21.37352 | $22.18283 | 0 |
| 2017 | $22.18283 | $22.23081 | 0 |
| 2018 | $22.23081 | $19.92777 | 0 |
| For the Year | Accumulation Unit Value | Accumulation Unit Value | Number of Accumulation Units |
| Ending December 31 | At Beginning of Period | At End of Period | Outstanding at End of Period |
| Oppenheimer Discovery Mid Cap Growth Fund/VA - Service Shares | |||
| 2009 | $5.93908 | $7.65087 | 0 |
| 2010 | $7.65087 | $9.47630 | 0 |
| 2011 | $9.47630 | $9.30760 | 0 |
| 2012 | $9.30760 | $10.53042 | 0 |
| 2013 | $10.53042 | $13.91077 | 0 |
| 2014 | $13.91077 | $14.29755 | 0 |
| 2015 | $14.29755 | $14.80978 | 0 |
| 2016 | $14.80978 | $14.72571 | 0 |
| 2017 | $14.72571 | $18.42811 | 0 |
| 2018 | $18.42811 | $16.81789 | 0 |
| Oppenheimer Global Fund/VA - Service Shares | |||
| 2009 | $8.58571 | $11.65348 | 0 |
| 2010 | $11.65348 | $13.13320 | 0 |
| 2011 | $13.13320 | $11.70145 | 0 |
| 2012 | $11.70145 | $13.78425 | 0 |
| 2013 | $13.78425 | $17.04989 | 0 |
| 2014 | $17.04989 | $16.94801 | 0 |
| 2015 | $16.94801 | $17.11354 | 0 |
| 2016 | $17.11354 | $16.64360 | 0 |
| 2017 | $16.64360 | $22.10369 | 0 |
| 2018 | $22.10369 | $18.64596 | 0 |
| Oppenheimer Main Street Small Cap Fund/VA - Service Shares | |||
| 2009 | $7.74655 | $10.32791 | 0 |
| 2010 | $10.32791 | $12.37902 | 0 |
| 2011 | $12.37902 | $11.77044 | 0 |
| 2012 | $11.77044 | $13.48940 | 0 |
| 2013 | $13.48940 | $18.47643 | 0 |
| 2014 | $18.47643 | $20.09345 | 0 |
| 2015 | $20.09345 | $18.37832 | 0 |
| 2016 | $18.37832 | $21.06556 | 0 |
| 2017 | $21.06556 | $23.37706 | 0 |
| 2018 | $23.37706 | $20.37020 | 0 |
| PIMCO International Bond (U.S. Dollar-Hedged) - Administrative Shares | |||
| formerly,PIMCO Foreign Bond Portfolio (U.S. Dollar-Hedged) - Administrative Shares | |||
| 2009 | $10.03944 | $11.30701 | 0 |
| 2010 | $11.30701 | $11.94916 | 0 |
| 2011 | $11.94916 | $12.42676 | 0 |
| 2012 | $12.42676 | $13.41583 | 0 |
| 2013 | $13.41583 | $13.13254 | 0 |
| 2014 | $13.13254 | $14.21859 | 0 |
| 2015 | $14.21859 | $13.88934 | 0 |
| 2016 | $13.88934 | $14.40539 | 0 |
| 2017 | $14.40539 | $14.42159 | 0 |
| 2018 | $14.42159 | $14.34515 | 0 |
| PIMCO Real Return Portfolio - Administrative Shares | |||
| 2009 | $9.97101 | $11.49837 | 0 |
| 2010 | $11.49837 | $12.10787 | 0 |
| 2011 | $12.10787 | $13.17081 | 0 |
| 2012 | $13.17081 | $13.95064 | 0 |
| 2013 | $13.95064 | $12.33532 | 0 |
| 2014 | $12.33532 | $12.38603 | 0 |
| 2015 | $12.38603 | $11.73760 | 0 |
| 2016 | $11.73760 | $12.02720 | 0 |
| 2017 | $12.02720 | $12.14507 | 0 |
| 2018 | $12.14507 | $11.56852 | 0 |
| For the Year | Accumulation Unit Value | Accumulation Unit Value | Number of Accumulation Units |
| Ending December 31 | At Beginning of Period | At End of Period | Outstanding at End of Period |
| PIMCO Total Return Portfolio - Administrative Shares | |||
| 2009 | $11.09563 | $12.32807 | 0 |
| 2010 | $12.32807 | $12.98228 | 0 |
| 2011 | $12.98228 | $13.10224 | 0 |
| 2012 | $13.10224 | $13.98468 | 0 |
| 2013 | $13.98468 | $13.35389 | 0 |
| 2014 | $13.35389 | $13.56315 | 0 |
| 2015 | $13.56315 | $13.26977 | 0 |
| 2016 | $13.26977 | $13.27168 | 0 |
| 2017 | $13.27168 | $13.56483 | 0 |
| 2018 | $13.56483 | $13.14236 | 0 |
| T. Rowe Price Blue Chip Growth Portfolio - II | |||
| 2009 | $6.95250 | $9.60183 | 0 |
| 2010 | $9.60183 | $10.84883 | 0 |
| 2011 | $10.84883 | $10.71121 | 0 |
| 2012 | $10.71121 | $12.30009 | 0 |
| 2013 | $12.30009 | $16.87464 | 0 |
| 2014 | $16.87464 | $17.88900 | 0 |
| 2015 | $17.88900 | $19.30530 | 0 |
| 2016 | $19.30530 | $18.90562 | 0 |
| 2017 | $18.90562 | $25.01698 | 0 |
| 2018 | $25.01698 | $24.76940 | 0 |
| T. Rowe Price Equity Income Portfolio - II | |||
| 2009 | $7.98171 | $9.73722 | 0 |
| 2010 | $9.73722 | $10.88244 | 0 |
| 2011 | $10.88244 | $10.49198 | 0 |
| 2012 | $10.49198 | $11.94785 | 0 |
| 2013 | $11.94785 | $15.05947 | 0 |
| 2014 | $15.05947 | $15.70981 | 0 |
| 2015 | $15.70981 | $14.21404 | 0 |
| 2016 | $14.21404 | $16.45610 | 0 |
| 2017 | $16.45610 | $18.55360 | 0 |
| 2018 | $18.55360 | $16.32007 | 0 |
| VanEck VIP Emerging Markets Fund - Initial Class | |||
| 2009 | $9.61021 | $19.95489 | 0 |
| 2010 | $19.95489 | $24.65363 | 0 |
| 2011 | $24.65363 | $17.83260 | 0 |
| 2012 | $17.83260 | $22.54516 | 0 |
| 2013 | $22.54516 | $24.59861 | 0 |
| 2014 | $24.59861 | $23.85942 | 0 |
| 2015 | $23.85942 | $19.98696 | 0 |
| 2016 | $19.98696 | $19.48873 | 0 |
| 2017 | $19.48873 | $28.67634 | 0 |
| 2018 | $28.67634 | $21.37112 | 0 |
| VanEck VIP Global Hard Assets Fund - Initial Class | |||
| 2009 | $16.38331 | $25.13825 | 0 |
| 2010 | $25.13825 | $31.64373 | 0 |
| 2011 | $31.64373 | $25.75152 | 0 |
| 2012 | $25.75152 | $25.92953 | 0 |
| 2013 | $25.92953 | $27.91575 | 0 |
| 2014 | $27.91575 | $21.99478 | 0 |
| 2015 | $21.99478 | $14.25679 | 0 |
| 2016 | $14.25679 | $19.95734 | 0 |
| 2017 | $19.95734 | $19.11249 | 0 |
| 2018 | $19.11249 | $13.35171 | 0 |
| For the Year | Accumulation Unit Value | Accumulation Unit Value | Number of Accumulation Units |
| Ending December 31 | At Beginning of Period | At End of Period | Outstanding at End of Period |
| Western Asset Variable Global High Yield Bond Portfolio - Class II | |||
| 2009 | $7.61171 | $11.48060 | 0 |
| 2010 | $11.48060 | $12.82554 | 0 |
| 2011 | $12.82554 | $12.65167 | 0 |
| 2012 | $12.65167 | $14.54929 | 0 |
| 2013 | $14.54929 | $15.02944 | 0 |
| 2014 | $15.02944 | $14.41767 | 0 |
| 2015 | $14.41767 | $13.18912 | 0 |
| 2016 | $13.18912 | $14.82022 | 0 |
| 2017 | $14.82022 | $15.65469 | 0 |
| 2018 | $15.65469 | $14.61333 | 0 |
| * The Accumulation Unit Values in this table reflect a mortality and expense risk charge of 2.50% and an administrative expense charge of 0.10%. | |||
| CONSULTANT SOLUTIONS VARIABLE ANNUITIES: LBL Consultant Solution Plus Contracts - PROSPECTUS | |||
| ACCUMULATION UNIT VALUE AND NUMBER OF ACCUMULATION UNITS OUTSTANDING FOR EACH VARIABLE | |||
| SUB-ACCOUNT* | |||
| Low | |||
| Mortality & Expense = 1.45 | |||
| For the Year | Accumulation Unit Value | Accumulation Unit Value | Number of Accumulation Units |
| Ending December 31 | At Beginning of Period | At End of Period | Outstanding at End of Period |
| Alger Capital Appreciation Portfolio - Class S | |||
| 2009 | $9.48694 | $14.07412 | 104,489 |
| 2010 | $14.07412 | $15.74425 | 103,711 |
| 2011 | $15.74425 | $15.40352 | 88,456 |
| 2012 | $15.40352 | $17.87736 | 81,631 |
| 2013 | $17.87736 | $23.72353 | 54,094 |
| 2014 | $23.72353 | $26.49634 | 47,231 |
| 2015 | $26.49634 | $27.62836 | 36,444 |
| 2016 | $27.62836 | $27.26130 | 31,792 |
| 2017 | $27.26130 | $35.09102 | 28,614 |
| 2018 | $35.09102 | $34.41797 | 25,688 |
| Alger Large Cap Growth Portfolio - Class S | |||
| 2009 | $7.13272 | $10.34012 | 217,489 |
| 2010 | $10.34012 | $11.49379 | 189,088 |
| 2011 | $11.49379 | $11.22969 | 139,411 |
| 2012 | $11.22969 | $12.09199 | 96,100 |
| 2013 | $12.09199 | $16.02072 | 67,839 |
| 2014 | $16.02072 | $17.43801 | 54,369 |
| 2015 | $17.43801 | $17.40000 | 41,192 |
| 2016 | $17.40000 | $16.92487 | 39,096 |
| 2017 | $16.92487 | $21.32223 | 30,595 |
| 2018 | $21.32223 | $21.35310 | 27,386 |
| Alger Mid Cap Growth Portfolio - Class S | |||
| 2009 | $6.53919 | $9.74127 | 382,540 |
| 2010 | $9.74127 | $11.40135 | 312,036 |
| 2011 | $11.40135 | $10.26065 | 265,823 |
| 2012 | $10.26065 | $11.68628 | 212,330 |
| 2013 | $11.68628 | $15.57840 | 166,426 |
| 2014 | $15.57840 | $16.49997 | 131,872 |
| 2015 | $16.49997 | $15.93652 | 104,319 |
| 2016 | $15.93652 | $15.76592 | 90,559 |
| 2017 | $15.76592 | $20.05268 | 70,198 |
| 2018 | $20.05268 | $18.20361 | 63,419 |
| ClearBridge Variable Large Cap Value Portfolio-Class I | |||
| 2009 | $6.16995 | $7.56257 | 69,529 |
| 2010 | $7.56257 | $8.15005 | 65,270 |
| 2011 | $8.15005 | $8.42139 | 57,030 |
| 2012 | $8.42139 | $9.65892 | 42,202 |
| 2013 | $9.65892 | $12.58738 | 36,017 |
| 2014 | $12.58738 | $13.84323 | 44,069 |
| 2015 | $13.84323 | $13.23781 | 28,986 |
| 2016 | $13.23781 | $14.72763 | 25,734 |
| 2017 | $14.72763 | $16.65174 | 23,610 |
| 2018 | $16.65174 | $14.93808 | 22,264 |
| For the Year | Accumulation Unit Value | Accumulation Unit Value | Number of Accumulation Units |
| Ending December 31 | At Beginning of Period | At End of Period | Outstanding at End of Period |
| Fidelity® VIP Asset Manager Portfolio - Service Class 2 | |||
| 2009 | $8.72176 | $11.05620 | 174,938 |
| 2010 | $11.05620 | $12.40481 | 162,655 |
| 2011 | $12.40481 | $11.86903 | 131,291 |
| 2012 | $11.86903 | $13.11431 | 97,344 |
| 2013 | $13.11431 | $14.89154 | 74,318 |
| 2014 | $14.89154 | $15.47271 | 46,037 |
| 2015 | $15.47271 | $15.22370 | 40,466 |
| 2016 | $15.22370 | $15.41398 | 34,180 |
| 2017 | $15.41398 | $17.26186 | 30,361 |
| 2018 | $17.26186 | $16.03939 | 29,806 |
| Fidelity® VIP Contrafund® Portfolio - Service Class 2 | |||
| 2009 | $9.33179 | $12.44566 | 860,886 |
| 2010 | $12.44566 | $14.32692 | 791,650 |
| 2011 | $14.32692 | $13.71259 | 685,524 |
| 2012 | $13.71259 | $15.67850 | 547,018 |
| 2013 | $15.67850 | $20.21338 | 419,146 |
| 2014 | $20.21338 | $22.21934 | 326,693 |
| 2015 | $22.21934 | $21.96581 | 244,603 |
| 2016 | $21.96581 | $23.29804 | 203,201 |
| 2017 | $23.29804 | $27.89056 | 151,549 |
| 2018 | $27.89056 | $25.63373 | 134,686 |
| Fidelity® VIP Equity-Income Portfolio - Service Class 2 | |||
| 2009 | $7.45332 | $9.53060 | 838,502 |
| 2010 | $9.53060 | $10.78267 | 770,594 |
| 2011 | $10.78267 | $10.68539 | 663,554 |
| 2012 | $10.68539 | $12.31350 | 562,960 |
| 2013 | $12.31350 | $15.49616 | 416,246 |
| 2014 | $15.49616 | $16.54962 | 326,978 |
| 2015 | $16.54962 | $15.60252 | 264,517 |
| 2016 | $15.60252 | $18.08173 | 167,388 |
| 2017 | $18.08173 | $20.05489 | 139,455 |
| 2018 | $20.05489 | $18.05752 | 127,867 |
| Fidelity® VIP Government Money Market Portfolio - Initial Class | |||
| 2016 | $10.00000 | $9.95719 | 219,004 |
| 2017 | $9.95719 | $9.86970 | 189,961 |
| 2018 | $9.86970 | $9.87679 | 171,454 |
| Fidelity® VIP Government Money Market Portfolio - Service Class 2 | |||
| 2009 | $10.83761 | $10.72026 | 1,916,252 |
| 2010 | $10.72026 | $10.56180 | 1,575,490 |
| 2011 | $10.56180 | $10.39958 | 1,456,478 |
| 2012 | $10.39958 | $10.23897 | 1,250,130 |
| 2013 | $10.23897 | $10.08127 | 1,052,425 |
| 2014 | $10.08127 | $9.92601 | 785,582 |
| 2015 | $9.92601 | $9.77314 | 617,151 |
| 2016 | $9.77314 | $9.62340 | 471,540 |
| 2017 | $9.62340 | $9.51516 | 423,844 |
| 2018 | $9.51516 | $9.49818 | 356,371 |
| For the Year | Accumulation Unit Value | Accumulation Unit Value | Number of Accumulation Units |
| Ending December 31 | At Beginning of Period | At End of Period | Outstanding at End of Period |
| Fidelity® VIP Growth Portfolio - Service Class 2 | |||
| 2009 | $6.90159 | $8.69474 | 226,398 |
| 2010 | $8.69474 | $10.60268 | 196,977 |
| 2011 | $10.60268 | $10.43530 | 163,363 |
| 2012 | $10.43530 | $11.75281 | 121,700 |
| 2013 | $11.75281 | $15.73624 | 95,517 |
| 2014 | $15.73624 | $17.19851 | 82,906 |
| 2015 | $17.19851 | $18.10098 | 66,778 |
| 2016 | $18.10098 | $17.91919 | 47,768 |
| 2017 | $17.91919 | $23.78546 | 45,493 |
| 2018 | $23.78546 | $23.31445 | 42,160 |
| Fidelity® VIP Index 500 Portfolio - Service Class 2 | |||
| 2009 | $7.98018 | $9.92280 | 1,179,069 |
| 2010 | $9.92280 | $11.20802 | 1,056,165 |
| 2011 | $11.20802 | $11.23153 | 897,385 |
| 2012 | $11.23153 | $12.78545 | 718,378 |
| 2013 | $12.78545 | $16.60387 | 526,001 |
| 2014 | $16.60387 | $18.51872 | 391,701 |
| 2015 | $18.51872 | $18.42904 | 324,647 |
| 2016 | $18.42904 | $20.24562 | 251,370 |
| 2017 | $20.24562 | $24.20047 | 212,194 |
| 2018 | $24.20047 | $22.69717 | 186,216 |
| Fidelity® VIP Investment Grade Bond Portfolio - Service Class 2 | |||
| 2009 | $10.21297 | $11.61008 | 1,239,977 |
| 2010 | $11.61008 | $12.29289 | 1,143,680 |
| 2011 | $12.29289 | $12.95434 | 962,082 |
| 2012 | $12.95434 | $13.46774 | 788,124 |
| 2013 | $13.46774 | $12.98481 | 587,576 |
| 2014 | $12.98481 | $13.50172 | 410,110 |
| 2015 | $13.50172 | $13.17949 | 333,031 |
| 2016 | $13.17949 | $13.55681 | 252,079 |
| 2017 | $13.55681 | $13.88048 | 223,839 |
| 2018 | $13.88048 | $13.55715 | 192,692 |
| Fidelity® VIP Overseas Portfolio - Service Class 2 | |||
| 2009 | $9.40583 | $11.68804 | 807,903 |
| 2010 | $11.68804 | $12.98328 | 685,772 |
| 2011 | $12.98328 | $10.56586 | 691,059 |
| 2012 | $10.56586 | $12.52145 | 571,559 |
| 2013 | $12.52145 | $16.04623 | 450,554 |
| 2014 | $16.04623 | $14.48678 | 370,578 |
| 2015 | $14.48678 | $14.73238 | 283,468 |
| 2016 | $14.73238 | $13.74049 | 232,454 |
| 2017 | $13.74049 | $17.58550 | 178,644 |
| 2018 | $17.58550 | $14.70534 | 164,421 |
| Goldman Sachs VIT Mid Cap Value Fund - Institutional | |||
| 2015 | $10.00000 | $8.72610 | 103,904 |
| 2016 | $8.72610 | $9.75368 | 82,108 |
| 2017 | $9.75368 | $10.66623 | 65,004 |
| 2018 | $10.66623 | $9.40214 | 54,881 |
| For the Year | Accumulation Unit Value | Accumulation Unit Value | Number of Accumulation Units |
| Ending December 31 | At Beginning of Period | At End of Period | Outstanding at End of Period |
| Guggenheim VIF Long Short Equity Fund | |||
| 2009 | $9.15677 | $11.47537 | 103,531 |
| 2010 | $11.47537 | $12.56392 | 89,854 |
| 2011 | $12.56392 | $11.55782 | 85,709 |
| 2012 | $11.55782 | $11.88244 | 72,991 |
| 2013 | $11.88244 | $13.74057 | 58,754 |
| 2014 | $13.74057 | $13.90567 | 30,656 |
| 2015 | $13.90567 | $13.86264 | 24,479 |
| 2016 | $13.86264 | $13.73778 | 22,813 |
| 2017 | $13.73778 | $15.53486 | 18,724 |
| 2018 | $15.53486 | $13.31500 | 17,565 |
| Invesco V.I. American Franchise Fund - Series II | |||
| 2012 | $10.00000 | $9.60958 | 70,498 |
| 2013 | $9.60958 | $13.22564 | 48,636 |
| 2014 | $13.22564 | $14.08426 | 36,426 |
| 2015 | $14.08426 | $14.52461 | 19,992 |
| 2016 | $14.52461 | $14.58851 | 17,356 |
| 2017 | $14.58851 | $18.24557 | 15,668 |
| 2018 | $18.24557 | $17.26310 | 14,219 |
| Invesco V.I. Core Equity Fund - Series II | |||
| 2009 | $7.85685 | $9.89953 | 241,788 |
| 2010 | $9.89953 | $10.64759 | 206,986 |
| 2011 | $10.64759 | $10.45211 | 176,338 |
| 2012 | $10.45211 | $11.69053 | 158,457 |
| 2013 | $11.69053 | $14.83971 | 130,436 |
| 2014 | $14.83971 | $15.75604 | 88,838 |
| 2015 | $15.75604 | $14.58067 | 76,543 |
| 2016 | $14.58067 | $15.79358 | 52,222 |
| 2017 | $15.79358 | $17.55230 | 43,469 |
| 2018 | $17.55230 | $15.61869 | 40,846 |
| Invesco V.I. Government Securities Fund - Series II | |||
| 2011 | $10.00000 | $12.02025 | 316,576 |
| 2012 | $12.02025 | $12.09603 | 290,657 |
| 2013 | $12.09603 | $11.56864 | 202,678 |
| 2014 | $11.56864 | $11.83138 | 183,808 |
| 2015 | $11.83138 | $11.65510 | 157,885 |
| 2016 | $11.65510 | $11.58992 | 107,434 |
| 2017 | $11.58992 | $11.60742 | 89,317 |
| 2018 | $11.60742 | $11.46064 | 64,462 |
| Invesco V.I. Growth and Income Fund - Series II | |||
| 2009 | $9.19054 | $11.22951 | 788,311 |
| 2010 | $11.22951 | $12.40344 | 688,083 |
| 2011 | $12.40344 | $11.93539 | 595,214 |
| 2012 | $11.93539 | $13.43584 | 476,292 |
| 2013 | $13.43584 | $17.69436 | 331,949 |
| 2014 | $17.69436 | $19.15606 | 246,664 |
| 2015 | $19.15606 | $18.23432 | 194,119 |
| 2016 | $18.23432 | $21.44059 | 134,084 |
| 2017 | $21.44059 | $24.07299 | 107,305 |
| 2018 | $24.07299 | $20.47762 | 95,861 |
| For the Year | Accumulation Unit Value | Accumulation Unit Value | Number of Accumulation Units |
| Ending December 31 | At Beginning of Period | At End of Period | Outstanding at End of Period |
| Invesco V.I. Mid Cap Core Equity Fund - Series II | |||
| 2009 | $9.56064 | $12.22255 | 365,382 |
| 2010 | $12.22255 | $13.69118 | 354,072 |
| 2011 | $13.69118 | $12.60266 | 317,651 |
| 2012 | $12.60266 | $13.72438 | 237,613 |
| 2013 | $13.72438 | $17.35773 | 169,959 |
| 2014 | $17.35773 | $17.80121 | 134,490 |
| 2015 | $17.80121 | $16.77508 | 98,531 |
| 2016 | $16.77508 | $18.68970 | 68,741 |
| 2017 | $18.68970 | $21.09777 | 59,274 |
| 2018 | $21.09777 | $18.36051 | 51,628 |
| Invesco V.I. Mid Cap Growth Fund - Series II | |||
| 2009 | $7.59449 | $11.69172 | 81,540 |
| 2010 | $11.69172 | $14.65006 | 83,826 |
| 2011 | $14.65006 | $13.07330 | 74,716 |
| 2012 | $13.07330 | $14.36659 | 43,857 |
| 2013 | $14.36659 | $19.32119 | 29,770 |
| 2014 | $19.32119 | $20.48481 | 25,435 |
| 2015 | $20.48481 | $20.37739 | 14,736 |
| 2016 | $20.37739 | $20.17722 | 11,195 |
| 2017 | $20.17722 | $24.26469 | 9,374 |
| 2018 | $24.26469 | $22.48419 | 7,731 |
| Invesco V.I. Value Opportunities Fund - Series II | |||
| 2009 | $5.84871 | $8.50690 | 343,201 |
| 2010 | $8.50690 | $8.95676 | 319,363 |
| 2011 | $8.95676 | $8.51881 | 281,990 |
| 2012 | $8.51881 | $9.86713 | 201,378 |
| 2013 | $9.86713 | $12.94630 | 126,948 |
| 2014 | $12.94630 | $13.55954 | 84,104 |
| 2015 | $13.55954 | $11.92690 | 57,888 |
| 2016 | $11.92690 | $13.84703 | 49,274 |
| 2017 | $13.84703 | $15.98228 | 43,420 |
| 2018 | $15.98228 | $12.68939 | 40,796 |
| Janus Henderson Balanced Portfolio - Service Shares | |||
| 2009 | $10.96387 | $13.55534 | 378,329 |
| 2010 | $13.55534 | $14.42892 | 330,052 |
| 2011 | $14.42892 | $14.39824 | 275,246 |
| 2012 | $14.39824 | $16.07041 | 226,957 |
| 2013 | $16.07041 | $18.95445 | 172,344 |
| 2014 | $18.95445 | $20.19801 | 136,802 |
| 2015 | $20.19801 | $19.96657 | 113,049 |
| 2016 | $19.96657 | $20.50786 | 82,061 |
| 2017 | $20.50786 | $23.85328 | 68,919 |
| 2018 | $23.85328 | $23.58376 | 52,256 |
| Janus Henderson Forty Portfolio - Service Shares | |||
| 2009 | $10.06928 | $14.47487 | 199,558 |
| 2010 | $14.47487 | $15.17398 | 172,341 |
| 2011 | $15.17398 | $13.90220 | 146,080 |
| 2012 | $13.90220 | $16.95160 | 118,380 |
| 2013 | $16.95160 | $21.84351 | 70,817 |
| 2014 | $21.84351 | $23.32594 | 50,625 |
| 2015 | $23.32594 | $25.70574 | 36,778 |
| 2016 | $25.70574 | $25.80000 | 33,393 |
| 2017 | $25.80000 | $33.02174 | 30,767 |
| 2018 | $33.02174 | $33.06710 | 27,798 |
| For the Year | Accumulation Unit Value | Accumulation Unit Value | Number of Accumulation Units |
| Ending December 31 | At Beginning of Period | At End of Period | Outstanding at End of Period |
| Janus Henderson Mid Cap Value Portfolio - Service Shares | |||
| 2009 | $10.36631 | $13.56534 | 498,879 |
| 2010 | $13.56534 | $15.40713 | 458,370 |
| 2011 | $15.40713 | $14.71647 | 389,734 |
| 2012 | $14.71647 | $16.05134 | 290,229 |
| 2013 | $16.05134 | $19.88115 | 234,824 |
| 2014 | $19.88115 | $21.22479 | 182,034 |
| 2015 | $21.22479 | $20.12469 | 117,497 |
| 2016 | $20.12469 | $23.53130 | 90,440 |
| 2017 | $23.53130 | $26.32656 | 77,203 |
| 2018 | $26.32656 | $22.33531 | 64,931 |
| Janus Henderson Overseas Portfolio - Service Shares | |||
| 2009 | $7.00340 | $12.34679 | 149,089 |
| 2010 | $12.34679 | $15.19664 | 152,251 |
| 2011 | $15.19664 | $10.12310 | 158,712 |
| 2012 | $10.12310 | $11.27939 | 100,717 |
| 2013 | $11.27939 | $12.69050 | 73,848 |
| 2014 | $12.69050 | $10.98181 | 55,277 |
| 2015 | $10.98181 | $9.85963 | 38,605 |
| 2016 | $9.85963 | $9.05610 | 26,653 |
| 2017 | $9.05610 | $11.66311 | 22,149 |
| 2018 | $11.66311 | $9.74379 | 22,082 |
| MFS® Investors Growth Stock Portfolio - Service Class | |||
| 2015 | $10.00000 | $18.11211 | 109,954 |
| 2016 | $18.11211 | $18.87389 | 85,853 |
| 2017 | $18.87389 | $23.80475 | 60,581 |
| 2018 | $23.80475 | $23.56961 | 46,718 |
| MFS® Investors Trust Series - Service Class | |||
| 2009 | $8.97828 | $11.18660 | 85,026 |
| 2010 | $11.18660 | $12.21155 | 69,448 |
| 2011 | $12.21155 | $11.73196 | 62,992 |
| 2012 | $11.73196 | $13.72482 | 52,324 |
| 2013 | $13.72482 | $17.80069 | 35,957 |
| 2014 | $17.80069 | $19.40184 | 26,032 |
| 2015 | $19.40184 | $19.09220 | 22,464 |
| 2016 | $19.09220 | $20.36014 | 10,143 |
| 2017 | $20.36014 | $24.66236 | 9,655 |
| 2018 | $24.66236 | $22.89313 | 7,098 |
| MFS® New Discovery Series - Service Class | |||
| 2009 | $6.83983 | $10.97087 | 134,171 |
| 2010 | $10.97087 | $14.68288 | 134,012 |
| 2011 | $14.68288 | $12.93870 | 122,440 |
| 2012 | $12.93870 | $15.39961 | 83,911 |
| 2013 | $15.39961 | $21.41021 | 77,443 |
| 2014 | $21.41021 | $19.49859 | 51,836 |
| 2015 | $19.49859 | $18.78444 | 37,627 |
| 2016 | $18.78444 | $20.12132 | 27,979 |
| 2017 | $20.12132 | $25.02762 | 25,349 |
| 2018 | $25.02762 | $24.21536 | 18,742 |
| For the Year | Accumulation Unit Value | Accumulation Unit Value | Number of Accumulation Units |
| Ending December 31 | At Beginning of Period | At End of Period | Outstanding at End of Period |
| MFS® Total Return Series - Service Class | |||
| 2009 | $9.34906 | $10.83554 | 575,285 |
| 2010 | $10.83554 | $11.69528 | 513,670 |
| 2011 | $11.69528 | $11.69690 | 443,345 |
| 2012 | $11.69690 | $12.77425 | 341,459 |
| 2013 | $12.77425 | $14.93289 | 288,713 |
| 2014 | $14.93289 | $15.91230 | 185,627 |
| 2015 | $15.91230 | $15.57488 | 132,833 |
| 2016 | $15.57488 | $16.68590 | 102,723 |
| 2017 | $16.68590 | $18.40408 | 93,787 |
| 2018 | $18.40408 | $17.05419 | 77,941 |
| MFS® Value Series - Service Class | |||
| 2009 | $9.72843 | $11.72794 | 183,765 |
| 2010 | $11.72794 | $12.84135 | 196,581 |
| 2011 | $12.84135 | $12.58374 | 179,027 |
| 2012 | $12.58374 | $14.35580 | 109,358 |
| 2013 | $14.35580 | $19.16430 | 83,721 |
| 2014 | $19.16430 | $20.79217 | 58,443 |
| 2015 | $20.79217 | $20.27870 | 42,888 |
| 2016 | $20.27870 | $22.71566 | 30,218 |
| 2017 | $22.71566 | $26.24530 | 21,224 |
| 2018 | $26.24530 | $23.16130 | 15,729 |
| MFS® VIT II High Yield - Service Class | |||
| 2013 | $10.00000 | $15.75910 | 158,197 |
| 2014 | $15.75910 | $15.90794 | 118,084 |
| 2015 | $15.90794 | $14.96882 | 82,244 |
| 2016 | $14.96882 | $16.74843 | 64,450 |
| 2017 | $16.74843 | $17.53052 | 58,216 |
| 2018 | $17.53052 | $16.69883 | 41,603 |
| Morgan Stanley VIF Growth Portfolio, Class II | |||
| 2009 | $7.19261 | $11.69418 | 91,860 |
| 2010 | $11.69418 | $14.11630 | 75,917 |
| 2011 | $14.11630 | $13.47535 | 61,271 |
| 2012 | $13.47535 | $15.13029 | 43,733 |
| 2013 | $15.13029 | $22.00475 | 33,018 |
| 2014 | $22.00475 | $22.98276 | 21,144 |
| 2015 | $22.98276 | $25.33454 | 14,770 |
| 2016 | $25.33454 | $24.46347 | 12,233 |
| 2017 | $24.46347 | $34.40025 | 11,941 |
| 2018 | $34.40025 | $36.33668 | 11,070 |
| Morgan Stanley VIF U.S. Real Estate Portfolio, Class II | |||
| 2009 | $9.92636 | $12.55692 | 582,988 |
| 2010 | $12.55692 | $16.01280 | 449,938 |
| 2011 | $16.01280 | $16.65773 | 391,905 |
| 2012 | $16.65773 | $18.96073 | 306,501 |
| 2013 | $18.96073 | $18.99387 | 248,646 |
| 2014 | $18.99387 | $24.20230 | 174,211 |
| 2015 | $24.20230 | $24.28522 | 145,647 |
| 2016 | $24.28522 | $25.47545 | 121,797 |
| 2017 | $25.47545 | $25.80209 | 111,494 |
| 2018 | $25.80209 | $23.37658 | 104,370 |
| For the Year | Accumulation Unit Value | Accumulation Unit Value | Number of Accumulation Units |
| Ending December 31 | At Beginning of Period | At End of Period | Outstanding at End of Period |
| Oppenheimer Discovery Mid Cap Growth Fund/VA - Service Shares | |||
| 2009 | $6.17793 | $8.04435 | 77,979 |
| 2010 | $8.04435 | $10.07092 | 77,409 |
| 2011 | $10.07092 | $9.99803 | 78,447 |
| 2012 | $9.99803 | $11.43377 | 69,630 |
| 2013 | $11.43377 | $15.26681 | 60,472 |
| 2014 | $15.26681 | $15.86050 | 46,296 |
| 2015 | $15.86050 | $16.60582 | 30,187 |
| 2016 | $16.60582 | $16.68907 | 24,494 |
| 2017 | $16.68907 | $21.10713 | 17,964 |
| 2018 | $21.10713 | $19.46894 | 15,115 |
| Oppenheimer Global Fund/VA - Service Shares | |||
| 2009 | $9.04992 | $12.41599 | 321,152 |
| 2010 | $12.41599 | $14.14319 | 280,674 |
| 2011 | $14.14319 | $12.73701 | 253,922 |
| 2012 | $12.73701 | $15.16621 | 203,828 |
| 2013 | $15.16621 | $18.96132 | 154,977 |
| 2014 | $18.96132 | $19.05122 | 112,800 |
| 2015 | $19.05122 | $19.44471 | 80,895 |
| 2016 | $19.44471 | $19.11407 | 69,541 |
| 2017 | $19.11407 | $25.65442 | 58,450 |
| 2018 | $25.65442 | $21.87291 | 51,507 |
| Oppenheimer Main Street Small Cap Fund/VA - Service Shares | |||
| 2009 | $8.16549 | $11.00389 | 576,312 |
| 2010 | $11.00389 | $13.33126 | 470,789 |
| 2011 | $13.33126 | $12.81228 | 400,433 |
| 2012 | $12.81228 | $14.84203 | 329,397 |
| 2013 | $14.84203 | $20.54801 | 262,728 |
| 2014 | $20.54801 | $22.58719 | 196,508 |
| 2015 | $22.58719 | $20.88199 | 147,834 |
| 2016 | $20.88199 | $24.19248 | 112,995 |
| 2017 | $24.19248 | $27.13264 | 94,627 |
| 2018 | $27.13264 | $23.89577 | 78,695 |
| PIMCO International Bond (U.S. Dollar-Hedged) - Administrative Shares | |||
| formerly,PIMCO Foreign Bond Portfolio (U.S. Dollar-Hedged) - Administrative Shares | |||
| 2009 | $10.58205 | $12.04653 | 415,232 |
| 2010 | $12.04653 | $12.86789 | 419,495 |
| 2011 | $12.86789 | $13.52604 | 346,787 |
| 2012 | $13.52604 | $14.76040 | 306,129 |
| 2013 | $14.76040 | $14.60450 | 250,415 |
| 2014 | $14.60450 | $15.98268 | 189,665 |
| 2015 | $15.98268 | $15.78090 | 140,091 |
| 2016 | $15.78090 | $16.54314 | 119,587 |
| 2017 | $16.54314 | $16.73796 | 105,521 |
| 2018 | $16.73796 | $16.82726 | 80,334 |
| PIMCO Real Return Portfolio - Administrative Shares | |||
| 2009 | $10.50996 | $12.25039 | 983,651 |
| 2010 | $12.25039 | $13.03878 | 897,156 |
| 2011 | $13.03878 | $14.33584 | 786,960 |
| 2012 | $14.33584 | $15.34870 | 687,658 |
| 2013 | $15.34870 | $13.71787 | 465,157 |
| 2014 | $13.71787 | $13.92275 | 343,298 |
| 2015 | $13.92275 | $13.33617 | 251,384 |
| 2016 | $13.33617 | $13.81212 | 207,158 |
| 2017 | $13.81212 | $14.09589 | 171,524 |
| 2018 | $14.09589 | $13.57031 | 146,153 |
| For the Year | Accumulation Unit Value | Accumulation Unit Value | Number of Accumulation Units |
| Ending December 31 | At Beginning of Period | At End of Period | Outstanding at End of Period |
| PIMCO Total Return Portfolio - Administrative Shares | |||
| 2009 | $11.69531 | $13.13437 | 1,507,227 |
| 2010 | $13.13437 | $13.98040 | 1,377,334 |
| 2011 | $13.98040 | $14.26125 | 1,279,562 |
| 2012 | $14.26125 | $15.38624 | 1,062,330 |
| 2013 | $15.38624 | $14.85064 | 772,482 |
| 2014 | $14.85064 | $15.24594 | 494,725 |
| 2015 | $15.24594 | $15.07697 | 371,146 |
| 2016 | $15.07697 | $15.24124 | 284,934 |
| 2017 | $15.24124 | $15.74364 | 246,165 |
| 2018 | $15.74364 | $15.41641 | 201,194 |
| T. Rowe Price Blue Chip Growth Portfolio - II | |||
| 2009 | $7.32853 | $10.23022 | 850,454 |
| 2010 | $10.23022 | $11.68330 | 736,797 |
| 2011 | $11.68330 | $11.65919 | 644,527 |
| 2012 | $11.65919 | $13.53330 | 548,267 |
| 2013 | $13.53330 | $18.76650 | 405,540 |
| 2014 | $18.76650 | $20.10906 | 305,885 |
| 2015 | $20.10906 | $21.93503 | 210,587 |
| 2016 | $21.93503 | $21.71183 | 174,278 |
| 2017 | $21.71183 | $29.03566 | 122,087 |
| 2018 | $29.03566 | $29.05583 | 100,174 |
| T. Rowe Price Equity Income Portfolio - II | |||
| 2009 | $8.41333 | $10.37445 | 1,377,891 |
| 2010 | $10.37445 | $11.71948 | 1,195,528 |
| 2011 | $11.71948 | $11.42056 | 1,031,213 |
| 2012 | $11.42056 | $13.14580 | 823,514 |
| 2013 | $13.14580 | $16.74789 | 595,171 |
| 2014 | $16.74789 | $17.65949 | 458,609 |
| 2015 | $17.65949 | $16.15040 | 368,424 |
| 2016 | $16.15040 | $18.89883 | 293,481 |
| 2017 | $18.89883 | $21.53427 | 242,738 |
| 2018 | $21.53427 | $19.14458 | 212,714 |
| VanEck VIP Emerging Markets Fund - Initial Class | |||
| 2009 | $10.12994 | $21.26038 | 178,220 |
| 2010 | $21.26038 | $26.54919 | 152,306 |
| 2011 | $26.54919 | $19.41067 | 116,500 |
| 2012 | $19.41067 | $24.80530 | 83,350 |
| 2013 | $24.80530 | $27.35631 | 66,803 |
| 2014 | $27.35631 | $26.82048 | 43,893 |
| 2015 | $26.82048 | $22.70993 | 30,817 |
| 2016 | $22.70993 | $22.38184 | 27,072 |
| 2017 | $22.38184 | $33.28318 | 22,304 |
| 2018 | $33.28318 | $25.07005 | 18,862 |
| VanEck VIP Global Hard Assets Fund - Initial Class | |||
| 2009 | $17.26898 | $26.78298 | 172,839 |
| 2010 | $26.78298 | $34.07709 | 146,787 |
| 2011 | $34.07709 | $28.03047 | 117,868 |
| 2012 | $28.03047 | $28.52934 | 92,607 |
| 2013 | $28.52934 | $31.04583 | 66,782 |
| 2014 | $31.04583 | $24.72525 | 46,420 |
| 2015 | $24.72525 | $16.19994 | 33,795 |
| 2016 | $16.19994 | $22.92113 | 29,967 |
| 2017 | $22.92113 | $22.18431 | 25,455 |
| 2018 | $22.18431 | $15.66363 | 22,305 |
| For the Year | Accumulation Unit Value | Accumulation Unit Value | Number of Accumulation Units |
| Ending December 31 | At Beginning of Period | At End of Period | Outstanding at End of Period |
| Western Asset Variable Global High Yield Bond Portfolio - Class II | |||
| 2009 | $8.02324 | $12.23154 | 724,610 |
| 2010 | $12.23154 | $13.81166 | 624,088 |
| 2011 | $13.81166 | $13.77092 | 547,554 |
| 2012 | $13.77092 | $16.00749 | 441,801 |
| 2013 | $16.00749 | $16.71397 | 360,164 |
| 2014 | $16.71397 | $16.20651 | 273,843 |
| 2015 | $16.20651 | $14.98545 | 212,545 |
| 2016 | $14.98545 | $17.01964 | 162,268 |
| 2017 | $17.01964 | $18.16918 | 134,265 |
| 2018 | $18.16918 | $17.14197 | 115,984 |
| * The Accumulation Unit Values in this table reflect a mortality and expense risk charge of 1.45% and an administrative expense charge of 0.10%. | |||
| CONSULTANT SOLUTIONS VARIABLE ANNUITIES: LBL Consultant Solution Plus Contracts - PROSPECTUS | |||
| ACCUMULATION UNIT VALUE AND NUMBER OF ACCUMULATION UNITS OUTSTANDING FOR EACH VARIABLE | |||
| SUB-ACCOUNT* | |||
| High | |||
| Mortality & Expense = 2.35 | |||
| For the Year | Accumulation Unit Value | Accumulation Unit Value | Number of Accumulation Units |
| Ending December 31 | At Beginning of Period | At End of Period | Outstanding at End of Period |
| Alger Capital Appreciation Portfolio - Class S | |||
| 2009 | $9.06857 | $13.33056 | 0 |
| 2010 | $13.33056 | $14.77629 | 0 |
| 2011 | $14.77629 | $14.32460 | 0 |
| 2012 | $14.32460 | $16.47288 | 0 |
| 2013 | $16.47288 | $21.66009 | 0 |
| 2014 | $21.66009 | $23.97062 | 0 |
| 2015 | $23.97062 | $24.76625 | 0 |
| 2016 | $24.76625 | $24.21444 | 0 |
| 2017 | $24.21444 | $30.88808 | 0 |
| 2018 | $30.88808 | $30.02079 | 0 |
| Alger Large Cap Growth Portfolio - Class S | |||
| 2009 | $6.81806 | $9.79368 | 0 |
| 2010 | $9.79368 | $10.78697 | 0 |
| 2011 | $10.78697 | $10.44297 | 0 |
| 2012 | $10.44297 | $11.14184 | 0 |
| 2013 | $11.14184 | $14.62700 | 0 |
| 2014 | $14.62700 | $15.77547 | 0 |
| 2015 | $15.77547 | $15.59715 | 0 |
| 2016 | $15.59715 | $15.03294 | 0 |
| 2017 | $15.03294 | $18.76798 | 0 |
| 2018 | $18.76798 | $18.62461 | 0 |
| Alger Mid Cap Growth Portfolio - Class S | |||
| 2009 | $6.25065 | $9.22636 | 0 |
| 2010 | $9.22636 | $10.70009 | 0 |
| 2011 | $10.70009 | $9.54164 | 0 |
| 2012 | $9.54164 | $10.76779 | 0 |
| 2013 | $10.76779 | $14.22288 | 0 |
| 2014 | $14.22288 | $14.92652 | 0 |
| 2015 | $14.92652 | $14.28496 | 0 |
| 2016 | $14.28496 | $14.00320 | 0 |
| 2017 | $14.00320 | $17.65011 | 0 |
| 2018 | $17.65011 | $15.87713 | 0 |
| ClearBridge Variable Large Cap Value Portfolio-Class I | |||
| 2009 | $6.07538 | $7.37858 | 0 |
| 2010 | $7.37858 | $7.87915 | 0 |
| 2011 | $7.87915 | $8.06720 | 0 |
| 2012 | $8.06720 | $9.16790 | 0 |
| 2013 | $9.16790 | $11.83837 | 0 |
| 2014 | $11.83837 | $12.90047 | 0 |
| 2015 | $12.90047 | $12.22348 | 0 |
| 2016 | $12.22348 | $13.47520 | 0 |
| 2017 | $13.47520 | $15.09826 | 0 |
| 2018 | $15.09826 | $13.42159 | 0 |
| For the Year | Accumulation Unit Value | Accumulation Unit Value | Number of Accumulation Units |
| Ending December 31 | At Beginning of Period | At End of Period | Outstanding at End of Period |
| Fidelity® VIP Asset Manager Portfolio - Service Class 2 | |||
| 2009 | $8.33715 | $10.47209 | 1,128 |
| 2010 | $10.47209 | $11.64215 | 1,127 |
| 2011 | $11.64215 | $11.03771 | 1,127 |
| 2012 | $11.03771 | $12.08403 | 1,078 |
| 2013 | $12.08403 | $13.59625 | 1,029 |
| 2014 | $13.59625 | $13.99772 | 0 |
| 2015 | $13.99772 | $13.64652 | 0 |
| 2016 | $13.64652 | $13.69113 | 0 |
| 2017 | $13.69113 | $15.19418 | 0 |
| 2018 | $15.19418 | $13.99007 | 0 |
| Fidelity® VIP Contrafund® Portfolio - Service Class 2 | |||
| 2009 | $8.92026 | $11.78807 | 0 |
| 2010 | $11.78807 | $13.44601 | 0 |
| 2011 | $13.44601 | $12.75203 | 0 |
| 2012 | $12.75203 | $14.44667 | 0 |
| 2013 | $14.44667 | $18.45511 | 0 |
| 2014 | $18.45511 | $20.10116 | 706 |
| 2015 | $20.10116 | $19.69012 | 670 |
| 2016 | $19.69012 | $20.69394 | 629 |
| 2017 | $20.69394 | $24.54976 | 595 |
| 2018 | $24.54976 | $22.35853 | 561 |
| Fidelity® VIP Equity-Income Portfolio - Service Class 2 | |||
| 2009 | $7.12456 | $9.02691 | 1,121 |
| 2010 | $9.02691 | $10.11954 | 1,120 |
| 2011 | $10.11954 | $9.93674 | 1,120 |
| 2012 | $9.93674 | $11.34588 | 1,071 |
| 2013 | $11.34588 | $14.14800 | 1,022 |
| 2014 | $14.14800 | $14.97169 | 936 |
| 2015 | $14.97169 | $13.98582 | 888 |
| 2016 | $13.98582 | $16.06045 | 834 |
| 2017 | $16.06045 | $17.65238 | 789 |
| 2018 | $17.65238 | $15.75007 | 744 |
| Fidelity® VIP Government Money Market Portfolio - Initial Class | |||
| 2016 | $10.00000 | $9.92726 | 0 |
| 2017 | $9.92726 | $9.75123 | 0 |
| 2018 | $9.75123 | $9.66976 | 0 |
| Fidelity® VIP Government Money Market Portfolio - Service Class 2 | |||
| 2009 | $10.35984 | $10.15398 | 0 |
| 2010 | $10.15398 | $9.91244 | 0 |
| 2011 | $9.91244 | $9.67121 | 0 |
| 2012 | $9.67121 | $9.43458 | 0 |
| 2013 | $9.43458 | $9.20435 | 0 |
| 2014 | $9.20435 | $8.97974 | 0 |
| 2015 | $8.97974 | $8.76061 | 0 |
| 2016 | $8.76061 | $8.54773 | 0 |
| 2017 | $8.54773 | $8.37532 | 0 |
| 2018 | $8.37532 | $8.28456 | 0 |
| For the Year | Accumulation Unit Value | Accumulation Unit Value | Number of Accumulation Units |
| Ending December 31 | At Beginning of Period | At End of Period | Outstanding at End of Period |
| Fidelity® VIP Growth Portfolio - Service Class 2 | |||
| 2009 | $6.59710 | $8.23516 | 0 |
| 2010 | $8.23516 | $9.95059 | 0 |
| 2011 | $9.95059 | $9.70416 | 0 |
| 2012 | $9.70416 | $10.82927 | 0 |
| 2013 | $10.82927 | $14.36723 | 0 |
| 2014 | $14.36723 | $15.55875 | 0 |
| 2015 | $15.55875 | $16.22550 | 0 |
| 2016 | $16.22550 | $15.91610 | 0 |
| 2017 | $15.91610 | $20.93620 | 0 |
| 2018 | $20.93620 | $20.33543 | 0 |
| Fidelity® VIP Index 500 Portfolio - Service Class 2 | |||
| 2009 | $7.62822 | $9.39846 | 0 |
| 2010 | $9.39846 | $10.51883 | 0 |
| 2011 | $10.51883 | $10.44473 | 0 |
| 2012 | $10.44473 | $11.78089 | 0 |
| 2013 | $11.78089 | $15.15954 | 0 |
| 2014 | $15.15954 | $16.75329 | 0 |
| 2015 | $16.75329 | $16.51976 | 0 |
| 2016 | $16.51976 | $17.98275 | 0 |
| 2017 | $17.98275 | $21.30175 | 0 |
| 2018 | $21.30175 | $19.79726 | 0 |
| Fidelity® VIP Investment Grade Bond Portfolio - Service Class 2 | |||
| 2009 | $9.76275 | $10.99686 | 0 |
| 2010 | $10.99686 | $11.53720 | 0 |
| 2011 | $11.53720 | $12.04718 | 0 |
| 2012 | $12.04718 | $12.40984 | 0 |
| 2013 | $12.40984 | $11.85547 | 0 |
| 2014 | $11.85547 | $12.21473 | 0 |
| 2015 | $12.21473 | $11.81422 | 0 |
| 2016 | $11.81422 | $12.04166 | 0 |
| 2017 | $12.04166 | $12.21792 | 0 |
| 2018 | $12.21792 | $11.82511 | 0 |
| Fidelity® VIP Overseas Portfolio - Service Class 2 | |||
| 2009 | $8.99102 | $11.07040 | 449 |
| 2010 | $11.07040 | $12.18494 | 448 |
| 2011 | $12.18494 | $9.82556 | 448 |
| 2012 | $9.82556 | $11.53747 | 429 |
| 2013 | $11.53747 | $14.65026 | 409 |
| 2014 | $14.65026 | $13.10551 | 0 |
| 2015 | $13.10551 | $13.20581 | 0 |
| 2016 | $13.20581 | $12.20439 | 0 |
| 2017 | $12.20439 | $15.47874 | 0 |
| 2018 | $15.47874 | $12.82613 | 0 |
| Goldman Sachs VIT Mid Cap Value Fund - Institutional | |||
| 2015 | $10.00000 | $8.67262 | 0 |
| 2016 | $8.67262 | $9.60554 | 0 |
| 2017 | $9.60554 | $10.40949 | 0 |
| 2018 | $10.40949 | $9.09256 | 0 |
| For the Year | Accumulation Unit Value | Accumulation Unit Value | Number of Accumulation Units |
| Ending December 31 | At Beginning of Period | At End of Period | Outstanding at End of Period |
| Guggenheim VIF Long Short Equity Fund | |||
| 2009 | $8.75294 | $10.86903 | 0 |
| 2010 | $10.86903 | $11.79140 | 0 |
| 2011 | $11.79140 | $10.74821 | 0 |
| 2012 | $10.74821 | $10.94881 | 0 |
| 2013 | $10.94881 | $12.54526 | 0 |
| 2014 | $12.54526 | $12.57993 | 0 |
| 2015 | $12.57993 | $12.42638 | 0 |
| 2016 | $12.42638 | $12.20219 | 0 |
| 2017 | $12.20219 | $13.67393 | 0 |
| 2018 | $13.67393 | $11.61366 | 0 |
| Invesco V.I. American Franchise Fund - Series II | |||
| 2012 | $10.00000 | $8.85449 | 0 |
| 2013 | $8.85449 | $12.07510 | 0 |
| 2014 | $12.07510 | $12.74146 | 0 |
| 2015 | $12.74146 | $13.01969 | 0 |
| 2016 | $13.01969 | $12.95778 | 0 |
| 2017 | $12.95778 | $16.05993 | 0 |
| 2018 | $16.05993 | $15.05727 | 0 |
| Invesco V.I. Core Equity Fund - Series II | |||
| 2009 | $7.66594 | $9.57069 | 0 |
| 2010 | $9.57069 | $10.19987 | 0 |
| 2011 | $10.19987 | $9.92128 | 0 |
| 2012 | $9.92128 | $10.99512 | 0 |
| 2013 | $10.99512 | $13.82947 | 0 |
| 2014 | $13.82947 | $14.54917 | 0 |
| 2015 | $14.54917 | $13.34070 | 0 |
| 2016 | $13.34070 | $14.31876 | 0 |
| 2017 | $14.31876 | $15.76971 | 0 |
| 2018 | $15.76971 | $13.90512 | 0 |
| Invesco V.I. Government Securities Fund - Series II | |||
| 2011 | $10.00000 | $11.17846 | 0 |
| 2012 | $11.17846 | $11.14584 | 0 |
| 2013 | $11.14584 | $10.56241 | 0 |
| 2014 | $10.56241 | $10.70357 | 0 |
| 2015 | $10.70357 | $10.44771 | 0 |
| 2016 | $10.44771 | $10.29456 | 0 |
| 2017 | $10.29456 | $10.21707 | 0 |
| 2018 | $10.21707 | $9.99641 | 0 |
| Invesco V.I. Growth and Income Fund - Series II | |||
| 2009 | $8.78525 | $10.63616 | 0 |
| 2010 | $10.63616 | $11.64075 | 0 |
| 2011 | $11.64075 | $11.09927 | 0 |
| 2012 | $11.09927 | $12.38013 | 0 |
| 2013 | $12.38013 | $16.15511 | 0 |
| 2014 | $16.15511 | $17.32978 | 0 |
| 2015 | $17.32978 | $16.34508 | 0 |
| 2016 | $16.34508 | $19.04399 | 0 |
| 2017 | $19.04399 | $21.18930 | 0 |
| 2018 | $21.18930 | $17.86106 | 0 |
| For the Year | Accumulation Unit Value | Accumulation Unit Value | Number of Accumulation Units |
| Ending December 31 | At Beginning of Period | At End of Period | Outstanding at End of Period |
| Invesco V.I. Mid Cap Core Equity Fund - Series II | |||
| 2009 | $9.13904 | $11.57676 | 0 |
| 2010 | $11.57676 | $12.84935 | 0 |
| 2011 | $12.84935 | $11.71981 | 0 |
| 2012 | $11.71981 | $12.64599 | 0 |
| 2013 | $12.64599 | $15.84775 | 0 |
| 2014 | $15.84775 | $16.10404 | 0 |
| 2015 | $16.10404 | $15.03696 | 0 |
| 2016 | $15.03696 | $16.60050 | 0 |
| 2017 | $16.60050 | $18.57038 | 0 |
| 2018 | $18.57038 | $16.01436 | 0 |
| Invesco V.I. Mid Cap Growth Fund - Series II | |||
| 2009 | $7.25946 | $11.07385 | 0 |
| 2010 | $11.07385 | $13.74916 | 0 |
| 2011 | $13.74916 | $12.15736 | 0 |
| 2012 | $12.15736 | $13.23761 | 0 |
| 2013 | $13.23761 | $17.64025 | 0 |
| 2014 | $17.64025 | $18.53160 | 0 |
| 2015 | $18.53160 | $18.26586 | 0 |
| 2016 | $18.26586 | $17.92152 | 0 |
| 2017 | $17.92152 | $21.35770 | 0 |
| 2018 | $21.35770 | $19.61090 | 0 |
| Invesco V.I. Value Opportunities Fund - Series II | |||
| 2009 | $5.59063 | $8.05717 | 0 |
| 2010 | $8.05717 | $8.40576 | 0 |
| 2011 | $8.40576 | $7.92179 | 0 |
| 2012 | $7.92179 | $9.09156 | 0 |
| 2013 | $9.09156 | $11.81976 | 0 |
| 2014 | $11.81976 | $12.26644 | 0 |
| 2015 | $12.26644 | $10.69081 | 0 |
| 2016 | $10.69081 | $12.29879 | 0 |
| 2017 | $12.29879 | $14.06729 | 0 |
| 2018 | $14.06729 | $11.06755 | 0 |
| Janus Henderson Balanced Portfolio - Service Shares | |||
| 2009 | $10.48050 | $12.83933 | 0 |
| 2010 | $12.83933 | $13.54191 | 0 |
| 2011 | $13.54191 | $13.38988 | 0 |
| 2012 | $13.38988 | $14.80801 | 0 |
| 2013 | $14.80801 | $17.30591 | 0 |
| 2014 | $17.30591 | $18.27275 | 0 |
| 2015 | $18.27275 | $17.89823 | 0 |
| 2016 | $17.89823 | $18.21588 | 0 |
| 2017 | $18.21588 | $20.99634 | 0 |
| 2018 | $20.99634 | $20.57083 | 0 |
| Janus Henderson Forty Portfolio - Service Shares | |||
| 2009 | $9.62521 | $13.71006 | 0 |
| 2010 | $13.71006 | $14.24095 | 0 |
| 2011 | $14.24095 | $12.92831 | 0 |
| 2012 | $12.92831 | $15.61974 | 0 |
| 2013 | $15.61974 | $19.94342 | 0 |
| 2014 | $19.94342 | $21.10223 | 0 |
| 2015 | $21.10223 | $23.04261 | 0 |
| 2016 | $23.04261 | $22.91626 | 0 |
| 2017 | $22.91626 | $29.06637 | 0 |
| 2018 | $29.06637 | $28.84226 | 0 |
| For the Year | Accumulation Unit Value | Accumulation Unit Value | Number of Accumulation Units |
| Ending December 31 | At Beginning of Period | At End of Period | Outstanding at End of Period |
| Janus Henderson Mid Cap Value Portfolio - Service Shares | |||
| 2009 | $9.90917 | $12.84858 | 0 |
| 2010 | $12.84858 | $14.45978 | 0 |
| 2011 | $14.45978 | $13.68557 | 0 |
| 2012 | $13.68557 | $14.79015 | 0 |
| 2013 | $14.79015 | $18.15169 | 0 |
| 2014 | $18.15169 | $19.20129 | 0 |
| 2015 | $19.20129 | $18.03960 | 0 |
| 2016 | $18.03960 | $20.90108 | 0 |
| 2017 | $20.90108 | $23.17299 | 0 |
| 2018 | $23.17299 | $19.48142 | 0 |
| Janus Henderson Overseas Portfolio - Service Shares | |||
| 2009 | $6.69447 | $11.69432 | 0 |
| 2010 | $11.69432 | $14.26220 | 0 |
| 2011 | $14.26220 | $9.41378 | 0 |
| 2012 | $9.41378 | $10.39289 | 0 |
| 2013 | $10.39289 | $11.58624 | 0 |
| 2014 | $11.58624 | $9.93448 | 0 |
| 2015 | $9.93448 | $8.83767 | 0 |
| 2016 | $8.83767 | $8.04339 | 0 |
| 2017 | $8.04339 | $10.26550 | 0 |
| 2018 | $10.26550 | $8.49832 | 0 |
| MFS® Investors Growth Stock Portfolio - Service Class | |||
| 2015 | $10.00000 | $16.23559 | 0 |
| 2016 | $16.23559 | $16.76421 | 0 |
| 2017 | $16.76421 | $20.95330 | 0 |
| 2018 | $20.95330 | $20.55810 | 0 |
| MFS® Investors Trust Series - Service Class | |||
| 2009 | $8.58233 | $10.59550 | 0 |
| 2010 | $10.59550 | $11.46067 | 0 |
| 2011 | $11.46067 | $10.91010 | 0 |
| 2012 | $10.91010 | $12.64646 | 0 |
| 2013 | $12.64646 | $16.25229 | 0 |
| 2014 | $16.25229 | $17.55226 | 0 |
| 2015 | $17.55226 | $17.11422 | 0 |
| 2016 | $17.11422 | $18.08444 | 0 |
| 2017 | $18.08444 | $21.70828 | 0 |
| 2018 | $21.70828 | $19.96812 | 0 |
| MFS® New Discovery Series - Service Class | |||
| 2009 | $6.53804 | $10.39098 | 0 |
| 2010 | $10.39098 | $13.77987 | 0 |
| 2011 | $13.77987 | $12.03210 | 0 |
| 2012 | $12.03210 | $14.18936 | 0 |
| 2013 | $14.18936 | $19.54744 | 0 |
| 2014 | $19.54744 | $17.63928 | 0 |
| 2015 | $17.63928 | $16.83783 | 0 |
| 2016 | $16.83783 | $17.87178 | 0 |
| 2017 | $17.87178 | $22.02911 | 0 |
| 2018 | $22.02911 | $21.12074 | 0 |
| For the Year | Accumulation Unit Value | Accumulation Unit Value | Number of Accumulation Units |
| Ending December 31 | At Beginning of Period | At End of Period | Outstanding at End of Period |
| MFS® Total Return Series - Service Class | |||
| 2009 | $8.93684 | $10.26311 | 1,124 |
| 2010 | $10.26311 | $10.97624 | 1,123 |
| 2011 | $10.97624 | $10.87765 | 1,123 |
| 2012 | $10.87765 | $11.77071 | 1,074 |
| 2013 | $11.77071 | $13.63404 | 1,025 |
| 2014 | $13.63404 | $14.39546 | 779 |
| 2015 | $14.39546 | $13.96139 | 739 |
| 2016 | $13.96139 | $14.82099 | 694 |
| 2017 | $14.82099 | $16.19970 | 656 |
| 2018 | $16.19970 | $14.87531 | 619 |
| MFS® Value Series - Service Class | |||
| 2009 | $9.29945 | $11.10832 | 0 |
| 2010 | $11.10832 | $12.05181 | 0 |
| 2011 | $12.05181 | $11.70229 | 0 |
| 2012 | $11.70229 | $13.22793 | 0 |
| 2013 | $13.22793 | $17.49736 | 0 |
| 2014 | $17.49736 | $18.81013 | 0 |
| 2015 | $18.81013 | $18.17789 | 0 |
| 2016 | $18.17789 | $20.17681 | 0 |
| 2017 | $20.17681 | $23.10173 | 0 |
| 2018 | $23.10173 | $20.20211 | 0 |
| MFS® VIT II High Yield - Service Class | |||
| 2013 | $10.00000 | $14.38845 | 0 |
| 2014 | $14.38845 | $14.39157 | 0 |
| 2015 | $14.39157 | $13.41813 | 0 |
| 2016 | $13.41813 | $14.87656 | 0 |
| 2017 | $14.87656 | $15.43075 | 0 |
| 2018 | $15.43075 | $14.56537 | 0 |
| Morgan Stanley VIF Growth Portfolio, Class II | |||
| 2009 | $6.87531 | $11.07618 | 0 |
| 2010 | $11.07618 | $13.24826 | 0 |
| 2011 | $13.24826 | $12.53136 | 0 |
| 2012 | $12.53136 | $13.94143 | 0 |
| 2013 | $13.94143 | $20.09061 | 0 |
| 2014 | $20.09061 | $20.79174 | 0 |
| 2015 | $20.79174 | $22.70982 | 0 |
| 2016 | $22.70982 | $21.72910 | 0 |
| 2017 | $21.72910 | $30.27987 | 0 |
| 2018 | $30.27987 | $31.69417 | 0 |
| Morgan Stanley VIF U.S. Real Estate Portfolio, Class II | |||
| 2009 | $9.48841 | $11.89302 | 0 |
| 2010 | $11.89302 | $15.02781 | 0 |
| 2011 | $15.02781 | $15.49051 | 0 |
| 2012 | $15.49051 | $17.47064 | 0 |
| 2013 | $17.47064 | $17.34116 | 0 |
| 2014 | $17.34116 | $21.89463 | 0 |
| 2015 | $21.89463 | $21.76883 | 0 |
| 2016 | $21.76883 | $22.62777 | 0 |
| 2017 | $22.62777 | $22.71117 | 0 |
| 2018 | $22.71117 | $20.38950 | 0 |
| For the Year | Accumulation Unit Value | Accumulation Unit Value | Number of Accumulation Units |
| Ending December 31 | At Beginning of Period | At End of Period | Outstanding at End of Period |
| Oppenheimer Discovery Mid Cap Growth Fund/VA - Service Shares | |||
| 2009 | $5.97278 | $7.70612 | 0 |
| 2010 | $7.70612 | $9.55942 | 0 |
| 2011 | $9.55942 | $9.40366 | 0 |
| 2012 | $9.40366 | $10.65551 | 0 |
| 2013 | $10.65551 | $14.09769 | 0 |
| 2014 | $14.09769 | $14.51200 | 0 |
| 2015 | $14.51200 | $15.05506 | 0 |
| 2016 | $15.05506 | $14.99260 | 0 |
| 2017 | $14.99260 | $18.79059 | 0 |
| 2018 | $18.79059 | $17.17493 | 0 |
| Oppenheimer Global Fund/VA - Service Shares | |||
| 2009 | $8.65082 | $11.75993 | 0 |
| 2010 | $11.75993 | $13.27356 | 0 |
| 2011 | $13.27356 | $11.84470 | 0 |
| 2012 | $11.84470 | $13.97453 | 0 |
| 2013 | $13.97453 | $17.31185 | 0 |
| 2014 | $17.31185 | $17.23490 | 0 |
| 2015 | $17.23490 | $17.43004 | 0 |
| 2016 | $17.43004 | $16.97744 | 0 |
| 2017 | $16.97744 | $22.58130 | 0 |
| 2018 | $22.58130 | $19.07798 | 0 |
| Oppenheimer Main Street Small Cap Fund/VA - Service Shares | |||
| 2009 | $7.80532 | $10.42231 | 0 |
| 2010 | $10.42231 | $12.51138 | 0 |
| 2011 | $12.51138 | $11.91458 | 0 |
| 2012 | $11.91458 | $13.67568 | 0 |
| 2013 | $13.67568 | $18.76039 | 0 |
| 2014 | $18.76039 | $20.43367 | 0 |
| 2015 | $20.43367 | $18.71829 | 0 |
| 2016 | $18.71829 | $21.48817 | 0 |
| 2017 | $21.48817 | $23.88228 | 0 |
| 2018 | $23.88228 | $20.84227 | 0 |
| PIMCO International Bond (U.S. Dollar-Hedged) - Administrative Shares | |||
| formerly,PIMCO Foreign Bond Portfolio (U.S. Dollar-Hedged) - Administrative Shares | |||
| 2009 | $10.11556 | $11.41027 | 0 |
| 2010 | $11.41027 | $12.07686 | 0 |
| 2011 | $12.07686 | $12.57885 | 0 |
| 2012 | $12.57885 | $13.60098 | 0 |
| 2013 | $13.60098 | $13.33429 | 0 |
| 2014 | $13.33429 | $14.45925 | 0 |
| 2015 | $14.45925 | $14.14619 | 0 |
| 2016 | $14.14619 | $14.69432 | 0 |
| 2017 | $14.69432 | $14.73322 | 0 |
| 2018 | $14.73322 | $14.67751 | 0 |
| PIMCO Real Return Portfolio - Administrative Shares | |||
| 2009 | $10.04661 | $11.60338 | 0 |
| 2010 | $11.60338 | $12.23726 | 0 |
| 2011 | $12.23726 | $13.33199 | 0 |
| 2012 | $13.33199 | $14.14315 | 0 |
| 2013 | $14.14315 | $12.52480 | 0 |
| 2014 | $12.52480 | $12.59566 | 0 |
| 2015 | $12.59566 | $11.95463 | 0 |
| 2016 | $11.95463 | $12.26841 | 0 |
| 2017 | $12.26841 | $12.40748 | 0 |
| 2018 | $12.40748 | $11.83653 | 0 |
| For the Year | Accumulation Unit Value | Accumulation Unit Value | Number of Accumulation Units |
| Ending December 31 | At Beginning of Period | At End of Period | Outstanding at End of Period |
| PIMCO Total Return Portfolio - Administrative Shares | |||
| 2009 | $11.17977 | $12.44068 | 675 |
| 2010 | $12.44068 | $13.12102 | 674 |
| 2011 | $13.12102 | $13.26260 | 674 |
| 2012 | $13.26260 | $14.17771 | 645 |
| 2013 | $14.17771 | $13.55907 | 616 |
| 2014 | $13.55907 | $13.79275 | 0 |
| 2015 | $13.79275 | $13.51518 | 0 |
| 2016 | $13.51518 | $13.53788 | 0 |
| 2017 | $13.53788 | $13.85795 | 0 |
| 2018 | $13.85795 | $13.44685 | 0 |
| T. Rowe Price Blue Chip Growth Portfolio - II | |||
| 2009 | $7.00526 | $9.68960 | 0 |
| 2010 | $9.68960 | $10.96484 | 0 |
| 2011 | $10.96484 | $10.84239 | 0 |
| 2012 | $10.84239 | $12.46994 | 0 |
| 2013 | $12.46994 | $17.13400 | 0 |
| 2014 | $17.13400 | $18.19193 | 621 |
| 2015 | $18.19193 | $19.66244 | 589 |
| 2016 | $19.66244 | $19.28494 | 553 |
| 2017 | $19.28494 | $25.55767 | 523 |
| 2018 | $25.55767 | $25.34340 | 493 |
| T. Rowe Price Equity Income Portfolio - II | |||
| 2009 | $8.04225 | $9.82619 | 0 |
| 2010 | $9.82619 | $10.99878 | 0 |
| 2011 | $10.99878 | $10.62045 | 0 |
| 2012 | $10.62045 | $12.11281 | 0 |
| 2013 | $12.11281 | $15.29087 | 0 |
| 2014 | $15.29087 | $15.97577 | 0 |
| 2015 | $15.97577 | $14.47694 | 0 |
| 2016 | $14.47694 | $16.78620 | 0 |
| 2017 | $16.78620 | $18.95452 | 0 |
| 2018 | $18.95452 | $16.69821 | 0 |
| VanEck VIP Emerging Markets Fund - Initial Class | |||
| 2009 | $9.68311 | $20.13718 | 0 |
| 2010 | $20.13718 | $24.91709 | 0 |
| 2011 | $24.91709 | $18.05091 | 0 |
| 2012 | $18.05091 | $22.85638 | 0 |
| 2013 | $22.85638 | $24.97659 | 0 |
| 2014 | $24.97659 | $24.26339 | 218 |
| 2015 | $24.26339 | $20.35670 | 207 |
| 2016 | $20.35670 | $19.87972 | 194 |
| 2017 | $19.87972 | $29.29606 | 184 |
| 2018 | $29.29606 | $21.86636 | 173 |
| VanEck VIP Global Hard Assets Fund - Initial Class | |||
| 2009 | $16.50757 | $25.36794 | 0 |
| 2010 | $25.36794 | $31.98199 | 0 |
| 2011 | $31.98199 | $26.06684 | 0 |
| 2012 | $26.06684 | $26.28755 | 0 |
| 2013 | $26.28755 | $28.34477 | 0 |
| 2014 | $28.34477 | $22.36728 | 0 |
| 2015 | $22.36728 | $14.52063 | 0 |
| 2016 | $14.52063 | $20.35788 | 0 |
| 2017 | $20.35788 | $19.52571 | 0 |
| 2018 | $19.52571 | $13.66125 | 0 |
| For the Year | Accumulation Unit Value | Accumulation Unit Value | Number of Accumulation Units |
| Ending December 31 | At Beginning of Period | At End of Period | Outstanding at End of Period |
| Western Asset Variable Global High Yield Bond Portfolio - Class II | |||
| 2009 | $7.66945 | $11.58547 | 0 |
| 2010 | $11.58547 | $12.96259 | 0 |
| 2011 | $12.96259 | $12.80651 | 0 |
| 2012 | $12.80651 | $14.75008 | 0 |
| 2013 | $14.75008 | $15.26029 | 0 |
| 2014 | $15.26029 | $14.66167 | 0 |
| 2015 | $14.66167 | $13.43299 | 0 |
| 2016 | $13.43299 | $15.11743 | 0 |
| 2017 | $15.11743 | $15.99289 | 0 |
| 2018 | $15.99289 | $14.95185 | 0 |
| * The Accumulation Unit Values in this table reflect a mortality and expense risk charge of 2.35% and an administrative expense charge of 0.10%. | |||
| CONSULTANT SOLUTIONS VARIABLE ANNUITIES: LBL Consultant Solution Select Contracts - PROSPECTUS | |||
| ACCUMULATION UNIT VALUE AND NUMBER OF ACCUMULATION UNITS OUTSTANDING FOR EACH VARIABLE | |||
| SUB-ACCOUNT* | |||
| Low | |||
| Mortality & Expense = 1.70 | |||
| For the Year | Accumulation Unit Value | Accumulation Unit Value | Number of Accumulation Units |
| Ending December 31 | At Beginning of Period | At End of Period | Outstanding at End of Period |
| Alger Capital Appreciation Portfolio - Class S | |||
| 2009 | $9.36922 | $13.86420 | 8,797 |
| 2010 | $13.86420 | $15.47008 | 4,945 |
| 2011 | $15.47008 | $15.09692 | 2,846 |
| 2012 | $15.09692 | $17.47693 | 2,301 |
| 2013 | $17.47693 | $23.13332 | 1,926 |
| 2014 | $23.13332 | $25.77154 | 1,300 |
| 2015 | $25.77154 | $26.80437 | 1,422 |
| 2016 | $26.80437 | $26.38127 | 331 |
| 2017 | $26.38127 | $33.87319 | 331 |
| 2018 | $33.87319 | $33.13977 | 330 |
| Alger Large Cap Growth Portfolio - Class S | |||
| 2009 | $7.04416 | $10.18583 | 15,504 |
| 2010 | $10.18583 | $11.29357 | 14,306 |
| 2011 | $11.29357 | $11.00612 | 13,568 |
| 2012 | $11.00612 | $11.82108 | 12,190 |
| 2013 | $11.82108 | $15.62203 | 10,963 |
| 2014 | $15.62203 | $16.96088 | 10,450 |
| 2015 | $16.96088 | $16.88091 | 10,560 |
| 2016 | $16.88091 | $16.37839 | 9,142 |
| 2017 | $16.37839 | $20.58208 | 6,532 |
| 2018 | $20.58208 | $20.55993 | 4,772 |
| Alger Mid Cap Growth Portfolio - Class S | |||
| 2009 | $6.45799 | $9.59590 | 15,709 |
| 2010 | $9.59590 | $11.20270 | 14,156 |
| 2011 | $11.20270 | $10.05631 | 12,397 |
| 2012 | $10.05631 | $11.42440 | 6,470 |
| 2013 | $11.42440 | $15.19065 | 4,773 |
| 2014 | $15.19065 | $16.04842 | 3,896 |
| 2015 | $16.04842 | $15.46101 | 3,847 |
| 2016 | $15.46101 | $15.25677 | 3,202 |
| 2017 | $15.25677 | $19.35649 | 2,726 |
| 2018 | $19.35649 | $17.52730 | 2,695 |
| ClearBridge Variable Large Cap Value Portfolio-Class I | |||
| 2009 | $6.14362 | $7.51117 | 4,311 |
| 2010 | $7.51117 | $8.07414 | 3,403 |
| 2011 | $8.07414 | $8.32181 | 4,149 |
| 2012 | $8.32181 | $9.52040 | 3,911 |
| 2013 | $9.52040 | $12.37539 | 2,511 |
| 2014 | $12.37539 | $13.57553 | 2,540 |
| 2015 | $13.57553 | $12.94884 | 1,521 |
| 2016 | $12.94884 | $14.36966 | 1,215 |
| 2017 | $14.36966 | $16.20630 | 1,006 |
| 2018 | $16.20630 | $14.50185 | 952 |
| For the Year | Accumulation Unit Value | Accumulation Unit Value | Number of Accumulation Units |
| Ending December 31 | At Beginning of Period | At End of Period | Outstanding at End of Period |
| Fidelity® VIP Asset Manager Portfolio - Service Class 2 | |||
| 2009 | $8.61352 | $10.89128 | 13,118 |
| 2010 | $10.89128 | $12.18877 | 8,427 |
| 2011 | $12.18877 | $11.63278 | 8,191 |
| 2012 | $11.63278 | $12.82055 | 10,063 |
| 2013 | $12.82055 | $14.52102 | 7,851 |
| 2014 | $14.52102 | $15.04940 | 6,124 |
| 2015 | $15.04940 | $14.76959 | 5,606 |
| 2016 | $14.76959 | $14.91633 | 4,416 |
| 2017 | $14.91633 | $16.66271 | 4,331 |
| 2018 | $16.66271 | $15.44366 | 4,298 |
| Fidelity® VIP Contrafund® Portfolio - Service Class 2 | |||
| 2009 | $9.21598 | $12.26000 | 81,493 |
| 2010 | $12.26000 | $14.07739 | 53,895 |
| 2011 | $14.07739 | $13.43961 | 45,208 |
| 2012 | $13.43961 | $15.32729 | 37,230 |
| 2013 | $15.32729 | $19.71044 | 24,831 |
| 2014 | $19.71044 | $21.61149 | 23,735 |
| 2015 | $21.61149 | $21.31064 | 20,812 |
| 2016 | $21.31064 | $22.54589 | 11,853 |
| 2017 | $22.54589 | $26.92255 | 9,566 |
| 2018 | $26.92255 | $24.68169 | 9,047 |
| Fidelity® VIP Equity-Income Portfolio - Service Class 2 | |||
| 2009 | $7.36081 | $9.38841 | 75,431 |
| 2010 | $9.38841 | $10.59485 | 78,583 |
| 2011 | $10.59485 | $10.47266 | 57,292 |
| 2012 | $10.47266 | $12.03763 | 60,518 |
| 2013 | $12.03763 | $15.11056 | 52,689 |
| 2014 | $15.11056 | $16.09682 | 45,304 |
| 2015 | $16.09682 | $15.13709 | 45,292 |
| 2016 | $15.13709 | $17.49793 | 31,625 |
| 2017 | $17.49793 | $19.35877 | 22,120 |
| 2018 | $19.35877 | $17.38680 | 16,220 |
| Fidelity® VIP Government Money Market Portfolio - Initial Class | |||
| 2016 | $10.00000 | $9.94890 | 23,258 |
| 2017 | $9.94890 | $9.83676 | 28,619 |
| 2018 | $9.83676 | $9.81903 | 30,469 |
| Fidelity® VIP Government Money Market Portfolio - Service Class 2 | |||
| 2009 | $10.70316 | $10.56038 | 204,879 |
| 2010 | $10.56038 | $10.37786 | 115,332 |
| 2011 | $10.37786 | $10.19259 | 105,038 |
| 2012 | $10.19259 | $10.00963 | 93,580 |
| 2013 | $10.00963 | $9.83044 | 99,838 |
| 2014 | $9.83044 | $9.65446 | 58,641 |
| 2015 | $9.65446 | $9.48163 | 39,320 |
| 2016 | $9.48163 | $9.31271 | 78,984 |
| 2017 | $9.31271 | $9.18489 | 19,303 |
| 2018 | $9.18489 | $9.14540 | 11,292 |
| For the Year | Accumulation Unit Value | Accumulation Unit Value | Number of Accumulation Units |
| Ending December 31 | At Beginning of Period | At End of Period | Outstanding at End of Period |
| Fidelity® VIP Growth Portfolio - Service Class 2 | |||
| 2009 | $6.81590 | $8.56498 | 57,607 |
| 2010 | $8.56498 | $10.41798 | 58,821 |
| 2011 | $10.41798 | $10.22752 | 39,731 |
| 2012 | $10.22752 | $11.48950 | 48,616 |
| 2013 | $11.48950 | $15.34465 | 38,482 |
| 2014 | $15.34465 | $16.72795 | 42,969 |
| 2015 | $16.72795 | $17.56102 | 34,065 |
| 2016 | $17.56102 | $17.34062 | 29,697 |
| 2017 | $17.34062 | $22.95987 | 17,301 |
| 2018 | $22.95987 | $22.44849 | 12,242 |
| Fidelity® VIP Index 500 Portfolio - Service Class 2 | |||
| 2009 | $7.88116 | $9.77479 | 188,699 |
| 2010 | $9.77479 | $11.01284 | 186,215 |
| 2011 | $11.01284 | $11.00797 | 112,062 |
| 2012 | $11.00797 | $12.49909 | 96,761 |
| 2013 | $12.49909 | $16.19079 | 101,931 |
| 2014 | $16.19079 | $18.01214 | 85,546 |
| 2015 | $18.01214 | $17.87939 | 77,986 |
| 2016 | $17.87939 | $19.59207 | 67,115 |
| 2017 | $19.59207 | $23.36061 | 51,883 |
| 2018 | $23.36061 | $21.85426 | 47,003 |
| Fidelity® VIP Investment Grade Bond Portfolio - Service Class 2 | |||
| 2009 | $10.08631 | $11.43698 | 109,299 |
| 2010 | $11.43698 | $12.07887 | 73,245 |
| 2011 | $12.07887 | $12.69658 | 52,851 |
| 2012 | $12.69658 | $13.16614 | 43,691 |
| 2013 | $13.16614 | $12.66180 | 32,645 |
| 2014 | $12.66180 | $13.13242 | 22,768 |
| 2015 | $13.13242 | $12.78645 | 14,698 |
| 2016 | $12.78645 | $13.11921 | 8,832 |
| 2017 | $13.11921 | $13.39876 | 7,184 |
| 2018 | $13.39876 | $13.05369 | 6,485 |
| Fidelity® VIP Overseas Portfolio - Service Class 2 | |||
| 2009 | $9.28911 | $11.51367 | 59,741 |
| 2010 | $11.51367 | $12.75715 | 48,418 |
| 2011 | $12.75715 | $10.35549 | 44,346 |
| 2012 | $10.35549 | $12.24091 | 53,374 |
| 2013 | $12.24091 | $15.64692 | 46,559 |
| 2014 | $15.64692 | $14.09040 | 44,726 |
| 2015 | $14.09040 | $14.29288 | 30,202 |
| 2016 | $14.29288 | $13.29683 | 27,327 |
| 2017 | $13.29683 | $16.97507 | 18,055 |
| 2018 | $16.97507 | $14.15909 | 16,666 |
| Goldman Sachs VIT Mid Cap Value Fund - Institutional | |||
| 2015 | $10.00000 | $8.71126 | 1,711 |
| 2016 | $8.71126 | $9.71244 | 1,796 |
| 2017 | $9.71244 | $10.59453 | 1,512 |
| 2018 | $10.59453 | $9.31540 | 2,506 |
| For the Year | Accumulation Unit Value | Accumulation Unit Value | Number of Accumulation Units |
| Ending December 31 | At Beginning of Period | At End of Period | Outstanding at End of Period |
| Guggenheim VIF Long Short Equity Fund | |||
| 2009 | $9.04315 | $11.30420 | 13,289 |
| 2010 | $11.30420 | $12.34513 | 12,260 |
| 2011 | $12.34513 | $11.32776 | 12,101 |
| 2012 | $11.32776 | $11.61627 | 11,965 |
| 2013 | $11.61627 | $13.39870 | 1,459 |
| 2014 | $13.39870 | $13.52524 | 864 |
| 2015 | $13.52524 | $13.44917 | 326 |
| 2016 | $13.44917 | $13.29427 | 297 |
| 2017 | $13.29427 | $14.99566 | 296 |
| 2018 | $14.99566 | $12.82046 | 296 |
| Invesco V.I. American Franchise Fund - Series II | |||
| 2012 | $10.00000 | $9.39434 | 5,393 |
| 2013 | $9.39434 | $12.89660 | 3,297 |
| 2014 | $12.89660 | $13.69898 | 3,048 |
| 2015 | $13.69898 | $14.09140 | 2,831 |
| 2016 | $14.09140 | $14.11756 | 2,282 |
| 2017 | $14.11756 | $17.61235 | 1,289 |
| 2018 | $17.61235 | $16.62199 | 609 |
| Invesco V.I. Core Equity Fund - Series II | |||
| 2009 | $7.80353 | $9.80739 | 16,715 |
| 2010 | $9.80739 | $10.52172 | 14,055 |
| 2011 | $10.52172 | $10.30238 | 12,208 |
| 2012 | $10.30238 | $11.49372 | 11,510 |
| 2013 | $11.49372 | $14.55286 | 8,377 |
| 2014 | $14.55286 | $15.41224 | 8,069 |
| 2015 | $15.41224 | $14.22628 | 8,177 |
| 2016 | $14.22628 | $15.37071 | 3,077 |
| 2017 | $15.37071 | $17.03954 | 2,038 |
| 2018 | $17.03954 | $15.12421 | 2,067 |
| Invesco V.I. Government Securities Fund - Series II | |||
| 2011 | $10.00000 | $11.78104 | 12,345 |
| 2012 | $11.78104 | $11.82513 | 7,815 |
| 2013 | $11.82513 | $11.28082 | 9,571 |
| 2014 | $11.28082 | $11.50774 | 7,672 |
| 2015 | $11.50774 | $11.30749 | 6,961 |
| 2016 | $11.30749 | $11.21578 | 4,981 |
| 2017 | $11.21578 | $11.20456 | 4,601 |
| 2018 | $11.20456 | $11.03501 | 3,279 |
| Invesco V.I. Growth and Income Fund - Series II | |||
| 2009 | $9.07648 | $11.06197 | 31,070 |
| 2010 | $11.06197 | $12.18739 | 27,922 |
| 2011 | $12.18739 | $11.69777 | 24,168 |
| 2012 | $11.69777 | $13.13483 | 22,503 |
| 2013 | $13.13483 | $17.25406 | 19,862 |
| 2014 | $17.25406 | $18.63196 | 12,486 |
| 2015 | $18.63196 | $17.69040 | 15,920 |
| 2016 | $17.69040 | $20.74835 | 6,367 |
| 2017 | $20.74835 | $23.23741 | 4,818 |
| 2018 | $23.23741 | $19.71701 | 4,947 |
| For the Year | Accumulation Unit Value | Accumulation Unit Value | Number of Accumulation Units |
| Ending December 31 | At Beginning of Period | At End of Period | Outstanding at End of Period |
| Invesco V.I. Mid Cap Core Equity Fund - Series II | |||
| 2009 | $9.44200 | $12.04023 | 23,028 |
| 2010 | $12.04023 | $13.45274 | 21,748 |
| 2011 | $13.45274 | $12.35177 | 22,611 |
| 2012 | $12.35177 | $13.41693 | 17,790 |
| 2013 | $13.41693 | $16.92581 | 16,032 |
| 2014 | $16.92581 | $17.31418 | 14,497 |
| 2015 | $17.31418 | $16.27467 | 13,712 |
| 2016 | $16.27467 | $18.08627 | 10,510 |
| 2017 | $18.08627 | $20.36545 | 8,858 |
| 2018 | $20.36545 | $17.67852 | 7,663 |
| Invesco V.I. Mid Cap Growth Fund - Series II | |||
| 2009 | $7.50021 | $11.51728 | 10,158 |
| 2010 | $11.51728 | $14.39487 | 7,082 |
| 2011 | $14.39487 | $12.81301 | 6,034 |
| 2012 | $12.81301 | $14.04470 | 6,076 |
| 2013 | $14.04470 | $18.84038 | 4,784 |
| 2014 | $18.84038 | $19.92430 | 3,162 |
| 2015 | $19.92430 | $19.76948 | 1,652 |
| 2016 | $19.76948 | $19.52571 | 1,030 |
| 2017 | $19.52571 | $23.42239 | 1,570 |
| 2018 | $23.42239 | $21.64897 | 986 |
| Invesco V.I. Value Opportunities Fund - Series II | |||
| 2009 | $5.77609 | $8.37994 | 17,395 |
| 2010 | $8.37994 | $8.80070 | 15,645 |
| 2011 | $8.80070 | $8.34916 | 12,474 |
| 2012 | $8.34916 | $9.64602 | 7,102 |
| 2013 | $9.64602 | $12.62409 | 6,070 |
| 2014 | $12.62409 | $13.18848 | 4,517 |
| 2015 | $13.18848 | $11.57104 | 3,652 |
| 2016 | $11.57104 | $13.39986 | 3,345 |
| 2017 | $13.39986 | $15.42742 | 2,656 |
| 2018 | $15.42742 | $12.21796 | 2,355 |
| Janus Henderson Balanced Portfolio - Service Shares | |||
| 2009 | $10.82785 | $13.35321 | 19,202 |
| 2010 | $13.35321 | $14.17770 | 20,105 |
| 2011 | $14.17770 | $14.11171 | 18,228 |
| 2012 | $14.11171 | $15.71051 | 10,712 |
| 2013 | $15.71051 | $18.48294 | 8,198 |
| 2014 | $18.48294 | $19.64555 | 6,363 |
| 2015 | $19.64555 | $19.37113 | 4,798 |
| 2016 | $19.37113 | $19.84592 | 2,684 |
| 2017 | $19.84592 | $23.02553 | 2,377 |
| 2018 | $23.02553 | $22.70801 | 2,175 |
| Janus Henderson Forty Portfolio - Service Shares | |||
| 2009 | $9.94433 | $14.25896 | 12,938 |
| 2010 | $14.25896 | $14.90971 | 10,052 |
| 2011 | $14.90971 | $13.62545 | 8,840 |
| 2012 | $13.62545 | $16.57189 | 7,253 |
| 2013 | $16.57189 | $21.30004 | 5,800 |
| 2014 | $21.30004 | $22.68783 | 3,321 |
| 2015 | $22.68783 | $24.93906 | 2,507 |
| 2016 | $24.93906 | $24.96711 | 2,019 |
| 2017 | $24.96711 | $31.87569 | 1,637 |
| 2018 | $31.87569 | $31.83904 | 1,607 |
| For the Year | Accumulation Unit Value | Accumulation Unit Value | Number of Accumulation Units |
| Ending December 31 | At Beginning of Period | At End of Period | Outstanding at End of Period |
| Janus Henderson Mid Cap Value Portfolio - Service Shares | |||
| 2009 | $10.23768 | $13.36298 | 30,080 |
| 2010 | $13.36298 | $15.13879 | 24,624 |
| 2011 | $15.13879 | $14.42352 | 21,913 |
| 2012 | $14.42352 | $15.69179 | 16,678 |
| 2013 | $15.69179 | $19.38649 | 14,698 |
| 2014 | $19.38649 | $20.64413 | 8,246 |
| 2015 | $20.64413 | $19.52442 | 6,864 |
| 2016 | $19.52442 | $22.77163 | 4,078 |
| 2017 | $22.77163 | $25.41282 | 3,697 |
| 2018 | $25.41282 | $21.50574 | 2,649 |
| Janus Henderson Overseas Portfolio - Service Shares | |||
| 2009 | $6.91646 | $12.16259 | 7,507 |
| 2010 | $12.16259 | $14.93197 | 5,973 |
| 2011 | $14.93197 | $9.92154 | 5,705 |
| 2012 | $9.92154 | $11.02666 | 6,067 |
| 2013 | $11.02666 | $12.37466 | 3,622 |
| 2014 | $12.37466 | $10.68128 | 1,555 |
| 2015 | $10.68128 | $9.56543 | 1,088 |
| 2016 | $9.56543 | $8.76361 | 851 |
| 2017 | $8.76361 | $11.25817 | 797 |
| 2018 | $11.25817 | $9.38177 | 770 |
| MFS® Investors Growth Stock Portfolio - Service Class | |||
| 2015 | $10.00000 | $17.57185 | 5,959 |
| 2016 | $17.57185 | $18.26452 | 3,986 |
| 2017 | $18.26452 | $22.97851 | 1,284 |
| 2018 | $22.97851 | $22.69419 | 1,046 |
| MFS® Investors Trust Series - Service Class | |||
| 2009 | $8.86686 | $11.01972 | 3,217 |
| 2010 | $11.01972 | $11.99887 | 1,719 |
| 2011 | $11.99887 | $11.49841 | 3,714 |
| 2012 | $11.49841 | $13.41738 | 3,388 |
| 2013 | $13.41738 | $17.35780 | 3,108 |
| 2014 | $17.35780 | $18.87108 | 2,607 |
| 2015 | $18.87108 | $18.52274 | 2,415 |
| 2016 | $18.52274 | $19.70286 | 2,086 |
| 2017 | $19.70286 | $23.80642 | 1,895 |
| 2018 | $23.80642 | $22.04289 | 1,732 |
| MFS® New Discovery Series - Service Class | |||
| 2009 | $6.75490 | $10.80713 | 13,125 |
| 2010 | $10.80713 | $14.42707 | 9,230 |
| 2011 | $14.42707 | $12.68105 | 8,946 |
| 2012 | $12.68105 | $15.05454 | 7,889 |
| 2013 | $15.05454 | $20.87736 | 4,629 |
| 2014 | $20.87736 | $18.96499 | 3,804 |
| 2015 | $18.96499 | $18.22397 | 5,636 |
| 2016 | $18.22397 | $19.47155 | 5,341 |
| 2017 | $19.47155 | $24.15875 | 5,331 |
| 2018 | $24.15875 | $23.31577 | 5,056 |
| For the Year | Accumulation Unit Value | Accumulation Unit Value | Number of Accumulation Units |
| Ending December 31 | At Beginning of Period | At End of Period | Outstanding at End of Period |
| MFS® Total Return Series - Service Class | |||
| 2009 | $9.23307 | $10.67394 | 20,112 |
| 2010 | $10.67394 | $11.49163 | 13,332 |
| 2011 | $11.49163 | $11.46410 | 13,081 |
| 2012 | $11.46410 | $12.48813 | 11,293 |
| 2013 | $12.48813 | $14.56137 | 9,152 |
| 2014 | $14.56137 | $15.47701 | 7,803 |
| 2015 | $15.47701 | $15.11035 | 4,680 |
| 2016 | $15.11035 | $16.14725 | 3,407 |
| 2017 | $16.14725 | $17.76535 | 2,707 |
| 2018 | $17.76535 | $16.42082 | 2,653 |
| MFS® Value Series - Service Class | |||
| 2009 | $9.60774 | $11.55303 | 3,502 |
| 2010 | $11.55303 | $12.61773 | 2,399 |
| 2011 | $12.61773 | $12.33328 | 2,554 |
| 2012 | $12.33328 | $14.03428 | 2,402 |
| 2013 | $14.03428 | $18.68755 | 2,381 |
| 2014 | $18.68755 | $20.22346 | 1,921 |
| 2015 | $20.22346 | $19.67394 | 923 |
| 2016 | $19.67394 | $21.98243 | 533 |
| 2017 | $21.98243 | $25.33452 | 435 |
| 2018 | $25.33452 | $22.30118 | 346 |
| MFS® VIT II High Yield - Service Class | |||
| 2013 | $10.00000 | $15.36705 | 4,159 |
| 2014 | $15.36705 | $15.47279 | 4,685 |
| 2015 | $15.47279 | $14.52237 | 3,448 |
| 2016 | $14.52237 | $16.20776 | 2,284 |
| 2017 | $16.20776 | $16.92209 | 2,124 |
| 2018 | $16.92209 | $16.07866 | 2,094 |
| Morgan Stanley VIF Growth Portfolio, Class II | |||
| 2009 | $7.10331 | $11.51970 | 5,504 |
| 2010 | $11.51970 | $13.87041 | 4,539 |
| 2011 | $13.87041 | $13.20708 | 4,772 |
| 2012 | $13.20708 | $14.79133 | 4,328 |
| 2013 | $14.79133 | $21.45723 | 3,807 |
| 2014 | $21.45723 | $22.35400 | 3,003 |
| 2015 | $22.35400 | $24.57887 | 1,744 |
| 2016 | $24.57887 | $23.67370 | 730 |
| 2017 | $23.67370 | $33.20635 | 729 |
| 2018 | $33.20635 | $34.98719 | 729 |
| Morgan Stanley VIF U.S. Real Estate Portfolio, Class II | |||
| 2009 | $9.80313 | $12.36949 | 39,348 |
| 2010 | $12.36949 | $15.73381 | 29,572 |
| 2011 | $15.73381 | $16.32605 | 27,469 |
| 2012 | $16.32605 | $18.53591 | 24,708 |
| 2013 | $18.53591 | $18.52115 | 21,474 |
| 2014 | $18.52115 | $23.54010 | 15,395 |
| 2015 | $23.54010 | $23.56078 | 11,583 |
| 2016 | $23.56078 | $24.65298 | 9,065 |
| 2017 | $24.65298 | $24.90651 | 9,053 |
| 2018 | $24.90651 | $22.50832 | 7,399 |
| For the Year | Accumulation Unit Value | Accumulation Unit Value | Number of Accumulation Units |
| Ending December 31 | At Beginning of Period | At End of Period | Outstanding at End of Period |
| Oppenheimer Discovery Mid Cap Growth Fund/VA - Service Shares | |||
| 2009 | $6.12044 | $7.94925 | 8,703 |
| 2010 | $7.94925 | $9.92663 | 6,348 |
| 2011 | $9.92663 | $9.82981 | 7,146 |
| 2012 | $9.82981 | $11.21279 | 5,665 |
| 2013 | $11.21279 | $14.93375 | 3,682 |
| 2014 | $14.93375 | $15.47508 | 4,374 |
| 2015 | $15.47508 | $16.16116 | 2,520 |
| 2016 | $16.16116 | $16.20103 | 1,275 |
| 2017 | $16.20103 | $20.43859 | 923 |
| 2018 | $20.43859 | $18.80477 | 658 |
| Oppenheimer Global Fund/VA - Service Shares | |||
| 2009 | $8.93761 | $12.23076 | 44,368 |
| 2010 | $12.23076 | $13.89686 | 41,921 |
| 2011 | $13.89686 | $12.48343 | 32,097 |
| 2012 | $12.48343 | $14.82644 | 36,198 |
| 2013 | $14.82644 | $18.48949 | 32,092 |
| 2014 | $18.48949 | $18.52996 | 30,546 |
| 2015 | $18.52996 | $18.86465 | 26,022 |
| 2016 | $18.86465 | $18.49690 | 16,284 |
| 2017 | $18.49690 | $24.76392 | 8,248 |
| 2018 | $24.76392 | $21.06042 | 7,450 |
| Oppenheimer Main Street Small Cap Fund/VA - Service Shares | |||
| 2009 | $8.06413 | $10.83968 | 31,176 |
| 2010 | $10.83968 | $13.09901 | 26,227 |
| 2011 | $13.09901 | $12.55715 | 21,911 |
| 2012 | $12.55715 | $14.50945 | 23,005 |
| 2013 | $14.50945 | $20.03663 | 19,793 |
| 2014 | $20.03663 | $21.96915 | 18,283 |
| 2015 | $21.96915 | $20.25900 | 15,722 |
| 2016 | $20.25900 | $23.41131 | 10,883 |
| 2017 | $23.41131 | $26.19075 | 8,342 |
| 2018 | $26.19075 | $23.00810 | 6,778 |
| PIMCO International Bond (U.S. Dollar-Hedged) - Administrative Shares | |||
| formerly,PIMCO Foreign Bond Portfolio (U.S. Dollar-Hedged) - Administrative Shares | |||
| 2009 | $10.45079 | $11.86692 | 25,316 |
| 2010 | $11.86692 | $12.64386 | 20,331 |
| 2011 | $12.64386 | $13.25689 | 16,521 |
| 2012 | $13.25689 | $14.42986 | 14,395 |
| 2013 | $14.42986 | $14.24118 | 12,784 |
| 2014 | $14.24118 | $15.54553 | 5,997 |
| 2015 | $15.54553 | $15.31029 | 4,556 |
| 2016 | $15.31029 | $16.00916 | 3,744 |
| 2017 | $16.00916 | $16.15710 | 3,298 |
| 2018 | $16.15710 | $16.20239 | 3,001 |
| PIMCO Real Return Portfolio - Administrative Shares | |||
| 2009 | $10.37958 | $12.06775 | 32,397 |
| 2010 | $12.06775 | $12.81177 | 32,722 |
| 2011 | $12.81177 | $14.05061 | 20,871 |
| 2012 | $14.05061 | $15.00502 | 16,504 |
| 2013 | $15.00502 | $13.37664 | 14,113 |
| 2014 | $13.37664 | $13.54195 | 9,334 |
| 2015 | $13.54195 | $12.93846 | 6,186 |
| 2016 | $12.93846 | $13.36628 | 5,442 |
| 2017 | $13.36628 | $13.60670 | 4,417 |
| 2018 | $13.60670 | $13.06635 | 3,375 |
| For the Year | Accumulation Unit Value | Accumulation Unit Value | Number of Accumulation Units |
| Ending December 31 | At Beginning of Period | At End of Period | Outstanding at End of Period |
| PIMCO Total Return Portfolio - Administrative Shares | |||
| 2009 | $11.55025 | $12.93854 | 93,450 |
| 2010 | $12.93854 | $13.73700 | 84,488 |
| 2011 | $13.73700 | $13.97748 | 122,070 |
| 2012 | $13.97748 | $15.04169 | 111,189 |
| 2013 | $15.04169 | $14.48121 | 49,016 |
| 2014 | $14.48121 | $14.82892 | 28,408 |
| 2015 | $14.82892 | $14.62733 | 25,235 |
| 2016 | $14.62733 | $14.74926 | 19,524 |
| 2017 | $14.74926 | $15.19725 | 15,969 |
| 2018 | $15.19725 | $14.84390 | 13,684 |
| T. Rowe Price Blue Chip Growth Portfolio - II | |||
| 2009 | $7.23756 | $10.07759 | 50,583 |
| 2010 | $10.07759 | $11.47981 | 35,122 |
| 2011 | $11.47981 | $11.42708 | 29,928 |
| 2012 | $11.42708 | $13.23013 | 30,044 |
| 2013 | $13.23013 | $18.29954 | 22,612 |
| 2014 | $18.29954 | $19.55890 | 16,859 |
| 2015 | $19.55890 | $21.28074 | 12,660 |
| 2016 | $21.28074 | $21.01087 | 5,906 |
| 2017 | $21.01087 | $28.02791 | 3,493 |
| 2018 | $28.02791 | $27.97670 | 2,391 |
| T. Rowe Price Equity Income Portfolio - II | |||
| 2009 | $8.30891 | $10.21966 | 63,978 |
| 2010 | $10.21966 | $11.51533 | 56,769 |
| 2011 | $11.51533 | $11.19318 | 48,248 |
| 2012 | $11.19318 | $12.85127 | 37,818 |
| 2013 | $12.85127 | $16.33112 | 24,332 |
| 2014 | $16.33112 | $17.17631 | 14,093 |
| 2015 | $17.17631 | $15.66860 | 10,593 |
| 2016 | $15.66860 | $18.28863 | 7,376 |
| 2017 | $18.28863 | $20.78677 | 5,989 |
| 2018 | $20.78677 | $18.43346 | 5,889 |
| VanEck VIP Emerging Markets Fund - Initial Class | |||
| 2009 | $10.00421 | $20.94330 | 10,954 |
| 2010 | $20.94330 | $26.08693 | 7,376 |
| 2011 | $26.08693 | $19.02428 | 5,823 |
| 2012 | $19.02428 | $24.24968 | 5,143 |
| 2013 | $24.24968 | $26.67565 | 4,678 |
| 2014 | $26.67565 | $26.08670 | 2,040 |
| 2015 | $26.08670 | $22.03245 | 1,431 |
| 2016 | $22.03245 | $21.65916 | 1,281 |
| 2017 | $21.65916 | $32.12792 | 1,536 |
| 2018 | $32.12792 | $24.13880 | 1,527 |
| VanEck VIP Global Hard Assets Fund - Initial Class | |||
| 2009 | $17.05472 | $26.38348 | 36,520 |
| 2010 | $26.38348 | $33.48365 | 30,164 |
| 2011 | $33.48365 | $27.47245 | 22,360 |
| 2012 | $27.47245 | $27.89019 | 21,376 |
| 2013 | $27.89019 | $30.27322 | 19,427 |
| 2014 | $30.27322 | $24.04858 | 17,441 |
| 2015 | $24.04858 | $15.71645 | 12,344 |
| 2016 | $15.71645 | $22.18076 | 15,845 |
| 2017 | $22.18076 | $21.41394 | 12,606 |
| 2018 | $21.41394 | $15.08154 | 10,438 |
| For the Year | Accumulation Unit Value | Accumulation Unit Value | Number of Accumulation Units |
| Ending December 31 | At Beginning of Period | At End of Period | Outstanding at End of Period |
| Western Asset Variable Global High Yield Bond Portfolio - Class II | |||
| 2009 | $7.92367 | $12.04912 | 33,607 |
| 2010 | $12.04912 | $13.57115 | 22,444 |
| 2011 | $13.57115 | $13.49685 | 19,914 |
| 2012 | $13.49685 | $15.64899 | 13,535 |
| 2013 | $15.64899 | $16.29818 | 11,196 |
| 2014 | $16.29818 | $15.76321 | 8,819 |
| 2015 | $15.76321 | $14.53851 | 8,273 |
| 2016 | $14.53851 | $16.47024 | 4,444 |
| 2017 | $16.47024 | $17.53861 | 3,016 |
| 2018 | $17.53861 | $16.50535 | 2,834 |
| * The Accumulation Unit Values in this table reflect a mortality and expense risk charge of 1.70% and an administrative expense charge of 0.10%. | |||
| CONSULTANT SOLUTIONS VARIABLE ANNUITIES: LBL Consultant Solution Select Contracts - PROSPECTUS | |||
| ACCUMULATION UNIT VALUE AND NUMBER OF ACCUMULATION UNITS OUTSTANDING FOR EACH VARIABLE | |||
| SUB-ACCOUNT* | |||
| High | |||
| Mortality & Expense = 2.60 | |||
| For the Year | Accumulation Unit Value | Accumulation Unit Value | Number of Accumulation Units |
| Ending December 31 | At Beginning of Period | At End of Period | Outstanding at End of Period |
| Alger Capital Appreciation Portfolio - Class S | |||
| 2009 | $8.95496 | $13.12985 | 0 |
| 2010 | $13.12985 | $14.51654 | 0 |
| 2011 | $14.51654 | $14.03681 | 0 |
| 2012 | $14.03681 | $16.10047 | 0 |
| 2013 | $16.10047 | $21.11622 | 0 |
| 2014 | $21.11622 | $23.30885 | 0 |
| 2015 | $23.30885 | $24.02079 | 0 |
| 2016 | $24.02079 | $23.42557 | 0 |
| 2017 | $23.42557 | $29.80627 | 0 |
| 2018 | $29.80627 | $28.89567 | 0 |
| Alger Large Cap Growth Portfolio - Class S | |||
| 2009 | $6.73265 | $9.64625 | 0 |
| 2010 | $9.64625 | $10.59737 | 0 |
| 2011 | $10.59737 | $10.23319 | 0 |
| 2012 | $10.23319 | $10.88997 | 0 |
| 2013 | $10.88997 | $14.25973 | 0 |
| 2014 | $14.25973 | $15.33994 | 0 |
| 2015 | $15.33994 | $15.12767 | 0 |
| 2016 | $15.12767 | $14.54318 | 0 |
| 2017 | $14.54318 | $18.11064 | 0 |
| 2018 | $18.11064 | $17.92659 | 0 |
| Alger Mid Cap Growth Portfolio - Class S | |||
| 2009 | $6.17233 | $9.08740 | 0 |
| 2010 | $9.08740 | $10.51196 | 0 |
| 2011 | $10.51196 | $9.34988 | 0 |
| 2012 | $9.34988 | $10.52430 | 0 |
| 2013 | $10.52430 | $13.86565 | 0 |
| 2014 | $13.86565 | $14.51432 | 0 |
| 2015 | $14.51432 | $13.85487 | 0 |
| 2016 | $13.85487 | $13.54688 | 0 |
| 2017 | $13.54688 | $17.03178 | 0 |
| 2018 | $17.03178 | $15.28194 | 0 |
| ClearBridge Variable Large Cap Value Portfolio-Class I | |||
| 2009 | $6.04921 | $7.32797 | 0 |
| 2010 | $7.32797 | $7.80506 | 0 |
| 2011 | $7.80506 | $7.97091 | 0 |
| 2012 | $7.97091 | $9.03521 | 0 |
| 2013 | $9.03521 | $11.63715 | 0 |
| 2014 | $11.63715 | $12.64871 | 0 |
| 2015 | $12.64871 | $11.95420 | 0 |
| 2016 | $11.95420 | $13.14467 | 0 |
| 2017 | $13.14467 | $14.69070 | 0 |
| 2018 | $14.69070 | $13.02607 | 0 |
| For the Year | Accumulation Unit Value | Accumulation Unit Value | Number of Accumulation Units |
| Ending December 31 | At Beginning of Period | At End of Period | Outstanding at End of Period |
| Fidelity® VIP Asset Manager Portfolio - Service Class 2 | |||
| 2009 | $8.23274 | $10.31445 | 0 |
| 2010 | $10.31445 | $11.43753 | 0 |
| 2011 | $11.43753 | $10.81597 | 0 |
| 2012 | $10.81597 | $11.81086 | 0 |
| 2013 | $11.81086 | $13.25485 | 0 |
| 2014 | $13.25485 | $13.61126 | 0 |
| 2015 | $13.61126 | $13.23574 | 0 |
| 2016 | $13.23574 | $13.24507 | 0 |
| 2017 | $13.24507 | $14.66198 | 0 |
| 2018 | $14.66198 | $13.46573 | 0 |
| Fidelity® VIP Contrafund® Portfolio - Service Class 2 | |||
| 2009 | $8.80854 | $11.61060 | 0 |
| 2010 | $11.61060 | $13.20968 | 0 |
| 2011 | $13.20968 | $12.49585 | 0 |
| 2012 | $12.49585 | $14.12009 | 0 |
| 2013 | $14.12009 | $17.99173 | 0 |
| 2014 | $17.99173 | $19.54624 | 0 |
| 2015 | $19.54624 | $19.09747 | 0 |
| 2016 | $19.09747 | $20.01978 | 0 |
| 2017 | $20.01978 | $23.68996 | 0 |
| 2018 | $23.68996 | $21.52059 | 0 |
| Fidelity® VIP Equity-Income Portfolio - Service Class 2 | |||
| 2009 | $7.03531 | $8.89096 | 0 |
| 2010 | $8.89096 | $9.94161 | 0 |
| 2011 | $9.94161 | $9.73706 | 0 |
| 2012 | $9.73706 | $11.08934 | 0 |
| 2013 | $11.08934 | $13.79270 | 0 |
| 2014 | $13.79270 | $14.55829 | 0 |
| 2015 | $14.55829 | $13.56478 | 0 |
| 2016 | $13.56478 | $15.53714 | 0 |
| 2017 | $15.53714 | $17.03402 | 0 |
| 2018 | $17.03402 | $15.15969 | 0 |
| Fidelity® VIP Government Money Market Portfolio - Initial Class | |||
| 2016 | $10.00000 | $9.91891 | 0 |
| 2017 | $9.91891 | $9.71840 | 0 |
| 2018 | $9.71840 | $9.61270 | 0 |
| Fidelity® VIP Government Money Market Portfolio - Service Class 2 | |||
| 2009 | $10.23015 | $10.00118 | 0 |
| 2010 | $10.00118 | $9.73825 | 0 |
| 2011 | $9.73825 | $9.47698 | 0 |
| 2012 | $9.47698 | $9.22133 | 0 |
| 2013 | $9.22133 | $8.97325 | 0 |
| 2014 | $8.97325 | $8.73185 | 0 |
| 2015 | $8.73185 | $8.49693 | 0 |
| 2016 | $8.49693 | $8.26928 | 0 |
| 2017 | $8.26928 | $8.08199 | 0 |
| 2018 | $8.08199 | $7.97409 | 0 |
| For the Year | Accumulation Unit Value | Accumulation Unit Value | Number of Accumulation Units |
| Ending December 31 | At Beginning of Period | At End of Period | Outstanding at End of Period |
| Fidelity® VIP Growth Portfolio - Service Class 2 | |||
| 2009 | $6.51445 | $8.11115 | 0 |
| 2010 | $8.11115 | $9.77566 | 0 |
| 2011 | $9.77566 | $9.50918 | 0 |
| 2012 | $9.50918 | $10.58443 | 0 |
| 2013 | $10.58443 | $14.00646 | 0 |
| 2014 | $14.00646 | $15.12919 | 0 |
| 2015 | $15.12919 | $15.73710 | 0 |
| 2016 | $15.73710 | $15.39756 | 0 |
| 2017 | $15.39756 | $20.20292 | 0 |
| 2018 | $20.20292 | $19.57328 | 0 |
| Fidelity® VIP Index 500 Portfolio - Service Class 2 | |||
| 2009 | $7.53270 | $9.25701 | 0 |
| 2010 | $9.25701 | $10.33398 | 0 |
| 2011 | $10.33398 | $10.23496 | 0 |
| 2012 | $10.23496 | $11.51464 | 0 |
| 2013 | $11.51464 | $14.77899 | 0 |
| 2014 | $14.77899 | $16.29088 | 0 |
| 2015 | $16.29088 | $16.02263 | 0 |
| 2016 | $16.02263 | $17.39702 | 0 |
| 2017 | $17.39702 | $20.55583 | 0 |
| 2018 | $20.55583 | $19.05542 | 0 |
| Fidelity® VIP Investment Grade Bond Portfolio - Service Class 2 | |||
| 2009 | $9.64054 | $10.83139 | 0 |
| 2010 | $10.83139 | $11.33448 | 0 |
| 2011 | $11.33448 | $11.80527 | 0 |
| 2012 | $11.80527 | $12.12941 | 0 |
| 2013 | $12.12941 | $11.55785 | 0 |
| 2014 | $11.55785 | $11.87759 | 0 |
| 2015 | $11.87759 | $11.45867 | 0 |
| 2016 | $11.45867 | $11.64943 | 0 |
| 2017 | $11.64943 | $11.79005 | 0 |
| 2018 | $11.79005 | $11.38199 | 0 |
| Fidelity® VIP Overseas Portfolio - Service Class 2 | |||
| 2009 | $8.87842 | $10.90373 | 0 |
| 2010 | $10.90373 | $11.97078 | 0 |
| 2011 | $11.97078 | $9.62814 | 0 |
| 2012 | $9.62814 | $11.27663 | 0 |
| 2013 | $11.27663 | $14.28237 | 0 |
| 2014 | $14.28237 | $12.74364 | 0 |
| 2015 | $12.74364 | $12.80825 | 0 |
| 2016 | $12.80825 | $11.80673 | 0 |
| 2017 | $11.80673 | $14.93654 | 0 |
| 2018 | $14.93654 | $12.34536 | 0 |
| Goldman Sachs VIT Mid Cap Value Fund - Institutional | |||
| 2015 | $10.00000 | $8.65774 | 0 |
| 2016 | $8.65774 | $9.56457 | 0 |
| 2017 | $9.56457 | $10.33890 | 0 |
| 2018 | $10.33890 | $9.00793 | 0 |
| For the Year | Accumulation Unit Value | Accumulation Unit Value | Number of Accumulation Units |
| Ending December 31 | At Beginning of Period | At End of Period | Outstanding at End of Period |
| Guggenheim VIF Long Short Equity Fund | |||
| 2009 | $8.64332 | $10.70541 | 0 |
| 2010 | $10.70541 | $11.58417 | 0 |
| 2011 | $11.58417 | $10.53229 | 0 |
| 2012 | $10.53229 | $10.70130 | 0 |
| 2013 | $10.70130 | $12.23024 | 0 |
| 2014 | $12.23024 | $12.23261 | 0 |
| 2015 | $12.23261 | $12.05234 | 0 |
| 2016 | $12.05234 | $11.80465 | 0 |
| 2017 | $11.80465 | $13.19501 | 0 |
| 2018 | $13.19501 | $11.17839 | 0 |
| Invesco V.I. American Franchise Fund - Series II | |||
| 2012 | $10.00000 | $8.65430 | 0 |
| 2013 | $8.65430 | $11.77186 | 0 |
| 2014 | $11.77186 | $12.38966 | 0 |
| 2015 | $12.38966 | $12.62775 | 0 |
| 2016 | $12.62775 | $12.53558 | 0 |
| 2017 | $12.53558 | $15.49740 | 0 |
| 2018 | $15.49740 | $14.49291 | 0 |
| Invesco V.I. Core Equity Fund - Series II | |||
| 2009 | $7.61342 | $9.48077 | 0 |
| 2010 | $9.48077 | $10.07815 | 0 |
| 2011 | $10.07815 | $9.77780 | 0 |
| 2012 | $9.77780 | $10.80828 | 0 |
| 2013 | $10.80828 | $13.55965 | 0 |
| 2014 | $13.55965 | $14.22876 | 0 |
| 2015 | $14.22876 | $13.01346 | 0 |
| 2016 | $13.01346 | $13.93183 | 0 |
| 2017 | $13.93183 | $15.30479 | 0 |
| 2018 | $15.30479 | $13.46084 | 0 |
| Invesco V.I. Government Securities Fund - Series II | |||
| 2011 | $10.00000 | $10.95396 | 0 |
| 2012 | $10.95396 | $10.89393 | 0 |
| 2013 | $10.89393 | $10.29723 | 0 |
| 2014 | $10.29723 | $10.40811 | 0 |
| 2015 | $10.40811 | $10.13326 | 0 |
| 2016 | $10.13326 | $9.95921 | 0 |
| 2017 | $9.95921 | $9.85923 | 0 |
| 2018 | $9.85923 | $9.62178 | 0 |
| Invesco V.I. Growth and Income Fund - Series II | |||
| 2009 | $8.67521 | $10.47602 | 0 |
| 2010 | $10.47602 | $11.43612 | 0 |
| 2011 | $11.43612 | $10.87627 | 0 |
| 2012 | $10.87627 | $12.10023 | 0 |
| 2013 | $12.10023 | $15.74942 | 0 |
| 2014 | $15.74942 | $16.85130 | 0 |
| 2015 | $16.85130 | $15.85304 | 0 |
| 2016 | $15.85304 | $18.42351 | 0 |
| 2017 | $18.42351 | $20.44709 | 0 |
| 2018 | $20.44709 | $17.19159 | 0 |
| For the Year | Accumulation Unit Value | Accumulation Unit Value | Number of Accumulation Units |
| Ending December 31 | At Beginning of Period | At End of Period | Outstanding at End of Period |
| Invesco V.I. Mid Cap Core Equity Fund - Series II | |||
| 2009 | $9.02461 | $11.40251 | 0 |
| 2010 | $11.40251 | $12.62354 | 0 |
| 2011 | $12.62354 | $11.48441 | 0 |
| 2012 | $11.48441 | $12.36017 | 0 |
| 2013 | $12.36017 | $15.44989 | 0 |
| 2014 | $15.44989 | $15.65951 | 0 |
| 2015 | $15.65951 | $14.58441 | 0 |
| 2016 | $14.58441 | $16.05974 | 0 |
| 2017 | $16.05974 | $17.92002 | 0 |
| 2018 | $17.92002 | $15.41421 | 0 |
| Invesco V.I. Mid Cap Growth Fund - Series II | |||
| 2009 | $7.16852 | $10.90711 | 0 |
| 2010 | $10.90711 | $13.50749 | 0 |
| 2011 | $13.50749 | $11.91309 | 0 |
| 2012 | $11.91309 | $12.93830 | 0 |
| 2013 | $12.93830 | $17.19725 | 0 |
| 2014 | $17.19725 | $18.01990 | 0 |
| 2015 | $18.01990 | $17.71597 | 0 |
| 2016 | $17.71597 | $17.33757 | 0 |
| 2017 | $17.33757 | $20.60954 | 0 |
| 2018 | $20.60954 | $18.87579 | 0 |
| Invesco V.I. Value Opportunities Fund - Series II | |||
| 2009 | $5.52057 | $7.93580 | 0 |
| 2010 | $7.93580 | $8.25794 | 0 |
| 2011 | $8.25794 | $7.76258 | 0 |
| 2012 | $7.76258 | $8.88595 | 0 |
| 2013 | $8.88595 | $11.52288 | 0 |
| 2014 | $11.52288 | $11.92769 | 0 |
| 2015 | $11.92769 | $10.36891 | 0 |
| 2016 | $10.36891 | $11.89800 | 0 |
| 2017 | $11.89800 | $13.57447 | 0 |
| 2018 | $13.57447 | $10.65265 | 0 |
| Janus Henderson Balanced Portfolio - Service Shares | |||
| 2009 | $10.34931 | $12.64616 | 0 |
| 2010 | $12.64616 | $13.30402 | 0 |
| 2011 | $13.30402 | $13.12101 | 0 |
| 2012 | $13.12101 | $14.47339 | 0 |
| 2013 | $14.47339 | $16.87154 | 0 |
| 2014 | $16.87154 | $17.76845 | 0 |
| 2015 | $17.76845 | $17.35967 | 0 |
| 2016 | $17.35967 | $17.62261 | 0 |
| 2017 | $17.62261 | $20.26116 | 0 |
| 2018 | $20.26116 | $19.80008 | 0 |
| Janus Henderson Forty Portfolio - Service Shares | |||
| 2009 | $9.50469 | $13.50371 | 0 |
| 2010 | $13.50371 | $13.99069 | 0 |
| 2011 | $13.99069 | $12.66863 | 0 |
| 2012 | $12.66863 | $15.26671 | 0 |
| 2013 | $15.26671 | $19.44274 | 0 |
| 2014 | $19.44274 | $20.51973 | 0 |
| 2015 | $20.51973 | $22.34914 | 0 |
| 2016 | $22.34914 | $22.16979 | 0 |
| 2017 | $22.16979 | $28.04851 | 0 |
| 2018 | $28.04851 | $27.76146 | 0 |
| For the Year | Accumulation Unit Value | Accumulation Unit Value | Number of Accumulation Units |
| Ending December 31 | At Beginning of Period | At End of Period | Outstanding at End of Period |
| Janus Henderson Mid Cap Value Portfolio - Service Shares | |||
| 2009 | $9.78509 | $12.65516 | 0 |
| 2010 | $12.65516 | $14.20564 | 0 |
| 2011 | $14.20564 | $13.41065 | 0 |
| 2012 | $13.41065 | $14.45582 | 0 |
| 2013 | $14.45582 | $17.69592 | 0 |
| 2014 | $17.69592 | $18.67121 | 0 |
| 2015 | $18.67121 | $17.49662 | 0 |
| 2016 | $17.49662 | $20.22018 | 0 |
| 2017 | $20.22018 | $22.36141 | 0 |
| 2018 | $22.36141 | $18.75129 | 0 |
| Janus Henderson Overseas Portfolio - Service Shares | |||
| 2009 | $6.61060 | $11.51824 | 0 |
| 2010 | $11.51824 | $14.01153 | 0 |
| 2011 | $14.01153 | $9.22462 | 0 |
| 2012 | $9.22462 | $10.15789 | 0 |
| 2013 | $10.15789 | $11.29527 | 0 |
| 2014 | $11.29527 | $9.66014 | 0 |
| 2015 | $9.66014 | $8.57159 | 0 |
| 2016 | $8.57159 | $7.78127 | 0 |
| 2017 | $7.78127 | $9.90586 | 0 |
| 2018 | $9.90586 | $8.17972 | 0 |
| MFS® Investors Growth Stock Portfolio - Service Class | |||
| 2015 | $10.00000 | $15.74695 | 0 |
| 2016 | $15.74695 | $16.21811 | 0 |
| 2017 | $16.21811 | $20.21950 | 0 |
| 2018 | $20.21950 | $19.78768 | 0 |
| MFS® Investors Trust Series - Service Class | |||
| 2009 | $8.47482 | $10.43598 | 0 |
| 2010 | $10.43598 | $11.25921 | 0 |
| 2011 | $11.25921 | $10.69091 | 0 |
| 2012 | $10.69091 | $12.36056 | 0 |
| 2013 | $12.36056 | $15.84419 | 0 |
| 2014 | $15.84419 | $17.06766 | 0 |
| 2015 | $17.06766 | $16.59905 | 0 |
| 2016 | $16.59905 | $17.49525 | 0 |
| 2017 | $17.49525 | $20.94795 | 0 |
| 2018 | $20.94795 | $19.21974 | 0 |
| MFS® New Discovery Series - Service Class | |||
| 2009 | $6.45612 | $10.23449 | 0 |
| 2010 | $10.23449 | $13.53761 | 0 |
| 2011 | $13.53761 | $11.79031 | 0 |
| 2012 | $11.79031 | $13.86850 | 0 |
| 2013 | $13.86850 | $19.05651 | 0 |
| 2014 | $19.05651 | $17.15216 | 0 |
| 2015 | $17.15216 | $16.33087 | 0 |
| 2016 | $16.33087 | $17.28940 | 0 |
| 2017 | $17.28940 | $21.25739 | 0 |
| 2018 | $21.25739 | $20.32899 | 0 |
| For the Year | Accumulation Unit Value | Accumulation Unit Value | Number of Accumulation Units |
| Ending December 31 | At Beginning of Period | At End of Period | Outstanding at End of Period |
| MFS® Total Return Series - Service Class | |||
| 2009 | $8.82493 | $10.10863 | 0 |
| 2010 | $10.10863 | $10.78333 | 0 |
| 2011 | $10.78333 | $10.65916 | 0 |
| 2012 | $10.65916 | $11.50464 | 0 |
| 2013 | $11.50464 | $13.29171 | 0 |
| 2014 | $13.29171 | $13.99805 | 0 |
| 2015 | $13.99805 | $13.54116 | 0 |
| 2016 | $13.54116 | $14.33817 | 0 |
| 2017 | $14.33817 | $15.63233 | 0 |
| 2018 | $15.63233 | $14.31783 | 0 |
| MFS® Value Series - Service Class | |||
| 2009 | $9.18301 | $10.94112 | 0 |
| 2010 | $10.94112 | $11.84001 | 0 |
| 2011 | $11.84001 | $11.46725 | 0 |
| 2012 | $11.46725 | $12.92895 | 0 |
| 2013 | $12.92895 | $17.05812 | 0 |
| 2014 | $17.05812 | $18.29094 | 0 |
| 2015 | $18.29094 | $17.63085 | 0 |
| 2016 | $17.63085 | $19.51961 | 0 |
| 2017 | $19.51961 | $22.29276 | 0 |
| 2018 | $22.29276 | $19.44508 | 0 |
| MFS® VIT II High Yield - Service Class | |||
| 2013 | $10.00000 | $14.02727 | 0 |
| 2014 | $14.02727 | $13.99436 | 0 |
| 2015 | $13.99436 | $13.01433 | 0 |
| 2016 | $13.01433 | $14.39201 | 0 |
| 2017 | $14.39201 | $14.89039 | 0 |
| 2018 | $14.89039 | $14.01958 | 0 |
| Morgan Stanley VIF Growth Portfolio, Class II | |||
| 2009 | $6.78917 | $10.90939 | 0 |
| 2010 | $10.90939 | $13.01536 | 0 |
| 2011 | $13.01536 | $12.27958 | 0 |
| 2012 | $12.27958 | $13.62623 | 0 |
| 2013 | $13.62623 | $19.58611 | 0 |
| 2014 | $19.58611 | $20.21769 | 0 |
| 2015 | $20.21769 | $22.02623 | 0 |
| 2016 | $22.02623 | $21.02118 | 0 |
| 2017 | $21.02118 | $29.21938 | 0 |
| 2018 | $29.21938 | $30.50636 | 0 |
| Morgan Stanley VIF U.S. Real Estate Portfolio, Class II | |||
| 2009 | $9.36953 | $11.71388 | 0 |
| 2010 | $11.71388 | $14.76359 | 0 |
| 2011 | $14.76359 | $15.17926 | 0 |
| 2012 | $15.17926 | $17.07564 | 0 |
| 2013 | $17.07564 | $16.90565 | 0 |
| 2014 | $16.90565 | $21.29013 | 0 |
| 2015 | $21.29013 | $21.11356 | 0 |
| 2016 | $21.11356 | $21.89059 | 0 |
| 2017 | $21.89059 | $21.91573 | 0 |
| 2018 | $21.91573 | $19.62531 | 0 |
| For the Year | Accumulation Unit Value | Accumulation Unit Value | Number of Accumulation Units |
| Ending December 31 | At Beginning of Period | At End of Period | Outstanding at End of Period |
| Oppenheimer Discovery Mid Cap Growth Fund/VA - Service Shares | |||
| 2009 | $5.91668 | $7.61419 | 0 |
| 2010 | $7.61419 | $9.42120 | 0 |
| 2011 | $9.42120 | $9.24399 | 0 |
| 2012 | $9.24399 | $10.44769 | 0 |
| 2013 | $10.44769 | $13.78732 | 0 |
| 2014 | $13.78732 | $14.15612 | 0 |
| 2015 | $14.15612 | $14.64823 | 0 |
| 2016 | $14.64823 | $14.55017 | 0 |
| 2017 | $14.55017 | $18.19001 | 0 |
| 2018 | $18.19001 | $16.58367 | 0 |
| Oppenheimer Global Fund/VA - Service Shares | |||
| 2009 | $8.54248 | $11.58290 | 0 |
| 2010 | $11.58290 | $13.04026 | 0 |
| 2011 | $13.04026 | $11.60673 | 0 |
| 2012 | $11.60673 | $13.65860 | 0 |
| 2013 | $13.65860 | $16.87713 | 0 |
| 2014 | $16.87713 | $16.75905 | 0 |
| 2015 | $16.75905 | $16.90537 | 0 |
| 2016 | $16.90537 | $16.42430 | 0 |
| 2017 | $16.42430 | $21.79038 | 0 |
| 2018 | $21.79038 | $18.36292 | 0 |
| Oppenheimer Main Street Small Cap Fund/VA - Service Shares | |||
| 2009 | $7.70756 | $10.26538 | 0 |
| 2010 | $10.26538 | $12.29145 | 0 |
| 2011 | $12.29145 | $11.67520 | 0 |
| 2012 | $11.67520 | $13.36650 | 0 |
| 2013 | $13.36650 | $18.28931 | 0 |
| 2014 | $18.28931 | $19.86953 | 0 |
| 2015 | $19.86953 | $18.15485 | 0 |
| 2016 | $18.15485 | $20.78812 | 0 |
| 2017 | $20.78812 | $23.04581 | 0 |
| 2018 | $23.04581 | $20.06110 | 0 |
| PIMCO International Bond (U.S. Dollar-Hedged) - Administrative Shares | |||
| formerly,PIMCO Foreign Bond Portfolio (U.S. Dollar-Hedged) - Administrative Shares | |||
| 2009 | $9.98892 | $11.23855 | 0 |
| 2010 | $11.23855 | $11.86463 | 0 |
| 2011 | $11.86463 | $12.32623 | 0 |
| 2012 | $12.32623 | $13.29361 | 0 |
| 2013 | $13.29361 | $12.99954 | 0 |
| 2014 | $12.99954 | $14.06015 | 0 |
| 2015 | $14.06015 | $13.72047 | 0 |
| 2016 | $13.72047 | $14.21567 | 0 |
| 2017 | $14.21567 | $14.21725 | 0 |
| 2018 | $14.21725 | $14.12751 | 0 |
| PIMCO Real Return Portfolio - Administrative Shares | |||
| 2009 | $9.92084 | $11.42877 | 0 |
| 2010 | $11.42877 | $12.02223 | 0 |
| 2011 | $12.02223 | $13.06427 | 0 |
| 2012 | $13.06427 | $13.82355 | 0 |
| 2013 | $13.82355 | $12.21039 | 0 |
| 2014 | $12.21039 | $12.24801 | 0 |
| 2015 | $12.24801 | $11.59487 | 0 |
| 2016 | $11.59487 | $11.86879 | 0 |
| 2017 | $11.86879 | $11.97297 | 0 |
| 2018 | $11.97297 | $11.39298 | 0 |
| For the Year | Accumulation Unit Value | Accumulation Unit Value | Number of Accumulation Units |
| Ending December 31 | At Beginning of Period | At End of Period | Outstanding at End of Period |
| PIMCO Total Return Portfolio - Administrative Shares | |||
| 2009 | $11.03982 | $12.25350 | 0 |
| 2010 | $12.25350 | $12.89048 | 0 |
| 2011 | $12.89048 | $12.99628 | 0 |
| 2012 | $12.99628 | $13.85731 | 0 |
| 2013 | $13.85731 | $13.21868 | 0 |
| 2014 | $13.21868 | $13.41203 | 0 |
| 2015 | $13.41203 | $13.10845 | 0 |
| 2016 | $13.10845 | $13.09690 | 0 |
| 2017 | $13.09690 | $13.37263 | 0 |
| 2018 | $13.37263 | $12.94295 | 0 |
| T. Rowe Price Blue Chip Growth Portfolio - II | |||
| 2009 | $6.91751 | $9.54370 | 0 |
| 2010 | $9.54370 | $10.77210 | 0 |
| 2011 | $10.77210 | $10.62457 | 0 |
| 2012 | $10.62457 | $12.18804 | 0 |
| 2013 | $12.18804 | $16.70378 | 0 |
| 2014 | $16.70378 | $17.68971 | 0 |
| 2015 | $17.68971 | $19.07063 | 0 |
| 2016 | $19.07063 | $18.65668 | 0 |
| 2017 | $18.65668 | $24.66259 | 0 |
| 2018 | $24.66259 | $24.39364 | 0 |
| T. Rowe Price Equity Income Portfolio - II | |||
| 2009 | $7.94154 | $9.67827 | 0 |
| 2010 | $9.67827 | $10.80546 | 0 |
| 2011 | $10.80546 | $10.40709 | 0 |
| 2012 | $10.40709 | $11.83900 | 0 |
| 2013 | $11.83900 | $14.90695 | 0 |
| 2014 | $14.90695 | $15.53473 | 0 |
| 2015 | $15.53473 | $14.04119 | 0 |
| 2016 | $14.04119 | $16.23935 | 0 |
| 2017 | $16.23935 | $18.29068 | 0 |
| 2018 | $18.29068 | $16.07241 | 0 |
| VanEck VIP Emerging Markets Fund - Initial Class | |||
| 2009 | $9.56185 | $19.83412 | 0 |
| 2010 | $19.83412 | $24.47932 | 0 |
| 2011 | $24.47932 | $17.68833 | 0 |
| 2012 | $17.68833 | $22.33976 | 0 |
| 2013 | $22.33976 | $24.34949 | 0 |
| 2014 | $24.34949 | $23.59354 | 0 |
| 2015 | $23.59354 | $19.74392 | 0 |
| 2016 | $19.74392 | $19.23202 | 0 |
| 2017 | $19.23202 | $28.27001 | 0 |
| 2018 | $28.27001 | $21.04681 | 0 |
| VanEck VIP Global Hard Assets Fund - Initial Class | |||
| 2009 | $16.30085 | $24.98605 | 0 |
| 2010 | $24.98605 | $31.41990 | 0 |
| 2011 | $31.41990 | $25.54314 | 0 |
| 2012 | $25.54314 | $25.69323 | 0 |
| 2013 | $25.69323 | $27.63294 | 0 |
| 2014 | $27.63294 | $21.74956 | 0 |
| 2015 | $21.74956 | $14.08332 | 0 |
| 2016 | $14.08332 | $19.69433 | 0 |
| 2017 | $19.69433 | $18.84150 | 0 |
| 2018 | $18.84150 | $13.14898 | 0 |
| For the Year | Accumulation Unit Value | Accumulation Unit Value | Number of Accumulation Units |
| Ending December 31 | At Beginning of Period | At End of Period | Outstanding at End of Period |
| Western Asset Variable Global High Yield Bond Portfolio - Class II | |||
| 2009 | $7.57341 | $11.41111 | 0 |
| 2010 | $11.41111 | $12.73482 | 0 |
| 2011 | $12.73482 | $12.54932 | 0 |
| 2012 | $12.54932 | $14.41674 | 0 |
| 2013 | $14.41674 | $14.87721 | 0 |
| 2014 | $14.87721 | $14.25699 | 0 |
| 2015 | $14.25699 | $13.02874 | 0 |
| 2016 | $13.02874 | $14.62503 | 0 |
| 2017 | $14.62503 | $15.43285 | 0 |
| 2018 | $15.43285 | $14.39160 | 0 |
| * The Accumulation Unit Values in this table reflect a mortality and expense risk charge of 2.60% and an administrative expense charge of 0.10%. | |||

| ITEM 13. | OTHER EXPENSES OF ISSUANCE AND DISTRIBUTION |
| Registration fees | $ | 0 | ||
| Cost of printing and engraving | $ | 3,519 | ||
| Legal fees | $ | 2,200 | ||
| Accounting fees | $ | 45,045 | ||
| Mailing fees | $ | 2,394 | ||
| ITEM 14. | INDEMNIFICATION OF DIRECTORS AND OFFICERS. |
| ITEM 15. | RECENT SALES OF UNREGISTERED SECURITIES |
| ITEM 16. | EXHIBITS AND FINANCIAL STATEMENT SCHEDULES |
Exh. No. | Description | |
| 1 | Form of Principal Underwriting Agreement. Incorporated herein by reference to Post-Effective Amendment to Form N-4 for Lincoln Benefit Life Variable Annuity Account (File No. 333-50545, 811-07924) filed January 28, 1999. | |
Exh. No. | Description | |
| 1(a) | Amended and Restated Principal Underwriting Agreement by and between Lincoln Benefit Life Company and Allstate Distributors, LLC, effective April 1, 2014. Incorporated herein by reference to Lincoln Benefit Life Company’s Form S-1 Post-Effective Amendment No. 2 to Registration Statement filed on April 4, 2014. (SEC file No. 333-180374) | |
| 3(i) | Amended and Restated Articles of Incorporation of Lincoln Benefit Life Company dated September 26, 2000, as amended by the Articles of Amendment to the Articles of Incorporation of Lincoln Benefit Life Company dated January 21, 2015. Incorporated herein by reference to Exhibit 3(i) to Lincoln Benefit Life Company’s Registration Statement on Form S-1 filed on April 13, 2015 (File No. 333-203376). | |
| 3(ii) | Amended and Restated By-Laws of Lincoln Benefit Life Company effective March 10, 2006. Incorporated herein by reference to Exhibit 3.2 to Lincoln Benefit Life Company’s Quarterly Report on Form 10-Q for the quarter ended March 31, 2006, as filed May 8, 2006. (SEC File No. 333-59765). | |
| 4(a) | Form of Variable Annuity Contract. Incorporated herein by reference to Registration Statement on Form N-4 for Lincoln Benefit Life Variable Annuity Account (File No. 333-82427, 811-07924) filed July 8, 1999. | |
| 4(b) | Form of Application. Incorporated herein by reference to Registration Statement on Form N-4 for Lincoln Benefit Life Variable Annuity Account (File No. 333-82427, 811-07924) filed July 8, 1999. | |
| 5(a) | Opinion and Consent of Counsel regarding legality. Incorporated herein by reference to Post-Effective Amendment to Form S-3 on Form S-1 for Lincoln Benefit Life Variable Annuity Account (SEC File No. 333-88045) filed April 6, 2000. | |
| 5(b) | Opinion and Consent of Counsel regarding legality. Incorporated herein by reference to Registrant’s Form S-3 Registration Statement (SEC File No. 333-158181) dated March 24, 2009. | |
| 5(c) | Opinion and Consent of Counsel regarding legality. (Incorporated by reference to Registrant’s Form S-1 Registration Statement (SEC File No. 333-180371) dated March 27, 2012). | |
| 5(d) | Opinion and Consent of Counsel regarding legality. Incorporated herein by reference to Exhibit 5(d) to Lincoln Benefit Life Company’s Registration Statement on Form S-1 filed on April 13, 2015 (SEC File No. 333-203376). | |
| 5(e) | Opinion and Consent of Counsel regarding legality. Incorporated herein by reference to Exhibit 5(e) of Lincoln Benefit Life Company’s Form S-1 Post-Effective Amendment No. 1 to Registration Statement filed on April 1, 2016 (SEC File No. 333-203376). | |
| 5(f) | Opinion and Consent of Counsel regarding legality. Incorporated herein by reference to Exhibit 5(f) of Lincoln Benefit Life Company’s Form S-1 Post-Effective Amendment No. 2 to Registration Statement filed on April 3, 2017 (SEC File No. 333-203376). | |
| 5(g) | Opinion and Consent of Counsel regarding legality. Incorporated herein by reference to Exhibit 5(g) of Lincoln Benefit Life Company’s Registration Statement on Form S-1 filed on April 2, 2018 (SEC File No. 333-224100). | |
| 5(h) | Opinion and Consent of Counsel regarding legality. Incorporated herein by reference to Exhibit 5(h) of Lincoln Benefit Life Company’s Form S-1 Post-Effective Amendment No. 1 to Registration Statement filed on April 1, 2019 (SEC File No. 333-224100). | |
| 5(i) | Opinion and Consent of Counsel regarding legality. Filed herewith. | |
| 8 | None | |
| 9 | None | |
| 10 | Material Contracts | |
| 10.1 | Administrative Services Agreement between Lincoln Benefit Life Company and Allstate Life Insurance Company effective June 1, 2006. Incorporated herein by reference to Exhibit 10.1 to Lincoln Benefit Life Company’s Quarterly Report on Form 10-Q for the quarter ended June 30, 2006. (SEC File No. 333-59765) | |
| 10.2 | Principal Underwriting Agreement by and among Lincoln Benefit Life Company and Allstate Distributors, LLC (ALFS, Inc., merged with and into Allstate Distributors, LLC effective September 1, 2011) effective November 25, 1998. (Variable Universal Life Account). Incorporated herein by reference to Exhibit 10.6 to Lincoln Benefit Life Company’s Quarterly Report on Form 10-Q for quarter ended June 30, 2002. (SEC File No. 333-59765) | |
| 10.3 | Amended and Restated Principal Underwriting Agreement between Lincoln Benefit Life Company and Allstate Distributors, LLC (ALFS, Inc. merged with and into Allstate Distributors, LLC effective September 1, 2011) effective June 1, 2006. Incorporated herein by reference to Exhibit 10.1 to Lincoln Benefit Life Company’s Current Report on Form 8-K filed December 20, 2007. (SEC File No. 333-59765) | |
Exh. No. | Description | |
| 10.4 | Selling Agreement between Lincoln Benefit Life Company, Allstate Distributors, LLC (ALFS, Inc., f/k/a Allstate Financial Services, Inc., merged with and into Allstate Distributors, LLC effective September 1, 2011) and Allstate Financial Services, LLC (f/k/a LSA Securities, Inc.) effective August 2, 1999. Incorporated herein by reference to Exhibit 10.8 to Allstate Life Insurance Company’s Annual Report on Form 10-K for 2003. (SEC File No. 000-31248) | |
| 10.5 | Coinsurance Agreement between Allstate Life Insurance Company and Lincoln Benefit Life Company, effective December 31, 2001. Incorporated herein by reference to Exhibit 10.11 to Lincoln Benefit Life Company’s Quarterly Report on Form 10-Q for quarter ended June 30, 2002. (SEC File No. 333-59765) | |
| 10.6 | Modified Coinsurance Agreement between Allstate Life Insurance Company and Lincoln Benefit Life Company, effective December 31, 2001. Incorporated herein by reference to Exhibit 10.12 to Lincoln Benefit Life Company’s Quarterly Report on Form 10-Q for quarter ended June 30, 2002. (SEC File No. 333-59765) | |
| 10.7 | Modified Coinsurance Agreement between Allstate Life Insurance Company and Lincoln Benefit Life Company, effective December 31, 2001. Incorporated herein by reference to Exhibit 10.13 to Lincoln Benefit Life Company’s Quarterly Report on Form 10-Q for quarter ended June 30, 2002. (SEC File No. 333-59765) | |
| 10.8 | Administrative Services Agreement between Allstate Distributors, LLC, (ALFS, Inc., merged with and into Allstate Distributors, LLC effective September 1, 2011) Allstate Life Insurance Company, Lincoln Benefit Life Company and Charter National Life Insurance Company effective January 1, 2000. Incorporated herein by reference to Exhibit 10.22 to Lincoln Benefit Life Company’s Annual Report on Form 10-K for the year ended December 31, 2008. (SEC File No. 333-59765) | |
| 10.9 | Assignment & Delegation of Administrative Services Agreements, Underwriting Agreements, and Selling Agreements entered into as of September 1, 2011 between ALFS, Inc., Allstate Life Insurance Company, Allstate Life Insurance Company of New York, Allstate Distributors, LLC, Charter National Life Insurance Company, Intramerica Life Insurance Company, Allstate Financial Services, LLC, and Lincoln Benefit Life Company. Incorporated herein by reference to Exhibit 10.1 to Allstate Life Insurance Company’s Current Report on Form 8-K filed September 1, 2011. (SEC File No. 000-31248) | |
| 10.10 | Reinsurance Agreement between Lincoln Benefit Life Company and Lincoln Benefit Reinsurance Company effective September 30, 2012, Incorporated herein by reference to Exhibit 10.1 to Allstate Life Insurance Company’s Current Report on Form 8-K filed October 3, 2012. (SEC File No. 000-31248) | |
| 10.11 | Recapture Agreement between Allstate Life Insurance Company (“ALIC”) and Lincoln Benefit Life Company (“LBL”), effective September 30, 2012. Incorporated herein by reference to Lincoln Benefit Life Company’s Form S-1 Post-Effective Amendment No. 1 to Registration Statement filed on April 3, 2013. (SEC File No. 333-180374) | |
| 10.12 | Voluntary Separation Agreement and Release by and between Allstate Insurance Company and Anurag Chandra, dated October 17, 2013. Incorporated herein by reference to Exhibit 10.22 of Lincoln Benefit Life Company’s Form S-1 Post-Effective Amendment No. 2 to Registration Statement filed on April 4, 2014. (SEC file No. 333-180374) | |
| 10.13 | Voluntary Separation Agreement and Release by and between Allstate Insurance Company and Lawrence W. Dahl, dated August 1, 2013. Incorporated herein by reference to Exhibit 10.23 of Lincoln Benefit Life Company’s Form S-1 Post-Effective Amendment No. 2 to Registration Statement filed on April 4, 2014. (SEC file No. 333-180374) | |
| 10.14 | Amended and Restated Administrative Services Agreement by and between Lincoln Benefit Life Company and Allstate Life Insurance Company, effective April 1, 2014. Incorporated herein by reference to Exhibit 10.14 of Lincoln Benefit Life Company’s Form S-1 Post-Effective Amendment No. 1 to Registration Statement filed on April 1, 2016 (SEC File No. 333-203376). | |
| 10.15 | Amended and Restated Reinsurance Agreement by and between Lincoln Benefit Life Company and Allstate Life Insurance Company, effective April 1, 2014. Incorporated herein by reference to Exhibit 10.25 of Lincoln Benefit Life Company’s Form S-1 Post-Effective Amendment No. 2 to Registration Statement filed on April 4, 2014. (SEC file No. 333-180374) | |
| 10.16 | Partial Commutation Agreement by and between Allstate Life Insurance Company and Lincoln Benefit Life Company, effective April 1, 2014. Incorporated herein by reference to Exhibit 10.26 of Lincoln Benefit Life Company’s Form S-1 Post-Effective Amendment No. 2 to Registration Statement filed on April 4, 2014. (SEC file No. 333-180374) | |
| 10.17 | Recapture and Termination Agreement between Lincoln Benefit Life Company and Lincoln Benefit Reinsurance Company effective December 8, 2017. Incorporated herein by reference to Exhibit 10.17 of Lincoln Benefit Life Company’s Form S-1 Post-Effective Amendment No. 1 to Registration Statement filed on April 1, 2019 (SEC File No. 333-224100). | |
| 15 | Not applicable. | |
Exh. No. | Description | |
| 16 | Letter re: change in certifying accountant. Incorporated herein by reference to Exhibit 16 of Lincoln Benefit Life Company’s Form S-1 Post-Effective Amendment No. 1 to Registration Statement filed on April 1, 2019 (SEC File No. 333-224100). | |
| 21 | Subsidiaries of the registrant. Incorporated herein by reference to Exhibit 21 to Lincoln Benefit Life Company’s Registration Statement on Form S-1 filed on April 13, 2015 (SEC File No. 333-203376). | |
| 23(a) | Consents of Independent Registered Public Accounting Firms. Filed herewith. | |
| 23(b) | Consents of Independent Registered Public Accounting Firms. Filed herewith. | |
| 24 | Powers of Attorney for Dhiren Jhaveri, Bradley Rosenblatt, Joseph Wieser and Burke Harr. Filed herewith. | |
| 25 | None | |
| 26 | None | |
| 99(a) | Experts. Filed herewith. | |
| 99(b) | Experts. Filed herewith. | |
| 16(b) | Financial statement schedules required by Regulation S-X (17 CFR Part 210) and Item 11(e) of Form S-1 are included in Part I. | |
| ITEM 17. | UNDERTAKINGS. |
Exh. No. | Description | |
| 1 | ||
| 1(a) | ||
| 3(i) | ||
| 3(ii) | ||
| 4(a) | ||
| 4(b) | ||
| 5(a) | ||
| 5(b) | ||
| 5(c) | ||
| 5(d) | ||
| 5(e) | ||
| 5(f) | ||
| 5(g) | ||
| 5(h) | ||
| 5(i) | ||
| 10.1 | ||
| 10.2 | ||
| 10.3 | ||
Exh. No. | Description | |
| 10.4 | ||
| 10.5 | ||
| 10.6 | ||
| 10.7 | ||
| 10.8 | ||
| 10.9 | ||
| 10.10 | ||
| 10.11 | ||
| 10.12 | ||
| 10.13 | ||
| 10.14 | ||
| 10.15 | ||
| 10.16 | ||
| 10.17 | ||
| 16 | ||
Exh. No. | Description | |
| 21 | ||
| 23(a) | ||
| 23(b) | ||
| 24 | ||
| 99(a) | ||
| 99(b) | ||
LINCOLN BENEFIT LIFE COMPANY (REGISTRANT) | ||
| By: | /s/ Carlos Sierra | |
| Carlos Sierra | ||
| Director and President | ||
| SIGNATURE | TITLE |
| *Dhiren Jhaveri | Director |
| Dhiren Jhaveri | |
| *Bradley Rosenblatt | Director |
| Bradley Rosenblatt | |
| *Joseph Wieser | Director |
| Joseph Wieser | |
| *Burke Harr | Director |
| Burke Harr | |
| /s/ Carlos Sierra | Director and President (Principal Executive Officer) |
| Carlos Sierra | |
| /s/ Erik Braun | Chief Financial Officer, Treasurer and Executive Vice President (Principal |
| Erik Braun | Financial Officer and Principal Accounting Officer) |
| *By: /s/ Erik Braun, pursuant to Power of Attorney. | |