 Financial Results Q1
2015  Forward-Looking Statements, Business Environment and Risk Factors This presentation may contain “forward-looking statements” within the meaning of Section 27A of the Securities Act of 1933, as amended, Section 21E of the Securities Exchange Act of 1934, as amended (the “Exchange Act”), and the Private Securities Litigation Reform Act of 1995. In addition, Century Casinos, Inc. (together with its subsidiaries, the “Company”) may make other written and oral communications from time to time that contain such statements. Forward-looking statements include statements as to industry trends and future expectations of the Company and other matters that do not relate strictly to historical facts and are based on certain assumptions by management at the time such statements are made. These statements are often identified by the use of words such as “may,” “will,” “expect,” “believe,” “anticipate,” “intend,” “could,” “estimate,” or “continue,” and similar expressions or variations. These statements are based on the beliefs and assumptions of the management of the Company based on information currently available to management. Such forward-looking statements are subject to risks, uncertainties and other factors that could cause actual results to differ materially from future results expressed or implied by such forward-looking statements. Important factors that could cause actual results to differ materially from the forward-looking statements include, among others, the risks described in the section entitled “Risk Factors” under Item 1A in our Annual Report on Form 10-K for the year ended December 31, 2014. We caution the reader to carefully consider such factors. Furthermore, such forward-looking statements speak only as of the date on which such statements are made. We undertake no obligation to update any forward-looking statements to reflect events or circumstances after the date of such statements. In this presentation the term “USD” refers to US dollars, the term “CAD” refers to Canadian dollars and the term “PLN” refers to Polish zloty. Amounts presented are rounded. As such, rounding differences could occur in period over period changes and percentages reported throughout this presentation.
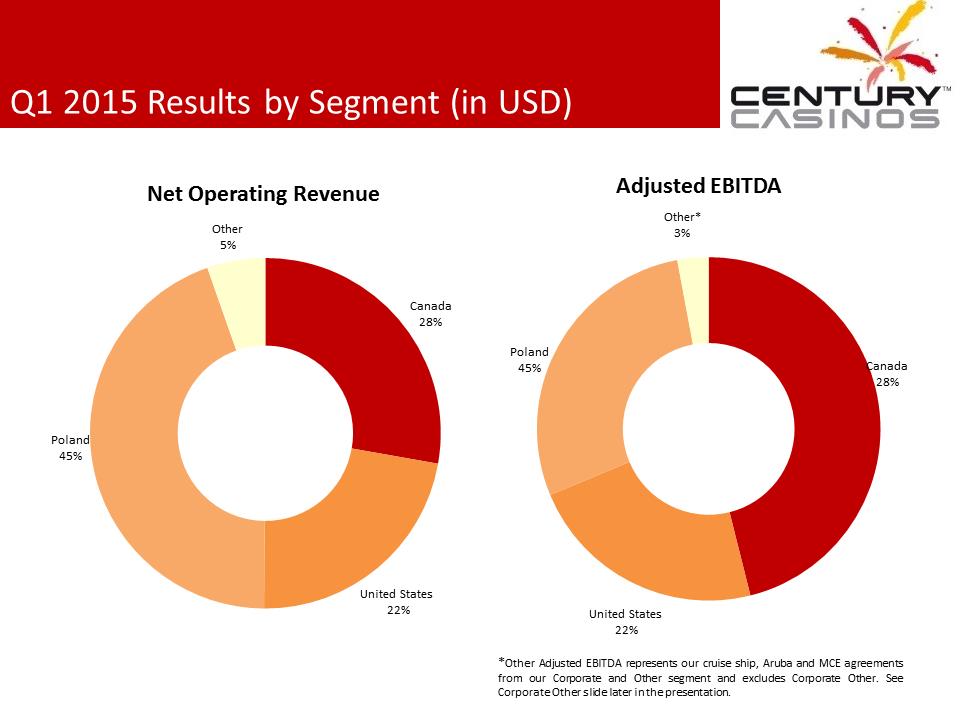 Q1 2015 Results by Segment (in USD) Canada 28% United States 22% Poland 45% Other 5% Net Operating Revenue Canada 28% United States 22% Poland 45% Other* 3% Adjusted EBITDA *Other Adjusted EBITDA represents our cruise ship, Aruba and MCE agreements from our Corporate and Other segment and excludes Corporate Other. See Corporate Other slide later in the presentation.
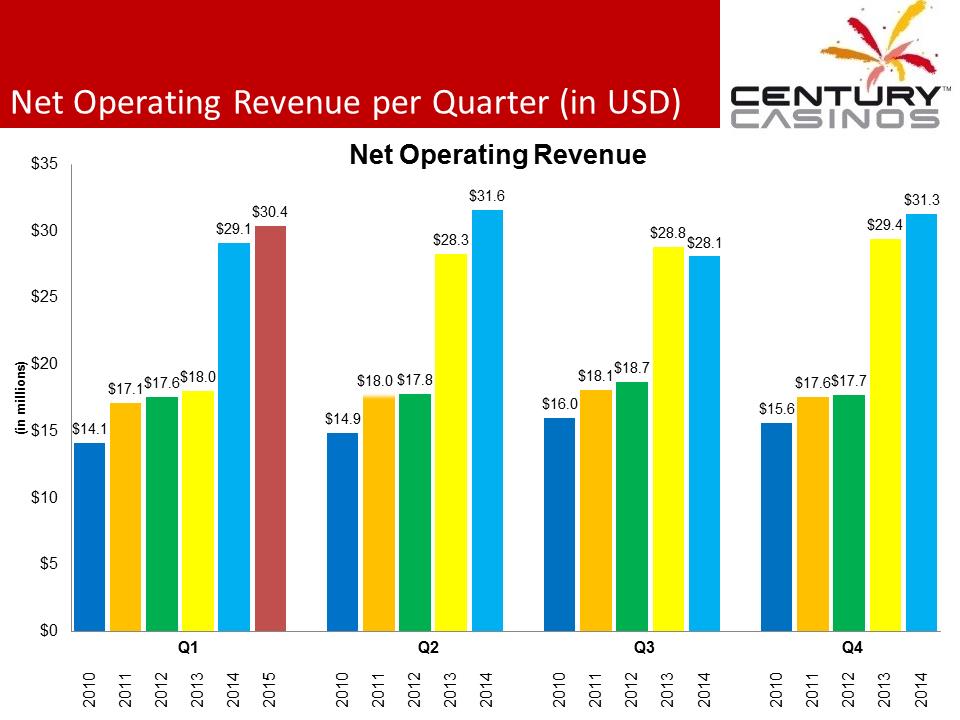 Net Operating Revenue per Quarter (in USD) $14.1 $17.1 $17.6 $18.0 $29.1 $30.4 $14.9 $18.0 $17.8 $28.3 $31.6 $16.0 $18.1 $18.7 $28.8 $28.1 $15.6 $17.6 $17.7 $29.4 $31.3 $0$5$10$15$20$25$30$35201020112012201320142015201020112012201320142010201120122013201420102011201220132014(in millions) Net Operating Revenue Q1 Q2 Q3 Q4
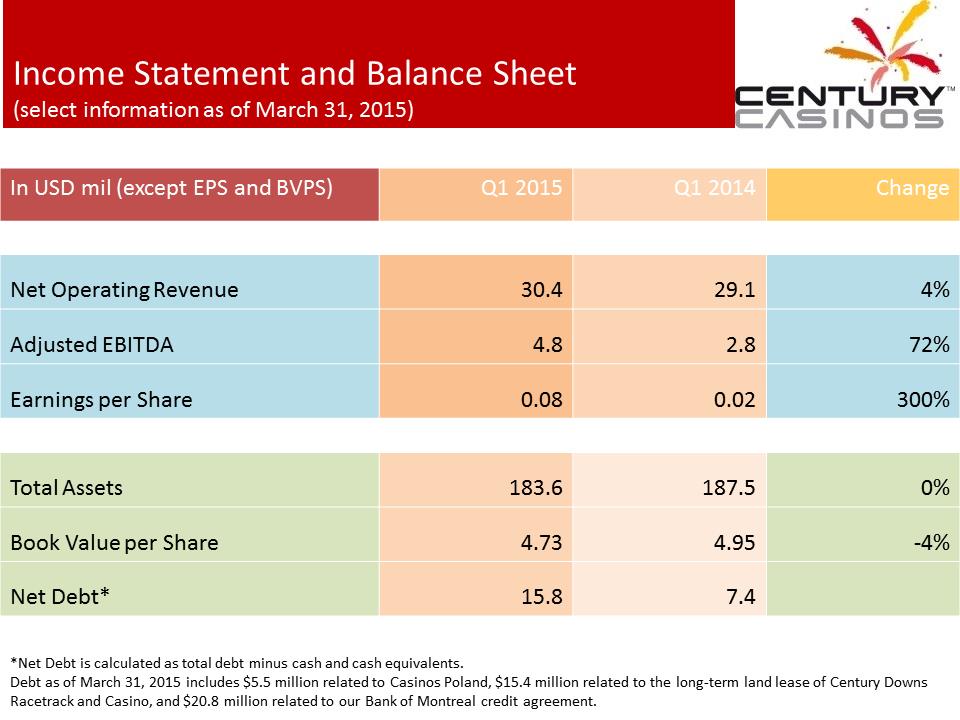 Income Statement and Balance Sheet (select information as of March 31, 2015) In USD mil (except EPS and BVPS) Q1 2015 Q1 2014 Change Net Operating Revenue 30.4 29.1 4% Adjusted EBITDA 4.8 2.8 72% Earnings per Share 0.08 0.02 300% Total Assets 183.6 187.5 0% Book Value per Share 4.73 4.95 -4% Net Debt* 15.8 7.4 *Net Debt is calculated as total debt minus cash and cash equivalents. Debt as of March 31, 2015 includes $5.5 million related to Casinos Poland, $15.4 million related to the long-term land lease of Century Downs Racetrack and Casino, and $20.8 million related to our Bank of Montreal credit agreement.
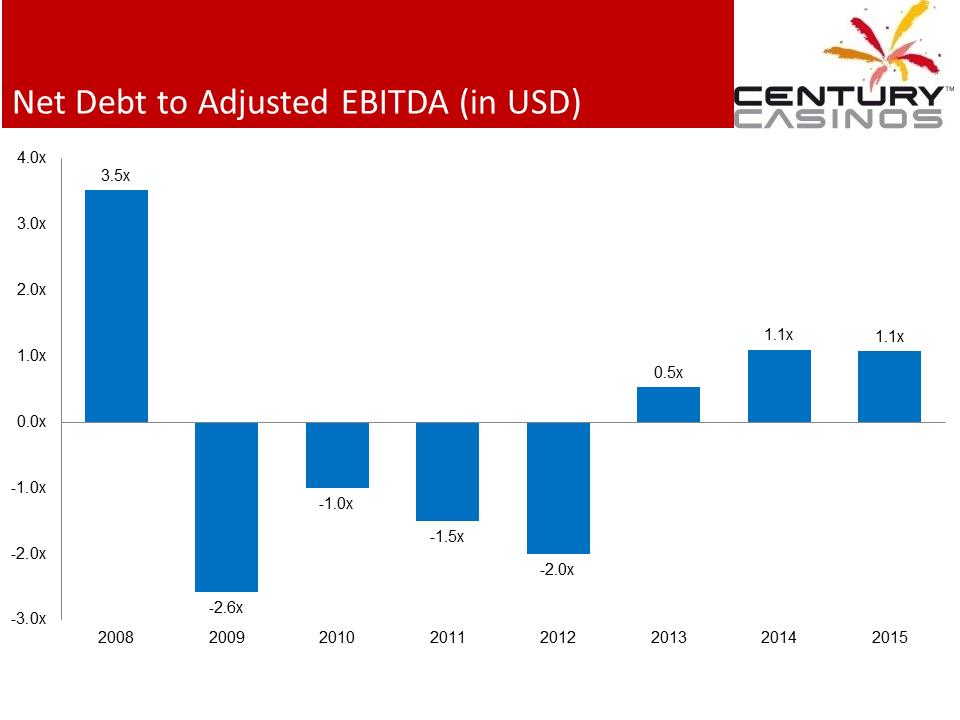 Net Debt to Adjusted EBITDA (in USD) 3.5x -2.6x -1.0x -1.5x -2.0x 0.5x 1.1x 1.1x -3.0x-2.0x-1.0x0.0x1.0x2.0x3.0x4.0x20082009201020112012201320142015
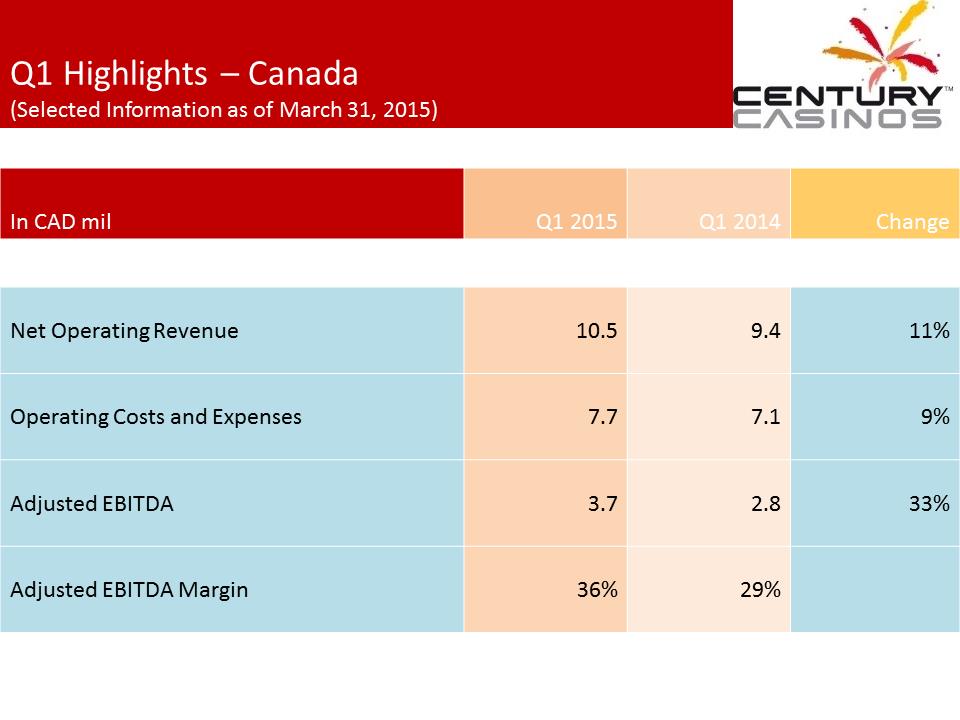 Q1 Highlights – Canada (Selected Information as of March 31, 2015) In CAD mil Q1 2015 Q1 2014 Change Net Operating Revenue 10.5 9.4 11% Operating Costs and Expenses 7.7 7.1 9% Adjusted EBITDA 3.7 2.8 33% Adjusted EBITDA Margin 36% 29%
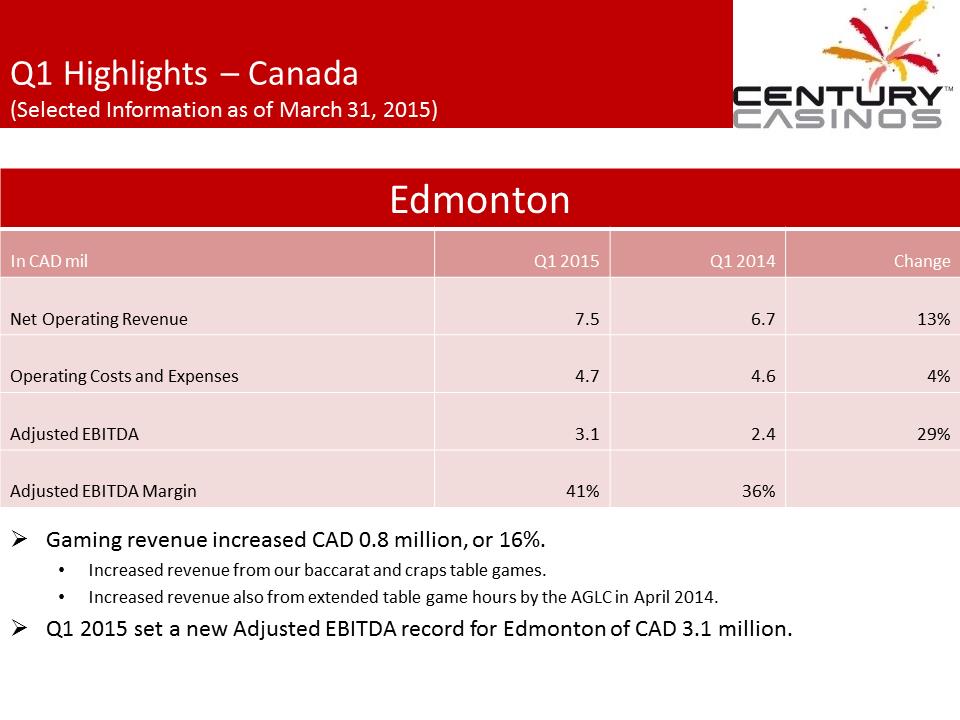 Q1 Highlights – Canada (Selected Information as of March 31, 2015) Edmonton In CAD mil Q1 2015 Q1 2014 Change Net Operating Revenue 7.5 6.7 13% Operating Costs and Expenses 4.7 4.6 4% Adjusted EBITDA 3.1 2.4 29% Adjusted EBITDA Margin 41% 36% .Gaming revenue increased CAD 0.8 million, or 16%. •Increased revenue from our baccarat and craps table games. •Increased revenue also from extended table game hours by the AGLC in April 2014. .Q1 2015 set a new Adjusted EBITDA record for Edmonton of CAD 3.1 million.
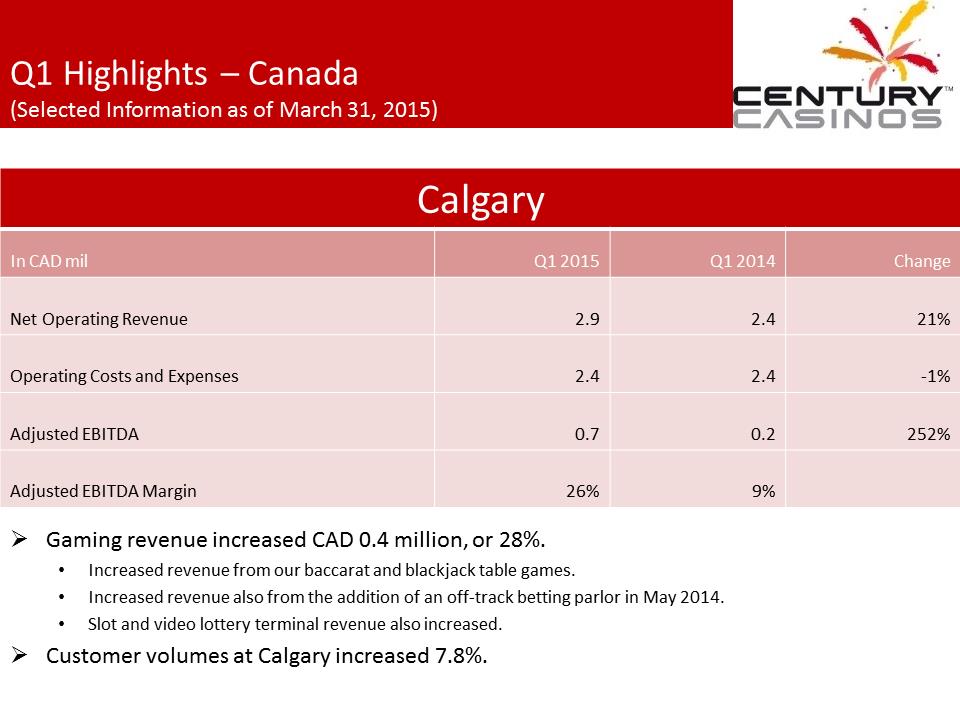 Q1 Highlights – Canada (Selected Information as of March 31, 2015) Calgary In CAD mil Q1 2015 Q1 2014 Change Net Operating Revenue 2.9 2.4 21% Operating Costs and Expenses 2.4 2.4 -1% Adjusted EBITDA 0.7 0.2 252% Adjusted EBITDA Margin 26% 9% .Gaming revenue increased CAD 0.4 million, or 28%. •Increased revenue from our baccarat and blackjack table games. •Increased revenue also from the addition of an off-track betting parlor in May 2014. •Slot and video lottery terminal revenue also increased. .Customer volumes at Calgary increased 7.8%.
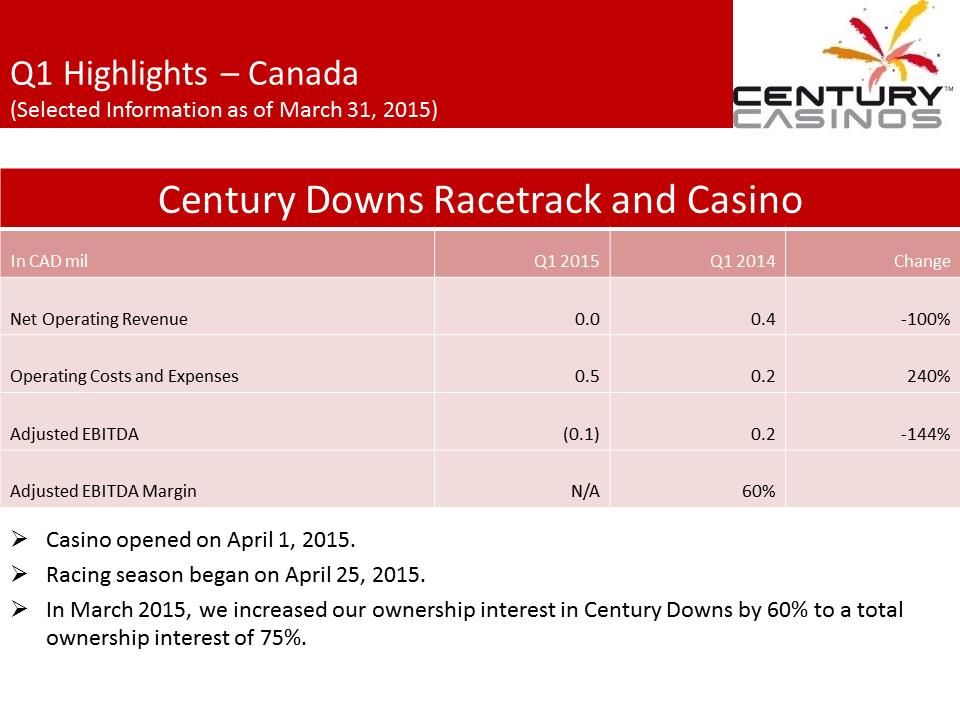 Q1 Highlights – Canada (Selected Information as of March 31, 2015) Century Downs Racetrack and Casino In CAD mil Q1 2015 Q1 2014 Change Net Operating Revenue 0.0 0.4 -100% Operating Costs and Expenses 0.5 0.2 240% Adjusted EBITDA (0.1) 0.2 -144% Adjusted EBITDA Margin N/A 60% .Casino opened on April 1, 2015. .Racing season began on April 25, 2015. .In March 2015, we increased our ownership interest in Century Downs by 60% to a total ownership interest of 75%.
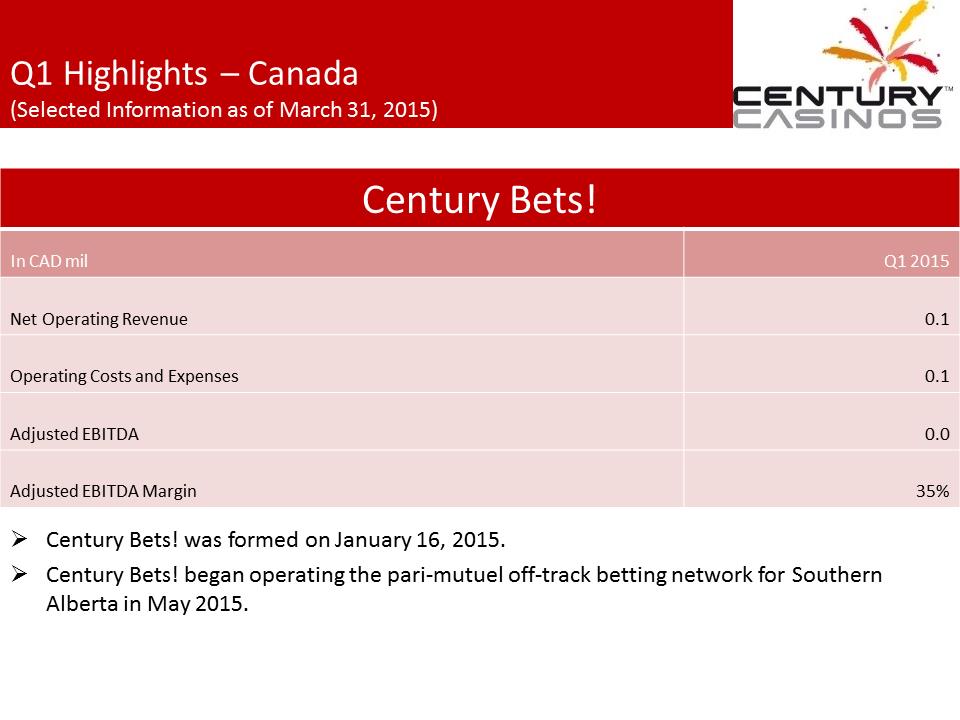 Q1 Highlights – Canada (Selected Information as of March 31, 2015) Century Bets! In CAD mil Q1 2015 Net Operating Revenue 0.1 Operating Costs and Expenses 0.1 Adjusted EBITDA 0.0 Adjusted EBITDA Margin 35% .Century Bets! was formed on January 16, 2015. .Century Bets! began operating the pari-mutuel off-track betting network for Southern Alberta in May 2015.
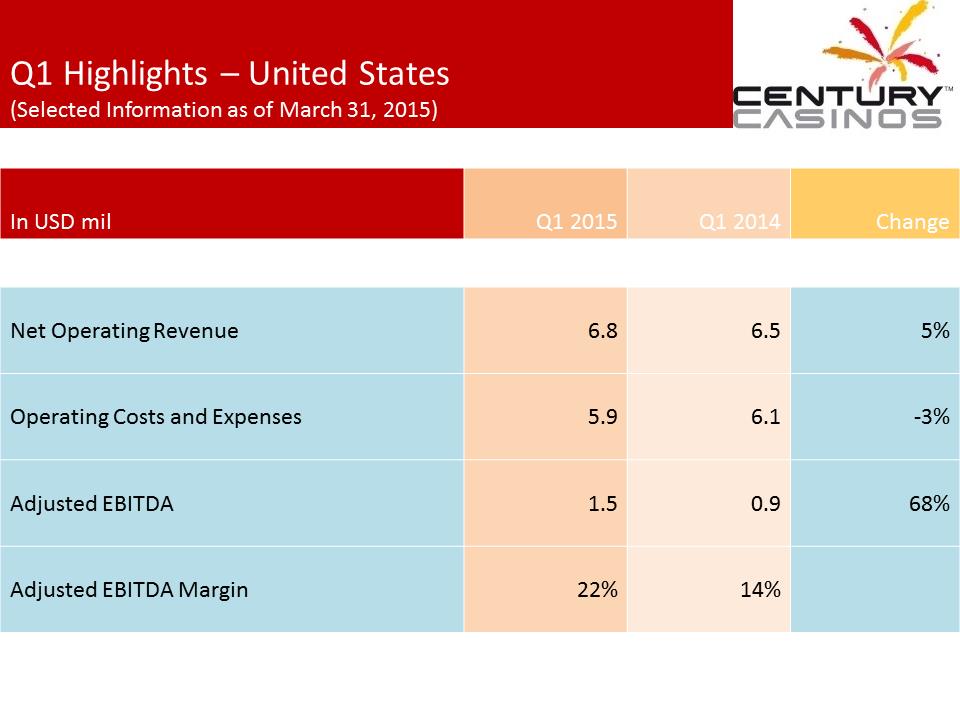 Q1 Highlights – United States (Selected Information as of March 31, 2015) In USD mil Q1 2015 Q1 2014 Change Net Operating Revenue 6.8 6.5 5% Operating Costs and Expenses 5.9 6.1 -3% Adjusted EBITDA 1.5 0.9 68% Adjusted EBITDA Margin 22% 14%
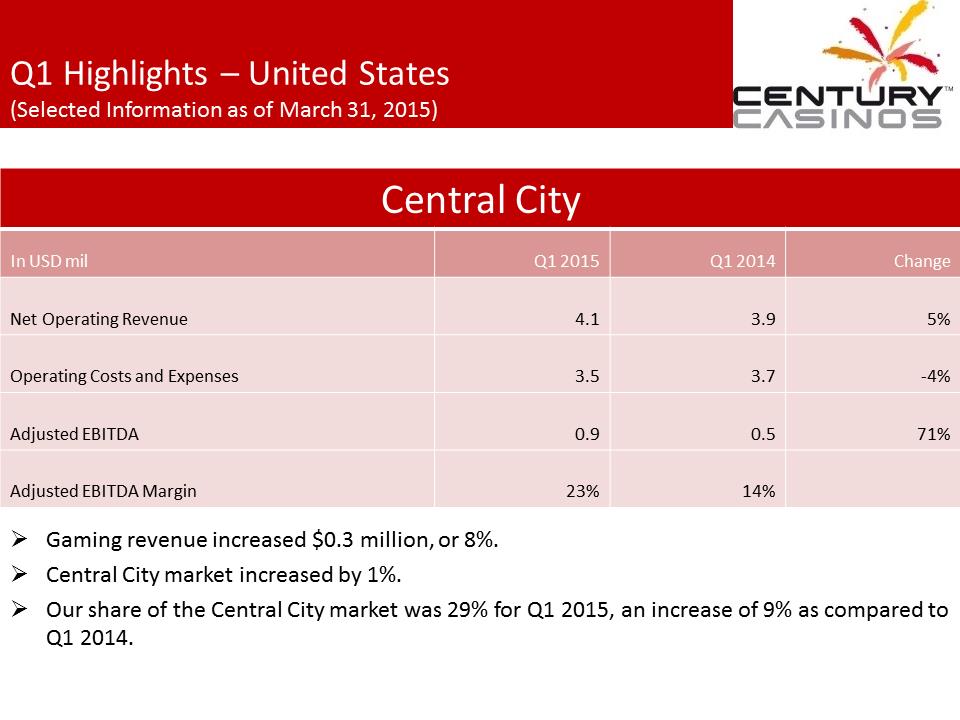 Q1 Highlights – United States (Selected Information as of March 31, 2015) Central City In USD mil Q1 2015 Q1 2014 Change Net Operating Revenue 4.1 3.9 5% Operating Costs and Expenses 3.5 3.7 -4% Adjusted EBITDA 0.9 0.5 71% Adjusted EBITDA Margin 23% 14% .Gaming revenue increased $0.3 million, or 8%. .Central City market increased by 1%. .Our share of the Central City market was 29% for Q1 2015, an increase of 9% as compared to Q1 2014.
 Q1 Highlights – United States (Selected Information as of March 31, 2015) Cripple Creek In USD mil Q1 2015 Q1 2014 Change Net Operating Revenue 2.7 2.5 5% Operating Costs and Expenses 2.4 2.4 -1% Adjusted EBITDA 0.5 0.3 64% Adjusted EBITDA Margin 20% 13% .Gaming revenue increased $0.2 million, or 6%. .Customer volumes increased 11%. .Our share of the Cripple Creek market was 10% in Q1 2015, an increase of 8% as compared to Q1 2014.
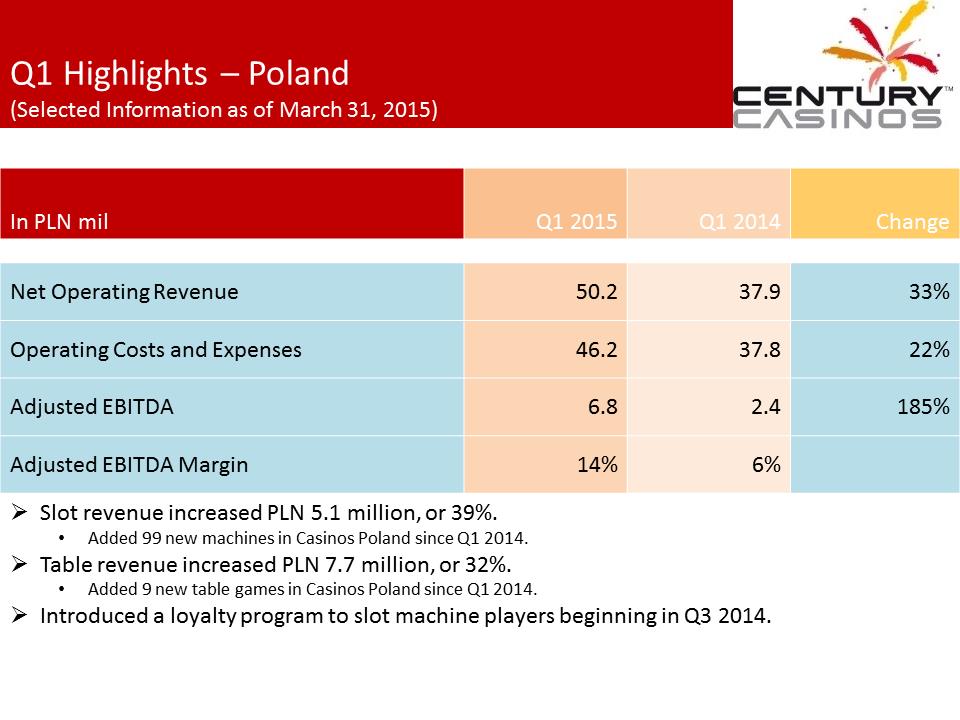 Q1 Highlights – Poland (Selected Information as of March 31, 2015) In PLN mil Q1 2015 Q1 2014 Change Net Operating Revenue 50.2 37.9 33% Operating Costs and Expenses 46.2 37.8 22% Adjusted EBITDA 6.8 2.4 185% Adjusted EBITDA Margin 14% 6% .Slot revenue increased PLN 5.1 million, or 39%. •Added 99 new machines in Casinos Poland since Q1 2014. .Table revenue increased PLN 7.7 million, or 32%. •Added 9 new table games in Casinos Poland since Q1 2014. .Introduced a loyalty program to slot machine players beginning in Q3 2014.
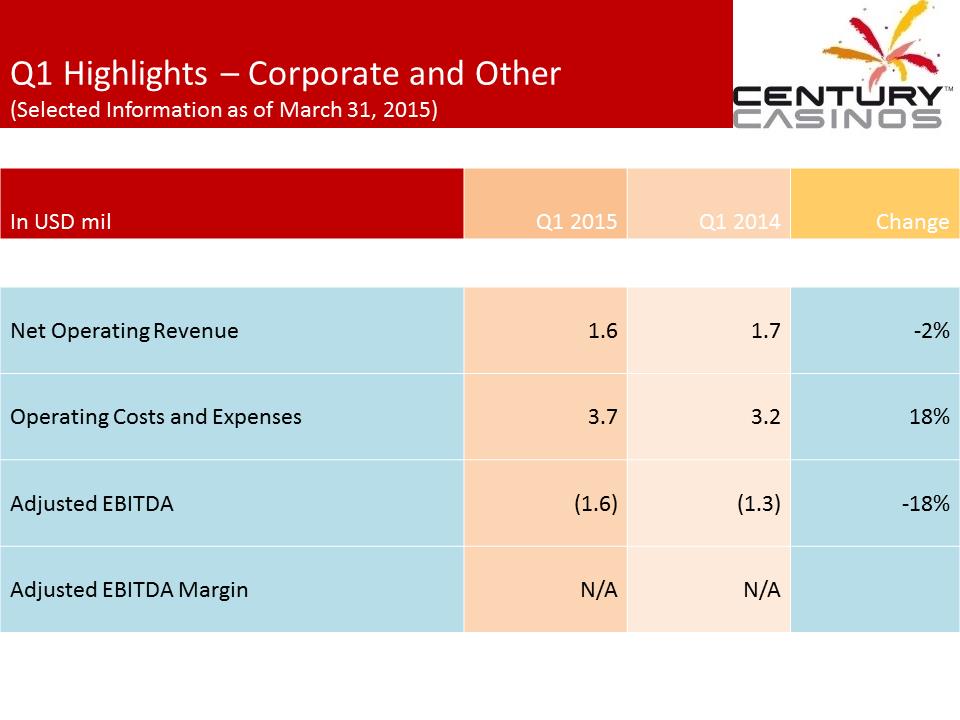 Q1 Highlights – Corporate and Other (Selected Information as of March 31, 2015) In USD mil Q1 2015 Q1 2014 Change Net Operating Revenue 1.6 1.7 -2% Operating Costs and Expenses 3.7 3.2 18% Adjusted EBITDA (1.6) (1.3) -18% Adjusted EBITDA Margin N/A N/A
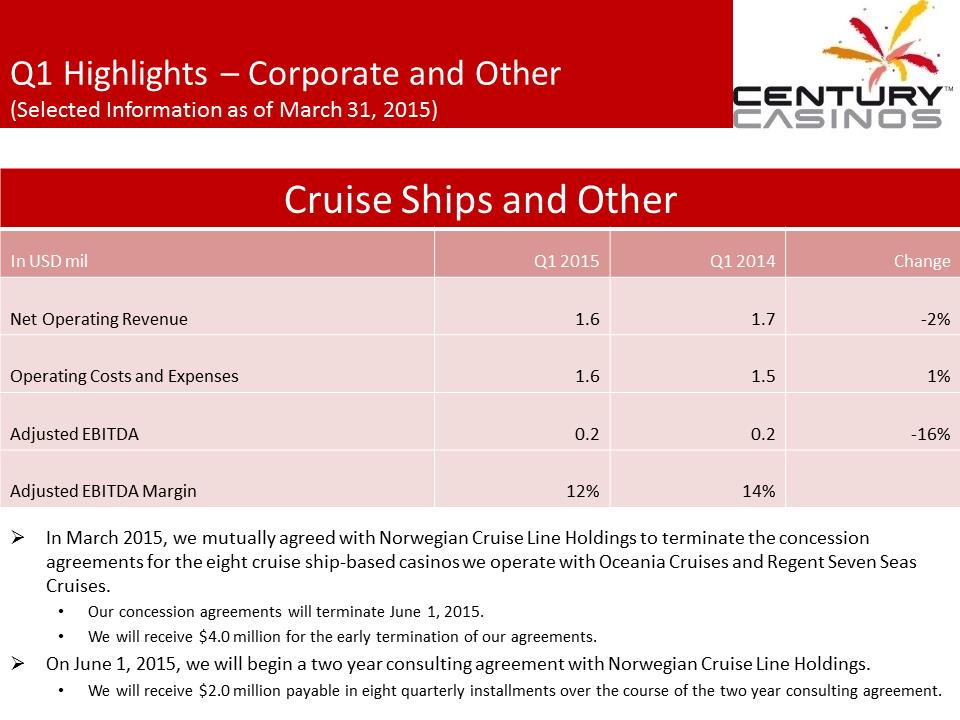 Q1 Highlights – Corporate and Other (Selected Information as of March 31, 2015) Cruise Ships and Other In USD mil Q1 2015 Q1 2014 Change Net Operating Revenue 1.6 1.7 -2% Operating Costs and Expenses 1.6 1.5 1% Adjusted EBITDA 0.2 0.2 -16% Adjusted EBITDA Margin 12% 14% .In March 2015, we mutually agreed with Norwegian Cruise Line Holdings to terminate the concession agreements for the eight cruise ship-based casinos we operate with Oceania Cruises and Regent Seven Seas Cruises. •Our concession agreements will terminate June 1, 2015. •We will receive $4.0 million for the early termination of our agreements. .On June 1, 2015, we will begin a two year consulting agreement with Norwegian Cruise Line Holdings. •We will receive $2.0 million payable in eight quarterly installments over the course of the two year consulting agreement.
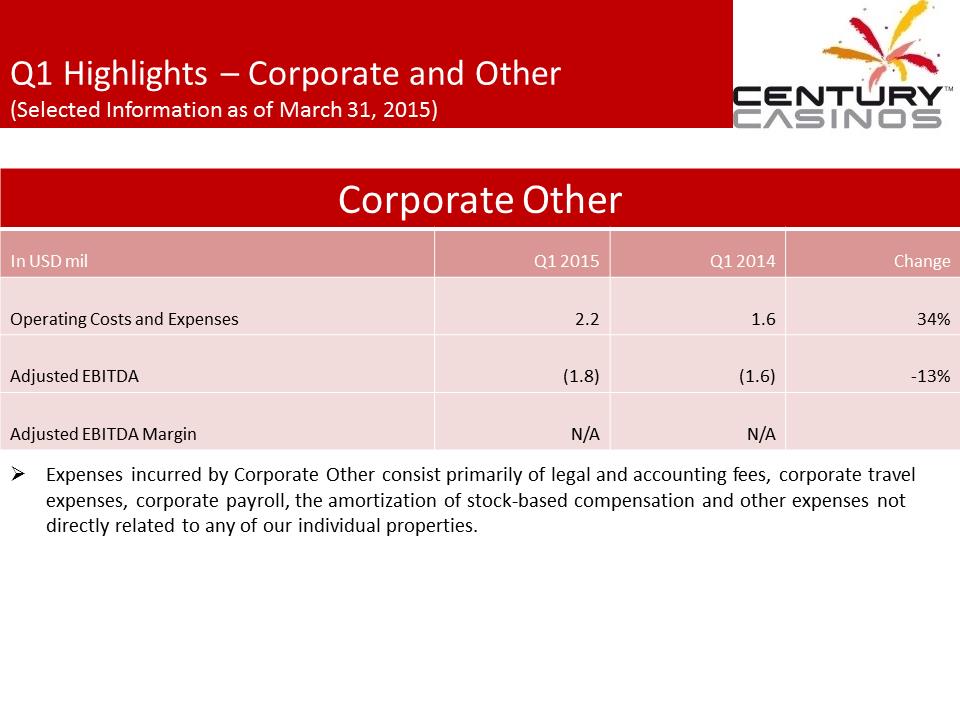 Q1 Highlights – Corporate and Other (Selected Information as of March 31, 2015) Corporate Other In USD mil Q1 2015 Q1 2014 Change Operating Costs and Expenses 2.2 1.6 34% Adjusted EBITDA (1.8) (1.6) -13% Adjusted EBITDA Margin N/A N/A .Expenses incurred by Corporate Other consist primarily of legal and accounting fees, corporate travel expenses, corporate payroll, the amortization of stock-based compensation and other expenses not directly related to any of our individual properties.
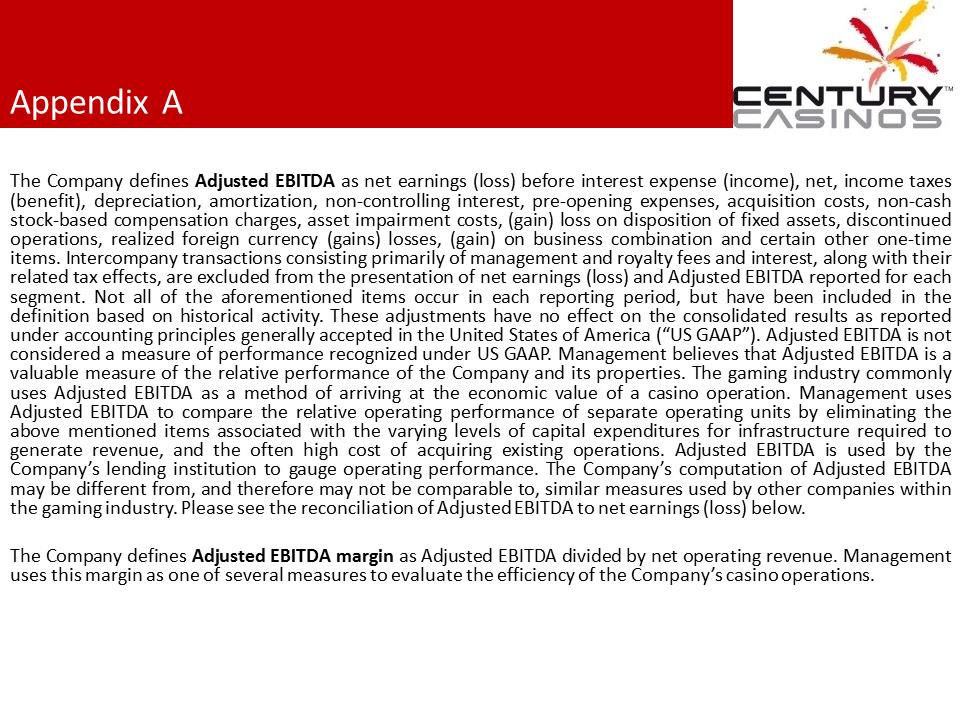 Appendix A The Company defines Adjusted EBITDA as net earnings (loss) before interest expense (income), net, income taxes (benefit), depreciation, amortization, non-controlling interest, pre-opening expenses, acquisition costs, non-cash stock-based compensation charges, asset impairment costs, (gain) loss on disposition of fixed assets, discontinued operations, realized foreign currency (gains) losses, (gain) on business combination and certain other one-time items. Intercompany transactions consisting primarily of management and royalty fees and interest, along with their related tax effects, are excluded from the presentation of net earnings (loss) and Adjusted EBITDA reported for each segment. Not all of the aforementioned items occur in each reporting period, but have been included in the definition based on historical activity. These adjustments have no effect on the consolidated results as reported under accounting principles generally accepted in the United States of America (“US GAAP”). Adjusted EBITDA is not considered a measure of performance recognized under US GAAP. Management believes that Adjusted EBITDA is a valuable measure of the relative performance of the Company and its properties. The gaming industry commonly uses Adjusted EBITDA as a method of arriving at the economic value of a casino operation. Management uses Adjusted EBITDA to compare the relative operating performance of separate operating units by eliminating the above mentioned items associated with the varying levels of capital expenditures for infrastructure required to generate revenue, and the often high cost of acquiring existing operations. Adjusted EBITDA is used by the Company’s lending institution to gauge operating performance. The Company’s computation of Adjusted EBITDA may be different from, and therefore may not be comparable to, similar measures used by other companies within the gaming industry. Please see the reconciliation of Adjusted EBITDA to net earnings (loss) below. The Company defines Adjusted EBITDA margin as Adjusted EBITDA divided by net operating revenue. Management uses this margin as one of several measures to evaluate the efficiency of the Company’s casino operations.
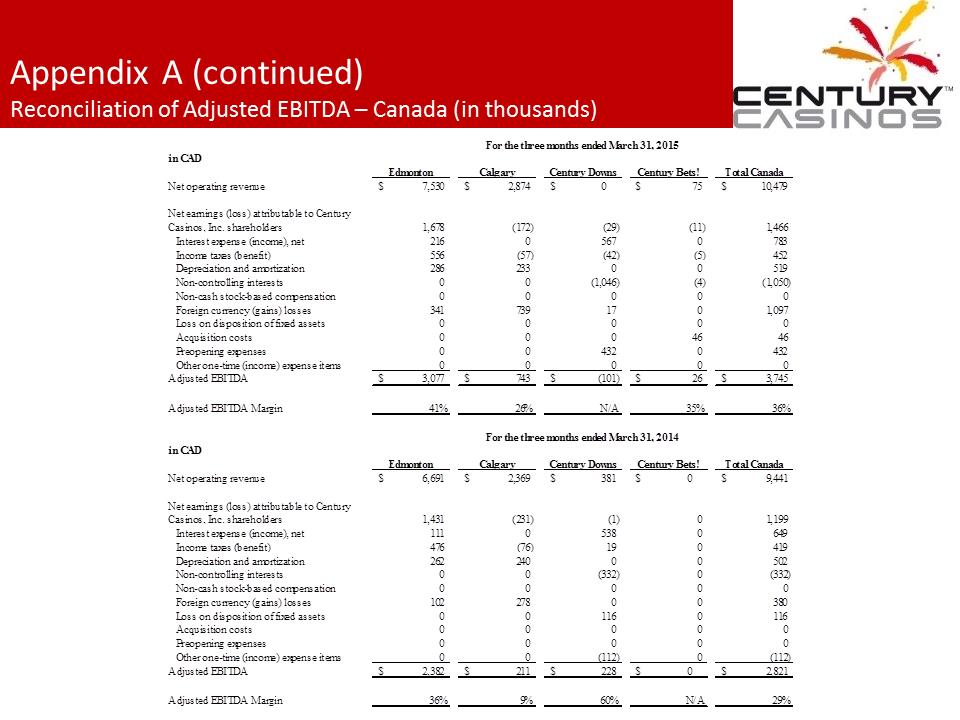 Appendix A (continued) Reconciliation of Adjusted EBITDA – Canada (in thousands)
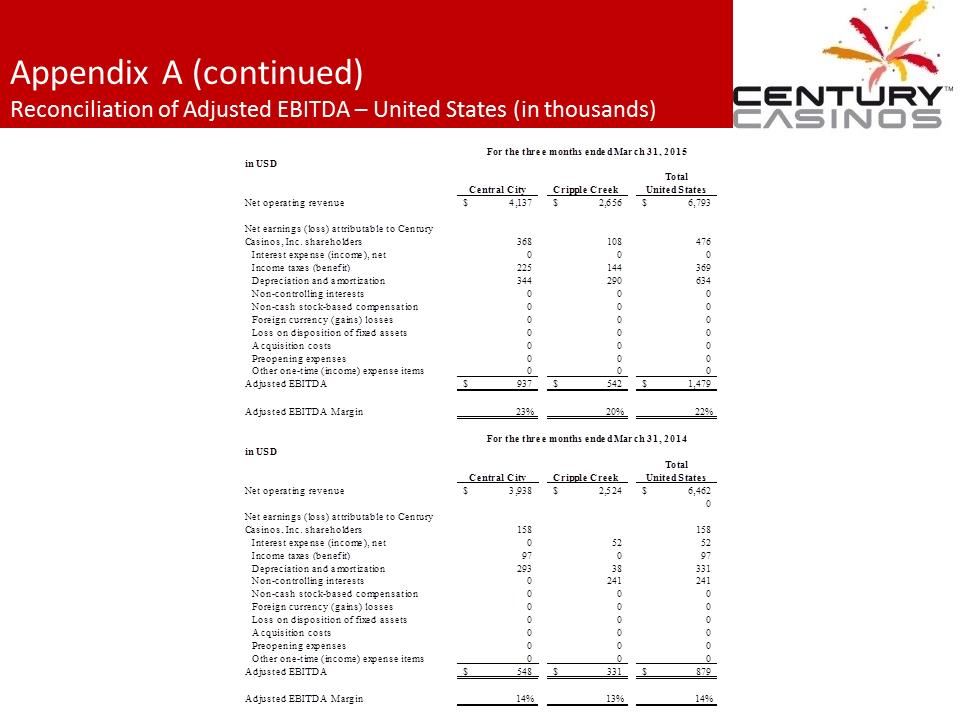 Appendix A (continued) Reconciliation of Adjusted EBITDA – United States (in thousands)
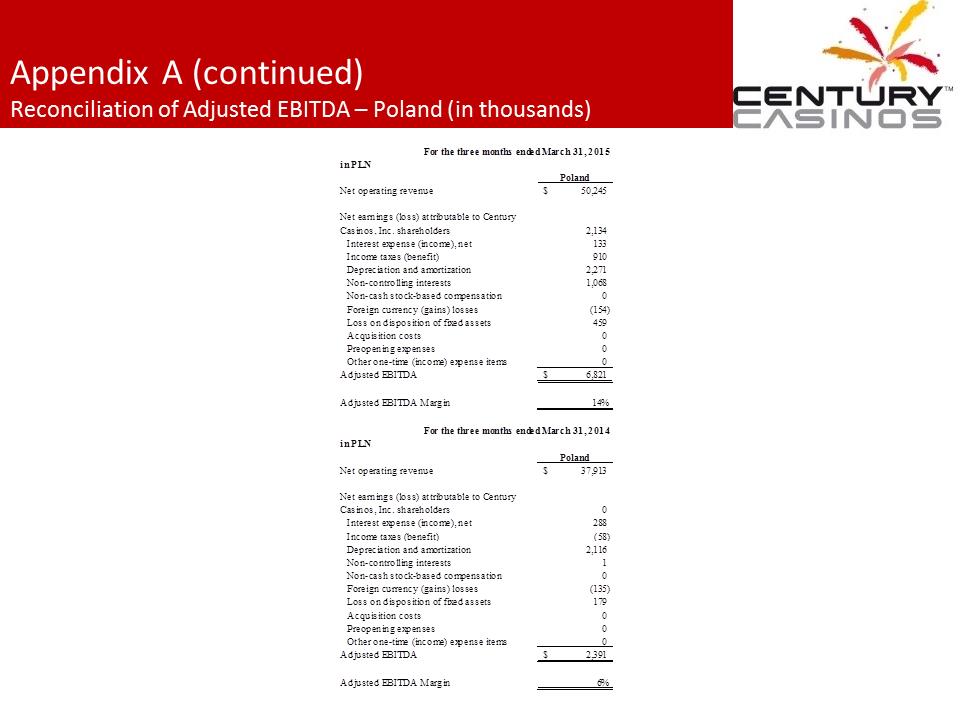 Appendix A (continued) Reconciliation of Adjusted EBITDA – Poland (in thousands)
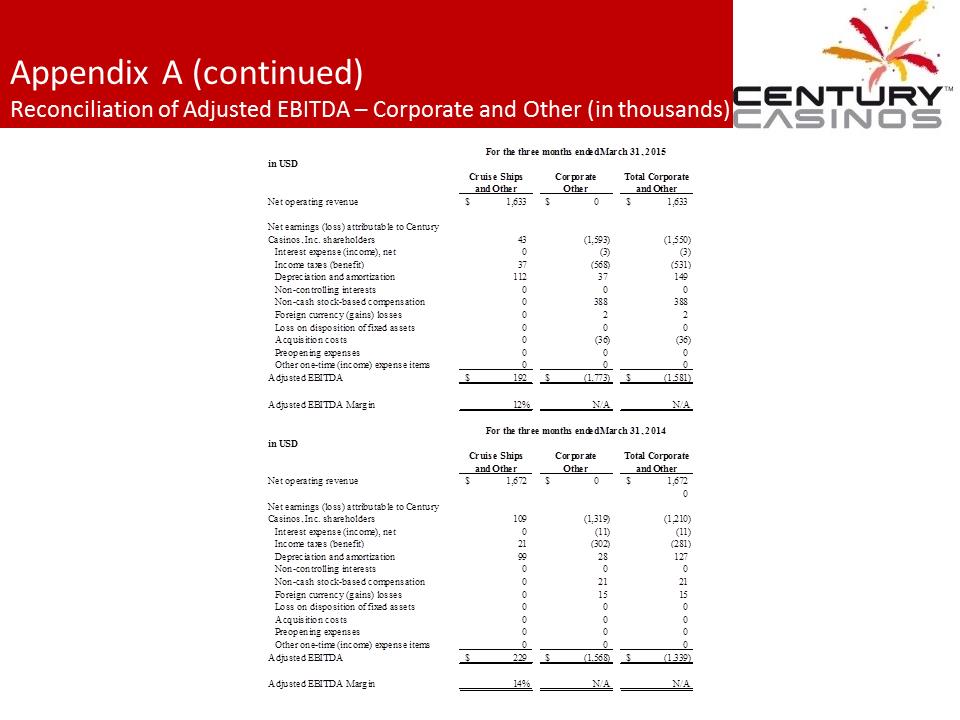 Appendix A (continued) Reconciliation of Adjusted EBITDA – Corporate and Other (in thousands)