 Financial Results Q3 2015
 Forward-Looking Statements, Business Environment and Risk Factors This presentation may contain “forward-looking statements” within the meaning of Section 27A of the Securities Act of 1933, as amended, Section 21E of the Securities Exchange Act of 1934, as amended (the “Exchange Act”), and the Private Securities Litigation Reform Act of 1995. In addition, Century Casinos, Inc. (together with its subsidiaries, the “Company”) may make other written and oral communications from time to time that contain such statements. Forward-looking statements include statements as to industry trends and future expectations of the Company and other matters that do not relate strictly to historical facts and are based on certain assumptions by management at the time such statements are made. These statements are often identified by the use of words such as “may,” “will,” “expect,” “believe,” “anticipate,” “intend,” “could,” “estimate,” or “continue,” and similar expressions or variations. These statements are based on the beliefs and assumptions of the management of the Company based on information currently available to management. Such forward-looking statements are subject to risks, uncertainties and other factors that could cause actual results to differ materially from future results expressed or implied by such forward-looking statements. Important factors that could cause actual results to differ materially from the forward-looking statements include, among others, the risks described in the section entitled “Risk Factors” under Item 1A in our Annual Report on Form 10-K for the year ended December 31, 2014 and in subsequent Form 10-Q filings. We caution the reader to carefully consider such factors. Furthermore, such forward-looking statements speak only as of the date on which such statements are made. We undertake no obligation to update any forward-looking statements to reflect events or circumstances after the date of such statements. In this presentation the term “USD” refers to US dollars, the term “CAD” refers to Canadian dollars and the term “PLN” refers to Polish zloty. Adjusted EBITDA and Adjusted EBITDA margin are non-GAAP financial measures. See Appendix A for the definition and reconciliation of Adjusted EBITDA and Adjusted EBITDA margin. Amounts presented are rounded. As such, rounding differences could occur in period over period changes and percentages reported throughout this presentation.
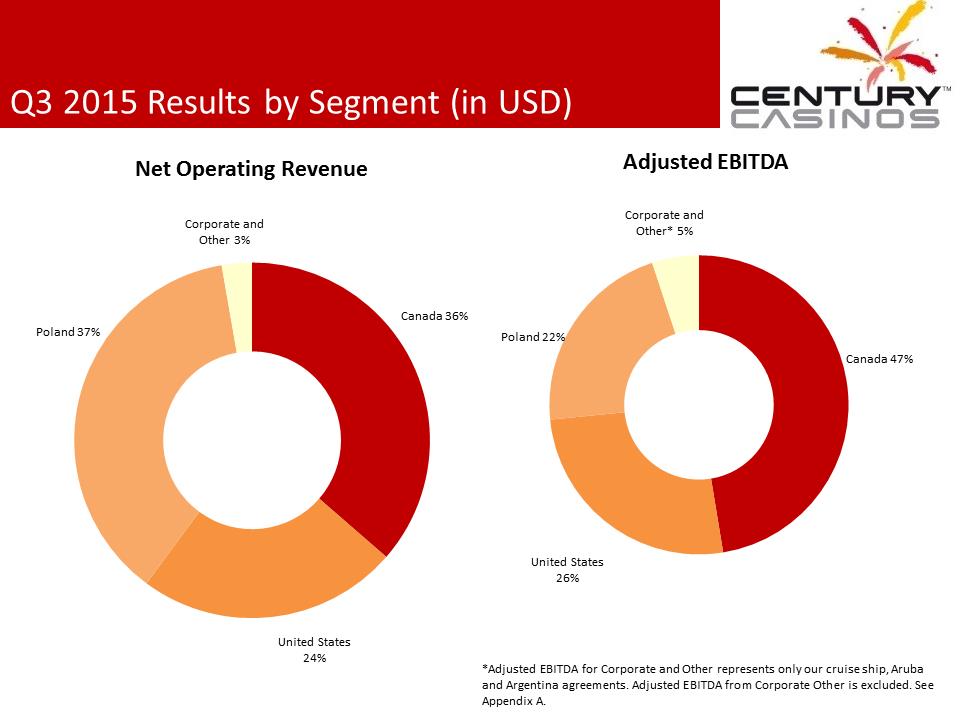 Q3 2015 Results by Segment (in USD) *Adjusted EBITDA for Corporate and Other represents only our cruise ship, Aruba and Argentina agreements. Adjusted EBITDA from Corporate Other is excluded. See Appendix A. Canada 36% United States 24% Poland 37% Corporate and Other 3% Net Operating Revenue Canada 47% United States 26% Poland 22% Corporate and Other* 5% Adjusted EBITDA
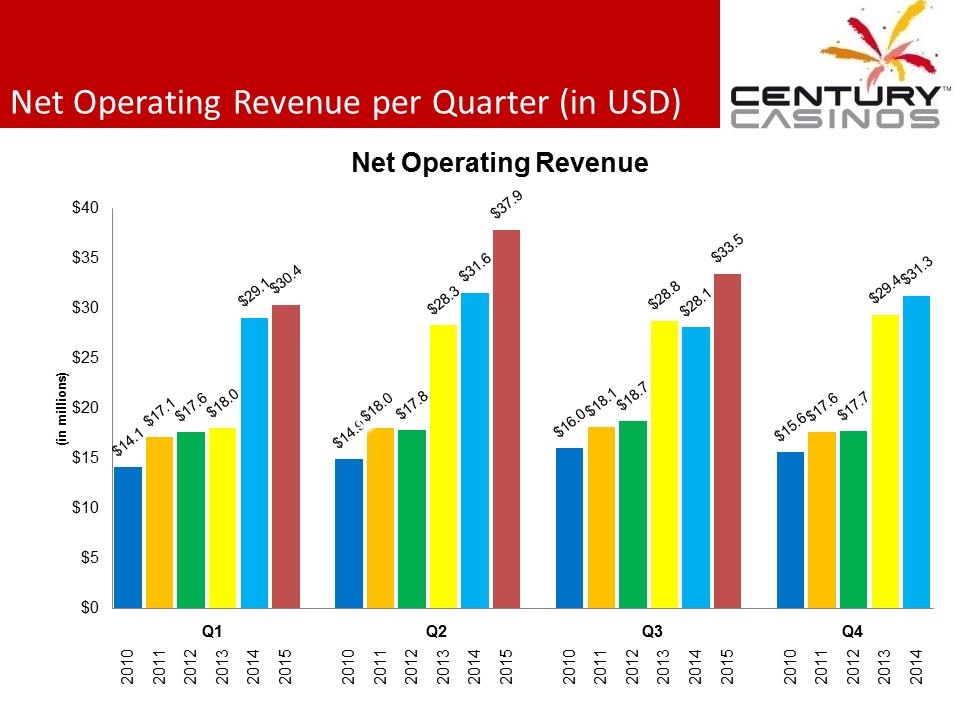 Net Operating Revenue per Quarter (in USD) $14.1$17.1$17.6$18.0$29.1$30.4$14.9$18.0$17.8$28.3$31.6$37.9$16.0$18.1$18.7$28.8$28.1$33.5$15.6$17.6$17.7$29.4$31.3$0$5$10$15$20$25$30$35$4020102011201220132014201520102011201220132014201520102011201220132014201520102011201220132014(in millions) Net Operating Revenue Q1 Q2 Q3 Q4
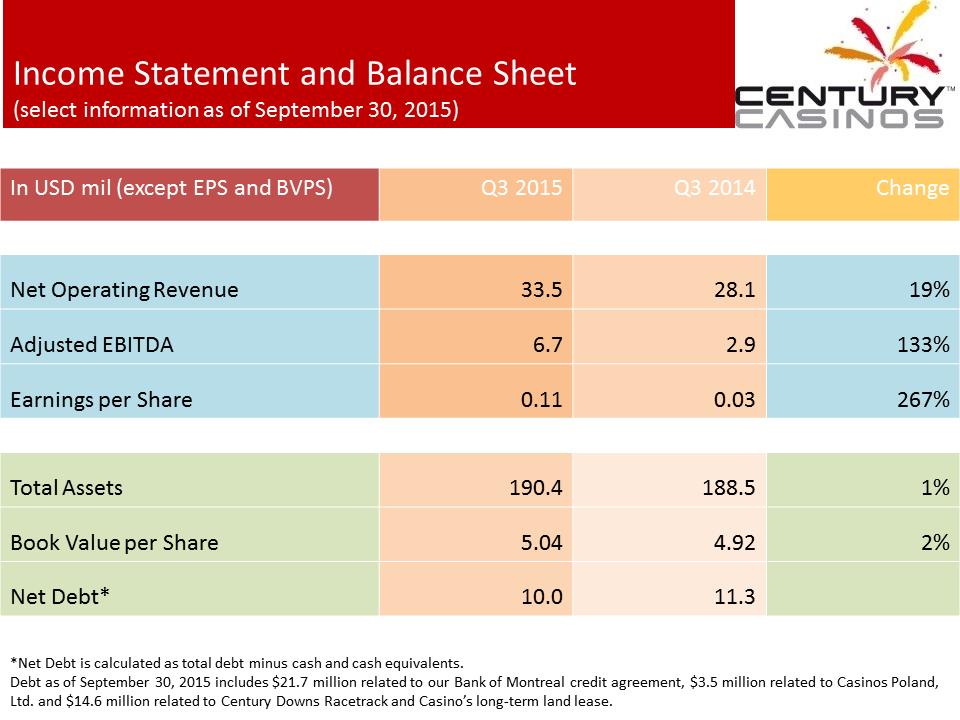 Income Statement and Balance Sheet (select information as of September 30, 2015) In USD mil (except EPS and BVPS) Q3 2015 Q3 2014 Change Net Operating Revenue 33.5 28.1 19% Adjusted EBITDA 6.7 2.9 133% Earnings per Share 0.11 0.03 267% Total Assets 190.4 188.5 1% Book Value per Share 5.04 4.92 2% Net Debt* 10.0 11.3 *Net Debt is calculated as total debt minus cash and cash equivalents. Debt as of September 30, 2015 includes $21.7 million related to our Bank of Montreal credit agreement, $3.5 million related to Casinos Poland, Ltd. and $14.6 million related to Century Downs Racetrack and Casino’s long-term land lease.
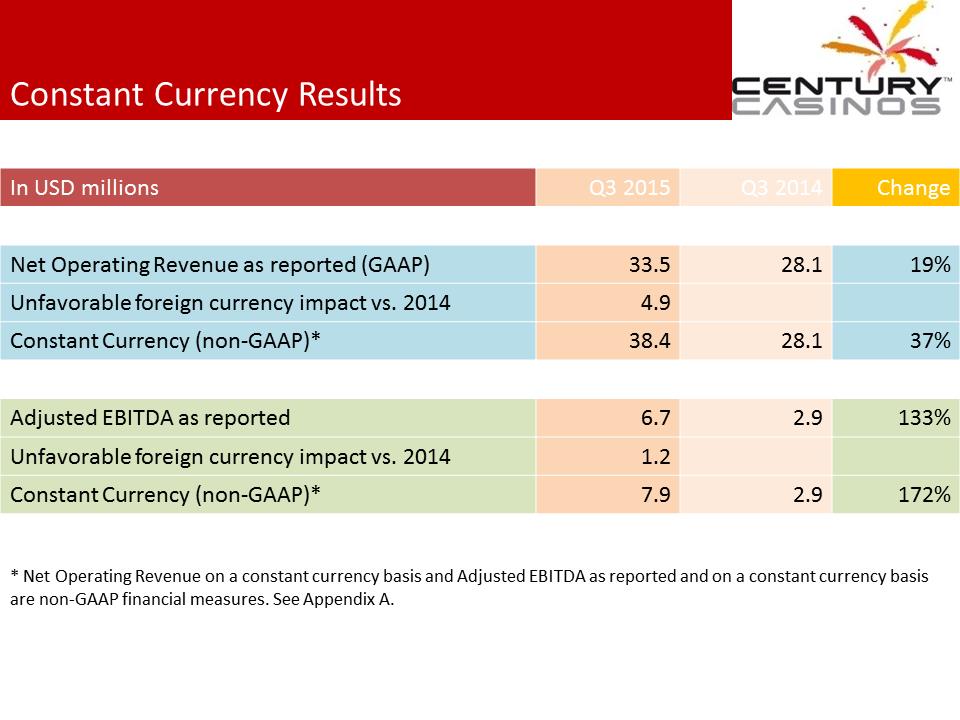 Constant Currency Results In USD millions Q3 2015 Q3 2014 Change Net Operating Revenue as reported (GAAP) 33.5 28.1 19% Unfavorable foreign currency impact vs. 2014 4.9 Constant Currency (non-GAAP)* 38.4 28.1 37% Adjusted EBITDA as reported 6.7 2.9 133% Unfavorable foreign currency impact vs. 2014 1.2 Constant Currency (non-GAAP)* 7.9 2.9 172% * Net Operating Revenue on a constant currency basis and Adjusted EBITDA as reported and on a constant currency basis are non-GAAP financial measures. See Appendix A.
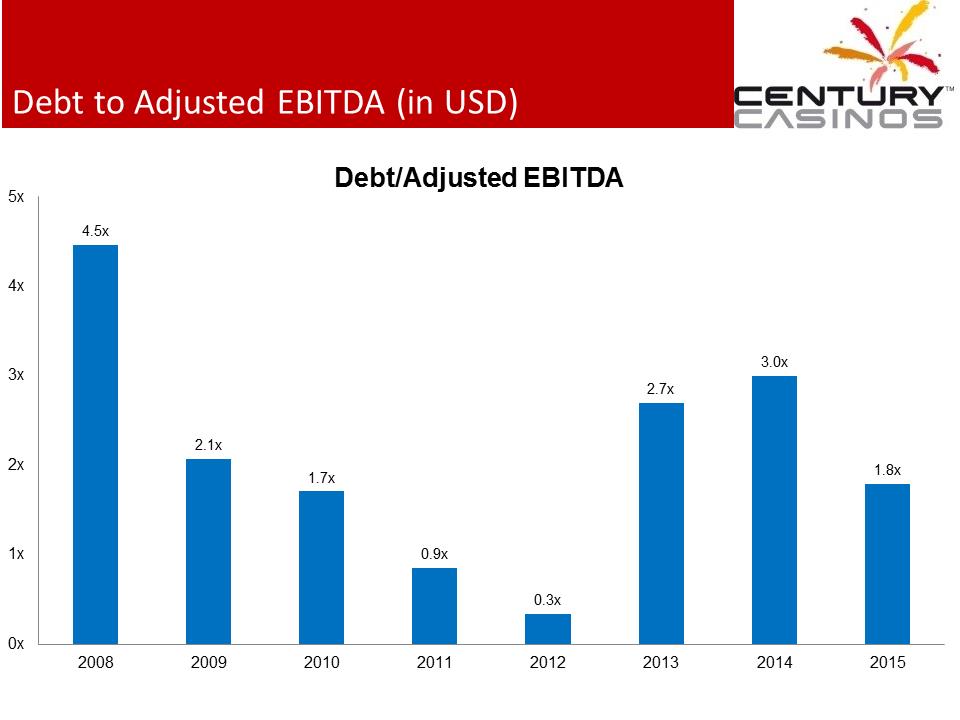 Debt to Adjusted EBITDA (in USD) 4.5x 2.1x 1.7x 0.9x 0.3x 2.7x 3.0x 1.8x 0x1x2x3x4x5x20082009201020112012201320142015Debt/Adjusted EBITDA
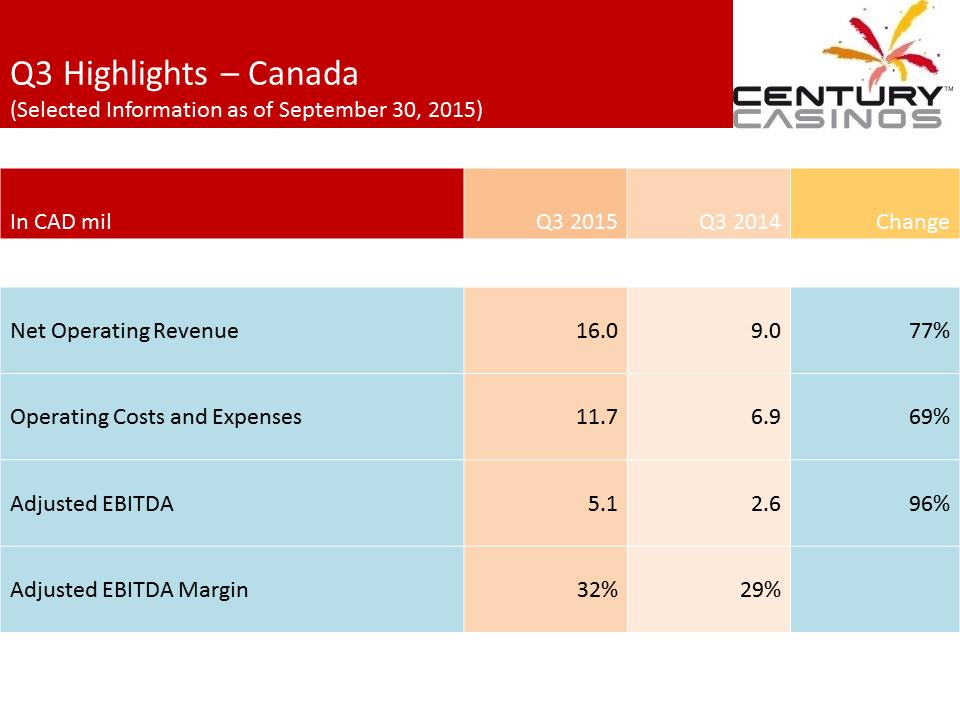 Q3 Highlights – Canada (Selected Information as of September 30, 2015) In CAD mil Q3 2015 Q3 2014 Change Net Operating Revenue 16.0 9.0 77% Operating Costs and Expenses 11.7 6.9 69% Adjusted EBITDA 5.1 2.6 96% Adjusted EBITDA Margin 32% 29%
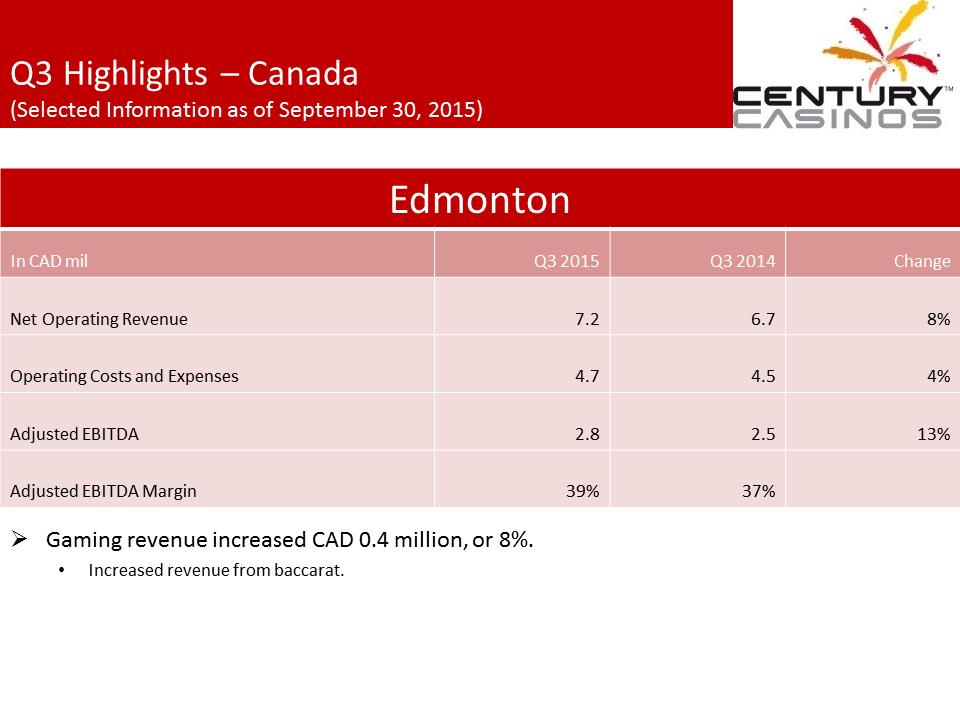 Q3 Highlights – Canada (Selected Information as of September 30, 2015) Edmonton In CAD mil Q3 2015 Q3 2014 Change Net Operating Revenue 7.2 6.7 8% Operating Costs and Expenses 4.7 4.5 4% Adjusted EBITDA 2.8 2.5 13% Adjusted EBITDA Margin 39% 37% .Gaming revenue increased CAD 0.4 million, or 8%. •Increased revenue from baccarat.
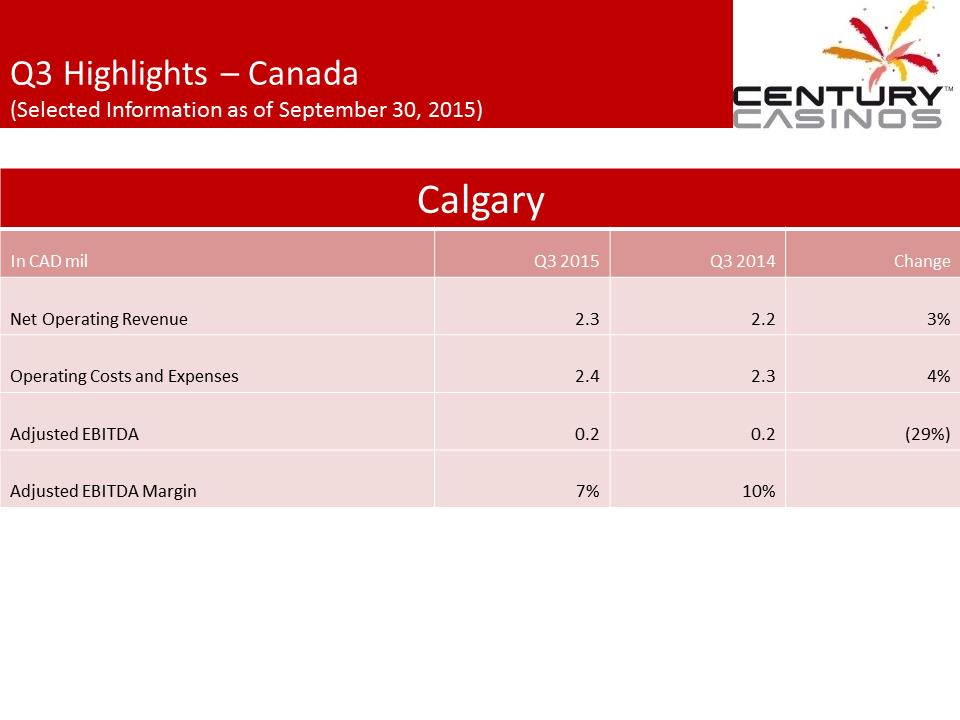 Q3 Highlights – Canada (Selected Information as of September 30, 2015) Calgary In CAD mil Q3 2015 Q3 2014 Change Net Operating Revenue 2.3 2.2 3% Operating Costs and Expenses 2.4 2.3 4% Adjusted EBITDA 0.2 0.2 (29%) Adjusted EBITDA Margin 7% 10%
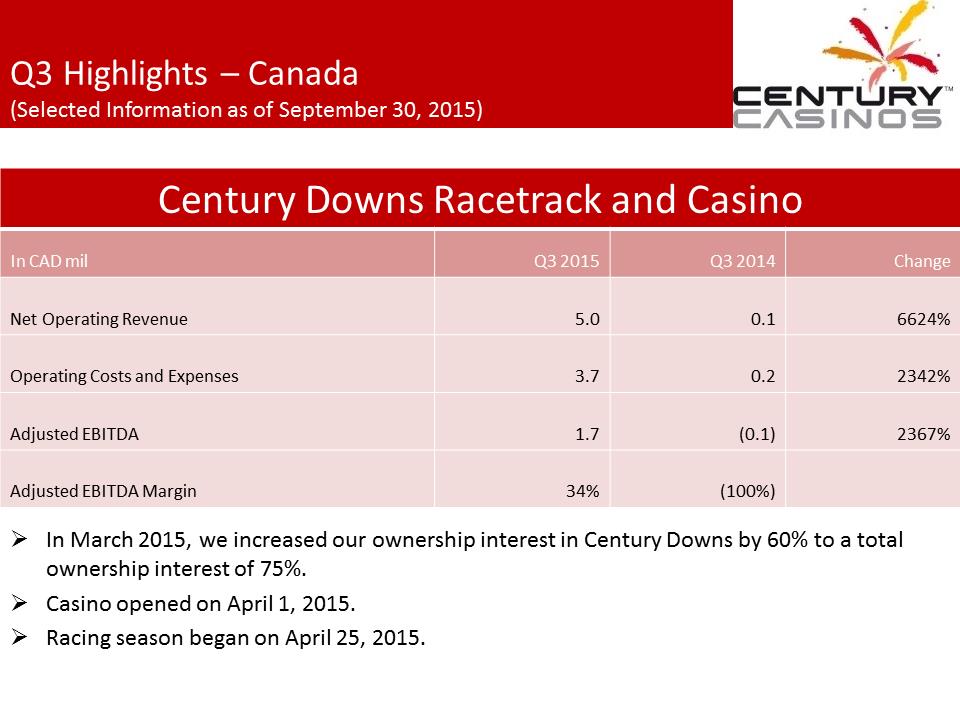 Q3 Highlights – Canada (Selected Information as of September 30, 2015) Century Downs Racetrack and Casino In CAD mil Q3 2015 Q3 2014 Change Net Operating Revenue 5.0 0.1 6624% Operating Costs and Expenses 3.7 0.2 2342% Adjusted EBITDA 1.7 (0.1) 2367% Adjusted EBITDA Margin 34% (100%) .In March 2015, we increased our ownership interest in Century Downs by 60% to a total ownership interest of 75%. .Casino opened on April 1, 2015. .Racing season began on April 25, 2015.
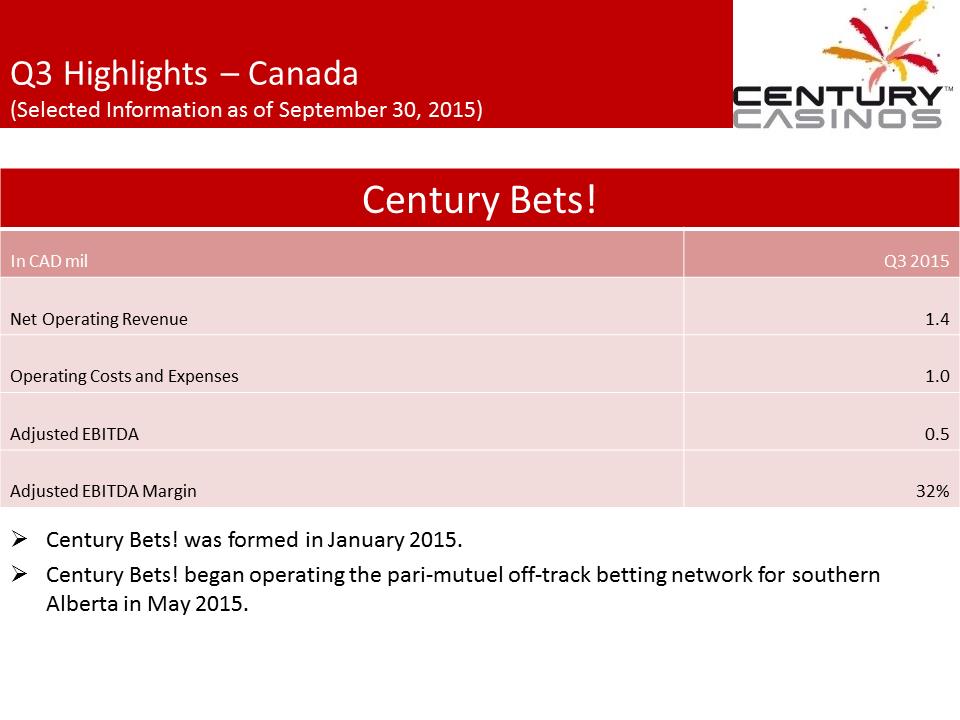 Q3 Highlights – Canada (Selected Information as of September 30, 2015) Century Bets! In CAD mil Q3 2015 Net Operating Revenue 1.4 Operating Costs and Expenses 1.0 Adjusted EBITDA 0.5 Adjusted EBITDA Margin 32% .Century Bets! was formed in January 2015. .Century Bets! began operating the pari-mutuel off-track betting network for southern Alberta in May 2015.
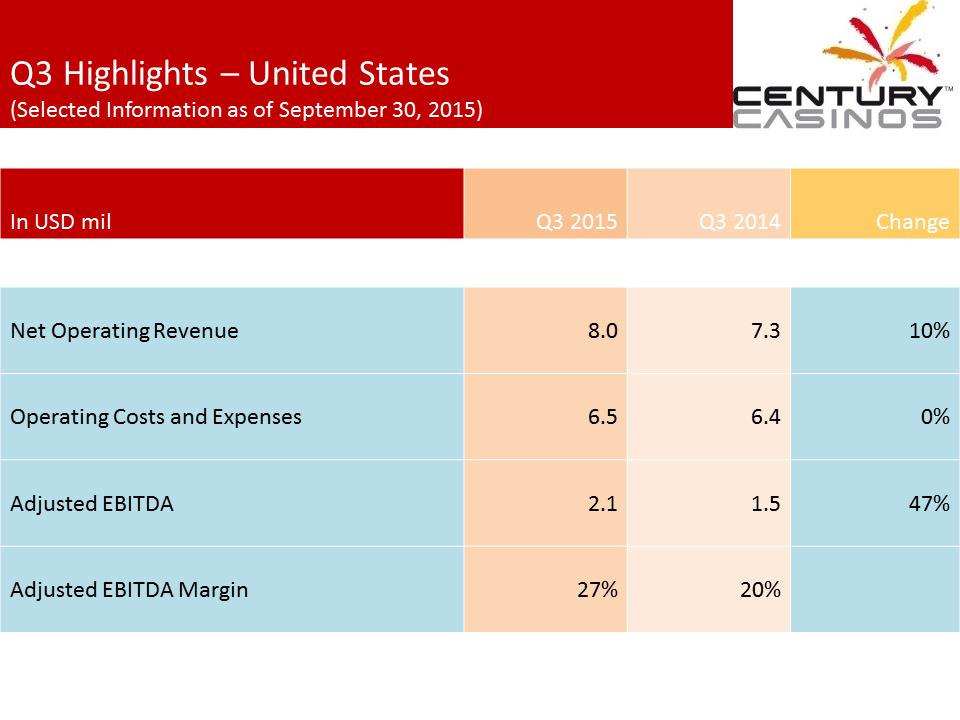 Q3 Highlights – United States (Selected Information as of September 30, 2015) In USD mil Q3 2015 Q3 2014 Change Net Operating Revenue 8.0 7.3 10% Operating Costs and Expenses 6.5 6.4 0% Adjusted EBITDA 2.1 1.5 47% Adjusted EBITDA Margin 27% 20%
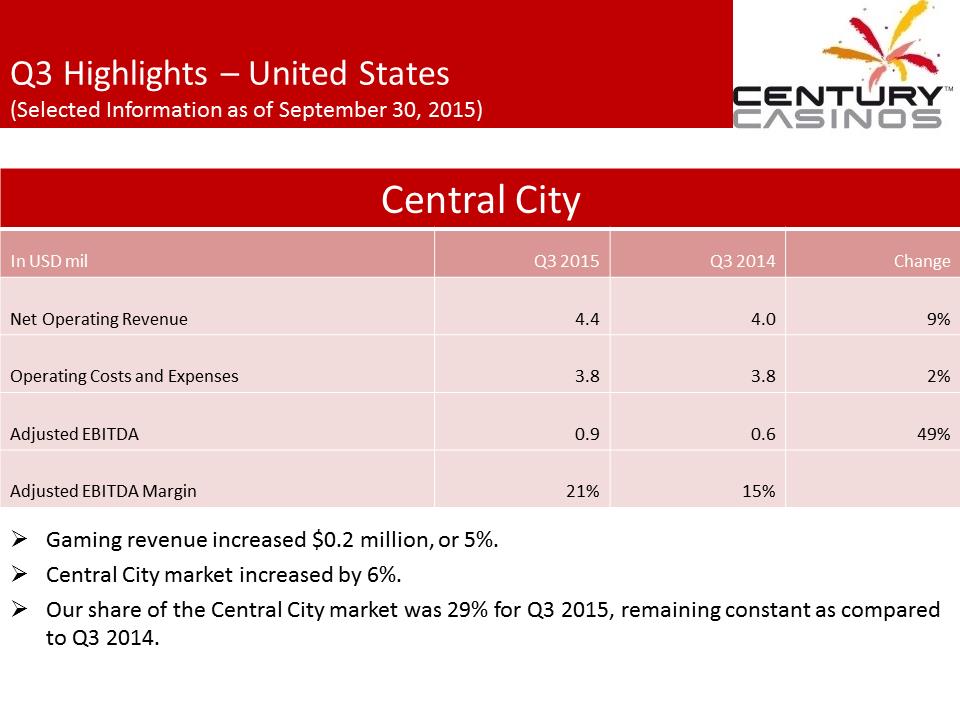 Q3 Highlights – United States (Selected Information as of September 30, 2015) Central City In USD mil Q3 2015 Q3 2014 Change Net Operating Revenue 4.4 4.0 9% Operating Costs and Expenses 3.8 3.8 2% Adjusted EBITDA 0.9 0.6 49% Adjusted EBITDA Margin 21% 15% .Gaming revenue increased $0.2 million, or 5%. .Central City market increased by 6%. .Our share of the Central City market was 29% for Q3 2015, remaining constant as compared to Q3 2014.
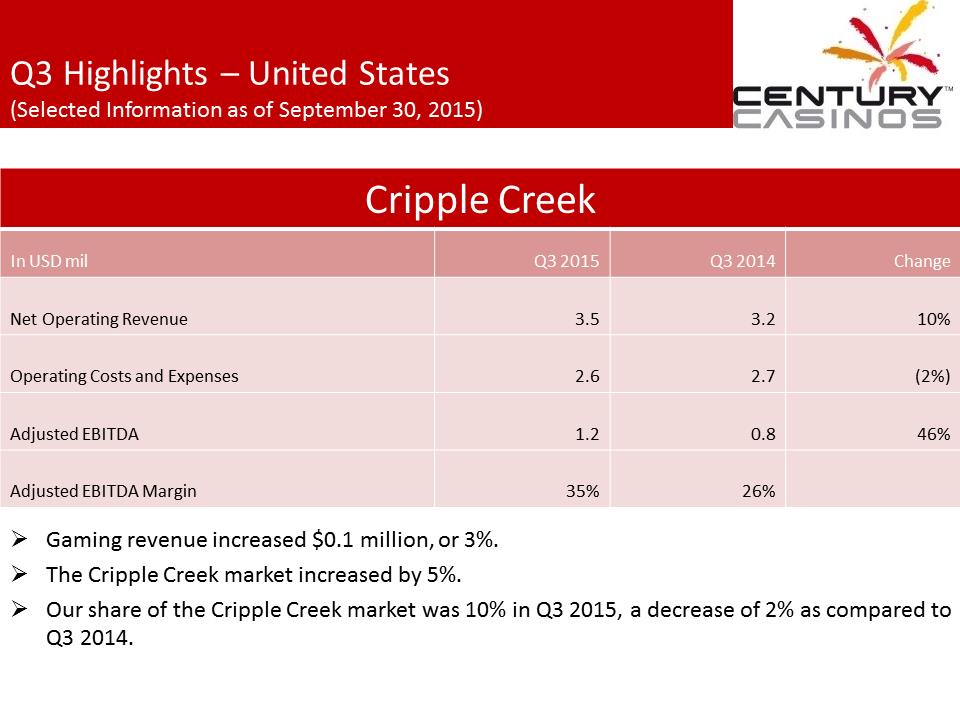 Q3 Highlights – United States (Selected Information as of September 30, 2015) Cripple Creek In USD mil Q3 2015 Q3 2014 Change Net Operating Revenue 3.5 3.2 10% Operating Costs and Expenses 2.6 2.7 (2%) Adjusted EBITDA 1.2 0.8 46% Adjusted EBITDA Margin 35% 26% .Gaming revenue increased $0.1 million, or 3%. .The Cripple Creek market increased by 5%. .Our share of the Cripple Creek market was 10% in Q3 2015, a decrease of 2% as compared to Q3 2014.
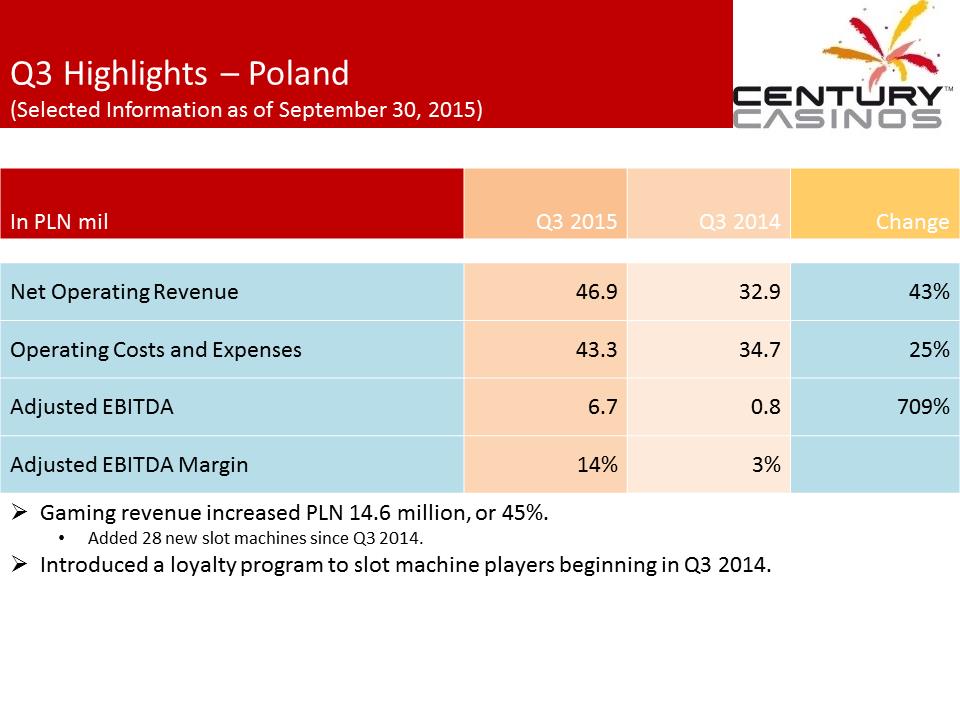 Q3 Highlights – Poland (Selected Information as of September 30, 2015) In PLN mil Q3 2015 Q3 2014 Change Net Operating Revenue 46.9 32.9 43% Operating Costs and Expenses 43.3 34.7 25% Adjusted EBITDA 6.7 0.8 709% Adjusted EBITDA Margin 14% 3% .Gaming revenue increased PLN 14.6 million, or 45%. •Added 28 new slot machines since Q3 2014. .Introduced a loyalty program to slot machine players beginning in Q3 2014.
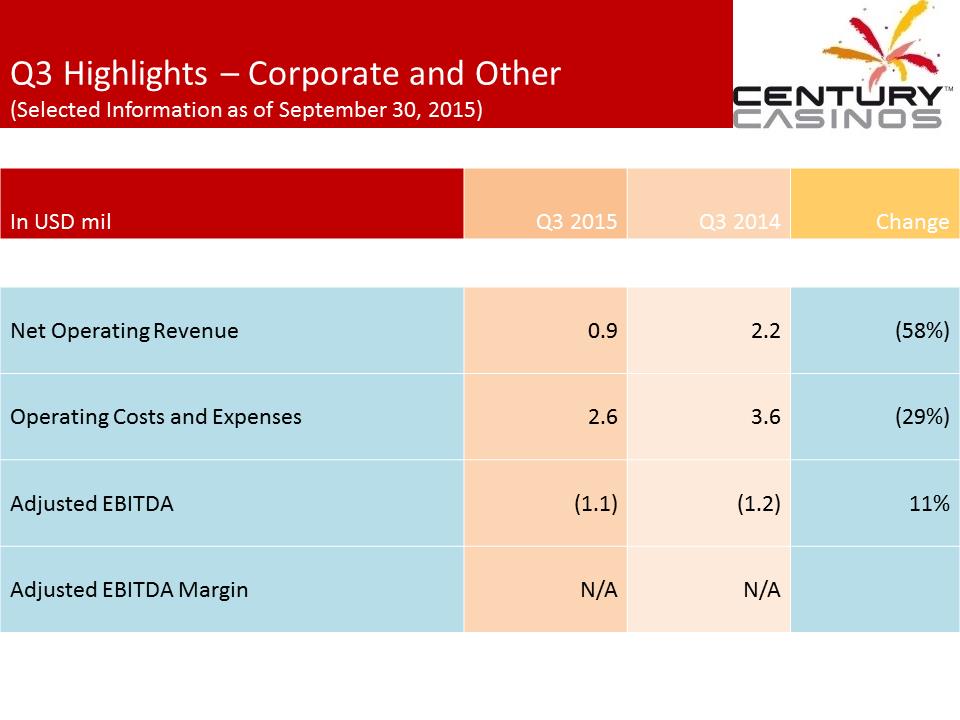 Q3 Highlights – Corporate and Other (Selected Information as of September 30, 2015) In USD mil Q3 2015 Q3 2014 Change Net Operating Revenue 0.9 2.2 (58%) Operating Costs and Expenses 2.6 3.6 (29%) Adjusted EBITDA (1.1) (1.2) 11% Adjusted EBITDA Margin N/A N/A
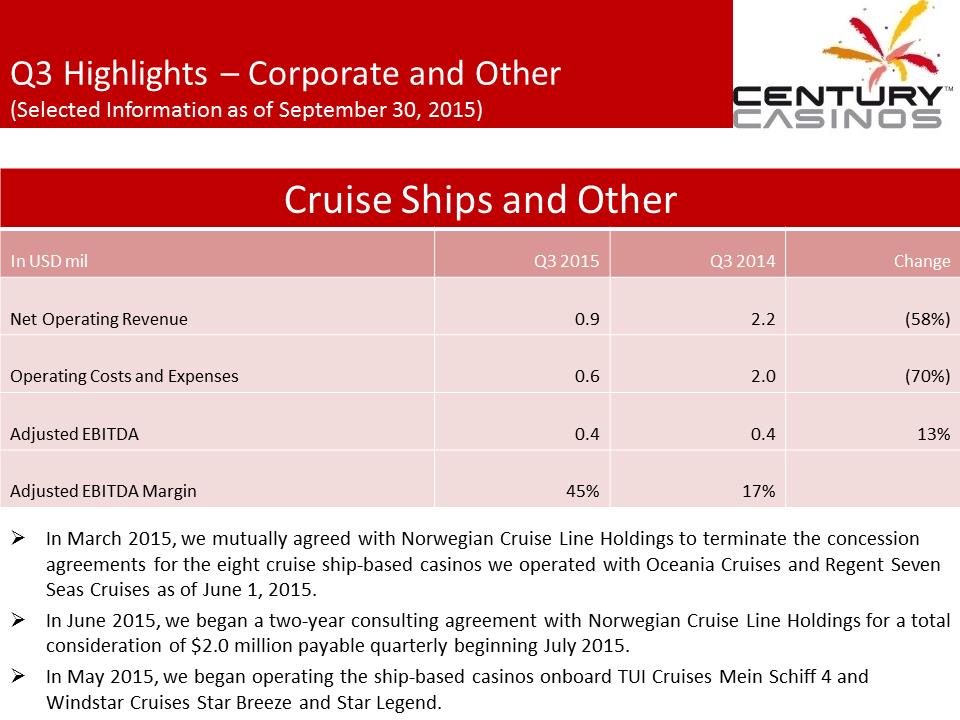 Q3 Highlights – Corporate and Other (Selected Information as of September 30, 2015) Cruise Ships and Other In USD mil Q3 2015 Q3 2014 Change Net Operating Revenue 0.9 2.2 (58%) Operating Costs and Expenses 0.6 2.0 (70%) Adjusted EBITDA 0.4 0.4 13% Adjusted EBITDA Margin 45% 17% .In March 2015, we mutually agreed with Norwegian Cruise Line Holdings to terminate the concession agreements for the eight cruise ship-based casinos we operated with Oceania Cruises and Regent Seven Seas Cruises as of June 1, 2015. .In June 2015, we began a two-year consulting agreement with Norwegian Cruise Line Holdings for a total consideration of $2.0 million payable quarterly beginning July 2015. .In May 2015, we began operating the ship-based casinos onboard TUI Cruises Mein Schiff 4 and Windstar Cruises Star Breeze and Star Legend.
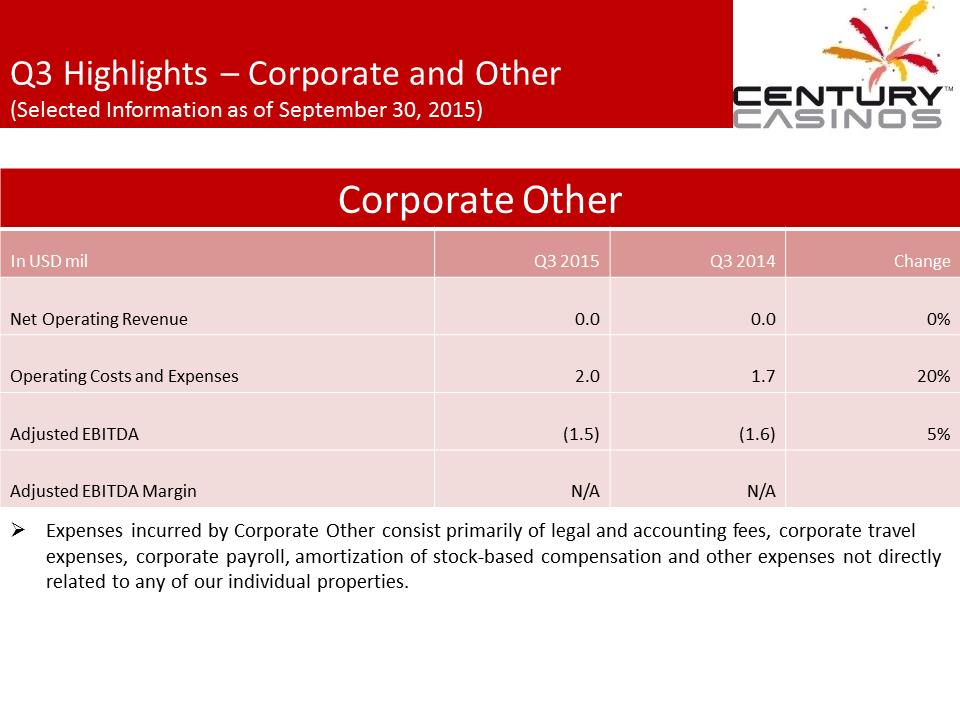 Q3 Highlights – Corporate and Other (Selected Information as of September 30, 2015) Corporate Other In USD mil Q3 2015 Q3 2014 Change Net Operating Revenue 0.0 0.0 0% Operating Costs and Expenses 2.0 1.7 20% Adjusted EBITDA (1.5) (1.6) 5% Adjusted EBITDA Margin N/A N/A .Expenses incurred by Corporate Other consist primarily of legal and accounting fees, corporate travel expenses, corporate payroll, amortization of stock-based compensation and other expenses not directly related to any of our individual properties.
 Appendix A – Non GAAP Financial Measures X:\Century Casinos\SEC Filings\2010\10-K\EDGAR\centurylogo.jpgThe Company supplements its condensed consolidated financial statements prepared in accordance with U.S. generally accepted accounting principles (“US GAAP”) by using the following non-GAAP financial measures, which management believes are useful in properly understanding the Company’s short-term and long-term financial trends. Management uses these non-GAAP financial measures to forecast and evaluate the operational performance of the Company as well as to compare results of current periods to prior periods on a consolidated basis. .Adjusted EBITDA .Adjusted EBITDA margin .Constant currency results Management believes presenting the non-GAAP financial measures used in this presentation provides investors greater transparency to the information used by management for financial and operational decision-making and allows investors to see the Company’s results “through the eyes” of management. Management also believes providing this information better enables our investors to understand the Company’s operating performance and evaluate the methodology used by management to evaluate and measure such performance. The adjustments made to GAAP financial measures result from facts and circumstances that vary in frequency and impact on the Company’s results of operations. The following is an explanation of each of the adjustments that management excludes in calculating its non-GAAP measures.
 Appendix A – Non GAAP Financial Measures The Company defines Adjusted EBITDA as net earnings (loss) before interest expense (income), net, income taxes (benefit), depreciation, amortization, non-controlling interest (earnings) losses and transactions, pre-opening expenses, acquisition costs, non-cash stock-based compensation charges, asset impairment costs, (gain) loss on disposition of fixed assets, discontinued operations, (gain) loss on foreign currency transactions and other, gain on business combination and certain other one-time items. Intercompany transactions consisting primarily of management and royalty fees and interest, along with their related tax effects, are excluded from the presentation of net earnings (loss) and Adjusted EBITDA reported for each segment and property. Not all of the aforementioned items occur in each reporting period, but have been included in the definition based on historical activity. These adjustments have no effect on the consolidated results as reported under US GAAP. Adjusted EBITDA is not considered a measure of performance recognized under US GAAP. Management believes that Adjusted EBITDA is a valuable measure of the relative performance of the Company and its properties. The gaming industry commonly uses Adjusted EBITDA as a method of arriving at the economic value of a casino operation. Management uses Adjusted EBITDA to compare the relative operating performance of separate operating units by eliminating the above mentioned items associated with the varying levels of capital expenditures for infrastructure required to generate revenue, and the often high cost of acquiring existing operations. Adjusted EBITDA is used by the Company’s lending institution to gauge operating performance. The Company’s computation of Adjusted EBITDA may be different from, and therefore may not be comparable to, similar measures used by other companies within the gaming industry. Please see the reconciliation of Adjusted EBITDA to net earnings (loss) below. The Company defines Adjusted EBITDA margin as Adjusted EBITDA divided by net operating revenue. Management uses this margin as one of several measures to evaluate the efficiency of the Company’s casino operations. The impact of foreign exchange rates is highly variable and difficult to predict. The Company uses a Constant Currency basis to show the impact from foreign exchange rates on current period revenue compared to prior period revenue using the prior period’s foreign exchange rates. In order to properly understand the underlying business trends and performance of the Company’s ongoing operations, management believes that investors may find it useful to consider the impact of excluding changes in foreign exchange rates from the Company’s net operating revenue and Adjusted EBITDA.
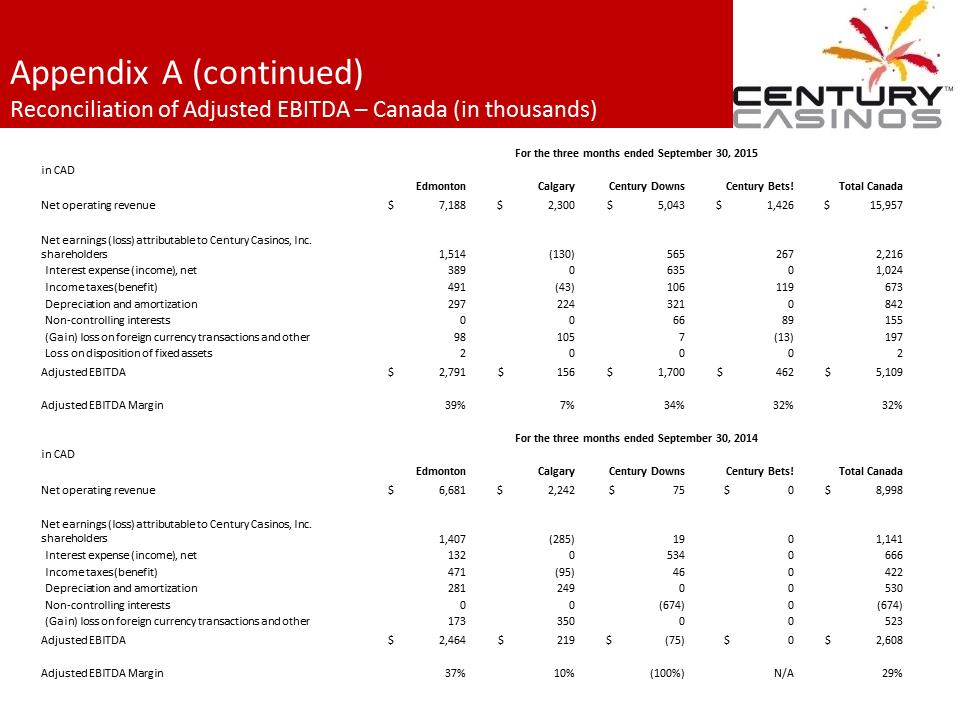 Appendix A (continued) Reconciliation of Adjusted EBITDA – Canada (in thousands) For the three months ended September 30, 2015 in CAD Edmonton Calgary Century Downs Century Bets! Total Canada Net operating revenue $ 7,188 $ 2,300 $ 5,043 $ 1,426 $ 15,957 Net earnings (loss) attributable to Century Casinos, Inc. shareholders 1,514 (130) 565 267 2,216 Interest expense (income), net 389 0 635 0 1,024 Income taxes (benefit) 491 (43) 106 119 673 Depreciation and amortization 297 224 321 0 842 Non-controlling interests 0 0 66 89 155 (Gain) loss on foreign currency transactions and other 98 105 7 (13) 197 Loss on disposition of fixed assets 2 0 0 0 2 Adjusted EBITDA $ 2,791 $ 156 $ 1,700 $ 462 $ 5,109 Adjusted EBITDA Margin 39% 7% 34% 32% 32% For the three months ended September 30, 2014 in CAD Edmonton Calgary Century Downs Century Bets! Total Canada Net operating revenue $ 6,681 $ 2,242 $ 75 $ 0 $ 8,998 Net earnings (loss) attributable to Century Casinos, Inc. shareholders 1,407 (285) 19 0 1,141 Interest expense (income), net 132 0 534 0 666 Income taxes (benefit) 471 (95) 46 0 422 Depreciation and amortization 281 249 0 0 530 Non-controlling interests 0 0 (674) 0 (674) (Gain) loss on foreign currency transactions and other 173 350 0 0 523 Adjusted EBITDA $ 2,464 $ 219 $ (75) $ 0 $ 2,608 Adjusted EBITDA Margin 37% 10% (100%) N/A 29%
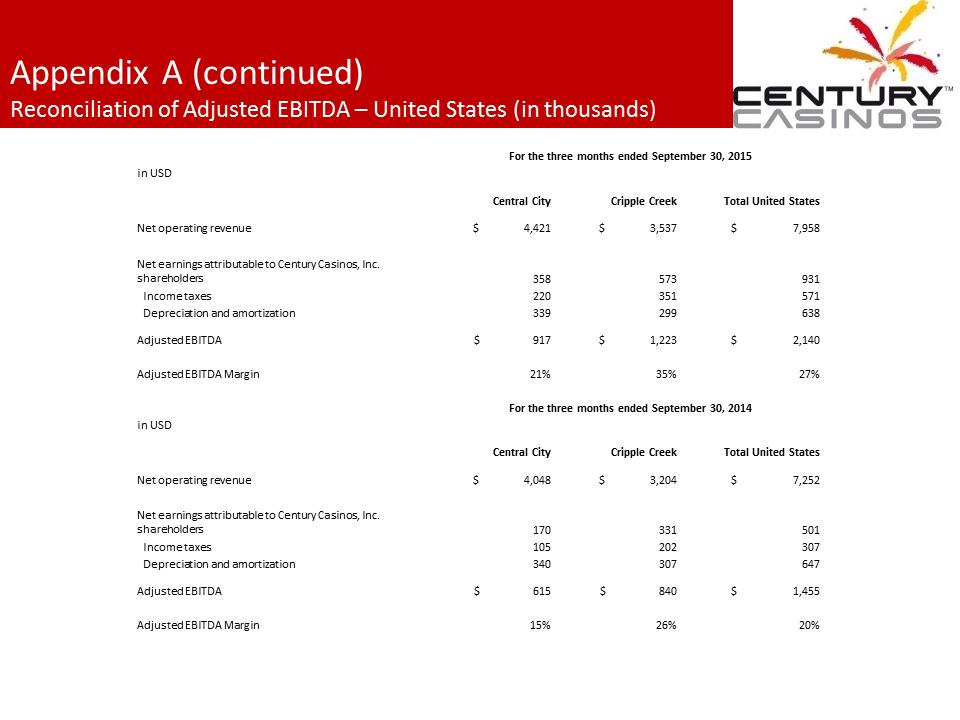 Appendix A (continued) Reconciliation of Adjusted EBITDA – United States (in thousands) For the three months ended September 30, 2015 in USD Central City Cripple Creek Total United States Net operating revenue $ 4,421 $ 3,537 $ 7,958 Net earnings attributable to Century Casinos, Inc. shareholders 358 573 931 Income taxes 220 351 571 Depreciation and amortization 339 299 638 Adjusted EBITDA $ 917 $ 1,223 $ 2,140 Adjusted EBITDA Margin 21% 35% 27% For the three months ended September 30, 2014 in USD Central City Cripple Creek Total United States Net operating revenue $ 4,048 $ 3,204 $ 7,252 Net earnings attributable to Century Casinos, Inc. shareholders 170 331 501 Income taxes 105 202 307 Depreciation and amortization 340 307 647 Adjusted EBITDA $ 615 $ 840 $ 1,455 Adjusted EBITDA Margin 15% 26% 20%
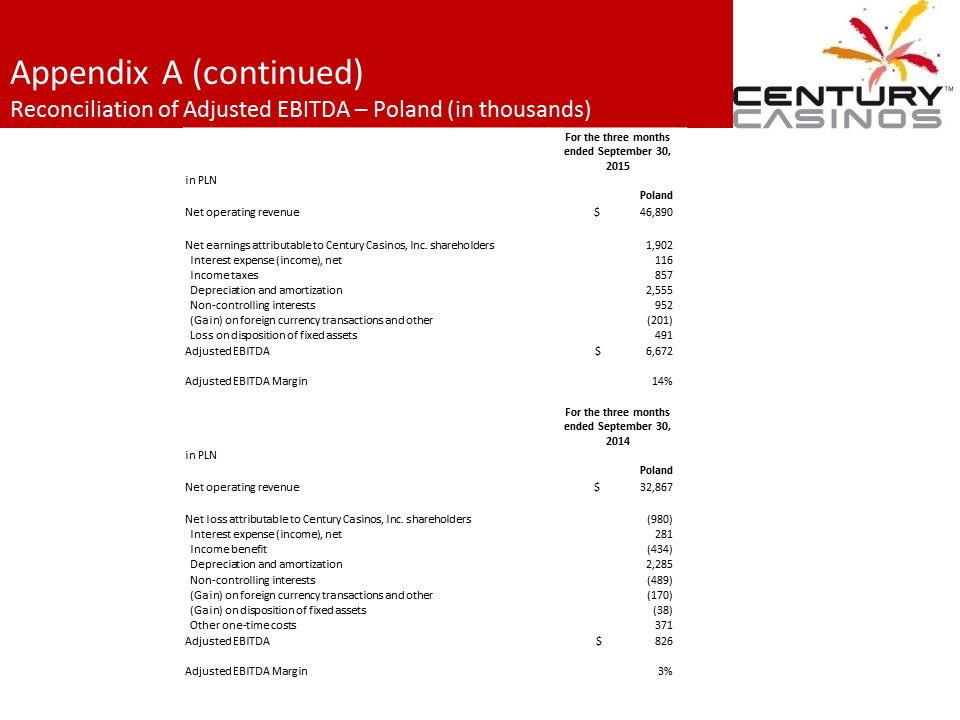 Appendix A (continued) Reconciliation of Adjusted EBITDA – Poland (in thousands) For the three months ended September 30, 2015 in PLN Poland Net operating revenue $ 46,890 Net earnings attributable to Century Casinos, Inc. shareholders 1,902 Interest expense (income), net 116 Income taxes 857 Depreciation and amortization 2,555 Non-controlling interests 952 (Gain) on foreign currency transactions and other (201) Loss on disposition of fixed assets 491 Adjusted EBITDA $ 6,672 Adjusted EBITDA Margin 14% For the three months ended September 30, 2014 in PLN Poland Net operating revenue $ 32,867 Net loss attributable to Century Casinos, Inc. shareholders (980) Interest expense (income), net 281 Income benefit (434) Depreciation and amortization 2,285 Non-controlling interests (489) (Gain) on foreign currency transactions and other (170) (Gain) on disposition of fixed assets (38) Other one-time costs 371 Adjusted EBITDA $ 826 Adjusted EBITDA Margin 3%
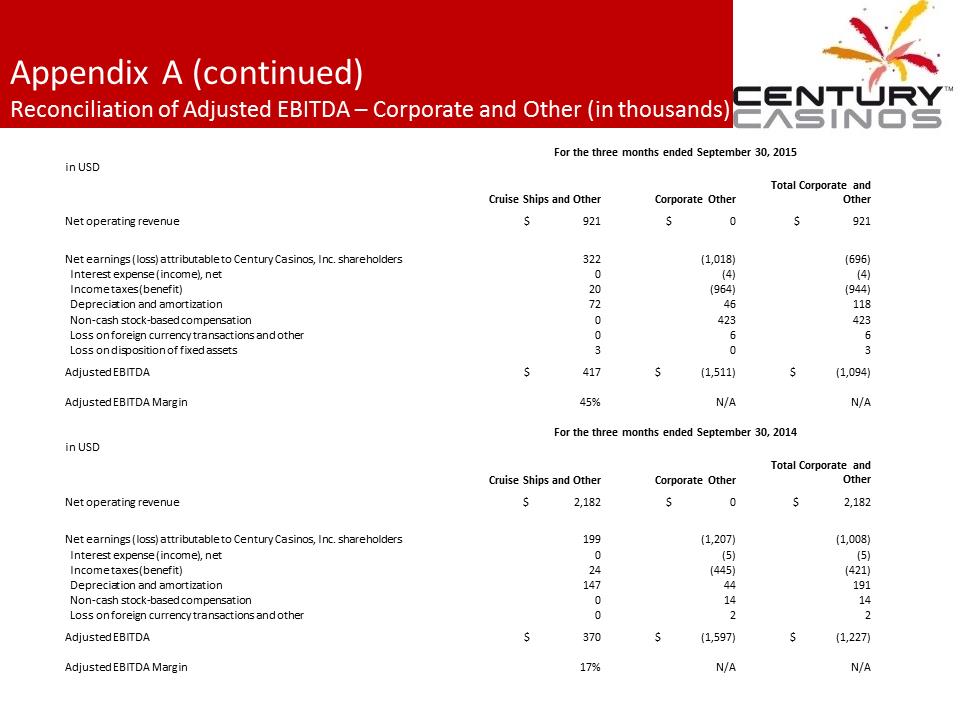 Appendix A (continued) Reconciliation of Adjusted EBITDA – Corporate and Other (in thousands) For the three months ended September 30, 2015 in USD Cruise Ships and Other Corporate Other Total Corporate and Other Net operating revenue $ 921 $ 0 $ 921 Net earnings (loss) attributable to Century Casinos, Inc. shareholders 322 (1,018) (696) Interest expense (income), net 0 (4) (4) Income taxes (benefit) 20 (964) (944) Depreciation and amortization 72 46 118 Non-cash stock-based compensation 0 423 423 Loss on foreign currency transactions and other 0 6 6 Loss on disposition of fixed assets 3 0 3 Adjusted EBITDA $ 417 $ (1,511) $ (1,094) Adjusted EBITDA Margin 45% N/A N/A For the three months ended September 30, 2014 in USD Cruise Ships and Other Corporate Other Total Corporate and Other Net operating revenue $ 2,182 $ 0 $ 2,182 Net earnings (loss) attributable to Century Casinos, Inc. shareholders 199 (1,207) (1,008) Interest expense (income), net 0 (5) (5) Income taxes (benefit) 24 (445) (421) Depreciation and amortization 147 44 191 Non-cash stock-based compensation 0 14 14 Loss on foreign currency transactions and other 0 2 2 Adjusted EBITDA $ 370 $ (1,597) $ (1,227) Adjusted EBITDA Margin 17% N/A N/A