 Financial Results Q4 2015
 Forward-Looking Statements, Business Environment and Risk FactorsThis presentation may contain “forward-looking statements” within the meaning of Section 27A of the Securities Act of 1933, as amended, Section 21E of the Securities Exchange Act of 1934, as amended (the “Exchange Act”), and the Private Securities Litigation Reform Act of 1995. In addition, Century Casinos, Inc. (together with its subsidiaries, the “Company”) may make other written and oral communications from time to time that contain such statements. Forward-looking statements include statements as to industry trends and future expectations of the Company and other matters that do not relate strictly to historical facts and are based on certain assumptions by management at the time such statements are made. These statements are often identified by the use of words such as “may,” “will,” “expect,” “believe,” “anticipate,” “intend,” “could,” “estimate,” or “continue,” and similar expressions or variations. These statements are based on the beliefs and assumptions of the management of the Company based on information currently available to management. Such forward-looking statements are subject to risks, uncertainties and other factors that could cause actual results to differ materially from future results expressed or implied by such forward-looking statements. Important factors that could cause actual results to differ materially from the forward-looking statements include, among others, the risks described in the section entitled “Risk Factors” under Item 1A in our Annual Report on Form 10-K for the year ended December 31, 2015. We caution the reader to carefully consider such factors. Furthermore, such forward-looking statements speak only as of the date on which such statements are made. We undertake no obligation to update any forward-looking statements to reflect events or circumstances after the date of such statements.In this presentation the term “USD” refers to US dollars, the term “CAD” refers to Canadian dollars and the term “PLN” refers to Polish zloty.Adjusted EBITDA and Adjusted EBITDA margin are non-GAAP financial measures. See Appendix A for the definition and reconciliation of Adjusted EBITDA and Adjusted EBITDA margin.Amounts presented are rounded. As such, rounding differences could occur in period over period changes and percentages reported throughout this presentation.
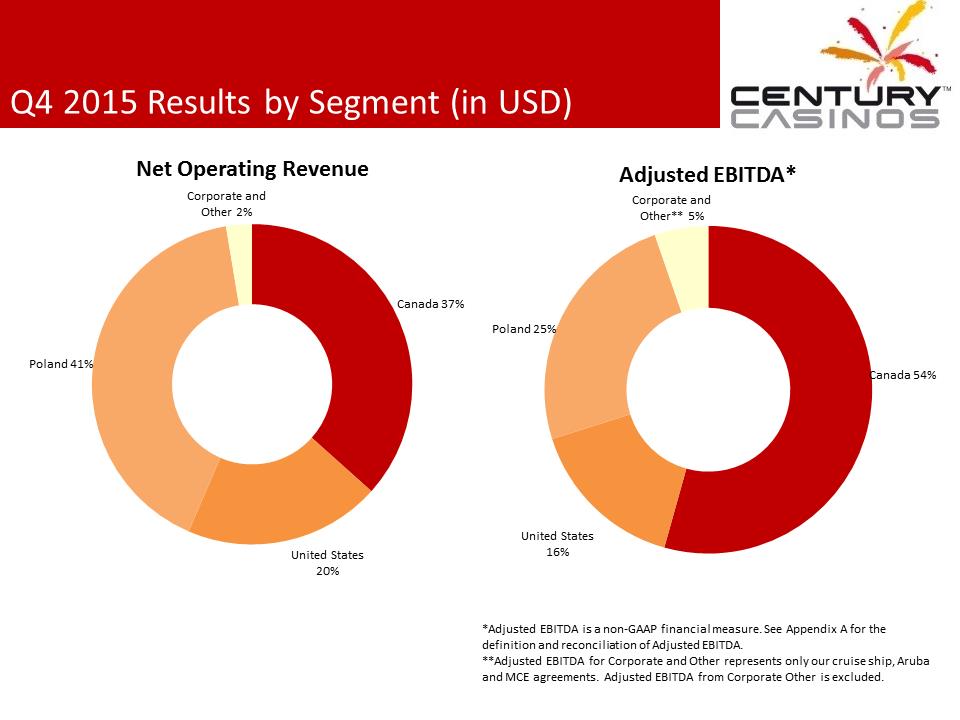 Q4 2015 Results by Segment (in USD) *Adjusted EBITDA is a non-GAAP financial measure. See Appendix A for the definition and reconciliation of Adjusted EBITDA.**Adjusted EBITDA for Corporate and Other represents only our cruise ship, Aruba and MCE agreements. Adjusted EBITDA from Corporate Other is excluded.Canada 37%United States 20%Poland 41%Corporate and Other 2%Net Operating RevenueCanada 54%United States 16%Poland 25%Corporate and Other** 5%Adjusted EBITDA*
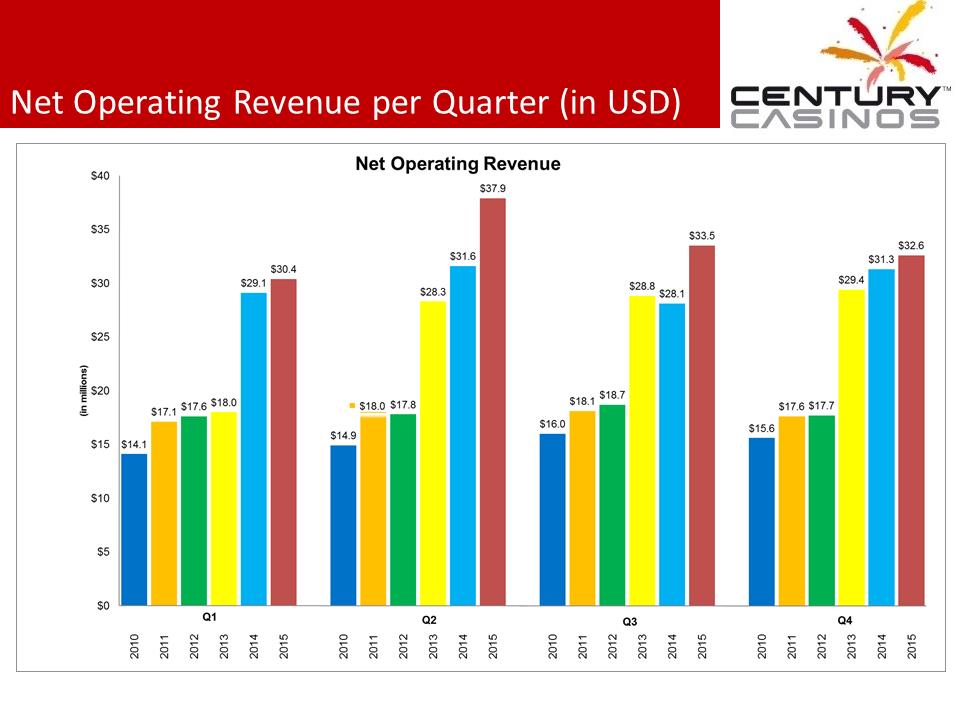 Net Operating Revenue per Quarter (in USD)
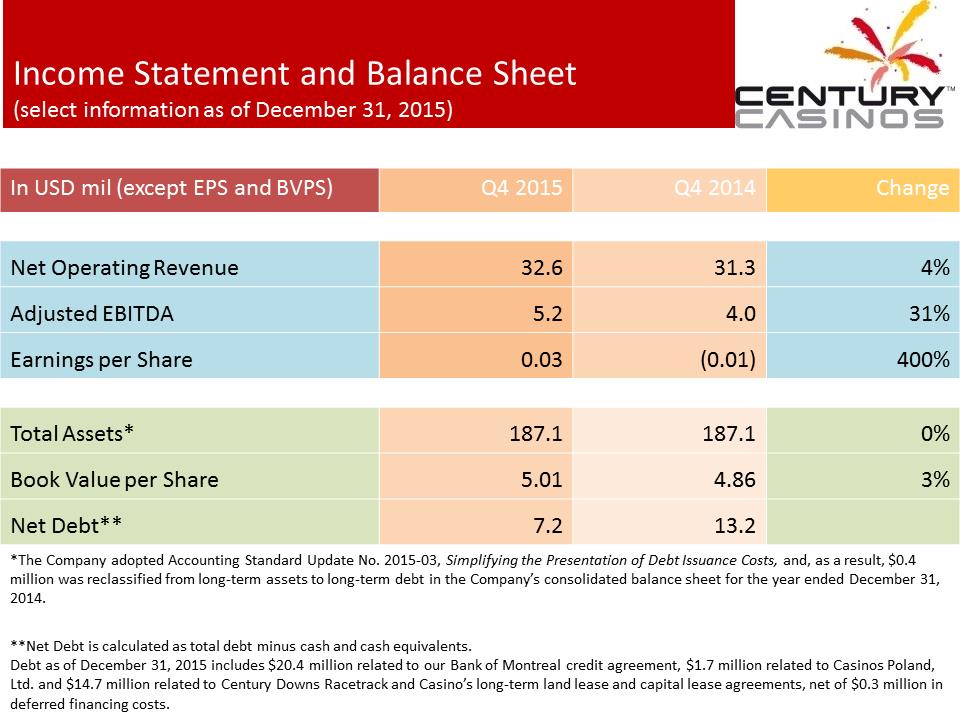 Income Statement and Balance Sheet (select information as of December 31, 2015)In USD mil (except EPS and BVPS) Q4 2015 Q4 2014 Change Net Operating Revenue 32.6 31.3 4% Adjusted EBITDA 5.2 4.0 31% Earnings per Share 0.03 (0.01) 400% Total Assets* 187.1 187.1 0% Book Value per Share 5.01 4.86 3% Net Debt** 7.2 13.2 *The Company adopted Accounting Standard Update No. 2015-03, Simplifying the Presentation of Debt Issuance Costs, and, as a result, $0.4 million was reclassified from long-term assets to long-term debt in the Company’s consolidated balance sheet for the year ended December 31, 2014. **Net Debt is calculated as total debt minus cash and cash equivalents.Debt as of December 31, 2015 includes $20.4 million related to our Bank of Montreal credit agreement, $1.7million related to Casinos Poland, Ltd. and $14.7 million related to Century Downs Racetrack and Casino’s long-term land lease and capital lease agreements, net of$0.3 million in deferred financing costs.
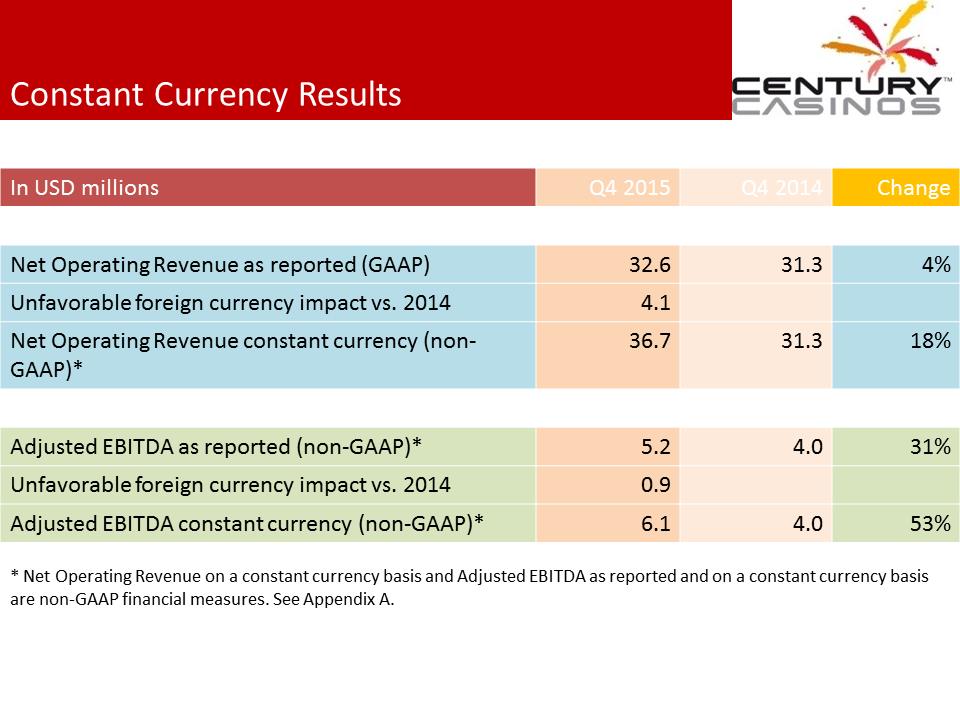 Constant Currency ResultsIn USD millions Q4 2015 Q4 2014 Change Net Operating Revenue as reported (GAAP) 32.6 31.3 4% Unfavorable foreign currency impact vs. 2014 4.1 Net Operating Revenue constant currency (non-GAAP)* 36.7 31.3 18% Adjusted EBITDA as reported (non-GAAP)* 5.2 4.0 31% Unfavorable foreign currency impact vs. 2014 0.9 Adjusted EBITDA constant currency (non-GAAP)* 6.1 4.0 * Net Operating Revenue on a constant currency basis and Adjusted EBITDA as reported and on a constant currency basis are non-GAAP financial measures. See Appendix A. 53%
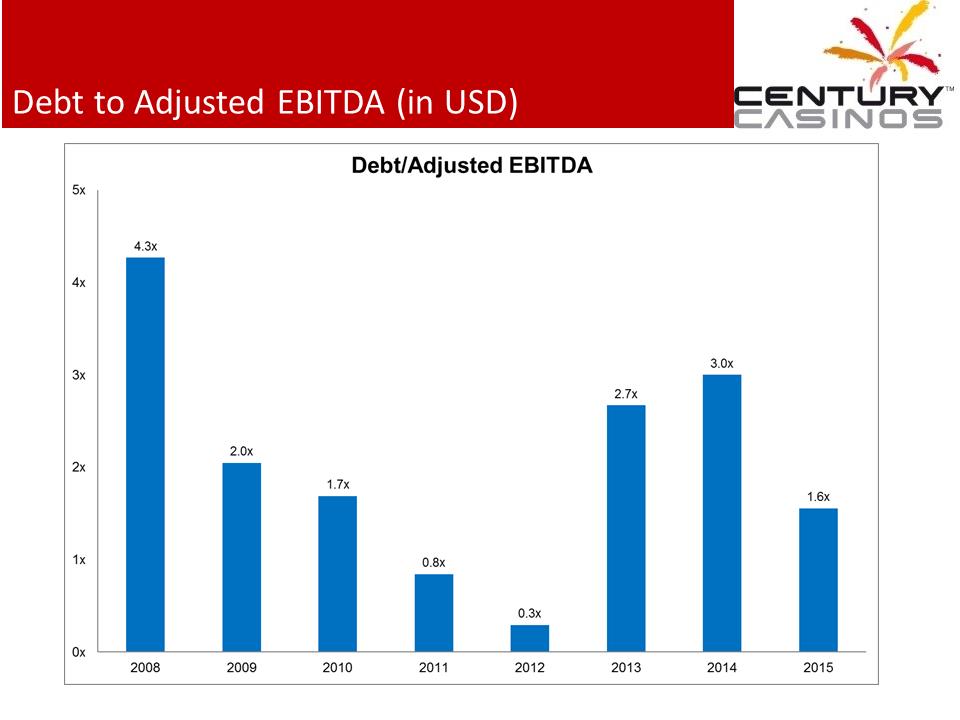 Debt to Adjusted EBITDA (in USD)
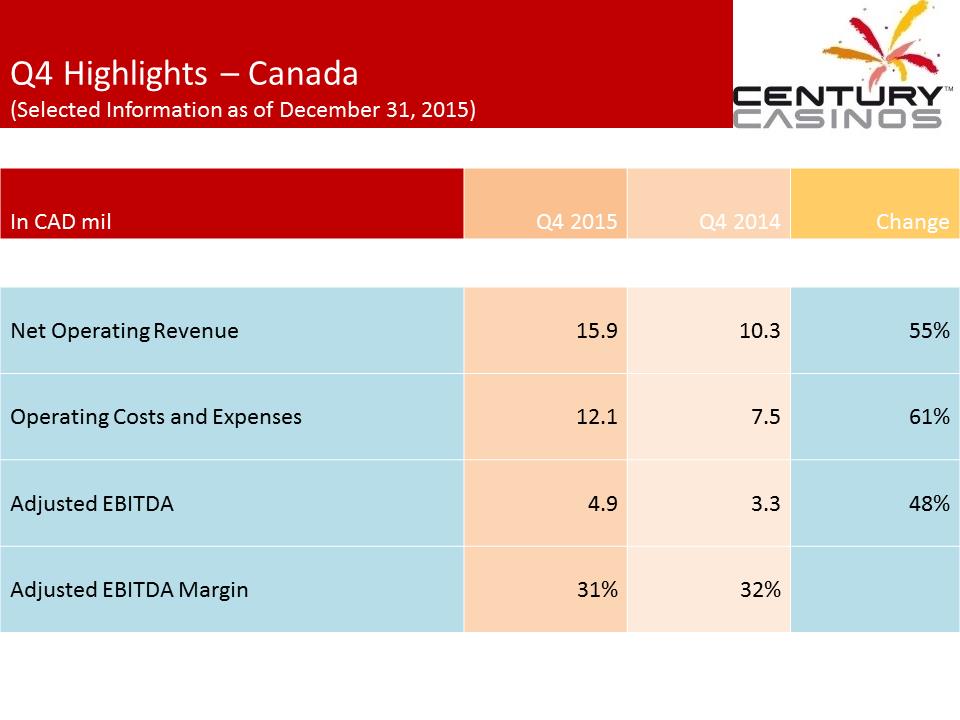 Q4 Highlights –Canada (Selected Information as of December 31, 2015)In CAD mil Q42015 Q4 2014 Change Net Operating Revenue 15.9 10.3 55% Operating Costs and Expenses 12.1 7.5 61% Adjusted EBITDA 4.9 3.3 48% Adjusted EBITDA Margin 31% 32%
 Q4 Highlights –Canada (Selected Information as of December 31, 2015)Edmonton In CAD mil Q4 2015 Q4 2014 Change Net Operating Revenue 7.5 7.5 0% Operating Costs and Expenses 5.1 5.0 1% Adjusted EBITDA 2.8 2.8 0% Adjusted EBITDA Margin 37% 37% As of December 31, 2015, the facility had 777 slot machines, 35 tables and 17 video lottery terminals.
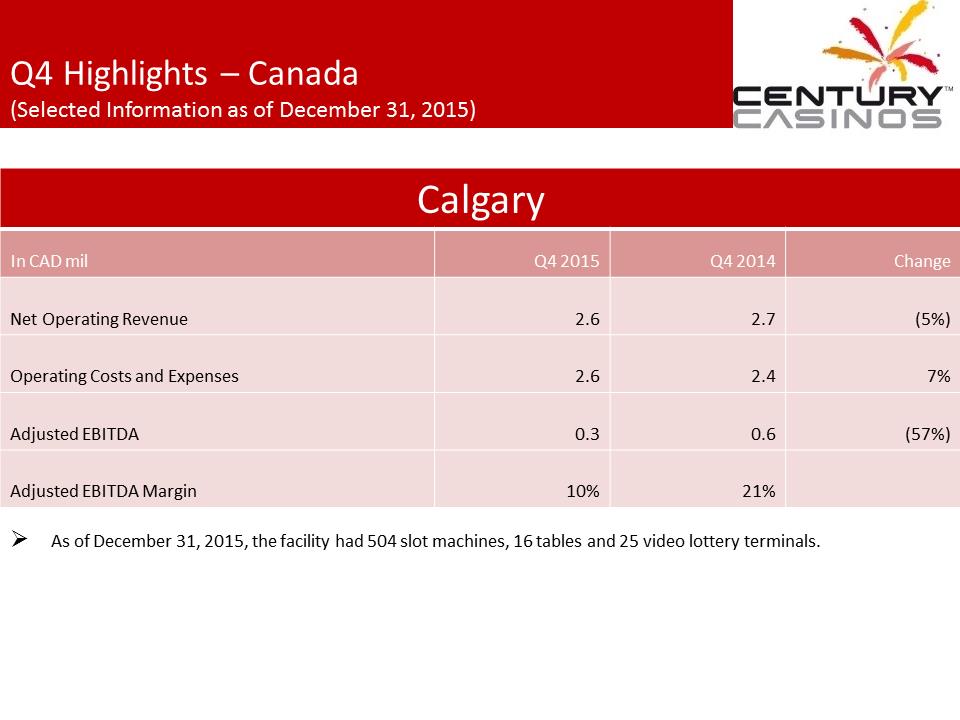 Q4 Highlights –Canada (Selected Information as of December 31, 2015)Calgary In CAD mil Q4 2015 Q4 2014 Change Net Operating Revenue 2.6 2.7 (5%) Operating Costs and Expenses 2.6 2.4 7% Adjusted EBITDA 0.3 0.6 (57%) Adjusted EBITDA Margin 10% 21% As of December 31, 2015, the facility had 504 slot machines, 16 tables and 25 video lottery terminals.
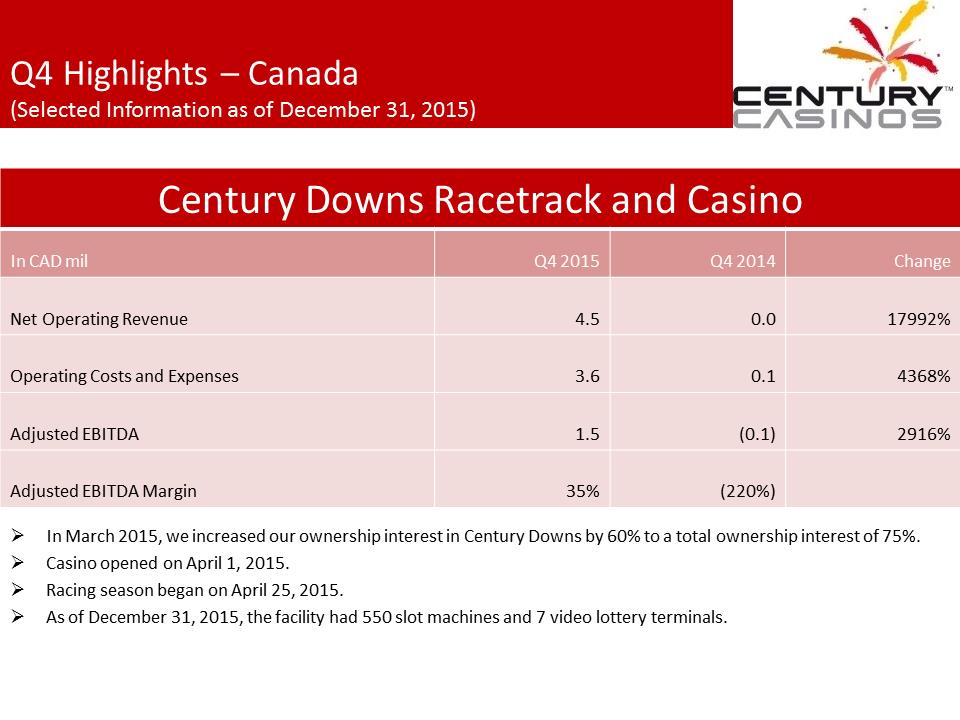 Q4 Highlights –Canada (Selected Information as of December 31, 2015)Century Downs Racetrack and Casino In CAD mil Q4 2015 Q4 2014 Change Net Operating Revenue 4.5 0.0 17992% Operating Costs and Expenses 3.6 0.1 4368% Adjusted EBITDA 1.5 (0.1) 2916% Adjusted EBITDA Margin 35% (220%) In March 2015, we increased our ownership interest in Century Downs by 60% to a total ownership interest of 75%.Casino opened on April 1, 2015.Racing season began on April 25, 2015.As of December 31, 2015, the facility had 550 slot machines and 7 video lottery terminals.
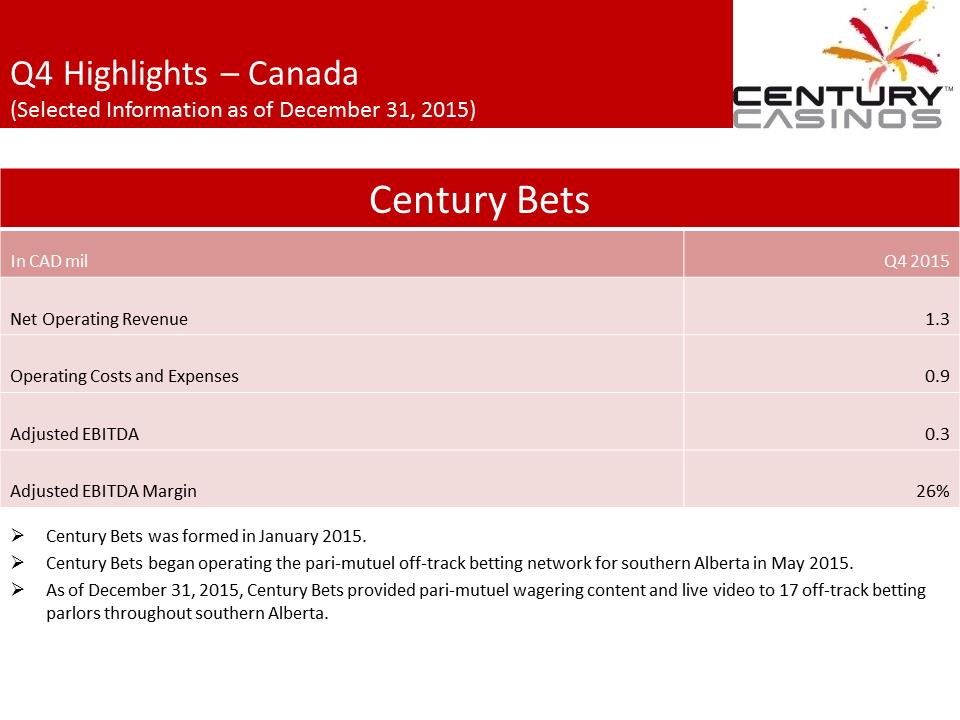 Q4 Highlights –Canada (Selected Information as of December 31, 2015)Century Bets In CAD mil Q4 2015 Net Operating Revenue 1.3 Operating Costs and Expenses 0.9 Adjusted EBITDA 0.3 Adjusted EBITDA Margin 26% Century Bets was formed in January 2015.Century Bets began operating the pari-mutuel off-track betting network for southern Alberta in May 2015.As of December 31, 2015, Century Bets provided pari-mutuel wagering content and live video to 17 off-track betting parlors throughout southern Alberta.
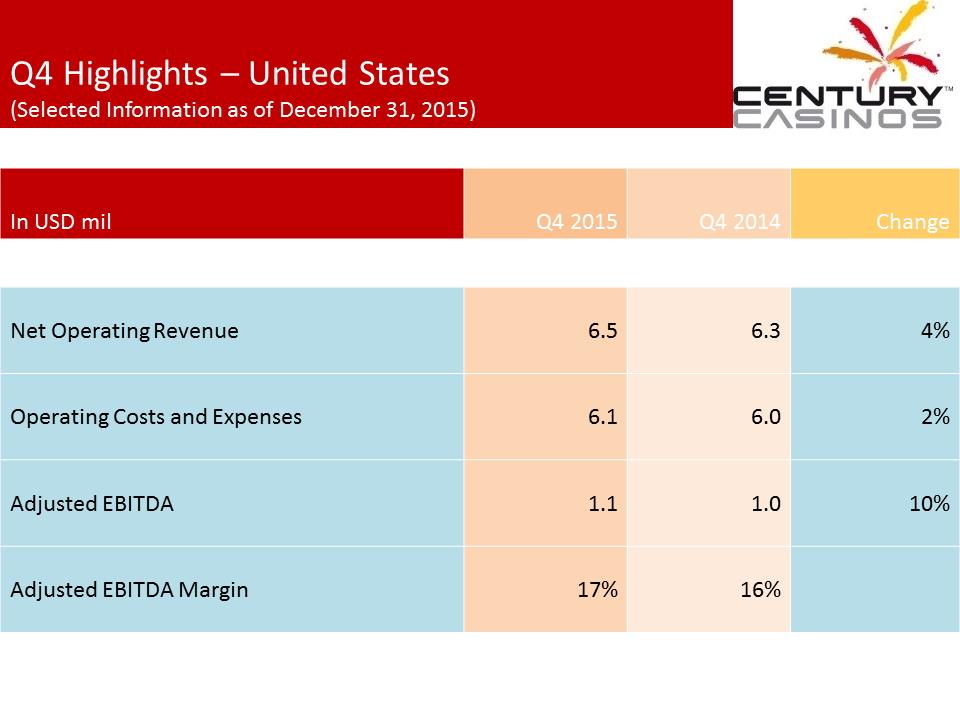 Q4 Highlights –United States (Selected Information as of December 31, 2015)In USD mil Q42015 Q4 2014 Change Net Operating Revenue 6.5 6.3 4% Operating Costs and Expenses 6.1 6.0 2% Adjusted EBITDA 1.1 1.0 10% Adjusted EBITDA Margin 17% 16%
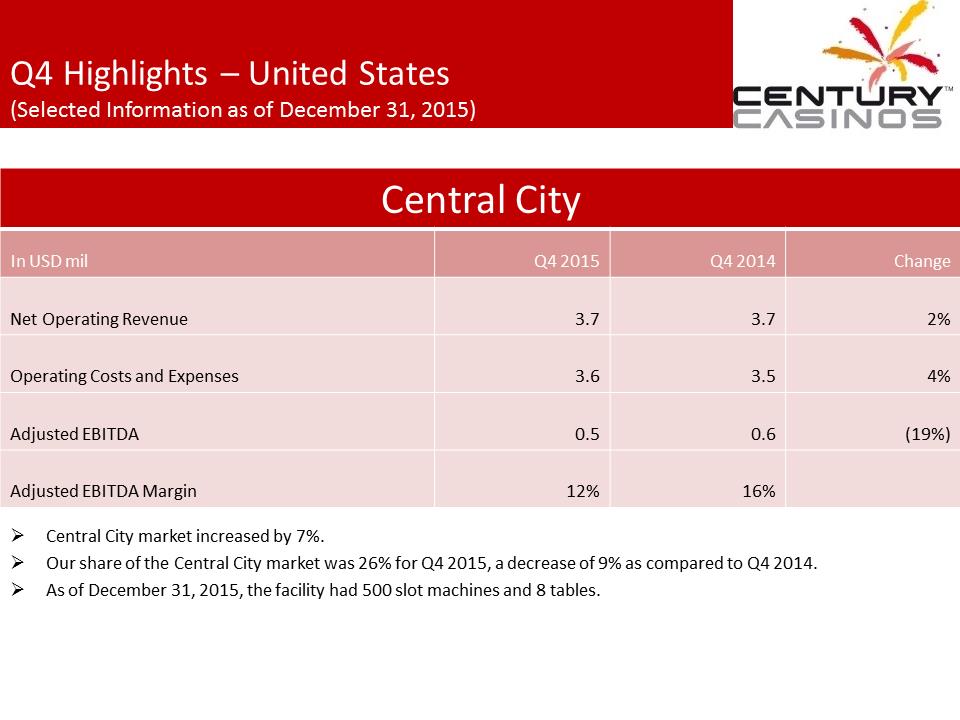 Q4 Highlights –United States (Selected Information as of December 31, 2015)Central City In USD mil Q4 2015 Q4 2014 Change Net Operating Revenue 3.7 3.7 2% Operating Costs and Expenses 3.6 3.5 4% Adjusted EBITDA 0.5 0.6 (19%) Adjusted EBITDA Margin 12% 16% Central City market increased by 7%.Our share of the Central City market was 26% for Q4 2015, a decrease of 9% as compared to Q4 2014..As of December 31, 2015, the facility had 500 slot machines and 8 tables.
 Q4 Highlights –United States(Selected Information as of December 31, 2015)Cripple Creek In USD mil Q4 2015 Q4 2014 Change Net Operating Revenue 2.7 2.6 7% Operating Costs and Expenses 2.4 2.5 (1%) Adjusted EBITDA 0.6 0.4 51% Adjusted EBITDA Margin 22% 16% The Cripple Creek market increased by 7%.Our share of the Cripple Creek market was 10% in Q4 2015, a decrease of 4% as compared to Q4 2014..As of December 31, 2015, the facility had 443 slot machines and 6 tables.
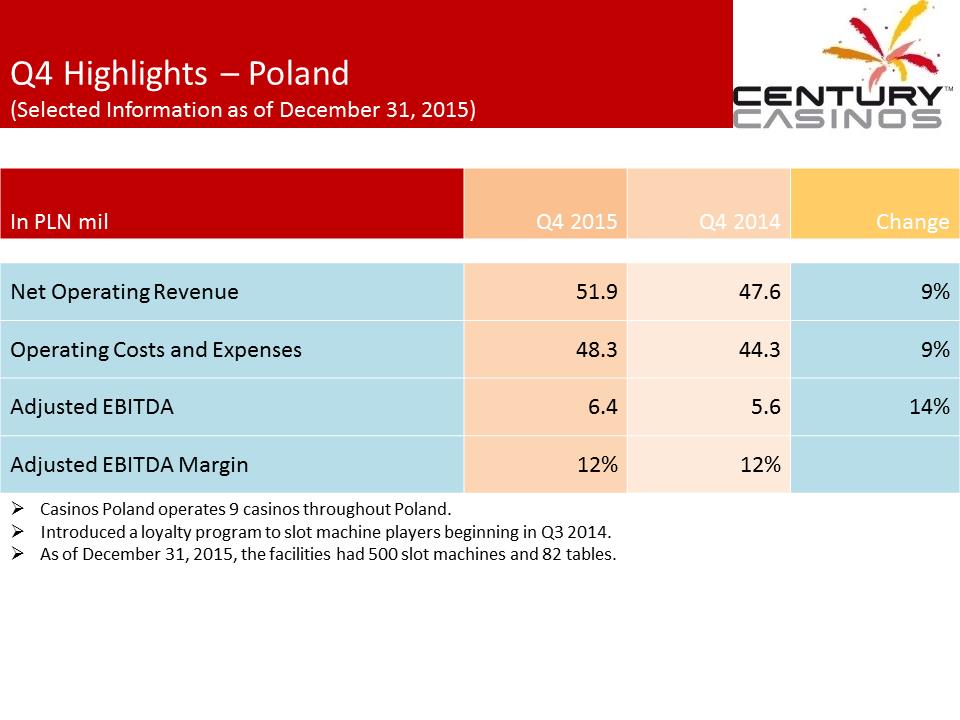 Q4 Highlights –Poland (Selected Information as of December 31, 2015)In PLN mil Q42015 Q4 2014 Change Net Operating Revenue 51.9 47.6 9% Operating Costs and Expenses 48.3 44.3 9% Adjusted EBITDA 6.4 5.6 14% Adjusted EBITDA Margin 12% 12% Casinos Poland operates 9 casinos throughout Poland.Introduced a loyalty program to slot machine players beginning in Q3 2014.As of December 31, 2015, the facilities had 500 slot machines and 82 tables.
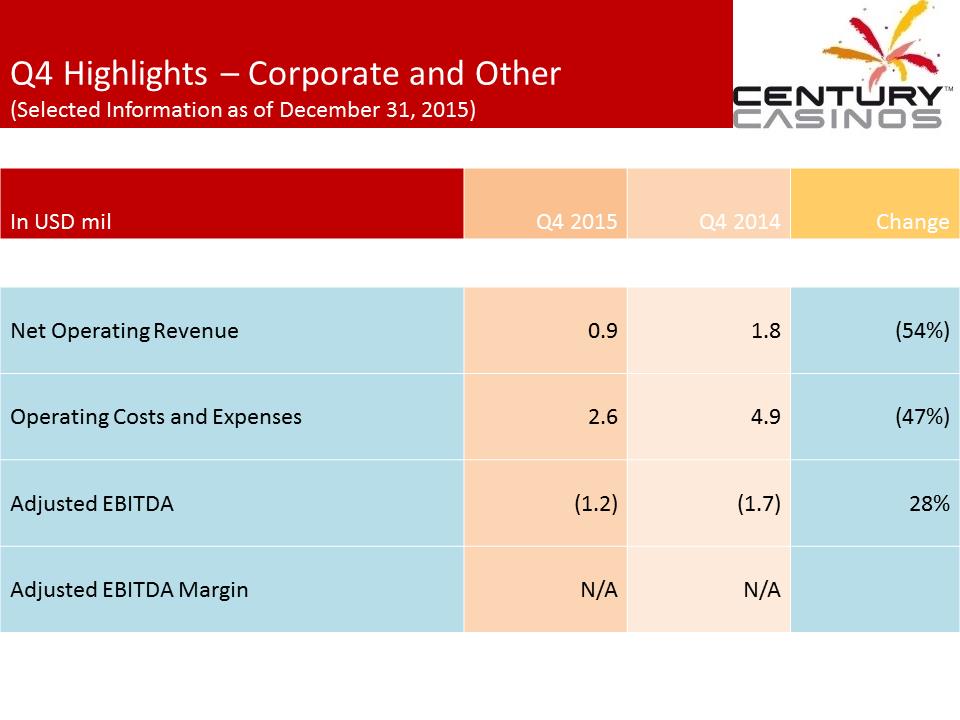 Q4 Highlights –Corporate and Other (Selected Information as of December 31, 2015)In USD mil Q42015 Q4 2014 Change Net Operating Revenue 0.9 1.8 (54%) Operating Costs and Expenses 2.6 4.9 (47%) Adjusted EBITDA (1.2) (1.7) 28% Adjusted EBITDA Margin N/A N/A
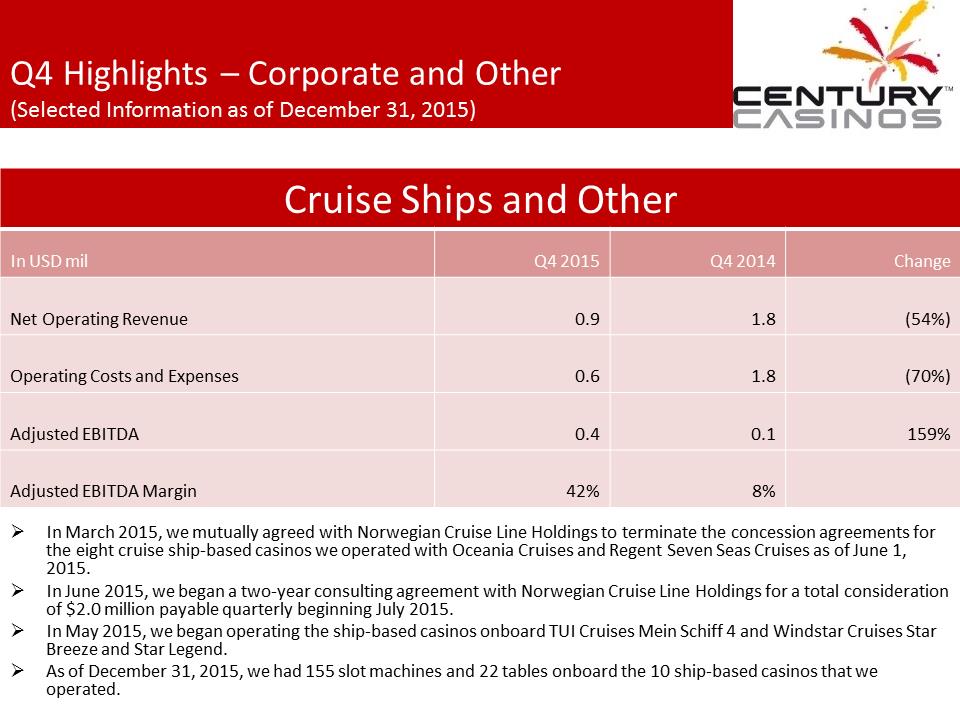 Q4 Highlights –Corporate and Other (Selected Information as of December 31, 2015)Cruise Ships and Other In USD mil Q4 2015 Q4 2014 Change Net Operating Revenue 0.9 1.8 (54%) Operating Costs and Expenses 0.6 1.8 (70%) Adjusted EBITDA 0.4 0.1 159% Adjusted EBITDA Margin 42% 8% In March 2015, we mutually agreed with Norwegian Cruise Line Holdings to terminate the concession agreements for the eight cruise ship-based casinos we operated with Oceania Cruises and Regent Seven Seas Cruises as of June 1, 2015.In June 2015, we began a two-year consulting agreement with Norwegian Cruise Line Holdings for a total consideration of $2.0 million payable quarterly beginning July 2015.In May 2015, we began operating the ship-based casinos onboard TUI Cruises Mein Schiff 4 and Windstar Cruises Star Breeze and Star Legend.As of December 31, 2015, we had 155 slot machines and 22 tables onboard the 10 ship-based casinos that we operated.
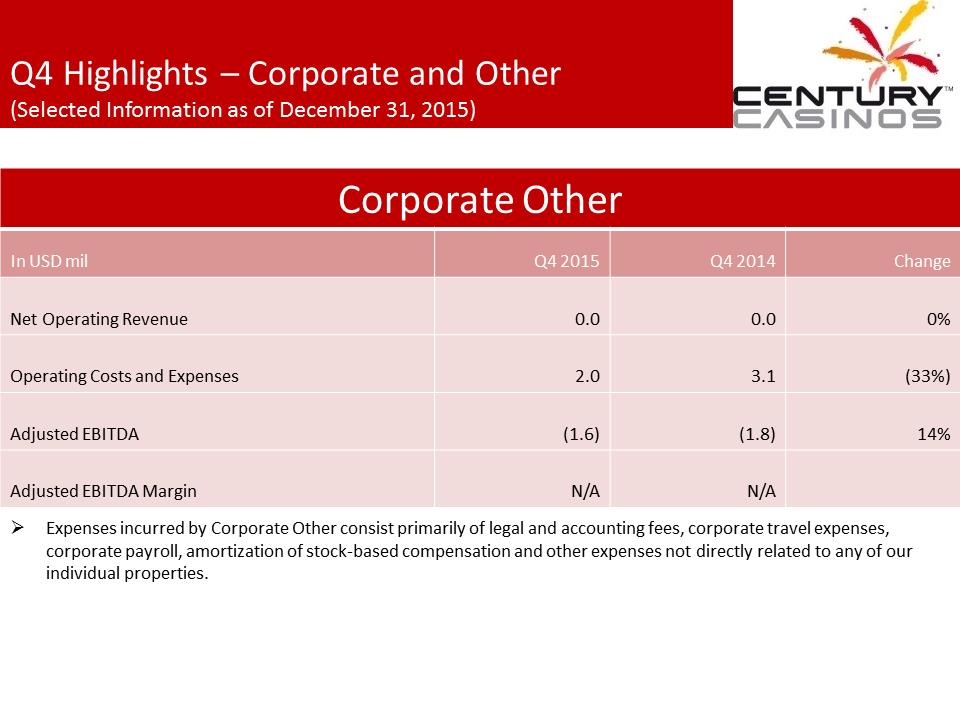 Q4 Highlights –Corporate and Other (Selected Information as of December 31, 2015)Corporate Other In USD mil Q4 2015 Q4 2014 Change Net Operating Revenue 0.0 0.0 0% Operating Costs and Expenses 2.0 3.1 (33%) Adjusted EBITDA (1.6) (1.8) 14% Adjusted EBITDA Margin N/A N/A Expenses incurred by Corporate Other consist primarily of legal and accounting fees, corporate travel expenses, corporate payroll, amortization of stock-based compensation and other expenses not directly related to any of our individual properties.
 Appendix A –Non GAAP Financial Measures The Company supplements its condensed onsolidated financial statements prepared in accordance with U.S. generally accepted accounting principles (“US GAAP”) by using the following non-GAAP financial measures, which management believes are useful in properly understanding the Company’s short-term and long-term financial trends. Management uses these non-GAAP financial measures to forecast and evaluate the operational performance of the Company as well as to compare results of current periods to prior periods on a consolidated basis.Adjusted EBITDAAdjusted EBITDA marginConstant currency resultsManagement believes presenting the non-GAAP financial measures used in this presentation provides investors greater transparency to the information used by management for financial and operational decision-making and allows investors to see the Company’s results “through the eyes” of management. Management also believes providing this information better enables our investors to understand the Company’s operating performance and evaluate the methodology used by management to evaluate and measure such performance.The adjustments made to GAAP financial measures result from facts and circumstances that vary in frequency and impact on the Company’s results of operations. The following is an explanation of each of the adjustments that management excludes in calculating its non-GAAP financial measures.
 Appendix A –Non GAAP Financial MeasuresThe Company defines Adjusted EBITDA as net earnings (loss) before interest expense (income), net, income taxes (benefit), depreciation, amortization, non-controlling interest (earnings) losses and transactions, pre-opening expenses ,acquisition costs, non-cash stock-based compensation charges, asset impairment costs, (gain) loss on disposition of fixed assets, discontinued operations, (gain) loss on foreign currency transactions and other, gain on business combination and certain other one-time items such as the consideration for the early termination of the concession agreements with Oceania Cruises and Regent Seven Seas Cruises. Intercompany transactions consisting primarily of management and royalty fees and interest, along with their related tax effects, are excluded from the presentation of net earnings (loss) and Adjusted EBITDA reported for each segment and property. Not all of the aforementioned items occur in each reporting period, but have been included in the definition based on historical activity. These adjustments have no effect on the consolidated results as reported under US GAAP. Adjusted EBITDA is not considered a measure of performance recognized under US GAAP. Management believes that Adjusted EBITDA is a valuable measure of the relative performance of the Company and its properties.The gaming industry commonly uses Adjusted EBITDA as a method of arriving at the economic value of a casino operation. Management uses Adjusted EBITDA to compare the relative operating performance of separate operating units by eliminating the above mentioned items associated with the varying levels of capital expenditures for infrastructure required to generate revenue, and the often high cost of acquiring existing operations. Adjusted EBITDA is used by the Company’s lending institution to gauge operating performance. The Company’s computation of Adjusted EBITDA may be different from, and therefore may not be comparable to, similar measures used by other companies within the gaming industry. Please see the reconciliation of Adjusted EBITDA to net earnings (loss)below.The Company defines adjusted EBITDA margin as Adjusted EBITDA divided by net operating revenue. Management uses this margin as one of several measures to evaluate the efficiency of the Company’s casino operations.The impact of foreign exchange rates is highly variable and difficult to predict. The Company uses a Constant Currency basis to show the impact from foreign exchange rates on current period revenue compared to prior period revenue using the prior period’s foreign exchange rates. In order to properly understand the underlying business trends and performance of the Company’s ongoing operations, management believes that investors may find it useful to consider the impact of excluding changes in foreign exchange rates from the Company’s net operating revenue and Adjusted EBITDA.
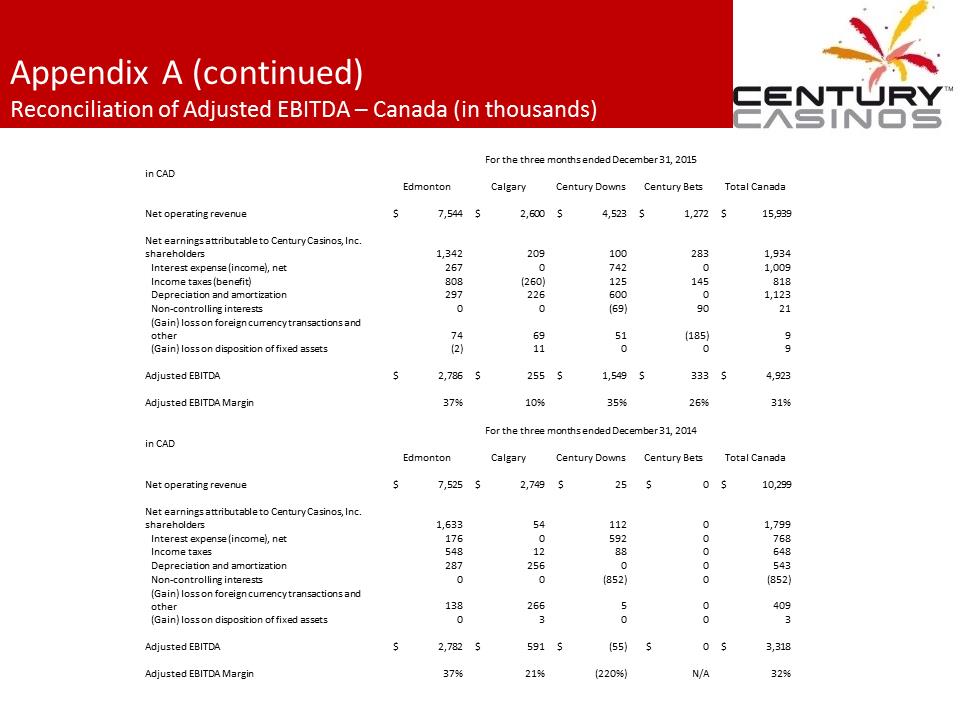 Appendix A (continued)Reconciliation of Adjusted EBITDA –Canada (in thousands)For the three months ended December 31, 2015in CADEdmontonCalgaryCentury DownsCentury BetsTotal CanadaNet operating revenue$ 7,544 $ 2,600 $ 4,523 $ 1,272 $ 15,939 Net earnings attributable to Century Casinos, Inc. shareholders1,342 209 100 283 1,934 Interest expense (income), net267 0 742 0 1,009 Income taxes (benefit)808 (260)125 145 818 Depreciation and amortization297 226 600 0 1,123 Non-controlling interests0 0 (69)90 21 (Gain) loss on foreign currency transactions and other74 69 51 (185)9 (Gain) loss on disposition of fixed assets(2)11 0 0 9 Adjusted EBITDA$ 2,786 $ 255 $ 1,549 $ 333 $ 4,923 Adjusted EBITDA Margin37%10%35%26%31%For the three months ended December 31, 2014in CADEdmontonCalgaryCentury DownsCentury BetsTotal CanadaNet operating revenue$ 7,525 $ 2,749 $ 25 $ 0 $ 10,299 Net earnings attributable to Century Casinos, Inc. shareholders1,633 54 112 0 1,799 Interest expense (income), net176 0 592 0 768 Income taxes 548 12 88 0 648 Depreciation and amortization287 256 0 0 543 Non-controlling interests0 0 (852)0 (852)(Gain) loss on foreign currency transactions and other138 266 5 0 409 (Gain) loss on disposition of fixed assets0 3 0 0 3 Adjusted EBITDA$ 2,782 $ 591 $ (55)$ 0 $ 3,318 Adjusted EBITDA Margin37%21%(220%)N/A32%
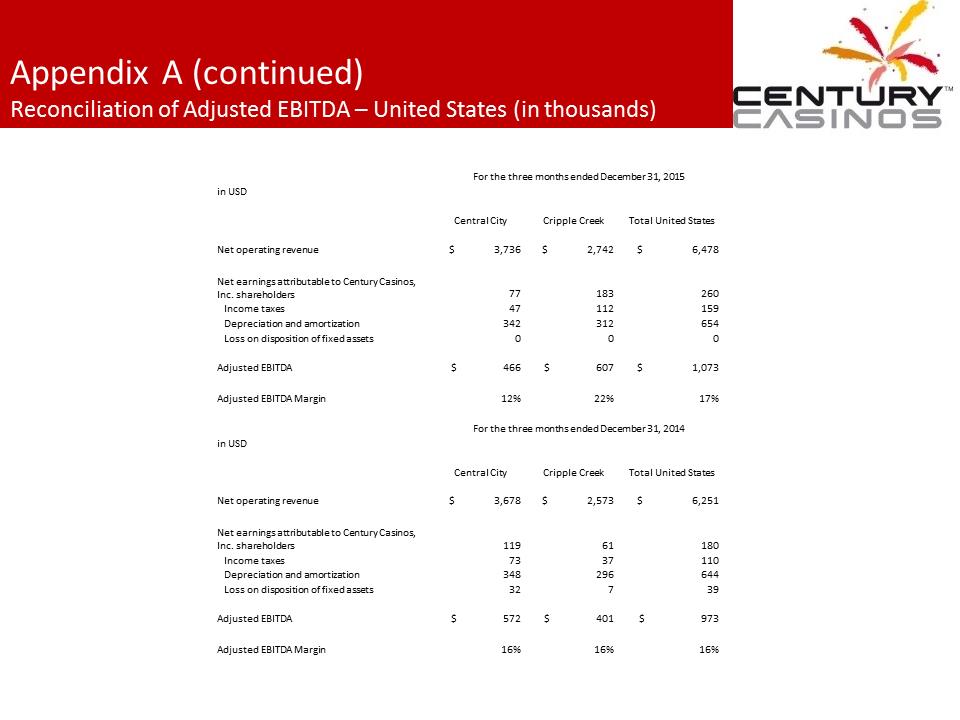 Appendix A (continued)Reconciliation of Adjusted EBITDA –United States (in thousands)in USDCentral CityCripple CreekTotal United StatesNet operating revenue$ 3,736 $ 2,742 $ 6,478 Net earnings attributable to Century Casinos, Inc. shareholders77 183 260 Income taxes47 112 159 Depreciation and amortization342 312 654 Loss on disposition of fixed assets0 0 0 Adjusted EBITDA$ 466 $ 607 $ 1,073 Adjusted EBITDA Margin12%22%17%For the three months ended December 31, 2014in USDCentral CityCripple CreekTotal United StatesNet operating revenue$ 3,678 $ 2,573 $ 6,251 Net earnings attributable to Century Casinos, Inc. shareholders119 61 180 Income taxes73 37 110 Depreciation and amortization348 296 644 Loss on disposition of fixed assets32 7 39 Adjusted EBITDA$ 572 $ 401 $ 973 Adjusted EBITDA Margin16%16%16%
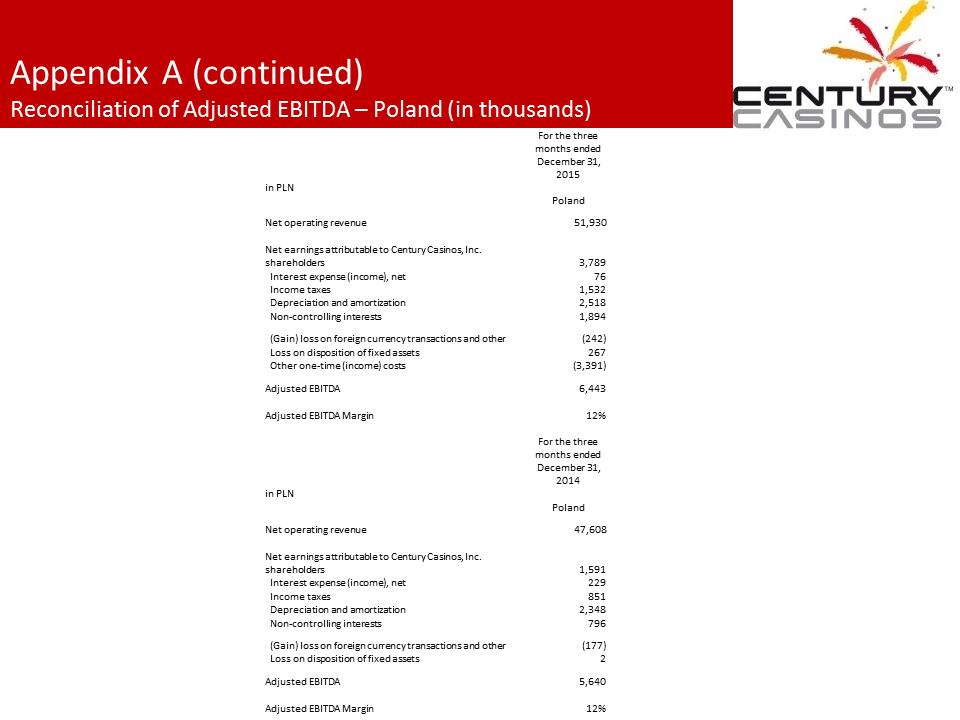 Appendix A (continued)Reconciliation of Adjusted EBITDA –Poland (in thousands)For the three months ended December 31, 2015in PLNPolandNet operating revenue51,930 Net earnings attributable to Century Casinos, Inc. shareholders3,789 Interest expense (income), net76 Income taxes1,532 Depreciation and amortization2,518 Non-controlling interests1,894 (Gain) loss on foreign currency transactions and other(242)Loss on disposition of fixed assets267 Other one-time (income) costs(3,391)Adjusted EBITDA6,443 Adjusted EBITDA Margin12%For the three months ended December 31, 2014in PLNPolandNet operating revenue47,608 Net earnings attributable to Century Casinos, Inc. shareholders1,591 Interest expense (income), net229 Income taxes851 Depreciation and amortization2,348 Non-controlling interests796 (Gain) loss on foreign currency transactions and other(177)Loss on disposition of fixed assets2 Adjusted EBITDA5,640 Adjusted EBITDA Margin12%
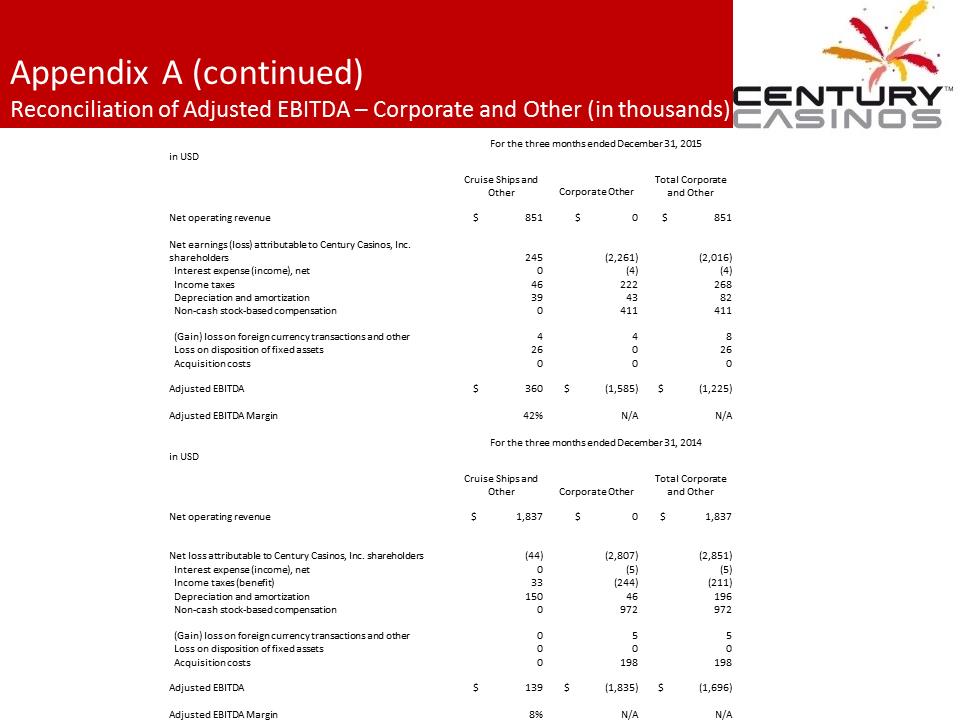 Appendix A (continued)Reconciliation of Adjusted EBITDA –Corporate and Other (in thousands)For the three months ended December 31, 2015in USDCruise Ships and OtherCorporate OtherTotal Corporate and OtherNet operating revenue$ 851 $ 0 $ 851 Net earnings (loss) attributable to Century Casinos, Inc. shareholders245 (2,261)(2,016)Interest expense (income), net0 (4)(4)Income taxes46 222 268 Depreciation and amortization39 43 82 Non-cash stock-based compensation0 411 411 (Gain) loss on foreign currency transactions and other4 4 8 Loss on disposition of fixed assets26 0 26 Acquisition costs0 0 0 Adjusted EBITDA$ 360 $ (1,585)$ (1,225)Adjusted EBITDA Margin42%N/AN/AFor the three months ended December 31, 2014in USDCruise Ships and OtherCorporate OtherTotal Corporate and OtherNet operating revenue$ 1,837 $ 0 $ 1,837 Net loss attributable to Century Casinos, Inc. shareholders(44)(2,807)(2,851)Interest expense (income), net0 (5)(5)Income taxes (benefit)33 (244)(211)Depreciation and amortization150 46 196 Non-cash stock-based compensation0 972 972 (Gain) loss on foreign currency transactions and other0 5 5 Loss on disposition of fixed assets0 0 0 Acquisition costs0 198 198 Adjusted EBITDA$ 139 $ (1,835)$ (1,696)Adjusted EBITDA Margin8%N/AN/A