 Financial Results Q2 2016
 Forward - Looking Statements, Business Environment and Risk Factors This presentation may contain “forward - looking statements” within the meaning of Section 27 A of the Securities Act of 1933, as amended, Section 21 E of the Securities Exchange Act of 1934, as amended (the “Exchange Act”), and the Private Securities Litigation Reform Act of 1995. In addition, Century Casinos, Inc. (together with its subsidiaries, the “Company”) may make other written and oral communications from time to time that contain such statements. Forward - looking statements include statements as to industry trends and future expectations of the Company and other matters that do not relate strictly to historical facts and are based on certain assumptions by management at the time such statements are made. Forward - looking statements in this presentation include statements relating to our acquisition of the Apex Casino in Edmonton, Alberta, Canada, which is expected to close in the fourth quarter of 2016. These statements are often identified by the use of words such as “may,” “will,” “expect,” “believe,” “anticipate,” “intend,” “could,” “estimate,” or “continue,” and similar expressions or variations. These statements are based on the beliefs and assumptions of the management of the Company based on information currently available to management. Such forward - looking statements are subject to risks, uncertainties and other factors that could cause actual results to differ materially from future results expressed or implied by such forward - looking statements. Important factors that could cause actual results to differ materially from the forward - looking statements include, among others, the risks described in the section entitled “Risk Factors” under Item 1 A in our Annual Report on Form 10 - K for the year ended December 31, 2015. We caution the reader to carefully consider such factors. Furthermore, such forward - looking statements speak only as of the date on which such statements are made. We undertake no obligation to update any forward - looking statements to reflect events or circumstances after the date of such statements. In this presentation the term “USD” refers to US dollars, the term “CAD” refers to Canadian dollars and the term “PLN” refers to Polish zloty. Adjusted EBITDA and Adjusted EBITDA margin are non - GAAP financial measures. See Appendix A for the definition and reconciliation of Adjusted EBITDA and Adjusted EBITDA margin. Amounts presented are rounded. As such, rounding differences could occur in period over period changes and percentages reported throughout this presentation.
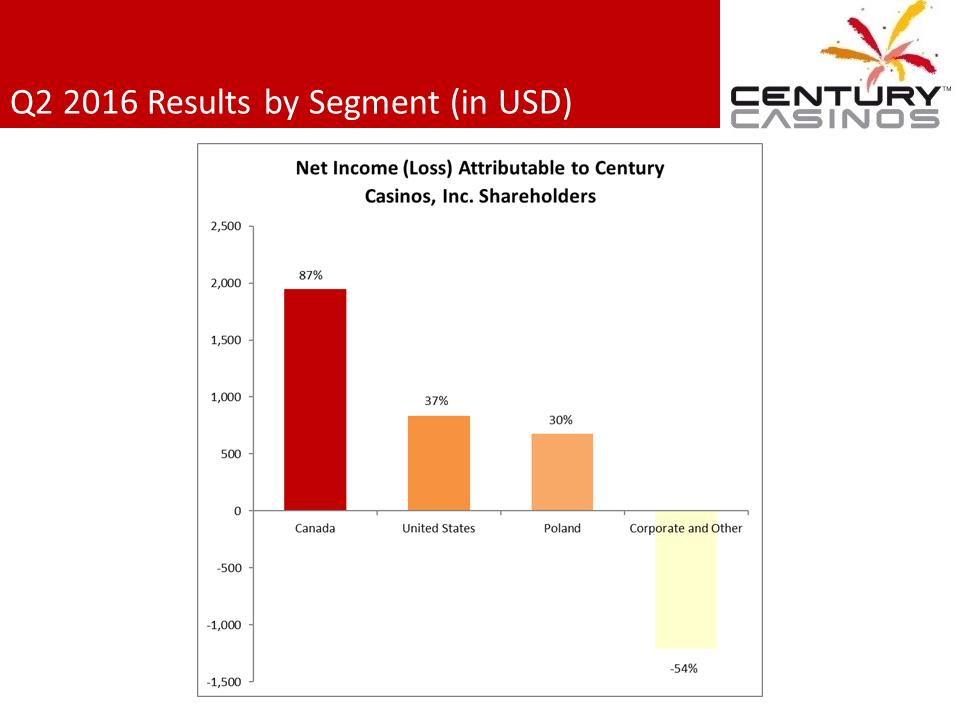
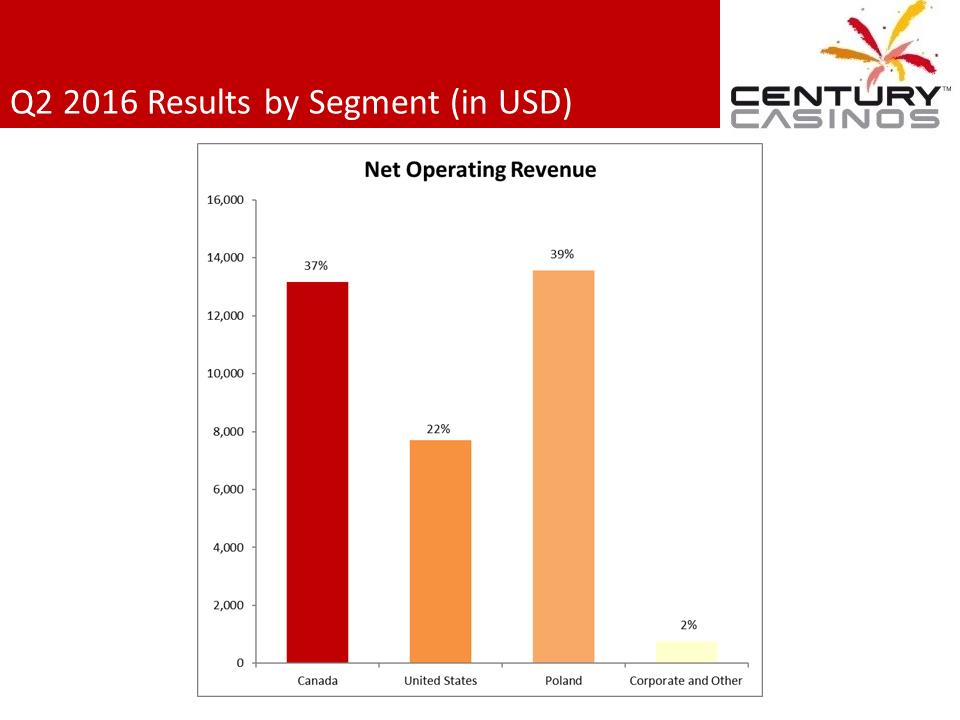 Q2 2016 Results by Segment (in USD)
 Q2 2016 Results by Segment (in USD)
 Q2 2016 Results by Segment (in USD) *Adjusted EBITDA is a non - GAAP financial measure. See Appendix A for the definition and reconciliation of Adjusted EBITDA.
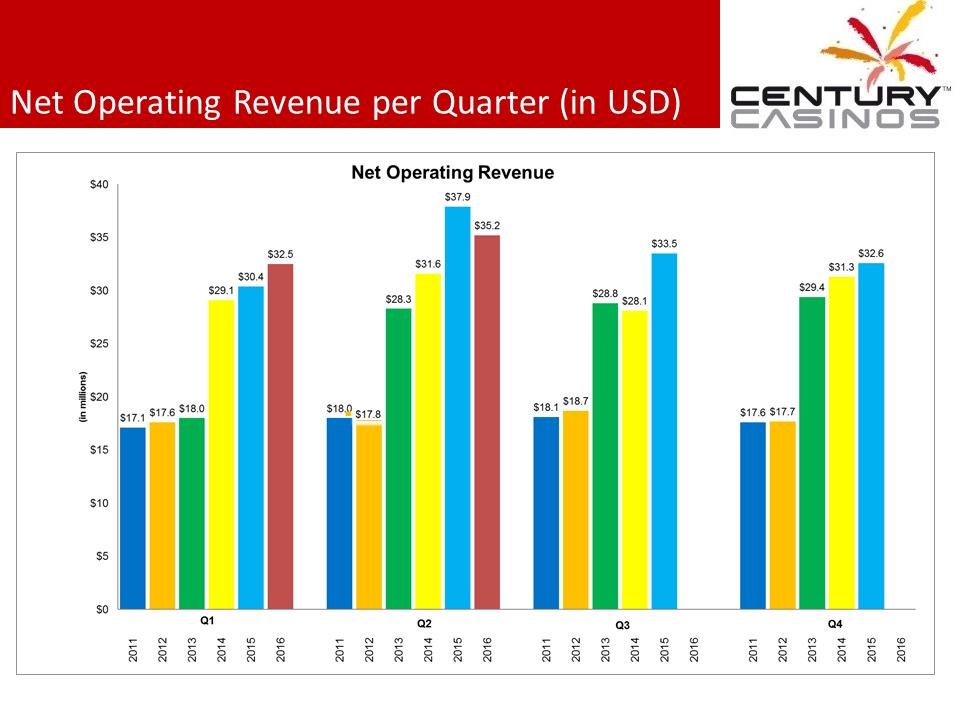 Net Operating Revenue per Quarter (in USD)
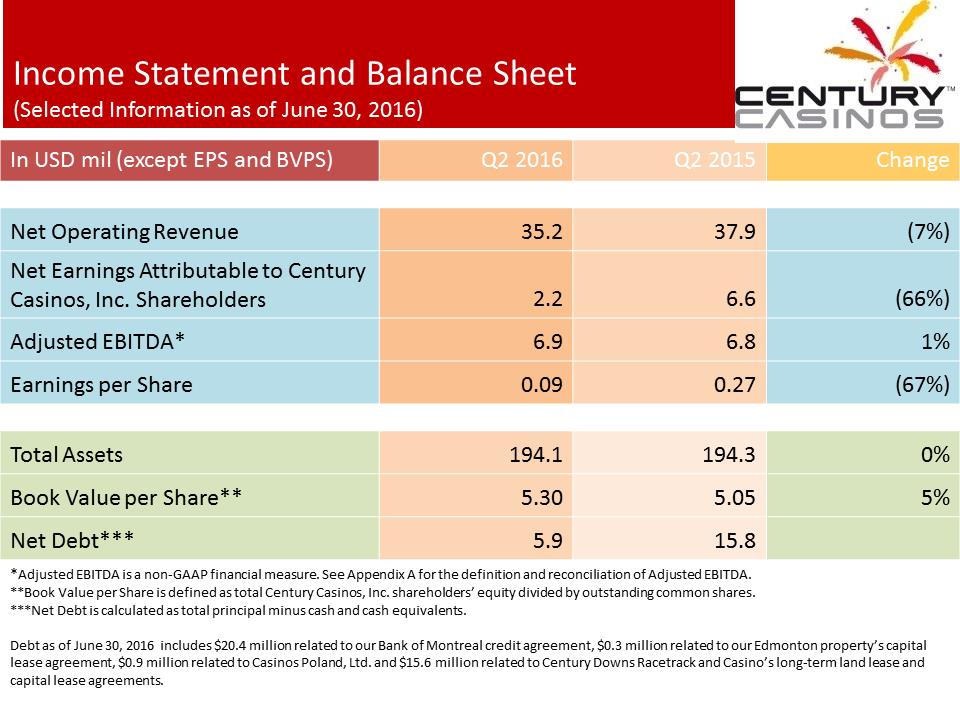 Income Statement and Balance Sheet (Selected Information as of June 30, 2016) In USD mil (except EPS and BVPS) Q2 2016 Q2 2015 Change Net Operating Revenue 35.2 37.9 (7%) Net Earnings Attributable to Century Casinos, Inc. Shareholders 2.2 6.6 (66%) Adjusted EBITDA* 6.9 6.8 1% Earnings per Share 0.09 0.27 (67%) Total Assets 194.1 194.3 0% Book Value per Share** 5.30 5.05 5% Net Debt*** 5.9 15.8 * Adjusted EBITDA is a non - GAAP financial measure. See Appendix A for the definition and reconciliation of Adjusted EBITDA. **Book Value per Share is defined as total Century Casinos, Inc. shareholders’ equity divided by outstanding common shares. ***Net Debt is calculated as tota l principal minus cash and cash equivalents. Debt as of June 30, 2016 includes $20.4 million related to our Bank of Montreal credit agreement, $0.3 million related to our Edmonton property’s capital lease agreement, $0.9 million related to Casinos Poland, Ltd. and $15.6 million related to Century Downs Racetrack and Casino’s long - term land lease and capital lease agreements.
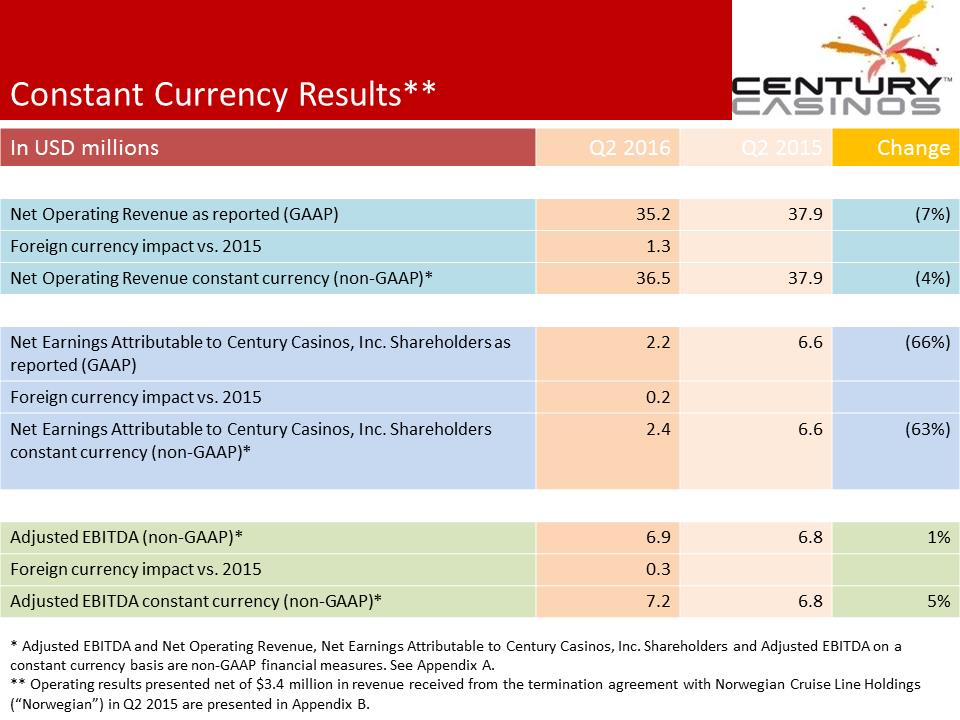 Constant Currency Results** In USD millions Q2 2016 Q2 2015 Change Net Operating Revenue a s reported (GAAP) 35.2 37.9 (7%) Foreign currency impact vs. 2015 1.3 Net Operating Revenue constant currency (non - GAAP)* 36.5 37.9 (4%) Net Earnings Attributable to Century Casinos, Inc. Shareholders as reported (GAAP) 2.2 6.6 (66%) Foreign currency impact vs. 2015 0.2 Net Earnings Attributable to Century Casinos, Inc. Shareholders constant currency (non - GAAP)* 2.4 6.6 (63%) Adjusted EBITDA (non - GAAP)* 6.9 6.8 1% Foreign currency impact vs. 2015 0.3 Adjusted EBITDA constant currency (non - GAAP)* 7.2 6.8 5% * Adjusted EBITDA and Net Operating Revenue, Net Earnings Attributable to Century Casinos, Inc. Shareholders and Adjusted EBI TDA on a constant currency basis are non - GAAP financial measures. See Appendix A. ** Operating results presented net of $3.4 million in revenue received from the termination agreement with Norwegian Cruise L ine Holdings (“Norwegian”) in Q2 2015 are presented in Appendix B.
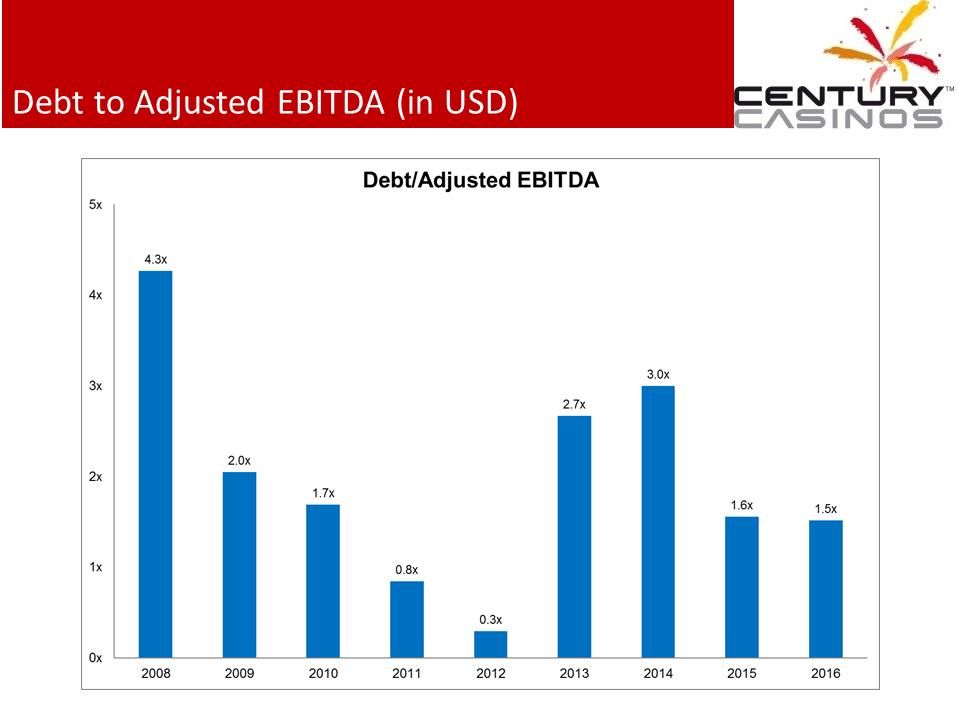 Debt to Adjusted EBITDA (in USD)
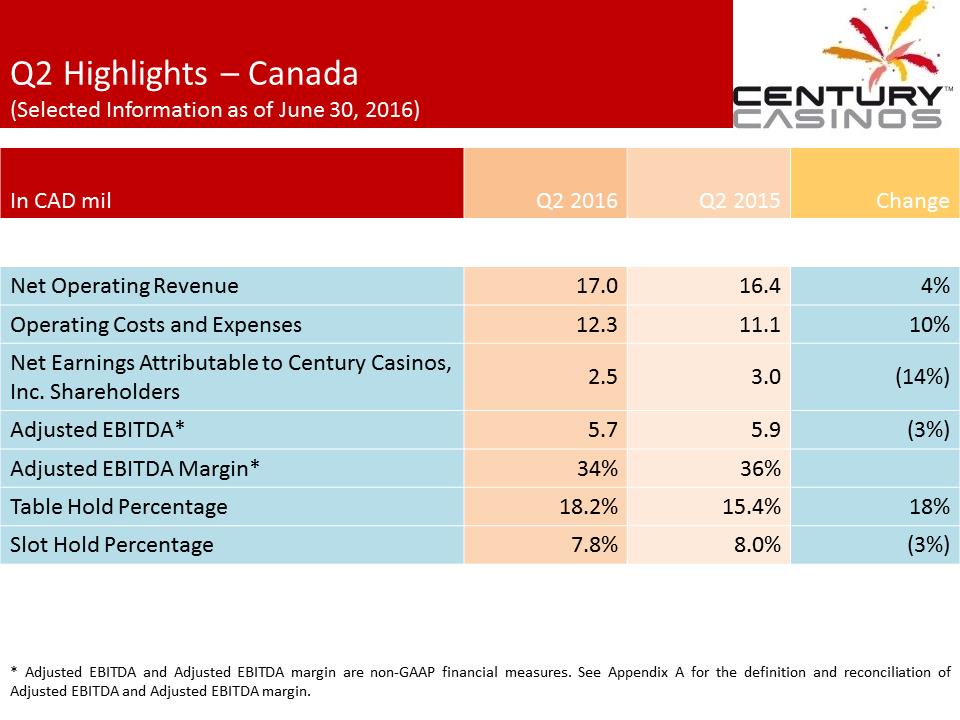 Q2 Highlights – Canada (Selected Information as of June 30, 2016) In CAD mil Q2 2016 Q2 2015 Change Net Operating Revenue 17.0 16.4 4% Operating Costs and Expenses 12.3 11.1 10% Net Earnings Attributable to Century Casinos, Inc. Shareholders 2.5 3.0 (14%) Adjusted EBITDA* 5.7 5.9 (3%) Adjusted EBITDA Margin* 34% 36% Table Hold Percentage 18.2% 15.4% 18% Slot Hold Percentage 7.8% 8.0% (3%) * Adjusted EBITDA and Adjusted EBITDA margin are non - GAAP financial measures. See Appendix A for the definition and reconciliation of Adjusted EBITDA and Adjusted EBITDA margin.
 Q2 Highlights – Canada (Selected Information as of June 30, 2016) Edmonton In CAD mil Q2 2016 Q2 2015 Change Net Operating Revenue 7.0 7.2 (2%) Operating Costs and Expenses 4.7 4.7 1% Net Earnings Attributable to Century Casinos, Inc. Shareholders 1.5 1.3 13% Adjusted EBITDA* 2.6 2.8 (7%) Adjusted EBITDA Margin* 37% 39% . As of June 30, 2016, the facility had 777 slot machines, 34 tables and 17 video lottery terminals. * Adjusted EBITDA and Adjusted EBITDA margin are non - GAAP financial measures. See Appendix A for the definition and reconciliation of Adjusted EBITDA and Adjusted EBITDA margin.
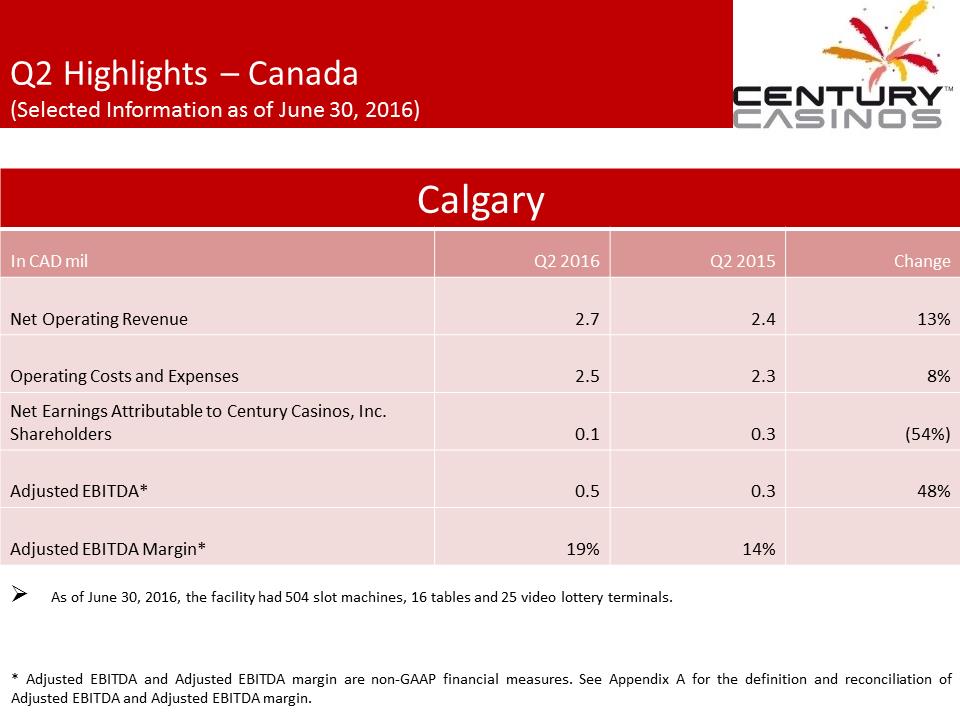 Q2 Highlights – Canada (Selected Information as of June 30, 2016) Calgary In CAD mil Q2 2016 Q2 2015 Change Net Operating Revenue 2.7 2.4 13% Operating Costs and Expenses 2.5 2.3 8% Net Earnings Attributable to Century Casinos, Inc. Shareholders 0.1 0.3 (54%) Adjusted EBITDA* 0.5 0.3 48% Adjusted EBITDA Margin* 19% 14% . As of June 30, 2016, the facility had 504 slot machines, 16 tables and 25 video lottery terminals. * Adjusted EBITDA and Adjusted EBITDA margin are non - GAAP financial measures. See Appendix A for the definition and reconciliation of Adjusted EBITDA and Adjusted EBITDA margin.
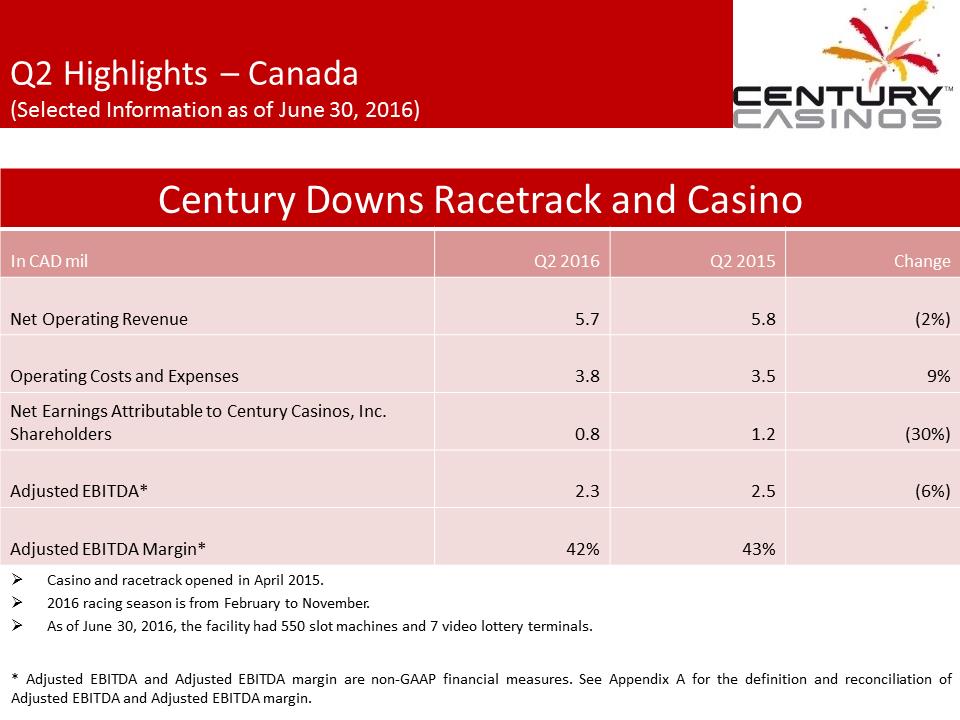 Q2 Highlights – Canada (Selected Information as of June 30, 2016) Century Downs Racetrack and Casino In CAD mil Q2 2016 Q2 2015 Change Net Operating Revenue 5.7 5.8 (2%) Operating Costs and Expenses 3.8 3.5 9% Net Earnings Attributable to Century Casinos, Inc. Shareholders 0.8 1.2 (30%) Adjusted EBITDA* 2.3 2.5 (6%) Adjusted EBITDA Margin* 42% 43% . Casino and racetrack opened in April 2015.. 2016 racing season is from February to November.. As of June 30, 2016, the facility had 550 slot machines and 7 video lottery terminals. * Adjusted EBITDA and Adjusted EBITDA margin are non - GAAP financial measures. See Appendix A for the definition and reconciliation of Adjusted EBITDA and Adjusted EBITDA margin.
 Q2 Highlights – Canada (Selected Information as of June 30, 2016) Century Bets In CAD mil Q2 2016 Q2 2015 Change Net Operating Revenue 1.6 1.0 58% Operating Costs and Expenses 1.3 0.7 94% Net Earnings Attributable to Century Casinos, Inc. Shareholders 0.1 0.2 (38%) Adjusted EBITDA* 0.2 0.3 (8%) Adjusted EBITDA Margin* 16% 27% . Century Bets began operating the pari - mutuel off - track betting network for southern Alberta in May 2015.. As of June 30, 2016, Century Bets provided pari - mutuel wagering content and live video to 16 off - track betting parlors throughou t southern Alberta. * Adjusted EBITDA and Adjusted EBITDA margin are non - GAAP financial measures. See Appendix A for the definition and reconciliation of Adjusted EBITDA and Adjusted EBITDA margin.
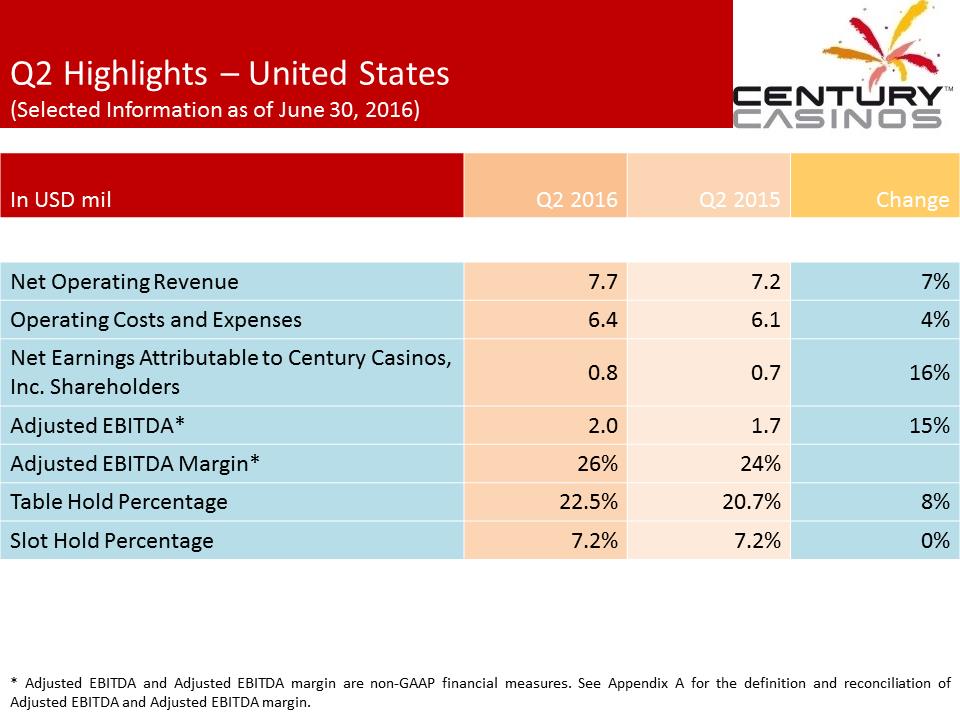 Q2 Highlights – United States (Selected Information as of June 30, 2016) In USD mil Q2 2016 Q2 2015 Change Net Operating Revenue 7.7 7.2 7% Operating Costs and Expenses 6.4 6.1 4% Net Earnings Attributable to Century Casinos, Inc. Shareholders 0.8 0.7 16% Adjusted EBITDA* 2.0 1.7 15% Adjusted EBITDA Margin* 26% 24% Table Hold Percentage 22.5% 20.7% 8% Slot Hold Percentage 7.2% 7.2% 0% * Adjusted EBITDA and Adjusted EBITDA margin are non - GAAP financial measures. See Appendix A for the definition and reconciliation of Adjusted EBITDA and Adjusted EBITDA margin.
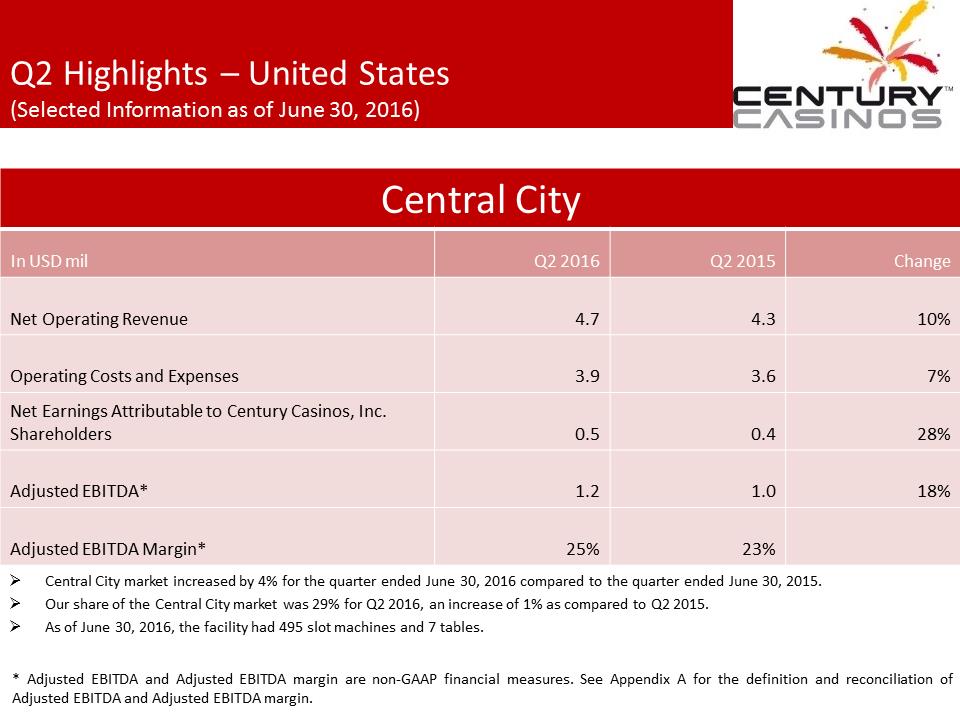 Q2 Highlights – United States (Selected Information as of June 30, 2016) Central City In USD mil Q2 2016 Q2 2015 Change Net Operating Revenue 4.7 4.3 10% Operating Costs and Expenses 3.9 3.6 7% Net Earnings Attributable to Century Casinos, Inc. Shareholders 0.5 0.4 28% Adjusted EBITDA* 1.2 1.0 18% Adjusted EBITDA Margin* 25% 23% . Central City market increased by 4% for the quarter ended June 30, 2016 compared to the quarter ended June 30, 2015.. Our share of the Central City market was 29% for Q2 2016, an increase of 1% as compared to Q2 2015.. As of June 30, 2016, the facility had 495 slot machines and 7 tables. * Adjusted EBITDA and Adjusted EBITDA margin are non - GAAP financial measures. See Appendix A for the definition and reconciliation of Adjusted EBITDA and Adjusted EBITDA margin.
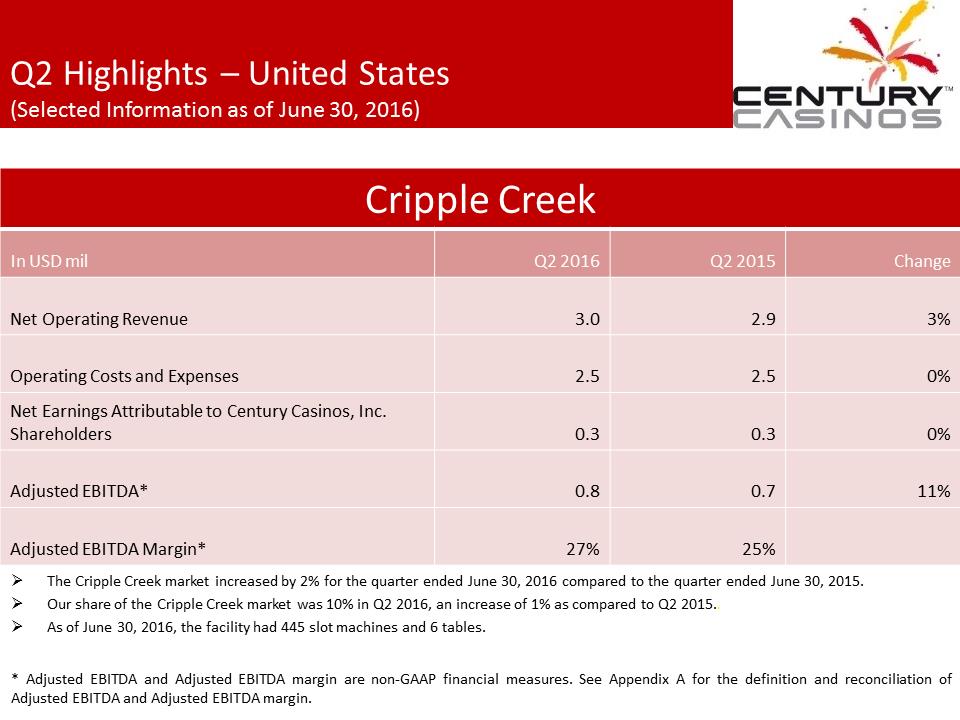 Q2 Highlights – United States (Selected Information as of June 30, 2016) Cripple Creek In USD mil Q2 2016 Q2 2015 Change Net Operating Revenue 3.0 2.9 3% Operating Costs and Expenses 2.5 2.5 0% Net Earnings Attributable to Century Casinos, Inc. Shareholders 0.3 0.3 0% Adjusted EBITDA* 0.8 0.7 11% Adjusted EBITDA Margin* 27% 25% . The Cripple Creek market increased by 2% for the quarter ended June 30, 2016 compared to the quarter ended June 30, 2015.. Our share of the Cripple Creek market was 10% in Q2 2016, an increase of 1% as compared to Q2 2015... As of June 30, 2016, the facility had 445 slot machines and 6 tables. * Adjusted EBITDA and Adjusted EBITDA margin are non - GAAP financial measures. See Appendix A for the definition and reconciliation of Adjusted EBITDA and Adjusted EBITDA margin.
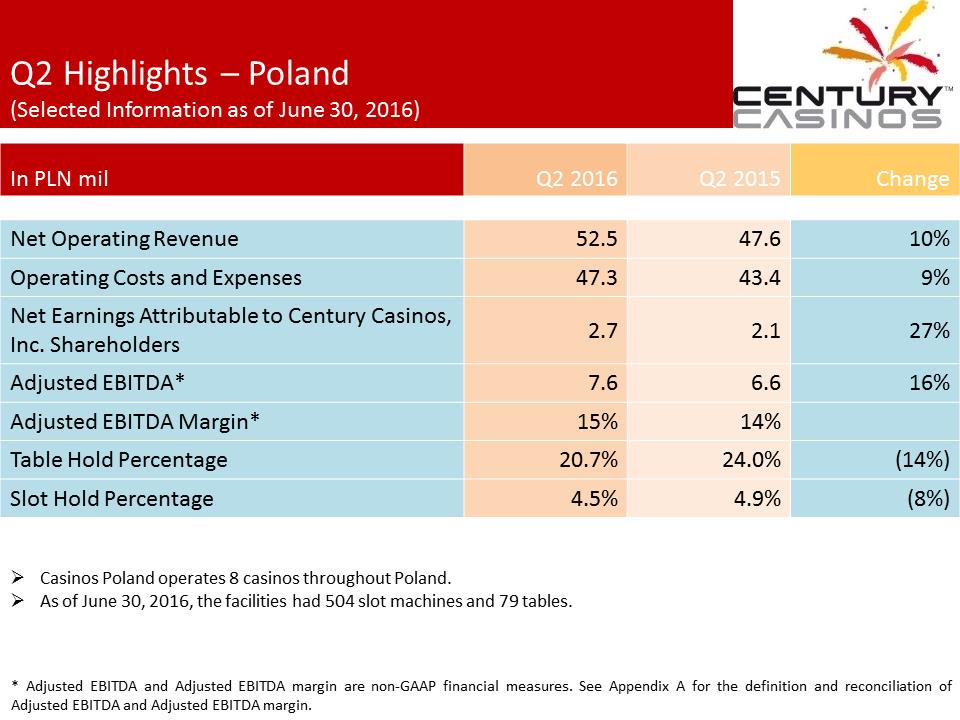 Q2 Highlights – Poland (Selected Information as of June 30, 2016) In PLN mil Q2 2016 Q2 2015 Change Net Operating Revenue 52.5 47.6 10% Operating Costs and Expenses 47.3 43.4 9% Net Earnings Attributable to Century Casinos, Inc. Shareholders 2.7 2.1 27% Adjusted EBITDA* 7.6 6.6 16% Adjusted EBITDA Margin* 15% 14% Table Hold Percentage 20.7% 24.0% (14%) Slot Hold Percentage 4.5% 4.9% (8%) . Casinos Poland operates 8 casinos throughout Poland.. As of June 30, 2016, the facilities had 504 slot machines and 79 tables. * Adjusted EBITDA and Adjusted EBITDA margin are non - GAAP financial measures. See Appendix A for the definition and reconciliation of Adjusted EBITDA and Adjusted EBITDA margin.
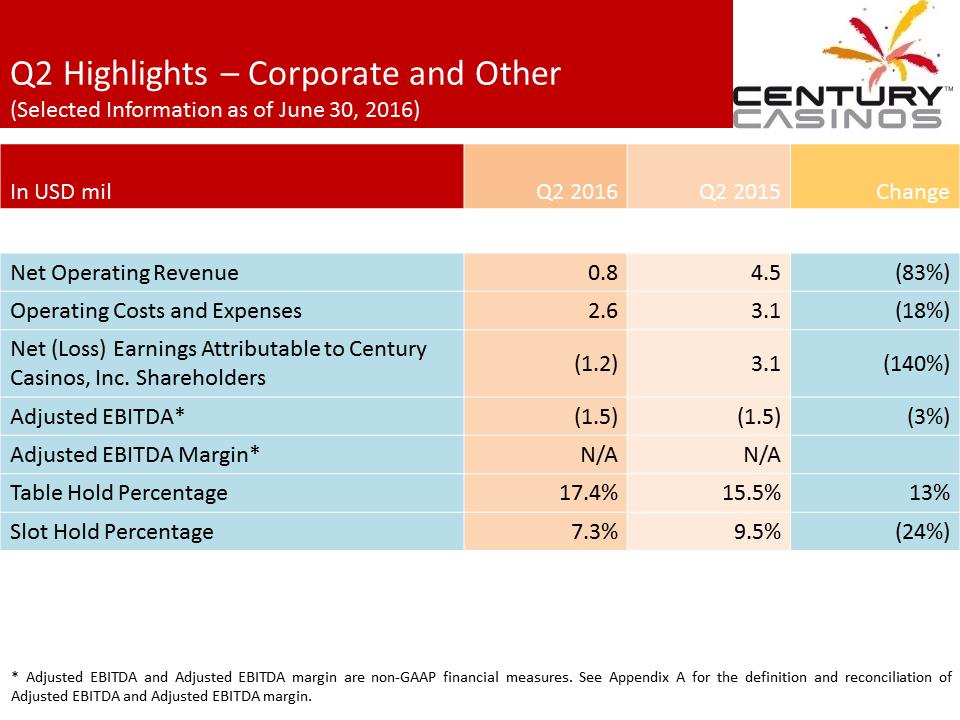 Q2 Highlights – Corporate and Other (Selected Information as of June 30, 2016) In USD mil Q2 2016 Q2 2015 Change Net Operating Revenue 0.8 4.5 (83%) Operating Costs and Expenses 2.6 3.1 (18%) Net (Loss) Earnings Attributable to Century Casinos, Inc. Shareholders (1.2) 3.1 (140%) Adjusted EBITDA* (1.5) (1.5) (3%) Adjusted EBITDA Margin* N/A N/A Table Hol d Percentage 17.4% 15.5% 13% Slot Hold Percentage 7.3% 9.5% (24%) * Adjusted EBITDA and Adjusted EBITDA margin are non - GAAP financial measures. See Appendix A for the definition and reconciliation of Adjusted EBITDA and Adjusted EBITDA margin.
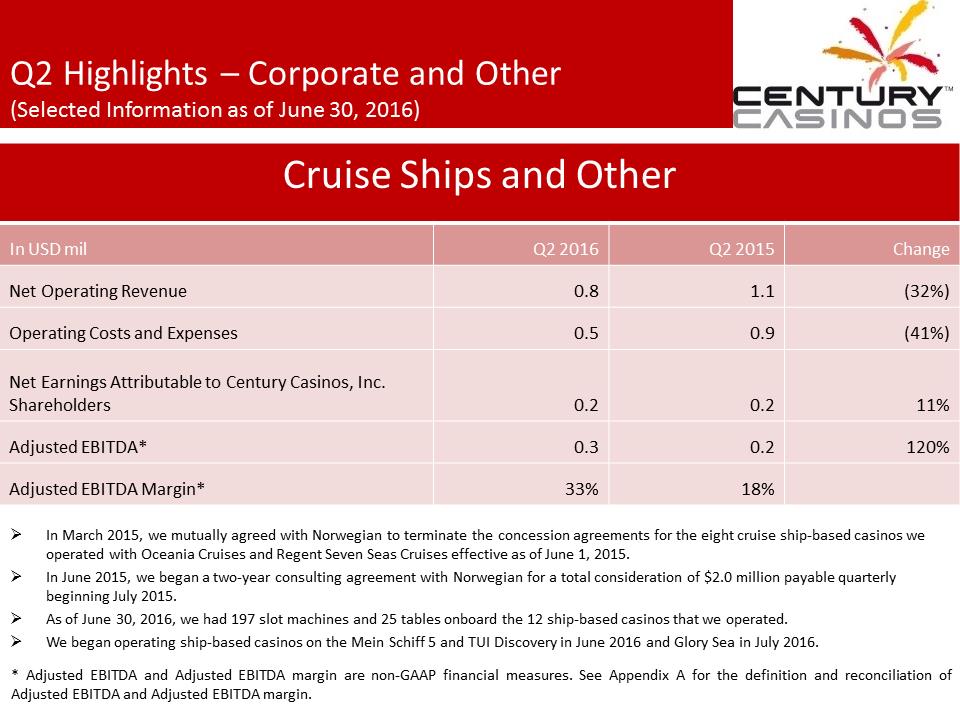 Q2 Highlights – Corporate and Other (Selected Information as of June 30, 2016) Cruise Ships and Other In USD mil Q2 2016 Q2 2015 Change Net Operating Revenue 0.8 1.1 (32%) Operating Costs and Expenses 0.5 0.9 (41%) Net Earnings Attributable to Century Casinos, Inc. Shareholders 0.2 0.2 11% Adjusted EBITDA* 0.3 0.2 120% Adjusted EBITDA Margin* 33% 18% . In March 2015, we mutually agreed with Norwegian to terminate the concession agreements for the eight cruise ship - based casinos we operated with Oceania Cruises and Regent Seven Seas Cruises effective as of June 1, 2015.. In June 2015, we began a two - year consulting agreement with Norwegian for a total consideration of $2.0 million payable quarterl y beginning July 2015.. As of June 30, 2016, we had 197 slot machines and 25 tables onboard the 12 ship - based casinos that we operated.. We began operating ship - based casinos on the Mein Schiff 5 and TUI Discovery in June 2016 and Glory Sea in July 2016. * Adjusted EBITDA and Adjusted EBITDA margin are non - GAAP financial measures. See Appendix A for the definition and reconciliation of Adjusted EBITDA and Adjusted EBITDA margin.
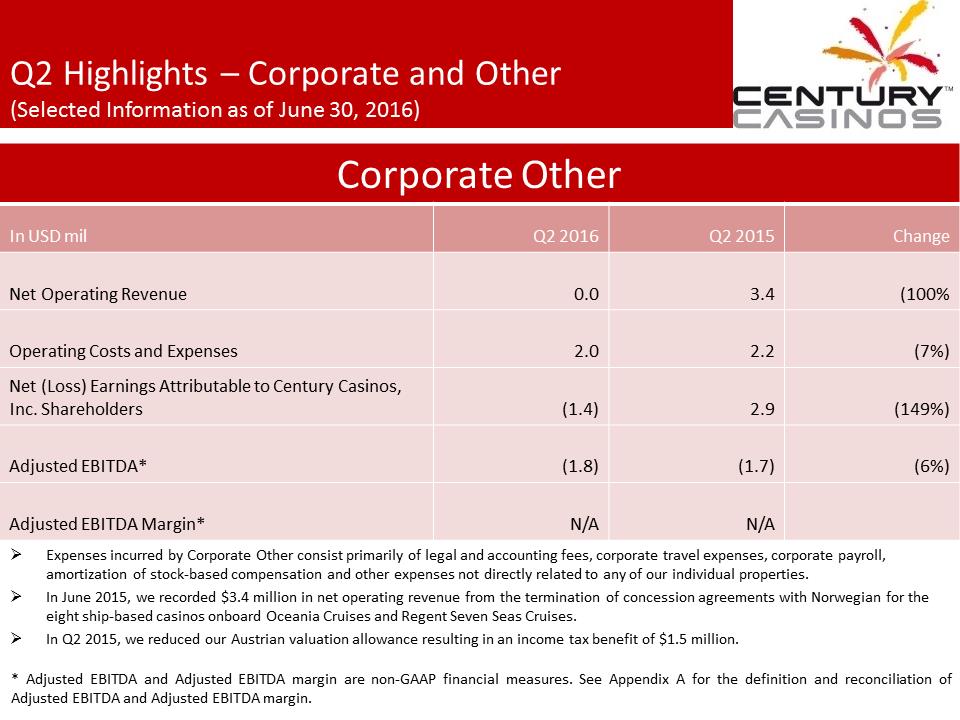 Q2 Highlights – Corporate and Other (Selected Information as of June 30, 2016) Corporate Other In USD mil Q2 2016 Q2 2015 Change Net Operating Revenue 0.0 3.4 (100% Operating Costs and Expenses 2.0 2.2 (7%) Net (Loss) Earnings Attributable to Century Casinos, Inc. Shareholders (1.4) 2.9 (149%) Adjusted EBITDA* (1.8) (1.7) (6%) Adjusted EBITDA Margin* N/A N/A . Expenses incurred by Corporate Other consist primarily of legal and accounting fees, corporate travel expenses, corporate pay rol l, amortization of stock - based compensation and other expenses not directly related to any of our individual properties.. In June 2015, we recorded $3.4 million in net operating revenue from the termination of concession agreements with Norwegian for the eight ship - based casinos onboard Oceania Cruises and Regent Seven Seas Cruises.. In Q2 2015, we reduced our Austrian valuation allowance resulting in an income tax benefit of $1.5 million. * Adjusted EBITDA and Adjusted EBITDA margin are non - GAAP financial measures. See Appendix A for the definition and reconciliation of Adjusted EBITDA and Adjusted EBITDA margin.
 Q2 Highlights – Additional Projects Under Development In June 2016, the Company announced that its subsidiary Century Casinos Europe GmbH (“CCE”) had entered into an agreement to acq uire 100% of the issued and outstanding shares and related land of entities operating the Apex Casino (“Apex”) in suburban Edmonton, Al ber ta, Canada. Apex is a 34,500 square foot casino facility located on approximately seven acres of land. The casino facility includes 382 s lot machines, 11 live table games, a restaurant, a bar, a lounge and a banquet facility that can accommodate up to 175 guests. The transaction, which is expected to close in the fourth quarter of 2016, is subject to, among other things, financing for t he acquisition and customary closing conditions, including the receipt of necessary regulatory and governmental approvals as well as the complet ion of due diligence by the Company. The total consideration for the transaction is CAD 29.9 million subject to adjustment for the closi ng date working capital of Apex. Payments are to be made according to the following schedule: . A CAD 0.6 million deposit was paid in two equal parts on April 25, 2016 and June 29, 2016. This is reported as deposits and o the r on the Company’s condensed consolidated balance sheet for the quarter ended June 30, 2016.. CAD 29.3 million will be paid at closing.. The working capital of Apex will be held in an escrow account until completion of the closing working capital statement. See Appendix C for unaudited financial results for Apex.
 Appendix A – Non - GAAP Financial Measures The Company supplements its condensed consolidated financial statements prepared in accordance with U. S. generally accepted accounting principles (“US GAAP”) by using the following non - GAAP financial measures, which management believes are useful in properly understanding the Company’s short - term and long - term financial trends. Management uses these non - GAAP financial measures to forecast and evaluate the operational performance of the Company as well as to compare results of current periods to prior periods on a consolidated basis. . Adjusted EBITDA. Adjusted EBITDA margin. Constant currency results Management believes presenting the non - GAAP financial measures used in this presentation provides investors greater transparency to the information used by management for financial and operational decision - making and allows investors to see the Company’s results “through the eyes” of management. Management also believes providing this information better enables our investors to understand the Company’s operating performance and evaluate the methodology used by management to evaluate and measure such performance. The adjustments made to U. S. GAAP financial measures result from facts and circumstances that vary in frequency and impact on the Company’s results of operations. The following is an explanation of each of the adjustments that management excludes in calculating its non - GAAP financial measures.
 Appendix A – Non - GAAP Financial Measures The Company defines Adjusted EBITDA as net earnings (loss) attributable to Century Casinos, Inc. shareholders before interest expense (income), net, income taxes (benefit), depreciation, amortization, non - controlling interest (earnings) losses and transactions, pre - opening expenses, acquisition costs, non - cash stock - based compensation charges, asset impairment costs, (gain) loss on disposition of fixed assets, discontinued operations, (gain) loss on foreign currency transactions and other, gain on business combination and certain other one - time items. Intercompany transactions consisting primarily of management and royalty fees and interest, along with their related tax effects, are excluded from the presentation of net earnings (loss) and Adjusted EBITDA reported for each segment and property. Not all of the aforementioned items occur in each reporting period, but have been included in the definition based on historical activity. These adjustments have no effect on the consolidated results as reported under US GAAP. Adjusted EBITDA is not considered a measure of performance recognized under US GAAP. Management believes that Adjusted EBITDA is a valuable measure of the relative performance of the Company and its properties. The gaming industry commonly uses Adjusted EBITDA as a method of arriving at the economic value of a casino operation. Management uses Adjusted EBITDA to compare the relative operating performance of separate operating units by eliminating the above mentioned items associated with the varying levels of capital expenditures for infrastructure required to generate revenue, and the often high cost of acquiring existing operations. Adjusted EBITDA is used by the Company’s lending institution to gauge operating performance. The Company’s computation of Adjusted EBITDA may be different from, and therefore may not be comparable to, similar measures used by other companies within the gaming industry. Please see the reconciliation of Adjusted EBITDA to net earnings (loss) attributable to Century Casinos, Inc. shareholders below. The Company defines Adjusted EBITDA margin as Adjusted EBITDA divided by net operating revenue. Management uses this margin as one of several measures to evaluate the efficiency of the Company’s casino operations. The impact of foreign exchange rates is highly variable and difficult to predict. The Company uses a Constant Currency basis to show the impact from foreign exchange rates on current period revenue compared to prior period revenue using the prior period’s foreign exchange rates. In order to properly understand the underlying business trends and performance of the Company’s ongoing operations, management believes that investors may find it useful to consider the impact of excluding changes in foreign exchange rates from the Company’s net operating revenue, net earnings (loss) attributable to Century Casinos, Inc. Shareholders and Adjusted EBITDA.
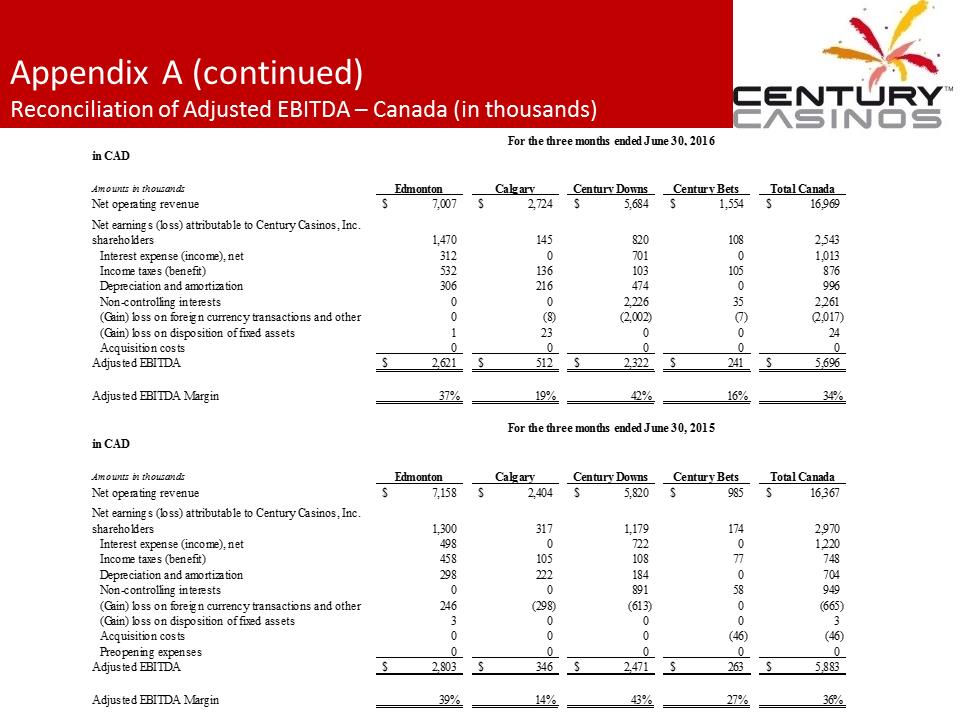 Appendix A (continued) Reconciliation of Adjusted EBITDA – Canada (in thousands) in CADAmounts in thousandsEdmontonCalgaryCentury DownsCentury BetsTotal CanadaNet operating revenue7,007$ 2,724$ 5,684$ 1,554$ 16,969$ Net earnings (loss) attributable to Century Casinos, Inc. shareholders1,4701458201082,543Interest expense (income), net312070101,013Income taxes (benefit)532136103105876Depreciation and amortization3062164740996Non-controlling interests002,226352,261(Gain) loss on foreign currency transactions and other0(8)(2,002)(7)(2,017) (Gain) loss on disposition of fixed assets1230024Acquisition costs00000Adjusted EBITDA2,621$ 512$ 2,322$ 241$ 5,696$ Adjusted EBITDA Margin37%19%42%16%34% in CADAmounts in thousandsEdmontonCalgaryCentury DownsCentury BetsTotal CanadaNet operating revenue7,158$ 2,404$ 5,820$ 985$ 16,367$ Net earnings (loss) attributable to Century Casinos, Inc. shareholders1,3003171,1791742,970Interest expense (income), net498072201,220Income taxes (benefit)45810510877748Depreciation and amortization2982221840704Non-controlling interests0089158949(Gain) loss on foreign currency transactions and other246(298)(613)0(665) (Gain) loss on disposition of fixed assets30003Acquisition costs000(46)(46) Preopening expenses00000Adjusted EBITDA2,803$ 346$ 2,471$ 263$ 5,883$ Adjusted EBITDA Margin39%14%43%27%36% For the three months ended June 30, 2016For the three months ended June 30, 2015
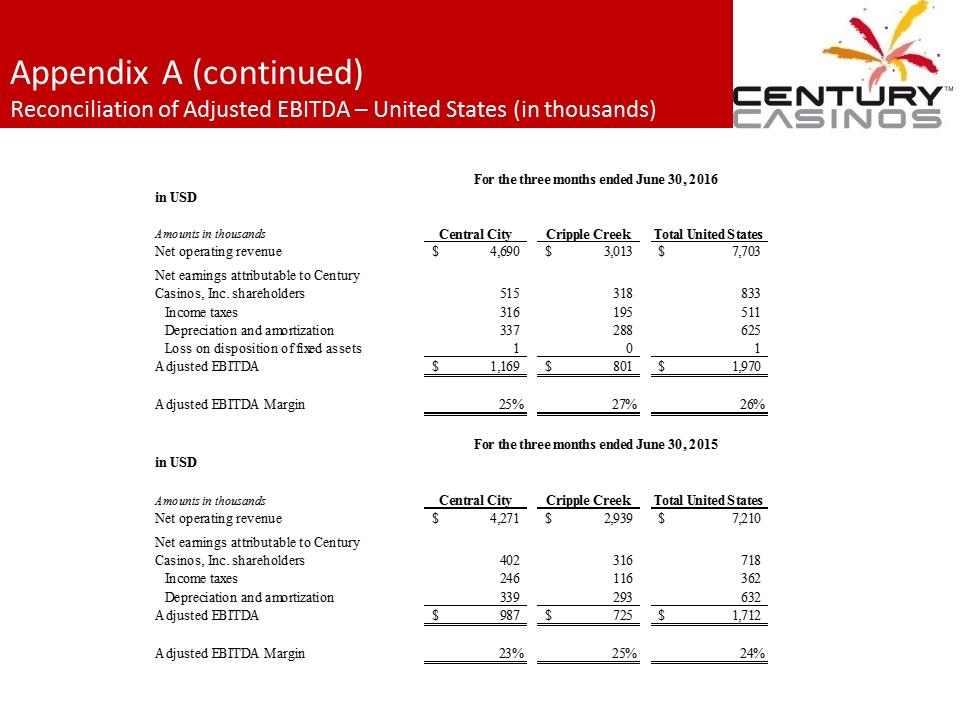 Appendix A (continued) Reconciliation of Adjusted EBITDA – United States (in thousands) in USDAmounts in thousandsCentral CityCripple CreekTotal United StatesNet operating revenue4,690$ 3,013$ 7,703$ Net earnings attributable to Century Casinos, Inc. shareholders515318833Income taxes316195511Depreciation and amortization337288625Loss on disposition of fixed assets101Adjusted EBITDA1,169$ 801$ 1,970$ Adjusted EBITDA Margin25%27%26% in USDAmounts in thousandsCentral CityCripple CreekTotal United StatesNet operating revenue4,271$ 2,939$ 7,210$ Net earnings attributable to Century Casinos, Inc. shareholders402316718Income taxes246116362Depreciation and amortization339293632Adjusted EBITDA987$ 725$ 1,712$ Adjusted EBITDA Margin23%25%24% For the three months ended June 30, 2016For the three months ended June 30, 2015
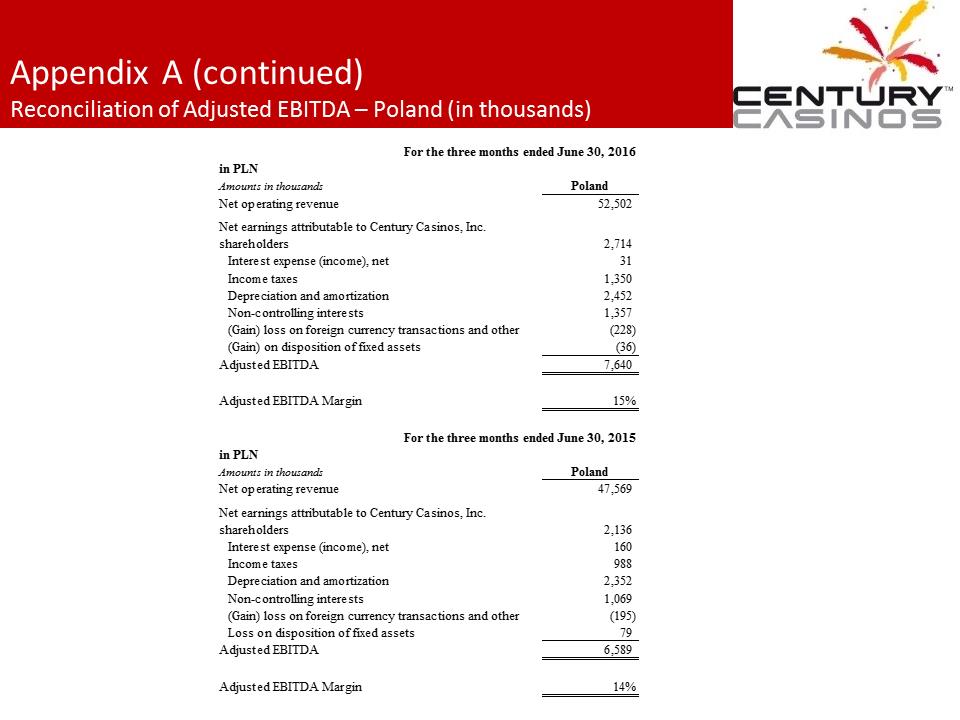 Appendix A (continued) Reconciliation of Adjusted EBITDA – Poland (in thousands) For the three months ended June 30, 2016in PLNAmounts in thousandsPolandNet operating revenue52,502 Net earnings attributable to Century Casinos, Inc. shareholders2,714Interest expense (income), net31Income taxes1,350Depreciation and amortization2,452Non-controlling interests1,357(Gain) loss on foreign currency transactions and other(228) (Gain) on disposition of fixed assets(36) Adjusted EBITDA7,640 Adjusted EBITDA Margin15% For the three months ended June 30, 2015in PLNAmounts in thousandsPolandNet operating revenue47,569 Net earnings attributable to Century Casinos, Inc. shareholders2,136Interest expense (income), net160Income taxes988Depreciation and amortization2,352Non-controlling interests1,069(Gain) loss on foreign currency transactions and other(195) Loss on disposition of fixed assets79Adjusted EBITDA6,589 Adjusted EBITDA Margin14%
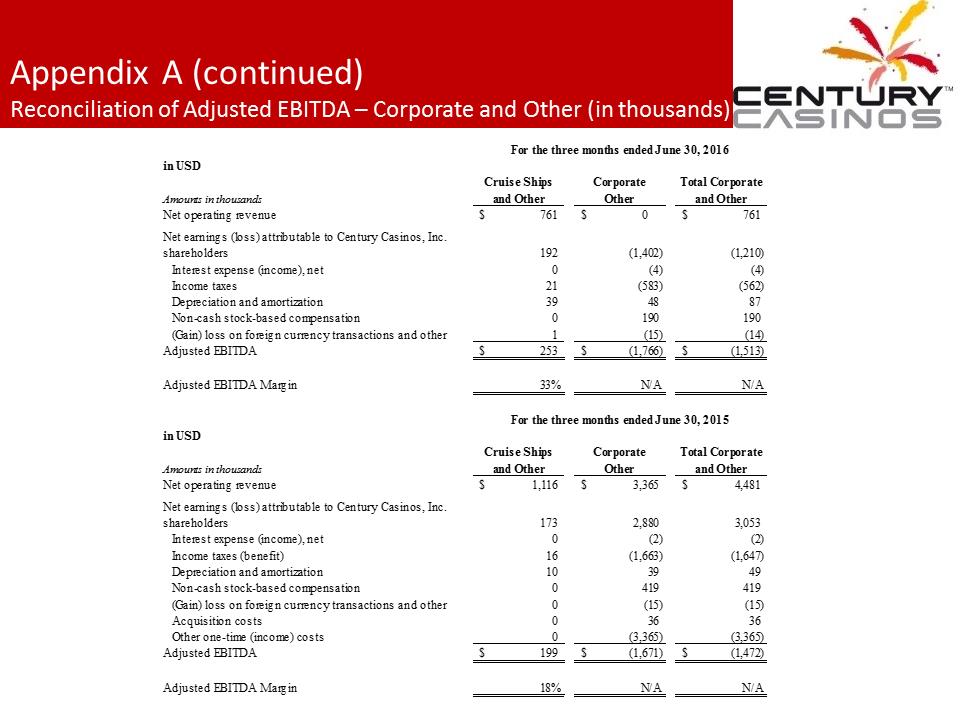 Appendix A (continued) Reconciliation of Adjusted EBITDA – Corporate and Other (in thousands) in USDAmounts in thousandsCruise Ships and OtherCorporate OtherTotal Corporate and OtherNet operating revenue761$ 0$ 761$ Net earnings (loss) attributable to Century Casinos, Inc. shareholders192(1,402)(1,210) Interest expense (income), net0(4)(4) Income taxes21(583)(562) Depreciation and amortization394887Non-cash stock-based compensation0190190(Gain) loss on foreign currency transactions and other1(15)(14) Adjusted EBITDA253$ (1,766)$ (1,513)$ Adjusted EBITDA Margin33%N/AN/Ain USDAmounts in thousandsCruise Ships and OtherCorporate OtherTotal Corporate and OtherNet operating revenue1,116$ 3,365$ 4,481$ Net earnings (loss) attributable to Century Casinos, Inc. shareholders1732,8803,053Interest expense (income), net0(2)(2) Income taxes (benefit)16(1,663)(1,647) Depreciation and amortization103949Non-cash stock-based compensation0419419(Gain) loss on foreign currency transactions and other0(15)(15) Acquisition costs03636Other one-time (income) costs0(3,365)(3,365) Adjusted EBITDA199$ (1,671)$ (1,472)$ Adjusted EBITDA Margin18%N/AN/AFor the three months ended June 30, 2016For the three months ended June 30, 2015
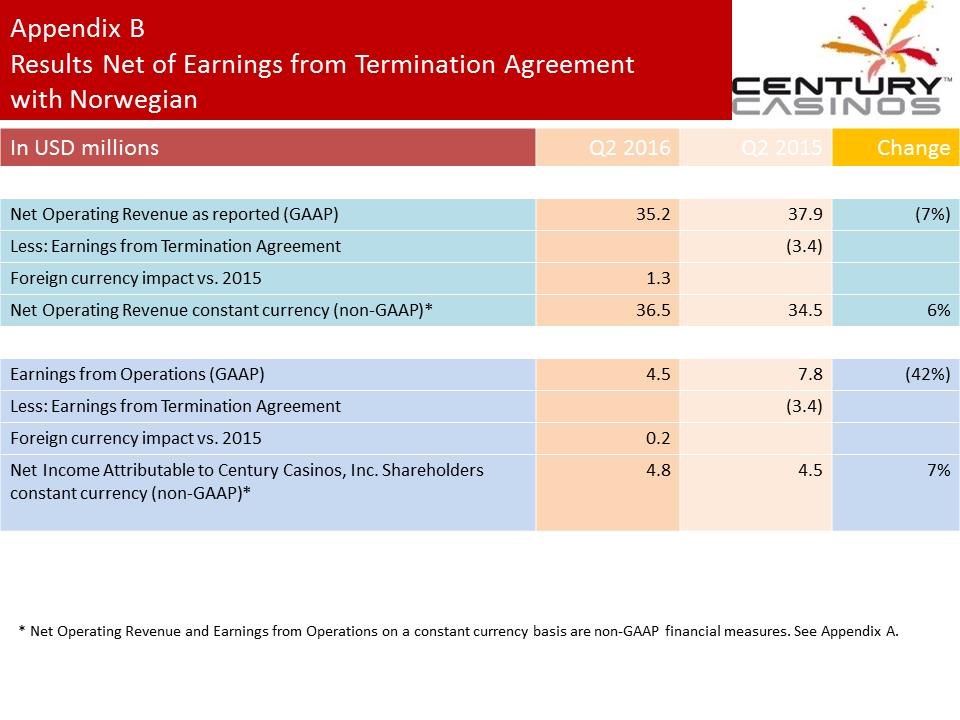 Appendix B Results Net of Earnings from Termination Agreement with Norwegian In USD millions Q2 2016 Q2 2015 Change Net Operating Revenue a s reported (GAAP) 35.2 37.9 (7%) Less: Earnings from Termination Agreement (3.4) Foreign currency impact vs. 2015 1.3 Net Operating Revenue constant currency (non - GAAP)* 36.5 34.5 6% Earnings from Operations (GAAP) 4.5 7.8 (42%) Less: Earnings from Termination Agreement (3.4) Foreign currency impact vs. 2015 0.2 Net Income Attributable to Century Casinos, Inc. Shareholders constant currency (non - GAAP)* 4.8 4.5 7% * Net Operating Revenue and Earnings from Operations on a constant currency basis are non - GAAP financial measures. See Appendix A.
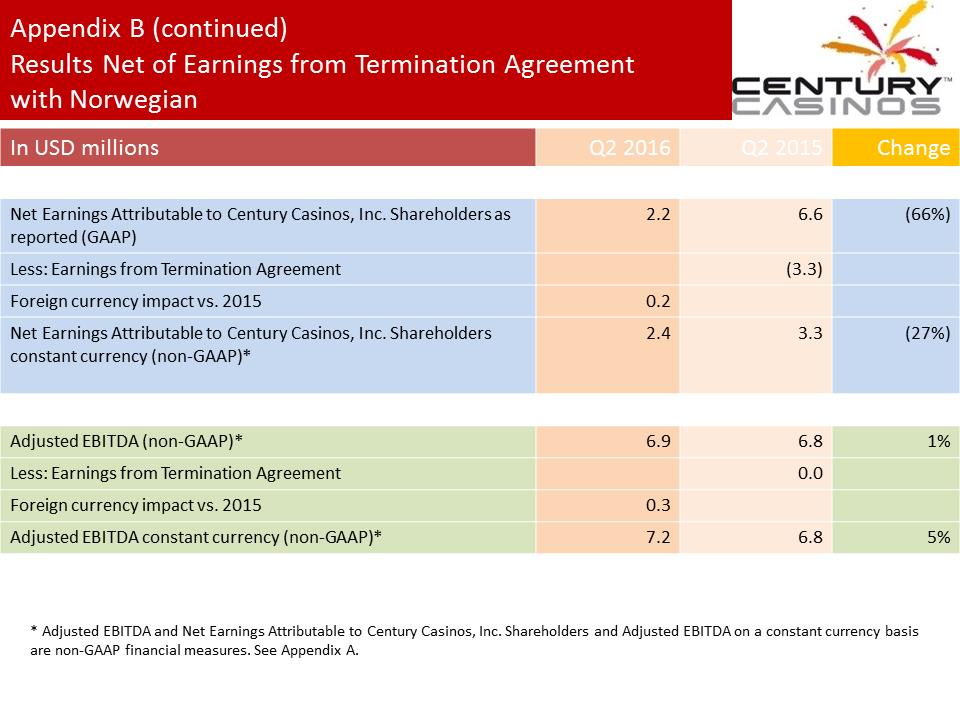 Appendix B (continued) Results Net of Earnings from Termination Agreement with Norwegian In USD millions Q2 2016 Q2 2015 Change Net Earnings Attributable to Century Casinos, Inc. Shareholders as reported (GAAP) 2.2 6.6 (66%) Less: Earnings from Termination Agreement (3.3) Foreign currency impact vs. 2015 0.2 Net Earnings Attributable to Century Casinos, Inc. Shareholders constant currency (non - GAAP)* 2.4 3.3 (27%) Adjusted EBITDA (non - GAAP)* 6.9 6.8 1% Less: Earnings from Termination Agreement 0.0 Foreign currency impact vs. 2015 0.3 Adjusted EBITDA constant currency (non - GAAP)* 7.2 6.8 5% * Adjusted EBITDA and Net Earnings Attributable to Century Casinos, Inc. Shareholders and Adjusted EBITDA on a constant curre ncy basis are non - GAAP financial measures. See Appendix A.
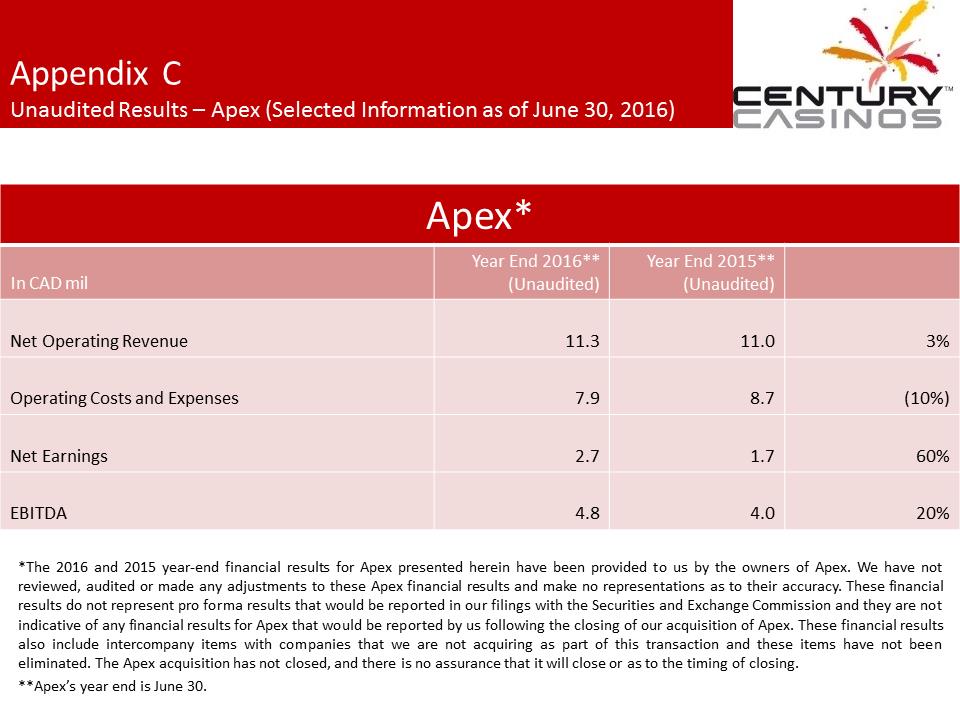 Appendix C Unaudited Results – Apex (Selected Information as of June 30, 2016) Apex* In CAD mil Year End 2016** (Unaudited) Year End 2015** (Unaudited) Net Operating Revenue 11.3 11.0 3% Operating Costs and Expenses 7.9 8.7 (10%) Net Earnings 2.7 1.7 60% EBITDA 4.8 4.0 20% *The 2016 and 2015 year - end financial results for Apex presented herein have been provided to us by the owners of Apex. We have not reviewed, audited or made any adjustments to these Apex financial results and make no representations as to their accuracy. These financial results do not represent pro forma results that would be reported in our filings with the Securities and Exchange Commission and they are not indicative of any financial results for Apex that would be reported by us following the closing of our acquisition of Apex. These financial results also include intercompany items with companies that we are not acquiring as part of this transaction and these items have not been eliminated. The Apex acquisition has not closed, and there is no assurance that it will close or as to the timing of closing. **Apex’s year end is June 30.
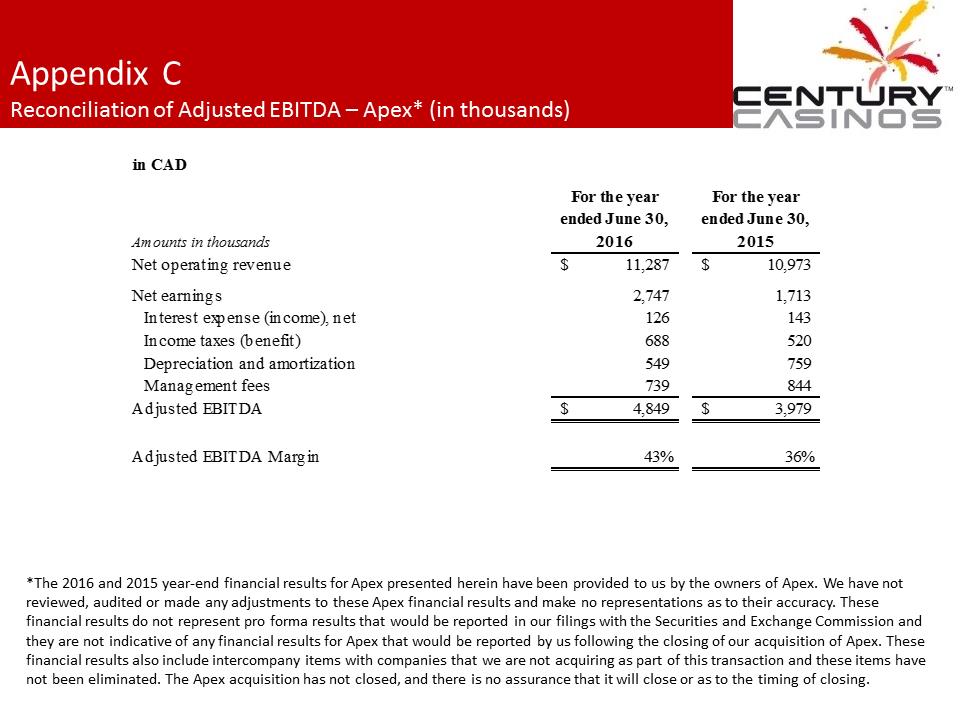 Appendix C Reconciliation of Adjusted EBITDA – Apex* (in thousands) in CADAmounts in thousandsFor the year ended June 30, 2016For the year ended June 30, 2015Net operating revenue11,287$ 10,973$ Net earnings 2,7471,713Interest expense (income), net126143Income taxes (benefit)688520Depreciation and amortization549759Management fees739844Adjusted EBITDA4,849$ 3,979$ Adjusted EBITDA Margin43%36% *The 2016 and 2015 year - end financial results for Apex presented herein have been provided to us by the owners of Apex. We have not reviewed, audited or made any adjustments to these Apex financial results and make no representations as to their accuracy. T hes e financial results do not represent pro forma results that would be reported in our filings with the Securities and Exchange C omm ission and they are not indicative of any financial results for Apex that would be reported by us following the closing of our acquisiti on of Apex. These financial results also include intercompany items with companies that we are not acquiring as part of this transaction and th ese items have not been eliminated. The Apex acquisition has not closed, and there is no assurance that it will close or as to the timing of cl osing.