 Financial Results Q3 2016
 Forward - Looking Statements, Business Environment and Risk Factors This presentation may contain “forward - looking statements” within the meaning of Section 27 A of the Securities Act of 1933 , as amended, Section 21 E of the Securities Exchange Act of 1934 , as amended (the “Exchange Act”), and the Private Securities Litigation Reform Act of 1995 . In addition, Century Casinos, Inc . (together with its subsidiaries, the “Company”) may make other written and oral communications from time to time that contain such statements . Forward - looking statements include statements as to industry trends and future expectations of the Company and other matters that do not relate strictly to historical facts and are based on certain assumptions by management at the time such statements are made . Forward - looking statements in this presentation include statements relating to our acquisition of the Apex Casino in Edmonton, Alberta, Canada, in October 2016 and our Century Mile project . These statements are often identified by the use of words such as “may,” “will,” “expect,” “believe,” “anticipate,” “intend,” “could,” “estimate,” or “continue,” and similar expressions or variations . These statements are based on the beliefs and assumptions of the management of the Company based on information currently available to management . Such forward - looking statements are subject to risks, uncertainties and other factors that could cause actual results to differ materially from future results expressed or implied by such forward - looking statements . Important factors that could cause actual results to differ materially from the forward - looking statements include, among others, the risks described in the section entitled “Risk Factors” under Item 1 A in our Annual Report on Form 10 - K for the year ended December 31 , 2015 . We caution the reader to carefully consider such factors . Furthermore, such forward - looking statements speak only as of the date on which such statements are made . We undertake no obligation to update any forward - looking statements to reflect events or circumstances after the date of such statements . In this presentation the term “USD” refers to US dollars, the term “CAD” refers to Canadian dollars and the term “PLN” refers to Polish zloty . Adjusted EBITDA and Adjusted EBITDA margin are non - GAAP financial measures . See Appendix A for the definition and reconciliation of Adjusted EBITDA and Adjusted EBITDA margin . Amounts presented are rounded . As such, rounding differences could occur in period over period changes and percentages reported throughout this presentation .
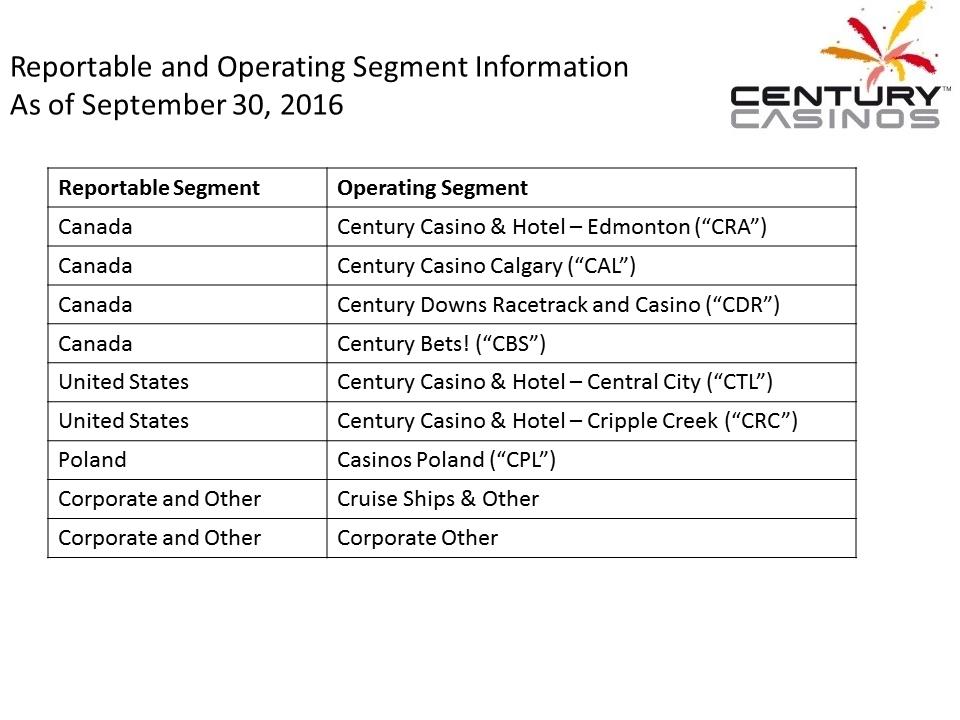 Reportable and Operating Segment Information As of September 30, 2016 Reportable Segment Operating Segment Canada Century Casino & Hotel – Edmonton (“CRA”) Canada Century Casino Calgary (“CAL”) Canada Century Downs Racetrack and Casino (“CDR”) Canada Century Bets! (“CBS”) United States Century Casino & Hotel – Central City (“CTL”) United States Century Casino & Hotel – Cripple Creek (“CRC”) Poland Casinos Poland (“CPL”) Corporate and Other Cruise Ships & Other Corporate and Other Corporate Other
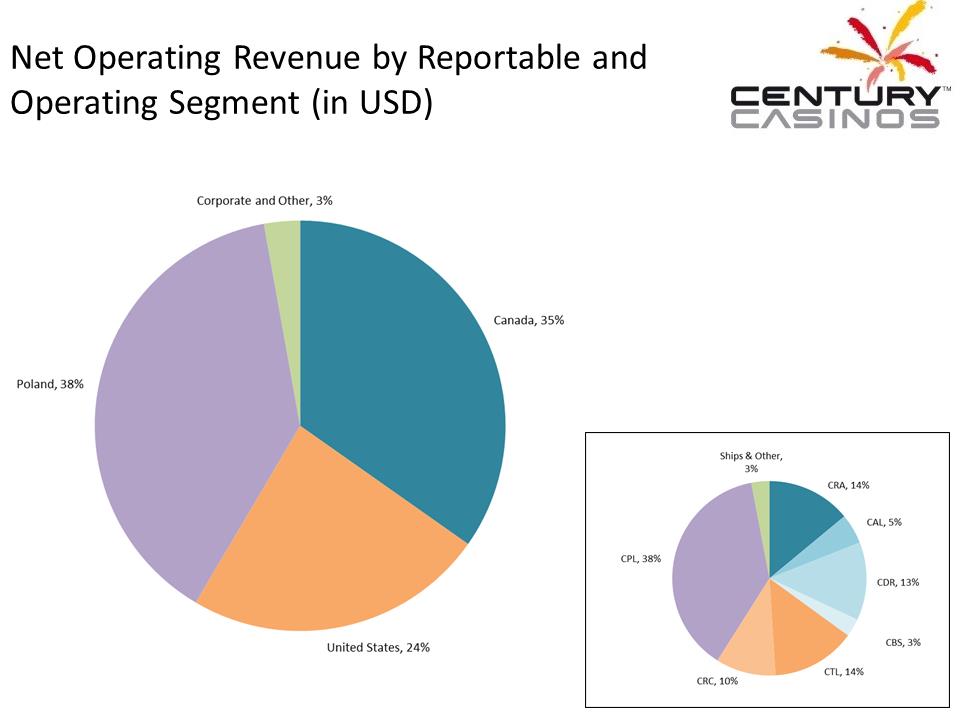 Net Operating Revenue by Reportable and Operating Segment (in USD)
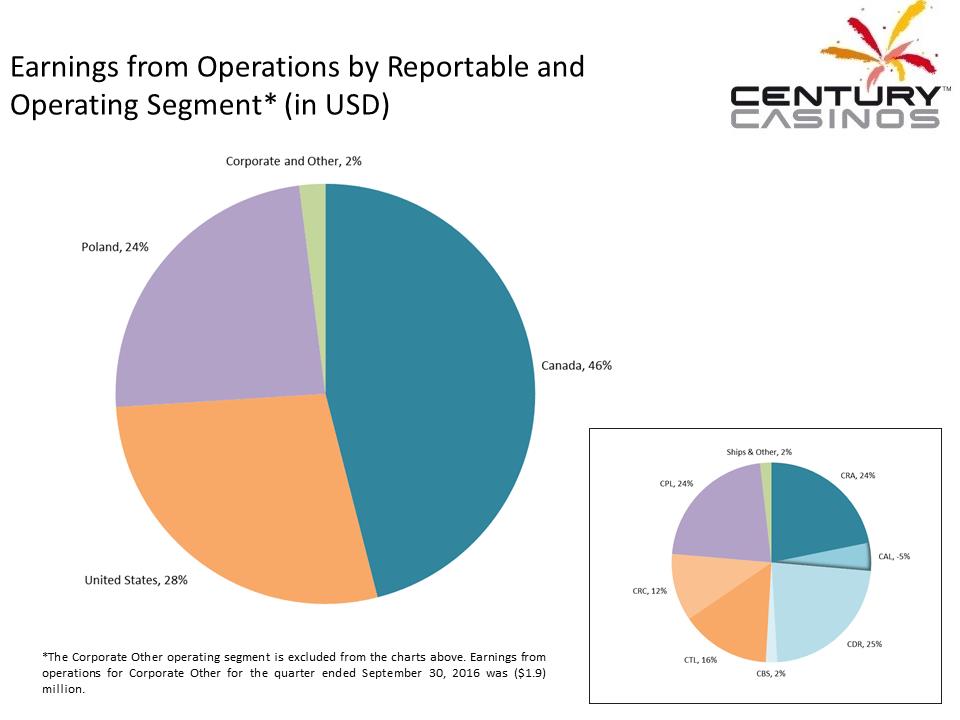 Earnings from Operations by Reportable and Operating Segment* (in USD) *The Corporate Other operating segment is excluded from the charts above . Earnings from operations for Corporate Other for the quarter ended September 30 , 2016 was ( $ 1 . 9 ) million .
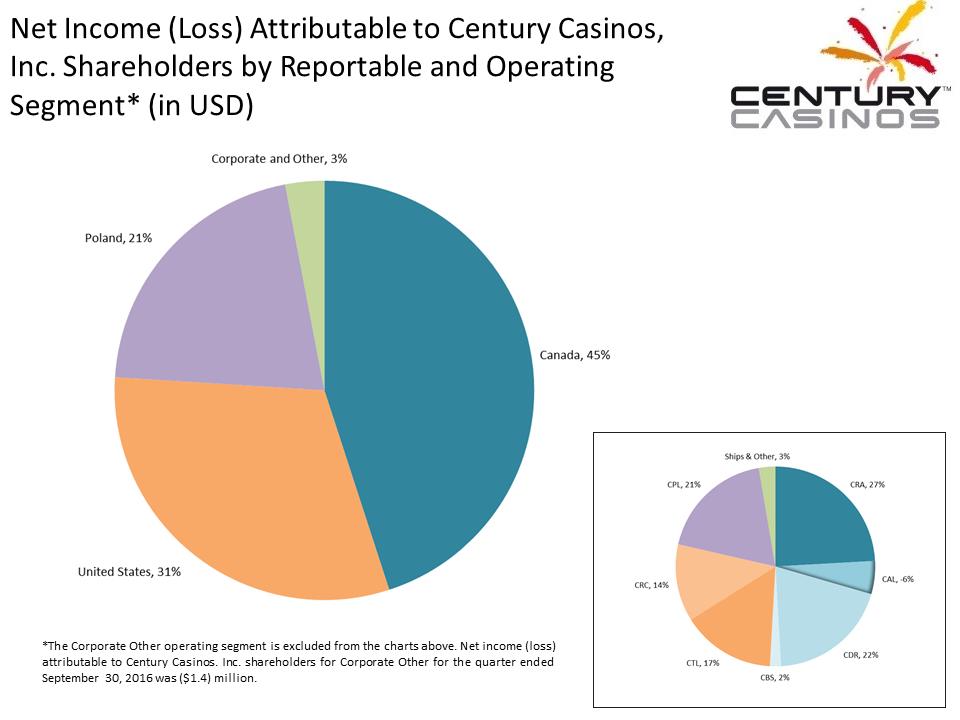 Net Income (Loss) Attributable to Century Casinos, Inc. Shareholders by Reportable and Operating Segment* (in USD) *The Corporate Other operating segment is excluded from the charts above . Net income (loss) attributable to Century Casinos . Inc . shareholders for Corporate Other for the quarter ended September 30 , 2016 was ( $ 1 . 4 ) million .
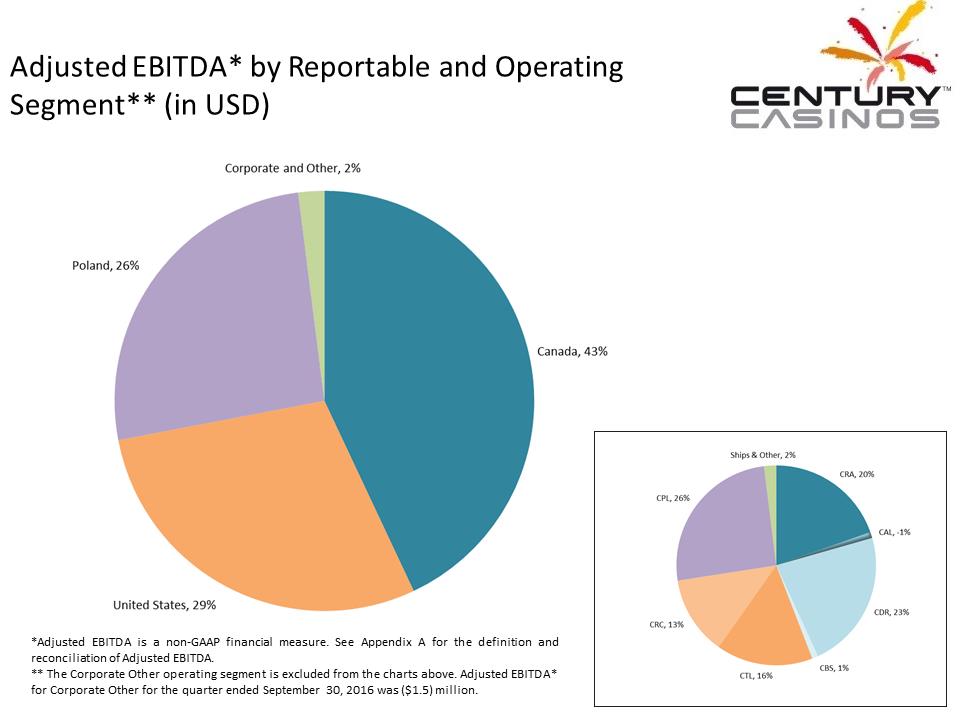 Adjusted EBITDA* by Reportable and Operating Segment** (in USD) *Adjusted EBITDA is a non - GAAP financial measure . See Appendix A for the definition and reconciliation of Adjusted EBITDA . ** The Corporate Other operating segment is excluded from the charts above . Adjusted EBITDA* for Corporate Other for the quarter ended September 30 , 2016 was ( $ 1 . 5 ) million .
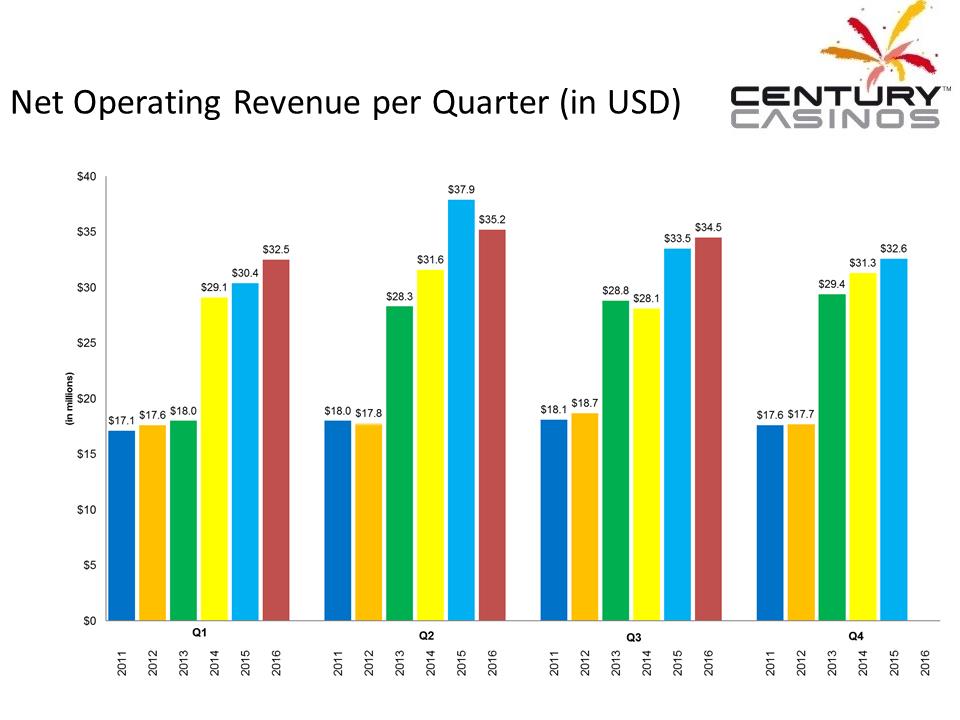 Net Operating Revenue per Quarter (in USD)
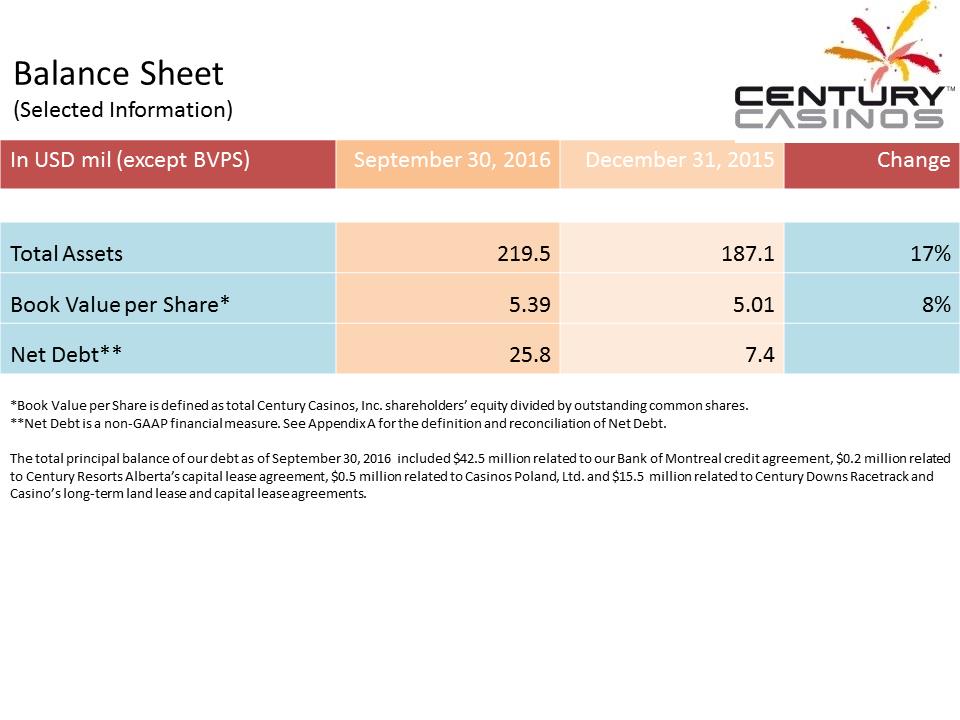 Balance Sheet (Selected Information) In USD mil (except BVPS) September 30, 2016 December 31, 2015 Change Total Assets 219.5 187.1 17% Book Value per Share* 5.39 5.01 8% Net Debt** 25.8 7.4 *Book Value per Share is defined as total Century Casinos, Inc. shareholders’ equity divided by outstanding common shares. **Net Debt is a non - GAAP financial measure. See Appendix A for the definition and reconciliation of Net Debt. The total principal balance of our d ebt as of September 30, 2016 included $42.5 million related to our Bank of Montreal credit agreement, $0.2 million related to Century Resorts Alberta’s capital lease agreement, $0.5 million related to Casinos Poland, Ltd. and $15.5 million related to Century Downs Racetrack and Casino’s long - term land lease and capital lease agreements .
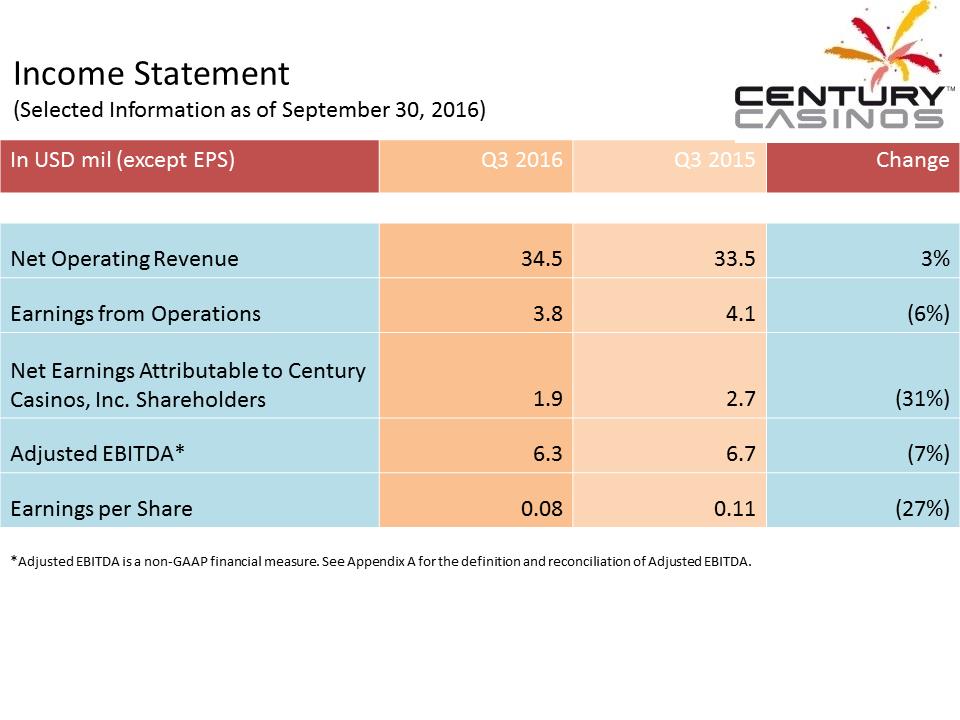 Income Statement (Selected Information as of September 30, 2016) In USD mil (except EPS) Q3 2016 Q3 2015 Change Net Operating Revenue 34.5 33.5 3% Earnings from Operations 3.8 4.1 (6%) Net Earnings Attributable to Century Casinos, Inc. Shareholders 1.9 2.7 (31%) Adjusted EBITDA* 6.3 6.7 (7%) Earnings per Share 0.08 0.11 (27%) * Adjusted EBITDA is a non - GAAP financial measure. See Appendix A for the definition and reconciliation of Adjusted EBITDA.
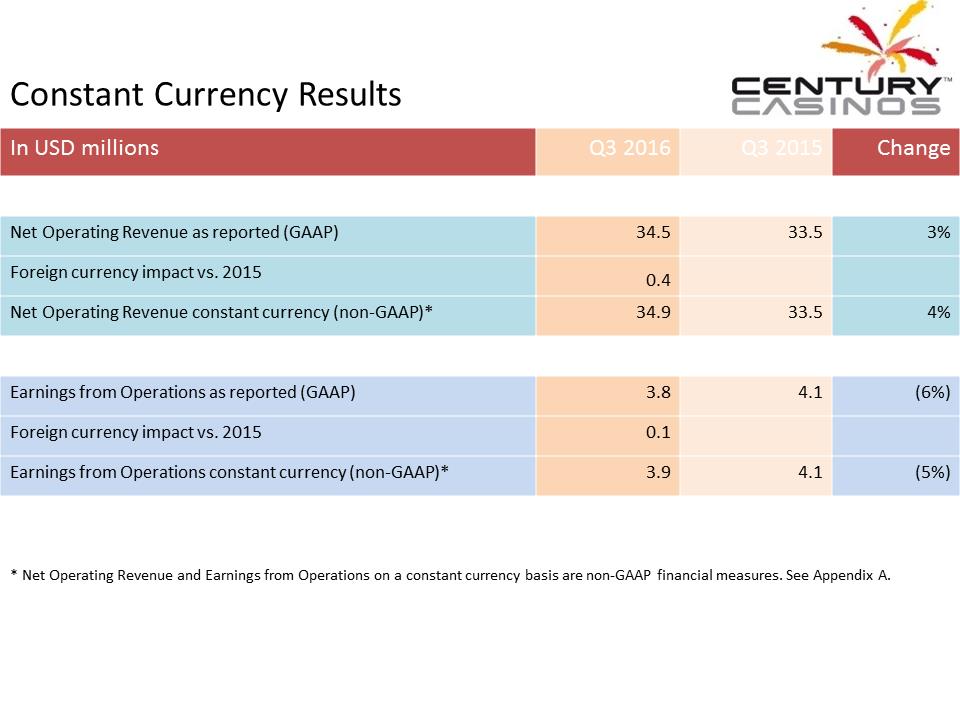 Constant Currency Results In USD millions Q3 2016 Q3 2015 Change Net Operating Revenue a s reported (GAAP) 34.5 33.5 3% Foreign currency impact vs. 2015 0.4 Net Operating Revenue constant currency (non - GAAP)* 34.9 33.5 4% Earnings from Operations as reported (GAAP) 3.8 4.1 (6%) Foreign currency impact vs. 2015 0.1 Earnings from Operations constant currency (non - GAAP)* 3.9 4.1 (5%) * Net Operating Revenue and Earnings from Operations on a constant currency basis are non - GAAP financial measures. See Appendix A.
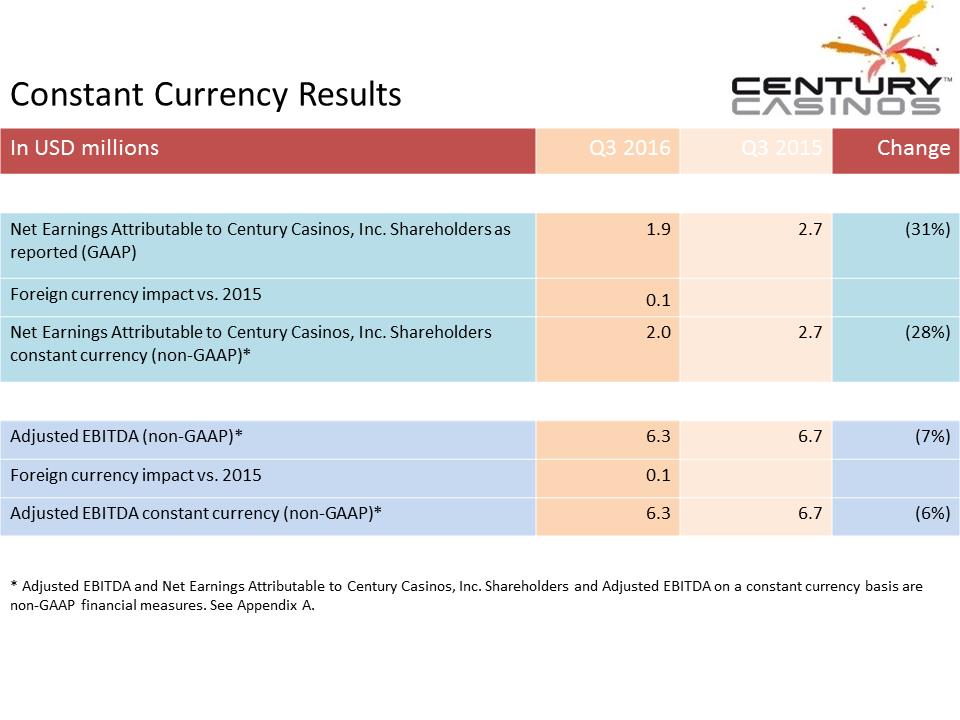 Constant Currency Results In USD millions Q3 2016 Q3 2015 Change Net Earnings Attributable to Century Casinos, Inc. Shareholders as reported (GAAP) 1.9 2.7 (31%) Foreign currency impact vs. 2015 0.1 Net Earnings Attributable to Century Casinos, Inc. Shareholders constant currency (non - GAAP)* 2.0 2.7 (28%) Adjusted EBITDA (non - GAAP)* 6.3 6.7 (7%) Foreign currency impact vs. 2015 0.1 Adjusted EBITDA constant currency (non - GAAP)* 6.3 6.7 (6%) * Adjusted EBITDA and Net Earnings Attributable to Century Casinos, Inc. Shareholders and Adjusted EBITDA on a constant curre ncy basis are non - GAAP financial measures. See Appendix A.
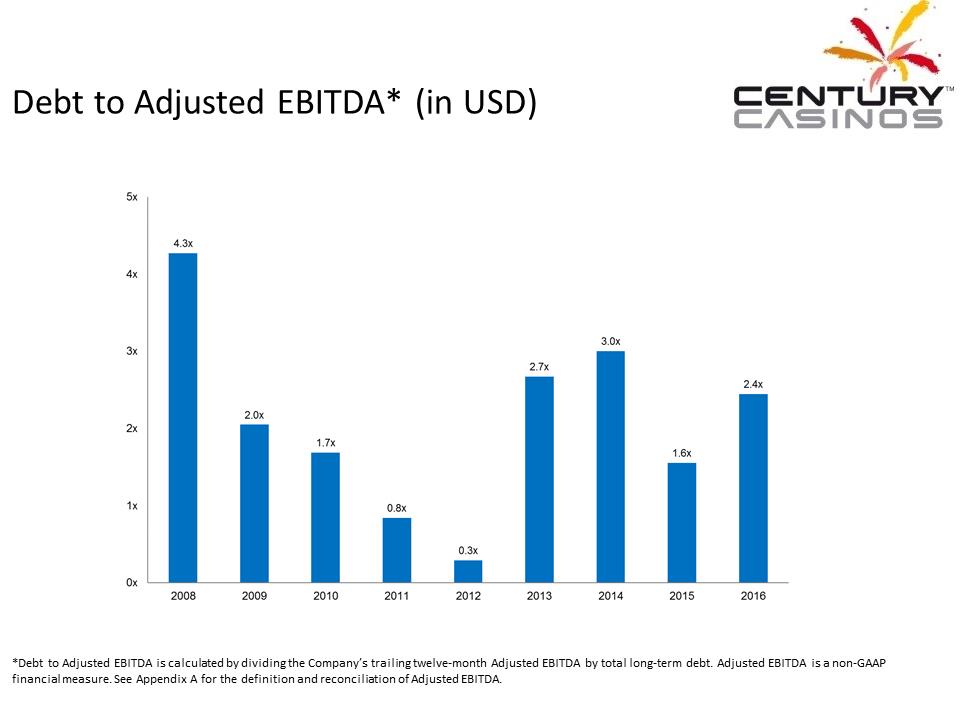 Debt to Adjusted EBITDA* (in USD) *Debt to Adjusted EBITDA is calculated by dividing the Company’s trailing twelve - month Adjusted EBITDA by total long - term debt. Adjusted EBITDA is a non - GAAP financial measure. See Appendix A for the definition and reconciliation of Adjusted EBITDA.
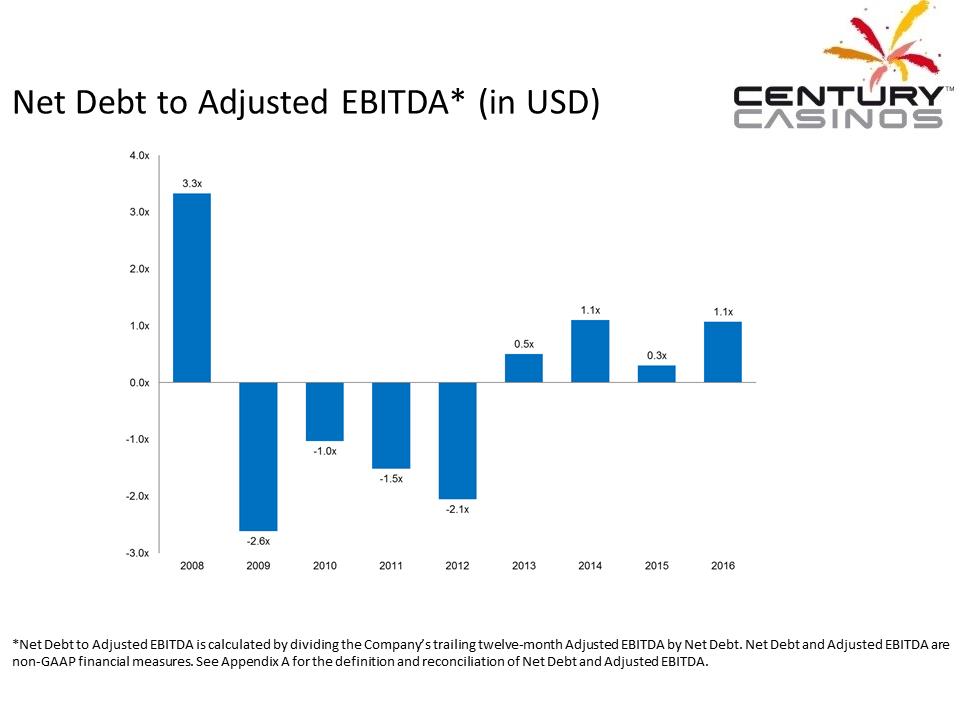 Net Debt to Adjusted EBITDA* (in USD) *Net Debt to Adjusted EBITDA is calculated by dividing the Company’s trailing twelve - month Adjusted EBITDA by Net Debt. Net Debt and Adjusted EBITDA are non - GAAP financial measures. See Appendix A for the definition and reconciliation of Net Debt and Adjusted EBITDA.
 Q3 Highlights – Canada (Selected Information as of September 30, 2016) In CAD mil Q3 2016 Q3 2015 Change Net Operating Revenue 15.7 16.0 (2%) Operating Costs and Expenses 12.3 11.7 5% Earnings from Operations 3.4 4.3 (21%) Net Earnings Attributable to Century Casinos, Inc. Shareholders 1.9 2.2 (16%) Adjusted EBITDA* 4.4 5.1 (14%) Adjusted EBITDA Margin* 28% 32% * Adjusted EBITDA and Adjusted EBITDA margin are non - GAAP financial measures . See Appendix A for the definition and reconciliation of Adjusted EBITDA and Adjusted EBITDA margin .
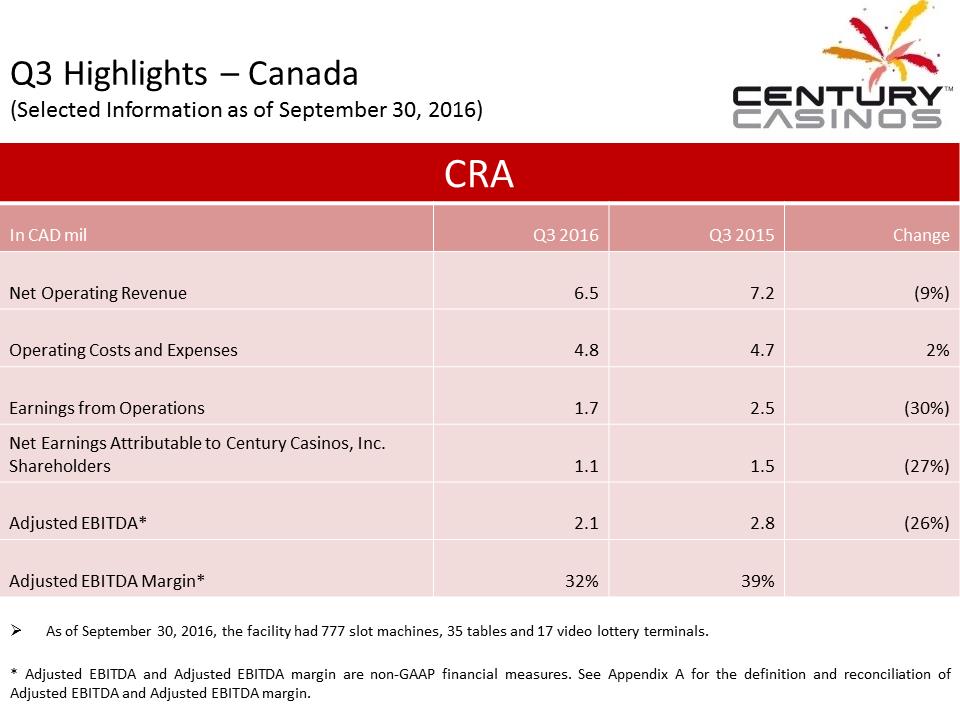 Q3 Highlights – Canada (Selected Information as of September 30, 2016) CRA In CAD mil Q3 2016 Q3 2015 Change Net Operating Revenue 6.5 7.2 (9%) Operating Costs and Expenses 4.8 4.7 2% Earnings from Operations 1.7 2.5 (30%) Net Earnings Attributable to Century Casinos, Inc. Shareholders 1.1 1.5 (27%) Adjusted EBITDA* 2.1 2.8 (26%) Adjusted EBITDA Margin* 32% 39% . As of September 30, 2016, the facility had 777 slot machines, 35 tables and 17 video lottery terminals. * Adjusted EBITDA and Adjusted EBITDA margin are non - GAAP financial measures . See Appendix A for the definition and reconciliation of Adjusted EBITDA and Adjusted EBITDA margin .
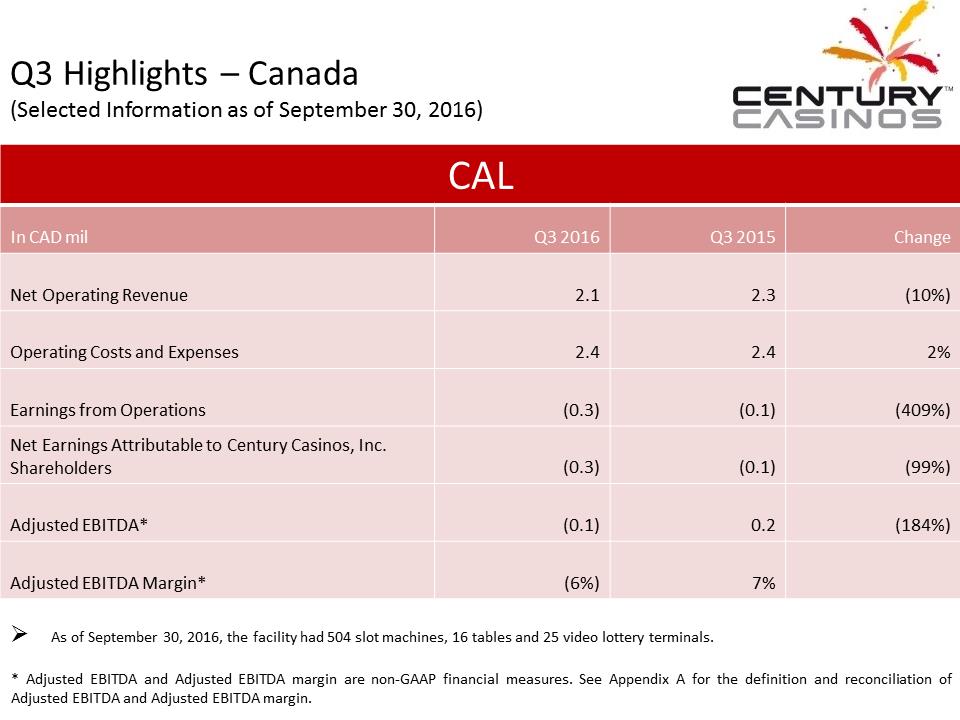 Q3 Highlights – Canada (Selected Information as of September 30, 2016) CAL In CAD mil Q3 2016 Q3 2015 Change Net Operating Revenue 2.1 2.3 (10%) Operating Costs and Expenses 2.4 2.4 2% Earnings from Operations (0.3) (0.1) (409%) Net Earnings Attributable to Century Casinos, Inc. Shareholders (0.3) (0.1) (99%) Adjusted EBITDA* (0.1) 0.2 (184%) Adjusted EBITDA Margin* (6%) 7% . As of September 30, 2016, the facility had 504 slot machines, 16 tables and 25 video lottery terminals. * Adjusted EBITDA and Adjusted EBITDA margin are non - GAAP financial measures . See Appendix A for the definition and reconciliation of Adjusted EBITDA and Adjusted EBITDA margin .
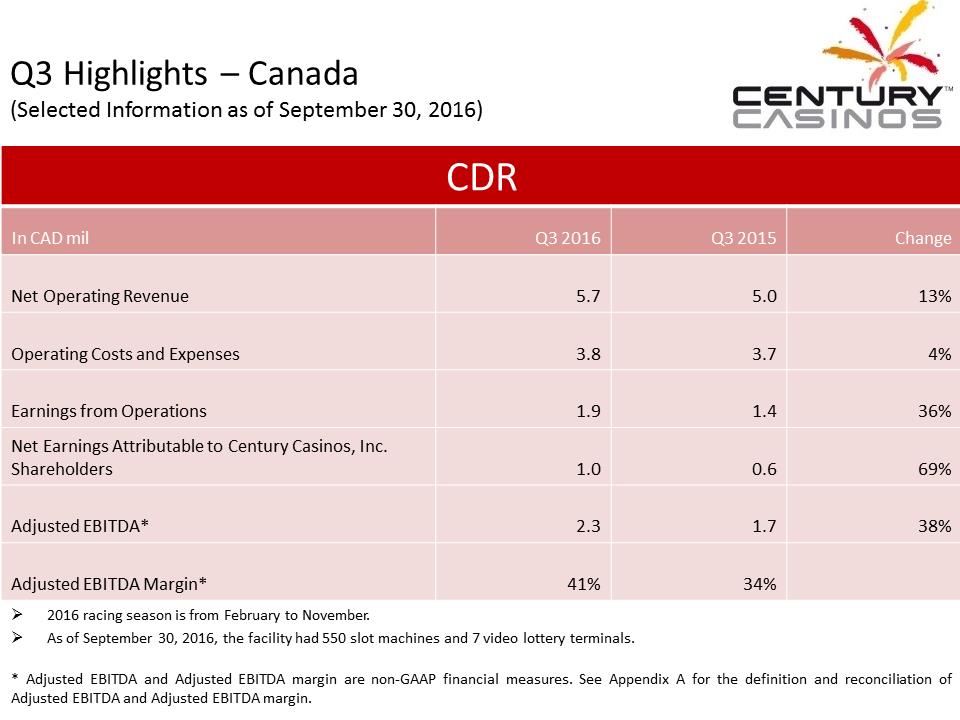 Q3 Highlights – Canada (Selected Information as of September 30, 2016) CDR In CAD mil Q3 2016 Q3 2015 Change Net Operating Revenue 5.7 5.0 13% Operating Costs and Expenses 3.8 3.7 4% Earnings from Operations 1.9 1.4 36% Net Earnings Attributable to Century Casinos, Inc. Shareholders 1.0 0.6 69% Adjusted EBITDA* 2.3 1.7 38% Adjusted EBITDA Margin* 41% 34% . 2016 racing season is from February to November. . As of September 30, 2016, the facility had 550 slot machines and 7 video lottery terminals. * Adjusted EBITDA and Adjusted EBITDA margin are non - GAAP financial measures . See Appendix A for the definition and reconciliation of Adjusted EBITDA and Adjusted EBITDA margin .
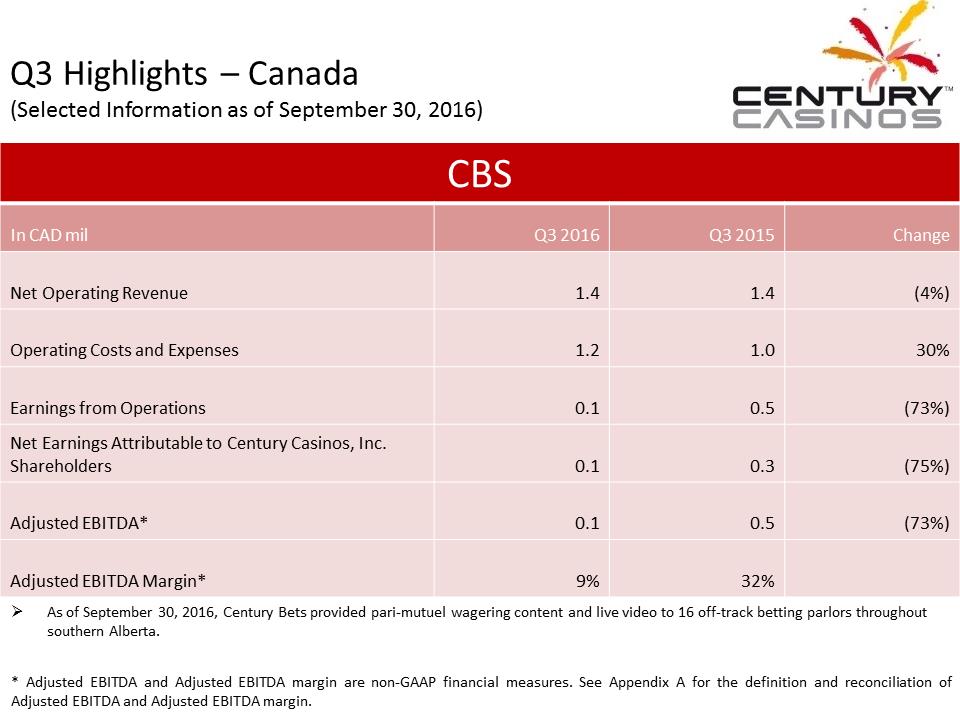 Q3 Highlights – Canada (Selected Information as of September 30, 2016) CBS In CAD mil Q3 2016 Q3 2015 Change Net Operating Revenue 1.4 1.4 (4%) Operating Costs and Expenses 1.2 1.0 30% Earnings from Operations 0.1 0.5 (73%) Net Earnings Attributable to Century Casinos, Inc. Shareholders 0.1 0.3 (75%) Adjusted EBITDA* 0.1 0.5 (73%) Adjusted EBITDA Margin* 9% 32% . As of September 30, 2016, Century Bets provided pari - mutuel wagering content and live video to 16 off - track betting parlors thro ughout southern Alberta. * Adjusted EBITDA and Adjusted EBITDA margin are non - GAAP financial measures . See Appendix A for the definition and reconciliation of Adjusted EBITDA and Adjusted EBITDA margin .
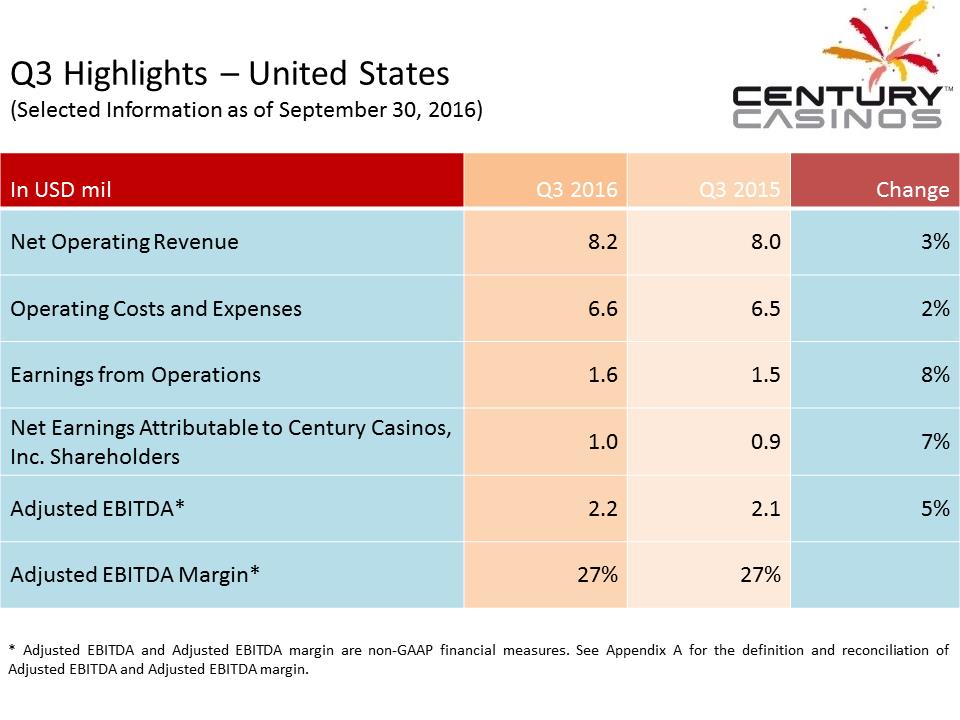 Q3 Highlights – United States (Selected Information as of September 30, 2016) In USD mil Q3 2016 Q3 2015 Change Net Operating Revenue 8.2 8.0 3% Operating Costs and Expenses 6.6 6.5 2% Earnings from Operations 1.6 1.5 8% Net Earnings Attributable to Century Casinos, Inc. Shareholders 1.0 0.9 7% Adjusted EBITDA* 2.2 2.1 5% Adjusted EBITDA Margin* 27% 27% * Adjusted EBITDA and Adjusted EBITDA margin are non - GAAP financial measures . See Appendix A for the definition and reconciliation of Adjusted EBITDA and Adjusted EBITDA margin .
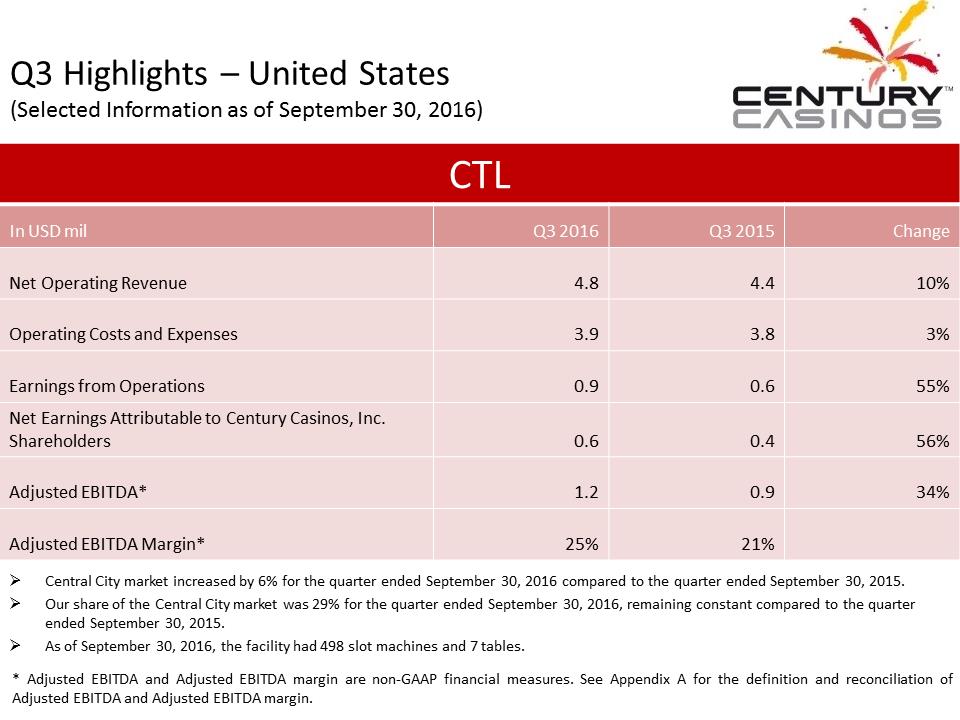 Q3 Highlights – United States (Selected Information as of September 30, 2016) CTL In USD mil Q3 2016 Q3 2015 Change Net Operating Revenue 4.8 4.4 10% Operating Costs and Expenses 3.9 3.8 3% Earnings from Operations 0.9 0.6 55% Net Earnings Attributable to Century Casinos, Inc. Shareholders 0.6 0.4 56% Adjusted EBITDA* 1.2 0.9 34% Adjusted EBITDA Margin* 25% 21% . Central City market increased by 6% for the quarter ended September 30, 2016 compared to the quarter ended September 30, 2015 . . Our share of the Central City market was 29% for the quarter ended September 30, 2016, remaining constant compared to the qua rte r ended September 30, 2015. . As of September 30, 2016, the facility had 498 slot machines and 7 tables. * Adjusted EBITDA and Adjusted EBITDA margin are non - GAAP financial measures . See Appendix A for the definition and reconciliation of Adjusted EBITDA and Adjusted EBITDA margin .
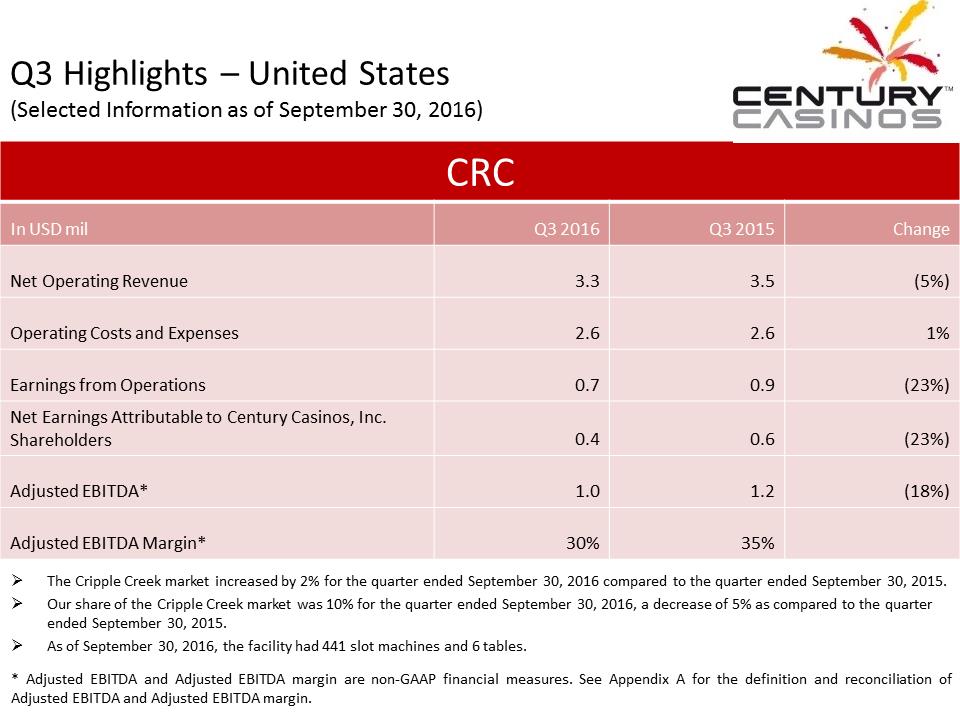 Q3 Highlights – United States (Selected Information as of September 30, 2016) CRC In USD mil Q3 2016 Q3 2015 Change Net Operating Revenue 3.3 3.5 (5%) Operating Costs and Expenses 2.6 2.6 1% Earnings from Operations 0.7 0.9 (23%) Net Earnings Attributable to Century Casinos, Inc. Shareholders 0.4 0.6 (23%) Adjusted EBITDA* 1.0 1.2 (18%) Adjusted EBITDA Margin* 30% 35% . The Cripple Creek market increased by 2% for the quarter ended September 30, 2016 compared to the quarter ended September 30, 20 15. . Our share of the Cripple Creek market was 10% for the quarter ended September 30, 2016, a decrease of 5% as compared to the q uar ter ended September 30, 2015. . As of September 30, 2016, the facility had 441 slot machines and 6 tables. * Adjusted EBITDA and Adjusted EBITDA margin are non - GAAP financial measures . See Appendix A for the definition and reconciliation of Adjusted EBITDA and Adjusted EBITDA margin .
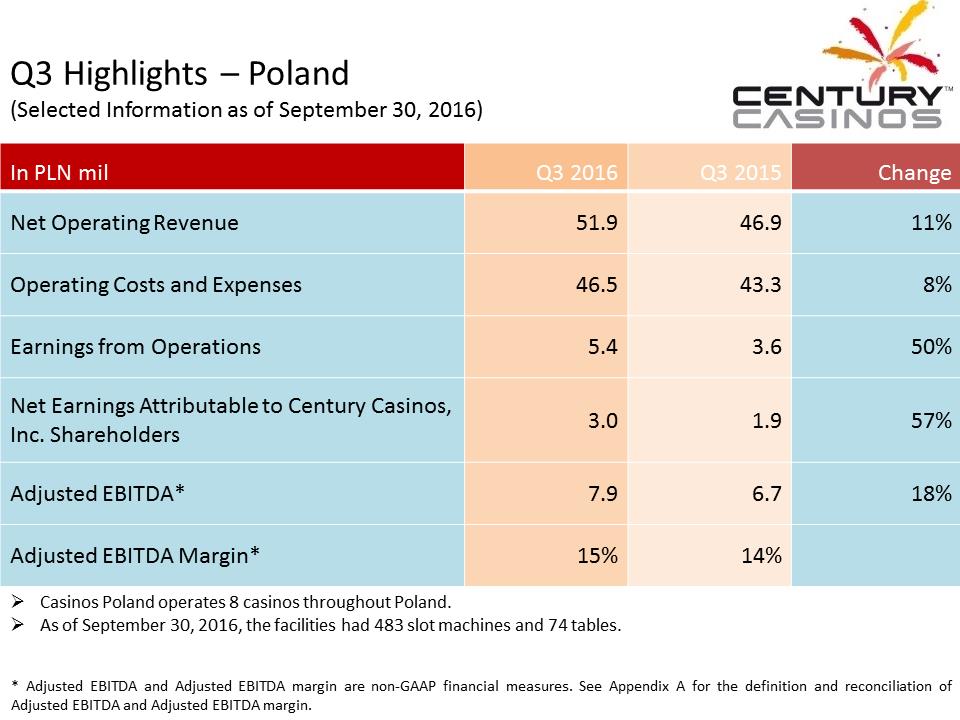 Q3 Highlights – Poland (Selected Information as of September 30, 2016) In PLN mil Q3 2016 Q3 2015 Change Net Operating Revenue 51.9 46.9 11% Operating Costs and Expenses 46.5 43.3 8% Earnings from Operations 5.4 3.6 50% Net Earnings Attributable to Century Casinos, Inc. Shareholders 3.0 1.9 57% Adjusted EBITDA* 7.9 6.7 18% Adjusted EBITDA Margin* 15% 14% . Casinos Poland operates 8 casinos throughout Poland. . As of September 30, 2016, the facilities had 483 slot machines and 74 tables. * Adjusted EBITDA and Adjusted EBITDA margin are non - GAAP financial measures . See Appendix A for the definition and reconciliation of Adjusted EBITDA and Adjusted EBITDA margin .
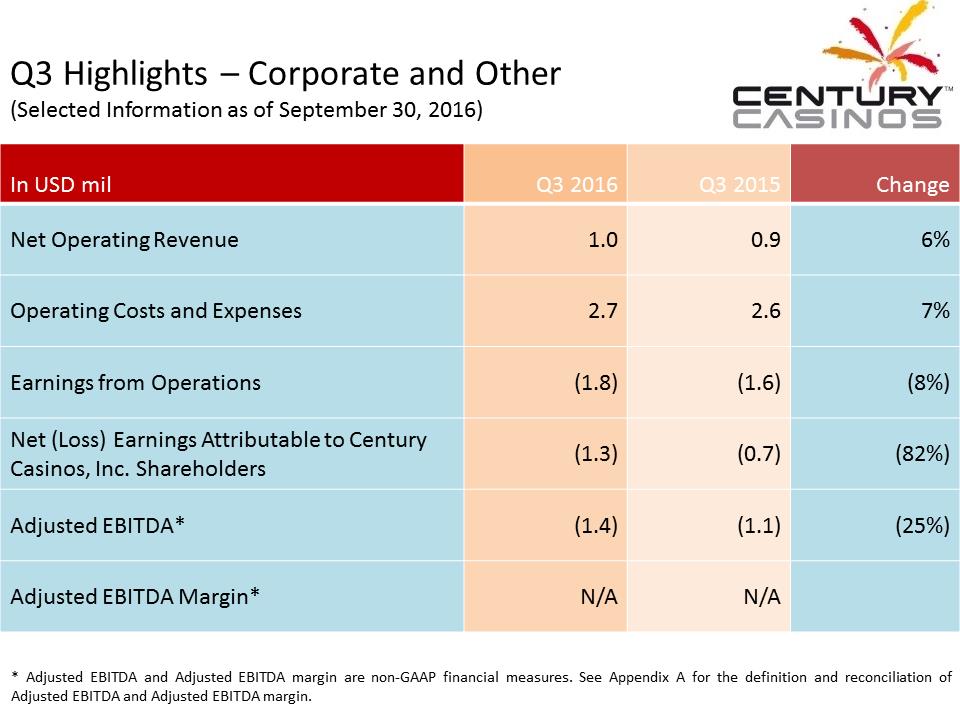 Q3 Highlights – Corporate and Other (Selected Information as of September 30, 2016) In USD mil Q3 2016 Q3 2015 Change Net Operating Revenue 1.0 0.9 6% Operating Costs and Expenses 2.7 2.6 7% Earnings from Operations (1.8) (1.6) (8%) Net (Loss) Earnings Attributable to Century Casinos, Inc. Shareholders (1.3) (0.7) (82%) Adjusted EBITDA* (1.4) (1.1) (25%) Adjusted EBITDA Margin* N/A N/A * Adjusted EBITDA and Adjusted EBITDA margin are non - GAAP financial measures . See Appendix A for the definition and reconciliation of Adjusted EBITDA and Adjusted EBITDA margin .
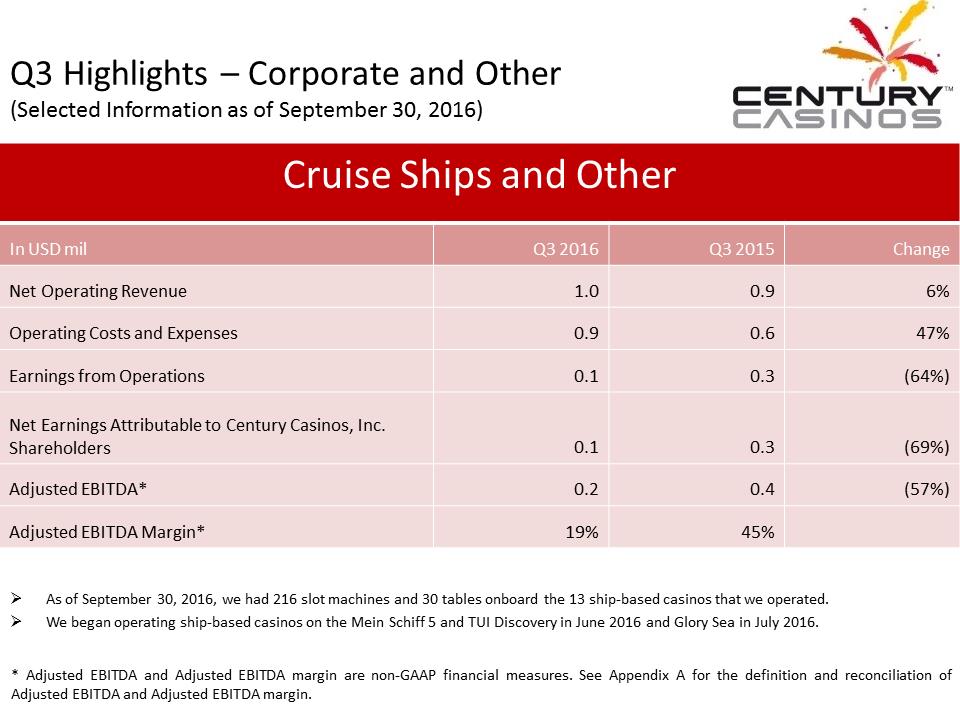 Q3 Highlights – Corporate and Other (Selected Information as of September 30, 2016) Cruise Ships and Other In USD mil Q3 2016 Q3 2015 Change Net Operating Revenue 1.0 0.9 6% Operating Costs and Expenses 0.9 0.6 47% Earnings from Operations 0.1 0.3 (64%) Net Earnings Attributable to Century Casinos, Inc. Shareholders 0.1 0.3 (69%) Adjusted EBITDA* 0.2 0.4 (57%) Adjusted EBITDA Margin* 19% 45% . As of September 30, 2016, we had 216 slot machines and 30 tables onboard the 13 ship - based casinos that we operated. . We began operating ship - based casinos on the Mein Schiff 5 and TUI Discovery in June 2016 and Glory Sea in July 2016. * Adjusted EBITDA and Adjusted EBITDA margin are non - GAAP financial measures . See Appendix A for the definition and reconciliation of Adjusted EBITDA and Adjusted EBITDA margin .
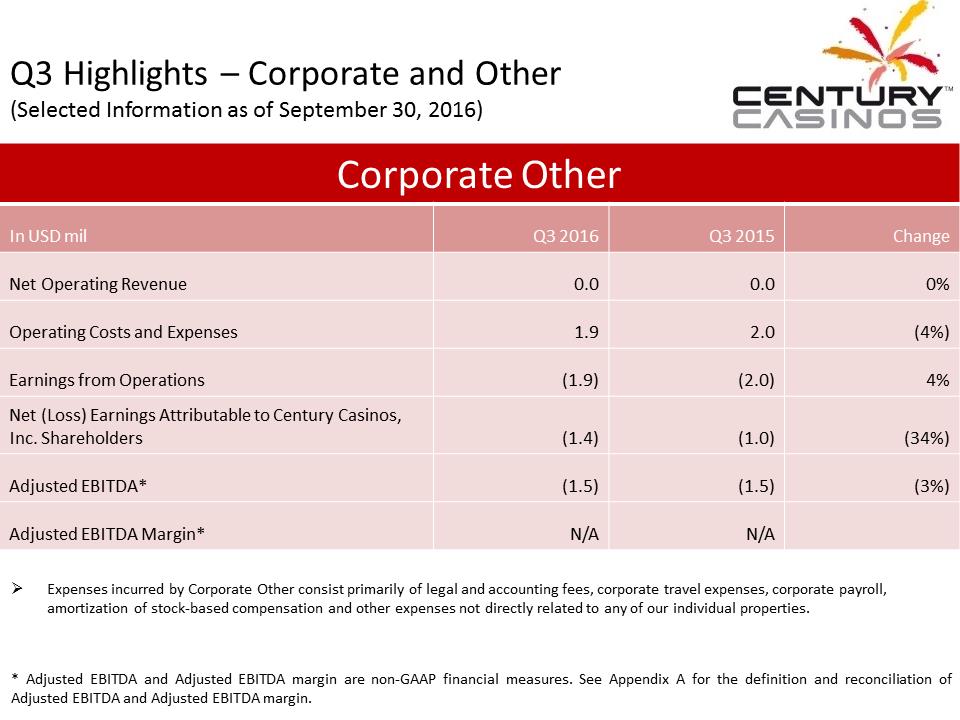 Q3 Highlights – Corporate and Other (Selected Information as of September 30, 2016) Corporate Other In USD mil Q3 2016 Q3 2015 Change Net Operating Revenue 0.0 0.0 0% Operating Costs and Expenses 1.9 2.0 (4%) Earnings from Operations (1.9) (2.0) 4% Net (Loss) Earnings Attributable to Century Casinos, Inc. Shareholders (1.4) (1.0) (34%) Adjusted EBITDA* (1.5) (1.5) (3%) Adjusted EBITDA Margin* N/A N/A . Expenses incurred by Corporate Other consist primarily of legal and accounting fees, corporate travel expenses, corporate pay rol l, amortization of stock - based compensation and other expenses not directly related to any of our individual properties. * Adjusted EBITDA and Adjusted EBITDA margin are non - GAAP financial measures . See Appendix A for the definition and reconciliation of Adjusted EBITDA and Adjusted EBITDA margin .
 Q3 Highlights – Additional Projects Under Development Century Mile In September 2016, the Company was selected as the successful applicant by Horse Racing Alberta to own, build and operate a h ors e racing facility in the Edmonton market area, which the Company will operate as Century Mile. Century Mile will be a one - mile horse race track an multi - level racing and entertainment center. The proposed location is on Edmonton International Airport land and close to the city of Leduc, south of Edmonton and positioned off Queen Elizabeth II highway. The Company estimates that the project will cost approximately CAD 50 .0 million and be completed by the end of 2018. Century Casino St. Albert On October 1, 2016, the Company’s subsidiary, Century Casino St. Albert Inc., acquired 100% of the issued and outstanding sha res and related land of entities operating the Apex Casino, which the Company now operates as Century Casino St. Albert (“CSA”), in suburban Edm onton, Alberta, Canada. CSA is a 34,500 square foot casino facility located on approximately seven acres of land that includes 382 s lot machines, 11 live table games, a restaurant, a bar, a lounge and a banquet facility that can accommodate up to 175 guests.
 Appendix A – Non - GAAP Financial Measures The Company supplements its condensed consolidated financial statements prepared in accordance with U . S . generally accepted accounting principles (“US GAAP”) by using the following non - GAAP financial measures, which management believes are useful in properly understanding the Company’s short - term and long - term financial trends . Management uses these non - GAAP financial measures to forecast and evaluate the operational performance of the Company as well as to compare results of current periods to prior periods on a consolidated basis . . Adjusted EBITDA . Adjusted EBITDA margin . Constant currency results . Net Debt Management believes presenting the non - GAAP financial measures used in this presentation provides investors greater transparency to the information used by management for financial and operational decision - making and allows investors to see the Company’s results “through the eyes” of management . Management also believes providing this information better enables our investors to understand the Company’s operating performance and evaluate the methodology used by management to evaluate and measure such performance . The adjustments made to U . S . GAAP financial measures result from facts and circumstances that vary in frequency and impact on the Company’s results of operations . The following is an explanation of each of the adjustments that management excludes in calculating its non - GAAP financial measures .
 Appendix A – Non - GAAP Financial Measures The Company defines Adjusted EBITDA as net earnings (loss) attributable to Century Casinos, Inc . shareholders before interest expense (income), net, income taxes (benefit), depreciation, amortization, non - controlling interest (earnings) losses and transactions, pre - opening expenses, acquisition costs, non - cash stock - based compensation charges, asset impairment costs, (gain) loss on disposition of fixed assets, discontinued operations, (gain) loss on foreign currency transactions and other, gain on business combination and certain other one - time items . Intercompany transactions consisting primarily of management and royalty fees and interest, along with their related tax effects, are excluded from the presentation of net earnings (loss) and Adjusted EBITDA reported for each segment and property . Not all of the aforementioned items occur in each reporting period, but have been included in the definition based on historical activity . These adjustments have no effect on the consolidated results as reported under US GAAP . Adjusted EBITDA is not considered a measure of performance recognized under US GAAP . Management believes that Adjusted EBITDA is a valuable measure of the relative performance of the Company and its properties . The gaming industry commonly uses Adjusted EBITDA as a method of arriving at the economic value of a casino operation . Management uses Adjusted EBITDA to compare the relative operating performance of separate operating units by eliminating the above mentioned items associated with the varying levels of capital expenditures for infrastructure required to generate revenue, and the often high cost of acquiring existing operations . Adjusted EBITDA is used by the Company’s lending institution to gauge operating performance . The Company’s computation of Adjusted EBITDA may be different from, and therefore may not be comparable to, similar measures used by other companies within the gaming industry . Please see the reconciliation of Adjusted EBITDA to net earnings (loss) attributable to Century Casinos, Inc . shareholders below . The Company defines Adjusted EBITDA margin as Adjusted EBITDA divided by net operating revenue . Management uses this margin as one of several measures to evaluate the efficiency of the Company’s casino operations . The impact of foreign exchange rates is highly variable and difficult to predict . The Company uses a Constant Currency basis to show the impact from foreign exchange rates on current period revenue compared to prior period revenue using the prior period’s foreign exchange rates . In order to properly understand the underlying business trends and performance of the Company’s ongoing operations, management believes that investors may find it useful to consider the impact of excluding changes in foreign exchange rates from the Company’s net operating revenue, net earnings (loss) attributable to Century Casinos, Inc . Shareholders and Adjusted EBITDA . The Company defines Net Debt as total long - term debt (including current portion) plus deferred financing costs minus cash and cash equivalents . Net Debt is no considered a liquidity measure recognized under US GAAP . Management believes that Net Debt is a valuable measure of our overall financial situation . Net Debt provides investors with an indication of our ability to pay off all of our long - term debt if it became due simultaneously .
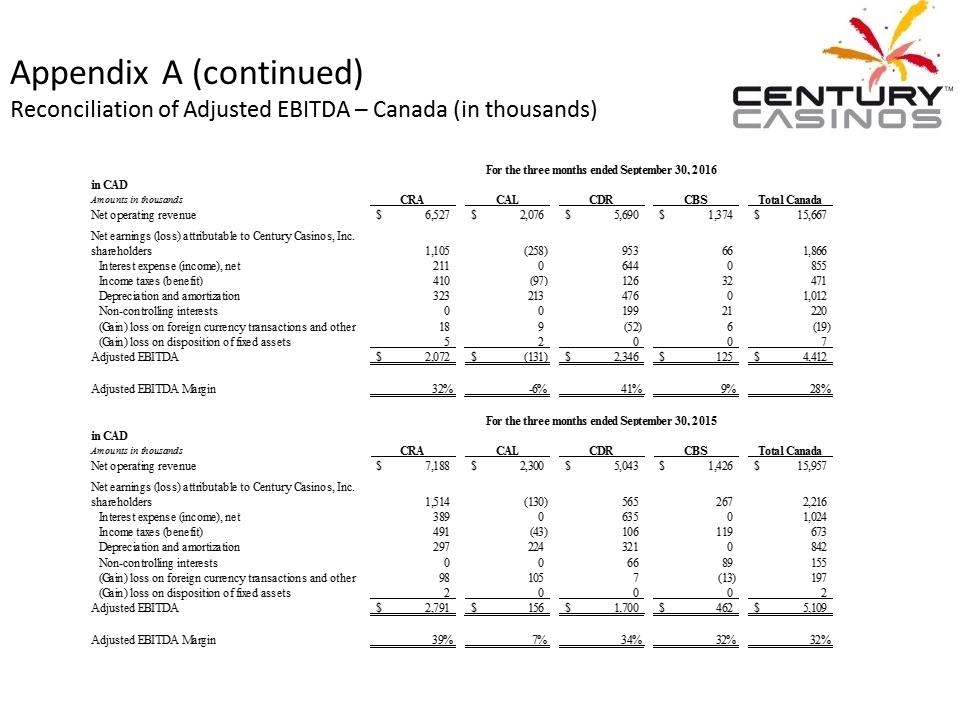 Appendix A (continued) Reconciliation of Adjusted EBITDA – Canada (in thousands) in CADAmounts in thousandsCRACALCDRCBSTotal CanadaNet operating revenue6,527$ 2,076$ 5,690$ 1,374$ 15,667$ Net earnings (loss) attributable to Century Casinos, Inc. shareholders1,105(258)953661,866Interest expense (income), net21106440855Income taxes (benefit)410(97)12632471Depreciation and amortization32321347601,012Non-controlling interests0019921220(Gain) loss on foreign currency transactions and other189(52)6(19) (Gain) loss on disposition of fixed assets52007Adjusted EBITDA2,072$ (131)$ 2,346$ 125$ 4,412$ Adjusted EBITDA Margin32%-6%41%9%28% in CADAmounts in thousandsCRACALCDRCBSTotal CanadaNet operating revenue7,188$ 2,300$ 5,043$ 1,426$ 15,957$ Net earnings (loss) attributable to Century Casinos, Inc. shareholders1,514(130)5652672,216Interest expense (income), net389063501,024Income taxes (benefit)491(43)106119673Depreciation and amortization2972243210842Non-controlling interests006689155(Gain) loss on foreign currency transactions and other981057(13)197(Gain) loss on disposition of fixed assets20002Adjusted EBITDA2,791$ 156$ 1,700$ 462$ 5,109$ Adjusted EBITDA Margin39%7%34%32%32% For the three months ended September 30, 2016For the three months ended September 30, 2015
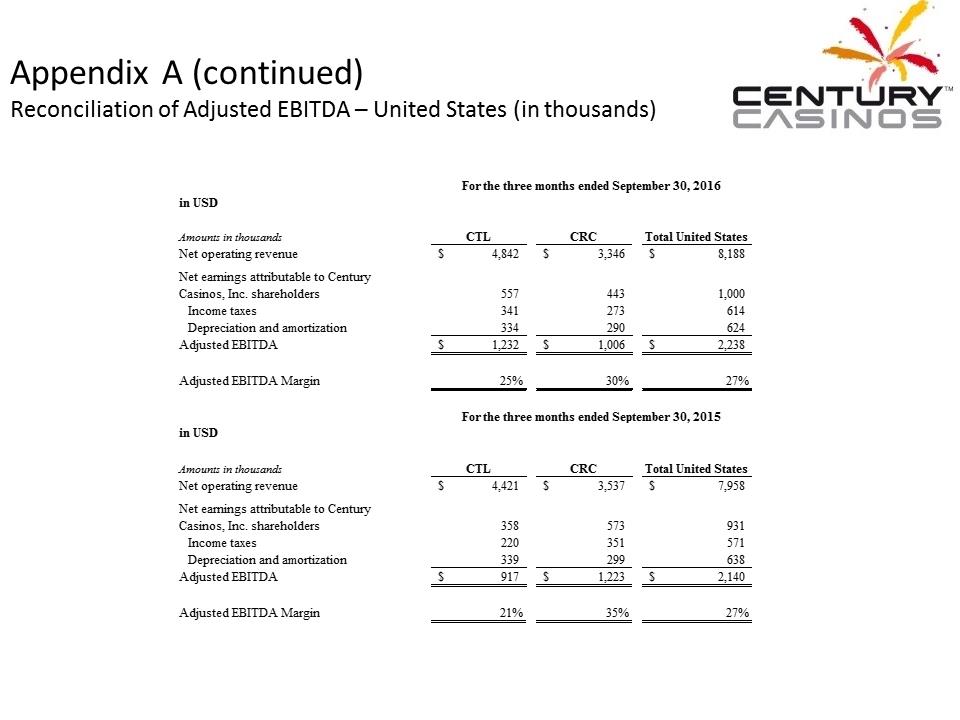 Appendix A (continued) Reconciliation of Adjusted EBITDA – United States (in thousands) in USDAmounts in thousandsCTLCRCTotal United StatesNet operating revenue4,842$ 3,346$ 8,188$ Net earnings attributable to Century Casinos, Inc. shareholders5574431,000Income taxes341273614Depreciation and amortization334290624Adjusted EBITDA1,232$ 1,006$ 2,238$ Adjusted EBITDA Margin25%30%27% in USDAmounts in thousandsCTLCRCTotal United StatesNet operating revenue4,421$ 3,537$ 7,958$ Net earnings attributable to Century Casinos, Inc. shareholders358573931Income taxes220351571Depreciation and amortization339299638Adjusted EBITDA917$ 1,223$ 2,140$ Adjusted EBITDA Margin21%35%27% For the three months ended September 30, 2016For the three months ended September 30, 2015
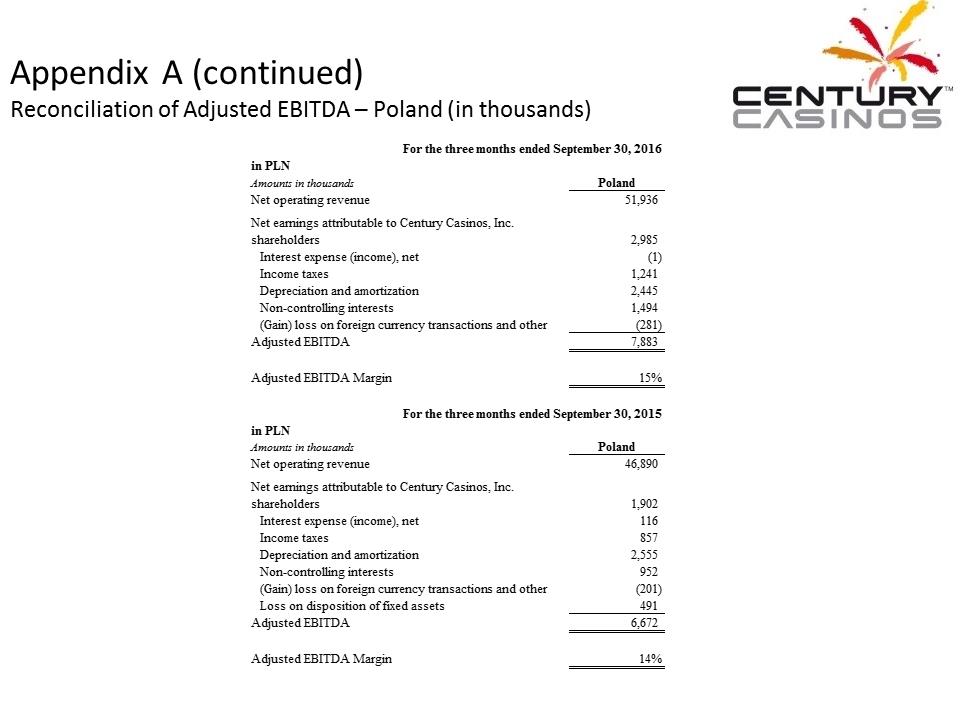 Appendix A (continued) Reconciliation of Adjusted EBITDA – Poland (in thousands) For the three months ended September 30, 2016in PLNAmounts in thousandsPolandNet operating revenue51,936 Net earnings attributable to Century Casinos, Inc. shareholders2,985Interest expense (income), net(1) Income taxes1,241Depreciation and amortization2,445Non-controlling interests1,494(Gain) loss on foreign currency transactions and other(281) Adjusted EBITDA7,883 Adjusted EBITDA Margin15% For the three months ended September 30, 2015in PLNAmounts in thousandsPolandNet operating revenue46,890 Net earnings attributable to Century Casinos, Inc. shareholders1,902Interest expense (income), net116Income taxes857Depreciation and amortization2,555Non-controlling interests952(Gain) loss on foreign currency transactions and other(201) Loss on disposition of fixed assets491Adjusted EBITDA6,672 Adjusted EBITDA Margin14%
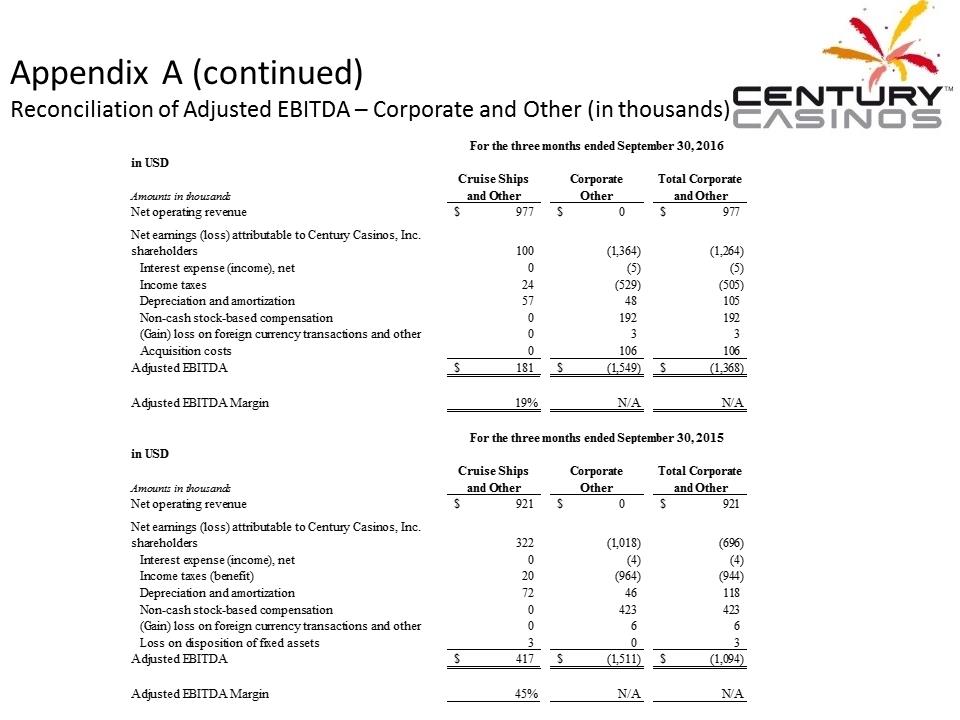 Appendix A (continued) Reconciliation of Adjusted EBITDA – Corporate and Other (in thousands) in USDAmounts in thousandsCruise Ships and OtherCorporate OtherTotal Corporate and OtherNet operating revenue977$ 0$ 977$ Net earnings (loss) attributable to Century Casinos, Inc. shareholders100(1,364)(1,264) Interest expense (income), net0(5)(5) Income taxes24(529)(505) Depreciation and amortization5748105Non-cash stock-based compensation0192192(Gain) loss on foreign currency transactions and other033Acquisition costs0106106Adjusted EBITDA181$ (1,549)$ (1,368)$ Adjusted EBITDA Margin19%N/AN/Ain USDAmounts in thousandsCruise Ships and OtherCorporate OtherTotal Corporate and OtherNet operating revenue921$ 0$ 921$ Net earnings (loss) attributable to Century Casinos, Inc. shareholders322(1,018)(696) Interest expense (income), net0(4)(4) Income taxes (benefit)20(964)(944) Depreciation and amortization7246118Non-cash stock-based compensation0423423(Gain) loss on foreign currency transactions and other066Loss on disposition of fixed assets303Adjusted EBITDA417$ (1,511)$ (1,094)$ Adjusted EBITDA Margin45%N/AN/AFor the three months ended September 30, 2016For the three months ended September 30, 2015
 Appendix A (continued) Reconciliation of Net Debt (in thousands) Total long-term debt, including current portion$58,356 $36,520 Deferred financing costs398 261 Total principal$58,754 $36,781 Less: cash and cash equivalents32,966 29,366 Net debt$25,788 $7,415 September 30, 2016December 31, 2015