Exhibit 99.2
CENTURY CASINOS Financial Results Q2 2019
Forward-LookingStatements, Business Environment and RiskFactors This presentation may contain “forward-looking statements” within the meaning of Section 27A of the Securities Act of 1933, as amended, Section 21E of the Securities Exchange Act of 1934, as amended (the “Exchange Act”), and the Private Securities Litigation Reform Act of 1995. In addition, Century Casinos, Inc. (together with its subsidiaries, the “Company”) may make other written and oral communications from time to time that contain such statements. Forward-looking statements include statements as to industry trends and future expectations of the Company and other matters that do not relate strictly to historical facts and are based on certain assumptions by management at the time such statements are made. Forward-looking statements in this presentation include statements regarding future results of operations, operating efficiencies, synergies and operational performance, the prospects for and timing and costs of new projects, projects in development and other opportunities, including the acquisition of Isle Casino Cape Girardeau (“Cape Girardeau”), Lady Luck Caruthersville (“Caruthersville”) and Mountaineer Casino, Racetrack and Resort (“Mountaineer”), plans to refinance our credit facility with a new credit facility, the Bermuda project, debt repayment, investments in joint ventures, outcomes of legal proceedings, changes in our tax provisions or exposure to additional income tax liabilities, and plans for our casinos and our Company. These statements are often identified by the use of words such as “may,” “will,” “expect,” “believe,” “anticipate,” “intend,” “could,” “estimate,” or “continue,” and similar expressions or variations. These statements are based on the beliefs and assumptions of the management of the Company based on information currently available to management. Such forward-looking statements are subject to risks, uncertainties and other factors that could cause actual results to differ materially from future results expressed or implied by such forward-looking statements. Important factors that could cause actual results to differ materially from the forward-looking statements include, among others, the risks described in the section entitled “Risk Factors” under Item 1A in our Annual Report on Form 10-K for the year ended December 31, 2018 (the “2018 Annual Report”) and our subsequent periodic and current reports filed with the SEC. We caution the reader to carefully consider such factors. Furthermore, such forward-looking statements speak only as of the date on which such statements are made. We undertake no obligation to update any forward-looking statements to reflect events or circumstances after the date of such statements.2
Notes on Presentation In this presentation the term “USD” refers to US dollars, the term “CAD” refers to Canadian dollars, the term “PLN” refers to Polish zloty and the term “GBP” refers to the British pound. Adjusted EBITDA and Adjusted EBITDA margin are non-GAAP financial measures. See Appendix A for the definition and reconciliation of Adjusted EBITDA and Adjusted EBITDA margin.Amounts presented are rounded. As such, rounding differences could occur in period-over-period changes and percentages reported throughout this presentation. The names of the Company’s subsidiaries and certain operating segments are abbreviated on certain of the following slides. See Appendix A for a list of the subsidiaries and their abbreviations. 3
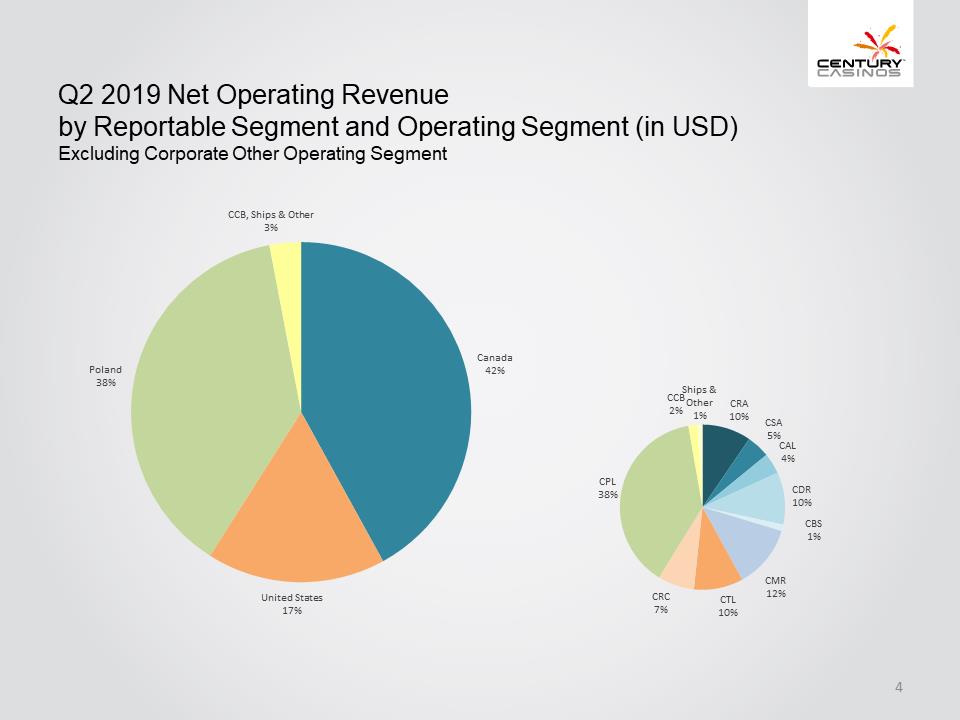
Q2 2019 Net Operating Revenue by Reportable Segment and Operating Segment (in USD) Excluding Corporate Other Operating Segment Canada 42% United States 17% Poland 38% CCB, Ships & Other 3% CRA 10% CSA 5% CAL 4% CDR 10% CBS 1% CMR 12% CTL 10% CRC 7% CPL 38% CCB 2% Ships & Other 1% 4
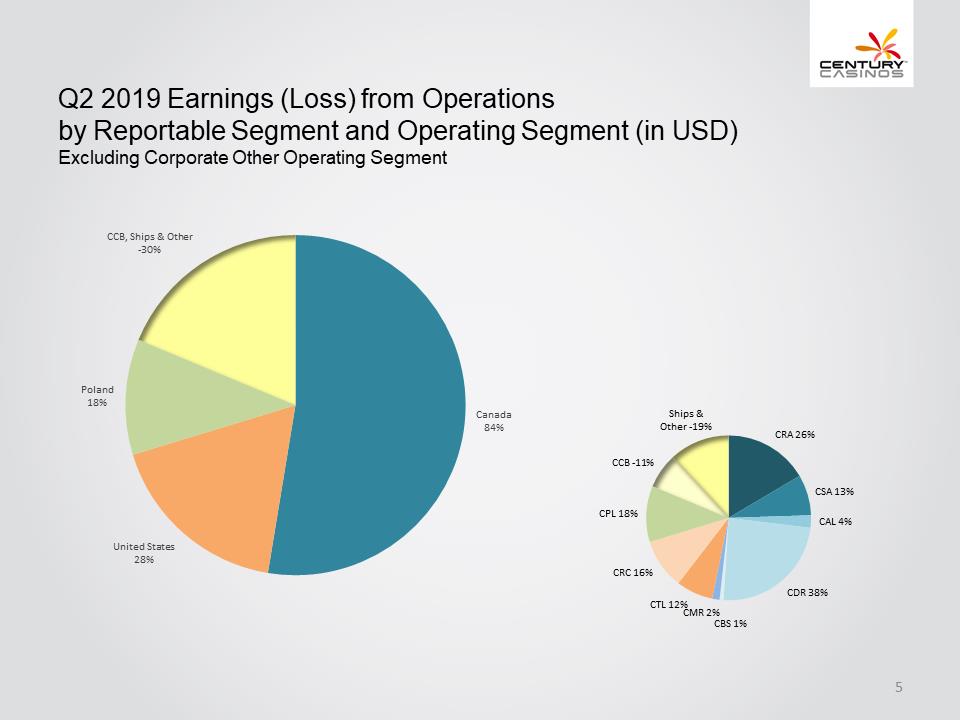
Q2 2019 Earnings (Loss) from Operationsby Reportable Segment and Operating Segment (in USD) Excluding Corporate Other Operating Segment Canada 84% United States 28% Poland 18% CCB, Ships & Other -30% CRA 26% CSA 13% CAL 4% CDR 38% CBS 1% CMR 2% CTL 12% CRC 16% CPL 18% CCB -11% Ships & Other- 19% 5
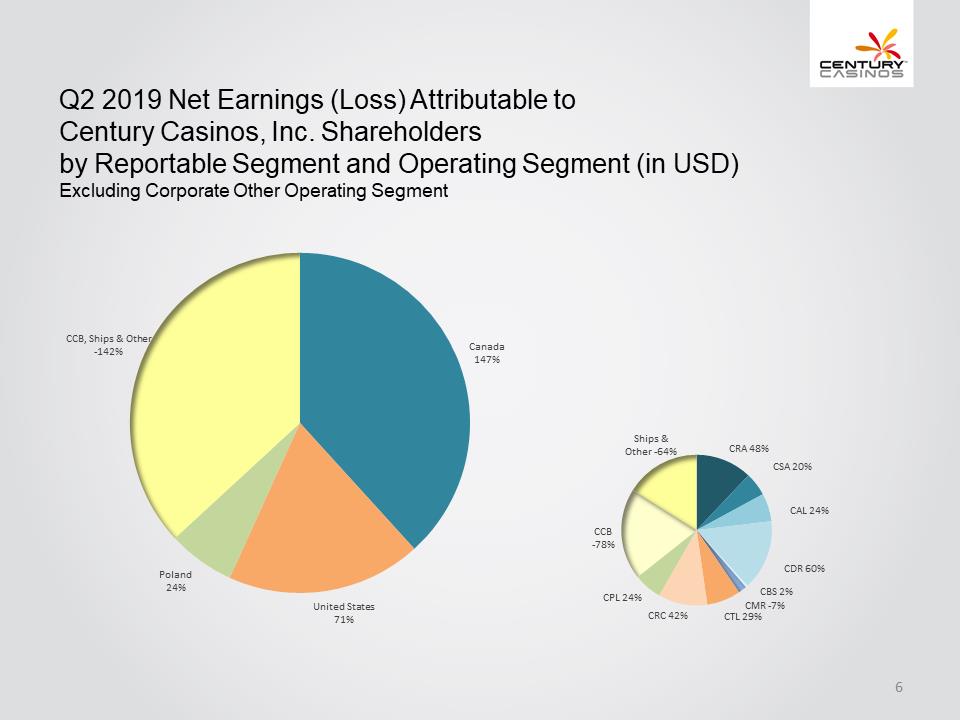
Q2 2019 Net Earnings (Loss) Attributable to Century Casinos, Inc. Shareholders by ReportableSegment and Operating Segment (in USD) Excluding Corporate Other Operating Segment Canada 147% United States 71% Poland 24% CCB, Ships & Other -142% CRA 48% CSA 20% CAL 24% CDR 60% CBS 2% CMR -7% CTL 29% CRC 42% CPL 24% CCB -78% Ships & Other -64% 6
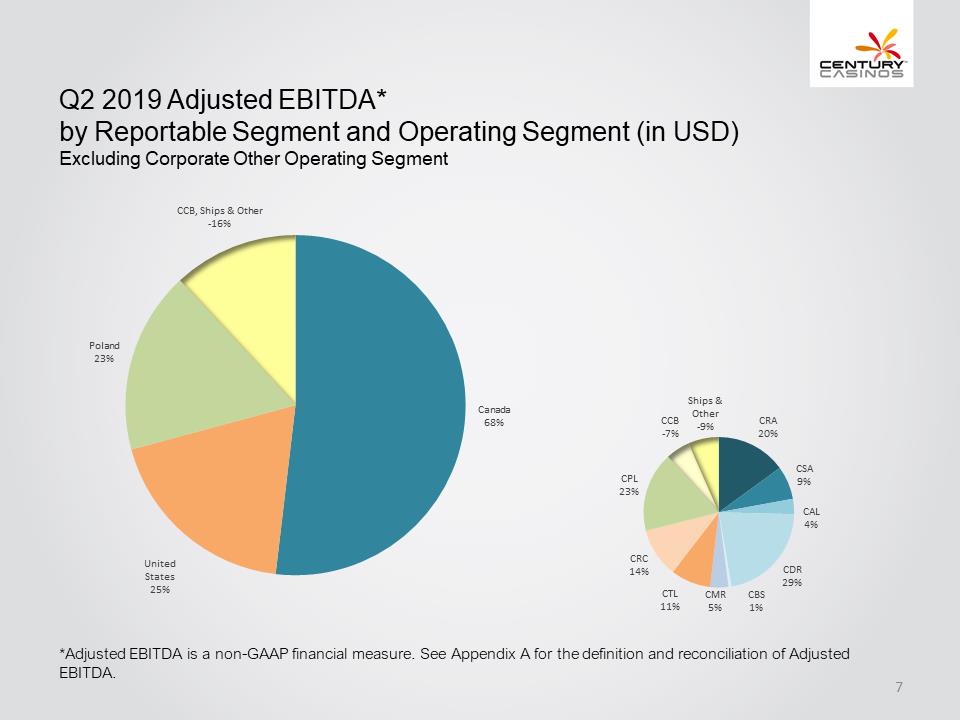
Q2 2019 Adjusted EBITDA* by Reportable Segment and Operating Segment (in USD) Excluding Corporate Other Operating Segment Canada 68% United States 25% Poland 23% CCB, Ships & Other -16% CRA 20% CSA 9% CAL 4% CDR 29% CBS 1% CMR 5% CTL 11% CRC 14% CPL 23% CCB -7% Ships & Other -9% *Adjusted EBITDA is a non-GAAP financial measure. See Appendix A for the definition and reconciliation of Adjusted EBITDA. 7
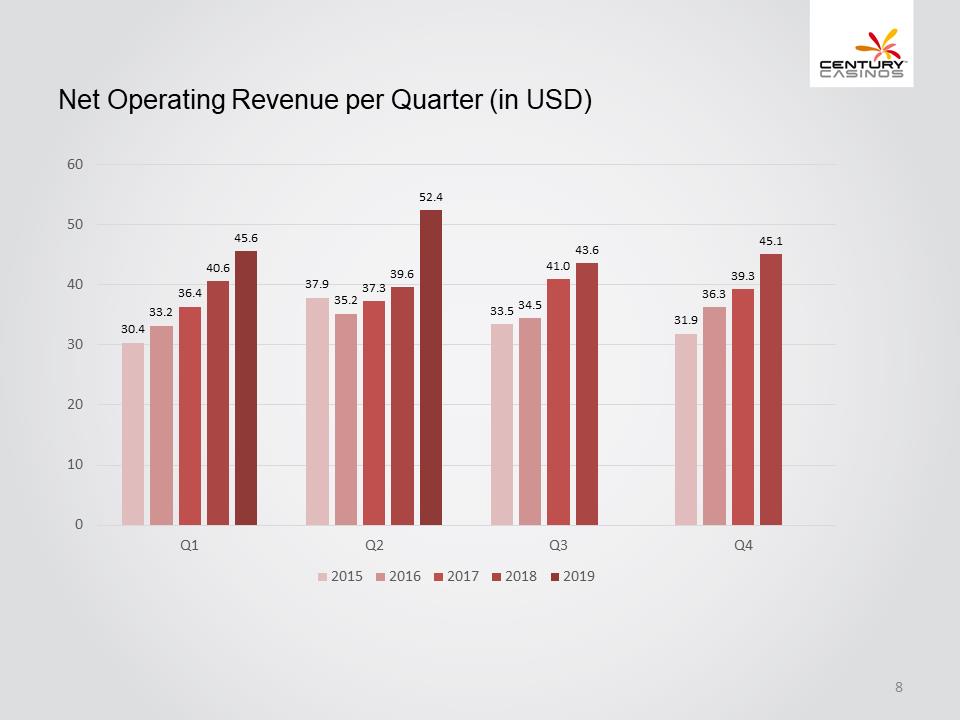
Net Operating Revenue per Quarter (in USD) 30.4 37.9 33.5 31.9 33.2 35.2 34.5 36.3 36.4 37.3 41.0 39.3 40.6 39.6 43.6 45.1 45.6 52.4 0 10 20 30 40 50 60 Q1 Q2 Q3 Q4 2015 2016 2017 2018 2019 8
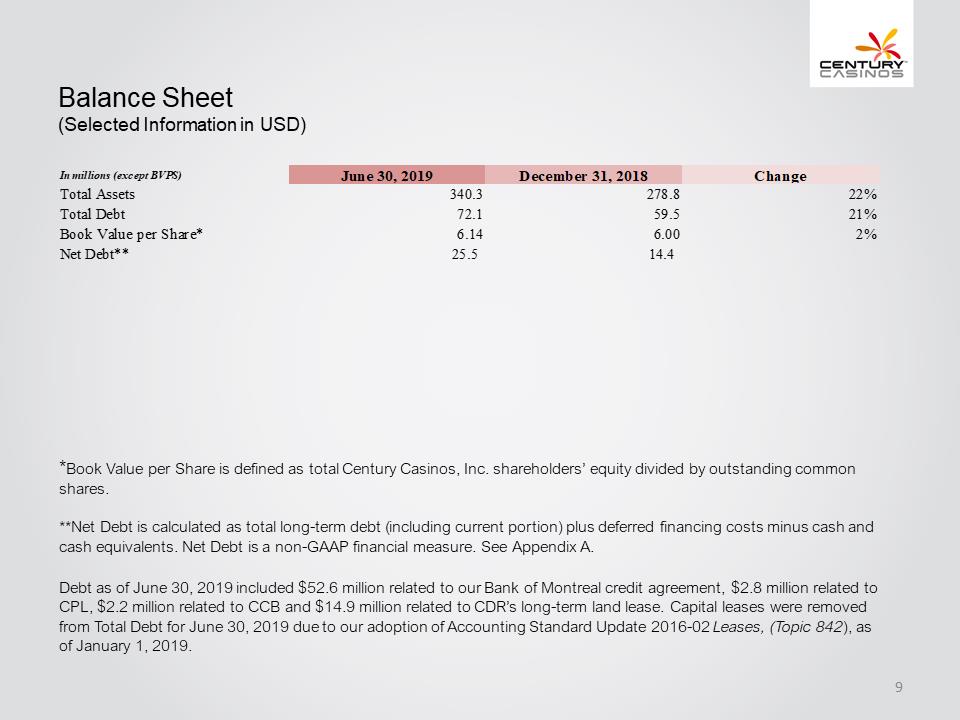
Balance Sheet (Selected Information in USD) In millions (except BVPS) June 30, 2019 December 31, 2018 Change Total Assets 340.3 278.8 22% Total Debt 72.1 59.5 21% Book Value per Share* 6.14 6.00 2% Net Debt** 25.5 14.4 *Book Value per Share is defined as total Century Casinos, Inc. shareholders’ equity divided by outstanding common shares. **Net Debt is calculated as total long-term debt (including current portion) plus deferred financing costs minus cash and cash equivalents. Net Debt is a non-GAAP financial measure. See Appendix A. Debt as of June 30, 2019 included $52.6 million related to our Bank of Montreal credit agreement, $2.8 million related to CPL, $2.2 million related to CCB and $14.9 million related to CDR’s long-term land lease. Capital leases were removed from Total Debt for June 30, 2019 due to our adoption of Accounting Standard Update 2016-02 Leases, (Topic 842), as of January 1, 2019. 9
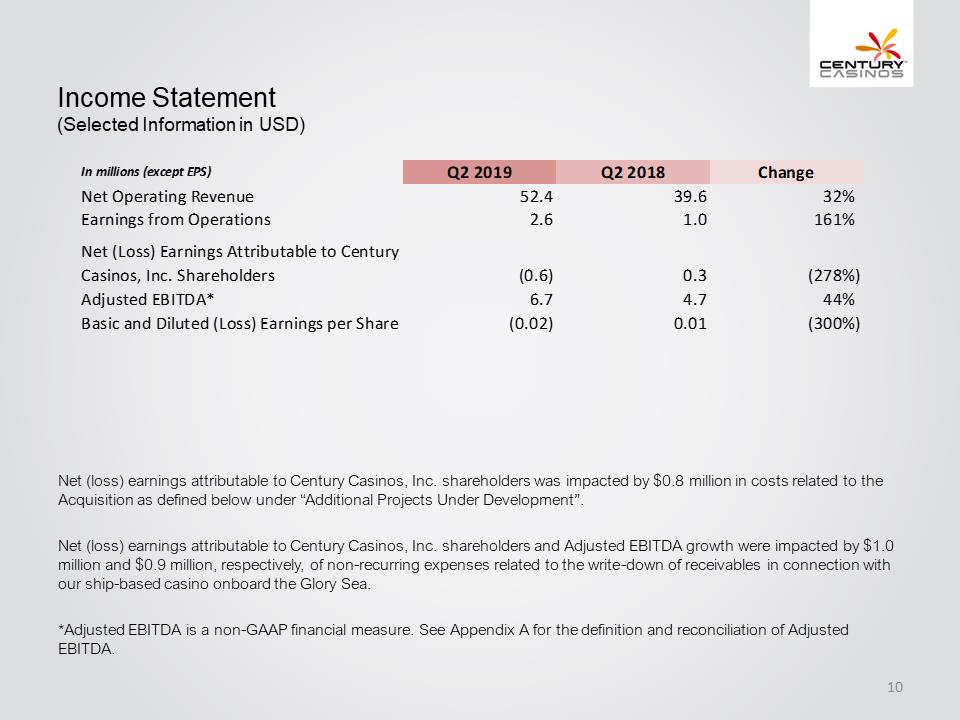
Income Statement (Selected Information in USD) In millions (except EPS) Q2 2019 Q2 2018 Change Net Operating Revenue 52.4 39.6 32% Earnings from Operations 2.6 1.0 161% Net (Loss) Earnings Attributable to Century Casinos, Inc. Shareholders (0.6)0.3 (278%) Adjusted EBITDA*6.7 4.7 44% Basic and Diluted (Loss) Earnings per Share (0.02) 0.01 (300%) Net (loss) earnings attributable to Century Casinos, Inc. shareholders was impacted by $0.8 million in costs related to the Acquisition as defined below under “Additional Projects Under Development”. Net (loss) earnings attributable to Century Casinos, Inc. shareholders and Adjusted EBITDA growth were impacted by $1.0 million and $0.9 million, respectively, of non-recurring expenses related to the write-down of receivables in connection with our ship-based casino onboard the Glory Sea. *Adjusted EBITDA is a non-GAAP financial measure. See Appendix A for the definition and reconciliation of Adjusted EBITDA. 10
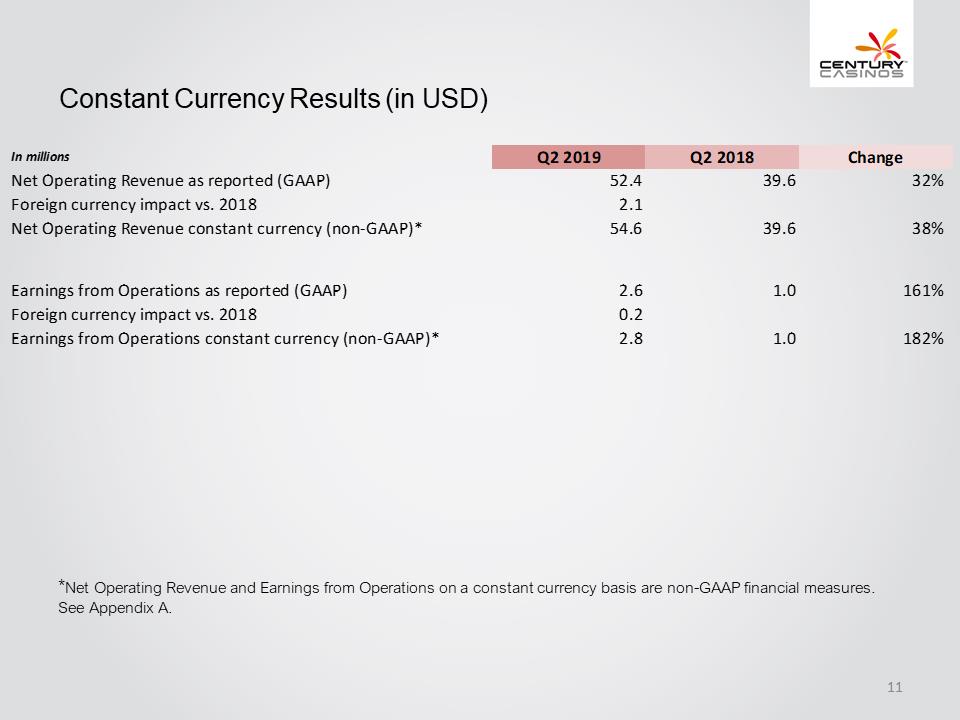
Constant Currency Results (in USD) In millions Q2 2019 Q2 2018 Change Net Operating Revenue as reported (GAAP) 52.4 39.6 32% Foreign currency impact vs. 2018 2.1 Net Operating Revenue constant currency (non-GAAP)* 54.6 39.6 38% Earnings from Operations as reported (GAAP) 2.6 1.0 161% Foreign currency impact vs. 2018 0.2 Earnings from Operations constant currency (non-GAAP)* 2.8 1.0 182% *Net Operating Revenue and Earnings from Operations on a constant currency basis are non-GAAP financial measures. See Appendix A. 11
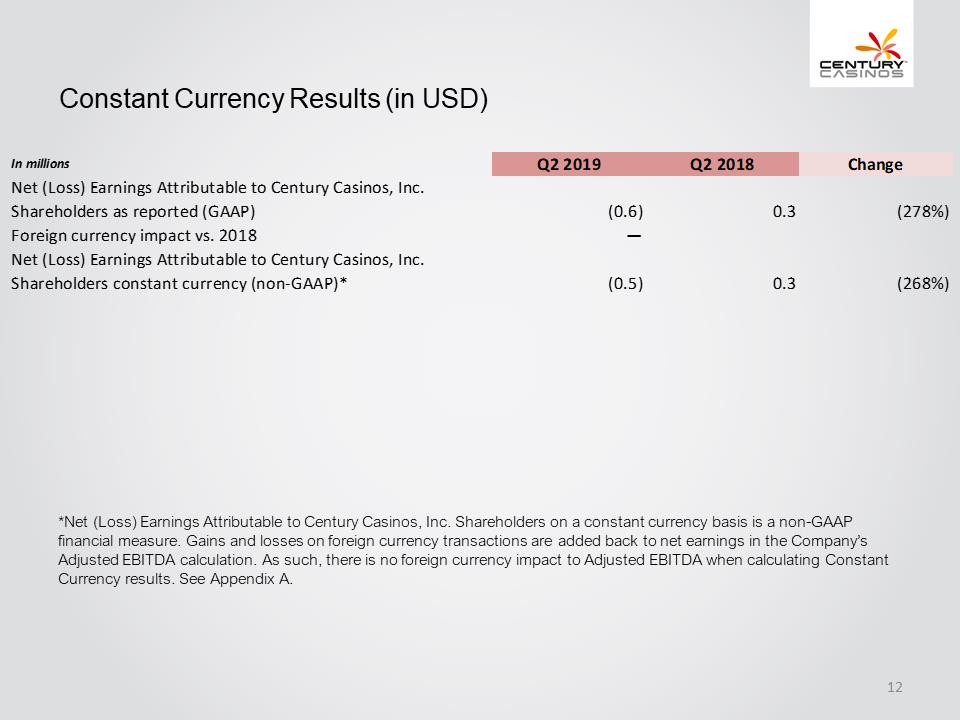
Constant Currency Results (in USD) In millions Q2 2019 Q2 2018 Change Net (Loss) Earnings Attributable to Century Casinos, Inc. Shareholders as reported (GAAP) (0.6) 0.3 (278%) Foreign currency impact vs. 2018 — Net (Loss) Earnings Attributable to Century Casinos, Inc. Shareholders constant currency (non-GAAP)* (0.5) 0.3 (268%) *Net (Loss) Earnings Attributable to Century Casinos, Inc. Shareholders on a constant currency basis is a non-GAAP financial measure. Gains and losses on foreign currency transactions are added back to net earnings in the Company’s Adjusted EBITDA calculation. As such, there is no foreign currency impact to Adjusted EBITDA when calculating Constant Currency results. See Appendix A. 12
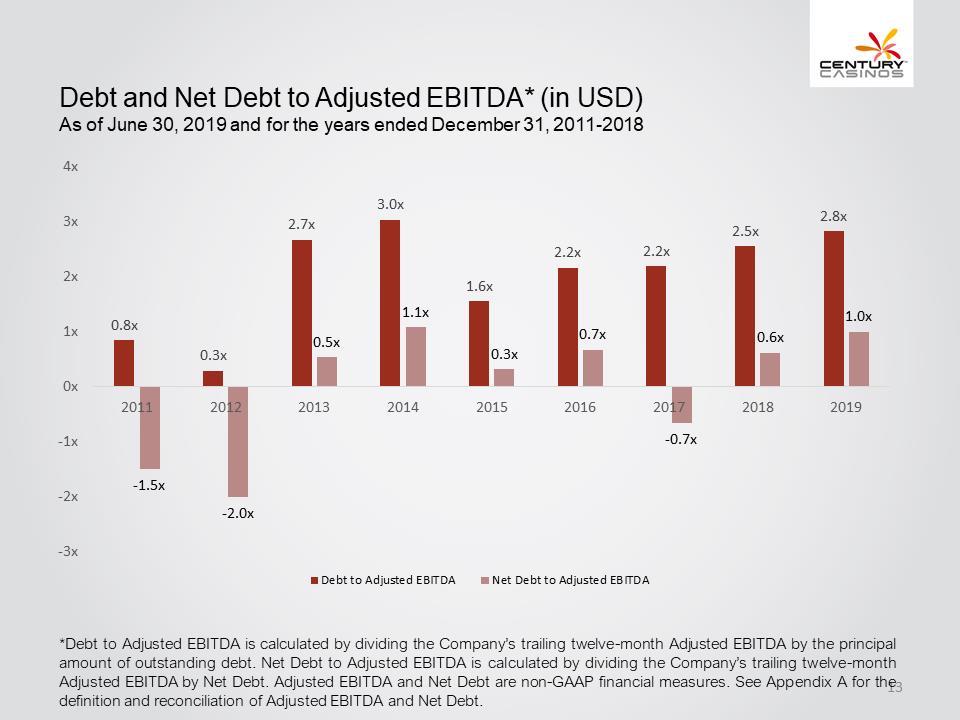
Debt and Net Debt to Adjusted EBITDA* (in USD) As of June 30, 2019 and for the years ended December 31, 2011-2018 0.8x 0.3x 2.7x 3.0x 1.6x 2.2x 2.2x 2.5x 2.8x -1.5x -2.0x 0.5x 1.1x 0.3x 0.7x -0.7x 0.6x 1.0x -3x -2x -1x 0x 1x 2x 3x 4x 2011 2012 2013 2014 2015 2016 2017 2018 2019 Debt to Adjusted EBITDA Net Debt to Adjusted EBITDA *Debt to Adjusted EBITDA is calculated by dividing the Company’s trailing twelve-month Adjusted EBITDA by the principal amount of outstanding debt. Net Debt to Adjusted EBITDA is calculated by dividing the Company’s trailing twelve-month Adjusted EBITDA by Net Debt. Adjusted EBITDA and Net Debt are non-GAAP financial measures. See Appendix A for the definition and reconciliation of Adjusted EBITDA and Net Debt 13
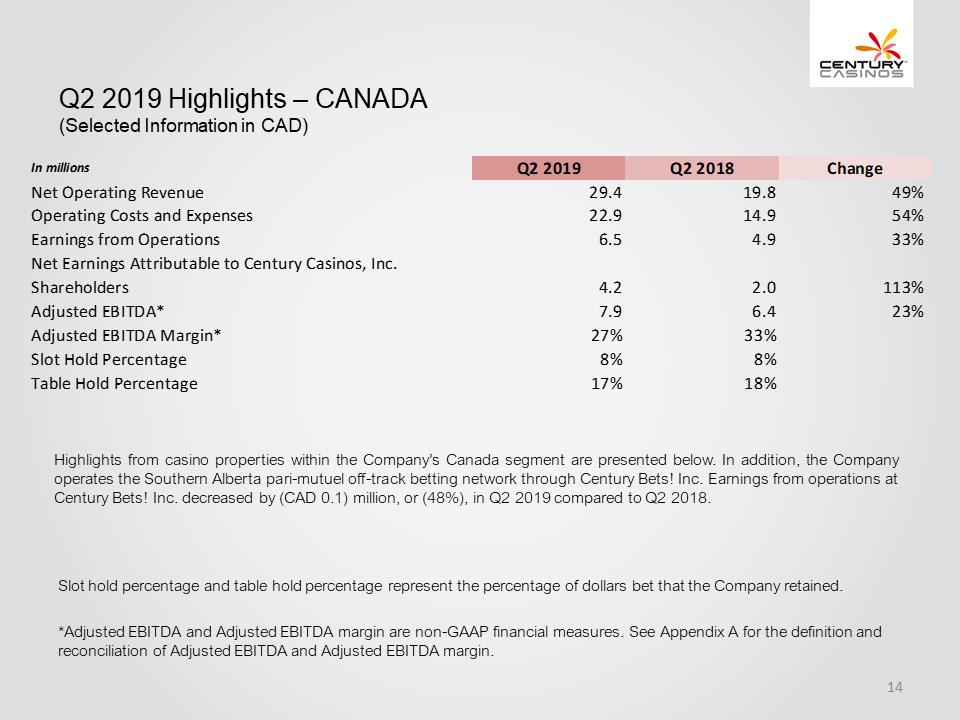
Q2 2019 Highlights –CANADA (Selected Information in CAD) In millions Q2 2019 Q2 2018 Change Net Operating Revenue 29.4 19.8 49% Operating Costs and Expenses 22.9 14.9 54% Earnings from Operations 6.5 4.9 33% Net Earnings Attributable to Century Casinos, Inc. Shareholders 4.2 2.0 113% Adjusted EBITDA* 7.9 6.4 23% Adjusted EBITDA Margin* 27% 33% Slot Hold Percentage 8% 8% Table Hold Percentage 17% 18% Highlights from casino properties within the Company’s Canada segment are presented below. In addition, the Company operates the Southern Alberta pari-mutuel off-track betting network through Century Bets! Inc. Earnings from operations at Century Bets! Inc. decreased by (CAD 0.1) million, or (48%), in Q2 2019 compared to Q2 2018. Slot hold percentage and table hold percentage represent the percentage of dollars bet that the Company retained. *Adjusted EBITDA and Adjusted EBITDA margin are non-GAAP financial measures. See Appendix A for the definition and reconciliation of Adjusted EBITDA and Adjusted EBITDA margin. 14
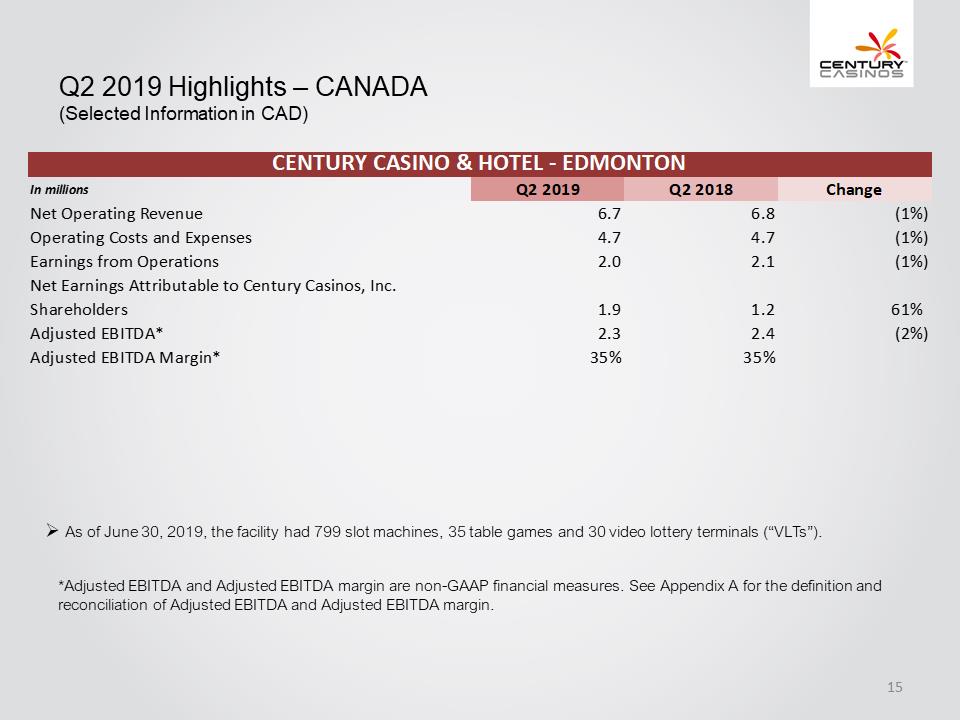
Q2 2019 Highlights –CANADA (Selected Information in CAD) CENTURY CASINO & HOTEL - EDMONTON In millions Q2 2019 Q2 2018 Change Net Operating Revenue 6.7 6.8 (1%) Operating Costs and Expenses 4.7 4.7 (1%) Earnings from Operations 2.0 2.1 (1%) Net Earnings Attributable to Century Casinos, Inc. Shareholders 1.9 1.2 61% Adjusted EBITDA* 2.3 2.4 (2%) Adjusted EBITDA Margin* 35% 35% As of June 30, 2019, the facility had 799 slot machines, 35 table games and 30 video lottery terminals (“VLTs”). *Adjusted EBITDA and Adjusted EBITDA margin are non-GAAP financial measures. See Appendix A for the definition and reconciliation of Adjusted EBITDA and Adjusted EBITDA margin. 15
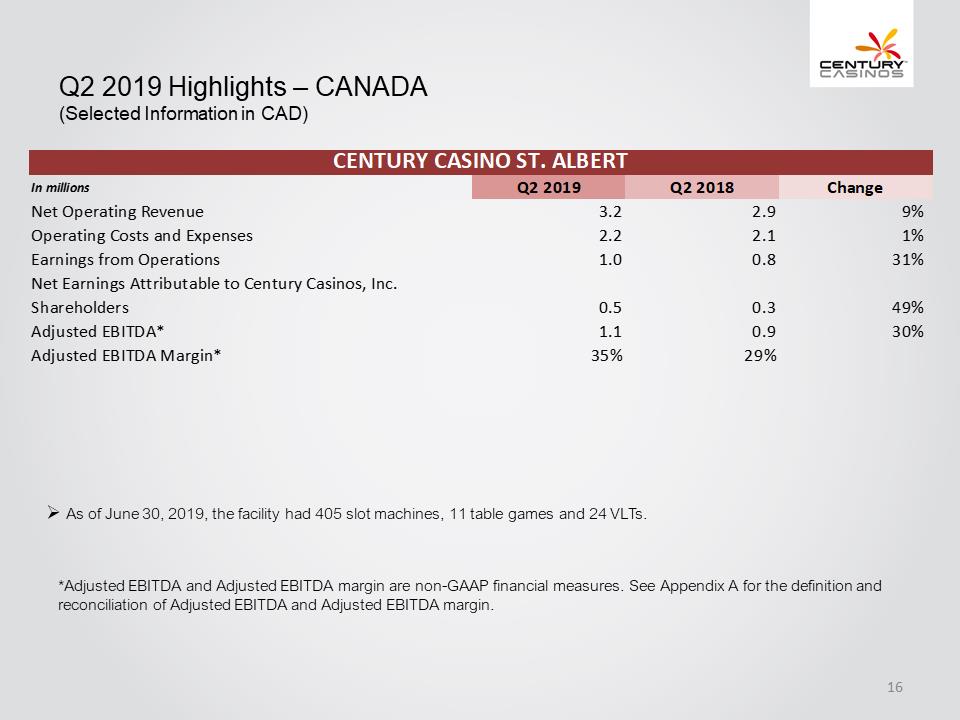
Q2 2019 Highlights –CANADA (Selected Information in CAD) CENTURY CASINO ST. ALBERT In millions Q2 2019 Q2 2018 Change Net Operating Revenue 3.2 2.9 9% Operating Costs and Expenses 2.2 2.1 1% Earnings from Operations 1.0 0.8 31% Net Earnings Attributable to Century Casinos, Inc. Shareholders 0.5 0.3 49% Adjusted EBITDA* 1.1 0.9 30% Adjusted EBITDA Margin* 35% 29% As of June 30, 2019, the facility had 405 slot machines, 11 table games and 24 VLTs. *Adjusted EBITDA and Adjusted EBITDA margin are non-GAAP financial measures. See Appendix A for the definition and reconciliation of Adjusted EBITDA and Adjusted EBITDA margin. 16
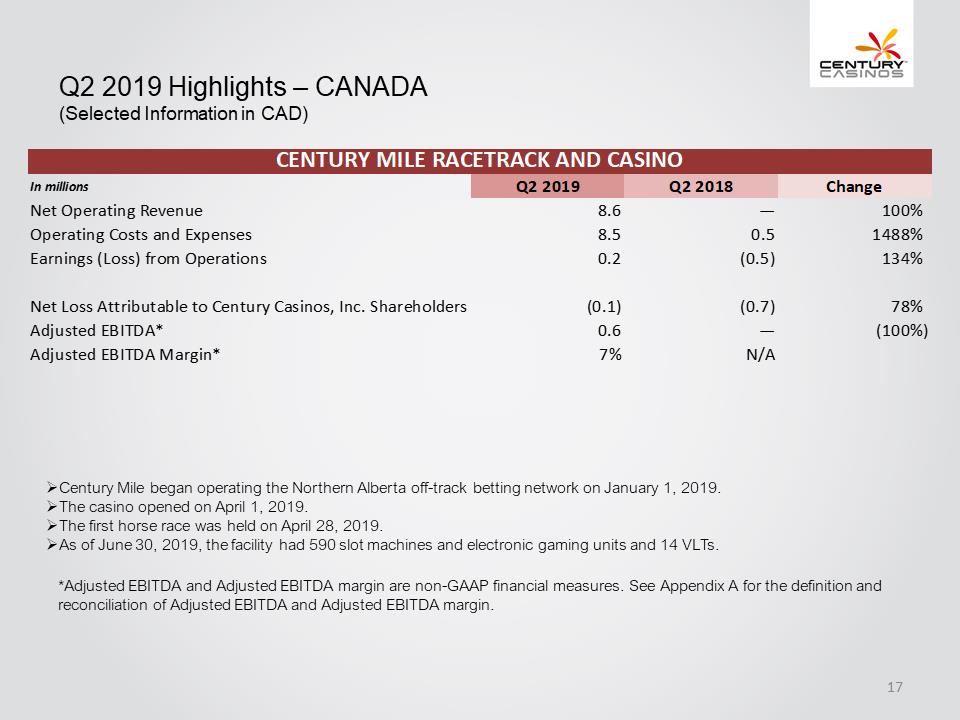
Q2 2019 Highlights –CANADA (Selected Information in CAD) CENTURY MILE RACETRACK AND CASINO In millions Q2 2019 Q2 2018 Change Net Operating Revenue 8.6 —100% Operating Costs and Expenses 8.5 0.5 1488% Earnings (Loss) from Operations 0.2 (0.5) 134% Net Loss Attributable to Century Casinos, Inc. Shareholders (0.1) (0.7) 78% Adjusted EBITDA* 0.6 — (100%) Adjusted EBITDA Margin*7% N/A Century Mile began operating the Northern Alberta off-track betting network on January 1, 2019.
The casino opened on April 1, 2019. The first horse race was held on April 28, 2019. As of June 30, 2019, the facility had 590 slot machines and electronic gaming units and 14 VLTs. *Adjusted EBITDA and Adjusted EBITDA margin are non-GAAP financial measures. See Appendix A for the definition and reconciliation of Adjusted EBITDA and Adjusted EBITDA margin. .17.
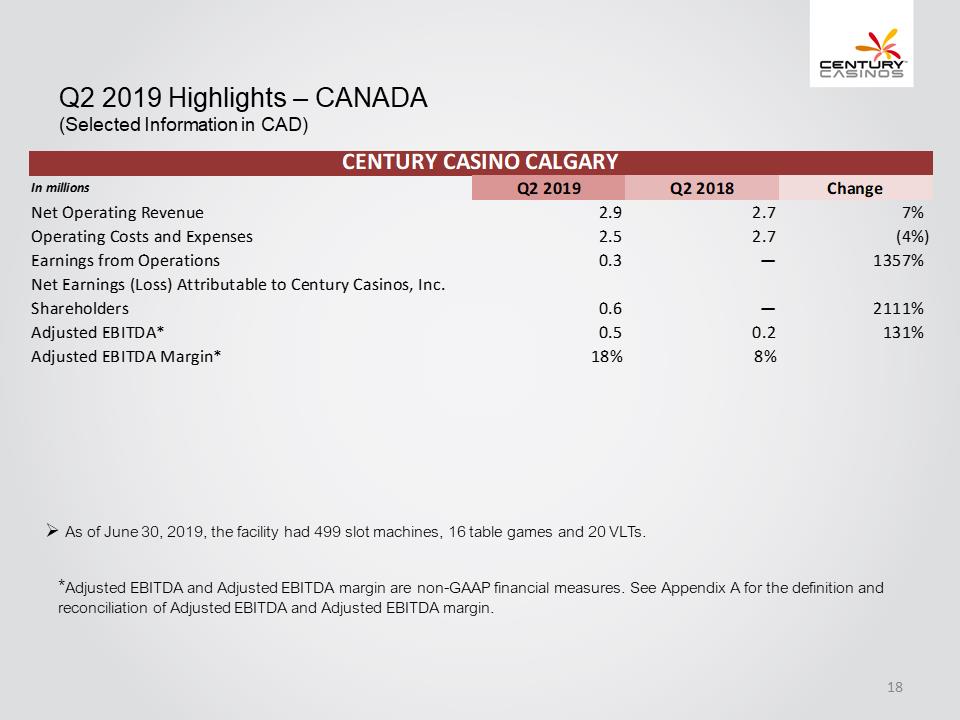
Q2 2019 Highlights –CANADA (Selected Information in CAD) CENTURY CASINO CALGARY In millions Q2 2019 Q2 2018 Change Net Operating Revenue 2.92.7 7% Operating Costs and Expenses 2.5 2.7 (4%) Earnings from Operations 0.3 — 1357% Net Earnings (Loss) Attributable to Century Casinos, Inc. Shareholders 0.6 — 2111% Adjusted EBITDA* 0.5 0.2 131% Adjusted EBITDA Margin* 18% 8% As of June 30, 2019, the facility had 499 slot machines, 16 table games and 20 VLTs *Adjusted EBITDA and Adjusted EBITDA margin are non-GAAP financial measures. See Appendix A for the definition and reconciliation of Adjusted EBITDA and Adjusted EBITDA margin. .18.
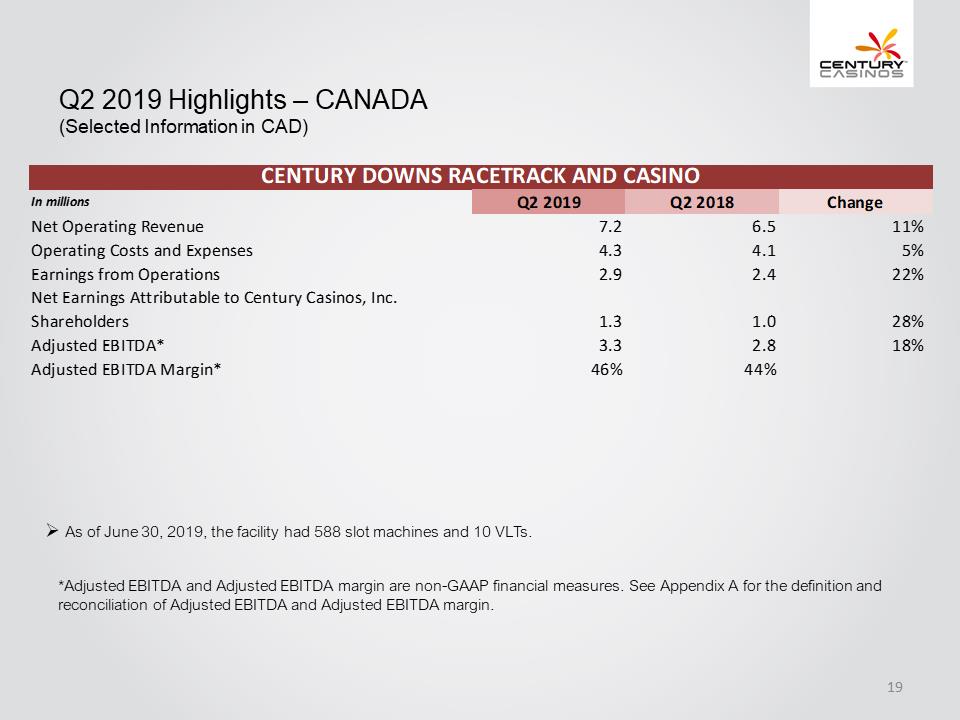
Q2 2019 Highlights –CANADA(Selected Information in CAD) CENTURY DOWNS RACETRACK AND CASINO In millions Q2 2019 Q2 2018 Change Net Operating Revenue 7.2 6.5 11% Operating Costs and Expenses 4.3 4.1 5% Earnings from Operations 2.9 2.4 22% Net Earnings Attributable to Century Casinos, Inc. Shareholders 1.3 1.0 28% Adjusted EBITDA* 3.3 2.8 18% Adjusted EBITDA Margin* 46% 44% As of June 30, 2019, the facility had 588 slot machines and 10 VLTs. *Adjusted EBITDA and Adjusted EBITDA margin are non-GAAP financial measures. See Appendix A for the definition and reconciliation of Adjusted EBITDA and Adjusted EBITDA margin. 19
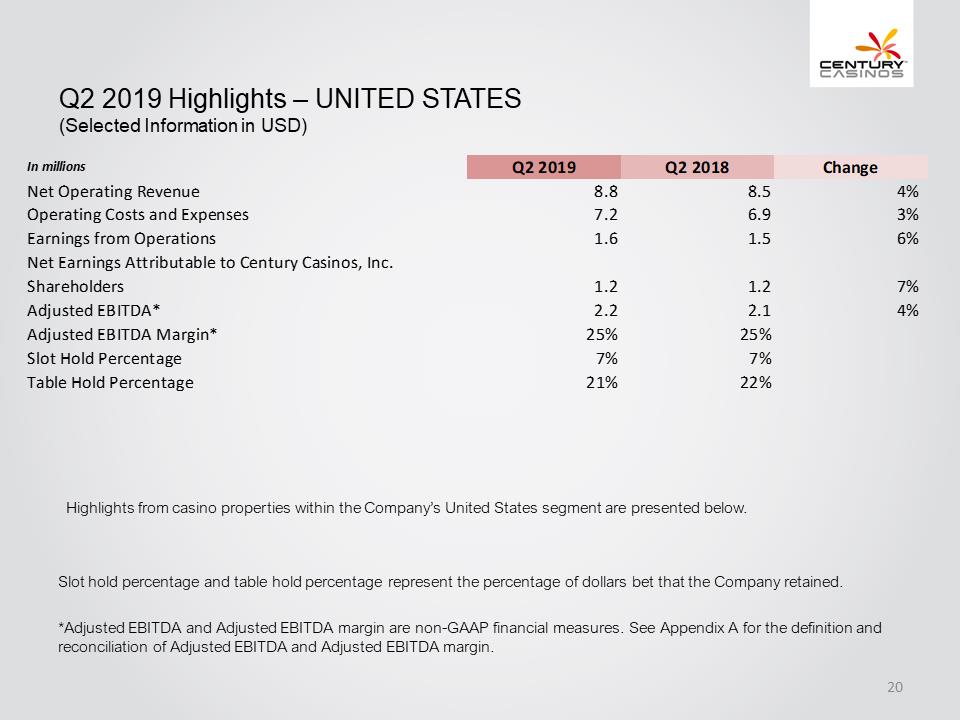
Q2 2019 Highlights –UNITED STATES (Selected Information in USD) In millions Q2 2019 Q2 2018 Change Net Operating Revenue 8.8 8.5 4% Operating Costs and Expenses 7.2 6.9 3% Earnings from Operations 1.6 1.5 6% Net Earnings Attributable to Century Casinos, Inc. Shareholders 1.2 1.2 7% Adjusted EBITDA* 2.2 2.1 4% Adjusted EBITDA Margin* 25% 25% Slot Hold Percentage 7% 7% Table Hold Percentage 21% 22% Highlights from casino properties within the Company’s United States segment are presented below. Slot hold percentage and table hold percentage represent the percentage of dollars bet that the Company retained. *Adjusted EBITDA and Adjusted EBITDA margin are non-GAAP financial measures. See Appendix A for the definition and reconciliation of Adjusted EBITDA and Adjusted EBITDA margin. 20
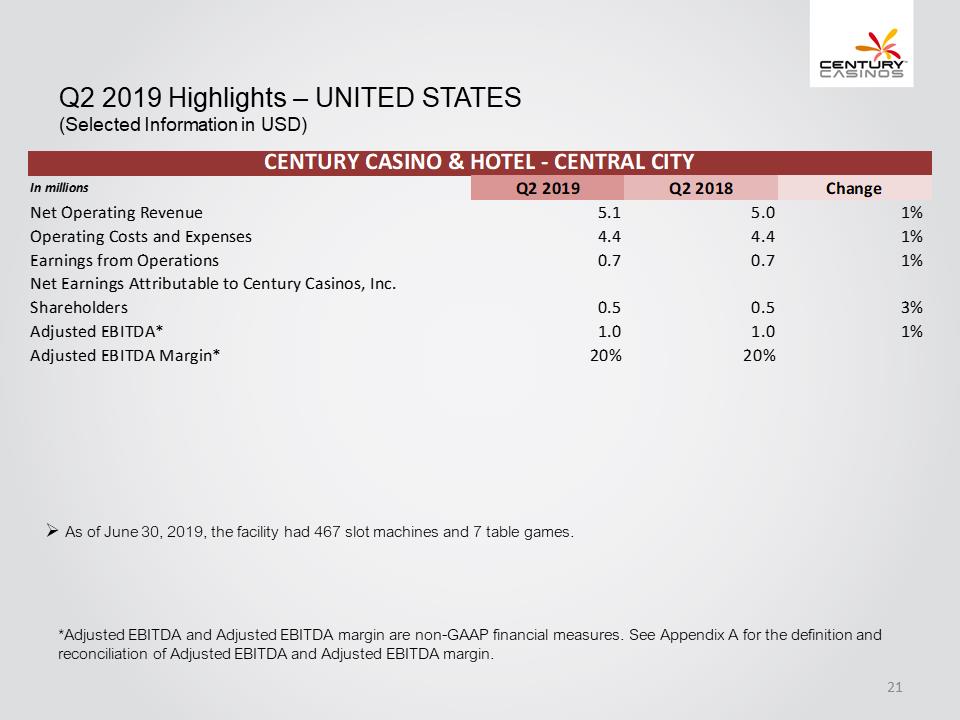
Q2 2019 Highlights –UNITED STATES (Selected Information in USD) CENTURY CASINO & HOTEL - CENTRAL CITY In millions Q2 2019 Q2 2018 Change Net Operating Revenue 5.1 5.0 1% Operating Costs and Expenses 4.4 4.4 1% Earnings from Operations 0.7 0.7 1% Net Earnings Attributable to Century Casinos, Inc. Shareholders 0.5 0.5 3% Adjusted EBITDA* 1.0 1.0 1% Adjusted EBITDA Margin* 20% 20% As of June 30, 2019, the facility had 467 slot machines and 7 table games. *Adjusted EBITDA and Adjusted EBITDA margin are non-GAAP financial measures. See Appendix A for the definition and reconciliation of Adjusted EBITDA and Adjusted EBITDA margin. 21

Q2 2019 Highlights –UNITED STATES (Selected Information in USD) CENTURY CASINO & HOTEL - CRIPPLE CREEK In millions Q2 2019 Q2 2018 Change Net Operating Revenue 3.8 3.4 9% Operating Costs and Expenses 2.8 2.6 9% Earnings from Operations 1.0 0.9 10% Net Earnings Attributable to Century Casinos, Inc. Shareholders 0.7 0.7 10% Adjusted EBITDA* 1.2 1.1 6% Adjusted EBITDA Margin* 31%32% As of June 30, 2019, the facility had 445 slot machines and 6 table games. *Adjusted EBITDA and Adjusted EBITDA margin are non-GAAP financial measures. See Appendix A for the definition and reconciliation of Adjusted EBITDA and Adjusted EBITDA margin. 22
*Adjusted EBITDA and Adjusted EBITDA margin are non-GAAP financial measures. See Appendix A for the definition and reconciliation of Adjusted EBITDA and Adjusted EBITDA margin. .AsofJune30,2019,thefacilityhad445slotmachinesand6tablegames.
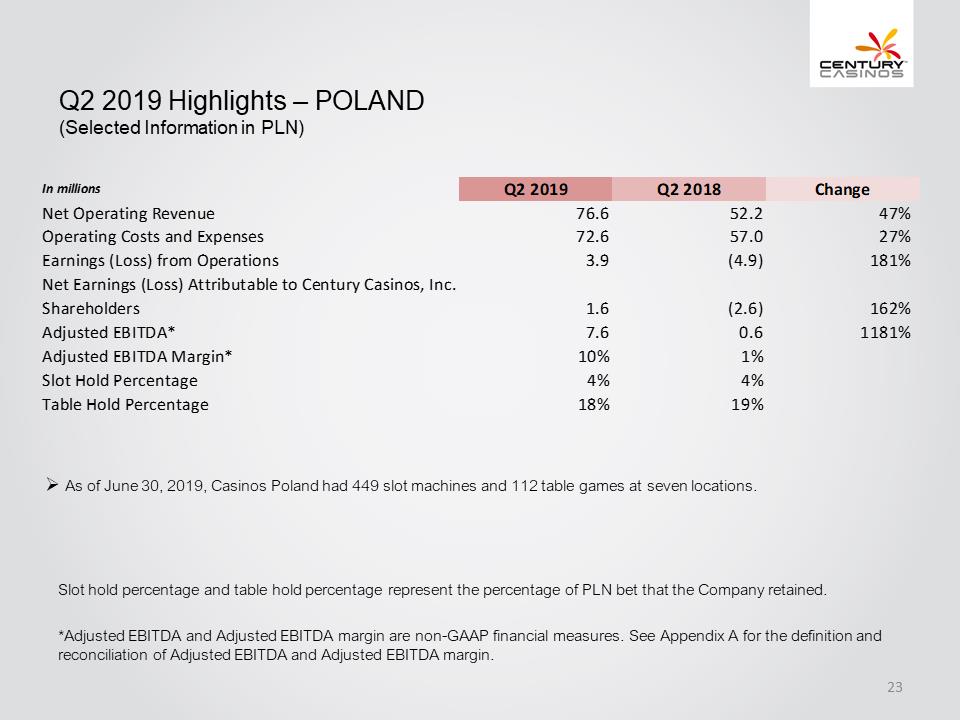
Q2 2019 Highlights –POLAND (Selected Information in PLN) . In millions Q2 2019Q2 2018 Change Net Operating Revenue 76.6 52.2 47% Operating Costs and Expenses 72.6 57.0 27% Earnings (Loss) from Operations 3.9 (4.9) 181% Net Earnings (Loss) Attributable to Century Casinos, Inc. Shareholders 1.6 (2.6) 162% Adjusted EBITDA* 7.6 0.6 1181% Adjusted EBITDA Margin* 10% 1% Slot Hold Percentage 4% 4% Table Hold Percentage 18% 19% As of June 30, 2019, Casinos Poland had 449 slot machines and 112 table games at seven locations. Slot hold percentage and table hold percentage represent the percentage of PLN bet that the Company retained. *Adjusted EBITDA and Adjusted EBITDA margin are non-GAAP financial measures. See Appendix A for the definition and reconciliation of Adjusted EBITDA and Adjusted EBITDA margin. 23
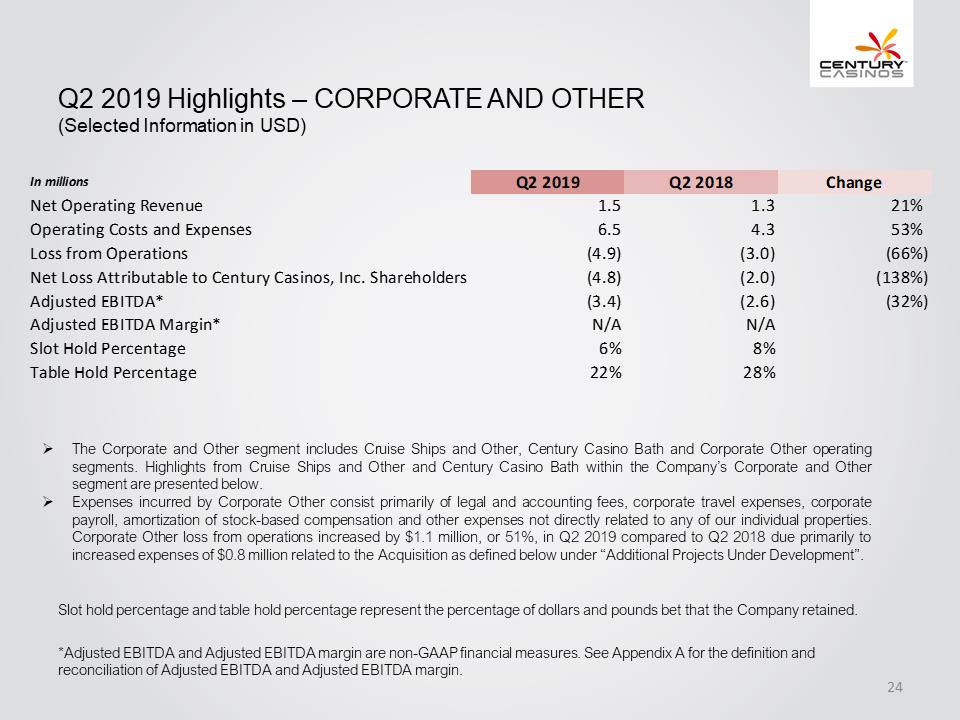
Q2 2019 Highlights –CORPORATE AND OTHER (Selected Information in USD) In millions Q2 2019Q2 2018 Change Net Operating Revenue 1.5 1.3 21% Operating Costs and Expenses 6.5 4.3 53% Loss from Operations (4.9) (3.0) (66%) Net Loss Attributable to Century Casinos, Inc. Shareholders (4.8) (2.0) (138%) Adjusted EBITDA* (3.4) (2.6) (32%) Adjusted EBITDA Margin* N/A N/A Slot Hold Percentage 6% 8% Table Hold Percentage 22% 28% The Corporate and Other segment includes Cruise Ships and Other, Century Casino Bath and Corporate Other operating segments. Highlights from Cruise Ships and Other and Century Casino Bath within the Company’s Corporate and Other segment are presented below. Expenses incurred by Corporate Other consist primarily of legal and accounting fees, corporate travel expenses, corporate payroll, amortization of stock-based compensation and other expenses not directly related to any of our individual properties. Corporate Other loss from operations increased by $1.1 million, or 51%, in Q2 2019 compared to Q2 2018 due primarily to increased expenses of $0.8 million related to the Acquisition as defined below under “Additional Projects Under Development”. Slot hold percentage and table hold percentage represent the percentage of dollars and pounds bet that the Company retained. *Adjusted EBITDA and Adjusted EBITDA margin are non-GAAP financial measures. See Appendix A for the definition and reconciliation of Adjusted EBITDA and Adjusted EBITDA margin. 24

Q2 2019 Highlights –CORPORATE AND OTHER (Selected Information in USD) CRUISE SHIPS AND OTHER In millions Q2 2019 Q2 2018 Change Net Operating Revenue 0.50.7 (27%) Operating Costs and Expenses 1.70.7 137% (Loss) Earnings from Operations (1.1) — (2349%) Net (Loss) Earnings Attributable to Century Casinos, Inc. Shareholders (1.1) — (2353%) Adjusted EBITDA* (0.8) 0.1 (762%) Adjusted EBITDA Margin* -141% 16% *Adjusted EBITDA and Adjusted EBITDA margin are non-GAAP financial measures. See Appendix A for the definition and reconciliation of Adjusted EBITDA and Adjusted EBITDA margin. 25
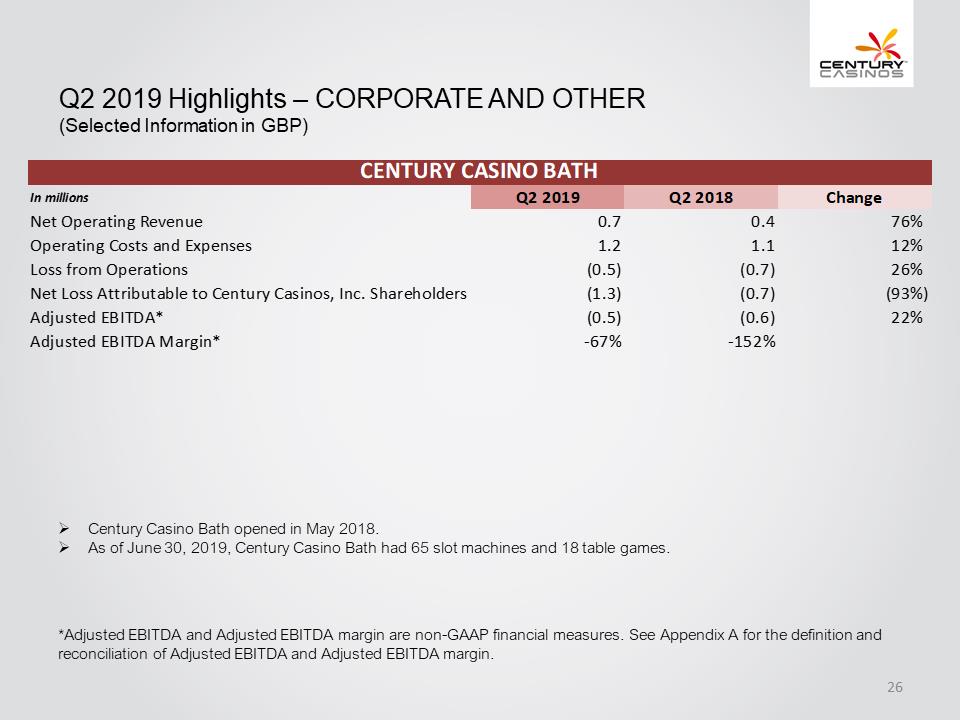
Q2 2019 Highlights –CORPORATE AND OTHER(Selected Information in GBP) CENTURY CASINO BATH In millions Q2 2019 Q2 2018 Change Net Operating Revenue 0.7 0.4 76% Operating Costs and Expenses 1.2 1.1 12% Loss from Operations (0.5) (0.7) 26% Net Loss Attributable to Century Casinos, Inc. Shareholders (1.3) (0.7) (93%) Adjusted EBITDA* (0.5) (0.6) 22% Adjusted EBITDA Margin* -67% -152% *Adjusted EBITDA and Adjusted EBITDA margin are non-GAAP financial measures. See Appendix A for the definition and reconciliation of Adjusted EBITDA and Adjusted EBITDA margin. 26
Q2 2019 Highlights –ADDITIONAL PROJECTS UNDER DEVELOPMENT United States On June 17, 2019, the Company entered into a definitive agreement to acquire the operations of Cape Girardeau, Caruthersville and Mountaineer from Eldorado Resorts, Inc. for approximately $107.0 million (the “Acquisition”), which it expects to finance through a new credit facility that also will replace its existing credit facility. Simultaneous with the closing of the transaction, VICI Properties Inc. (“VICI”) will acquire the real estate assets of the three properties for approximately $278.0 million and the Company will enter into a triple net lease agreement with VICI for the three casino properties. The lease will have an initial annual rent of approximately $25.0 million and an initial term of 15 years, with four five-year renewal options. The transaction, which is expected to close in early 2020, is subject to approvals of the Missouri Gaming Commission and the West Virginia Lottery as well as other customary closing conditions. Bermuda In August 2017, the Company announced that, together with Hamilton Properties Limited, it had submitted a casino license application to the Bermudan government for a casino at the Hamilton Princess Hotel & Beach Club in Hamilton, Bermuda. The Company’s subsidiary, CRM, entered into a long-term management agreement with Hamilton Properties Limited pursuant to which the Company will assist with the license application and manage the operations of the casino for which it will receive a management fee, should the license be awarded. In September 2017, the Bermuda Casino Gaming Commission granted a provisional casino gaming license, which is subject to certain conditions and approvals including the adoption of certain rules and regulations by the Bermudan government. 27
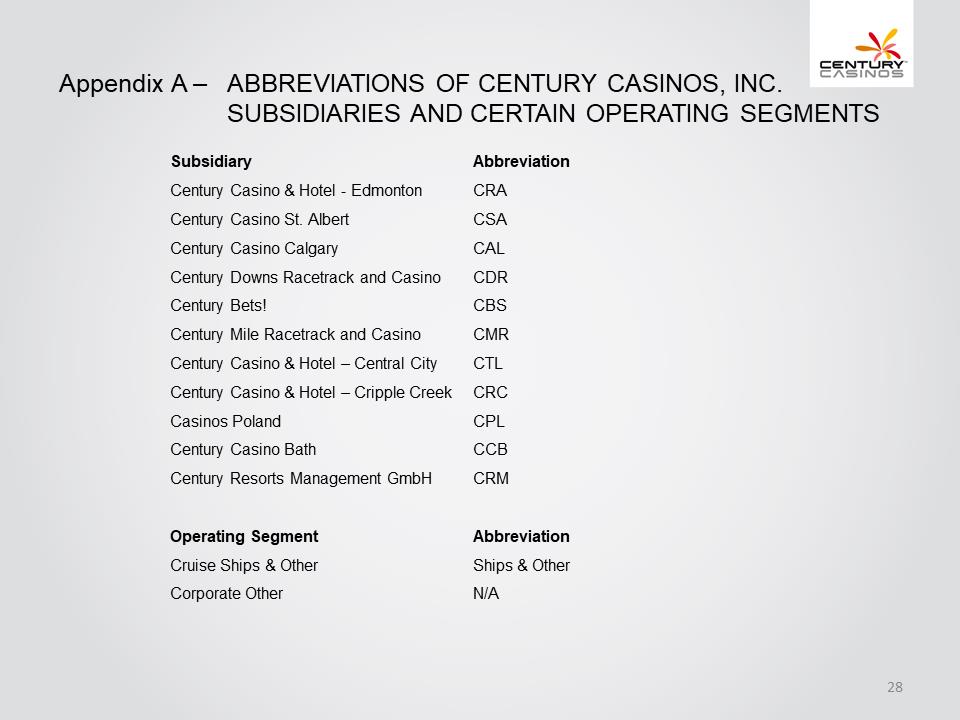
Appendix A –ABBREVIATIONS OF CENTURY CASINOS, INC. SUBSIDIARIES AND CERTAIN OPERATING SEGMENTS Subsidiary Abbreviation Century Casino & Hotel -Edmonton CRA Century Casino St.Albert CSA Century Casino Calgary CAL Century Downs Racetrack and Casino CDR Century Bets! CBS Century Mile Racetrack and Casino CMR Century Casino & Hotel –Central City CTL Century Casino &Hotel –Cripple Creek CRC Casinos Poland CPL Century Casino Bath CCB Century Resorts Management GmbH CRM Operating Segment Abbreviation Cruise Ships& Other Ships & Other Corporate Other N/A 28
Appendix A –NON-GAAP FINANCIAL MEASURES The Company supplements its consolidated financial statements prepared in accordance with U.S. generally accepted accounting principles (“GAAP”) by using the following non-GAAP financial measures, which management believes are useful in properly understanding the Company’s short-term and long-term financial trends. Management uses these non-GAAP financial measures to forecast and evaluate the operational performance of the Company as well as to compare results of current periods to prior periods on a consolidated basis. Adjusted EBITDA Adjusted EBITDA margin Constant currency results Net Debt Management believes presenting the non-GAAP financial measures used in this presentation provides investors greater transparency to the information used by management for financial and operational decision-making and allows investors to see the Company’s results “through the eyes” of management. Management also believes providing this information better enables our investors to understand the Company’s operating performance and evaluate the methodology used by management to evaluate and measure such performance. The adjustments made to GAAP financial measures result from facts and circumstances that vary in frequency and impact on the Company’s results of operations. The following is an explanation of each of the adjustments that management excludes in calculating its non-GAAP financial measures. 29
Appendix A –NON-GAAP FINANCIAL MEASURES The Company defines Adjusted EBITDA as net earnings (loss) attributable to Century Casinos, Inc. shareholders before interest expense (income), net, income taxes (benefit), depreciation and amortization, non-controlling interests net earnings (loss) and transactions, pre-opening expenses, acquisition costs, non-cash stock-based compensation charges, asset impairment costs, (gain) loss on disposition of fixed assets, discontinued operations, (gain) loss on foreign currency transactions, cost recovery income and other, gain on business combination and certain other one-time items, such as acquisition and disposition costs and gain or loss. Intercompany transactions consisting primarily of management and royalty fees and interest, along with their related tax effects, are excluded from the presentation of net earnings (loss) attributable to Century Casinos, Inc. shareholders and Adjusted EBITDA reported for each segment. Not all of the aforementioned items occur in each reporting period, but have been included in the definition based on historical activity. These adjustments have no effect on the consolidated results as reported under GAAP. Adjusted EBITDA is not considered a measure of performance recognized under GAAP. Management believes that Adjusted EBITDA is a valuable measure of the relative performance of the Company and its properties. The gaming industry commonly uses Adjusted EBITDA as a method of arriving at the economic value of a casino operation. Management uses Adjusted EBITDA to compare the relative operating performance of separate operating units by eliminating the above mentioned items associated with the varying levels of capital expenditures for infrastructure required to generate revenue and the often high cost of acquiring existing operations. Adjusted EBITDA is used by the Company’s lending institution to gauge operating performance. The Company’s computation of Adjusted EBITDA may be different from, and therefore may not be comparable to, similar measures used by other companies within the gaming industry. Please see the reconciliation of Adjusted EBITDA to net earnings (loss) attributable to Century Casinos, Inc. shareholders below. The Company defines Adjusted EBITDA margin as Adjusted EBITDA divided by net operating revenue. Management uses this margin as one of several measures to evaluate the efficiency of the Company’s casino operations. 30
Appendix A –NON-GAAP FINANCIAL MEASURES The impact of foreign exchange rates is highly variable and difficult to predict. The Company uses a Constant Currency basis to show the impact from foreign exchange rates on current period financial information compared to prior period financial information using the prior period’s foreign exchange rates. In order to properly understand the underlying business trends and performance of the Company’s ongoing operations, management believes that investors may find it useful to consider the impact of excluding changes in foreign exchange rates from the Company’s net operating revenue, earnings from operations and net earnings (loss) attributable to Century Casinos, Inc. shareholders. Constant currency results are calculated by dividing the current year to date local currency segment results excluding the local currency impact of foreign currency gains and losses, by the prior year’s average exchange rate for the year to date and comparing them to actual U.S. dollar results for the prior year to date. The average exchange rates for the current quarter and prior year second quarter are reported in Item 1 of the Company’s Quarterly Report on Form 10-Q for the quarter ended June 30, 2019. Constant currency information is not a measure of financial performance under GAAP and should not be considered a substitute for net operating revenue, earnings from operations or net earnings (loss) attributable to Century Casinos, Inc. shareholders as determined in accordance with GAAP. The Company defines Net Debt as total long-term debt (including current portion) plus deferred financing costs minus cash and cash equivalents. Net Debt is not considered a liquidity measure recognized under GAAP. Management believes that Net Debt is a valuable measure of our overall financial situation. Net Debt provides investors with an indication of our ability to pay off all of our long-term debt if it became due simultaneously. 31
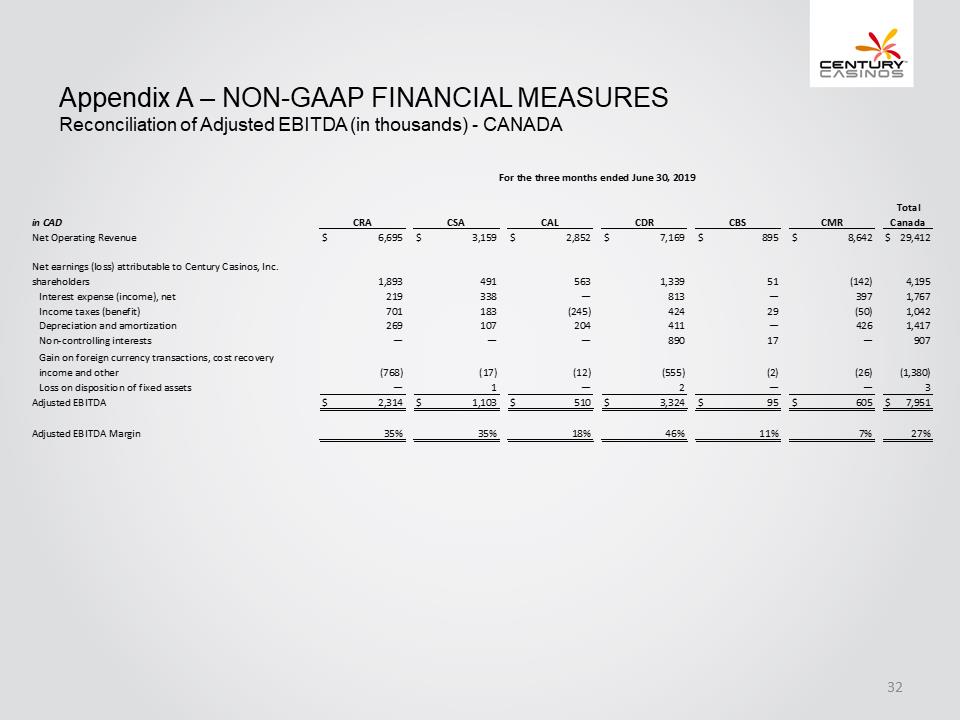
Appendix A –NON-GAAP FINANCIAL MEASURES Reconciliation of Adjusted EBITDA (in thousands) -CANADA For the three months ended June 30, 2019 in CAD CRA CSA CAL CDR CBS CMR Total Canada Net Operating Revenue 6,695$ 3,159$ 2,852$ 7,169$ 895$ 8,642$ 29,412$ Net earnings (loss) attributable to Century Casinos, Inc. shareholders 1,893 491 563 1,339 51 (142) 4,195 Interest expense (income), net 219 338 — 813 — 397 1,767 Income taxes (benefit) 701 183 (245) 424 29 (50) 1,042 Depreciation and amortization 269 107 204 411 — 426 1,417 Non-controlling interests — — — 890 17 — 907 Gain on foreign currency transactions, cost recovery income and other (768) (17) (12) (555) (2) (26) (1,380) Loss on disposition of fixed assets — 1 — 2 — — 3 Adjusted EBITDA 2,314$ 1,103$ 510$ 3,324$ 95$ 605$ 7,951$ Adjusted EBITDA Margin 35% 35% 18% 46% 11% 7% 27% 32
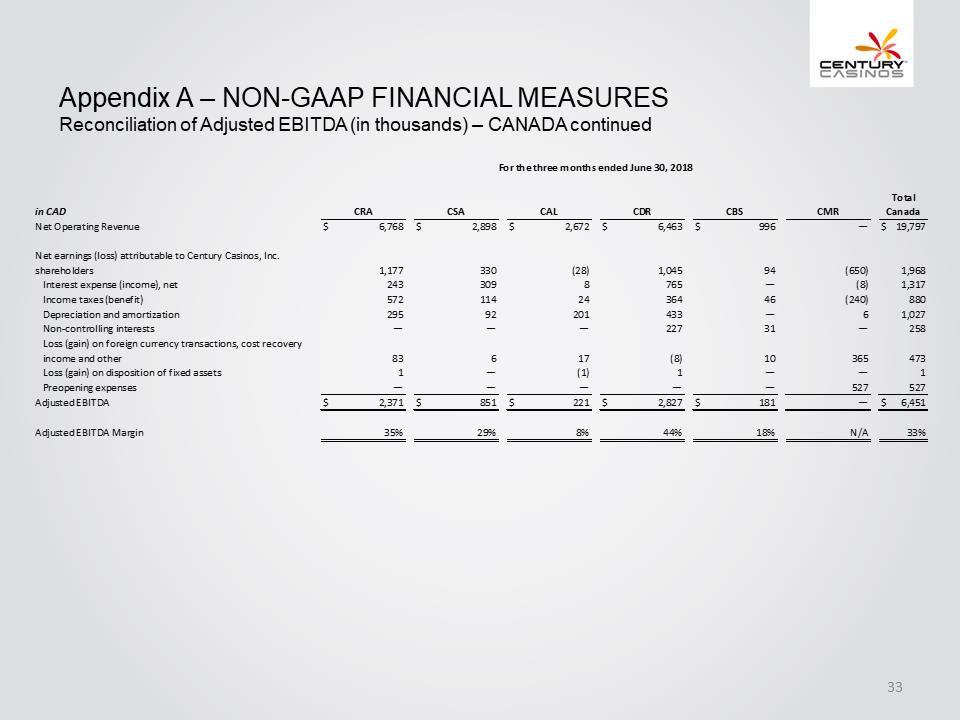
Appendix A –NON-GAAP FINANCIAL MEASURES Reconciliation of Adjusted EBITDA (in thousands) –CANADA continued For the three months ended June 30, 2018 in CAD CRA CSA CAL CDR CBS CMR Total Canada Net Operating Revenue 6,768$ 2,898$ 2,672$ 6,463$ 996$ — 19,797$ Net earnings (loss) attributable to Century Casinos, Inc. shareholders 1,177 330 (28) 1,045 94 (650) 1,968 Interest expense (income), net 243 309 8 765 — (8) 1,317 Income taxes (benefit) 572 114 24 364 46 (240) 880 Depreciation and amortization 295 92 201 433 — 6 1,027 Non-controlling interests — — — 227 31 — 258 Loss (gain) on foreign currency transactions, cost recovery income and other 83 6 17 (8) 10 365 473 Loss (gain) on disposition of fixed assets 1 — (1) 1 — — 1 Preopening expenses — — — — — 527 527 Adjusted EBITDA 2,371$ 851$ 221$ 2,827$ 181$ —6,451$ Adjusted EBITDA Margin 35% 29% 8% 44% 18% N/A 33% 33
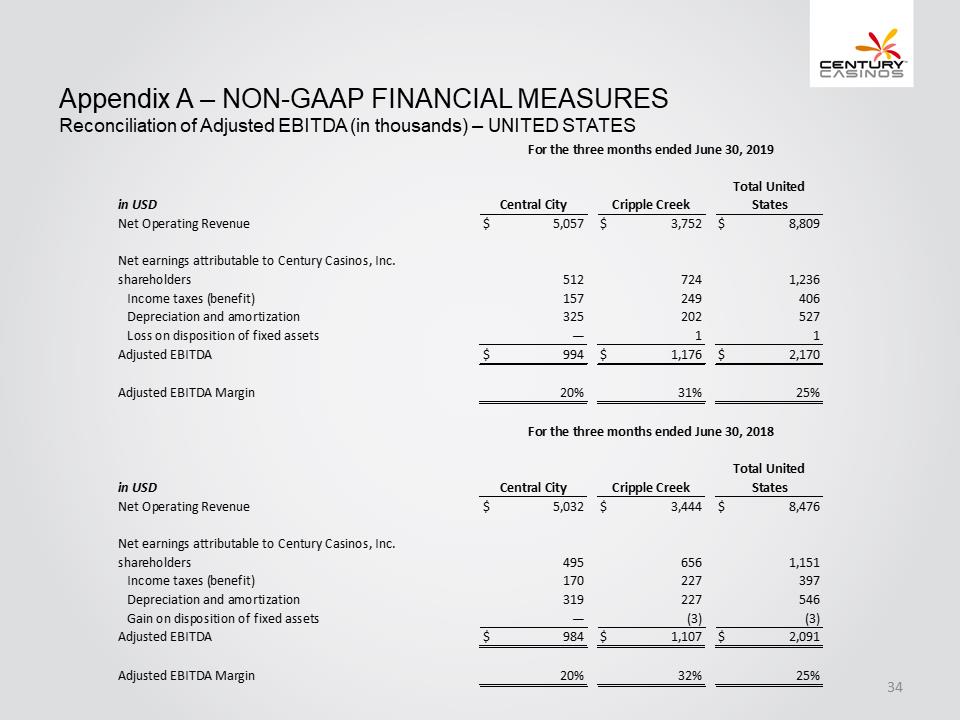
Appendix A –NON-GAAP FINANCIAL MEASURES Reconciliation of Adjusted EBITDA (in thousands) –UNITED STATES For the three months ended June 30, 2019 in USD Central City Cripple CreekTotal United States Net Operating Revenue 5,057$ 3,752$ 8,809$ Net earnings attributable to Century Casinos, Inc. shareholders 512 724 1,236 Income taxes (benefit) 157 249 406 Depreciation and amortization 325 202 527 Loss on disposition of fixed assets — 1 1 Adjusted EBITDA 994$ 1,176$ 2,170$ Adjusted EBITDA Margin 20% 31% 25% For the three months ended June 30, 2018 in USD Central City Cripple Creek Total United States Net Operating Revenue5,032$ 3,444$ 8,476$ Net earnings attributable to Century Casinos, Inc. shareholders 495 656 1,151 Income taxes (benefit) 170 227 397 Depreciation and amortization 319 227 546 Gain on disposition of fixed assets — (3) (3) Adjusted EBITDA 984$ 1,107$ 2,091$ Adjusted EBITDA Margin 20% 32% 25% 34
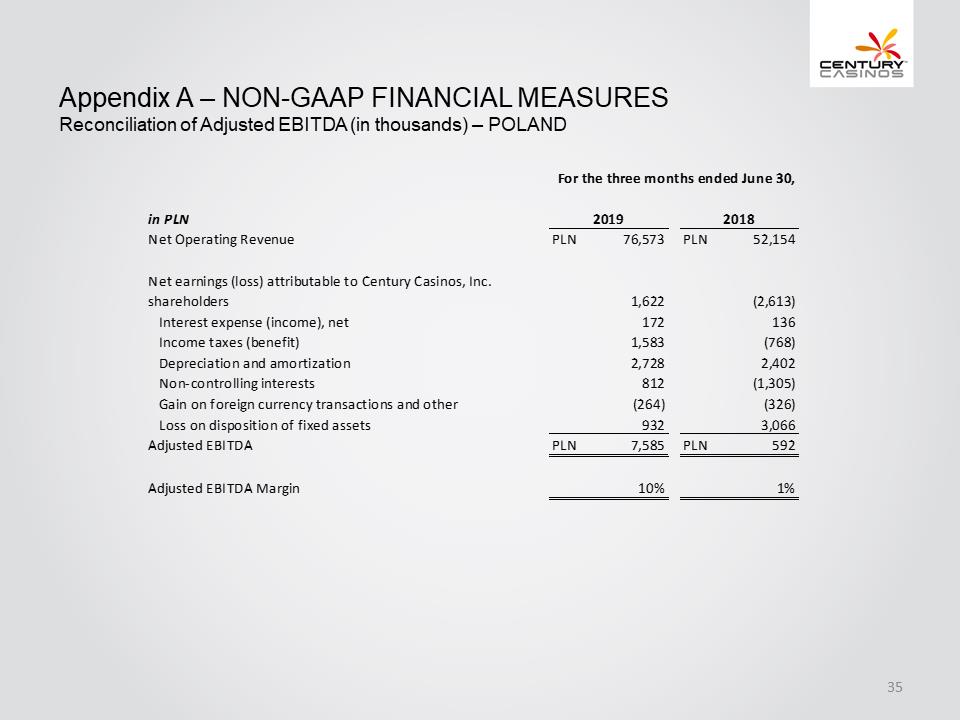
Appendix A –NON-GAAP FINANCIAL MEASURES Reconciliation of Adjusted EBITDA (in thousands) –POLAND For the three months ended June 30, 2019 2018
in PLN Net Operating Revenue 76,573PLN 52,154PLN Net earnings (loss) attributable to Century Casinos, Inc. shareholders 1,622 (2,613) Interest expense (income), net 172 136 Income taxes (benefit) 1,583 (768) Depreciation and amortization 2,728 2,402 Non-controlling interests 812 (1,305) Gain on foreign currency transactions and other (264) (326) Loss on disposition of fixed assets 932 3,066 Adjusted EBITDA 7,585 PLN 592PLN Adjusted EBITDA Margin 10% 1% 35
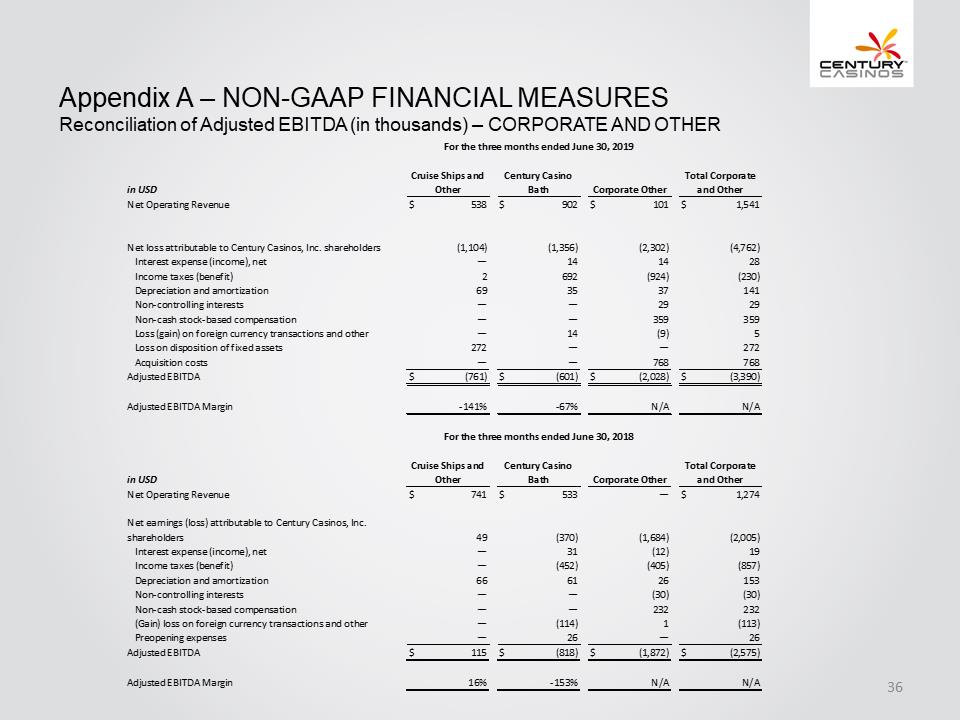
Appendix A –NON-GAAP FINANCIAL MEASURES Reconciliation of Adjusted EBITDA (in thousands) –CORPORATE AND OTHER in USD For the three months ended June 30, 2019 Cruise Ships and Other Century Casino Bath Corporate Other Total Corporate and Other Net Operating Revenue 538$ 902$ 101$ 1,541$ Net loss attributable to Century Casinos, Inc. shareholders (1,104) (1,356) (2,302) (4,762) Interest expense (income), net —14 14 28 Income taxes (benefit) 2 692 (924) (230) Depreciation and amortization 69 35 37 141 Non-controlling interests — — 29 29 Non-cash stock-based compensation — — 359 359 Loss (gain) on foreign currency transactions and other — 14 (9) 5 Loss on disposition of fixed assets 272 — — 272 Acquisition costs — — 768 768 Adjusted EBITDA (761)$ (601)$ (2,028)$ (3,390)$ Adjusted EBITDA Margin- 141% -67% N/A N/A For the three months ended June 30, 2018 in USD Cruise Ships and Other Century Casino Bath Corporate Other Total Corporate and Other Net Operating Revenue 741$ 533$ — 1,274$ Net earnings (loss) attributable to Century Casinos, Inc. shareholders 49 (370) (1,684) (2,005) Interest expense (income), net — 31 (12) 19 Income taxes (benefit) — (452) (405) (857) Depreciation and amortization 66 61 26 153 Non-controlling interests — — (30) (30) Non-cash stock-based compensation — — 232 232 (Gain) loss on foreign currency transactions and other — (114) 1 (113) Preopening expenses — 26 — 26 Adjusted EBITDA 115$ (818)$ (1,872)$ (2,575)$ Adjusted EBITDA Margin 16% -153% N/A N/A 36
9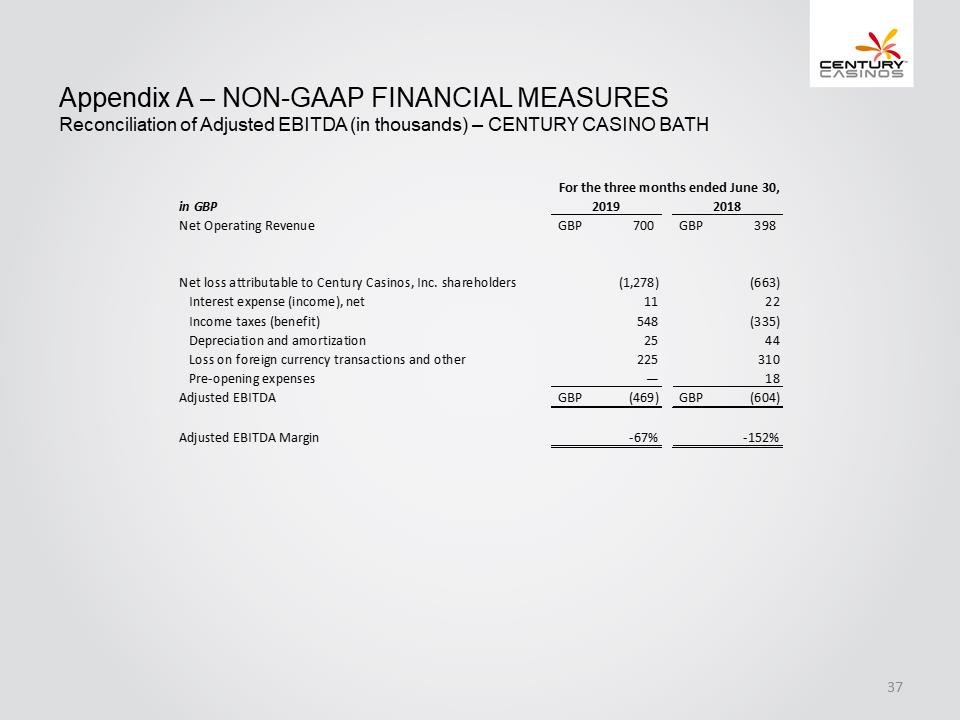
Appendix A –NON-GAAP FINANCIAL MEASURES Reconciliation of Adjusted EBITDA (in thousands) –CENTURY CASINO BATH in GBP For the three months ended June 30, 2019 2018 Net Operating Revenue 700GBP 398GBP Net loss attributable to Century Casinos, Inc. shareholders (1,278) (663) Interest expense (income), net 11 22 Income taxes (benefit) 548 (335) Depreciation and amortization 25 44 Loss on foreign currency transactions and other 225 310 Pre-opening expenses — 18 Adjusted EBITDA (469)GBP (604)GBP Adjusted EBITDA Margin -67% -152% 37
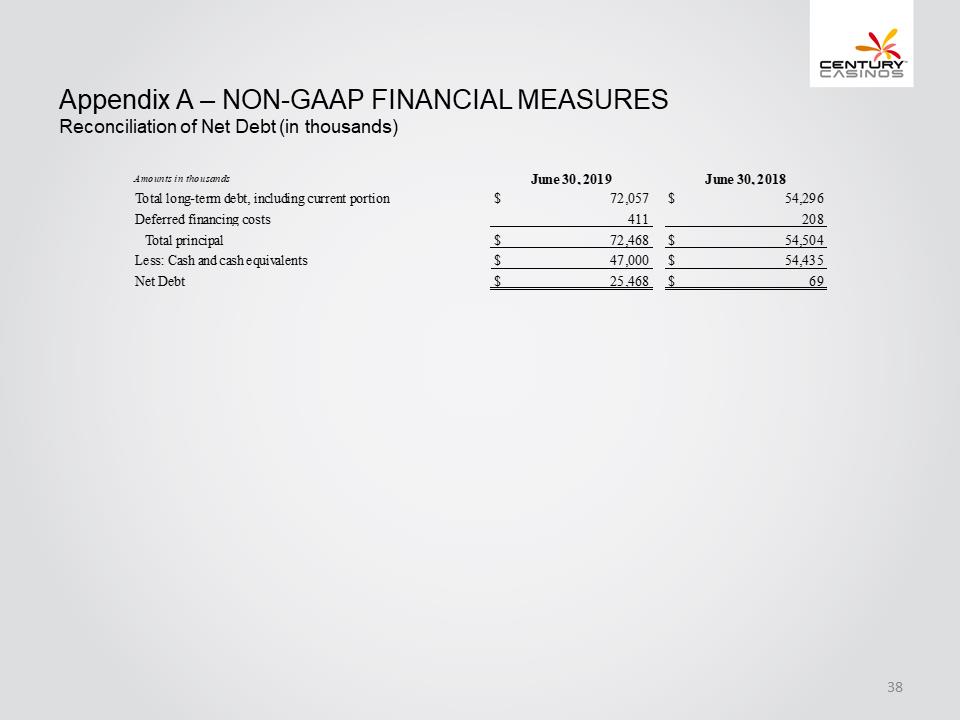
Appendix A –NON-GAAP FINANCIAL MEASURES Reconciliation of Net Debt (in thousands) Amounts in thousands June 30, 2019 June 30, 2018 Total long-term debt, including current portion$ 72,057 $ 54,296 Deferred financing costs 411 208 Total principal$ 72,468 $ 54,504 Less: Cash and cash equivalents$ 47,000 $ 54,435 Net Debt$ 25,468 $ 69 38
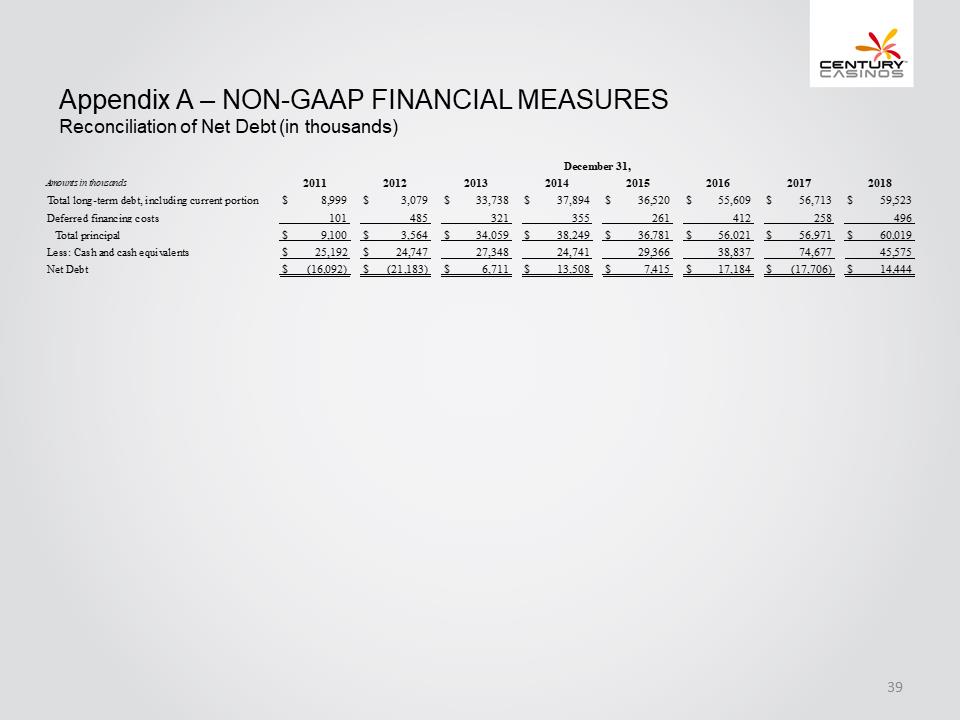
Appendix A –NON-GAAP FINANCIAL MEASURES Reconciliation of Net Debt (in thousands) Amounts in thousands December 31, 2011 2012 2013 2014 2015 2016 2017 2018 Total long-term debt, including current portion$ 8,999 $ 3,079 $ 33,738 $ 37,894 $ 36,520 $ 55,609 $ 56,713 $ 59,523 Deferred financing costs 101 485 321 355 261 412 258 496 Total principal$ 9,100 $ 3,564 $ 34,059 $ 38,249 $ 36,781 $ 56,021 $ 56,971 $ 60,019 Less: Cash and cash equivalents$ 25,192 $ 24,747 27,348 24,741 29,366 38,837 74,677 45,575 Net Debt$ (16,092)$ (21,183)$ 6,711 $ 13,508 $ 7,415 $ 17,184 $ (17,706)$ 14,444 39