Exhibit 99.2
CENTURY CASINOS, INC. Financial Results 2021 1
CENTURY CASINOS FORWARD-LOOKING STATEMENTS, BUSINESS ENVIRONMENT AND RISK FACTORS This presentation may contain “forward-looking statements” within the meaning of Section 27A of the Securities Act of 1933, as amended, Section 21E of the Securities Exchange Act of 1934, as amended (the “Exchange Act”), and the Private Securities Litigation Reform Act of 1995. In addition, Century Casinos, Inc. (together with its subsidiaries, the “Company”, “we”, “us”, “our”) may make other written and oral communications from time to time that contain such statements. Forward-looking statements include statements as to industry trends and future expectations of the Company and other matters that do not relate strictly to historical facts and are based on certain assumptions by management at the time such statements are made. Forward-looking statements in this presentation include statements regarding the hotel and casino projects in Missouri, our plans to acquire Nugget Casino Resort, future results of operations, including statements about operating margins, the impact of the current coronavirus (COVID-19) pandemic, estimates of the financial impact of COVID-19, the adequacy of cash flows from operations and available cash to meet our future liquidity needs, particularly if we cannot operate our casinos due to COVID-19 or their operations are restricted, operating efficiencies, synergies and operational performance, the prospects for and timing and costs of new projects, projects in development and other opportunities, the credit agreement with Macquarie (as defined herein) and obligations under our Master Lease (as defined herein) and the ability to repay debt and other obligations, our entry into a new credit facility, investments in joint ventures, outcomes of legal proceedings, changes in our tax provisions or exposure to additional income tax liabilities, and plans for our casinos and our Company. These statements are often identified by the use of words such as “may,” “will,” “expect,” “believe,” “anticipate,” “intend,” “could,” “estimate,” or “continue,” and similar expressions or variations. These statements are based on the beliefs and assumptions of the management of the Company based on information currently available to management. Such forward-looking statements are subject to risks, uncertainties and other factors that could cause actual results to differ materially from future results expressed or implied by such forward-looking statements. Important factors that could cause actual results to differ materially from the forward-looking statements include, among others, the risks described in the section entitled “Risk Factors” under Item 1A in our Annual Report on Form 10-K for the year ended December 31, 2021 (the “2021 Annual Report”) and our subsequent periodic and current reports filed with the SEC. We caution the reader to carefully consider such factors. Furthermore, such forward-looking statements speak only as of the date on which such statements are made. We undertake no obligation to update any forward-looking statements to reflect events or circumstances after the date of such statements. 2
CENTURY CASINOS NOTES ON PRESENTATION In this presentation the term “USD” refers to US dollars, the term “CAD” refers to Canadian dollars and the term “PLN” refers to Polish zloty. Adjusted EBITDA and Adjusted EBITDA margin are non-GAAP financial measures. See Appendix A for the definition and reconciliation of Adjusted EBITDA and Adjusted EBITDA margin. Amounts presented are rounded. As such, rounding differences could occur in period-over-period changes and percentages reported throughout this presentation. The names of the Company’s subsidiaries and certain operating segments are abbreviated on certain of the following slides. See Appendix A for a list of the subsidiaries and their abbreviations. 3
CENTURY CASINOS COVID-19 UPDATE The COVID-19 pandemic had an adverse effect on the Company’s 2020 results of operations and financial condition, and negatively impacted the Company’s results of operations to a lesser extent in 2021 because the Company’s United States properties were open and operating during this period. The Company’s Canada properties reopened on June 10, 2021, and its Poland casinos reopened on May 28, 2021. The Company’s casinos in the United States have been open since June 2020. Each of the Company’s properties has been required to vary its operations based on the governmental health and safety requirements in the jurisdiction in which it is located. The Company’s operations currently have limited health and safety requirements for entry related to COVID-19. 4
CENTURY CASINOS OTHER PROJECTS AND DEVELOPMENTS The Company plans to relocate its Century Casino Caruthersville casino, currently the last remaining casino riverboat on open water in Missouri, to a land-based casino with an attached hotel, estimated to open in 2024, and to build a hotel that will attach onto Century Casino Cape Girardeau, estimated to open in late 2023. The Company estimates project costs of $73.0 million. The Company plans to finance the cost of these projects with cash on hand, financing, or with a combination of the two. On February 22, 2022, the “Company entered into a definitive agreement with Marnell Gaming, LLC (the “Seller”), pursuant to which a newly-formed wholly-owned subsidiary of the Company will purchase from the Seller (i) 50% of the membership interests in Smooth Bourbon, LLC (“PropCo”), and (ii) 100% of the membership interests of Nugget Sparks, LLC (“OpCo”). OpCo owns and operates the Nugget Casino Resort in Sparks, Nevada, and PropCo owns the real property on which the casino is located. At the First Closing (as defined below), PropCo will enter into a lease with OpCo for an annual rent of $15.0 million. The Company will purchase 50% of the membership interests in PropCo for approximately $95.0 million (subject to certain adjustments) at the first closing, which is expected to occur early in the second quarter of 2022 (the “First Closing”). Subject to approval from the Nevada Gaming Commission, the Company's purchase of 100% of the membership interests in OpCo for approximately $100.0 million (subject to certain adjustments) is expected to close within one year after the First Closing (the “Second Closing”). Following the Second Closing, the Company will own the operating assets of Nugget Casino Resort and 50% of the membership interests in PropCo and have a five-year option to acquire the remaining 50% of the membership interests in PropCo for $105 million plus 2% per annum (the "Nugget Acquisition"). The Company has received a commitment letter from Goldman Sachs Bank USA for (i) $350 million in senior secured term loan financing to support the Nugget Acquisition, refinance the Company’s existing debt and for general corporate purposes and (ii) a $30 million senior secured revolving credit facility. 5
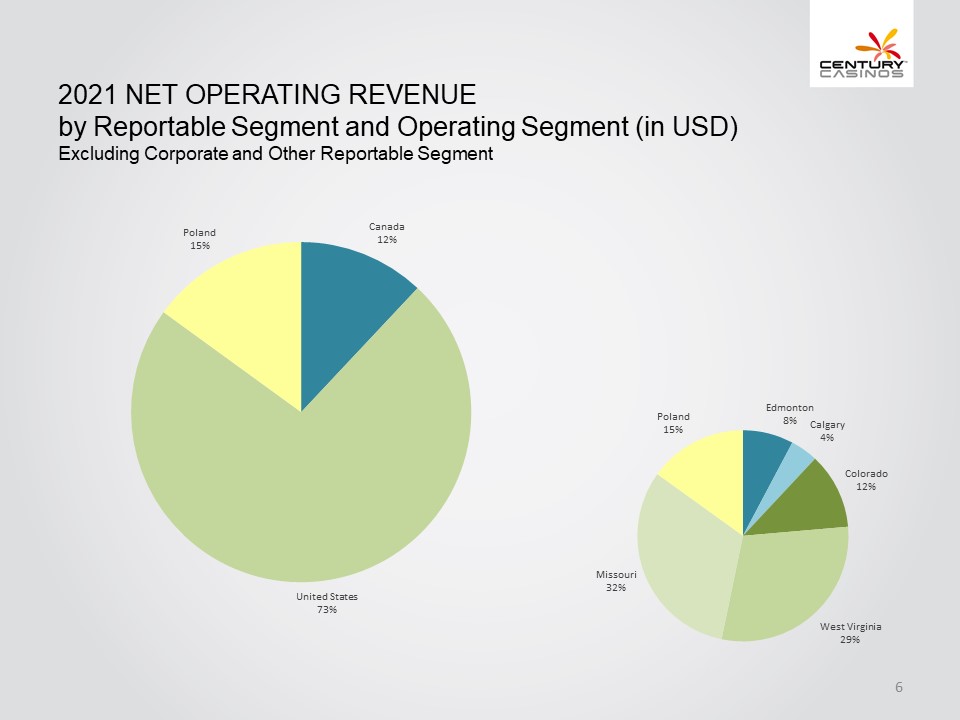
CENTURY CASINOS 2021 NET OPERATING REVENUE by Reportable Segment and Operating Segment (in USD) Excluding Corporate and Other Reportable Segment Poland 15% Canada 12% United States 73 % Poland 15 % Edmonton 8% Calgary 4% Colorado 12% West Virginia 29% Missouri 32% 6
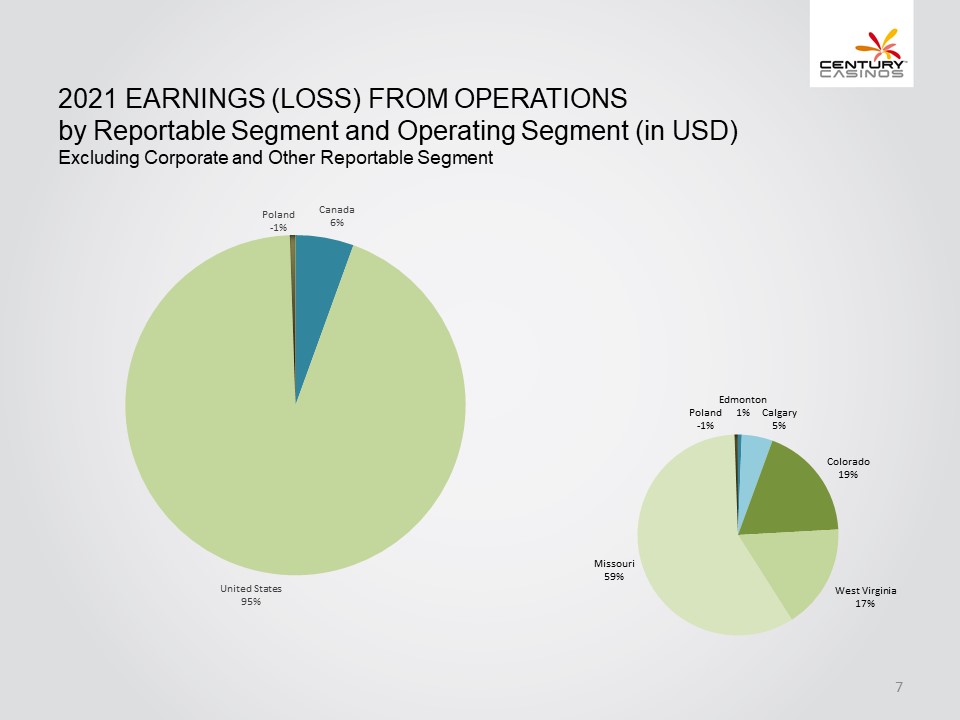
CENTURY CASINOS 2021 Earnings (LOSS) from Operations by Reportable Segment and Operating Segment (in USD) Excluding Corporate and Other Reportable Segment Poland -1% Canada 6% United States 95% Poland -1% Edmonton 1% Calgary 5% Colorado 19% West Virginia 17% Missouri 59% 7
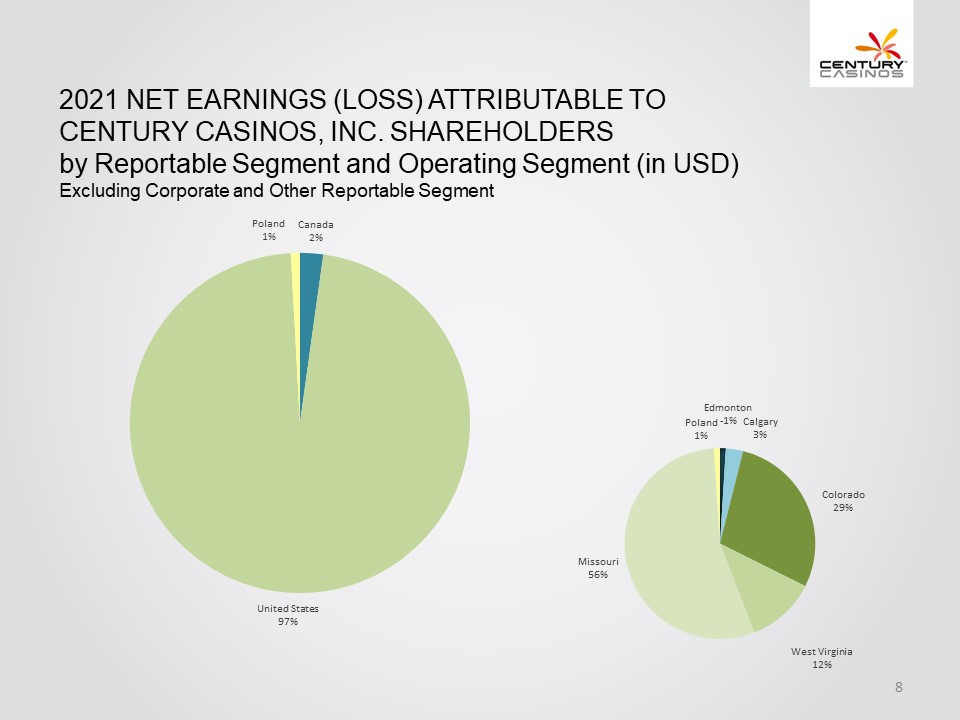
CENTURY CASINOS 2021 Net Earnings (LOSS) Attributable to Century Casinos, Inc. Shareholders by Reportable Segment and Operating Segment (in USD) Excluding Corporate and Other Reportable Segment Poland 1% Canada 2% United States 97% Poland 1% Edmonton -1% Calgary 3% Colorado 29% West Virginia 12% Missouri 56% 8
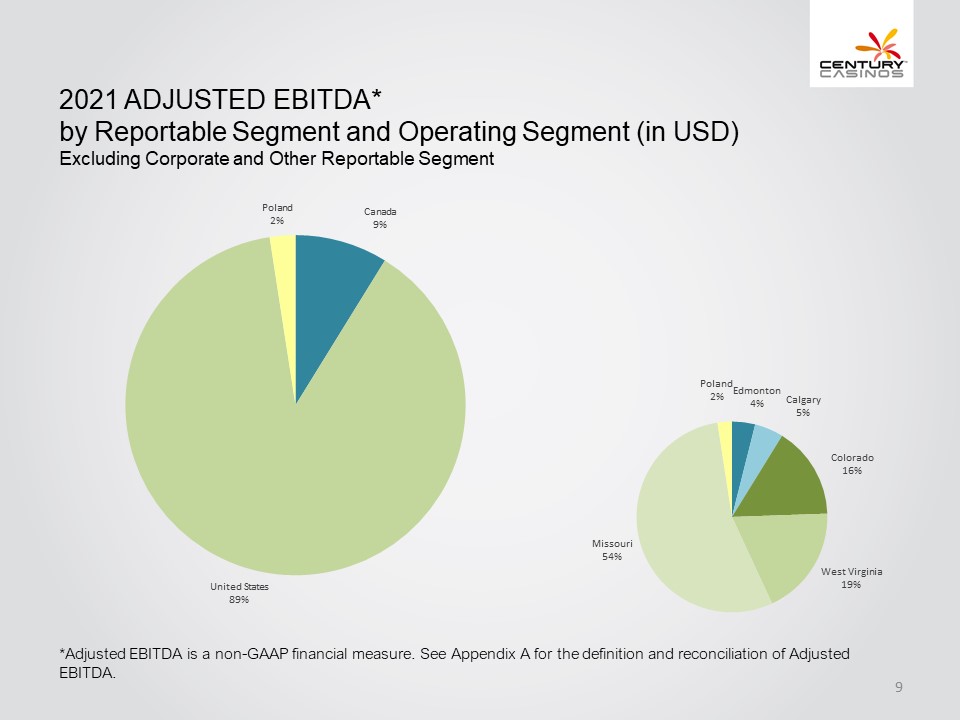
CENTURY CASINOS 2021 Adjusted EBITDA* by Reportable Segment and Operating Segment (in USD) Excluding Corporate and Other Reportable Segment Poland 2% Canada 9% United States 89% Poland 2% Edmonton 4% Calgary 5% Colorado 16% West Virginia 19% Missouri 54% *Adjusted EBITDA is a non-GAAP financial measure. See Appendix A for the definition and reconciliation of Adjusted EBITDA. 9
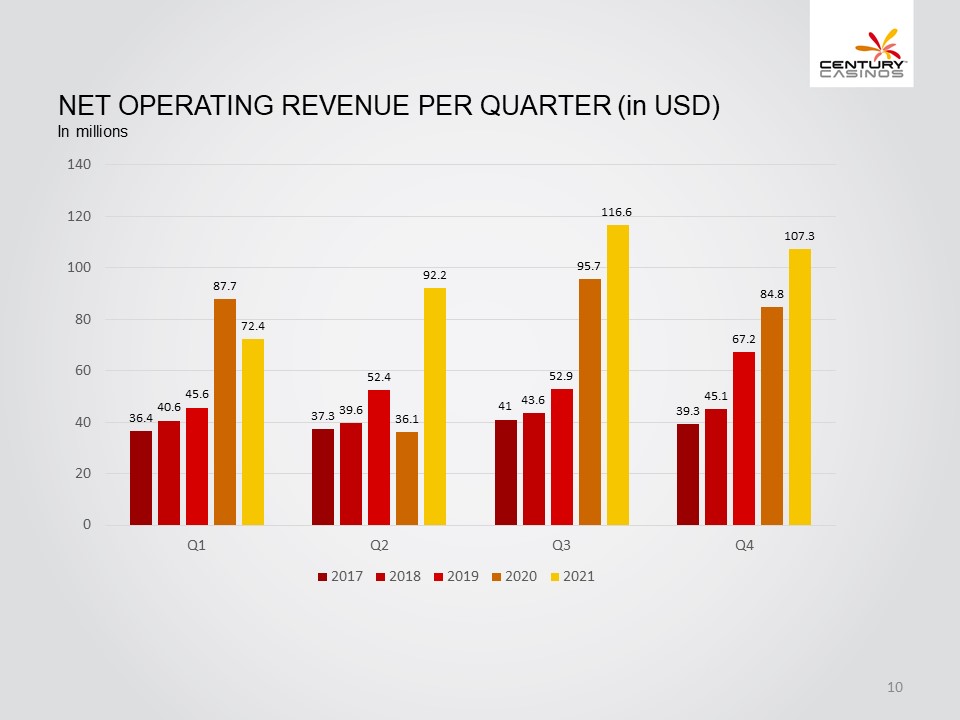
CENTURY CASINOS Net Operating Revenue per Quarter (in USD) In millions 140 120 100 80 60 40 20 0 36.4 40.6 45.6 87.7 72.4 37.3 39.6 52.4 36.1 92.2 41 43.6 52.9 95.7 116.6 39.3 45.1 67.2 84.8 107.3 Q1 Q2 Q3 Q4 2017 2018 2019 2020 2021 10

CENTURY CASINOS Balance Sheet (Selected Information in USD) In millions (except BVPS) December 31, 2021 December 31, 2020 Change Total Assets 703.4 680.8 3% Total Debt 181.5 184.6 (2%) Book Value per Share* 4.78 3.99 20% Net Debt** 81.4 130.4 *Book Value per Share is defined as total Century Casinos, Inc. shareholders’ equity divided by outstanding common shares. **Net Debt is calculated as total long-term debt (including current portion) plus deferred financing costs minus cash and cash equivalents. Net Debt is a non-GAAP financial measure. See Appendix A. Debt as of December 31, 2021 included $166.6 million related to our credit agreement with Macquarie Capital (“Macquarie”), $0.2 million related to CPL, $7.0 million related to CRM and $15.4 million related to CDR’s long-term land lease, offset by $7.7 million in deferred financing costs. The Company also has a $281.9 million long-term financing obligation under its triple-net master lease (“Master Lease”). 11
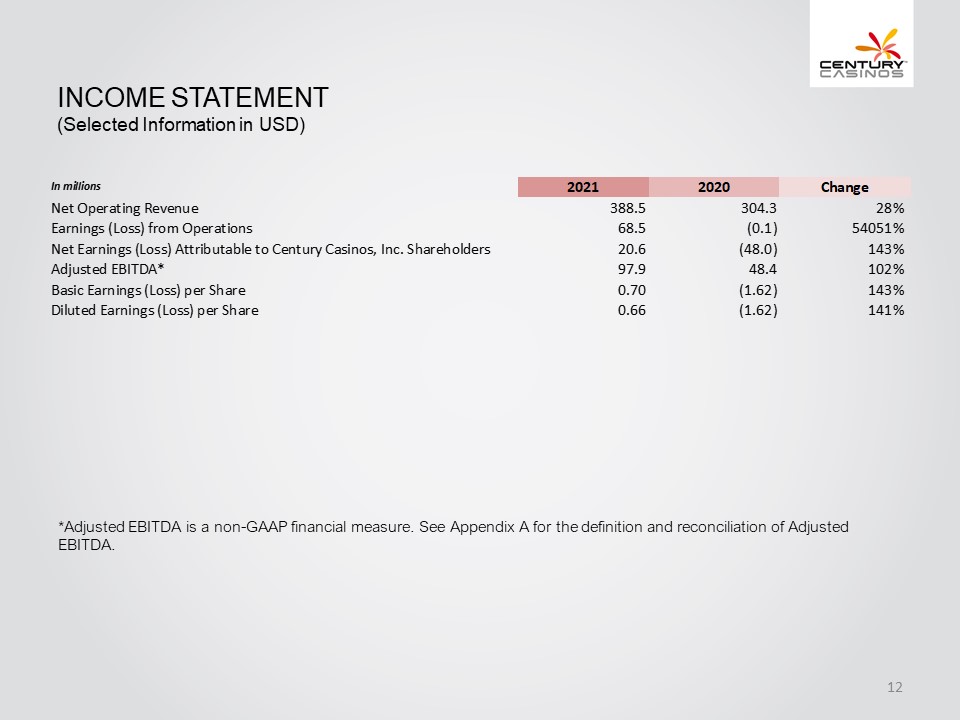
CENTURY CASINOS Income Statement (Selected Information in USD) In mitions 2021 2020 Change Net Operating Revenue 388.5 304.3 28% Earnings (Loss) from Operations 68.5 (0.1) 54051% Net Earnings (Loss) Attributable to Century Casinos, Inc. Shareholders 20.6 (48.0) 143% Adjusted EBITDA* 97.9 48.4 102% Basic Earnings (Loss) per Share 0.70 (1.62) 143% Diluted Earnings (Loss) per Share 0.66 (1.62) 141% *Adjusted EBITDA is a non-GAAP financial measure. See Appendix A for the definition and reconciliation of Adjusted EBITDA. 12
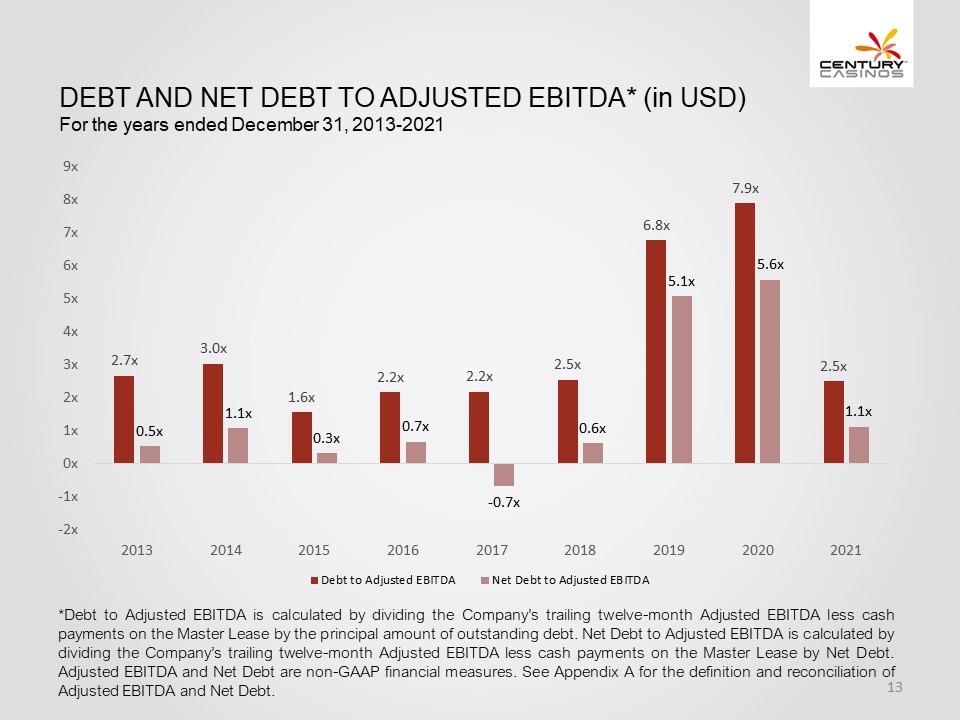
CENTURY CASINOS Debt and Net Debt to Adjusted EBITDA* (in USD) For the years ended December 31, 2013-2021 9x 8x 7x 6x 5x 4x 3x 2x 1x 0x -1x -2x 2.7x 0.5x 3.0x 1.1x 1.6x 0.3x 2.2x 0.7x 2.2x -0.7x 2.5 0.6x 6.8x 5.1x 7.9x 5.6x 2.5x 1.1x 2013 2014 2015 2016 2017 2018 2019 2020 2021 Debt to Adjusted EBITDA Net Debt to Adjusted EBITDA *Debt to Adjusted EBITDA is calculated by dividing the Company’s trailing twelve-month Adjusted EBITDA less cash payments on the Master Lease by the principal amount of outstanding debt. Net Debt to Adjusted EBITDA is calculated by dividing the Company’s trailing twelve-month Adjusted EBITDA less cash payments on the Master Lease by Net Debt. Adjusted EBITDA and Net Debt are non-GAAP financial measures. See Appendix A for the definition and reconciliation of Adjusted EBITDA and Net Debt. 13
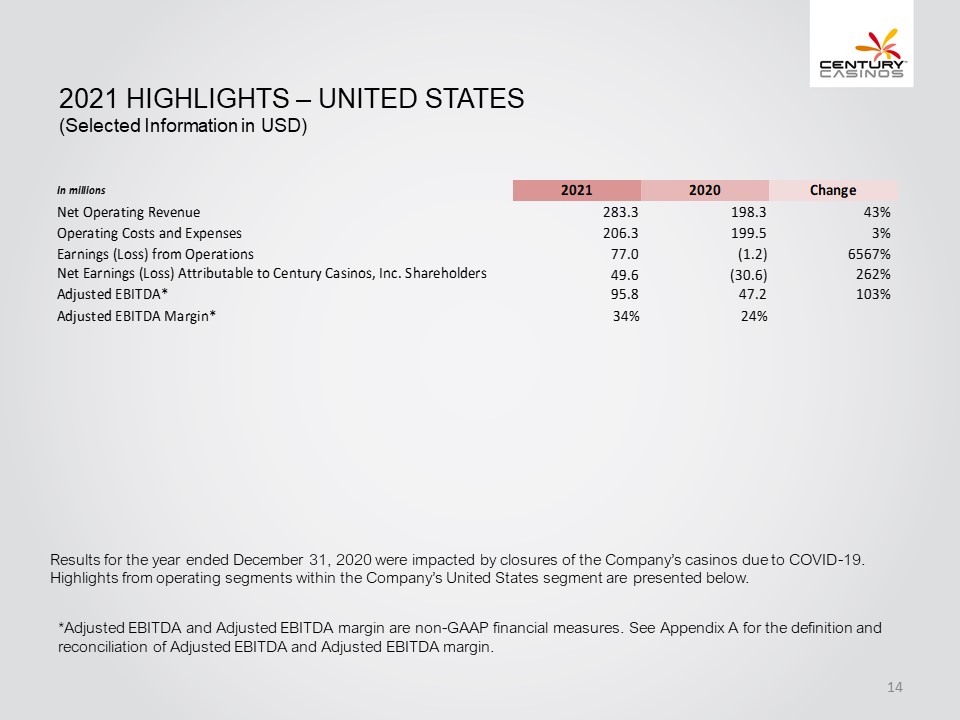
CENTURY CASINOS 2021 Highlights – UNITED STATES (Selected Information in USD) In millions 2021 2020 Change Net Operating Revenue 283.3 198.3 43% Operating Costs and Expenses 206.3 199.5 3% Earnings (Loss) from Operations 77.0 (1.2) 6567% Net Earnings (Loss) Attributable to Century Casinos, Inc. Shareholders 49.6 (30.6) 262% Adjusted EBITDA* 95.8 47.2 103% Adjusted EBITDA Margin* 34% 24% Results for the year ended December 31, 2020 were impacted by closures of the Company’s casinos due to COVID-19. Highlights from operating segments within the Company’s United States segment are presented below. *Adjusted EBITDA and Adjusted EBITDA margin are non-GAAP financial measures. See Appendix A for the definition and reconciliation of Adjusted EBITDA and Adjusted EBITDA margin. 14
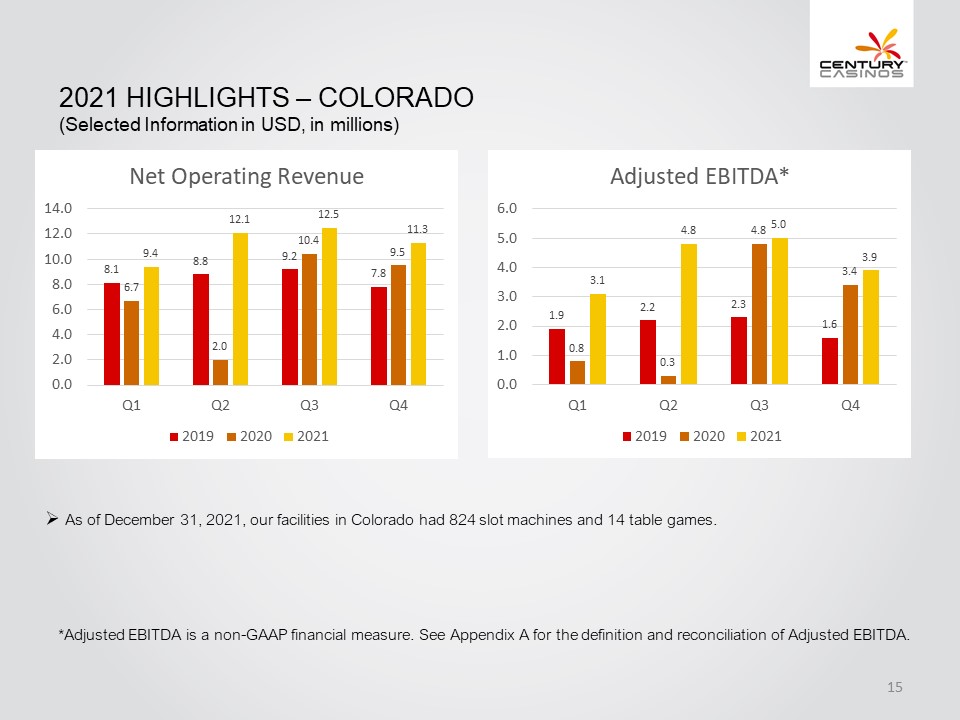
CENTURY CASINOS 2021 Highlights – COLORADO (Selected Information in USD, in millions) Net Operating Revenue 14.0 12.0 10.0 8.0 6.0 4.0 2.0 0.0 8.1 6.7 9.4 8.8 2.0 12.1 9.2 10.4 12.5 7.8 9.5 11.3 Q1 Q2 Q3 Q4 2019 2020 2021 Adjusted EBITDA* 6.0 5.0 4.0 3.0 2.0 1.0 0.0 1.9 0.8 3.1 2.2 0.3 4.8 2.3 4.8 5.0 1.6 3.4 3.9 Q1 Q2 Q3 Q4 2019 2020 2021 As of December 31, 2021, our facilities in Colorado had 824 slot machines and 14 table games. *Adjusted EBITDA is a non-GAAP financial measure. See Appendix A for the definition and reconciliation of Adjusted EBITDA. 15
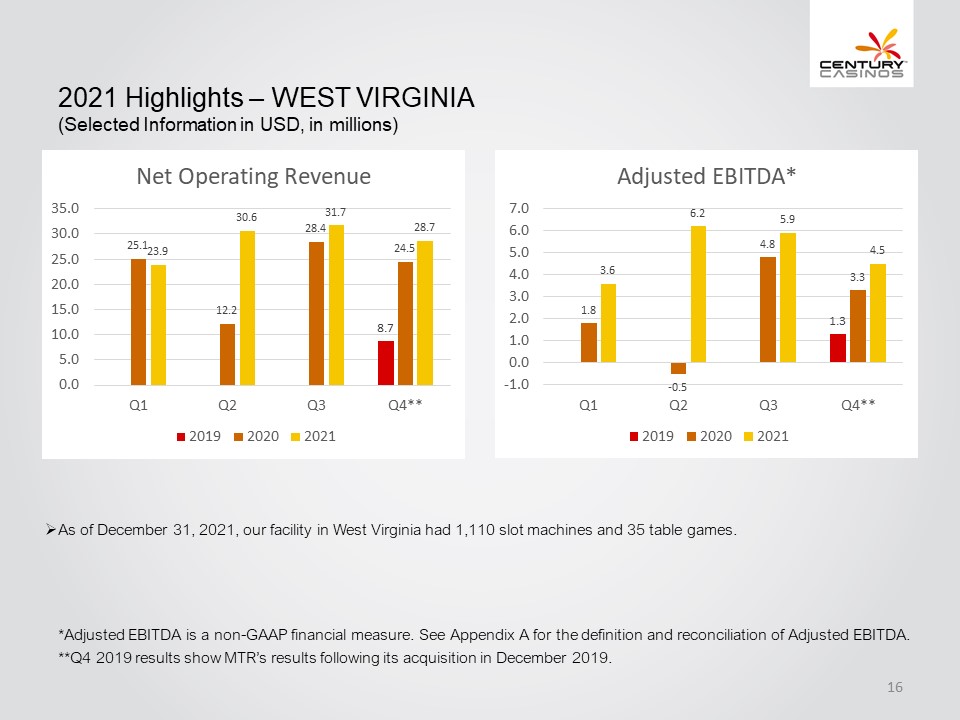
CENTURY CASINOS 2021 Highlights – WEST VIRGINIA (Selected Information in USD, in millions) Net Operating Revenue 35.0 30.0 25.0 20.0 15.0 10.0 5.0 0.0 25.1 23.9 12.2 30.6 28.4 31.7 8.7 24.5 28.7 Q1 Q2 Q3 Q4** 2019 2020 2021 Adjusted EBITDA* 7.0 6.0 5.0 4.0 3.0 2.0 1.0 0.0 -1.0 1.8 3.6 -0.5 6.2 4.8 5.9 1.3 3.3 4.5 Q1 Q2 Q3 Q4** 2019 2020 2021 As of December 31, 2021, our facility in West Virginia had 1,110 slot machines and 35 table games. *Adjusted EBITDA is a non-GAAP financial measure. See Appendix A for the definition and reconciliation of Adjusted EBITDA. **Q4 2019 results show MTR’s results following its acquisition in December 2019. 16
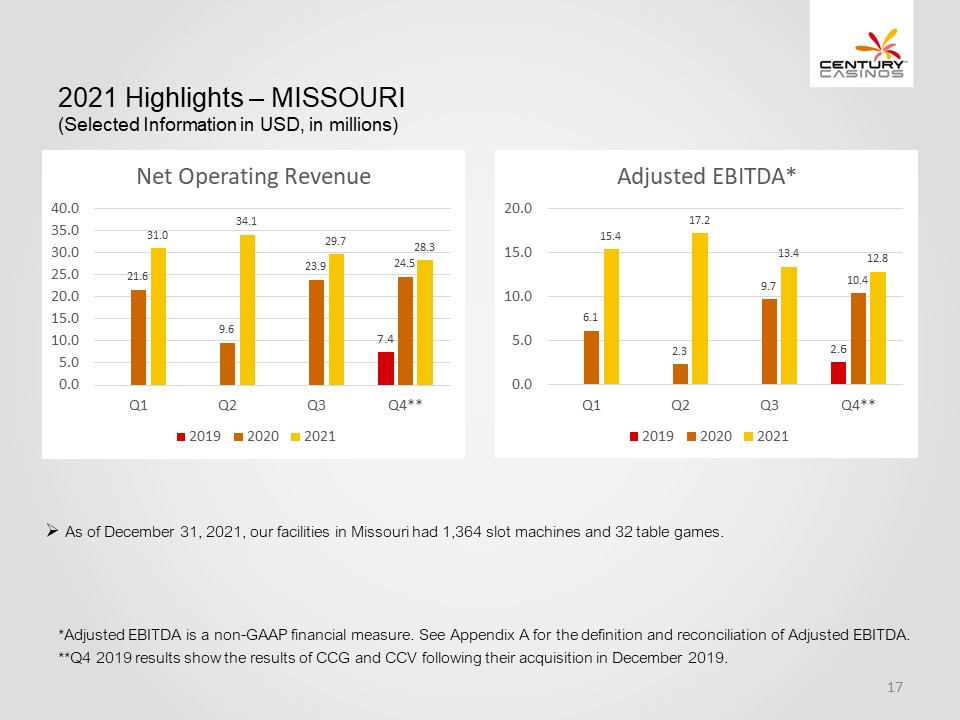
CENTURY CASINOS 2021 Highlights – MISSOURI (Selected Information in USD, in millions) Net Operating Revenue 40.0 35.0 30.0 25.0 20.0 15.0 10.0 5.0 0.0 21.6 31.0 9.6 34.1 23.9 29.7 7.4 24.5 28.3 Q1 Q2 Q3 Q4** 2019 2020 2021 Adjusted EBITDA* 25.0 20.0 15.0 10.0 5.0 0.0 6.1 15.4 2.3 17.2 9.7 13.4 2.6 10.4 12.8 Q1 Q2 Q3 Q4** 2019 2020 2021 As of December 31, 2021, our facilities in Missouri had 1,364 slot machines and 32 table games. *Adjusted EBITDA is a non-GAAP financial measure. See Appendix A for the definition and reconciliation of Adjusted EBITDA. **Q4 2019 results show the results of CCG and CCV following their acquisition in December 2019. 17

CENTURY CASINOS 2021 Highlights – CANADA (Selected Information in CAD) In millions 2021 2020 Change Net Operating Revenue 58.2 66.8 (13%) Operating Costs and Expenses 52.6 55.2 (5%) Earnings from Operations 5.7 11.6 (51%) Net Earnings Attributable to Century Casinos, Inc. Shareholders 2.9 4.9 (41%) Adjusted EBITDA* 13.1 15.0 (13%) Adjusted EBITDA Margin* 22% 22% Highlights from operating segments within the Company’s Canada segment are presented below. *Adjusted EBITDA and Adjusted EBITDA margin are non-GAAP financial measures. See Appendix A for the definition and reconciliation of Adjusted EBITDA and Adjusted EBITDA margin. 18
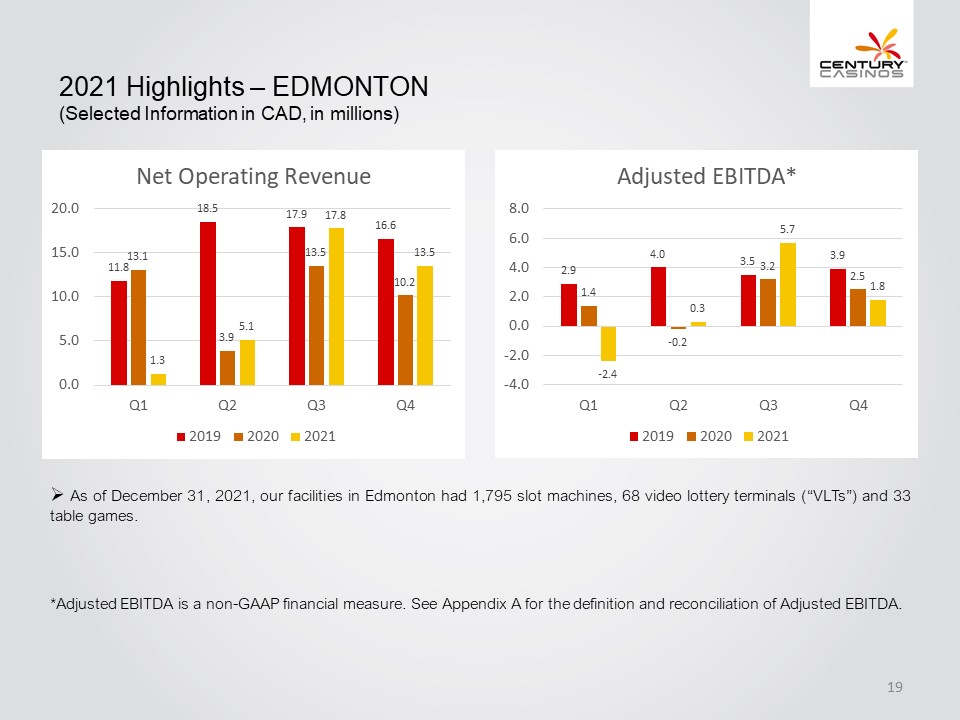
CENTURY CASINOS 2021 Highlights – EDMONTON (Selected Information in CAD, in millions) Net Operating Revenue 20.0 15.0 10.0 5.0 0.0 11.8 13.1 1.3 18.5 3.9 5.1 17.9 13.5 17.8 16.6 10.2 13.5 Q1 Q2 Q3 Q4 2019 2020 2021 Adjusted EBITDA* 8.0 6.0 4.0 2.0 0.0 -2.0 -4.0 2.9 1.4 -2.4 4.0 -0.2 0.3 3.5 3.2 5.7 3.9 2.5 1.8 Q1 Q2 Q3 Q4 2019 2020 2021 As of December 31, 2021, our facilities in Edmonton had 1,795 slot machines, 68 video lottery terminals (“VLTs”) and 33 table games. *Adjusted EBITDA is a non-GAAP financial measure. See Appendix A for the definition and reconciliation of Adjusted EBITDA. 19

CENTURY CASINOS 2021 Highlights – CALGARY (Selected Information in CAD, in millions) Net Operating Revenue 12.0 10.0 8.0 6.0 4.0 2.0 0.0 9.9 8.5 1.2 10.9 2.6 3.1 11.2 8.6 9.1 10.2 6.4 7.1 Q1 Q2 Q3 Q4 2019 2020 2021 Adjusted EBITDA* 5.0 4.0 3.0 2.0 1.0 0.0 -1.0 3.8 2.5 -0.7 3.9 0.0 0.5 2.9 2.7 4.3 3.2 2.8 2.5 Q1 Q2 Q3 Q4 2019 2020 2021 As of December 31, 2021, our facilities in Calgary had 663 slot machines and 10 VLTs. The casino operations of Century Casino Calgary were sold in December 2020. *Adjusted EBITDA is a non-GAAP financial measure. See Appendix A for the definition and reconciliation of Adjusted EBITDA. 20
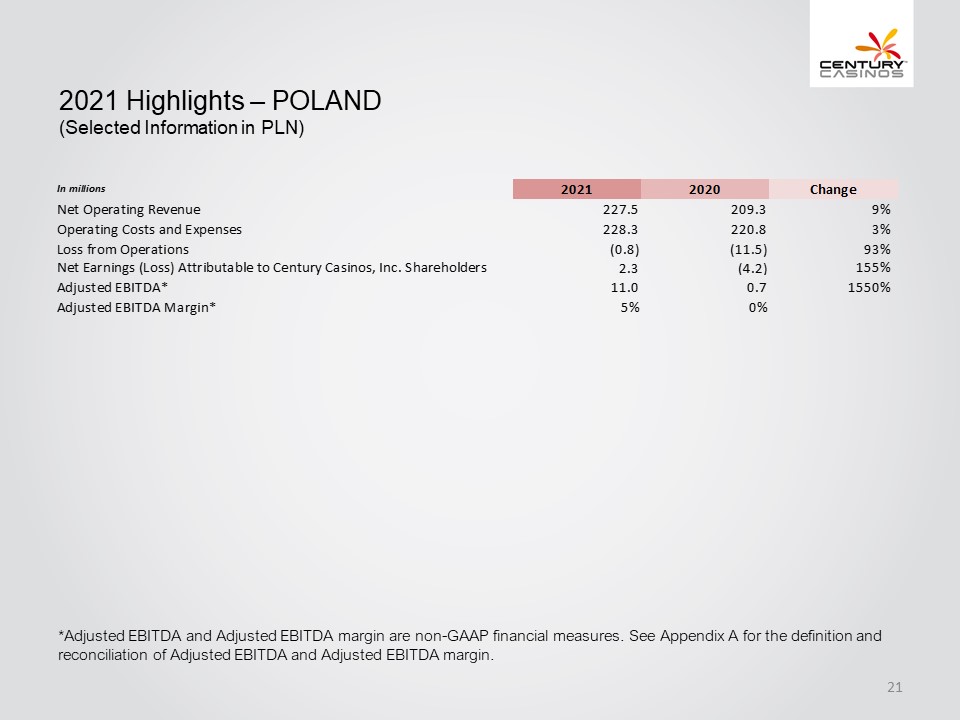
CENTURY CASINOS 2021 Highlights – POLAND (Selected Information in PLN) In millions 2021 2020 Change Net Operating Revenue 227.5 209.3 9% Operating Costs and Expenses 228.3 220.8 3% Loss from Operations (0.8) (11.5) 93% Net Earnings (Loss) Attributable to Century Casinos, Inc. Shareholders 2.3 (4.2) 155% Adjusted EBITDA* 11.0 0.7 1550% Adjusted EBITDA Margin* 5% 0% *Adjusted EBITDA and Adjusted EBITDA margin are non-GAAP financial measures. See Appendix A for the definition and reconciliation of Adjusted EBITDA and Adjusted EBITDA margin. 21
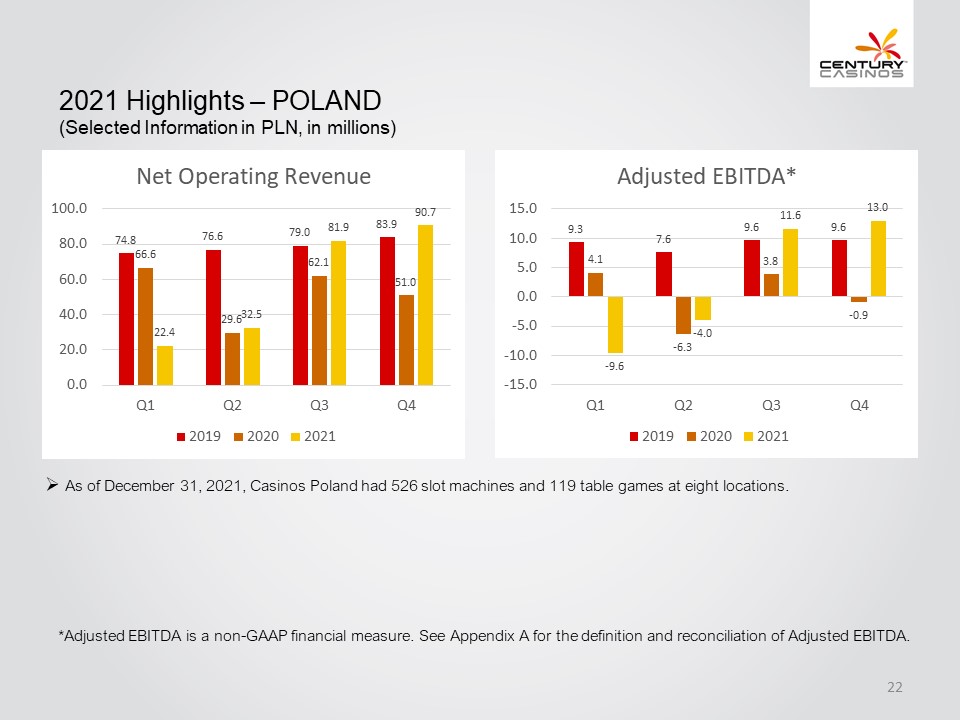
CENTURY CASINOS 2021 Highlights – POLAND (Selected Information in PLN, in millions) Net Operating Revenue 100.0 80.0 60.0 40.0 20.0 0.0 74.8 66.6 22.4 76.6 29.6 32.5 79.0 62.1 81.9 83.9 51.0 90.7 Q1 Q2 Q3 Q4 2019 2020 2021 Adjusted EBITDA* 15.0 10.0 5.0 0.0 -5.0 -10.0 -15.0 9.3 4.1 -9.6 7.6 -6.3 -4.0 9.6 3.8 11.6 9.6 -0.9 13.0 Q1 Q2 Q3 Q4 2019 2020 2021 As of December 31, 2021, Casinos Poland had 526 slot machines and 119 table games at eight locations. *Adjusted EBITDA is a non-GAAP financial measure. See Appendix A for the definition and reconciliation of Adjusted EBITDA. 22
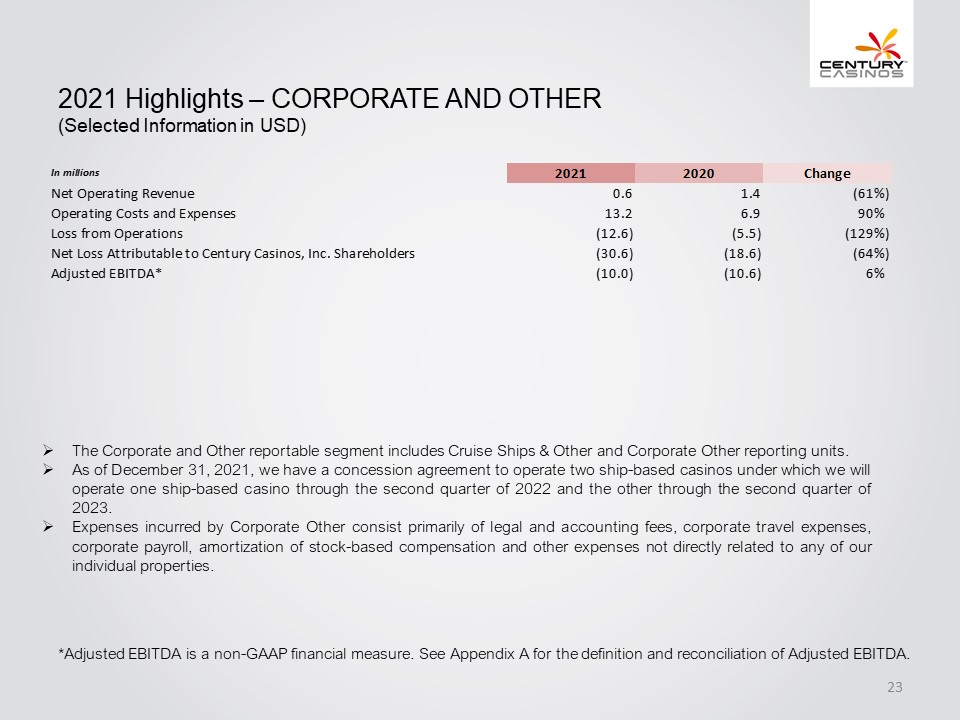
CENTURY CASINOS 2021 Highlights – CORPORATE AND OTHER (Selected Information in USD) In millions 2021 2020 Change Net Operating Revenue 0.6 1.4 (61%) Operating Costs and Expenses 13.2 6.9 90% Loss from Operations (12.6) (5.5) (129%) Net Loss Attributable to Century Casinos, Inc. Shareholders (30.6) (18.6) (64%) Adjusted EBITDA* (10.0) (10.6) 6% The Corporate and Other reportable segment includes Cruise Ships & Other and Corporate Other reporting units. As of December 31, 2021, we have a concession agreement to operate two ship-based casinos under which we will operate one ship-based casino through the second quarter of 2022 and the other through the second quarter of 2023. Expenses incurred by Corporate Other consist primarily of legal and accounting fees, corporate travel expenses, corporate payroll, amortization of stock-based compensation and other expenses not directly related to any of our individual properties. *Adjusted EBITDA is a non-GAAP financial measure. See Appendix A for the definition and reconciliation of Adjusted EBITDA. 23
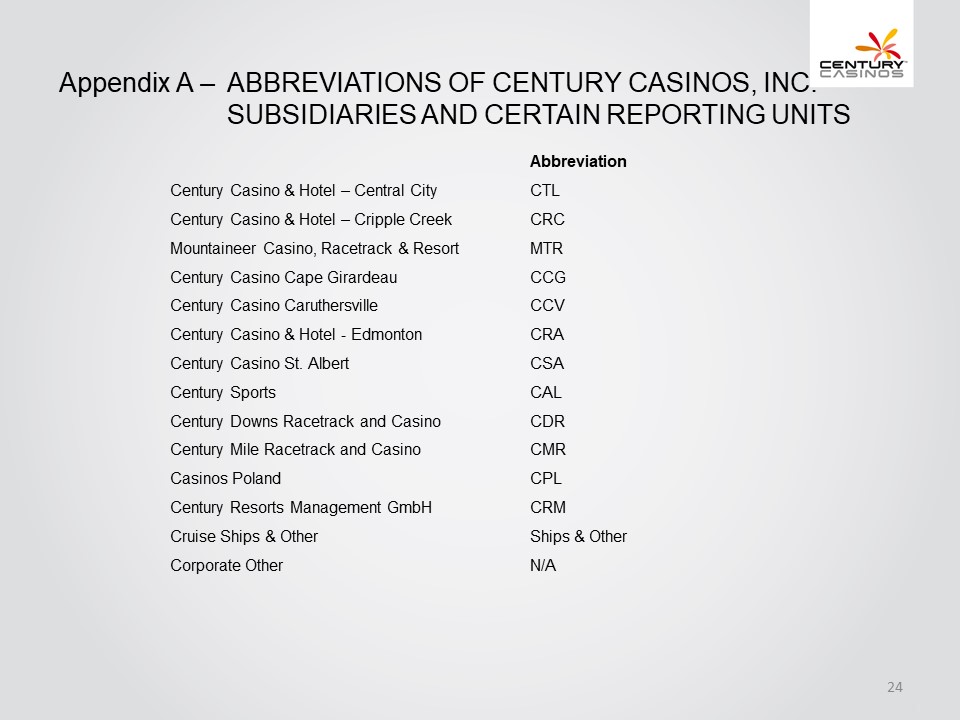
CENTURY CASINOS Appendix A – ABBREVIATIONS OF CENTURY CASINOS, INC. SUBSIDIARIES AND CERTAIN REPORTING UNITS Abbreviation Century Casino & Hotel – Central City CTL Century Casino & Hotel – Cripple Creek CRC Mountaineer Casino, Racetrack & Resort MTR Century Casino Cape Girardeau CCG Century Casino Caruthersville CCV Century Casino & Hotel - Edmonton CRA Century Casino St. Albert CSA Century Sports CAL Century Downs Racetrack and Casino CDR Century Mile Racetrack and Casino CMR Casinos Poland CPL Century Resorts Management GmbH CRM Cruise Ships & Other Ships & Other Corporate Other N/A 24
CENTURY CASINOS Appendix A – NON-GAAP FINANCIAL MEASURES The Company supplements its consolidated financial statements prepared in accordance with U.S. generally accepted accounting principles (“GAAP”) by using the following non-GAAP financial measures, which management believes are useful in properly understanding the Company’s short-term and long-term financial trends. Management uses these non-GAAP financial measures to forecast and evaluate the operational performance of the Company as well as to compare results of current periods to prior periods on a consolidated basis. Adjusted EBITDA Adjusted EBITDA margin Net Debt Management believes presenting the non-GAAP financial measures used in this presentation provides investors greater transparency to the information used by management for financial and operational decision-making and allows investors to see the Company’s results “through the eyes” of management. Management also believes providing this information better enables our investors to understand the Company’s operating performance and evaluate the methodology used by management to evaluate and measure such performance. The adjustments made to GAAP financial measures result from facts and circumstances that vary in frequency and impact on the Company’s results of operations. The following is an explanation of each of the adjustments that management excludes in calculating its non-GAAP financial measures. 25
CENTURY CASINOS Appendix A – NON-GAAP FINANCIAL MEASURES The Company defines Adjusted EBITDA as net earnings (loss) attributable to Century Casinos, Inc. shareholders before interest expense (income), net, income taxes (benefit), depreciation and amortization, non-controlling interests net earnings (loss) and transactions, pre-opening expenses, acquisition costs, non-cash stock-based compensation charges, asset impairment costs, (gain) loss on disposition of fixed assets, discontinued operations, (gain) loss on foreign currency transactions, cost recovery income and other, gain on business combination and certain other one-time transactions. Expense related to the Master Lease for the Company’s acquired casinos in Missouri and West Virginia and CDR land lease is included in the interest expense (income), net line item. Intercompany transactions consisting primarily of management and royalty fees and interest, along with their related tax effects, are excluded from the presentation of net earnings (loss) attributable to Century Casinos, Inc. shareholders and Adjusted EBITDA reported for each segment. Non-cash stock-based compensation expense is presented under Corporate and Other as the expense is not allocated to reportable segments when reviewed by the Company’s chief operating decision makers. Not all of the aforementioned items occur in each reporting period, but have been included in the definition based on historical activity. These adjustments have no effect on the consolidated results as reported under GAAP. Adjusted EBITDA is not considered a measure of performance recognized under GAAP. Management believes that Adjusted EBITDA is a valuable measure of the relative performance of the Company and its properties. The gaming industry commonly uses Adjusted EBITDA as a method of arriving at the economic value of a casino operation. Management uses Adjusted EBITDA to compare the relative operating performance of separate operating units by eliminating the above-mentioned items associated with the varying levels of capital expenditures for infrastructure required to generate revenue and the often high cost of acquiring existing operations. Adjusted EBITDA is used by the Company’s lending institution to gauge operating performance. The Company’s computation of Adjusted EBITDA may be different from, and therefore may not be comparable to, similar measures used by other companies within the gaming industry. Please see the reconciliation of Adjusted EBITDA to net earnings (loss) attributable to Century Casinos, Inc. shareholders below. The Company defines Adjusted EBITDA margin as Adjusted EBITDA divided by net operating revenue. Management uses this margin as one of several measures to evaluate the efficiency of the Company’s casino operations. 26
CENTURY CASINOS Appendix A – NON-GAAP FINANCIAL MEASURES The Company defines Net Debt as total long-term debt (including current portion) plus deferred financing costs minus cash and cash equivalents. Net Debt is not considered a liquidity measure recognized under GAAP. Management believes that Net Debt is a valuable measure of our overall financial situation. Net Debt provides investors with an indication of our ability to pay off all of our long-term debt if it became due simultaneously. The cash payments related to the Company’s Master Lease are deducted from Adjusted EBITDA to calculate the debt and Net Debt to Adjusted EBITDA ratios. The Company does not recognize rent expense related to these leased assets; instead, a portion of the periodic payment under the Master Lease is recognized as interest expense with the remainder of the payment reducing the failed sale-leaseback financing obligation using the effective interest method. Management believes that deducting cash payments related to its Master Lease from Adjusted EBITDA provides investors with an indication of the length of time it would take the Company to repay its long-term debt. 27
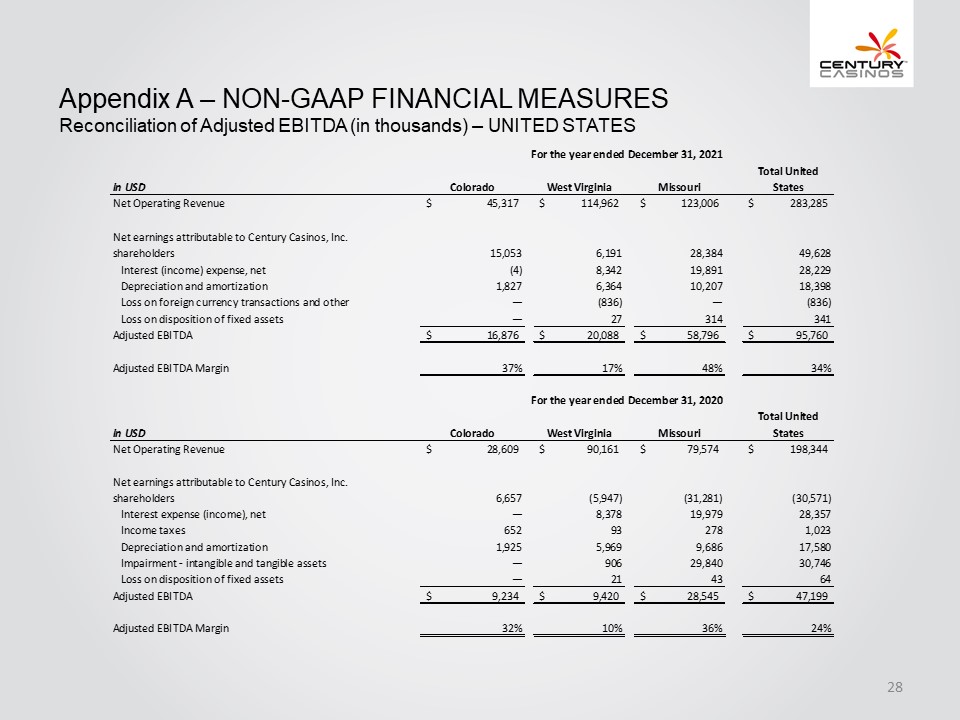
CENTURY CASINOS Appendix A – NON-GAAP FINANCIAL MEASURES Reconciliation of Adjusted EBITDA (in thousands) – UNITED STATES For the year ended December 31, 2021 In USD Colorado West Virginia Missouri Total United States Net Operating Revenue $ 45,317 $ 114,962 $ 123,006 $ 283,285 Net earnings attributable to Century Casinos, Inc. shareholders 15,053 6,191 28,384 49,628 Interest (income) expense, net (4) 8,342 19,891 28,229 Depreciation and amortization 1,827 6,364 10,207 18,398 Loss on foreign currency transactions and other — (836) — (836) Loss on disposition of fixed assets — 27 314 341 Adjusted EBITDA $ 16,876 $ 20,088 $ 58,796 $ 95,760 Adjusted EBITDA Margin 37% 17% 48% 34% For the year ended December 31, 2020 In USD Colorado West Virginia Missouri Total United States Net Operating Revenue $ 28,609 $ 90,161 $ 79,574 $ 198,344 Net earnings attributable to Century Casinos, Inc. shareholders 6,657 (5,947) (31,281) (30,571) Interest expense (income), net — 8,378 19,979 28,357 Income taxes 652 93 278 1,023 Depreciation and amortization 1,925 5,969 9,686 17,580 Impairment - intangible assets — 906 29,840 30,746 Loss on disposition of fixed assets — 21 43 64 Adjusted EBITDA $ 9,234 $ 9,420 $ 28,545 $ 47,199 Adjusted EBITDA Margin 32% 10% 36% 24% 28
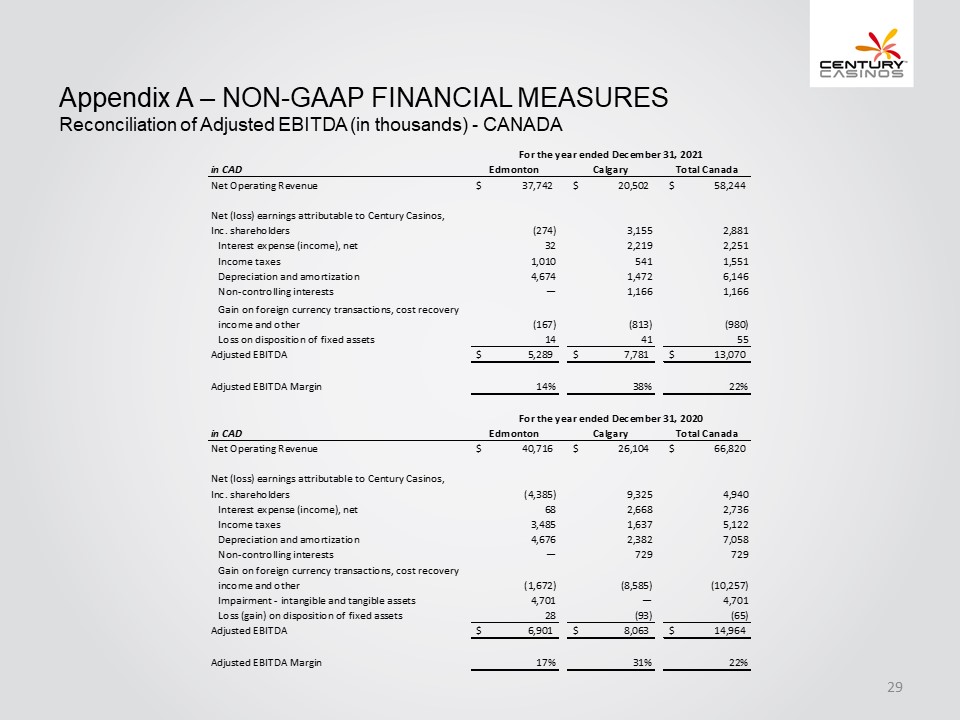
CENTURY CASINOS Appendix A – NON-GAAP FINANCIAL MEASURES Reconciliation of Adjusted EBITDA (in thousands) - CANADA For the year ended December 31 2021 in CAD Edmonton Canary Total Canada Net Operating Revenue $ 37,742 $ 20,502 $ 58,244 Net (loss) earnings attributable to Century Casinos, Inc. shareholders (274) 3,155 2,881 Interest expense (income), net 32 2,219 2,251 Income taxes 1,010 541 1,551 Depreciation and amortization 4,674 1,472 6,146 Non-controlling interests — 1,166 1,166 Gain on foreign currency transactions, cost recovery income and other (167) (813) (980) Loss on disposition of fixed assets 14 41 55 Adjusted EBITDA $ 5,289 $ 7,781 $13,070 Adjusted EBITDA Margin 14% 38% 22% in CAD Edmonton Calgary Total Canada Net Operating Revenue $ 40,719 $ 26,104 $ 66,820 Net (loss) earnings attributable to Century Casinos, Inc. shareholders(4,395) 9,325 4,940 Interest expense (income), net 68 2,668 2,736 Income taxes 3,485 1,637 5,122 Depreciation and amortization 4,676 2,382 7,058 Non-controlling interests — 729 729 Gain on foreign currency transactions, cost recovery income and other (1,672) (8,585) (10,257) Impairment - intangible and tangible assets 4,701 — 4,701 Loss (gain) on disposition of fixed assets 28 (93) (65) Adjusted EBITDA $ 6,901 $ 8,063 $ 14,964 Adjusted EBITDA Margin 17% 31% 22% 29
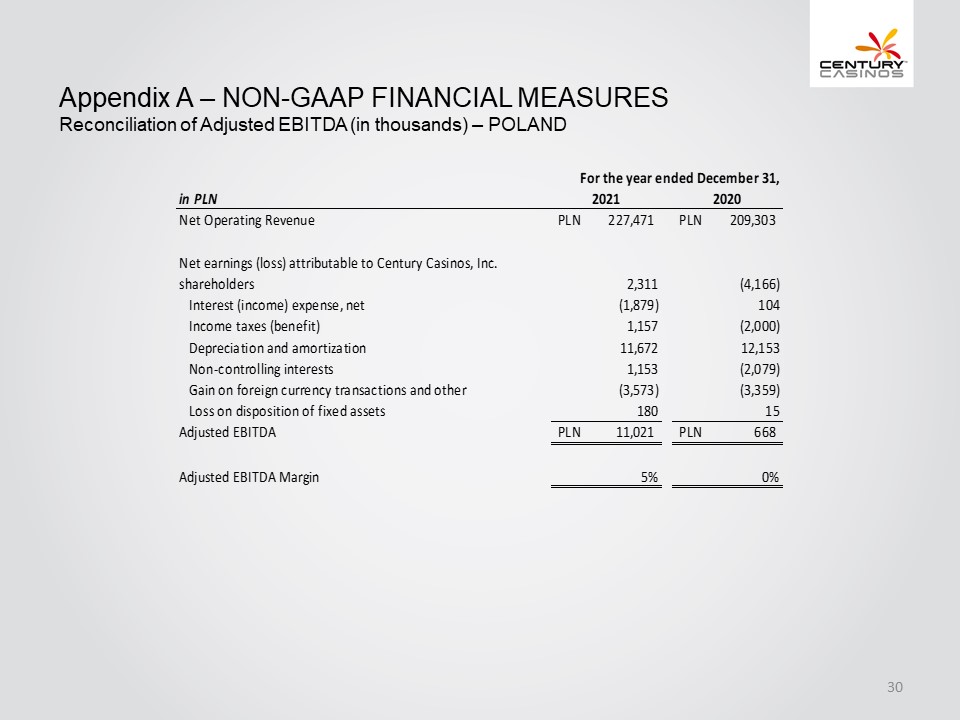
CENTURY CASINOS Appendix A – NON-GAAP FINANCIAL MEASURES Reconciliation of Adjusted EBITDA (in thousands) – POLAND in PLN For the year ended December 31, 2021 2020 Net Operating Revenue PLN 227,471 PLN 209,303 Net earnings (loss) attributable to Century Casinos, Inc. shareholders 2,311 (4,166) Interest (income) expense, net (1,879) 104 Income taxes (benefit) 1,157 (2,000) Depreciation and amortization 11,672 12,153 Non-controlling interests 1,153 (2,079) Gain on foreign currency transactions and other (3,573) (3,359) Loss on disposition of fixed assets 180 15 Adjusted EBITDA PLN 11,021 PLN 668 Adjusted EBITDA Margin 5% 0% 30
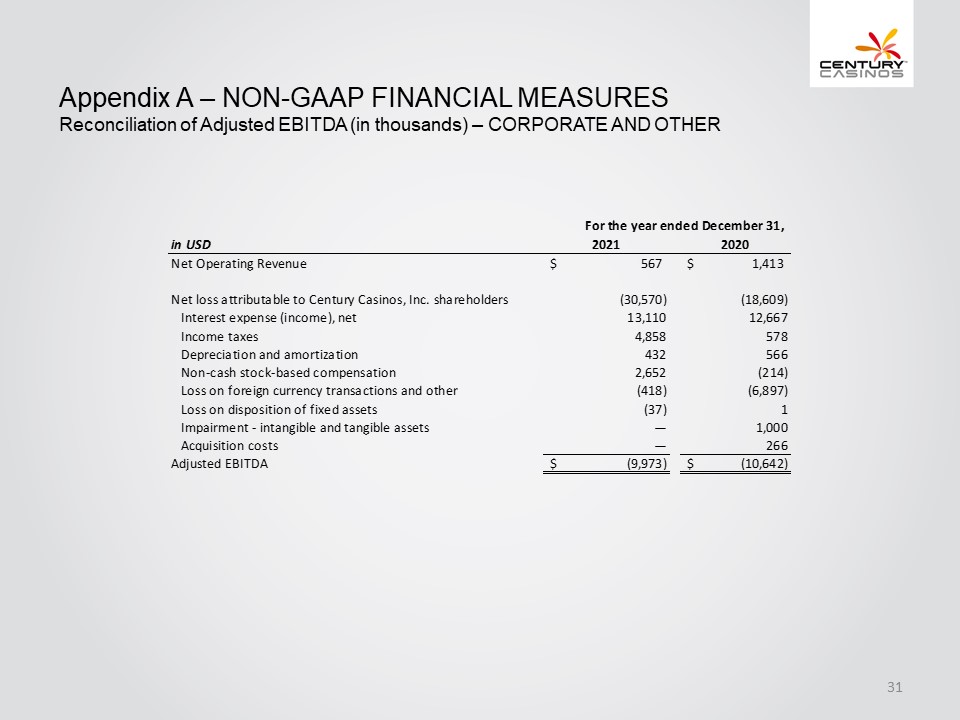
CENTURY CASINOS Appendix A – NON-GAAP FINANCIAL MEASURES Reconciliation of Adjusted EBITDA (in thousands) – CORPORATE AND OTHER in USD For the year ended December 31, 2021 2020 Net Operating Revenue $ 567 $ 1,413 Net loss attributable to Century Casinos, Inc. shareholders (30,570) (18,609) Interest expense (income), net 13,110 12,667 Income taxes 4,858 578 Depreciation and amortization 432 566 Non-cash stock-based compensation 2,652 (214) Loss on foreign currency transactions and other (418) (6,897) Loss on disposition of fixed assets (37) 1 Impairment - intangible and tangible assets — 1,000 Acquisition costs — 266 Adjusted EBITDA $ (9,973) $ (10,642) 31
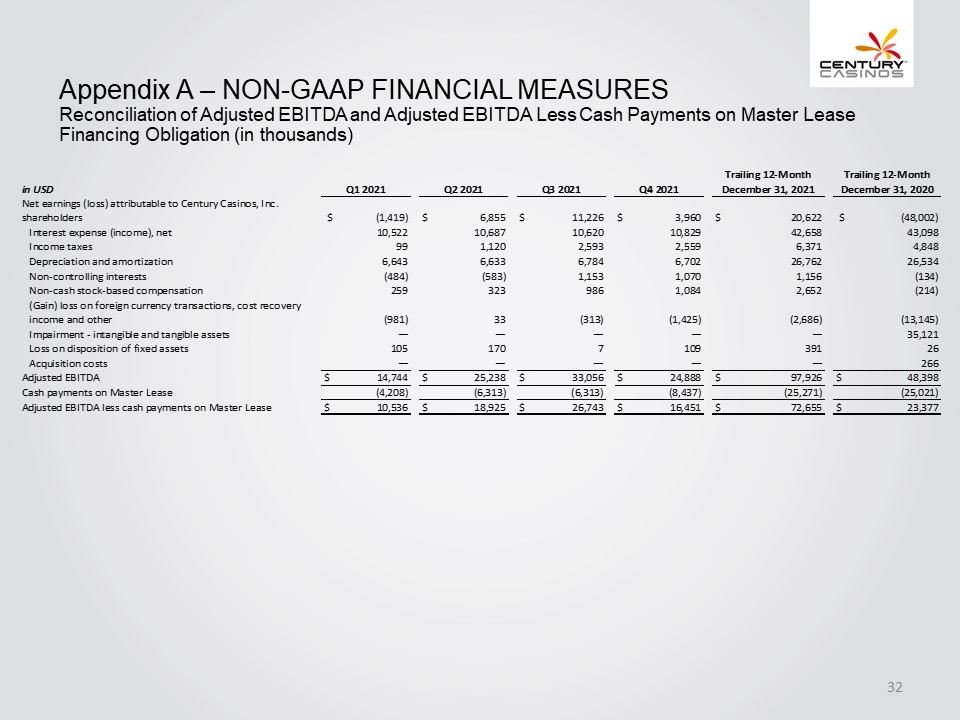
CENTURY CASINOS Appendix A – NON-GAAP FINANCIAL MEASURES Reconciliation of Adjusted EBITDA and Adjusted EBITDA Less Cash Payments on Master Lease Financing Obligation (in thousands) in USD Q1 2021 Q2 2021 Q3 2021 Q4 2021 Trailing 12-Month December 31, 2021 Trailing 12-Month December 31, 2020 Net earnings (loss) attributable to Century Casinos, Inc. shareholders $ (1,419) $ 6,855 $ 11,226 $ 3,960 $ 20,622 $ (48,002) Interest expense (income), net 10,522 10,687 10,620 10,829 42,658 43,098 Interest taxes 99 1,120 2,593 2,559 6,371 4,848 Depreciation and amortization 6,643 6,633 6,784 6,702 26,762 26,534 Non-controlling interests (484) (583) 1,153 1,070 1,156 (134) Non-cash stock-based compensation 259 323 986 1,084 2,652 (214) (Gain) loss on foreign currency transactions, cost recovery income and other (981) 33 (313) (1,425) (2,686) (13,145) Impairment- Intangible and tangible assets — — — — — 35,121 Loss on disposition of fixed assets 105 170 7 109 391 26 Acquisition costs — — — — — 266 Adjusted EBITDA $ 14,744 $ 25,238 $ 33,056 $ 24,888 $ 97,926 $ 48,398 Cash payments on Master Lease (4,208) (6,313) (6,313) (8,437) (25,271) (25,021) Adjusted EBITDA less cash payments on Master Lease $ 10,536 $ 18,925 $ 26,743 $ 16,451 $ 72.655 $ 23377 32
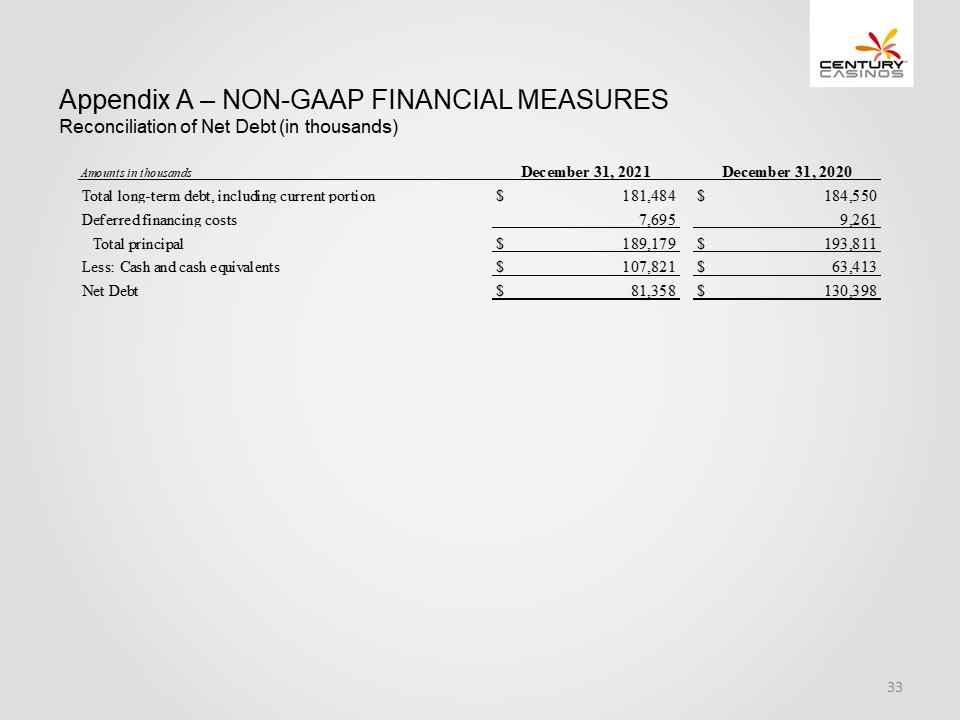
CENTURY CASINOS Appendix A – NON-GAAP FINANCIAL MEASURES Reconciliation of Net Debt (in thousands) Amounts in thousands December 31, 2021 December 31, 2020Total long-term debt, including current portion $ 181,484 $ 184,550 Deferred financing costs 7,695 9,261 Total principal $ 189,179 $ 193,811 Less: Cash and cash equivalents $ 107,821 $ 63,413 Net Debt $ 81,358 $ 130,398 33