Exhibit 99.1
CENTURY CASINOS LENDER PRESENTATION March 2022
Authorization Letter CENTURY CASINOS CENTURY CASINOS, INC. 455 E. Pikes Peak Ave., Suite 210 Colorado Springs, CO 80903 March 1, 2022 Goldman Sachs Bank USA 200 West Street New York, NY 10282 Ladies and Gentlemen: We refer to the proposed $350,000,000 senior secured term loan credit facility (the "Facility") for Century Casinos, Inc. (the "Company") that you are arranging at our request, and the Lender Presentation forwarded herewith (the "Lender Presentation"). We understand and acknowledge that, to the extent that any of the Borrower or its subsidiaries have any publicly traded securities issued and outstanding, potential lenders whose representatives do not wish to receive material, non-public information within the meaning of United States federal and state securities laws (“Public-Siders”) may trade in such securities on the basis of information contained in the Lender Presentation. We have reviewed or participated in preparing the Lender Presentation and the information contained therein. The Company has reviewed the information contained in the Lender Presentation and represents and warrants to you that the information contained in the Lender Presentation is, when taken as a whole, complete and correct in all material respects and does not contain any untrue statement of a material fact or omit to state a material fact necessary in order to make the statements contained therein, in light of the circumstances under which they were made, not materially misleading. Any management projections or forward-looking statements included in the Lender Presentation are based on assumptions and estimates developed by management of the Company in good faith and management believes such assumption and estimates to be reasonable as of the date of the Lender Presentation. Whether or not such projections or forward looking statements are in fact achieved will depend upon future events some of which are not within the control of the Company. Accordingly, actual results may vary from the projections and such variations may be material. The projections included in the Lender Presentation should not be regarded as a representation by the Company or its management that the projected results will be achieved. The Company represents and warrants that the information contained in the Lender Presentation is either information that is publicly available or not material information (although it may be sensitive and proprietary) with respect to the Company or its securities for purposes of United States federal and state securities laws. We request that you distribute the Lender Presentation to such financial institutions as you may deem appropriate to include in the Facility. We agree that we will rely on, and that you are authorized to rely on, the undertakings, acknowledgments and agreements contained in the Notice to and Undertaking by Recipients accompanying the Lender Presentation or otherwise acknowledged by recipients of the Lender Presentation. Yours sincerely, For and on behalf of Century Casinos, Inc. Erwin Haitzmann, CEO 1
Disclaimer CENTURY CASINOS This presentation contains certain “forward-looking statements” within the meaning of Section 27A of the Securities Act of 1933, as amended, Section 21E of the Securities Exchange Act of 1934, as amended, and the Private Securities Litigation Reform Act of 1995. Forward-looking statements may be identified by words such as “expect,” “anticipate,” “believe,” “intend,” “estimate,” “plan,” “target,” “goal,” or similar expressions, or future or conditional verbs such as “will,” “may,” “might,” “should,” “would,” “could,” or similar variations. These statements are based on the beliefs and assumptions of the management of Century Casinos based on information currently available to management. Such forward-looking statements include, but are not limited to, certain plans, expectations, goals, projections, and statements about the benefits of the transaction, as well as Century Casinos’ plans, objectives, expectations, intentions, and other statements relating to cash flow and operating results, a new credit facility and debt repayment; the possibility that the transaction does not close when expected or at all because conditions to closing are not satisfied on a timely basis or at all; potential adverse reactions or changes to business or employee relationships, including those resulting from the completion of the transaction; the possibility that the anticipated benefits of the transaction are not realized when expected or at all. Such forward-looking statements are subject to risks, uncertainties and other factors that could cause actual results to differ materially from future results expressed or implied by such forward-looking statements. Important factors that could cause actual results to differ materially from forward-looking statements include, among others, risks described in the section entitled “Risk Factors” under Item 1A in the Company’s Annual Report on Form 10-K for the year ended December 31, 2021, and in subsequent periodic and current SEC filings the Company may make. Century Casinos disclaims any obligation to revise or update any forward-looking statement that may be made from time to time by it or on its behalf. The Company obtained the industry, market and competitive position data used in this presentation from (i) its own internal estimates and research of third-party company websites and other sources, (ii) industry and general publications and research or (iii) studies and surveys conducted by third parties. Such sources generally do not guarantee the accuracy or completeness of included information. While the Company believes that the information included in this presentation from such publications, research, studies, surveys and websites is reliable, it has not independently verified data from these third-party sources. While the Company believes its internal estimates and research are reliable, neither such estimates and research nor such definitions have been verified by any independent source. 2
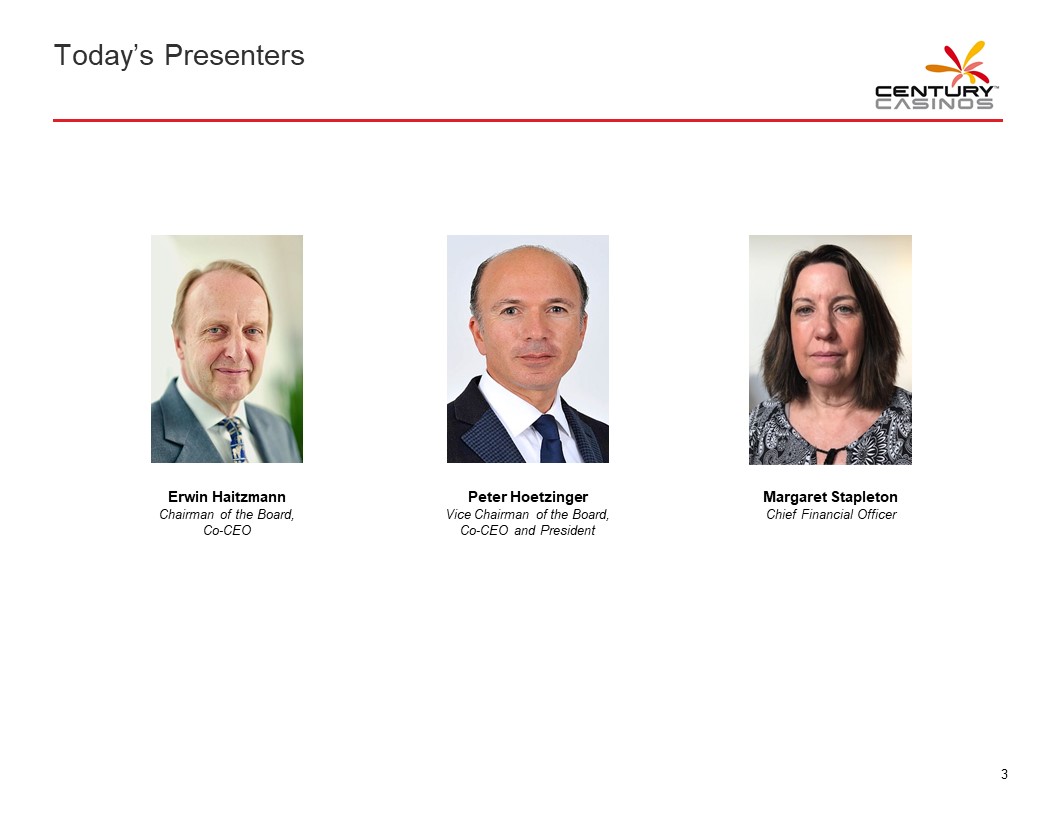
Today’s Presenters CENTURY CASINOS Erwin Haitzmann Chairman of the Board, Co-CEO Peter Hoetzinger Vice Chairman of the Board, Co-CEO and President Margaret Stapleton Chief Financial Officer 3
Agenda CENTURY CASINOS 1 Transaction Overview 2 Century at a Glance 3 The Nugget Casino Resort Overview 4 Key Credit Highlights 5 Financial Overview 6 Appendix 4
1 TRANSACTION OVERVIEW CENTURY CASINOS
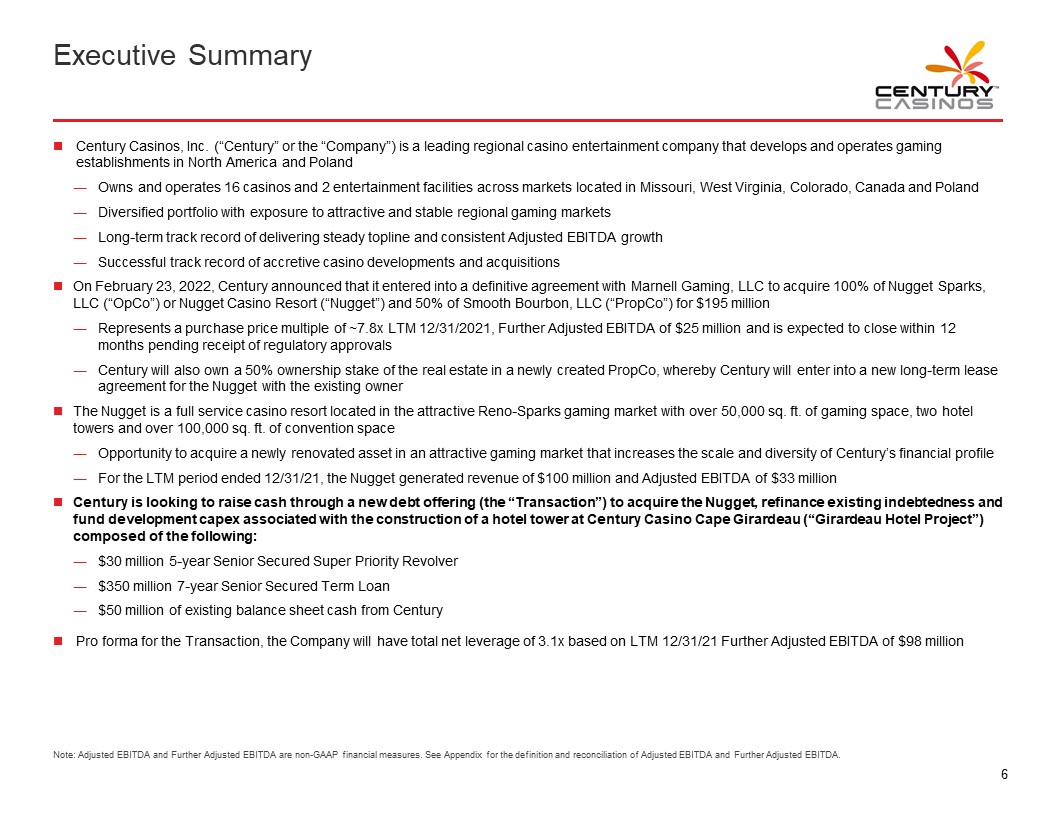
Executive Summary CENTURY CASINOS • Century Casinos, Inc. (“Century” or the “Company”) is a leading regional casino entertainment company that develops and operates gaming establishments in North America and Poland - Owns and operates 16 casinos and 2 entertainment facilities across markets located in Missouri, West Virginia, Colorado, Canada and Poland - Diversified portfolio with exposure to attractive and stable regional gaming markets - Long-term track record of delivering steady topline and consistent Adjusted EBITDA growth - Successful track record of accretive casino developments and acquisitions • On February 23, 2022, Century announced that it entered into a definitive agreement with Marnell Gaming, LLC to acquire 100% of Nugget Sparks, LLC (“OpCo”) or Nugget Casino Resort (“Nugget”) and 50% of Smooth Bourbon, LLC (“PropCo”) for $195 million - Represents a purchase price multiple of ~7.8x LTM 12/31/2021, Further Adjusted EBITDA of $25 million and is expected to close within 12 months pending receipt of regulatory approvals - Century will also own a 50% ownership stake of the real estate in a newly created PropCo, whereby Century will enter into a new long-term lease agreement for the Nugget with the existing owner • The Nugget is a full service casino resort located in the attractive Reno-Sparks gaming market with over 50,000 sq. ft. of gaming space, two hotel towers and over 100,000 sq. ft. of convention space - Opportunity to acquire a newly renovated asset in an attractive gaming market that increases the scale and diversity of Century’s financial profile - For the LTM period ended 12/31/21, the Nugget generated revenue of $100 million and Adjusted EBITDA of $33 million • Century is looking to raise cash through a new debt offering (the “Transaction”) to acquire the Nugget, refinance existing indebtedness and fund development capex associated with the construction of a hotel tower at Century Casino Cape Girardeau (“Girardeau Hotel Project”) composed of the following: - $30 million 5-year Senior Secured Super Priority Revolver - $350 million 7-year Senior Secured Term Loan - $50 million of existing balance sheet cash from Century • Pro forma for the Transaction, the Company will have total net leverage of 3.1x based on LTM 12/31/21 Further Adjusted EBITDA of $98 million Note: Adjusted EBITDA and Further Adjusted EBITDA are non-GAAP financial measures. See Appendix for the definition and reconciliation of Adjusted EBITDA and Further Adjusted EBITDA. 6
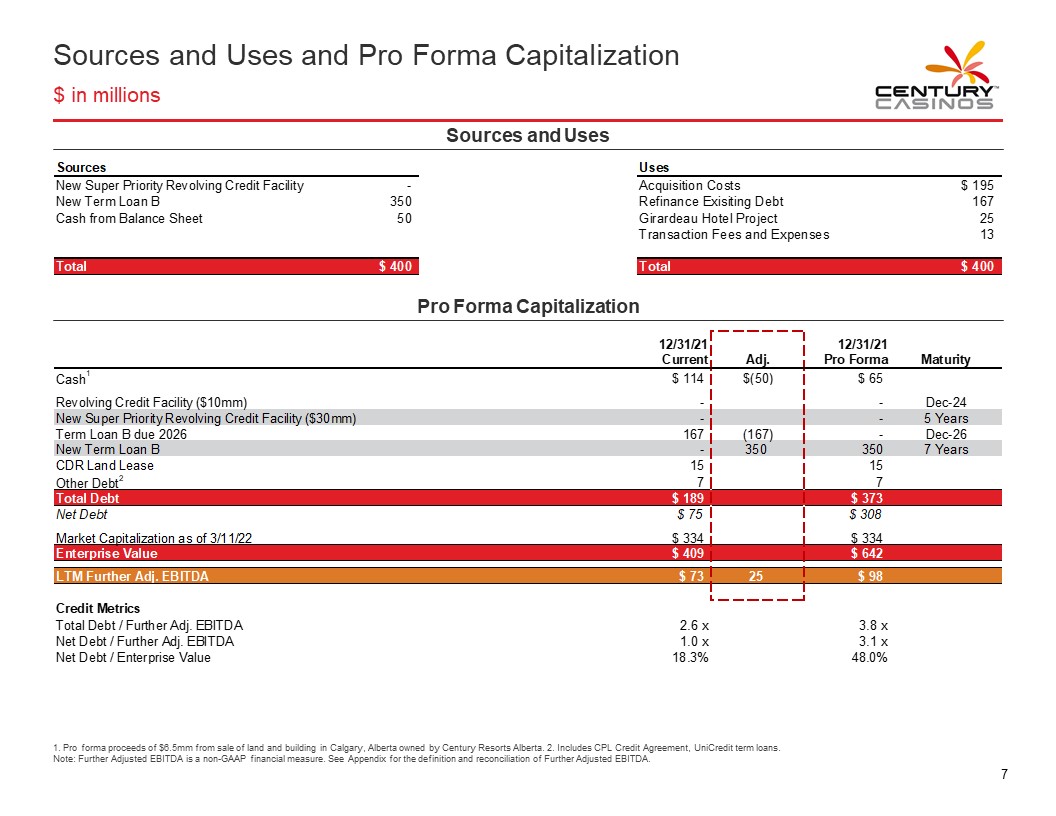
Sources and Uses and Pro Forma Capitalization $ in millions CENTURY CASINOS Sources and Uses Sources New Super Priority Revolving Credit Facility - New Term Loan B 350 Cash from Balance Sheet 50 Uses Acquisition Costs $195 Refinance Exisiting Debt 167 Girardeau Hotel Project 25 Transaction Fees and Expenses 13 Total $400 Pro Forma Capitalization 12/31/21 Current Adj. 12/31/21 Pro Forma Maturity Cash1 $ 114 $(50) $ 65 Revolving Credit Facility ($10mm) - Dec-24 New Super Priority Revolving Credit Facility ($30mm) - - [5 Years] Term Loan B 167 (167) - Dec-26 New Term Loan B – 350 350 [7 Years] CDR Land Lease 15 15 Other Debt2 7 7 Total Debt $ 189 $ 373 Net Debt $ 75 $ 308 Market Capitalization as of 3/11/22 $ 334 $ 334 Enterprise Value $ 409 $ 642 LTM Further Adj. EBITDA $ 73 25 $ 98 Credit Metrics Total Debt / Further Adj. EBITDA 2.6 x 3.8 x Net Debt / Further Adj. EBITDA 1.0 x 3.1 x Net Debt / Enterprise Value 18.3% 48.0% 1. Pro forma proceeds of $6.5mm from sale of land and building in Calgary, Alberta owned by Century Resorts Alberta. 2. Includes CPL Credit Agreement, UniCredit term loans. Note: Further Adjusted EBITDA is a non-GAAP financial measure. See Appendix for the definition and reconciliation of Further Adjusted EBITDA. 7
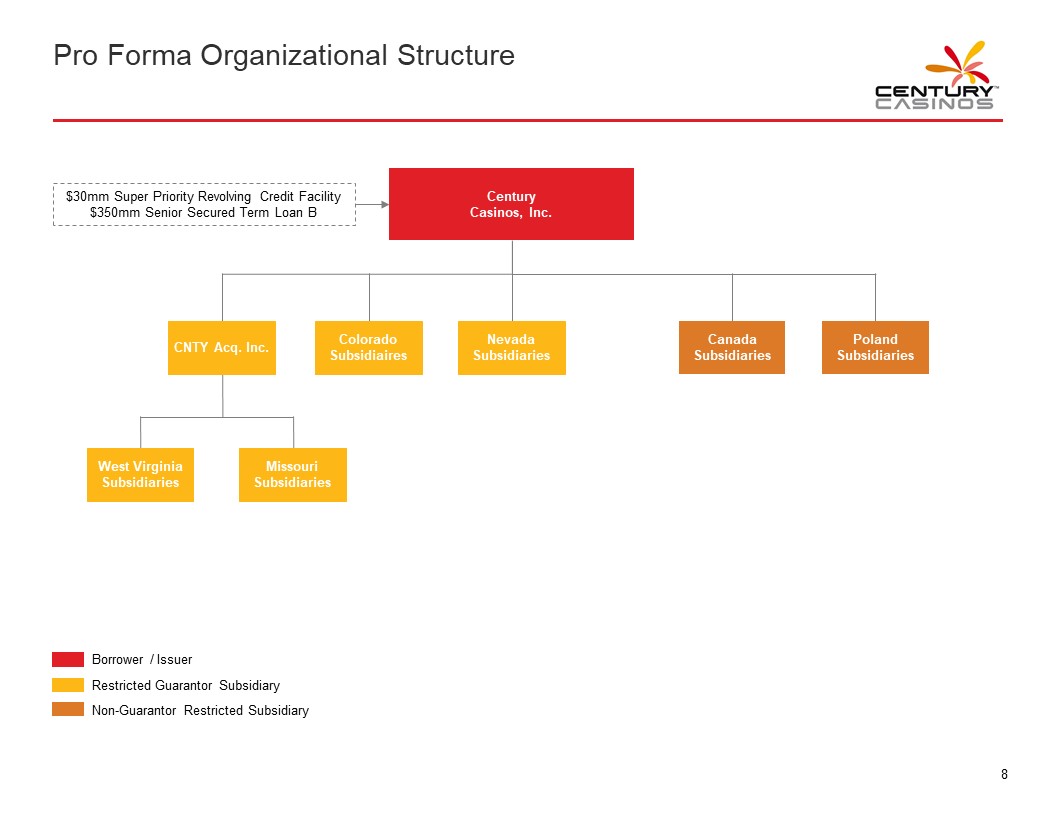
Pro Forma Organizational Structure CENTURY CASINOS $30mm Super Priority Revolving Credit Facility $350mm Senior Secured Term Loan B Century Casinos, Inc. CNTY Acq. Inc. Colorado Subsidiaries Nevada Subsidiaries Canada Subsidiaries Poland Subsidiaries West Virginia Subsidiaries Missouri Subsidiaries Borrower / Issuer Restricted Guarantor Subsidiary Non-Guarantor Restricted Subsidiary 8
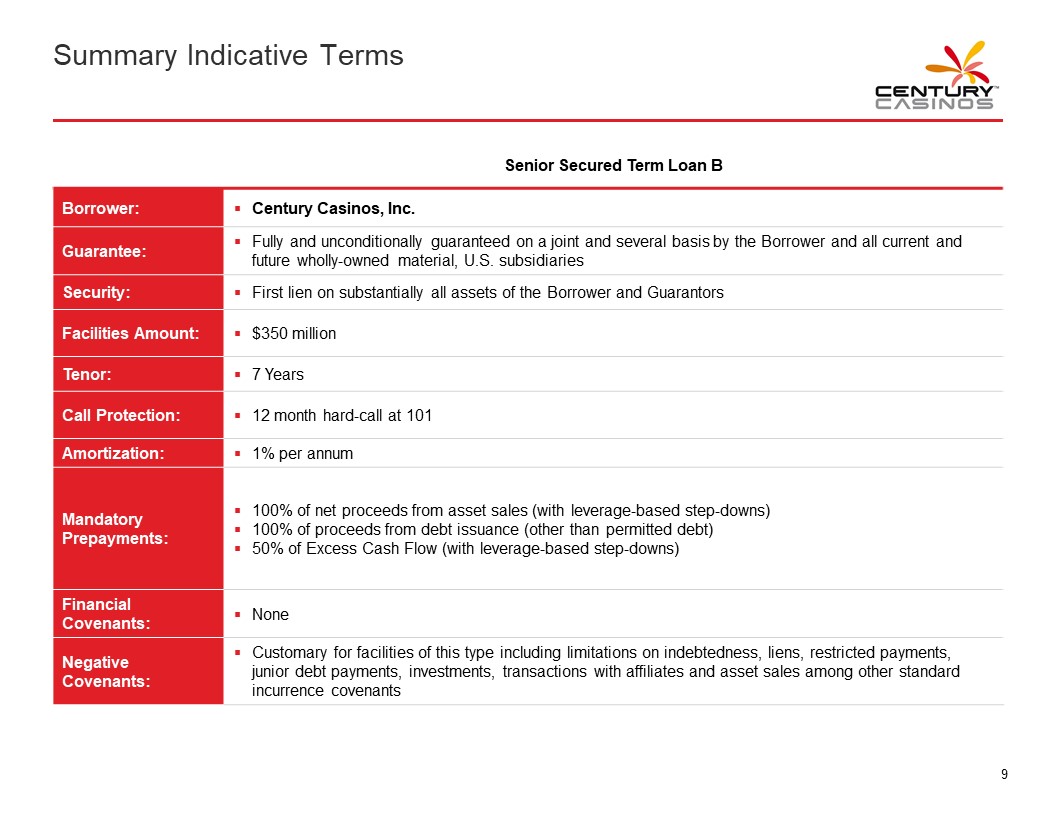
Summary Indicative Terms CENTURY CASINOS Senior Secured Term Loan B Borrower: • Century Casinos, Inc. Guarantee: • Fully and unconditionally guaranteed on a joint and several basis by the Borrower and all current and future wholly-owned material, U.S. subsidiaries Security: • First lien on substantially all assets of the Borrower and Guarantors Facilities Amount: • $350 million Tenor: • 7 Years Call Protection: • 12 month hard-call at 101 Amortization: • 1% per annum Mandatory Prepayments: • 100% of net proceeds from asset sales (with leverage-based step-downs) • 100% of proceeds from debt issuance (other than permitted debt) • 50% of Excess Cash Flow (with leverage-based step-downs) Financial Covenants: • None Negative Covenants: • Customary for facilities of this type including limitations on indebtedness, liens, restricted payments, junior debt payments, investments, transactions with affiliates and asset sales among other standard incurrence covenants 9
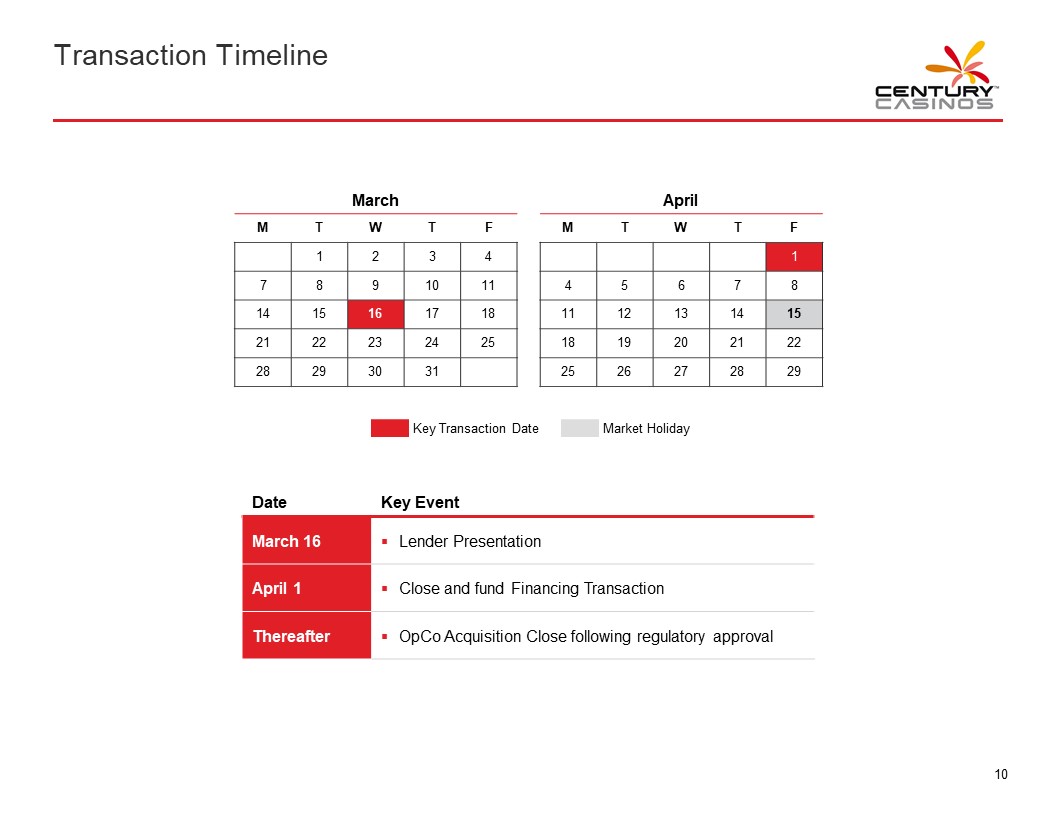
Transaction Timeline CENTURY CASINOS March M T W T F 1 2 3 4 7 8 9 10 11 14 15 16 17 18 21 22 23 24 25 28 29 30 31 April M T W T F 1 4 5 6 7 8 11 12 13 14 15 18 19 20 21 22 25 26 27 28 29 Key Transaction Date Market Holiday Date Key Event March 16 • Lender Presentation April 1 • Close and fund Financing Transaction Thereafter • OpCo Acquisition Close following regulatory approval 10
2 CENTURY AT A GLANCE CENTURY CASINOS
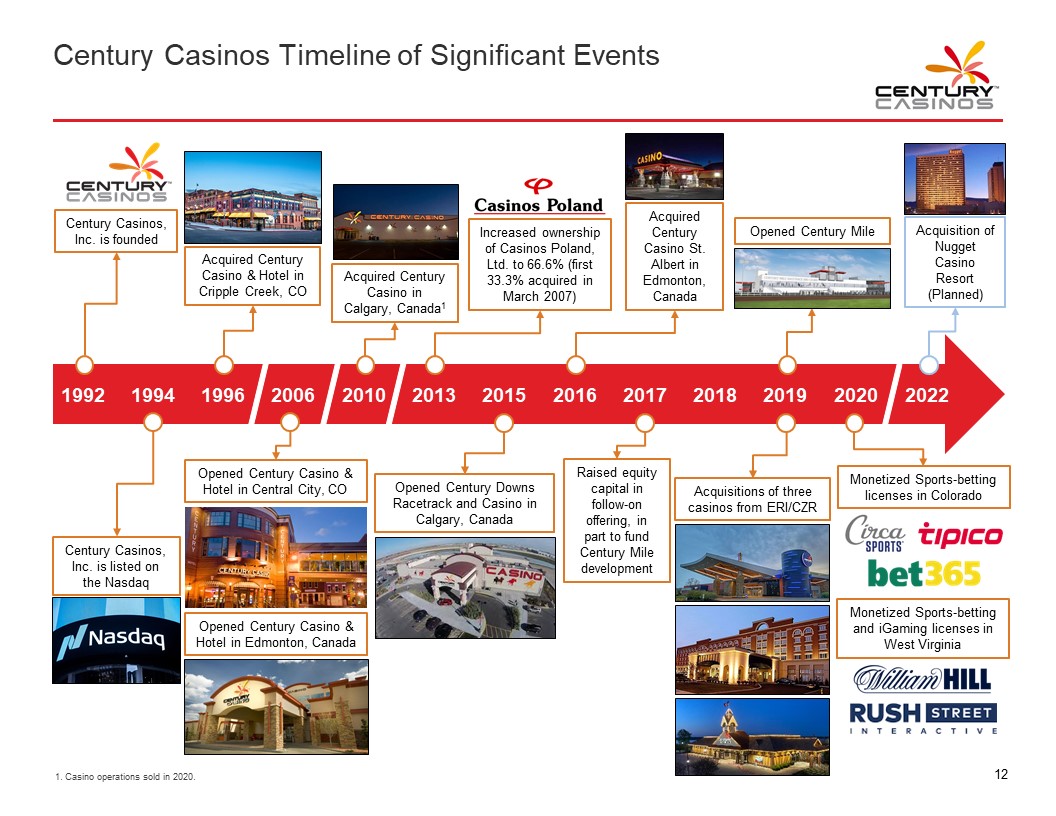
Century Casinos Timeline of Significant Events CENTURY CASINOS 1992 CENTURY CASINOS Century Casino, Inc. is founded 1994 Century Casinos, Inc. is listed on the Nasdaq 1996 Acquired Century Casino & Hotel in Cripple Creek, CO 2006 Opened Century Casinos & Hotel in Central City, CO Opened Century Casino & Hotel in Edmonton, Canada 2010 Acquired Century Casino Calgary, Canada1 2013 Casinos Poland Increased ownership of Casinos Poland, Ltd. to 66.6% (first 33.3% acquired in March 2007) 2015 Opened Century Downs Racetrack and Casino in Calgary, Canada 2016 Acquired Century Casino St. Albert in Edmonton, Canada 2017 Raised equity capital in follow-on offering, in part to fund Century Mile development 2018 2019 Opened Century Mile Acquisition of three casinos from ERI/CZR 2020 Monetized Sports-betting licenses in Colorado Circa SPORTS tipico bet365 Monetized Sports-betting and iGaming licenses in West Virginia William Hill RUSH STREET INTERACTIVE 2022 Acquisition of Nugget Casino Resort (Planned) 1. Casino operations sold in 2020. 12
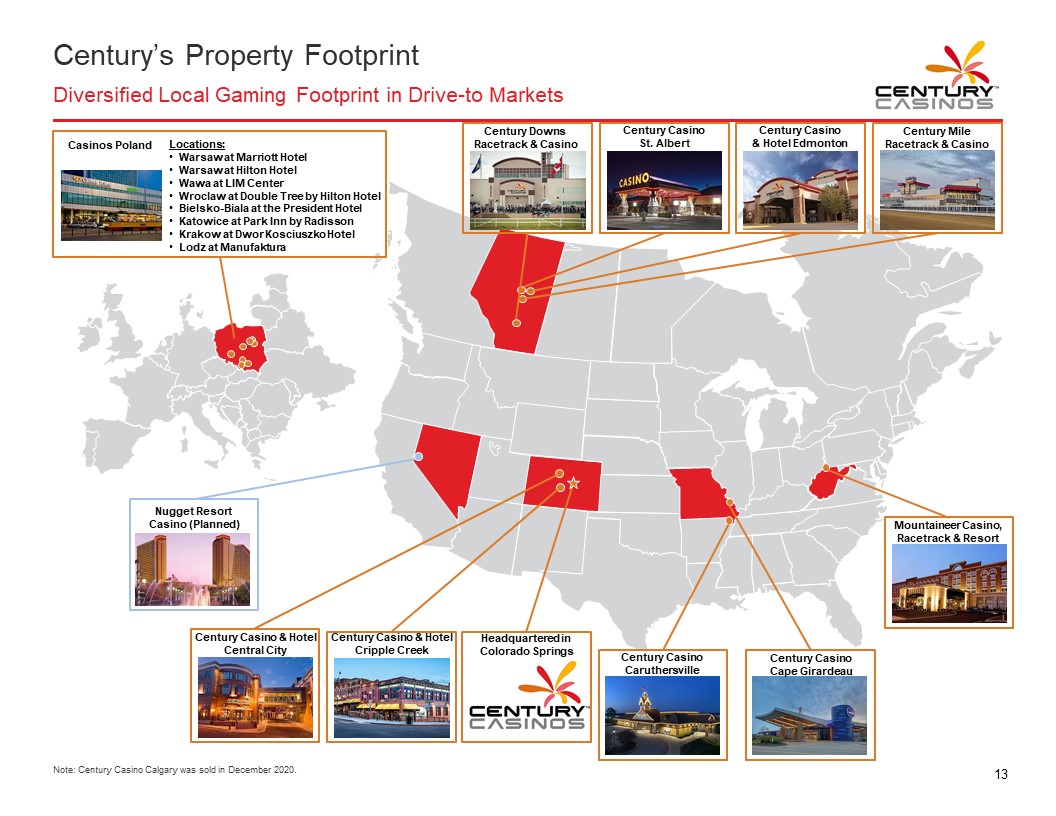
Century’s Property Footprint Diversified Local Gaming Footprint in Drive-to Markets CENTURY CASINOS Casinos Poland Locations: • Warsaw at Marriott Hotel • Warsaw at Hilton Hotel • Warsaw at LIM Center • Wroclaw at Double Tree by Hilton Hotel • Bielsko-Biala at the President Hotel • Katowice at Park Inn by Radisson • Krakow at Dwor Kosciuszko Hotel • Lodz at Manufaktura Century Downs Racetrack & Casino Century Casino St. Albert Century Casino & Hotel Edmonton Century Mile Racetrack & Casino Nugget Resort Casino (Planned) Century Casino & Hotel Central City Century Casino & Hotel Cripple Creek Headquartered in Colorado Springs Century Casino Caruthersville Century Casino Cape Girardeau Mountaineer Casino, Racetrack & Resort Note: Century Casino Calgary was sold in December 2020. 13
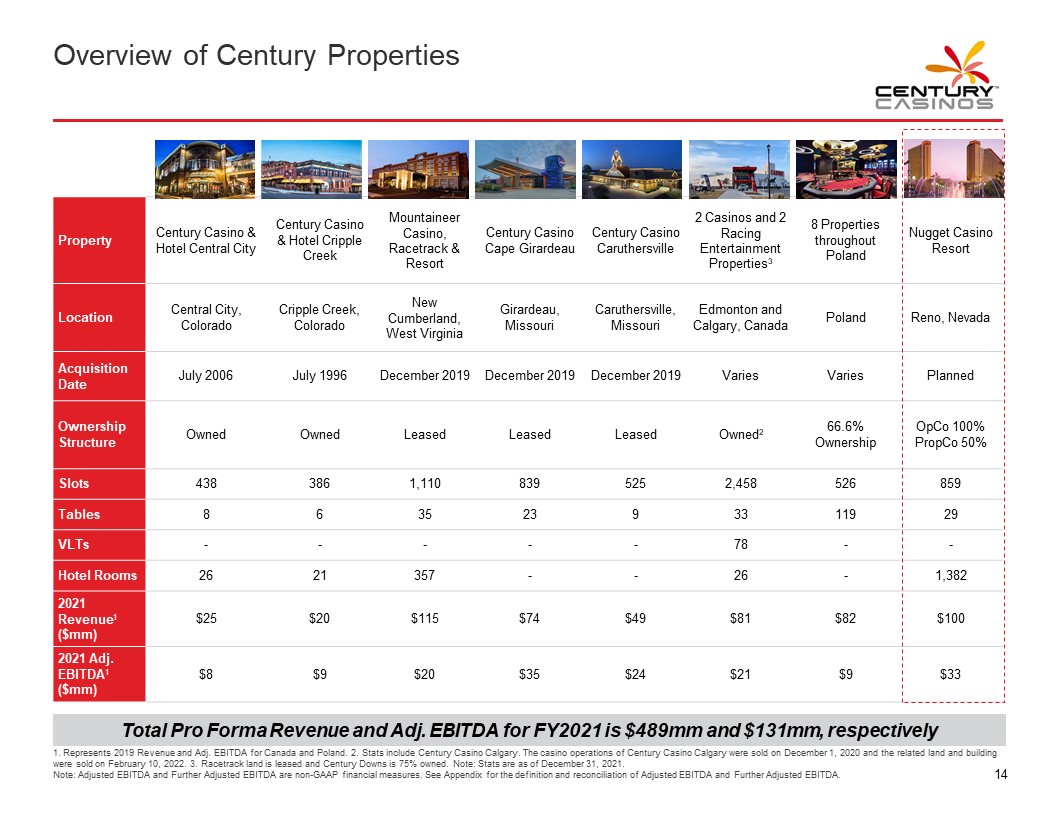
Overview of Century Properties Property Century Casino & Hotel Central City Century Casino & Hotel Cripple Creek Mountaineer Casino, Racetrack & Resort Century Casino Cape Girardeau Century Casino Caruthersville 2 Casinos and 2 Racing Entertainment Properties3 8 Properties throughout Poland Nugget Casino Resort Location Central City, Colorado Cripple Creek, Colorado New Cumberland, West Virginia Girardeau, Missouri Caruthersville, Missouri Edmonton and Calgary, Canada Poland Reno, Nevada Acquisition Date July 2006 July 1996 December 2019 December 2019 December 2019 Varies Varies Planned Ownership Structure Owned Owned Leased Leased Leased Owned2 66.6% Ownership OpCo 100% PropCo 50% Slots 438 386 1,110 839 525 2,458 526 859 Tables 8 6 35 23 9 33 119 29 VLTs - - - - - 78 - - Hotel Rooms 26 21 357 - - 26 - 1,382 2021 Revenue1 ($mm) $25 $20 $115 $74 $49 $81 $82 $100 2021 Adj. EBITDA1 ($mm) $8 $9 $20 $35 $24 $21 $9 $33 Total Pro Forma Revenue and Adj. EBITDA for FY2021 is $489mm and $131mm, respectively 1. Represents 2019 Revenue and Adj. EBITDA for Canada and Poland. 2. Stats include Century Casino Calgary. The casino operations of Century Casino Calgary were sold on December 1, 2020 and the related land and building were sold on February 10, 2022. 3. Racetrack land is leased and Century Downs is 75% owned. Note: Stats are as of December 31, 2021. Note: Adjusted EBITDA and Further Adjusted EBITDA are non-GAAP financial measures. See Appendix for the definition and reconciliation of Adjusted EBITDA and Further Adjusted EBITDA. 14
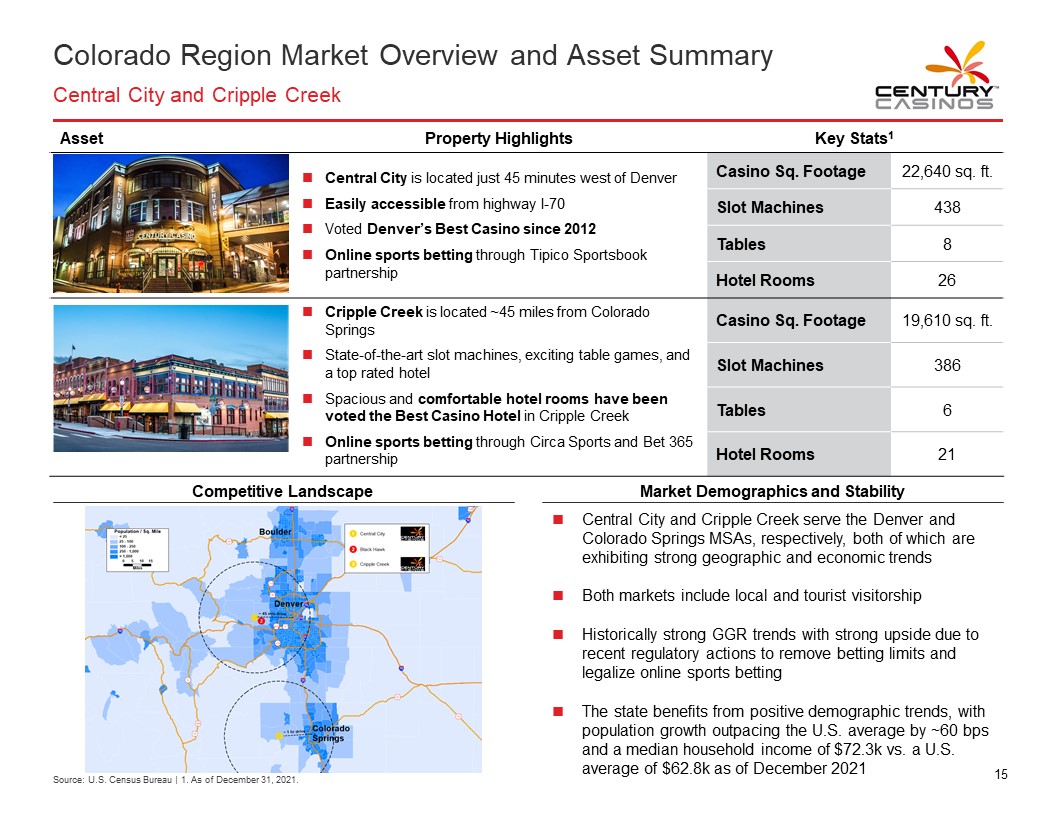
Colorado Region Market Overview and Asset Summary Central City and Cripple Creek CENTURY CASINOS Asset Property Highlights Key Stats1 • Central City is located just 45 minutes west of Denver • Easily accessible from highway I-70 • Voted Denver’s Best Casino since 2012 • Online sports betting through Tipico Sportsbook partnership Casino Sq. Footage 22,640 sq. ft. Slot Machines 438 Tables 8 Hotel Rooms 26 • Cripple Creek is located ~45 miles from Colorado Springs • State-of-the-art slot machines, exciting table games, and a top rated hotel • Spacious and comfortable hotel rooms have been voted the Best Casino Hotel in Cripple Creek • Online sports betting through Circa Sports and Bet 365 partnership Casino Sq. Footage Slot Machines 19,610 sq. ft. Slot Machines 386 Tables 6 Hotel Rooms 21 Competitive Landscape Market Demographics and Stability • Central City and Cripple Creek serve the Denver and Colorado Springs MSAs, respectively, both of which are exhibiting strong geographic and economic trends • Both markets include local and tourist visitorship • Historically strong GGR trends with strong upside due to recent regulatory actions to remove betting limits and legalize online sports betting • The state benefits from positive demographic trends, with population growth outpacing the U.S. average by ~60 bps and a median household income of $72.3k vs. a U.S. average of $62.8k as of December 2021 Source: U.S. Census Bureau | 1. As of December 31, 2021. 15
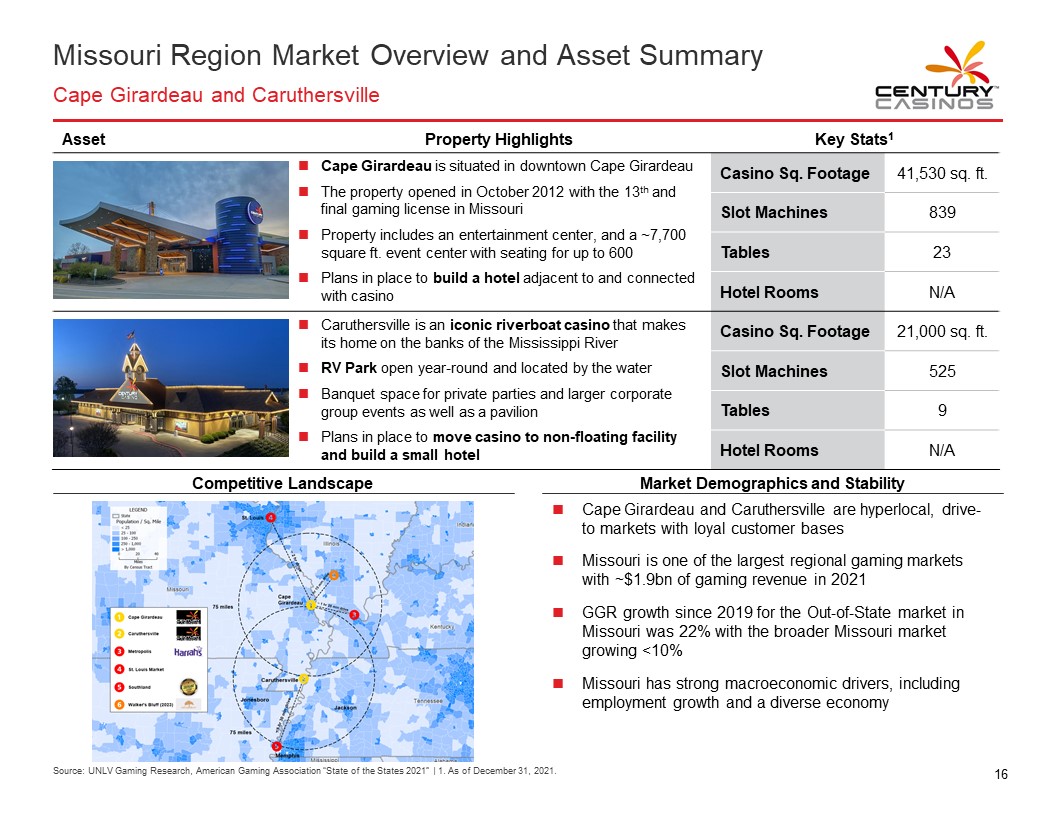
Missouri Region Market Overview and Asset Summary Cape Girardeau and Caruthersville CENTURY CASINO Asset Property Highlights Key Stats1 • Cape Girardeau is situated in downtown Cape Girardeau • The property opened in October 2012 with the 13th and final gaming license in Missouri • Property includes an entertainment center, and a ~7,700 square ft. event center with seating for up to 600 • Plans in place to build a hotel adjacent to and connected with casino Casino Sq. Footage 41,530 sq. ft. Slot Machines 839 Tables 23 Hotel Rooms N/A • Caruthersville is an iconic riverboat casino that makes its home on the banks of the Mississippi River • RV Park open year-round and located by the water • Banquet space for private parties and larger corporate group events as well as a pavilion • Plans in place to move casino to non-floating facility and build a small hotel Casino Sq. Footage 21,000 sq. ft. Slot Machines 525 Tables 9 Hotel Rooms N/A Competitive Landscape Market Demographics and Stability • Cape Girardeau and Caruthersville are hyperlocal, drive-to markets with loyal customer bases • Missouri is one of the largest regional gaming markets with ~$1.9bn of gaming revenue in 2021 • GGR growth since 2019 for the Out-of-State market in Missouri was 22% with the broader Missouri market growing <10% • Missouri has strong macroeconomic drivers, including employment growth and a diverse economy Source: UNLV Gaming Research, American Gaming Association “State of the States 2021” | 1. As of December 31, 2021. 16
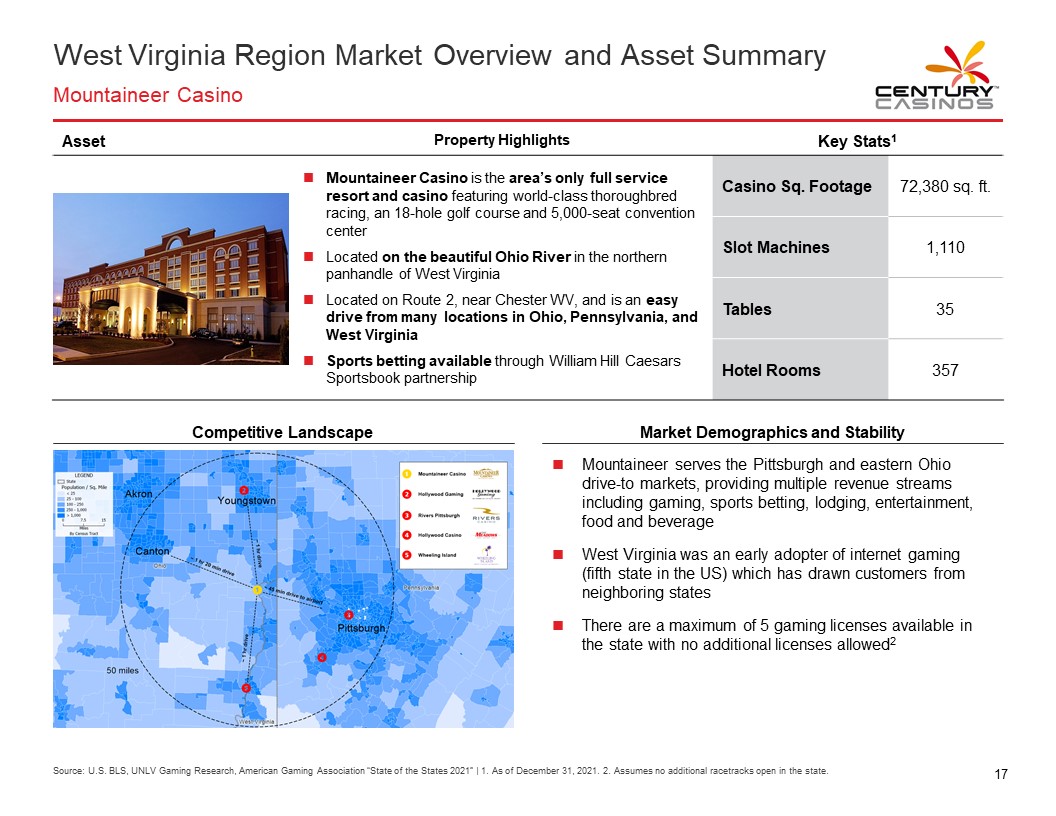
West Virginia Region Market Overview and Asset Summary Mountaineer Casino CENTURY CASINOS Asset Property Highlights Key Stats1 • Mountaineer Casino is the area’s only full service resort and casino featuring world-class thoroughbred racing, an 18-hole golf course and 5,000-seat convention center • Located on the beautiful Ohio River in the northern panhandle of West Virginia • Located on Route 2, near Chester WV, and is an easy drive from many locations in Ohio, Pennsylvania, and West Virginia • Sports betting available through William Hill Caesars Sportsbook partnership Casino Sq. Footage 72,380 sq. ft. Slot Machines 1,110 Tables 35 Hotel Rooms 357 Competitive Landscape Market Demographics and Stability • Mountaineer serves the Pittsburgh and eastern Ohio drive-to markets, providing multiple revenue streams including gaming, sports betting, lodging, entertainment, food and beverage • West Virginia was an early adopter of internet gaming (fifth state in the US) which has drawn customers from neighboring states • There are a maximum of 5 gaming licenses available in the state with no additional licenses allowed2 Source: U.S. BLS, UNLV Gaming Research, American Gaming Association “State of the States 2021” | 1. As of December 31, 2021. 2. Assumes no additional racetracks open in the state. 17
3 THE NUGGET CASINO RESORT OVERVIEW CENTURY CASINOS
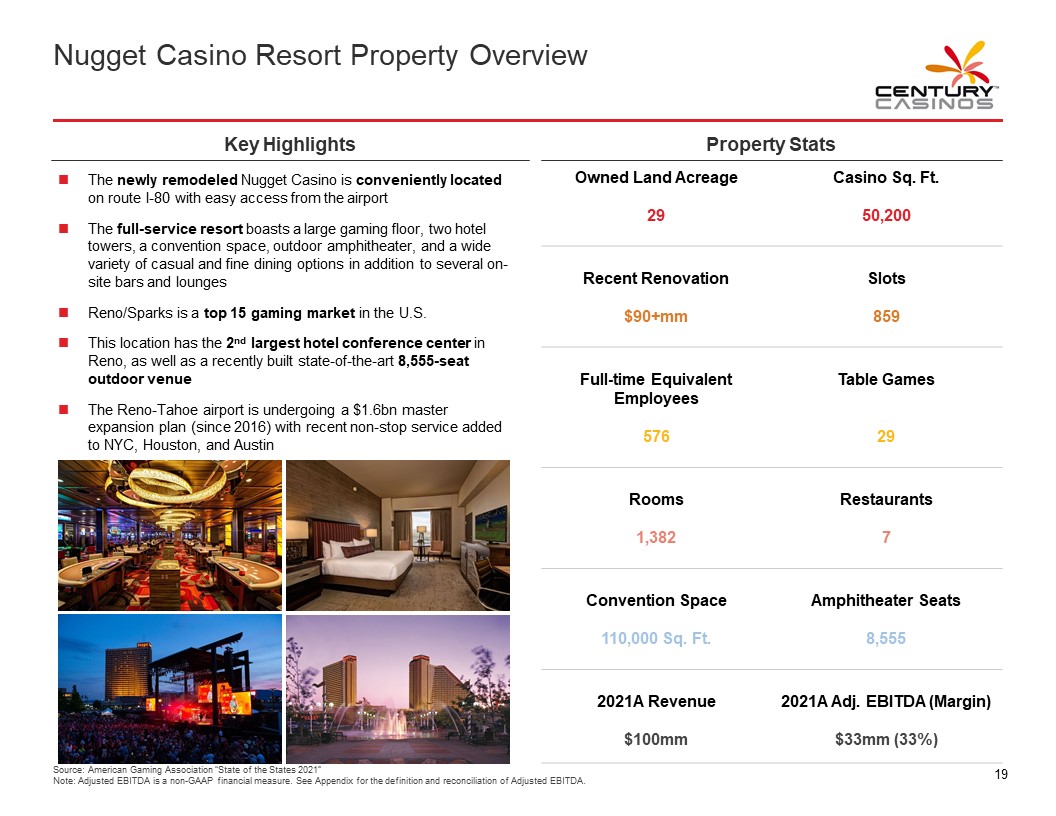
Nugget Casino Resort Property Overview Key Highlights Property Stats • The newly remodeled Nugget Casino is conveniently located on route I-80 with easy access from the airport • The full-service resort boasts a large gaming floor, two hotel towers, a convention space, outdoor amphitheater, and a wide variety of casual and fine dining options in addition to several on-site bars and lounges • Reno/Sparks is a top 15 gaming market in the U.S. • This location has the 2nd largest hotel conference center in Reno, as well as a recently built state-of-the-art 8,555-seat outdoor venue • The Reno-Tahoe airport is undergoing a $1.6bn master expansion plan (since 2016) with recent non-stop service added to NYC, Houston, and Austin Owned Land Acreage 29 Casino Sq. Ft. 50,200 Recent Renovation $90+mm Slots 859 Full-time Equivalent Employees 576 Table Games 29 Rooms 1,382 Restaurants 7 Convention Space 110,000 Sq. Ft. Amphitheater Seats 8,555 2021A Revenue $100mm 2021A Adj. EBITDA (Margin) $33mm (33%) Source: American Gaming Association “State of the States 2021” Note: Adjusted EBITDA is a non-GAAP financial measure. See Appendix for the definition and reconciliation of Adjusted EBITDA. 19
.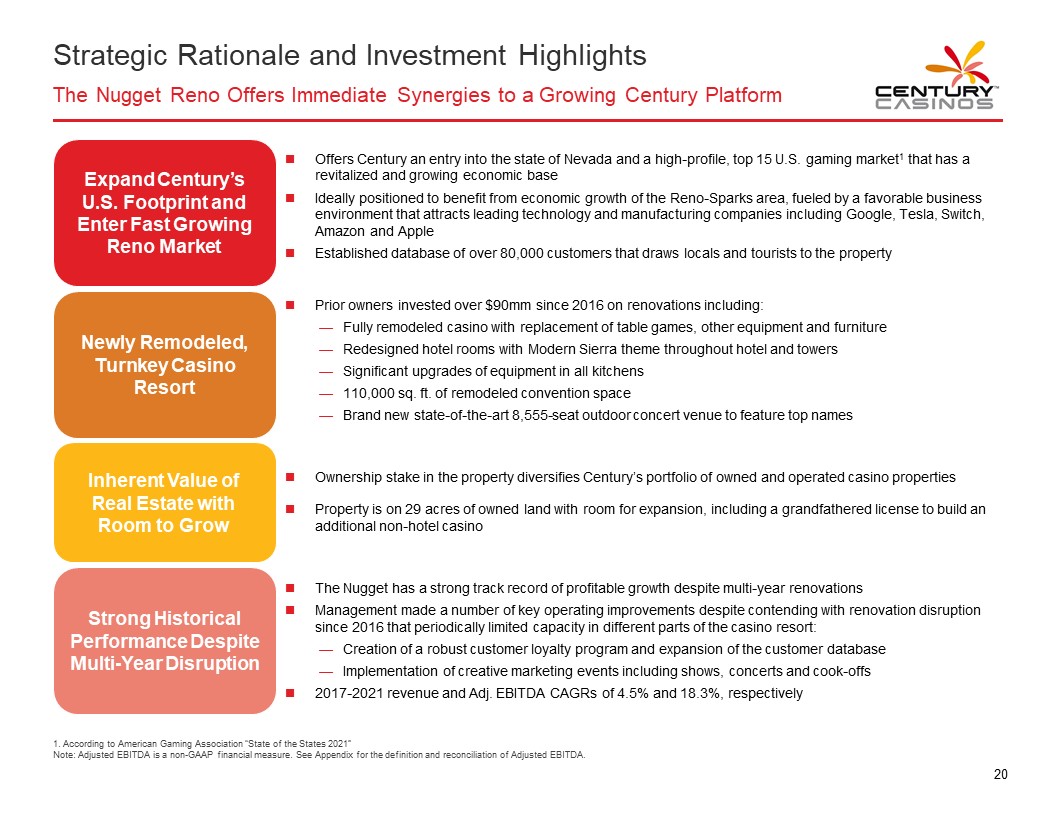
Strategic Rationale and Investment Highlights The Nugget Reno Offers Immediate Synergies to a Growing Century Platform CENTURY CASINOS Expand Century's U.S. Footprint and Enter Fast Growing Reno Market • Offers Century an entry into the state of Nevada and a high-profile, top 15 U.S. gaming market1 that has a revitalized and growing economic base • Ideally positioned to benefit from economic growth of the Reno-Sparks area, fueled by a favorable business environment that attracts leading technology and manufacturing companies including Google, Tesla, Switch, Amazon and Apple • Established database of over 80,000 customers that draws locals and tourists to the property Newly Remodeled, Turnkey Casino Resort • Prior owners invested over $90mm since 2016 on renovations including: — Fully remodeled casino with replacement of table games, other equipment and furniture — Redesigned hotel rooms with Modern Sierra theme throughout hotel and towers — Significant upgrades of equipment in all kitchens — 110,000 sq. ft. of remodeled convention space — Brand new state-of-the-art 8,555-seat outdoor concert venue to feature top names Inherent Value of Real Estate with Room to Grow • Ownership stake in the property diversifies Century’s portfolio of owned and operated casino properties • Property is on 29 acres of owned land with room for expansion, including a grandfathered license to build an additional non-hotel casino Strong Historical Performance Despite Multi-Year Disruption • The Nugget has a strong track record of profitable growth despite multi-year renovations • Management made a number of key operating improvements despite contending with renovation disruption since 2016 that periodically limited capacity in different parts of the casino resort: — Creation of a robust customer loyalty program and expansion of the customer database — Implementation of creative marketing events including shows, concerts and cook-offs • 2017-2021revenue and Adj. EBITDA CAGRs of 4.5% and 18.3%, respectively 1. According to American Gaming Association “State of the States 2021” Note: Adjusted EBITDA is a non-GAAP financial measure. See Appendix for the definition and reconciliation of Adjusted EBITDA. 20
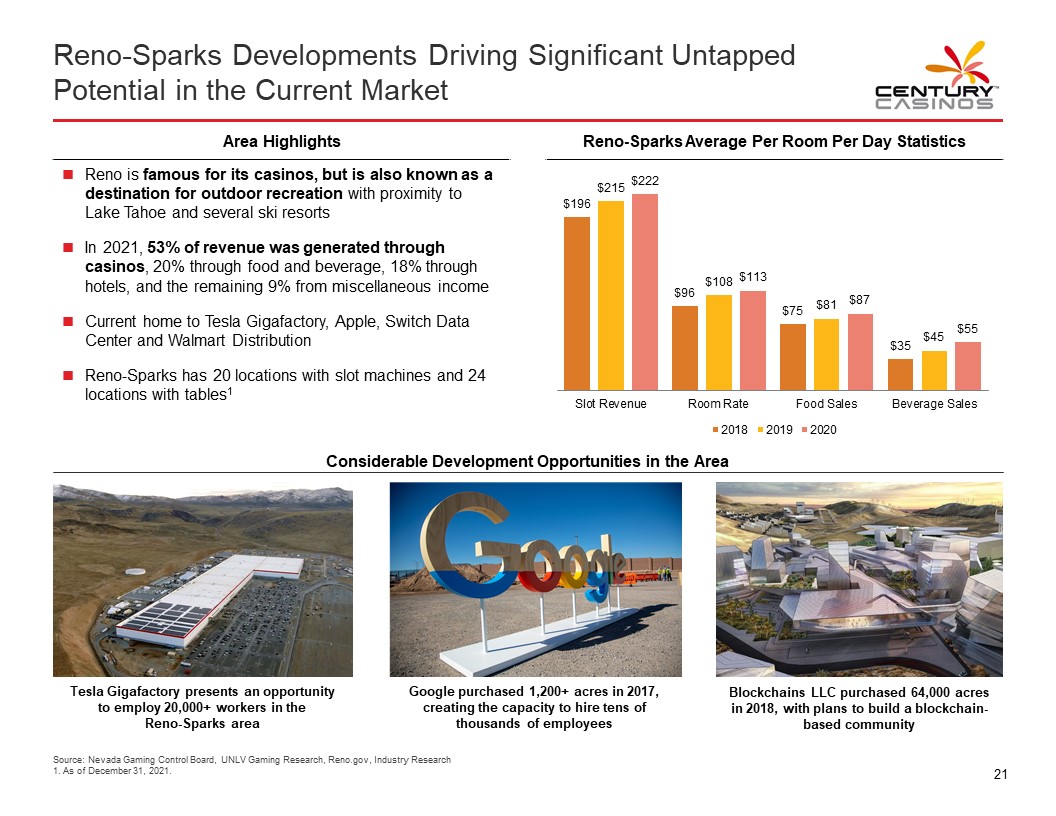
Reno-Sparks Developments Driving Significant Untapped Potential in the Current Market CENTURY CASINOS Area Highlights Reno-Sparks Average Per Room Per Day Statistics • Reno is famous for its casinos, but is also known as a destination for outdoor recreation with proximity to Lake Tahoe and several ski resorts • In 2021, 53% of revenue was generated through casinos, 20% through food and beverage, 18% through hotels, and the remaining 9% from miscellaneous income • Current home to Tesla Gigafactory, Apple, Switch Data Center and Walmart Distribution • Reno-Sparks has 20 locations with slot machines and 24 locations with tables1 $196 $215 $222 Slot Revenue $96 $108 $113 Room Rate $75 $81 $87 Food Sales $35 $45 $55 Beverage Sales 2018 2019 2020 Considerable Development Opportunities in the Area
Tesla Gigafactory presents an opportunity to employ 20,000+ workers in the Reno-Sparks area Google purchased 1,200+ acres in 2017, creating the capacity to hire tens of thousands of employees Blockchains LLC purchased 64,000 acres in 2018, with plans to build a blockchain-based community Source: Nevada Gaming Control Board, UNLV Gaming Research, Reno.gov, Industry Research 1. As of December 31, 2021. 21
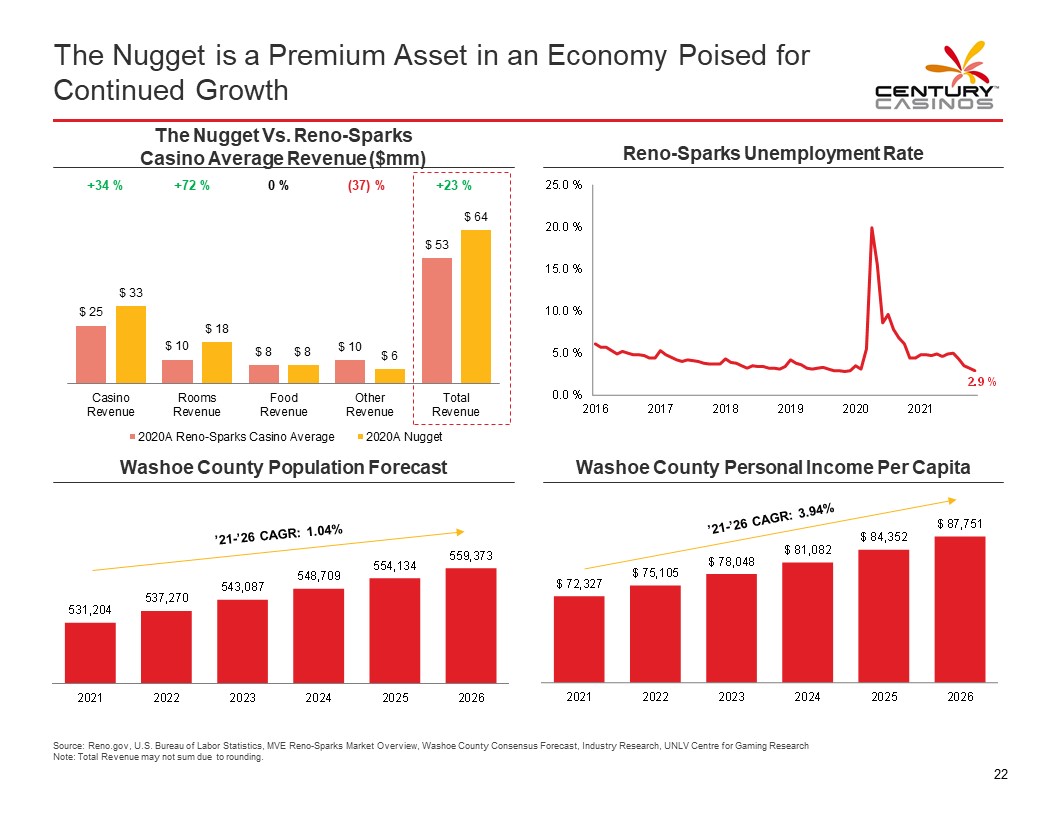
The Nugget is a Premium Asset in an Economy Poised for Continued Growth CENTURY CASINOS The Nugget Vs. Reno-Sparks Casino Average Revenue ($mm) +34 % $25 $33 Casino Revenue +72 % $10 $18 Rooms Revenue 0 % $8 $8 Food Revenue (37)% $10 $6 Other Revenue +23 % $53 $64 Total Revenue 2020A Reno-Sparks Casino Average 2020A Nugget Reno-Sparks Unemployment Rate 25.0 % 20.0 % 15.0 % 10.0 % 5.0 % 0.0 % 2016 2017 2018 2019 2020 2021 2.9 % Washoe County Population Forecast '21-'26 CAGR: 1.04% 531,204 2021 537,270 2022 543,087 2023 548,709 2024 554,134 2025 559,373 2026 Washoe County Personal Income Per Capita '21-'26 CAGR: 3.94% $ 72,327 2021 $ 75,105 2022 $ 78,048 2023 $ 81,082 2024 $ 84,352 2025 $ 87,751 2026 Source: Reno.gov, U.S. Bureau of Labor Statistics, MVE Reno-Sparks Market Overview, Washoe County Consensus Forecast, Industry Research, UNLV Centre for Gaming Research Note: Total Revenue may not sum due to rounding. 22
4 KEY CREDIT HIGHLIGHTS CENTURY CASINOS
Key Credit Highlights CENTURY CASINOS 1 Diverse regional exposure in stable, mature gaming markets 2 Broad geographic and asset diversification 3 Long-term operating track record and accretive acquisitions 4 Well-positioned for the next stage of growth 5 Robust liquidity and free cash flow generation 6 Experienced management team with significant gaming operating expertise 24
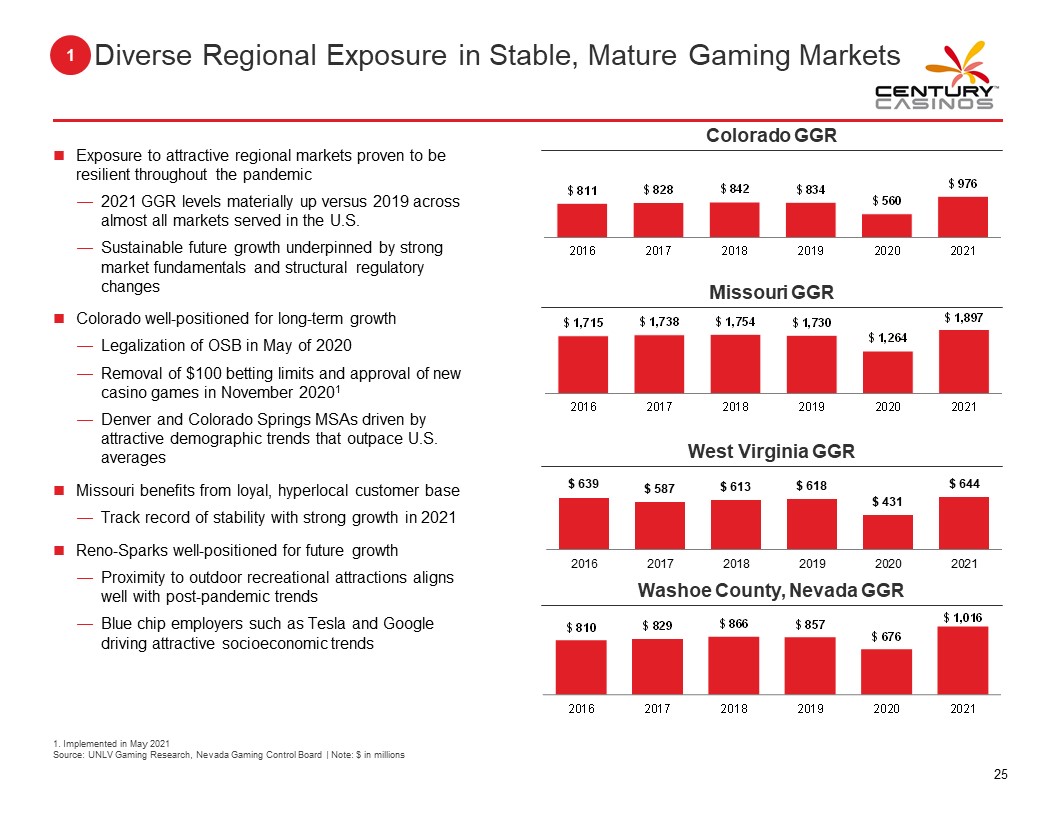
1 Diverse Regional Exposure in Stable, Mature Gaming Markets CENTURY CASINOS • Exposure to attractive regional markets proven to be resilient throughout the pandemic — 2021 GGR levels materially up versus 2019 across almost all markets served in the U.S. — Sustainable future growth underpinned by strong market fundamentals and structural regulatory changes • Colorado well-positioned for long-term growth — Legalization of OSB in May of 2020 — Removal of $100 betting limits and approval of new casino games in November 20201 — Denver and Colorado Springs MSAs driven by attractive demographic trends that outpace U.S. averages • Missouri benefits from loyal, hyperlocal customer base — Track record of stability with strong growth in 2021 • Reno-Sparks well-positioned for future growth — Proximity to outdoor recreational attractions aligns well with post-pandemic trends Washoe County, Nevada GGR — Blue chip employers such as Tesla and Google driving attractive socioeconomic trends Colorado GGR $811 2016 $828 2017 $842 2018 $834 2019 $560 2020 $976 2021 Missouri GGR $1,715 2016 $1,738 2017 $1,754 2018 $1,730 2019 $1,264 2020 $1,897 2021 West Virginia GGR $639 2016 $587 2017 $613 2018 $618 2019 $431 2020 $644 2021 Washoe County, Nevada GGR $810 2016 $829 2017 $866 2018 $857 2019 $676 2020 $1,016 2021 1. Implemented in May 2021 Source: UNLV Gaming Research, Nevada Gaming Control Board | Note: $ in millions 25
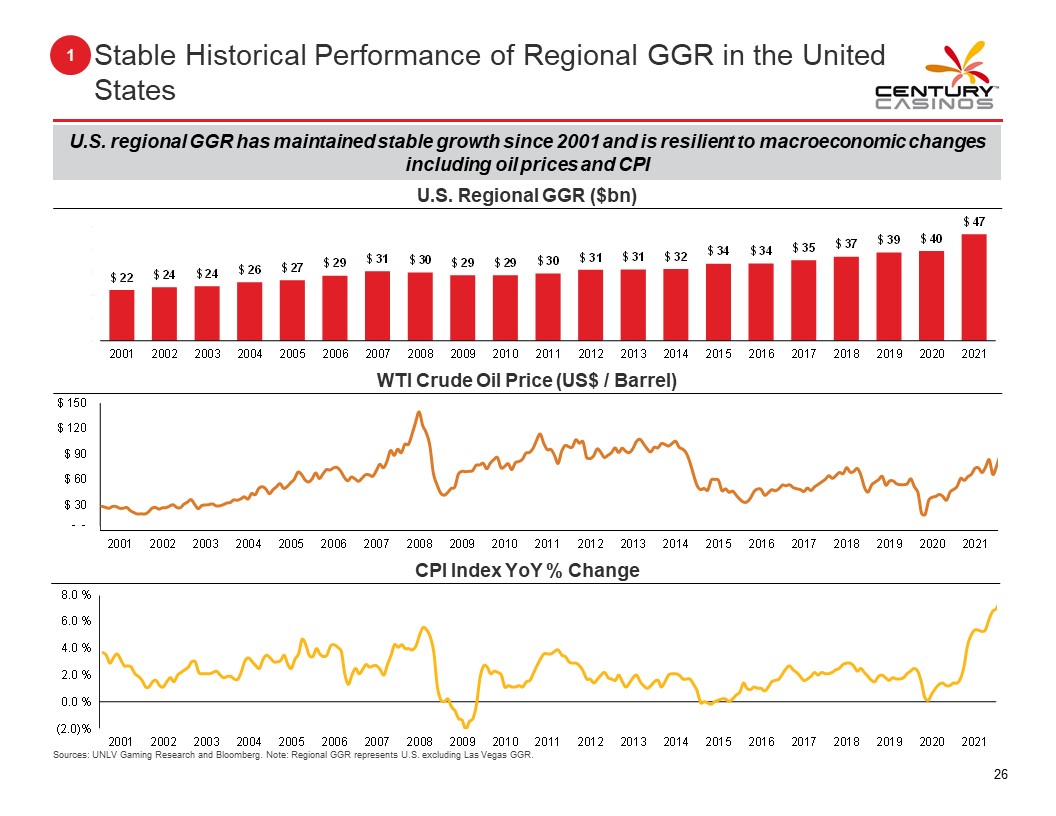
1 Stable Historical Performance of Regional GGR in the United States CENTURY CASINOS U.S. regional GGR has maintained stable growth since 2001 and is resilient to macroeconomic changes including oil prices and CPI U.S. Regional GGR ($bn) $22 2001 $24 2002 $24 2003 $26 2004 $27 2005 $29 2006 $31 2007 $30 2008 $29 2009 $29 2010 $30 2011 $31 2012 $31 2013 $32 2014 $34 2015 $34 2016 $35 2017 $37 2018 $39 2019 $40 2020 $47 2021 WTI Crude Oil Price (US$ / Barrel) $150 $120 $90 $60 $30 2001 2002 2003 2004 2005 2006 2007 2008 2009 2010 2011 2012 2013 2014 2015 2016 2017 2018 2019 2020 2021 CPI Index YoY % Change 8.0 % 6.0 % 4.0 % 2.0 % 0.0 % (2.0)% 2001 2002 2003 2004 2005 2006 2007 2008 2009 2010 2011 2012 2013 2014 2015 2016 2017 2018 2019 2020 2021 Sources: UNLV Gaming Research and Bloomberg. Note: Regional GGR represents U.S. excluding Las Vegas GGR. 26
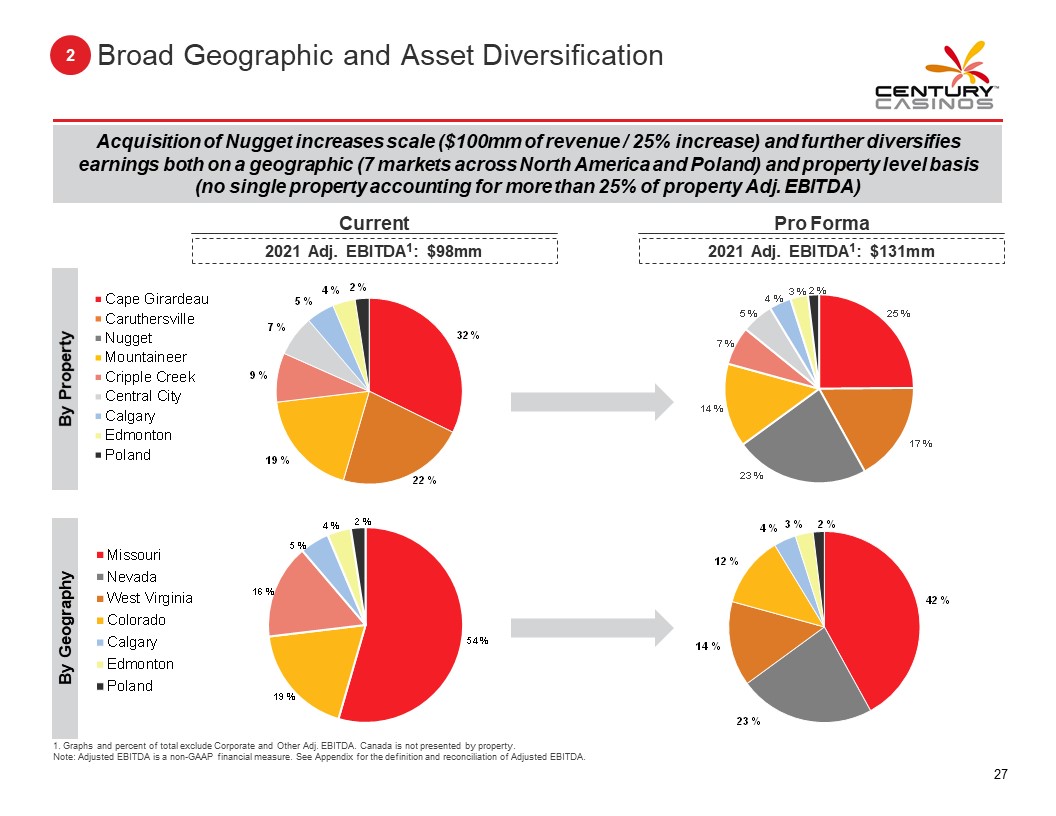
2 Broad Geographic and Asset Diversification CENTURY CASINOS Acquisition of Nugget increases scale ($100mm of revenue / 25% increase) and further diversifies earnings both on a geographic (7 markets across North America and Poland) and property level basis (no single property accounting for more than 25% of property Adj. EBITDA) Current 2021 Adj. EBITDA1: $98mm Pro Forma 2021 Adj. EBITDA1: $131mm By Property Cape Girardeau Caruthersville Nugget Mountaineer Cripple Creek Central City Calgary Edmonton Poland 9% 7% 5% 4% 2% 32% 22% 19% 7% 5% 4% 3% 2% 25% 17% 23% 14% By Geography Missouri Nevada West Virginia Colorado Calgary Edmonton Poland 16% 5% 4% 2% 54% 19% 14% 12% 4% 3% 2% 42% 23% 1. Graphs and percent of total exclude Corporate and Other Adj. EBITDA. Canada is not presented by property. Note: Adjusted EBITDA is a non-GAAP financial measure. See Appendix for the definition and reconciliation of Adjusted EBITDA. 27
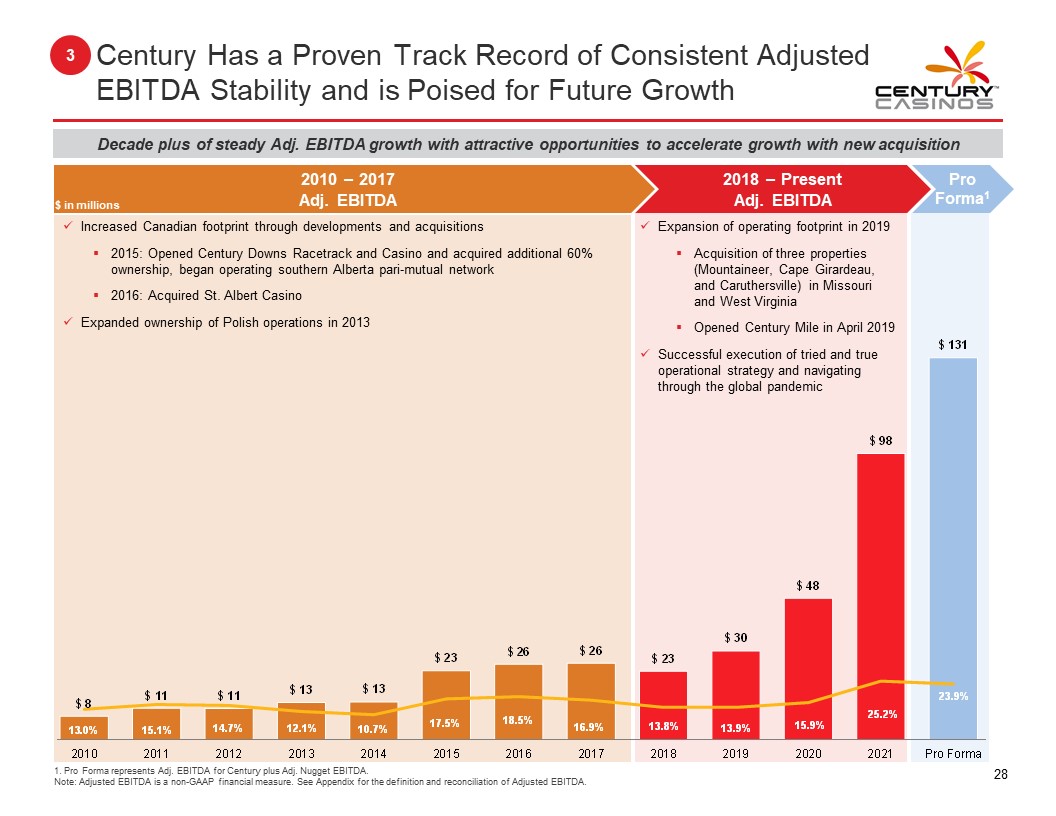
3 Century Has a Proven Track Record of Consistent Adjusted EBITDA Stability and is Poised for Future Growth CENTURY CASINOS Decade plus of steady Adj. EBITDA growth with attractive opportunities to accelerate growth with new acquisition $ in millions 2010-2017 Adj. EBITDA • Increased Canadian footprint through developments and acquisitions • 2015: Opened Century Downs Racetrack and Casino and acquired additional 60% ownership, began operating southern Alberta pari-mutual network • 2016: Acquired St. Albert Casino • Expanded ownership of Polish operations in 2013 $8 13.0% 2010 $11 15.1% 2011 $11 14.7% 2012 $13 12.1% 2013 $13 10.7% 2014 $23 17.5% 2015 $26 18.5% 2016 $26 16.9% 2017 2018-Present Adj. EBITDA • Expansion of operating footprint in 2019 • Acquisition of three properties (Mountaineer, Cape Girardeau, and Caruthersville) in Missouri and West Virginia • Opened Century Mile in April 2019 • Successful execution of tried and true operational strategy and navigating through the global pandemic $23 13.8% 2018 $30 13.9% 2019 $48 15.9% 2020 $98 25.2% 2021 Pro Forma1 $131 23.9% Pro Forma 1. Pro Forma represents Adj. EBITDA for Century plus Adj. Nugget EBITDA. Note: Adjusted EBITDA is a non-GAAP financial measure. See Appendix for the definition and reconciliation of Adjusted EBITDA. 28
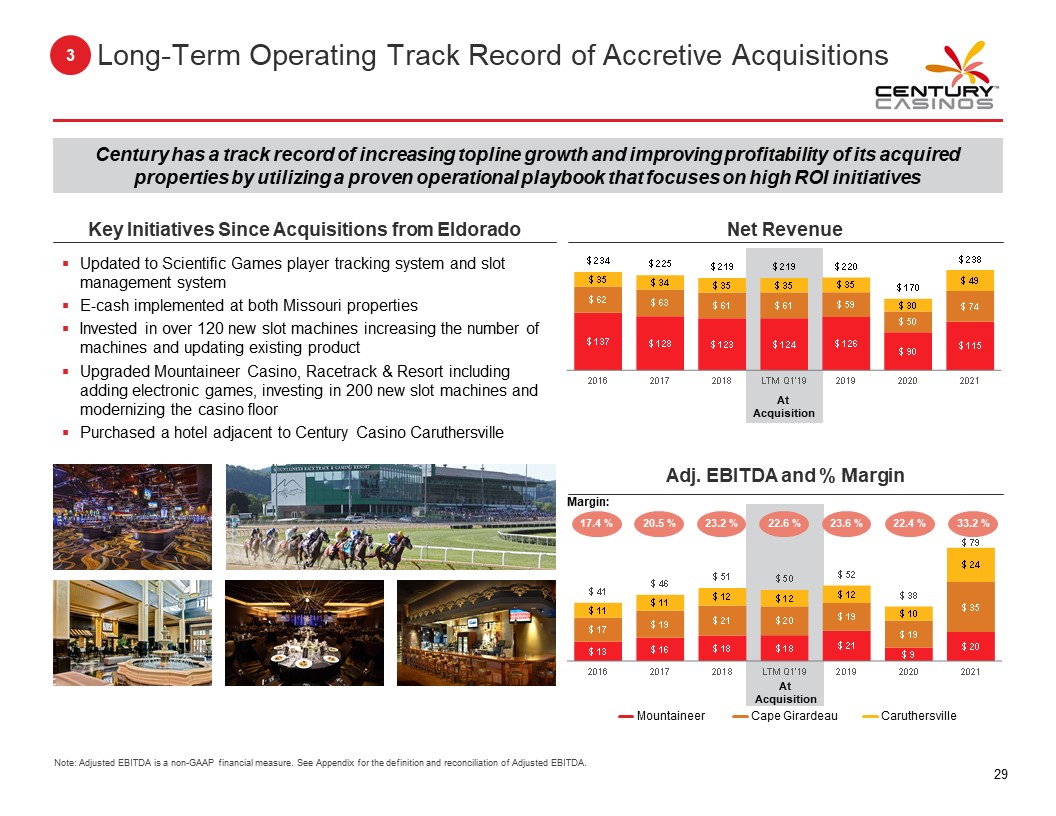
3 Long-Term Operating Track Record of Accretive Acquisitions CENTURY CASINOS Century has a track record of increasing topline growth and improving profitability of its acquired properties by utilizing a proven operational playbook that focuses on high ROI initiatives Key Initiatives Since Acquisitions from Eldorado • Updated to Scientific Games player tracking system and slot management system • E-cash implemented at both Missouri properties • Invested in over 120 new slot machines increasing the number of machines and updating existing product • Upgraded Mountaineer Casino, Racetrack & Resort including adding electronic games, investing in 200 new slot machines and modernizing the casino floor • Purchased a hotel adjacent to Century Casino Caruthersville Net Revenue $234 $35 $62 $137 2016 $225 $34 $63 $128 2017 $219 $35 $61 $123 2018 $219 $35 $61 $124 LTM Q1'19 At Acquisition $220 $35 $59 $126 2019 $170 $30 $50 $90 2020 $238 $49 $74 $115 2021 Adj. EBITDA and % Margin Margin: 17.4% $41 $11 $17 $13 2016 20.5% $46 $11 $19 $16 2017 23.2% $51 $12 $21 $18 2018 22.6% $50 $12 $20 $18 LTM Q1'19 At Acquisition 23.6% $52 $12 $19 $21 2019 22.4% $38 $10 $19 $9 2020 33.2% $79 $24 $35 $20 2021 Mountaineer Cape Girardeau Caruthersville Note: Adjusted EBITDA is a non-GAAP financial measure. See Appendix for the definition and reconciliation of Adjusted EBITDA. 29
4 Century is Well-Positioned for the Next Stage of Growth CENTURY CASINOS Century’s operating expertise has provided opportunities to make targeted and strategic investments that have long-term impact Recently Completed or in-Process Organic Growth Projects • Truing Up mobile app to enhance customer experience, build loyalty, streamline process and reinforce operation efficiency • Partnerships with established iGaming and sports betting operators including Rush Street and William Hill Caesars Sportsbook — Contracts include a minimum guaranteed amount and a revenue share above a set level • Introduction of player loyalty app and web portal across all U.S. properties • In West Virginia, multi-year slot floor upgrade to include adding electronic table games, investing in 200 new slot machines, modernization of the casino floor as well as updating hotel amenities, exterior and food venues — Already completed renovations include improvements to Mountaineer’s slot floor, notably a new VIP area, upgrades to center bar and updating floor layout, upgrades to the sports betting area and relocation of smoking casino section Key Partnerships and Vendors RUSH STREET INTERACTIVE bet365 tipico VICI Circa SPORTS CAESAS SPORTSBOOK BY Wiliam HILL SG SCEINTIFIC GAMES 30
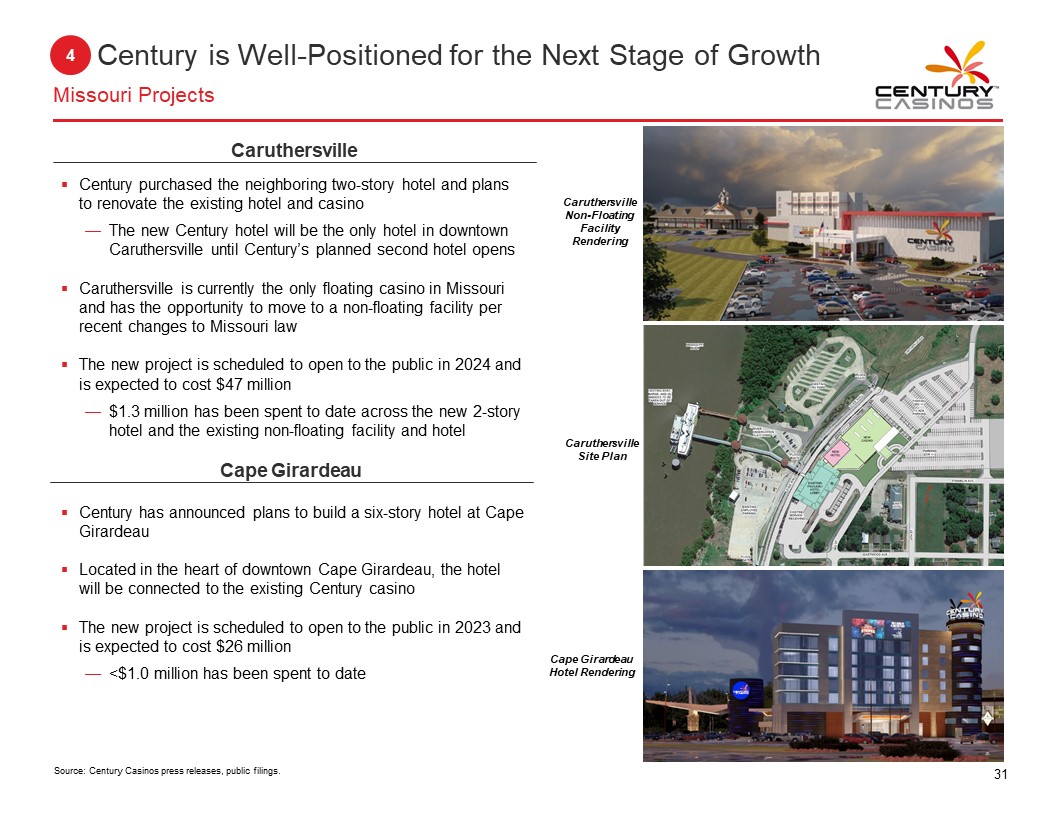
4 Century is Well-Positioned for the Next Stage of Growth Missouri Projects CENTURY CASINOS Caruthersville • Century purchased the neighboring two-story hotel and plans to renovate the existing hotel and casino — The new Century hotel will be the only hotel in downtown Caruthersville until Century’s planned second hotel opens • Caruthersville is currently the only floating casino in Missouri and has the opportunity to move to a non-floating facility per recent changes to Missouri law • The new project is scheduled to open to the public in 2024 and is expected to cost $47 million — $1.3 million has been spent to date across the new 2-story hotel and the existing non-floating facility and hotel Cape Girardeau • Century has announced plans to build a six-story hotel at Cape Girardeau • Located in the heart of downtown Cape Girardeau, the hotel will be connected to the existing Century casino • The new project is scheduled to open to the public in 2023 and is expected to cost $26 million — <$1.0 million has been spent to date Caruthersville Non-Floating Facility Rendering Caruthersville Site Plan Cape Girardeau Hotel Rendering Source: Century Casinos press releases, public filings. 31
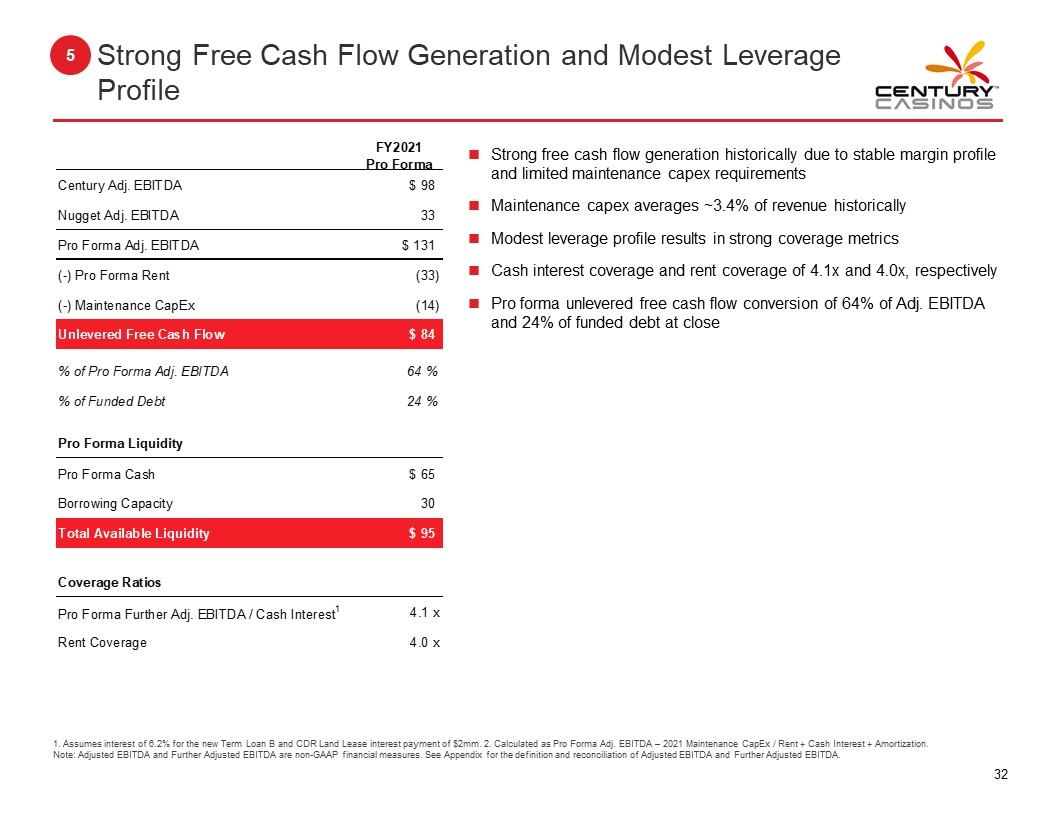
5 Strong Free Cash Flow Generation and Modest Leverage Profile CENTURY CASINOS FY2021 Pro Forma Century Adj. EBITDA $ 98 Nugget Adj. EBITDA 33 Pro Forma Adj. EBITDA $ 131 (-) Pro Forma Rent (33) (-) Maintenance CapEx (14) Unlevered Free Cash Flow $ 84 % of Pro Forma Adj. EBITDA 64 % % of Funded Debt 24 % Pro Forma Liquidity Pro Forma Cash $ 65 Borrowing Capacity 30 Total Available Liquidity $ 95 Coverage Ratios Pro Forma Further Adj. EBITDA / Cash Interest1 4.1 x Rent Coverage 4.0 x • Strong free cash flow generation historically due to stable margin profile and limited maintenance capex requirements • Maintenance capex averages ~3.4% of revenue historically • Modest leverage profile results in strong coverage metrics • Cash interest coverage and rent coverage of 4.1x and 4.0x, respectively • Pro forma unlevered free cash flow conversion of 64% of Adj. EBITDA and 24% of funded debt at close 1. Assumes interest of 6.2% for the new Term Loan B and CDR Land Lease interest payment of $2mm. 2. Calculated as Pro Forma Adj. EBITDA – 2021 Maintenance CapEx / Rent + Cash Interest + Amortization. Note: Adjusted EBITDA and Further Adjusted EBITDA are non-GAAP financial measures. See Appendix for the definition and reconciliation of Adjusted EBITDA and Further Adjusted EBITDA. 32
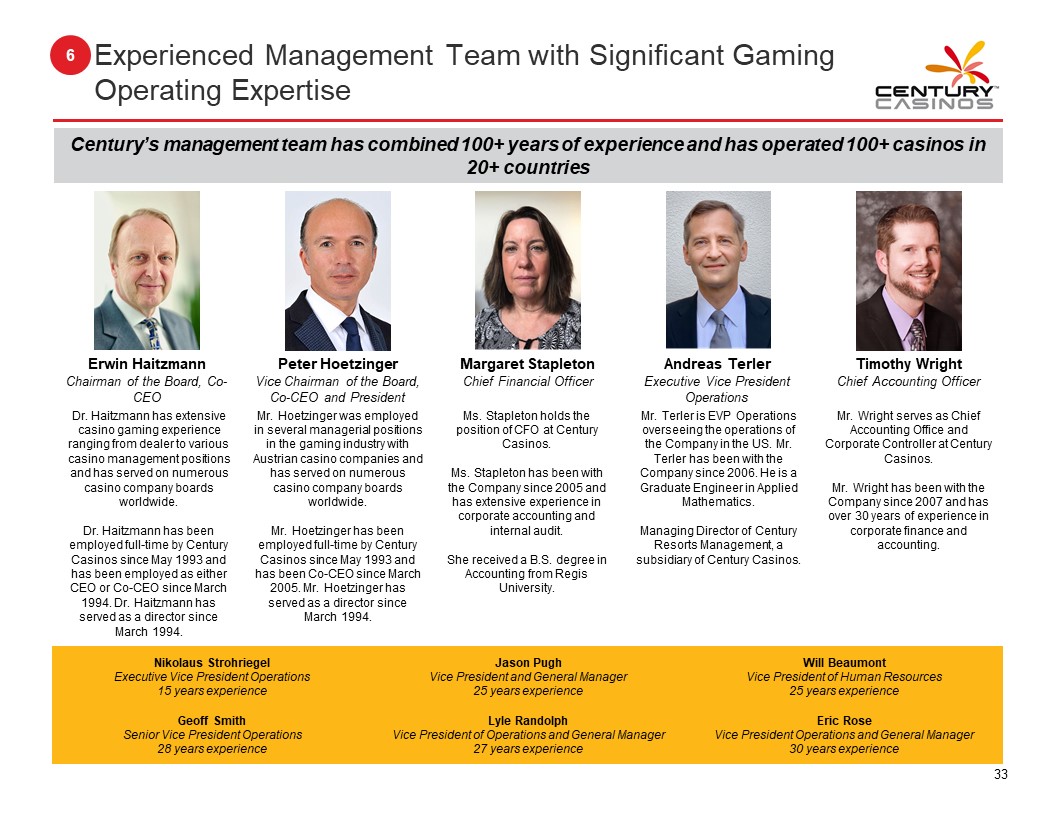
6 Experienced Management Team with Significant Gaming Operating Expertise CENTURY CASINOS Century’s management team has combined 100+ years of experience and has operated 100+ casinos in 20+ countries Erwin Haitzmann Chairman of the Board, Co-CEO Dr. Haitzmann has extensive casino gaming experience ranging from dealer to various casino management positions and has served on numerous casino company boards worldwide. Dr. Haitzmann has been employed full-time by Century Casinos since May 1993 and has been employed as either CEO or Co-CEO since March 1994. Dr. Haitzmann has served as a director since March 1994. Peter Hoetzinger Vice Chairman of the Board, Co-CEO and President Mr. Hoetzinger was employed in several managerial positions in the gaming industry with Austrian casino companies and has served on numerous casino company boards worldwide. Mr. Hoetzinger has been employed full-time by Century Casinos since May 1993 and has been Co-CEO since March 2005. Mr. Hoetzinger has served as a director since March 1994. Margaret Stapleton Chief Financial Officer Ms. Stapleton holds the position of CFO at Century Casinos. Ms. Stapleton has been with the Company since 2005 and has extensive experience in corporate accounting and internal audit. She received a B.S. degree in Accounting from Regis University. Andreas Terler Executive Vice President Operations Mr. Terler is EVP Operations overseeing the operations of the Company in the US. Mr. Terler has been with the Company since 2006. He is a Graduate Engineer in Applied Mathematics. Managing Director of Century Resorts Management, a subsidiary of Century Casinos. Timothy Wright Chief Accounting Officer Mr. Wright serves as Chief Accounting Office and Corporate Controller at Century Casinos. Mr. Wright has been with the Company since 2007 and has over 30 years of experience in corporate finance and accounting. Nikolaus Strohriegel Executive Vice President Operations 15 years experience Geoff Smith Senior Vice President Operations 28 years experience Jason Pugh Vice President and General Manager 25 years experience Lyle Randolph Vice President of Operations and General Manager 27 years experience Will Beaumont Vice President of Human Resources 25 years experience Eric Rose Vice President of Operations and General Manager 30 years experience 33
5 FINANCIAL OVERVIEW CENTURY CASINOS
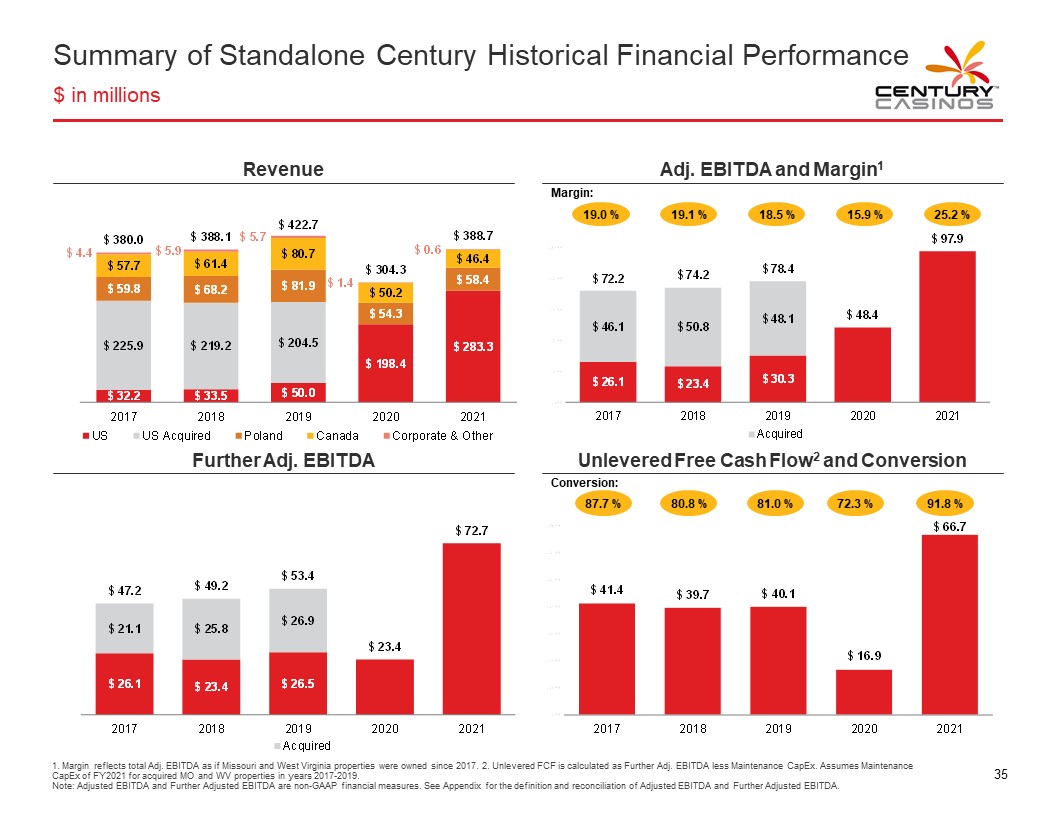
Summary of Standalone Century Historical Financial Performance $ in millions CENTURY CASINOS Revenue $380.0 $4.4 $57.7 $59.8 $225.9 $32.2 2017 $388.1 $5.9 $61.4 $68.2 $219.2 $33.5 2018 $422.7 $5.7 $80.7 $81.9 $204.5 $50.0 2019 $304.3 $1.4 $50.2 $54.3 $198.4 2020 $388.7 $0.6 $46.4 $58.4 $283.3 2021 US US Acquired Poland Canada Corporate & Other Adj. EBITDA and Margin1 Margin: 19.0% $72.2 $46.1 $26.1 2017 19.1% $74.2 $50.8 $23.4 2018 18.5% $78.4 $48.1 $30.3 2019 15.9% $48.4 2020 25.2% $97.9 2021 Acquired Further Adj. EBITDA $47.2 $21.1 $26.1 2017 $49.2 $25. $23.4 2018 $53.4 $26.9 $26.5 2019 $23.4 2020 $72.7 2021 Acquired Unlevered Free Cash Flow2 and Conversion Conversion: 87.7% $41.4 2017 80.8% $39.7 2018 81.0% $40.1 2019 72.3% $16.9 2020 91.8% $66.7 2021 1. Margin reflects total Adj. EBITDA as if Missouri and West Virginia properties were owned since 2017. 2. Unlevered FCF is calculated as Further Adj. EBITDA less Maintenance CapEx. Assumes Maintenance CapEx of FY2021 for acquired MO and WV properties in years 2017-2019. Note: Adjusted EBITDA and Further Adjusted EBITDA are non-GAAP financial measures. See Appendix for the definition and reconciliation of Adjusted EBITDA and Further Adjusted EBITDA. 35
e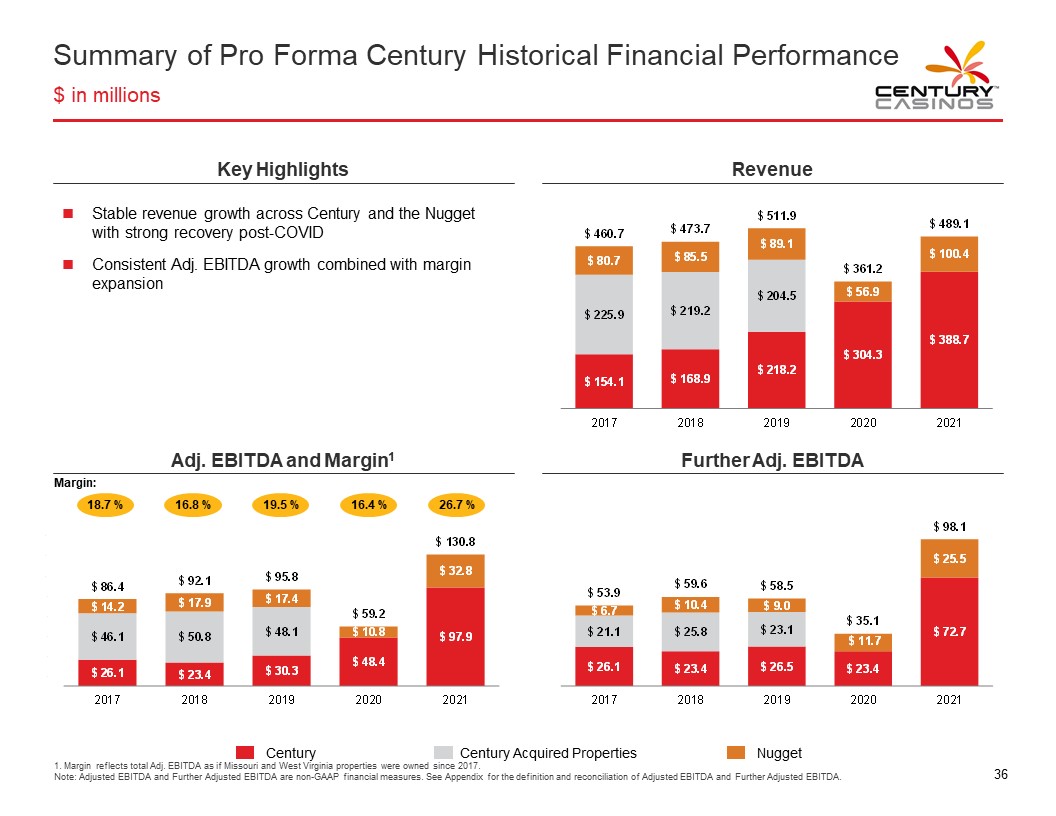
Summary of Pro Forma Century Historical Financial Performance $ in millions CENTURY CASINOS Key Highlights Revenue • Stable revenue growth across Century and the Nugget with strong recovery post-COVID • Consistent Adj. EBITDA growth combined with margin expansion Revenue $460.7 $80.7 $225.9 $154.1 2017 $473.7 $85.5 $219.2 $168.9 2018 $511.9 $89.1 $204.5 $218.2 2019 $361.2 $56.9 $304.3 2020 $489.1 $100.4 $388.7 2021 Adj. EBITDA and Margin1 Margin: 18.7% $86.4 $14.2 $46.1 $26.1 2017 16.8% $92.1 $17.9 $50.8 $23.4 2018 19.5% $95.8 $17.4 $48.1 $30.3 2019 16.4% $59.2 $10.8 $48.4 2020 26.7% $130.8 $32.8 $97.9 2021 Further Adj. EBITDA $53.9 $6.7 $21.1 $26.1 2017 $59.6 $10.4 $25.8 $23.4 2018 $58.5 $9.0 $23.1 $26.5 2019 $35.1 $11.7 $23.4 2020 $98.1 $25.5 $72.7 2021 Century Century Acquired Properties Nugget 1. Margin reflects total Adj. EBITDA as if Missouri and West Virginia properties were owned since 2017. Note: Adjusted EBITDA and Further Adjusted EBITDA are non-GAAP financial measures. See Appendix for the definition and reconciliation of Adjusted EBITDA and Further Adjusted EBITDA. 36
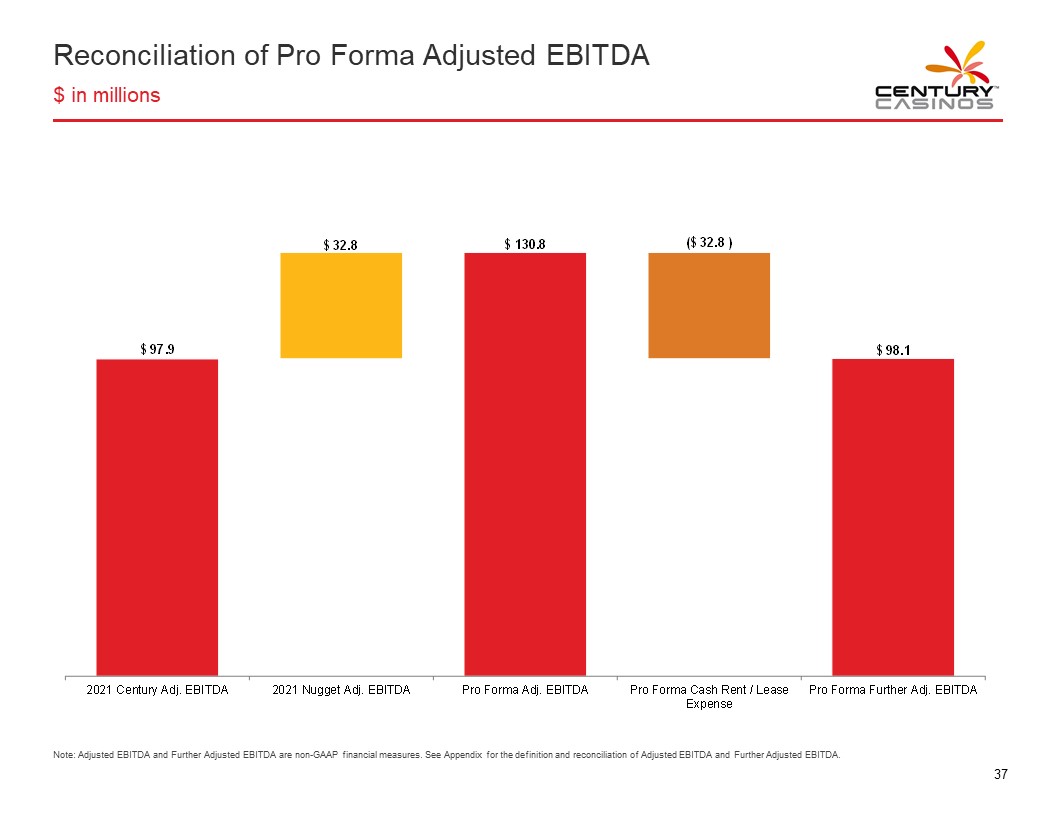
Reconciliation of Pro Forma Adjusted EBITDA $ in millions CENTURY CASINOS $97.9 2021 Century Adj. EBITDA $32.8 2021 Nugget Adj. EBITDA $130.8 Pro Forma Adj. EBITDA ($32.8) Pro Forma Cash Rent / Lease $98.1 Pro Forma Further Adj. EBITDA Expense Note: Adjusted EBITDA and Further Adjusted EBITDA are non-GAAP financial measures. See Appendix for the definition and reconciliation of Adjusted EBITDA and Further Adjusted EBITDA. 37
6 APPENDIX CENTURY CASINOS
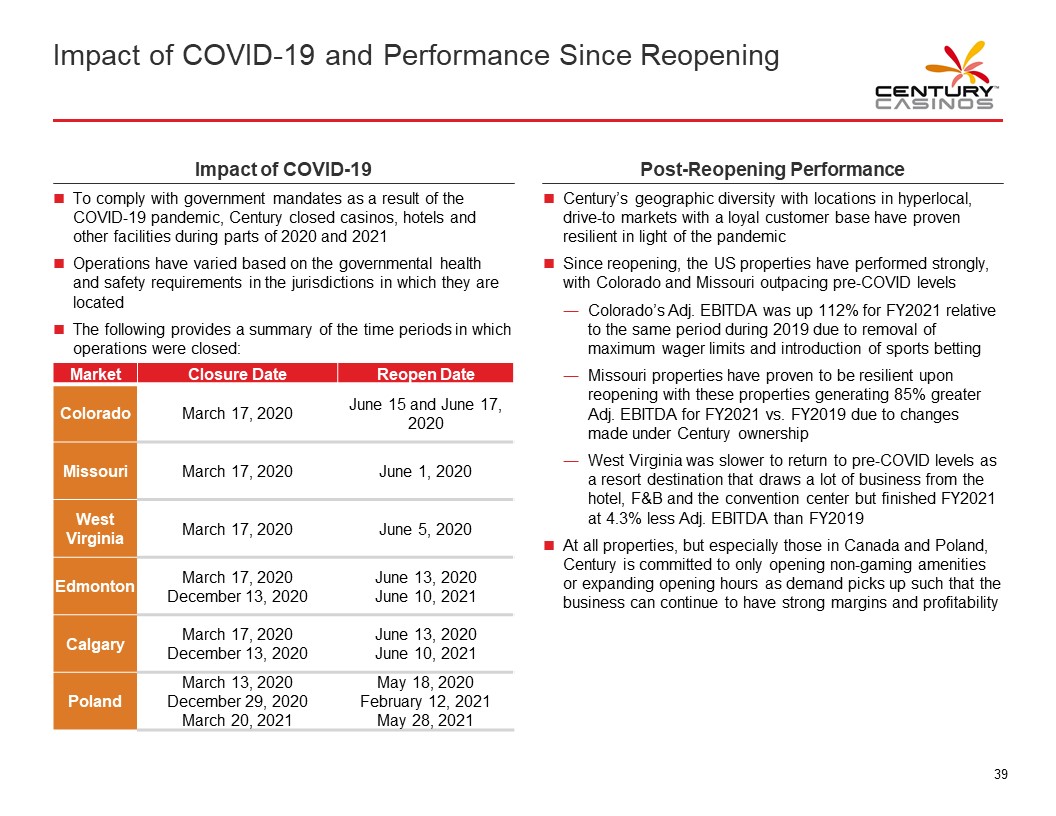
Impact of COVID-19 and Performance Since Reopening CENTURY CASINOS Impact of COVID-19 • To comply with government mandates as a result of the COVID-19 pandemic, Century closed casinos, hotels and other facilities during parts of 2020 and 2021 • Operations have varied based on the governmental health and safety requirements in the jurisdictions in which they are located • The following provides a summary of the time periods in which operations were closed: Market Closure Date Reopen Date Colorado March 17, 2020 June 15 and June 17, 2020 Missouri March 17, 2020 June 1, 2020 West Virginia March 17, 2020 June 5, 2020 Edmonton March 17, 2020 June 13, 2020 December 13, 2020 June 10, 2021 Calgary March 17, 2020 June 13, 2020 December 13, 2020 June 10, 2021 Poland March 13, 2020 May 18, 2020 December 29, 2020 February 12, 2021 March 20, 2021 May 28, 2021 Post-Reopening Performance • Century’s geographic diversity with locations in hyperlocal, drive-to markets with a loyal customer base have proven resilient in light of the pandemic • Since reopening, the US properties have performed strongly, with Colorado and Missouri outpacing pre-COVID levels - Colorado’s Adj. EBITDA was up 112% for FY2021 relative to the same period during 2019 due to removal of maximum wager limits and introduction of sports betting - Missouri properties have proven to be resilient upon reopening with these properties generating 85% greater Adj. EBITDA for FY2021 vs. FY2019 due to changes made under Century ownership - West Virginia was slower to return to pre-COVID levels as a resort destination that draws a lot of business from the hotel, F&B and the convention center but finished FY2021 at 4.3% less Adj. EBITDA than FY2019 • At all properties, but especially those in Canada and Poland, Century is committed to only opening non-gaming amenities or expanding opening hours as demand picks up such that the business can continue to have strong margins and profitability 39
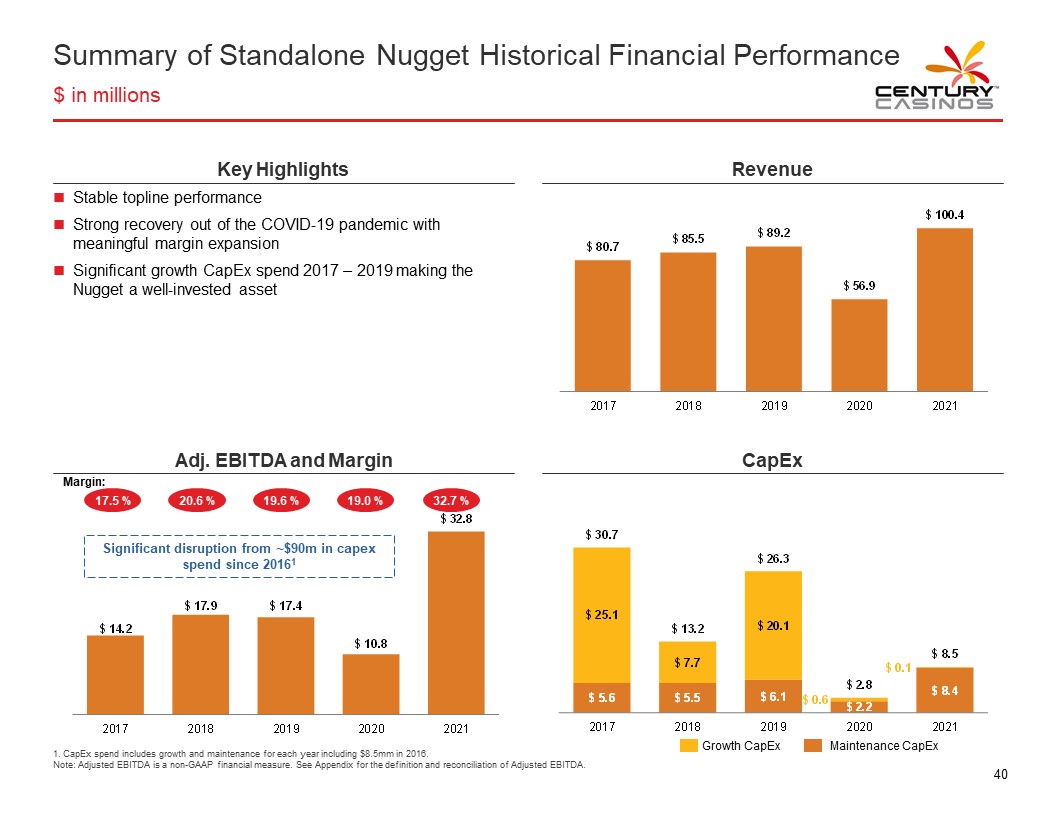
Summary of Standalone Nugget Historical Financial Performance $ in millions CENTURY CASINOS Key Highlights Revenue • Stable topline performance • Strong recovery out of the COVID-19 pandemic with meaningful margin expansion • Significant growth CapEx spend 2017 – 2019 making the Nugget a well-invested asset Revenue $80.7 2017 $85.5 2018 $89.2 2019 $56.9 2020 $100.4 2021 Adj. EBITDA and Margin Margin: 17.5% $14.2 2017 20.6% $17.9 2018 19.6% $17.4 2019 19.0% $10.8 2020 32.7% $32.8 2021 Significant disruption from ~$90m in capex spend since 20161 CapEx $30.7 $25.1 $5.6 2017 $13.2 $7.7 $5.5 2018 $26.3 $20.1 $6.1 2019 $2.8 $0.6 $2.2 2020 $8.5 $0.1 $8.4 2021 Growth CapEx Maintenance CapEx 1. CapEx spend includes growth and maintenance for each year including $8.5mm in 2016. Note: Adjusted EBITDA is a non-GAAP financial measure. See Appendix for the definition and reconciliation of Adjusted EBITDA. 40
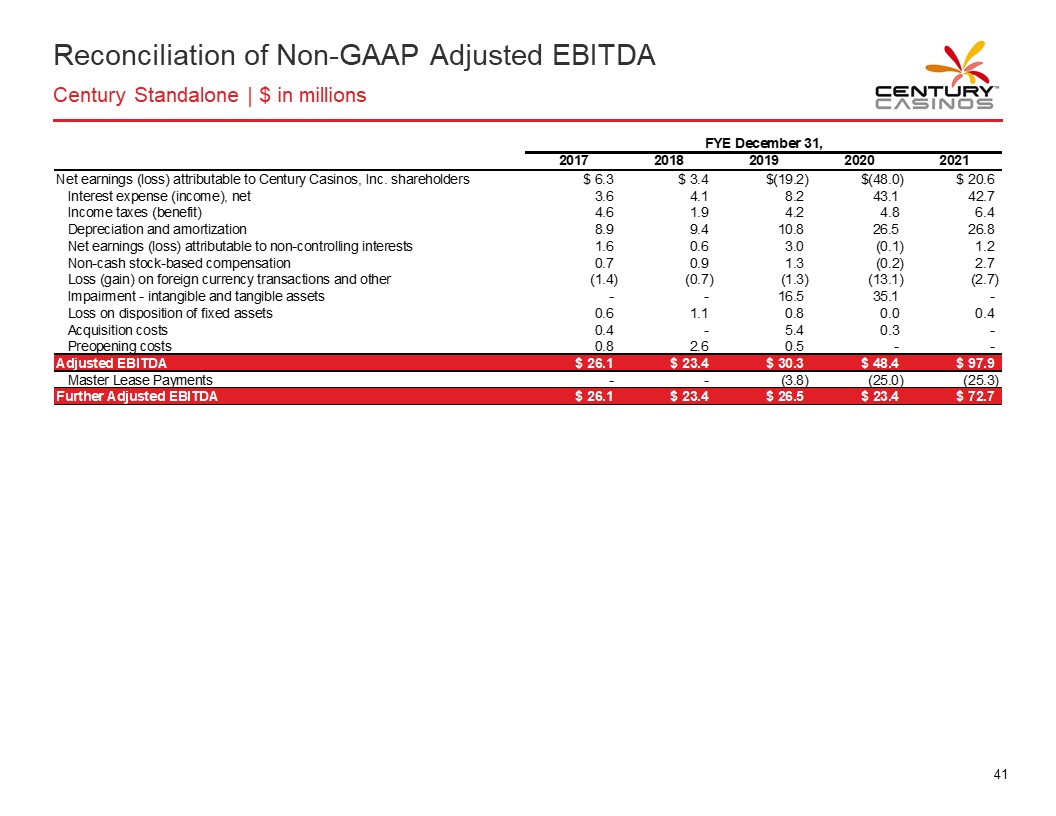
Reconciliation of Non-GAAP Adjusted EBITDA Century Standalone | $ in millions CENTURY CASINOS FYE December 31, 2017 2018 2019 2020 2021 Net earnings (loss) attributable to Century Casinos, Inc. shareholders $ 6.3 $ 3.4 $(19.2) $(48.0) $ 20.6 Interest expense (income), net 3.6 4.1 8.2 43.1 42.7 Income taxes (benefit) 4.6 1.9 4.2 4.8 6.4 Depreciation and amortization 8.9 9.4 10.8 26.5 26.8 Net earnings (loss) attributable to non-controlling interests 1.6 0.6 3.0 (0.1) 1.2 Non-cash stock-based compensation 0.7 0.9 1.3 (0.2) 2.7 Loss (gain) on foreign currency transactions and other (1.4) (0.7) (1.3) (13.1) (2.7) Impairment - intangible and tangible assets - - 16.5 35.1 Loss on disposition of fixed assets 0.6 1.1 0.8 0.0 0.4 Acquisition costs 0.4 - 5.4 0.3 - Preopening costs 0.8 2.6 0.5 - Adjusted EBITDA $26.1 $23.4 $30.3 $48.4 $97.9 Master Lease Payments - - (3.8) (25.0) (25.3) Further Adjusted EBITDA $26.1 $23.4 $26.5 $23.4 $72.7 41
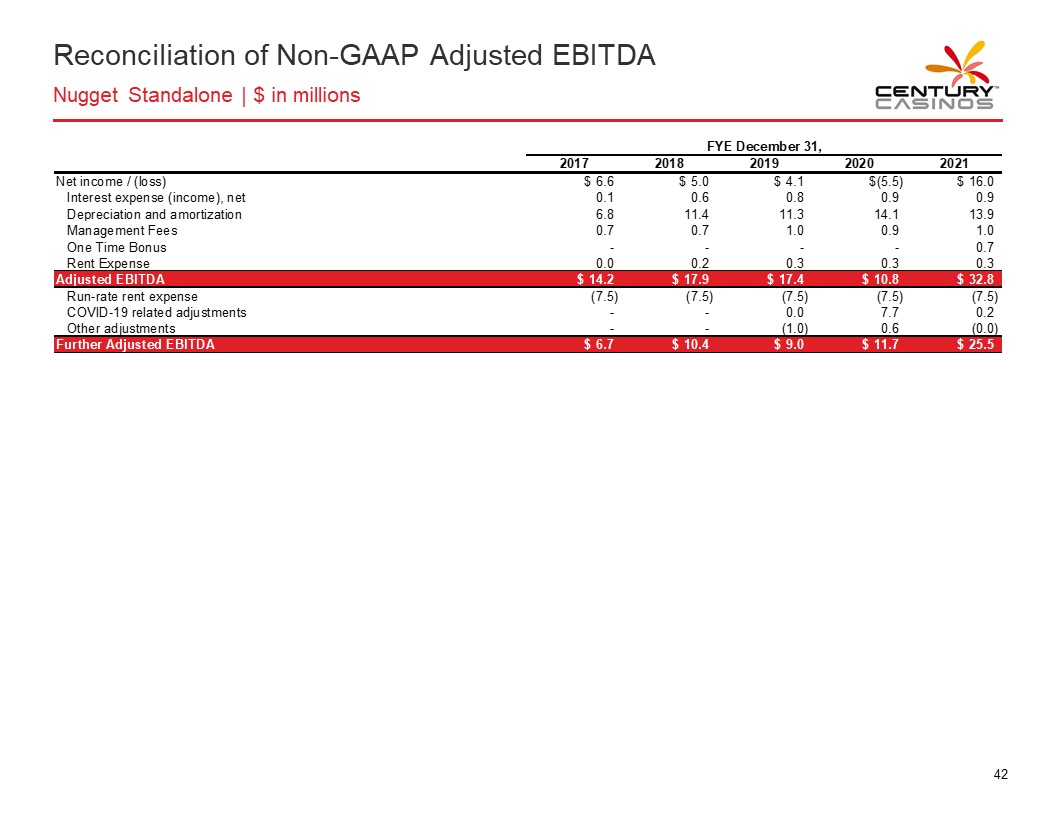
Reconciliation of Non-GAAP Adjusted EBITDA Nugget Standalone | $ in millions CENTURY CASINOS FYE December 31, 2017 2018 2019 2020 2021 Net income / (loss) $ 6.6 $ 5.0 $ 4.1 $(5.5) $ 16.0 Interest expense (income), net 0.1 0.6 0.8 0.9 0.9 Depreciation and amortization 6.8 11.4 11.3 14.1 13.9 Management Fees 0.7 0.7 1.0 0.9 1.0 One Time Bonus - - - - 0.7 Rent Expense 0.0 0.2 0.3 0.3 0.3 Adjusted EBITDA $14.2 $17.9 $17.4 $10.8 $32.8 Run-rate rent expense (7.5) (7.5) (7.5) (7.5) (7.5) COVID-19 related adjustments - - 0.0 7.7 0.2 Other adjustments - - (1.0) 0.6 (0.0) Further Adjusted EBITDA $6.7 $10.4 $9.0 $11.7 $25.5 42
Non-GAAP Financial Measures CENTURY CASINOS The Company defines Adjusted EBITDA as net earnings (loss) attributable to Century Casinos, Inc. shareholders before interest expense (income), net, income taxes (benefit), depreciation and amortization, non-controlling interests net earnings (loss) and transactions, pre-opening expenses, acquisition costs, non-cash stock-based compensation charges, asset impairment costs, (gain) loss on disposition of fixed assets, discontinued operations, (gain) loss on foreign currency transactions, cost recovery income and other, gain on business combination and certain other one-time transactions. Expense related to the Company’s Master Lease and Century Downs Racetrack and Casino land lease is included in the interest expense (income), net line item. Intercompany transactions consisting primarily of management and royalty fees and interest, along with their related tax effects, are excluded from the presentation of net earnings (loss) attributable to Century Casinos, Inc. shareholders and Adjusted EBITDA reported for each segment. Non-cash stock-based compensation expense is presented under Corporate and Other as the expense is not allocated to reportable segments when reviewed by the Company’s chief operating decision makers. Not all of the aforementioned items occur in each reporting period, but have been included in the definition based on historical activity. These adjustments have no effect on the consolidated results as reported under US GAAP. Adjusted EBITDA is not considered a measure of performance recognized under US GAAP. Management believes that Adjusted EBITDA is a valuable measure of the relative performance of the Company and its properties. The gaming industry commonly uses Adjusted EBITDA as a method of arriving at the economic value of a casino operation. Management uses Adjusted EBITDA to compare the relative operating performance of separate operating units by eliminating the above-mentioned items associated with the varying levels of capital expenditures for infrastructure required to generate revenue and the often high cost of acquiring existing operations. Adjusted EBITDA is used by the Company’s lending institution to gauge operating performance. The Company’s computation of Adjusted EBITDA may be different from, and therefore may not be comparable to, similar measures used by other companies within the gaming industry. With respect to OpCo and the Nugget Casino Resort, Adjusted EBITDA also excludes one-time bonuses paid to OpCo employees related to the COVID-19 pandemic, management fees and rent expense, and the Adjusted EBITDA multiple described above also excludes pro forma rent expense payable by OpCo to PropCo. Further Adjusted EBITDA is defined as Adjusted EBITDA less cash rent payments associated with VICI Master Lease and 50% of PropCo interest owned by Marnell Gaming, LLC. The Company defines Net Debt as long-term debt (including current portion) plus deferred financing costs minus cash and cash equivalents. Net Debt is not considered a liquidity measure recognized under US GAAP. Management believes that Net Debt is a valuable measure of our overall financial situation. Net Debt provides investors with an indicator of our ability to pay off all of our longterm debt if it becomes due simultaneously. 43