| | OMB APPROVAL |
| | OMB Number: | 3235-0570 |
| | Expires: | October 31, 2006 |
| UNITED STATES | Estimated average burden hours per response. . . . . . . . . . . . . . . . .19.3 |
| SECURITIES AND EXCHANGE COMMISSION | |
| Washington, D.C. 20549 | |
| | | | |
FORM N-CSR
CERTIFIED SHAREHOLDER REPORT OF REGISTERED
MANAGEMENT INVESTMENT COMPANIES
Investment Company Act file number | 811-7978 |
|
ING Mayflower Trust |
(Exact name of registrant as specified in charter) |
|
7337 E. Doubletree Ranch Rd., Scottsdale, AZ | | 85258 |
(Address of principal executive offices) | | (Zip code) |
|
CT Corporation System, 101 Federal Street, Boston, MA 02110 |
(Name and address of agent for service) |
|
Registrant’s telephone number, including area code: | 1-800-992-0180 | |
|
Date of fiscal year end: | October 31 | |
|
Date of reporting period: | November 1, 2005 to April 30, 2006 | |
| | | | | | | | | |
ITEM 1. REPORTS TO STOCKHOLDERS.
The following is a copy of the report transmitted to stockholders pursuant to Rule 30e-1 under the Act (17 CFR 270.30e-1):

| | Funds |
Semi-Annual Report
April 30, 2006
Classes A, B, C, I, M and Q
Global Equity Funds
 ING Global Equity Dividend Fund
ING Global Real Estate Fund
ING Global Value Choice Fund
International Equity Funds
ING Emerging Countries Fund
ING Foreign Fund
ING Greater China Fund
ING Index Plus International Equity Fund
ING International Fund
ING International Capital Appreciation Fund
ING International Real Estate Fund
ING International SmallCap Fund
ING International Value Fund
ING International Value Choice Fund
ING Precious Metals Fund
ING Russia Fund
International Fixed-Income Fund
ING Emerging Markets Fixed Income Fund
International Fund-of-Funds
ING Diversified International Fund
 E-Delivery Sign-up – details inside
This report is submitted for general information to shareholders of the ING Funds. It is not authorized for distribution to prospective shareholders unless accompanied or preceded by a prospectus which includes details regarding the funds’ investment objectives, risks, charges, expenses and other information. This information should be read carefully. | |

|
| Go Paperless with E-Delivery! |
|
| Sign up now for on-line prospectuses, fund reports, and proxy statements. In less than five minutes, you can help reduce paper mail and lower fund costs. |
|
| Just go to www.ingfunds.com, click on the E-Delivery icon from the home page, follow the directions and complete the quick 5 Steps to Enroll. |
|
| You will be notified by e-mail when these communications become available on the internet. Documents that are not available on the internet will continue to be sent by mail. |
| | | |
(THIS PAGE INTENTIONALLY LEFT BLANK)

| Dear Shareholder, |
|
As you may recall in my last letter, I described the enthusiasm that we were experiencing here at ING Funds as we worked to bring more of the world’s investment opportunities to you, the investor. |
|
I am happy to report that that enthusiasm is continuing to thrive. With the New Year, we have launched a series of new international mutual funds, each created to bring more of the world’s opportunities to you. |
|
Meanwhile, we have also heard you loud and clear. Our research tells us that many investors report that they find investing an intimidating and overly-complex endeavor. That is why ING is committed to |
helping investors across the country cut through the confusion and clutter. “Your future. Made easier.SM” are more than words, they represent our promise to you. |
|
Those two objectives — bringing you more of the world’s opportunities and doing it in a way that is easier for you — are behind the development of the ING Diversified International Fund. The new Fund is among those that we launched in January but it is unique in that it is a fund-of-funds. It is also, we believe, simply an easier way to invest internationally. |
|
The ING Diversified International Fund brings together six distinct, international mutual funds, each managed by well-known asset managers who specialize in key international sub-asset classes. What’s more, the Fund is periodically reviewed by a seasoned team of ING asset allocation experts who re-adjust the Fund’s allocation based on prevailing market conditions. |
|
Best of all: we’ve made it easy. With just one investment, investors can now acquire a broadly diversified, actively managed international equity portfolio. |
|
The ING Diversified International Fund marks one more way that we at ING Funds are continuing to offer you the global expertise, product innovation and world-class service that you have come to expect from us. |
|
On behalf of everyone at ING Funds, I thank you for your continued support and loyalty. We look forward to serving you in the future. |
Sincerely,

James M. Hennessy
President
ING Funds
June 23, 2006
The views expressed in the President’s Letter reflect those of the President as of the date of the letter. Any such views are subject to change at any time based upon market or other conditions and ING Funds disclaims any responsibility to update such views. These views may not be relied on as investment advice and because investment decisions for an ING Fund are based on numerous factors, may not be relied on as an indication of investment intent on behalf of any ING Fund. Reference to specific company securities should not be construed as recommendations or investment advice.
International investing does pose special risks including currency fluctuation, economic and political risks not found in investments that are solely domestic.
For more complete information, or to obtain a prospectus on any ING fund, please call your Investment Professional or ING Fund Distributor, LLC at (800) 992-0180 or log on to www.ingfunds.com. The prospectus should be read carefully before investing. Consider the fund’s investment objectives, risks, charges and expenses. The prospectus contains this information and other information about the fund. Check with your Investment Professional to determine which funds are available for sale within their firm. Not all funds are available for sale at all firms.
1
MARKET PERSPECTIVE: SIX MONTH ENDED APRIL 30, 2006
Global equities ended up with strong gains for the half-year period ended April 30, 2006 with the foreign markets leading the way. The Morgan Stanley Capital International (“MSCI”) World Index(1) calculated in dollars, including net reinvested dividends rose 16.3%. Indeed, the first quarter of 2006 was the best first quarter since 1998 and the busiest quarter for merger and acquisition activity since 2000. As for currencies, the U.S. dollar at first extended its run of the first ten months of 2005. Few had expected such dollar strength in 2005. Relatively high U.S. interest rates explained part of it, especially the re-cycling of oil exporters’ burgeoning wealth into dollar denominated securities. The yen’s particular weakness was connected with the sharp rise in Japanese stock prices, fueled by outside investors who were hedging their currency risk. Also material was the tax-related “repatriation” into dollars of U.S. corporations’ foreign currency balances. However, by year-end 2005 each of these dynamics was losing steam. A January 2006 correction was partially reversed before resuming in earnest and the dollar ended the April 30, 2006 six-month period weaker than it started, by 5.1% against the euro, 2.2% against the yen and 3.1% against the pound.
Equities investors kept a wary eye on the U.S. fixed-income markets where for over a year, the main issue had been the unexpected flattening of the yield curve. Between June 2004 and October 31, 2005 the Federal Open Market Committee (“FOMC”) had raised the federal funds rate by 25 basis points eleven times, pulling other short-term rates up. However, the yield on the ten-year U.S. Treasury Note had actually fallen by 14 basis points over the same period. By the time Federal Reserve Chairman Alan Greenspan had chaired his final FOMC meeting on the last day of January 2006, rates had been raised three more times. Incoming Chairman Ben Bernanke quickly confirmed that he would maintain the focus of his predecessor. February 2006 ended with the yield curve slightly inverted along much of its range. This largely disappeared in March 2006 as fourth quarter core inflation was reported at an uncomfortable 2.4% and Mr Bernanke’s FOMC raised rates for the fifteenth time. The curve steepened further in April as commodity prices soared on expectations of rising global demand and China’s insatiable appetite. The price of a barrel of oil reached a new record, elevated in addition by political concerns in Iran, Venezuela and Nigeria. For the six-month period the yield on the ten-year U.S. Treasury Note rose 51 basis points to 5.07%, a near four-year high, while the yield on the three-month U.S. Treasury Bill added 84 basis points to 4.65%.
The U.S. equities market in the form of the Standard and Poor’s 500® Composite Stock Price (“S&P 500®”) Index(2), gained 9.6% including dividends during the half year ended April 30, 2006. Boosting sentiment was the continued growth of corporate profits, which looked set in the first quarter of 2006, to record the 11th straight double-digit increase. In the same quarter economic growth roared back to 4.8% after a hurricane affected 1.7% previously. For most of the period investors warmed to the feeling that an end to rising short-term interest rates was drawing near, although the chill could be instantly restored by a single piece of economic data or loose comment by a Federal Reserve official. And latterly, as commodity prices surged ever higher, the market, while still rising, was nonetheless getting increasingly nervous.
Japan equities had been soaring since the middle of 2005 and they kept up the pace in the six-month period April 30, 2006 leaping 24.4% in dollars according to the MSCI Japan® Index(3) plus net dividends. Investors cheered Japan’s re-emergence as a balanced economy, less dependent on exports. Japanese corporations and banks have repaired their balance sheets. At last, core consumer prices started rising in November 2005. Higher wages are supporting domestic demand, leading the rate of fourth quarter gross domestic product (“GDP”) growth to a healthy 4.4%. The long-feared announcement, that the Bank of Japan would end its zero-interest rate policy, thereby reducing liquidity, came on March 9, 2006. However, the Bank of Japan also signaled that it was in no rush, and a relieved market completed the last 9% of its remarkable rise.
European ex UK markets matched Japan’s with a 24.9% return, according to the MSCI Europe ex UK Index(4) including net dividends, despite the first interest rate increase in over five years, followed by another, to 2.5%. Evidence of recovery continued to mount, if not entirely convincingly. Fourth quarter Eurozone GDP growth was only 0.3%, with Germany flat. Unemployment barely edged down to 8.2%. Yet business confidence continued to improve; in Germany’s case to a 15-year high. The key is that tepid macro-economic reports believe the strong profitability of European companies, which are increasingly producing and selling outside developed Europe. This and merger and acquisition activity, in businesses from tobacco to banking to insurance to power to frozen food to drugs, kept stocks buoyant.
2
MARKET PERSPECTIVE: SIX MONTH ENDED APRIL 30, 2006
UK equities jumped 18.5% in the half year, based on the MSCI UK® Index(5) including net dividends. The economic reports were mostly miserable, with manufacturing in decline, GDP growth in 2005 finalized at 1.8%, the weakest since 1992 and unemployment claims up in 13 out of the last 14 months. Yet the market advanced. The comparatively large energy and materials sectors benefited as commodities prices exploded, while the sizeable financials sector contained a number of companies close to the rampant merger and acquisition action (or thought to be). Further support came from rebounding house prices, first quarter GDP growth at 0.6%, within which industrial production outpaced services for the first time since 1999, and in the last few days an unexpectedly strong retail sales report.
(1) The MSCI World® Index is an unmanaged index that measures the performance of over 1,400 securities listed on exchanges in the U.S., Europe, Canada, Australia, New Zealand and the Far East.
(2) The Standard & Poor’s 500® Composite Stock Price (“S&P 500®”) Index is an unmanaged index that measures the performance of securities of approximately 500 of the largest companies in the United States.
(3) The MSCI Japan® Index is a free float-adjusted market capitalization index that is designed to measure developed market equity performance in Japan.
(4) The MSCI Europe ex UK® Index is a free float-adjusted market capitalization index that is designed to measure developed market equity performance in Europe, excluding the UK.
(5) The MSCI UK® Index is a free float-adjusted market capitalization index that is designed to measure developed market equity performance in the UK.
All indices are unmanaged and investors cannot invest directly in an index.
Past performance does not guarantee future results. The performance quoted represents past performance. Investment return and principal value of an investment will fluctuate, and shares, when redeemed, may be worth more or less than their original cost. The Funds’ performance is subject to change since the period’s end and may be lower or higher than the performance data shown. Please call (800) 992-0180 or log on to www.ingfunds.com to obtain performance data current to the most recent month end.
Market Perspective reflects the views of ING’s Chief Investment Risk Officer only through the end of the period, and is subject to change based on market and other conditions.
3
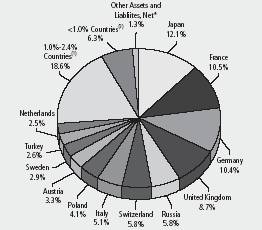
ING GLOBAL EQUITY DIVIDEND FUND | | PORTFOLIO MANAGERS’ REPORT |
Country Allocation
as of April 30, 2006
(as a percent of net assets)
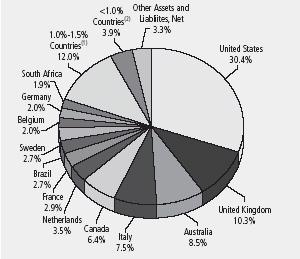
(1) Includes eleven countries, which each represents 1.0%-1.5% of net assets.
(2) Includes six countries, which each represents < 1.0% of net assets.
Portfolio holdings are subject to change daily.
ING Global Equity Dividend Fund (the “Fund”) seeks growth of capital with dividend income as a secondary consideration. The Fund is managed by Portfolio Managers, Nicolas Simar and Moudy El Khodr of ING Investment Management Advisors B.V — the Sub-Adviser.
Performance: For the six months ended April 30, 2006, the Fund’s Class A shares, excluding sales charges, provided a total return of 18.30% compared to the Morgan Stanley Capital International (“MSCI”) World IndexSM, which returned 16.29% for the same period.
Portfolio Specifics: During the reporting period, the Fund had strong performance. Buoyed by the positive economic data and supported by good earnings results the markets performed strongly over the period. Cyclical sectors such as Basic Materials and Industrials performed strongly. Basic Materials were strong on the back of further rises in commodity prices. Industrials did well on a better outlook for the global economy. The Energy sector also had a solid positive performance as oil prices rose further. The defensive and high dividend paying sectors such as Telecoms and Utilities lagged as the market favored the growth oriented sectors. Financials, including Real Estate, were also strong. The sectors were boosted by good earnings results, rising markets and market demand.
The Fund benefited from its positioning in Financials (especially in Real Estate) and Energy. However, the strong positioning in the high dividend paying sectors of Telecoms and Utilities were a drag on the performance as these sectors lagged. As the Fund is underrepresented in the cyclical sectors, their strong performance was also a drag on the Fund.
The Fund profited from its regional positioning. We have a large position in Emerging Markets, which performed strongly especially Brazil. Emerging Markets offer many investment opportunities with very attractive dividend yields, sound fundamentals and above average growth prospects. Our strong position in Europe also performed well as the economic outlook and business sentiment for the region improved. The strong performance of Japan was a drag on the performance as the Fund has no representation in the region because companies do not meet the strategy’s criteria.
In general, stock selection clearly had a positive contribution. The Fund benefited from the strong performance of the UK home builders. Our key bet in Persimmon sold as of April 30, 2006, an England based home builder, plans to save as much as $87 million in costs from its proposed takeover of rival homebuilder Westbury Plc. We sold this stock in December once it reached our dividend threshold. The market was positive regarding the acquisition and the stock performed strongly. Investments in emerging markets — Petroleo Brasileiro and Petrochina, Brazilian and Chinese oil companies respectively — were also amongst our best performers as oil prices rose.
Current Strategy and Outlook: The outlook for the Global Equity Dividend strategy remains positive. Investments in defensive sectors like utilities, real estate, telecommunication services and consumer staples give the strategy downside protection. These sectors are relatively cheap, less dependent on the economic environment and offer stable, high dividend yields. This strategy should perform well on a relative basis in a down market. If the equity markets move sideways, the Fund’s performance will be dependent on stock selection and the application of our disciplined strategy which looks for good value opportunities in countries, sectors or individual stocks.
4
PORTFOLIO MANAGERS’ REPORT | | ING GLOBAL EQUITY DIVIDEND FUND |
| | | | | | | | | | | |
| Average Annual Total Returns for the Periods Ended April 30, 2006 | |
| | | | | | | | | | | |
| | | 1 Year | Since Inception
of Class A
September 17, 2003 | | Since Inception
of Class B
October 24, 2003 | | Since Inception
of Class C
October 29, 2003 | | |
| | | | | | | | | | | |
| Including Sales Charge: | | | | | | | | | | |
| Class A(1) | | 15.29 | % | 19.60 | % | — | | — | | |
| Class B(2) | | 16.43 | % | — | | 20.15 | % | — | | |
| Class C(3) | | 20.47 | % | — | | — | | 20.54 | % | |
| Excluding Sales Charge: | | | | | | | | | | |
| Class A | | 22.29 | % | 22.33 | % | — | | — | | |
| Class B | | 21.43 | % | — | | 21.05 | % | — | | |
| Class C | | 21.47 | % | — | | — | | 20.54 | % | |
| MSCI World IndexSM(4) | | 24.91 | % | 19.82 | %(5) | 17.79 | %(6) | 17.79 | %(6) | |
| | | | | | | | | | | |
| | | | | | | | | | | | | | | |
Based on a $10,000 initial investment, the table above illustrates the total return of ING Global Equity Dividend Fund against the index indicated. The index is unmanaged and has no cash in its portfolio, imposes no sales charges and incurs no operating expenses. An investor cannot invest directly in the index. The Fund’s performance is shown both with and without the imposition of sales charges.
The performance table does not reflect the deduction of taxes that a shareholder will pay on Fund distributions or the redemption of Fund shares.
The performance shown may include the effect of fee waivers and/or expense reimbursements by the Investment Manager and/or other service providers, which have the effect of increasing total return. Had all fees and expenses been considered, the total returns would have been lower.
Performance data represents past performance and is no assurance of future results. Investment return and principal value of an investment in the Fund will fluctuate. Shares, when sold, may be worth more or less than their original cost. The Fund’s current performance may be lower or higher than the performance data shown. Please log on to www.ingfunds.com or call (800) 992-0180 to get performance through the most recent month end.
It is important to note that the Fund has a limited operating history. Performance over a longer period of time may be more meaningful than short-term performance.
This report contains statements that may be “forward-looking” statements. Actual results may differ materially from those projected in the “forward-looking” statements.
The views expressed in this report reflect those of the portfolio managers, only through the end of the period as stated on the cover. The portfolio managers’ views are subject to change at any time based on market and other conditions.
Fund holdings are subject to change daily.
(1) | Reflects deduction of the maximum Class A sales charge of 5.75%. |
| |
(2) | Reflects deduction of the Class B deferred sales charge of 5% and 3%, respectively, for the 1 year and since inception returns. |
| |
(3) | Reflects deduction of the Class C deferred sales charge of 1% for the 1 year return. |
| |
(4) | The MSCI World IndexSM is an unmanaged index that measures the performance of over 1,400 securities listed on exchanges in the U.S., Europe, Canada, Australia, New Zealand and the Far East. |
| |
(5) | Since inception performance for the index is shown from October 1, 2003. |
| |
(6) | Since inception performance for the index is shown from November 1, 2003. |
5
ING GLOBAL REAL ESTATE FUND | | PORTFOLIO MANAGERS’ REPORT |
Country Allocation
as of April 30, 2006
(as a percent of net assets)
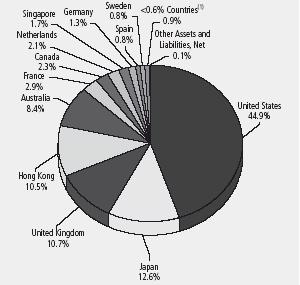
(1) Includes three countries, which each represents < 0.6% of net assets.
Portfolio holdings are subject to change daily.
ING Global Real Estate Fund (the “Fund”) seeks high total return. T. Ritson Ferguson, CFA, and Steven D. Burton, CFA have been jointly responsible for the day-to-day management of the Fund, ING Clarion Real Estate Securities L.P.—the Sub-Adviser.
Performance: For the six months ended April 30, 2006, the Fund’s Class A shares, excluding sales charges, provided a total return of 22.90% compared to the S&P/Citigroup World Property Index, which returned 21.13% for the same period.
Portfolio Specifics: Overall performance for the six months ended April 30, 2006 was driven by the European and Asia-Pacific regions. European property stocks garnered the best performance by major region of the world with total return of 30.1% (in USD) over this time period. The Asia-Pacific region followed with total return of 25.3%, driven by Japan 35.6% and Hong Kong 25.6% both of which continue to exhibit signs of sustainable economic expansion. North America total return for the six months ended April 30 was 15.1%.
Thematically, some of the more significant events among world property stocks over the past six months have been: 1) final details regarding the Real Estate Investment Trust (“REIT”) structure in the U.K., 2) continued improving fundamentals in Japan and 3) continued syndicate activity with the formation of new property companies worldwide. In the U.K., the Treasury issued in March, 2006 critical details on the structure of REITs which surprised the market to the upside and should contribute to the healthy conversion and expansion of real estate securities in the U.K., beginning January 1, 2007. The details included a conversion tax of 2% of total assets (at the lower end of expectations), a payout requirement on net income of 90% (versus 95% previously stated) and a recurring net income to interest expense ratio of 1.5X (versus 2.5X previously stated).
In Japan, vacancy and rent trends continue to improve. Vacancies in the Tokyo central five wards declined for the ninth straight month to 3.41% in March from 3.67% in February. Average office rent rose to 18,095 yen per tsubo, the Japanese standard of land measurement that is equivalent to 35.6 square feet, or 3.3 square meters, from 18,038 yen. Separately, the annual land price survey conducted by the Ministry of Land, Infrastructure, and Transport indicated in March an increase in land prices in urban areas for the first time since 1991. The price surge was even more evident in the city centers, as the Tokyo central 5 wards average commercial land price increased 7%. Property stocks generally reacted favorably to the survey.
Syndicate activity was robust during the six months as the global property stock sector continues to expand. Hong Kong now has three REITs with an active pipeline (up from no REITs six months ago) and the Japanese REIT market is approaching USD$30 billion in aggregate size with several new IPO’s, including the first hotel REIT. Europe has seen several billions of equity market cap created among the property companies over the past six months via IPO’s with a bias toward the German markets, Eastern Europe and France.
The Fund achieved its outperformance versus the benchmark over the six months ended April 30 primarily via stock selection in Japan, the U.S. and Hong Kong. Overweights in Tokyo-focused companies Mitsubishi Estate and Sumitomo Realty contributed to the relative outperformance in Japan. In the U.S., companies with significant investments in Manhattan, including SL Green Realty and Boston Properties, contributed to relative outperformance. Hong Kong picks were bolstered by investments in the homebuilding sector in China as well as Hong Kong’s first REIT, The Link REIT, which has performed well since the IPO.
The U.S. dollar generally weakened during the six months against other major currencies, most notably versus the Euro 5.1%, followed by the British pound 3.1%, the Japanese Yen 2.2% and the Australian dollar 0.6%. A weakening U.S. dollar benefits an investor in the Fund as returns translated from the strengthening currency convert to more U.S. dollars once converted back.
Current Strategy and Outlook: The Fund, while maintaining a core of higher dividend yielding, defensively positioned stocks, is positioned to take advantage of the higher growth countries and sectors which will likely respond better to sustained economic recovery. The Fund has reduced its overall weight in continental Europe over the past six months and added to the recovering economies of the Asia-Pacific region, particularly Japan and Hong Kong both of which are exhibiting improving property fundamentals. By property type, the Fund is shifting its weighting towards sectors which have further to respond to improving economies, such as the office, apartment and lodging sectors. Through an average 3-4% dividend yield plus 5-8% prospective annual earnings growth, global property stocks continue to be well-positioned to conservatively deliver attractive total returns over the next several years.
6
PORTFOLIO MANAGERS’ REPORT | | ING GLOBAL REAL ESTATE FUND |
| | | | | | | | | | | | | |
| Average Annual Total Returns for the Periods Ended April 30, 2006 | |
| | | | | | | | | | | | | |
| | | 1 Year | Since Inception
of Class A
November 5, 2001 | | Since Inception
of Class B
March 15, 2002 | | Since Inception
of Class C
January 8, 2002 | | Since Inception
of Class I
June 3, 2005 | | |
| | | | | | | | | | | | |
| Including Sales Charge: | | | | | | | | | | | | |
| Class A(1) | | 25.43 | % | 23.98 | % | — | | — | | — | | |
| Class B(2) | | 27.06 | % | — | | 23.49 | % | — | | — | | |
| Class C(3) | | 30.94 | % | — | | — | | 23.56 | % | — | | |
| Class I | | — | | | | | | | | 30.61 | % | |
| Excluding Sales Charge: | | | | | | | | | | | | |
| Class A | | 33.04 | % | 25.58 | % | — | | — | | — | | |
| Class B | | 32.06 | % | — | | 23.47 | % | — | | — | | |
| Class C | | 31.94 | % | — | | — | | 23.56 | % | — | | |
| Class I | | — | | | | | | | | 30.61 | % | |
| S&P/Citigroup World Property Index(4) | | 31.99 | % | 24.85 | %(5) | 25.36 | %(6) | 24.33 | %(7) | 33.10 | %(8) | |
| | | | | | | | | | | | | |
| | | | | | | | | | | | | | | | | | | | |
Based on a $10,000 initial investment, the table above illustrates the total return of ING Global Real Estate Fund against the index indicated. The index is unmanaged and has no cash in its portfolio, imposes no sales charge and incurs no operating expenses. An investor cannot invest directly in the index. The Fund’s performance is shown both with and without the imposition of sales charges.
The performance table does not reflect the deduction of taxes that a shareholder will pay on Fund distributions or the redemption of Fund shares.
The performance shown may include the effect of fee waivers and/or expense reimbursements by the Investment Manager and/or other service providers, which have the effect of increasing total return. Had all fees and expenses been considered, the total returns would have been lower.
Performance data represents past performance and is no assurance of future results. Investment return and principal value of an investment in the Fund will fluctuate. Shares, when sold, may be worth more or less than their original cost. The Fund’s current performance may be lower or higher than the performance data shown. Please log on to www.ingfunds.com or call (800) 992-0180 to get performance through the most recent month end.
It is important to note that the Fund has a limited operating history. Performance over a longer period of time may be more meaningful than short-term performance.
This report contains statements that may be “forward-looking” statements. Actual results may differ materially from those projected in the “forward-looking” statements.
The views expressed in this report reflect those of the portfolio managers, only through the end of the period as stated on the cover. The portfolio managers’ views are subject to change at any time based on market and other conditions.
Fund holdings are subject to change daily.
(1) | Reflects deduction of the maximum Class A sales charge of 5.75%. |
| |
(2) | Reflects deduction of the Class B deferred sales charge of 5% and 3%, respectively, for the 1 year and since inception returns. |
| |
(3) | Reflects deduction of the Class C deferred sales charge of 1% for the 1 year return. |
| |
(4) | The S&P/Citigroup World Property Index is an unmanaged market-weighted total return index which consists of many companies from developed markets whose floats are larger than $100 million and derive more than half of their revenue from property-related activities. |
| |
(5) | Since inception performance for index is shown from November 1, 2001. |
| |
(6) | Since inception performance for index is shown from March 1, 2002. |
| |
(7) | Since inception performance for index is shown from January 1, 2002. |
| |
(8) | Since inception performance for index is shown from June 1, 2005. |
7
ING GLOBAL VALUE CHOICE FUND | | PORTFOLIO MANAGERS’ REPORT |
Country Allocation
as of April 30, 2006
(as a percent of net assets)
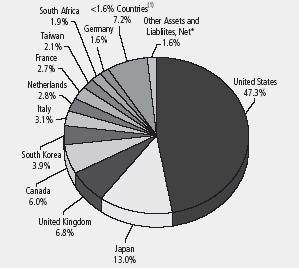
(1) | Includes six countries, which each represents < 1.6% of net assets. |
* | Includes securities lending collateral. |
Portfolio holdings are subject to change daily.
ING Global Value Choice Fund (the “Fund”) focuses on long-term capital appreciation by investing primarily in equity securities throughout the world, including the United States. The Fund is managed by Paul S. Hechmer, Managing Director and Institutional Portfolio Manager, and David B. Iben, Managing Director and Chief Investment Officer, Tradewinds NWQ Global Investors, LLC. — the Sub-Adviser*
Performance: For the six months ended April 30, 2006, the Fund’s Class A shares, excluding sales charges, provided a total return of 18.09% compared to the Morgan Stanley Capital International (“MSCI”) World IndexSM which returned 16.29% for the same period.
Portfolio Specifics: The Fund outperformed the benchmark during the period as a result of strong stock selection across most countries and sectors. Markets around the world performed strongly, with non-US markets in aggregate outperforming the US, with a weaker US dollar adding to overall returns in the global Fund. During the period most commodities performed strongly, with many individual commodities reaching multi year highs. The companies we held in this sector, including Lonmin, Lihir Gold and Impala Platinum, outperformed the benchmark and our overweight exposure to the sector also aided returns. Strong returns in our holdings in the Healthcare sector, including Daiichi Sankyo in Japan also contributed to our strong performance. Individual securities in the Consumer Discretionary sector, including Premiere Ag the German pay TV company detracted from returns, as the company lost the right to broadcast key programming in Germany. We continue to hold the name, believing that the share price has fallen well below the intrinsic value of this market leading company. We were also hurt by our underweight exposure to the Financials sector, and exposure to poorly performing names such as Takefuji in Japan and Citigroup in the US.
Japan was one of the best performing major markets, as investor optimism grew regarding the end of deflation and Japan emerging from a fifteen year economic slump. Our holdings in Japan, while performing strongly from an absolute perspective underperformed relative to the benchmark, as investors focused on higher beta more highly leveraged companies. In the US our overall returns were stronger than that of the market, as names such as Kerr McGee and International Paper rallied strongly significantly outperforming the benchmark return.
Current Strategy and Outlook: Overall on a global basis we believe that market performance would appear to have outpaced the fundamental underlying improvement in business conditions. Further, interest rates appear to be on a northward trend in most major markets around the world. Either or both of these forces could present headwinds to further strong performance in the equity markets. Never the less, our investment universe is extremely broad, and comprised of economies in varied stages of the economic cycle. Japan continues to rebound from 15 years of recession, Europe continues to react positively to the increased competitive environment that the European Union brought with it, and the emerging markets continue to grow very rapidly and the US has significantly lagged other markets throughout the world. In such an environment we continue to be optimistic that good opportunities can still be found.
* The Fund was previously sub-advised by NWQ Investment Management Company.
8
PORTFOLIO MANAGERS’ REPORT | | ING GLOBAL VALUE CHOICE FUND |
| | | | | | | | | |
| Average Annual Total Returns for the Periods Ended April 30, 2006 | |
| | | | | | | | | |
| | | 1 Year | | 5 Year | | 10 Year | | |
| | | | | | | | | |
| Including Sales Charge: | | | | | | | | |
| Class A(1) | | 21.03 | % | 0.26 | % | 7.70 | % | |
| Class B(2) | | 22.67 | % | 0.40 | % | 7.65 | % | |
| Class C(3) | | 26.65 | % | 0.79 | % | 7.65 | % | |
| Class Q | | 28.90 | % | 1.79 | % | 8.65 | % | |
| Excluding Sales Charge: | | | | | | | | |
| Class A | | 28.42 | % | 1.46 | % | 8.34 | % | |
| Class B | | 27.67 | % | 0.79 | % | 7.65 | % | |
| Class C | | 27.65 | % | 0.79 | % | 7.65 | % | |
| Class Q | | 28.90 | % | 1.79 | % | 8.65 | % | |
| MSCI World IndexSM(4) | | 24.91 | % | 5.99 | % | 7.81 | % | |
| | | | | | | | | |
| | | | | | | | | | | | |
Based on a $10,000 initial investment, the table above illustrates the total return of ING Global Value Choice Fund against the index indicated. The index is unmanaged and has no cash in its portfolio, imposes no sales charge and incurs no operating expenses. An investor cannot invest directly in the index. The Fund’s performance is shown both with and without the imposition of sales charges.
The performance table does not reflect the deduction of taxes that a shareholder will pay on Fund distributions or the redemption of Fund shares.
The performance shown may include the effect of fee waivers and/or expense reimbursements by the Investment Manager and/or other service providers, which have the effect of increasing total return. Had all fees and expenses been considered, the total returns would have been lower.
Performance data represents past performance and is no assurance of future results. Investment return and principal value of an investment in the Fund will fluctuate. Shares, when sold, may be worth more or less than their original cost. The Fund’s current performance may be lower or higher than the performance data shown. Please log on to www.ingfunds.com or call (800) 992-0180 to get performance through the most recent month end.
This report contains statements that may be “forward-looking” statements. Actual results may differ materially from those projected in the “forward-looking” statements.
The views expressed in this report reflect those of the portfolio managers, only through the end of the period as stated on the cover. The portfolio managers’ views are subject to change at any time based on market and other conditions.
Fund holdings are subject to change daily.
(1) | Reflects deduction of the maximum Class A sales charge of 5.75%. |
| |
(2) | Reflects deduction of the Class B deferred sales charge of 5% and 2%, respectively, for the 1 year and 5 year returns. |
| |
(3) | Reflects deduction of the Class C deferred sales charge of 1% for the 1 year return. |
| |
(4) | The MSCI World IndexSM is an unmanaged index that measures the performance of over 1,400 securities listed on exchanges in the U.S., Europe, Canada, Australia, New Zealand and the Far East. |
Prior to April 24, 2006, the Fund was advised by a different sub-adviser.
9
ING EMERGING COUNTRIES FUND | | PORTFOLIO MANAGERS’ REPORT |
Country Allocation
as of April 30, 2006
(as a percent of net assets)
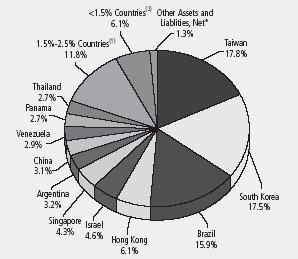
(1) | Includes six countries, which each represents 1.5%-2.5% of net assets. |
(2) | Includes six countries, which each represents < 1.5% of net assets. |
* | Includes securities lending collateral. |
Portfolio holdings are subject to change daily.
ING Emerging Countries Fund (the “Fund”) seeks long-term capital appreciation by normally investing at least 80% of its assets in a number of different countries with emerging securities markets. The Fund is managed by Brandes Investment Partners, L.P. — the Sub-Adviser.
Performance: For the six-month period ended April 30, 2006, the Fund’s Class A shares, excluding sales charges, provided a total return of 27.00% compared to the Morgan Stanley Capital International Emerging Markets IndexSM, (“MSCI EM IndexSM”) which returned 37.77% for the same period.
Portfolio Specifics: On an industry basis, gains for positions in wireless telecom services, commercial banking, and diversified telecom services had the most substantial impact on performance. Among the holdings from these industries posting gains were TIM Participacoes (Brazil — wireless telecom services), Turkiye Vakiflar Bank (Turkey — commercial banking), and CANTV (Venezuela — diversified telecom services).
The Fund’s holdings in Brazil, South Korea, and Taiwan, such as CIA Saneamento Basico (Brazil — water utilities), Korea Electric Power (South Korea — electric utilities), and Yageo (Taiwan — electronic equipment & instruments), also tended to advance in the six-month period.
Relative to the index, some of the recent portfolio underperformance can be attributed at the industry level to underexposure to stocks in the oil, gas & consumable fuels and metals and mining industries, and overexposure to diversified telecom stocks. Within industries, our holdings in commercial banks, capital markets and semiconductors & semiconductor equipment underperformed their industries, as represented in the MSCI Emerging Market Index.
During the period, we sold select positions as their market prices advanced toward our estimates of their intrinsic values, including Sinopec Yizheng Chemical (China — chemicals), Lukoil (Russia — oil, gas, & consumable fuels), and CIA Parananese de Energia (Brazil — independent power producers & energy traders). We purchased shares of companies at prices that we considered attractive, including Taishin Financial Holdings (Taiwan — commercial banking), Wan Hai Lines (Taiwan — marine), and Far EasTone Telecom (Taiwan — wireless telecom services).
Current Strategy and Outlook: Note that our industry exposure is a result of our focus on the fundamentals and valuations of individual companies. We invest in firms that we believe offer a “margin of safety” — companies selling at a price below our estimate of fair value. This often involves investing in unpopular firms and industries. Industry exposures are substantially driven by stock selection, and not by any “industry allocation” decision. Many companies in the oil gas & consumable fuels and metals & mining industries are selling at what we believe to be overly optimistic prices. For the six-month period ending April 30, 2006, both the oil gas & consumable fuels and metals & mining industry components of the Index climbed by more than 50%, or more than 100% on an annualized basis. We do not believe current valuations support the prices for many firms in these industries; in other words, we find firms in these industries expensive. We believe quality businesses with attractive margins of safety represent compelling opportunities for long-term gains.
While we monitor short-term events in emerging markets, our investment philosophy focuses on company-by-company analysis. We take a long-term perspective and believe that none or very little of the short-term “market news” provides useful information to investors.
10
PORTFOLIO MANAGERS’ REPORT | | ING EMERGING COUNTRIES FUND |
| | |
| Average Annual Total Returns for the Periods Ended April 30, 2006 | |
| | | |
| | | | | | | | | Since Inception | | Since Inception | |
| | | | | | | | | of Class I | | of Class M | |
| | | 1 Year | | 5 Year | | 10 Year | | December 21, 2005 | | August 5, 2002 | |
| | | | | | | | | | | | |
| Including Sales Charge: | | | | | | | | | | | |
| Class A(1) | | 30.83 | % | | 14.82 | % | | 7.62 | % | | — | | | — | | |
| Class B(2) | | 32.83 | % | | 15.28 | % | | 7.67 | % | | — | | | — | | |
| Class C(3) | | 36.82 | % | | 15.22 | % | | 7.53 | % | | — | | | — | | |
| Class I | | — | | | — | | | — | | | 17.05 | % | | — | | |
| Class M(4) | | 33.32 | % | | — | | | — | | | — | | | 24.88 | % | |
| Class Q | | 39.03 | % | | 16.34 | % | | 8.56 | % | | — | | | — | | |
| Excluding Sales Charge: | | | | | | | | | | | | | | | | |
| Class A | | 38.83 | % | | 16.19 | % | | 8.26 | % | | — | | | — | | |
| Class B | | 37.83 | % | | 15.51 | % | | 7.67 | % | | — | | | — | | |
| Class C | | 37.82 | % | | 15.22 | % | | 7.53 | % | | — | | | — | | |
| Class I | | — | | | — | | | — | | | 17.05 | % | | — | | |
| Class M | | 38.14 | % | | — | | | — | | | — | | | 26.07 | % | |
| Class Q | | 39.03 | % | | 16.34 | % | | 8.56 | % | | — | | | — | | |
| MSCI EM IndexSM(5) | | 62.89 | % | | 24.09 | % | | 7.88 | % | | 20.12 | %(6) | | 36.03 | %(7) | |
| | | | | | | | | | | | | | | | | |
Based on a $10,000 initial investment, the table above illustrates the total return of ING Emerging Countries Fund against the index indicated. The index is unmanaged and has no cash in its portfolio, imposes no sales charge and incurs no operating expenses. An investor cannot invest directly in the index. The Fund’s performance is shown both with and without the imposition of sales charges.
The performance table does not reflect the deduction of taxes that a shareholder will pay on Fund distributions or the redemption of Fund shares.
The performance shown may include the effect of fee waivers and/or expense reimbursements by the Investment Manager and/or other service providers, which have the effect of increasing total return. Had all fees and expenses been considered, the total returns would have been lower.
Performance data represents past performance and is no assurance of future results. Investment return and principal value of an investment in the Fund will fluctuate. Shares, when sold, may be worth more or less than their original cost. The Fund’s current performance may be lower or higher than the performance data shown. Please log on to www.ingfunds.com or call (800) 992-0180 to get performance through the most recent month end.
This report contains statements that may be “forward-looking” statements. Actual results may differ materially from those projected in the “forward-looking” statements.
The views expressed in this report reflect those of the portfolio managers, only through the end of the period as stated on the cover. The portfolio managers’ views are subject to change at any time based on market and other conditions.
Fund holdings are subject to change daily.
(1) | | Reflects deduction of the maximum Class A sales charge of 5.75%. |
| | |
(2) | | Reflects deduction of the Class B deferred sales charge of 5% and 2%, respectively, for the 1 year and 5 year returns. |
| | |
(3) | | Reflects deduction of the Class C deferred sales charge of 1% for the 1 year return. |
| | |
(4) | | Reflects deduction of the maximum Class M sales charge of 3.50%. |
| | |
(5) | | The MSCI EM IndexSM is an unmanaged index that measures the performance of securities listed on exchanges in developing nations throughout the world. |
| | |
(6) | | Since inception performance for index is shown from January 1, 2006. |
| | |
(7) | | Since inception performance for index is shown from August 1, 2002. |
Prior to March 1, 2005, the Fund was advised by a different sub-adviser.
11
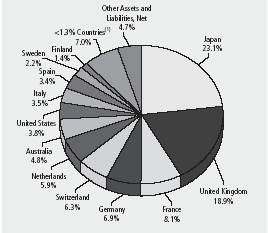
ING FOREIGN FUND | | PORTFOLIO MANAGERS’ REPORT |
Country Allocation
as of April 30, 2006
(as a percent of net assets)
* Includes securities lending collateral.
(1) Includes eleven countries, which each represents 1.0%-2.4% of net assets.
(2) Includes twenty-two countries, which each represents < 1.0% of net assets.
Portfolio holdings are subject to change daily.
ING Foreign Fund (the “Fund”) seeks long-term growth of capital by investing primarily in equity securities tied economically to countries outside the United States. The Fund is managed by Rudolph-Riad Younes, CFA, Senior Vice President and Head of International Equity and Richard Pell, Senior Vice President and Chief Investment Officer, both with Julius Baer Investment Management LLC, — the Sub-Adviser.
Performance: For the six months ended April 30, 2006, the Fund’s Class A shares, excluding sales charges, provided a total return of 26.87% compared to the Morgan Stanley Capital International — Europe, Australasia and Far East® Index (“MSCI EAFE® Index”), which returned 23.10% for the same period.
Portfolio Specifics: Emerging European markets positively impacted results. Specifically, Russia, Turkey, Poland and Romania were all solid performers, although the Czech Republic and Hungary were exceptions. Our decision to underweight the United Kingdom also supported results. Stock selection within Germany, Italy, France and Norway was also a positive contributor. However, the small liquidity position held by the Fund proved to be a detractor to performance amid such a strong backdrop for equities.
From a sector perspective, banks in Eastern and Central Europe as well as Italian banks supported results. Stock selection within the energy sector also had a positive impact given positions in Russia and Norway in particular. Stock selection within utilities, telecommunication services and industrials also had a positive impact on performance. However, our underweight to information technology detracted from results as this sector was strong for the period.
In terms of stock selection, several positions within Russia contributed to results. Specifically, Sberbank, the country’s largest lender, provided strong results over the period. Also, within the energy sector, shares of Gazprom ADR and Lukoil ADR (Russia) were strong performers. In addition, positions held in P.K.O. Bank Polski (Poland) and Akbank T.A.S. (Turkey) were also supportive of results, and reflect our optimism toward the region. Within Germany, Fraport, the German airport operator whose properties include the European hub in Frankfurt, positively contributed to results.
Within the emerging markets, shares of Komercni Banka A.S., the third-largest Czech bank, RAO Unified Energy System (Russia), OTP Bank (Hungary), Eastern Europe’s largest lender by market value, and Magyar Telekom Communications, Hungary’s largest phone company, underperformed the Index over the period.
Shares of Aiful Corp. Japan’s largest consumer lender, detracted from results. Aiful reported a drop in third quarter net income, negatively impacting performance. Additionally, within the spirits industry, our overweight to Pernod Ricard (France) and Diageo (UK) detracted from results.
Current Strategy and Outlook: Our bottom-up approach to security selection within developed markets has continued to support investments in several areas. Infrastructure-related companies such as airport and seaport operators are likely beneficiaries given the increase in global travel and trade. We believe construction companies are also attractive. With funding-related challenges, public authorities are engaging private companies for the construction of toll roads. Another area of interest is the cement industry, which has been slowly consolidating leading to more pricing discipline and additional capacity.
We anticipate the luxury goods industry will enjoy strong growth driven by the expected increase in purchasing power of consumers from emerging economies. The global spirits industry is also likely to benefit as consumers in emerging economies grow in wealth and increase consumption of top brands as a show of status. Italian banks are another area of interest where we anticipate a wave of consolidations over the next few years.
From a regional perspective, we are comfortable with our underweight to Japan. While the economy has certainly improved, we find the market already reflects these positive developments, and find valuations to be demanding versus Europe. Finally, within emerging markets, we remain constructive toward Eastern and Central Europe as beneficiaries of the drive to reunite Europe.
12
PORTFOLIO MANAGERS’ REPORT | | ING FOREIGN FUND |
| | |
| Average Annual Total Returns for the Periods Ended April 30, 2006 | |
| | | | | | | | | | | | | |
| | | | Since Inception | | Since Inception | | Since Inception | | Since Inception | | Since Inception | |
| | | | of Class A | | of Class B | | of Class C | | of Class I | | of Class Q | |
| | 1 Year | | July 1, 2003 | | July 8, 2003 | | July 7, 2003 | | September 8, 2003 | | July 10, 2003 | |
| | | | | | | | | | | | | |
| Including Sales Charge: | | | | | | | | | | | | | |
| Class A(1) | | 32.80 | % | | 22.99 | % | | — | | | — | | | — | | | — | | |
| Class B(2) | | 34.87 | % | | — | | | 22.88 | % | | — | | | — | | | — | | |
| Class C(3) | | 38.81 | % | | — | | | — | | | 23.72 | % | | — | | | — | | |
| Class I | | 41.21 | % | | — | | | — | | | — | | | 25.25 | % | | — | | |
| Class Q | | 40.93 | % | | — | | | — | | | — | | | — | | | 25.27 | % | |
| Excluding Sales Charge: | | | | | | | | | | | | | | | | | | | |
| Class A | | 40.87 | % | | 25.58 | % | | — | | | — | | | — | | | — | | |
| Class B | | 39.87 | % | | — | | | 23.61 | % | | — | | | — | | | — | | |
| Class C | | 39.81 | % | | — | | | — | | | 23.72 | % | | — | | | — | | |
| Class I | | 41.21 | % | | — | | | — | | | — | | | 25.25 | % | | — | | |
| Class Q | | 40.93 | % | | — | | | — | | | — | | | — | | | 25.27 | % | |
| MSCI EAFE® Index(4) | | 34.00 | % | | 27.74 | %(5) | | 27.39 | %(5) | | 27.74 | %(5) | | 27.39 | %(6) | | 27.74 | %(5) | |
| | | | | | | | | | | | | | | | | | | | |
Based on a $10,000 initial investment, the table above illustrates the total return of ING Foreign Fund against the index indicated. The index is unmanaged and has no cash in its portfolio, imposes no sales charge and incurs no operating expenses. An investor cannot invest directly in the index. The Fund’s performance is shown both with and without the imposition of sales charges.
The performance table does not reflect the deduction of taxes that a shareholder will pay on Fund distributions or the redemption of Fund shares.
The performance shown may include the effect of fee waivers and/or expense reimbursements by the Investment Manager and/or other service providers, which have the effect of increasing total return. Had all fees and expenses been considered, the total returns would have been lower.
Performance data represents past performance and is no assurance of future results. Investment return and principal value of an investment in the Fund will fluctuate. Shares, when sold, may be worth more or less than their original cost. The Fund’s current performance may be lower or higher than the performance data shown. Please log on to www.ingfunds.com or call (800) 992-0180 to get performance through the most recent month end.
It is important to note that the Fund has a limited operating history. Performance over a longer period of time may be more meaningful than short-term performance.
This report contains statements that may be “forward-looking” statements. Actual results may differ materially from those projected in the “forward-looking” statements.
The views expressed in this report reflect those of the portfolio managers, only through the end of the period as stated on the cover. The portfolio managers’ views are subject to change at any time based on market and other conditions.
Fund holdings are subject to change daily.
(1) | | Reflects deduction of the maximum Class A sales charge of 5.75%. |
| | |
(2) | | Reflects deduction of the Class B deferred sales charge of 5% and 3%, respectively, for the 1 year and since inception returns. |
| | |
(3) | | Reflects deduction of the Class C deferred sales charge of 1% for the 1 year return. |
| | |
(4) | | The MSCI EAFE® Index is an unmanaged index that measures the performance of securities listed on exchanges in Europe, Australasia and the Far East. |
| | |
(5) | | Since inception performance for index is shown from July 1, 2003. |
| | |
(6) | | Since inception performance for index is shown from September 1, 2003. |
13
ING GREATER CHINA FUND | | PORTFOLIO MANAGERS’ REPORT |
Country Allocation
as of April 30, 2006
(as a percent of net assets)
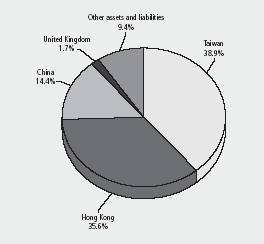
Portfolio holdings are subject to change daily.
ING Greater China Fund (the “Fund”) seeks long-term capital appreciation. The Fund is managed by Nick Toovey, CFA, Bratain Sanyal, Oscar Leung Kin Fai, CFA, and Michael Hon Lung Chiu, CFA, ING Investment Management Asia/Pacific (Hong Kong) Limited — the Sub-Adviser.
Performance: From December 21, 2005, the inception of the Fund, to April 30, 2006, the Fund’s Class A shares, excluding sales charges, provided a total return of 21.30% compared to the MSCI All Countries Golden Dragon Net Dividend Reinvested Index, which returned 16.50% for the same period.
Portfolio Specifics: The Fund launched at the end of 2005 under fairly positive economic conditions. The macroeconomic figures announced by China during the 6 months period ended April 30, 2006 were broadly positive. Fourth quarter 2005 gross domestic product (“GDP”) growth of China surprised the market on the upside, rising 9.9% Year-on-Year (“YoY”), up from the 9.8% YoY growth in the previous quarter. For the full year 2005, China reported 9.9% growth in GDP, placing the country as the fourth largest economy in the world. First quarter 2006 GDP growth was 10.2% YoY in China. Fixed asset investment as well as money supply growth also remained strong in first quarter 2006. To avoid potential overheating, Peoples Bank of China, (the central bank of China) took a pre-emptive move by announcing a 27 basis points increase in bank lending rate in April. The Chinese government finally came up with a policy to allow local Chinese money to invest in overseas markets through the Qualified Domestic Institutional Investor (QDII) scheme. Economic growth in Hong Kong remained on track during the period with stable inflation and employment trends. GDP growth in fourth quarter 2005 came in at 7.6% YoY, following the stellar growth of 8.3% YoY in third quarter 2005. First quarter 2006 GDP growth was 8.2% YoY in Hong Kong. However, due to the continuous rise in interest rates, the property sector suffered in the period after its strong run since third quarter 2003. In Taiwan GDP growth in fourth quarter 2005 came in higher than forecast at 6.4% YoY up from 4.4% YoY in the previous quarter. First quarter 2006 GDP growth was 4.9% YoY in Taiwan. On the corporate front, technology companies such as AU Optronics and Siliconware Precision reported better than expected numbers for fourth quarter 2005 with higher capacity utilization and stabilization in product prices. Performance of the Taiwan banking sector was choppy during the period, with negative surprises coming from higher delinquencies of consumer lending while hopes of industry consolidation remained in place.
The Fund’s outperformance against the benchmark was mainly due to stock selection, which added substantial value in each territory.
In terms of performance attribution, our overweight in China and relative underweight in Hong Kong and Taiwan worked well for the Fund from a country selection perspective. Our overweight in the property sectors in China and Taiwan have also contributed positively to performance. In Taiwan, stock selection in the Computer Hardware sub-sector was particularly beneficial. Selected technology names with a focus on mobile communications performed well and have added value, while our overweight in some of the computer manufacturing companies detracted value as they underperformed. In Hong Kong favorable selection among the banks, (partially offset by an allocation to non-benchmark HSBC) and the underweight of a major industrial conglomerate helped relative performance. In China, stock selection gains arose mostly from overweighting Real Estate Management and Development companies and a Metals company which more than doubled in value during the period. Export oriented companies in China also underperformed a rising market due to concerns over Chinese RMB appreciation and higher raw material costs and have contributed negatively.
Current Strategy and Outlook: The Fund continues to favor China because of its strong macroeconomic outlook. The recently announced first quarter 2006 GDP growth and the fixed asset investment growth surprised the market on the upside. As a result, the market widely believes that the recent increase in Chinese interest rate would help cool down the vibrant economy. Nevertheless, we remain bullish on the medium-term outlook for the Chinese markets from a liquidity standpoint. Hong Kong may continue to struggle in the near term due to concerns over a prolonged period of U.S. interest rate hikes. Real estate related stocks in Taiwan are gaining more traction recently thanks to the appreciation of Taiwan dollar as well as hopes of an improvement in cross strait relationship. Technology stocks in Taiwan were hampered by the worse than expected results from the U.S. heavyweights such as Intel. Insurance companies look more promising on a relative basis due to their real asset holdings and improvement in interest rates. Overall, we remain neutral in Taiwan as a market with a preference for domestic plays.
14
PORTFOLIO MANAGERS’ REPORT | | ING GREATER CHINA FUND |
| | |
| Cumulative Total Returns for the Periods Ended April 30, 2006 | |
| | | | | | | |
| | Since Inception | | Since Inception | | Since Inception | |
| | of Class A | | of Class B | | of Class C | |
| | December 21, 2005 | | January 6, 2006 | | January 11, 2006 | |
| | | | | | | |
| Including Sales Charge: | | | | | | | |
| Class A(1) | | 14.33 | % | | — | | | — | | |
| Class B(2) | | — | | | 9.25 | % | | — | | |
| Class C(3) | | — | | | — | | | 12.59 | % | |
| Excluding Sales Charge: | | | | | | | | | | |
| Class A | | 21.30 | % | | — | | | — | | |
| Class B | | — | | | 14.25 | % | | — | | |
| Class C | | — | | | — | | | 13.50 | % | |
| MSCI All Countries Golden Dragon Index | | 16.50 | %(5) | | 16.50 | %(5) | | 16.50 | %(5) | |
| | | | | | | | | | | |
Based on a $10,000 initial investment, the table above illustrates the total return of ING International SmallCap Fund against the Indicies indicated. The index is unmanaged and has no cash in its portfolio, imposes no sales charge and incurs no operating expenses. An investor cannot invest directly in the index. The Fund’s performance is shown both with and without the imposition of sales charges.
The performance table does not reflect the deduction of taxes that a shareholder will pay on Fund distributions or the redemption of Fund shares.
The performance shown may include the effect of fee waivers and/or expense reimbursements by the Investment Manager and/or other service providers, which have the effect of increasing total return. Had all fees and expenses been considered, the total returns would have been lower.
Performance data represents past performance and is no assurance of future results. Investment return and principal value of an investment in the Fund will fluctuate. Shares, when sold, may be worth more or less than their original cost. The Fund’s current performance may be lower or higher than the performance data shown. Please log on to www.ingfunds.com or call (800) 992-0180 to get performance through the most recent month end.
It is important to note that the Fund has a limited operating history. Performance over a longer period of time may be more meaningful than short-term performance.
This report contains statements that may be “forward-looking” statements. Actual results may differ materially from those projected in the “forward-looking” statements.
The views expressed in this report reflect those of the portfolio managers, only through the end of the period as stated on the cover. The portfolio managers’ views are subject to change at any time based on market and other conditions.
Fund holdings are subject to change daily.
(1) | | Reflects deduction of the maximum Class A sales charge of 5.75%. |
| | |
(2) | | Reflects deduction of the Class B deferred sales charge of 5%. |
| | |
(3) | | Reflects deduction of the Class C deferred sales charge of 1%. |
| | |
(4) | | The MSCI All Countries Golden Dragon Index is a broad-based, unmanaged index of common stocks traded in China, Hong Kong and Taiwan. |
| | |
(5) | | Since inception performance for the index is shown from January 1, 2006. |
15
ING INDEX PLUS INTERNATIONAL EQUITY FUND | | PORTFOLIO MANAGERS’ REPORT |
Country Allocation
as of April 30, 2006
(as a percent of net assets)
(1) Includes twelve industries, which each represents < 1.3% of net assets.
Portfolio holdings are subject to change daily.
ING Index Plus International Equity Fund (the “Fund”) seeks to exceed the benchmark for developed markets outside the United States (the MSCI EAFE) while maintaining a market level of risk and characteristics comparable to the index. The Fund is managed by Carl Ghielen and Martin Jansen, ING Investment Management Advisors B.V. — the Sub-Adviser.
Performance: From December 21, 2005, the inception of the Fund, to April 30, 2006 the Fund’s Class A shares, excluding sales charges, provided a total return of 12.20% compared to the MSCI EAFE Index, which returned 14.78% for the same period.
Portfolio Specifics: The Fund’s strategy is designed to add value to the MSCI EAFE benchmark through bottom-up security selection on the basis of customized sector models while maintaining approximate benchmark weights of countries, sectors and industries represented in the benchmark. The active risk is substantially controlled by the relatively large number of securities in the Fund (between 340 and 430). As a first step, the best ranked 200 stocks are selected for inclusion across countries, sectors and industries. To ensure that appropriate index weights and an index-like profile are maintained, an additional 140-230 of the next most attractive securities are added. The Fund is rebalanced monthly to maintain the desired tilt to stocks ranking well in the individual sectors and industries represented in the benchmark.
The Fund’s return underperformed the benchmark in the six months ended April 30, 2006. Apart from the negative impact of residual cash in a strongly rising market, this shortfall was attributable almost entirely to value lost within the sectors, as by design the country and sector neutral construction of the portfolio does not add value.
The predictive power of the individual factors included in each of the international sector models for a particular reporting period substantially determines the stock selection result in each sector. For this reporting period, our positioning in the financials had the largest negative impact, due largely to adverse ranking outcomes of the change in return on invested capital and historic price/earnings ratio factors used in the sector model. The earnings and cash flow variables used in the health care and industrial sectors also detracted from the outcome, as did the earnings momentum and price reversal factors in the consumer discretionary sector. On the positive side, our ranking model in materials proved especially effective as earnings, cash flow and dividend yield factors combined to select stocks successfully. The change in return on invested capital and EBITDA/price factors drove successful stock selection in the energy sector. The selection results from the utilities, telecommunication services, and consumer staples sectors also contributed marginally.
Current Strategy and Outlook: By design, the Fund maintains approximate benchmark weights of the countries, economic sectors and industries constituting the MSCI EAFE, and is expected to track the benchmark relatively closely. Stock selection flows from the in-sector/industry ranking models. Fund construction and risk control seek to ensure the characteristics of the Fund remain within an acceptable band around the benchmark. Our most attractively ranked stocks may have individual overweights of up to 100 basis points, while for risk control purposes the maximum allowable underweight per security is 50 basis points. Within this context, the Fund currently has a modest tilt towards lower valuation and smaller capitalization stocks and has a resultant modest focus on stocks linked primarily to local economies. The current portfolio of stocks has generated an historic earnings growth slightly higher than the index, and carries a dividend yield similar to the index.
16
PORTFOLIO MANAGERS’ REPORT | | ING INDEX PLUS INTERNATIONAL EQUITY FUND |
| | | | | |
| Cumulative Total Returns for the Periods Ended April 30, 2006 | |
| | | | | |
| | Since Inception | | Since Inception | |
| | of Class A & I | | of Class B & C | |
| | December 21, 2005 | | January 12, 2006 | |
| | | | | |
| Including Sales Charge: | | | | | |
| Class A(1) | | 5.75 | % | | — | | |
| Class B(2) | | — | | | 2.38 | % | |
| Class C(3) | | — | | | 6.29 | % | |
| Class I | | 12.20 | % | | — | | |
| Excluding Sales Charge: | | | | | | | |
| Class A | | 12.20 | % | | — | | |
| Class B | | — | | | 7.38 | % | |
| Class C | | — | | | 7.29 | % | |
| Class I | | 12.20 | % | | — | | |
| MSCI EAFE® Index(4) | | 14.78 | %(5) | | 14.78 | %(5) | |
| | | | | | | | |
Based on a $10,000 initial investment, the table above illustrates the total return of ING International SmallCap Fund against the Index indicated. The index is unmanaged and has no cash in its portfolio, imposes no sales charge and incurs no operating expenses. An investor cannot invest directly in the index. The Fund’s performance is shown both with and without the imposition of sales charges.
The performance table does not reflect the deduction of taxes that a shareholder will pay on Fund distributions or the redemption of Fund shares.
The performance shown may include the effect of fee waivers and/or expense reimbursements by the Investment Manager and/or other service providers, which have the effect of increasing total return. Had all fees and expenses been considered, the total returns would have been lower.
Performance data represents past performance and is no assurance of future results. Investment return and principal value of an investment in the Fund will fluctuate. Shares, when sold, may be worth more or less than their original cost. The Fund’s current performance may be lower or higher than the performance data shown. Please log on to www.ingfunds.com or call (800) 992-0180 to get performance through the most recent month end.
It is important to note that the Fund has a limited operating history. Performance over a longer period of time may be more meaningful than short-term performance.
This report contains statements that may be “forward-looking” statements. Actual results may differ materially from those projected in the “forward-looking” statements.
The views expressed in this report reflect those of the portfolio managers, only through the end of the period as stated on the cover. The portfolio managers’ views are subject to change at any time based on market and other conditions.
Fund holdings are subject to change daily.
(1) | | Reflects deduction of the maximum Class A sales charge of 5.75%. |
| | |
(2) | | Reflects deduction of the Class B deferred sales charge of 5% and 2%, respectively, for the 1 year and 5 year returns. |
| | |
(3) | | Reflects deduction of the Class C deferred sales charge of 1% for the 1 year return. |
| | |
(4) | | The MSCI EAFE® Index is an unmanaged index that measures the performance of securities listed on exchanges in markets in Europe, Australasia and the Far East. |
| | |
(5) | | Since inception performance for the index is shown from January 1, 2006. |
17
ING INTERNATIONAL FUND | | PORTFOLIO MANAGERS’ REPORT |
Country Allocation
as of April 30, 2006
(as a percent of net assets)
Japan | | 22.6 | % |
United Kingdom | | 18.4 | % |
Germany | | 8.8 | % |
United States | | 8.1 | % |
Switzerland | | 7.4 | % |
France | | 7.2 | % |
Australia | | 3.9 | % |
Netherlands | | 3.5 | % |
Belgium | | 2.5 | % |
Finland | | 2.3 | % |
Hong Kong | | 2.3 | % |
1.3%-2.1% Industries(1) | | 10.6 | % |
<1.3% Industries(2) | | 4.3 | % |
Other Assets and Liabliites, Net* | | (1.9 | )% |
* Includes securities lending collateral.
(1) Includes seven countries, which each represents 1.3%-2.1% of net assets.
(2) Includes five countries, which each represents <1.3% of net assets.
Portfolio holdings are subject to change daily.
ING International Fund (the “Fund”) seeks long-term growth of capital through investment in equity securities and equity equivalents of companies outside the U.S. Before April 28, 2006, Philip Schwartz, CFA and Richard Saler managed the Fund, ING Investment Management Co. — the Sub-Adviser.*
Performance: For the six-month period ended April 30, 2006, the Fund’s Class A shares, excluding sales charges, provided a total return of 22.48% compared to the MSCI EAFE Index, which returned 23.10% for the same period.
Portfolio Specifics: Rising investor confidence and an improving economic outlook in Europe and Japan led to a strong advance of the cyclically sensitive sectors.
Our regional positioning proved successful during the period as the Fund benefitted from our allocation to emerging market stocks. Our move from an underweight of developed Asia to a modest overweight position added to performance. We remained underweight Europe as well, which also proved effective. Stock selection was particularly beneficial within developed Asia and Japan during this period but it was weak in European Markets.
However, our sector strategy reacted negatively while we obtained positive results from successful stock selection. The positive contributions from our overweight of the financials and underweight of the telecom services sectors were offset by our underweight of the strong industrials sector. Positive selection outcome came mainly from stocks within the materials, telecom services and financials sectors. The sectors that detracted most from value were the health care, energy and utilities sectors.
At the security level, one of our largest contributions came from our holding in Nordea Bank AB, a Swedish bank, following announcements of higher profits and an increased dividend. Another positive contributor was Amada Co. Ltd., a Japanese industrial company, following increased income due to higher orders as both domestic and overseas capital expenditures hit higher levels. Another significant individual contributor was NHN Corp., a Korean web search engine, due mostly to rumors that Google was going to initiate a hostile takeover of the firm. Among the major detractors were Cadbury Schweppes, and British telecom company, Vodafone Group PLC, after a decrease in profits. Another negative contributor was Acom Co. Ltd., a Japanese consumer finance firm after the Japanese government announced plans to limit consumer lending.
Current Strategy and Outlook: Uri Landesman assumed responsibility for management of the Fund on May 1, 2006, the day following the last day of the period covered by this report. As portfolio manager he intends to reshape the Fund profile toward large cap growth stocks. Accordingly, we expect that the fundamental characteristics of the portfolio will be consistent with an emphasis on companies with earnings growth rates that are faster than the average for companies in broad international benchmarks such as the MSCI EAFE International Index. Further, stock selection screens will rank stocks on the basis of free cash flow generation, earnings momentum and price momentum to determine a shorter list of purchase candidates for more intensive analysis. Ultimately, the portfolio will differ from its starting point in several ways. For instance, faster rates of growth suggest that price-to-book value, price-to-cash flow and price-to-earnings ratios will be higher, and dividend yield will be lower, features that are consistent with a growth-biased portfolio. We also expect average market capitalization to be lower than that of the original portfolio. Generally the Fund will assume a regionally neutral stance, but we expect to maintain overweight positions in growth-oriented sectors such as consumer discretionary, health care and information technology. Conversely, we intend to maintain underweight positions in more value-oriented sectors such as energy, financials and utilities.
Over very long periods, the outlook for an international growth strategy is not materially different from a core strategy. However, over shorter periods, the growth strategy tends to be favored when investors prefer high quality companies and when international economies and markets are healthy and the portfolio benefits from expanding stock valuations and reported growth rates that exceed analyst estimates. In any event, we believe the emphasis on growth stocks will provide dependable opportunities to provide good performance in most market environments.
* As of May 1, 2006 Uri Landesman, head of international equity, is managing the Fund.
18
PORTFOLIO MANAGERS’ REPORT | | ING INTERNATIONAL FUND |
| | | | | | | | | | | | | | | |
| Average Annual Total Returns for the Periods Ended April 30, 2006 | |
| | | | | | | | | | | | | | | |
| | | | | | | | Since Inception | | Since Inception | | Since Inception | | Since Inception | |
| | | | | | | | of Class B | | of Class C | | of Class Q | | of Class I | |
| | 1 Year | | 5 Year | | 10 Year | | August 22, 2000 | | September 15, 2000 | | February 26, 2001 | | January 15, 2002 | |
| | | | | | | | | | | | | | | |
| Including Sales Charge: | | | | | | | | | | | | | | | |
| Class A(1) | | 24.18 | % | | 5.61 | % | | 7.50 | % | | — | | | — | | | — | | | — | | |
| Class B(2) | | 25.66 | % | | 5.53 | % | | — | | | 2.31 | % | | — | | | — | | | — | | |
| Class C(3) | | 29.56 | % | | 5.85 | % | | — | | | — | | | 3.42 | % | | — | | | — | | |
| Class I | | 32.07 | % | | — | | | — | | | — | | | — | | | — | | | 12.67 | % | |
| Class Q | | 31.76 | % | | 6.91 | % | | — | | | — | | | — | | | 6.40 | % | | — | | |
| Excluding Sales Charge: | | | | | | | | | | | | | | | | | | | | | | |
| Class A | | 31.73 | % | | 6.88 | % | | 8.14 | % | | — | | | — | | | — | | | — | | |
| Class B | | 30.66 | % | | 5.85 | % | | — | | | 2.46 | % | | — | | | — | | | — | | |
| Class C | | 30.56 | % | | 5.85 | % | | — | | | — | | | 3.42 | % | | — | | | — | | |
| Class I | | 32.07 | % | | — | | | — | | | — | | | — | | | — | | | 12.67 | % | |
| Class Q | | 31.76 | % | | 6.91 | % | | — | | | — | | | — | | | 6.40 | % | | — | | |
| MSCI EAFE® Index(4) | | 34.00 | % | | 9.59 | % | | 7.03 | % | | 5.49 | %(5) | | 5.49 | %(5) | | 9.26 | %(6) | | 15.31 | %(7) | |
| | | | | | | | | | | | | | | | | | | | | | | |
Based on a $10,000 initial investment, the table above illustrates the total return of ING International Fund against the index indicated. The index is unmanaged and has no cash in its portfolio, imposes no sales charge and incurs no operating expenses. An investor cannot invest directly in the index. The Fund’s performance is shown both with and without the imposition of sales charges.
The performance table does not reflect the deduction of taxes that a shareholder will pay on Fund distributions or the redemption of Fund shares.
The performance shown may include the effect of fee waivers and/or expense reimbursements by the Investment Manager and/or other service providers, which have the effect of increasing total return. Had all fees and expenses been considered, the total returns would have been lower.
Performance data represents past performance and is no assurance of future results. Investment return and principal value of an investment in the Fund will fluctuate. Shares, when sold, may be worth more or less than their original cost. The Fund’s current performance may be lower or higher than the performance data shown. Please log on to www.ingfunds.com or call (800) 992-0180 to get performance through the most recent month end.
This report contains statements that may be “forward-looking” statements. Actual results may differ materially from those projected in the “forward-looking” statements.
The views expressed in this report reflect those of the portfolio managers, only through the end of the period as stated on the cover. The portfolio managers’ views are subject to change at any time based on market and other conditions.
Fund holdings are subject to change daily.
(1) | | Reflects deduction of the maximum Class A sales charge of 5.75%. |
| | |
(2) | | Reflects deduction of the Class B deferred sales charge of 5% and 1%, respectively, for the 1 year and since inception returns. |
| | |
(3) | | Reflects deduction of the Class C deferred sales charge of 1% for the 1 year return. |
| | |
(4) | | The MSCI EAFE® Index is an unmanaged index that measures the performance of securities listed on exchanges in markets in Europe, Australasia and the Far East. |
| | |
(5) | | Since inception performance for the index is shown from September 1, 2000. |
| | |
(6) | | Since inception performance for the index is shown from March 1, 2001. |
| | |
(7) | | Since inception performance for the index is shown from January 1, 2002. |
Effective November 1, 2001, Class A shares liquidated within 30 days of purchase are subject to a 2% redemption fee.
Prior to July 26, 2000, the Fund was advised by a different sub-adviser.
19
ING INTERNATIONAL CAPITAL APPRECIATION FUND | | PORTFOLIO MANAGERS’ REPORT |
Country Allocation
as of April 30, 2006
(as a percent of net assets)
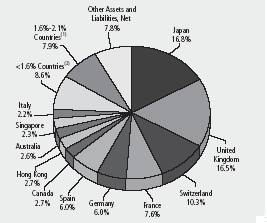
(1) Includes four countries, which each represents 1.6%-2.1% of net assets.
(2) Includes eight countries, which each represents < 1.6% of net assets.
Portfolio holdings are subject to change daily.
ING International Capital Appreciation Fund (the “Fund”) seeks capital appreciation through equity securities of companies located in a number of different countries other than the U.S. The Fund is managed by Thomas Tibbles, CFA, Portfolio Manager, Barry A. Lockhart, CFA, Trevor Graham, CFA, and Patrick Tan, Hansberger Global Investors (“HGI”) — the Sub-Adviser.
Performance: From December 21, 2005, the inception of the Fund, to April 30, 2006, the Fund’s Class A shares, excluding sales charges, provided a total return of 9.40% compared to the Morgan Stanley Capital International (“MSCI”) All Country World Ex U.S. Index, which returned 15.42% for the same period.
Portfolio Specifics: Looking back over the first four months since inception of the Fund, the period provided favorable returns for international equity investors. All sectors and regions provided positive absolute returns. Emerging Markets led the way regionally and from a sector perspective, the Energy, Industrials, Materials and Utilities sectors were the strongest performing sectors on an absolute basis.
Hansberger’s Growth strategy invests in companies that are industry leaders that have the ability to generate sustainable earnings growth. Our analytical resources are dedicated to those companies that, in our view, have demonstrated sustainable competitive advantages in their industries. For the period under review smaller capitalization and lower quality names surged ahead and the Fund trailed these names that do not meet our strict investment criteria. In addition, several of our stocks under-performed the broad benchmark and detracted from both absolute and relative performance. The Fund’s overweight in Information Technology and stock selection in this sector also had a negative impact on performance. On a relative basis the Consumer Discretionary, Materials and Health Care Sectors joined Information Technology as the largest under-performers relative to the benchmark for the period while Industrials and Utilities were the top relative performing sectors for the Fund. The out-performance in Industrials and Utilities was driven by strong stock selection.
The Fund’s leading contributors to performance for the period came primarily from the Industrials, Energy and Materials sectors. The best performing stock was Denmark based Vestas Wind Systems (Industrials) followed by Brazilian based pulp producer Aracruz Celulose (Materials). The lagging contributors tended to come from an eclectic mix of stocks whose weakness tended to be company-specific. The worst performing stocks for the period under review were Nidec (InformationTechnology), followed by Carnival PLC (Consumer Discretionary).
Since the Fund has only recently been established, new cash contributions had a negative impact on performance. Also the decline of the US dollar relative to other benchmark currencies also had a negative impact on performance.
Current Strategy and Outlook: The remainder of 2006 brings many global economic factors into view. High energy and commodity prices (and their potential impact on inflation and interest rates), apparent structural imbalances in trade flows (and the concerns over the future of the current state of multi-lateral trade), potential currency fluctuations (specifically in the U.S. dollar and the Chinese renminbi) may prove to be a challenging environment for global financial assets; both equity and bonds. In addition, there still remains the geopolitical risk that is contained in the Iranian nuclear situation and Venezuela’s current political stance. We believe that balancing these risks is the fact that global growth continues to be quite strong and inflation, specifically wage inflation, remains relatively benign. What is clear in our opinion, however, is that a solid understanding of corporate fundamentals, market positioning, and growth at an individual company level is, and shall continue to be, the most effective way to consistently add value to Fund performance over the long term. The management team of the Fund will continue to monitor the situations of our high quality universe of companies in order to take advantage of opportunities to add stocks of these companies to the Fund at reasonable valuation levels.
In our opinion, the Fund continues to be structured favorably in the event that risk premiums widen in global equity markets in the future. The Fund remains slightly underweight in the Basic Materials and Industrials Sectors. This allows the Fund to be opportunistic in these areas in the event that prices in high quality companies become attractive throughout the year. In interest rate sensitive areas, such as Financials and Utilities, the Fund is also positioned with a relative underweight versus the benchmark. The largest relative overweight positions in the Fund are currently Information Technology, Consumer Discretionary and Healthcare sectors, all of which are the result of a collection of very company specific growth profiles. In general, the Fund remains fully invested in equities of reasonably priced, high quality companies that have, in our view, demonstrated their ability to create their own opportunities for growth over the long term.
20
PORTFOLIO MANAGERS’ REPORT | | ING INTERNATIONAL CAPITAL APPRECIATION FUND |
| | | | | | | |
| Cumulative Total Returns for the Periods Ended April 30, 2006 | |
| | | | | | | |
| | Since Inception | | Since Inception | | Since Inception | |
| | of Class A & I | | of Class B | | of Class C | |
| | December 21, 2005 | | January 9, 2006 | | January 24, 2006 | |
| | | | | | | |
| Including Sales Charge: | | | | | | | |
| Class A(1) | | 3.11 | % | | — | | | — | | |
| Class B(2) | | — | | | 0.30 | % | | — | | |
| Class C(3) | | — | | | — | | | 5.13 | % | |
| Class I | | 9.50 | % | | — | | | — | | |
| Excluding Sales Charge: | | | | | | | | | | |
| Class A | | 9.40 | % | | — | | | — | | |
| Class B | | — | | | 4.70 | % | | — | | |
| Class C | | — | | | — | | | 6.13 | % | |
| Class I | | 9.50 | % | | — | | | — | | |
| MSCI All Country World ex US Index®(4) | | 15.42 | %(5) | | 15.42 | %(5) | | 7.90 | %(6) | |
| | | | | | | | | | | |
Based on a $10,000 initial investment, the table above illustrates the total return of ING International SmallCap Fund against the Indicies indicated. The index is unmanaged and has no cash in its portfolio, imposes no sales charge and incurs no operating expenses. An investor cannot invest directly in the index. The Fund’s performance is shown both with and without the imposition of sales charges.
The performance table does not reflect the deduction of taxes that a shareholder will pay on Fund distributions or the redemption of Fund shares.
The performance shown may include the effect of fee waivers and/or expense reimbursements by the Investment Manager and/or other service providers, which have the effect of increasing total return. Had all fees and expenses been considered, the total returns would have been lower.
Performance data represents past performance and is no assurance of future results. Investment return and principal value of an investment in the Fund will fluctuate. Shares, when sold, may be worth more or less than their original cost. The Fund’s current performance may be lower or higher than the performance data shown. Please log on to www.ingfunds.com or call (800) 992-0180 to get performance through the most recent month end.
It is important to note that the Fund has a limited operating history. Performance over a longer period of time may be more meaningful than short-term performance.
This report contains statements that may be “forward-looking” statements. Actual results may differ materially from those projected in the “forward-looking” statements.
The views expressed in this report reflect those of the portfolio managers, only through the end of the period as stated on the cover. The portfolio managers’ views are subject to change at any time based on market and other conditions.
Fund holdings are subject to change daily.
(1) Reflects deduction of the maximum Class A sales charge of 5.75%.
(2) Reflects deduction of the Class B deferred sales charge of 5%.
(3) Reflects deduction of the Class C deferred sales charge of 1%.
(4) The MSCI ACWI Ex US Index® measures the returns of equities of companies which are domiciled outside the U.S.
(5) Since inception performance for the index is shown from January 1, 2006.
(6) Since inception performance for the index is shown from February 1, 2006.
21
ING INTERNATIONAL REAL ESTATE FUND | | PORTFOLIO MANAGERS’ REPORT |
Country Allocation
as of April 30, 2006
(as a percent of net assets)
Japan | | 21.3 | % |
United Kingdom | | 14.7 | % |
Hong Kong | | 14.6 | % |
United States | | 14.2 | % |
Australia | | 13.7 | % |
France | | 4.9 | % |
Canada | | 4.2 | % |
Singapore | | 4.2 | % |
Netherlands | | 2.7 | % |
Germany | | 1.7 | % |
Sweden | | 1.4 | % |
Spain | | 1.3 | % |
<1.3% Industries(1) | | 2.7 | % |
Other Assets and Liabilities, Net | | (1.6 | )% |
(1) Includes five countries, which each represents <1.3% of net assets.
Portfolio holdings are subject to change daily.
ING International Real Estate Fund (the “Fund”) seeks high total return. T. Ritson Ferguson, CFA, and Steven D. Burton, CFA have been jointly responsible for the day-to-day management of the Fund, ING Clarion Real Estate Securities L.P. — the Sub-Adviser.
Performance: From February 28, 2006, the inception of the Fund, to April 30, 2006, the Fund’s Class A shares, excluding sales charges, provided a total return of 5.33% compared to the S&P/Citigroup World Property Index, ex-U.S., Index, which returned 6.10% for the same period.
Portfolio Specifics: International property stocks were up 5.46% for the period (two months) ended April 30, 2006, led by the European and Asian-Pacific property stocks which were up 7.5% and 5.6%, respectively. The Fund underperformed the benchmark return by 64 basis points during this period which begins with the inception date of the Fund.
Leading the Asia-Pacific region were property companies in Hong Kong and Japan which were up 8.4% and 5.5%, respectively. Hong Kong property stocks rallied on an increased sense that interest rate increases are nearing an end in the intermediate future. An exception to this were Hong Kong-based companies focused on mainland China. These companies performed poorly as a result of the late-in-April announcement by the Chinese government that one-year interest rates would be increased by 27 basis points to 5.85%.
The Japanese property stocks were up on continued evidence of economic recovery. Macro economic positives in Japan included a consumer price index which increased for the fifth consecutive month, fiscal year 2006 projected GDP which was revised up by the Bank of Japan in its semi-annual review to 2.4% from 1.8%, and a jobless rate which remained unchanged at 4.1% in March (lowest level in seven years). Property industry data indicated continued improved trends with: 1) vacancies in Tokyo which fell to their lowest level in nine years in March at 3.41% versus 3.67% the prior month, and 2) record profits reported by a dominant Tokyo-based developers, Mitsui Fudosan, which acts as a relevant indicator for industry trends.
Europe was led by continental Europe which was up 9.3% for the two months ended April 30, 2006. New company formation marked the European sector with the initial public offering (“IPO”) of French diversified company Icade, which is the real estate group within France’s Caisse des Depots et Consignations (a large financial services company). The company’s property mix is approximately 50% residential and 50% commercial (industrial and office) largely in the Paris metropolitan area. Total equity market capitalization is approximately 2.5 billion euros. This IPO is significant in that it brings a seasoned, proven property company to the public universe. Attention is now shifting to Germany which is under active discussion of legislating a REIT-type structure. The Wall Street Journal reported on April 5, 2006 “Germany is gearing up to structure its real-estate investment trusts to outmaneuver their U.K. counterparts in luring investors. Real-estate experts say German REITs are likely to offer a more flexible alternative to U.K. REITs.” A REIT structure is anticipated in Germany by 2007 in addition to U.K. REITs which have already been announced.
The U.S. dollar (USD) generally weakened sharply versus other major currencies primarily during the month of April. The USD in April weakened by 6.0% versus the Australian dollar, 5.1% versus the British pound, 4.3% versus the euro, and 3.5% for the Japanese yen. A weakening U.S. dollar benefits an investor in the Fund as returns translated from the strengthening currency convert to more U.S. dollars once converted back.
Current Strategy &Outlook: International property companies have provided strong absolute and relative returns when compared to broad equities over the past several years. Valuation disparities continue to provide investment opportunities to an investor with a global scope. Through an average 2%-3% dividend yield plus 6%-9% prospective annual earnings growth, international property stocks continue to be well-positioned to conservatively deliver attractive total returns over the next several years.
22
PORTFOLIO MANAGERS’ REPORT | | ING INTERNATIONAL REAL ESTATE FUND |
| | | |
| Cumulative Total Returns for the Periods Ended April 30, 2006 | |
| | | |
| | Since Inception | |
| | of Classes, A, B, C & I | |
| | February 28, 2006 | |
| | | |
| Including Sales Charge: | | | | |
| Class A(1) | | (0.73 | )% | |
| Class B(2) | | 0.35 | % | |
| Class C(3) | | 4.23 | % | |
| Class I | | 5.46 | % | |
| Excluding Sales Charge: | | | | |
| Class A | | 5.33 | % | |
| Class B | | 5.35 | % | |
| Class C | | 5.23 | % | |
| Class I | | 5.46 | % | |
| S&P/Citigroup World Property Index, ex U.S. Index(4) | | 6.10 | %(5) | |
| | | | | |
Based on a $10,000 initial investment, the table above illustrates the total return of ING International SmallCap Fund against the Indicies indicated. The index is unmanaged and has no cash in its portfolio, imposes no sales charge and incurs no operating expenses. An investor cannot invest directly in the index. The Fund’s performance is shown both with and without the imposition of sales charges.
The performance table does not reflect the deduction of taxes that a shareholder will pay on Fund distributions or the redemption of Fund shares.
The performance shown may include the effect of fee waivers and/or expense reimbursements by the Investment Manager and/or other service providers, which have the effect of increasing total return. Had all fees and expenses been considered, the total returns would have been lower.
Performance data represents past performance and is no assurance of future results. Investment return and principal value of an investment in the Fund will fluctuate. Shares, when sold, may be worth more or less than their original cost. The Fund’s current performance may be lower or higher than the performance data shown. Please log on to www.ingfunds.com or call (800) 992-0180 to get performance through the most recent month end.
It is important to note that the Fund has a limited operating history. Performance over a longer period of time may be more meaningful than short-term performance.
This report contains statements that may be “forward-looking” statements. Actual results may differ materially from those projected in the “forward-looking” statements.
The views expressed in this report reflect those of the portfolio managers, only through the end of the period as stated on the cover. The portfolio managers’ views are subject to change at any time based on market and other conditions.
Fund holdings are subject to change daily.
(1) Reflects deduction of the maximum Class A sales charge of 5.75%.
(2) Reflects deduction of the Class B deferred sales charge of 5% for the since inception return.
(3) Reflects deduction of the Class C deferred sales charge of 1% for the since inception return.
(4) The S&P/Citigroup World Property Index, ex U.S., is an unmanaged market-weighted total return index which consists of many companies from developed markets, excluding the United States, whose floats are larger than $100 million and derive more than half of their revenue from property-related activities.
(5) Since inception performance for the index is shown from March 1, 2001.
23
ING INTERNATIONAL SMALLCAP FUND | | PORTFOLIO MANAGERS’ REPORT |
Country Allocation
as of April 30, 2006
(as a percent of net assets)
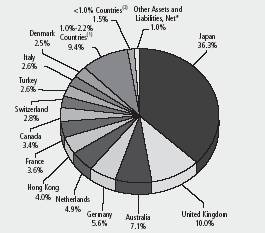
* Includes securities lending collateral.
(1) Includes six countries, which each represents 1.0%-2.2% of net assets.
(2) Includes fourteen countries, which each represents < 1.0% of net assets.
Portolio holdings are subject to change daily.
ING International SmallCap Fund (the “Fund”) seeks to provide capital appreciation through investments of assets in securities of small companies. The Fund is co-managed by John Chisholm, CFA, Executive Vice President and Co-Chief Investment Officer and Matthew J. Cohen, CFA, Senior Vice President and Portfolio Manager, Acadian Asset Management Inc, — the Sub-Adviser.
Performance: For the six months ended April 30, 2006, the Fund’s Class A shares, excluding sales charges, provided a total return of 29.76% compared to the MSCI EAFE Small Cap Index, which returned 28.60% for the same period.
Portfolio Specifics: Strong stock selection in Australia offset the smaller amount of value lost to a country overweighting. Materials holding Zinifex was the top contributor to value added to the Fund’s overall performance. Active allocations to China and Turkey contributed meaningfully to benchmark-relative return, exposing the Fund to some top-performing holdings in the energy sector. Stock selection in Germany was also a positive contributor. Positions in capital equipment holding SolarWorld, steel producer Salzgitter and technology company Wincor were major contributors in this market. Stock-level performance in the U.K. was strong, with distributor Pendragon leading the Fund’s group of holdings in this market. A combination of stock- and country-level performance delivered good returns in the Netherlands. Capital equipment holdings such as industrial machinery maker Stork were among the top-contributing stocks for the period. Stock selection in Italy contributed additionally to return, while the combination of stock selection and a market underweight to Finland also generated excess return. In Switzerland, stock selection delivered positive relative return, with insurer Baloise leading the Fund’s holdings in this market.
Underperformance in Japanese stocks had the greatest negative effect on the Fund’s performance during the period. Holdings such as automotive retailer Tonichi Carlife trailed the benchmark significantly, while a lack of positioning in Japan Steel Works was also costly. Lack of exposure to the Japanese technology sector also detracted notably. The Fund was also not exposed to the surging Norwegian energy sector, a positioning that detracted significantly from return. Other missed opportunities for the Fund included DNO and Petroleum GEO. A country underweighting in Sweden detracted from return as well as a lack of positioning in the materials stock Boliden, and some other strong performers in the Swedish finance sector. Stock selection in Denmark cost the Fund additional active return, as holdings, including trucking service DSV and Sydbank, trailed the benchmark most significantly. Stock-level performance in Greece was also a negative factor as the Fund missed opportunities to add value with strong benchmark stocks such as Hellenic Technodom.
Current Strategy and Outlook: Country weightings are driven by bottom-up stock selection. The Fund is currently overweighted in Australia, Denmark and France and actively allocated to Canada, Turkey, Korea and China. Significant underweightings include the U.K., Sweden and Norway. Our bottom-up process has led the Fund to focus on materials, durables and energy stocks.
We are positive on almost all markets in Europe. The region’s attractiveness is based on several key factors. Inflation remains controlled and Europe’s major economies have shown encouraging signs of continued, if moderate, growth. In our view, corporate profitability is improving and valuations are reasonable. Norway and other Scandinavian markets top our forecasts with attractive valuations and strong earnings trends. The U.K. is the strongest of the larger markets given high value and earnings factor scores across most sectors, particularly in energy, banking and materials. However, it is important to note that the unusually high cost of transacting in the U.K. market tends to reduce the number of U.K. stocks that enter Acadian-managed Funds, due to the cost control component of our investment process. France and Italy have recently strengthened in our ranking given solid earnings expectations in energy and banking. Germany is also favorable — a view that is supported by positive fundamentals such as robust business confidence and strong exports. Australia also looks positive on the continued expected outperformance of the materials sector, especially given the record high prices the sector has seen recently.
Many emerging markets are positively ranked in our process as the asset class continues to exhibit signs of growth and improving economic fundamentals. Venezuela, Turkey, Malaysia and Russia appear the most positive in our framework.
24
PORTFOLIO MANAGERS’ REPORT | | ING INTERNATIONAL SMALLCAP FUND |
| | | | | | | | | |
| Average Annual Total Returns for the Periods Ended April 30, 2006 | |
| | | | | | | | | |
| | | | | | | | Since Inception | |
| | | | | | | | of Class I | |
| | 1 Year | | 5 Year | | 10 Year | | December 21, 2005 | |
| | | | | | | | | |
| Including Sales Charge: | | | | | | | | | |
| Class A(1) | | 41.24 | % | | 11.32 | % | | 16.09 | % | | — | | |
| Class B(2) | | 43.88 | % | | 11.69 | % | | 16.07 | % | | — | | |
| Class C(3) | | 47.88 | % | | 11.93 | % | | 16.04 | % | | — | | |
| Class I | | — | | | — | | | — | | | 19.78 | % | |
| Class Q | | 50.19 | % | | 13.02 | % | | 17.09 | % | | — | | |
| Excluding Sales Charge: | | | | | | | | | | | | | |
| Class A | | 49.84 | % | | 12.65 | % | | 16.78 | % | | — | | |
| Class B | | 48.88 | % | | 11.94 | % | | 16.07 | % | | — | | |
| Class C | | 48.88 | % | | 11.93 | % | | 16.09 | % | | — | | |
| Class I | | — | | | — | | | — | | | 19.78 | % | |
| Class Q | | 50.19 | % | | 13.02 | % | | 17.09 | % | | — | | |
| MSCI EAFE SmallCap Index(4) | | 43.57 | % | | 20.12 | % | | 5.39 | % | | 15.96 | %(5) | |
| | | | | | | | | | | | | | |
Based on a $10,000 initial investment, the table above illustrates the total return of ING International SmallCap Fund against the index indicated. The index is unmanaged and has no cash in its portfolio, imposes no sales charge and incurs no operating expenses. An investor cannot invest directly in the index. The Fund’s performance is shown both with and without the imposition of sales charges.
The performance table does not reflect the deduction of taxes that a shareholder will pay on Fund distributions or the redemption of Fund shares.
The performance shown may include the effect of fee waivers and/or expense reimbursements by the Investment Manager and/or other service providers, which have the effect of increasing total return. Had all fees and expenses been considered, the total returns would have been lower.
Performance data represents past performance and is no assurance of future results. Investment return and principal value of an investment in the Fund will fluctuate. Shares, when sold, may be worth more or less than their original cost. The Fund’s current performance may be lower or higher than the performance data shown. Please log on to www.ingfunds.com or call (800) 992-0180 to get performance through the most recent month end.
This report contains statements that may be “forward-looking” statements. Actual results may differ materially from those projected in the “forward-looking” statements.
The views expressed in this report reflect those of the portfolio managers, only through the end of the period as stated on the cover. The portfolio managers’ views are subject to change at any time based on market and other conditions.
Fund holdings are subject to change daily.
(1) Reflects deduction of the maximum Class A sales charge of 5.75%.
(2) Reflects deduction of the Class B deferred sales charge of 5% and 2%, respectively, for the 1 year and 5 year returns.
(3) Reflects deduction of the Class C deferred sales charge of 1% for the 1 year return.
(4) The MSCI EAFE SmallCap Index is an unmanaged, market-weighted index that represents the smallcap segments in 21 developed equity markets outside of North America.
(5) Since inception performance for the index is shown from January 1, 2006.
Prior to March 1, 2005, the Fund was advised by a different sub-adviser.
25
ING INTERNATIONAL VALUE FUND | | PORTFOLIO MANAGERS’ REPORT |
Country Allocation
as of April 30, 2006
(as a percent of net assets)
Japan | | 17.7 | % |
United Kingdom | | 16.9 | % |
Germany | | 11.0 | % |
Netherlands | | 8.6 | % |
France | | 8.4 | % |
Switzerland | | 5.5 | % |
Italy | | 5.0 | % |
South Korea | | 4.9 | % |
Brazil | | 4.4 | % |
Singapore | | 3.4 | % |
Spain | | 3.4 | % |
<2.0% Countries(1) | | 10.9 | % |
Other Assets and Liablilities, Net* | | (0.1 | )% |
| | | |
(1) Includes nine countries, which each represents <2.0% of net assets. |
* Includes securities lending collateral. |
Portfolio holdings are subject to change daily.
ING International Value Fund (the “Fund”) seeks long-term capital appreciation by investing primarily in non-U.S. companies with market capitalizations greater than $1 billion, but it may hold up to 25% of its assets in companies with smaller market capitalizations. The Fund is managed by Brandes Investment Partners, L.P. — the Sub-Adviser. Brandes’ Large Cap Investment Committee is responsible for making the day-to-day investment decisions for the Fund.
Performance: For the six-month period ended April 30, 2006, the Fund’s Class A shares, excluding sales charges, provided a total return of 23.13% compared to the Morgan Stanley Capital International Europe, Australasia and Far East Index (“MSCI EAFE®”), which returned 23.10% for the same period.
Portfolio Specifics: Gains for positions in commercial banking, electric utilities, and insurance made positive contributions to returns for the period ended April 30, 2006. Holdings in these industries posting gains included Mitsubishi UFJ Financial Group (Japan — commercial banking), Eletrobras (Brazil — electric utilities), and Zurich Financial Services (Switzerland — insurance).
Japan, the United Kingdom, and Germany helped drive the Fund’s returns. Top performers from these countries included Sony (Japan — household durables), Marks & Spencer (United Kingdom — multiline retail), and Volkswagen (Germany — automobiles). Holdings from other countries making positive contributions to performance included Electricite de France (France — electric utilities) and Akzo Nobel (Netherlands — chemicals).
On a relative basis, the Fund benefited from stock selection in the wireless telecommunication services industry and an lack of exposure to the oil, gas & consumable fuels industry. Conversely, the Fund’s overweight exposure to the diversified telecom services industry and underweight exposure to the capital markets industry detracted from relative performance.
Note that the Fund’s industry exposure is a result of a focus on fundamentals and valuations of individual companies. We invest in firms that we believe offer a “margin of safety” — companies selling at a price below our estimate of fair value. This often involves investing in unpopular firms and industries. Industry exposures are substantially driven by stock selection, and not by any “industry allocation” decision. For example, many companies in the oil gas & consumable fuels industry are selling at what we believe to be overly optimistic prices. We believe quality businesses with attractive margins of safety represent compelling opportunities for long-term gains.
Current Strategy and Outlook: During the six-month period, we sold our positions in companies such as Matsushita Electric Industrial (Japan — household durables), Sumitomo Mitsui Financial Group (Japan — commercial banking), and Mitsubishi Heavy Industries (Japan — machinery) as their market prices advanced toward our estimates of intrinsic value. We established new positions in select names, including United Microelectronics (Taiwan — semiconductors & semiconductor equipment) and Tyco International (Bermuda — industrial conglomerate) at prices we consider attractive.
While we monitor short-term events in international markets, our investment philosophy focuses on company-by-company analysis. We take a long-term perspective and believe that none or very little of the short-term “market news” provides useful information to investors.
26
PORTFOLIO MANAGERS’ REPORT | | ING INTERNATIONAL VALUE FUND |
| | |
| Average Annual Total Returns for the Periods Ended April 30, 2006 | |
| | | | | | | | | | | | | | |
| | | 1 Year | | 5 Year | | 10 Year | | Since Inception
of Class B
April 18, 1997 | | Since Inception
of Class Q
January 24, 2000 | | Since Inception
of Class I
June 18, 2001 | |
| Including Sales Charge: | | | | | | | | | | | | | |
| Class A(1) | | 26.23 | % | 10.06 | % | 13.51 | % | — | | — | | — | | |
| Class B(2) | | 28.08 | % | 10.32 | % | — | | 13.17 | % | — | | — | | |
| Class C(3) | | 32.06 | % | 10.59 | % | 13.41 | % | — | | — | | — | | |
| Class I | | 34.45 | % | — | | — | | — | | — | | 13.65 | % | |
| Class Q | | 34.15 | % | — | | — | | — | | 10.15 | % | — | | |
| | | | | | | | | | | | | | | |
| Excluding Sales Charge: | | | | | | | | | | | | | | |
| Class A | | 33.95 | % | 11.37 | % | 14.19 | % | — | | — | | — | | |
| Class B | | 33.08 | % | 10.59 | % | — | | 13.17 | % | — | | — | | |
| Class C | | 33.06 | % | 1059 | % | 13.41 | % | — | | — | | — | | |
| Class I | | 34.45 | % | — | | — | | — | | — | | 13.65 | % | |
| Class Q | | 34.15 | % | — | | — | | — | | 10.15 | % | — | | |
| MSCI EAFE Index®(4) | | 34.00 | % | 9.59 | % | 7.03 | % | 7.91 | %(5) | 4.82 | %(6) | 11.69 | %(7) | |
| | | | | | | | | | | | | | | |
| | | | | | | | | | | | | | | | | | | | |
Based on a $10,000 initial investment, the table above illustrates the total return of ING International SmallCap Fund against the Indicies indicated. The index is unmanaged and has no cash in its portfolio, imposes no sales charge and incurs no operating expenses. An investor cannot invest directly in the index. The Fund’s performance is shown both with and without the imposition of sales charges.
The performance table does not reflect the deduction of taxes that a shareholder will pay on Fund distributions or the redemption of Fund shares.
The performance shown may include the effect of fee waivers and/or expense reimbursements by the Investment Manager and/or other service providers, which have the effect of increasing total return. Had all fees and expenses been considered, the total returns would have been lower.
Performance data represents past performance and is no assurance of future results. Investment return and principal value of an investment in the Fund will fluctuate. Shares, when sold, may be worth more or less than their original cost. The Fund’s current performance may be lower or higher than the performance data shown. Please log on to www.ingfunds.com or call (800) 992-0180 to get performance through the most recent month end.
This report contains statements that may be “forward-looking” statements. Actual results may differ materially from those projected in the “forward-looking” statements.
The views expressed in this report reflect those of the portfolio managers, only through the end of the period as stated on the cover. The portfolio managers’ views are subject to change at any time based on market and other conditions.
Fund holdings are subject to change daily.
(1) | | Reflects deduction of the maximum Class A sales charge of 5.75%. |
| | |
(2) | | Reflects deduction of the Class B deferred sales charge of 5% and 2%, respectively, for the 1 year and 5 year returns. |
| | |
(3) | | Reflects deduction of the Class C deferred sales charge of 1% for the 1 year return. |
| | |
(4) | | The MSCI EAFE Index is an unmanaged index that measures the performance of securities listed or exchanges in Europe, Australasia and the Far East. |
| | |
(5) | | Since inception performance for index is shown from May 1, 1997. |
| | |
(6) | | Since inception performance for index is shown from February 1, 2000. |
| | |
(7) | | Since inception performance for index is shown from July 1, 2001. |
27
ING INTERNATIONAL VALUE CHOICE FUND | | PORTFOLIO MANAGERS’ REPORT |
Country Allocation
as of April 30, 2006
(as a percent of net assets)
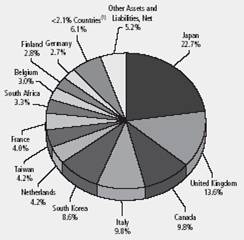
(1) Includes five countries, which each represents < 2.1% of net assets.
Portfolio holdings are subject to change daily.
ING International Value Choice Fund (the “Fund”) focuses on long-term capital appreciation by investing primarily in foreign equity securities of issuer located in a number of countries outside the U.S. The Fund is managed by Paul Hechmer, Managing Director and International Portfolio Manager, Tradewinds NWQ Global Investors, LLC — the Sub-Adviser, a newly formed affiliate of NWQ Investment Management Company, LLC.
Performance: For the six months ended April 30, 2006, the Fund’s Class A shares, excluding sales charges, provided a total return of 18.53% compared to the Morgan Stanley Capital International Europe, Australasia and Far East (“MSCI EAFE”) Index, which returned 23.10% for the same period.
Portfolio Specifics: The Fund posted strong absolute returns in the referenced period, but underperformed its benchmark. Global markets performed strongly, with impressive returns coming from all regions and the Fund participated in these market returns and the returns generated from a weaker US dollar, in particular in the first four months of 2006. As a bottom-up stock specific manager, we continued to find opportunities which fit our criteria of attractive valuations and strong franchises. A good example is the Materials sector, which was the main contributor to the Fund’s absolute performance. Many commodities hit multi-year highs and stocks related to these commodities performed well as a result. In particular, we were helped by Lonmin, a UK based platinum company, Barrick Gold of Canada and Anglo American a diversified mining company, all of which posted impressive returns. Two primary factors contributed to the Fund’s underperformance during the period — an overweight in the Telecommunications sector and individual security selection in the Consumer Discretionary sector. In Telecommunications there is good value in the names the Fund held, all of which are strong franchises; however, names such as NTT of Japan and Belgacom detracted from returns. In the Consumer Discretionary sector, Fund performance suffered due to Premiere, the German pay TV company, which lost the right to broadcast key content in Germany. The Fund continues to hold the name, believing that the share price has fallen well below the intrinsic value of this market leading company. The Fund was also hurt by its holding in Northern Foods, a British food company in the Consumer Staples sector.
Regionally, an overweight in Japan aided returns, but the type of companies held, in our view, strong franchises with generally strong balance sheets, lagged the overall market return in Japan. The Fund’s emerging markets exposure, in particular through South African materials was a positive contributor to returns. In addition the Fund’s lack of exposure to the European financials sector also detracted from relative performance.
Current Strategy and Outlook: Overall market performance would appear to have outpaced the fundamental underlying improvement in business conditions. Further, interest rates appear to be on a northward trend in most major markets around the world. Either or both of these forces could present headwinds to further strong performance in the equity markets. Nevertheless, our investment universe is extremely broad, and comprised of economies in varied stages of the economic cycle. In our view, Japan continues to rebound from 15 years of recession, Europe continues to react positively to the increased competitive environment that the European Union brings with it, and the emerging markets continue to grow very rapidly. In such an environment we continue to be optimistic that good opportunities can still be found.
28
PORTFOLIO MANAGERS’ REPORT | | ING INTERNATIONAL VALUE CHOICE FUND |
| | |
| Average Annual Total Returns for the Periods Ended April 30, 2006 | |
| | |
| | | 1 Year | | Since Inception
of Classes A and B
February 1, 2005 | | Since Inception
of Class C
February 4, 2005 | | Since Inception
of Class I
December 21, 2005 | |
| Including Sales Charge: | | | | | | | | | | |
| Class A(1) | | 23.01 | % | 15.46 | % | — | | — | | |
| Class B(2) | | 24.28 | % | 17.01 | % | — | | — | | |
| Class C(3) | | 28.37 | % | — | | 20.33 | % | — | | |
| Class I | | — | | — | | — | | 12.14 | % | |
| | | | | | | | | | | |
| Excluding Sales Charge: | | | | | | | | | | |
| Class A | | 30.48 | % | 21.10 | % | — | | — | | |
| Class B | | 29.28 | % | 20.10 | % | — | | — | | |
| Class C | | 29.37 | % | — | | 20.33 | % | — | | |
| Class I | | — | | — | | — | | 12.14 | % | |
| MSCI EAFE® Index(4) | | 34.00 | % | 25.86 | %(5) | 25.86 | %(5) | 14.78 | %(6) | |
| | | | | | | | | | | |
| | | | | | | | | | | | | | | |
Based on a $10,000 initial investment, the table above illustrates the total return of ING International Value Choice Fund against the index indicated. The index is unmanaged and has no cash in its portfolio, imposes no sales charge and incurs no operating expenses. An investor cannot invest directly in the index. The Fund’s performance is shown both with and without the imposition of sales charges.
The performance table does not reflect the deduction of taxes that a shareholder will pay on Fund distributions or the redemption of Fund shares.
The performance shown may include the effect of fee waivers and/or expense reimbursements by the Investment Manager and/or other service providers, which have the effect of increasing total return. Had all fees and expenses been considered, the total returns would have been lower.
Performance data represents past performance and is no assurance of future results. Investment return and principal value of an investment in the Fund will fluctuate. Shares, when sold, may be worth more or less than their original cost. The Fund’s current performance may be lower or higher than the performance data shown. Please log on to www.ingfunds.com or call (800) 992-0180 to get performance through the most recent month end.
This report contains statements that may be “forward-looking” statements. Actual results may differ materially from those projected in the “forward-looking” statements.
The views expressed in this report reflect those of the portfolio managers, only through the end of the period as stated on the cover. The portfolio managers’ views are subject to change at any time based on market and other conditions.
Fund holdings are subject to change daily.
(1) | | Reflects deduction of the maximum Class A sales charge of 5.75%. |
| | |
(2) | | Reflects deduction of the Class B deferred sales charge of 5% for the since inception return. |
| | |
(3) | | Reflects deduction of the Class C deferred sales charge of 1% for the since inception return. |
| | |
(4) | | The MSCI EAFE® Index is an unmanaged index that measures the performance of securities listed on exchanges in markets in Europe, Australasia and the Far East. |
| | |
(5) | | Since inception performance for index is shown from February 1, 2005. |
| | |
(6) | | Since inception performance for index is shown from January 1, 2006. |
29
ING PRECIOUS METALS FUND | | PORTFOLIO MANAGERS’ REPORT |
Country Allocation
as of April 30, 2006
(as a percent of net assets)
Canada | | 69.2 | % |
United States | | 14.7 | % |
United Kingdom | | 5.6 | % |
South Africa | | 5.0 | % |
Australia | | 4.2 | % |
Papua New Guinea | | 4.0 | % |
Peru | | 1.0 | % |
Cayman Islands | | 0.4 | % |
Other Assets and Liabilities, Net | | (4.1 | )% |
Portfolio holdings are subject to change daily.
ING Precious Metals Fund (the “Fund”) seeks to attain capital appreciation and hedge against the loss of buying power of the U.S. dollar, as may be obtained through investment in gold and securities of companies engaged in mining or processing gold throughout the world. James A. Vail, CFA, Senior Vice President and Portfolio Manager, manages the Fund, ING Investment Management Co. — the Sub-Adviser.
Performance: For the six-month period ended April 30, 2006, the Fund’s class A shares, excluding sales charges, provided a total return of 65.82%, compared to 9.64% for the S&P 500® Index and to 46.87% for the Financial Times Gold Index.
Portfolio Specifics: Commodities in general and precious metals in particular showed strong price gains during the reporting period. Gold opened the period at $460 ounce and exited April at $655, a gain of 42%. Continued geopolitical uncertainty, record U.S. current account deficits and projections of declining mine supply helped push bullion higher. While jewelry demand softened in response to higher gold prices, exchange traded fund (ETFs) continued to attract new investment, which supported bullion prices. The star performer in precious metals was silver, which rose 85% as the SEC approved a silver-backed ETF subsequently listed on the American Stock Exchange (“AMEX”). Global inventories of silver are decreasing and the incremental demand from the silver-backed ETF is likely to drive prices even higher.
The Fund’s outperformance was a result of favorable stock selection, particularly in the gold sub-sector. Within gold, Agnico-Eagle Mines, Gammon Lake Resources and Yamana Gold were strong performers. The Fund also benefited from underweighting Barrick and Newmont Mining. Investing in the diversified metals and mining sector had a positive impact on absolute performance, particularly when Western Silver announced its pending acquisition by Glamis Gold. Other positive contributors were Glamis Gold, Kinross and Centerra Gold. However, our top holding, Shore Gold, fell in value over the period. During the last six months, it was rumored to be the target of a takeover by DeBeers which failed to materialize. Despite this, fundamentals remain attractive. Shore Gold possesses one of the most attractive diamond deposits in the world, in Canada. Exploration results continually increase the value of the property. In such strong markets our average cash holding of almost 5% significantly detracted from performance.
Current Strategy and Outlook: In the short term, we expect gold prices to consolidate between $600-650 per ounce as we enter the current period of seasonally slow demand, which extends into the third calendar quarter. We believe Christmas demand then reignites jewelry demand, usually pushing prices higher. Since the successful launch of the silver-backed ETF, we expect silver to consolidate around $13 per ounce before moving higher.
We expect longer-term gold prices to move to higher levels and mine supply to shrink until the end of the decade. Foreign bank displeasure with a weak U.S. dollar could cause a move to increase gold reserves. Comments from central banks in Argentina, China and Russia imply a fear of holding dollar-denominated debt, and may cause an increase in bullion reserves. Finally, unabated geopolitical tensions and associated distrust of paper currencies should keep demand robust for gold backed ETFs.
The Fund continues to focus on companies that demonstrate increasing metal production, along with potential exploration surprises. We seek to invest in companies capable of growing earnings and cash flow along with increasing value of assets in the ground. We continue to see opportunities across all precious metal categories.
30
PORTFOLIO MANAGERS’ REPORT | | ING PRECIOUS METALS FUND |
| | | | | | | | | |
| Average Annual Total Returns for the Periods Ended April 30, 2006 | |
| | | | | | | | | |
| | | 1 Year | | 5 Year | | 10 Year | | |
| Including Sales Charge: | | | | | | | | |
| Class A(1) | | 99.21 | % | 33.36 | % | 6.11 | % | |
| | | | | | | | | |
| Excluding Sales Charge: | | | | | | | | |
| Class A | | 111.31 | % | 34.43 | % | 6.75 | % | |
| S&P 500® Index(2) | | 15.42 | % | 2.70 | % | 8.94 | % | |
| FT Gold Mines Index(3) | | 84.81 | % | 28.66 | % | 1.30 | % | |
| Gold Bullion Commodity(4) | | 47.87 | % | 19.61 | % | 5.11 | % | |
| | | | | | | | | |
| | | | | | | | | | | | |
Based on a $10,000 initial investment, the table above illustrates the total return of ING Precious Metals Fund against the Indices indicated. An Index is unmanaged and has no cash in its portfolio, imposes no sales charge and incurs no operating expenses. An investor cannot invest directly in an index. The Fund’s performance is shown both with and without the imposition of sales charges.
The performance table does not reflect the deduction of taxes that a shareholder will pay on Fund distributions or the redemption of Fund shares.
The performance shown may include the effect of fee waivers and/or expense reimbursements by the Investment Manager and/or other service providers, which have the effect of increasing total return. Had all fees and expenses been considered, the total returns would have been lower.
Performance data represents past performance and is no assurance of future results. Investment return and principal value of an investment in the Fund will fluctuate. Shares, when sold, may be worth more or less than their original cost. The Fund’s current performance may be lower or higher than the performance data shown. Please log on to www.ingfunds.com or call (800) 992-0180 to get performance through the most recent month end.
This report contains statements that may be “forward-looking” statements. Actual results may differ materially from those projected in the “forward-looking” statements.
The views expressed in this report reflect those of the portfolio managers, only through the end of the period as stated on the cover. The portfolio managers’ views are subject to change at any time based on market and other conditions.
Fund holdings are subject to change daily.
(1) | | Reflects deduction of the maximum Class A sales charge of 5.75%. |
| | |
(2) | | The S&P 500® Index is an unmanaged index that measures the performance of securities of approximately 500 large-capitalization U.S. companies whose securities are traded on major U.S. stock markets. |
| | |
(3) | | The FT Gold Mines Index® is an unmanaged cap weighted index that is designed to reflect the performance of the worldwide market in the shares of companies whose principal activity is the mining of gold. |
| | |
(4) | | GOLD BULLION IS NOT AN INDEX. It is a commodity. |
31
ING RUSSIA FUND | | PORTFOLIO MANAGERS’ REPORT |
Industry Allocation
as of April 30, 2006
(as a percent of net assets)
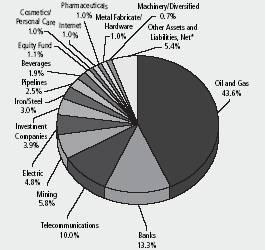
* Includes securities lending collateral.
Portfolio holdings are subject to change daily.
ING Russia Fund (“the Fund”) seeks long term capital appreciation through investments primarily in equity securities of Russian companies. Samuel Oubadia, Senior Investment Manager — Emerging Markets equities, Bernard Mignon, Senior Investment Manager — Emerging Market Equities, JanWim Derks, Director — Head of Emerging Market equities, ING Investment Management Advisors B.V. — the Sub-Adviser.
Performance: For the six months ended April 30, 2006 the Fund’s Class A shares, excluding sales charges, provided a total return of 63.30%. In the same period the Russian Trading System Index (RTS) returned 77.3%, and the MSCI Emerging Markets Index returned 37.6%.
Portfolio Specifics: In the most recent reporting period, Emerging Markets, as an asset class, performed very well. Against the backdrop of a high appetite for risky assets, and rising prices for oil and other commodities, Russian equities outperformed most of their peers in other emerging markets. The rally in Russia was fairly broad-based, as not only did the commodity stocks perform well, but so did most companies whose fortunes are tied to growth in personal consumption. This includes companies that operate in the financial services, media, and the retail sector.
Arguably the most closely followed story over the period under review was Gazprom. After years of promises that foreign investors would eventually be allowed to invest in the world’s largest producer of natural gas, the restrictions that prevented them from doing so were finally removed. As such, foreign investors were allowed to purchase Gazprom’s local shares in early 2006. This, coupled with the high price for natural gas, led to a 127.5% increase in Gazprom shares over the relevant period. The Russia Fund had exposure to Gazprom even prior to the removal of the trading restrictions, and was essentially overweight for most of the period. However, after a rebalancing of the RTS Index in March, Gazprom entered the index for the first time with a weighting of over 15.0%. The Fund has since increased its position in Gazprom, but has held an underweight position since the rebalancing.
Another stock that performed very well was Sberbank. Sberbank is Russia’s largest commercial bank, and also operates the country’s largest retail network. In the last few quarters, the bank has consistently released financial results that have beaten consensus estimates. The bank has seen strong growth in lending, and boasts a return-on-equity above most of its peers in the region of Central and Eastern Europe. As a result, Sberbank shares rose 103.3% in the most recent six-month period. Over most of this period, Sberbank was among the Russia Fund’s top three holdings. Nevertheless, given the stock’s large weighting in the RTS Index, the Russia Fund was still underweight Sberbank
In recent months, Russia’s mobile telecommunications sector has underperformed broader market. However, Vimpelcom (VIP), one of the country’s two main cellular operators, has had to deal with a separate issue at the same time. The company’s two main strategic shareholders have been at odds over their operations in Ukraine. Specifically, one shareholder would like to merge VIP with its Ukrainian subsidiary, while the other shareholder is opposed. Some investors feared that this dispute would eventually have an effect on VIP’s day-to-day operations. The company’s shares rose 16.5% over the relevant period. As the Russia Fund held an overweight position in VIP, this hurt the Fund’s performance.
Current Strategy and Outlook: The RTS Index ended the month of April close to its all-time high. The market has gained about 50.0% since the start of this calendar year, making it one of the best performing emerging markets on a year-to-date basis. While this is underpinned by Russia’s strong economic performance, it is also driven by the huge inflows into the Emerging Markets asset class, with Russia being one of the largest beneficiaries of these inflows. Although, in our view, the economic outlook for Russia remains quite positive, some form of market correction would not be entirely unexpected. The main risk remains the prospect of higher inflation in the US, and subsequently higher that anticipated interest rates in the US.
As has been the case, the Russia Fund will maintain its underweight position in the Energy sector. The underweight will be even larger given Gazprom’s large weight in the RTS index. Nevertheless, the absolute exposure to the Energy sector will remain quite high. The Fund will continue to look for opportunities in sectors that may be difficult to gain exposure to through Russian equities. In such cases, the Fund will attempt to gain this exposure through non-Russian companies that derive a significant portion of their revenue in Russia.
32
PORTFOLIO MANAGERS’ REPORT | | ING RUSSIA FUND |
| | | | | | | | | |
| Average Annual Total Returns for the Periods Ended April 30, 2006 | |
| | | | | | | | | |
| | | 1 Year | | 5 Year | | Since Inception
July 3, 1996 | | |
| Including Sales Charge: | | | | | | | | |
| Class A(1) | | 107.87 | % | 48.43 | % | 18.85 | % | |
| | | | | | | | | |
| Excluding Sales Charge: | | | | | | | | |
| Class A | | 120.52 | % | 50.19 | % | 19.57 | % | |
| MSCI EM IndexSM(2) | | 15.42 | % | 2.70 | % | 8.77 | %(3) | |
| Russian Trading System Index(4) | | 151.87 | % | 55.74 | % | 23.72 | %(3) | |
| Moscow Times Index(5) | | 171.05 | % | 61.49 | % | 29.10 | %(3) | |
| | | | | | | | | |
| | | | | | | | | | | | |
Based on a $10,000 initial investment, the table above illustrates the total return of ING Russia Fund against the Indices indicated. An Index is unmanaged and has no cash in its portfolio, imposes no sales charge and incurs no operating expenses. An investor cannot invest directly in an index. The Fund’s performance is shown both with and without the imposition of sales charges.
The performance table does not reflect the deduction of taxes that a shareholder will pay on Fund distributions or the redemption of Fund shares.
The performance shown may include the effect of fee waivers and/or expense reimbursements by the Investment Manager and/or other service providers, which have the effect of increasing total return. Had all fees and expenses been considered, the total returns would have been lower.
Performance data represents past performance and is no assurance of future results. Investment return and principal value of an investment in the Fund will fluctuate. Shares, when sold, may be worth more or less than their original cost. The Fund’s current performance may be lower or higher than the performance data shown. Please log on to www.ingfunds.com or call (800) 992-0180 to get performance through the most recent month end.
This report contains statements that may be “forward-looking” statements. Actual results may differ materially from those projected in the “forward-looking” statements.
The views expressed in this report reflect those of the portfolio managers, only through the end of the period as stated on the cover. The portfolio managers’ views are subject to change at any time based on market and other conditions.
Fund holdings are subject to change daily.
(1) | | Reflects deduction of the maximum Class A sales charge of 5.75%. |
| | |
(2) | | The MSCI EM IndexSM is an unmanaged index that measures the performance of securities listed on exchanges in developing nations throughout the world. The MSCI EM IndexSM more closely tracks the types of securities in which the Fund invests than the Moscow Times Index and the Russian Trading System Index. |
| | |
(3) | | Since inception performance for index is shown from July 1, 1996. |
| | |
(4) | | The Russian Trading System Index is a capitalization-weighted index that is calculated in U.S. dollars. The index tracks the performance of Russia’s most active stocks traded on the Russian Trading System. The index is operated by the National Association of Participants in the Securities Markets, a non-profit body. |
| | |
(5) | | The Moscow Times Index is an unmanaged index that measures the performance of 50 Russian stocks considered to represent the most liquid and most highly capitalized Russian stocks. |
Redemptions on shares held less than 365 days are subject to a redemption fee of 2% of the redemption proceeds.
33
ING EMERGING MARKETS FIXED INCOME FUND | | PORTFOLIO MANAGERS’ REPORT |
Country Allocation
as of April 30, 2006
(as a percent of net assets)
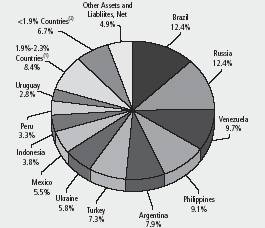
(1) Includes four countries, which each represents 1.9%-2.3% of net assets.
(2) Includes six countries, which each represents < 1.9% of net assets.
Portfolio holdings are subject to change daily.
ING Emerging Markets Fixed Income Fund (the “Fund”) seeks to maximize total return through investments in debt securities of issuers located or primarily conducting their business in emerging market countries. The Fund is managed by Rob Drijkoningen and Gorky Urquieta, Portfolio Managers, ING Investment Management Advisors B.V. — the Sub-Adviser.
Performance: From December 21, 2005, the inception of the Fund, to April 30, 2006, the Fund’s Class A shares, excluding sales charges, provided a total return of 3.87% compared to the JPMorgan Emerging Markets Bond Index Global Diversified, which returned 1.69% for the same period.
Portfolio Specifics: In the first four months of 2006, emerging market spreads came in strongly from 246 basis points over Treasuries to 187 basis points, despite US 10-year Treasury yields rising about 0.6%. Three factors were behind the strong decline in spreads. First, there was continuous creditworthiness improvement of the asset class, as can be seen from strong economic data and the continuously improving ratings from Moody’s and S&P. Second, there was the ease with which countries managed to secure most of their 2006 financing needs. And finally, the demand for emerging market debt has continued with a strong influx of new money. Expectations are for new money inflows to match last year’s high level.
In this environment riskier countries performed best, and as a result Latin America was the best performing region. Argentina and Ecuador performed very well, as they offer high yields and limited short term risks, with Argentina growing more strongly than expected and Ecuador managing to secure its funding for 2006. But also for Venezuela, Dominican Republic and Brazil spreads came in significantly as economic developments continued to be supportive and risk was re-evaluated. Asia managed to perform reasonably well on the back of its high-yielders Philippines, Indonesia and Pakistan while low-yielders, such as issuers in Malaysia, reflected the move in U.S. Treasuries. Eastern Europe witnessed little spread change and only reflected U.S. Treasury weakness.
The Fund outperformed the benchmark strongly. The overweight in Argentina, Ivory Coast and Venezuela, as well as underweights in China and Malaysia, added most to the Fund’s performance. The Fund also benefited from its strong top-down spread duration overweight versus the benchmark. Detractors of performance were the overweight in Russia and in Ukraine, where election and political developments affected prices.
During the period, we increased exposure to the Dominican Republic, Brazil, Turkey and Philippines. We reduced exposure to Mexico, Malaysia and Panama. Also, we first sold, and later re-bought securities of issuers in Peru as there were trading opportunities around the election noise.
Current Strategy and Outlook: In May the market sold off, as risk aversion hit global (emerging) equity markets. The EM index spread has widened about 30 basis points from the end of April. Global economic growth expectations however remain elevated, and we believe favorable economic conditions in emerging markets overall will continue. We view current valuations as somewhat tight, but the market has a possibility of allowing fundamentals (and credit ratings) to play catch-up. We expect continued inflows into the asset class, and see a significant adjustment as unlikely. Most countries have financed a large part of their 2006 needs, while balance of payments developments are also still positive in emerging markets. Besides that, the option of investing in emerging markets has to be weighed against the option of investing in mature markets, where several caveats apply. In the medium term, the outcome of the elections in some countries in Latin-America could raise tensions. In this respect, Brazil remains a very important benchmark to monitor; so far it has played a very positive role.
34
PORTFOLIO MANAGERS’ REPORT | | ING EMERGING MARKETS FIXED INCOME FUND |
| | | | | | | | | | |
| Cumulative Total Returns for the Periods Ended April 30, 2006 | |
| | | | | | | | | | |
| | | Since Inception
of Class A
December 21, 2005 | | Since Inception
of Class B
January 4, 2006 | | Since Inception
of Class C
March 1, 2006 | | Since Inception
of Class I
February 7, 2006 | |
| Including Sales Charge: | | | | | | | | | |
| Class A(1) | | (2.10 | )% | — | | — | | — | | |
| Class B(2) | | — | | (3.04 | )% | — | | — | | |
| Class C(3) | | — | | — | | (2.90 | )% | — | | |
| Class I | | — | | — | | — | | 0.91 | % | |
| | | | | | | | | | | |
| Excluding Sales Charge: | | | | | | | | | | |
| Class A | | 3.87 | % | — | | — | | — | | |
| Class B | | — | | 1.96 | % | — | | — | | |
| Class C | | — | | — | | (1.92 | )% | — | | |
| Class I | | — | | — | | — | | 0.91 | % | |
| JP Morgan Emerging Markets Bond Index Global Diversified(4) | | 1.69 | %(6) | 1.69 | %(6) | (1.66 | )% | 0.39 | %(5) | |
| | | | | | | | | | |
| | | | | | | | | | | | | | |
Based on a $10,000 initial investment, the table above illustrates the total return of ING Emerging Markets Fixed Income Fund against the index indicated. The index is unmanaged and has no cash in its portfolio, imposes no sales charge and incurs no operating expenses. An investor cannot invest directly in the index. The Fund’s performance is shown both with and without the imposition of sales charges.
The performance table does not reflect the deduction of taxes that a shareholder will pay on Fund distributions or the redemption of Fund shares.
The performance shown may include the effect of fee waivers and/or expense reimbursements by the Investment Manager and/or other service providers, which have the effect of increasing total return. Had all fees and expenses been considered, the total returns would have been lower.
Performance data represents past performance and is no assurance of future results. Investment return and principal value of an investment in the Fund will fluctuate. Shares, when sold, may be worth more or less than their original cost. The Fund’s current performance may be lower or higher than the performance data shown. Please log on to www.ingfunds.com or call (800) 992-0180 to get performance through the most recent month end.
It is important to note that the Fund has a limited operating history. Performance over a longer period of time may be more meaningful than short-term performance.
This report contains statements that may be “forward-looking” statements. Actual results may differ materially from those projected in the “forward-looking” statements.
The views expressed in this report reflect those of the portfolio managers, only through the end of the period as stated on the cover. The portfolio managers’ views are subject to change at any time based on market and other conditions.
Fund holdings are subject to change daily.
(1) | | Reflects deduction of the maximum Class A sales charge of 5.75%. |
| | |
(2) | | Reflects deduction of the Class B deferred sales charge of 5% for the since inception return. |
| | |
(3) | | Reflects deduction of the Class C deferred sales charge of 1% for the since inception return. |
| | |
(4) | | The JPMorgan Emerging Markets Bond Index Global Diversified is a uniquely-weighted version of the Emerging Markets Bond Index (“EMBI”) Global. It limits the weights of those index countries with larger debt stocks by only including specified portions of these countries’ eligible current face amounts of debt outstanding. |
| | |
(5) | | Since inception performance for index is shown from February 1, 2005. |
| | |
(6) | | Since inception performance for index is shown from January 1, 2006. |
35
ING DIVERSIFIED INTERNATIONAL FUND | | PORTFOLIO MANAGERS’ REPORT |
ING Diversified International Fund (the “Fund”) seeks long term growth of capital by investing in a combination of underlying Funds according to a fixed formula. The Fund is managed by ING Investments, LLC, under the guidance of an Investment Review Committee*.
Portfolio Specifics: The Fund’s current approximate target investment allocations (expressed as a percentage of its net assets) among the Underlying Funds are set out below. As these are Target Allocations, the actual allocations of the Fund’s assets may deviate from the percentages shown.
| | | | |
| | | ING Diversified
International
Fund | |
| International Core | | 40 | % | |
| International Growth | | 18 | % | |
| International Value | | 12 | % | |
| International Small Cap | | 13 | % | |
| Emerging Markets | | 17 | % | |
| | | | |
Assets will be allocated among funds and markets based on judgments made by ING Investments. The performance of the Fund reflects the performance of the underlying Funds in which it invests.
There is a risk that the Fund may allocate assets to a Fund or market that underperforms other asset classes. For example, the Fund may be underweighted in assets or a market that is experiencing significant returns or overweighted in assets or a market with significant declines.
The following tables illustrates the asset allocation of the underlying Fund’s, as of April 30, 2006.
| | | | |
| Asset Allocation as of April 30, 2006 (as a percent of net assets) | |
| | | | |
| Underlying Affiliated Funds | | ING Diversified
International
Fund | |
| ING Emerging Countries Fund - Class I | % | 10.1 | | |
| ING Foreign Fund - Class I | % | 17.0 | | |
| ING Index Plus International Equity Fund - Class I | % | 30.0 | | |
| ING International Capital Appreciation Fund - Class I | % | 17.9 | | |
| ING International SmallCap Fund - Class I | % | 13.0 | | |
| ING International Value Choice Fund Fund - Class I | % | 12.0 | | |
| | % | 100.0 | | |
| | | | | |
| Portfolio holdings are subject to change daily. | |
| | | | |
| | | | | | |
* The members of the Investment Review Committee Committee are: Shaun Mathews, Stan Vyner, Laurie Tillinghast, and Bill Evans.
36
PORTFOLIO MANAGERS’ REPORT | | ING DIVERSIFIED INTERNATIONAL FUND |
The ING Diversified International Fund (the “Fund”) seeks to make your investment grow by investing in a combination of Underlying Funds according to a fixed formula that over time should reflect an allocation of approximately 100% in equity securities.
| | | | |
| Cumulative Total Returns for the Periods Ended April 30, 2006 | |
| | | | |
| | | Since Inception
of the Fund
December 21, 2005 | |
| Including Sales Charge: | | | |
| Class A | | 7.54 | % | |
| Class B | | 8.90 | % | |
| Class C | | 12.90 | % | |
| Class I | | 14.20 | % | |
| | | | | |
| Excluding Sales Charge: | | | | |
| Class A | | 14.10 | % | |
| Class B | | 13.90 | % | |
| Class C | | 13.90 | % | |
| Class I | | 14.20 | % | |
| MSCI All Country World ex US Index(2) | | 15.42 | %(2) | |
| | | | |
| | | | | | | | |
Based on a $10,000 initial investment, the graph and table above illustrate the total return of ING Diversified International Fund against the MSCI All Country World ex US Index. The Index is unmanaged and has no cash in its portfolio, impose no sales charge and incur no operating expense. An investor cannot invest directly in the index. The Fund’s performance is shown without the imposition of any expenses or charges which are, or may be, imposed under your annuity contract. Total returns would have been lower if such expenses or charges were included.
The performance table does not reflect the deduction of taxes that a shareholder will pay on Fund distributions or the redemption of Fund Shares.
The Performance shown may include the effect of the waivers and/or expense reimbursements by the Investment Manager and/or other service providers, which have the effect of increasing total return. Had all fees and expenses been considered, the total returns would have been lower.
It is important to note that the Fund has a limited operating history. Performance over a longer period of time may be more meaningful than short-term performance.
This report contains statements that may be “forward-looking” statements. Actual results may differ materially from those projected in the “forward-looking” statements.
The views expressed in this report reflect those of the portfolio managers, only through the end of the period as stated on the cover. The portfolio managers’ views are subject to change at any time based on market and other conditions.
Portfolio holdings are subject to change daily.
(1) | | Since inception performance of the index is shown from January 1, 2006. |
| | |
(2) | | The Morgan Stanley Capital (“MSCI”) All Country World ex U.S. Index is a broad-based unmanaged index comprised of equity securities in countries around the world, other developed countries and emerging markets, excluding the United States. |
37
SHAREHOLDER EXPENSE EXAMPLES (UNAUDITED)
As a shareholder of a Fund, you incur two types of costs: (1) transaction costs, including sales charges (loads) on purchase payments; redemption fees; and exchange fees; and (2) ongoing costs, including management fees; distribution [and/or service] (12b-1) fees; and other Fund expenses. These Examples are intended to help you understand your ongoing costs (in dollars) of investing in a Fund and to compare these costs with the ongoing costs of investing in other mutual funds.
The Examples are based on an investment of $1,000 invested at the beginning of the period and held for the entire period from November 1, 2005 to April 30, 2006.
Actual Expenses
The first section of the table shown, “Actual Fund Return,” provides information about actual account values and actual expenses. You may use the information in this section, together with the amount you invested, to estimate the expenses that you paid over the period. Simply divide your account value by $1,000 (for example, an $8,600 account value divided by $1,000 = 8.6), then multiply the result by the number in the first section under the heading entitled “Expenses Paid During Period” to estimate the expenses you paid on your account during this period.
Hypothetical Example for Comparison Purposes
The second section of the table shown, “Hypothetical 5% Return,” provides information about hypothetical account values and hypothetical expenses based on the Fund’s actual expense ratio and an assumed rate of return of 5% per year before expenses, which is not the Fund’s actual return. The hypothetical account values and expenses may not be used to estimate the actual ending account balance or expenses you paid for the period. You may use this information to compare the ongoing costs of investing in the Fund and other funds. To do so, compare this 5% hypothetical example with the 5% hypothetical examples that appear in the shareholder reports of the other funds.
Please note that the expenses shown in the table are meant to highlight your ongoing costs only and do not reflect any transactional costs, such as sales charges (loads), redemption fees, or exchange fees. Therefore, the hypothetical lines of the table are useful in comparing ongoing costs only, and will not help you determine the relative total costs of owning different funds. In addition, if these transactional costs were included, your costs would have been higher.
| | | | | | | | | | |
| | | | | | | | | | |
| | | | | | | | | | |
| | | | Beginning
Account
Value
November 1, 2005 | | Ending
Account
Value
April 30, 2006 | | Annualized
Expense
Ratio | | Expenses Paid
During the
Six Months Ended
April 30, 2006* | |
| ING Global Equity Dividend Fund | | | | | | | | | | |
| Actual Fund Return | | | | | | | | | |
| Class A | | $ | 1,000.00 | | $ | 1,183.00 | | 1.40 | % | $ | 7.58 | | |
| Class B | | 1,000.00 | | 1,178.50 | | 2.15 | | 11.61 | | |
| Class C | | 1,000.00 | | 1,179.70 | | 2.15 | | 11.62 | | |
| Hypothetical (Excluding Expenses) | | | | | | | | | | |
| Class A | | $ | 1,000.00 | | $ | 1,017.85 | | 1.40 | % | $ | 7.00 | | |
| Class B | | 1,000.00 | | 1,014.13 | | 2.15 | | 10.74 | | |
| Class C | | 1,000.00 | | 1,014.13 | | 2.15 | | 10.74 | | |
| | | | | | | | | | |
| | | | | | | | | | | | | | | | | | | |
* Expenses are equal to each Fund’s respective annualized expense ratios multiplied by the average account value over the period, multiplied by 181/365 to reflect the most recent fiscal half-year.
38
SHAREHOLDER EXPENSE EXAMPLES (UNAUDITED) (CONTINUED)
| | | | | | | | | | |
| | | | Beginning
Account
Value
November 1, 2005 | | Ending
Account
Value
April 30, 2006 | | Annualized
Expense
Ratio | | Expenses Paid
During the
Six Months Ended
April 30, 2006* | |
| ING Global Real Estate Fund | | | | | | | | | | |
| Actual Fund Return | | | | | | | | | |
| Class A | | $ | 1,000.00 | | $ | 1,229.00 | | 1.54 | % | $ | 8.51 | | |
| Class B | | 1,000.00 | | 1,224.40 | | 2.29 | | 12.63 | | |
| Class C | | 1,000.00 | | 1,224.00 | | 2.29 | | 12.63 | | |
| Class I | | 1,000.00 | | 1,230.50 | | 1.20 | | 6.64 | | |
| Hypothetical (Excluding Expenses) | | | | | | | | | | |
| Class A | | $ | 1,000.00 | | $ | 1,017.16 | | 1.54 | % | $ | 7.70 | | |
| Class B | | 1,000.00 | | 1,013.44 | | 2.29 | | 11.43 | | |
| Class C | | 1,000.00 | | 1,013.44 | | 2.29 | | 11.43 | | |
| Class I | | 1,000.00 | | 1,018.84 | | 1.20 | | 6.01 | | |
| | | | | | | | | | | |
| ING Global Value Choice Fund | | | | | | | | | | |
| Actual Fund Return | | | | | | | | | | |
| Class A | | $ | 1,000.00 | | $ | 1,180.90 | | 1.85 | % | $ | 10.00 | | |
| Class B | | 1,000.00 | | 1,177.40 | | 2.50 | | 13.50 | | |
| Class C | | 1,000.00 | | 1,177.30 | | 2.50 | | 13.50 | | |
| Class Q | | 1,000.00 | | 1,182.80 | | 1.55 | | 8.39 | | |
| Hypothetical (Excluding Expenses) | | | | | | | | | | |
| Class A | | $ | 1,000.00 | | $ | 1,015.62 | | 1.85 | % | $ | 9.25 | | |
| Class B | | 1,000.00 | | 1,012.40 | | 2.50 | | 12.47 | | |
| Class C | | 1,000.00 | | 1,012.40 | | 2.50 | | 12.47 | | |
| Class Q | | 1,000.00 | | 1,017.11 | | 1.55 | | 7.75 | | |
| | | | | | | | | | | |
| ING Emerging Countries Fund | | | | | | | | | | |
| Actual Fund Return | | | | | | | | | | |
| Class A | | $ | 1,000.00 | | $ | 1,270.00 | | 1.93 | % | $ | 10.86 | | |
| Class B | | 1,000.00 | | 1,265.90 | | 2.68 | | 15.06 | | |
| Class C | | 1,000.00 | | 1,265.70 | | 2.68 | | 15.06 | | |
| Class I (a) | | 1,000.00 | | 1,170.50 | | 2.16 | | 8.41 | | |
| Class M | | 1,000.00 | | 1,267.10 | | 2.43 | | 13.66 | | |
| Class Q | | 1,000.00 | | 1,271.20 | | 1.81 | | 10.19 | | |
| Hypothetical (Excluding Expenses) | | | | | | | | | | |
| Class A | | $ | 1,000.00 | | $ | 1,015.22 | | 1.93 | % | $ | 9.64 | | |
| Class B | | 1,000.00 | | 1,011.50 | | 2.68 | | 13.37 | | |
| Class C | | 1,000.00 | | 1,011.50 | | 2.68 | | 13.37 | | |
| Class I | | 1,000.00 | | 1,010.19 | | 2.16 | | 7.79 | | |
| Class M | | 1,000.00 | | 1,012.74 | | 2.43 | | 12.13 | | |
| Class Q | | 1,000.00 | | 1,015.82 | | 1.81 | | 9.05 | | |
| | | | | | | | | | |
| | | | | | | | | | | | | | | | | | |
* Expenses are equal to each Fund’s respective annualized expense ratios multiplied by the average account value over the period, multiplied by 181/365 to reflect the most recent fiscal half-year (except “Actual Fund Return” information for ING Emerging Countries Fund, which reflects the 131-day period ended April 30, 2006 due to its Class I inception date of December 21, 2005).
(a) Commencement of operations for Class I on December 21, 2005.
39
SHAREHOLDER EXPENSE EXAMPLES (UNAUDITED) (CONTINUED)
| | | | | | | | | | |
| | | | Beginning
Account
Value
November 1, 2005 | | Ending
Account
Value
April 30, 2006 | | Annualized
Expense
Ratio | | Expenses Paid
During the
Six Months Ended
April 30, 2006* | |
| ING Foreign Fund | | | | | | | | | | |
| Actual Fund Return | | | | | | | | | |
| Class A | | $ | 1,000.00 | | $ | 1,268.70 | | 1.65 | % | $ | 9.28 | | |
| Class B | | 1,000.00 | | 1,264.20 | | 2.40 | | 13.47 | | |
| Class C | | 1,000.00 | | 1,263.80 | | 2.40 | | 13.47 | | |
| Class I | | 1,000.00 | | 1,270.30 | | 1.30 | | 7.32 | | |
| Class Q | | 1,000.00 | | 1,269.50 | | 1.65 | | 9.28 | | |
| Hypothetical (Excluding Expenses) | | | | | | | | | | |
| Class A | | $ | 1,000.00 | | $ | 1,016.61 | | 1.65 | % | $ | 8.25 | | |
| Class B | | 1,000.00 | | 1,012.89 | | 2.40 | | 11.98 | | |
| Class C | | 1,000.00 | | 1,012.89 | | 2.40 | | 11.98 | | |
| Class I | | 1,000.00 | | 1,018.35 | | 1.30 | | 6.51 | | |
| Class Q | | 1,000.00 | | 1,016.61 | | 1.65 | | 8.25 | | |
| | | | | | | | | | | |
| ING Greater China Fund(a) | | | | | | | | | | |
| Actual Fund Return | | | | | | | | | | |
| Class A | | $ | 1,000.00 | | $ | 1,213.00 | | 2.90 | % | $ | 11.43 | | |
| Class B | | 1,000.00 | | 1,142.50 | | 3.65 | | 12.21 | | |
| Class C | | 1,000.00 | | 1,135.90 | | 3.65 | | 11.64 | | |
| Hypothetical (Excluding Expenses) | | | | | | | | | | |
| Class A | | $ | 1,000.00 | | $ | 1,007.48 | | 2.90 | % | $ | 10.37 | | |
| Class B | | 1,000.00 | | 1,004.22 | | 3.65 | | 11.42 | | |
| Class C | | 1,000.00 | | 1,004.03 | | 3.65 | | 10.92 | | |
| | | | | | | | | | | |
| ING Index Plus International Equity Fund(b) | | | | | | | | | | |
| Actual Fund Return | | | | | | | | | | |
| Class A | | $ | 1,000.00 | | $ | 1,122.00 | | 1.15 | % | $ | 4.38 | | |
| Class B | | 1,000.00 | | 1,073.80 | | 1.90 | | 6.48 | | |
| Class C | | 1,000.00 | | 1,072.90 | | 1.90 | | 6.47 | | |
| Class I | | 1,000.00 | | 1,122.00 | | 0.90 | | 3.43 | | |
| Hypothetical (Excluding Expenses) | | | | | | | | | | |
| Class A | | $ | 1,000.00 | | $ | 1,013.82 | | 1.15 | % | $ | 4.16 | | |
| Class B | | 1,000.00 | | 1,010.19 | | 1.90 | | 6.28 | | |
| Class C | | 1,000.00 | | 1,010.19 | | 1.90 | | 6.28 | | |
| Class I | | 1,000.00 | | 1,014.72 | | 0.90 | | 3.25 | | |
| | | | | | | | | | |
| | | | | | | | | | | | | | | | | | |
* Expenses are equal to each Fund’s respective annualized expense ratios multiplied by the average account value over the period, multiplied by 181/365 to reflect the most recent fiscal half-year (except “Actual Fund Return” information for ING Greater China Fund, which reflects the 130-day period due to its Class A inception date of December 21, 2005, the 114-day period due to its Class B inception date of January 6, 2006, and 109-day period due to its Class C inception date of January 11, 2006, and for ING Index Plus International Equity Fund, which reflects the 131-day period due to its Class A and Class I inception date of December 21, 2006 and the 120-day period due to its Class B and Class C inception date of January 12, 2006).
(a) Commencement of operations for Class A, Class B, and Class C on December 21, 2005, January 6, 2006, and January 11, 2006, respectively.
(b) Commencement of operations for Class A and Class I on December 21, 2005 and for Class B and Class C on January 12, 2006.
40
SHAREHOLDER EXPENSE EXAMPLES (UNAUDITED) (CONTINUED)
| | | | | | | | | | |
| | | Beginning
Account
Value
November 1, 2005 | | Ending
Account
Value
April 30, 2006 | | Annualized
Expense
Ratio | | Expenses Paid
During the
Six Months Ended
April 30, 2006* | |
| ING International Fund | | | | | | | | | |
| Actual Fund Return | | | | | | | | | | |
| Class A | | $ | 1,000.00 | | $ | 1,224.80 | | 1.66 | % | $ | 9.16 | | |
| Class B | | 1,000.00 | | 1,220.00 | | 2.41 | | 13.27 | | |
| Class C | | 1,000.00 | | 1,220.20 | | 2.41 | | 13.27 | | |
| Class I | | 1,000.00 | | 1,226.50 | | 1.27 | | 7.01 | | |
| Class Q | | 1,000.00 | | 1,225.70 | | 1.53 | | 8.44 | | |
| Hypothetical (Excluding Expenses) | | | | | | | | | | |
| Class A | | $ | 1,000.00 | | $ | 1,016.56 | | 1.66 | % | $ | 8.30 | | |
| Class B | | 1,000.00 | | 1,012.84 | | 2.41 | | 12.03 | | |
| Class C | | 1,000.00 | | 1,012.84 | | 2.41 | | 12.03 | | |
| Class I | | 1,000.00 | | 1,018.50 | | 1.27 | | 6.36 | | |
| Class Q | | 1,000.00 | | 1,017.21 | | 1.53 | | 7.65 | | |
| | | | | | | | | | | |
| ING International Capital Appreciation Fund(a) | | | | | | | | | | |
| Actual Fund Return | | | | | | | | | | |
| Class A | | $ | 1,000.00 | | $ | 1,094.00 | | 1.50 | % | $ | 5.59 | | |
| Class B | | 1,000.00 | | 1,047.00 | | 2.25 | | 7.00 | | |
| Class C | | 1,000.00 | | 1,061.30 | | 2.25 | | 6.10 | | |
| Class I | | 1,000.00 | | 1,095.00 | | 1.25 | | 4.66 | | |
| Hypothetical (Excluding Expenses) | | | | | | | | | | |
| Class A | | $ | 1,000.00 | | $ | 1,012.47 | | 1.50 | % | $ | 5.38 | | |
| Class B | | 1,000.00 | | 1,008.36 | | 2.25 | | 6.87 | | |
| Class C | | 1,000.00 | | 1,007.23 | | 2.25 | | 5.94 | | |
| Class I | | 1,000.00 | | 1,013.36 | | 1.25 | | 4.48 | | |
| | | | | | | | | | | |
| ING International Real Estate Fund(b) | | | | | | | | | | |
| Actual Fund Return | | | | | | | | | | |
| Class A | | $ | 1,000.00 | | $ | 1,054.30 | | 1.50 | % | $ | 2.62 | | |
| Class B | | 1,000.00 | | 1,053.50 | | 2.25 | | 3.92 | | |
| Class C | | 1,000.00 | | 1,052.30 | | 2.25 | | 3.92 | | |
| Class I | | 1,000.00 | | 1,054.60 | | 1.25 | | 2.18 | | |
| all funds | | | | | | | | | | |
| Hypothetical (Excluding Expenses) | | | | | | | | | | |
| Class A | | $ | 1,000.00 | | $ | 1,005.95 | | 1.50 | % | $ | 2.56 | | |
| Class B | | 1,000.00 | | 1,004.67 | | 2.25 | | 3.83 | | |
| Class C | | 1,000.00 | | 1,004.67 | | 2.25 | | 3.83 | | |
| Class I | | 1,000.00 | | 1,006.37 | | 1.25 | | 2.13 | | |
| | | | | | | | | | |
| | | | | | | | | | | | | | | | | |
* Expenses are equal to each Fund’s respective annualized expense ratios multiplied by the average account value over the period, multiplied by 181/365 to reflect the most recent fiscal half-year (except “Actual Fund Return” information for ING International Capital Appreciation Fund, which reflects the 130-day period due to its Class A and Class I inception date of December 21, 2005, the 111-day period due to its Class B inception date of January 9, 2006, and the 96-day period due to its Class C inception date of January 24, 2006, and for ING Intermediate Real Estate Fund, which reflects the 62-day period due to its classes inception date of February 28, 2006).
(a) Commencement of operations for Class A and Class I, Class B, and Class C on December 21, 2005, January 9, 2006, and January 24, 2006, respectively.
(b) Commencement of operations for all classes on February 28, 2006.
41
SHAREHOLDER EXPENSE EXAMPLES (UNAUDITED) (CONTINUED)
| | | | | | | | | | |
| | | Beginning
Account
Value
November 1, 2005 | | Ending
Account
Value
April 30, 2006 | | Annualized
Expense
Ratio | | Expenses Paid
During the
Six Months Ended
April 30, 2006* | |
| ING International SmallCap Fund | | | | | | | | | |
| Actual Fund Return | | | | | | | | | | |
| Class A | | $ | 1,000.00 | | $ | 1,297.60 | | 1.69 | % | $ | 9.63 | | |
| Class B | | 1,000.00 | | 1,293.20 | | 2.34 | | 13.30 | | |
| Class C | | 1,000.00 | | 1,293.50 | | 2.34 | | 13.31 | | |
| Class I(a) | | 1,000.00 | | 1,197.80 | | 1.20 | | 4.73 | | |
| Class Q | | 1,000.00 | | 1,298.80 | | 1.47 | | 8.38 | | |
| Hypothetical (Excluding Expenses) | | | | | | | | | | |
| Class A | | $ | 1,000.00 | | $ | 1,016.41 | | 1.69 | % | $ | 8.45 | | |
| Class B | | 1,000.00 | | 1,013.19 | | 2.34 | | 11.68 | | |
| Class C | | 1,000.00 | | 1,013.19 | | 2.34 | | 11.68 | | |
| Class I | | 1,000.00 | | 1,013.64 | | 1.20 | | 4.34 | | |
| Class Q | | 1,000.00 | | 1,017.50 | | 1.47 | | 7.35 | | |
| | | | | | | | | | | |
| ING International Value Fund | | | | | | | | | | |
| Actual Fund Return | | | | | | | | | | |
| Class A | | $ | 1,000.00 | | $ | 1,231.30 | | 1.60 | % | $ | 8.85 | | |
| Class B | | 1,000.00 | | 1,227.80 | | 2.30 | | 12.70 | | |
| Class C | | 1,000.00 | | 1,227.30 | | 2.30 | | 12.70 | | |
| Class I | | 1,000.00 | | 1,234.00 | | 1.23 | | 6.81 | | |
| Class Q | | 1,000.00 | | 1,231.90 | | 1.48 | | 8.19 | | |
| Hypothetical (Excluding Expenses) | | | | | | | | | | |
| Class A | | $ | 1,000.00 | | $ | 1,016.86 | | 1.60 | % | $ | 8.00 | | |
| Class B | | 1,000.00 | | 1,013.39 | | 2.30 | | 11.48 | | |
| Class C | | 1,000.00 | | 1,013.39 | | 2.30 | | 11.48 | | |
| Class I | | 1,000.00 | | 1,018.70 | | 1.23 | | 6.16 | | |
| Class Q | | 1,000.00 | | 1,017.46 | | 1.48 | | 7.40 | | |
| | | | | | | | | | | |
| ING International Value Choice Fund | | | | | | | | | | |
| Actual Fund Return | | | | | | | | | | |
| Class A | | $ | 1,000.00 | | $ | 1,185.30 | | 1.68 | % | $ | 9.10 | | |
| Class B | | 1,000.00 | | 1,178.60 | | 2.43 | | 13.13 | | |
| Class C | | 1,000.00 | | 1,179.70 | | 2.43 | | 13.13 | | |
| Class I(a) | | 1,000.00 | | 1,121.40 | | 1.38 | | 5.25 | | |
| Hypothetical (Excluding Expenses) | | | | | | | | | | |
| Class A | | $ | 1,000.00 | | $ | 1,016.46 | | 1.68 | % | $ | 8.40 | | |
| Class B | | 1,000.00 | | 1,012.74 | | 2.43 | | 12.13 | | |
| Class C | | 1,000.00 | | 1,012.74 | | 2.43 | | 12.13 | | |
| Class I | | 1,000.00 | | 1,012.99 | | 1.38 | | 4.99 | | |
| | | | | | | | | | |
| | | | | | | | | | | | | | | | | | |
* Expenses are equal to each Fund’s respective annualized expense ratios multiplied by the average account value over the period, multiplied by 181/365 to reflect the most recent fiscal half-year (except “Actual Fund Return” information for ING International SmallCap Fund and ING International Value Choice Fund, which reflects the 131-day period ended April 30, 2006 due to their Class I inception date of December 21, 2005).
(a) Commencement of operations for Class I on December 21, 2005.
42
SHAREHOLDER EXPENSE EXAMPLES (UNAUDITED) (CONTINUED)
| | | | | | | | | | |
| | | Beginning
Account
Value
November 1, 2005 | | Ending
Account
Value
April 30, 2006 | | Annualized
Expense
Ratio | | Expenses Paid
During the
Six Months Ended
April 30, 2006* | |
| ING Precious Metals Fund | | | | | | | | | |
| Actual Fund Return | | $ | 1,000.00 | | $ | 1,658.20 | | 1.44 | % | $ | 9.49 | | |
| Hypothetical (Excluding Expenses) | | $ | 1,000.00 | | $ | 1,017.65 | | 1.44 | % | $ | 7.20 | | |
| | | | | | | | | | | |
| ING Russia Fund | | | | | | | | | | |
| Actual Fund Return | | $ | 1,000.00 | | $ | 1,633.00 | | 2.03 | % | $ | 13.25 | | |
| Hypothetical (Excluding Expenses) | | $ | 1,000.00 | | $ | 1,014.73 | | 2.03 | % | $ | 10.14 | | |
| | | | | | | | | | | |
| ING Emerging Markets Fixed Income Fund(a) | | | | | | | | | | |
| Actual Fund Return | | | | | | | | | | |
| Class A | | $ | 1,000.00 | | $ | 1,038.70 | | 1.25 | % | $ | 4.54 | | |
| Class B | | 1,000.00 | | 1,019.60 | | 2.00 | | 6.42 | | |
| Class C | | 1,000.00 | | 980.80 | | 2.00 | | 3.26 | | |
| Class I | | 1,000.00 | | 1,009.10 | | 1.00 | | 2.26 | | |
| Hypothetical (Excluding Expenses) | | | | | | | | | | |
| Class A | | $ | 1,000.00 | | $ | 1,013.36 | | 1.25 | % | $ | 4.48 | | |
| Class B | | 1,000.00 | | 1,009.53 | | 2.00 | | 6.39 | | |
| Class C | | 1,000.00 | | 1,004.93 | | 2.00 | | 3.30 | | |
| Class I | | 1,000.00 | | 1,008.99 | | 1.00 | | 2.26 | | |
| | | | | | | | | | | |
| ING Diversified International Fund(b) | | | | | | | | | | |
| Actual Fund Return | | | | | | | | | | |
| Class A | | $ | 1,000.00 | | $ | 1,141.00 | | 0.35 | %** | $ | 1.34 | | |
| Class B | | 1,000.00 | | 1,139.00 | | 1.10 | ** | 4.22 | | |
| Class C | | 1,000.00 | | 1,139.00 | | 1.10 | ** | 4.22 | | |
| Class I | | 1,000.00 | | 1,142.00 | | 0.10 | ** | 0.38 | | |
| Hypothetical (Excluding Expenses) | | | | | | | | | | |
| Class A | | $ | 1,000.00 | | $ | 1,016.69 | | 0.35 | %** | $ | 1.27 | | |
| Class B | | 1,000.00 | | 1,014.00 | | 1.10 | ** | 3.98 | | |
| Class C | | 1,000.00 | | 1,014.00 | | 1.10 | ** | 3.98 | | |
| Class I | | 1,000.00 | | 1,017.59 | | 0.10 | ** | 0.36 | | |
| | | | | | | | | | |
| | | | | | | | | | | | | | | | | | |
* Expenses are equal to each Fund’s respective annualized expense ratios multiplied by the average account value over the period, multiplied by 181/365 to reflect the most recent fiscal half-year (except “Actual Fund Return” information for ING Emerging Markets Fixed Income Fund, which reflects the 130-day period due to its Class A inception date of December 21, 2005, the 116-day period due to its Class B inception date of January 4, 2006, the 60-day period due to its Class C inception date of March 1, 2006, and the 82-day period due to its Class I inception date of February 7, 2006, and for ING Index Plus International Equity Fund, which reflects the 131-day period due to its classes inception date of December 21, 2006).
** Expense ratios do not include expenses of the underlying funds.
(a) Commencement of operations for Class A, Class B, Class C, and Class I on December 21, 2005, January 4, 2006, March 1, 2006, and February 7, 2006, respectively.
(b) Commencement of operations for all classes on December 21, 2005.
43
STATEMENTS OF ASSETS AND LIABILITIES AS OF APRIL 30, 2006 (UNAUDITED)
| | ING
Global Equity
Dividend
Fund | | ING
Global
Real Estate
Fund | | ING
Global
Value Choice
Fund | | ING
Emerging
Countries
Fund | |
ASSETS: | | | | | | | | | |
Investments in securities at value+* | | $ | 178,736,505 | | $ | 290,180,080 | | $ | 103,837,634 | | $ | 198,908,377 | |
Short-term investments at amortized cost | | — | | 10,419,726 | | 25,926,683 | | 36,855,075 | |
Cash | | 3,869,218 | | 1,168,993 | | 818,626 | | 1,411,868 | |
Foreign currencies at value*** | | 1,601,851 | | — | | 181,369 | | — | |
Receivables: | | | �� | | | | | | |
Investment securities sold | | — | | 2,254,523 | | 2,968,094 | | 498,655 | |
Fund shares sold | | 628,882 | | 3,680,625 | | 88,931 | | 1,633,186 | |
Dividends and interest | | 622,936 | | 487,052 | | 295,697 | | 1,186,742 | |
Prepaid expenses | | 24,499 | | 38,596 | | 42,740 | | 38,506 | |
Reimbursement due from manager | | — | | — | | 3,521 | | — | |
Total assets | | 185,483,891 | | 308,229,595 | | 134,163,295 | | 240,532,409 | |
| | | | | | | | | |
LIABILITIES: | | | | | | | | | |
Payable for investment securities purchased | | — | | 5,769,037 | | 2,011,360 | | 511,350 | |
Payable for fund shares redeemed | | 286,262 | | 276,826 | | 236,759 | | 283,516 | |
Payable upon receipt of securities loaned | | — | | — | | 18,930,538 | | 33,476,488 | |
Payable to custodian due to foreign currency overdraft*** | | — | | 958,024 | | — | | 759,591 | |
Payable to affiliates | | 228,261 | | 351,891 | | 163,258 | | 285,601 | |
Payable for trustee fees | | — | | 685 | | 32,627 | | 61,101 | |
Other accrued expenses and liabilities | | 54,996 | | 56,104 | | 161,941 | | 129,076 | |
Total liabilities | | 569,519 | | 7,412,567 | | 21,536,483 | | 35,506,723 | |
NET ASSETS | | $ | 184,914,372 | | $ | 300,817,028 | | $ | 112,626,812 | | $ | 205,025,686 | |
| | | | | | | | | |
NET ASSETS WERE COMPRISED OF: | | | | | | | | | |
Paid-in capital | | $ | 158,141,657 | | $ | 235,789,536 | | $ | 281,518,933 | | $ | 223,190,722 | |
Undistributed net investment income
(distributions in excess) | | 742,484 | | (6,161,267 | ) | 182,685 | | 1,407,018 | |
Accumulated net realized gain (loss) on investments and foreign currency related transactions | | 7,520,498 | | 3,511,814 | | (182,592,711 | ) | (48,959,803 | ) |
Net unrealized appreciation on investments and foreign currency related transactions | | 18,509,733 | | 67,676,945 | | 13,517,905 | | 29,387,749 | |
NET ASSETS | | $ | 184,914,372 | | $ | 300,817,028 | | $ | 112,626,812 | | $ | 205,025,686 | |
+ | | Including securities loaned at value | | $ | — | | $ | — | | $ | 18,474,705 | | $ | 32,219,145 | |
* | | Cost of investments in securities | | $ | 160,284,348 | | $ | 222,476,410 | | $ | 90,323,973 | | $ | 169,526,418 | |
*** | | Cost of foreign currencies | | $ | 1,551,932 | | $ | (947,594 | ) | $ | 183,652 | | $ | (758,769 | ) |
See Accompanying Notes to Financial Statements
44
STATEMENTS OF ASSETS AND LIABILITIES AS OF APRIL 30, 2006 (UNAUDITED) (CONTINUED)
| | ING
Global Equity
Dividend
Fund | | ING
Global
Real Estate
Fund | | ING
Global
Value Choice
Fund | | ING
Emerging
Countries
Fund | |
Class A: | | | | | | | | | |
Net assets | | $ | 83,072,593 | | $ | 226,714,630 | | $ | 49,796,358 | | $ | 121,138,976 | |
Shares authorized | | unlimited | | unlimited | | unlimited | | unlimited | |
Par value | | $ | — | | $ | — | | $ | — | | $ | — | |
Shares outstanding | | 5,514,613 | | 11,616,037 | | 2,338,496 | | 4,063,061 | |
Net asset value and redemption price per share | | $ | 15.06 | | $ | 19.52 | | $ | 21.29 | | $ | 29.81 | |
Maximum offering price per share (5.75%)(1) | | $ | 15.98 | | $ | 20.71 | | $ | 22.59 | | $ | 31.63 | |
| | | | | | | | | |
Class B: | | | | | | | | | |
Net assets | | $ | 38,510,214 | | $ | 19,017,127 | | $ | 23,954,218 | | $ | 16,163,841 | |
Shares authorized | | unlimited | | unlimited | | unlimited | | unlimited | |
Par value | | $ | — | | $ | — | | $ | — | | $ | — | |
Shares outstanding | | 2,561,724 | | 1,126,248 | | 1,034,468 | | 551,057 | |
Net asset value and redemption price per share(2) | | $ | 15.03 | | $ | 16.89 | | $ | 23.16 | | $ | 29.33 | |
Maximum offering price per share | | $ | 15.03 | | $ | 16.89 | | $ | 23.16 | | $ | 29.33 | |
| | | | | | | | | |
Class C: | | | | | | | | | |
Net assets | | $ | 63,331,565 | | $ | 50,581,370 | | $ | 33,323,711 | | $ | 35,736,443 | |
Shares authorized | | unlimited | | unlimited | | unlimited | | unlimited | |
Par value | | $ | — | | $ | — | | $ | — | | $ | — | |
Shares outstanding | | 4,220,443 | | 2,861,809 | | 1,619,167 | | 1,285,140 | |
Net asset value and redemption price per share(2) | | $ | 15.01 | | $ | 17.67 | | $ | 20.58 | | $ | 27.81 | |
Maximum offering price per share | | $ | 15.01 | | $ | 17.67 | | $ | 20.58 | | $ | 27.81 | |
| | | | | | | | | |
Class M: | | | | | | | | | |
Net assets | | n/a | | n/a | | n/a | | $ | 1,521,746 | |
Shares authorized | | n/a | | n/a | | n/a | | unlimited | |
Par value | | n/a | | n/a | | n/a | | $ | — | |
Shares outstanding | | n/a | | n/a | | n/a | | 51,808 | |
Net asset value and redemption price per share | | n/a | | n/a | | n/a | | $ | 29.37 | |
Maximum offering price per share (3.50%)(3) | | n/a | | n/a | | n/a | | $ | 30.44 | |
| | | | | | | | | |
Class I: | | | | | | | | | |
Net assets | | n/a | | $ | 4,503,901 | | n/a | | $ | 14,074,632 | |
Shares authorized | | n/a | | unlimited | | n/a | | unlimited | |
Par value | | n/a | | $ | — | | n/a | | $ | — | |
Shares outstanding | | n/a | | 230,747 | | n/a | | 471,182 | |
Net asset value and redemption price per share | | n/a | | $ | 19.52 | | n/a | | $ | 29.87 | |
Maximum offering price per share | | n/a | | $ | 19.52 | | n/a | | $ | 29.87 | |
| | | | | | | | | |
Class Q: | | | | | | | | | |
Net assets | | n/a | | n/a | | $ | 5,552,525 | | $ | 16,390,048 | |
Shares authorized | | n/a | | n/a | | unlimited | | unlimited | |
Par value | | n/a | | n/a | | $ | — | | $ | — | |
Shares outstanding | | n/a | | n/a | | 222,853 | | 532,209 | |
Net asset value and redemption price per share | | n/a | | n/a | | $ | 24.92 | | $ | 30.80 | |
Maximum offering price per share | | n/a | | n/a | | $ | 24.92 | | $ | 30.80 | |
(1) | Maximum offering price is computed at 100/94.25 of net asset value. On purchases of $50,000 or more, the offering price is reduced. |
(2) | Redemption price per share may be reduced for any applicable contingent deferred sales charges. |
(3) | Maximum offering price is computed at 100/96.50 of net asset value. On purchases of $50,000 or more, the offering price is reduced. |
See Accompanying Notes to Financial Statements
45
STATEMENTS OF ASSETS AND LIABILITIES AS OF APRIL 30, 2006 (UNAUDITED)
| | ING
Foreign
Fund | | ING
Greater China
Fund | | ING
Index Plus
International
Equity
Fund | | ING
International
Fund | |
ASSETS: | | | | | | | | | |
Investments in securities at value+* | | $ | 395,961,876 | | $ | 17,405,113 | | $ | 56,913,642 | | $ | 131,983,530 | |
Short-term investments at amortized cost | | 17,853,078 | | — | | — | | 326,444 | |
Repurchase agreement | | — | | — | | — | | 7,959,000 | |
Cash | | 5,133,284 | | 1,406,895 | | 2,527,159 | | 72,289 | |
Foreign currencies at value*** | | 1,644,951 | | — | | 35,239 | | 15,000 | |
Receivables: | | | | | | | | | |
Investment securities sold | | 3,025,412 | | 5,604 | | 6,862,102 | | 53,149,649 | |
Fund shares sold | | 4,126,610 | | 721,661 | | 2,689,138 | | 220,377 | |
Dividends and interest | | 724,979 | | 58,716 | | 132,612 | | 705,477 | |
Unrealized appreciation on forward foreign currency contracts | | 84,025 | | — | | — | | — | |
Prepaid expenses | | 31,737 | | 70,987 | | 71,082 | | 44,700 | |
Reimbursement due from manager | | — | | — | | 15,681 | | — | |
Total assets | | 428,585,952 | | 19,668,976 | | 69,246,655 | | 194,476,466 | |
| | | | | | | | | |
LIABILITIES: | | | | | | | | | |
Payable for investment securities purchased | | 7,912,417 | | 152,682 | | 9,429,244 | | 56,317,810 | |
Payable for fund shares redeemed | | 361,830 | | — | | — | | 223,560 | |
Payable upon receipt of securities loaned | | 12,719,705 | | — | | — | | 326,444 | |
Payable to custodian due to foreign currency overdraft*** | | — | | 249,227 | | — | | — | |
Unrealized depreciation on forward currency contracts | | 438,817 | | — | | — | | — | |
Payable to affiliates | | 568,403 | | 21,053 | | 31,484 | | 168,873 | |
Payable for trustee fees | | 104 | | 813 | | 862 | | 30,708 | |
Other accrued expenses and liabilities | | 125,934 | | 33,827 | | 42,265 | | 84,470 | |
Total liabilities | | 22,127,210 | | 457,602 | | 9,503,855 | | 57,151,865 | |
NET ASSETS | | $ | 406,458,742 | | $ | 19,211,374 | | $ | 59,742,800 | | $ | 137,324,601 | |
| | | | | | | | | |
NET ASSETS WERE COMPRISED OF: | | | | | | | | | |
Paid-in capital | | $ | 303,814,136 | | $ | 16,609,710 | | $ | 55,730,882 | | $ | 114,359,147 | |
Undistributed net investment income
(accumulated net investment loss) | | 387,365 | | (44,366 | ) | 281,682 | | 329,349 | |
Accumulated net realized gain on investments and foreign currency related transactions | | 8,142,008 | | 436,686 | | 873,661 | | 8,600,779 | |
Net unrealized appreciation on investments and foreign currency related transactions | | 94,115,233 | | 2,209,344 | | 2,856,575 | | 14,035,326 | |
NET ASSETS | | $ | 406,458,742 | | $ | 19,211,374 | | $ | 59,742,800 | | $ | 137,324,601 | |
| | | | | | | | | |
|
+ | | Including securities loaned at value | | $ | 16,454,832 | | $ | — | | $ | — | | $ | 317,070 | |
* | | Cost of investments in securities | | $ | 301,511,234 | | $ | 15,195,852 | | $ | 54,060,114 | | $ | 117,964,990 | |
*** | | Cost of foreign currencies | | $ | 1,596,163 | | $ | (249,310 | ) | $ | 35,918 | | $ | 14,959 | |
See Accompanying Notes to Financial Statements
46
STATEMENTS OF ASSETS AND LIABILITIES AS OF APRIL 30, 2006 (UNAUDITED) (CONTINUED)
| | ING
Foreign
Fund | | ING
Greater China
Fund | | ING
Index Plus
International
Equity
Fund | | ING
International
Fund | |
Class A: | | | | | | | | | |
Net assets | | $ | 200,588,386 | | $ | 17,794,977 | | $ | 17,425,230 | | $ | 62,374,269 | |
Shares authorized | | unlimited | | unlimited | | unlimited | | unlimited | |
Par value | | $ | — | | $ | — | | $ | — | | $ | — | |
Shares outstanding | | 10,936,137 | | 1,467,046 | | 1,553,674 | | 4,710,948 | |
Net asset value and redemption price per share | | $ | 18.34 | | $ | 12.13 | | $ | 11.22 | | $ | 13.24 | |
Maximum offering price per share (5.75%)(1) | | $ | 19.46 | | $ | 12.87 | | $ | 11.90 | | $ | 14.05 | |
| | | | | | | | | |
Class B: | | | | | | | | | |
Net assets | | $ | 37,875,662 | | $ | 544,045 | | $ | 128,333 | | $ | 19,095,485 | |
Shares authorized | | unlimited | | unlimited | | unlimited | | unlimited | |
Par value | | $ | — | | $ | — | | $ | — | | $ | — | |
Shares outstanding | | 2,108,089 | | 44,932 | | 11,453 | | 1,494,905 | |
Net asset value and redemption price per share(2) | | $ | 17.97 | | $ | 12.11 | | $ | 11.21 | | $ | 12.77 | |
Maximum offering price per share | | $ | 17.97 | | $ | 12.11 | | $ | 11.21 | | $ | 12.77 | |
| | | | | | | | | |
Class C: | | | | | | | | | |
Net assets | | $ | 141,742,404 | | $ | 872,352 | | $ | 421,859 | | $ | 17,592,250 | |
Shares authorized | | unlimited | | unlimited | | unlimited | | unlimited | |
Par value | | $ | — | | $ | — | | $ | — | | $ | — | |
Shares outstanding | | 7,877,390 | | 72,026 | | 37,703 | | 1,376,015 | |
Net asset value and redemption price per share(2) | | $ | 17.99 | | $ | 12.11 | | $ | 11.19 | | $ | 12.78 | |
Maximum offering price per share | | $ | 17.99 | | $ | 12.11 | | $ | 11.19 | | $ | 12.78 | |
| | | | | | | | | |
Class I: | | | | | | | | | |
Net assets | | $ | 25,065,024 | | n/a | | $ | 41,767,378 | | $ | 12,462,732 | |
Shares authorized | | unlimited | | n/a | | unlimited | | unlimited | |
Par value | | $ | — | | n/a | | $ | — | | $ | — | |
Shares outstanding | | 1,352,288 | | n/a | | 3,723,502 | | 946,045 | |
Net asset value and redemption price per share | | $ | 18.54 | | n/a | | $ | 11.22 | | $ | 13.17 | |
Maximum offering price per share | | $ | 18.54 | | n/a | | $ | 11.22 | | $ | 13.17 | |
| | | | | | | | | |
Class Q: | | | | | | | | | |
Net assets | | $ | 1,187,266 | | n/a | | n/a | | $ | 25,799,865 | |
Shares authorized | | unlimited | | n/a | | n/a | | unlimited | |
Par value | | $ | — | | n/a | | n/a | | $ | — | |
Shares outstanding | | 64,554 | | n/a | | n/a | | 1,966,019 | |
Net asset value and redemption price per share | | $ | 18.39 | | n/a | | n/a | | $ | 13.12 | |
Maximum offering price per share | | $ | 18.39 | | n/a | | n/a | | $ | 13.12 | |
(1) | Maximum offering price is computed at 100/94.25 of net asset value. On purchases of $50,000 or more, the offering price is reduced. |
(2) | Redemption price per share may be reduced for any applicable contingent deferred sales charges. |
See Accompanying Notes to Financial Statements
47
STATEMENTS OF ASSETS AND LIABILITIES AS OF APRIL 30, 2006 (UNAUDITED)
| | ING
International
Capital
Appreciation
Fund | | ING
International
Real Estate
Fund | | ING
International
SmallCap
Fund | |
ASSETS: | | | | | | | |
Investments in securities at value+* | | $ | 28,122,649 | | $ | 17,461,435 | | $ | 478,387,075 | |
Short-term investments at amortized cost | | — | | 2,828,654 | | 106,099,426 | |
Cash | | 5,849,113 | | 326,086 | | 1,198,932 | |
Foreign currencies at value*** | | 107,304 | | — | | 581,130 | |
Receivables: | | | | | | | |
Fund shares sold | | 1,511,496 | | 1,946,374 | | 3,110,300 | |
Dividends and interest | | 38,857 | | 27,019 | | 1,869,287 | |
Prepaid expenses | | 69,781 | | 89,060 | | 44,462 | |
Reimbursement due from manager | | 17,956 | | 15,003 | | — | |
Total assets | | 35,717,156 | | 22,693,631 | | 591,290,612 | |
| | | | | | | |
LIABILITIES: | | | | | | | |
Payable for investment securities purchased | | 5,163,915 | | 2,319,187 | | — | |
Payable for fund shares redeemed | | — | | — | | 1,165,372 | |
Payable upon receipt of securities loaned | | — | | — | | 95,176,761 | |
Payable to custodian due to foreign currency overdraft*** | | — | | 326,533 | | — | |
Payable to affiliates | | 19,257 | | 17,887 | | 629,335 | |
Payable for trustee fees | | 366 | | 706 | | 4,102 | |
Other accrued expenses and liabilities | | 42,690 | | 59,440 | | 263,568 | |
Total liabilities | | 5,226,228 | | 2,723,753 | | 97,239,138 | |
NET ASSETS | | $ | 30,490,928 | | $ | 19,969,878 | | $ | 494,051,474 | |
| | | | | | | |
NET ASSETS WERE COMPRISED OF: | | | | | | | |
Paid-in capital | | $ | 29,205,813 | | $ | 19,364,439 | | $ | 411,753,466 | |
Undistributed net investment income | | 44,253 | | 15,088 | | 885,740 | |
Accumulated net realized gain (loss) on investments and foreign currency related transactions | | 46,553 | | (11,344 | ) | (25,391,252 | ) |
Net unrealized appreciation on investments and foreign currency related transactions | | 1,194,309 | | 601,695 | | 106,803,520 | |
NET ASSETS | | $ | 30,490,928 | | $ | 19,969,878 | | $ | 494,051,474 | |
+ | | Including securities loaned at value | | $ | — | | $ | — | | $ | 89,616,941 | |
* | | Cost of investments in securities | | $ | 26,925,721 | | $ | 16,853,384 | | $ | 371,620,858 | |
*** | | Cost of foreign currencies | | $ | 103,928 | | $ | (325,463 | ) | $ | 576,432 | |
See Accompanying Notes to Financial Statements
48
STATEMENTS OF ASSETS AND LIABILITIES AS OF APRIL 30, 2006 (UNAUDITED) (CONTINUED)
| | ING
International
Capital
Appreciation
Fund | | ING
International
Real Estate
Fund | | ING
International
SmallCap
Fund | |
Class A: | | | | | | | |
Net assets | | $ | 5,509,534 | | $ | 16,729,095 | | $ | 252,419,825 | |
Shares authorized | | unlimited | | unlimited | | unlimited | |
Par value | | $ | — | | $ | — | | $ | — | |
Shares outstanding | | 503,742 | | 1,589,843 | | 5,195,244 | |
Net asset value and redemption price per share | | $ | 10.94 | | $ | 10.52 | | $ | 48.59 | |
Maximum offering price per share (5.75%)(1) | | $ | 11.61 | | $ | 11.16 | | $ | 51.55 | |
| | | | | | | |
Class B: | | | | | | | |
Net assets | | $ | 45,948 | | $ | 120,100 | | $ | 68,927,568 | |
Shares authorized | | unlimited | | unlimited | | unlimited | |
Par value | | $ | — | | $ | — | | $ | — | |
Shares outstanding | | 4,210 | | 11,422 | | 1,373,986 | |
Net asset value and redemption price per share(2) | | $ | 10.91 | | $ | 10.51 | | $ | 50.17 | |
Maximum offering price per share | | $ | 10.91 | | $ | 10.51 | | $ | 50.17 | |
| | | | | | | |
Class C: | | | | | | | |
Net assets | | $ | 43,044 | | $ | 3,119,620 | | $ | 70,969,561 | |
Shares authorized | | unlimited | | unlimited | | unlimited | |
Par value | | $ | — | | $ | — | | $ | — | |
Shares outstanding | | 3,944 | | 296,814 | | 1,546,224 | |
Net asset value and redemption price per share(2) | | $ | 10.91 | | $ | 10.51 | | $ | 45.90 | |
Maximum offering price per share | | $ | 10.91 | | $ | 10.51 | | $ | 45.90 | |
| | | | | | | |
Class I: | | | | | | | |
Net assets | | $ | 24,892,402 | | $ | 1,063 | | $ | 18,081,355 | |
Shares authorized | | unlimited | | unlimited | | unlimited | |
Par value | | $ | — | | $ | — | | $ | — | |
Shares outstanding | | 2,274,123 | | 101 | | 371,410 | |
Net asset value and redemption price per share | | $ | 10.95 | | $ | 10.52 | | $ | 48.68 | |
Maximum offering price per share | | $ | 10.95 | | $ | 10.52 | | $ | 48.68 | |
| | | | | | | |
Class Q: | | | | | | | |
Net assets | | n/a | | n/a | | $ | 83,653,165 | |
Shares authorized | | n/a | | n/a | | unlimited | |
Par value | | n/a | | n/a | | $ | — | |
Shares outstanding | | n/a | | n/a | | 1,603,999 | |
Net asset value and redemption price per share | | n/a | | n/a | | $ | 52.15 | |
Maximum offering price per share | | n/a | | n/a | | $ | 52.15 | |
(1) | Maximum offering price is computed at 100/94.25 of net asset value. On purchases of $50,000 or more, the offering price is reduced. |
(2) | Redemption price per share may be reduced for any applicable contingent deferred sales charges. |
See Accompanying Notes to Financial Statements
49
STATEMENTS OF ASSETS AND LIABILITIES AS OF APRIL 30, 2006 (UNAUDITED)
| | ING
International
Value
Fund | | ING
International
Value Choice
Fund | | ING
Precious
Metals
Fund | |
ASSETS: | | | | | | | |
Investments in securities at value+* | | $ | 4,743,460,356 | | $ | 35,011,692 | | $ | 143,458,472 | |
Short-term investments at amortized cost | | 149,774,064 | | — | | — | |
Repurchase agreement | | — | | — | | 8,365,000 | |
Cash | | 5,922,350 | | — | | — | |
Foreign currencies at value*** | | 8,436,083 | | 96,815 | | 30,574 | |
Receivables: | | | | | | | |
Investment securities sold | | — | | 905,474 | | 1,020,688 | |
Fund shares sold | | 3,870,466 | | 1,234,091 | | 887,309 | |
Dividends and interest | | 24,091,332 | | 78,123 | | 25,905 | |
Unrealized appreciation on forward foreign currency contracts | | 141,427 | | — | | 931 | |
Prepaid expenses | | 120,612 | | 21,442 | | 16,145 | |
Reimbursement due from manager | | — | | 11,006 | | — | |
Total assets | | 4,935,816,690 | | 37,358,643 | | 153,805,024 | |
| | | | | | | |
LIABILITIES: | | | | | | | |
Payable for investment securities purchased | | 26,387,958 | | 137,748 | | 7,645,176 | |
Payable for fund shares redeemed | | 11,584,913 | | 2,655 | | 55,610 | |
Payable upon receipt of securities loaned | | 91,188,226 | | — | | — | |
Unrealized depreciation on forward currency contracts | | 141,427 | | — | | 930 | |
Payable to affiliates | | 5,668,389 | | 40,570 | | 134,047 | |
Payable to custodian due to bank overdraft | | — | | 160,532 | | 5,418 | |
Payable for trustee fees | | 6,830 | | 745 | | 61,628 | |
Other accrued expenses and liabilities | | 2,053,030 | | 65,867 | | 70,402 | |
Total liabilities | | 137,030,773 | | 408,117 | | 7,973,211 | |
NET ASSETS | | $ | 4,798,785,917 | | $ | 36,950,526 | | $ | 145,831,813 | |
| | | | | | | |
NET ASSETS WERE COMPRISED OF: | | | | | | | |
Paid-in capital | | $ | 3,334,862,228 | | $ | 33,323,057 | | $ | 108,690,124 | |
Undistributed net investment income (accumulated net investment loss) | | 20,938,750 | | 185,089 | | (387,034 | ) |
Accumulated net realized gain (loss) on investments and foreign currency related transactions | | 250,440,438 | | 366,480 | | (15,644,278 | ) |
Net unrealized appreciation on investments and foreign currency related transactions | | 1,192,544,501 | | 3,075,900 | | 53,173,001 | |
NET ASSETS | | $ | 4,798,785,917 | | $ | 36,950,526 | | $ | 145,831,813 | |
| | | | | | | | | |
|
+ | | Including securities loaned at value | | $ | 82,674,492 | | $ | — | | $ | — | |
* | | Cost of investments in securities | | $ | 3,551,158,586 | | $ | 31,937,341 | | $ | 90,283,141 | |
*** | | Cost of foreign currencies | | $ | 8,249,768 | | $ | 96,472 | | $ | 4,359 | |
See Accompanying Notes to Financial Statements
50
STATEMENTS OF ASSETS AND LIABILITIES AS OF APRIL 30, 2006 (UNAUDITED) (CONTINUED)
| | ING
International
Value
Fund | | ING
International
Value Choice
Fund | | ING
Precious
Metals
Fund | |
Class A: | | | | | | | |
Net assets | | $ | 2,018,326,242 | | $ | 13,446,349 | | $ | 145,831,813 | |
Shares authorized | | unlimited | | unlimited | | unlimited | |
Par value | | $ | 0.01 | | $ | — | | $ | — | |
Shares outstanding | | 97,201,950 | | 1,085,654 | | 12,000,798 | |
Net asset value and redemption price per share | | $ | 20.76 | | $ | 12.39 | | $ | 12.15 | |
Maximum offering price per share (5.75%)(1) | | $ | 22.03 | | $ | 13.15 | | $ | 12.89 | |
| | | | | | | |
Class B: | | | | | | | |
Net assets | | $ | 423,639,019 | | $ | 3,261,263 | | n/a | |
Shares authorized | | unlimited | | unlimited | | n/a | |
Par value | | $ | 0.01 | | $ | — | | n/a | |
Shares outstanding | | 20,768,646 | | 265,488 | | n/a | |
Net asset value and redemption price per share(2) | | $ | 20.40 | | $ | 12.28 | | n/a | |
Maximum offering price per share | | $ | 20.40 | | $ | 12.28 | | n/a | |
| | | | | | | |
Class C: | | | | | | | |
Net assets | | $ | 750,843,386 | | $ | 3,553,188 | | n/a | |
Shares authorized | | unlimited | | unlimited | | n/a | |
Par value | | $ | 0.01 | | $ | — | | n/a | |
Shares outstanding | | 36,956,525 | | 288,662 | | n/a | |
Net asset value and redemption price per share(2) | | $ | 20.32 | | $ | 12.31 | | n/a | |
Maximum offering price per share | | $ | 20.32 | | $ | 12.31 | | n/a | |
| | | | | | | |
Class I: | | | | | | | |
Net assets | | $ | 1,575,914,339 | | $ | 16,689,726 | | n/a | |
Shares authorized | | unlimited | | unlimited | | n/a | |
Par value | | $ | 0.01 | | $ | — | | n/a | |
Shares outstanding | | 75,822,657 | | 1,348,619 | | n/a | |
Net asset value and redemption price per share | | $ | 20.78 | | $ | 12.38 | | n/a | |
Maximum offering price per share | | $ | 20.78 | | $ | 12.38 | | n/a | |
| | | | | | | |
Class Q: | | | | | | | |
Net assets | | $ | 30,062,931 | | n/a | | n/a | |
Shares authorized | | unlimited | | n/a | | n/a | |
Par value | | $ | 0.01 | | n/a | | n/a | |
Shares outstanding | | 1,445,725 | | n/a | | n/a | |
Net asset value and redemption price per share | | $ | 20.79 | | n/a | | n/a | |
Maximum offering price per share | | $ | 20.79 | | n/a | | n/a | |
(1) | Maximum offering price is computed at 100/94.25 of net asset value. On purchases of $50,000 or more, the offering price is reduced. |
(2) | Redemption price per share may be reduced for any applicable contingent deferred sales charges. |
See Accompanying Notes to Financial Statements
51
STATEMENTS OF ASSETS AND LIABILITIES AS OF APRIL 30, 2006 (UNAUDITED)
| | ING
Russia
Fund | | ING
Emerging
Markets
Fixed Income
Fund | | ING
Diversified
International
Fund | |
ASSETS: | | | | | | | |
Investments in securities at value and affiliated funds+* | | $ | 691,699,802 | | $ | 10,317,376 | | $ | 139,244,110 | |
Short-term investments at amortized cost | | 65,421,771 | | — | | — | |
Cash | | 45,217,745 | | 185,848 | | — | |
Cash collateral for futures | | — | | 10,800 | | — | |
Foreign currencies at value*** | | 57,495 | | — | | — | |
Receivables: | | | | | | | |
Investment securities sold | | 1,322,758 | | — | | — | |
Fund shares sold | | 13,010,366 | | 30,615 | | 8,224,904 | |
Dividends and interest | | 2,361,118 | | 191,192 | | — | |
Prepaid expenses | | 33,510 | | 70,940 | | 102,002 | |
Reimbursement due from manager | | — | | 14,023 | | 29,913 | |
Total assets | | 819,124,565 | | 10,820,794 | | 147,600,929 | |
| | | | | | | |
LIABILITIES: | | | | | | | |
Payable for investment securities purchased | | 19,646,412 | | — | | 6,740,933 | |
Payable for fund shares redeemed | | 1,334,276 | | — | | 25,416 | |
Payable upon receipt of securities loaned | | 65,421,771 | | — | | — | |
Payable to affiliates | | 868,492 | | 8,794 | | 59,825 | |
Payable to custodian due to bank overdraft | | — | | — | | 1,457,842 | |
Payable for trustee fees | | 30,000 | | 666 | | 1,044 | |
Other accrued expenses and liabilities | | 400,507 | | 33,865 | | 35,464 | |
Total liabilities | | 87,701,458 | | 43,325 | | 8,320,524 | |
NET ASSETS | | $ | 731,423,107 | | $ | 10,777,469 | | $ | 139,280,405 | |
| | | | | | | |
NET ASSETS WERE COMPRISED OF: | | | | | | | |
Paid-in capital | | $ | 420,700,740 | | $ | 10,594,903 | | $ | 131,499,352 | |
Undistributed net investment income (accumulated net investment loss) | | (2,414,032 | ) | 44,761 | | (117,633 | ) |
Accumulated net realized gain on investments, foreign currency related transactions, and futures | | 15,573,288 | | 96,368 | | 152,421 | |
Net unrealized appreciation on investments and futures | | 297,563,111 | | 41,437 | | 7,746,265 | |
NET ASSETS | | $ | 731,423,107 | | $ | 10,777,469 | | $ | 139,280,405 | |
| | | | | | | |
| |
+ | | Including securities loaned at value | | $ | 64,994,030 | | $ | — | | $ | — | |
* | | Cost of investments in securities | | $ | 394,133,700 | | $ | 10,311,633 | | $ | 131,497,845 | |
*** | | Cost of foreign currencies | | $ | — | | $ | — | | $ | — | |
See Accompanying Notes to Financial Statements
52
STATEMENTS OF ASSETS AND LIABILITIES AS OF APRIL 30, 2006 (UNAUDITED) (CONTINUED)
| | ING
Russia
Fund | | ING
Emerging
Markets
Fixed Income
Fund | | ING
Diversified
International
Fund | |
Class A: | | | | | | | |
Net assets | | $ | 731,423,107 | | $ | 10,538,606 | | $ | 86,857,558 | |
Shares authorized | | unlimited | | unlimited | | unlimited | |
Par value | | $ | — | | $ | — | | $ | — | |
Shares outstanding | | 13,372,868 | | 1,034,520 | | 7,610,451 | |
Net asset value and redemption price per share | | $ | 54.69 | | $ | 10.19 | | $ | 11.41 | |
Maximum offering price per share (5.75%)(1) | | $ | 58.03 | | $ | 10.81 | | $ | 12.11 | |
| | | | | | | |
Class B: | | | | | | | |
Net assets | | n/a | | $ | 71,832 | | $ | 13,335,000 | |
Shares authorized | | n/a | | unlimited | | unlimited | |
Par value | | n/a | | $ | — | | $ | — | |
Shares outstanding | | n/a | | 7,067 | | 1,170,969 | |
Net asset value and redemption price per share(2) | | n/a | | $ | 10.16 | | $ | 11.39 | |
Maximum offering price per share | | n/a | | $ | 10.16 | | $ | 11.39 | |
| | | | | | | |
Class C: | | | | | | | |
Net assets | | n/a | | $ | 154,364 | | $ | 39,086,694 | |
Shares authorized | | n/a | | unlimited | | unlimited | |
Par value | | n/a | | $ | — | | $ | — | |
Shares outstanding | | n/a | | 15,187 | | 3,433,324 | |
Net asset value and redemption price per share(2) | | n/a | | $ | 10.16 | | $ | 11.38 | |
Maximum offering price per share | | n/a | | $ | 10.16 | | $ | 11.38 | |
| | | | | | | |
Class I: | | | | | | | |
Net assets | | n/a | | $ | 12,667 | | $ | 1,153 | |
Shares authorized | | n/a | | unlimited | | unlimited | |
Par value | | n/a | | $ | — | | $ | — | |
Shares outstanding | | n/a | | 1,244 | | 101 | |
Net asset value and redemption price per share | | n/a | | $ | 10.18 | | $ | 11.42 | |
Maximum offering price per share | | n/a | | $ | 10.18 | | $ | 11.42 | |
(1) | Maximum offering price is computed at 100/94.25 of net asset value. On purchases of $50,000 or more, the offering price is reduced. |
(2) | Redemption price per share may be reduced for any applicable contingent deferred sales charges. |
See Accompanying Notes to Financial Statements
53
STATEMENTS OF OPERATIONS FOR THE SIX MONTHS ENDED APRIL 30, 2006 (UNAUDITED)
| | ING
Global Equity
Dividend
Fund | | ING
Global
Real Estate
Fund | | ING
Global
Value Choice
Fund | | ING
Emerging
Countries
Fund | | |
INVESTMENT INCOME: | | | | | | | | | | |
Dividends, net of foreign taxes withheld* | | | $ | 3,888,940 | | | | $ | 2,457,031 | | | $ | 1,181,516 | | | | $ | 2,725,865 | | | |
Interest | | | 99,328 | | | | 120,035 | | | 152,495 | | | | 368,254 | | | |
Securities lending income | | | — | | | | 102 | | | 8,918 | | | | 53,486 | | | |
Total investment income | | | 3,988,268 | | | | 2,577,168 | | | 1,342,929 | | | | 3,147,605 | | | |
EXPENSES: | | | | | | | | | | | | | | | | | |
Investment management fees | | | 583,288 | | | | 1,142,945 | | | 532,224 | | | | 1,032,101 | | | |
Distribution and service fees: | | | | | | | | | | | | | | | | | |
Class A | | | 95,986 | | | | 219,048 | | | 79,859 | | | | 182,363 | | | |
Class B | | | 167,125 | | | | 76,432 | | | 118,840 | | | | 71,025 | | | |
Class C | | | 282,196 | | | | 186,809 | | | 160,684 | | | | 139,620 | | | |
Class M | | | — | | | | — | | | — | | | | 6,825 | | | |
Class Q | | | — | | | | — | | | 6,132 | | | | 16,543 | | | |
Transfer agent fees: | | | | | | | | | | | | | | | | | |
Class A | | | 42,433 | | | | 75,471 | | | 50,029 | | | | 81,990 | | | |
Class B | | | 18,479 | | | | 6,596 | | | 26,055 | | | | 10,830 | | | |
Class C | | | 31,197 | | | | 15,805 | | | 35,387 | | | | 21,985 | | | |
Class M | | | — | | | | — | | | — | | | | 1,218 | | | |
Class Q | | | — | | | | — | | | 466 | | | | 2,448 | | | |
Administrative service fees | | | 83,326 | | | | 115,194 | | | 53,222 | | | | 82,567 | | | |
Shareholder reporting expense | | | 10,964 | | | | 15,928 | | | 56,648 | | | | 25,470 | | | |
Registration fees | | | 27,077 | | | | 31,080 | | | 29,491 | | | | 30,142 | | | |
Professional fees | | | 21,111 | | | | 41,734 | | | 9,822 | | | | 11,602 | | | |
Custody and accounting expense | | | 27,150 | | | | 28,226 | | | 20,031 | | | | 66,904 | | | |
Trustee fees | | | 1,099 | | | | 2,534 | | | 1,810 | | | | 2,170 | | | |
Insurance expense | | | 930 | | | | 1,827 | | | 1,522 | | | | 1,514 | | | |
Miscellaneous expense | | | 3,862 | | | | 2,659 | | | 4,462 | | | | 5,477 | | | |
Total expenses | | | 1,396,223 | | | | 1,962,288 | | | 1,186,684 | | | | 1,792,794 | | | |
Net recouped (waived and reimbursed) fees | | | 106,899 | | | | — | | | (27,402 | ) | | | (53,820 | ) | | |
Net expenses | | | 1,503,122 | | | | 1,962,288 | | | 1,159,282 | | | | 1,738,974 | | | |
Net investment income | | | 2,485,146 | | | | 614,880 | | | 183,647 | | | | 1,408,631 | | | |
| | | | | | | | | | | | | | | | | |
REALIZED AND UNREALIZED GAIN ON INVESTMENTS AND FOREIGN CURRENCY RELATED TRANSACTIONS: | | | | | | | | | | | | | | | | | |
Net realized gain (loss) on: | | | | | | | | | | | | | | | | | |
Investments | | | 7,998,008 | | | | 3,727,404 | | | 7,538,513 | | | | 11,999,728 | | | |
Foreign currency related transactions | | | (205,173 | ) | | | (227,929 | ) | | (76,523 | ) | | | (48,938 | ) | | |
Net realized gain on investments and foreign currency related transactions | | | 7,792,835 | | | | 3,499,475 | | | 7,461,990 | | | | 11,950,790 | | | |
Net change in unrealized appreciation or depreciation on: | | | | | | | | | | | | | | | | | |
Investments | | | 17,550,985 | | | | 41,370,796 | | | 9,930,333 | | | | 25,642,232 | | | |
Foreign currency related transactions | | | 58,689 | | | | (24,540 | ) | | 7,222 | | | | (73,549 | ) | | |
Net change in unrealized appreciation or depreciation on investments and foreign currency related transactions | | | 17,609,674 | | | | 41,346,256 | | | 9,937,555 | | | | 25,568,683 | | | |
Net realized and unrealized gain on investments and foreign currency related transactions | | | 25,402,509 | | | | 44,845,731 | | | 17,399,545 | | | | 37,519,473 | | | |
Increase in net assets resulting from operations | | | $ | 27,887,655 | | | | $ | 45,460,611 | | | $ | 17,583,192 | | | | $ | 38,928,104 | | |
| | | | | | | | | | | | | | | | | |
| |
* Foreign taxes withheld | | | $ | 370,113 | | | | $ | 216,819 | | | $ | 81,636 | | | | $ | 221,270 | | | |
| | | | | | | | | | | | | | | | | | | | | | | | | | | |
See Accompanying Notes to Financial Statements
54
STATEMENTS OF OPERATIONS FOR THE SIX MONTHS ENDED APRIL 30, 2006 (UNAUDITED)
| | ING
Foreign
Fund | | ING
Greater China
Fund | | ING Index Plus
International
Equity Fund | | ING
International
Fund | |
| | Six Months
Ended
April 30,
2006 | | December 21,
2005(1) to
April 30,
2006 | | December 21,
2005(1) to
April 30,
2006 | | Six Months
Ended
April 30,
2006 | |
INVESTMENT INCOME: | | | | | | | | | |
Dividends, net of foreign taxes withheld* | | $ | 1,988,256 | | $ | 89,598 | | $ | 389,213 | | $ | 1,339,777 | |
Interest | | 281,560 | | 68 | | 3,699 | | 182,666 | |
Securities lending income | | 48,256 | | — | | — | | 4,861 | |
Total investment income | | 2,318,072 | | 89,666 | | 392,912 | | 1,527,304 | |
| | | | | | | | | |
EXPENSES: | | | | | | | | | |
Investment management fees | | 1,531,773 | | 52,773 | | 61,436 | | 625,970 | |
Distribution and service fees: | | | | | | | | | |
Class A | | 196,395 | | 11,177 | | 14,110 | | 70,939 | |
Class B | | 147,145 | | 437 | | 143 | | 88,133 | |
Class C | | 559,159 | | 743 | | 488 | | 80,436 | |
Class Q | | 1,436 | | — | | — | | 23,917 | |
Transfer agent fees: | | | | | | | | | |
Class A | | 72,124 | | 6,036 | | 6,773 | | 39,917 | |
Class B | | 13,462 | | 59 | | 17 | | 12,397 | |
Class C | | 51,159 | | 100 | | 58 | | 11,315 | |
Class I | | 1,622 | | — | | 6,556 | | 468 | |
Class Q | | 368 | | — | | — | | 574 | |
Administrative service fees | | 153,176 | | 4,589 | | 11,170 | | 62,596 | |
Shareholder reporting expense | | 19,185 | | 7,298 | | 4,038 | | 20,996 | |
Registration fees | | 35,124 | | 2,861 | | 5,900 | | 36,587 | |
Professional fees | | 10,960 | | 3,724 | | 4,780 | | 7,156 | |
Custody and accounting expense | | 103,821 | | 5,512 | | 8,044 | | 29,503 | |
Trustee Fees | | 3,620 | | 896 | | 1,069 | | 1,769 | |
Offering expense | | — | | 35,890 | | 35,890 | | — | |
Miscellaneous expense | | 7,318 | | 1,937 | | 2,298 | | 8,875 | |
Total expenses | | 2,907,847 | | 134,032 | | 162,770 | | 1,121,548 | |
Net recouped (waived and reimbursed) fees | | 130,691 | | — | | (51,540 | ) | — | |
Reimbursement of brokerage commission recapture | | (926 | ) | — | | — | | — | |
Net expenses | | 3,037,612 | | 134,032 | | 111,230 | | 1,121,548 | |
Net investment income/(loss) | | (719,540 | ) | (44,366 | ) | 281,682 | | 405,756 | |
| | | | | | | | | |
REALIZED AND UNREALIZED GAIN ON INVESTMENTS AND FOREIGN CURRENCY RELATED TRANSACTIONS: | | | | | | | | | |
Net realized gain (loss) on: | | | | | | | | | |
Investments | | 10,960,501 | | 436,051 | | 978,707 | | 19,577,800 | |
Foreign currency related transactions | | (1,620,282 | ) | 635 | | (105,046 | ) | (56,117 | ) |
Net realized gain on investments and foreign currency related transactions | | 9,340,219 | | 436,686 | | 873,661 | | 19,521,683 | |
Net change in unrealized appreciation or depreciation on: | | | | | | | | | |
Investments | | 63,172,096 | | 2,209,261 | | 2,853,528 | | 5,421,369 | |
Foreign currency related transactions | | 896,806 | | 83 | | 3,047 | | 24,113 | |
Net change in unrealized appreciation or depreciation on investments and foreign currency related transactions | | 64,068,902 | | 2,209,344 | | 2,856,575 | | 5,445,482 | |
Net realized and unrealized gain on investments and foreign currency related transactions | | 73,409,121 | | 2,646,030 | | 3,730,236 | | 24,967,165 | |
Increase in net assets resulting from operations | | $ | 72,689,581 | | $ | 2,601,664 | | $ | 4,011,918 | | $ | 25,372,921 | |
| | | | | | | | | |
|
* Foreign taxes withheld | | $ | 253,910 | | $ | — | | $ | 34,082 | | $ | 95,032 | |
| | | | | | | | | | | | | | | | | | | | | |
(1) Commencement of Operations
See Accompanying Notes to Financial Statements
55
STATEMENTS OF OPERATIONS FOR THE SIX MONTHS ENDED APRIL 30, 2006 (UNAUDITED)
| | ING | | ING | | ING | |
| | International Capital | | International | | International | |
| | Appreciation | | Real Estate | | SmallCap | |
| | Fund | | Fund | | Fund | |
| | December 21, | | February 28, | | Six Months | |
| | 2005(1) to | | 2006(1) to | | Ended | |
| | April 30, | | April 30, | | April 30, | |
| | 2006 | | 2006 | | 2006 | |
INVESTMENT INCOME: | | | | | | | |
Dividends, net of foreign taxes withheld* | | $ | 89,411 | | $ | 55,280 | | $ | 3,854,297 | |
Interest | | 11,040 | | 8,500 | | 305,768 | |
Securities lending income | | — | | — | | 449,453 | |
Total investment income | | 100,451 | | 63,780 | | 4,609,518 | |
| | | | | | | |
EXPENSES: | | | | | | | |
Investment management fees | | 39,297 | | 21,019 | | 2,020,181 | |
Distribution and service fees: | | | | | | | |
Class A | | 4,632 | | 4,794 | | 360,491 | |
Class B | | 44 | | 52 | | 313,315 | |
Class C | | 88 | | 1,789 | | 300,372 | |
Class Q | | — | | — | | 88,141 | |
Transfer agent fees: | | | | | | | |
Class A | | 2,223 | | 2,299 | | 133,350 | |
Class B | | 5 | | 6 | | 40,360 | |
Class C | | 10 | | 215 | | 39,037 | |
Class I | | 3,309 | | — | | — | |
Class Q | | — | | — | | 5,422 | |
Administrative service fees | | 4,623 | | 2,102 | | 202,016 | |
Shareholder reporting expense | | 6,132 | | 4,468 | | 37,748 | |
Registration fees | | 3,937 | | 1,285 | | 35,046 | |
Professional fees | | 2,584 | | 2,138 | | 18,937 | |
Custody and accounting expense | | 3,112 | | 1,471 | | 89,784 | |
Trustee fees | | 450 | | 706 | | 6,878 | |
Offering expense | | 35,890 | | 16,712 | | — | |
Insurance expense | | — | | — | | 4,505 | |
Miscellaneous expense | | 1,763 | | 411 | | 23,225 | |
Total expenses | | 108,099 | | 59,467 | | 3,718,808 | |
Net waived and reimbursed fees | | (51,475 | ) | (26,062 | ) | — | |
Reimbursement of brokerage commission recapture | | (426 | ) | — | | — | |
Net expenses | | 56,198 | | 33,405 | | 3,718,808 | |
Net investment income | | 44,253 | | 30,375 | | 890,710 | |
| | | | | | | |
REALIZED AND UNREALIZED GAIN ON INVESTMENTS AND FOREIGN CURRENCY RELATED TRANSACTIONS: | | | | | | | |
Net realized gain (loss) on: | | | | | | | |
Investments | | 97,055 | | (5,098 | ) | 38,784,926 | |
Foreign currency related transactions | | (50,502 | ) | (6,246 | ) | 62,834 | |
Net realized gain (loss) on investments and foreign currency related transactions | | 46,553 | | (11,344 | ) | 38,847,760 | |
Net change in unrealized appreciation or depreciation on: | | | | | | | |
Investments | | 1,196,928 | | 608,051 | | 66,159,951 | |
Foreign currency related transactions | | (2,619 | ) | (6,356 | ) | 44,839 | |
Net change in unrealized appreciation or depreciation on investments and foreign currency related transactions | | 1,194,309 | | 601,695 | | 66,204,790 | |
Net realized and unrealized gain on investments and foreign currency related transactions | | 1,240,862 | | 590,351 | | 105,052,550 | |
Increase in net assets resulting from operations | | $ | 1,285,115 | | $ | 620,726 | | $ | 105,943,260 | |
| | | | | | | |
|
* Foreign taxes withheld | | $ | 7,921 | | $ | 5,453 | | $ | 302,385 | |
(1) Commencement of Operations
See Accompanying Notes to Financial Statements
56
STATEMENTS OF OPERATIONS FOR THE SIX MONTHS ENDED APRIL 30, 2006 (UNAUDITED)
| | ING | | ING | | ING | |
| | International | | International | | Precious | |
| | Value | | Value Choice | | Metals | |
| | Fund | | Fund | | Fund | |
INVESTMENT INCOME: | | | | | | | |
Dividends, net of foreign taxes withheld* | | $ | 51,004,547 | | $ | 307,083 | | $ | 326,736 | |
Interest | | 5,781,512 | | 42,428 | | 148,264 | |
Securities lending income | | 337,575 | | — | | — | |
Total investment income | | 57,123,634 | | 349,511 | | 475,000 | |
| | | | | | | |
EXPENSES: | | | | | | | |
Investment management fees | | 21,774,996 | | 97,289 | | 487,204 | |
Distribution and service fees: | | | | | | | |
Class A | | 2,785,162 | | 11,223 | | 141,739 | |
Class B | | 2,048,417 | | 12,132 | | — | |
Class C | | 3,480,355 | | 13,435 | | — | |
Class Q | | 35,538 | | — | | — | |
Transfer agent fees: | | | | | | | |
Class A | | 1,153,422 | | 4,893 | | 80,461 | |
Class B | | 254,434 | | 1,322 | | — | |
Class C | | 432,371 | | 1,464 | | — | |
Class I | | 329,182 | | 80 | | — | |
Class Q | | 6,856 | | — | | — | |
Administrative service fees | | 2,177,476 | | 9,729 | | 56,695 | |
Shareholder reporting expense | | 155,800 | | 1,130 | | 19,367 | |
Registration fees | | 53,875 | | 15,700 | | 10,482 | |
Professional fees | | 173,169 | | 9,938 | | 6,697 | |
Custody and accounting expense | | 607,911 | | 4,978 | | 10,196 | |
Trustee fees | | 62,787 | | 551 | | 1,448 | |
Offering expense | | — | | 50,137 | | — | |
Insurance expense | | 53,068 | | 46 | | 1,214 | |
Miscellaneous expense | | 587,162 | | 1,958 | | 2,672 | |
Total expenses | | 36,171,981 | | 236,005 | | 818,175 | |
Net waived and reimbursed fees | | — | | (77,277 | ) | — | |
Reimbursement of brokerage commission recapture | | — | | (1,113 | ) | — | |
Net expenses | | 36,171,981 | | 157,615 | | 818,175 | |
Net investment income/(loss) | | 20,951,653 | | 191,896 | | (343,175 | ) |
| | | | | | | |
REALIZED AND UNREALIZED GAIN ON INVESTMENTS AND FOREIGN CURRENCY RELATED TRANSACTIONS: | | | | | | | |
Net realized gain (loss) on: | | | | | | | |
Investments | | 259,533,180 | | 420,576 | | 21,382,208 | |
Foreign currency related transactions | | (283,877 | ) | (41,999 | ) | (14,561 | ) |
Net realized gain on investments and foreign currency related transactions | | 259,249,303 | | 378,577 | | 21,367,647 | |
Net change in unrealized appreciation or depreciation on: | | | | | | | |
Investments | | 638,198,425 | | 2,817,863 | | 36,618,709 | |
Foreign currency related transactions | | 337,100 | | 727 | | (2,316 | ) |
Net change in unrealized appreciation or depreciation on investments and foreign currency related transactions | | 638,535,525 | | 2,818,590 | | 36,616,393 | |
Net realized and unrealized gain on investments and foreign currency related transactions | | 897,784,828 | | 3,197,167 | | 57,984,040 | |
Increase in net assets resulting from operations | | $ | 918,736,481 | | $ | 3,389,063 | | $ | 57,640,865 | |
| | | | | | | | | | | | |
* Foreign taxes withheld | | $ | 6,344,512 | | $ | 53,834 | | $ | 8,924 | |
See Accompanying Notes to Financial Statements
57
STATEMENTS OF OPERATIONS FOR THE SIX MONTHS ENDED APRIL 30, 2006 (UNAUDITED)
| | | | ING | | ING | |
| | ING | | Emerging Markets | | Diversified | |
| | Russia | | Fixed Income | | International | |
| | Fund | | Fund | | Fund | |
| | Six Months | | December 21, | | December 21, | |
| | Ended | | 2005(1) to | | 2005(1) to | |
| | April 30, | | April 30, | | April 30, | |
| | 2006 | | 2006 | | 2006 | |
INVESTMENT INCOME: | | | | | | | |
Dividends, net of foreign taxes withheld* | | $ | 2,132,023 | | $ | — | | $ | — | |
Interest | | — | | 278,352 | | — | |
Securities lending income | | 112,143 | | 15,371 | | — | |
Total investment income | | 2,244,166 | | 293,723 | | — | |
| | | | | | | |
EXPENSES: | | | | | | | |
Investment management fees | | 2,862,979 | | 23,868 | | — | |
Distribution and service fees: | | | | | | | |
Class A | | 572,594 | | 9,101 | | 28,453 | |
Class B | | — | | 91 | | 18,792 | |
Class C | | — | | 196 | | 50,542 | |
Transfer agent fees: | | | | | | | |
Class A | | 195,630 | | 4,368 | | 9,466 | |
Class B | | — | | 11 | | 1,561 | |
Class C | | — | | 23 | | 4,203 | |
Class I | | — | | 4 | | — | |
Administrative service fees | | 229,036 | | 3,672 | | 18,314 | |
Shareholder reporting expense | | 50,137 | | 5,983 | | 10,698 | |
Registration fees | | 15,500 | | 2,216 | | 4,245 | |
Professional fees | | 10,317 | | 3,367 | | 4,736 | |
Custody and accounting expense | | 706,306 | | 3,602 | | 7,606 | |
Trustee fees | | 5,973 | | 734 | | 1,378 | |
Offering expense | | — | | 35,890 | | 36,312 | |
Miscellaneous expense | | 9,726 | | 1,593 | | 1,381 | |
Total expenses | | 4,658,198 | | 94,719 | | 197,687 | |
Net waived and reimbursed fees | | — | | (45,942 | ) | (80,054 | ) |
Net expenses | | 4,658,198 | | 48,777 | | 117,633 | |
Net investment income/(loss) | | (2,414,032 | ) | 244,946 | | (117,633 | ) |
| | | | | | | |
REALIZED AND UNREALIZED GAIN ON INVESTMENTS, FOREIGN CURRENCY RELATED TRANSACTIONS, AND FUTURES: | | | | | | | |
Net realized gain (loss) on: | | | | | | | |
Investments | | 19,174,293 | | 78,884 | | 152,421 | |
Foreign currency related transactions | | (21,413 | ) | — | | — | |
Futures | | — | | 17,484 | | — | |
Net realized gain on investments, foreign currency related transactions, and futures | | 19,152,880 | | 96,368 | | 152,421 | |
Net change in unrealized appreciation or depreciation on: | | | | | | | |
Investments | | 200,386,536 | | 5,743 | | 7,746,265 | |
Foreign currency related transactions | | (2,991 | ) | — | | — | |
Futures | | — | | 35,694 | | — | |
Net change in unrealized appreciation or depreciation on investments, foreign currency related transactions, and futures | | 200,383,545 | | 41,437 | | 7,746,265 | |
Net realized and unrealized gain on investments, foreign currency related transactions, and futures | | 219,536,425 | | 137,805 | | 7,898,686 | |
Increase in net assets resulting from operations | | $ | 217,122,393 | | $ | 382,751 | | $ | 7,781,053 | |
* Foreign taxes withheld | | $ | 347,571 | | $ | 17,541 | | $ | — | |
(1) Commencement of Operations
See Accompanying Notes to Financial Statements
58
STATEMENTS OF CHANGES IN NET ASSETS (UNAUDITED)
| | ING Global Equity Dividend Fund | | ING Global Real Estate Fund | |
| | Six Months
Ended
April 30,
2006 | | Year
Ended
October 31,
2005 | | Six Months
Ended
April 30,
2006 | | Year
Ended
October 31,
2005 | |
FROM OPERATIONS: | | | | | | | | | |
Net investment income | | $ | 2,485,146 | | $ | 2,915,778 | | $ | 614,880 | | $ | 1,966,752 | |
Net realized gain on investments and foreign currency related transactions | | 7,792,835 | | 1,687,744 | | 3,499,475 | | 12,164,023 | |
Net change in unrealized appreciation or depreciation on investments and foreign currency related transactions | | 17,609,674 | | (344,549 | ) | 41,346,256 | | 10,845,250 | |
Net increase in net assets resulting from operations | | 27,887,655 | | 4,258,973 | | 45,460,611 | | 24,976,025 | |
| | | | | | | | | |
FROM DISTRIBUTIONS TO SHAREHOLDERS: | | | | | | | | | |
Net investment income: | | | | | | | | | |
Class A | | (961,522 | ) | (1,612,143 | ) | (2,873,355 | ) | (3,673,599 | ) |
Class B | | (321,539 | ) | (464,058 | ) | (241,253 | ) | (233,025 | ) |
Class C | | (539,640 | ) | (739,105 | ) | (549,909 | ) | (422,111 | ) |
Class I | | — | | — | | (44,190 | ) | (17,876 | ) |
Net realized gains: | | | | | | | | | |
Class A | | (1,118,180 | ) | (202,278 | ) | (8,946,554 | ) | (5,775,476 | ) |
Class B | | (431,639 | ) | (68,833 | ) | (920,111 | ) | (334,884 | ) |
Class C | | (736,438 | ) | (78,925 | ) | (2,017,572 | ) | (517,618 | ) |
Class I | | — | | — | | (103,752 | ) | — | |
Total distributions | | (4,108,958 | ) | (3,165,342 | ) | (15,696,696 | ) | (10,974,589 | ) |
| | | | | | | | | |
FROM CAPITAL SHARE TRANSACTIONS: | | | | | | | | | |
Net proceeds from sale of shares | | 41,959,894 | | 156,092,182 | | 97,173,521 | | 95,904,278 | |
Dividends reinvested | | 2,358,570 | | 1,717,095 | | 11,188,088 | | 8,286,072 | |
| | 44,318,464 | | 157,809,277 | | 108,361,609 | | 104,190,350 | |
Cost of shares redeemed | | (34,145,524 | ) | (26,214,327 | ) | (17,595,133 | ) | (46,019,544 | ) |
Net increase in net assets resulting from capital share transactions | | 10,172,940 | | 131,594,950 | | 90,766,476 | | 58,170,806 | |
Net increase in net assets | | 33,951,637 | | 132,688,581 | | 120,530,391 | | 72,172,242 | |
| | | | | | | | | |
NET ASSETS: | | | | | | | | | |
Beginning of period | | 150,962,735 | | 18,274,154 | | 180,286,637 | | 108,114,395 | |
End of year | | $ | 184,914,372 | | $ | 150,962,735 | | $ | 300,817,028 | | $ | 180,286,637 | |
| | | | | | | | | | | | | |
Undistributed net investment income (distributions in excess) at end of period | | $ | 742,484 | | $ | 80,039 | | $ | (6,161,267 | ) | $ | (3,067,440 | ) |
| | | | | | | | | | | | | | | | | |
See Accompanying Notes to Financial Statements
59
STATEMENTS OF CHANGES IN NET ASSETS (UNAUDITED)
| | ING Global Value Choice Fund | | ING Emerging Countries Fund | |
| | Six Months
Ended
April 30,
2006 | | Year
Ended
October 31,
2005 | | Six Months
Ended
April 30,
2006 | | Year
Ended
October 31,
2005 | |
FROM OPERATIONS: | | | | | | | | | |
Net investment income | | $ | 183,647 | | $ | 124,251 | | $ | 1,408,631 | | $ | 858,328 | |
Net realized gain on investments and foreign currency related transactions | | 7,461,990 | | 25,142,182 | | 11,950,790 | | 46,125,240 | |
Net change in unrealized appreciation or depreciation on investments and foreign currency related transactions | | 9,937,555 | | (11,171,818 | ) | 25,568,683 | | (26,356,354 | ) |
Net increase in net assets resulting from operations | | 17,583,192 | | 14,094,615 | | 38,928,104 | | 20,627,214 | |
| | | | | | | | | |
FROM DISTRIBUTIONS TO SHAREHOLDERS: | | | | | | | | | |
Net investment income: | | | | | | | | | |
Class A | | (322,489 | ) | — | | (521,510 | ) | (59,355 | ) |
Class C | | (35,318 | ) | — | | (76,339 | ) | — | |
Class M | | — | | — | | (1,172 | ) | — | |
Class Q | | (39,663 | ) | — | | (72,796 | ) | (13,322 | ) |
Total distributions | | (397,470 | ) | — | | (671,817 | ) | (72,677 | ) |
| | | | | | | | | |
FROM CAPITAL SHARE TRANSACTIONS: | | | | | | | | | |
Net proceeds from sale of shares | | 10,352,007 | | 15,058,733 | | 57,059,378 | | 49,570,991 | |
Dividends reinvested | | 232,247 | | — | | 558,626 | | 65,764 | |
| | 10,584,254 | | 15,058,733 | | 57,618,004 | | 49,636,755 | |
Cost of shares redeemed | | (15,872,106 | ) | (43,124,283 | ) | (23,524,711 | ) | (37,110,260 | ) |
Net increase (decrease) in net assets resulting from capital share transactions | | (5,287,852 | ) | (28,065,550 | ) | 34,093,293 | | 12,526,495 | |
Net increase (decrease) in net assets | | 11,897,870 | | (13,970,935 | ) | 72,349,580 | | 33,081,032 | |
| | | | | | | | | |
NET ASSETS: | | | | | | | | | |
Beginning of period | | 100,728,942 | | 114,699,877 | | 132,676,106 | | 99,595,074 | |
End of period | | $ | 112,626,812 | | $ | 100,728,942 | | $ | 205,025,686 | | $ | 132,676,106 | |
Undistributed net investment income at end of period | | $ | 182,685 | | $ | 396,508 | | $ | 1,407,018 | | $ | 670,204 | |
| | | | | | | | | | | | | | | | | |
See Accompanying Notes to Financial Statements
60
STATEMENTS OF CHANGES IN NET ASSETS (UNAUDITED)
| | ING Foreign Fund | | ING Greater China Fund | |
| | Six Months
Ended
April 30,
2006 | | Year
Ended
October 31,
2005 | | December 21,
2005(1)
to April 30,
2006 | |
FROM OPERATIONS: | | | | | | | |
Net investment income (loss) | | $ | (719,540 | ) | $ | 337,622 | | | $ | (44,366 | ) | |
Net realized gain on investments and foreign currency related transactions | | 9,340,219 | | 7,668,921 | | | 436,686 | | |
Net change in unrealized appreciation or depreciation on investments and foreign currency related transactions | | 64,068,902 | | 20,316,629 | | | 2,209,344 | | |
Net increase in net assets resulting from operations | | 72,689,581 | | 28,323,172 | | | 2,601,664 | | |
FROM DISTRIBUTIONS TO SHAREHOLDERS: | | | | | | | | | |
Net realized gains: | | | | | | | | | |
Class A | | (3,149,065 | ) | — | | | — | | |
Class B | | (602,429 | ) | — | | | — | | |
Class C | | (2,293,757 | ) | — | | | — | | |
Class I | | (25,483 | ) | — | | | — | | |
Class Q | | (26,071 | ) | — | | | — | | |
Total distributions | | (6,096,805 | ) | — | | | — | | |
FROM CAPITAL SHARE TRANSACTIONS: | | | | | | | | | |
Net proceeds from sale of shares | | 129,042,852 | | 130,983,247 | | | 16,790,194 | | |
Dividends reinvested | | 3,983,766 | | — | | | — | | |
| | 133,026,618 | | 130,983,247 | | | 16,790,194 | | |
Cost of shares redeemed | | (28,991,707 | ) | (42,711,627 | ) | | (180,484 | ) | |
Net increase in net assets resulting from capital share transactions | | 104,034,911 | | 88,271,620 | | | 16,609,710 | | |
Net increase in net assets | | 170,627,687 | | 116,594,792 | | | 19,211,374 | | |
NET ASSETS: | | | | | | | | | |
Beginning of period | | 235,831,055 | | 119,236,263 | | | — | | |
End of period | | $ | 406,458,742 | | $ | 235,831,055 | | | $ | 19,211,374 | | |
Undistributed net investment income (accumulated net
investment loss) at end of period | | $ | 387,365 | | $ | 1,106,905 | | | $ | (44,366 | ) | |
(1) Commencement of Operations
See Accompanying Notes to Financial Statements
61
STATEMENTS OF CHANGES IN NET ASSETS (UNAUDITED)
| | ING Index Plus | | | | | |
| | International Equity Fund | | ING International Fund | |
| | December 21,
2005(1)
to April 30,
2006 | | Six Months
Ended
April 30,
2006 | | Year
Ended
October 31,
2005 | |
FROM OPERATIONS: | | | | | | | |
Net investment income | | | $ | 281,682 | | | $ | 405,756 | | $ | 924,866 | |
Net realized gain on investments and foreign currency related transactions | | | 873,661 | | | 19,521,683 | | 15,771,935 | |
Net change in unrealized appreciation or depreciation on investments and foreign currency related transactions | | | 2,856,575 | | | 5,445,482 | | (3,071,289 | ) |
Net increase in net assets resulting from operations | | | 4,011,918 | | | 25,372,921 | | 13,625,512 | |
FROM DISTRIBUTIONS TO SHAREHOLDERS: | | | | | | | | | |
Net investment income: | | | | | | | | | |
Class A | | | — | | | (808,009 | ) | (500,256 | ) |
Class B | | | — | | | (134,209 | ) | (77,407 | ) |
Class C | | | — | | | (114,855 | ) | (70,840 | ) |
Class I | | | — | | | (475,409 | ) | (268,842 | ) |
Class Q | | | — | | | (281,619 | ) | (93,747 | ) |
Total distributions | | | — | | | (1,814,101 | ) | (1,011,092 | ) |
FROM CAPITAL SHARE TRANSACTIONS: | | | | | | | | | |
Net proceeds from sale of shares | | | 56,020,584 | | | 23,061,936 | | 34,317,445 | |
Dividends reinvested | | | — | | | 1,681,978 | | 927,388 | |
Redemption Fee Proceeds | | | — | | | 257 | | 12,635 | |
| | | 56,020,584 | | | 24,744,171 | | 35,257,468 | |
Cost of shares redeemed | | | (289,702 | ) | | (31,513,070 | ) | (30,672,702 | ) |
Net increase in net assets resulting from capital share transactions | | | 55,730,882 | | | (6,768,899 | ) | 4,584,766 | |
Net increase in net assets | | | 59,742,800 | | | 16,789,921 | | 17,199,186 | |
NET ASSETS: | | | | | | | | | |
Beginning of period | | | — | | | 120,534,680 | | 103,335,494 | |
End of period | | | $ | 59,742,800 | | | $ | 137,324,601 | | $ | 120,534,680 | |
Undistributed net investment income at end of period | | | $ | 281,682 | | | $ | 329,349 | | $ | 1,737,694 | |
| | | | | | | | | | | | | |
(1) Commencement of Operations
See Accompanying Notes to Financial Statements
62
STATEMENTS OF CHANGES IN NET ASSETS (UNAUDITED)
| | ING International | | ING International | |
| | Capital Appreciation Fund | | Real Estate Fund | |
| | December 21,
2005(1)
to April 30,
2006 | | February 28,
2006(1)
to April 30,
2006 | |
FROM OPERATIONS: | | | | | |
Net investment income | | | $ | 44,253 | | | | $ | 30,375 | | |
Net realized gain (loss) on investments and foreign currency related transactions | | | 46,553 | | | | (11,344 | ) | |
Net change in unrealized appreciation or depreciation on investments and foreign currency related transactions | | | 1,194,309 | | | | 601,695 | | |
Net increase in net assets resulting from operations | | | 1,285,115 | | | | 620,726 | | |
FROM DISTRIBUTIONS TO SHAREHOLDERS: | | | | | | | | | |
Net investment income: | | | | | | | | | |
Class A | | | — | | | | (13,999 | ) | |
Class B | | | — | | | | (1,264 | ) | |
Class C | | | — | | | | (2 | ) | |
Class S | | | — | | | | (22 | ) | |
Total distributions | | | — | | | | (15,287 | ) | |
FROM CAPITAL SHARE TRANSACTIONS: | | | | | | | | | |
Net proceeds from sale of shares | | | 29,283,497 | | | | 19,379,616 | | |
Dividends reinvested | | | — | | | | 811 | | |
| | | 29,283,497 | | | | 19,380,427 | | |
Cost of shares redeemed | | | (77,684 | ) | | | (15,984 | ) | |
Net increase in net assets resulting from capital share transactions | | | 29,205,813 | | | | 19,364,443 | | |
Net increase in net assets | | | 30,490,928 | | | | 19,969,878 | | |
NET ASSETS: | | | | | | | | | |
Beginning of period | | | — | | | | — | | |
End of period | | | $ | 30,490,928 | | | | $19,969,878 | | |
Undistributed net investment income at end of period | | | $ | 44,253 | | | | $ | 15,088 | | |
(1) Commencement of Operations
See Accompanying Notes to Financial Statements
63
STATEMENTS OF CHANGES IN NET ASSETS (UNAUDITED)
| | ING International SmallCap Fund | | ING International Value Fund | |
| | Six Months
Ended
April 30,
2006 | | Year
Ended
October 31,
2005 | | Six Months
Ended
April 30,
2006 | | Year
Ended
October 31,
2005 | |
FROM OPERATIONS: | | | | | | | | | |
Net investment income | | $ | 890,710 | | $ | 2,689,988 | | $ | 20,951,653 | | $ | 30,795,481 | |
Net realized gain on investments and foreign currency related transactions | | 38,847,760 | | 97,859,485 | | 259,249,303 | | 333,307,624 | |
Net change in unrealized appreciation or depreciation on investments and foreign currency related transactions | | 66,204,790 | | (16,256,485 | ) | 638,535,525 | | 192,970,828 | |
Net increase in net assets resulting from operations | | 105,943,260 | | 84,292,988 | | 918,736,481 | | 557,073,933 | |
FROM DISTRIBUTIONS TO SHAREHOLDERS: | | | | | | | | | |
Net investment income: | | | | | | | | | |
Class A | | (1,533,625 | ) | — | | (14,654,043 | ) | (24,560,725 | ) |
Class B | | (57,978 | ) | — | | (194,179 | ) | (2,978,147 | ) |
Class C | | (164,327 | ) | — | | (1,042,925 | ) | (4,480,827 | ) |
Class I | | — | | — | | (15,430,051 | ) | (14,637,231 | ) |
Class Q | | (617,820 | ) | — | | (268,368 | ) | (416,197 | ) |
Net realized gains: | | | | | | | | | |
Class A | | — | | — | | (133,758,480 | ) | (88,815,999 | ) |
Class B | | — | | — | | (30,856,576 | ) | (21,863,296 | ) |
Class C | | — | | — | | (51,541,230 | ) | (32,628,011 | ) |
Class I | | — | | — | | (94,544,982 | ) | (40,249,883 | ) |
Class Q | | — | | — | | (2,101,201 | ) | (1,347,031 | ) |
Total distributions | | (2,373,750 | ) | — | | (344,392,035 | ) | (231,977,347 | ) |
FROM CAPITAL SHARE TRANSACTIONS: | | | | | | | | | |
Net proceeds from sale of shares | | 110,912,035 | | 93,365,295 | | 438,162,701 | | 888,315,865 | |
Dividends reinvested | | 1,879,677 | | — | | 245,908,952 | | 168,697,259 | |
| | 112,791,712 | | 93,365,295 | | 684,071,653 | | 1,057,013,124 | |
Cost of shares redeemed | | (63,319,348 | ) | (158,584,246 | ) | (516,246,092 | ) | (1,185,357,264 | ) |
Net increase (decrease) in net assets resulting from capital share transactions | | 49,472,364 | | (65,218,951 | ) | 167,825,561 | | (128,344,140 | ) |
Net increase in net assets | | 153,041,874 | | 19,074,037 | | 742,170,007 | | 196,752,446 | |
NET ASSETS: | | | | | | | | | |
Beginning of period | | 341,009,600 | | 321,935,563 | | 4,056,615,910 | | 3,859,863,464 | |
End of period | | $ | 494,051,474 | | $ | 341,009,600 | | $ | 4,798,785,917 | | $ | 4,056,615,910 | |
Undistributed net investment income at end of period | | $ | 885,740 | | $ | 2,368,780 | | $ | 20,938,750 | | $ | 31,576,663 | |
| | | | | | | | | | | | | | |
See Accompanying Notes to Financial Statements
64
STATEMENTS OF CHANGES IN NET ASSETS (UNAUDITED) | |
| | ING International Value Choice Fund | | ING Precious Metals Fund | |
| | Six Months
Ended
April 30,
2006 | | February 1,
2005(1)
to October 31,
2005 | | Six Months
Ended
April 30,
2006 | | Year
Ended
October 31,
2005 | |
FROM OPERATIONS: | | | | | | | | | |
Net investment income (loss) | | $ | 191,896 | | $ | 36,817 | | $ | (343,175 | ) | $ | (645,673 | ) |
Net realized gain on investments and foreign currency related transactions | | 378,577 | | 159,513 | | 21,367,647 | | 8,968,836 | |
Net change in unrealized appreciation or depreciation on investments and foreign currency related transactions | | 2,818,590 | | 257,310 | | 36,616,393 | | (3,271,199 | ) |
Net increase in net assets resulting from operations | | 3,389,063 | | 453,640 | | 57,640,865 | | 5,051,964 | |
FROM DISTRIBUTIONS TO SHAREHOLDERS: | | | | | | | | | |
Net investment income: | | | | | | | | | |
Class A | | (65,003 | ) | — | | (180,375 | ) | (2,990,570 | ) |
Class B | | (16,400 | ) | — | | — | | — | |
Class C | | (15,496 | ) | — | | — | | — | |
Net realized gains: | | | | | | | | | |
Class A | | (106,743 | ) | — | | — | | — | |
Class B | | (32,501 | ) | — | | — | | — | |
Class C | | (33,480 | ) | — | | — | | — | |
Total distributions | | (269,623 | ) | — | | (180,375 | ) | (2,990,570 | ) |
FROM CAPITAL SHARE TRANSACTIONS: | | | | | | | | | |
Net proceeds from sale of shares | | 30,578,440 | | 9,890,518 | | 11,873,939 | | 8,755,764 | |
Dividends reinvested | | 176,320 | | — | | 161,561 | | 2,642,230 | |
| | 30,754,760 | | 9,890,518 | | 12,035,500 | | 11,397,994 | |
Cost of shares redeemed | | (6,262,255 | ) | (1,005,577 | ) | (11,104,946 | ) | (17,774,785 | ) |
Net increase (decrease) in net assets resulting from capital share transactions | | 24,492,505 | | 8,884,941 | | 930,554 | | (6,376,791 | ) |
Net increase (decrease) in net assets | | 27,611,945 | | 9,338,581 | | 58,391,044 | | (4,315,397 | ) |
NET ASSETS: | | | | | | | | | |
Beginning of period | | 9,338,581 | | — | | 87,440,769 | | 91,756,166 | |
End of period | | $ | 36,950,526 | | $ | 9,338,581 | | $ | 145,831,813 | | $ | 87,440,769 | |
Undistributed net investment income (accumulated net investment loss) at end of period | | $ | 185,089 | | $ | 90,092 | | $ | (387,034 | ) | $ | 136,516 | |
| | | | | | | | | | | | | | | |
(1) Commencement of Operations
See Accompanying Notes to Financial Statements
65
STATEMENTS OF CHANGES IN NET ASSETS (UNAUDITED)
| | | | | | ING Emerging Markets | |
| | ING Russia Fund | | Fixed Income Fund | |
| | Six Months
Ended
April 30,
2006 | | Year
Ended
October 31,
2005 | | December 21,
2005(1)
to April 30,
2006 | |
FROM OPERATIONS: | | | | | | | |
Net investment income (loss) | | $ | (2,414,032 | ) | $ | (11,304 | ) | | $ | 244,946 | | |
Net realized gain on investments, foreign currency related transactions, and futures | | 19,152,880 | | 77,079 | | | 96,368 | | |
Net change in unrealized appreciation or depreciation on investments, foreign currency related transactions, and futures | | 200,383,545 | | 61,195,797 | | | 41,437 | | |
Net increase in net assets resulting from operations | | 217,122,393 | | 61,261,572 | | | 382,751 | | |
FROM DISTRIBUTIONS TO SHAREHOLDERS: | | | | | | | | | |
Net investment income: | | | | | | | | | |
Class A | | — | | (111,452 | ) | | (198,699 | ) | |
Class B | | — | | — | | | (596 | ) | |
Class C | | — | | — | | | (700 | ) | |
Class I | | — | | — | | | (190 | ) | |
Total distributions | | — | | (111,452 | ) | | (200,185 | ) | |
FROM CAPITAL SHARE TRANSACTIONS: | | | | | | | | | |
Net proceeds from sale of shares | | 309,014,398 | | 93,862,631 | | | 10,594,979 | | |
Dividends reinvested | | — | | 96,494 | | | 2,239 | | |
| | 309,014,398 | | 93,959,125 | | | 10,597,218 | | |
Redemption fee proceeds | | 518,566 | | 850,706 | | | — | | |
Cost of shares redeemed | | (66,835,001 | ) | (96,537,671 | ) | | (2,315 | ) | |
Net increase (decrease) in net assets resulting from capital share transactions | | 242,697,963 | | (1,727,840 | ) | | 10,594,903 | | |
Net increase in net assets | | 459,820,356 | | 59,422,280 | | | 10,777,469 | | |
NET ASSETS: | | | | | | | | | |
Beginning of period | | 271,602,751 | | 212,180,471 | | | — | | |
End of period | | $ | 731,423,107 | | $ | 271,602,751 | | | $ | 10,777,469 | | |
Undistributed net investment income (accumulated net investment loss) at end of period | | $ | (2,414,032 | ) | $ | — | | | $ | 44,761 | | |
| | | | | | | | | | | | | | | |
(1) Commencement of Operations
See Accompanying Notes to Financial Statements
66
STATEMENTS OF CHANGES IN NET ASSETS (UNAUDITED)
| | ING Diversified | |
| | International Fund | |
| | December 21,
2005(1)
to April 30,
2006 | |
FROM OPERATIONS: | | | |
Net investment income (loss) | | $ | (117,633 | ) |
Net realized gain on investments | | 152,421 | |
Net change in unrealized appreciation or depreciation on investments | | 7,746,265 | |
Net increase in net assets resulting from operations | | 7,781,053 | |
FROM DISTRIBUTIONS TO SHAREHOLDERS: | | | |
Total distributions | | — | |
FROM CAPITAL SHARE TRANSACTIONS: | | | |
Net proceeds from sale of shares | | 133,078,796 | |
Dividends reinvested | | — | |
| | 133,078,796 | |
Cost of shares redeemed | | (1,579,444 | ) |
Net increase in net assets resulting from capital share transactions | | 131,499,352 | |
Net increase in net assets | | 139,280,405 | |
NET ASSETS: | | | |
Beginning of period | | — | |
End of period | | $ | 139,280,405 | |
Accumulated net investment loss at end of period | | $ | (117,633 | ) |
| | | | | | |
(1) Commencement of Operations
See Accompanying Notes to Financial Statements
67
ING GLOBAL EQUITY DIVIDEND FUND (UNAUDITED) | FINANCIAL HIGHLIGHTS |
Selected data for a share of beneficial interest outstanding throughout each period.
| | | | Class A | |
| | | | Six Months
Ended
April 30, | | Year Ended October 31, | | September 17,
2003(1) to
October 31, | |
| | | | 2006 | | 2005 | | 2004 | | 2003 | |
Per Share Operating Performance: | | | | | | | | | | | |
Net asset value, beginning of period | | $ | | 13.07 | | | 12.41 | | | 10.49 | | | | 10.00 | | |
Income from investment operations: | | | | | | | | | | | | | | | | |
Net investment income | | $ | | 0.24 | | | 0.47 | * | | 0.44 | | | | 0.02 | | |
Net realized and unrealized gain on investments | | $ | | 2.12 | | | 0.92 | | | 1.87 | | | | 0.47 | | |
Total from investment operations | | $ | | 2.36 | | | 1.39 | | | 2.31 | | | | 0.49 | | |
Less distributions from: | | | | | | | | | | | | | | | | |
Net investment income | | $ | | 0.18 | | | 0.54 | | | 0.39 | | | | — | | |
Net realized gains on investments | | $ | | 0.19 | | | 0.19 | | | — | | | | — | | |
Total distributions | | $ | | 0.37 | | | 0.73 | | | 0.39 | | | | — | | |
Net asset value, end of period | | $ | | 15.06 | | | 13.07 | | | 12.41 | | | | 10.49 | | |
Total Return(2) | | % | | 18.30 | | | 11.45 | | | 22.59 | | | | 4.90 | | |
| | | | | | | | | | | | | | | | |
Ratios and Supplemental Data: | | | | | | | | | | | | | | | | |
Net assets, end of period (000’s) | | $ | | 83,073 | | | 73,186 | | | 11,316 | | | | 4,274 | | |
Ratios to average net assets: | | | | | | | | | | | | | | | | |
Net expenses after expense reimbursement/recoupment(3)(4) | | % | | 1.40 | | | 1.40 | | | 1.40 | | | | 1.40 | | |
Gross expenses prior to expense reimbursement/recoupment(3) | | % | | 1.27 | | | 1.28 | | | 3.44 | | | | 7.00 | | |
Net investment income after expense reimbursement/
recoupment(3)(4) | | % | | 3.38 | | | 3.60 | | | 4.39 | | | | 3.58 | | |
Portfolio turnover rate | | % | | 37 | | | 57 | | | 60 | | | | 3 | | |
| | | | Class B | |
| | | | Six Months
Ended
April 30, | | Year Ended October 31, | | October 24,
2003(1) to
October 31, | |
| | | | 2006 | | 2005 | | 2004 | | 2003 | |
Per Share Operating Performance: | | | | | | | | | | | |
Net asset value, beginning of period | | $ | | | 13.05 | | | 12.37 | | | 10.49 | | | | 10.31 | | |
Income from investment operations: | | | | | | | | | | | | | | | | | |
Net investment income | | $ | | | 0.18 | | | 0.37 | * | | 0.42 | | | | 0.00 | ** | |
Net realized and unrealized gain on investments | | $ | | | 2.12 | | | 0.92 | | | 1.82 | | | | 0.18 | | |
Total from investment operations | | $ | | | 2.30 | | | 1.29 | | | 2.24 | | | | 0.18 | | |
Less distributions from: | | | | | | | | | | | | | | | | | |
Net investment income | | $ | | | 0.13 | | | 0.42 | | | 0.36 | | | | — | | |
Net realized gains on investments | | $ | | | 0.19 | | | 0.19 | | | — | | | | — | | |
Total distributions | | $ | | | 0.32 | | | 0.61 | | | 0.36 | | | | — | | |
Net asset value, end of period | | $ | | | 15.03 | | | 13.05 | | | 12.37 | | | | 10.49 | | |
Total Return(2) | | % | | | 17.85 | | | 10.65 | | | 21.92 | | | | 1.75 | | |
| | | | | | | | | | | | | | | | | |
Ratios and Supplemental Data: | | | | | | | | | | | | | | | | | |
Net assets, end of period (000’s) | | $ | | | 38,510 | | | 28,811 | | | 3,303 | | | | 12 | | |
Ratios to average net assets: | | | | | | | | | | | | | | | | | |
Net expenses after expense reimbursement/recoupment(3)(4) | | % | | | 2.15 | | | 2.15 | | | 2.15 | | | | 2.15 | | |
Gross expenses prior to expense reimbursement/recoupment(3) | | % | | | 2.02 | | | 2.03 | | | 4.19 | | | | 7.75 | | |
Net investment income (loss) after expense reimbursement/
recoupment(3)(4) | | % | | | 2.63 | | | 2.83 | | | 4.03 | | | | (0.67 | ) | |
Portfolio turnover rate | | % | | | 37 | | | 57 | | | 60 | | | | 3 | | |
(1) | Commencement of operations. |
(2) | Total return is calculated assuming reinvestment of all dividends and capital gain distributions at net asset value and excluding the deduction of sales charges. Total return for less than one year is not annualized. |
(3) | Annualized for periods less than one year. |
(4) | The Investment Manager has agreed to limit expenses, (excluding interest, taxes, brokerage and extraordinary expenses) subject to possible recoupment by ING Investments, LLC within three years of being incurred. |
* | Per share data calculated using average number of shares outstanding throughout the period. |
** | Amount represents less than $0.005 per share |
See Accompanying Notes to Financial Statements
68
ING GLOBAL EQUITY DIVIDEND FUND (UNAUDITED) (CONTINUED) | FINANCIAL HIGHLIGHTS |
Selected data for a share of beneficial interest outstanding throughout each period.
| | | | Class C | |
| | | | Six Months
Ended
April 30, | | Year Ended October 31, | | October 29,
2003(1) to
October 31, | |
| | | | 2006 | | 2005 | | 2004 | | 2003 | |
Per Share Operating Performance: | | | | | | | | | | | |
Net asset value, beginning of period | | $ | | | 13.02 | | | 12.37 | | | 10.48 | | | | 10.44 | | |
Income from investment operations: | | | | | | | | | | | | | | | | | |
Net investment income | | $ | | | 0.18 | | | 0.37 | * | | 0.39 | | | | 0.00 | ** | |
Net realized and unrealized gain on investments | | $ | | | 2.13 | | | 0.90 | | | 1.86 | | | | 0.04 | | |
Total from investment operations | | $ | | | 2.31 | | | 1.27 | | | 2.25 | | | | 0.04 | | |
Less distributions from: | | | | | | | | | | | | | | | | | |
Net investment income | | $ | | | 0.19 | | | 0.43 | | | 0.36 | | | | — | | |
Net realized gains on investments | | $ | | | 0.13 | | | 0.19 | | | — | | | | — | | |
Total distributions | | $ | | | 0.32 | | | 0.62 | | | 0.36 | | | | — | | |
Net asset value, end of period | | $ | | | 15.01 | | | 13.02 | | | 12.37 | | | | 10.48 | | |
Total Return(2) | | % | | | 17.97 | | | 10.51 | | | 21.99 | | | | 0.38 | | |
| | | | | | | | | | | | | | | | | |
Ratios and Supplemental Data: | | | | | | | | | | | | | | | | | |
Net assets, end of period (000’s) | | $ | | | 63,332 | | | 48,965 | | | 3,655 | | | | 19 | | |
Ratios to average net assets: | | | | | | | | | | | | | | | | | |
Net expenses after expense reimbursement/recoupment(3)(4) | | % | | | 2.15 | | | 2.15 | | | 2.15 | | | | 2.15 | | |
Gross expenses prior to expense reimbursement/recoupment(3) | | % | | | 2.02 | | | 2.03 | | | 4.19 | | | | 7.75 | | |
Net investment income (loss) after expense reimbursement/
recoupment(3)(4) | | % | | | 2.63 | | | 2.82 | | | 3.99 | | | | (0.88 | ) | |
Portfolio turnover rate | | % | | | 37 | | | 57 | | | 60 | | | | 3 | | |
(1) | Commencement of operations. |
(2) | Total return is calculated assuming reinvestment of all dividends and capital gain distributions at net asset value and excluding the deduction of sales charges. Total return for less than one year is not annualized. |
(3) | Annualized for periods less than one year. |
(4) | The Investment Manager has agreed to limit expenses, (excluding interest, taxes, brokerage and extraordinary expenses) subject to possible recoupment by ING Investments, LLC within three years of being incurred. |
* | Per share data calculated using average number of shares outstanding throughout the period. |
** | Amount represents less than $0.005 per share |
See Accompanying Notes to Financial Statements
69
ING GLOBAL REAL ESTATE FUND (UNAUDITED) | FINANCIAL HIGHLIGHTS |
Selected data for a share of beneficial interest outstanding throughout each period.
| | | | Class A | |
| | | | Six Months
Ended
April 30, | | Year Ended October 31, | | November 5,
2001(1) to
October 31, | |
| | | | 2006 | | 2005 | | 2004 | | 2003 | | 2002 | |
Per Share Operating Performance: | | | | | | | | | | | | | |
Net asset value, beginning of period | | $ | | | 17.14 | | | 15.40 | | | 13.06 | | | 10.40 | | | | 10.01 | | |
Income from investment operations: | | | | | | | | | | | | | | | | | | | | |
Net investment income | | $ | | | 0.06 | * | | 0.26 | *† | | 0.27 | | | 0.57 | | | | 0.45 | | |
Net realized and unrealized gain on investments | | $ | | | 2.62 | | | 2.94 | † | | 3.26 | | | 2.79 | | | | 0.31 | | |
Total from investment operations | | $ | | | 2.68 | | | 3.20 | | | 3.53 | | | 3.36 | | | | 0.76 | | |
Less distributions from: | | | | | | | | | | | | | | | | | | | | |
Net investment income | | $ | | | 0.30 | | | 0.54 | | | 0.43 | | | 0.54 | | | | 0.37 | | |
Net realized gain on investments | | $ | | | — | | | 0.92 | | | 0.76 | | | 0.16 | | | | — | | |
Total distributions | | $ | | | 0.30 | | | 1.46 | | | 1.19 | | | 0.70 | | | | 0.37 | | |
Net asset value, end of period | | $ | | | 19.52 | | | 17.14 | | | 15.40 | | | 13.06 | | | | 10.40 | | |
Total Return(2) | | % | | | 22.90 | | | 21.95 | | | 28.90 | | | 33.77 | | | | 7.47 | | |
| | | | | | | | | | | | | | | | | | | | |
Ratios and Supplemental Data: | | | | | | | | | | | | | | | | | | | | |
Net assets, end of period (000’s) | | $ | | | 226,715 | | | 138,314 | | | 95,561 | | | 41,549 | | | | 25,440 | | |
Ratios to average net assets: | | | | | | | | | | | | | | | | | | | | |
Net expenses after expense reimbursement/recoupment(3)(4) | | % | | | 1.54 | | | 1.59 | | | 1.75 | | | 1.75 | | | | 1.76 | | |
Gross expenses prior to expense reimbursement/recoupment(3) | | % | | | 1.54 | | | 1.50 | | | 1.55 | | | 1.95 | | | | 2.46 | | |
Net investment income after expense reimbursement/
recoupment(3)(4) | | % | | | 0.70 | | | 1.58 | † | | 2.55 | | | 5.14 | | | | 4.12 | | |
Portfolio turnover rate | | % | | | 20 | | | 91 | | | 129 | | | 124 | | | | 141 | | |
| | | | Class B | |
| | | | Six Months
Ended
April 30, | | Year Ended October 31, | | March 15,
2002(1) to
October 31, | |
| | | | 2006 | | 2005 | | 2004 | | 2003 | | 2002 | |
Per Share Operating Performance: | | | | | | | | | | | | | |
Net asset value, beginning of period | | $ | | | 15.01 | | | 13.67 | | | 11.74 | | | 9.43 | | | | 10.03 | | |
Income (loss) from investment operations: | | | | | | | | | | | | | | | | | | | | |
Net investment income | | $ | | | (0.00 | )* | ** | 0.12 | *† | | 0.14 | | | 0.48 | | | | 0.16 | | |
Net realized and unrealized gain (loss) on investments | | $ | | | 2.13 | | | 2.59 | † | | 2.90 | | | 2.47 | | | | (0.58 | ) | |
Total from investment operations | | $ | | | 2.13 | | | 2.71 | | | 3.04 | | | 2.95 | | | | (0.42 | ) | |
Less distributions from: | | | | | | | | | | | | | | | | | | | | |
Net investment income | | $ | | | 0.25 | | | 0.45 | | | 0.35 | | | 0.48 | | | | 0.18 | | |
Net realized gain on investments | | $ | | | — | | | 0.92 | | | 0.76 | | | 0.16 | | | | — | | |
Total distributions | | $ | | | 0.25 | | | 1.37 | | | 1.11 | | | 0.64 | | | | 0.18 | | |
Net asset value, end of period | | $ | | | 16.89 | | | 15.01 | | | 13.67 | | | 11.74 | | | | 9.43 | | |
Total Return(2) | | % | | | 22.44 | | | 21.05 | | | 27.89 | | | 32.83 | | | | (4.29 | ) | |
| | | | | | | | | | | | | | | | | | | | |
Ratios and Supplemental Data: | | | | | | | | | | | | | | | | | | | | |
Net assets, end of period (000’s) | | $ | | | 19,017 | | | 12,302 | | | 4,736 | | | 1,506 | | | | 677 | | |
Ratios to average net assets: | | | | | | | | | | | | | | | | | | | | |
Net expenses after expense reimbursement/recoupment(3)(4) | | % | | | 2.29 | | | 2.34 | | | 2.50 | | | 2.50 | | | | 2.52 | | |
Gross expenses prior to expense reimbursement/recoupment(3) | | % | | | 2.29 | | | 2.25 | | | 2.30 | | | 2.70 | | | | 3.19 | | |
Net investment income after expense reimbursement/
recoupment(3)(4) | | % | | | (0.05 | ) | | 0.79 | † | | 1.78 | | | 4.44 | | | | 3.74 | | |
Portfolio turnover rate | | % | | | 20 | | | 91 | | | 129 | | | 124 | | | | 141 | | |
(1) | Commencement of operations. |
(2) | Total return is calculated assuming reinvestment of all dividends and capital gain distributions at net asset value and excluding the deduction of sales charges. Total return for less than one year is not annualized. |
(3) | Annualized for periods less than one year. |
(4) | The Investment Manager has agreed to limit expenses, (excluding interest, taxes, brokerage and extraordinary expenses) subject to possible recoupment by ING Investments, LLC within three years of being incurred. |
* | Per share data calculated using average number of shares outstanding throughout the period. |
** | Amount represents less than $0.005 per share. |
† | Effective November 1, 2004, the Fund adopted a policy to reduce cost of investments for financial statement purposes by the distributions received in excess of income from Real Estate Investment Trusts. The effect of this change for the twelve months ended October 31, 2005 was to decrease the net investment income per share by $0.12, $0.10 and $0.11, increase net realized and unrealized gain on investments per share by $0.12, $0.10 and $0.11 and decrease the ratio of net investment income to average net assets from 2.31% to 1.58%, 1.51% to 0.79% and 1.51% to 0.78% on Class A, Class B and Class C, respectively. |
See Accompanying Notes to Financial Statements
70
ING GLOBAL REAL ESTATE FUND (UNAUDITED) (CONTINUED) | FINANCIAL HIGHLIGHTS |
Selected data for a share of beneficial interest outstanding throughout each period.
| | | | Class C | |
| | | | Six Months
Ended
April 30, | | Year Ended October 31, | | January 8,
2002(1) to
October 31, | |
| | | | 2006 | | 2005 | | 2004 | | 2003 | | 2002 | |
Per Share Operating Performance: | | | | | | | | | | | | | |
Net asset value, beginning of period | | $ | | | 15.65 | | | 14.19 | | | 12.14 | | | 9.70 | | | | 9.99 | | |
Income (loss) from investment operations: | | | | | | | | | | | | | | | | | | | | |
Net investment income | | $ | | | (0.00 | )* | ** | 0.12 | *† | | 0.14 | | | 0.45 | | | | 0.19 | | |
Net realized and unrealized gain (loss) on investments | | $ | | | 2.27 | | | 2.71 | † | | 3.02 | | | 2.60 | | | | (0.31 | ) | |
Total from investment operations | | $ | | | 2.27 | | | 2.83 | | | 3.16 | | | 3.05 | | | | (0.12 | ) | |
Less distributions from: | | | | | | | | | | | | | | | | | | | | |
Net investment income | | $ | | | 0.25 | | | 0.45 | | | 0.35 | | | 0.45 | | | | 0.17 | | |
Net realized gain on investments | | $ | | | — | | | 0.92 | | | 0.76 | | | 0.16 | | | | — | | |
Total distributions | | $ | | | 0.25 | | | 1.37 | | | 1.11 | | | 0.61 | | | | 0.17 | | |
Net asset value, end of period | | $ | | | 17.67 | | | 15.65 | | | 14.19 | | | 12.14 | | | | 9.70 | | |
Total Return(2) | | % | | | 22.40 | | | 21.11 | | | 27.93 | | | 32.89 | | | | (1.24 | ) | |
| | | | | | | | | | | | | | | | | | | | |
Ratios and Supplemental Data: | | | | | | | | | | | | | | | | | | | | |
Net assets, end of period (000’s) | | $ | | | 50,581 | | | 27,989 | | | 7,817 | | | 1,732 | | | | 2,320 | | |
Ratios to average net assets: | | | | | | | | | | | | | | | | | | | | |
Net expenses after expense reimbursement/recoupment(3)(4) | | % | | | 2.29 | | | 2.34 | | | 2.50 | | | 2.50 | | | | 2.52 | | |
Gross expenses prior to expense reimbursement/recoupment(3) | | % | | | 2.29 | | | 2.25 | | | 2.30 | | | 2.70 | | | | 3.19 | | |
Net investment income after expense reimbursement/
recoupment(3)(4) | | % | | | (0.05 | ) | | 0.78 | † | | 1.72 | | | 4.60 | | | | 3.51 | | |
Portfolio turnover rate | | % | | | 20 | | | 91 | | | 129 | | | 124 | | | | 141 | | |
| | | | Class I | |
| | | | Six Months
Ended
April 30,
2006 | | June 3,
2005 to
October 31,
2005(1) | |
Per Share Operating Performance: | | | | | | | |
Net asset value, beginning of period | | $ | | | 17.14 | | | | 16.32 | | |
Income from investment operations: | | | | | | | | | | | |
Net investment income | | $ | | | 0.10 | * | | | 0.14 | *†† | |
Net realized and unrealized gain on investments | | $ | | | 2.60 | | | | 0.86 | †† | |
Total from investment operations | | $ | | | 2.70 | | | | 1.00 | | |
Less distributions from: | | | | | | | | | | | |
Net investment income | | $ | | | 0.32 | | | | 0.18 | | |
Total distributions | | $ | | | 0.32 | | | | 0.18 | | |
Net asset value, end of period | | $ | | | 19.52 | | | | 17.14 | | |
Total Return(2) | | % | | | 23.05 | | | | 6.14 | | |
| | | | | | | | | | | |
Ratios and Supplemental Data: | | | | | | | | | | | |
Net assets, end of period (000’s) | | $ | | | 4,504 | | | | 1,681 | | |
Ratios to average net assets: | | | | | | | | | | | |
Net expenses after expense reimbursement/recoupment(3)(4) | | % | | | 1.20 | | | | 1.30 | | |
Gross expenses prior to expense reimbursement/recoupment(3) | | % | | | 1.20 | | | | 1.22 | | |
Net investment income after expense reimbursement/recoupment(3)(4) | | % | | | 1.06 | | | | 0.85 | † | |
Portfolio turnover rate | | % | | | 20 | | | | 91 | | |
(1) | Commencement of operations. |
(2) | Total return is calculated assuming reinvestment of all dividends and capital gain distributions at net asset value and excluding the deduction of sales charges. Total return for less than one year is not annualized. |
(3) | Annualized for periods less than one year. |
(4) | The Investment Manager has agreed to limit expenses, (excluding interest, taxes, brokerage and extraordinary expenses) subject to possible recoupment by ING Investments, LLC within three years of being incurred. |
* | Per share data calculated using average number of shares outstanding throughout the period. |
** | Amount represents less than $0.005 per share. |
† | Effective November 1, 2004, the Fund adopted a policy to reduce cost of investments for financial statement purposes by the distributions received in excess of income from Real Estate Investment Trusts. The effect of this change for the twelve months ended October 31, 2005 was to decrease the net investment income per share by $0.12, $0.10 and $0.11, increase net realized and unrealized gain on investments per share by $0.12, $0.10 and $0.11 and decrease the ratio of net investment income to average net assets from 2.31% to 1.58%, 1.51% to 0.79% and 1.51% to 0.78% on Class A, Class B and Class C, respectively. |
†† | Effective November 1, 2004, the Fund adopted a policy to reduce cost of investments for financial statement purposes by the distributions received in excess of income from Real Estate Investment Trusts. The effect of this change for the twelve months ended October 31, 2005 was to decrease the net investment income per share by $0.30, increase net realized and unrealized gain on investments per share by $0.30 and decrease the ratio of net investment income to average net assets from 2.60% to 0.85% for Class I. |
See Accompanying Notes to Financial Statements
71
ING GLOBAL VALUE CHOICE FUND (UNAUDITED) | | FINANCIAL HIGHLIGHTS |
| | |
Selected data for a share of beneficial interest outstanding throughout each period. | |
| | Class A | |
| | Six Months
Ended
April 30, | | Year Ended October 31, | |
| | 2006 | | 2005 | | 2004 | | 2003 | | 2002 | | 2001 | |
Per Share Operating Performance: | | | | | | | | | | | | | |
Net asset value, beginning of period | $ | | 18.16 | | | 15.96 | | | 14.76 | | | 12.36 | | | 15.45 | | | 26.36 | | |
Income (loss) from investment operations: | | | | | | | | | | | | | | | | | | | | |
Net investment income (loss) | $ | | 0.07 | | | 0.09 | | | (0.04 | ) | | (0.06 | ) | | (0.12 | )* | | (0.11 | ) | |
Net realized and unrealized gain (loss) on investments | $ | | 3.20 | | | 2.11 | | | 1.24 | | | 2.46 | | | (2.97 | )* | | (9.73 | ) | |
Total from investment operations | $ | | 3.27 | | | 2.20 | | | 1.20 | | | 2.40 | | | (3.09 | ) | | (9.84 | ) | |
Less distributions from: | | | | | | | | | | | | | | | | | | | | |
Net investment income | $ | | 0.14 | | | — | | | — | | | — | | | — | | | — | | |
Net realized gain on investments | $ | | — | | | — | | | — | | | — | | | — | | | 0.77 | | |
Tax return of capital | $ | | — | | | — | | | — | | | — | | | — | | | 0.30 | | |
Total distributions | $ | | — | | | — | | | — | | | — | | | — | | | 1.07 | | |
Payment by affiliate | $ | | 0.14 | | | 0.00 | ** | | — | | | — | | | — | | | — | | |
Net asset value, end of period | $ | | 21.29 | | | 18.16 | | | 15.96 | | | 14.76 | | | 12.36 | | | 15.45 | | |
Total Return(1) | % | | 18.09 | | | 13.78 | † | | 8.13 | | | 19.42 | | | (20.00 | ) | | (38.80 | ) | |
| | | | | | | | | | | | | | | | | | | | |
Ratios and Supplemental Data: | | | | | | | | | | | | | | | | | | | | |
Net assets, end of period (000’s) | $ | | 49,796 | | | 41,941 | | | 46,133 | | | 56,877 | | | 69,478 | | | 134,152 | | |
Ratios to average net assets: | | | | | | | | | | | | | | | | | | | | |
Net expenses after expense
reimbursement/recoupment(2)(3) | % | | 1.85 | | | 1.85 | | | 1.85 | | | 1.85 | | | 1.86 | | | 1.85 | | |
Gross expenses prior to expense
reimbursement/recoupment(3) | % | | 1.90 | | | 1.90 | | | 1.77 | | | 1.93 | | | 1.96 | | | 1.95 | | |
Net investment income (loss) after expense reimbursement/recoupment(2)(3) | % | | 0.69 | | | 0.46 | | | (0.21 | ) | | (0.35 | ) | | (0.83 | ) | | (0.65 | ) | |
Portfolio turnover rate | % | | 38 | | | 129 | | | 101 | | | 125 | | | 281 | | | 302 | | |
| | Class B | |
| | Six Months
Ended
April 30, | | Year Ended October 31, | |
| | 2006 | | 2005 | | 2004 | | 2003 | | 2002 | | 2001 | |
Per Share Operating Performance: | | | | | | | | | | | | | |
Net asset value, beginning of period | $ | 19.67 | | | 17.39 | | | 16.19 | | | 13.65 | | | 17.19 | | | 29.52 | | |
Income (loss) from investment operations: | | | | | | | | | | | | | | | | | | | |
Net investment loss | $ | 0.00 | * ** | | (0.04 | ) | | (0.17 | ) | | (0.16 | ) | | (0.25 | )* | | (0.31 | ) | |
Net realized and unrealized gain (loss) on investments | $ | 3.49 | | | 2.32 | | | 1.37 | | | 2.70 | | | (3.29 | )* | | (10.82 | ) | |
Total from investment operations | $ | 3.49 | | | 2.28 | | | 1.20 | | | 2.54 | | | (3.54 | ) | | (11.13 | ) | |
Less distributions from: | | | | | | | | | | | | | | | | | | | |
Net realized gain on investments | $ | — | | | — | | | — | | | — | | | — | | | 0.86 | | |
Tax return of capital | $ | — | | | — | | | — | | | — | | | — | | | 0.34 | | |
Total distributions | $ | — | | | — | | | — | | | — | | | — | | | 1.20 | | |
Payment by affiliate | $ | — | | | 0.00 | ** | | — | | | — | | | — | | | — | | |
Net asset value, end of period | $ | 23.16 | | | 19.67 | | | 17.39 | | | 16.19 | | | 13.65 | | | 17.19 | | |
Total Return(1) | % | 17.74 | | | 13.11 | † | | 7.41 | | | 18.61 | | | (20.59 | ) | | (39.19 | ) | |
| | | | | | | | | | | | | | | | | | | |
Ratios and Supplemental Data: | | | | | | | | | | | | | | | | | | | |
Net assets, end of period (000’s) | $ | 23,954 | | | 23,483 | | | 28,559 | | | 35,459 | | | 38,603 | | | 71,943 | | |
Ratios to average net assets: | | | | | | | | | | | | | | | | | | | |
Net expenses after expense reimbursement/recoupment(2)(3) | % | 2.50 | | | 2.50 | | | 2.50 | | | 2.50 | | | 2.51 | | | 2.51 | | |
Gross expenses prior to expense reimbursement/recoupment(3) | % | 2.55 | | | 2.55 | | | 2.42 | | | 2.58 | | | 2.61 | | | 2.61 | | |
Net investment loss after expense reimbursement/recoupment(2)(3) | % | 0.00 | ** | | (0.19 | ) | | (0.87 | ) | | (1.00 | ) | | (1.46 | ) | | (1.31 | ) | |
Portfolio turnover rate | % | 38 | | | 129 | | | 101 | | | 125 | | | 281 | | | 302 | | |
(1) | Total return is calculated assuming reinvestment of all dividends and capital gain distributions at net asset value and excluding the deduction of sales charges. Total return for less than one year is not annualized. |
(2) | The Investment Manager has agreed to limit expenses, (excluding interest, taxes, brokerage and extraordinary expenses) subject to possible recoupment by ING Investments, LLC within three years of being incurred. |
(3) | Annualized for periods less than one year. |
* | Per share data calculated using average number of shares outstanding throughout the period. |
** | Amount represents less than $0.005 per share or 0.005%. |
† | In 2005, there was no impact on total return due to payment by affiliate. |
See Accompanying Notes to Financial Statements
72
ING GLOBAL VALUE CHOICE FUND (UNAUDITED)(CONTINUED) | | FINANCIAL HIGHLIGHTS |
| | |
Selected data for a share of beneficial interest outstanding throughout each period. | |
| | Class C | |
| | Six Months
Ended
April 30, | | Year Ended October 31, | |
| | 2006 | | 2005 | | 2004 | | 2003 | | 2002 | | 2001 | |
Per Share Operating Performance: | | | | | | | | | | | | | |
Net asset value, beginning of period | $ | | 17.50 | | | 15.48 | | | 14.41 | | | 12.14 | | | 15.29 | | | 26.26 | | |
Income (loss) from investment operations: | | | | | | | | | | | | | | | | | | | | |
Net investment loss | $ | | 0.00 | * ** | | (0.04 | ) | | (0.15 | ) | | (0.15 | ) | | (0.22 | )* | | (0.40 | ) | |
Net realized and unrealized gain (loss) on investments | $ | | 3.10 | | | 2.06 | | | 1.22 | | | 2.42 | | | (2.93 | )* | | (9.50 | ) | |
Total from investment operations | $ | | 3.10 | | | 2.02 | | | 1.07 | | | 2.27 | | | (3.15 | ) | | (9.90 | ) | |
Less distributions from: | | | | | | | | | | | | | | | | | | | | |
Net investment income | $ | | 0.02 | | | — | | | — | | | — | | | — | | | — | | |
Net realized gain on investments | $ | | — | | | — | | | — | | | — | | | — | | | 0.77 | | |
Tax return of capital | $ | | — | | | — | | | — | | | — | | | — | | | 0.30 | | |
Total distributions | $ | | 0.02 | | | — | | | — | | | — | | | — | | | 1.07 | | |
Payment by affiliate | $ | | — | | | 0.00 | ** | | — | | | — | | | — | | | — | | |
Net asset value, end of period | $ | | 20.58 | | | 17.50 | | | 15.48 | | | 14.41 | | | 12.14 | | | 15.29 | | |
Total Return(1) | % | | 17.73 | | | 13.05 | † | | 7.43 | | | 18.70 | | | (20.60 | ) | | (39.20 | ) | |
| | | | | | | | | | | | | | | | | | | | |
Ratios and Supplemental Data: | | | | | | | | | | | | | | | | | | | | |
Net assets, end of period (000’s) | $ | | 33,324 | | | 30,918 | | | 35,784 | | | 45,476 | | | 51,868 | | | 102,919 | | |
Ratios to average net assets: | | | | | | | | | | | | | | | | | | | | |
Net expenses after expense
reimbursement/recoupment(2)(3) | % | | 2.50 | | | 2.50 | | | 2.50 | | | 2.50 | | | 2.51 | | | 2.51 | | |
Gross expenses prior to expense
reimbursement/recoupment(3) | % | | 2.55 | | | 2.55 | | | 2.42 | | | 2.58 | | | 2.61 | | | 2.60 | | |
Net investment income (loss) after expense
reimbursement/recoupment(2)(3) | % | | 0.02 | | | (0.19 | ) | | (0.87 | ) | | (1.01 | ) | | (1.46 | ) | | (1.30 | ) | |
Portfolio turnover rate | % | | 38 | | | 129 | | | 101 | | | 125 | | | 281 | | | 302 | | |
| | Class Q | |
| | Six Months
Ended
April 30, | | Year Ended October 31, | |
| | 2006 | | 2005 | | 2004 | | 2003 | | 2002 | | 2001 | |
Per Share Operating Performance: | | | | | | | | | | | | | |
Net asset value, beginning of period | $ | | 21.25 | | | 18.61 | | | 17.17 | | | 14.34 | | | 17.87 | | | 30.37 | | |
Income (loss) from investment operations: | | | | | | | | | | | | | | | | | | | | |
Net investment income (loss) | $ | | 0.11 | | | 0.15 | | | 0.01 | | | (0.01 | ) | | (0.08 | )* | | (0.07 | )* | |
Net realized and unrealized gain (loss) on investments | $ | | 3.75 | | | 2.49 | | | 1.43 | | | 2.84 | | | (3.45 | )* | | (11.19 | )* | |
Total from investment operations | $ | | 3.86 | | | 2.64 | | | 1.44 | | | 2.83 | | | (3.53 | ) | | (11.26 | ) | |
Less distributions from: | | | | | | | | | | | | | | | | | | | | |
Net investment income | $ | | 0.19 | | | — | | | — | | | — | | | — | | | — | | |
Net realized gains on investments | $ | | — | | | — | | | — | | | — | | | — | | | 0.89 | | |
Tax return of capital | $ | | — | | | — | | | — | | | — | | | — | | | 0.35 | | |
Total distributions | $ | | 0.19 | | | — | | | — | | | — | | | — | | | 1.24 | | |
Payment by affiliate | $ | | — | | | 0.00 | ** | | — | | | — | | | — | | | — | | |
Net asset value, end of period | $ | | 24.92 | | | 21.25 | | | 18.61 | | | 17.17 | | | 14.34 | | | 17.87 | | |
Total Return(1) | % | | 18.28 | | | 14.19 | † | | 8.39 | | | 19.74 | | | (19.75 | ) | | (38.56 | ) | |
| | | | | | | | | | | | | | | | | | | | |
Ratios and Supplemental Data: | | | | | | | | | | | | | | | | | | | | |
Net assets, end of period (000’s) | $ | | 5,553 | | | 4,387 | | | 4,223 | | | 6,454 | | | 8,194 | | | 17,178 | | |
Ratios to average net assets: | | | | | | | | | | | | | | | | | | | | |
Net expense after reimbursement/recoupment(2)(3) | % | | 1.55 | | | 1.55 | | | 1.59 | | | 1.54 | | | 1.49 | | | 1.51 | | |
Gross expenses prior to expense reimbursement/recoupment(3) | % | | 1.60 | | | 1.60 | | | 1.51 | | | 1.62 | | | 1.59 | | | 1.60 | | |
Net investment income (loss) after expense reimbursement/recoupment(2)(3) | % | | 0.99 | | | 0.75 | | | 0.05 | | | (0.04 | ) | | (0.47 | ) | | (0.30 | ) | |
Portfolio turnover rate | % | | 38 | | | 129 | | | 101 | | | 125 | | | 281 | | | 302 | | |
(1) | Total return is calculated assuming reinvestment of all dividends and capital gain distributions at net asset value and excluding the deduction of sales charges. Total return for less than one year is not annualized. |
(2) | The Investment Manager has agreed to limit expenses, (excluding interest, taxes, brokerage and extraordinary expenses) subject to possible recoupment by ING Investments, LLC within three years of being incurred. |
(3) | Annualized for periods less than one year. |
* | Per share data calculated using average number of shares outstanding throughout the period. |
** | Amount represents less than $0.005 per share. |
† | In 2005, there was no impact on total return due to payment by affiliate. |
See Accompanying Notes to Financial Statements
73
ING EMERGING COUNTRIES FUND (UNAUDITED) | FINANCIAL HIGHLIGHTS |
Selected data for a share of beneficial interest outstanding throughout each period.
| | Class A | |
| | Six Months
Ended
April 30, | | Year Ended October 31, | |
| | 2006 | | 2005 | | 2004 | | 2003 | | 2002 | | 2001 | |
Per Share Operating Performance: | | | | | | | | | | | | | |
Net asset value, beginning of period | $ | 23.60 | | | 19.40 | | | 17.32 | | | 12.44 | | | 11.87 | | | 16.33 | | |
Income (loss) from investment operations: | | | | | | | | | | | | | | | | | | | |
Net investment income (loss) | $ | 0.24 | ** | | 0.19 | | | 0.09 | | | 0.03 | | | (0.10 | ) | | (0.02 | ) | |
Net realized and unrealized gain (loss) on investments (net of Indian tax) | $ | 6.11 | | | 3.98 | | | 2.08 | | | 4.85 | | | 0.67 | | | (4.44 | ) | |
Total from investment operations | $ | 6.35 | | | 4.17 | | | 2.17 | | | 4.88 | | | 0.57 | | | (4.46 | ) | |
Less distributions from: | | | | | | | | | | | | | | | | | | | |
Net investment income (loss) | $ | 0.14 | | | 0.02 | | | 0.09 | | | — | | | (0.00 | )* | | — | | |
Total distributions | $ | 0.14 | | | 0.02 | | | 0.09 | | | — | | | — | | | — | | |
Payment by affiliate | $ | — | | | 0.05 | | | 0.00 | * | | — | | | — | | | — | | |
Net asset value, end of period | $ | 29.81 | | | 23.60 | | | 19.40 | | | 17.32 | | | 12.44 | | | 11.87 | | |
Total Return(1) | % | 27.00 | | | 21.76 | †† | | 12.58 | † | | 39.23 | | | 4.80 | | | (27.31 | ) | |
| | | | | | | | | | | | | | | | | | | |
Ratios and Supplemental Data: | | | | | | | | | | | | | | | | | | | |
Net assets, end of period (000’s) | $ | 121,139 | | | 87,143 | | | 67,282 | | | 71,953 | | | 62,063 | | | 67,247 | | |
Ratios to average net assets: | | | | | | | | | | | | | | | | | | | |
Net expenses after expense reimbursement/recoupment(2)(3) | % | 1.93 | | | 2.00 | | | 2.20 | | | 2.27 | | | 2.32 | | | 2.32 | | |
Gross expenses prior to expense
reimbursement/ recoupment(3) | % | 2.03 | | | 2.09 | | | 2.10 | | | 2.37 | | | 2.26 | | | 2.33 | | |
Net investment income (loss) after expense reimbursement/recoupment(2)(3) | % | 1.78 | | | 0.91 | | | 0.41 | | | 0.22 | | | (0.56 | ) | | (0.16 | ) | |
Portfolio turnover rate | % | 19 | | | 124 | | | 88 | | | 135 | | | 124 | | | 74 | | |
| | Class B | |
| | Six Months
Ended
April 30, | | Year Ended October 31, | |
| | 2006 | | 2005 | | 2004 | | 2003 | | 2002 | | 2001 | |
Per Share Operating Performance: | | | | | | | | | | | | | |
Net asset value, beginning of period | $ | 23.17 | | | 19.17 | | | 17.15 | | | 12.39 | | | 11.85 | | | 16.41 | | |
Income (loss) from investment operations: | | | | | | | | | | | | | | | | | | | |
Net investment income (loss) | $ | 0.13 | ** | | 0.04 | | | (0.04 | ) | | (0.06 | ) | | (0.16 | ) | | (0.11 | ) | |
Net realized and unrealized gain (loss) on investments (net of Indian tax) | $ | 6.03 | | | 3.91 | | | 2.06 | | | 4.82 | | | 0.70 | | | (4.45 | ) | |
Total from investment operations | $ | 6.16 | | | 3.95 | | | 2.02 | | | 4.76 | | | 0.54 | | | (4.56 | ) | |
Payment by affiliate | $ | — | | | 0.05 | | | 0.00 | * | | — | | | — | | | — | | |
Net asset value, end of period | $ | 29.33 | | | 23.17 | | | 19.17 | | | 17.15 | | | 12.39 | | | 11.85 | | |
Total Return(1) | % | 26.59 | | | 20.87 | †† | | 11.78 | † | | 38.42 | | | 4.56 | | | (27.79 | ) | |
| | | | | | | | | | | | | | | | | | | |
Ratios and Supplemental Data: | | | | | | | | | | | | | | | | | | | |
Net assets, end of period (000’s) | $ | 16,164 | | | 12,562 | | | 12,581 | | | 16,425 | | | 15,150 | | | 14,637 | | |
Ratios to average net assets: | | | | | | | | | | | | | | | | | | | |
Net expenses after expense reimbursement/recoupment(2)(3) | % | 2.68 | | | 2.74 | | | 2.85 | | | 2.92 | | | 2.97 | | | 2.99 | | |
Gross expenses prior to expense
reimbursement/ recoupment(3) | % | 2.68 | | | 2.74 | | | 2.75 | | | 3.02 | | | 2.91 | | | 3.00 | | |
Net investment income (loss) after expense reimbursement/recoupment(2)(3) | % | 1.00 | | | 0.14 | | | (0.30 | ) | | (0.40 | ) | | (1.23 | ) | | (0.72 | ) | |
Portfolio turnover rate | % | 19 | | | 124 | | | 88 | | | 135 | | | 124 | | | 74 | | |
(1) | Total return is calculated assuming reinvestment of all dividends and capital gain distributions at net asset value and excluding the deduction of sales charges. Total return for less than one year is not annualized. |
(2) | The Investment Manager has agreed to limit expenses, (excluding interest, taxes, brokerage and extraordinary expenses) subject to possible recoupment by ING Investments, LLC within three years of being incurred. |
(3) | Annualized for periods less than one year. |
* | Amount represents less than $0.005 per share. |
** | Per share data calculated using average number of shares outstanding throughout the period. |
† | In 2004, 0.06% of the total return consists of a gain on the disposition of an investment not meeting the Fund’s investment restrictions. Excluding this item, total return would have been 12.52% and 11.72% for Class A and Class B, respectively. There was no impact on total return due to the payment by affiliate. |
†† | In 2005, 0.26% of the total return consists of a payment by affiliate. Excluding this item, total return would have been 21.50% and 20.61% for Class A and Class B, respectively. |
See Accompanying Notes to Financial Statements
74
Ing EMERGING COUNTRIES FUND (UNAUDITED) (CONTINUED) | FINANCIAL HIGHLIGHTS |
Selected data for a share of beneficial interest outstanding throughout each period.
| | Class C | |
| | Six Months
Ended
April 30, | | Year Ended October 31, | |
| | 2006 | | 2005 | | 2004 | | 2003 | | 2002 | | 2001 | |
Per Share Operating Performance: | | | | | | | | | | | | | |
Net asset value, beginning of period | $ | 22.04 | | | 18.24 | | | 16.32 | | | 11.79 | | | 11.41 | | | 15.81 | | |
Income (loss) from investment operations: | | | | | | | | | | | | | | | | | | | |
Net investment income (loss) | $ | 0.14 | ** | | 0.03 | | | (0.03 | ) | | (0.06 | ) | | (0.25 | ) | | (0.12 | ) | |
Net realized and unrealized gain (loss) on
investments (net of Indian tax) | $ | 5.70 | | | 3.72 | | | 1.95 | | | 4.59 | | | 0.63 | | | (4.28 | ) | |
Total from investment operations | $ | 5.84 | | | 3.75 | | | 1.92 | | | 4.53 | | | 0.38 | | | (4.40 | ) | |
Less distributions from: | | | | | | | | | | | | | | | | | | | |
Net investment income | $ | 0.07 | | | — | | | — | | | — | | | 0.04 | | | — | | |
Total Distributions | $ | 0.07 | | | — | | | — | | | — | | | 0.04 | | | — | | |
Payment by affiliate | $ | — | | | 0.05 | | | 0.00 | * | | — | | | — | | | — | | |
Net asset value, end of period | $ | 27.81 | | | 22.04 | | | 18.24 | | | 16.32 | | | 11.79 | | | 11.41 | | |
Total Return(1) | % | 26.57 | | | 20.83 | †† | | 11.76 | † | | 38.42 | | | 3.33 | | | (27.83 | ) | |
| | | | | | | | | | | | | | | | | | | |
Ratios and Supplemental Data: | | | | | | | | | | | | | | | | | | | |
Net assets, end of period (000’s) | $ | 35,736 | | | 20,985 | | | 9,680 | | | 10,033 | | | 9,519 | | | 12,746 | | |
Ratios to average net assets: | | | | | | | | | | | | | | | | | | | |
Net expenses after expense
reimbursement/recoupment(2)(3) | % | 2.68 | | | 2.74 | | | 2.85 | | | 2.92 | | | 2.97 | | | 2.99 | | |
Gross expenses prior to expense reimbursement/recoupment(2) | % | 2.68 | | | 2.74 | | | 2.75 | | | 3.02 | | | 2.91 | | | 3.00 | | |
Net investment income (loss) after expense reimbursement/recoupment(2)(3) | % | 1.17 | | | 0.25 | | | (0.20 | ) | | (0.40 | ) | | (1.20 | ) | | (0.73 | ) | |
Portfolio turnover rate | % | 19 | | | 124 | | | 88 | | | 135 | | | 124 | | | 74 | | |
| | Class M | |
| | Six Months
Ended
April 30, | | Year Ended October 31, | | August 5,
2002(4) to
October 31, | |
| | 2006 | | 2005 | | 2004 | | 2003 | | 2002 | |
Per Share Operating Performance: | | | | | | | | | | | |
Net asset value, beginning of period | $ | 23.20 | | | 19.15 | | | 17.12 | | | 12.35 | | | 12.39 | | |
Income (loss) from investment operations: | | | | | | | | | | | | | | | | |
Net investment income (loss) | $ | 0.16 | ** | | 0.09 | | | (0.00 | )* ** | | (0.02 | ) | | (0.03 | ) | |
Net realized and unrealized gain (loss) on
investments (net of Indian tax) | $ | 6.03 | | | 3.91 | | | 2.06 | | | 4.79 | | | (0.01 | ) | |
Total from investment operations | $ | 6.19 | | | 4.00 | | | 2.06 | | | 4.77 | | | (0.04 | ) | |
Less distributions from: | | | | | | | | | | | | | | | | |
Net investment income | $ | 0.02 | | | — | | | 0.03 | | | — | | | — | | |
Total distributions | $ | 0.02 | | | — | | | 0.03 | | | — | | | — | | |
Payment by affiliate | $ | — | | | 0.05 | | | 0.00 | * | | — | | | — | | |
Net asset value, end of period | $ | 29.37 | | | 23.20 | | | 19.15 | | | 17.12 | | | 12.35 | | |
Total Return(1) | % | 26.71 | | | 21.15 | †† | | 12.07 | † | | 38.62 | | | (0.32 | ) | |
| | | | | | | | | | | | | | | | |
Ratios and Supplemental Data: | | | | | | | | | | | | | | | | |
Net assets, end of period (000’s) | $ | 1,522 | | | 1,210 | | | 1,124 | | | 1,237 | | | 1,125 | | |
Ratios to average net assets: | | | | | | | | | | | | | | | | |
Net expenses after expense reimbursement(2)(3) | % | 2.43 | | | 2.49 | | | 2.60 | | | 2.67 | | | 2.73 | | |
Gross expenses prior to expense
reimbursement/recoupment(2) | % | 2.68 | | | 2.74 | | | 2.50 | | | 2.77 | | | 2.73 | | |
Net investment income (loss) after expense reimbursement/recoupment/recoupment(2)(3) | % | 1.22 | | | 0.37 | | | (0.01 | ) | | (0.14 | ) | | (1.32 | ) | |
Portfolio turnover rate | % | 19 | | | 124 | | | 88 | | | 135 | | | 124 | | |
(1) | Total return is calculated assuming reinvestment of all dividends and capital gain distributions at net asset value and excluding the deduction of sales charges. Total return for less than one year is not annualized. |
(2) | Annualized for periods less than one year. |
(3) | The Investment Manager has agreed to limit expenses, (excluding interest, taxes, brokerage and extraordinary expenses) subject to possible recoupment by ING Investments, LLC within three years of being incurred. |
(4) | Commencement of operations. |
* | Amount represents less than $0.005 per share. |
** | Per share data calculated using average number of shares outstanding throughout the period. |
† | In 2004, 0.06% of the total return consists of a gain on the disposition of an investment not meeting the Fund’s investment restrictions. Excluding this item, total return would have been 11.70% and 12.01% for Class C and Class M, respectively. There was no impact on total return due to the payment by affiliate. |
†† | In 2005, 0.27% and 0.26% of the total return on Class C and Class M, respectively, consists of a payment by affiliate. Excluding this item, total return would have been 20.56% and 20.89% for Class C and Class M, respectively. |
See Accompanying Notes to Financial Statements
75
ING EMERGING COUNTRIES FUND (UNAUDITED) (CONTINUED) | FINANCIAL HIGHLIGHTS |
Selected data for a share of beneficial interest outstanding throughout each period.
| | Class I | |
| | December 21, 2005(1)
to April 30, 2006 | |
| | | |
Per Share Operating Performance: | | | |
Net asset value, beginning of period | | $ | 25.52 | |
Income from investment operations: | | | |
Net investment income | | $ | 0.51 | |
Net realized and unrealized gain on investments | | $ | 3.84 | |
Total from investment operations | | $ | 4.35 | |
Net asset value, end of period | | $ | 29.87 | |
Total Return(2): | | % | 17.05 | |
| | | | |
Ratios/Supplemental Data: | | | |
Net assets, end of period ($000) | | $ | 14,075 | |
Ratio to average net assets: | | | | |
Net expenses after expense reimbursement/recoupment(3)(4) | | % | 2.16 | |
Net expenses after expense reimbursement/recoupment(3)(4) | | % | 2.16 | |
Gross expenses prior to expense reimbursement/recoupment(4) | | % | 2.16 | |
Net investment income(3)(4) | | % | 7.03 | |
Portfolio turnover rate | | % | 19 | |
| | Class Q | |
| | Six Months
Ended
April 30, | | Year Ended October 31, | |
| | 2006 | | 2005 | | 2004 | | 2003 | | 2002 | | 2001 | |
Per Share Operating Performance: | | | | | | | | | | | | | |
Net asset value, beginning of period | $ | 24.38 | | 20.03 | | 17.89 | | 12.80 | | 12.26 | | 16.81 | |
Income (loss) from investment operations: | | | | | | | | | | | | | |
Net investment income (loss) | $ | 0.28 | ** | 0.26 | | 0.09 | | 0.12 | | (0.14 | ) | 0.09 | |
Net realized and unrealized gain (loss) on investments | $ | 6.30 | | 4.07 | | 2.17 | | 4.97 | | 0.68 | | (4.64 | ) |
Total from investment operations | $ | 6.58 | | 4.33 | | 2.26 | | 5.09 | | 0.54 | | (4.55 | ) |
Less distributions from: | | | | | | | | | | | | | |
Net investment income | $ | 0.16 | | 0.03 | | 0.12 | | — | | 0.00 | * | — | |
Total distributions | $ | 0.16 | | 0.03 | | 0.12 | | — | | 0.00 | * | — | |
Payment by affiliate | $ | — | | 0.05 | | 0.00 | * | — | | — | | — | |
Net asset value, end of period | $ | 30.80 | | 24.38 | | 20.03 | | 17.89 | | 12.80 | | 12.26 | |
Total Return(2) | % | 27.12 | | 21.89 | †† | 12.70 | † | 39.77 | | 4.41 | | (27.01 | ) |
| | | | | | | | | | | | | |
Ratios and Supplemental Data: | | | | | | | | | | | | | |
Net assets, end of period (000’s) | $ | 16,390 | | 10,776 | | 8,929 | | 18,168 | | 21,132 | | 26,783 | |
Ratios to average net assets: | | | | | | | | | | | | | |
Net expenses after expense reimbursement/recoupment(3)(4) | % | 1.81 | | 1.85 | | 2.10 | | 1.93 | | 2.00 | | 1.97 | |
Gross expenses prior to expense reimbursement/recoupment(4) | % | 1.81 | | 1.85 | | 2.00 | | 2.03 | | 1.94 | | 1.98 | |
Net investment income (loss) after expense | | | | | | | | | | | | | |
reimbursement/recoupment(3)(4) | % | 2.02 | | 1.12 | | 0.36 | | 0.59 | | (0.24 | ) | 0.42 | |
Portfolio turnover rate | % | 19 | | 124 | | 88 | | 135 | | 124 | | 74 | |
| | | | | | | | | | | | | | | | | | | |
(1) Commencement of operations.
(2) Total return is calculated assuming reinvestment of all dividends and capital gain distributions at net asset value. Total return for less than one year is not annualized.
(3) The Investment Manager has agreed to limit expenses, (excluding interest, taxes, brokerage and extraordinary expenses) subject to possible recoupment by ING Investments, LLC within three years of being incurred.
(4) Annualized for periods less than one year.
* Amount represents less than $0.005 per share.
** Per share data calculated using average number of shares outstanding throughout the period.
† In 2004, 0.06% of the total return consists of a gain on an investment not meeting the Fund’s investment restrictions. Excluding this item, total return would have been 12.64%. There was no impact on total return due to the payment by affiliate.
†† In 2005, 0.25% of the total return consists of a payment by affiliate. Excluding this item, total return would have been 21.64% for the Fund.
See Accompanying Notes to Financial Statements
76
ING FOREIGN FUND (UNAUDITED) | FINANCIAL HIGHLIGHTS |
Selected data for a share of beneficial interest outstanding throughout each period.
| | Class A | |
| | Six Months
Ended
April 30, | | Year Ended October 31, | | July 1,
2003(1) to
October 31, | |
| | 2006 | | 2005 | | 2004 | | 2003 | |
Per Share Operating Performance: | | | | | | | | | |
Net asset value, beginning of period | $ | 14.79 | | 12.38 | | 11.01 | | 10.00 | |
Income (loss) from investment operations: | | | | | | | | | |
Net investment income (loss) | $ | (0.01 | )** | 0.06 | | 0.11 | | (0.00 | )* |
Net realized and unrealized gain on investments | $ | 3.92 | | 2.35 | | 1.44 | | 1.01 | |
Total from investment operations | $ | 3.91 | | 2.41 | | 1.55 | | 1.01 | |
Less distributions from: | | | | | | | | | |
Net investment income | $ | — | | — | | 0.04 | | — | |
Return of capital | $ | — | | — | | 0.10 | | — | |
Net realized gain on investments | $ | 0.36 | | — | | 0.04 | | — | |
Total distributions | $ | 0.36 | | — | | 0.18 | | — | |
Net asset value, end of period | $ | 18.34 | | 14.79 | | 12.38 | | 11.01 | |
Total Return(2) | % | 26.87 | | 19.47 | | 14.25 | | 10.10 | |
| | | | | | | | | |
Ratios and Supplemental Data: | | | | | | | | | |
Net assets, end of period (000’s) | $ | 200,588 | | 122,883 | | 62,949 | | 6,598 | |
Ratios to average net assets: | | | | | | | | | |
Net expenses after brokerage commission recapture and expense reimbursement/recoupment(3)(4) | % | 1.65 | | 1.68 | | 1.70 | | 1.95 | |
Net expenses after expense reimbursement and prior to brokerage commission recapture(3)(4) | % | 1.65 | | 1.68 | | 1.70 | | 1.95 | |
Gross expenses prior to brokerage commission recapture and expense reimbursement/recoupment(3) | % | 1.56 | | 1.66 | | 1.95 | | 6.03 | |
Net investment income (loss) after expense reimbursement/recoupment(3)(4) | % | (0.15 | ) | 0.53 | | 0.37 | | (0.32 | ) |
Portfolio turnover rate | % | 35 | | 81 | | 141 | | 50 | |
| | | | | | | | | | | | | |
| | Class B | |
| | Six Months
Ended
April 30, | | Year Ended October 31, | | July 8,
2003(1) to
October 31, | |
| | 2006 | | 2005 | | 2004 | | 2003 | |
Per Share Operating Performance: | | | | | | | | | |
Net asset value, beginning of period | $ | 14.55 | | 12.26 | | 10.99 | | 10.29 | |
Income (loss) from investment operations: | | | | | | | | | |
Net investment income (loss) | $ | (0.07 | )** | (0.03 | ) | (0.05 | )** | (0.01 | ) |
Net realized and unrealized gain on investments | $ | 3.85 | | 2.32 | | 1.49 | | 0.71 | |
Total from investment operations | $ | 3.78 | | 2.29 | | 1.44 | | 0.70 | |
Less distributions from: | | | | | | | | | |
Net investment income | $ | — | | — | | 0.03 | | — | |
Return of capital | $ | — | | — | | 0.10 | | — | |
Net realized gain on investments | $ | 0.36 | | — | | 0.04 | | — | |
Total distributions | $ | 0.36 | | — | | 0.17 | | — | |
Net asset value, end of period | $ | 17.97 | | 14.55 | | 12.26 | | 10.99 | |
Total Return(2) | % | 26.42 | | 18.68 | | 13.32 | | 6.80 | |
| | | | | | | | | |
Ratios and Supplemental Data: | | | | | | | | | |
Net assets, end of period (000’s) | $ | 37,876 | | 22,944 | | 11,263 | | 1,344 | |
Ratios to average net assets: | | | | | | | | | |
Net expenses after brokerage commission recapture and expense reimbursement/recoupment(3)(4) | % | 2.40 | | 2.43 | | 2.45 | | 2.70 | |
Net expenses after expense reimbursement and prior to brokerage commission recapture(3)(4) | % | 2.40 | | 2.43 | | 2.45 | | 2.70 | |
Gross expenses prior to brokerage commission recapture and expense reimbursement/recoupment(3) | % | 2.31 | | 2.41 | | 2.70 | | 6.78 | |
Net investment income (loss) after expense reimbursement/recoupment(3)(4) | % | (0.90 | ) | (0.23 | ) | (0.46 | ) | (1.03 | ) |
Portfolio turnover rate | % | 35 | | 81 | | 141 | | 50 | |
| | | | | | | | | | | | | |
(1) Commencement of operations.
(2) Total return is calculated assuming reinvestment of all dividends and capital gain distributions at net asset value and excluding the deduction of sales charges. Total return for less than one year is not annualized.
(3) Annualized for periods less than one year.
(4) The Investment Manager has agreed to limit expenses, (excluding interest, taxes, brokerage and extraordinary expenses) subject to possible recoupment by ING Investments, LLC within three years of being incurred.
* Amount represents less than $0.005 per share.
** Per share data calculated using average number of shares outstanding throughout the period.
See Accompanying Notes to Financial Statements
77
ING FOREIGN FUND (UNAUDITED) (CONTINUED) | FINANCIAL HIGHLIGHTS |
Selected data for a share of beneficial interest outstanding throughout each period.
| | Class C | |
| | Six Months
Ended
April 30, | | Year Ended October 31, | | July 7,
2003(1) to
October 31, | |
| | 2006 | | 2005 | | 2004 | | 2003 | |
Per Share Operating Performance: | | | | | | | | | |
Net asset value, beginning of period | $ | 14.57 | | 12.28 | | 11.01 | | 10.27 | |
Income (loss) from investment operations: | | | | | | | | | |
Net investment loss | $ | (0.07 | )** | (0.03 | ) | (0.04 | )** | (0.01 | ) |
Net realized and unrealized gain on investments | $ | 3.85 | | 2.32 | | 1.48 | | 0.75 | |
Total from investment operations | $ | 3.78 | | 2.29 | | 1.44 | | 0.74 | |
Less distributions from: | | | | | | | | | |
Net investment income | $ | — | | — | | 0.03 | | — | |
Return of capital | $ | — | | — | | 0.10 | | — | |
Net realized gain on investments | $ | 0.36 | | — | | 0.04 | | — | |
Total distributions | $ | 0.36 | | — | | 0.17 | | — | |
Net asset value, end of period | $ | 17.99 | | 14.57 | | 12.28 | | 11.01 | |
Total Return(2) | % | 26.38 | | 18.65 | | 13.28 | | 7.21 | |
| | | | | | | | | |
Ratios and Supplemental Data: | | | | | | | | | |
Net assets, end of period (000’s) | $ | 141,742 | | 87,877 | | 41,424 | | 5,601 | |
Ratios to average net assets: | | | | | | | | | |
Net expenses after brokerage commission recaputre and expense reimbursement/recoupment(3)(4) | % | 2.40 | | 2.43 | | 2.45 | | 2.70 | |
Net expenses after expense reimbursement and prior to brokerage commission recapture(3)(4) | % | 2.40 | | 2.43 | | 2.45 | | 2.70 | |
Gross expenses prior to brokerage commission recapture and expense reimbursement/recoupment(3) | % | 2.31 | | 2.41 | | 2.70 | | 6.78 | |
Net investment loss after expense reimbursement/recoupment(3)(4) | % | (0.90 | ) | (0.27 | ) | (0.41 | ) | (1.03 | ) |
Portfolio turnover rate | % | 35 | | 81 | | 141 | | 50 | |
| | | | | | | | | | | | | |
| | Class I | |
| | Six Months
Ended
April 30, | | Year Ended October 31, | | September 10,
2003(1) to
October 31, | |
| | 2006 | | 2005 | | 2004 | | 2003 | |
Per Share Operating Performance: | | | | | | | | | |
Net asset value, beginning of period | $ | 14.93 | | 12.45 | | 11.05 | | 10.63 | |
Income (loss) from investment operations: | | | | | | | | | |
Net investment income (loss) | $ | 0.10 | ** | 0.34 | | 0.19 | | 0.00 | * |
Net realized and unrealized gain on investments | $ | 3.87 | | 2.14 | | 1.39 | | 0.42 | |
Total from investment operations | $ | 3.97 | | 2.48 | | 1.58 | | 0.42 | |
Less distributions from: | | | | | | | | | |
Net investment income | $ | — | | — | | 0.04 | | — | |
Return of capital | $ | — | | — | | 0.10 | | — | |
Net realized gain on investments | $ | 0.36 | | — | | 0.04 | | — | |
Total distributions | $ | 0.36 | | — | | 0.18 | | — | |
Net asset value, end of period | $ | 18.54 | | 14.93 | | 12.45 | | 11.05 | |
Total Return(2) | % | 27.03 | | 19.92 | | 14.53 | | 3.95 | |
| | | | | | | | | |
Ratios and Supplemental Data: | | | | | | | | | |
Net assets, end of period (000’s) | $ | 25,065 | | 1,049 | | 2,547 | | 188 | |
Ratios to average net assets: | | | | | | | | | |
Net expenses after brokerage commission recapture and expense reimbursement/recoupment(3)(4) | % | 1.30 | | 1.35 | | 1.25 | | 1.43 | |
Net expenses after expense reimbursement and prior to brokerage commission recapture(3)(4) | % | 1.30 | | 1.35 | | 1.25 | | 1.43 | |
Gross expenses prior to brokerage commission recapture and and expense reimbursement/recoupment(3) | % | 1.23 | | 1.34 | | 1.50 | | 5.51 | |
Net investment income (loss) after expense reimbursement/recoupment(3)(4) | % | 1.14 | | 0.97 | | 1.58 | | 0.21 | |
Portfolio turnover rate | % | 35 | | 81 | | 141 | | 50 | |
| | | | | | | | | | | | | |
(1) Commencement of operations.
(2) Total return is calculated assuming reinvestment of all dividends and capital gain distributions at net asset value and excluding the deduction of sales charges. Total return for less than one year is not annualized.
(3) Annualized for periods less than one year.
(4) The Investment Manager has agreed to limit expenses, (excluding interest, taxes, brokerage and extraordinary expenses) subject to possible recoupment by ING Investments, LLC within three years of being incurred.
* Amount represents less than $0.005 per share.
** Per share data calculated using average number of shares outstanding throughout the period.
See Accompanying Notes to Financial Statements
78
ING FOREIGN FUND (UNAUDITED) (CONTINUED) | FINANCIAL HIGHLIGHTS |
Selected data for a share of beneficial interest outstanding throughout each period.
| | Class Q | |
| | Six Months
Ended
April 30, | | Year Ended October 31, | | July 11,
2003(1) to
October 31, | |
| | 2006 | | 2005 | | 2004 | | 2003 | |
Per Share Operating Performance: | | | | | | | | | |
Net asset value, beginning of period | $ | 14.82 | | 12.40 | | 11.02 | | 10.13 | |
Income (loss) from investment operations: | | | | | | | | | |
Net investment income (loss) | $ | (0.01 | )** | 0.08 | | 0.09 | | (0.00 | )* |
Net realized and unrealized gain on investments | $ | 3.94 | | 2.34 | | 1.46 | | 0.89 | |
Total from investment operations | $ | 3.93 | | 2.42 | | 1.55 | | 0.89 | |
Less distributions from: | | | | | | | | | |
Net investment income | $ | — | | — | | 0.03 | | — | |
Return of capital | $ | — | | — | | 0.10 | | — | |
Net realized gain on investments | $ | 0.36 | | — | | 0.04 | | — | |
Total distributions | $ | 0.36 | | — | | 0.17 | | — | |
Net asset value, end of period | $ | 18.39 | | 14.82 | | 12.40 | | 11.02 | |
Total Return(2) | % | 26.95 | | 19.52 | | 14.28 | | 8.79 | |
| | | | | | | | | |
Ratios and Supplemental Data: | | | | | | | | | |
Net assets, end of period (000’s) | $ | 1,187 | | 1,079 | | 1,054 | | 421 | |
Ratios to average net assets: | | | | | | | | | |
Net expenses after brokerage commission recapture and expense reimbursement/recoupment(3)(4) | % | 1.65 | | 1.60 | | 1.60 | | 1.85 | |
Net expenses after expense reimbursement and prior to brokerage commission recapture(3)(4) | % | 1.65 | | 1.60 | | 1.60 | | 1.85 | |
Gross expenses prior to brokerage commission recapture and and expense reimbursement/recoupment(3) | % | 1.58 | | 1.59 | | 1.85 | | 5.93 | |
Net investment income (loss) after proceeds and expense reimbursement/recoupment(3)(4) | % | (0.26 | ) | 0.53 | | 0.34 | | (0.17 | ) |
Portfolio turnover rate | % | 35 | | 81 | | 141 | | 50 | |
| | | | | | | | | | | | | |
(1) Commencement of operations.
(2) Total return is calculated assuming reinvestment of all dividends and capital gain distributions at net asset value. Total return for less than one year is not annualized.
(3) Annualized for periods less than one year.
(4) The Investment Manager has agreed to limit expenses, (excluding interest, taxes, brokerage and extraordinary expenses) subject to possible recoupment by ING Investments, LLC within three years of being incurred.
* Amount represents less than $0.005 per share.
** Per share data calculated using average number of shares outstanding throughout the period.
See Accompanying Notes to Financial Statements
79
ING GREATER CHINA FUND | FINANCIAL HIGHLIGHTS |
Selected data for a share of beneficial interest outstanding throughout each period.
| | Class A | | Class B | | Class C | |
| | December 21,
2005(1) to
April 30,
2006 | | January 6,
2006(1) to
April 30,
2006 | | January 11,
2006(1) to
April 30,
2006 | |
Per Share Operating Performance: | | | | | | | |
Net asset value, beginning of period | $ | 10.00 | | 10.60 | | 10.67 | |
Income (loss) from investment operations: | | | | | | | |
Net investment income | $ | (0.04 | )* | (0.01 | )* | (0.01 | )* |
Net realized and unrealized gain on investments | $ | 2.17 | | 1.52 | | 1.45 | |
Total from investment operations | $ | 2.13 | | 1.51 | | 1.44 | |
Net asset value, end of period | $ | 12.13 | | 12.11 | | 12.11 | |
Total Return(2) | % | 21.30 | | 14.25 | | 13.50 | |
| | | | | | | |
Ratios and Supplemental Data: | | | | | | | |
Net assets, end of period (000’s) | $ | 17,795 | | 544 | | 872 | |
Ratios to average net assets: | | | | | | | |
Expenses(3) | % | 2.90 | | 3.65 | | 3.65 | |
Net investment income(3) | % | (0.99 | ) | (0.34 | ) | (0.19 | ) |
Portfolio turnover rate(4) | % | 39 | | 39 | | 39 | |
| | | | | | | | | | |
(1) Commencement of operations.
(2) Total return is calculated assuming reinvestment of dividends and capital gain distributions at net asset value and excluding the deduction of sales charge. Total return for less than one year is not annualized.
(3) Annualized for periods less than one year.
(4) Not Annualized.
* Per share data calculated using average number of shares outstanding throughout the period.
See Accompanying Notes to Financial Statements
80
ING INDEX PLUS INTERNATIONAL EQUITY FUND | FINANCIAL HIGHLIGHTS |
Selected data for a share of beneficial interest outstanding throughout each period.
| | Class A | | Class B | | Class C | | Class I | |
| | December 21,
2005(1) to
April 30,
2006 | | January 12,
2006(1) to
April 30,
2006 | | January 12,
2006(1) to
April 30,
2006 | | December 21,
2005(1) to
April 30,
2006 | |
Per Share Operating Performance: | | | | | | | | | |
Net asset value, beginning of period | $ | 10.00 | | 10.43 | | 10.43 | | 10.00 | |
Income from investment operations: | | | | | | | | | |
Net investment income | $ | 0.06 | * | 0.09 | * | 0.09 | * | 0.13 | * |
Net realized and unrealized gain on investments | $ | 1.16 | | 0.69 | | 0.67 | | 1.09 | |
Total from investment operations | $ | 1.22 | | 0.78 | | 0.76 | | 1.22 | |
Net asset value, end of period | $ | 11.22 | | 11.21 | | 11.19 | | 11.22 | |
Total Return(2) | % | 12.20 | | 7.48 | | 7.29 | | 12.00 | |
| | | | | | | | | |
Ratios and Supplemental Data: | | | | | | | | | |
Net assets, end of period (000’s) | $ | 17,425 | | 128 | | 422 | | 41,767 | |
Ratios to average net assets: | | | | | | | | | |
Net expenses after expense reimbursement(3) | % | 1.15 | | 1.90 | | 1.90 | | 0.90 | |
Gross expenses prior to expense reimbursement(3) | % | 1.61 | | 2.36 | | 2.36 | | 1.36 | |
Net investment income after expense reimbursement(3) | % | 1.63 | | 2.15 | | 2.15 | | 3.41 | |
Portfolio turnover rate(4) | % | 97 | | 97 | | 97 | | 97 | |
| | | | | | | | | | | | | |
(1) Commencement of operations.
(2) Total return is calculated assuming reinvestment of dividends and capital gain distributions at net asset value and excluding the deduction of sales charge. Total return for less than one year is not annualized.
(3) Annualized for periods less than one year.
(4) Not Annualized.
* Per share data calculated using average number of shares outstanding throughout the period.
See Accompanying Notes to Financial Statements
81
ING INTERNATIONAL FUND (UNAUDITED) | FINANCIAL HIGHLIGHTS |
Selected data for a share of beneficial interest outstanding throughout each period.
| | Class A | |
| | Six Months
Ended
April 30, | | Year Ended October 31, | |
| | 2006 | | 2005 | | 2004 | | 2003 | | 2002 | | 2001 | |
Per Share Operating Performance: | | | | | | | | | | | | | |
Net asset value, beginning of period | $ | 10.97 | | 9.78 | | 8.48 | | 7.05 | | 8.09 | | 11.22 | |
Income (loss) from investment operations: | | | | | | | | | | | | | |
Net investment income (loss) | $ | 0.04 | | 0.10 | | 0.09 | | 0.04 | | (0.02 | ) | (0.05 | ) |
Net realized and unrealized gain (loss) on investments | $ | 2.40 | | 1.18 | | 1.22 | | 1.37 | | (1.04 | ) | (2.14 | ) |
Total from investment operations | $ | 2.44 | | 1.28 | | 1.31 | | 1.41 | | (1.06 | ) | (2.19 | ) |
Less distributions from: | | | | | | | | | | | | | |
Net investment income | $ | 0.17 | | 0.10 | | 0.01 | | 0.03 | | — | | — | |
Net realized gain on investments | $ | — | | — | | — | | — | | — | | 0.94 | |
Total distributions | $ | 0.17 | | 0.10 | | 0.01 | | 0.03 | | — | | 0.94 | |
Redemption fees applied to capital | $ | | | — | | 0.00 | * | 0.05 | | 0.02 | | — | |
Payment by affiliate | $ | | | 0.01 | | — | | — | | — | | — | |
Net asset value, end of period | $ | 13.24 | | 10.97 | | 9.78 | | 8.48 | | 7.05 | | 8.09 | |
Total Return(1) | % | 22.48 | | 13.30 | † | 15.49 | | 20.72 | | (12.86 | ) | (21.38 | ) |
| | | | | | | | | | | | | |
Ratios and Supplemental Data: | | | | | | | | | | | | | |
Net assets, end of period (000’s) | $ | 62,374 | | 51,193 | | 47,551 | | 43,821 | | 43,314 | | 37,489 | |
Ratios to average net assets: | | | | | | | | | | | | | |
Net expenses after expense reimbursement/recoupment(2)(3) | % | 1.66 | | 1.65 | | 1.68 | | 1.85 | | 2.14 | | 2.51 | |
Gross expenses prior to expense reimbursement/recoupment(3) | % | 1.66 | | 1.65 | | 1.64 | | 1.87 | | 2.18 | | 2.51 | |
Net investment income (loss) after expense reimbursement/ recoupment(2)(3) | % | 0.77 | | 0.94 | | 0.78 | | 0.64 | | (0.32 | ) | (0.74 | ) |
Portfolio turnover rate | % | 110 | | 116 | | 90 | | 100 | | 126 | | 169 | |
| | | | | | | | | | | | | | | | | | | |
| | Class B | |
| | Six Months
Ended
April 30, | | Year Ended October 31, | |
| | 2006 | | 2005 | | 2004 | | 2003 | | 2002 | | 2001 | |
Per Share Operating Performance: | | | | | | | | | | | | | |
Net asset value, beginning of period | $ | 10.55 | | 9.43 | | 8.22 | | 6.91 | | 8.03 | | 11.19 | |
Income (loss) from investment operations: | | | | | | | | | | | | | |
Net investment income (loss) | $ | 0.00 | * | 0.02 | | (0.00 | )* | (0.00 | )* | (0.02 | ) | (0.62 | ) |
Net realized and unrealized gain (loss) on investments | $ | 2.31 | | 1.14 | | 1.21 | | 1.31 | | (1.10 | ) | (1.60 | ) |
Total from investment operations | $ | 2.31 | | 1.16 | | 1.21 | | 1.31 | | (1.12 | ) | (2.22 | ) |
Less distributions from: | | | | | | | | | | | | | |
Net investment income | $ | 0.09 | | 0.05 | | — | | — | | — | | — | |
Net realized gain on investments | $ | — | | — | | — | | — | | — | | 0.94 | |
Total distributions | $ | 0.09 | | 0.05 | | — | | — | | — | | 0.94 | |
Payment by affiliate | $ | | | 0.01 | | — | | — | | — | | — | |
Net asset value, end of period | $ | 12.77 | | 10.55 | | 9.43 | | 8.22 | | 6.91 | | 8.03 | |
Total Return(1) | % | 22.00 | | 12.41 | † | 14.72 | | 18.96 | | (13.95 | ) | (21.74 | ) |
| | | | | | | | | | | | | |
Ratios and Supplemental Data: | | | | | | | | | | | | | |
Net assets, end of period (000’s) | $ | 19,095 | | 16,338 | | 15,069 | | 12,466 | | 10,246 | | 1,961 | |
Ratios to average net assets: | | | | | | | | | | | | | |
Net expenses after expense reimbursement/recoupment(2)(3) | % | 2.41 | | 2.40 | | 2.43 | | 2.60 | | 2.76 | | 3.32 | |
Gross expenses prior to expense reimbursement/recoupment(3) | % | 2.41 | | 2.40 | | 2.39 | | 2.62 | | 2.83 | | 3.32 | |
Net investment income (loss) after expense reimbursement/recoupment(2)(3) | % | 0.01 | | 0.19 | | (0.02 | ) | (0.05 | ) | (1.10 | ) | (1.40 | ) |
Portfolio turnover rate | % | 110 | | 116 | | 90 | | 100 | | 126 | | 169 | |
| | | | | | | | | | | | | | | | | | | |
(1) Total return is calculated assuming reinvestment of all dividends and capital gain distributions at net asset value and excluding the deduction of sales charges. Total return for less than one year is not annualized.
(2) The Investment Manager has agreed to limit expenses, (excluding interest, taxes, brokerage and extraordinary expenses) subject to possible recoupment by ING Investments, LLC within three years of being incurred.
(3) Annualized for periods less than one year.
* Amount represents less than $0.005 per share.
† In 2005, 0.10% of the total return on Class A and Class B, consists of a payment by affiliate. Excluding this item, total return would have been 13.20% and 12.31% for Class A and Class B, respectively.
See Accompanying Notes to Financial Statements
82
ING INTERNATIONAL FUND (UNAUDITED) (CONTINUED) | FINANCIAL HIGHLIGHTS |
Selected data for a share of beneficial interest outstanding throughout each period.
| | Class C | |
| | Six Months | | | | | | | | | | | |
| | Ended | | | | | | | | | | | |
| | April 30, | | Year Ended October 31, | |
| | 2006 | | 2005 | | 2004 | | 2003 | | 2002 | | 2001 | |
| | | | | | | | | | | | | |
Per Share Operating Performance: | | | | | | | |
Net asset value, beginning of period | $ | 10.55 | | 9.42 | | 8.22 | | 6.91 | | 8.02 | | 11.21 | |
Income (loss) from investment operations: | | | | | | | | | | | | | |
Net investment income (loss) | $ | 0.00 | * | 0.03 | | (0.00 | )* | (0.00 | )* | (0.02 | ) | (0.62 | ) |
Net realized and unrealized gain (loss) on investments | $ | 2.31 | | 1.13 | | 1.20 | | 1.31 | | (1.09 | ) | (1.63 | ) |
Total from investment operations | $ | 2.31 | | 1.16 | | 1.20 | | 1.31 | | (1.11 | ) | (2.25 | ) |
Less distributions from: | | | | | | | | | | | | | |
Net investment income | $ | 0.08 | | 0.04 | | — | | 0.00 | * | — | | — | |
Net realized gain on investments | $ | — | | — | | — | | — | | — | | 0.94 | |
Total distributions | $ | 0.08 | | 0.04 | | — | | 0.00 | * | — | | 0.94 | |
Payment by affiliate | $ | — | | 0.01 | | — | | — | | — | | — | |
Net asset value, end of period | $ | 12.78 | | 10.55 | | 9.42 | | 8.22 | | 6.91 | | 8.02 | |
Total Return(2) | % | 22.02 | | 12.46 | † | 14.60 | | 18.97 | | (13.84 | ) | (21.98 | ) |
| | | | | | | | | | | | | |
Ratios and Supplemental Data: | | | | | | | | | | | | | |
Net assets, end of period (000’s) | $ | 17,592 | | 15,008 | | 16,230 | | 14,526 | | 12,384 | | 1,514 | |
Ratios to average net assets: | | | | | | | | | | | | | |
Net expenses after expense reimbursement/recoupment(3)(4) | % | 2.41 | | 2.40 | | 2.43 | | 2.60 | | 2.76 | | 3.31 | |
Gross expenses prior to expense
reimbursement/ | | | | | | | | | | | | | |
recoupment(3) | % | 2.41 | | 2.40 | | 2.39 | | 2.62 | | 2.84 | | 3.31 | |
Net investment income (loss) after expense reimbursement/ | | | | | | | | | | | | | |
recoupment(3)(4) | % | 0.01 | | 0.18 | | (0.04 | ) | (0.05 | ) | (1.18 | ) | (1.46 | ) |
Portfolio turnover rate | % | 110 | | 116 | | 90 | | 100 | | 126 | | 169 | |
| | | | | | | | | | | | | | | | | | | |
| | Class I | |
| | Six Months | | | | | | | | January 15, | |
| | Ended | | | | | | | | 2002 to | |
| | April 30, | | Year Ended October 31, | | October 31, | |
| | 2006 | | 2005 | | 2004 | | 2003 | | 2002(1) | |
Per Share Operating Performance: | | | | | | |
Net asset value, beginning of period | $ | 10.94 | | 9.76 | | 8.45 | | 7.06 | | 8.25 | |
Income (loss) from investment operations: | | | | | | | | | | | |
Net investment income | $ | 0.06 | | 0.14 | | 0.09 | | 0.10 | | 0.05 | |
Net realized and unrealized gain (loss) on investments | $ | 2.37 | | 1.18 | | 1.25 | | 1.34 | | (1.24 | ) |
Total from investment operations | $ | 2.43 | | 1.32 | | 1.34 | | 1.44 | | (1.19 | ) |
Less distributions from: | | | | | | | | | | | |
Net investment income | $ | 0.20 | | 0.15 | | 0.03 | | 0.05 | | — | |
Total distributions | $ | 0.20 | | 0.15 | | 0.03 | | 0.05 | | — | |
Payment by affiliate | $ | — | | 0.01 | | — | | — | | — | |
Net asset value, end of period | $ | 13.17 | | 10.94 | | 9.76 | | 8.45 | | 7.06 | |
Total Return(2) | % | 22.65 | | 13.73 | † | 15.94 | | 20.53 | | (14.42 | ) |
| | | | | | | | | | | |
Ratios and Supplemental Data: | | | | | | | | | | | |
Net assets, end of period (000’s) | $ | 12,463 | | 23,452 | | 17,211 | | 11,582 | | 6,384 | |
Ratios to average net assets: | | | | | | | | | | | |
Net expenses after expense reimbursement/recoupment(3)(4) | % | 1.27 | | 1.26 | | 1.26 | | 1.33 | | 1.48 | |
Gross expenses prior to expense
reimbursement/recoupment(3) | % | 1.27 | | 1.26 | | 1.22 | | 1.34 | | 1.53 | |
Net investment income after expense reimbursement/recoupment(3)(4) | % | 1.06 | | 1.34 | | 1.13 | | 1.29 | | 0.72 | |
Portfolio turnover rate | % | 110 | | 116 | | 90 | | 100 | | 126 | |
| | | | | | | | | | | | | | | | |
(1) | Commencement of operations. |
(2) | Total return is calculated assuming reinvestment of all dividends and capital gain distributions at net asset value and excluding the deduction of sales charges. Total return for less than one year is not annualized. |
(3) | Annualized for periods less than one year. |
(4) | The Investment Manager has agreed to limit expenses, (excluding interest, taxes, brokerage and extraordinary expenses) subject to possible recoupment by ING Investments, LLC within three years of being incurred. |
* | Amount represents less than $0.005 per share. |
† | In 2005, 0.10% of the total return on Class A and Class B, consists of a payment by affiliate. Excluding this item, total return would have been 13.20% and 12.31% for Class A and Class B, respectively. |
† | In 2005, 0.10% of the total return on Class I and Class Q, respectively, consists of a payment by affiliate. Excluding this item, total return would have been 13.63% and 13.31% for Class I and Class Q, respectively. |
See Accompanying Notes to Financial Statements
83
ING INTERNATIONAL FUND (UNAUDITED) (CONTINUED) | | FINANCIAL HIGHLIGHTS |
Selected data for a share of beneficial interest outstanding throughout each period.
| | Class Q | |
| | Six Months
Ended
April 30, | | Year Ended October 31, | | February 26,
2001 to
October 31, | |
| | 2006 | | 2005 | | 2004 | | 2003 | | 2002 | | 2001(1) | |
Per Share Operating Performance: | | | | | | | |
Net asset value, beginning of period | $ | 10.89 | | 9.72 | | 8.43 | | 7.04 | | 8.10 | | 9.89 | |
Income (loss) from investment operations: | | | | | | | | | | | | | |
Net investment income (loss) | $ | 0.06 | | 0.08 | | 0.06 | | 0.07 | | (0.03 | ) | (0.02 | ) |
Net realized and unrealized gain (loss) on investments | $ | 2.39 | | 1.20 | | 1.25 | | 1.37 | | (1.03 | ) | (1.77 | ) |
Total from investment operations | $ | 2.45 | | 1.28 | | 1.31 | | 1.44 | | (1.06 | ) | (1.79 | ) |
Less distributions from: | | | | | | | | | | | | | |
Net investment income | $ | 0.22 | | 0.12 | | 0.02 | | 0.05 | | — | | — | |
Total distributions | $ | 0.22 | | 0.12 | | 0.02 | | 0.05 | | — | | — | |
Payment by affiliate | $ | — | | 0.01 | | — | | — | | — | | — | |
Net asset value, end of period | $ | 13.12 | | 10.89 | | 9.72 | | 8.43 | | 7.04 | | 8.10 | |
Total Return(2) | % | 22.57 | | 13.41 | † | 15.61 | | 20.51 | | (13.09 | ) | (18.10 | ) |
| | | | | | | | | | | | | |
Ratios and Supplemental Data: | | | | | | | | | | | | | |
Net assets, end of period (000’s) | $ | 25,800 | | 14,544 | | 7,274 | | 14,755 | | 6,949 | | 7 | |
Ratios to average net assets: | | | | | | | | | | | | | |
Net expenses after expense reimbursement/recoupment(3)(4) | % | 1.53 | | 1.51 | | 1.60 | | 1.59 | | 1.61 | | 2.27 | |
Gross expenses prior to expense reimbursement/recoupment(3) | % | 1.53 | | 1.51 | | 1.56 | | 1.59 | | 1.70 | | 2.27 | |
Net investment income (loss) after expense reimbursement/recoupment(3)(4) | % | 1.05 | | 1.00 | | 0.73 | | 0.91 | | (0.08 | ) | (0.24 | ) |
Portfolio turnover rate | % | 110 | | 116 | | 90 | | 100 | | 126 | | 169 | |
| | | | | | | | | | | | | | | | | | | |
(1) | Commencement of operations. |
(2) | Total return is calculated assuming reinvestment of all dividends and capital gain distributions at net asset value. Total return for less than one year is not annualized. |
(3) | Annualized for periods less than one year. |
(4) | The Investment Manager has agreed to limit expenses, (excluding interest, taxes, brokerage and extraordinary expenses) subject to possible recoupment by ING Investments, LLC within three years of being incurred. |
† | In 2005, 0.10% of the total return on Class I and Class Q, respectively, consists of a payment by affiliate. Excluding this item, total return would have been 13.63% and 13.31% for Class I and Class Q, respectively. |
See Accompanying Notes to Financial Statements
84
ING INTERNATIONAL CAPITAL APPRECIATION FUND | | FINANCIAL HIGHLIGHTS |
Selected data for a share of beneficial interest outstanding throughout each period.
| | Class A | | Class B | | Class C | | Class I | |
| | December 21,
2005(1) to
April 30,
2006 | | January 9,
2006(1) to
April 30,
2006 | | January 24,
2006(1) to
April 30,
2006 | | December 21,
2005(1) to
April 30,
2006 | |
Per Share Operating Performance: | | | | | | | | | |
Net asset value, beginning of period | $ | 10.00 | | 10.42 | | 10.28 | | 10.00 | |
Income (loss) from investment operations: | | | | | | | | | |
Net investment income | $ | 0.01 | * | (0.00 | )** | (0.01 | )* | 0.05 | * |
Net realized and unrealized gain on investments | $ | 0.93 | | 0.49 | | 0.64 | | 0.90 | |
Total from investment operations | $ | 0.94 | | 0.49 | | 0.63 | | 0.95 | |
Net asset value, end of period | $ | 10.94 | | 10.91 | | 10.91 | | 10.95 | |
Total Return(2) | % | 9.40 | | 4.70 | | 6.13 | | 9.50 | |
| | | | | | | | | |
Ratios and Supplemental Data: | | | | | | | | | |
Net assets, end of period (000’s) | $ | 5,510 | | 46 | | 43 | | 24,892 | |
Ratios to average net assets: | | | | | | | | | |
Net expenses after expense reimbursement and brokerage | | | | | | | | | |
commission recapture(3)(4) | % | 1.50 | | 2.25 | | 2.25 | | 1.25 | |
Net expenses after expense reimbursement/recoupment prior to brokerage commission recapture(3)(4) | % | 1.50 | | 2.25 | | 2.25 | | 1.25 | |
Gross expenses prior to expense reimbursement and brokerage | | | | | | | | | |
commission recapture(4) | % | 2.45 | | 3.20 | | 3.20 | | 2.20 | |
Net investment income after expense reimbursement and brokerage commission recapture(3)(4) | % | 0.27 | | (0.09 | ) | (0.39 | ) | 1.43 | |
Portfolio turnover rate(5) | % | 39 | | 39 | | 39 | | 39 | |
| | | | | | | | | | | | | |
(1) Commencement of operations.
(2) Total return is calculated assuming reinvestment of dividends and capital gain distributions at net asset value and excluding the deduction of sales charge. Total return for less than one year is not annualized.
(3) The investment manager has agreed to limit expenses, (excluding interest, taxes, brokerage and extraordinary expenses) subject to possible recoupment by ING Investments, LLC within three years of being incurred.
(4) Annualized for periods less than one year.
(5) Not Annualized.
* Per share data calculated using average number of shares outstanding throughout the period.
** Amount represents less than $0.005 per share.
See Accompanying Notes to Financial Statements
85
ING INTERNATIONAL REAL ESTATE FUND | FINANCIAL HIGHLIGHTS |
Selected data for a share of beneficial interest outstanding throughout each period.
| | Class A | | Class B | | Class C | | Class I | |
| | February 28,
2006(1) to
April 30,
2006 | | February 28,
2006(1) to
April 30,
2006 | | February 28,
2006(1) to
April 30,
2006 | | February 28,
2006(1) to
April 30,
2006 | |
Per Share Operating Performance: | | | | | | | | | |
Net asset value, beginning of period | $ | 10.00 | | 10.00 | | 10.00 | | | 10.00 | |
Income (loss) from investment operations: | | | | | | | | | |
Net investment income | $ | | 0.03 | * | 0.03 | * | 0.02 | * | 0.03 | * |
Net realized and unrealized gain on investments | $ | | 0.50 | | 0.50 | | 0.50 | | 0.51 | |
Total from investment operations | $ | | 0.53 | | 0.53 | | 0.52 | | 0.54 | |
Less distributions from: | | | | | | | | | |
Net investment income | $ | | 0.01 | | 0.02 | | 0.01 | | 0.02 | |
Total distributions | $ | | 0.01 | | 0.02 | | 0.01 | | 0.02 | |
Net asset value, end of period | $ | | 10.52 | | 10.51 | | 10.51 | | 10.52 | |
Total Return(2) | % | 5.43 | | 5.35 | | 5.23 | | 5.46 | |
| | | | | | | | | |
Ratios and Supplemental Data: | | | | | | | | | |
Net assets, end of period (000’s) | $ | | 16,729 | | 120 | | 3,120 | | 1 | |
Ratios to average net assets: | | | | | | | | | |
Net expenses after expense reimbursement(3)(4) | % | 1.50 | | 2.25 | | 2.25 | | 1.25 | |
Gross expenses prior to expense reimbursement(4) | % | 3.11 | | 3.86 | | 3.86 | | 2.86 | |
Net investment income after expense reimbursement(3)(4) | % | 1.42 | | 1.65 | | 1.40 | | 1.63 | |
Portfolio turnover rate(5) | % | 1 | | 1 | | 1 | | 1 | |
| | | | | | | | | | | | | | | |
(1) Commencement of operations.
(2) Total return is calculated assuming reinvestment of dividends and capital gain distributions at net asset value and excluding the deduction of sales charge. Total return for less than one year is not annualized.
(3) The investment manager has agreed to limit expenses, (excluding interest, taxes, brokerage and extraordinary expenses) subject to possible recoupment by ING Investments, LLC within three years of being incurred.
(4) Annualized for periods less than one year.
(5) Not Annualized.
* Per share data calculated using average number of shares outstanding throughout the period.
See Accompanying Notes to Financial Statements
86
ING INTERNATIONAL SMALLCAP FUND (UNAUDITED) | FINANCIAL HIGHLIGHTS |
Selected data for a share of beneficial interest outstanding throughout each period.
| | Class A | |
| | Six Months
Ended
April 30, | | Year Ended October 31, | |
| | 2006 | | 2005 | | 2004 | | 2003 | | 2002 | | 2001 | |
Per Share Operating Performance: | | | | | | | |
Net asset value, beginning of period | $ | | 37.75 | | 29.27 | | 25.37 | | 18.35 | | 21.85 | | 36.08 | |
Income (loss) from investment operations: | | | | | | | | | | | | | |
Net investment income (loss) | $ | | 0.12 | | 0.33 | ** | 0.02 | | 0.01 | | (0.07 | ) | (0.11 | ) |
Net realized and unrealized gain (loss) on investments | $ | | 11.05 | | 8.05 | ** | 3.86 | | 7.01 | | (3.43 | ) | (11.39 | ) |
Total from investment operations | $ | | 11.17 | | 8.38 | | 3.88 | | 7.02 | | (3.50 | ) | (11.50 | ) |
Less distributions from: | | | | | | | | | | | | | |
Net investment income | $ | | 0.33 | | — | | 0.00 | * | — | | — | | 0.24 | |
Net realized gain on investments | $ | | — | | — | | — | | — | | — | | 2.49 | |
Total distributions | $ | | 0.33 | | — | | 0.00 | * | — | | — | | 2.73 | |
Payment by affiliate | $ | | — | | 0.10 | | 0.02 | | — | | — | | — | |
Net asset value, end of period | $ | | 48.59 | | 37.75 | | 29.27 | | 25.37 | | 18.35 | | 21.85 | |
Total Return(1) | % | 29.76 | | 28.97 | †† | 15.39 | † | 38.26 | | (16.02 | ) | (34.30 | ) |
| | | | | | | | | | | | | |
Ratios and Supplemental Data: | | | | | | | | | | | | | |
Net assets, end of period (000’s) | $ | | 252,420 | | 173,612 | | 154,658 | | 150,043 | | 123,206 | | 153,804 | |
Ratios to average net assets: | | | | | | | | | | | | | |
Net expenses after expense reimbursement/recoupment(2)(3) | % | 1.69 | | 1.74 | | 1.75 | | 1.95 | | 1.95 | | 1.83 | |
Gross expenses prior to expense reimbursement/recoupment(3) | % | 1.69 | | 1.74 | | 1.72 | | 1.94 | | 1.99 | | 1.83 | |
Net investment income (loss) after expense reimbursement/recoupment(2)(3) | % | 0.59 | | 0.98 | | 0.07 | | 0.00 | | (0.32 | ) | (0.33 | ) |
Portfolio turnover rate | % | 35 | | 124 | | 106 | | 114 | | 149 | | 143 | |
| | | | | | | | | | | | | | | | | | | | |
| | Class B | |
| | Six Months
Ended
April 30, | | Year Ended October 31, | |
| | 2006 | | 2005 | | 2004 | | 2003 | | 2002 | | 2001 | |
Per Share Operating Performance: | | | | | | | |
Net asset value, beginning of period | $ | | 38.83 | | 30.30 | | 26.43 | | 19.25 | | 23.06 | | 38.05 | |
Income (loss) from investment operations: | | | | | | | | | | | | | |
Net investment income (loss) | $ | | (0.02 | ) | 0.10 | ** | (0.19 | ) | (0.24 | ) | (0.32 | ) | (0.32 | ) |
Net realized and unrealized gain (loss) on investments | $ | | 11.40 | | 8.33 | ** | 4.04 | | 7.42 | | (3.49 | ) | (11.98 | ) |
Total from investment operations | $ | | 11.38 | | 8.43 | | 3.85 | | 7.18 | | (3.81 | ) | (12.30 | ) |
Less distributions from: | | | | | | | | | | | | | |
Net investment income | $ | | 0.04 | | — | | — | | — | | — | | 0.07 | |
Net realized gain on investments | $ | | — | | — | | — | | — | | — | | 2.62 | |
Total distributions | $ | | 0.04 | | — | | — | | — | | — | | 2.69 | |
Payment by affiliate | $ | | — | | 0.10 | | 0.02 | | — | | — | | — | |
Net asset value, end of period | $ | | 50.17 | | 38.83 | | 30.30 | | 26.43 | | 19.25 | | 23.06 | |
Total Return(1) | % | 29.32 | | 28.15 | †† | 14.64 | † | 37.30 | | (16.52 | ) | (34.59 | ) |
| | | | | | | | | | | | | |
Ratios and Supplemental Data: | | | | | | | | | | | | | |
Net assets, end of period (000’s) | $ | | 68,928 | | 57,131 | | 58,318 | | 62,104 | | 52,661 | | 74,541 | |
Ratios to average net assets: | | | | | | | | | | | | | |
Net expenses after expense reimbursement/recoupment(2)(3) | % | 2.34 | | 2.39 | | 2.40 | | 2.60 | | 2.60 | | 2.48 | |
Gross expenses prior to expense reimbursement/recoupment(3) | % | 2.34 | | 2.39 | | 2.37 | | 2.59 | | 2.63 | | 2.48 | |
Net investment income (loss) after expense reimbursement/recoupment(2)(3) | % | (0.16 | ) | 0.29 | | (0.60 | ) | (0.68 | ) | (0.98 | ) | (0.98 | ) |
Portfolio turnover rate | % | 35 | | 124 | | 106 | | 114 | | 149 | | 143 | |
| | | | | | | | | | | | | | | | | | | | |
(1) Total return is calculated assuming reinvestment of all dividends and capital gain distributions at net asset value and excluding the deduction of sales charges. Total return for less than one year is not annualized.
(2) The Investment Manager has agreed to limit expenses, (excluding interest, taxes, brokerage and extraordinary expenses) subject to possible recoupment by ING Investments, LLC within three years of being incurred.
(3) Annualized for periods less than one year.
* Amount represents less than $0.005 per share.
** Per share data calculated using average number of shares outstanding throughout the period.
† In 2004, the Sub-Adviser fully reimbursed the Fund for a loss incurred from a transaction not meeting the Fund’s investment guidelines, which otherwise would have reduced total return by 0.07%.
†† In 2005, 0.34% and 0.33% of the total return on Class A and Class B, respectively, consists of a payment by affiliate. Excluding this item, total return would have been 28.63% and 27.82% on Class A and Class B, respectively.
See Accompanying Notes to Financial Statements
87
ING INTERNATIONAL SMALLCAP FUND (UNAUDITED) (CONTINUED) | FINANCIAL HIGHLIGHTS |
Selected data for a share of beneficial interest outstanding throughout each period.
| | Class C | |
| | Six Months Ended
April 30, | | Year Ended October 31, | |
| | 2006 | | 2005 | | 2004 | | 2003 | | 2002 | | 2001 | |
Per Share Operating Performance: | | | | | | | |
Net asset value, beginning of period | $ | | 35.59 | | 27.77 | | 24.23 | | 17.65 | | 21.14 | | 34.93 | |
Income (loss) from investment operations: | | | | | | | | | | | | | |
Net investment income (loss) | $ | | (0.02 | ) | 0.10 | * | (0.17 | ) | (0.29 | ) | (0.32 | ) | (0.38 | ) |
Net realized and unrealized gain (loss) on investments | $ | | 10.44 | | 7.62 | * | 3.70 | | 6.87 | | (3.17 | ) | (10.91 | ) |
Total from investment operations | $ | | 10.42 | | 7.72 | | 3.53 | | 6.58 | | (3.49 | ) | (11.29 | ) |
Less distributions from: | | | | | | | | | | | | | |
Net investment income | $ | | 0.11 | | — | | — | | — | | — | | 0.09 | |
Net realized gain on investments | $ | | — | | — | | — | | — | | — | | 2.41 | |
Total distributions | $ | | 0.11 | | — | | — | | — | | — | | 2.50 | |
Payment by affiliate | $ | | — | | 0.10 | | 0.01 | | — | | — | | — | |
Net asset value, end of period | $ | | 45.90 | | 35.59 | | 27.77 | | 24.23 | | 17.65 | | 21.14 | |
Total Return(1) | % | 29.35 | | 28.16 | †† | 14.61 | †† | 37.28 | | (16.51 | ) | (34.62 | ) |
| | | | | | | | | | | | | |
Ratios and Supplemental Data: | | | | | | | | | | | | | |
Net assets, end of period (000’s) | $ | | 70,970 | | 52,420 | | 47,793 | | 50,227 | | 46,703 | | 69,320 | |
Ratios to average net assets: | | | | | | | | | | | | | |
Net expenses after expense reimbursement/recoupment(2)(3) | % | 2.34 | | 2.39 | | 2.40 | | 2.60 | | 2.60 | | 2.48 | |
Gross expenses prior to expense reimbursement/recoupment(3) | % | 2.34 | | 2.39 | | 2.37 | | 2.59 | | 2.63 | | 2.48 | |
Net investment income (loss) after expense reimbursement/recoupment(2)(3) | % | (0.09 | ) | 0.30 | | (0.60 | ) | (0.68 | ) | (0.99 | ) | (0.98 | ) |
Portfolio turnover rate | % | 35 | | 124 | | 106 | | 114 | | 149 | | 143 | |
| | | | | | | | | | | | | | | | | | | | |
| | Class I | |
| | December 21,
2005(4) to
April 30, | |
| | 2006 | |
Per Share Operating Performance: | | | |
Net asset value, beginning of period | $ | | 40.64 | |
Income from investment operations: | | | |
Net investment income | $ | | 0.52 | |
Net realized and unrealized gain on investments | $ | | 7.52 | |
Total from investment operations | $ | | 8.04 | |
Net asset value, end of period | $ | | 48.68 | |
Total Return(1) | % | 19.78 | |
| | | |
Ratios and Supplemental Data: | | | |
Net assets, end of period (000’s) | $ | | 18,081 | |
Ratios to average net assets: | | | |
Net expenses after expense reimbursement/recoupment(2)(3) | % | 1.20 | |
Gross expenses prior to expense reimbursement/recoupment(3) | % | 1.20 | |
Net investment income after expense reimbursement/recoupment(2)(3) | % | 3.20 | |
Portfolio turnover rate | % | 35 | |
| | | | | |
(1) Total return is calculated assuming reinvestment of all dividends and capital gain distributions at net asset value and excluding the deduction of sales charges. Total return for less than one year is not annualized.
(2) The Investment Manager has agreed to limit expenses, (excluding interest, taxes, brokerage and extraordinary expenses) subject to possible recoupment by ING Investments, LLC within three years of being incurred.
(3) Annualized for periods less than one year.
(4) Commencement of operations.
* Per share data calculated using average number of shares outstanding throughout the period.
† In 2004, the Sub-Adviser fully reimbursed the Fund for a loss incurred from a transaction not meeting the Fund’s investment guidelines, which otherwise would have reduced total return by 0.04%.
†† In 2005, 0.36% of the total return consists of a payment by affiliate. Excluding this item, total return would have been 27.80%.
See Accompanying Notes to Financial Statements
88
ING INTERNATIONAL SMALLCAP FUND (UNAUDITED) (CONTINUED) | FINANCIAL HIGHLIGHTS |
Selected data for a share of beneficial interest outstanding throughout each period.
| | Class Q | |
| | Six Months
Ended
April 30, | | Year Ended October 31, | |
| | 2006 | | 2005 | | 2004 | | 2003 | | 2002 | | 2001 | |
Per Share Operating Performance: | | | | | | �� | |
Net asset value, beginning of period | $ | | 40.53 | | 31.34 | | 27.11 | | 19.54 | | 23.19 | | 38.18 | |
Income (loss) from investment operations: | | | | | | | | | | | | | |
Net investment income | $ | | 0.17 | | 0.43 | * | 0.10 | | 0.21 | | 0.04 | | 0.00 | * |
Net realized and unrealized gain (loss) on investments | $ | 11.86 | | 8.66 | | 4.13 | | 7.36 | | (3.69 | ) | (12.12 | ) |
Total from investment operations | $ | | 12.03 | | 9.09 | | 4.23 | | 7.57 | | (3.65 | ) | (12.12 | ) |
Less distributions from: | | | | | | | | | | | | | |
Net investment income | $ | | 0.41 | | — | | 0.01 | | — | | — | | 0.24 | |
Net realized gains on investments | $ | | — | | — | | — | | — | | — | | 2.63 | |
Total distributions | $ | | 0.41 | | — | | 0.01 | | — | | — | | 2.87 | |
Payment by affiliate | $ | | — | | 0.10 | | 0.01 | | — | | — | | — | |
Net asset value, end of period | $ | | 52.15 | | 40.53 | | 31.34 | | 27.11 | | 19.54 | | 23.19 | |
Total Return(1) | % | 29.88 | | 29.32 | †† | 15.66 | † | 38.74 | | (15.74 | ) | (34.11 | ) |
| | | | | | | | | | | | | |
Ratios and Supplemental Data: | | | | | | | | | | | | | |
Net assets, end of period (000’s) | $ | | 83,653 | | 57,846 | | 61,166 | | 79,140 | | 70,404 | | 91,089 | |
Ratios to average net assets: | | | | | | | | | | | | | |
Net expenses after expense reimbursement/recoupment(2)(3) | % | 1.47 | | 1.49 | | 1.50 | | 1.59 | | 1.55 | | 1.50 | |
Gross expenses prior to expense reimbursement/recoupment(3) | % | 1.47 | | 1.49 | | 1.47 | | 1.58 | | 1.59 | | 1.50 | |
Net investment income (loss) after expense reimbursement/recoupment(2)(3) | % | 0.80 | | 1.18 | | 0.28 | | 0.35 | | 0.07 | | 0.04 | |
Portfolio turnover rate | % | 35 | | 124 | | 106 | | 114 | | 149 | | 143 | |
| | | | | | | | | | | | | | | | | | | | |
(1) Total return is calculated assuming reinvestment of all dividends and capital gain distributions at net asset value and excluding the deduction of sales charges. Total return for less than one year is not annualized.
(2) The Investment Manager has agreed to limit expenses, (excluding interest, taxes, brokerage and extraordinary expenses) subject to possible recoupment by ING Investments, LLC within three years of being incurred.
(3) Annualized for periods less than one year.
* Per share data calculated using average number of shares outstanding throughout the period.
† In 2004, the Sub-Adviser fully reimbursed the Fund for a loss incurred from a transaction not meeting the Fund’s investment guidelines, which otherwise would have reduced total return by 0.04%.
†† In 2005, 0.36% of the total return consists of a payment by affiliate. Excluding this item, total return would have been 27.80%.
See Accompanying Notes to Financial Statements
89
ING INTERNATIONAL VALUE FUND (UNAUDITED) | FINANCIAL HIGHLIGHTS |
Selected data for a share of beneficial interest outstanding throughout each period.
| | Class A | |
| | Six Months
Ended
April 30, | | Year Ended October 31, | |
| | 2006 | | 2005 | | 2004 | | 2003 | | 2002 | | 2001 | |
Per Share Operating Performance: | | | | | | | | | | | | | |
Net asset value, beginning of period | $ | | 18.33 | | 16.90 | | 13.71 | | 10.40 | | 12.33 | | 16.68 | |
Income (loss) from investment operations: | | | | | | | | | | | | | |
Net investment income | $ | | 0.10 | ** | 0.17 | | 0.13 | | 0.08 | | 0.06 | | 0.11 | |
Net realized and unrealized gain (loss) on investments | $ | | 3.90 | | 2.28 | | 3.15 | | 3.48 | | (1.64 | ) | (2.44 | ) |
Total from investment operations | $ | | 4.00 | | 2.45 | | 3.28 | | 3.56 | | (1.58 | ) | (2.33 | ) |
Less distributions from: | | | | | | | | | | | | | |
Net investment income | $ | | 0.16 | | 0.22 | | 0.09 | | 0.05 | | 0.09 | | 0.14 | |
Net realized gain on investments | $ | | 1.41 | | 0.80 | | — | | 0.20 | | 0.26 | | 1.88 | |
Total distributions | $ | | 1.57 | | 1.02 | | 0.09 | | 0.25 | | 0.35 | | 2.02 | |
Payment by affiliate | $ | | — | | 0.00 | * | — | | — | | — | | — | |
Net asset value, end of period | $ | | 20.76 | | 18.33 | | 16.90 | | 13.71 | | 10.40 | | 12.33 | |
Total Return(1) | % | 23.13 | | 15.06 | † | 24.03 | | 35.11 | | (13.31 | ) | (15.89 | ) |
| | | | | | | | | | | | | |
Ratios and Supplemental Data: | | | | | | | | | | | | | |
Net assets, end of period (000’s) | $ | 2,018,326 | | 1,732,332 | | 1,869,868 | | 1,641,943 | | 1,356,334 | | 920,591 | |
Ratios to average net assets: | | | | | | | | | | | | | |
Expenses(2) | % | 1.60 | | 1.60 | | 1.61 | | 1.74 | | 1.76 | | 1.67 | |
Net investment income(2) | % | 1.01 | | 0.88 | | 0.79 | | 0.66 | | 0.58 | | 0.88 | |
Portfolio turnover rate | % | 15 | | 21 | | 29 | | 9 | | 20 | | 15 | |
| | | | | | | | | | | | | | | | | | | | |
| | Class B | |
| | Six Months
Ended
April 30, | | Year Ended October 31, | |
| | 2006 | | 2005 | | 2004 | | 2003 | | 2002 | | 2001 | |
Per Share Operating Performance: | | | | | | | | | | | | | |
Net asset value, beginning of period | $ | | 17.95 | | 16.58 | | 13.45 | | 10.23 | | 12.13 | | 16.43 | |
Income (loss) from investment operations: | | | | | | | | | | | | | |
Net investment income (loss) | $ | | 0.03 | | 0.05 | | 0.02 | | (0.00 | )* | (0.02 | ) | 0.02 | |
Net realized and unrealized gain (loss) on investments | $ | | 3.84 | | 2.23 | | 3.11 | | 3.42 | | (1.62 | ) | (2.41 | ) |
Total from investment operations | $ | | 3.87 | | 2.28 | | 3.13 | | 3.42 | | (1.64 | ) | (2.39 | ) |
Less distributions from: | | | | | | | | | | | | | |
Net investment income | $ | | 0.01 | | 0.11 | | — | | — | | 0.00 | * | 0.03 | |
Net realized gain on investments | $ | | 1.41 | | 0.80 | | — | | 0.20 | | 0.26 | | 1.88 | |
Total distributions | $ | | 1.42 | | 0.91 | | — | | 0.20 | | 0.26 | | 1.91 | |
Payment by affiliate | $ | | — | | 0.00 | * | — | | — | | — | | — | |
Net asset value, end of period | $ | | 20.40 | | 17.95 | | 16.58 | | 13.45 | | 10.23 | | 12.13 | |
Total Return(1) | % | 22.78 | | 14.21 | † | 23.27 | | 34.11 | | (13.90 | ) | (16.48 | ) |
| | | | | | | | | | | | | |
Ratios and Supplemental Data: | | | | | | | | | | | | | |
Net assets, end of period (000’s) | $ | | 423,639 | | 411,071 | | 454,952 | | 420,651 | | 375,967 | | 421,884 | |
Ratios to average net assets: | | | | | | | | | | | | | |
Expenses(2) | % | 2.30 | | 2.30 | | 2.31 | | 2.44 | | 2.45 | | 2.37 | |
Net investment income (loss)(2) | % | 0.25 | | 0.17 | | 0.09 | | (0.04 | ) | (0.13 | ) | 0.16 | |
Portfolio turnover rate | % | 15 | | 21 | | 29 | | 9 | | 20 | | 15 | |
| | | | | | | | | | | | | | | | | | | | |
(1) Total return is calculated assuming reinvestment of all dividends and capital gain distributions at net asset value and excluding the deduction of sales charges. Total return for less than one year is not annualized.
(2) Annualized for periods less than one year.
* Amount represents less than $0.005 per share.
** Per share data calculated using average number of shares outstanding throughout the period.
† In 2005, there was no impact on total return due to payment by affiliate.
See Accompanying Notes to Financial Statements
90
ING INTERNATIONAL VALUE FUND (UNAUDITED) (CONTINUED) | | FINANCIAL HIGHLIGHTS |
Selected data for a share of beneficial interest outstanding throughout each period.
| | Class C | |
| | Six Months
Ended
April 30, | | Year Ended October 31, | |
| | 2006 | | 2005 | | 2004 | | 2003 | | 2002 | | 2001 | |
Per Share Operating Performance: | | | | | | | | |
Net asset value, beginning of period | $ | | 17.91 | | 16.54 | | 13.42 | | 10.21 | | 12.10 | | 16.41 | |
Income (loss) from investment operations: | | | | | | | | | | | | | |
Net investment income (loss) | $ | | 0.03 | | 0.04 | | 0.02 | | (0.00 | )* | (0.02 | ) | 0.02 | |
Net realized and unrealized gain (loss) on investments | $ | | 3.82 | | 2.24 | | 3.10 | | 3.41 | | (1.61 | ) | (2.41 | ) |
Total from investment operations | $ | | 3.85 | | 2.28 | | 3.12 | | 3.41 | | (1.63 | ) | (2.39 | ) |
Less distributions from: | | | | | | | | | | | | | |
Net investment income | $ | | 0.03 | | 0.11 | | — | | — | | 0.00 | * | 0.04 | |
Net realized gain on investments | $ | | 1.41 | | 0.80 | | — | | 0.20 | | 0.26 | | 1.88 | |
Total distributions | $ | | 1.44 | | 0.91 | | — | | 0.20 | | 0.26 | | 1.92 | |
Payment by affiliate | $ | �� | — | | 0.00 | ** | — | | — | | — | | — | |
Net asset value, end of period | $ | | 20.32 | | 17.91 | | 16.54 | | 13.42 | | 10.21 | | 12.10 | |
Total Return(1) | % | 22.73 | | 14.25 | † | 23.25 | | 34.08 | | (13.85 | ) | (16.52 | ) |
| | | | | | | | | | | | | |
Ratios and Supplemental Data: | | | | | | | | | | | | | |
Net assets, end of period (000’s) | $ | | 750,843 | | 663,626 | | 675,039 | | 628,704 | | 573,712 | | 603,229 | |
Ratios to average net assets: | | | | | | | | | | | | | |
Expenses(3) | % | 2.30 | | 2.30 | | 2.31 | | 2.44 | | 2.46 | | 2.37 | |
Net investment income (loss)(3) | % | 0.30 | | 0.15 | | 0.09 | | (0.04 | ) | (0.13 | ) | 0.16 | |
Portfolio turnover rate | % | 15 | | 21 | | 29 | | 9 | | 20 | | 15 | |
| | | | | | | | | | | | | | | | | | | |
| | Class I | |
| | Six Months
Ended
April 30, | | Year Ended October 31, | | June 18,
2001 to
October 31, | |
| | 2006 | | 2005 | | 2004 | | 2003 | | 2002 | | 2001(2) | |
Per Share Operating Performance: | | | | | | | | | | | | | |
Net asset value, beginning of period | $ | 18.38 | | 16.96 | | 13.74 | | 10.43 | | 12.35 | | 13.89 | |
Income (loss) from investment operations: | | | | | | | | | | | | | |
Net investment income | $ | 0.14 | * | 0.20 | | 0.16 | | 0.13 | | 0.16 | | 0.02 | |
Net realized and unrealized gain (loss) on investments | $ | 3.90 | | 2.31 | | 3.20 | | 3.48 | | (1.68 | ) | (1.56 | ) |
Total from investment operations | $ | 4.04 | | 2.51 | | 3.36 | | 3.61 | | (1.52 | ) | (1.54 | ) |
Less distributions from: | | | | | | | | | | | | | |
Net investment income | $ | 0.23 | | 0.29 | | 0.14 | | 0.10 | | 0.14 | | — | |
Net realized gains on investments | $ | 1.41 | | 0.80 | | — | | 0.20 | | 0.26 | | — | |
Total distributions | $ | 1.64 | | 1.09 | | 0.14 | | 0.30 | | 0.40 | | — | |
Payment by affiliate | $ | — | | 0.00 | ** | — | | — | | — | | — | |
Net asset value, end of period | $ | 20.78 | | 18.38 | | 16.96 | | 13.74 | | 10.43 | | 12.35 | |
Total Return(1) | % | 23.40 | | 15.42 | † | 24.67 | | 35.58 | | (12.89 | ) | (11.09 | ) |
| | | | | | | | | | | | | |
Ratios and Supplemental Data: | | | | | | | | | | | | | |
Net assets, end of period (000’s) | $ | 1,575,914 | | 1,221,594 | | 831,142 | | 482,047 | | 372,352 | | 226,067 | |
Ratios to average net assets: | | | | | | | | | | | | | |
Expenses(3) | % | 1.23 | | 1.23 | | 1.21 | | 1.29 | | 1.32 | | 1.24 | |
Net investment income(3) | % | 1.44 | | 1.18 | | 1.18 | | 1.12 | | 1.04 | | 0.62 | |
Portfolio turnover rate | % | 15 | | 21 | | 29 | | 9 | | 20 | | 15 | |
(1) Total return is calculated assuming reinvestment of all dividends and capital gain distributions at net asset value and excluding the deduction of sales charges. Total return for less than one year is not annualized.
† In 2005, there was no impact on total return due to payment by affiliate.
(2) Commencement of operations.
(3) Annualized for periods less than one year.
* Per share data calculated using average number of shares outstanding throughout the period.
** Amount represents less than $0.005 per share.
See Accompanying Notes to Financial Statements
91
ING INTERNATIONAL VALUE FUND (UNAUDITED) (CONTINUED) | | FINANCIAL HIGHLIGHTS |
Selected data for a share of beneficial interest outstanding throughout each period.
| | Class Q | |
| | Six Months Ended
April 30, | | Year Ended October 31, | |
| | 2006 | | 2005 | | 2004 | | 2003 | | 2002 | | 2001 | |
Per Share Operating Performance: | | | | | | | | | | | | | |
Net asset value, beginning of period | $ | 18.37 | | 16.94 | | 13.73 | | 10.44 | | 12.34 | | 16.68 | |
Income (loss) from investment operations: | | | | | | | | | | | | | |
Net investment income | $ | 0.11 | | 0.19 | | 0.14 | | 0.10 | | 0.07 | | 0.10 | |
Net realized and unrealized gain (loss) on investments | $ | 3.91 | | 2.29 | | 3.17 | | 3.49 | | (1.63 | ) | (2.42 | ) |
Total from investment operations | $ | 4.02 | | 2.48 | | 3.31 | | 3.59 | | (1.56 | ) | (2.32 | ) |
Less distributions from: | | | | | | | | | | | | | |
Net investment income | $ | 0.18 | | 0.25 | | 0.10 | | 0.10 | | 0.08 | | 0.14 | |
Net realized gains on investments | $ | 1.41 | | 0.80 | | — | | 0.20 | | 0.26 | | 1.88 | |
Total distributions | $ | 1.59 | | 1.05 | | 0.10 | | 0.30 | | 0.34 | | 2.02 | |
Payment by affiliate | $ | — | | 0.00 | * | — | | — | | — | | — | |
Net asset value, end of period | $ | 20.79 | | 18.37 | | 16.94 | | 13.73 | | 10.44 | | 12.34 | |
Total Return(1) | % | 23.19 | | 15.20 | † | 24.32 | | 35.37 | | (13.11 | ) | (15.80 | ) |
| | | | | | | | | | | | | |
Ratios and Supplemental Data: | | | | | | | | | | | | | |
Net assets, end of period (000’s) | $ | 30,063 | | 27,993 | | 28,862 | | 29,319 | | 29,836 | | 35,802 | |
Ratios to average net assets: | | | | | | | | | | | | | |
Expenses(2) | % | 1.48 | | 1.48 | | 1.46 | | 1.54 | | 1.49 | | 1.59 | |
Net investment income(2) | % | 1.11 | | 0.99 | | 0.89 | | 0.87 | | 0.63 | | 0.91 | |
Portfolio turnover rate | % | 15 | | 21 | | 29 | | 9 | | 20 | | 15 | |
(1) Total return is calculated assuming reinvestment of all dividends and capital gain distributions at net asset value. Total return for less than one year is not annualized.
(2) Annualized for periods less than one year.
* Amount represents less than $0.005 per share.
† In 2005, there was no impact on total return due to payment by affiliate.
See Accompanying Notes to Financial Statements
92
ING INTERNATIONAL VALUE CHOICE FUND (UNAUDITED) | | FINANCIAL HIGHLIGHTS |
Selected data for a share of beneficial interest outstanding throughout each period.
| | Class A | | Class B | | Class C | | Class I | |
| | Six Months Ended
April 30,
2006 | | February 1,
2005(1) to
October 31,
2005 | | Six Months
Ended
April 30,
2006 | | February 1,
2005(1) to
October 31, 2005 | | Six Months
Ended
April 30,
2006 | | February 4,
2005(1) to
October 31,
2005 | | December 21 2005(1) to
April 30,
2006 | |
Per Share Operating Performance: | | |
Net asset value, beginning of period | $ | 10.70 | | 10.00 | | 10.65 | | 10.00 | | 10.66 | | 10.01 | | 11.04 | |
Income (loss) from investment operations: | | | | | | | | | | | | | | | |
Net investment income | $ | 0.08 | | 0.11 | * | 0.04 | | 0.04 | * | 0.03 | | 0.04 | * | 0.17 | |
Net realized and unrealized gain (loss) on investments | $ | 1.87 | | 0.59 | * | 1.83 | | 0.61 | * | 1.86 | | 0.61 | * | 1.17 | |
Total from investment operations | $ | 1.95 | | 0.70 | | 1.87 | | 0.65 | | 1.89 | | 0.65 | | 1.34 | |
Less distributions from: | | | | | | | | | | | | | | | |
Net investment income | $ | 0.10 | | — | | 0.08 | | — | | 0.08 | | — | | — | |
Net realized gain on investments | $ | 0.16 | | — | | 0.16 | | — | | 0.16 | | — | | — | |
Total distributions | $ | 0.26 | | — | | 0.24 | | — | | 0.24 | | — | | — | |
Net asset value, end of period | $ | 12.39 | | 10.70 | | 12.28 | | 10.65 | | 12.31 | | 10.66 | | 12.38 | |
Total Return(2) | % | 18.53 | | 7.00 | | 17.86 | | 6.50 | | 17.97 | | 6.49 | | 12.14 | |
| | | | | | | | | | | | | | | |
Ratios and Supplemental Data: | | | | | | | | | | | | | | | |
Net assets, end of period (000’s) | $ | 13,446 | | 6,115 | | 3,261 | | 1,427 | | 3,553 | | 1,796 | | 16,690 | |
Ratios to average net assets: | | | | | | | | | | | | | | | |
Net expenses after brokerage | | | | | | | | | | | | | | | |
commission recapture and expense | | | | | | | | | | | | | | | |
reimbursement(3)(4) | % | 1.68 | | 1.70 | | 2.43 | | 2.45 | | 2.43 | | 2.45 | | 1.38 | |
Net expenses after expense reimbursement and prior to brokerage commission recapture(3)(4) | % | 1.70 | | 1.70 | | 2.45 | | 2.45 | | 2.45 | | 2.45 | | 1.40 | |
Gross expenses prior to brokerage commission recapture and expense reimbursement(3) | % | 2.47 | | 3.44 | | 3.22 | | 4.19 | | 3.22 | | 4.19 | | 2.18 | |
Net investment income(3)(4) | % | 1.46 | | 1.08 | | 0.67 | | 0.36 | | 0.59 | | 0.35 | | 5.69 | |
Portfolio turnover rate | % | 13 | | 24 | | 13 | | 24 | | 13 | | 24 | | 13 | |
| | | | | | | | | | | | | | | | | | | | | | |
(1) Commencement of operations.
(2) Total return is calculated assuming reinvestment of all dividends and capital gain distributions at net asset value and excluding the deduction of sales charges. Total return for less than one year is not annualized.
(3) Annualized for periods less than one year.
(4) The Investment Manager has agreed to limit expenses, (excluding interest, taxes, brokerage and extraordinary expenses) subject to possible recoupment by ING Investments, LLC within three years of being incurred.
* Per share data calculated using average number of shares outstanding throughout the period.
See Accompanying Notes to Financial Statements
93
ING PRECIOUS METALS FUND (UNAUDITED) | | FINANCIAL HIGHLIGHTS |
Selected data for a share of beneficial interest outstanding throughout each period.
| | Class A | |
| | Six Months Ended
April 30, | | Year Ended October 31, | |
| | 2006 | | 2005 | | 2004 | | 2003 | | 2002 | | 2001 | |
Per Share Operating Performance: | | | | | | | | | | | | | |
Net asset value, beginning of period | $ | 7.34 | | 7.09 | | 6.94 | | 4.40 | | 3.05 | | 2.27 | |
Income (loss) from investment operations: | | | | | | | | | | | | | |
Net investment income (loss) | $ | (0.03 | ) | (0.06 | ) | (0.05 | ) | (0.02 | ) | (0.01 | ) | 0.02 | |
Net realized and unrealized gain on investments | $ | 4.86 | | 0.54 | | 0.20 | | 2.56 | | 1.38 | | 0.76 | |
Total from investment operations | $ | 4.83 | | 0.48 | | 0.15 | | 2.54 | | 1.37 | | 0.78 | |
Less distributions from: | | | | | | | | | | | | | |
Net investment income | $ | 0.02 | | 0.23 | | — | | — | | 0.02 | | 0.00 | * |
Total distributions | $ | 0.02 | | 0.23 | | — | | — | | 0.02 | | 0.00 | * |
Net asset value, end of period | $ | 12.15 | | 7.34 | | 7.09 | | 6.94 | | 4.40 | | 3.05 | |
Total Return(1) | % | 65.82 | | 6.81 | | 2.16 | | 57.73 | | 45.01 | | 34.56 | |
| | | | | | | | | | | | | |
Ratios and Supplemental Data: | | | | | | | | | | | | | |
Net assets, end of period (000’s) | $ | 145,832 | | 87,441 | | 91,756 | | 101,696 | | 72,346 | | 60,563 | |
Ratios to average net assets: | | | | | | | | | | | | | |
Expenses(2) | % | 1.44 | | 1.56 | | 1.44 | | 1.57 | | 1.73 | | 1.96 | |
Net investment income (loss)(2) | % | (0.61 | ) | (0.77 | ) | (0.69 | ) | (0.36 | ) | (0.33 | ) | 0.67 | |
Portfolio turnover rate | % | 49 | | 78 | | 77 | | 94 | | 54 | | 83 | |
(1) Total return is calculated assuming reinvestment of all dividends and capital gain distributions at net asset value and excluding the deduction of sales charges. Total return for less than one year is not annualized.
(2) Annualized for periods less than one year.
* Amount represents less than $0.005 per share
See Accompanying Notes to Financial Statements
94
ING RUSSIA FUND (UNAUDITED) | | FINANCIAL HIGHLIGHTS |
Selected data for a share of beneficial interest outstanding throughout each period.
| | Class A | |
| | Six Months Ended
April 30, | | Year Ended October 31, | |
| | 2006 | | 2005 | | 2004 | | 2003 | | 2002 | | 2001 | |
Per Share Operating Performance: | | | | | | | | | | | | | |
Net asset value, beginning of period | $ | 33.49 | | 25.01 | | 19.13 | | 12.15 | | 8.04 | | 7.15 | |
Income (loss) from investment operations: | | | | | | | | | | | | | |
Net investment income (loss) | $ | (0.18 | ) | (0.00 | )* | 0.04 | | (0.00 | )* | 0.17 | | (0.04 | ) |
Net realized and unrealized gain on investments | $ | 21.38 | | 8.39 | | 5.69 | | 7.06 | | 3.92 | | 0.93 | |
Total from investment operations | $ | 21.20 | | 8.39 | | 5.73 | | 7.06 | | 4.09 | | 0.89 | |
Less distributions from: | | | | | | | | | | | | | |
Net investment income | $ | — | | 0.01 | | 0.02 | | 0.12 | | — | | — | |
Total distributions | $ | — | | 0.01 | | 0.02 | | 0.12 | | — | | — | |
Redemption fees applied to capital | $ | — | | 0.10 | | 0.17 | | 0.04 | | 0.02 | | — | |
Net asset value, end of period | $ | 54.69 | | 33.49 | | 25.01 | | 19.13 | | 12.15 | | 8.04 | |
Total Return(1) | % | 63.30 | | 33.98 | | 30.88 | | 58.98 | | 51.12 | | 12.45 | |
| | | | | | | | | | | | | |
Ratios and Supplemental Data: | | | | | | | | | | | | | |
Net assets, end of period (000’s) | $ | 731,423 | | 271,603 | | 212,180 | | 161,601 | | 85,658 | | 49,019 | |
Ratios to average net assets: | | | | | | | | | | | | | |
Net expenses after expense reimbursement(2)(3) | % | 2.03 | | 2.13 | | 2.01 | | 2.09 | | 1.77 | | 2.23 | |
Gross expenses prior to expense
reimbursement(2) | % | 2.03 | | 2.13 | | 2.01 | | 2.09 | | 2.20 | | 2.77 | |
Net investment income (loss) after expense reimbursement(2)(3) | % | (1.05) | | (0.01 | ) | 0.15 | | (0.02 | ) | 1.33 | | (0.56 | ) |
Portfolio turnover rate | % | 7 | | 26 | | 54 | | 23 | | 32 | | 28 | |
(1) Total return is calculated assuming reinvestment of all dividends and capital gain distributions at net asset value and excluding the deduction of sales charges. Total return for less than one year is not annualized.
(2) Annualized for periods less than one year.
(3) The Investment Manager has agreed to limit expenses, (excluding interest, taxes, brokerage and extraordinary expenses) subject to possible recoupment by ING Investments, LLC within three years of being incurred.
* Amount is less than $0.005 per share.
See Accompanying Notes to Financial Statements
95
ING EMERGING MARKETS FIXED INCOME FUND | | FINANCIAL HIGHLIGHTS |
Selected data for a share of beneficial interest outstanding throughout each period.
| | Class A | | Class B | | Class C | | Class I | |
| | December 21, 2005(1) to
April 30,
2006 | | January 4, 2006(1) to
April 30,
2006 | | March 1,
2006(1) to
April 30,
2006 | | February 7, 2006(1) to
April 30,
2006 | |
Per Share Operating Performance: | | |
Net asset value, beginning of period | $ | 10.00 | | 10.15 | | 10.43 | | 10.24 | |
Income (loss) from investment operations: | | | | | | | | | |
Net investment income | $ | 0.24 | * | 0.23 | * | 0.22 | * | 0.28 | * |
Net realized and unrealized gain on investments | $ | 0.15 | | (0.03 | ) | (0.42 | ) | (0.19 | ) |
Total from investment operations | $ | 0.39 | | 0.20 | | (0.20 | ) | 0.09 | |
Less distributions from: | | | | | | | | | |
Net investment income | $ | 0.20 | | 0.19 | | 0.07 | | 0.15 | |
Total distributions | $ | 0.20 | | 0.19 | | 0.07 | | 0.15 | |
Net asset value, end of period | $ | 10.19 | | 10.16 | | 10.16 | | 10.18 | |
Total Return(2) | % | 3.87 | | 1.96 | | (1.92 | ) | 0.91 | |
| | | | | | | | | |
Ratios and Supplemental Data: | | | | | | | | | |
Net assets, end of period ($000) | $ | 10,539 | | 72 | | 154 | | 13 | |
Ratios to average net assets: | | | | | | | | | |
Net expenses after expense reimbursement(3)(4) | % | 1.25 | | 2.00 | | 2.00 | | 1.00 | |
Gross expenses prior to expense reimbursement(4) | % | 2.57 | | 3.65 | | 3.65 | | 2.65 | |
Net investment income after expense reimbursement(3)(4) | % | 6.67 | | 6.46 | | 6.17 | | 7.79 | |
Portfolio turnover rate(5) | % | 26 | | 26 | | 26 | | 26 | |
| | | | | | | | | | | | | |
(1) Commencement of operations.
(2) Total return is calculated assuming reinvestment of dividends and capital gain distributions at net asset value and excluding the deduction of sales charge. Total return for less than one year is not annualized.
(3) The Investment Manager has agreed to limit expenses, (excluding interest, taxes, brokerage and extraordinary expenses) subject to possible recoupment by ING Investments, LLC within three years of being incurred.
(4) Annualized for periods less than one year.
(5) Not Annualized.
* Per share data calculated using average number of shares outstanding throughout the period.
See Accompanying Notes to Financial Statements
96
ING DIVERSIFIED INTERNATIONAL FUND | | FINANCIAL HIGHLIGHTS |
Selected data for a share of beneficial interest outstanding throughout each period.
| | Class A | | Class B | | Class C | | Class I | |
| | December 21,
2005(1) to
April 30,
2006 | | December 21,
2005(1) to
April 30,
2006 | | December 21,
2005(1) to
April 30,
2006 | | December 21,
2005(1) to
April 30,
2006 | |
Per Share Operating Performance: | | |
Net asset value, beginning of period | $ | 10.00 | | 10.28 | | 10.54 | | 10.00 | |
Income (loss) from investment operations: | | | | | | | | | |
Net investment income | $ | (0.01 | )* | (0.04 | )* | (0.04 | )* | 0.00 | * |
Net realized and unrealized gain on investments | $ | 1.42 | | 1.15 | | 0.88 | | 1.42 | |
Total from investment operations | $ | 1.41 | | 1.11 | | 0.84 | | 1.42 | |
Net asset value, end of period | $ | 11.41 | | 11.39 | | 11.38 | | 11.42 | |
Total Return(2) | % | 14.10 | | 10.80 | | 7.97 | | 14.20 | |
| | | | | | | | | |
Ratios and Supplemental Data: | | | | | | | | | |
Net assets, end of period ($000) | $ | 86,858 | | 13,335 | | 39,087 | | 1 | |
Ratios to average net assets: | | | | | | | | | |
Net expenses after expense reimbursement(3)(4)(5) | % | 0.35 | | 1.10 | | 1.10 | | 0.10 | |
Gross expenses prior to expense reimbursement(4)(5) | % | 0.79 | | 1.54 | | 1.54 | | 0.54 | |
Net investment income(3)(4) | % | (0.35 | ) | (1.10 | ) | (1.10 | ) | (0.10 | ) |
Portfolio turnover rate(6) | % | 12 | | 12 | | 12 | | 12 | |
| | | | | | | | | | | | | |
(1) Commencement of operations.
(2) Total return is calculated assuming reinvestment of dividends and capital gain distributions at net asset value and excluding the deduction of sales charge. Total return for less than one year is not annualized.
(3) The Investment Manager has agreed to limit expenses, (excluding interest, taxes, brokerage and extraordinary expenses) subject to possible recoupment by ING Investments, LLC within three years of being incurred.
(4) Annualized for periods less than one year.
(5) Expense ratios do not include expenses of Underlying Funds.
(6) Not Annualized.
* Per share data calculated using average number of shares outstanding throughout the period.
** Amount represents less than $0.005 per share or 0.005%.
See Accompanying Notes to Financial Statements
97
NOTES TO FINANCIAL STATEMENTS AS OF APRIL 30, 2006 (UNAUDITED)
NOTE 1 — ORGANIZATION
Organization. The ING Funds included in this report are comprised of ING Mutual Funds (“IMF”) and ING Mayflower Trust (“IMT”); both are organized as open-end investment management companies registered under the Investment Company Act of 1940, as amended.
IMF is a Delaware statutory trust organized in 1992 with seventeen separate series, sixteen of which are included in this report, (“Funds”): ING Global Equity Dividend Fund (“Global Equity Dividend”), ING Global Real Estate Fund (“Global Real Estate”), ING Global Value Choice Fund (“Global Value Choice”), ING Emerging Countries Fund (“Emerging Countries”), ING Foreign Fund (“Foreign”), ING Greater China Fund (“Greater China”), ING Index Plus International Equity Fund (“Index Plus International Equity”), ING International Fund (“International”), ING International Capital Appreciation Fund (“International Capital Appreciation”), ING International Real Estate Fund (“International Real Estate”), ING International SmallCap Fund (“International SmallCap”), ING International Value Choice Fund (“International Value Choice”), ING Precious Metals Fund (“Precious Metals”), ING Russia Fund (“Russia”), ING Emerging Markets Fixed Income Fund (“Emerging Markets Fixed Income”) and ING Diversified International Fund (“Diversified International”). IMT is a Massachusetts business trust organized in 1993 with one series (“Fund”), ING International Value Fund (“International Value”). The investment objective of each Fund is described in the Fund’s prospectus.
Each Fund offers one or more of the following classes of shares: Class A, Class B, Class C, Class I, Class M and Class Q. The separate classes of shares differ principally in the applicable sales charges (if any), distribution fees and shareholder servicing fees and transfer agent fees. Shareholders of each class also bear certain expenses that pertain to that particular class. All shareholders bear the common expenses of the Fund and earn income and realized gains/losses from the portfolio pro rata based on the average daily net assets of each class, without distinction between share classes. Differences in per share dividend rates generally result from the differences in separate class expenses, including distribution and shareholder servicing fees. Class B shares, along with their pro rata reinvested dividend shares, automatically convert to Class A shares approximately eight years after purchase.
Effective September 2, 2003, International Value was closed to new investments except for shares purchased (1) through the reinvestment of dividends and distributions; (2) by 401(k), 403(b) and 457 plans that have selected International Value as an investment option prior to June 28, 2002; (3) by shareholders participating in mutual fund wrap fee programs who were invested in International Value prior to June 28, 2002; (4) by new 401(k), 403(b) and 457 plans and new shareholders participating in mutual fund wrap fee programs subject to approval by the Investment Manager and Sub-Adviser based on their assessment of the Fund’s ability to invest the monies consistent with the Fund’s objectives in light of market conditions, the size of the purchase, and other relevant factors relating to International Value, or (5) by employees of the Investment Manager or Sub-Adviser and their affiliates. Proof of eligibility may be required. Employees of the Investment Manager or Sub-Adviser and their affiliates must identify themselves as such at the time of purchase. Failure to do so may result in a rejection of the purchase.
Diversified International seeks to achieve its investment objective by investing in other ING Funds (“Underlying Funds”) and uses asset allocation strategies to determine how much to invest in the Underlying Funds.
NOTE 2 — SIGNIFICANT ACCOUNTING POLICIES
The following significant accounting policies are consistently followed by the Funds in the preparation of their financial statements, and such policies are in conformity with accounting principles generally accepted in the United States of America for investment companies.
A. Security Valuation. For all Funds except Russia, investments in equity securities traded on a national securities exchange are valued at the last reported sale price. Securities reported by NASDAQ will be valued at the NASDAQ official closing prices. Securities traded on an exchange or NASDAQ for which there has been no sale, securities traded in the over-the-counter-market, gold and silver bullion, platinum and palladium are valued at the mean between the last reported bid and ask prices. All investments quoted in foreign currencies will be valued daily in U.S. dollars on the basis of the foreign currency exchange rates prevailing at that time. Debt securities are valued at prices obtained from independent services or from one or more dealers making markets in the securities and may be adjusted based on the Fund’s valuation procedures. U.S. Government obligations are valued by using market quotations or independent pricing services that use prices provided by market-makers or estimates of market
98
NOTES TO FINANCIAL STATEMENTS AS OF APRIL 30, 2006 (UNAUDITED) (CONTINUED)
NOTE 2 — SIGNIFICANT ACCOUNTING POLICIES (continued)
values obtained from yield data relating to instruments or securities with similar characteristics.
Securities and assets for which market quotations are not readily available (which may include certain restricted securities which are subject to limitations as to their sale) are valued at their fair values as determined in good faith by or under the supervision of the Funds’ Board in accordance with methods that are specifically authorized by the Board. Securities traded on exchanges, including foreign exchanges, which close earlier than the time that a Fund calculates its next net asset value may also be valued at their fair values as determined in good faith by or under the supervision of a Fund’s Board, in accordance with methods that are specifically authorized by the Board. The valuation techniques applied in any specific instance are likely to vary from case to case. With respect to a restricted security, for example, consideration is generally given to the cost of the investment, the market value of any unrestricted securities of the same class at the time of valuation, the potential expiration of restrictions on the security, the existence of any registration rights, the costs to the Fund related to registration of the security, as well as factors relevant to the issuer itself. Consideration may also be given to the price and extent of any public trading in similar securities of the issuer or comparable companies’ securities.
The value of a foreign security traded on an exchange outside the United States is generally based on its price on the principal foreign exchange where it trades as of the time the Fund determines its NAV or if the foreign exchange closes prior to the time the Fund determines its NAV, the most recent closing price of the foreign security on its principal exchange. Trading in certain non-U.S. securities may not take place on all days on which the NYSE is open. Further, trading takes place in various foreign markets on days on which the NYSE is not open. Consequently, the calculation of the Fund’s NAV may not take place contemporaneously with the determination of the prices of securities held by the Fund in foreign securities markets. Further, the value of a Fund’s assets may be significantly affected by foreign trading on days when a shareholder cannot purchase or redeem shares of the Fund. In calculating a Fund’s NAV, foreign securities in foreign currency are converted to U.S. dollar equivalents.
If an event occurs after the time at which the market for foreign securities held by the Fund closes but before the time that the Fund’s next NAV is calculated, such event may cause the closing price on the foreign exchange to not represent a readily available reliable market value quotation for such securities at the time the Fund determines its NAV. In such a case, the Fund will use the fair value of such securities as determined under the Fund’s valuation procedures. Events after the close of trading on a foreign market that could require the Fund to fair value some or all of its foreign securities include, among others, securities trading in the U.S. and other markets, corporate announcements, natural and other disasters, and political and other events. Among other elements of analysis in the determination of a security’s fair value, the Board has authorized the use of one or more independent research services to assist with such determinations. An independent research service may use statistical analyses and quantitative models to help determine fair value as of the time a Fund calculates its NAV. There can be no assurance that such models accurately reflect the behavior of the applicable markets or the effect of the behavior of such markets on the fair value of securities, or that such markets will continue to behave in a fashion that is consistent with such models. Unlike the closing price of a security on an exchange, fair value determinations employ elements of judgment. Consequently, the fair value assigned to a security may not represent the actual value that the Fund could obtain if it were to sell the security at the time of the close of the NYSE. Pursuant to procedures adopted by the Board, the Fund is not obligated to use the fair valuations suggested by any research service, and valuation recommendations provided by such research services may be overridden if other events have occurred or if other fair valuations are determined in good faith to be more accurate. Unless an event is such that it causes the Fund to determine that the closing prices for one or more securities do not represent readily available reliable market value quotations at the time the Fund determines its NAV, events that occur between the time of the close of the foreign market on which they are traded and the close of regular trading on the NYSE will not be reflected in the Fund’s NAV. Investments in securities maturing in 60 days or less are valued at amortized cost, which, when combined with accrued interest approximates market value.
For the Russia Fund, the valuation procedures for Russian equity securities are to price local shares according to the most recent available bid prices. If securities are not listed on the Russian Trade System or on any other pricing service that lists available bid quotes, then the mean of at least two broker bid quotes is used. For equity securities of an issuer in Russia for which there are
99
NOTES TO FINANCIAL STATEMENTS AS OF APRIL 30, 2006 (UNAUDITED) (CONTINUED)
NOTE 2 — SIGNIFICANT ACCOUNTING POLICIES (continued)
no readily available reliable market value quotations, the following benchmark pricing procedure shall apply on any day on which the largest securities exchange in Russia (the “RTS”) declines by 21/2% or more. The price of the security shall be adjusted by the amount of the downward change in a composite of the other companies that are publicly traded in the same sector as the issuer, if ascertainable, and if not ascertainable, by the amount of downward change in the RTS.
For Diversified International, the valuation of the Fund’s investments in its underlying funds is based on the net asset values of the underlying funds each business day.
B. Security Transactions and Revenue Recognition. Securities transactions are accounted for on the trade date. Realized gains and losses are reported on the basis of identified cost of securities sold. Interest income is recorded on an accrual basis. Dividend income is recorded, net of any applicable withholding tax, on the ex-dividend date, or for certain foreign securities, when the information becomes available to the Funds. Premium amortization and discount accretion are determined by the effective yield method.
Global Real Estate and International Real Estate estimate components of distributions from real estate investment trust (REITs). Distributions received in excess of income are recorded as a reduction of cost of the related investments. If the Funds no longer own the applicable securities, any distributions received in excess of income are recorded as realized gains.
C. Foreign Currency Translation. The books and records of the Funds are maintained in U.S. dollars. Any foreign currency amounts are translated into U.S. dollars on the following basis:
(1) Market value of investment securities, other assets and liabilities — at the exchange rates prevailing at the end of the day.
(2) Purchases and sales of investment securities, income and expenses — at the rates of exchange prevailing on the respective dates of such transactions.
Although the net assets and the market values are presented at the foreign exchange rates at the end of the day, the Funds do not isolate the portion of the results of operations resulting from changes in foreign exchange rates on investments from the fluctuations arising from changes in market prices of securities held. Such fluctuations are included with the net realized and unrealized gains or losses from investments. For securities that are subject to foreign withholding tax upon disposition, liabilities are recorded on the Statements of Assets and Liabilities for the estimated tax withholding based on the securities’ current market value. Upon disposition, realized gains or losses on such securities are recorded net of foreign withholding tax.
Reported net realized foreign exchange gains or losses arise from sales of foreign currencies, currency gains or losses realized between the trade and settlement dates on securities transactions, the difference between the amounts of dividends, interest, and foreign withholding taxes recorded on the Fund’s books, and the U.S. dollar equivalent of the amounts actually received or paid. Net unrealized foreign exchange gains and losses arise from changes in the value of assets and liabilities other than investments in securities at fiscal year end, resulting from changes in the exchange rate. Foreign security and currency transactions may involve certain considerations and risks not typically associated with investing in U.S. companies and U.S. Government securities. These risks include, but are not limited to revaluation of currencies and future adverse political and economic developments which could cause securities and their markets to be less liquid and prices more volatile than those of comparable U.S. companies and U.S. Government securities.
D. Foreign Currency Transactions and Futures Contracts. Each Fund may enter into foreign currency exchange transactions to convert to and from different foreign currencies and to and from the U.S. dollar, generally in connection with the planned purchases or sales of securities. The Funds either enter into these transactions on a spot basis at the spot rate prevailing in the foreign currency exchange market or uses forward foreign currency contracts to purchase or sell foreign currencies. When the contract is fulfilled or closed, gains or losses are realized. Until then, the gain or loss is included in unrealized appreciation or depreciation. Risks may arise upon entering into forward contracts from the potential inability of counterparties to meet the terms of their forward contracts and from unanticipated movements in the value of foreign currencies relative to the U.S. dollar.
Each Fund may enter into futures contracts involving foreign currency, interest rates, securities and securities indices. A futures contract obligates the seller of the contract to deliver and the purchaser of the contract to take delivery of the type of foreign currency, financial instrument or security called for in the contract at a specified future time for a specified price. Upon entering into such a contract, a Fund is required to deposit and maintain as collateral such initial margin as required by the exchange on which the contract is traded. Pursuant to the contract, a Fund agrees to receive from or pay to the broker an amount equal to the daily fluctuations in the value of the contract. Such receipts or payments are known as
100
NOTES TO FINANCIAL STATEMENTS AS OF APRIL 30, 2006 (UNAUDITED) (CONTINUED)
NOTE 2 — SIGNIFICANT ACCOUNTING POLICIES (continued)
variation margin and are recorded as unrealized gains or losses by the Fund. When the contract is closed, the Fund records a realized gain or loss equal to the difference between the value of the contract at the time it was opened and the value at the time it was closed.
E. Distributions to Shareholders. The Funds record distributions to their shareholders on ex-dividend date. Each Fund pays dividends and capital gains, if any, annually (except, Global Equity Dividend, Global Real Estate and International Real Estate, which pay dividends, if any, quarterly and Emerging Markets Fixed Income, which pay dividends monthly). The Funds may make distributions on a more frequent basis to comply with the distribution requirements of the Internal Revenue Code. The characteristics of income and gains to be distributed are determined in accordance with income tax regulations, which may differ from accounting principles generally accepted in the United States of America for investment companies.
F. Federal Income Taxes. It is the policy of the Funds to comply with subchapter M of the Internal Revenue Code and related excise tax provisions applicable to regulated investment companies and to distribute substantially all of their net investment income and any net realized capital gains to their shareholders. Therefore, no federal income tax provision is required. No capital gain distributions shall be made until any capital loss carryforwards have been fully utilized or expired.
The Funds may utilize equalization accounting for tax purposes, where by a portion of redemption payments are treated as distributions of income or gain.
G. Use of Estimates. Management of the Funds has made certain estimates and assumptions relating to the reporting of assets, liabilities, income, and expenses to prepare these financial statements in conformity with accounting principles generally accepted in the United States of America for investment companies. Actual results could differ from these estimates.
H. Organization Expenses and Offering Costs. Costs incurred with the organization of the Funds are expensed as incurred. Costs incurred with the offering of shares of the Funds are deferred and amortized over a twelve-month period on a straight-line basis.
I. Repurchase Agreements. Each Fund may invest in repurchase agreements only with government securities dealers recognized by the Board of Governors of the Federal Reserve System. Under such agreements, the seller of the security agrees to repurchase it at a mutually agreed upon time and price. The resale price is in excess of the purchase price and reflects an agreed upon interest rate for the period of time the agreement is outstanding. The period of the repurchase agreements is usually short, from overnight to one week, while the underlying securities generally have longer maturities. Each Fund will receive as collateral securities acceptable to it whose market value is equal to at least 100% of the carrying amount of the repurchase agreements, plus accrued interest, being invested by the Fund. The underlying collateral is valued daily on a mark to market basis to assure that the value, including accrued interest is at least equal to the repurchase price. There would be potential loss to the Fund in the event the Fund is delayed or prevented from exercising its right to dispose of the collateral, and it might incur disposition costs in liquidating the collateral.
J. Securities Lending. Each Fund has the option to temporarily loan up to 30% of its total assets to brokers, dealers or other financial institutions in exchange for a negotiated lender’s fee. The borrower is required to fully collateralize the loans with cash or U.S. Government securities. Generally, in the event of counterparty default, each Fund has the right to use collateral to offset losses incurred. There would be potential loss to a Fund in the event the Fund is delayed or prevented from exercising its right to dispose of the collateral. Each Fund bears the risk of loss with respect to the investment of collateral. Engaging in securities lending could have a leveraging effect, which may intensify the credit, market and other risks associated with investing in a Fund.
K. Options Contracts. All Funds may purchase put and call options and may write (sell) put options and covered call options. The Funds may engage in option transactions as a hedge against adverse movements in the value of portfolio holdings or to increase market exposure. Option contracts are valued daily and unrealized gains or losses are recorded based upon the last sales price on the principal exchange on which the options are traded. The Funds will realize a gain or loss upon the expiration or closing of the option contract. When an option is exercised, the proceeds on sales of the underlying security for a written call option, the purchase cost of the security for a written put option, or the cost of the security for a purchased put or call option is adjusted by the amount of premium received or paid. Realized and unrealized gains or losses on option contracts are reflected in the accompanying financial statements. The risk in writing a call option is that the Funds give up the opportunity for profit if the market price of the security increases and the option is exercised. The risk in writing a put option is that the Funds may incur a loss if the market price of the security decreases and the option is
101
NOTES TO FINANCIAL STATEMENTS AS OF APRIL 30, 2006 (UNAUDITED) (CONTINUED)
NOTE 2 — SIGNIFICANT ACCOUNTING POLICIES (continued)
exercised. The risk in buying an option is that the Funds pay a premium whether or not the option is exercised. Risks may also arise from an illiquid secondary market or from the inability of counterparties to meet the terms of the contract.
L. Illiquid and Restricted Securities. Each Fund may not invest more than 15% of its net assets in illiquid securities. Illiquid securities are not readily marketable. Disposing of illiquid investments may involve time-consuming negotiation and legal expenses, and it may be difficult or impossible for the Funds to sell them promptly at an acceptable price. Each Fund may also invest in restricted securities which include those sold under Rule 144A of the Securities Act of 1933 (“1933 Act”) or securities offered pursuant to Section 4(2) of the 1933 Act, and/or are subject to legal or contractual restrictions on resale and may not be publicly sold without registration under the 1933 Act. Certain restricted securities may be considered liquid pursuant to procedures adopted by the Board or may be deemed illiquid because they may not be readily marketable. Illiquid and restricted securities are valued using market quotations when readily available. In the absence of market quotations, the securities are valued based upon their fair value determined under procedures approved by the Board.
M. Delayed Delivery Transaction. The Funds may purchase or sell securities on a when-issued or forward commitment basis. The price of the underlying securities and date when the securities will be delivered and paid for are fixed at the time the transaction is negotiated. The market value of these securities is identified in the Funds’ Portfolio of Investments. Losses may arise due to changes in the market value of the securities or from the inability of counterparties to meet the terms of the contract. In connection with such purchases, the Funds are required to segregate liquid assets sufficient to cover the purchase price.
NOTE 3 — INVESTMENT TRANSACTIONS
For the six month period ended April 30, 2006, the cost of purchases and proceeds from sales of securities, excluding short-term securities, were as follows:
| | Purchases | | Sales | |
Global Equity Dividend | | $ | 67,481,071 | | $ | 60,880,846 | |
Global Real Estate | | 115,287,472 | | 45,973,039 | |
Global Value Choice | | 39,017,008 | | 50,143,362 | |
Emerging Countries | | 68,425,219 | | 29,526,357 | |
Foreign | | 209,400,616 | | 105,439,482 | |
Greater China | | 19,750,568 | | 4,990,767 | |
Index Plus International Equity | | 83,269,803 | | 30,187,824 | |
International | | 135,532,671 | | 144,299,441 | |
International Capital Appreciation | | 31,915,300 | | 5,331,150 | |
International Real Estate | | 17,009,421 | | 151,285 | |
International SmallCap | | 179,285,481 | | 139,604,013 | |
International Value | | 647,267,700 | | 823,200,694 | |
International Value Choice | | 26,081,128 | | 2,275,978 | |
Precious Metals | | | 54,500,757 | | | 54,716,390 | |
Russia | | 243,344,494 | | 32,110,276 | |
Emerging Markets Fixed Income | | 12,726,512 | | 2,539,866 | |
Diversified International | | 138,774,394 | | 7,428,970 | |
NOTE 4 — REDEMPTION FEES
A 2% redemption fee is charged on shares of Russia that are redeemed (included in connection with an exchange) within 365 days or less from their date of purchase. The redemption fee is recorded as an addition to paid-in capital. Total redemption fee proceeds for the periods ended April 30, 2006 and October 31, 2005 were $518,566 and $850,706, respectively, and are set forth in the Statements of Changes in Net Assets.
Up through April 2, 2006, International imposed a 2% redemption fee on Class A shares redeemed (including in connection with an exchange) within 30 days or less from their date of purchase. The redemption fee is recorded as an addition to paid-in capital. Total redemption fee proceeds through April 2, 2006 and for the period ended October 31, 2005 were $257 and $12,635, respectively, and are set forth in the Statements of Changes in Net Assets. Effective April 3, 2006, International no longer charges a redemption fee.
NOTE 5 — INVESTMENT MANAGEMENT AND ADMINISTRATIVE FEES
Each of the Funds except Diversified International has entered into an Investment Management Agreement with ING Investments, LLC (the “Investment Manager”). The Investment Management Agreements compensate the Investment Manager with a fee, computed daily and payable monthly, based on the average daily net assets of each Fund, at the following annual rates:
| | As a percentage of average net assets |
Global Equity Dividend | | 0.70% |
Global Real Estate | | 0.80% on the first $250 million; 0.775% on the next $250 million; and 0.70% thereafter |
Global Value Choice | | 1.00% on the first $250 million; 0.90% on the next $250 million; 0.80% on the next $500 million; and 0.75% thereafter |
Emerging Countries | | 1.25% |
Foreign | | 1.00% on the first $500 million; and 0.90% thereafter |
Greater China | | 1.15% on the first $100 million; 1.05% of the next $150 million; and 0.95% thereafter |
Index Plus International Equity | | 0.55% |
International | | 1.00% |
International Capital Appreciation | | 0.85% on the first $500 million; 0.80% on the next $500 million; and 0.75% thereafter |
International Real Estate | | 1.00% on the first $250 million; 0.90% on the next $250 million; and 0.80% thereafter |
International SmallCap | | 1.00% on first $500 million; 0.90% on next $500 million; and 0.85% thereafter |
International Value | | 1.00% |
International Value Choice | | 1.00% |
Precious Metals | | 1.00% on first $50 million; and 0.75% thereafter |
Russia | | 1.25% |
Emerging Markets Fixed Income | | 0.65% on the first $250 million; 0.60% on the next $250 million; and 0.55% thereafter |
102
NOTES TO FINANCIAL STATEMENTS AS OF APRIL 30, 2006 (UNAUDITED) (CONTINUED)
NOTE 5 — INVESTMENT MANAGEMENT AND ADMINISTRATIVE FEES (continued)
Prior to April 28, 2006, the investment management fees for Global Real Estate were 1.00% on the first $250 million; 0.90% on the next $250 million; and 0.80% above $500 million.
ING Investment Management Advisors B.V. (“IIMA”), a registered investment adviser, serves as Sub-Adviser to Global Equity Dividend, Index Plus International Equity, Russia and Emerging Markets Fixed Income pursuant to a Sub-Advisory Agreement between the Investment Manager and IIMA.
ING Clarion Real Estate Securities L.P. (“ING CRES”) a registered investment adviser, serves as a Sub-Adviser to Global Real Estate and International Real Estate pursuant to a Sub-Advisory Agreement between the Investment Manager and ING CRES.
Tradewinds NWQ Global Investors, LLC (“NWQ”), a registered investment adviser, serves as a Sub-Adviser to Global Value Choice and International Value Choice pursuant to a Sub-Advisory Agreement between the Investment Manager and NWQ.
Brandes Investment Partners, L.P. (“Brandes”), a registered investment adviser, serves as a Sub-Adviser to Emerging Countries and International Value pursuant to a Sub-Advisory Agreement between the Investment Manager and Brandes.
Julius Baer Investment Management, LLC (“JBIM”), a registered investment adviser wholly-owned by the Julius Baer Securities, serves as Sub-Adviser to Foreign pursuant to a Sub-Advisory Agreement between the Investment Manager and JBIM.
ING Investment Management Co. (“ING IM”), a registered investment adviser serves as Sub-Adviser to International and Precious Metals pursuant to a Sub-Advisory Agreement between the Investment Manager and ING IM.
Acadian Asset Management, Inc. (“Acadian”), a registered investment adviser, serves as a Sub-Adviser to International SmallCap pursuant to a Sub-Advisory Agreement between the Investment Manager and Acadian.
ING Investment Management Asia/Pacific (Hong Kong) Limited (“ING Asia”), a registered investment adviser, serves as a Sub-Adviser to Greater China pursuant to a Sub-Advisory Agreement between the Investment Manager and ING Asia.
Hansberger Global Investors, Inc. (“HGI”), a registered investment adviser, serves as Sub-Adviser to International Capital Appreciation pursuant to a Sub-Advisory Agreement between the Investment Manager and HGI.
ING Funds Services, LLC (the “Administrator”), serves as administrator to each Fund. The Funds pay the Administrator a fee calculated at an annual rate of 0.10% of each Fund’s average daily net assets.
International Value Fund also pays the Administrator an annual shareholder account-servicing fee of $5.00 for each account of beneficial owners of shares.
The Investment Manager, ING IM, ING CRES, IIMA and the Administrator are indirect, wholly-owned subsidiaries of ING Groep N.V. (“ING Groep”). ING Groep is one of the largest financial services organizations in the world, and offers an array of banking, insurance and asset management services to both individual and institutional investors.
NOTE 6 — DISTRIBUTION AND SERVICE FEES
Each share class of the Funds, except Class I, has adopted a Plan pursuant to Rule 12b-1 under the 1940 Act (the “12b-1 Plans”), whereby ING Funds Distributor, LLC (the “Distributor”), an indirect, wholly-owned subsidiary of ING Groep, is reimbursed or compensated (depending on the class of shares) by the Funds for expenses incurred in the distribution of each Funds’ shares (“Distribution Fees”). Pursuant to the 12b-1 Plans, the Distributor is entitled to a payment each month for expenses incurred in the distribution and promotion of each Fund’s shares, including expenses incurred in printing prospectuses and reports used for sales purposes, expenses incurred in preparing and printing sales literature and other such distribution related expenses, including any distribution or shareholder servicing fees (“Service Fees”) paid to securities dealers who have executed a distribution agreement with the Distributor. Under the 12b-1 Plans, each class of shares of the Fund pays the Distributor a Distribution and/or Service Fee based on average daily net assets at the following annual rates:
| | Class A | | Class B | | Class C | | Class M | | Class Q | |
| | | | | | | | | | | |
Global Equity Dividend | | 0.25 | % | | 1.00 | % | | 1.00 | % | | N/A | | | N/A | | |
Global Real Estate | | 0.25 | % | | 1.00 | % | | 1.00 | % | | N/A | | | N/A | | |
Global Value Choice | | 0.35 | % | | 1.00 | % | | 1.00 | % | | N/A | | | 0.25 | % | |
Emerging Countries | | 0.35 | %(1) | | 1.00 | % | | 1.00 | % | | 1.00 | %(2) | | 0.25 | % | |
Foreign | | 0.25 | % | | 1.00 | % | | 1.00 | % | | N/A | | | 0.25 | % | |
Greater China | | 0.25 | % | | 1.00 | % | | 1.00 | % | | N/A | | | N/A | | |
Index Plus International Equity | | 0.25 | % | | 1.00 | % | | 1.00 | % | | N/A | | | N/A | | |
International | | 0.25 | % | | 1.00 | % | | 1.00 | % | | N/A | | | 0.25 | % | |
International Capital Appreciation | | 0.25 | % | | 1.00 | % | | 1.00 | % | | N/A | | | N/A | | |
International Real Estate | | 0.25 | % | | 1.00 | % | | 1.00 | % | | N/A | | | N/A | | |
International SmallCap | | 0.35 | % | | 1.00 | % | | 1.00 | % | | N/A | | | 0.25 | % | |
International Value | | 0.30 | % | | 1.00 | % | | 1.00 | % | | N/A | | | 0.25 | % | |
International Value Choice | | 0.25 | % | | 1.00 | % | | 1.00 | % | | N/A | | | N/A | | |
Precious Metals | | 0.25 | % | | N/A | | | N/A | | | N/A | | | N/A | | |
Russia | | 0.25 | % | | N/A | | | N/A | | | N/A | | | N/A | | |
Emerging Markets Fixed Income | | 0.25 | % | | 1.00 | % | | 1.00 | % | | N/A | | | N/A | | |
Diversified International Fund | | 0.25 | % | | 1.00 | % | | 1.00 | % | | N/A | | | N/A | | |
(1) ING Funds Distributor, LLC has agreed to waive 0.10% of the Distribution Fee for Class A shares of Emerging Countries for the period from January 1, 2006 through December 31, 2006.
(2) ING Funds Distributor, LLC has agreed to waive 0.25% of the Distribution Fee for Class M shares of Emerging Countries. Effective June 1, 2006, this waiver was eliminated and the 12b-1 fee permanently reduced to 0.75%.
103
NOTES TO FINANCIAL STATEMENTS AS OF APRIL 30, 2006 (UNAUDITED) (CONTINUED)
NOTE 6 — DISTRIBUTION AND SERVICE FEES (continued)
Fees paid to the Distributor by class during the six months ended April 30, 2006 are shown in the accompanying Statements of Operations.
The Distributor also receives the proceeds of the initial sales charge paid by shareholders upon the purchase of Class A shares, and the contingent deferred sales charge paid by shareholders upon certain redemptions for Class A, Class B, Class C and Class M shares. For the six months ended April 30, 2006, the Distributor retained the following amounts in sales charges for the Funds:
| | Class A | | Class B | | Class C | | Class M | |
Initial Sales Charges | | | | | | | | | |
Global Equity Dividend | | $ | 37,220 | | N/A | | | N/A | | | N/A | | |
Global Real Estate | | 56,955 | | N/A | | | N/A | | | N/A | | |
Global Value Choice | | 18,492 | | N/A | | | N/A | | | N/A | | |
Emerging Countries | | 30,745 | | N/A | | | N/A | | | $ | 216 | | |
Foreign | | 89,341 | | N/A | | | N/A | | | N/A | | |
Greater China | | 16,999 | | N/A | | | N/A | | | N/A | | |
Index Plus International Equity | | 2,441 | | N/A | | | N/A | | | N/A | | |
International | | 5,388 | | N/A | | | N/A | | | N/A | | |
International Capital Appreciation | | 145 | | N/A | | | N/A | | | N/A | | |
International Real Estate | | 6,203 | | N/A | | | N/A | | | N/A | | |
International SmallCap Growth | | 36,424 | | N/A | | | N/A | | | N/A | | |
International Value | | 514 | | N/A | | | N/A | | | N/A | | |
International Value Choice | | 6,337 | | N/A | | | N/A | | | N/A | | |
Precious Metals | | 18,847 | | N/A | | | N/A | | | N/A | | |
Russia | | 1,245,548 | | N/A | | | N/A | | | N/A | | |
Emerging Markets Fixed Income | | 936 | | N/A | | | N/A | | | N/A | | |
Diversified International Fund | | 208,593 | | N/A | | | N/A | | | N/A | | |
Contingent Deferred Sales Charges | | | | | | | | | | | | |
Global Equity Dividend | | 82,447 | | $ | — | | | $ | 5,898 | | | N/A | | |
Global Real Estate | | — | | — | | | 4,832 | | | N/A | | |
Global Value Choice | | — | | — | | | 754 | | | N/A | | |
Emerging Countries | | — | | — | | | 900 | | | N/A | | |
Foreign | | 34 | | — | | | 3,438 | | | N/A | | |
Greater China | | — | | — | | | — | | | N/A | | |
Index Plus International Equity | | — | | — | | | — | | | N/A | | |
International | | — | | — | | | 167 | | | N/A | | |
International Capital Appreciation | | — | | — | | | — | | | N/A | | |
International Real Estate | | — | | — | | | — | | | N/A | | |
International SmallCap Growth | | 2,638 | | — | | | 420 | | | N/A | | |
International Value | | 3,048 | | — | | | 224 | | | N/A | | |
International Value Choice | | — | | — | | | — | | | N/A | | |
Precious Metals | | — | | — | | | — | | | N/A | | |
Russia | | 34 | | — | | | — | | | N/A | | |
Emerging Markets Fixed Income | | — | | — | | | — | | | N/A | | |
Diversified International Fund | | — | | — | | | 40 | | | N/A | | |
| | | | | | | | | | | | | | | | |
NOTE 7 — OTHER TRANSACTIONS WITH AFFILIATES AND RELATED PARTIES
At April 30, 2006, the Funds had the following amounts recorded in payable to affiliates on the accompanying Statements of Assets and Liabilities (See Notes 5 and 6):
| | Accrued
Investment
Management
Fees | | Accrued
Administrative
Fees | | Accrued
Shareholder
Services and
Distribution Fees | | Recoupment | | Total | |
Global Equity Dividend | | $ | 103,236 | | $ | 27,217 | | $ | 97,808 | | $ | — | | $ | 228,261 | |
Global Real Estate | | 228,806 | | 23,652 | | 99,431 | | 2 | | 351,891 | |
Global Value Choice | | 91,899 | | 9,190 | | 62,169 | | — | | 163,258 | |
Emerging Countries | | 201,015 | | 16,080 | | 68,506 | | — | | 285,601 | |
Foreign Fund | | 314,876 | | 60,887 | | 180,904 | | 11,736 | | 568,403 | |
Greater China | | 15,719 | | 1,638 | | 3,696 | | — | | 21,053 | |
Index Plus International Equity | | 23,364 | | 4,248 | | 3,872 | | — | | 31,484 | |
International | | 110,440 | | 11,044 | | 47,389 | | — | | 168,873 | |
International Capital Appreciation | | 16,175 | | 1,903 | | 1,179 | | — | | 19,257 | |
International Real Estate | | 12,357 | | 1,236 | | 4,294 | | — | | 17,887 | |
International Small Cap | | 391,296 | | 39,130 | | 198,909 | | — | | 629,335 | |
International Value | | 3,843,976 | | 384,392 | | 1,440,021 | | — | | 5,668,389 | |
International Value Choice | | 29,633 | | 2,964 | | 7,973 | | — | | 40,570 | |
Precious Metals | | 94,665 | | 11,252 | | 28,130 | | — | | 134,047 | |
Russia | | 678,510 | | 54,280 | | 135,702 | | — | | 868,492 | |
Emerging Markets Fixed Income | | 5,639 | | 868 | | 2,287 | | — | | 8,794 | |
Diversified International | | — | | 9,443 | | 50,382 | | — | | 59,825 | |
| | | | | | | | | | | | | | | | |
At April 30, 2006, the following indirect, wholly owned subsidiaries of ING Groep owned the following Funds:
ING Life Insurance and Annuity Company — Greater China (64.80%); Index Plus International Equity (29.19%); International Capital Appreciation (18.69%); International Real Estate (57.68%); and Emerging Markets Fixed Income (94.67%).
ING National Nederlanden Intervest — Global Real Estate (20.30%).
ING National Trust — International (18.99%)
Control is defined by the Investment Company Act of 1940 (“1940 Act”) as the beneficial ownership, either directly or through one or more controlled companies, of more than 25% of the voting securities of a company. Investment activities of these shareholders could have a material impact on the Funds.
104
NOTES TO FINANCIAL STATEMENTS AS OF APRIL 30, 2006 (UNAUDITED) (CONTINUED)
NOTE 7 — OTHER TRANSACTIONS WITH AFFILIATES AND RELATED PARTIES (continued)
The Investment Manager may request that the Fund’s portfolio managers use their best efforts (subject to obtaining best execution of each transaction) to allocate a Portfolio’s equity security transactions through certain designated broker-dealers. The designated broker-dealer, in turn, will reimburse a portion of the brokerage commissions to pay certain expenses of that Fund. Any amounts credited to a Fund are reflected as a reimbursement of expenses in the Statements of Operations.
Each Fund has adopted a Retirement Policy covering all independent trustees of the Fund who will have served as an independent trustee for at least five years at the time of retirement. Benefits under this plan are based on an annual rate as defined in the plan agreement.
The following is a summary of the transaction during the six months ended April 30, 2006 in which the issuer was an affiliate of the ING Family of Funds.
ING Global Real
Estate Fund | | Purchases | | Unrealized
gain on
investment | | Value
at | |
| | Shares | | Cost | | securities | | 4/30/2006 | |
ING UK Real Estate Income Trust Ltd. | | 1,266,400 | | | $2,611,784 | | | $99,858 | | | $2,711,642 | | |
| | | | | | | | | | | | | |
NOTE 8 — OTHER ACCRUED EXPENSES AND LIABILITIES
At April 30, 2006, the Funds had the following payables included in Other Accrued Expenses and Liabilities on the Statement of Assets and Liabilities that exceeded 5% of total liabilities:
| | Accrued Custody Fees | |
Emerging Markets Fixed Income | | $ 2,521 | | |
| | Accrued Transfer Agent Fees | |
Global Equity Dividend | | $ 29,064 | | |
International SmallCap | | 128,637 | | |
Emerging Markets Fixed Income | | 3,634 | | |
| | Accrued Postage Fees | |
Emerging Markets Fixed Income | | $ 5,007 | | |
| | Accrued Offering Fees | |
International Value Choice | | $ 48,544 | | |
Emerging Markets Fixed Income | | 19,481 | | |
NOTE 9 — EXPENSE LIMITATIONS
The Investment Manager has agreed to limit expenses, excluding interest, taxes, brokerage and extraordinary expenses to the levels listed below:
Maximum Operating Expense Limit (as a percentage of average net assets)
| | Class A | | Class B | | Class C | | Class I | | Class M | | Class Q | |
Global Equity Dividend | | 1.40 | % | 2.15 | % | 2.15 | % | N/A | | N/A | | N/A | |
Global Real Estate | | 1.75 | % | 2.50 | % | 2.50 | % | 1.50 | % | N/A | | N/A | |
Global Value Choice | | 1.85 | % | 2.50 | % | 2.50 | % | 1.50 | % | N/A | | 1.75 | % |
Emerging Countries(1) | | 2.25 | % | 2.90 | % | 2.90 | % | 1.75 | % | 2.65 | % | 2.15 | % |
Foreign(2) | | 1.95 | % | 2.70 | % | 2.70 | % | 1.60 | % | N/A | | 1.85 | % |
Greater China | | N/A | | N/A | | N/A | | N/A | | N/A | | N/A | |
Index Plus International Equity | | 1.15 | % | 1.90 | % | 1.90 | % | 0.90 | % | N/A | | N/A | |
International(3) | | 2.75 | % | 3.50 | % | 3.50 | % | 2.50 | % | N/A | | 2.75 | % |
International Capital Appreciation | | 1.50 | % | 2.25 | % | 2.25 | % | 1.25 | % | N/A | | N/A | |
International Real Estate | | 1.50 | % | 2.25 | % | 2.25 | % | 1.25 | % | N/A | | N/A | |
International SmallCap | | 1.95 | % | 2.60 | % | 2.60 | % | 1.40 | % | N/A | | 1.85 | % |
International Value | | N/A | | N/A | | N/A | | N/A | | N/A | | N/A | |
International Value Choice | | 1.70 | % | 2.45 | % | 2.45 | % | 1.45 | % | N/A | | N/A | |
Precious Metals | | 2.75 | % | N/A | | N/A | | N/A | | N/A | | N/A | |
Russia | | 3.35 | % | N/A | | N/A | | N/A | | N/A | | N/A | |
Emerging Markets Fixed Income | | 1.25 | % | 2.00 | % | 2.00 | % | 1.00 | % | N/A | | N/A | |
Diversified International Fund | | 1.65 | % | 2.40 | % | 2.40 | % | 1.40 | % | N/A | | N/A | |
| | | | | | | | | | | | | | | | | | | |
(1) Effective January 1, 2006, pursuant to a side agreement, ING Investments has lowered the expense limits for Emerging Countries through at least December 31, 2006. The expense limits for Emerging Countries are 2.10%, 2.85%, 2.85%, 2.60% and 2.10% for Class A, B, C, M and Q shares, respectively. If, after December 31, 2006, ING Investments elects not to renew the side agreement, the expense limits will revert to the limits listed in the table above. There is no guarantee that this side agreement will continue after that date. The side agreement will only renew if ING Investments elects to renew it. Any fees waived pursuant to the side agreement shall not be eligible for recoupment.
(2) Pursuant to a side agreement dated February 1, 2006, ING Investments has lowered the expense limits for Foreign through at least March 1, 2007. The expense limits for the Foreign are 1.70%, 2.45%, 2.45%, 1.35% and 1.60% for Class A, B, C, I and Q, respectively. If, after March 1, 2007, ING Investments elects not to renew the side agreement, the expense limits will revert to the limits listed in the table above. There is no guarantee that this side agreement will continue after that date. The side agreement will only renew if ING Investments, LLC elects to renew it.
(3) Pursuant to a side agreement dated February 1, 2006, ING Investments has lowered the expense limits for International through at least March 1, 2007. The expense limits for the International are 1.95%, 2.70%, 2.70%, 1.60% and 1.85% for Class A, B, C, I and Q, respectively. If, after March 1, 2007, ING Investments elects not to renew the side agreement, the expense limits will revert to the limits listed in the table above. There is no guarantee that this side agreement will continue after that date. The side agreement will only renew if ING Investments, LLC elects to renew it.
The Investment Manager may at a later date recoup from a Fund management fees waived and other expenses assumed by the Investment Manager during the previous 36 months, but only if, after such recoupment, a Fund’s expense ratio does not exceed the percentage described above. Waived and reimbursed fees net of any recoupment by the Investment Manager of such waived and reimbursed fees are reflected on the accompanying Statement of Operations for each Fund. Amounts payable by the Investment Manager are reflected on the accompanying Statement of Assets and Liabilities for each Fund.
105
NOTES TO FINANCIAL STATEMENTS AS OF APRIL 30, 2006 (UNAUDITED) (CONTINUED)
NOTE 9 — EXPENSE LIMITATIONS (continued)
As of April 30, 2006, the amounts of waived or reimbursed fees that are subject to possible recoupment by the Investment Manager, and the related expiration dates, are as follows:
| | April 30, | | | |
| | 2007 | | 2008 | | 2009 | | Total | |
Global Equity Dividend | | $ | 9,679 | | $ | — | | $ | — | | $ | 9,679 | |
Global Value Choice | | 65,585 | | 18,289 | | 71,671 | | 155,545 | |
Foreign Fund | | 46,840 | | 52,505 | | 8,141 | | 107,486 | |
Index Plus International Equity | | — | | — | | 51,540 | | 51,540 | |
International Capital Appreciation | | — | | — | | 51,475 | | 51,475 | |
International Real Estate | | — | | — | | 30,679 | | 30,679 | |
International Value Choice | | — | | 9,658 | | 142,164 | | 151,822 | |
Emerging Markets Fixed Income | | — | | — | | 50,885 | | 50,885 | |
Diversified International | | — | | — | | 80,054 | | 80,054 | |
| | | | | | | | | | | | | |
The Expense Limitation Agreements are contractual and shall renew automatically for one-year terms unless ING Investments provides written notice of the termination of the Expense Limitation Agreement within 90 days of the end of the then current term.
NOTE 10 — LINE OF CREDIT
All of the Funds included in this report, in addition to certain other funds managed by the Investment Manager, have entered into an unsecured committed revolving line of credit agreement (the “Credit Agreement”) with The Bank of New York for an aggregate amount of $125,000,000. The proceeds may be used only to: (1) temporarily finance the purchase and sale of securities; (2) finance the redemption of shares of an investor in the Funds; and (3) enable the Funds to meet other emergency expenses as defined in the Credit Agreement. The Funds to which the line of credit is available pay a commitment fee equal to 0.09% per annum on the daily unused portion of the committed line amount payable quarterly in arrears.
The following Funds utilized the line of credit during the six months ended April 30, 2006:
Fund | | Days
Utilized | | Approximate
Average Daily
Balance For
Days Utilized | | Approximate
Weighted
Average
Interest Rate
For Days
Utilized | |
Diversified International | | 7 | | $ | 1,128,571 | | | 5.01% | |
Foreign | | 7 | | 684,286 | | | 4.56% | |
Index Plus International Equity | | 6 | | 790,000 | | | 4.99% | |
International | | 1 | | 630,000 | | | 4.49% | |
International SmallCap | | 1 | | 5,590,000 | | | 4.76% | |
International Value | | 1 | | 85,800,000 | | | 4.80% | |
NOTE 11 — CAPITAL SHARES
| | Class A | | Class B | | Class C | |
| | Six Months Ended
April 30,
2006 | | Year
Ended
October 31,
2005 | | Six Months Ended
April 30,
2006 | | Year
Ended
October 31,
2005 | | Six Months
Ended
April 30,
2006 | | Year
Ended
October 31,
2005 | |
Global Equity Dividend (Number of Shares) | | | | | | | | | | | | | |
Shares sold | | 1,681,769 | | 6,261,568 | | 513,506 | | 2,059,087 | | 811,746 | | 3,638,370 | |
Dividends reinvested | | 84,242 | | 73,143 | | 35,331 | | 25,087 | | 51,135 | | 34,087 | |
Shares redeemed | | (1,851,131 | ) | (1,646,562 | ) | (195,444 | ) | (142,758 | ) | (401,969 | ) | (208,449 | ) |
Net increase (decrease) in shares outstanding | | (85,120 | ) | 4,688,149 | | 353,393 | | 1,941,416 | | 460,912 | | 3,464,008 | |
| | | | | | | | | | | | | |
Global Equity Dividend ($) | | | | | | | | | | | | | |
Shares sold | | $ | 23,459,627 | | $ | 81,890,229 | | $ | 7,197,343 | | $ | 26,849,839 | | $ | 11,302,924 | | $ | 47,352,114 | |
Dividends reinvested | | 1,166,859 | | 950,413 | | 487,761 | | 325,721 | | 703,950 | | 440,961 | |
Shares redeemed | | (25,690,177 | ) | (21,584,892 | ) | (2,760,855 | ) | (1,878,685 | ) | (5,694,492 | ) | (2,750,750 | ) |
Net increase (decrease) | | $ | (1,063,691 | ) | $ | 61,255,750 | | $ | 4,924,249 | | $ | 25,296,875 | | $ | 6,312,382 | | $ | 45,042,325 | |
106
NOTES TO FINANCIAL STATEMENTS AS OF APRIL 30, 2006 (UNAUDITED) (CONTINUED)
NOTE 11 — CAPITAL SHARES (continued)
| | Class A | | Class B | | Class C | |
| | Six Months
Ended
April 30,
2006 | | Year
Ended
October 31,
2005 | | Six Months
Ended
April 30,
2006 | | Year
Ended
October 31,
2005 | | Six Months
Ended
April 30,
2006 | | Year
Ended
October 31,
2005 | |
Global Real Estate (Number of Shares) | | | | | | | | | | | | | |
Shares sold | | 3,719,331 | | 3,934,092 | | 317,820 | | 555,131 | | 1,210,229 | | 1,428,969 | |
Dividends reinvested | | 503,134 | | 464,771 | | 57,602 | | 31,215 | | 97,447 | | 41,618 | |
Shares redeemed | | (675,638 | ) | (2,535,905 | ) | (68,890 | ) | (113,195 | ) | (234,183 | ) | (232,975 | ) |
Net increase in shares outstanding | | 3,546,827 | | 1,862,958 | | 306,532 | | 473,151 | | 1,073,493 | | 1,237,612 | |
| | | | | | | | | | | | | |
Global Real Estate ($) | | | | | | | | | | | | | |
Shares sold | | $ | 69,148,317 | | $ | 64,903,422 | | $ | 5,111,755 | | $ | 7,963,178 | | $ | 20,398,142 | | $ | 21,436,748 | |
Dividends reinvested | | 8,770,212 | | 7,259,137 | | 867,640 | | 429,581 | | 1,537,820 | | 597,354 | |
Shares redeemed | | (12,511,148 | ) | (40,814,853 | ) | (1,110,872 | ) | (1,640,044 | ) | (3,973,113 | ) | (3,564,647 | ) |
Net increase | | $ | 65,407,381 | | $ | 31,347,706 | | $ | 4,868,523 | | $ | 6,752,715 | | $ | 16,578,811 | | $ | 18,469,455 | |
| | Class I | |
| | Six Months
Ended
April 30,
2006 | | June 3,
2005(1) to
October 31,
2005 | |
Global Real Estate (Number of Shares) | | | | | |
Shares sold | | 132,013 | | 98,101 | |
Dividends reinvested | | 633 | | — | |
Net increase in shares outstanding | | 132,646 | | 98,101 | |
| | | | | |
Global Real Estate ($) | | | | | |
Shares sold | | $ | 2,515,307 | | $ | 1,600,930 | |
Dividends reinvested | | 12,416 | | — | |
Net increase | | $ | 2,527,723 | | $ | 1,600,930 | |
(1) Commencement of operations
| | Class A | | Class B | | Class C | |
| | Six Months
Ended
April 30,
2006 | | Year
Ended
October 31,
2005 | | Six Months
Ended
April 30,
2006 | | Year
Ended
October 31,
2005 | | Six Months
Ended
April 30,
2006 | | Year
Ended
October 31,
2005 | |
Global Value Choice (Number of Shares) | | | | | | | | | | | | | |
Shares sold | | 355,086 | | 516,545 | | 49,604 | | 101,943 | | 66,608 | | 150,930 | |
Dividends reinvested | | 9,174 | | — | | — | | — | | 901 | | — | |
Shares redeemed | | (334,866 | ) | (1,098,757 | ) | (208,939 | ) | (550,241 | ) | (214,807 | ) | (696,774 | ) |
Net increase (decrease) in shares outstanding | | 29,394 | | (582,212 | ) | (159,335 | ) | (448,298 | ) | (147,298 | ) | (545,844 | ) |
| | | | | | | | | | | | | |
Global Value Choice ($) | | | | | | | | | | | | | |
Shares sold | | $ | 7,035,311 | | $ | 8,997,761 | | $ | 1,082,051 | | $ | 1,939,488 | | $ | 1,263,627 | | $ | 2,547,625 | |
Dividends reinvested | | 177,004 | | — | | — | | — | | 16,685 | | — | |
Shares redeemed | | (6,655,471 | ) | (19,124,741 | ) | (4,506,553 | ) | (10,345,519 | ) | (4,094,596 | ) | (11,682,829 | ) |
Net increase (decrease) | | $ | 556,844 | | $ | (10,126,980 | ) | $ | (3,424,502 | ) | $ | (8,406,031 | ) | $ | (2,814,284 | ) | $ | (9,135,204 | ) |
| | Class Q | |
| | Six Months
Ended
April 30,
2006 | | Year
Ended
October 31,
2005 | |
Global Value Choice (Number of Shares) | | | | | |
Shares sold | | 41,291 | | 78,062 | |
Dividends reinvested | | 1,706 | | — | |
Shares redeemed | | (26,592 | ) | (98,578 | ) |
Net increase (decrease) in shares outstanding | | 16,405 | | (20,516 | ) |
| | | | | |
Global Value Choice ($) | | | | | |
Shares sold | | $ | 971,126 | | $ | 1,573,859 | |
Dividends reinvested | | 38,450 | | — | |
Shares redeemed | | (615,486 | ) | (1,971,194 | ) |
Net increase (decrease) | | $ | 394,090 | | $ | (397,335 | ) |
107
NOTES TO FINANCIAL STATEMENTS AS OF APRIL 30, 2006 (UNAUDITED) (CONTINUED)
NOTE 11 — CAPITAL SHARES (continued)
| | Class A | | Class B | | Class C | |
| | Six Months
Ended
April 30,
2006 | | Year
Ended
October 31,
2005 | | Six Months
Ended
April 30,
2006 | | Year
Ended
October 31,
2005 | | Six Months
Ended
April 30,
2006 | | Year
Ended
October 31,
2005 | |
Emerging Countries (Number of Shares) | | | | | | | | | | | | | |
Shares sold | | 876,705 | | 1,264,116 | | 113,522 | | 171,033 | | 410,597 | | 575,933 | |
Dividends reinvested | | 17,399 | | 2,583 | | — | | — | | 2,002 | | — | |
Shares redeemed | | (523,576 | ) | (1,042,704 | ) | (104,582 | ) | (285,210 | ) | (79,604 | ) | (154,421 | ) |
Net increase (decrease) in shares outstanding | | 370,528 | | 223,995 | | 8,940 | | (114,177 | ) | 332,995 | | 421,512 | |
| | | | | | | | | | | | | |
Emerging Countries ($) | | | | | | | | | | | | | |
Shares sold | | $ | 23,589,852 | | $ | 28,706,819 | | $ | 3,002,062 | | $ | 3,787,933 | | $ | 10,298,703 | | $ | 12,439,033 | |
Dividends reinvested | | 440,876 | | 53,415 | | — | | — | | 47,440 | | — | |
Shares redeemed | | (14,094,161 | ) | (22,759,798 | ) | (2,739,395 | ) | (6,281,049 | ) | (2,009,222 | ) | (3,238,715 | ) |
Net increase (decrease) | | $ | 9,936,567 | | $ | 6,000,436 | | $ | 262,667 | | $ | (2,493,116 | ) | $ | 8,336,921 | | $ | 9,200,318 | |
| | Class I | | Class M | | Class Q | |
| | December 21,
2005(1) to
April 30,
2006 | | Six Months
Ended
April 30,
2006 | | Year
Ended
October 31,
2005 | | Six Months
Ended
April 30,
2006 | | Year
Ended
October 31,
2005 | |
Emerging Countries (Number of Shares) | | | | | | | | | | | |
Shares sold | | 559,248 | | 1,552 | | 3,080 | | 160,030 | | 197,600 | |
Dividends reinvested | | — | | 46 | | — | | 2,644 | | 579 | |
Shares redeemed | | (88,066 | ) | (1,952 | ) | (9,604 | ) | (72,455 | ) | (202,059 | ) |
Net increase (decrease) in shares outstanding | | 471,182 | | (354 | ) | (6,524 | ) | 90,219 | | (3,880 | ) |
| | | | | | | | | | | |
Emerging Countries ($) | | | | | | | | | | | |
Shares sold | | $ | 15,608,444 | | $ | 41,699 | | $ | 67,841 | | $ | 4,518,618 | | $ | 4,569,365 | |
Dividends reinvested | | — | | 1,146 | | — | | 69,164 | | 12,349 | |
Shares redeemed | | (2,590,337 | ) | (52,392 | ) | (209,918 | ) | (2,039,204 | ) | (4,620,780 | ) |
Net increase (decrease) | | $ | 13,018,107 | | $ | (9,547 | ) | $ | (142,077 | ) | $ | 2,548,578 | | $ | (39,066 | ) |
| | Class A | | Class B | | Class C | |
| | Six Months
Ended
April 30,
2006 | | Year
Ended
October 31,
2005 | | Six Months
Ended
April 30,
2006 | | Year
Ended
October 31,
2005 | | Six Months
Ended
April 30,
2006 | | Year
Ended
October 31, 2005 | |
Foreign (Number of Shares) | | | | | | | | | | | | | |
Shares sold | | 3,671,005 | | 5,350,389 | | 629,257 | | 864,486 | | 2,196,060 | | 3,258,501 | |
Dividends reinvested | | 134,509 | | — | | 27,967 | | — | | 93,622 | | — | |
Shares redeemed | | (1,178,498 | ) | (2,127,775 | ) | (126,522 | ) | (205,551 | ) | (444,580 | ) | (598,703 | ) |
Net increase in shares outstanding | | 2,627,016 | | 3,222,614 | | 530,702 | | 658,935 | | 1,845,102 | | 2,659,798 | |
| | | | | | | | | | | | | |
Foreign ($) | | | | | | | | | | | | | |
Shares sold | | $ | 60,598,731 | | $ | 74,069,872 | | $ | 10,232,274 | | $ | 11,879,135 | | $ | 35,725,335 | | $ | 44,999,926 | |
Dividends reinvested | | 2,082,196 | | — | | 425,093 | | — | | 1,424,923 | | — | |
Shares redeemed | | (19,316,894 | ) | (29,478,835 | ) | (2,050,420 | ) | (2,815,133 | ) | (7,274,305 | ) | (8,239,806 | ) |
Net increase | | $ | 43,364,033 | | $ | 44,591,037 | | $ | 8,606,947 | | $ | 9,064,002 | | $ | 29,875,953 | | $ | 36,760,120 | |
| | Class I | | Class Q | |
| | Six Months
Ended
April 30,
2006 | | Year
Ended
October 31,
2005 | | Six Months
Ended
April 30,
2006 | | Year
Ended
October 31,
2005 | |
Foreign (Number of Shares) | | | | | | | | | |
Shares sold | | 1,290,367 | | 1,482 | | — | | 1,009 | |
Dividends reinvested | | 1,630 | | — | | 1,679 | | — | |
Shares redeemed | | (9,966 | ) | (135,704 | ) | (9,924 | ) | (13,187 | ) |
Net increase (decrease) in shares outstanding | | 1,282,031 | | (134,222 | ) | (8,245 | ) | (12,178 | ) |
| | | | | | | | | |
Foreign ($) | | | | | | | | | |
Shares sold | | $ | 22,486,512 | | $ | 20,576 | | $ | — | | $ | 13,738 | |
Dividends reinvested | | 25,483 | | — | | 26,071 | | — | |
Shares redeemed | | (180,327 | ) | (1,983,638 | ) | (169,761 | ) | (194,215 | ) |
Net increase (decrease) | | $ | 22,331,668 | | $ | (1,963,062 | ) | $ | (143,690 | ) | $ | (180,477 | ) |
(1) Commencement of operations
108
NOTES TO FINANCIAL STATEMENTS AS OF APRIL 30, 2006 (UNAUDITED) (CONTINUED)
NOTE 11 — CAPITAL SHARES (continued)
| | Class A | | Class B | | Class C | |
| | December 21,
2005(1) to
April 30,
2006 | | January 06,
2006(1) to
April 30,
2006 | | January 11,
2006(1) to
April 30,
2006 | |
Greater China (Number of Shares) | | | | | | | |
Shares sold | | 1,483,715 | | 44,957 | | 72,026 | |
Shares redeemed | | (16,669 | ) | (25 | ) | — | |
Net increase in shares outstanding | | 1,467,046 | | 44,932 | | 72,026 | |
| | | | | | | |
Greater China ($) | | | | | | | |
Shares sold | | $ | 15,453,464 | | $ | 511,323 | | $ | 825,407 | |
Shares redeemed | | (180,200 | ) | (284 | ) | — | |
Net increase | | $ | 15,273,264 | | $ | 511,039 | | $ | 825,407 | |
(1) Commencement of operations
| | Class A | | Class B | | Class C | | Class I | |
| | December 21,
2005(1) to
April 30,
2006 | | January 12,
2006(1) to
April 30,
2006 | | January 12,
2006(1) to
April 30,
2006 | | December 21,
2005(1) to
April 30,
2006 | |
Index Plus International Equity (Number of Shares) | | | | | | | | | |
Shares sold | | 1,558,929 | | 11,453 | | 38,185 | | 3,744,167 | |
Shares redeemed | | (5,255 | ) | — | | (482 | ) | (20,665 | ) |
Net increase in shares outstanding | | 1,553,674 | | 11,453 | | 37,703 | | 3,723,502 | |
| | | | | | | | | |
Index Plus International Equity ($) | | | | | | | | | |
Shares sold | | $ | 15,636,690 | | $ | 122,228 | | $ | 405,837 | | $ | 39,855,704 | |
Shares redeemed | | (56,607 | ) | — | | (6,835 | ) | (226,135 | ) |
Net increase | | $ | 15,580,083 | | $ | 122,228 | | $ | 399,002 | | $ | 39,629,569 | |
(1) Commencement of operations
| | Class A | | Class B | | Class C | |
| | Six Months
Ended
April 30,
2006 | | Year
Ended
October 31,
2005 | | Six Months
Ended
April 30,
2006 | | Year
Ended
October 31,
2005 | | Six Months
Ended
April 30,
2006 | | Year
Ended
October 31,
2005 | |
International (Number of Shares) | | | | | | | | | | | | | |
Shares sold | | 589,976 | | 1,286,982 | | 159,113 | | 398,615 | | 82,957 | | 158,046 | |
Dividends reinvested | | 65,163 | | 45,507 | | 9,571 | | 6,257 | | 5,646 | | 3,911 | |
Shares redeemed | | (611,275 | ) | (1,528,096 | ) | (222,507 | ) | (454,549 | ) | (134,857 | ) | (461,767 | ) |
Net increase (decrease) in shares outstanding | | 43,864 | | (195,607 | ) | (53,823 | ) | (49,677 | ) | (46,254 | ) | (299,810 | ) |
| | | | | | | | | | | | | |
International ($) | | | | | | | | | | | | | |
Shares sold | | $ | 7,177,588 | | $ | 13,471,465 | | $ | 1,862,105 | | $ | 4,018,737 | | $ | 989,500 | | $ | 1,592,528 | |
Dividends reinvested | | 754,581 | | 464,320 | | 107,204 | | 61,882 | | 63,297 | | 38,715 | |
Redemption Fee Proceeds | | 257 | | 12,635 | | — | | — | | — | | — | |
Shares redeemed | | (7,489,039 | ) | (15,999,726 | ) | (2,600,271 | ) | (4,604,837 | ) | (1,582,477 | ) | (4,666,612 | ) |
Net increase (decrease) | | $ | 443,387 | | $ | (2,051,306 | ) | $ | (630,962 | ) | $ | (524,218 | ) | $ | (529,680 | ) | $ | (3,035,369 | ) |
109
NOTES TO FINANCIAL STATEMENTS AS OF APRIL 30, 2006 (UNAUDITED) (CONTINUED)
NOTE 11 — CAPITAL SHARES (continued)
| | Class I | | Class Q | |
| | Six Months
Ended
April 30,
2006 | | Year
Ended
October 31,
2005 | | Six Months
Ended
April 30,
2006 | | Year
Ended
October 31,
2005 | |
International (Number of Shares) | | | | | | | | | |
Shares sold | | 288,208 | | 618,736 | | 792,406 | | 832,726 | |
Dividends reinvested | | 41,301 | | 26,513 | | 24,539 | | 9,243 | |
Shares redeemed | | (1,528,027 | ) | (264,569 | ) | (186,344 | ) | (255,015 | ) |
Net increase (decrease) in shares outstanding | | (1,198,518 | ) | 380,680 | | 630,601 | | 586,954 | |
| | | | | | | | | |
International ($) | | | | | | | | | |
Shares sold | | $ | 3,477,895 | | $ | 6,503,305 | | $ | 9,554,848 | | $ | 8,731,410 | |
Dividends reinvested | | 475,409 | | 268,842 | | 281,487 | | 93,629 | |
Shares redeemed | | (17,645,186 | ) | (2,749,364 | ) | (2,196,097 | ) | (2,652,163 | ) |
Net increase (decrease) | | $ | (13,691,882 | ) | $ | 4,022,783 | | $ | 7,640,238 | | $ | 6,172,876 | |
| | Class A | | Class B | | Class C | | Class I | |
| | December 21,
2005(1) to
April 30,
2006 | | January 9,
2006(1) to
April 30,
2006 | | January 24,
2006(1) to
April 30,
2006 | | December 21,
2005(1) to
April 30,
2006 | |
International Capital Appreciation (Number of Shares) | | | | | | | | | |
Shares sold | | 506,589 | | 4,210 | | 3,944 | | 2,278,642 | |
Dividends reinvested | | — | | — | | — | | — | |
Shares redeemed | | (2,847 | ) | — | | — | | (4,519 | ) |
Net increase in shares outstanding | | 503,742 | | 4,210 | | 3,944 | | 2,274,123 | |
| | | | | | | | | |
International Capital Appreciation ($) | | | | | | | | | |
Shares sold | | $ | 5,068,853 | | $ | 44,393 | | $ | 40,999 | | $ | 24,129,253 | |
Dividends reinvested | | — | | — | | — | | — | |
Shares redeemed | | (29,750 | ) | — | | — | | (47,934 | ) |
Net increase | | $ | 5,039,103 | | $ | 44,393 | | $ | 40,999 | | $ | 24,081,319 | |
(1) Commencement of operations
| | Class A | | Class B | | Class C | | Class I | |
| | February 28,
2006(1) to
April 30,
2006 | | February 28,
2006(1) to
April 30,
2006 | | February 28,
2006(1) to
April 30,
2006 | | February 28,
2006(1) to
April 30,
2006 | |
International Real Estate (Number of Shares) | | | | | | | | | |
Shares sold | | 1,591,223 | | 11,421 | | 296,834 | | 102 | |
Dividends reinvested | | 50 | | 2 | | 76 | | — | |
Shares redeemed | | (1,430 | ) | (1 | ) | (96 | ) | (1 | ) |
Net increase in shares outstanding | | 1,589,843 | | 11,422 | | 296,814 | | 101 | |
| | | | | | | | | |
International Real Estate ($) | | | | | | | | | |
Shares sold | | $ | 16,180,013 | | $ | 119,332 | | $ | 3,078,722 | | $ | 1,020 | |
Dividends reinvested | | 528 | | 21 | | 800 | | — | |
Shares redeemed | | (14,953 | ) | (10 | ) | (1,021 | ) | (10 | ) |
Net increase | | $ | 16,165,588 | | $ | 119,343 | | $ | 3,078,501 | | $ | 1,010 | |
(1) Commencement of operations
110
NOTES TO FINANCIAL STATEMENTS AS OF APRIL 30, 2006 (UNAUDITED) (CONTINUED)
NOTE 11 — CAPITAL SHARES (continued)
| | Class A | | Class B | | Class C | |
| | Six Months
Ended
April 30,
2006 | | Year
Ended
October 31,
2005 | | Six Months
Ended
April 30,
2006 | | Year
Ended
October 31,
2005 | | Six Months
Ended
April 30,
2006 | | Year
Ended
October 31,
2005 | |
International SmallCap (Number of Shares) | | | | | | | | | | | | | |
Shares sold | | 1,480,518 | | 2,004,704 | | 123,808 | | 224,730 | | 204,856 | | 190,803 | |
Dividends reinvested | | 28,203 | | — | | 1,067 | | — | | 3,317 | | — | |
Shares redeemed | | (912,344 | ) | (2,690,302 | ) | (222,253 | ) | (678,220 | ) | (134,671 | ) | (438,858 | ) |
Net increase (decrease) in shares outstanding | | 596,377 | | (685,598 | ) | (97,378 | ) | (453,490 | ) | 73,502 | | (248,055 | ) |
| | | | | | | | | | | | | |
International SmallCap ($) | | | | | | | | | | | | | |
Shares sold | | $ | 63,737,656 | | $ | 69,514,851 | | $ | 5,421,235 | | $ | 7,909,327 | | $ | 8,442,682 | | $ | 6,229,347 | |
Dividends reinvested | | 1,143,069 | | — | | 44,742 | | — | | 127,269 | | — | |
Shares redeemed | | (38,610,915 | ) | (92,289,760 | ) | (9,877,245 | ) | (23,667,520 | ) | (5,438,236 | ) | (14,015,886 | ) |
Net increase (decrease) | | $ | 26,269,810 | | $ | (22,774,909 | ) | $ | (4,411,268 | ) | $ | (15,758,193 | ) | $ | 3,131,715 | | $ | (7,786,539 | ) |
| | Class I | | Class Q | |
| | December 21,
2005(1) to
April 30,
2006 | | Six Months
Ended
April 30,
2006 | | Year
Ended
October 31,
2005 | |
International SmallCap (Number of Shares) | | | | | | | |
Shares sold | | 380,488 | | 359,222 | | 268,648 | |
Dividends reinvested | | — | | 12,988 | | — | |
Shares redeemed | | (9,078 | ) | (195,435 | ) | (793,003 | ) |
Net increase (decrease) in shares outstanding | | 371,410 | | 176,775 | | (524,355 | ) |
| | | | | | | |
International SmallCap ($) | | | | | | | |
Shares sold | | $ | 17,098,464 | | $ | 16,211,997 | | $ | 9,711,770 | |
Dividends reinvested | | — | | 564,597 | | — | |
Shares redeemed | | (362,524 | ) | (9,030,428 | ) | (28,611,080 | ) |
Net increase (decrease) | | $ | 16,735,940 | | $ | 7,746,166 | | $ | (18,899,310 | ) |
(1) Commencement of operations
| | Class A | | Class B | | Class C | |
| | Six Months
Ended
April 30,
2006 | | Year
Ended
October 31,
2005 | | Six Months
Ended
April 30,
2006 | | Year
Ended
October 31,
2005 | | Six Months
Ended
April 30,
2006 | | Year
Ended
October 31,
2005 | |
International Value (Number of Shares) | | | | | | | | | | | | | |
Shares sold | | 10,189,433 | | 22,440,717 | | 496,598 | | 733,853 | | 667,524 | | 579,699 | |
Dividends reinvested | | 6,154,438 | | 4,658,879 | | 1,288,594 | | 1,078,233 | | 2,160,993 | | 1,619,582 | |
Shares redeemed | | (13,650,188 | ) | (43,203,094 | ) | (3,914,955 | ) | (6,355,256 | ) | (2,931,685 | ) | (5,949,587 | ) |
Net increase (decrease) in shares outstanding | | 2,693,683 | | (16,103,498 | ) | (2,129,763 | ) | (4,543,170 | ) | (103,168 | ) | (3,750,306 | ) |
| | | | | | | | | | | | | |
International Value ($) | | | | | | | | | | | | | |
Shares sold | | $ | 192,649,260 | | $ | 389,616,539 | | $ | 9,051,724 | | $ | 12,423,736 | | $ | 11,809,978 | | $ | 9,661,315 | |
Dividends reinvested | | 110,779,870 | | 78,640,245 | | 22,846,769 | | 17,941,796 | | 38,163,141 | | 26,885,154 | |
Shares redeemed | | (261,048,508 | ) | (748,947,369 | ) | (73,104,552 | ) | (109,082,787 | ) | (54,560,561 | ) | (101,804,139 | ) |
Net increase (decrease) | | $ | 42,380,622 | | $ | (280,690,585 | ) | $ | (41,206,059 | ) | $ | (78,717,255 | ) | $ | (4,587,442 | ) | $ | (65,257,670 | ) |
111
NOTES TO FINANCIAL STATEMENTS AS OF APRIL 30, 2006 (UNAUDITED) (CONTINUED)
NOTE 11 — CAPITAL SHARES (continued)
| | Class I | | Class Q | |
| | Six Months
Ended
April 30,
2006 | | Year
Ended
October 31,
2005 | | Six Months
Ended
April 30,
2006 | | Year
Ended
October 31,
2005 | |
International Value (Number of Shares) | | | | | | | | | |
Shares sold | | 11,833,756 | | 27,489,973 | | 11,016 | | 27,155 | |
Dividends reinvested | | 4,027,145 | | 2,611,199 | | 92,721 | | 69,842 | |
Shares redeemed | | (6,486,758 | ) | (12,662,805 | ) | (182,086 | ) | (276,510 | ) |
Net increase (decrease) in shares outstanding | | 9,374,143 | | 17,438,367 | | (78,349 | ) | (179,513 | ) |
| | | | | | | | | |
International Value ($) | | | | | | | | | |
Shares sold | | $ | 224,443,500 | | $ | 476,140,222 | | $ | 208,239 | | $ | 474,053 | |
Dividends reinvested | | 72,448,346 | | 44,050,433 | | 1,670,826 | | 1,179,631 | |
Shares redeemed | | (124,086,941 | ) | (220,723,705 | ) | (3,445,530 | ) | (4,799,264 | ) |
Net increase (decrease) | | $ | 172,804,905 | | $ | 299,466,950 | | $ | (1,566,465 | ) | $ | (3,145,580 | ) |
| | Class A | | Class B | | Class C | |
| | Six Months
Ended
April 30,
2006 | | February 1,
2005(1) to
October 31,
2005 | | Six Months
Ended
April 30,
2006 | | February 1,
2005(1) to
October 31,
2005 | | Six Months
Ended
April 30,
2006 | | February 4,
2005(1) to
October 31,
2005 | |
International Value Choice (Number of Shares) | | | | | | | | | | | | | |
Shares sold | | 682,294 | | 651,176 | | 134,497 | | 143,012 | | 130,065 | | 175,350 | |
Dividends reinvested | | 9,872 | | — | | 2,909 | | — | | 3,129 | | — | |
Shares redeemed | | (177,740 | ) | (79,948 | ) | (5,992 | ) | (8,938 | ) | (13,048 | ) | (6,834 | ) |
Net increase in shares outstanding | | 514,426 | | 571,228 | | 131,414 | | 134,074 | | 120,146 | | 168,516 | |
| | | | | | | | | | | | | |
International Value Choice ($) | | | | | | | | | | | | | |
Shares sold | | $ | 7,925,237 | | $ | 6,637,390 | | $ | 1,519,025 | | $ | 1,456,873 | | $ | 1,488,004 | | $ | 1,796,255 | |
Dividends reinvested | | 109,590 | | — | | 32,117 | | — | | 34,613 | | — | |
Shares redeemed | | (2,048,354 | ) | (845,622 | ) | (68,240 | ) | (90,130 | ) | (149,201 | ) | (69,825 | ) |
Net increase | | $ | 5,986,473 | | $ | 5,791,768 | | $ | 1,482,902 | | $ | 1,366,743 | | $ | 1,373,416 | | $ | 1,726,430 | |
| | Class I | |
| | December 21,
2005(1) to
April 30,
2006 | |
International Value Choice (Number of Shares) | | | |
Shares sold | | 1,672,488 | |
Shares redeemed | | (323,869 | ) |
Net increase in shares outstanding | | 1,348,619 | |
| | | |
International Value Choice ($) | | | |
Shares sold | | $ | 19,646,173 | |
Shares redeemed | | (3,996,460 | ) |
Net increase | | $ | 15,649,713 | |
(1) Commencement of operations
| | Class A | |
| | Six Months
Ended
April 30,
2006 | | Year
Ended
October 31,
2005 | |
Precious Metals (Number of Shares) | | | | | |
Shares sold | | 1,216,392 | | 1,303,928 | |
Dividends reinvested | | 18,990 | | 368,023 | |
Shares redeemed | | (1,143,990 | ) | (2,702,207 | ) |
Net increase (decrease) in shares outstanding | | 91,392 | | (1,030,256 | ) |
| | | | | |
Precious Metals ($) | | | | | |
Shares sold | | $ | 11,873,939 | | $ | 8,755,764 | |
Dividends reinvested | | 161,561 | | 2,642,230 | |
Shares redeemed | | (11,104,946 | ) | (17,774,785 | ) |
Net increase (decrease) | | $ | 930,554 | | $ | (6,376,791 | ) |
112
NOTES TO FINANCIAL STATEMENTS AS OF APRIL 30, 2006 (UNAUDITED) (CONTINUED)
NOTE 11 — CAPITAL SHARES (continued)
| | Class A | |
| | Six Months
Ended
April 30,
2006 | | Year
Ended
October 31,
2005 | |
Russia (Number of Shares) | | | | | |
Shares sold | | 6,733,737 | | 3,240,434 | |
Dividends reinvested | | — | | 3,801 | |
Shares redeemed | | (1,470,593 | ) | (3,616,898 | ) |
Net increase (decrease) in shares outstanding | | 5,263,144 | | (372,663 | ) |
| | | | | |
Russia ($) | | | | | |
Shares sold | | $ | 309,014,398 | | $ | 93,862,631 | |
Dividends reinvested | | — | | 96,494 | |
Redemption Fee Proceeds | | 518,566 | | 850,706 | |
Shares redeemed | | (66,835,001 | ) | (96,537,671 | ) |
Net increase (decrease) | | $ | 242,697,963 | | $ | (1,727,840 | ) |
| | Class A | | Class B | | Class C | | Class I | |
| | December 21,
2005(1) to
April 30,
2006 | | January 4,
2006(1) to
April 30,
2006 | | March 1,
2006(1) to
April 30,
2006 | | February 7,
2006(1) to
April 30,
2006 | |
Emerging Markets Fixed Income (Number of Shares) | | | | | | | | | |
Shares sold | | 1,034,675 | | 7,007 | | 15,118 | | 1,226 | |
Dividends reinvested | | 77 | | 55 | | 69 | | 18 | |
Shares redeemed | | (232 | ) | 5 | | — | | — | |
Net increase in shares outstanding | | 1,034,520 | | 7,067 | | 15,187 | | 1,244 | |
| | | | | | | | | |
Emerging Markets Fixed Income ($) | | | | | | | | | |
Shares sold | | $ | 10,354,215 | | $ | 72,119 | | $ | 156,095 | | $ | 12,550 | |
Dividends reinvested | | 783 | | 566 | | 700 | | 190 | |
Shares redeemed | | (2,363 | ) | 48 | | — | | — | |
Net increase | | $ | 10,352,635 | | $ | 72,733 | | $ | 156,795 | | $ | 12,740 | |
(1) Commencement of operations
| | Class A | | Class B | | Class C | | Class I | |
| | December 21,
2005(1) to
April 30,
2006 | | December 21,
2005(1) to
April 30,
2006 | | December 21,
2005(1) to
April 30,
2006 | | December 21,
2005(1) to
April 30,
2006 | |
Diversified International (Number of Shares) | | | | | | | | | |
Shares sold | | 7,733,406 | | 1,173,670 | | 3,451,856 | | 101 | |
Shares redeemed | | (122,955 | ) | (2,701 | ) | (18,532 | ) | — | |
Net increase in shares outstanding | | 7,610,451 | | 1,170,969 | | 3,433,324 | | 101 | |
| | | | | | | | | |
Diversified International ($) | | | | | | | | | |
Shares sold | | $ | 83,350,824 | | $ | 12,603,662 | | $ | 37,123,253 | | $ | 1,057 | |
Shares redeemed | | (1,344,662 | ) | (30,283 | ) | (204,499 | ) | — | |
Net increase | | $ | 82,006,162 | | $ | 12,573,379 | | $ | 36,918,754 | | $ | 1,057 | |
(1) Commencement of operations
113
NOTES TO FINANCIAL STATEMENTS AS OF APRIL 30, 2006 (UNAUDITED) (CONTINUED)
NOTE 12 — ILLIQUID SECURITIES
Pursuant to guidelines adopted by the Fund’s Board, the following securities have been deemed to be illiquid. The Funds currently limit investments in illiquid securities to 15% of the Fund’s net assets, at market value, at time of purchase.
Fund | | Security | | Shares | | Initial
Acquisition
Date | | Cost | | Value | | Percent
of Net
Assets | |
Emerging Markets | | | | | | | | | | | | | |
Fixed Income | | Citigroup Funding, Inc., 0.000%, due 08/17/10 | | 252,290 | | 02/21/06 | | $ 252,536 | | $ 253,895 | | | 2.3 | % |
| | | | | | | | $ 252,536 | | $ 253,895 | | | 2.3 | % |
| | | | | | | | | | | | | | |
Foreign | | Bulgarian Compensation Notes | | 60,720 | | 04/06/05 | | $ 27,710 | | $ 25,142 | | | 0.0 | % |
| | Bulgarian Housing Compensation Notes | | 25,950 | | 04/06/05 | | 12,145 | | 10,737 | | | 0.0 | % |
| | Bulgarian Registered Comp Vouchers | | 117,641 | | 04/05/05 | | 53,276 | | 48,522 | | | 0.0 | % |
| | Centernergo ADR | | 1,530 | | 12/17/03 | | 3,623 | | 12,647 | | | 0.0 | % |
| | OJSC TNK -BP HOLDING | | 225,232 | | 02/03/05 | | 533,778 | | 765,789 | | | 0.2 | % |
| | RenShares Utilities Ltd. | | 104,109 | | 02/22/06 | | 165,580 | | 200,930 | | | 0.0 | % |
| | Ukrnafta Open JT STK ADR | | 87 | | 12/28/04 | | 10,005 | | 31,123 | | | 0.0 | % |
| | Polyus Gold ADR | | 18,360 | | 10/22/04 | | 293,760 | | 293,760 | | | 0.1 | % |
| | UkrTelecom ADR | | 16,172 | | 12/17/04 | | 114,476 | | 175,191 | | | 0.0 | % |
| | | | | | | | $1,214,353 | | $ 1,563,841 | | | 0.3 | % |
| | | | | | | | | | | | | | |
Russia | | Konakovskaya Gres | | 2,842,200 | | 10/06/03 | | $1,539,366 | | $ 2,785,356 | | | 0.4 | % |
| | Novy Neft Ltd. | | 142,452 | | 11/14/03 | | 1,964,885 | | 9,839,872 | | | 1.3 | % |
| | Novy Neft Ltd. II | | 240,219 | | 02/23/04 | | 2,516,576 | | 11,579,757 | | | 1.6 | % |
| | | | | | | | $6,020,827 | | $24,204,985 | | | 3.3 | % |
| | | | | | | | | | | | | | | |
NOTE 13 — CONCENTRATION OF RISKS
Foreign Securities (All Funds). Investments in foreign securities may entail risks not present in domestic investments. Since securities in which the Funds may invest are denominated in foreign currencies, changes in the relationship of these foreign currencies to the U.S. dollar can significantly affect the value of the investments and earnings of the Funds. Foreign investments may also subject the Funds to foreign government exchange restrictions, expropriation, taxation or other political, social or economic developments, as well as changes vis-a-vis the U.S. dollar from movements in currency, and changes in security value and interest rate, all of which could affect the market and/or credit risk of the Funds’ investments.
Emerging Markets Investments (All Funds except Index Plus International Equity). Because of less developed markets and economies and, in some countries, less mature governments and governmental institutions, the risks of investing in foreign securities can be intensified in the case of investments in issuers domiciled or doing substantial business in emerging market countries.
Industry Concentration (Global Real Estate, International Real Estate, and Precious Metals). As a result of the Funds’ concentrating their assets in securities related to a particular industry, each Fund may be subject to greater market fluctuation than a fund that invests in securities representing a broader range of investment alternatives.
Geographic Concentration (Greater China and Russia). As a result of the Funds’ concentrating their assets in a single region of the world, the Fund’s performance may be more volatile than that of a fund that invests globally. If securities in the region that each Fund is concentrated fall out of favor, it may cause the Fund to underperform in relation to funds that focus on other types of stocks.
Non-Diversified (Global Real Estate, Greater China, International Real Estate, Precious Metals, Russia, and Emerging Markets Fixed Income). The Funds are each classified as non-diversified investment companies under the 1940 Act, which means that each Fund is not limited by the 1940 Act in the proportion of assets that they may invest in the obligations of a single issuer. Declines in the value of that single company can significantly impact the value of a Fund. The investment of a large percentage of a Fund’s assets in the securities of a small number of issuers may cause the Funds’ share price to fluctuate more than that of a diversified investment company. Conversely, even though classified as non-diversified, a Fund may actually maintain a portfolio that is diversified with a large number of issuers. In such an event, a Fund would benefit less from appreciation in a single corporate issuer than if it had greater exposure to that issuer.
Restricted and Illiquid Securities (Greater China and Emerging Markets Fixed Income). If a security is illiquid, a Fund may not be able to sell the security at a time when the Adviser or a Sub-Adviser might wish to sell, and the security could have the effect of decreasing the overall level of a Fund’s liquidity. Further, the lack of an established secondary market may make it more difficult to value illiquid securities,
114
NOTES TO FINANCIAL STATEMENTS AS OF APRIL 30, 2006 (UNAUDITED) (CONTINUED)
NOTE 13 — CONCENTRATION OF RISKS (continued)
which could vary from the amount a Fund could realize upon disposition. Restricted securities, i.e., securities subject to legal or contractual restrictions on resale, may be illiquid. However, some restricted securities may be treated as liquid, although they may be less liquid than registered securities traded on established secondary markets.
Rule 144A Securities (Greater China). Rule 144A securities are securities that are not registered, but which are bought and sold solely by institutional investors. The Fund considers Rule 144A securities to be “liquid” although the market for such securities typically is less active than public securities markets and may lead to less ability to sell these securities.
NOTE 14 — SECURITIES LENDING
Under an agreement with The Bank of New York (“BNY”), the Funds can lend their securities to approved brokers, dealers and other financial institutions. Loans are collateralized by cash and U.S. Government securities. The collateral must be in an amount equal to at least 105% of the market value of non-U.S. securities loaned and 102% of the market value of U.S. securities loaned. The cash collateral received is invested in approved investments as defined in the Securities Lending Agreement with BNY (the “Agreement”). The securities purchased with cash collateral received are reflected in the Portfolio of Investments. Generally, in the event of counterparty default, the Funds have the right to use the collateral to offset losses incurred. The Agreement contains certain guarantees by BNY in the event of counterparty default and/or a borrower’s failure to return a loaned security, however there would be a potential loss to the Funds in the event the Funds are delayed or prevented from exercising their right to dispose of the collateral. The Funds bear the risk of loss with respect to the investment of collateral. Engaging in securities lending could have a leveraging effect, which may intensify the credit, market and other risks associated with investing in a Fund. At April 30, 2006, the following Funds had securities on loan with the following market values:
Fund | | Value of
Securities
Loaned | | Value of
Collateral | |
Global Value Choice | | $18,474,705 | | $18,930,538 | |
Emerging Countries | | 32,219,145 | | 33,476,488 | |
Foreign | | 12,394,933 | | 12,719,705 | |
International | | 317,070 | | 326,444 | |
International SmallCap | | 89,616,941 | | 95,176,761 | |
International Value | | 82,674,492 | | 91,188,226 | |
Russia | | 64,944,030 | | 65,421,771 | |
NOTE 15 — FEDERAL INCOME TAXES
The amount of distributions from net investment income and net realized capital gains are determined in accordance with federal income tax regulations, which may differ from U.S. generally accepted accounting principles for investment companies. These book/tax differences may be either temporary or permanent. Permanent differences are reclassified within the capital accounts based on their federal tax-basis treatment; temporary differences are not reclassified. Key differences include the treatment of short-term capital gains, foreign currency transactions, and wash sale deferrals. Distributions in excess of net investment income and/or net realized capital gains for tax purposes are reported as distributions of paid-in capital.
Dividends paid by a Fund from net investment income and distributions of net realized short-term capital gains are, for federal income tax purposes, taxable as ordinary income to shareholders.
The tax composition of dividends and distributions to shareholders was as follows:
| | Six Months Ended April 30, 2006 | | Year Ended October 31, 2005 | |
| | Ordinary
Income | | Long-Term
Capital Gains | | Ordinary
Income | | Long-Term
Capital Gains | |
Global Equity Dividend | | $ 3,280,817 | | $ 828,141 | | $ 3,156,591 | | $ 8,751 | |
Global Real Estate(1) | | 10,906,488 | | 4,790,208 | | 9,149,441 | | 1,825,148 | |
Global Value Choice | | 397,470 | | — | | 9,149,441 | | 1,825,148 | |
Emerging Countries | | 671,817 | | — | | 72,677 | | — | |
Foreign | | — | | 6,096,805 | | — | | — | |
International | | 1,814,101 | | — | | 1,011,092 | | — | |
International Real Estate | | 15,287 | | — | | — | | — | |
International SmallCap | | 2,373,750 | | — | | — | | — | |
International Value | | 49,299,120 | | 295,092,915 | | 47,073,127 | | 184,904,220 | |
International Value Choice | | 269,623 | | — | | — | | — | |
Precious Metals | | 180,375 | | — | | 2,990,570 | | — | |
Russia | | — | | — | | 111,452 | | — | |
Emerging Markets Fixed Income | | 200,185 | | — | | — | | — | |
(1) | | Composition of dividends and distributions presented herein differ from final amounts based on the Fund’s tax year-end of December 31, 2005. |
115
NOTES TO FINANCIAL STATEMENTS AS OF APRIL 30, 2006 (UNAUDITED) (CONTINUED)
NOTE 15 — FEDERAL INCOME TAXES (continued)
The tax-basis components of distributable earnings and the expiration dates of the capital loss carryforwards which may be used to offset future realized capital gains for federal income tax purposes as of October 31, 2005 were:
| | Undistributed
Ordinary
Income | | Undistributed
Long Term
Capital Gains | | Unrealized
Appreciation/
Depreciation | | Post-
October
Currency
Losses
Deferred | | Capital
Loss
Carryforwards | | Expiration
Dates | |
Global Equity Dividend | | $ | 1,498,273 | | $ | 827,494 | | $ | 668,755 | | $ | — | | $ | — | | — | | |
Global Real Estate(1) | | 4,020,925 | | 1,259,587 | | 21,712,266 | | (105,095 | ) | — | | — | | |
Global Value Choice | | 396,434 | | — | | 3,490,697 | | — | | $ | (102,001,944 | ) | 2009 | | |
| | | | | | | | | | (81,779,077 | ) | 2010 | | |
| | | | | | | | | | (6,183,953 | ) | 2011 | | |
| | | | | | | | | | $ | (189,964,974 | ) | | | |
Emerging Countries | | 670,276 | | — | | 3,670,186 | | — | | $ | (710,694 | ) | 2007 | | |
| | | | | | | | | | (10,231,430 | ) | 2008 | | |
| | | | | | | | | | (31,553,234 | ) | 2009 | | |
| | | | | | | | | | (18,266,429 | ) | 2010 | | |
| | | | | | | | | | $ | (60,761,787 | )* | | | |
Foreign | | — | | 6,094,388 | | 29,965,937 | | — | | — | | — | | |
International | | 1,737,951 | | — | | 8,440,406 | | — | | $ | (2,735,596 | ) | 2007 | | |
| | | | | | | | | | (3,061,891 | ) | 2008 | | |
| | | | | | | | | | (2,802,182 | ) | 2010 | | |
| | | | | | | | | | (2,172,053 | ) | 2011 | | |
| | | | | | | | | | $ | (10,771,722 | ) | | | |
International SmallCap | | 2,368,870 | | — | | 40,093,875 | | — | | $ | (6,087,776 | ) | 2009 | | |
| | | | | | | | | | (57,646,473 | ) | 2010 | | |
| | | | | | | | | | $ | (63,734,249 | ) | | | |
International Value | | 49,269,447 | | 295,069,722 | | 545,240,077 | | — | | — | | — | | |
International Value Choice | | 262,270 | | — | | 245,759 | | — | | — | | — | | |
Precious Metals | | 136,502 | | — | | 14,921,684 | | — | | $ | (10,079,564 | ) | 2007 | | |
| | | | | | | | | | (14,912,400 | ) | 2008 | | |
| | | | | | | | | | (10,385,023 | ) | 2009 | | |
| | | | | | | | | | $ | (35,376,987 | ) | | | |
Russia | | — | | — | | 96,587,012 | | — | | $ | (2,987,038 | ) | 2009 | | |
| | | | | | | | | | | | | | | | | | | |
* Utilization of these capital losses is subject to annual limitations under Section 382 of the Internal Revenue Code.
(1) As of the Fund’s tax year-end of December 31, 2004.
NOTE 16 — INFORMATION REGARDING TRADING OF ING’S U.S. MUTUAL FUNDS
ING Investments has reported to the Boards of Directors/Trustees (the “Boards”) of the ING Funds that, like many U.S. financial services companies, ING Investments and certain of its U.S. affiliates have received informal and formal requests for information since September 2003 from various governmental and self-regulatory agencies in connection with investigations related to mutual funds and variable insurance products. ING Investments has advised the Boards that it and its affiliates have cooperated fully with each request.
In addition to responding to regulatory and governmental requests, ING Investments reported that management of U.S. affiliates of ING Groep N.V., including ING Investments (collectively, “ING”), on their own initiative, have conducted, through independent special counsel and a national accounting firm, an extensive internal review of trading in ING insurance, retirement, and mutual fund products. The goal of this review was to identify any instances of inappropriate trading in those products by third parties or by ING investment professionals and other ING personnel. ING’s internal review related to mutual fund trading is now substantially completed. ING has reported that, of the millions of customer relationships that ING maintains, the internal review identified several isolated arrangements allowing third parties to engage in frequent trading of mutual funds within ING’s variable insurance and mutual fund products, and identified other circumstances where frequent trading occurred, despite measures taken by ING intended to combat market timing. ING further reported that each of these arrangements has been terminated and fully disclosed to regulators. The results of the internal review were also reported to the independent members of the Board.
ING Investments has advised the Board that most of the identified arrangements were initiated prior to ING’s acquisition of the businesses in question in the U.S. ING Investments further reported that the companies in question did not receive special benefits
116
NOTES TO FINANCIAL STATEMENTS AS OF APRIL 30, 2006 (UNAUDITED) (CONTINUED)
NOTE 16 — INFORMATION REGARDING TRADING OF ING’S U.S. MUTUAL FUNDS (continued)
in return for any of these arrangements, which have all been terminated.
Based on the internal review, ING Investments has advised the Board that the identified arrangements do not represent a systemic problem in any of the companies that were involved.
In September 2005, ING Funds Distributor, LLC (“IFD”), the distributor of certain ING Funds, settled an administrative proceeding with the NASD regarding three arrangements, dating from 1995, 1996 and 1998, under which the administrator to the then-Pilgrim Funds, which subsequently became part of the ING Funds, entered into formal and informal arrangements that permitted frequent trading. Under the terms of the Letter of Acceptance, Waiver and Consent (“AWC”) with the NASD, under which IFD neither admitted nor denied the allegations or findings, IFD consented to the following sanctions: (i) a censure; (ii) a fine of $1.5 million; (iii) restitution of approximately $1.44 million to certain ING Funds for losses attributable to excessive trading described in the AWC; and (iv) agreement to make certification to NASD regarding the review and establishment of certain procedures.
In addition to the arrangements discussed above, ING Investments reported to the Board that, at this time, these instances include the following, in addition to the arrangements subject to the AWC discussed above:
• Aeltus Investment Management, Inc. (a predecessor entity to ING Investment Management Co.) has identified two investment professionals who engaged in extensive frequent trading in certain ING Funds. One was subsequently terminated for cause and incurred substantial financial penalties in connection with this conduct and the second has been disciplined.
• ReliaStar Life Insurance Company (“ReliaStar”) entered into agreements seven years ago permitting the owner of policies issued by the insurer to engage in frequent trading and to submit orders until 4pm Central Time. In 2001 ReliaStar also entered into a selling agreement with a broker-dealer that engaged in frequent trading. Employees of ING affiliates were terminated and/or disciplined in connection with these matters.
• In 1998, Golden American Life Insurance Company entered into arrangements permitting a broker-dealer to frequently trade up to certain specific limits in a fund available in an ING variable annuity product. No employee responsible for this arrangement remains at the company.
For additional information regarding these matters, you may consult the Form 8-K and Form 8-K/A for each of four life insurance companies, ING USA Annuity and Life Insurance Company, ING Life Insurance and Annuity Company, ING Insurance Company of America, and ReliaStar Life Insurance Company of New York, each filed with the Securities and Exchange Commission (the “SEC”) on October 29, 2004 and September 8, 2004. These Forms 8-K and Forms 8-K/A can be accessed through the SEC’s Web site at http://www.sec.gov. Despite the extensive internal review conducted through independent special counsel and a national accounting firm, there can be no assurance that the instances of inappropriate trading reported to the Board are the only instances of such trading respecting the ING Funds.
ING Investments reported to the Board that ING is committed to conducting its business with the highest standards of ethical conduct with zero tolerance for noncompliance. Accordingly, ING Investments advised the Board that ING management was disappointed that its voluntary internal review identified these situations. Viewed in the context of the breadth and magnitude of its U.S. business as a whole, ING management does not believe that ING’s acquired companies had systemic ethical or compliance issues in these areas. Nonetheless, Investments reported that given ING’s refusal to tolerate any lapses, it has taken the steps noted below, and will continue to seek opportunities to further strengthen the internal controls of its affiliates.
• ING has agreed with the ING Funds to indemnify and hold harmless the ING Funds from all damages resulting from wrongful conduct by ING or its employees or from ING’s internal investigation, any investigations conducted by any governmental or self-regulatory agencies, litigation or other formal proceedings, including any proceedings by the Securities and Exchange Commission. ING Investments reported to the Board that ING management believes that the total amount of any indemnification obligations will not be material to ING or its U.S. business.
• ING updated its Code of Conduct for employees reinforcing its employees’ obligation to conduct personal trading activity consistent with the law, disclosed limits, and other requirements.
117
NOTES TO FINANCIAL STATEMENTS AS OF APRIL 30, 2006 (UNAUDITED) (CONTINUED)
NOTE 16 — INFORMATION REGARDING TRADING OF ING’S U.S. MUTUAL FUNDS (continued)
• The ING Funds, upon a recommendation from ING, updated their respective Codes of Ethics applicable to investment professionals with ING entities and certain other fund personnel, requiring such personnel to pre-clear any purchases or sales of ING Funds that are not systematic in nature (i.e., dividend reinvestment), and imposing minimum holding periods for shares of ING Funds.
• ING instituted excessive trading policies for all customers in its variable insurance and retirement products and for shareholders of the ING Funds sold to the public through financial intermediaries. ING does not make exceptions to these policies.
• ING reorganized and expanded its U.S. Compliance Department, and created an Enterprise Compliance team to enhance controls and consistency in regulatory compliance.
As has been widely reported in the media, the New York Attorney General’s office (“NYAG”) is conducting broad investigations regarding insurance quoting and brokerage practices. ING U.S. has been subpoenaed in this regard, and is cooperating fully with these NYAG requests for information.
ING U.S. believes that its practices are consistent with our business principles and our commitment to our customers.
At this time, in light of the current regulatory factors, ING U.S. is actively engaged in reviewing whether any modifications in our practices are appropriate for the future.
There can be no assurance that these matters, or the adverse publicity associated with them, will not result in increased fund redemptions, reduced sale of fund shares, or other adverse consequences to ING Funds.
118
| | PORTFOLIO OF INVESTMENTS |
Ing GLOBAL EQUITY DIVIDEND FUND | | AS OF APRIL 30, 2006 (UNAUDITED) |
Shares | | | | Value | |
COMMON STOCK: 93.8% | | | |
| | Australia: 8.5% | | | |
96,574 | | | Australia & New Zealand Banking Group Ltd. | | $ | 2,048,823 | |
170,518 | | | Coca-Cola Amatil Ltd. | | 941,613 | |
466,512 | | | Foster’s Group Ltd. | | 2,083,714 | |
71,959 | | | Publishing & Broadcasting Ltd. | | 1,015,087 | |
111,861 | | | Santos Ltd. | | 1,004,159 | |
82,007 | | | St. George Bank Ltd. | | 1,919,669 | |
169,410 | | | Stockland | | 885,117 | |
75,960 | | | SunCorp.-Metway Ltd. | | 1,173,079 | |
85,126 | | | TABCorp. Holdings Ltd. | | 988,225 | |
69,472 | | | Wesfarmers Ltd. | | 1,907,900 | |
140,964 | | | Westfield Group | | 1,812,694 | |
| | | | | 15,780,080 | |
| | | Belgium: 2.0% | | | |
53,350 | | | Belgacom SA | | 1,742,803 | |
51,806 | | | Fortis | | 1,938,868 | |
| | | | | 3,681,671 | |
| | | Brazil: 2.7% | | | |
29,697 | | | Cia Siderurgica Nacional SA ADR | | 1,045,631 | |
23,154 | | | Petroleo Brasileiro SA ADR | | 2,058,159 | |
107,033 | | | Tele Norte Leste Participacoes SA ADR | | 1,945,860 | |
| | | | | 5,049,650 | |
| | | Canada: 6.4% | | | |
108,344 | | | BCE, Inc. | | 2,663,761 | |
23,806 | | | Canadian Imperial Bank of Commerce | | 1,758,017 | |
16,462 | | | Enerplus Resources Fund | | 882,199 | |
44,687 | | | Fording Canadian Coal Trust | | 1,642,247 | |
30,406 | | | Penn West Energy Trust | | 1,174,127 | |
53,493 | | | Precision Drilling Corp. | | 1,895,205 | |
59,714 | | | TransCanada Corp. | | 1,759,633 | |
| | | | | 11,775,189 | |
| | | China: 1.0% | | | |
1,674,000 | | | PetroChina Co., Ltd. | | 1,871,512 | |
| | | | | 1,871,512 | |
| | | Denmark: 1.0% | | | |
48,300 | | | Danske Bank A/S | | 1,916,974 | |
| | | | | 1,916,974 | |
| | | France: 2.9% | | | |
74,850 | | | France Telecom SA | | 1,741,265 | |
11,725 | | | Societe Generale | | 1,786,833 | |
50,869 | | | Vivendi Universal SA | | 1,854,448 | |
| | | | | 5,382,546 | |
| | | Germany: 2.0% | | | |
98,940 | | @ | Deutsche Telekom AG | | 1,788,018 | |
16,087 | | | EON AG | | 1,966,882 | |
| | | | | 3,754,900 | |
| | | Greece: 0.9% | | | |
45,808 | | | OPAP SA | | 1,682,502 | |
| | | | | 1,682,502 | |
| | Hong Kong: 1.0% | | | |
284,000 | | Citic Pacific Ltd. | | $ | 1,021,572 | |
142,500 | | CLP Holdings Ltd. | | 830,804 | |
| | | | 1,852,376 | |
| | Ireland: 1.0% | | | |
74,329 | | Allied Irish Banks PLC | | 1,794,870 | |
| | | | 1,794,870 | |
| | Israel: 0.7% | | | |
234,519 | | Bank Hapoalim Ltd. | | 1,204,509 | |
| | | | 1,204,509 | |
| | Italy: 7.5% | | | |
291,413 | | Banca Intesa S.p.A. | | 1,723,935 | |
250,591 | | Enel S.p.A. | | 2,164,854 | |
93,674 | | ENI-Ente Nazionale Idrocarburi S.p.A. | | 2,862,145 | |
147,951 | | Mediaset S.p.A. | | 1,869,422 | |
394,353 | | Snam Rete Gas S.p.A. | | 1,764,459 | |
659,843 | | Telecom Italia S.p.A. | | 1,647,661 | |
238,274 | | UniCredito Italiano S.p.A. | | 1,791,950 | |
| | | | 13,824,426 | |
| | Mexico: 0.6% | | | |
326,140 | | Grupo Mexico SA de CV | | 1,141,358 | |
| | | | 1,141,358 | |
| | Netherlands: 3.5% | | | |
57,460 | | ABN Amro Holding NV | | 1,705,749 | |
8,678 | | Rodamco Europe NV | | 932,430 | |
56,297 | | Royal Dutch Shell PLC | | 1,923,239 | |
156,123 | | Royal KPN NV | | 1,832,254 | |
| | | | 6,393,672 | |
| | New Zealand: 1.0% | | | |
528,659 | | Telecom Corp. of New Zealand Ltd. | | 1,921,256 | |
| | | | 1,921,256 | |
| | Norway: 1.0% | | | |
136,205 | | DNB Holding ASA | | 1,882,633 | |
| | | | 1,882,633 | |
| | Portugal: 1.5% | | | |
93,053 | | Brisa-Auto Estradas de Portugal SA | | 977,878 | |
142,997 | | Portugal Telecom SGPS SA | | 1,812,618 | |
| | | | 2,790,496 | |
| | Singapore: 1.0% | | | |
184,000 | | United Overseas Bank Ltd. | | 1,897,013 | |
| | | | 1,897,013 | |
| | South Africa: 1.9% | | | |
153,005 | | Edgars Consolidated Stores Ltd. | | 959,579 | |
62,619 | | Standard Bank Group Ltd. | | 886,736 | |
67,394 | | Telkom SA Ltd. | | 1,589,376 | |
| | | | 3,435,691 | |
| | South Korea: 1.1% | | | |
110 | | KT Corp. | | 4,949 | |
41,732 | | KT Corp. ADR | | 971,104 | |
13,690 | | S-Oil Corp. | | 1,060,349 | |
| | | | 2,036,402 | |
| | | | | | | | |
See Accompanying Notes to Financial Statements
119
| | PORTFOLIO OF INVESTMENTS |
Ing GLOBAL EQUITY DIVIDEND FUND | | AS OF APRIL 30, 2006 (UNAUDITED) (CONTINUED) |
Shares | | | | Value | |
| | Spain: 0.5% | | | |
75,771 | | Telefonica Publicidad e Informacion SA | | $ | 835,781 | |
| | | | 835,781 | |
| | Sweden: 2.7% | | | |
21,300 | | Scania AB | | 987,871 | |
41,185 | | Svenska Cellulosa AB | | 1,859,183 | |
43,500 | | Volvo AB | | 2,183,297 | |
| | | | 5,030,351 | |
| | Thailand: 0.7% | | | |
253,800 | | Advanced Info Service PLC | | 597,029 | |
112,400 | | Siam Cement PLC | | 758,261 | |
| | | | 1,355,290 | |
| | United Kingdom: 10.3% | | | |
149,214 | | Barclays PLC | | 1,848,132 | |
178,695 | | BBA Group PLC | | 851,169 | |
114,168 | | Diageo PLC | | 1,871,350 | |
539,840 | | Dixons Group PLC | | 1,799,667 | |
65,873 | | GlaxoSmithKline PLC | | 1,887,021 | |
107,768 | | GUS PLC | | 2,011,395 | |
57,874 | | Imperial Tobacco Group PLC | | 1,788,174 | |
686,682 | | Legal & General Group PLC | | 1,727,540 | |
71,707 | | Provident Financial PLC | | 813,144 | |
81,046 | | Royal Bank of Scotland Group PLC | | 2,627,495 | |
86,987 | | Severn Trent PLC | | 1,823,419 | |
| | | | 19,048,506 | |
| | United States: 30.4% | | | |
22,703 | | AGL Resources, Inc. | | 803,232 | |
36,153 | | Altria Group, Inc. | | 2,644,953 | |
34,412 | | Ameren Corp. | | 1,733,332 | |
49,320 | | American Capital Strategies Ltd. | | 1,717,322 | |
31,023 | | Arthur J Gallagher & Co. | | 851,271 | |
67,019 | | AT&T, Inc. | | 1,756,568 | |
56,537 | | Bank of America Corp. | | 2,822,327 | |
54,708 | | Citigroup, Inc. | | 2,732,665 | |
97,752 | | Citizens Communications Co. | | 1,298,147 | |
82,449 | | ConAgra Foods, Inc. | | 1,869,943 | |
15,849 | | Developers Diversified Realty Corp. | | 843,167 | |
60,786 | | Duke Energy Corp. | | 1,770,088 | |
18,405 | | Duke Realty Corp. | | 651,537 | |
40,955 | | EI Du Pont de Nemours & Co. | | 1,806,116 | |
35,315 | | Energy East Corp. | | 853,210 | |
41,109 | | First Horizon National Corp. | | 1,743,844 | |
15,765 | | Hospitality Properties Trust | | 679,472 | |
18,284 | | iStar Financial, Inc. | | 699,546 | |
47,088 | | Keycorp | | 1,799,703 | |
23,397 | | Kinder Morgan Energy Partners LP | | 1,086,323 | |
18,978 | | Kinder Morgan, Inc. | | 1,670,444 | |
14,684 | | Liberty Property Trust | | 656,375 | |
48,698 | | Merck & Co., Inc. | | 1,676,185 | |
41,536 | | Oneok, Inc. | | 1,371,103 | |
68,349 | | Pfizer, Inc. | | 1,731,280 | |
25,349 | | Public Service Enterprise Group, Inc. | | 1,589,382 | |
20,376 | | Rayonier, Inc. | | 838,676 | |
51,416 | | Regal Entertainment Group | | 1,080,764 | |
16,272 | | Reynolds America, Inc. | | 1,784,225 | |
97,313 | | Sara Lee Corp. | | $ | 1,738,983 | |
8,190 | | Simon Property Group LP | | 670,597 | |
53,107 | | Southern Co. | | 1,711,639 | |
29,511 | | Thornburg Mortgage, Inc. | | 853,163 | |
30,447 | | United Dominion Realty Trust, Inc. | | 827,854 | |
54,363 | | US BanCorp. | | 1,709,173 | |
63,623 | | UST, Inc. | | 2,794,958 | |
21,056 | | Ventas, Inc. | | 687,900 | |
56,590 | | Washington Mutual, Inc. | | 2,549,945 | |
| | | | 56,105,412 | |
| | Total Common Stock
(Cost $155,979,465) | | 173,445,066 | |
WARRANTS: 2.9% | | | | | | |
| | India: 1.4% | | | | | |
45,395 | @ | Oil & Natural Gas Corp., Ltd. | | | | 1,305,106 | |
655,000 | @ | Steel Authority of India Ltd. | | | | 1,198,650 | |
| | | | | | 2,503,756 | |
| | Luxembourg: 0.5% | | | | | |
598,000 | @ | Lite-On Technology Corp. | | | | 944,840 | |
| | | | | | 944,840 | |
| | Taiwan: 1.0% | | | | | |
556,890 | @ | Formosa Chemicals & Fibre Corp. | | | | 902,163 | |
1,206,000 | @,# | Mega Financial Holdings Co., Ltd. | | | | 940,680 | |
| | | | | | 1,842,843 | |
| | Total Warrants
(Cost $4,304,883) | | | | 5,291,439 | |
| | Total Long-Term Investments:
(Cost $160,284,348) | | | | 178,736,505 | |
| | | | | | | |
| | Total Investments In Securities (Cost $160,284,348)* | | 96.7 | % | $178,736,505 | |
| | Other Assets and Liabilities-Net | | 3.3 | | 6,177,867 | |
| | Net Assets | | 100.0 | % | $184,914,372 | |
| | Securities may have been fair valued in accordance with procedures approved by the Board of Directors/Trustees (Note 2A). |
@ | | Non-income producing security |
ADR | | American Depositary Receipt |
# | | Securities with purchases pursuant to Rule 144A, under the Securities Act of 1933 and may not be resold subject to that rule except to qualified institutional buyers. These securities have been determined to be liquid under the guidelines established by the Funds’ Board of Directors/Trustees. |
* | | Cost for federal income tax purposes is $160,381,595 |
| Net unrealized appreciation consists of: | | | |
| Gross Unrealized Appreciation | | $19,941,316 | |
| Gross Unrealized Depreciation | | (1,586,406 | ) |
| Net Unrealized Appreciation | | $18,354,910 | |
| | | | | | |
See Accompanying Notes to Financial Statements
120
| | PORTFOLIO OF INVESTMENTS |
Ing GLOBAL EQUITY DIVIDEND FUND | | AS OF APRIL 30, 2006 (UNAUDITED) (CONTINUED) |
Industry | | Percentage of
Net Assets | |
Advertising | | 0.5 | % |
Agriculture | | 4.9 | |
Auto Manufacturers | | 1.7 | |
Banks | | 21.0 | |
Beverages | | 2.6 | |
Building Materials | | 0.4 | |
Chemicals | | 1.5 | |
Coal | | 0.9 | |
Commercial Services | | 0.5 | |
Computers | | 0.5 | |
Diversified Financial Services | | 2.4 | |
Electric | | 6.8 | |
Entertainment | | 2.0 | |
Food | | 1.9 | |
Forest Products & Paper | | 1.5 | |
Gas | | 2.1 | |
Holding Companies - Diversified | | 0.6 | |
Insurance | | 1.4 | |
Investment Companies | | 0.9 | |
Iron/Steel | | 1.2 | |
Media | | 2.6 | |
Mining | | 0.6 | |
Miscellaneous Manufacturing | | 1.5 | |
Oil & Gas | | 8.7 | |
Pharmaceuticals | | 2.9 | |
Pipelines | | 2.4 | |
Real Estate | | 1.5 | |
Real Estate Investment Trust | | 3.6 | |
Retail | | 2.6 | |
Savings & Loans | | 1.4 | |
Telecommunications | | 12.6 | |
Water | | 1.0 | |
Other Assets and Liabilities, Net | | | 3.3 | |
Total Net Assets | | | 100.0 | % |
| | | | | |
See Accompanying Notes to Financial Statements
121
| | PORTFOLIO OF INVESTMENTS |
ING GLOBAL REAL ESTATE FUND | | AS OF APRIL 30, 2006 (UNAUDITED) |
Shares | | Value | |
COMMON STOCK: 96.5% | | | |
| | Australia: 8.4% | | | |
1,301,900 | | DB Rreef Trust | | $ | 1,447,845 | |
1,421,500 | | GPT Group | | 4,532,114 | |
886,100 | | Investa Property Group | | 1,459,963 | |
1,007,600 | | Macquarie CountryWide Trust | | 1,476,197 | |
517,000 | | Macquarie Goodman Group | | 2,023,424 | |
459,100 | | Mirvac Group | | 1,475,348 | |
688,700 | | Prime Retail Group | | 3,394,822 | |
725,978 | | Westfield Group | | 9,335,545 | |
| | | | 25,145,258 | |
| | Canada: 2.3% | | | |
64,000 | @,# | Calloway Real Estate Investment Trust | | 1,393,601 | |
146,800 | | RioCan Real Estate Investment Trust | | 2,790,451 | |
124,700 | | Summit Real Estate Investment Trust | | 2,783,229 | |
| | | | 6,967,281 | |
| | Finland: 0.5% | | | |
26,400 | @ | Citycon OYJ | | 123,442 | |
132,100 | | Sponda OYJ | | 1,414,573 | |
| | | | 1,538,015 | |
| | France: 2.9% | | | |
21,800 | | Klepierre | | 2,553,005 | |
19,400 | | Nexity | | 1,353,671 | |
17,400 | | Societe de la Tour Eiffel | | 1,972,514 | |
16,500 | | Unibail | | 2,869,995 | |
| | | | 8,749,185 | |
| | Germany: 1.3% | | | |
5,900 | | Deutsche Wohnen AG | | 1,939,334 | |
20,100 | | IVG Immobilien AG | | 576,769 | |
52,600 | @ | Patrizia Immobilien AG | | 1,419,238 | |
| | | | 3,935,341 | |
| | Hong Kong: 10.5% | | | |
5,215,000 | | Agile Property Holdings Ltd. | | 4,035,519 | |
474,100 | | Cheung Kong Holdings Ltd. | | 5,346,272 | |
2,111,000 | | China Overseas Land & Investment Ltd. | | 1,349,697 | |
499,000 | | Great Eagle Holding Co. | | 1,803,487 | |
720,000 | | Hang Lung Properties Ltd. | | 1,713,258 | |
852,300 | | Hongkong Land Holdings Ltd. | | 3,342,323 | |
822,000 | | Hysan Development Co., Ltd. | | 2,365,934 | |
542,000 | | Kerry Properties Ltd. | | 1,913,997 | |
478,400 | @ | Link REIT | | 1,054,805 | |
628,639 | | New World Development Ltd. | | 1,130,189 | |
454,200 | | Sun Hung Kai Properties Ltd. | | 5,191,592 | |
81,200 | | Swire Pacific Ltd. | | 830,691 | |
374,000 | | Wharf Holdings Ltd. | | 1,501,192 | |
| | | | 31,578,956 | |
| | Italy: 0.3% | | | |
760,800 | | Beni Stabili S.p.A. | | 881,820 | |
| | | | 881,820 | |
| | Japan: 12.6% | | | |
230 | | Japan Logistics Fund, Inc. | | 1,772,458 | |
146 | | Kenedix Realty Investment Corp. | | 782,199 | |
32,900 | | Leopalace21 Corp. | | 1,274,013 | |
593,700 | | Mitsubishi Estate Co., Ltd. | | $ | 12,940,089 | |
438,300 | | Mitsui Fudosan Co., Ltd. | | 9,786,872 | |
276 | | Nippon Building Fund, Inc. | | 2,606,874 | |
326,700 | | Sumitomo Realty & Development Co., Ltd. | | 8,619,479 | |
| | | | 37,781,984 | |
| | Netherlands: 2.1% | | | |
1,085 | | Eurocommercial Properties NV | | 41,762 | |
53,000 | | Rodamco Europe NV | | 5,694,721 | |
6,700 | | Vastned Retail NV | | 548,647 | |
| | | | 6,285,130 | |
| | Singapore: 1.7% | | | |
1,199,000 | | CapitaLand Ltd. | | 3,720,236 | |
217,000 | | City Developments Ltd. | | 1,390,387 | |
| | | | 5,110,623 | |
| | South Korea: 0.1% | | | |
20,000 | @,#,L | Lotte Shopping Co. GDR | | 410,800 | |
| | | | 410,800 | |
| | Spain: 0.8% | | | |
32,600 | | Inmobiliaria Colonial | | 2,324,462 | |
| | | | 2,324,462 | |
| | Sweden: 0.8% | | | |
246,000 | | Castellum AB | | 2,389,865 | |
| | | | 2,389,865 | |
| | United Kingdom: 10.7% | | | |
205,500 | @ | Atlas Estates Ltd. | | 1,231,705 | |
251,200 | | British Land Co. PLC | | 5,714,942 | |
147,015 | | Capital & Regional PLC | | 2,950,449 | |
99,000 | | Derwent Valley Holdings PLC | | 2,842,109 | |
139,300 | | Hammerson PLC | | 2,933,931 | |
1,266,400 | | ING UK Real Estate Income Trust Ltd. | | 2,711,642 | |
297,450 | | Land Securities Group PLC | | 9,996,428 | |
39,600 | | Liberty International PLC | | 819,134 | |
17,600 | | Mapeley Ltd. | | 1,027,539 | |
180,000 | | Slough Estates PLC | | 1,996,103 | |
| | | | 32,223,982 | |
| | United States: 41.5% | | | |
74,700 | L | AMB Property Corp. | | 3,734,253 | |
120,800 | | Archstone-Smith Trust | | 5,904,704 | |
49,300 | L | AvalonBay Communities, Inc. | | 5,309,610 | |
52,300 | L | BioMed Realty Trust, Inc. | | 1,447,664 | |
64,700 | L | Boston Properties, Inc. | | 5,711,069 | |
40,400 | | BRE Properties | | 2,176,752 | |
45,800 | | Camden Property Trust | | 3,147,834 | |
35,000 | L | Corporate Office Properties Trust SBI MD | | 1,452,500 | |
55,500 | L | Developers Diversified Realty Corp. | | 2,952,600 | |
117,000 | L | Equity Office Properties Trust | | 3,781,417 | |
149,200 | L | Equity Residential | | 6,694,604 | |
33,400 | L | Federal Realty Investment Trust | | 2,278,882 | |
71,200 | | General Growth Properties, Inc. | | 3,342,840 | |
36,200 | L | Heritage Property Investment Trust | | 1,398,044 | |
64,400 | | Highwoods Properties, Inc. | | 2,031,176 | |
116,910 | L | Host Marriott Corp. | | 2,461,010 | |
17,000 | L | Kilroy Realty Corp. | | 1,212,440 | |
See Accompanying Notes to Financial Statements
122
| | PORTFOLIO OF INVESTMENTS |
ING GLOBAL REAL ESTATE FUND | | AS OF APRIL 30, 2006 (UNAUDITED)(CONTINUED) |
Shares | | | | | | Value | |
| | | | United States (continued) | | | | |
45,200 | | L | | Liberty Property Trust | | $ | 2,020,440 | |
67,400 | | | | Macerich Co. | | 4,935,028 | |
77,000 | | L | | Maguire Properties, Inc. | | 2,614,920 | |
48,500 | | | | Mills Corp. | | 1,547,635 | |
59,800 | | L | | New Plan Excel Realty Trust | | 1,474,070 | |
134,300 | | | | Omega Healthcare Investors, Inc. | | 1,717,697 | |
47,500 | | | | Pan Pacific Retail Properties, Inc. | | 3,165,400 | |
58,700 | | L | | Post Properties, Inc. | | 2,564,603 | |
123,700 | | | | Prologis | | 6,212,214 | |
29,600 | | L | | Public Storage, Inc. | | 2,275,648 | |
87,600 | | L | | Reckson Associates Realty Corp. | | 3,563,568 | |
46,500 | | L | | Regency Centers Corp. | | 2,933,685 | |
19,700 | | | | Shurgard Storage Centers, Inc. | | 1,240,706 | |
92,700 | | | | Simon Property Group LP | | 7,590,276 | |
41,200 | | L | | SL Green Realty Corp. | | 4,078,800 | |
52,000 | | L | | Starwood Hotels & Resorts | | 2,983,760 | |
86,200 | | L | | Strategic Hotel Capital, Inc. | | 1,955,016 | |
43,700 | | L | | Sunstone Hotel Investors, Inc. | | 1,255,938 | |
32,300 | | | | Taubman Centers, Inc. | | 1,328,822 | |
182,000 | | L | | Trizec Properties, Inc. | | 4,553,640 | |
68,200 | | L | | U-Store-It Trust | | 1,246,696 | |
47,300 | | L | | United Dominion Realty Trust, Inc. | | 1,286,087 | |
69,000 | | L | | Ventas, Inc. | | 2,254,230 | |
52,500 | | | | Vornado Realty Trust | | 5,021,100 | |
| | | | | | 124,857,378 | |
| | | | Total Common Stock
(Cost $222,476,410) | | 290,180,080 | |
Principal
Amount | | | | Value | |
| | | | | |
SHORT-TERM INVESTMENTS: 3.4% | | | | | |
| | | | | |
| | U.S. Government Agency Obligations: 3.4% | | | | | |
$ | 10,421,000 | | Federal Home Loan Bank, 4.400%, due 05/01/06 | | | | 10,419,726 | |
| | Total Short-Term Investments
(Cost $10,419,726) | | | | 10,419,726 | |
| | Total Investments In Securities
(Cost $232,896,136)* | | 99.9 | % | $ | 300,599,806 | |
| | Other Assets and Liabilities-Net | | 0.1 | | 217,222 | |
| | Net Assets | | 100.0 | % | $ | 300,817,028 | |
| | | | | | | | | |
| | Securities may have been fair valued in accordance with procedures approved by the Board of Directors/Trustees (Note 2A). |
@ | | Non-income producing security |
GDR | | Global Depositary Receipt |
# | | Securities with purchases pursuant to Rule 144A, under the Securities Act of 1933 and may not be resold subject to that rule except to qualified institutional buyers. These securities have been determined to be liquid under the guidelines established by the Funds’ Board of Directors/Trustees. |
L | | Loaned security, a portion or all of the security is on loan at April 30, 2006. |
* | | Cost for federal income tax purposes is $238,167,776 |
| | | Net unrealized appreciation consists of: | | |
| | | Gross Unrealized Appreciation | $62,604,541 | |
| | | Gross Unrealized Depreciation | (172,511 | ) |
| | | Net Unrealized Appreciation | $62,432,030 | |
Industry | | Percentage of
Net Assets |
Closed-end Funds | | 0.9 | % |
Distribution/Wholesale | | 0.1 | |
Federal Home Loan Bank | | 3.5 | |
Holding Companies - Diversified | | 0.8 | |
Investment Companies | | 0.4 | |
Lodging | | 1.0 | |
Real Estate | | 43.8 | |
Real Estate Investment Trust | | 49.4 | |
Other Assets and Liabilities, Net | | 0.1 | |
Net Assets | | 100.0 | % |
| | | | |
See Accompanying Notes to Financial Statements
123
| | PORTFOLIO OF INVESTMENTS |
ING GLOBAL VALUE CHOICE FUND | | AS OF APRIL 30, 2006 (UNAUDITED) |
Shares | | | | | | Value | |
COMMON STOCK: 92.2% | | | |
| | | | Australia: 1.1% | | | |
215,560 | | | | Alumina Ltd. | | $ | 1,180,211 | |
| | | | | | 1,180,211 | |
| | | | Belgium: 1.3% | | | |
44,842 | | | | Belgacom SA | | 1,464,869 | |
| | | | | | 1,464,869 | |
| | | | Canada: 6.0% | | | |
82,259 | | L | | Barrick Gold Corp. | | 2,507,254 | |
325,300 | | L | | Domtar, Inc. | | 2,433,244 | |
23,800 | | L | | Magna International, Inc. | | 1,867,110 | |
| | | | | | 6,807,608 | |
| | | | Finland: 1.5% | | | |
105,000 | | | | Stora Enso OYJ | | 1,640,285 | |
| | | | | | 1,640,285 | |
| | | | France: 2.7% | | | |
2,500 | | | | Areva | | 1,889,473 | |
4,200 | | | | Total SA | | 1,157,277 | |
| | | | | | 3,046,750 | |
| | | | Germany: 1.6% | | | |
110,000 | | @,L | | Premiere AG | | 1,796,495 | |
| | | | | | 1,796,495 | |
| | | | Italy: 3.1% | | | |
46,144 | | | | ENI-Ente Nazionale Idrocarburi S.p.A. | | 1,409,898 | |
811,926 | | | | Telecom Italia S.p.A. | | 2,027,420 | |
| | | | | | 3,437,318 | |
| | | | Japan: 13.0% | | | |
59,000 | | | | Dai Nippon Printing Co., Ltd. | | 1,053,875 | |
84,400 | | | | Daiichi Sankyo Co., Ltd. | | 2,164,272 | |
51,800 | | | | Fuji Photo Film Co., Ltd. | | 1,755,027 | |
86,000 | | | | Kirin Brewery Co., Ltd. | | 1,269,480 | |
3,500 | | L | | Mabuchi Motor Co., Ltd. | | 196,532 | |
31,000 | | @,L | | NEC Electronics Corp. | | 1,138,655 | |
8,100 | | | | Nintendo Co., Ltd. | | 1,200,699 | |
42,000 | | L | | Nippon Telegraph & Telephone Corp. ADR | | 944,580 | |
84,000 | | | | Sekisui House Ltd. | | 1,297,481 | |
57,000 | | | | Shiseido Co., Ltd. | | 1,101,032 | |
22,200 | | | | Takefuji Corp. | | 1,435,674 | |
81,000 | | | | Wacoal Corp. | | 1,091,527 | |
| | | | | | 14,648,834 | |
| | | | Netherlands: 2.8% | | | |
27,583 | | L | | Royal Dutch Shell PLC ADR | | 1,969,702 | |
32,400 | | | | TPG NV | | 1,164,281 | |
| | | | | | 3,133,983 | |
| | | | Papua New Guinea: 1.3% | | | |
603,204 | | @ | | Lihir Gold Ltd. | | 1,503,698 | |
| | | | | | 1,503,698 | |
| | | | Portugal: 1.0% | | | |
297,602 | | | | Electricidade de Portugal SA | | 1,169,955 | |
| | | | | | 1,169,955 | |
| | | | South Africa: 1.9% | | | |
23,300 | | L | | Anglogold Ashanti Ltd. ADR | | $ | 1,274,044 | |
4,800 | | | | Impala Platinum Holdings Ltd. | | 905,078 | |
| | | | | | 2,179,122 | |
| | | | South Korea: 3.9% | | | |
64,550 | | | | Korea Electric Power Corp. ADR | | 1,471,740 | |
77,700 | | | | KT Corp. ADR | | 1,808,079 | |
20,000 | | | | Samsung SDI Co., Ltd. | | 1,127,327 | |
| | | | | | 4,407,146 | |
| | | | Switzerland: 1.0% | | | |
31,080 | | | | Xstrata PLC | | 1,115,982 | |
| | | | | | 1,115,982 | |
| | | | Taiwan: 2.1% | | | |
116,600 | | | | Chunghwa Telecom Co., Ltd. ADR | | 2,401,960 | |
| | | | | | 2,401,960 | |
| | | | United Kingdom: 6.8% | | | |
34,000 | | | | Anglo American PLC | | 1,449,575 | |
184,891 | | | | J Sainsbury PLC | | 1,121,125 | |
23,492 | | | | Lonmin PLC | | 1,163,405 | |
273,977 | | | | Misys PLC | | 1,034,597 | |
141,249 | | | | United Utilities PLC | | 1,723,641 | |
500,000 | | | | Vodafone Group PLC | | 1,178,762 | |
| | | | | | 7,671,105 | |
| | | | United States: 41.1% | | | |
145,300 | | @,L | | AGCO Corp. | | 3,439,251 | |
31,600 | | | | Altria Group, Inc. | | 2,311,856 | |
42,500 | | L | | AT&T, Inc. | | 1,113,925 | |
107,800 | | L | | CA, Inc. | | 2,733,808 | |
19,800 | | L | | CDW Corp. | | 1,178,496 | |
40,850 | | @,L | | Comcast Corp. | | 1,259,406 | |
52,000 | | | | ConAgra Foods, Inc. | | 1,179,360 | |
65,600 | | @ | | Genco Shipping & Trading Ltd. | | 1,132,256 | |
45,100 | | | | Genworth Financial, Inc. | | 1,497,320 | |
50,900 | | | | Idacorp, Inc. | | 1,733,145 | |
32,767 | | | | Kerr-McGee Corp. | | 3,272,113 | |
164,450 | | @ | | Liberty Media Corp. | | 1,373,158 | |
21,950 | | | | Lockheed Martin Corp. | | 1,666,005 | |
82,700 | | | | Microsoft Corp. | | 1,997,609 | |
51,350 | | | | Noble Energy, Inc. | | 2,309,723 | |
31,200 | | L | | Northrop Grumman Corp. | | 2,087,280 | |
90,200 | | | | PNM Resources, Inc. | | 2,282,962 | |
20,400 | | | | Radian Group, Inc. | | 1,279,488 | |
30,100 | | | | Raytheon Co. | | 1,332,527 | |
72,200 | | | | Sprint Corp. - FON Group | | 1,790,561 | |
323,200 | | L | | Tyson Foods, Inc. | | 4,718,720 | |
14,800 | | | | Union Pacific Corp. | | 1,349,908 | |
56,900 | | @ | | Viacom, Inc. | | 2,266,327 | |
36,400 | | | | Viacom, Inc. - Class B | | 927,109 | |
| | | | | | 46,232,313 | |
| | | | Total Common Stock
(Cost $90,323,973) | | 103,837,634 | |
See Accompanying Notes to Financial Statements
124
| | PORTFOLIO OF INVESTMENTS |
ING GLOBAL VALUE CHOICE FUND | | AS OF APRIL 30, 2006 (UNAUDITED)(CONTINUED) |
Principal
Amount | | | | Value | |
SHORT-TERM INVESTMENTS: 23.0% | | | | | |
| | U.S. Government Agency Obligations: 6.2% | | | | | |
$ | 6,997,000 | | Federal Home Loan Babk, 4.400%, due 05/01/06 | | | | $ | 6,996,145 | |
| | Total U.S. Government Agency Obligation
(Cost $6,996,145) | | | | 6,996,145 | |
| | Securities Lending Collateralcc: 16.8% | | | | | |
18,930,538 | | The Bank of New York Institutional Cash Reserves Fund | | | | 18,930,538 | |
| | Total Securities Lending Collateral
(Cost $18,930,538) | | | | 18,930,538 | |
| | Total Short-Term Investments
(Cost $25,926,683) | | | | 25,926,683 | |
| | Total Investments In Securities
(Cost $116,250,656)* | | 115.2 | % | $ | 129,764,317 | |
| | Other Assets and Liabilities-Net | | (15.2 | ) | (17,137,505 | ) |
| | Net Assets | | 100.0 | % | $ | 112,626,812 | |
| | | | | | | | | |
| | Securities may have been fair valued in accordance with procedures approved by the Board of Directors/Trustees (Note 2A). |
@ | | Non-income producing security |
ADR | | American Depositary Receipt |
cc | | Securities purchased with cash collateral for securities loaned. |
L | | Loaned security, a portion or all of the security is on loan at April 30, 2006. |
* | | Cost for federal income tax purposes is $116,271,394 |
| | | Net unrealized appreciation consists of: | | |
| | | Gross Unrealized Appreciation | $15,366,220 | |
| | | Gross Unrealized Depreciation | (1,873,297 | ) |
| | | Net Unrealized Appreciation | $13,492,923 | |
Industry | | Percentage of
Net Assets |
Aerospace/Defense | | 4.5 | % |
Agriculture | | 2.0 | |
Apparel | | 1.0 | |
Auto Parts & Equipment | | 1.7 | |
Beverages | | 1.1 | |
Commercial Services | | 0.9 | |
Cosmetics/Personal Care | | 1.0 | |
Distribution/Wholesale | | 1.0 | |
Diversified Financial Services | | 1.3 | |
Electric | | 5.9 | |
Electronics | | 1.2 | |
Energy - Alternate Sources | | 1.7 | |
Federal Home Loan Bank | | 6.2 | |
Food | | 6.2 | |
Forest Products & Paper | | 3.6 | |
Home Builders | | 1.1 | |
Insurance | | 2.5 | |
Machinery - Diversified | | 3.1 | |
Media | | 6.8 | |
Mining | | 9.9 | |
Miscellaneous Manufacturing | | 1.6 | |
Oil & Gas | | 9.0 | |
Pharmaceuticals | | 1.9 | |
Semiconductors | | 1.0 | |
Software | | 5.1 | |
Telecommunications | | 11.3 | |
Toys/Games/Hobbies | | 1.1 | |
Transportation | | 3.2 | |
Water | | 1.5 | |
Securities Lending Collateral | | 16.8 | |
Other Assets and Liabilities, Net | | (15.2 | ) |
Total Net Assets | | 100.0 | % |
| | | | |
See Accompanying Notes to Financial Statements
125
| | PORTFOLIO OF INVESTMENTS |
ING EMERGING COUNTRIES FUND | | AS OF APRIL 30, 2006 (UNAUDITED) |
Shares | | | | | | Value | |
COMMON STOCK: 95.8% | | | |
| | | | Argentina: 3.2% | | | |
591,044 | | @,L | | Grupo Financiero Galicia SA ADR | | $ | 4,302,800 | |
178,070 | | @,L | | Telecom Argentina SA ADR | | 2,306,007 | |
| | | | | | 6,608,807 | |
| | | | Brazil: 14.6% | | | |
105,898,352 | | | | AES Tiete SA | | 2,759,814 | |
127,000 | | L | | Brasil Telecom Participacoes SA ADR | | 5,187,950 | |
233,000 | | L | | Centrais Eletricas Brasileiras SA ADR | | 3,291,125 | |
40,000 | | | | Cia de Saneamento Basico do Estado de Sao Paulo | | 3,919,187 | |
64,500 | | L | | Contax Participacoes SA ADR | | 74,949 | |
123,000 | | | | Souza Cruz SA | | 2,329,133 | |
149,190 | | L | | Tele Norte Leste Participacoes SA ADR | | 2,712,274 | |
99,900 | | L | | Tim Participacoes SA ADR | | 3,841,155 | |
1,416,788 | | @,L | | Vivo Participacoes SA ADR | | 5,851,334 | |
| | | | | | 29,966,921 | |
| | | | Chile: 2.5% | | | |
188,720 | | | | AFP Provida SA ADR | | 5,152,056 | |
| | | | | | 5,152,056 | |
| | | | China: 3.1% | | | |
3,472,000 | | | | People’s Food Holdings Ltd. | | 2,749,582 | |
2,719,000 | | @ | | Weiqiao Textile Co. | | 3,569,594 | |
| | | | | | 6,319,176 | |
| | | | Croatia: 0.9% | | | |
84,650 | | | | Pliva DD GDR | | 1,748,023 | |
| | | | | | 1,748,023 | |
| | | | Czech Republic: 1.0% | | | |
91,548 | | @ | | Cesky Telecom AS | | 2,011,117 | |
| | | | | | 2,011,117 | |
| | | | Estonia: 1.2% | | | |
77,771 | | | | Eesti Telekom GDR | | 2,374,660 | |
| | | | | | 2,374,660 | |
| | | | Greece: 1.2% | | | |
225,400 | | @ | | Hellenic Telecommunications Organization SA ADR | | 2,558,290 | |
| | | | | | 2,558,290 | |
| | | | Hong Kong: 6.1% | | | |
22,742,000 | | L | | Brilliance China Automotive Holdings Ltd. | | 3,990,237 | |
12,162,000 | | | | First Pacific Co. | | 5,091,042 | |
4,882,000 | | | | SCMP Group Ltd. | | 1,825,953 | |
1,395,000 | | | | SmarTone Telecommunications Holding Ltd. | | 1,565,263 | |
| | | | | | 12,472,495 | |
| | | | Hungary: 2.0% | | | |
900,699 | | | | Matav Magyar Tavkozlesi Rt | | 4,110,332 | |
| | | | | | 4,110,332 | |
| | | | Indonesia: 2.4% | | | |
1,823,000 | | | | Gudang Garam Tbk PT | | $ | 2,185,219 | |
21,484,500 | | | | Indofood Sukses Makmur Tbk PT | | 2,758,019 | |
| | | | | | 4,943,238 | |
| | | | Israel: 4.6% | | | |
1,564,870 | | | | Bezeq Israeli Telecommunication Corp., Ltd. | | 2,013,350 | |
852,069 | | @ | | Partner Communications | | 7,387,241 | |
| | | | | | 9,400,591 | |
| | | | Luxembourg: 1.8% | | | |
81,400 | | L | | Quilmes Industrial SA ADR | | 3,646,720 | |
| | | | | | 3,646,720 | |
| | | | Malaysia: 1.5% | | | |
1,903,014 | | | | Proton Holdings Bhd | | 3,123,999 | |
| | | | | | 3,123,999 | |
| | | | Mexico: 1.2% | | | |
109,800 | | L | | Telefonos de Mexico SA de CV ADR | | 2,414,502 | |
| | | | | | 2,414,502 | |
| | | | Panama: 2.7% | | | |
328,540 | | | | Banco Latino Americano | | 5,532,614 | |
| | | | | | 5,532,614 | |
| | | | Philippines: 0.6% | | | |
3,652,100 | | @ | | Manila Electric Co. | | 1,305,077 | |
| | | | | | 1,305,077 | |
| | | | Singapore: 4.3% | | | |
449,000 | | | | DBS Group Holdings Ltd. | | 5,051,945 | |
1,355,000 | | | | MobileOne Ltd. | | 1,842,194 | |
463,200 | | | | Oversea-Chinese Banking Corp. | | 1,994,076 | |
| | | | | | 8,888,215 | |
| | | | South Korea: 17.5% | | | |
117,860 | | | | Korea Electric Power Corp. | | 5,235,080 | |
17,200 | | | | KT Corp. | | 773,793 | |
131,290 | | | | KT Freetel Co., Ltd. | | 4,365,638 | |
67,260 | | | | Kumho Tire Co., Inc. | | 1,046,671 | |
138,590 | | | | LG Chem Ltd. | | 6,114,859 | |
23,370 | | | | LG Electronics, Inc. | | 1,930,514 | |
3,267 | | L | | Lotte Chilsung Beverage Co., Ltd. | | 3,949,368 | |
7,316 | | | | Posco | | 2,077,340 | |
5,125 | | | | Samsung Electronics Co., Ltd. | | 3,497,670 | |
260,110 | | L | | SK Telecom Co., Ltd. ADR | | 6,944,937 | |
| | | | | | 35,935,870 | |
| | | | Taiwan: 17.8% | | | |
3,100,000 | | | | China Motor Corp. | | 3,299,182 | |
191,000 | | | | Chunghwa Telecom Co., Ltd. | | 367,129 | |
215,020 | | L | | Chunghwa Telecom Co., Ltd. ADR | | 4,429,412 | |
3,198,000 | | | | Far EasTone Telecommunications Co., Ltd. | | 3,999,101 | |
7,307,000 | | | | Taishin Financial Holdings Co., Ltd. | | 4,800,315 | |
2,462,000 | | | | United Microelectronics Corp. | | 1,713,477 | |
See Accompanying Notes to Financial Statements
126
| | PORTFOLIO OF INVESTMENTS |
ING EMERGING COUNTRIES FUND | | AS OF APRIL 30, 2006 (UNAUDITED)(CONTINUED) |
Shares | | | | | | Value | |
| | | | Taiwan (continued) | | | |
802,268 | | L | | United Microelectronics Corp. ADR | | $ | 3,024,550 | |
10,322,000 | | | | Walsin Lihwa Corp. | | 4,247,118 | |
5,965,000 | | | | Wan Hai Lines Ltd. | | 4,113,764 | |
7,243,000 | | @ | | Winbond Electronics Corp. | | 2,463,400 | |
1,899,718 | | @,L | | Yageo Corp. GDR | | 4,108,330 | |
| | | | | | 36,565,778 | |
| | | | Thailand: 2.7% | | | |
2,466,600 | | | | Glow Energy PLC | | 2,133,006 | |
1,506,200 | | | | Siam Makro PLC | | 3,207,276 | |
| | | | | | 5,340,282 | |
| | | | Venezuela: 2.9% | | | |
289,910 | | | | Cia Anonima Nacional Telefonos de Venezuela ADR | | 5,905,464 | |
| | | | | | 5,905,464 | |
| | | | Total Common Stock
(Cost $167,808,637) | | 196,324,227 | |
| | | |
PREFERRED STOCK: 1.3% | | | |
| | | | Brazil: 1.3% | | | |
975,469,880 | | | | Embratel Participacoes SA | | 2,584,150 | |
| | | | Total Preferred Stock
(Cost $1,717,781) | | 2,584,150 | |
| | | | Total Long-Term Investments
(Cost $169,526,418) | | 198,908,377 | |
| | | | | | | | |
Principal
Amount | | | | Value | |
| | | | | |
SHORT-TERM INVESTMENTS: 17.9% | | | | | |
| | U.S. Government Agency Obligation: 1.6% | | | | | |
$ | 3,379,000 | | Federal Home Loan Bank, 4.400%, due 05/01/06 | | | | 3,378,587 | |
| | Total U.S. Government Agency Obligation
(Cost $3,378,587) | | | | 3,378,587 | |
| | Securities Lending Collateralcc: 16.3% | | | | | |
| | The Bank of New York Institutional Cash Reserve Fund | | | | 33,476,488 | |
| | Total Securities Lending Collateral
(Cost $33,476,488) | | | | 33,476,488 | |
| | Total Short-Term Investments
(Cost $36,855,075) | | | | 36,855,075 | |
| | Total Investments In Securities
(Cost $206,381,493)* | | 115.0 | % | $ | 235,763,452 | |
| | Other Assets and Liabilities-Net | | (15.0 | ) | (30,737,766 | ) |
| | Net Assets | | 100.0 | % | $ | 205,025,686 | |
| | | | | | | | | |
| | Securities may have been fair valued in accordance with procedures approved by the Board of Directors/Trustees (Note 2A). |
@ | | Non-income producing security |
ADR | | American Depositary Receipt |
GDR | | Global Depositary Receipt |
cc | | Securities purchased with cash collateral for securities loaned. |
L | | Loaned security, a portion or all of the security is on loan at April 30, 2006. |
* | | Cost for federal income tax purposes is $206,506,497 |
| | | Net unrealized appreciation consists of: | | |
| | | Gross Unrealized Appreciation | $34,547,783 | |
| | | Gross Unrealized Depreciation | (5,290,828 | ) |
| | | Net Unrealized Appreciation | $29,256,955 | |
Industry | | Percentage of
Net Assets |
Agriculture | | 2.2 | % |
Auto Manufacturers | | 5.1 | |
Auto Parts & Equipment | | 0.5 | |
Banks | | 8.5 | |
Beverages | | 3.7 | |
Chemicals | | 3.0 | |
Diversified Financial Services | | 2.1 | |
Electric | | 7.2 | |
Electrical Components & Equipment | | 3.0 | |
Electronics | | 2.0 | |
Federal Home Loan Bank | | 1.6 | |
Food | | 2.7 | |
Holding Companies - Diversified | | 2.5 | |
Investment Companies | | 2.5 | |
Iron/Steel | | 1.0 | |
Media | | 0.9 | |
Pharmaceuticals | | 0.9 | |
Retail | | 1.6 | |
Semiconductors | | 5.2 | |
Telecommunications | | 36.9 | |
Textiles | | 1.7 | |
Transportation | | 2.0 | |
Water | | 1.9 | |
Securities Lending Collateral | | 16.3 | |
Other Assets and Liabilities, Net | | (15.0 | ) |
Total Net Assets | | 100.0 | % |
| | | | |
See Accompanying Notes to Financial Statements
127
| | PORTFOLIO OF INVESTMENTS |
ING FOREIGN FUND | | AS OF APRIL 30, 2006 (UNAUDITED) |
Shares | | | | | | Value | |
COMMON STOCK: 95.8% | | | |
| | | | Australia: 2.4% | | | |
111,618 | | | | BHP Billiton Ltd. | | $ | 2,533,351 | |
32,257 | | | | Brambles Industries Ltd. | | 273,817 | |
9,821 | | | | CSL Ltd. | | 428,289 | |
810,138 | | | | Macquarie Airports | | 2,017,426 | |
172,202 | | | | Newcrest Mining Ltd. | | 3,003,952 | |
24,940 | | | | Rio Tinto Ltd. | | 1,492,673 | |
| | | | | | 9,749,508 | |
| | | | Austria: 3.3% | | | |
14,664 | | @ | | Erste Bank der Oesterreichischen Sparkassen AG | | 878,321 | |
30,874 | | | | Erste Bank der Oesterreichischen Sparkassen AG - Expired Class | | 1,870,592 | |
4,643 | | | | Flughafen Wien AG | | 353,554 | |
259,816 | | @ | | IMMOFINANZ Immobilien Anlagen AG | | 2,841,657 | |
30,623 | | | | OMV AG | | 2,123,434 | |
24,559 | | @ | | Raiffeisen International Bank Holding AG | | 2,136,585 | |
55,769 | | | | Telekom Austria AG | | 1,365,160 | |
11,345 | | | | Wiener Staedtische Allgemeine Versicherung AG | | 725,501 | |
19,199 | | | | Wienerberger AG | | 1,013,438 | |
| | | | | | 13,308,242 | |
| | | | Belgium: 2.0% | | | |
6,241 | | | | Almancora Comm Va | | 841,805 | |
61,842 | | | | Fortis | | 2,314,471 | |
42,186 | | | | KBC Bancassurance Holding | | 4,888,718 | |
| | | | | | 8,044,994 | |
| | | | Brazil: 0.1% | | | |
10,964 | | | | Aracruz Celulose SA ADR | | 603,897 | |
| | | | | | 603,897 | |
| | | | Bulgaria: 0.0% | | | |
60,720 | | @ | | Bulgarian Compensation Notes | | 25,142 | |
25,950 | | @ | | Bulgarian Housing Compensation Notes | | 10,737 | |
117,641 | | @ | | Bulgarian Registered Comp Vouchers | | 48,522 | |
| | | | | | 84,401 | |
| | | | Canada: 0.4% | | | |
23,601 | | | | Barrick Gold Corp. | | 716,107 | |
55,092 | | @ | | Bema Gold Corp. | | 310,724 | |
829 | | @,# | | Centerra Gold, Inc. | | 34,919 | |
44,793 | | @ | | Eldorado Gold Corp. | | 233,449 | |
3,787 | | @ | | Ivanhoe Mines Ltd. | | 36,838 | |
2,310 | | @,L | | Research In Motion Ltd. | | 177,015 | |
| | | | | | 1,509,052 | |
| | | | China: 0.8% | | | |
296,000 | | | | Beijing Capital International Airport Co., Ltd. | | 171,611 | |
1,306,410 | | | | China Life Insurance Co., Ltd. | | 1,759,259 | |
1,443,394 | | @ | | Dongfeng Motor Group Co., Ltd. | | 721,357 | |
45,630 | | | | Shenzhen Chiwan Wharf Holdings Ltd. | | 78,564 | |
244,498 | | | | Weiqiao Textile Co. | | 320,985 | |
84,393 | | | | Wumart Stores, Inc. | | 277,549 | |
| | | | | | 3,329,325 | |
| | | | Cyprus: 0.5% | | | |
219,402 | | | | Bank of Cyprus Ltd. | | $ | 2,135,811 | |
| | | | | | 2,135,811 | |
| | | | Czech Republic: 1.4% | | | |
36,430 | | | | Komercni Banka AS | | 5,772,634 | |
| | | | | | 5,772,634 | |
| | | | Denmark: 0.3% | | | |
1,975 | | @ | | ALK-Abello A/S | | 299,149 | |
2,025 | | | | Bryggerigruppen AS | | 218,313 | |
2,501 | | | | Novo-Nordisk A/S | | 161,279 | |
25,326 | | @,L | | Vestas Wind Systems A/S | | 686,388 | |
| | | | | | 1,365,129 | |
| | | | Egypt: 0.2% | | | |
10,913 | | | | Orascom Telecom Holding SAE GDR | | 579,864 | |
9,759 | | | | Telecom Egypt GDR | | 126,867 | |
| | | | | | 706,731 | |
| | | | Finland: 1.8% | | | |
108,680 | | | | Fortum OYJ | | 2,737,629 | |
109,292 | | | | Nokia OYJ | | 2,475,467 | |
29,510 | | | | Sampo OYJ | | 607,976 | |
12,361 | | | | Sanoma-WSOY OYJ | | 316,004 | |
5,350 | | | | Stockmann OYJ Abp | | 218,997 | |
4,192 | | | | Wartsila OYJ | | 178,289 | |
23,788 | | | | YIT OYJ | | 669,780 | |
| | | | | | 7,204,142 | |
| | | | France: 10.5% | | | |
2,906 | | | | Accor | | 182,533 | |
12,565 | | | | Air Liquide | | 2,713,799 | |
3,962 | | @ | | Alstom RGPT | | 358,062 | |
5,343 | | @,# | | Atos Origin | | 399,921 | |
26,218 | | | | BNP Paribas | | 2,472,320 | |
32,837 | | | | Bouygues | | 1,788,301 | |
10,745 | | | | Cie de Saint-Gobain | | 804,979 | |
36,059 | | @ | | Electricite de France | | 2,102,871 | |
2,796 | | | | Eurazeo | | 337,577 | |
6,116 | | | | Generale de Sante | | 182,065 | |
13,987 | | @ | | JC Decaux SA | | 417,828 | |
39,848 | | | | Lafarge SA | | 4,884,607 | |
5,490 | | | | Lagardere SCA | | 452,722 | |
41,464 | | | | LVMH Moet Hennessy Louis Vuitton SA | | 4,356,471 | |
9,824 | | | | Pernod-Ricard | | 1,902,411 | |
13,033 | | | | Pinault-Printemps-Redoute | | 1,687,744 | |
7,730 | | | | Publicis Groupe | | 320,775 | |
19,205 | | | | Renault SA | | 2,224,105 | |
20,222 | | | | Safran SA | | 518,250 | |
55,725 | | | | Sanofi-Synthelabo SA | | 5,246,569 | |
5,829 | | | | Schneider Electric SA | | 658,784 | |
6,386 | | | | Societe Generale | | 973,195 | |
33,559 | | | | Societe Television Francaise 1 | | 1,112,218 | |
14,220 | | | | Suez SA | | 554,381 | |
15,160 | | | | Total SA | | 4,177,219 | |
12,426 | | | | Vinci SA | | 1,232,915 | |
15,071 | | | | Vivendi Universal SA | | 549,419 | |
| | | | | | 42,612,041 | |
See Accompanying Notes to Financial Statements
128
| | PORTFOLIO OF INVESTMENTS |
ING FOREIGN FUND | | AS OF APRIL 30, 2006 (UNAUDITED) (CONTINUED) |
Shares | | | | | | Value | |
| | | | Germany: 10.0% | | | |
1,529 | | | | Adidas-Salomon AG | | $ | 322,664 | |
104,375 | | | | Commerzbank AG | | 4,307,714 | |
3,691 | | | | Continental AG | | 438,677 | |
24,737 | | | | DaimlerChrysler AG | | 1,359,747 | |
20,775 | | | | Deutsche Bank AG | | 2,533,260 | |
13,698 | | | | Deutsche Boerse AG | | 1,976,544 | |
65,499 | | | | Deutsche Post AG | | 1,744,828 | |
6,192 | | | | Deutsche Postbank AG | | 472,453 | |
12,393 | | | | EON AG | | 1,515,234 | |
79,315 | | | | Fraport AG Frankfurt Airport Services Worldwide | | 6,016,968 | |
3,522 | | | | Fresenius AG | | 585,680 | |
13,915 | | | | Fresenius Medical Care AG | | 1,666,539 | |
7,453 | | | | Henkel KGaA | | 817,246 | |
797 | | | | Henkel KGaA - Vorzug | | 95,870 | |
20,482 | | | | Hochtief AG | | 1,393,754 | |
25,620 | | | | Hypo Real Estate Holding | | 1,788,201 | |
64,876 | | | | INDEXCHANGE - DAXEX | | 4,735,737 | |
70,326 | | | | IVG Immobilien AG | | 2,018,004 | |
7,119 | | @ | | KarstadtQuelle AG | | 214,252 | |
2,553 | | | | MAN AG | | 193,181 | |
7,512 | | | | Merck KGaA | | 797,026 | |
457 | | | | Puma AG Rudolf Dassler Sport | | 184,109 | |
3,437 | | | | SAP AG | | 750,616 | |
33,567 | | | | Siemens AG | | 3,179,077 | |
3,041 | | | | Solarworld AG | | 945,129 | |
16,172 | | I | | UkrTelecom ADR | | 175,191 | |
2,935 | | @ | | Wacker Chemie AG | | 386,973 | |
| | | | | | 40,614,674 | |
| | | | Greece: 0.5% | | | |
16,742 | | | | Alpha Bank AE | | 631,972 | |
55,041 | | | | Hellenic Telecommunications Organization SA | | 1,230,735 | |
| | | | | | 1,862,707 | |
| | | | Hong Kong: 2.4% | | | |
656,850 | | | | China Merchants Holdings International Co., Ltd. | | 2,242,271 | |
180,696 | | | | China Netcom Group Corp. Hong Kong Ltd. | | 330,206 | |
234,222 | | | | China Resources Enterprise | | 501,353 | |
129,000 | | | | Clear Media Ltd. | | 159,718 | |
942,873 | | | | Galaxy Entertainment Group Ltd. | | 815,653 | |
546,741 | | @ | | Hutchison Telecommunications International Ltd. | | 968,305 | |
937,174 | | | | Melco International Development | | 2,102,276 | |
1,860,294 | | L | | Shun TAK Holdings Ltd. | | 2,363,526 | |
186,000 | | | | Texwinca Holdings Ltd. | | 136,736 | |
| | | | | | 9,620,044 | |
| | | | Hungary: 0.5% | | | |
2,147 | | | | Egis Rt | | 349,053 | |
155,346 | | | | Matav Magyar Tavkozlesi Rt | | 708,920 | |
27,868 | | | | OTP Bank Rt | | 1,077,728 | |
| | | | | | 2,135,701 | |
| | | | India: 0.1% | | | |
11,848 | | | | State Bank of India Ltd. GDR | | 601,550 | |
| | | | | | 601,550 | |
| | | | Indonesia: 0.4% | | | |
1,923,511 | | | | Bank Mandiri Persero TBK PT | | $ | 419,909 | |
546,500 | | | | Indofood Sukses Makmur TBK PT | | 70,156 | |
84,757 | | | | Semen Gresik Persero TBK PT | | 264,613 | |
984,452 | | | | Telekomunikasi Indonesia TBK PT | | 846,025 | |
| | | | | | 1,600,703 | |
| | | | Ireland: 1.0% | | | |
210,989 | | @ | | Dragon Oil PLC | | 743,184 | |
68,739 | | @,L | | EURO STOXX 50 NAV | | 3,350,056 | |
| | | | | | 4,093,240 | |
| | | | Italy: 5.1% | | | |
30,164 | | | | Assicurazioni Generali S.p.A. | | 1,129,019 | |
235,469 | | | | Banca Intesa S.p.A. | | 1,305,208 | |
121,751 | | | | Banca Intesa S.p.A. - RNC | | 720,252 | |
9,304 | | | | Banca Italease | | 563,962 | |
3,543 | | | | Banca Popolare dell’Emilia Romagna SCRL | | 213,797 | |
136,091 | | | | Banca Popolare di Milano SCRL | | 1,718,402 | |
10,870 | | | | Banca Popolare di Sondrio SCRL | | 180,678 | |
76,250 | | | | Banca Popolare Italiana | | 801,334 | |
42,688 | | | | Banche Popolari Unite SCRL | | 1,078,158 | |
30,353 | | | | Banco Popolare di Verona e Novara SCRL | | 853,105 | |
124,078 | | | | Beni Stabili S.p.A. | | 143,815 | |
13,711 | | | | Bulgari S.p.A. | | 169,916 | |
62,787 | | | | Buzzi Unichem S.p.A. | | 1,601,727 | |
288,060 | | | | Capitalia S.p.A. | | 2,497,776 | |
317,879 | | | | Cassa di Risparmio di Firenze S.p.A. | | 1,122,246 | |
76,711 | | | | Credito Emiliano S.p.A. | | 1,066,556 | |
15,534 | | | | Finmeccanica S.p.A. | | 371,824 | |
33,323 | | | | Geox S.p.A. | | 474,272 | |
14,139 | | | | Luxottica Group S.p.A. | | 420,410 | |
121,983 | | @ | | Parmalat S.p.A | | 409,120 | |
524,181 | | | | UniCredito Italiano S.p.A. | | 3,945,233 | |
| | | | | | 20,786,810 | |
| | | | Japan: 12.1% | | | |
17,925 | | | | Aeon Credit Service Co., Ltd. | | 491,784 | |
6,750 | | | | Aiful Corp. | | 401,359 | |
15,600 | | | | Aisin Seiki Co., Ltd. | | 583,374 | |
11,000 | | | | Bank of Fukuoka Ltd. | | 94,264 | |
42,000 | | | | Bank of Yokohama Ltd. | | 327,320 | |
27,737 | | S | | Canon, Inc. | | 2,101,164 | |
10,000 | | | | Chiba Bank Ltd. | | 90,202 | |
20,658 | | | | Credit Saison Co., Ltd. | | 1,081,047 | |
29,000 | | | | Dai Nippon Printing Co., Ltd. | | 518,006 | |
11,600 | | | | Daikin Industries Ltd. | | 403,394 | |
52,000 | | | | Daiwa Securities Group, Inc. | | 715,980 | |
28,887 | | | | Denso Corp. | | 1,126,832 | |
99 | | | | Dentsu, Inc. | | 342,780 | |
103 | | | | East Japan Railway Co. | | 801,389 | |
6,200 | | | | Eisai Co., Ltd. | | 281,930 | |
2,800 | | | | Exedy Corp. | | 87,354 | |
5,800 | | | | Fanuc Ltd. | | 546,610 | |
327 | | S | | Fuji Television Network, Inc. | | 810,402 | |
17,000 | | | | Fujitsu Ltd. | | 140,831 | |
17,000 | | | | Gunma Bank Ltd. | | 130,587 | |
28,463 | | S | | Honda Motor Co., Ltd. | | 2,009,672 | |
7,800 | | | | Hoya Corp. | | 314,127 | |
4,500 | | | | Ibiden Co., Ltd. | | 212,503 | |
61,000 | | | | Itochu Corp. | | 550,486 | |
3,800 | | | | Jafco Co., Ltd. | | 251,282 | |
275 | | | | Japan Tobacco, Inc. | | 1,099,898 | |
See Accompanying Notes to Financial Statements
129
| | PORTFOLIO OF INVESTMENTS |
ING FOREIGN FUND | | AS OF APRIL 30, 2006 (UNAUDITED) (CONTINUED) |
Shares | | | | | | Value | |
| | | | Japan (continued) | | | |
6,489 | | | | JS Group Corp. | | $ | 143,687 | |
13,248 | | | | JSR Corp. | | 405,863 | |
660 | | | | Keyence Corp. | | 172,396 | |
19,126 | | | | Koito Manufacturing Co., Ltd. | | 274,097 | |
17,330 | | | | Kubota Corp. | | 194,641 | |
3,600 | | | | Kyocera Corp. | | 335,565 | |
4,102 | | | | Leopalace21 Corp. | | 158,845 | |
5,993 | | | | Makita Corp. | | 177,301 | |
137,471 | | | | Matsushita Electric Industrial Co., Ltd. | | 3,305,797 | |
33,000 | | | | Mitsubishi Securities Co., Ltd. | | 516,453 | |
237 | | S | | Mitsubishi Tokyo Financial Group, Inc. | | 3,694,427 | |
19,723 | | | | Mitsui Fudosan Co., Ltd. | | 440,398 | |
248 | | S | | Mizuho Financial Group, Inc. | | 2,104,685 | |
22,000 | | | | NGK Spark Plug Co., Ltd. | | 479,233 | |
26,333 | | | | NHK Spring Co., Ltd. | | 303,693 | |
15,290 | | | | Nikko Cordial Corp. | | 245,791 | |
1,100 | | | | Nintendo Co., Ltd. | | 163,058 | |
7,000 | | | | Nippon Electric Glass Co., Ltd. | | 156,408 | |
10,000 | | | | Nissan Chemical Industries Ltd. | | 168,837 | |
28,106 | | | | Nissan Motor Co., Ltd. | | 368,083 | |
15,100 | | | | Nitto Denko Corp. | | 1,259,637 | |
10,100 | | | | NOK Corp. | | 305,645 | |
70,353 | | | | Nomura Holdings, Inc. | | 1,584,442 | |
20,000 | | | | NSK Ltd. | | 179,851 | |
2,130 | | | | ORIX Corp. | | 638,355 | |
36,000 | | | | Ricoh Co., Ltd. | | 710,247 | |
3,500 | | | | Secom Co., Ltd. | | 190,367 | |
8,700 | | | | Sega Sammy Holdings, Inc. | | 344,983 | |
19,386 | | | | Seven & I Holdings Co., Ltd. | | 748,926 | |
47,000 | | | | Sharp Corp. | | 820,042 | |
41,433 | | | | Sony Corp. | | 2,019,993 | |
19,099 | | | | Stanley Electric Co. Ltd. | | 442,237 | |
66,000 | | | | Sumitomo Chemical Co., Ltd. | | 575,804 | |
25,188 | | | | Sumitomo Corp. | | 375,442 | |
90,145 | | | | Sumitomo Metal Industries Ltd. | | 378,333 | |
135 | | S | | Sumitomo Mitsui Financial Group, Inc. | | 1,475,849 | |
54,830 | | | | Sumitomo Trust & Banking Co., Ltd. | | 579,929 | |
25,700 | | | | Suzuki Motor Corp. | | 623,625 | |
7,200 | | | | Takeda Chemical Industries Ltd. | | 439,015 | |
24,000 | | | | Teijin Ltd. | | 163,720 | |
13,000 | | | | Toppan Printing Co., Ltd. | | 173,397 | |
21,000 | | | | Toray Industries, Inc. | | 195,603 | |
65,700 | | S | | Toyota Motor Corp. | | 3,826,867 | |
4,400 | | | | Yamada Denki Co., Ltd. | | 477,183 | |
20,000 | | | | Yamaha Motor Co., Ltd. | | 546,842 | |
16,846 | | | | Yamato Transport Co., Ltd. | | 334,619 | |
21,300 | | | | Yokogawa Electric Corp. | | 334,608 | |
| | | | | | 49,069,396 | |
| | | | Luxembourg: 0.2% | | | |
19,380 | | @,L | | Millicom International Cellular SA | | 953,108 | |
| | | | | | 953,108 | |
| | | | Mexico: 0.8% | | | |
13,433 | | | | Consorcio ARA SA | | 71,000 | |
43,750 | | | | Fomento Economico Mexicano SA de CV | | 404,866 | |
14,650 | | | | Fomento Economico Mexicano SA de CV ADR | | 1,360,692 | |
278,866 | | | | Grupo Financiero Banorte SA de CV | | $ | 725,650 | |
18,336 | | | | Grupo Televisa SA ADR | | 388,723 | |
14,960 | | @ | | Urbi Desarrollos Urbanos SA de CV | | 122,519 | |
| | | | | | 3,073,450 | |
| | | | Netherlands: 2.5% | | | |
19,153 | | | | Euronext NV | | 1,708,115 | |
4,978 | | | | European Aeronautic Defense and Space Co. | | 196,112 | |
9,124 | | | | Heineken NV | | 369,184 | |
36,231 | | | | Koninklijke Philips Electronics NV | | 1,247,699 | |
9,882 | | | | Randstad Holdings NV | | 655,670 | |
72,917 | | | | Royal KPN NV | | 855,752 | |
13,546 | | @ | | Royal Numico NV | | 613,033 | |
76,150 | | | | TPG NV | | 2,736,420 | |
7,781 | | | | Unilever NV | | 561,033 | |
36,263 | | | | Vedior NV | | 844,053 | |
9,887 | | | | VNU NV | | 339,149 | |
| | | | | | 10,126,220 | |
| | | | New Zealand: 0.1% | | | |
160,764 | | | | Auckland International Airport Ltd. | | 208,467 | |
| | | | | | 208,467 | |
| | | | Norway: 2.2% | | | |
45,000 | | | | Acta Holding ASA | | 201,852 | |
53,582 | | | | DNB Holding ASA | | 740,614 | |
23,058 | | S | | Norsk Hydro ASA | | 3,522,916 | |
27,940 | | | | Orkla ASA | | 1,464,642 | |
88,356 | | | | Statoil ASA | | 2,888,835 | |
12,794 | | | | Telenor ASA | | 147,893 | |
| | | | | | 8,966,752 | |
| | | | Papua New Guinea: 0.2% | | | |
338,587 | | @ | | Lihir Gold Ltd. | | 844,047 | |
| | | | | | 844,047 | |
| | | | Philippines: 0.1% | | | |
9,734 | | L | | Philippine Long Distance Telephone ADR | | 386,927 | |
| | | | | | 386,927 | |
| | | | Poland: 4.1% | | | |
14,828 | | | | Agora SA | | 215,382 | |
84,578 | | | | Bank Pekao SA | | 5,647,476 | |
8,151 | | | | Bank Przemyslowo-Handlowy PBK SA | | 2,093,850 | |
15,273 | | @ | | Budimex SA | | 278,265 | |
13,619 | | @ | | CCC SA | | 195,275 | |
57,550 | | @ | | Cersanit Krasnystaw SA | | 334,709 | |
4,572 | | | | Grupa Kety SA | | 207,574 | |
5,162 | | | | Inter Cars SA | | 43,063 | |
513,483 | | S | | PKO Bank Polski SA | | 6,431,084 | |
4,510 | | | | Polska Graupa Framaceutycz SA | | 97,930 | |
10,496 | | | | Sniezka SA | | 100,941 | |
1,308 | | @ | | Stomil Sanok | | 63,011 | |
128,804 | | S | | Telekomunikacja Polska SA | | 939,786 | |
41,024 | | @ | | ZM Duda SA | | 182,828 | |
| | | | | | 16,831,174 | |
See Accompanying Notes to Financial Statements
130
| | PORTFOLIO OF INVESTMENTS |
ING FOREIGN FUND | | AS OF APRIL 30, 2006 (UNAUDITED) (CONTINUED) |
Shares | | | | | | Value | |
| | | | Portugal: 0.1% | | | |
6,004 | | | | Jeronimo Martins | | $ | 108,147 | |
31,961 | | | | Portugal Telecom SGPS SA | | 405,135 | |
| | | | | | 513,282 | |
| | | | Romania: 0.7% | | | |
895,328 | | | | Impact | | 204,376 | |
1,069,500 | | @ | | Rolast AG | | 25,770 | |
154,500 | | | | SIF 1 Banat Crisana Arad | | 132,113 | |
167,500 | | | | SIF 2 Moldova Bacau | | 136,554 | |
127,000 | | | | SIF 3 Transilvania Brasov | | 102,156 | |
232,500 | | | | SIF 4 Muntenia Bucuresti | | 132,260 | |
147,500 | | | | SIF 5 Oltenia Craiova | | 141,092 | |
8,637,415 | | S | | SNP Petrom SA | | 1,768,231 | |
585,000 | | | | SOCEP CONSTANTA | | 44,936 | |
| | | | | | 2,687,488 | |
| | | | Russia: 5.8% | | | |
38,999 | | L | | LUKOIL ADR | | 3,535,291 | |
20,641 | | | | MMC Norilsk Nickel ADR | | 2,724,612 | |
275 | | | | NovaTek OAO | | 1,009,771 | |
8,000 | | #,L | | NovaTek OAO GDR | | 340,000 | |
118,466 | | L | | OAO Gazprom ADR | | 5,368,894 | |
225,232 | | @,I | | OJSC TNK -BP HOLDING | | 765,789 | |
18,360 | | @,I,X | | Polyus Gold ADR | | 293,760 | |
104,109 | | @,I | | RenShares Utilities Ltd. | | 200,930 | |
2,372 | | | | Rosneft-Purneftegaz | | 114,093 | |
2,976 | | | | Sberbank RF | | 5,350,462 | |
2,582 | | | | Sibneft | | 12,923 | |
69,714 | | | | Surgutneftegaz OJSC | | 117,796 | |
49,845 | | | | Unified Energy System GDR | | 3,823,112 | |
| | | | | | 23,657,433 | |
| | | | South Africa: 0.0% | | | |
14,253 | | | | MTN Group Ltd. | | 141,226 | |
| | | | | | 141,226 | |
| | | | South Korea: 1.4% | | | |
15,260 | | | | Hyundai Motor Co. | | 1,343,903 | |
1,198 | | @ | | NHN Corp. | | 425,039 | |
5,888 | | | | Samsung Electronics Co., Ltd. | | 4,022,058 | |
| | | | | | 5,791,000 | |
| | | | Spain: 1.0% | | | |
100,889 | | | | Banco Bilbao Vizcaya Argentaria SA | | 2,223,884 | |
37,804 | | | | Corp Mapfre SA | | 798,452 | |
9,980 | | | | Grupo Empresarial Ence SA | | 412,284 | |
19,428 | | | | Inditex SA | | 789,572 | |
| | | | | | 4,224,192 | |
| | | | Sweden: 2.9% | | | |
7,669 | | | | Autoliv, Inc. | | 423,424 | |
90,271 | | | | ForeningsSparbanken AB | | 2,478,880 | |
34,890 | | | | Getinge AB | | 602,198 | |
7,310 | | | | Hennes & Mauritz AB | | 276,648 | |
22,220 | | @ | | Modern Times Group AB | | 1,215,578 | |
164,765 | | | | Nordea AB | | 2,114,327 | |
8,425 | | | | Securitas AB | | 175,170 | |
114,559 | | | | Skandinaviska Enskilda Banken AB | | 2,880,188 | |
60,957 | | | | Skanska AB | | 1,052,079 | |
131,166 | | | | Telefonaktiebolaget LM Ericsson | | 463,824 | |
24,174 | | | | TeliaSonera AB | | 149,523 | |
| | | | | | 11,831,839 | |
| | | | Switzerland: 5.8% | | | |
18,102 | | | | Adecco SA | | $ | 1,119,584 | |
1,140 | | | | BKW FMB Energie AG | | 117,332 | |
44,660 | | | | Compagnie Financiere Richemont AG | | 2,306,694 | |
41,424 | | | | Credit Suisse Group | | 2,594,516 | |
50,043 | | | | Holcim Ltd. | | 4,186,152 | |
9,099 | | S | | Nestle SA | | 2,766,190 | |
61,926 | | | | Novartis AG | | 3,539,139 | |
17,191 | | S | | Roche Holding AG | | 2,630,823 | |
683 | | | | SGS SA | | 673,864 | |
13,599 | | | | Swatch Group AG | | 2,430,824 | |
4,629 | | @ | | Syngenta AG | | 641,434 | |
3,238 | | | | Synthes, Inc. | | 399,329 | |
394 | | | | Unique Zurich Airport | | 86,214 | |
| | | | | | 23,492,095 | |
| | | | Thailand: 0.2% | | | |
97,043 | | | | Bangkok Bank PLC | | 307,035 | |
24,334 | | | | Bangkok Bank PLC - Non-Voting Depositary Receipt | | 73,106 | |
1,164,428 | | | | Krung Thai Bank PLC | | 380,980 | |
| | | | | | 761,121 | |
| | | | Turkey: 2.6% | | | |
161,533 | | S | | Akbank T.A.S. | | 1,348,005 | |
376,111 | | @ | | Dogan Sriketler Grubu Holdings | | 1,802,613 | |
436,868 | | | | HACI Omer Sabanci Holding | | 2,074,919 | |
560,842 | | | | Turkiye Garanti Bankasi | | 2,317,609 | |
302,768 | | | | Turkiye Is Bank ASI - C | | 2,557,435 | |
56,157 | | @ | | Turkiye Vakiflar Bankasi Tao | | 358,684 | |
| | | | | | 10,459,265 | |
| | | | Ukraine: 0.0% | | | |
1,530 | | @,L,I | | Centrenergo ADR | | 12,647 | |
87 | | I | | Ukrnafta Open JT STK ADR | | 31,123 | |
| | | | | | 43,770 | |
| | | | United Arab Emirates: 0.1% | | | |
17,360 | | @ | | Investcom LLC GDR | | 263,004 | |
| | | | | | 263,004 | |
| | | | United Kingdom: 8.7% | | | |
139,281 | | | | Aegis Group PLC | | 345,569 | |
58,941 | | | | Anglo American PLC | | 2,512,923 | |
73,912 | | | | Associated British Ports Holdings PLC | | 979,909 | |
183,511 | | | | BAA PLC | | 2,836,408 | |
70,255 | | | | BAE Systems PLC | | 531,373 | |
28,475 | | | | BG Group PLC | | 378,182 | |
27,190 | | | | BP PLC | | 331,297 | |
88,659 | | | | Burberry Group PLC | | 758,137 | |
248,159 | | | | Compass Group PLC | | 1,071,863 | |
186,164 | | S | | Diageo PLC | | 3,051,450 | |
127,452 | | S | | GlaxoSmithKline PLC | | 3,651,034 | |
34,701 | | | | Highland Gold Mining Ltd. | | 181,835 | |
11,515 | | | | Imperial Tobacco Group PLC | | 355,787 | |
56,014 | | | | Kazakhmys PLC | | 1,165,788 | |
28,680 | | | | London Stock Exchange PLC | | 644,851 | |
22,050 | | @ | | Peter Hambro Mining PLC | | 660,505 | |
69,509 | | | | Prudential PLC | | 808,458 | |
53,050 | | | | Reckitt Benckiser PLC | | 1,925,914 | |
7,249 | | | | Rio Tinto PLC | | 398,403 | |
138,992 | | @ | | Rolls-Royce Group PLC | | 1,213,297 | |
See Accompanying Notes to Financial Statements
131
| | PORTFOLIO OF INVESTMENTS |
ING FOREIGN FUND | | AS OF APRIL 30, 2006 (UNAUDITED) (CONTINUED) |
Shares | | | | | | Value | |
| | | | United Kingdom (continued) | | | |
16,422 | | | | SABMiller PLC | | $ | 342,881 | |
41,841 | | | | Scottish & Newcastle PLC | | 385,877 | |
69,624 | | | | Smith & Nephew PLC | | 572,329 | |
14,974 | | | | Smiths Group PLC | | 276,323 | |
360,211 | | | | Tesco PLC | | 2,090,237 | |
1,919,721 | | S | | Vodafone Group PLC | | 4,525,789 | |
62,592 | | | | William Hill PLC | | 720,807 | |
44,139 | | | | Wolseley PLC | | 1,098,534 | |
120,445 | | | | WPP Group PLC | | 1,476,900 | |
| | | | | | 35,292,660 | |
| | | | United States: 0.5% | | | |
97,564 | | L | | News Corp., Inc. | | 1,778,592 | |
2,231 | | L | | Southern Copper Corp. | | 220,981 | |
| | | | | | 1,999,573 | |
| | | | Venezuela: 0.0% | | | |
10,148 | | | | Cia Anonima Nacional Telefonos de Venezuela ADR | | 206,715 | |
| | | | | | 206,715 | |
| | | | Total Common Stock
(Cost $295,786,774) | | 389,565,540 | |
| | | | | | | |
PREFERRED STOCK: 0.4% | | | |
| | | | Germany: 0.4% | | | |
52,734 | | | | ProSieben SAT.1 Media AG | | 1,456,067 | |
| | | | | | 1,456,067 | |
| | | | Total Preferred Stock (Cost $1,053,559) | | 1,456,067 | |
| | | | | | | |
EQUITY LINKED SECURITIES: 0.8% | | | |
| | | | India: 0.7% | | | |
328,261 | | @ | | Bharti Televentures | | 2,957,632 | |
| | | | | | 2,957,632 | |
| | | | Luxembourg: 0.1% | | | |
14,049 | | @ | | State Bank of India Ltd. | | 275,501 | |
| | | | | | 275,501 | |
| | | | Total Equity Linked Securities
(Cost $2,681,093) | | 3,233,133 | |
| | | | | | | | |
No. of
Contracts | | | | | | Value | |
| | | | | | | |
OPTIONS: 0.0% | | | | | |
| | | | Switzerland: 0.0% | | | |
4,629 | | @ | | Syngenta AG Warrant, Put Option, Strike Price 234, Expires 05/23/06 | | 7,406 | |
| | | | | | 7,406 | |
| | | | Total Options Purchased
(Cost $—) | | 7,406 | |
| | | | | | | |
Shares | | | | | | Value | |
WARRANTS: 0.4% | | | | | |
| | | | India: 0.4% | | | |
86,028 | | @ | | State Bank of India | | $ | 1,699,730 | |
| | | | | | 1,699,730 | |
| | | | Total Warrants (Cost $1,989,808) | | 1,699,730 | |
| | | | Total Long-Term Investments
(Cost $301,511,234) | | 395,961,876 | |
| | | | | | | | |
Principal
Amount | | | | Value | |
| | | |
SHORT-TERM INVESTMENTS: 4.4% | | | |
| | U.S. Government Agency Obligations: 1.3% | | | |
$ | 5,134,000 | | Federal Home Loan Bank, | | | |
| | 4.400%, due 05/01/06 | | 5,133,373 | |
| | Total U.S. Government Agency Obligations (Cost $5,133,373) | | 5,133,373 | |
| | Securities Lending Collateralcc: 3.1% | | | |
12,719,705 | | The Bank of New York | | | |
| | Institutional Cash Reserve Fund | | 12,719,705 | |
| | Total Securities Lending Collateral
(Cost $12,719,705) | | 12,719,705 | |
| | Total Short-Term Investments
(Cost $17,853,078) | | 17,853,078 | |
| | Total Investments In Securities
(Cost $319,364,312)* | | 101.8 | % | $ | 413,814,954 | |
| | Other Assets and Liabilities-Net | | (1.8 | ) | (7,356,212 | ) |
| | Net Assets | | 100.0 | % | $ | 406,458,742 | |
| | | | | | | | | |
| | Securities may have been fair valued in accordance with procedures approved by the Board of Directors/Trustees (Note 2A). | |
@ | | Non-income producing security | |
ADR | | American Depositary Receipt | |
GDR | | Global Depositary Receipt | |
# | | Securities with purchases pursuant to Rule 144A, under the Securities Act of 1933 and may not be resold subject to that rule except to qualified institutional buyers. These securities have been determined to be liquid under the guidelines established by the Funds’ Board of Directors/Trustees. | |
cc | | Securities purchased with cash collateral for securities loaned. | |
S | | Segregated securities for certain derivatives, when-issued or delayed delivery securities and forward currency exchange contracts. | |
I | | Illiquid security | |
L | | Loaned security, a portion or all of the security is on loan at April 30, 2006. | |
X | | Fair value determined by ING Funds Valuation Committee appointed by the Funds’ Board of Directors/Trustees. | |
* | | Cost for federal income tax purposes is $320,881,546 | |
| | | Net unrealized appreciation consists of: | | |
| | | Gross Unrealized Appreciation | $94,454,781 | |
| | | Gross Unrealized Depreciation | (1,521,373 | ) |
| | | Net Unrealized Appreciation | $92,933,408 | |
| | | | | | |
See Accompanying Notes to Financial Statements
132
| | PORTFOLIO OF INVESTMENTS |
ING FOREIGN FUND | | AS OF APRIL 30, 2006 (UNAUDITED) (CONTINUED) |
At April 30, 2006 the following forward foreign currency contracts were outstanding for the ING Foreign Fund:
Currency | | Buy/Sell | | Settlement
Date | | In
Exchange
For | | Value | | Unrealized
Appreciation
(Depreciation) | |
British Pound Sterling
GBP 1,139,113 | | Buy | | 09/25/06 | | USD
1,991,192 | | 2,075,218 | | | $ | 84,026 | |
Czech Republic Koruny
CZK 7,407,646 | | Sell | | 09/25/06 | | USD
316,810 | | 331,689 | | (14,879 | ) |
Czech Republic Koruny
CZK 15,501,997 | | Sell | | 09/25/06 | | USD
656,308 | | 694,126 | | (37,818 | ) |
Czech Republic Koruny
CZK 19,081,262 | | Sell | | 09/25/06 | | USD
807,843 | | 854,393 | | (46,550 | ) |
Euro
EUR 9,162,727 | | Sell | | 06/30/06 | | USD
11,247,613 | | 11,587,182 | | | | (339,569 | ) |
| | | | | | | | | | | $ | (354,792 | ) |
Industry | | Percentage of
Net Assets | |
Advertising | | 0.8 | % |
Aerospace/Defense | | 0.7 | |
Agriculture | | 0.4 | |
Apparel | | 0.5 | |
Auto Manufacturers | | 3.1 | |
Auto Parts & Equipment | | 1.0 | |
Banks | | 24.9 | |
Beverages | | 2.0 | |
Building Materials | | 3.6 | |
Chemicals | | 1.5 | |
Commercial Services | | 1.1 | |
Computers | | 0.2 | |
Distribution/Wholesale | | 0.5 | |
Diversified Financial Services | | 3.2 | |
Electric | | 2.7 | |
Electrical Components & Equipment | | 0.6 | |
Electronics | | 0.9 | |
Energy - Alternate Sources | | 0.2 | |
Engineering & Construction | | 4.0 | |
Entertainment | | 0.2 | |
Federal Home Loan Bank | | 1.3 | |
Food | | 2.0 | |
Food Service | | 0.3 | |
Forest Products & Paper | | 0.2 | |
Healthcare - Products | | 0.5 | |
Healthcare - Services | | 0.6 | |
Holding Companies - Diversified | | 3.2 | |
Home Furnishings | | 1.3 | |
Household Products/Wares | | 0.7 | |
Insurance | | 1.3 | |
Internet | | 0.1 | |
Investment Companies | | 2.8 | |
Iron/Steel | | 0.1 | |
Leisure Time | | 0.2 | |
Machinery - Diversified | | 0.2 | |
Media | | 2.1 | |
Mining | | 4.3 | |
Miscellaneous Manufacturing | | 0.9 | |
Office/Business Equipment | | 0.7 | |
Oil & Gas | | 6.7 | |
Pharmaceuticals | | 4.4 | |
Real Estate | | 2.0 | |
Retail | | 2.4 | |
Semiconductors | | 1.0 | |
Software | | 0.2 | |
Telecommunications | | 5.2 | |
Textiles | | 0.2 | |
Transportation | | 1.6 | |
Venture Capital | | 0.1 | |
Securities Lending Collateral | | 3.1 | |
Other Assets and Liabilities, Net | | (1.8 | ) |
Net Assets | | 100.0 | % |
| | | | | |
See Accompanying Notes to Financial Statements
133
| | PORTFOLIO OF INVESTMENTS |
ING GREATER CHINA FUND | | AS OF APRIL 30, 2006 (UNAUDITED) |
Shares | | | | | | Value | |
COMMON STOCK: 90.6% | | | |
| | | | China: 14.4% | | | |
705,000 | | @,# | | China Construction Bank | | $ | 304,766 | |
300,000 | | @ | | China Life Insurance Co., Ltd. | | 403,991 | |
141,500 | | | | China Shenhua Energy Co., Ltd. | | 256,021 | |
72,200 | | | | Guangzhou R&F Properties Co., Ltd. | | 373,391 | |
147,000 | | @ | | Jiangxi Copper Co., Ltd. | | 154,642 | |
1,140,000 | | | | PetroChina Co., Ltd. | | 1,274,507 | |
| | | | | | 2,767,318 | |
| | | | Hong Kong: 35.6% | | | |
28,500 | | | | ASM Pacific Technology | | 165,957 | |
156,800 | | | | Bank of East Asia | | 655,077 | |
110,000 | | | | Cheung Kong Holdings Ltd. | | 1,240,434 | |
62,500 | | | | China Mobile Hong Kong Ltd. | | 361,579 | |
221,000 | | | | China Netcom Group Corp. Hong Kong Ltd. | | 403,858 | |
862,000 | | | | China Overseas Land & Investment Ltd. | | 551,131 | |
146,000 | | | | China Resources Enterprise | | 312,513 | |
804,000 | | | | Denway Motors Ltd. | | 323,629 | |
16,000 | | | | Esprit Holdings Ltd. | | 127,734 | |
110,000 | | | | Hang Lung Properties Ltd. | | 261,748 | |
115,000 | | | | Hong Kong & China Gas | | 274,305 | |
22,000 | | | | Hong Kong Exchanges and Clearing Ltd. | | 158,130 | |
269,000 | | | | MTR Corp. | | 717,282 | |
1,150,000 | | | | Pacific Century Premium Developments Ltd. | | 363,474 | |
650,000 | | | | Solomon Systech International Ltd. | | 289,303 | |
39,000 | | | | Sun Hung Kai Properties Ltd. | | 445,777 | |
18,000 | | | | Swire Pacific Ltd. | | 184,143 | |
| | | | | | 6,836,074 | |
| | | | Taiwan: 38.9% | | | |
184,000 | | | | AU Optronics Corp. | | 302,742 | |
30,000 | | | | Catcher Technology Co., Ltd. | | 335,316 | |
305,000 | | | | Cathay Financial Holding Co., Ltd. | | 683,020 | |
404,000 | | | | Chung Hsin Electric & Machinery Manufacturing Corp. | | 307,361 | |
108,000 | | | | Chunghwa Telecom Co., Ltd. | | 207,591 | |
311,000 | | | | Far Eastern Textile Co., Ltd. | | 286,255 | |
61,000 | | | | Foxconn Technology Co., Ltd. | | 458,127 | |
6,000 | | | | High Tech Computer Corp. | | 191,842 | |
162,000 | | | | HON HAI Precision Industry Co., Ltd. | | 1,094,458 | |
291,000 | | | | Lite-On Technology Corp. | | 459,620 | |
26,000 | | | | MediaTek, Inc. | | 303,841 | |
90,000 | | | | Powertech Technology, Inc. | | 309,399 | |
552,000 | | | | ProMOS Technologies, Inc. | | 213,431 | |
179,000 | | | | Quanta Storage, Inc. | | 331,444 | |
200,000 | | | | Siliconware Precision Industries Co. | | 286,458 | |
198,000 | | @ | | Sinkong Spinning | | 109,036 | |
500,000 | | | | Taiwan Semiconductor Manufacturing Co., Ltd. | | 1,057,113 | |
429,000 | | | | United Microelectronics Corp. | | 298,571 | |
507,000 | | | | Yuen Foong Yu Paper Manufacturing Co., Ltd. | | 228,978 | |
| | | | | | 7,464,603 | |
| | | | United Kingdom: 1.7% | | | |
19,600 | | | | HSBC Holdings PLC | | $ | 337,118 | |
| | | | | | 337,118 | |
| | | | Total Common Stock
(Cost $15,195,852) | | 17,405,113 | |
| | | | Total Investments In Securities (Cost $15,195,852)* | | 90.6 | % | $ | 17,405,113 | |
| | | | Other Assets and Liabilities-Net | | 9.4 | | 1,806,261 | |
| | | | Net Assets | | 100.0 | % | $ | 19,211,374 | |
| | Securities may have been fair valued in accordance with procedures approved by the Board of Directors/Trustees (Note 2A). |
@ | | Non-income producing security |
# | | Securities with purchases pursuant to Rule 144A, under the Securities Act of 1933 and may not be resold subject to that rule except to qualified institutional buyers. These securities have been determined to be liquid under the guidelines established by the Funds’ Board of Directors/Trustees. |
* | | Cost for federal income tax purposes is $15,198,711 |
| Net unrealized appreciation consists of: | | | |
| Gross Unrealized Appreciation | | $2,232,943 | |
| Gross Unrealized Depreciation | | (26,541 | ) |
| Net Unrealized Appreciation | | $2,206,402 | |
| | | | | | |
Industry | | Percentage of
Net Assets | |
Auto Manufacturers | | 1.7 | % |
Banks | | 6.8 | |
Coal | | 1.3 | |
Computers | | 7.5 | |
Distribution/Wholesale | | 0.7 | |
Diversified Financial Services | | 0.8 | |
Electronics | | 7.3 | |
Forest Products & Paper | | 1.2 | |
Gas | | 1.4 | |
Holding Companies - Diversified | | 2.6 | |
Insurance | | 5.7 | |
Machinery - Diversified | | 1.6 | |
Metal Fabricate/Hardware | | 2.5 | |
Oil & Gas | | 6.6 | |
Real Estate | | 16.8 | |
Semiconductors | | 15.2 | |
Telecommunications | | 5.1 | |
Textiles | | 2.1 | |
Transportation | | 3.7 | |
Other Net Assets and Liabilities, Net | | 9.4 | |
Total Net Assets | | 100.0 | % |
| | | | | |
See Accompanying Notes to Financial Statements
134
| | PORTFOLIO OF INVESTMENTS |
ING INDEX PLUS INTERNATIONAL EQUITY FUND | | AS OF APRIL 30, 2006 (UNAUDITED) |
Shares | | | | | | Value | |
COMMON STOCK: 93.8% | | | |
| | | | Australia: 4.8% | | | |
47,753 | | | | Amcor Ltd. | | $ | 261,823 | |
5,354 | | | | Aristocrat Leisure Ltd. | | 59,922 | |
2,804 | | | | Australian Gas Light Co., Ltd. | | 41,285 | |
4,639 | | | | BHP Billiton Ltd. | | 105,290 | |
62,604 | | | | BlueScope Steel Ltd. | | 365,796 | |
4,679 | | | | Brambles Industries Ltd. | | 39,718 | |
5,167 | | | | Coca-Cola Amatil Ltd. | | 28,533 | |
14,725 | | | | Coles Myer Ltd. | | 119,718 | |
11,313 | | | | Commonwealth Bank of Australia | | 403,721 | |
1,007 | | | | CSL Ltd. | | 43,996 | |
10,320 | | | | Foster’s Group Ltd. | | 46,083 | |
39,956 | | | | Insurance Australia Group Ltd. | | 171,512 | |
9,712 | | | | John Fairfax Holdings Ltd. | | 28,719 | |
3,700 | | | | Leighton Holdings Ltd. | | 47,003 | |
14,234 | | | | Macquarie Airports | | 35,442 | |
16,388 | | | | Mayne Group Ltd. | | 42,546 | |
55,851 | | | | Prime Retail Group | | 275,532 | |
23,112 | | | | Qantas Airways Ltd. | | 60,654 | |
14,811 | | | | Santos Ltd. | | 132,947 | |
10,495 | | | | SunCorp.-Metway Ltd. | | 162,078 | |
19,579 | | | | Westpac Banking Corp. | | 372,927 | |
| | | | | | 2,845,245 | |
| | | | Austria: 0.4% | | | |
77 | | | | Boehler-Uddeholm ADG | | 17,449 | |
993 | | | | Erste Bank der Oesterreichischen Sparkassen AG | | 60,164 | |
3,638 | | @ | | IMMOFINANZ Immobilien Anlagen AG | | 39,792 | |
655 | | | | OMV AG | | 45,418 | |
1,057 | | | | Telekom Austria AG | | 25,874 | |
42 | | | | Verbund - Oesterreichische Elektrizitaetswirtschafts AG | | 19,940 | |
209 | | | | Voestalpine AG | | 30,456 | |
219 | | | | Wienerberger AG | | 11,560 | |
| | | | | | 250,653 | |
| | | | Belgium: 1.0% | | | |
856 | | | | AGFA-Gevaert NV | | 17,336 | |
149 | | | | Bekaert SA | | 17,098 | |
939 | | | | Belgacom SA | | 30,675 | |
453 | | | | Delhaize Group | | 32,599 | |
7,251 | | | | Fortis | | 271,372 | |
505 | | | | Interbrew | | 25,431 | |
1,390 | | | | KBC Bancassurance Holding | | 161,080 | |
406 | | | | Solvay SA | | 47,390 | |
| | | | | | 602,981 | |
| | | | Bermuda: 0.3% | | | |
5,150 | | | | Frontline Ltd. | | 165,644 | |
| | | | | | 165,644 | |
| | | | Denmark: 0.6% | | | |
9 | | | | AP Moller - Maersk A/S | | 77,168 | |
250 | | | | Carlsberg A/S | | 16,793 | |
1,872 | | | | Danske Bank A/S | | 74,298 | |
575 | | | | East Asiatic Co., Ltd. A/S | | 24,480 | |
800 | | | | GN Store Nord | | 11,346 | |
1,300 | | | | Novo-Nordisk A/S | | 84,337 | |
250 | | | | Novozymes A/S | | 19,492 | |
150 | | @ | | Topdanmark A/S | | 19,577 | |
1,000 | | @ | | Vestas Wind Systems A/S | | 27,102 | |
| | | | | | 354,593 | |
| | | | Finland: 1.4% | | | |
2,000 | | | | Fortum OYJ | | $ | 50,380 | |
700 | | | | Kesko OYJ | | 24,137 | |
550 | | | | Neste Oil OYJ | | 19,089 | |
18,770 | | | | Nokia OYJ | | 477,462 | |
1,000 | | | | Orion OYJ | | 23,706 | |
3,223 | | | | Outokumpu OYJ | | 553 | |
3,326 | | | | Rautaruukki OYJ | | 140,890 | |
1,800 | | | | Sampo OYJ | | 37,084 | |
2,041 | | | | Wartsila OYJ | | 86,805 | |
| | | | | | 860,106 | |
| | | | France: 8.1% | | | |
1,425 | | | | Accor | | 89,525 | |
912 | | | | Air France | | 21,196 | |
8,005 | | @ | | Alcatel SA | | 115,265 | |
1,304 | | @,# | | Atos Origin | | 97,625 | |
251 | | | | Autoroutes du Sud de la France | | 16,128 | |
7,651 | | | | AXA | | 279,711 | |
960 | | | | BNP Paribas | | 90,527 | |
4,170 | | | | Bouygues | | 227,098 | |
1,909 | | | | Casino Guichard Perrachon SA | | 151,743 | |
2,923 | | | | Cie de Saint-Gobain | | 218,981 | |
406 | | # | | Cie Generale D’Optique Essilor International SA | | 40,584 | |
9,609 | | | | Credit Agrocole SA | | 386,794 | |
2,092 | | | | Gaz de France | | 75,088 | |
1,621 | | | | Groupe Danone | | 202,044 | |
1,426 | | | | L’Oreal SA | | 131,983 | |
1,204 | | | | Lagardere SCA | | 99,286 | |
1,623 | | | | LVMH Moet Hennessy Louis Vuitton SA | | 170,553 | |
3,023 | | | | Michelin (C.G.D.E.) | | 217,868 | |
235 | | | | Pinault-Printemps-Redoute | | 30,432 | |
1,440 | | | | Publicis Groupe | | 59,785 | |
4,954 | | | | Sanofi-Synthelabo SA | | 466,444 | |
1,839 | | | | Societe Generale | | 280,668 | |
4,860 | | | | Suez SA | | 189,472 | |
3,864 | | | | Technip SA | | 243,608 | |
5,634 | | | | Thales SA | | 241,712 | |
1,640 | | | | Total SA | | 451,889 | |
230 | | | | Unibail | | 40,006 | |
1,037 | | | | Veolia Environnement | | 61,877 | |
4,096 | | | | Vivendi Universal SA | | 149,321 | |
| | | | | | 4,847,213 | |
| | | | Germany: 5.4% | | | |
336 | | | | Adidas-Salomon AG | | 70,906 | |
753 | | | | Allianz AG | | 125,795 | |
210 | | | | BASF AG | | 17,950 | |
338 | | | | Bayer AG | | 15,485 | |
267 | | | | Beiersdorf AG | | 40,353 | |
175 | | | | Celesio AG | | 16,491 | |
5,413 | | | | Commerzbank AG | | 223,403 | |
3,550 | | | | Deutsche Bank AG | | 433,022 | |
11,965 | | | | Deutsche Lufthansa AG | | 220,296 | |
1,170 | | | | Deutsche Post AG | | 31,168 | |
11,973 | | | | Deutsche Telekom AG | | 216,373 | |
354 | | | | Douglas Holding AG | | 17,043 | |
686 | | | | EON AG | | 83,874 | |
378 | | | | Fresenius Medical Care AG | | 45,285 | |
5,228 | | | | Hochtief AG | | 355,754 | |
2,591 | | @ | | Infineon Technologies AG | | 31,529 | |
1,281 | | @ | | Merck KGaA | | 135,915 | |
See Accompanying Notes to Financial Statements
135
| | PORTFOLIO OF INVESTMENTS |
ING INDEX PLUS INTERNATIONAL EQUITY FUND | | AS OF APRIL 30, 2006 (UNAUDITED) (CONTINUED) |
Shares | | | | | | Value | |
| | | | Germany (continued) | | | |
398 | | | | Metro AG | | $ | 22,508 | |
2,065 | | | | Muenchener Rueckversicherungs AG | | 291,557 | |
896 | | | | ProSiebenSat.1 Media AG | | 24,797 | |
1,069 | | | | SAP AG | | 233,462 | |
934 | | | | Siemens AG | | 88,458 | |
12,688 | | | | ThyssenKrupp AG | | 417,911 | |
1,088 | | | | TUI AG | | 23,139 | |
120,000 | | | | Wincor Nixdorf AG | | 17,241 | |
| | | | | | 3,199,715 | |
| | | | Greece: 0.5% | | | |
547 | | | | Coca Cola Hellenic Bottling Co. SA | | 17,921 | |
1,693 | | | | Cosmote Mobile Communications SA | | 41,423 | |
2,186 | | | | EFG Eurobank Ergasias SA | | 86,973 | |
1,626 | | | | Hellenic Petroleum | | 24,564 | |
1,575 | | | | National Bank of Greece | | 78,038 | |
1,277 | | | | OPAP SA | | 46,903 | |
| | | | | | 295,822 | |
| | | | Hong Kong: 1.3% | | | |
15,287 | | | | Cathay Pacific Airways Ltd. | | 27,313 | |
22,800 | | | | CLP Holdings Ltd. | | 132,958 | |
6,430 | | | | Esprit Holdings Ltd. | | 51,333 | |
22,481 | | | | Hang Lung Properties Ltd. | | 45,201 | |
9,529 | | | | Henderson Land Development | | 56,005 | |
4,000 | | | | Hong Kong Exchanges and Clearing Ltd. | | 28,751 | |
9,364 | | | | Hutchison Whampoa International Ltd. | | 91,990 | |
4,500 | | | | Kerry Properties Ltd. | | 15,957 | |
14,000 | | | | New World Development Ltd. | | 25,159 | |
47,678 | | | | Sino Land Co. | | 79,358 | |
9,000 | | | | Swire Pacific Ltd. | | 92,072 | |
13,500 | | | | Wing Hang Bank Ltd. | | 124,847 | |
4,523 | | | | Wharf Holdings Ltd. | | 18,155 | |
385 | | | | Yue Yuen Industrial Holdings | | 1,129 | |
| | | | | | 790,228 | |
| | | | Ireland: 0.7% | | | |
952 | | | | Allied Irish Banks PLC | | 196,355 | |
2,261 | | | | CRH PLC | | 82,920 | |
6,257 | | | | Eircom Group PLC | | 17,118 | |
1,790 | | @ | | Elan Corp. PLC | | 26,186 | |
1,852 | | | | Grafton Group PLC | | 25,633 | |
1,110 | | | | Irish Life & Permanent PLC | | 28,185 | |
1,317 | | | | Kerry Group PLC | | 32,624 | |
| | | | | | 409,021 | |
| | | | Italy: 3.5% | | | |
5,078 | | | | Assicurazioni Generali S.p.A. | | 190,073 | |
1,180 | | | | Autostrade S.p.A. | | 36,164 | |
13,638 | | | | Banca Fideuram S.p.A. | | 82,132 | |
60,380 | | | | Banca Intesa S.p.A. | | 357,424 | |
555 | | | | Banche Popolari Unite SCRL | | 14,017 | |
2,274 | | | | Bulgari S.p.A | | 28,181 | |
46,224 | | | | Capitalia S.p.A. | | 400,810 | |
24,016 | | | | Enel S.p.A. | | 207,474 | |
12,399 | | | | ENI-Ente Nazionale Idrocarburi S.p.A. | | 378,779 | |
3,148 | | @ | | Fiat S.p.A. | | 44,232 | |
660 | | | | Italcementi S.p.A. | | 17,343 | |
4,143 | | | | Mediaset S.p.A. | | $ | 52,349 | |
52,531 | | | | Pirelli & C S.p.A. | | 51,137 | |
38,189 | | | | Seat Pagine Gialle S.p.A. | | 18,193 | |
72,888 | | | | Telecom Italia S.p.A. | | 203,923 | |
| | | | | | 2,082,231 | |
| | | | Japan: 23.1% | | | |
1,920 | | | | Acom Co., Ltd. | | 111,676 | |
700 | | | | Advantest Corp. | | 80,382 | |
3,800 | | | | Aiful Corp. | | 226,036 | |
3,000 | | | | Ajinomoto Co., Inc. | | 37,234 | |
1,000 | | | | Alps Electric Co., Ltd. | | 17,513 | |
3,000 | | | | All Nippon Airways Co., Ltd. | | 11,149 | |
6,500 | | | | Asahi Breweries Ltd. | | 92,716 | |
7,000 | | | | Asahi Kasei Corp. | | 51,521 | |
6,000 | | | | Bank of Fukuoka Ltd. | | 51,417 | |
9,000 | | | | Bank of Kyoto Ltd. | | 103,797 | |
19,000 | | | | Bridgestone Corp. | | 460,632 | |
2,000 | | | | Canon Sales Co., Inc. | | 44,931 | |
4,200 | | | | Casio Computer Co., Ltd. | | 78,512 | |
11 | | | | Central Japan Railway Co. | | 112,846 | |
12,100 | | | | Chugai Pharmaceutical Co., Ltd. | | 261,286 | |
1,900 | | | | CSK Holdings Corp. | | 90,886 | |
8,000 | | | | Dai Nippon Printing Co., Ltd. | | 142,898 | |
15,000 | | | | Dainippon Screen Manufacturing Co., Ltd. | | 155,670 | |
1,000 | | | | Daiwa Securities Group, Inc. | | 13,769 | |
14,000 | | | | Denki Kagaku Kogyo K K | | 63,840 | |
9 | | | | East Japan Railway Co. | | 70,024 | |
3,800 | | | | Eisai Co., Ltd. | | 172,795 | |
14,000 | | | | Fujitsu Ltd. | | 115,978 | |
800 | | | | Hakuhodo DY Holdings, Inc. | | 75,218 | |
700 | | | | Hikari Tsushin Inc. | | 43,174 | |
40,000 | | | | Hino Motors Ltd. | | 243,169 | |
50,000 | | | | Hitachi Ltd. | | 370,518 | |
5,700 | | | | Isetan Co., Ltd. | | 116,319 | |
40,000 | | | | Itochu Corp. | | 361,112 | |
200 | | | | Jafco Co., Ltd | | 13,225 | |
25,000 | | @ | | Japan Airlines Corp. | | 66,143 | |
45 | | | | Japan Tobacco, Inc. | | 179,984 | |
6,300 | | | | JFE Holdings, Inc. | | 243,705 | |
5,000 | | | | Kao Corp. | | 134,001 | |
13,000 | | | | Kawasaki Kisen Kaisha Ltd. | | 81,449 | |
46 | | | | KDDI Corp. | | 282,908 | |
3,000 | | | | Keisei Electric Railway Co., Ltd. | | 20,499 | |
830 | | | | Keyence Corp. | | 216,800 | |
9,000 | | | | Kintetsu Corp. | | 33,547 | |
19,000 | | | | Kobe Steel Ltd. | | 64,372 | |
5,500 | | | | Leopalace21 Corp. | | 212,981 | |
7,800 | | | | Makita Corp. | | 230,797 | |
2,000 | | | | Marubeni Corp. | | 11,479 | |
3,000 | | | | Meiji Dairies Corp. | | 19,002 | |
5,100 | | | | Mediceo Paltac Holdings Co., Ltd. | | 94,277 | |
5 | | | | Millea Holdings, Inc. | | 99,555 | |
21,000 | | | | Mitsubishi Chemical Holdings Corp. | | 132,295 | |
22 | | | | Mitsubishi Tokyo Financial Group, Inc. | | 342,943 | |
8,000 | | | | Mitsui Chemicals, Inc. | | 57,678 | |
10,000 | | | | Mitsui OSK Lines Ltd. | | 71,342 | |
9,000 | | | | Mitsui Sumitomo Insurance Co., Ltd. | | 120,789 | |
26,000 | | | | Mitsui Trust Holdings, Inc. | | 357,479 | |
3,000 | | | | Mitsukoshi Ltd. | | 17,399 | |
See Accompanying Notes to Financial Statements
136
| | PORTFOLIO OF INVESTMENTS |
ING INDEX PLUS INTERNATIONAL EQUITY FUND | AS OF APRIL 30, 2006 (UNAUDITED) (CONTINUED) |
Shares | | | | | | Value | |
| | | | Japan (continued) | | | |
34 | | | | Mizuho Financial Group, Inc. | | $ | 288,546 | |
9,000 | | | | Nikon Corp. | | 176,332 | |
1,800 | | | | Nintendo Co., Ltd. | | 266,822 | |
5,000 | | | | Nippon Express Co., Ltd. | | 26,292 | |
36,000 | | | | Nippon Steel Corp. | | 132,347 | |
15 | | | | Nippon Unipac Holding | | 63,951 | |
8,000 | | | | Nippon Yusen Kabushiki Kaisha | | 48,866 | |
54,000 | | | | Nishi-Nippon City Bank Ltd. | | 273,066 | |
44,000 | | | | Nisshin Steel Co., Ltd. | | 153,016 | |
6,000 | | | | Nisshinbo Industries, Inc. | | 70,507 | |
10,000 | | | | OJI Paper Co., Ltd. | | 59,432 | |
89,000 | | | | Oki Electric Industry Ltd. | | 274,069 | |
500 | | | | Omron Corp. | | 13,886 | |
500 | | | | Oriental Land Co., Ltd. | | 29,941 | |
490 | | | | ORIX Corp. | | 146,851 | |
3,400 | | | | Promise Co., Ltd. | | 208,975 | |
89 | | | | Resona Holdings, Inc. | | 301,322 | |
1,000 | | | | Sankyo Co., Ltd. | | 70,716 | |
2,000 | | | | Sekisui Chemical Co., Ltd. | | 17,213 | |
7,000 | | | | Sekisui House Ltd. | | 108,119 | |
71,000 | | | | Shimizu Corp. | | 489,877 | |
10,200 | | | | Showa Shell Sekiyu KK | | 125,948 | |
8,000 | | | | Sompo Japan Insurance, Inc. | | 115,551 | |
3,000 | | | | Sony Corp. | | 146,259 | |
2,000 | | | | Sumitomo Chemical Co., Ltd. | | 17,449 | |
5,000 | | | | Sumitomo Corp. | | 74,528 | |
15,000 | | | | Sumitomo Metal Industries Ltd. | | 62,954 | |
2 | | | | Sumitomo Mitsui Financial Group, Inc. | | 21,865 | |
85,000 | | | | Taisei Corp. | | 378,653 | |
4,000 | | | | Takashimaya Co., Ltd. | | 58,083 | |
2,600 | | | | Takeda Chemical Industries Ltd. | | 158,533 | |
8,000 | | | | Tokyo Electric Power Company Inc. | | 205,006 | |
1,700 | | | | Tokyo Electron Ltd. | | 121,637 | |
66,000 | | | | Tokyo Gas Co., Ltd. | | 317,947 | |
1,800 | | | | Tokyo Steel Manufacturing Co., Ltd. | | 37,980 | |
11,000 | | | | Tokyo Tatemono Co., Ltd. | | 126,426 | |
18,000 | | | | Toshiba Corp. | | 113,899 | |
34,000 | | | | Tosoh Corp. | | 165,982 | |
31,000 | | | | Toyobo Co., Ltd. | | 96,818 | |
8,800 | | | | Toyota Motor Corp. | | 512,629 | |
16,000 | | | | UNY Co., Ltd. | | 284,485 | |
11 | | | | West Japan Railway Co. | | 48,691 | |
19,100 | | | | Yamaha Motor Co., Ltd. | | 522,234 | |
| | | | | | 13,815,370 | |
| | | | Luxembourg: 0.6% | | | |
8,007 | | | | Arcelor | | 330,142 | |
| | | | | | 330,142 | |
| | | | Netherlands: 5.9% | | | |
10,894 | | | | Aegon NV | | 197,130 | |
3,495 | | @ | | ASML Holding NV | | 73,793 | |
3,432 | | | | Buhrmann NV | | 66,416 | |
3,807 | | | | DSM NV | | 173,396 | |
395 | | | | Euronext NV | | 35,227 | |
417 | | | | European Aeronautic Defence and Space Co NV | | 16,439 | |
10,590 | | @ | | Koninklijke Ahold NV | | 86,824 | |
8,869 | | | | Koninklijke Philips Electronics NV | | 305,425 | |
630 | | | | Rodamco Europe NV | | 67,692 | |
22,413 | | | | Royal Dutch Shell PLC - A Shares | | 761,644 | |
23,485 | | | | Royal Dutch Shell PLC - B Shares | | $ | 835,061 | |
13,979 | | | | Royal KPN NV | | 164,057 | |
275 | | | | SBM Offshore NV | | 29,464 | |
2,915 | | | | TPG NV | | 104,749 | |
4,991 | | | | Unilever NV | | 359,866 | |
242 | | | | Wereldhave NV | | 25,215 | |
7,635 | | | | Wolters Kluwer NV | | 198,699 | |
| | | | | | 3,501,097 | |
| | | | New Zealand: 0.1% | | | |
6,496 | | | | Fletcher Building Ltd. | | 37,606 | |
2,795 | | | | Telecom Corp. of New Zealand Ltd. | | 10,158 | |
| | | | | | 47,764 | |
| | | | Norway: 0.5% | | | |
4,000 | | | | DNB Holding ASA | | 55,323 | |
100 | | | | Norsk Hydro ASA | | 15,279 | |
800 | | | | Orkla ASA | | 41,937 | |
1,600 | | @ | | Petroleum Geo-Services ASA | | 89,390 | |
827 | | | | Statoil ASA | | 27,039 | |
900 | | | | Tandberg Television ASA | | 18,075 | |
3,000 | | | | Telenor ASA | | 34,679 | |
1,600 | | | | Yara International ASA | | 25,623 | |
| | | | | | 307,345 | |
| | | | Portugal: 0.3% | | | |
16,809 | | | | Banco Comercial Portugues SA | | 51,291 | |
7,746 | | | | Electricidade de Portugal SA | | 30,452 | |
4,120 | | | | Portugal Telecom SGPS SA | | 52,225 | |
15,459 | | | | Sonae SGPS SA | | 26,302 | |
| | | | | | 160,270 | |
| | | | Singapore: 0.7% | | | |
14,000 | | | | CapitaLand Ltd. | | 43,439 | |
50,000 | | | | ComfortDelgro Corp., Ltd. | | 50,962 | |
4,000 | | | | Fraser and Neave Ltd. | | 55,979 | |
9,000 | | | | SembCorp Industries Ltd. | | 20,500 | |
7,000 | | | | Singapore Press Holdings Ltd. | | 18,971 | |
27,000 | | | | Singapore Telecommunications Ltd. | | 46,848 | |
19,000 | | | | United Overseas Bank Ltd. | | 195,901 | |
| | | | | | 432,600 | |
| | | | Spain: 3.4% | | | |
1,765 | | | | Abertis Infraestructuras SA | | 46,534 | |
619 | | | | Antena 3 de Television SA | | 16,282 | |
20,299 | | | | Banco Bilbao Vizcaya Argentaria SA | | 447,448 | |
28,031 | | | | Banco Santander Central Hispano SA | | 432,393 | |
2,944 | | | | Ebro Puleva SA | | 58,147 | |
10,419 | | | | Endesa SA | | 344,570 | |
1,703 | | | | Fomento de Construcciones y Contratas SA | | 137,979 | |
1,093 | | | | Inditex SA | | 44,422 | |
331 | | | | Metrovacesa SA | | 30,212 | |
4,996 | | | | Repsol YPF SA | | 148,925 | |
20,574 | | | | Telefonica SA | | 328,946 | |
439 | | | | Union Fenosa SA | | 16,952 | |
| | | | | | 2,052,810 | |
| | | | Sweden: 2.2% | | | |
2,102 | | | | Atlas Copco AB | | 57,207 | |
2,000 | | @ | | Capio AB | | 39,294 | |
1,327 | | | | Electrolux AB | | 39,615 | |
See Accompanying Notes to Financial Statements
137
| | PORTFOLIO OF INVESTMENTS |
ING INDEX PLUS INTERNATIONAL EQUITY FUND | AS OF APRIL 30, 2006 (UNAUDITED) (CONTINUED) |
Shares | | | | | | Value | |
| | | | Sweden (continued) | | | |
800 | | | | Elekta AB | | $ | 13,165 | |
2,087 | | @ | | Hennes & Mauritz AB | | 78,983 | |
900 | | | | Kungsleden AB | | 31,942 | |
400 | | @ | | Modern Times Group AB | | 21,883 | |
20,500 | | | | Nordea AB | | 263,064 | |
1,841 | | | | Scania AB | | 85,384 | |
1,200 | | | | Securitas AB | | 24,950 | |
800 | | | | SKF AB | | 13,698 | |
900 | | | | Ssab Svenskt Stal AB | | 52,863 | |
500 | | | | Svenska Cellulosa AB | | 22,571 | |
1,400 | | | | Swedish Match AB | | 20,936 | |
6,137 | | | | Tele2 AB | | 77,479 | |
72,073 | | | | Telefonaktiebolaget LM Ericsson | | 254,862 | |
1,200 | | | | Trelleborg AB | | 26,659 | |
3,662 | | | | Volvo AB - B Shares | | 183,673 | |
| | | | | | 1,308,228 | |
| | | | Switzerland: 6.3% | | | |
790 | | | | Adecco SA | | 48,860 | |
3,323 | | | | Ciba Specialty Chemicals AG | | 203,281 | |
2,586 | | | | Compagnie Financiere Richemont AG | | 133,567 | |
1,881 | | | | Credit Suisse Group | | 117,813 | |
443 | | @ | | Logitech International SA | | 18,262 | |
1,837 | | | | Nestle SA | | 558,499 | |
6,157 | | | | Novartis AG | | 351,879 | |
1,224 | | | | Phonak Holding AG | | 75,815 | |
5,146 | | | | Roche Holding AG | | 787,570 | |
3,484 | | | | Schindler Holding AG | | 190,314 | |
2,614 | | | | STMicroelectronics NV | | 47,812 | |
192 | | | | Swatch Group AG | | 34,349 | |
90 | | | | Swisscom AG | | 29,940 | |
7,642 | | | | UBS AG | | 894,329 | |
1,093 | | @ | | Zurich Financial Services AG | | 265,204 | |
| | | | | | 3,757,494 | |
| | | | United Kingdom: 18.9% | | | |
8,808 | | | | Amec PLC | | 63,403 | |
27,177 | | | | Amvescap PLC | | 294,548 | |
395 | | | | Anglo American PLC | | 16,859 | |
12,210 | | | | AstraZeneca PLC | | 669,667 | |
1,200 | | | | Aviva PLC | | 17,393 | |
7,159 | | | | Barclays PLC | | 88,670 | |
2,543 | | | | BBA Group PLC | | 12,113 | |
2,430 | | @ | | Berkeley Group Holdings PLC | | 50,708 | |
10,832 | | | | Boots Group PLC | | 138,055 | |
76,785 | | | | BP PLC | | 936,498 | |
8,644 | | | | Brambles Industries PLC | | 71,651 | |
10,225 | | @ | | British Airways PLC | | 61,724 | |
1,005 | | | | British American Tobacco PLC | | 254,108 | |
24,551 | | | | Brixton PLC | | 217,575 | |
102,840 | | | | BT Group PLC | | 410,662 | |
1,708 | | | | Cadbury Schweppes PLC | | 16,885 | |
1,657 | | | | Carnival PLC | | 82,225 | |
71,335 | | | | Centrica PLC | | 386,723 | |
283,752 | | | | Corus Group PLC | | 435,989 | |
4,149 | | | | Davis Service Group PLC | | 35,521 | |
63,647 | | | | Dixons Group PLC | | 212,414 | |
3,869 | | | | Electrocomponents | | 18,935 | |
11,938 | | | | First Choice Holidays PLC | | 48,467 | |
5,450 | | | | First Group PLC | | 41,407 | |
3,447 | | | | GKN PLC | | 19,752 | |
16,492 | | | | GlaxoSmithKline PLC | | 472,436 | |
39,908 | | | | HBOS PLC | | $ | 700,032 | |
37,222 | | | | HSBC Holdings PLC | | 640,362 | |
5,498 | | | | Intercontinental Hotels Group PLC | | 96,816 | |
29,370 | | | | International Power PLC | | 159,495 | |
27,978 | | | | iSOFT Group PLC | | 60,069 | |
12,931 | | | | Ladbrokes PLC | | 99,602 | |
44,314 | | | | Legal & General Group PLC | | 112,069 | |
17,144 | | | | LogicaCMG PLC | | 55,609 | |
2,149 | | | | Mitchells & Butlers PLC | | 19,177 | |
1,551 | | | | National Express Group PLC | | 25,386 | |
4,901 | | | | Old Mutual PLC | | 17,222 | |
94,547 | | | | Pilkington PLC | | 280,830 | |
2,626 | | | | Reckitt Benckiser PLC | | 95,334 | |
17,654 | | | | Rentokil Initial PLC | | 51,078 | |
42,139 | | | | Rexam PLC | | 416,746 | |
304 | | | | Rio Tinto PLC | | 16,759 | |
158,534 | | | | Royal & Sun Alliance Insurance Group | | 396,565 | |
29,185 | | | | Royal Bank of Scotland Group PLC | | 946,161 | |
11,387 | | | | SABMiller PLC | | 237,753 | |
9,041 | | | | Scottish & Newcastle PLC | | 83,712 | |
76,782 | | | | Signet Group PLC | | 147,892 | |
20,220 | | | | Stagecoach Group PLC | | 40,098 | |
13,366 | | | | Taylor Woodrow PLC | | 93,080 | |
19,966 | | | | Tesco PLC | | 115,859 | |
21,010 | | | | Tomkins PLC | | 129,196 | |
19,556 | | | | Trinity Mirror PLC | | 196,223 | |
32,891 | | | | Unilever PLC | | 346,241 | |
19,469 | | | | United Business Media PLC | | 254,595 | |
166,947 | | | | Vodafone Group PLC | | 393,582 | |
| | | | | | 11,301,931 | |
| | | | United States: 3.8% | | | |
33,600 | | | | iShares MSCI EAFE Index Fund | | 2,285,808 | |
| | | | | | 2,285,808 | |
| | | | Total Common Stock
(Cost $53,214,938) | | 56,004,311 | |
| | | | | | | |
PREFERRED STOCK: 1.5% | | | |
| | | | Germany: 1.5% | | | |
5,977 | | | | RWE AG | | 465,678 | |
7,965 | | | | Volkswagen AG | | 442,976 | |
| | | | | | 908,654 | |
| | | | Total Preferred Stock
(Cost $845,176) | | 908,654 | |
RIGHTS: 0.0% | | | |
| | | | Sweden: 0.0% | | | |
500 | | | | CAPIO AB | | 366 | |
900 | | | | Ssab Svenskt Stal AB | | 311 | |
| | | | | | 677 | |
| | | | Total Rights (Cost $ — ) | | 677 | |
| | | | Total Long-Term Investments
(Cost $54,060,114) | | 56,913,642 | |
| | | | Total Investments In Securities (Cost $54,060,114)* | 95.3 | % | | $ | 56,913,642 | |
| | | | Other Assets and Liabilities-Net | 4.7 | | | 2,829,158 | |
| | | | Net Assets | 100.0 | % | | $ | 59,742,800 | |
| | | | | | | | | | | |
See Accompanying Notes to Financial Statements
138
| | PORTFOLIO OF INVESTMENTS |
ING INDEX PLUS INTERNATIONAL EQUITY FUND | AS OF APRIL 30, 2006 (UNAUDITED) (CONTINUED) |
| Securities may have been fair valued in accordance with procedures approved by the Board of Directors/Trustees (Note 2A). |
@ | Non-income producing security |
# | Securities with purchases pursuant to Rule 144A, under the Securities Act of 1933 and may not be resold subject to that rule except to qualified institutional buyers. These securities have been determined to be liquid under the guidelines established by the Funds’ Board of Directors/Trustees. |
* | Cost for federal income tax purposes is $54,091,169 |
| Net unrealized appreciation consists of: | | |
| Gross Unrealized Appreciation | | $ | 3,098,910 | |
| Gross Unrealized Depreciation | | (276,437 | ) |
| Net Unrealized Appreciation | | $ | 2,822,473 | |
| | | | | | |
Industry | | Percentage of
Net Assets |
Advertising | | 0.2 | % |
Aerospace/Defense | | 0.4 | |
Agriculture | | 0.8 | |
Airlines | | 0.8 | |
Apparel | | 0.1 | |
Auto Manufacturers | | 2.5 | |
Auto Parts & Equipment | | 1.2 | |
Banks | | 18.0 | |
Beverages | | 1.0 | |
Building Materials | | 1.1 | |
Chemicals | | 1.6 | |
Commercial Services | | 0.9 | |
Computers | | 0.7 | |
Cosmetics/Personal Care | | 0.5 | |
Distribution/Wholesale | | 1.0 | |
Diversified Financial Services | | 2.0 | |
Electric | | 3.2 | |
Electrical Components & Equipment | | 1.0 | |
Electronics | | 1.4 | |
Engineering & Construction | | 2.9 | |
Entertainment | | 0.4 | |
Equity Fund | | 3.8 | |
Food | | 3.6 | |
Forest Products & Paper | | 0.2 | |
Gas | | 1.4 | |
Hand/Machine Tools | | 0.7 | |
Healthcare - Products | | 0.2 | |
Healthcare - Services | | 0.1 | |
Holding Companies - Diversified | | 0.8 | |
Home Builders | | 0.5 | |
Home Furnishings | | 0.3 | |
Household Products/Wares | | 0.2 | |
Insurance | | 4.1 | |
Investment Companies | | 0.1 | |
Iron/Steel | | 4.2 | |
Leisure Time | | 1.3 | |
Lodging | | 0.3 | |
Machinery - Construction & Mining | | 0.1 | |
Media | | 1.8 | |
Mining | | 0.2 | |
Miscellaneous Manufacturing | | 0.7 | |
Oil & Gas | | 6.5 | |
Oil & Gas Services | | 0.6 | |
Packaging & Containers | | 1.1 | |
Pharmaceuticals | | 6.4 | |
Real Estate | | 2.0 | % |
Real Estate Investment Trust | | 0.2 | |
Retail | | 2.6 | |
Semiconductors | | 0.5 | |
Software | | 0.5 | |
Telecommunications | | 6.0 | |
Textiles | | 0.3 | |
Toys/Games/Hobbies | | 0.4 | |
Transportation | | 1.8 | |
Water | | 0.1 | |
Other Assets and Liabilities | | | 4.7 | |
Total Net Assets | | | 100.0 | % |
See Accompanying Notes to Financial Statements
139
| | PORTFOLIO OF INVESTMENTS |
ING INTERNATIONAL FUND | | AS OF APRIL 30, 2006 (UNAUDITED) |
Shares | | | | | | Value | |
COMMON STOCK: 96.1% | | | |
| | | | Australia: 3.9% | | | |
156,900 | | | | Aristocrat Leisure Ltd. | | $ | 1,737,239 | |
82,749 | | S | | BHP Billiton Ltd. | | 1,878,122 | |
199,043 | | | | Brambles Industries Ltd. | | 1,689,601 | |
| | | | | | 5,304,962 | |
| | | | Belgium: 2.5% | | | |
41,200 | | | | Fortis | | 1,541,933 | |
38,672 | | | | InBev NV | | 1,948,138 | |
| | | | | | 3,490,071 | |
| | | | Canada: 2.1% | | | |
8,300 | | @ | | Major Drilling Group International | | 188,880 | |
55,400 | | S | | Petro - Canada | | 2,719,200 | |
| | | | | | 2,908,080 | |
| | | | Finland: 2.3% | | | |
141,722 | | S | | Nokia OYJ | | 3,210,008 | |
| | | | | | 3,210,008 | |
| | | | France: 7.2% | | | |
35,500 | | | | Carrefour SA | | 2,056,732 | |
19,200 | | S | | Groupe Danone | | 2,391,130 | |
40,021 | | S | | Sanofi-Synthelabo SA | | 3,768,644 | |
10,478 | | | | Societe Generale | | 1,596,796 | |
| | | | | | 9,813,302 | |
| | | | Germany: 8.8% | | | |
20,007 | | S | | Allianz AG | | 3,337,009 | |
23,460 | | S | | BASF AG | | 2,005,282 | |
16,700 | | S | | Deutsche Bank AG | | 2,036,363 | |
93,771 | | S | | Deutsche Lufthansa AG | | 1,723,006 | |
13,700 | | | | EON AG | | 1,675,035 | |
13,974 | | | | Siemens AG | | 1,323,455 | |
| | | | | | 12,100,150 | |
| | | | Greece: 1.3% | | | |
46,408 | | | | Alpha Bank AE | | 1,752,622 | |
| | | | | | 1,752,622 | |
| | | | Hong Kong: 2.3% | | | |
173,000 | | | | Hutchison Whampoa Ltd. | | 1,696,673 | |
3,234,000 | | | | Solomon Systech International Ltd. | | 1,433,155 | |
| | | | | | 3,129,828 | |
| | | | India: 0.7% | | | |
166,000 | | @,# | | Cipla Ltd./India GDR | | 964,460 | |
| | | | | | 964,460 | |
| | | | Italy: 1.3% | | | |
64,000 | | S | | Banco Popolare di Verona e Novara SCRL | | 1,798,793 | |
| | | | | | 1,798,793 | |
| | | | Israel: 1.3% | | | |
42,300 | | | | Teva Pharmaceuticals Industries Ltd. | | 1,713,573 | |
| | | | | | 1,713,573 | |
| | | | Japan: 22.6% | | | |
33,700 | | | | Aeon Mall Co., Ltd. | | $ | 1,682,255 | |
197,000 | | S | | Amada Co., Ltd. | | 2,145,744 | |
219,000 | | | | Furukawa Electric Co., Ltd. | | 1,738,865 | |
50,600 | | | | Hoya Corp. | | 2,043,222 | |
56,900 | | | | JSR Corp. | | 1,745,159 | |
67,000 | | | | Komatsu Ltd. | | 1,424,407 | |
295 | | | | Mitsubishi Tokyo Financial Group, Inc. | | 4,616,137 | |
11,600 | | | | Nintendo Co., Ltd. | | 1,716,861 | |
7,900 | | | | ORIX Corp. | | 2,367,679 | |
105,225 | | S | | Ricoh Co., Ltd. | | 2,075,992 | |
19,700 | | | | Ryohin Keikaku Co., Ltd. | | 1,757,486 | |
37,200 | | S | | Sankyo Co., Ltd. | | 2,630,643 | |
105,000 | | | | Sekisui House Ltd. | | 1,621,851 | |
407,000 | | | | Taisei Corp. | | 1,802,004 | |
29,600 | | S | | Toyota Motor Corp. | | 1,724,129 | |
| | | | | | 31,092,434 | |
| | | | Malaysia: 1.3% | | | |
251,900 | | | | Genting Bhd | | 1,740,145 | |
| | | | | | 1,740,145 | |
| | | | Mexico: 1.2% | | | |
253,400 | | | | Cemex SA de CV | | 1,708,287 | |
| | | | | | 1,708,287 | |
| | | | Netherlands: 3.5% | | | |
95,600 | | | | ASML Holding NV | | 2,023,706 | |
82,300 | | | | Koninklijke Philips Electronics NV | | 2,832,742 | |
| | | | | | 4,856,448 | |
| | | | Poland: 1.2% | | | |
89,800 | | | | Grupa Lotos SA | | 1,669,566 | |
| | | | | | 1,669,566 | |
| | | | Russia: 0.0% | | | |
66,751 | | | | TNK - BP Holding BRG | | 8,002 | |
| | | | | | 8,002 | |
| | | | South Africa: 1.3% | | | |
113,700 | | | | JD Group Ltd. | | 1,743,435 | |
| | | | | | 1,743,435 | |
| | | | Sweden: 1.2% | | | |
132,500 | | | | Nordea AB | | 1,700,290 | |
| | | | | | 1,700,290 | |
| | | | Switzerland: 7.4% | | | |
24,500 | | | | Lonza Group AG | | 1,733,495 | |
5,690 | | | | Nestle SA | | 1,730,080 | |
87,588 | | S | | Novartis AG | | 5,007,229 | |
14,086 | | | | UBS AG | | 1,648,458 | |
| | | | | | 10,119,262 | |
| | | | Thailand: 2.0% | | | |
332,000 | | | | AU Optronics Corp | | 544,669 | |
521,800 | | | | Bangkok Bank PLC | | 1,650,926 | |
700,000 | | | | Taiwan Cement Corp | | 547,477 | |
| | | | | | 2,743,072 | |
See Accompanying Notes to Financial Statements
140
| | PORTFOLIO OF INVESTMENTS |
ING INTERNATIONAL FUND | | AS OF APRIL 30, 2006 (UNAUDITED) (CONTINUED) |
Shares | | | | | | Value | |
| | | | United Kingdom: 18.4% | | | |
48,000 | | S | | Anglo American PLC | | $ | 2,046,459 | |
69,118 | | S | | AstraZeneca PLC | | 3,808,005 | |
221,400 | | S | | Cadbury Schweppes PLC | | 2,176,719 | |
219,361 | | | | Capita Group PLC | | 1,862,325 | |
138,400 | | | | Diageo PLC | | 2,288,714 | |
72,401 | | | | Imperial Tobacco Group PLC | | 2,254,348 | |
642,100 | | | | Legal & General Group PLC | | 1,615,381 | |
467,100 | | | | Old Mutual PLC | | 1,625,320 | |
107,300 | | | | Smiths Group PLC | | 1,998,913 | |
1,497,449 | | | | Vodafone Group PLC | | 3,537,079 | |
165,397 | | S | | WPP Group PLC | | 2,028,103 | |
| | | | | | 25,241,366 | |
| | | | United States: 2.3% | | | |
31,100 | | | | ENSCO International Inc | | 1,663,850 | |
25,900 | | L | | Newmont Mining Corp. | | 1,511,524 | |
| | | | | | 3,175,374 | |
| | | | Total Common Stock
(Cost $117,964,990) | | 131,983,530 | |
Principal
Amount | | | | | | Value | |
| | | |
SHORT-TERM INVESTMENTS: 6.0% | | | |
| | | | Repurchase Agreement: 5.8% | | | |
$ | 7,959,000 | | S | | Goldman Sachs Repurchase Agreement dated, 04/28/06, 4.760%, due 05/01/06, $7,962,157 to be received upon repurchase (Collateralized by $8,105,000 Federal Home Loan Bank, 5.375%, Market Value plus accrued interest $8,122,870, due 02/23/11) | | $ | 7,959,000 | |
| | | | | | 7,959,000 | |
| | | | Total Repurchase Agreements
(Cost $7,959,000) | | 7,959,000 | |
| | | | Securities Lending Collateralcc: 0.2% | | | |
326,444 | | | | The Bank of New York Cash Reserves Fund | | 326,444 | |
| | | | Total Securities Collateral Lending (Cost $326,444) | | 326,444 | |
| | | | Total Short-Term Investments
(Cost $8,285,444) | | 8,285,444 | |
| | | | Total Investments In Securities (Cost $126,250,434)* | 102.1 | % | | $ | 140,268,974 | |
| | | | Other Assets and Liabilities-Net | (2.1 | ) | | (2,944,373 | ) |
| | | | Net Assets | 100.0 | % | | $ | 137,324,601 | |
| | | | | | | | | | | |
| Securities may have been fair valued in accordance with procedures approved by the Board of Directors/Trustees (Note 2A). |
@ | Non-income producing security |
GDR | Global Depositary Receipt |
# | Securities with purchases pursuant to Rule 144A, under the Securities Act of 1933 and may not be resold subject to that rule except to qualified institutional buyers. These securities have been determined to be liquid under the guidelines established by the Funds’ Board of Directors/Trustees. |
cc | Securities purchased with cash collateral for securities loaned. |
S | Segregated securities for certain derivatives, when-issued or delayed delivery securities and forward exchange currency contracts. |
L | Loaned security, a portion or all of the security is on loan at April 30, 2006. |
* | Cost for federal income tax purposes is $126,570,625 |
| | Net unrealized appreciation consists of: | | |
| | Gross Unrealized Appreciation | | $13,991,409 | |
| | Gross Unrealized Depreciation | | (293,060 | ) |
| | Net Unrealized Appreciation | | $13,698,349 | |
Industry | | Percentage of
Net Assets |
Advertising | | 1.5 | % |
Agriculture | | 1.6 | |
Airlines | | 1.3 | |
Auto Manufacturers | | 1.3 | |
Banks | | 13.4 | |
Beverages | | 3.1 | |
Building Materials | | 1.6 | |
Chemicals | | 4.0 | |
Commercial Services | | 2.6 | |
Diversified Financial Services | | 1.7 | |
Electric | | 1.2 | |
Electrical Components & Equipment | | 1.3 | |
Electronics | | 3.9 | |
Engineering & Construction | | 1.3 | |
Entertainment | | 1.3 | |
Food | | 6.1 | |
Holding Companies-Divers | | 1.2 | |
Home Builders | | 1.2 | |
Insurance | | 4.8 | |
Leisure Time | | 1.9 | |
Lodging | | 1.3 | |
Machinery - Construction & Mining | | 1.0 | |
Machinery - Diversified | | 1.6 | |
Mining | | 4.1 | |
Miscellaneous Manufacturing | | 2.4 | |
Office/Business Equipment | | 1.5 | |
Oil & Gas | | 4.4 | |
Pharmaceuticals | | 11.1 | |
Real Estate | | 1.2 | |
Repurchase Agreement | | 5.8 | |
Retail | | 2.5 | |
Semiconductors | | 2.5 | |
Telecommunications | | 4.9 | |
Toys/Games/Hobbies | | 1.3 | |
Securities Lending Collateral | | 0.2 | |
Other Assets and Liabilities | | (2.1 | ) |
Total Net Assets | | 100.0 | % |
See Accompanying Notes to Financial Statements
141
| | PORTFOLIO OF INVESTMENTS |
ING INTERNATIONAL CAPITAL APPRECIATION FUND | AS OF APRIL 30, 2006 (UNAUDITED) |
Shares | | | | | | Value | |
COMMON STOCK: 92.2% | | | |
| | | | Australia: 2.6% | | | |
55,424 | | | | Computershare Ltd. | | $ | 331,781 | |
13,130 | | | | Woodside Petroleum Ltd. | | 465,705 | |
| | | | | | 797,486 | |
| | | | Austria: 1.0% | | | |
4,859 | | | | Erste Bank der Oesterreichischen Sparkassen AG | | 295,704 | |
| | | | | | 295,704 | |
| | | | Belgium: 1.2% | | | |
7,100 | | | | Interbrew | | 357,299 | |
| | | | | | 357,299 | |
| | | | Brazil: 1.2% | | | |
6,900 | | | | Aracruz Celulose SA ADR | | 380,052 | |
| | | | | | 380,052 | |
| | | | Canada: 2.7% | | | |
6,000 | | | | Manulife Financial Corp. | | 391,740 | |
4,945 | | | | Suncor Energy, Inc. | | 423,984 | |
| | | | | | 815,724 | |
| | | | China: 2.1% | | | |
544,000 | | | | China Petroleum & Chemical Corp. | | 346,262 | |
143,000 | | @ | | Foxconn International Holdings Ltd. | | 307,055 | |
| | | | | | 653,317 | |
| | | | Denmark: 1.6% | | | |
18,400 | | @ | | Vestas Wind Systems A/S | | 499,146 | |
| | | | | | 499,146 | |
| | | | Finland: 0.9% | | | |
16,250 | | | | Nokian Renkaat OYJ | | 278,676 | |
| | | | | | 278,676 | |
| | | | France: 7.6% | | | |
5,700 | | | | Bouygues | | 310,840 | |
3,400 | | # | | Cie Generale D’Optique Essilor International SA | | 339,811 | |
3,850 | | | | Schneider Electric SA | | 435,383 | |
5,500 | | | | Technip SA | | 356,966 | |
3,520 | | | | Total SA ADR | | 485,830 | |
6,600 | | | | Veolia Environnement | | 394,210 | |
| | | | | | 2,323,040 | |
| | | | Germany: 6.0% | | | |
1,800 | | | | Adidas-Salomon AG | | 379,764 | |
2,842 | | | | Allianz AG | | 474,554 | |
3,644 | | | | RWE AG | | 315,419 | |
5,500 | | | | SAP AG ADR | | 300,465 | |
3,900 | | | | Siemens AG | | 370,039 | |
| | | | | | 1,840,241 | |
| | | | Hong Kong: 2.7% | | | |
63,500 | | | | Esprit Holdings Ltd. | | 506,071 | |
172,000 | | | | Shangri-La Asia Ltd. | | 304,816 | |
| | | | | | 810,887 | |
| | | | India: 2.1% | | | |
5,306 | | | | HDFC Bank Ltd. ADR | | $ | 312,099 | |
4,000 | | | | Infosys Technologies Ltd. ADR | | 314,600 | |
| | | | | | 626,699 | |
| | | | Israel: 1.2% | | | |
8,700 | | | | Teva Pharmaceutical Industries Ltd. ADR | | 352,350 | |
| | | | | | 352,350 | |
| | | | Italy: 2.2% | | | |
88,400 | | | | UniCredito Italiano S.p.A. | | 665,407 | |
| | | | | | 665,407 | |
| | | | Japan: 16.8% | | | |
15,700 | | | | Denso Corp. | | 612,912 | |
7,100 | | | | Ibiden Co., Ltd. | | 335,266 | |
1,160 | | | | Keyence Corp. | | 303,228 | |
5,900 | | | | Nidec Corp. | | 452,627 | |
4,700 | | | | Nitto Denko Corp. | | 391,495 | |
2,610 | | | | ORIX Corp. | | 777,815 | |
27,000 | | | | Sharp Corp. | | 472,100 | |
3,100 | | | | SMC Corp. | | 469,016 | |
45 | | | | Sumitomo Mitsui Financial Group, Inc. | | 492,799 | |
9,400 | | | | THK Co., Ltd. | | 305,351 | |
8,600 | | | | Toyota Motor Corp. | | 501,136 | |
| | | | | | 5,113,745 | |
| | | | Luxembourg: 1.1% | | | |
20,752 | | | | SES Global | | 339,053 | |
| | | | | | 339,053 | |
| | | | Mexico: 1.0% | | | |
11,166 | | | | Wal-Mart de Mexico SA de CV ADR | | 317,749 | |
| | | | | | 317,749 | |
| | | | Singapore: 2.3% | | | |
28,000 | | | | DBS Group Holdings Ltd. | | 313,466 | |
40,000 | | | | Keppel Corp., Ltd. | | 387,344 | |
| | | | | | 700,810 | |
| | | | South Korea: 2.1% | | | |
3,700 | | | | Kookmin Bank ADR | | 329,485 | |
907 | | # | | Samsung Electronics Co., Ltd. GDR | | 309,591 | |
| | | | | | 639,076 | |
| | | | Spain: 6.0% | | | |
30,600 | | | | Banco Bilbao Vizcaya Argentaria SA | | 673,445 | |
25,945 | | | | Banco Santander Central Hispano SA | | 399,818 | |
47,800 | | | | Telefonica SA | | 764,328 | |
| | | | | | 1,837,591 | |
| | | | Switzerland: 10.3% | | | |
5,865 | | | | Credit Suisse Group | | 366,833 | |
990 | | | | Nestle SA | | 301,292 | |
1,450 | | | | Nobel Biocare Holding AG | | 355,792 | |
11,700 | | | | Novartis AG | | 669,547 | |
3,040 | | | | Roche Holding AG | | 465,825 | |
2,392 | | @ | | Syngenta AG | | 331,758 | |
See Accompanying Notes to Financial Statements
142
| PORTFOLIO OF INVESTMENTS |
ING INTERNATIONAL CAPITAL APPRECIATION FUND | AS OF APRIL 30, 2006 (UNAUDITED) (CONTINUED) |
Shares | | | | | | Value | |
| | | | Switzerland (continued) | | | |
2,477 | | | | Synthes, Inc. | | $ | 305,712 | |
3,050 | | | | UBS AG | | 357,233 | |
| | | | | | 3,153,992 | |
| | | | Taiwan: 1.0% | | | |
27,700 | | | | Taiwan Semiconductor Manufacturing Co., Ltd. ADR | | 290,296 | |
| | | | | | 290,296 | |
| | | | United Kingdom: 16.5% | | | |
166,822 | | | | ARM Holdings PLC | | 409,718 | |
40,400 | | | | Barclays PLC | | 500,883 | |
21,000 | | | | BHP Billiton PLC | | 431,194 | |
7,106 | | | | BP PLC ADR | | 523,854 | |
62,500 | | | | British Sky Broadcasting PLC | | 595,227 | |
6,513 | | | | Carnival PLC | | 319,696 | |
121,711 | | | | Hays PLC | | 374,113 | |
28,400 | | | | HBOS PLC | | 498,170 | |
24,903 | | | | Prudential PLC | | 290,295 | |
8,200 | | | | Reckitt Benckiser PLC | | 298,620 | |
1,043,720 | | @ | | Rolls-Royce Group PLC | | 1,897 | |
99,200 | | | | Rolls-Royce Group PLC | | 186 | |
41,600 | | | | Smith & Nephew PLC | | 342,888 | |
77,000 | | | | Tesco PLC | | 447,568 | |
| | | | | | 5,034,309 | |
| | | | Total Common Stock (Cost $26,925,721) | | 28,122,649 | |
| | | | Total Investments In Securities (Cost $26,925,721)* | 92.2 | % | | $28,122,649 | |
| | | | Other Assets and Liabilities-Net | 7.8 | | | 2,368,279 | |
| | | | Net Assets | 100.0 | % | | $30,490,928 | |
| | | | | | | | | | |
| Securities may have been fair valued in accordance with procedures approved by the Board of Directors/Trustees (Note 2A). |
@ | Non-income producing security |
ADR | American Depositary Receipt |
GDR | Global Depositary Receipt |
* | Cost for federal income tax purposes is $26,935,104 |
| | Net unrealized appreciation consists of: | | |
| | Gross Unrealized Appreciation | $1,318,717 | |
| | Gross Unrealized Depreciation | (131,172 | ) |
| | Net Unrealized Appreciation | $1,187,545 | |
Industry | | Percentage of
Net Assets |
Apparel | 1.2 | % |
Auto Manufacturers | | 1.6 | |
Auto Parts & Equipment | | 2.9 | |
Banks | | 17.1 | |
Beverages | | 1.2 | |
Chemicals | | 2.4 | |
Commercial Services | | 1.2 | |
Computers | | 1.1 | |
Distribution/Wholesale | | 1.7 | |
Diversified Financial Services | | 2.6 | |
Electric | | 1.0 | |
Electrical Components & Equipment | | 4.6 | |
Electronics | | 2.1 | |
Engineering & Construction | | 1.0 | |
Food | | 2.5 | |
Forest Products & Paper | | 1.2 | |
Hand/Machine Tools | | 4.0 | |
Healthcare - Products | | 4.4 | |
Holding Companies - Diversified | | 1.3 | |
Household Products/Wares | | 1.0 | |
Insurance | | 3.8 | |
Leisure Time | | 1.0 | |
Lodging | | 1.0 | |
Media | | 2.0 | |
Mining | | 1.4 | |
Miscellaneous Manufacturing | | 1.2 | |
Oil & Gas | | 7.4 | |
Oil & Gas Services | | 1.2 | |
Pharmaceuticals | | 4.9 | |
Retail | | 1.0 | |
Semiconductors | | 3.3 | |
Software | | 2.0 | |
Telecommunications | | 4.6 | |
Water | | 1.3 | |
Other Assets and Liabilities, Net | | 7.8 | |
Total Net Assets | | 100.0 | % |
| | | | |
See Accompanying Notes to Financial Statements
143
| | PORTFOLIO OF INVESTMENTS |
ING INTERNATIONAL REAL ESTATE FUND | AS OF APRIL 30, 2006 (UNAUDITED) |
Shares | | | | | | Value | |
COMMON STOCK: 87.4% | | | |
| | | | Australia: 13.7% | | | |
135,900 | | | | DB Rreef Trust | | $ | 151,135 | |
121,000 | | | | GPT Group | | 401,718 | |
81,300 | | | | Investa Property Group | | 133,952 | |
80,000 | | | | Macquarie CountryWide Trust | | 117,205 | |
38,200 | | | | Macquarie Goodman Group | | 149,358 | |
46,900 | | | | Mirvac Group | | 150,716 | |
62,400 | | | | Prime Retail Group | | 314,700 | |
32,800 | | | | Stockland | | 171,370 | |
72,300 | | | | Valad Property Group | | 88,676 | |
78,400 | | | | Westfield Group | | 1,046,561 | |
| | | | | | 2,725,391 | |
| | | | Canada: 4.2% | | | |
6,600 | | @,# | | Calloway Real Estate Investment Trust — Series 144A | | 143,715 | |
2,000 | | | | Calloway Real Estate Investment Trust | | 44,442 | |
17,000 | | | | RioCan Real Estate Investment Trust | | 323,165 | |
14,600 | | | | Summit Real Estate Investment Trust | �� | 325,885 | |
| | | | | | 837,207 | |
| | | | China: 0.4% | | | |
17,000 | | | | Guangzhou R&F Properties Co., Ltd. | | 87,918 | |
| | | | | | 87,918 | |
| | | | Finland: 0.8% | | | |
14,300 | | | | Sponda OYJ | | 153,129 | |
| | | | | | 153,129 | |
| | | | France: 4.9% | | | |
1,900 | | | | Klepierre | | 222,510 | |
2,200 | | | | Nexity | | 153,509 | |
1,500 | | | | Societe de la Tour Eiffel | | 170,044 | |
2,400 | | | | Unibail | | 434,880 | |
| | | | | | 980,943 | |
| | | | Germany: 1.7% | | | |
300 | | | | Deutsche Wohnen AG | | 98,610 | |
2,000 | | | | IVG Immobilien AG | | 69,043 | |
6,400 | | @ | | Patrizia Immobilien AG | | 172,683 | |
| | | | | | 340,336 | |
| | | | Hong Kong: 14.6% | | | |
338,000 | | | | Agile Property Holdings Ltd. | | 261,554 | |
43,800 | | | | Cheung Kong Holdings Ltd. | | 505,125 | |
260,000 | | | | China Overseas Land & Investment Ltd. | | 166,235 | |
50,000 | | | | Great Eagle Holding Co. | | 187,861 | |
104,000 | | | | Hang Lung Properties Ltd. | | 257,013 | |
41,900 | | | | Hongkong Land Holdings Ltd. | | 164,312 | |
91,000 | | | | Hysan Development Co., Ltd. | | 273,418 | |
73,000 | | | | Kerry Properties Ltd. | | 271,806 | |
54,000 | | | | New World Development Ltd. | | 97,083 | |
49,000 | | | | Sun Hung Kai Properties Ltd. | | 560,079 | |
40,000 | | | | Wharf Holdings Ltd. | | 160,555 | |
| | | | | | 2,905,041 | |
| | | | Italy: 0.6% | | | |
101,200 | | | | Beni Stabili S.p.A. | | 117,298 | |
| | | | | | 117,298 | |
| | | | Japan: 21.3% | | | |
19 | | | | Japan Logistics Fund, Inc. | | $ | 184,666 | |
3,700 | | | | Leopalace21 Corp. | | 143,278 | |
66,000 | | | | Mitsubishi Estate Co., Ltd. | | 1,569,589 | |
45,000 | | | | Mitsui Fudosan Co., Ltd. | | 1,094,423 | |
22 | | | | Nippon Building Fund, Inc. | | 264,650 | |
29,000 | | | | Sumitomo Realty & Development Co., Ltd. | | 818,143 | |
9,000 | | | | Tokyu Land Corp. | | 92,949 | |
9 | | | | Tokyu REIT, Inc. | | 93,279 | |
| | | | | | 4,260,977 | |
| | | | Netherlands: 2.7% | | | |
4,400 | | | | Rodamco Europe NV | | 472,769 | |
800 | | | | Vastned Retail NV | | 73,649 | |
| | | | | | 546,418 | |
| | | | Philippines: 0.4% | | | |
308,000 | | | | Ayala Land, Inc. | | 83,763 | |
| | | | | | 83,763 | |
| | | | Singapore: 4.2% | | | |
59,000 | | | | Ascendas Real Estate Investment Trust | | 85,271 | |
68,000 | | | | CapitaCommercial Trust | | 78,203 | |
104,000 | | | | CapitaLand Ltd. | | 344,453 | |
38,000 | | | | City Developments Ltd. | | 262,704 | |
86,000 | | | | Fortune Real Estate Investment Trust | | 74,613 | |
| | | | | | 845,244 | |
| | | | Spain: 1.3% | | | |
3,400 | | | | Inmobiliaria Colonial | | 263,723 | |
| | | | | | 263,723 | |
| | | | Sweden: 1.4% | | | |
29,200 | | | | Castellum AB | | 283,673 | |
| | | | | | 283,673 | |
| | | | Thailand: 0.5% | | | |
173,000 | | | | Central Pattana PLC | | 91,238 | |
| | | | | | 91,238 | |
| | | | United Kingdom: 14.7% | | | |
18,700 | | @ | | Atlas Estates Ltd. | | 112,082 | |
20,700 | | | | British Land Co. PLC | | 484,708 | |
11,400 | | | | Capital & Regional PLC | | 243,046 | |
10,900 | | | | Derwent Valley Holdings PLC | | 312,919 | |
14,900 | | | | Hammerson PLC | | 313,823 | |
27,600 | | | | Land Securities Group PLC | | 998,982 | |
6,700 | | | | Liberty International PLC | | 159,474 | |
1,300 | | | | Mapeley Ltd. | | 87,615 | |
18,900 | | | | Slough Estates PLC | | 226,487 | |
| | | | | | 2,939,136 | |
| | | | Total Common Stock
(Cost $16,853,384) | | 17,461,435 | |
See Accompanying Notes to Financial Statements
144
| | PORTFOLIO OF INVESTMENTS |
ING INTERNATIONAL REAL ESTATE FUND | AS OF APRIL 30, 2006 (UNAUDITED) (CONTINUED) |
Principal
Amount | | | | Value | |
SHORT-TERM INVESTMENTS: 14.2% | | | | | |
| | | | | | | |
| | U.S. Government Agency Obligations: 14.2% | | | | | |
$ 2,829,000 | | Federal Home Loan Bank, | | | | | |
| | 4.400%, due 05/01/06 | | | | $ | 2,828,654 | |
| | Total U.S. Government Agency | | | | | |
| | Obligations (Cost $2,828,654) | | | | 2,828,654 | |
| | Total Short-Term Investments | | | | | |
| | (Cost $2,828,654) | | | | 2,828,654 | |
| | Total Investments In | | | | | |
| | Securities (Cost | | | | | |
| | $19,682,038)* | | 101.6 | % | $ | 20,290,089 | |
| | Other Assets and | | | | | |
| | Liabilities-Net | | (1.6 | ) | (320,211 | ) |
| | Net Assets | | 100.0 | % | $ | 19,969,878 | |
| | Securities may have been fair valued in accordance with procedures approved by the Board of Directors/Trustees (Note 2A). |
@ | | Non-income producing security |
# | | Securities with purchases pursuant to Rule 144A, under the Securities Act of 1933 and may not be resold subject to that rule except to qualified institutional buyers. These securities have been determined to be liquid under the guidelines established by the Funds’ Board of Directors/Trustees. |
* | | Cost for federal income tax purposes is $19,684,060 |
| | | Net unrealized appreciation consists of: | | |
| | | Gross Unrealized Appreciation | $ | 668,118 | |
| | | Gross Unrealized Depreciation | (62,089 | ) |
| | | Net Unrealized Appreciation | $ | 606,029 | |
Industry | | Percentage of
Net Assets |
Federal Home Loan Bank | 14.2 | % |
Holding Companies | | 0.8 | |
Investment Companies | | 0.6 | |
Property Trust | | 13.7 | |
Real Estate Management/Services | | 12.2 | |
Real Estate Operation/Development | | 45.2 | |
REITS - Diversified | | 8.1 | |
REITS - Office Property | | 2.6 | |
REITS - Shopping Centers | | 3.3 | |
REITS - Warehouse/Industrial | | 0.9 | |
Other Assets and Liabilities | | (1.6 | ) |
Total Net Assets | | 100.0 | % |
| | | | |
See Accompanying Notes to Financial Statements
145
| | PORTFOLIO OF INVESTMENTS |
ING INTERNATIONAL SMALLCAP FUND | AS OF APRIL 30, 2006 (UNAUDITED) |
Shares | | | | | | Value | |
COMMON STOCK: 96.2% | | | |
| | | | Australia: 7.1% | | | |
108,418 | | L | | Adelaide Bank Ltd. | | $ | 1,087,558 | |
43,833 | | | | Alesco Corp., Ltd. | | 331,074 | |
42,370 | | | | Ansell Ltd. | | 367,874 | |
57,400 | | @ | | ARC Energy Ltd. | | 67,831 | |
385,983 | | @ | | Austar United Communications Ltd. | | 356,932 | |
193,019 | | L | | Australian Stock Exchange Ltd. | | 4,813,080 | |
184,819 | | L | | Babcock & Brown Ltd. | | 2,567,013 | |
14,791 | | | | Bank of Queensland Ltd. | | 174,187 | |
133,221 | | | | Baycorp Advantage Ltd. | | 326,816 | |
48,939 | | | | Challenger Financial Services Group Ltd. | | 131,981 | |
71,070 | | | | Coates Hire Ltd. | | 332,201 | |
9,490 | | | | Cochlear Ltd. | | 380,314 | |
65,054 | | L | | Consolidated Minerals Ltd. | | 128,986 | |
128,464 | | L | | Corporate Express Australia Ltd. | | 580,531 | |
278,179 | | | | Downer EDI Ltd. | | 1,835,191 | |
248,421 | | | | Galileo Shopping America Trust | | 224,590 | |
25,007 | | | | Jubilee Mines NL | | 152,844 | |
230,482 | | L | | Just Group Ltd. | | 550,664 | |
52,624 | | | | MacArthur Coal Ltd. | | 219,186 | |
180,554 | | @ | | Mayne Pharma Ltd. | | 404,886 | |
285,622 | | | | Metcash Ltd. | | 997,475 | |
81,086 | | @ | | Miller’s Retail Ltd. | | 105,398 | |
164,688 | | | | Minara Resources Ltd. | | 306,298 | |
87,409 | | | | OneSteel Ltd. | | 264,018 | |
841,325 | | L | | Oxiana Ltd. | | 2,194,191 | |
91,084 | | | | Pacific Brands Ltd. | | 156,966 | |
195,610 | | @ | | PMP Ltd. | | 218,196 | |
15,251 | | | | Ramsay Health Care Ltd. | | 122,926 | |
131,233 | | L | | Record Investments Ltd. | | 1,055,692 | |
43,437 | | | | Seek Ltd. | | 130,871 | |
21,296 | | | | Spotless Group Ltd. | | 80,151 | |
368,270 | | @ | | Tap Oil Ltd. | | 602,378 | |
321,347 | | L | | Tattersall’s Ltd. | | 782,129 | |
17,872 | | | | Transpacific Industries Group Ltd. | | 124,743 | |
34,381 | | | | United Group Ltd. | | 344,589 | |
59,913 | | L | | WorleyParsons Ltd. | | 886,565 | |
1,463,835 | | L | | Zinifex Ltd. | | 11,545,142 | |
| | | | | | 34,951,467 | |
| | | | Austria: 0.2% | | | |
6,916 | | | | Andritz AG | | 1,210,456 | |
| | | | | | 1,210,456 | |
| | | | Belgium: 0.5% | | | |
1,593 | | | | Bekaert SA | | 182,703 | |
35,201 | | | | Compagnie Maritime Belge SA | | 1,141,868 | |
9,804 | | | | Euronav NV | | 281,301 | |
32,000 | | @ | | Option NV | | 914,697 | |
3,000 | | | | Oriflame Cosmetics SA | | 113,156 | |
| | | | | | 2,633,725 | |
| | | | Bermuda: 0.1% | | | |
60,019 | | | | Catlin Group Ltd. | | 528,290 | |
| | | | | | 528,290 | |
| | | | Brazil: 0.1% | | | |
14,100 | | | | Cia Brasileira de Petroleo Ipiranga | | 249,266 | |
9,450 | | | | Metalurgica Gerdau SA | | 193,813 | |
| | | | | | 443,079 | |
| | | | Canada: 3.4% | | | |
121,600 | | | | Algoma Steel, Inc. | | $ | 3,459,558 | |
10,500 | | @ | | Compton Petroleum Corp. | | 142,430 | |
8,600 | | | | Crescent Point Energy Trust | | 174,602 | |
10,500 | | | | Focus Energy Trust | | 231,917 | |
93,500 | | | | IPSCO, Inc. | | 9,627,442 | |
5,200 | | | | Laurentian Bank Of Canada | | 151,190 | |
3,200 | | | | Mullen Group Income Fund | | 97,352 | |
14,400 | | | | Northbridge Financial Corp. | | 418,937 | |
7,400 | | @ | | Novatel, Inc. | | 254,708 | |
21,800 | | | | Pengrowth Energy Trust | | 533,010 | |
51,700 | | @,# | | Rona, Inc. | | 1,063,944 | |
3,200 | | | | Rothmans, Inc. | | 59,028 | |
10,000 | | @ | | Trican Well Service Ltd. | | 483,602 | |
10,400 | | | | Vermilion Energy Trust | | 306,557 | |
| | | | | | 17,004,277 | |
| | | | China: 1.2% | | | |
3,002,000 | | L | | Angang New Steel Co., Ltd. | | 2,610,877 | |
218,000 | | | | Anhui Expressway Co. | | 158,754 | |
177,500 | | L | | COSCO Holdings | | 92,181 | |
324,000 | | | | Dongfang Electrical Machinery Co., Ltd. | | 668,575 | |
155,000 | | L | | FU JI Food and Catering Services Holdings Ltd. | | 323,661 | |
308,000 | | | | Harbin Power Equipment | | 279,947 | |
1,134,000 | | | | Jiangxi Copper Co., Ltd. | | 1,192,950 | |
410,000 | | L | | Maanshan Iron & Steel | | 146,759 | |
294,000 | | | | Travelsky Technology LTD | | 348,749 | |
| | | | | | 5,822,453 | |
| | | | Denmark: 2.5% | | | |
1,900 | | | | Amagerbanken A/S | | 145,394 | |
9,400 | | | | Auriga Industries | | 270,256 | |
130 | | | | D/S Norden | | 63,680 | |
53,250 | | L | | D/S Torm A/S | | 2,439,291 | |
5,725 | | | | East Asiatic Co., Ltd. A/S | | 243,643 | |
17,900 | | L | | FLSmidth & Co. A/S | | 812,509 | |
8,600 | | @ | | Genmab A/S | | 304,236 | |
49,200 | | | | GN Store Nord | | 697,796 | |
59,000 | | @ | | Jyske Bank | | 3,579,233 | |
10,150 | | | | NKT Holding A/S | | 650,726 | |
875 | | | | Sjaelso Gruppen | | 382,387 | |
15,560 | | | | Sydbank A/S | | 564,768 | |
18,150 | | @ | | Topdanmark A/S | | 2,368,814 | |
| | | | | | 12,522,733 | |
| | | | Finland: 0.9% | | | |
8,100 | | | | Cargotec Corp. | | 392,966 | |
12,200 | | | | Finnair OYJ | | 186,044 | |
132,200 | | | | M-real OYJ | | 859,131 | |
29,100 | | | | Orion OYJ | | 689,530 | |
95,500 | | | | Raisio Group PLC | | 240,637 | |
3,800 | | | | Ramirent OYJ | | 141,500 | |
52,050 | | | | Rautaruukki OYJ | | 1,821,050 | |
| | | | | | 4,330,858 | |
| | | | France: 3.6% | | | |
12,955 | | @ | | Alten | | 489,400 | |
1,675 | | | | BioMerieux | | 104,364 | |
11,999 | | | | Bourbon SA | | 1,530,220 | |
19,122 | | | | CFF Recycling | | 710,364 | |
28,432 | | | | Etablissements Maurel et Prom | | 689,476 | |
6,560 | | | | Kaufman & Broad SA | | 388,400 | |
See Accompanying Notes to Financial Statements
146
| | PORTFOLIO OF INVESTMENTS |
ING INTERNATIONAL SMALLCAP FUND | AS OF APRIL 30, 2006 (UNAUDITED) (CONTINUED) |
Shares | | | | | | Value | |
| | | | France (continued) | | | |
68,487 | | | | Neopost SA | | $ | 7,736,639 | |
14,134 | | | | Nexans SA | | 1,189,301 | |
29,584 | | | | Nexity | | 2,064,278 | |
36,340 | | @,L | | Oberthur Card Systems SA | | 298,336 | |
5,447 | | | | Pinguely-Haulotte | | 166,107 | |
4,982 | | | | Trigano SA | | 286,281 | |
47,034 | | @,L | | UBISOFT Entertainment | | 2,326,239 | |
| | | | | | 17,979,405 | |
| | | | Germany: 5.4% | | | |
25,652 | | | | AWD Holding AG | | 907,381 | |
32,365 | | | | Balda AG | | 438,530 | |
2,043 | | | | Deutsche Wohnen AG | | 671,535 | |
88,623 | | @ | | Deutz AG | | 812,696 | |
25,025 | | @,L | | EM.TV AG | | 133,972 | |
5,692 | | | | Hochtief AG | | 387,328 | |
11,687 | | | | IWKA AG | | 339,194 | |
9,475 | | | | Leoni AG | | 390,646 | |
10,565 | | | | MPC Muenchmeyer Petersen Capital AG | | 895,779 | |
57,691 | | @ | | MTU Aero Engines Holding AG | | 2,094,596 | |
7,571 | | | | Norddeutsche Affinerie AG | | 215,987 | |
3,428 | | | | Rhoen Klinikum AG | | 159,687 | |
58,866 | | | | Salzgitter AG | | 4,674,321 | |
72,514 | | @ | | SGL Carbon AG | | 1,514,362 | |
31,965 | | @,L | | Singulus Technologies | | 501,941 | |
3,653 | | | | Sixt AG | | 180,502 | |
13,396 | | | | Solarworld AG | | 4,163,415 | |
48,162 | | | | Stada Arzneimittel AG | | 2,319,310 | |
34,486 | | | | Techem AG | | 1,548,801 | |
6,021 | | @ | | Vivacon AG | | 320,555 | |
28,161 | | | | Wincor Nixdorf AG | | 4,032,313 | |
| | | | | | 26,702,851 | |
| | | | Greece: 1.4% | | | |
68,564 | | @ | | Aegek SA | | 122,594 | |
83,180 | | | | Germanos SA | | 1,806,133 | |
134,600 | | L | | Tsakos Energy Navigation Ltd. | | 5,165,948 | |
| | | | | | 7,094,675 | |
| | | | Hong Kong: 4.0% | | | |
373,000 | | L | | ASM Pacific Technology | | 2,172,003 | |
11,040,000 | | | | Cnpc Hong Kong Ltd. | | 6,633,254 | |
1,408,000 | | | | Emperor International Holdings | | 343,899 | |
202,000 | | L | | Jinhui Shipping & Transportation Ltd. | | 384,267 | |
434,000 | | | | Midland Realty Holdings | | 252,375 | |
87,200 | | L | | Orient Overseas International Ltd. | | 328,184 | |
249,000 | | | | Pacific Andes Holdings Ltd. | | 129,252 | |
1,659,000 | | L | | Pacific Basin Shipping Ltd. | | 738,175 | |
262,000 | | | | Prime Success International Group | | 174,021 | |
6,794,000 | | | | Solomon Systech International Ltd. | | 3,023,883 | |
91,000 | | | | Television Broadcasts Ltd. | | 568,629 | |
124,000 | | | | Tianjin Development Hldgs | | 98,301 | |
8,040,000 | | L | | Titan Petrochemicals Group Ltd. | | 631,992 | |
152,000 | | | | Vtech Holdings Ltd. | | 722,395 | |
371,500 | | | | Wing Hang Bank Ltd. | | 3,444,939 | |
| | | | | | 19,645,569 | |
| | | | Ireland: 0.1% | | | |
44,400 | | | | C&C Group PLC | | $ | 343,960 | |
2,100 | | | | FBD Holdings PLC | | 100,495 | |
| | | | | | 444,455 | |
| | | | Italy: 2.2% | | | |
94,300 | | | | Aedes S.p.A | | 724,781 | |
1,837 | | | | Amplifon S.p.A. | | 168,690 | |
82,586 | | | | Astaldi S.p.A. | | 621,245 | |
69,262 | | | | Azimut Holding S.p.A. | | 847,370 | |
220,621 | | | | Banca Finnat Euramerica S.p.A. | | 321,723 | |
10,725 | | | | Banco di Desio e della Brianza S.p.A. | | 94,627 | |
44,618 | | | | Benetton Group S.p.A. | | 677,391 | |
5,410 | | | | Cattolica di Assicurazioni SCRL | | 301,499 | |
187,292 | | | | CIR-Compagnie Industriali Riunite S.p.A. | | 589,655 | |
194,213 | | | | Cremonini S.p.A. | | 575,028 | |
47,548 | | | | Davide Campari-Milano S.p.A. | | 464,157 | |
139,372 | | | | Esprinet S.p.A. | | 3,044,361 | |
37,005 | | @ | | Gemina S.p.A. | | 137,315 | |
62,833 | | | | IMMSI S.p.A. | | 201,049 | |
42,453 | | @ | | Marzotto S.p.A. | | 197,995 | |
57,656 | | | | Milano Assicurazioni S.p.A. | | 444,067 | |
5,018 | | | | Pirelli & C Real Estate S.p.A. | | 367,564 | |
35,248 | | | | Premafin Finanziaria S.p.A. | | 93,629 | |
22,344 | | | | Recordati S.p.A. | | 173,379 | |
41,115 | | | | Sogefi S.p.A. | | 313,538 | |
1,851 | | | | Tod’s S.p.A. | | 145,959 | |
12,765 | | @ | | Valentino Fashion Group S.p.A. | | 413,242 | |
| | | | | | 10,918,264 | |
| | | | Japan: 36.3% | | | |
109,100 | | L | | ABILIT Corp. | | 1,957,885 | |
9,000 | | L | | Aeon Fantasy Co., Ltd. | | 376,381 | |
42,400 | | | | Aichi Corp. | | 466,587 | |
26,000 | | L | | Air Water, Inc. | | 264,821 | |
357,600 | | L | | AOC Holdings, Inc. | | 7,491,088 | |
97,000 | | L | | Asahi Soft Drinks Co., Ltd. | | 1,529,224 | |
10,000 | | | | Asia Securities Printing Co., Ltd. | | 110,622 | |
41,000 | | | | Asics Corp. | | 496,991 | |
253,000 | | | | Atsugi Co., Ltd. | | 452,802 | |
3,400 | | | | Autobacs Seven Co., Ltd. | | 162,187 | |
12,000 | | | | Awa Bank Ltd. | | 75,636 | |
24 | | | | Axell Corp. | | 90,056 | |
14,000 | | | | Bank of Nagoya Ltd. | | 103,466 | |
27,000 | | | | BMB Corp. | | 135,365 | |
231,601 | | L | | Bosch Corp. | | 1,107,742 | |
99,000 | | | | Calsonic Kansei Corp. | | 823,468 | |
24,200 | | | | Canon Finetech, Inc. | | 477,567 | |
14,500 | | L | | Capcom Co., Ltd. | | 149,966 | |
46,100 | | | | Century Leasing System, Inc. | | 733,542 | |
17,300 | | @ | | Chiba Kogyo Bank Ltd. | | 362,213 | |
1,008,000 | | @,L | | Chori Co., Ltd. | | 2,198,198 | |
26,800 | | L | | Chubu Steel Plate Co., Ltd. | | 394,660 | |
25,000 | | | | CKD Corp. | | 438,966 | |
2,300 | | | | Commercial RE Co. | | 72,551 | |
137,000 | | | | COMSYS Holdings Corp. | | 1,827,301 | |
11 | | @ | | Crayfish Co., Ltd. | | 158,216 | |
1,167,000 | | L | | Daiichi Chuo Kisen Kaisha | | 2,529,265 | |
57,000 | | | | Daiichi Jitsugyo Co., Ltd. | | 328,310 | |
8,800 | | | | Daikoku Denki Co., Ltd. | | 343,255 | |
34,000 | | | | Dainippon Screen Manufacturing Co., Ltd. | | 352,851 | |
See Accompanying Notes to Financial Statements
147
| | PORTFOLIO OF INVESTMENTS |
ING INTERNATIONAL SMALLCAP FUND | | AS OF APRIL 30, 2006 (UNAUDITED) (CONTINUED) |
Shares | | | | | | Value | |
| | | | Japan (continued) | | | |
44,000 | | | | Daito Bank Ltd. | | $ | 92,883 | |
6,500 | | | | Daiwabo Information System Co., Ltd. | | 116,283 | |
12,600 | | | | Denyo Co., Ltd. | | 192,768 | |
895,700 | | @,L | | DIA Kensetsu Co., Ltd. | | 2,457,009 | |
8,400 | | L | | Diamond City Co., Ltd. | | 398,714 | |
77,400 | | L | | Diamond Lease Co., Ltd. | | 4,126,705 | |
5,100 | | | | Disco Corp. | | 324,413 | |
1,658 | | L | | eAccess Ltd. | | 1,140,880 | |
7,800 | | | | EDION Corp. | | 187,600 | |
43,300 | | L | | Eizo Nanao Corp. | | 1,470,464 | |
700 | | | | en-japan, Inc. | | 4,177,055 | |
12,000 | | | | Excel Co., Ltd. | | 319,340 | |
6,400 | | | | Exedy Corp. | | 199,667 | |
10,000 | | | | Ezaki Glico Co., Ltd. | | 105,698 | |
541,000 | | | | Fuji Fire & Marine Insurance Co., Ltd. | | 2,453,238 | |
26,400 | | | | Fuji Machine Manufacturing Co., Ltd. | | 494,870 | |
169,000 | | | | Fujikura Ltd. | | 1,942,081 | |
56,000 | | | | Fujitsu Frontech Ltd. | | 549,345 | |
195,000 | | @,L | | Fujitsu General Ltd. | | 667,813 | |
5,200 | | | | Futaba Corp. | | 140,064 | |
620 | | L | | Geo Co., Ltd. | | 1,348,536 | |
233,900 | | | | Glory Ltd. | | 4,703,725 | |
2,820 | | L | | Goldcrest Co., Ltd. | | 139,609 | |
4,000 | | | | Hakudo Co., Ltd. | | 98,151 | |
6,300 | | | | Happinet Corp. | | 189,743 | |
1,824,500 | | @,L | | Haseko Corp. | | 6,890,304 | |
6,000 | | | | Hirano Tecseed Co., Ltd. | | 126,076 | |
81,000 | | | | Hitachi Cable Ltd. | | 439,644 | |
94,000 | | | | Hitachi Kokusai Electric, Inc. | | 1,149,292 | |
119,000 | | | | Hodogaya Chemical Co., Ltd. | | 638,236 | |
72,000 | | | | Hokuriku Electric Industry Co., Ltd. | | 258,091 | |
22 | | | | Hoosiers Corp. | | 89,639 | |
3,400 | | | | HS Securities Co., Ltd. | | 55,620 | |
15,000 | | | | Hyakugo Bank Ltd. | | 100,914 | |
38,300 | | | | IBJ Leasing Co., Ltd. | | 1,033,231 | |
97,400 | | | | Ichiyoshi Securities Co., Ltd. | | 1,777,865 | |
151,300 | | L | | Iino Kaiun Kaisha Ltd. | | 1,438,581 | |
46,000 | | | | Inabata & Co., Ltd. | | 429,569 | |
50 | | | | IXI Co., Ltd. | | 353,443 | |
5,600 | | L | | Izumi Co., Ltd. | | 223,953 | |
339,000 | | | | JFE Shoji Holdings, Inc. | | 1,666,030 | |
69,000 | | | | Jidosha Buhin Kogyo Co., Ltd. | | 365,277 | |
38,000 | | L | | Joshin Denki Co., Ltd. | | 296,903 | |
237,000 | | | | Juki Corp. | | 1,535,712 | |
16,000 | | | | Juroku Bank Ltd. | | 106,715 | |
33,000 | | | | Kandenko Co., Ltd. | | 258,546 | |
39,300 | | | | Kanto Auto Works Ltd. | | 576,670 | |
135,000 | | @ | | Kawai Musical Instruments Manufacturing Co., Ltd. | | 346,243 | |
87,600 | | | | Keihin Corp. | | 2,597,158 | |
20,000 | | | | Keiyo Bank Ltd. | | 129,250 | |
813,000 | | L | | Kenwood Corp. | | 2,001,908 | |
3,700 | | | | Kintetsu World Express, Inc. | | 90,796 | |
50,400 | | | | Kirin Beverage Corp. | | 1,336,402 | |
49,000 | | | | Kitz Corp. | | 452,266 | |
36,000 | | | | Koito Manufacturing Co., Ltd. | | 515,921 | |
23,000 | | | | Komatsu Electronic Metals Co., Ltd. | | 630,830 | |
213,000 | | @,L | | Kumagai Gumi Co., Ltd. | | 868,691 | |
791,000 | | L | | Kyoei Tanker Co., Ltd. | | $ | 2,668,286 | |
36,100 | | | | Mars Engineering Corp. | | 971,751 | |
52,000 | | | | Marusan Securities Co., Ltd. | | 792,582 | |
13,000 | | | | Mie Bank Ltd. | | 76,973 | |
468,000 | | @,L | | Mitsubishi Paper Mills Ltd. | | 984,459 | |
35,000 | | | | Mitsui Home Co., Ltd. | | 263,313 | |
46,000 | | | | Mitsui-Soko Co., Ltd. | | 268,560 | |
17,000 | | | | Mizuno Corp. | | 126,644 | |
44 | | @,L | | Momiji Holdings, Inc. | | 115,474 | |
100,400 | | L | | Mori Seiki Co., Ltd. | | 2,151,516 | |
11,700 | | L | | Moshi Moshi Hotline, Inc. | | 462,909 | |
66,000 | | | | Nabtesco Corp. | | 828,714 | |
4,000 | | | | Nadex Co., Ltd. | | 48,997 | |
8,000 | | | | Nagase & Co., Ltd. | | 115,587 | |
264,000 | | | | Nakayama Steel Works Ltd. | | 1,295,077 | |
11,400 | | | | NEC Leasing Ltd. | | 270,181 | |
247,000 | | | | Nichimo Corp. | | 344,941 | |
15,000 | | | | Nihon Parkerizing Co., Ltd. | | 270,746 | |
14,000 | | | | Nippon Konpo Unyu Soko Co., Ltd. | | 205,698 | |
506,000 | | L | | Nippon Metal Industry Co., Ltd. | | 1,139,945 | |
8,000 | | | | Nippon Signal Co., Ltd. | | 74,619 | |
101,600 | | | | Nippon Suisan Kaisha Ltd. | | 498,294 | |
535,000 | | L | | Nippon Yakin Kogyo Co., Ltd. | | 2,683,059 | |
3,800 | | | | Nishio Rent All Co., Ltd. | | 73,991 | |
1,044,000 | | L | | Nissan Diesel Motor Co., Ltd. | | 5,421,243 | |
42,000 | | | | Nissan Shatai Co., Ltd. | | 309,663 | |
7,000 | | | | Nissha Printing Co., Ltd. | | 282,573 | |
26,000 | | | | Nisshin Oillio Group Ltd. | | 199,914 | |
133,200 | | | | Nissin Kogyo Co., Ltd. | | 2,782,998 | |
11,900 | | | | Nitta Corp. | | 210,350 | |
114 | | | | Okinawa Cellular Telephone Co. | | 275,502 | |
564,000 | | | | Okuma Corp. | | 7,621,015 | |
10,200 | | | | Osaka Steel Co., Ltd. | | 210,021 | |
374,000 | | L | | Pacific Metals Co., Ltd. | | 2,409,739 | |
22,000 | | | | PanaHome Corp. | | 211,852 | |
30,930 | | | | Point, Inc. | | 2,170,747 | |
266,000 | | | | Press Kogyo Co., Ltd. | | 1,460,436 | |
53,000 | | | | Rengo Co., Ltd. | | 416,559 | |
44,800 | | | | Ricoh Leasing Co., Ltd. | | 1,311,952 | |
2,500 | | | | Right On Co., Ltd. | | 106,934 | |
13,000 | | | | Rohto Pharmaceutical Co., Ltd. | | 157,432 | |
43,300 | | | | Ryohin Keikaku Co., Ltd. | | 3,862,673 | |
15,000 | | | | San-Ai Oil Co., Ltd. | | 69,532 | |
79,200 | | | | Santen Pharmaceutical Co., Ltd. | | 1,949,754 | |
24,800 | | L | | Sanyo Electric Credit Co., Ltd. | | 525,789 | |
9,400 | | | | Sanyo Shinpan Finance Co., Ltd. | | 553,288 | |
7,500 | | | | Satori Electric Co., Ltd. | | 157,035 | |
143 | | | | Secured Capital Japan Co., Ltd. | | 498,407 | |
4,100 | | | | Seijo Corp. | | 122,392 | |
14,000 | | | | Shiga Bank Ltd. | | 103,931 | |
24,700 | | | | Shinki Co., Ltd. | | 199,245 | |
80,300 | | | | Shinko Electric Industries | | 2,181,211 | |
150,000 | | | | Shinko Plantech Co., Ltd. | | 1,030,491 | |
20,000 | | | | Shinmaywa Industries Ltd. | | 119,342 | |
496,000 | | L | | Shinwa Kaiun Kaisha Ltd. | | 1,420,606 | |
73,200 | | L | | Skylark Co., Ltd. | | 1,330,471 | |
54,000 | | | | SMBC Friend Securities Co., Ltd. | | 488,495 | |
46,000 | | L | | Sodick Co., Ltd. | | 705,330 | |
229 | | | | Starbucks Coffee Japan Ltd. | | 111,927 | |
13,400 | | | | STB Leasing Co., Ltd. | | 269,003 | |
395,000 | | | | Sumikin Bussan Corp. | | 1,777,159 | |
49,500 | | | | Sumisho Lease Co., Ltd. | | 2,831,565 | |
See Accompanying Notes to Financial Statements
148
| | PORTFOLIO OF INVESTMENTS |
ING INTERNATIONAL SMALLCAP FUND | | AS OF APRIL 30, 2006 (UNAUDITED) (CONTINUED) |
Shares | | | | | | Value | |
| | | | Japan (continued) | | | |
1,700 | | | | Sumitomo Real Estate Sales Co., Ltd. | | $ | 111,857 | |
37,000 | | | | Sumitomo Warehouse Co., Ltd. | | 286,434 | |
33,200 | | L | | Tachi-S Co., Ltd. | | 380,184 | |
109,000 | | | | Taihei Kogyo Co., Ltd. | | 374,229 | |
75,000 | | | | Takagi Securities Co., Ltd. | | 522,950 | |
154 | | | | Take And Give Needs Co., Ltd. | | 233,146 | |
48,000 | | | | Takisawa Machine Tool Co., Ltd. | | 192,610 | |
35,400 | | L | | Tamron Co., Ltd. | | 655,376 | |
87,000 | | | | TBK Co., Ltd. | | 602,903 | |
96,000 | | | | Toa Corp. | | 175,978 | |
130,000 | | | | Toagosei Co., Ltd. | | 551,392 | |
14,300 | | | | Tocalo Co., Ltd. | | 528,746 | |
8,800 | | | | Tokai Rika Co., Ltd. | | 234,887 | |
155,000 | | | | Tokai Tokyo Securities Co., Ltd. | | 1,073,262 | |
2,100 | | | | Token Corp. | | 136,217 | |
41,700 | | | | Tokyo Leasing Co., Ltd. | | 674,703 | |
199,200 | | L | | Tokyo Steel Manufacturing Co., Ltd. | | 4,203,072 | |
65,000 | | L | | Tokyo Tekko Co., Ltd. | | 712,089 | |
2,700 | | | | Tokyu Community Corp. | | 83,170 | |
1,700 | | | | Tokyu Livable, Inc. | | 104,515 | |
3,000 | | | | Tomen Electronics Corp. | | 74,058 | |
47,000 | | | | Tomoe Corp. | | 235,871 | |
409,000 | | | | Tonichi Carlife Group, Inc. | | 1,694,797 | |
26,000 | | | | Toshiba Ceramics Co., Ltd. | | 102,145 | |
462,500 | | @,L | | Towa Real Estate Development Co., Ltd. | | 3,700,691 | |
23,000 | | | | Toyo Securities Co., Ltd. | | 168,653 | |
90,000 | | L | | Toyo Suisan Kaisha Ltd. | | 1,368,441 | |
161 | | | | Traders Securities Co., Ltd. | | 188,305 | |
28,400 | | L | | Trans Cosmos, Inc. | | 798,663 | |
18,000 | | | | Trusco Nakayama Corp. | | 418,184 | |
25,000 | | | | Tsugami Corp. | | 202,819 | |
173 | | | | TV Asahi Corp. | | 451,116 | |
46,300 | | L | | UFJ Central Leasing Co., Ltd. | | 2,849,927 | |
26,800 | | | | United Arrows Ltd. | | 682,723 | |
8,600 | | | | Valor Co., Ltd. | | 174,547 | |
57 | | | | Wowow, Inc. | | 139,789 | |
11,000 | | | | Yamanashi Chuo Bank Ltd. | | 84,825 | |
205,600 | | | | Yamato Kogyo Co., Ltd. | | 4,428,231 | |
162,000 | | | | Yamazen Corp. | | 1,207,865 | |
20,000 | | | | Yokogawa Bridge Corp. | | 136,913 | |
31,000 | | | | Yokohama Rubber Co., Ltd. | | 161,869 | |
25,500 | | | | Yonekyu Corp. | | 298,162 | |
613,000 | | @,L | | Yuasa Trading Co., Ltd. | | 1,433,093 | |
39,000 | | | | Yusen Air & Sea Service Co., Ltd. | | 1,048,592 | |
| | | | | | 179,314,503 | |
| | | | Liechtenstein: 0.1% | | | |
1,170 | | | | Verwalt & Privat-Bank AG | | 269,360 | |
| | | | | | 269,360 | |
| | | | Luxembourg: 0.0% | | | |
1,178 | | | | Orco Property Group | | 150,851 | |
| | | | | | 150,851 | |
| | | | Malaysia: 0.2% | | | |
298,900 | | @ | | Digi.Com BHD | | 923,625 | |
698,600 | | | | Lion Industries Corp. BHD | | 182,965 | |
| | | | | | 1,106,590 | |
| | | | Netherlands: 4.9% | | | |
64,310 | | | | Aalberts Industries NV | | $ | 5,230,956 | |
6,864 | | | | Arcadis NV | | 325,235 | |
18,426 | | | | Boskalis Westminster | | 1,434,438 | |
13,837 | | @,L | | Crucell NV | | 376,947 | |
15,771 | | | | CSM | | 478,486 | |
7,119 | | @ | | Endemol NV | | 124,160 | |
1,400 | | @ | | Exact Holding NV | | 49,746 | |
22,855 | | | | Fugro NV | | 956,781 | |
1,969 | | | | Hunter Douglas NV | | 139,142 | |
6,667 | | | | Imtech NV | | 366,312 | |
38,120 | | | | Koninklijke BAM Groep NV | | 4,085,504 | |
2,584 | | | | Macintosh Retail Group NV | | 269,964 | |
37,931 | | | | Nutreco Holding NV | | 2,243,517 | |
33,400 | | | | OCE NV | | 555,169 | |
1,137 | | | | OPG Groep NV | | 107,560 | |
77,986 | | | | Stork NV | | 4,620,411 | |
22,400 | | | | United Services Group NV | | 1,925,890 | |
19,786 | | | | Univar NV | | 1,099,094 | |
| | | | | | 24,389,312 | |
| | | | Norway: 0.8% | | | |
159,000 | | | | Acta Holding ASA | | 713,209 | |
43,000 | | @ | | Cermaq ASA | | 629,947 | |
10,600 | | | | Leroy Seafood Group ASA | | 211,216 | |
1,575,000 | | @ | | PAN Fish ASA | | 1,596,034 | |
65,000 | | @ | | Tomra Systems ASA | | 642,560 | |
| | | | | | 3,792,966 | |
| | | | Portugal: 0.0% | | | |
10,300 | | @ | | Impresa SGPS | | 65,844 | |
| | | | | | 65,844 | |
| | | | Singapore: 1.9% | | | |
1,882,000 | | @,L | | Chartered Semiconductor Manufacturing Ltd. | | 2,137,626 | |
105,000 | | | | ComfortDelgro Corp., Ltd. | | 107,055 | |
1,248,000 | | L | | Hi-P International Ltd. | | 932,048 | |
114,000 | | | | Jurong Technologies Industrial Corp., Ltd. | | 116,138 | |
407,000 | | | | Labroy Marine Ltd. | | 385,996 | |
196,000 | | | | MFS Technology Ltd. | | 154,099 | |
180,000 | | | | MMI Holding Ltd. | | 77,424 | |
20,000 | | | | MobileOne Ltd. | | 27,191 | |
47,000 | | | | Neptune Orient Lines Ltd. | | 67,751 | |
291,000 | | | | Singapore Exchange Ltd. | | 792,014 | |
257,000 | | L | | Singapore Petroleum Co., Ltd. | | 936,212 | |
1,798,000 | | @ | | STATS ChipPAC Ltd. | | 1,553,269 | |
3,008,000 | | @ | | United Test and Assembly Center Ltd. | | 1,957,205 | |
| | | | | | 9,244,028 | |
| | | | South Korea: 1.7% | | | |
497,740 | | @,L | | Curitel Communications, Inc. | | 813,429 | |
27,450 | | @ | | Dongbu Insurance Co., Ltd. | | 686,666 | |
143,450 | | L | | Dongyang Mechatronics Corp. | | 634,948 | |
18,900 | | | | Halla Engineering & Construction Corp. | | 626,202 | |
17,450 | | | | Hanshin Construction Ltd. | | 342,516 | |
26,960 | | | | Korean Petrochemical Industrial Co. | | 728,880 | |
10,256 | | | | Kyeryong Construction Industrial Co., Ltd. | | 482,257 | |
44,384 | | | | People & Telecommunication | | 458,597 | |
219,842 | | | | S&T Dynamics Co., Ltd. | | 1,698,808 | |
See Accompanying Notes to Financial Statements
149
| | PORTFOLIO OF INVESTMENTS |
ING INTERNATIONAL SMALLCAP FUND | | AS OF APRIL 30, 2006 (UNAUDITED) (CONTINUED) |
Shares | | | | | | Value | |
| | | | South Korea (continued) | | | |
28,830 | | | | SeAH Steel Corp. | | $ | 920,541 | |
35,771 | | | | SFA Engineering Corp. | | 1,191,124 | |
| | | | | | 8,583,968 | |
| | | | Spain: 0.5% | | | |
4,336 | | | | Abengoa SA | | 134,922 | |
10,365 | | @ | | Amper SA | | 125,293 | |
39,361 | | @ | | Avanzit SA | | 137,761 | |
964 | | | | Cementos Portland Valderrivas SA | | 110,487 | |
42,330 | | @,L | | La Seda de Barcelona SA | | 131,685 | |
14,284 | | | | Obrascon Huarte Lain SA | | 324,027 | |
25,354 | | | | Sol Melia SA | | 395,908 | |
93,229 | | | | Tubacex SA | | 621,146 | |
88,700 | | | | Uralita SA | | 492,700 | |
| | | | | | 2,473,929 | |
| | | | Sweden: 1.0% | | | |
24,000 | | | | D Carnegie AB | | 531,900 | |
13,400 | | | | Intrum Justitia AB | | 126,057 | |
33,000 | | | | JM AB | | 2,116,186 | |
90,800 | | @ | | Lindex AB | | 1,339,731 | |
6,000 | | | | Nobia AB | | 188,686 | |
20,000 | | | | Trelleborg AB | | 443,999 | |
| | | | | | 4,746,559 | |
| | | | Switzerland: 2.8% | | | |
9,527 | | @ | | Actelion NV | | 1,072,311 | |
1,339 | | | | AFG Arbonia-Forster Holding | | 465,222 | |
71,427 | | L | | Baloise Holding Ltd. | | 5,436,806 | |
1,295 | | @ | | Barry Callebaut AG | | 484,707 | |
4,540 | | | | Bucher Industries AG | | 441,436 | |
9,597 | | @ | | Charles Voegele Holding AG | | 810,734 | |
80,748 | | L | | Converium Holding AG | | 1,026,656 | |
2,569 | | | | Geberit AG | | 2,989,720 | |
1,271 | | @ | | Georg Fischer AG | | 616,211 | |
390 | | | | Helvetia Patria Holding | | 105,023 | |
80 | | | | Hiestand Holding AG | | 81,367 | |
3,437 | | | | Phonak Holding AG | | 212,517 | |
258 | | | | Rieter Holding AG | | 112,800 | |
| | | | | | 13,855,510 | |
| | | | Taiwan: 0.6% | | | |
17,000 | | | | AV Tech Co. | | 97,604 | |
441,000 | | | | Chunghwa Picture Tubes Ltd. | | 131,529 | |
1,697,440 | | | | Micro-Star International Co., Ltd. | | 951,420 | |
310,000 | | | | ProMOS Technologies, Inc. | | 119,862 | |
289,000 | | | | Quanta Storage, Inc. | | 535,125 | |
50,000 | | | | Syntech Information Co., Ltd. | | 116,266 | |
29,000 | | | | Tung Ho Steel Enterprise Corp. | | 26,000 | |
656,000 | | | | U-Ming Marine Transport Corp. | | 748,058 | |
277,000 | | | | Vanguard International Semiconductor Corp. | | 207,318 | |
| | | | | | 2,933,182 | |
| | | | Turkey: 2.6% | | | |
55,760 | | | | Aksa Akrilik Kimya Sanayii | | 478,047 | |
181,497 | | @ | | Ayen Enerji | | 372,135 | |
125,983 | | @ | | Beko Elektronik | | 254,229 | |
213,824 | | | | Bolu Cimento Sanayii | | 495,116 | |
276,305 | | | | Bossa Ticaret Sanayi Isletme | | 254,645 | |
310,212 | | | | Doktas Dokumculuk Ticaret | | 640,659 | |
28,916 | | @ | | Goodyear Lastikleri TAS | | 368,656 | |
746,616 | | | | Ihlas Holding | | 488,763 | |
75,798 | | | | Mardin Cimento Sanayii | | 548,182 | |
264,065 | | @ | | Park Elektrik Madencilik Sanayi Ve Ticaret AS | | $ | 1,707,430 | |
443,805 | | @ | | Petrol Ofisi | | 2,844,479 | |
172,470 | | @ | | TAT Konserve | | 292,397 | |
180,073 | | @ | | Turcas Petrolculuk AS | | 789,569 | |
61,364 | | | | Turk Ekonomi Bankasi AS | | 1,140,971 | |
60,145 | | @ | | Turk Hava Yollari | | 331,159 | |
274,917 | | | | Turk Sise Ve Cam Fabrikalari | | 1,219,540 | |
126,602 | | @ | | Vestel Elektronik Sanayi | | 458,295 | |
| | | | | | 12,684,272 | |
| | | | United Kingdom: 10.0% | | | |
121,316 | | | | Admiral Group PLC | | 1,462,654 | |
170,706 | | | | Aegis Group PLC | | 423,537 | |
181,267 | | | | Aggreko PLC | | 1,016,935 | |
423,388 | | | | Amlin PLC | | 2,182,169 | |
404,565 | | | | Ashtead Group PLC | | 1,729,784 | |
56,340 | | @ | | Autonomy Corp. PLC | | 457,266 | |
58,552 | | | | AWG PLC | | 1,227,686 | |
95,312 | | | | Bodycote International | | 482,710 | |
301,647 | | | | Brit Insurance Holdings PLC | | 523,975 | |
86,491 | | @ | | Britvic PLC | | 345,863 | |
134,059 | | | | Burren Energy PLC | | 2,428,767 | |
50,497 | | @ | | Charter PLC | | 732,118 | |
67,655 | | | | Cookson Group PLC | | 650,198 | |
240,134 | | | | Countrywide PLC | | 2,315,081 | |
21,962 | | | | Cranswick PLC | | 243,507 | |
8,477 | | @ | | CSR PLC | | 186,545 | |
41,100 | | | | Dairy Crest Group PLC | | 352,961 | |
93,479 | | @ | | Dana Petroleum PLC | | 1,879,926 | |
13,451 | | | | De La Rue PLC | | 133,476 | |
88,334 | | | | De Vere Group PLC | | 1,307,964 | |
216,363 | | | | First Choice Holidays PLC | | 878,411 | |
18,971 | | @ | | Gyrus Group PLC | | 131,822 | |
40,727 | | | | Hiscox PLC | | 170,279 | |
39,907 | | | | Inchcape PLC | | 1,969,639 | |
9,907 | | | | Intermediate Capital Group PLC | | 244,648 | |
43,900 | | | | Intertek Group PLC | | 657,357 | |
77,979 | | | | London Stock Exchange PLC | | 1,753,305 | |
176,367 | | | | Mcbride PLC | | 535,661 | |
442,702 | | | | Michael Page International PLC | | 3,079,855 | |
63,663 | | @ | | MyTravel Group PLC | | 260,351 | |
37,260 | | | | National Express Group PLC | | 603,294 | |
56,010 | | @ | | NETeller PLC | | 795,504 | |
22,041 | | | | Northgate PLC | | 441,438 | |
110,623 | | | | Paragon Group of Companies LLC | | 1,425,265 | |
686,950 | | | | Pendragon PLC | | 7,534,988 | |
12,527 | | | | Rotork PLC | | 175,880 | |
212,974 | | | | SIG PLC | | 3,502,846 | |
385,935 | | | | Sportingbet PLC | | 2,967,322 | |
45,317 | | | | St James’s Place Capital PLC | | 298,412 | |
48,586 | | | | Stanley Leisure PLC | | 626,827 | |
57,039 | | | | TT electronics PLC | | 187,655 | |
26,075 | | | | Ultra Electronics Holdings | | 517,316 | |
16,553 | | | | Wetherspoon (J.D.) PLC | | 117,141 | |
39,072 | | @ | | Wolfson Microelectronics PLC | | 333,768 | |
| | | | | | 49,292,106 | |
| | | | Venezuela: 0.1% | | | |
21,600 | | | | Cia Anonima Nacional Telefonos de Venezuela ADR | | 439,992 | |
| | | | | | 439,992 | |
| | | | Total Common Stock
(Cost $369,398,139) | | 475,575,529 | |
See Accompanying Notes to Financial Statements
150
| | PORTFOLIO OF INVESTMENTS |
ING INTERNATIONAL SMALLCAP FUND | | AS OF APRIL 30, 2006 (UNAUDITED) (CONTINUED) |
Shares | | | | | | Value | |
PREFERRED STOCK: 0.6% | | | |
| | | | Germany: 0.2% | | | |
5,268 | | | | Hugo Boss AG | | $ | 248,909 | |
17,071 | | | | ProSieben SAT.1 Media AG | | 471,357 | |
| | | | | | 720,266 | |
| | | | Italy: 0.4% | | | |
85,868 | | | | Instituto Finanziario Industriale S.p.A. | | 2,028,390 | |
| | | | | | 2,028,390 | |
| | | | Total Preferred Stock
(Cost $2,222,719) | | 2,748,656 | |
RIGHT: 0.0% | | | | | |
| | | | Germany: 0.0% | | | |
25,025 | | @ | | EM.TV AG | | 63 | |
| | | | | | 63 | |
| | | | Spain: 0.0% | | | |
39,361 | | @ | | Avanzit SA | | 11,899 | |
| | | | | | 11,899 | |
| | | | Sweden: 0.0% | | | |
33,000 | | @ | | JM AB SEK4 Rights | | 45,276 | |
| | | | | | 45,276 | |
| | | | Turkey: 0.0% | | | |
746,616 | | @ | | Ihlas Holding | | 5,652 | |
| | | | | | 5,652 | |
| | | | Total Right (Cost $ —) | | 62,890 | |
| | | | Total Long-Term Investments
(Cost $371,620,858) | | 478,387,075 | |
| | | | | | | |
Principal
Amount | | | | | | Value | |
SHORT TERM INVESTMENTS: 21.5% | | | |
| | | | U.S. Government Agency Obligations: 2.2% | | | |
$ | 10,924,000 | | | | Federal Home Loan Bank, | | | |
| | | | 4.400%, due 05/01/06 | | 10,922,665 | |
| | | | Total U.S. Government Agency
Obligations (Cost $10,922,665) | | 10,922,665 | |
| | | | Securities Lending Collateral: 19.3% | | | |
| 95,176,761 | | | | The Bank of New York Institutional | | 95,176,761 | |
| | | | Cash Reserves Fund | | | |
| | | | Total Securities Lending Collateral
(Cost $95,176,761) | | 95,176,761 | |
| | | | Total Short-Term Investments
(Cost $106,099,426) | | 106,099,426 | |
| | | | Total Investments In Securities
(Cost $477,720,284)* | 118.3 | % | $ | 584,486,501 | |
| | | | Other Assets and
Liabilities-Net | (18.3 | ) | (90,435,027 | ) |
| | | | Net Assets | 100.0 | % | $ | 494,051,474 | |
| | | | | | | | | | | |
| | Securities may have been fair valued in accordance with procedures approved by the Board of Directors/Trustees (Note 2A). |
@ | | Non-income producing security |
ADR | | American Depositary Receipt |
# | | Securities with purchases pursuant to Rule 144A, under the Securities Act of 1933 and may not be resold subject to that rule except to qualified institutional buyers. These securities have been determined to be liquid under the guidelines established by the Funds’ Board of Directors/Trustees. |
L | | Loaned security, a portion or all of the security is on loan at April 30, 2006. |
* | | Cost for federal income tax purposes is $478,225,047 |
| | | Net unrealized appreciation consists of: | | |
| | | Gross Unrealized Appreciation | $ | 117,130,365 | |
| | | Gross Unrealized Depreciation | | (10,868,911 | ) |
| | | Net Unrealized Appreciation | $ | 106,261,454 | |
| | | | | | | |
Industry | | Percentage of
Net Assets |
Advertising | | 0.2 | % |
Aerospace/Defense | | 0.4 | |
Airlines | | 0.1 | |
Apparel | | 0.6 | |
Auto Manufacturers | | 1.3 | |
Auto Parts & Equipment | | 3.0 | |
Banks | | 2.5 | |
Beverages | | 0.8 | |
Biotechnology | | 0.1 | |
Building Materials | | 1.9 | |
Chemicals | | 1.0 | |
Commercial Services | | 2.3 | |
Computers | | 1.2 | |
Distribution/Wholesale | | 3.1 | |
Diversified Financial Services | | 7.8 | |
Electric | | 0.4 | |
Electrical Components & Equipment | | 1.2 | |
Electronics | | 1.5 | |
Energy - Alternate Sources | | 0.8 | |
Engineering & Construction | | 3.9 | |
Entertainment | | 1.0 | |
Environmental Control | | 0.2 | |
Federal Home Loan Bank | | 2.2 | |
Food | | 2.4 | |
Forest Products & Paper | | 0.5 | |
Hand/Machine Tools | | 0.6 | |
Healthcare - Products | | 0.1 | |
Healthcare - Services | | 0.1 | |
Holding Companies - Diversified | | 0.7 | |
Home Builders | | 1.6 | |
Home Furnishings | | 1.1 | |
Household Products/Wares | | 0.3 | |
Housewares | | 0.3 | |
Insurance | | 3.7 | |
Internet | | 1.2 | |
Iron/Steel | | 7.8 | |
Leisure Time | | 0.6 | |
Lodging | | 0.3 | |
Machinery - Construction & Mining | | 0.1 | |
Machinery - Diversified | | 3.9 | |
Media | | 0.6 | |
Metal Fabricate/Hardware | | 1.3 | |
Mining | | 3.4 | |
| | | | |
See Accompanying Notes to Financial Statements
151
| | PORTFOLIO OF INVESTMENTS |
ING INTERNATIONAL SMALLCAP FUND | | AS OF APRIL 30, 2006 (UNAUDITED) (CONTINUED) |
Industry | | Percentage of
Net Assets |
Miscellaneous Manufacturing | | 3.4 | % |
Office/Business Equipment | | 1.8 | |
Oil & Gas | | 4.5 | |
Oil & Gas Services | | 0.7 | |
Pharmaceuticals | | 1.4 | |
Real Estate | | 3.0 | |
Retail | | 6.0 | |
Semiconductors | | 3.0 | |
Software | | 0.8 | |
Storage/Warehousing | | 0.1 | |
Telecommunications | | 1.4 | |
Textiles | | 0.1 | |
Transportation | | 4.5 | |
Water | | 0.2 | |
Securities Lending Collateral | | 19.3 | |
Other Assets and Liabilities | | (18.3 | ) |
Total Net Assets | | 100.0 | % |
| | | | |
See Accompanying Notes to Financial Statements
152
| | PORTFOLIO OF INVESTMENTS |
ING INTERNATIONAL VALUE FUND | | AS OF APRIL 30, 2006 (UNAUDITED) |
Shares | | | | | | Value | |
COMMON STOCK: 98.9% | | | |
| | | | Bermuda: 1.3% | | | |
2,321,991 | | L | | Tyco International Ltd. | | $ | 61,184,463 | |
| | | | | | 61,184,463 | |
| | | | Brazil: 4.4% | | | |
7,745,531 | | | | Centrais Eletricas Brasileiras SA ADR | | 109,405,625 | |
3,741,386 | | L | | Contax Participacoes SA ADR | | 4,347,491 | |
2,532,786 | | L | | Tele Norte Leste Participacoes SA ADR | | 46,046,049 | |
1,208,600 | | | | Telecomunicacoes Brasileiras SA ADR | | 44,536,910 | |
111,928 | | L | | Tim Participacoes SA ADR | | 4,303,632 | |
776,726 | | @,L | | Vivo Participacoes SA ADR | | 3,207,878 | |
| | | | | | 211,847,585 | |
| | | | Canada: 1.7% | | | |
12,138,000 | | @ | | Bombardier, Inc. | | 46,578,377 | |
13,614,900 | | @,L | | Nortel Networks Corp. | | 36,215,634 | |
| | | | | | 82,794,011 | |
| | | | France: 8.4% | | | |
7,228,100 | | @,L | | Alcatel SA | | 104,065,343 | |
1,054,190 | | @ | | Carrefour SA | | 60,987,826 | |
1,641,747 | | @ | | Electricite de France | | 95,742,591 | |
3,936,200 | | | | France Telecom SA | | 91,569,382 | |
561,050 | | | | Sanofi-Synthelabo SA | | 52,823,468 | |
| | | | | | 405,188,610 | |
| | | | Germany: 11.0% | | | |
2,268,600 | | | | DaimlerChrysler AG | | 124,700,773 | |
8,485,800 | | @ | | Deutsche Telekom AG | | 153,353,189 | |
411,200 | | | | Hypo Real Estate Holding | | 28,700,553 | |
2,158,500 | | @ | | Infineon Technologies AG | | 26,265,826 | |
326,500 | | | | Muenchener Rueckversicherungs AG | | 46,098,395 | |
359,298 | | L | | Schering AG | | 38,500,509 | |
1,400,117 | | @ | | Volkswagen AG | | 108,423,206 | |
| | | | | | 526,042,451 | |
| | | | Hong Kong: 0.6% | | | |
1,624,636 | | | | Jardine Matheson Holdings Ltd. | | 29,450,089 | |
| | | | | | 29,450,089 | |
| | | | Italy: 5.0% | | | |
10,705,782 | | | | Banca Intesa S.p.A. | | 63,333,035 | |
10,329,085 | | | | Telecom Italia S.p.A. | | 28,890,865 | |
23,951,100 | | | | Telecom Italia S.p.A. - RNC | | 59,807,107 | |
11,513,600 | | | | UniCredito Italiano S.p.A. | | 86,922,009 | |
| | | | | | 238,953,016 | |
| | | | Japan: 17.7% | | | |
4,268,436 | | | | Daiichi Sankyo Co., Ltd. | | 109,455,669 | |
960,000 | | | | Fuji Photo Film Co., Ltd. | | 32,525,597 | |
12,859,700 | | | | Hitachi Ltd. | | 95,248,948 | |
26,140 | | | | Japan Tobacco, Inc. | | 104,550,301 | |
4,545 | | | | Millea Holdings, Inc. | | 90,523,108 | |
6,203 | | | | Mitsubishi Tokyo Financial Group, Inc. | | 96,694,223 | |
4,932,000 | | | | Mitsui Sumitomo Insurance Co., Ltd. | | 66,154,113 | |
13,125 | | | | Nippon Telegraph & Telephone Corp. | | 58,678,714 | |
1,174,000 | | | | Ono Pharmaceutical Co., Ltd. | | $ | 58,140,452 | |
921,800 | | | | Sony Corp. | | 44,940,730 | |
509,000 | | | | TDK Corp. | | 42,419,584 | |
1,153,800 | | | | Yamanouchi Pharmaceutical Co., Ltd. | | 47,965,658 | |
| | | | | | 847,297,097 | |
| | | | Mexico: 1.3% | | | |
2,942,320 | | L | | Telefonos de Mexico SA de CV ADR | | 64,701,617 | |
| | | | | | 64,701,617 | |
| | | | Netherlands: 8.6% | | | |
3,916,088 | | | | Aegon NV | | 70,862,674 | |
1,737,200 | | | | Akzo Nobel NV | | 99,939,252 | |
11,760,841 | | @ | | Koninklijke Ahold NV | | 96,422,834 | |
1,188,700 | | | | Unilever NV | | 85,708,799 | |
2,365,432 | | | | Wolters Kluwer NV | | 61,477,769 | |
| | | | | | 414,411,328 | |
| | | | New Zealand: 1.0% | | | |
13,335,944 | | | | Telecom Corp. of New Zealand Ltd. | | 48,465,580 | |
| | | | | | 48,465,580 | |
| | | | Portugal: 1.8% | | | |
6,709,676 | | | | Portugal Telecom SGPS SA | | 85,051,297 | |
| | | | | | 85,051,297 | |
| | | | Singapore: 3.4% | | | |
3,652,191 | | | | DBS Group Holdings Ltd. | | 41,092,799 | |
6,060,800 | | # | | DBS Group Holdings Ltd. ADR | | 68,210,668 | |
12,232,800 | | | | Oversea-Chinese Banking Corp. | | 52,662,196 | |
| | | | | | 161,965,663 | |
| | | | South Korea: 4.9% | | | |
1,463,610 | | | | Korea Electric Power Corp. | | 65,010,314 | |
2,745,880 | | L | | Korea Electric Power Corp. ADR | | 62,606,064 | |
183,200 | | | | KT Corp. | | 8,241,793 | |
2,192,310 | | | | KT Corp. ADR | | 51,015,054 | |
202,885 | | | | SK Telecom Co., Ltd. | | 47,865,548 | |
| | | | | | 234,738,773 | |
| | | | Spain: 3.4% | | | |
3,107,600 | | | | Banco Santander Central Hispano SA | | 47,896,559 | |
7,078,302 | | | | Telefonica SA | | 113,162,101 | |
| | | | | | 161,058,660 | |
| | | | Switzerland: 5.5% | | | |
511,900 | | | | Nestle SA | | 155,622,888 | |
91,700 | | | | Swisscom AG | | 30,505,226 | |
328,715 | | @ | | Zurich Financial Services AG | | 79,759,007 | |
| | | | | | 265,887,121 | |
| | | | Taiwan: 1.5% | | | |
100,205,000 | | | | United Microelectronics Corp. | | 69,739,640 | |
| | | | | | 69,739,640 | |
| | | | United Kingdom: 16.9% | | | |
2,964,800 | | | | British Sky Broadcasting PLC | | 28,191,394 | |
12,269,781 | | | | BT Group PLC | | 48,995,848 | |
11,619,100 | | | | Compass Group PLC | | 50,185,905 | |
27,091,350 | | | | Corus Group PLC | | 41,410,503 | |
See Accompanying Notes to Financial Statements
153
| | PORTFOLIO OF INVESTMENTS |
ING INTERNATIONAL VALUE FUND | | AS OF APRIL 30, 2006 (UNAUDITED) (CONTINUED) |
Shares | | | | | | Value | |
| | | | United Kingdom (continued) | | | |
3,066,000 | | | | GlaxoSmithKline PLC | | $ | 87,829,700 | |
78,261,262 | | @ | | Invensys PLC | | 33,784,746 | |
33,530,226 | | | | ITV PLC | | 70,024,815 | |
8,159,200 | | | | J Sainsbury PLC | | 49,474,997 | |
11,046,451 | | | | Marks & Spencer Group PLC | | 117,317,891 | |
32,163,031 | | | | Morrison WM Supermarkets | | 109,019,066 | |
34,690,097 | | | | Royal & Sun Alliance Insurance Group | | 86,775,844 | |
8,253,700 | | | | Unilever PLC | | 86,885,982 | |
| | | | | | 809,896,691 | |
| | | | Venezuela: 0.5% | | | |
1,216,822 | | | | Cia Anonima Nacional Telefonos de Venezuela ADR | | 24,786,664 | |
| | | | | | 24,786,664 | |
| | | | Total Common Stock
(Cost $3,551,158,586) | | 4,743,460,356 | |
| | | | | | | |
Principal
Amount | | | | | | Value | |
SHORT-TERM INVESTMENTS: 3.1% | | | |
| | | | U.S Government Agency Obligation: 1.2% | | | |
$ | 58,593,000 | | | | Federal Home Loan Bank, | | | |
| | | | | 4.400%, due 05/01/2006 | | 58,585,838 | |
| | | | Total U.S. Government Agency
Obligation (Cost $58,585,838) | | 58,585,838 | |
| | | | Securities Lending Collateralcc: 1.9% | | | |
| | | | The Bank of New York Institutional
Cash Reserve Fund | | 91,188,226 | |
| | | | Total Securities Lending Collateral
(Cost $91,188,226) | | 91,188,226 | |
| | | | Total Short-Term Investments
(Cost $149,774,064) | | 149,774,064 | |
| | | | Total Investments In Securities
(Cost $3,700,932,650)* | 102.0 | % | $ | 4,893,234,420 | |
| | | | Other Assets and
Liabilities-Net | (2.0 | ) | | (94,448,503 | ) |
| | | | Net Assets | 100.0 | % | $ | 4,798,785,917 | |
| | | | | | | | | | | |
| | Securities may have been fair valued in accordance with procedures approved by the Board of Directors/Trustees (Note 2A). |
@ | | Non-income producing security |
ADR | | American Depositary Receipt |
# | | Securities with purchases pursuant to Rule 144A, under the Securities Act of 1933 and may not be resold subject to that rule except to qualified institutional buyers. These securities have been determined to be liquid under the guidelines established by the Funds’ Board of Directors/Trustees. |
cc | | Securities purchased with cash collateral for securities loaned. |
L | | Loaned security, a portion or all of the security is on loan at April 30, 2006. |
* | | Cost for federal income tax purposes is the same as for financial reporting purposes. |
| | | Net unrealized appreciation consists of: | | |
| | | Gross Unrealized Appreciation | $ | 1,335,499,218 | |
| | | Gross Unrealized Depreciation | | (143,197,448 | ) |
| | | Net Unrealized Appreciation | $ | 1,192,301,770 | |
| | | | | | | | |
Industry | | Percentage of
Net Assets |
Agriculture | | 2.2 | % |
Auto Manufacturers | | 4.9 | |
Banks | | 10.1 | |
Chemicals | | 2.1 | |
Computers | | 0.9 | |
Electric | | 6.9 | |
Electrical Components & Equipment | | 2.0 | |
Federal Home Loan Bank | | 1.2 | |
Food | | 13.4 | |
Food Service | | 1.1 | |
Holding Companies - Diversified | | 0.6 | |
Home Furnishings | | 0.9 | |
Insurance | | 9.2 | |
Iron/Steel | | 0.9 | |
Media | | 3.3 | |
Miscellaneous Manufacturing | | 3.6 | |
Pharmaceuticals | | 8.2 | |
Retail | | 2.5 | |
Semiconductors | | 2.0 | |
Telecommunications | | 24.1 | |
Securities Lending Collateral | | 1.9 | |
Other Assets and Liabilities-Net | | (2.0 | ) |
Total Net Assets | | 100.0 | % |
| | | | |
See Accompanying Notes to Financial Statements
154
| | PORTFOLIO OF INVESTMENTS |
ING INTERNATIONAL VALUE CHOICE FUND | | AS OF APRIL 30, 2006 (UNAUDITED) |
Shares | | | | | | Value | |
COMMON STOCK: 94.8% | | | |
| | | | Australia: 2.1% | | | |
140,456 | | | | Alumina Ltd. | | $ | 769,010 | |
| | | | | | 769,010 | |
| | | | Belgium: 3.0% | | | |
34,150 | | | | Belgacom SA | | 1,115,590 | |
| | | | | | 1,115,590 | |
| | | | Canada: 9.8% | | | |
52,344 | | | | Barrick Gold Corp. | | 1,595,445 | |
40,100 | | @ | | Ivanhoe Mines Ltd./CA | | 390,975 | |
13,900 | | | | Magna International, Inc. | | 1,090,455 | |
6,080 | | | | Suncor Energy, Inc. | | 521,299 | |
| | | | | | 3,598,174 | |
| | | | Cayman Islands: 1.0% | | | |
17,000 | | @ | | Apex Silver Mines Ltd. | | 362,100 | |
| | | | | | 362,100 | |
| | | | Finland: 2.8% | | | |
66,600 | | | | Stora Enso OYJ | | 1,040,409 | |
| | | | | | 1,040,409 | |
| | | | France: 4.0% | | | |
430 | | | | Areva | | 324,989 | |
18,130 | | | | Thales SA | | 777,665 | |
1,300 | | | | Total SA | | 358,205 | |
| | | | | | 1,460,859 | |
| | | | Germany: 2.7% | | | |
61,480 | | @ | | Premiere AG | | 1,004,077 | |
| | | | | | 1,004,077 | |
| | | | Italy: 9.8% | | | |
120,300 | | | | Enel S.p.A. | | 1,039,271 | |
37,480 | | | | ENI-Ente Nazionale Idrocarburi S.p.A. | | 1,145,176 | |
575,540 | | | | Telecom Italia S.p.A. | | 1,437,152 | |
| | | | | | 3,621,599 | |
| | | | Japan: 22.7% | | | |
60 | | | | Central Japan Railway Co. | | 615,523 | |
17,000 | | | | Dai Nippon Printing Co., Ltd. | | 303,659 | |
47,990 | | | | Daiichi Sankyo Co., Ltd. | | 1,230,609 | |
33,800 | | | | Fuji Photo Film Co., Ltd. | | 1,145,172 | |
47,000 | | | | Kirin Brewery Co., Ltd. | | 693,786 | |
4,400 | | @ | | NEC Electronics Corp. | | 161,616 | |
4,300 | | | | Nintendo Co., Ltd. | | 637,408 | |
33,730 | | | | Nippon Telegraph & Telephone Corp. ADR | | 758,588 | |
42,000 | | | | Sekisui House Ltd. | | 648,740 | |
29,000 | | | | Shiseido Co., Ltd. | | 560,174 | |
19,300 | | | | Takefuji Corp. | | 1,248,131 | |
29,000 | | | | Wacoal Corp. | | 390,794 | |
| | | | | | 8,394,200 | |
| | | | Netherlands: 4.2% | | | |
12,186 | | | | Aegon NV | | 220,509 | |
14,732 | | | | Royal Dutch Shell PLC ADR | | 1,052,012 | |
7,750 | | | | TPG NV | | 278,493 | |
| | | | | | 1,551,014 | |
| | | | Papua New Guinea: 1.1% | | | |
164,400 | | @ | | Lihir Gold Ltd. | | $ | 409,825 | |
| | | | | | 409,825 | |
| | | | Portugal: 1.0% | | | |
89,540 | | | | Electricidade de Portugal SA | | 352,006 | |
| | | | | | 352,006 | |
| | | | South Africa: 3.3% | | | |
16,920 | | | | Anglogold Ashanti Ltd. ADR | | 925,186 | |
1,600 | | | | Impala Platinum Holdings Ltd. | | 301,693 | |
| | | | | | 1,226,879 | |
| | | | South Korea: 8.6% | | | |
27,950 | | | | Korea Electric Power Corp. ADR | | 637,260 | |
61,540 | | | | KT Corp. ADR | | 1,432,036 | |
19,500 | | | | Samsung SDI Co., Ltd. | | 1,099,144 | |
| | | | | | 3,168,440 | |
| | | | Switzerland: 0.9% | | | |
9,570 | | | | Xstrata PLC | | 343,628 | |
| | | | | | 343,628 | |
| | | | Taiwan: 4.2% | | | |
75,760 | | | | Chunghwa Telecom Co., Ltd. ADR | | 1,560,656 | |
| | | | | | 1,560,656 | |
| | | | United Kingdom: 13.6% | | | |
13,600 | | | | Anglo American PLC | | 579,830 | |
2,200 | | | | Anglo American PLC ADR | | 47,410 | |
167,810 | | | | J Sainsbury PLC | | 1,017,551 | |
13,640 | | | | Lonmin PLC | | 675,500 | |
190,630 | | | | Misys PLC | | 719,860 | |
145,770 | | | | Northern Foods PLC | | 238,317 | |
54,000 | | | | Tomkins PLC | | 332,061 | |
51,500 | | | | United Utilities PLC | | 628,447 | |
336,900 | | | | Vodafone Group PLC | | 794,250 | |
| | | | | | 5,033,226 | |
| | | | Total Common Stock
(Cost $31,937,341) | | 35,011,692 | |
| | | | Total Investments In Securities
(Cost $31,937,341)* | 94.8 | % | $ | 35,011,692 | |
| | | | Other Assets and
Liabilities-Net | 5.2 | | 1,938,834 | |
| | | | Net Assets | 100.0 | % | $ | 36,950,526 | |
| | Securities may have been fair valued in accordance with procedures approved by the Board of Directors/Trustees (Note 2A). |
@ | | Non-income producing security |
ADR | | American Depositary Receipt |
* | | Cost for federal income tax purposes is $31,948,892 |
| | Net unrealized appreciation consists of: |
| | Gross Unrealized Appreciation | $ | 3,432,913 | |
| | Gross Unrealized Depreciation | (370,113 | ) |
| | Net Unrealized Appreciation | $ | 3,062,800 | |
See Accompanying Notes to Financial Statements
155
| | PORTFOLIO OF INVESTMENTS |
ING INTERNATIONAL VALUE CHOICE FUND | | AS OF APRIL 30, 2006 (UNAUDITED) (CONTINUED) |
Industry | | Percentage of
Net Assets |
Aerospace/Defense | | 2.1 | % |
Apparel | | 1.1 | |
Auto Parts & Equipment | | 3.0 | |
Beverages | | 1.9 | |
Commercial Services | | 0.8 | |
Cosmetics/Personal Care | | 1.5 | |
Diversified Financial Services | | 3.4 | |
Electric | | 5.5 | |
Electronics | | 3.0 | |
Energy - Alternate Sources | | 0.9 | |
Food | | 3.4 | |
Forest Products & Paper | | 2.8 | |
Holding Companies - Diversified | | 0.9 | |
Home Builders | | 1.8 | |
Insurance | | 0.6 | |
Media | | 2.7 | |
Mining | | 17.3 | |
Miscellaneous Manufacturing | | 3.1 | |
Oil & Gas | | 8.3 | |
Pharmaceuticals | | 3.3 | |
Semiconductors | | 0.4 | |
Software | | 2.0 | |
Telecommunications | | 19.2 | |
Toys/Games/Hobbies | | 1.7 | |
Transportation | | 2.4 | |
Water | | 1.7 | |
Other Assets and Liabilities, Net | | 5.2 | |
Total Net Assets | | 100.0 | % |
| | | | |
See Accompanying Notes to Financial Statements
156
| | PORTFOLIO OF INVESTMENTS |
ING PRECIOUS METALS FUND | | AS OF APRIL 30, 2006 (UNAUDITED) |
Shares | | | | | | Value | |
COMMON STOCK: 98.4% | | | |
| | | | Australia: 4.2% | | | |
92,241 | | | | Aquarius Platinum Ltd. | | $ | 1,352,803 | |
31,100 | | | | BHP Billiton Ltd. ADR | | 1,416,916 | |
95,000 | | | | Kingsgate Consolidated Ltd. | | 422,013 | |
4,406,100 | | @ | | Pan Australian Resources Ltd. | | 1,177,032 | |
442,500 | | @ | | Sino Gold Ltd. | | 1,760,091 | |
| | | | | | 6,128,855 | |
| | | | Canada: 69.2% | | | |
207,700 | | | | Agnico-Eagle Mines Ltd. | | 7,655,822 | |
154,100 | | @ | | Alamos Gold, Inc. | | 1,450,854 | |
135,400 | | @ | | Banro Corp. | | 1,601,072 | |
56,700 | | | | Barrick Gold Corp. | | 1,728,216 | |
918,046 | | @ | | Bema Gold Corp. | | 5,191,576 | |
386,600 | | @ | | Cambior, Inc. | | 1,545,641 | |
34,800 | | | | Cameco Corp. | | 1,412,746 | |
95,400 | | @,# | | Centerra Gold, Inc. | | 4,018,455 | |
300,000 | | @ | | Diamonds North Resources Ltd. | | 259,694 | |
1,098,250 | | @ | | Eldorado Gold Corp. | | 5,723,779 | |
650,000 | | @ | | European Goldfields Ltd. | | 2,511,713 | |
126,800 | | @ | | Gammon Lake Resources, Inc. | | 1,948,593 | |
195,300 | | @ | | Glamis Gold Ltd. | | 7,665,525 | |
203,225 | | | | GoldCorp, Inc. | | 7,132,798 | |
610,500 | | @ | | High River Gold Mines Ltd. | | 1,552,742 | |
419,455 | | | | Iamgold Corp. | | 4,002,945 | |
220,000 | | @ | | Ivanhoe Mines Ltd. | | 2,145,000 | |
552,700 | | @ | | Kinross Gold Corp. | | 6,770,575 | |
52,200 | | @ | | Major Drilling Group International | | 1,187,899 | |
137,800 | | @ | | Meridian Gold, Inc. | | 4,475,072 | |
91,400 | | @ | | Minefinders Corp. | | 840,141 | |
227,300 | | @ | | North Atlantic Resources Ltd. | | 851,957 | |
98,440 | | @ | | Novagold Resources, Inc. | | 1,575,040 | |
608,400 | | @ | | Orezone Resources, Inc. | | 1,270,498 | |
152,800 | | @ | | PAN American Silver Corp. | | 3,789,440 | |
4,075,300 | | @ | | Queenstake Resources Ltd. | | 1,709,331 | |
1,487,400 | | @ | | RIO Narcea Gold Mines Ltd. | | 3,092,804 | |
1,098,400 | | @ | | Shore Gold, Inc. | | 6,273,491 | |
162,312 | | @ | | Silver Wheaton Corp. | | 1,819,320 | |
109,000 | | @ | | Silvercorp Metals, Inc. | | 1,875,436 | |
110,779 | | @ | | Viceroy Exploration Ltd. | | 884,809 | |
628,952 | | @ | | Yamana Gold, Inc. | | 6,920,689 | |
| | | | | | 100,883,673 | |
| | | | Cayman Islands: 0.4% | | | |
25,000 | | @ | | Apex Silver Mines Ltd. | | 532,500 | |
| | | | | | 532,500 | |
| | | | Papua New Guinea: 4.0% | | | |
2,339,100 | | @ | | Lihir Gold Ltd. | | 5,831,031 | |
| | | | | | 5,831,031 | |
| | | | Peru: 1.0% | | | |
49,200 | | | | Cia de Minas Buenaventura SA ADR | | 1,434,564 | |
| | | | | | 1,434,564 | |
| | | | South Africa: 5.0% | | | |
24,200 | | | | Anglogold Ashanti Ltd. ADR | | 1,323,256 | |
182,600 | | | | Gold Fields Ltd. ADR | | 4,620,004 | |
82,000 | | @ | | Harmony Gold Mining Co., Ltd. ADR | | 1,377,600 | |
| | | | | | 7,320,860 | |
| | | | United Kingdom: 5.6% | | | |
310,430 | | @ | | Highland Gold Mining Ltd. | | $ | 1,626,673 | |
242,800 | | @ | | Randgold Resources Ltd. ADR | | 5,909,752 | |
2,900 | | | | Rio Tinto PLC ADR | | 645,830 | |
| | | | | | 8,182,255 | |
| | | | United States: 9.0% | | | |
35,400 | | | | Alcoa, Inc. | | 1,195,812 | |
16,400 | | | | Cleveland-Cliffs, Inc. | | 1,403,676 | |
239,900 | | @ | | Coeur d’Alene Mines Corp. | | 1,674,502 | |
72,300 | | | | Freeport-McMoRan Copper & Gold, Inc. | | 4,669,134 | |
239,000 | | @ | | Hecla Mining Co. | | 1,546,330 | |
213,700 | | @ | | Metallica Resources, Inc. | | 741,862 | |
22,200 | | | | Phelps Dodge Corp. | | 1,913,418 | |
| | | | | | 13,144,734 | |
| | | | Total Common Stock
(Cost $90,283,141) | | 143,458,472 | |
| | | | | | | |
Principal
Amount | | | | | | Value | |
| | | |
SHORT-TERM INVESTMENT: 5.7% | | | |
| | | | Repurchase Agreement: 5.7% | | | |
$ | 8,365,000 | | S | | Morgan Stanley Repurchase Agreement dated 04/28/06, 4.750%, due 05/01/06 | | | |
| | | | | $8,368,311 to be received upon repurchase (Collateralized by $8,715,000 Federal Home Loan Mortgage Corporation, 0.000%, Market Value plus accrued interest $8,658,643 due 11/09/09) | | 8,365,000 | |
| | | | Total Short-Term Investments
(Cost $8,365,000) | | 8,365,000 | |
| | | | Total Investments In Securities
(Cost $98,648,141)* | 104.1 | % | $ | 151,823,472 | |
| | | | Other Assets and
Liabilities-Net | (4.1 | ) | (5,991,659 | ) |
| | | | Net Assets | 100.0 | % | $ | 145,831,813 | |
| | Securities may have been fair valued in accordance with procedures approved by the Board of Directors/Trustees (Note 2A). |
@ | | Non-income producing security |
ADR | | American Depositary Receipt |
# | | Securities with purchases pursuant to Rule 144A, under the Securities Act of 1933 and may not be resold subject to that rule except to qualified institutional buyers. These securities have been determined to be liquid under the guidelines established by the Funds’ Board of Directors/Trustees. |
S | | Segregated securities for certain derivatives, when-issued or delayed delivery securities and forward exchange currency contracts. |
* | | Cost for federal income tax purposes is $99,544,834 |
| | Net unrealized appreciation consists of: |
| | Gross Unrealized Appreciation | $ | 53,004,502 | |
| | Gross Unrealized Depreciation | (725,864 | ) |
| | Net Unrealized Appreciation | $ | 52,278,638 | |
See Accompanying Notes to Financial Statements
157
| | PORTFOLIO OF INVESTMENTS |
ING PRECIOUS METALS FUND | | AS OF APRIL 30, 2006 (UNAUDITED) (CONTINUED) |
Industry | | Percentage of
Net Assets |
Diamonds/Precious Stones | | 4.5 | % |
Diversified Minerals | | 2.4 | |
Gold Mining | | 69.8 | |
Metal - Aluminum | | 0.8 | |
Metal - Copper | | 1.3 | |
Metal - Diversified | | 6.2 | |
Metal - Iron | | 1.0 | |
Mining Services | | 0.8 | |
Non-Ferrous Metals | | 1.0 | |
Platinum | | 0.9 | |
Precious Metals | | 4.2 | |
Silver Mining | | 5.5 | |
Repurchase Agreement | | 5.7 | |
Other Assets and Liabilities, Net | | (4.1 | ) |
Net Assets | | 100.0 | % |
| | | | |
See Accompanying Notes to Financial Statements
158
| | PORTFOLIO OF INVESTMENTS |
ING RUSSIA FUND | | AS OF APRIL 30, 2006 (UNAUDITED) |
Shares | | | | | | Value | |
COMMON STOCK: 92.5% | | | |
| | | | Banks: 13.3% | | | |
93,000 | | L | | OTP Bank Rt GDR | | $ | 7,203,734 | |
4,600,000 | | @ | | Promstroibank St Petersburg | | 5,704,000 | |
90,000 | | @ | | Raiffeisen International Bank Holding AG | | 7,832,633 | |
43,000 | | | | Sberbank RF | | 76,540,000 | |
| | | | | | 97,280,367 | |
| | | | Beverages: 1.9% | | | |
123,200 | | @ | | Efes Breweries International NV GDR | | 4,681,600 | |
56,800 | | @,# | | Efes Breweries International NV GDR - Series 144A | | 2,158,400 | |
350,000 | | @ | | SABMiller PLC | | 7,360,573 | |
| | | | | | 14,200,573 | |
| | | | Cosmetics/Personal Care: 1.0% | | | |
170,000 | | | | Kalina | | 7,536,000 | |
| | | | | | 7,536,000 | |
| | | | Electric: 4.8% | | | |
2,842,200 | | @,I | | Konakovskaya Gres | | 2,785,356 | |
42,000,000 | | | | Unified Energy System | | 32,004,000 | |
| | | | | | 34,789,356 | |
| | | | Internet: 1.0% | | | |
777,764 | | @ | | RBC Information Systems | | 7,233,205 | |
| | | | | | 7,233,205 | |
| | | | Investment Companies: 3.9% | | | |
240,219 | | I | | Novy Neft Ltd. | | 11,579,757 | |
142,452 | | I | | Novy Neft II Ltd. | | 9,839,872 | |
3,500,000 | | | | RenShares Utilities Ltd. | | 6,755,000 | |
| | | | | | 28,174,629 | |
| | | | Iron/Steel: 3.0% | | | |
400,000 | | | | Cherepovets MK Severstal | | 5,272,000 | |
370,000 | | L | | Mechel Steel Group OAO ADR | | 10,027,000 | |
3,200,000 | | | | Novolipetsk Ferrous Metal FA | | 6,800,000 | |
| | | | | | 22,099,000 | |
| | | | Metal Fabricate/Hardware: 1.0% | | | |
32,000 | | @ | | Verkhnaya Salda Metallurgical Production Association | | 7,686,400 | |
| | | | | | 7,686,400 | |
| | | | Mining: 5.8% | | | |
217,900 | | @ | | Celtic Resources Holdings PLC | | 1,287,214 | |
260,000 | | | | MMC Norilsk Nickel ADR | | 34,320,000 | |
430,000 | | @ | | Polyus Gold ADR | | 6,880,000 | |
| | | | | | 42,487,214 | |
| | | | Oil & Gas: 43.6% | | | |
1,270,000 | | | | Lukoil ADR | | 115,062,000 | |
300,000 | | | | NovaTek OAO GDR | | 12,750,000 | |
7,500,000 | | | | OAO Gazprom | | 84,975,000 | |
3,276,056 | | @ | | OJSC TNK - BP Holding | | 11,122,210 | |
1,700,000 | | | | Sibneft | | 8,330,000 | |
110,000 | | L | | Surgutneftegaz Preferred ADR | | 14,300,000 | |
520,000 | | | | Surgutneftegaz ADR | | 45,240,000 | |
226,000 | | L | | Tatneft ADR | | 26,961,800 | |
| | | | | | 318,741,010 | |
| | | | Pharmaceuticals: 1.0% | | | |
35,000 | | | | Gedeon Richter Rt GDR | | $ | 7,530,789 | |
| | | | | | 7,530,789 | |
| | | | Pipelines: 2.5% | | | |
8,500 | | | | Transneft | | 18,020,000 | |
| | | | | | 18,020,000 | |
| | | | Telecommunications: 9.7% | | | |
440,000 | | @ | | AFK Sistema GDR | | 10,560,000 | |
7,342,400 | | | | Central Telecommunication Co. | | 4,460,508 | |
375,000 | | | | Mobile Telesystems ADR | | 12,247,500 | |
127,900 | | | | Moscow City Telephone | | 2,494,050 | |
1,200,000 | | | | Rostelecom | | 4,224,000 | |
100,000,000 | | | | Sibirtelecom | | 8,750,000 | |
100,000,000 | | | | Uralsvyazinform | | 4,190,000 | |
300,000 | | @,L | | Vimpel-Communications ADR | | 13,965,000 | |
528,730 | | | | VolgaTelecom | | 1,914,002 | |
1,900,000 | | | | VolgaTelecom Class Preferred | | 7,923,000 | |
| | | | | | 70,728,060 | |
| | | | Total Common Stock
(Cost $386,902,494) | | 676,506,603 | |
| | | | | | | |
PREFERRED STOCK: 1.0% | | | |
| | | | Machinery - Diversified: 0.7% | | | |
40,000,000 | | | | Silovye Mashiny | | 4,760,000 | |
| | | | | | 4,760,000 | |
| | | | Telecommunications: 0.3% | | | |
67,344,114 | | | | Uralsvyazinform | | 2,296,434 | |
| | | | | | 2,296,434 | |
| | | | Total Preferred Stock
(Cost $3,052,206) | | 7,056,434 | |
| | | | | |
WARRANTS: 1.1% | | | | | |
| | | | Equity Fund: 1.1% | | | |
390 | | # | | Baskets - Russian Small Cap Stocks | | 8,136,765 | |
| | | | | | 8,136,765 | |
| | | | Total Warrants (Cost $4,179,000) | | 8,136,765 | |
| | | | Total Long-Term Investments
(Cost $394,133,700) | | 691,699,802 | |
See Accompanying Notes to Financial Statements
159
| | PORTFOLIO OF INVESTMENTS |
ING RUSSIA FUND | | AS OF APRIL 30, 2006 (UNAUDITED) (CONTINUED) |
Principal
Amount | | | | | | Value | |
SHORT-TERM INVESTMENTS: 8.9% | | | |
| | | | Securities Lending CollateralCC: 8.9% | | | |
$ | 65,421,771 | | | | The Bank of New York Insitutional | | | |
| | | | Cash Reserves Fund | | $ | 65,421,771 | |
| | | | Total Short-Term Investments
(Cost $65,421,771) | | 65,421,771 | |
| | | | Total Investments In Securities
(Cost $459,555,471)* | 103.5 | % | $ | 757,121,573 | |
| | | | Other Assets and
Liabilities-Net | (3.5 | ) | (25,698,466 | ) |
| | | | Net Assets | 100.0 | % | $ | 731,423,107 | |
| | | | | | | | | | |
| | Securities may have been fair valued in accordance with procedures approved by the Board of Directors/Trustees (Note 2A). |
@ | | Non-income producing security |
ADR | | American Depositary Receipt |
GDR | | Global Depositary Receipt |
# | | Securities with purchases pursuant to Rule 144A, under the Securities Act of 1933 and may not be resold subject to that rule except to qualified institutional buyers. These securities have been determined to be liquid under the guidelines established by the Funds’ Board of Directors/Trustees. |
cc | | Securities purchased with cash collateral for securities loaned. |
I | | Illiquid security |
L | | Loaned security, a portion or all of the security is on loan at April 30, 2006. |
* | | Cost for federal income tax purposes is $460,148,025 |
| | Net unrealized appreciation consists of: |
| | Gross Unrealized Appreciation | $ | 297,733,687 | |
| | Gross Unrealized Depreciation | (760,139 | ) |
| | Net Unrealized Appreciation | $ | 296,973,548 | |
See Accompanying Notes to Financial Statements
160
| | PORTFOLIO OF INVESTMENTS |
ING EMERGING MARKETS FIXED INCOME FUND | | AS OF APRIL 30, 2006 (UNAUDITED) |
Principal
Amount | | | | | | Value | |
CORPORATE BONDS/NOTES: 15.0% | | | |
| | | | Indonesia: 0.9% | | | |
$ | 100,000 | | #,C | | Excelcomindo Finance Co. BV, 7.125%, due 01/18/13 | | $ | 99,750 | |
| | | | | | 99,750 | |
| | | | Mexico: 2.7% | | | |
250,000 | | | | Pemex Project Funding Master Trust, 8.625%, due 02/01/22 | | 290,125 | |
| | | | | | 290,125 | |
| | | | Philippines: 4.7% | | | |
450,000 | | | | National Power Corp., 9.625%, due 05/15/28 | | 505,627 | |
| | | | | | 505,627 | |
| | | | Russia: 4.4% | | | |
400,000 | | | | Morgan Stanley Bank AG for OAO Gazprom, 9.625%, due 03/01/13 | | 474,000 | |
| | | | | | 474,000 | |
| | | | United States: 2.3% | | | |
252,290 | | #,I | | Citigroup Funding, Inc., 0.000%, due 08/17/10 | | 253,895 | |
| | | | | | 253,895 | |
| | | | Total Corporate Bonds/Notes
(Cost $1,635,193) | | 1,623,397 | |
| | | | | |
OTHER BONDS: 80.7% | | | | | |
| | | | Argentina: 8.0% | | | |
1,050,000 | | + | | Province of Buenos Aires Argentina, 2.000%, due 05/15/35 | | 467,775 | |
200,000 | | | | Argentina Government International Bond, 4.889%, due 08/03/12 | | 167,400 | |
60,000 | | | | Argentina Government International Bond, 8.000%, due 12/15/35 | | 6,135 | |
217,805 | | | | Argentina Government International Bond, 8.280%, due 12/31/33 | | 217,261 | |
| | | | | | 858,571 | |
| | | | Brazil: 12.4% | | | |
250,000 | | | | Brazil Government Bond, 11.000%, due 01/11/12 | | 307,000 | |
400,000 | | C | | Brazil Government Bond, 11.000%, due 08/17/40 | | 515,500 | |
350,000 | | | | Brazil Government Bond, 12.750%, due 01/15/20 | | 518,000 | |
| | | | | | 1,340,500 | |
| | | | Colombia: 2.3% | | | |
150,000 | | | | Colombia Government Intl. Bond, 10.000%, due 01/23/12 | | 177,900 | |
50,000 | | | | Colombia Government Intl. Bond, 11.750%, due 02/25/20 | | 71,375 | |
| | | | | | 249,275 | |
| | | | Costa Rica: 0.6% | | | |
$ | 50,000 | | | | Costa Rica Government International Bond, 9.995%, due 08/01/20 | | $ | 61,950 | |
| | | | | | 61,950 | |
| | | | Dominican Republic: 1.8% | | | |
100,000 | | # | | Dominican Republic International Bond, 8.625%, due 04/20/27 | | 104,500 | |
85,506 | | | | Dominican Republic International Bond, 9.040%, due 01/23/18 | | 94,270 | |
| | | | | | 198,770 | |
| | | | Ecuador: 1.9% | | | |
200,000 | | +,C | | Ecuador Government Bond, 9.000%, due 08/15/30 | | 207,500 | |
| | | | | | 207,500 | |
| | | | El Salvador: 1.9% | | | |
200,000 | | # | | El Salvador Government International Bond, 7.650%, due 06/15/35 | | 201,000 | |
| | | | | | 201,000 | |
| | | | Indonesia: 2.9% | | | |
200,000 | | | | Indonesia Government International Bond, 7.250%, due 04/20/15 | | 205,510 | |
100,000 | | | | Indonesia Government International Bond, 8.500%, due 10/12/35 | | 110,273 | |
| | | | | | 315,783 | |
| | | | Ivory Coast: 1.0% | | | |
400,000 | | | | Ivory Coast Government International Bond, 2.000%, due 03/30/18 | | 103,000 | |
| | | | | | 103,000 | |
| | | | Mexico: 2.8% | | | |
200,000 | | | | Mexico Government International Bond, 11.500%, due 05/15/26 | | 306,000 | |
| | | | | | 306,000 | |
| | | | Nigeria: 1.2% | | | |
500,000 | | | | Central Bank of Nigeria, 5.092%, due 01/05/10 | | 130,625 | |
| | | | | | 130,625 | |
| | | | Panama: 1.1% | | | |
120,000 | | | | Panama Government International Bond, 7.125%, due 01/29/26 | | 121,800 | |
| | | | | | 121,800 | |
| | | | Peru: 3.3% | | | |
120,000 | | | | Peru Government Bond, 7.350%, due 07/21/25 | | 119,280 | |
200,000 | | | | Peru Government Bond, 9.875%, due 02/06/15 | | 238,500 | |
| | | | | | 357,780 | |
See Accompanying Notes to Financial Statements
161
| | PORTFOLIO OF INVESTMENTS |
ING EMERGING MARKETS FIXED INCOME FUND | | AS OF APRIL 30, 2006 (UNAUDITED) (CONTINUED) |
Principal
Amount | | | | | | Value | |
| | | | Philippines: 4.5% | | | |
$ | 370,000 | | | | Philippine Government International Bond, 10.625%, due 03/16/25 | | $ | 480,075 | |
| | | | | | 480,075 | |
| | | | Russia: 8.1% | | | |
400,000 | | + | | Russia Government Bond, 5.000%, due 03/31/30 | | 434,330 | |
250,000 | | | | Russia Government International Bond, 12.750%, due 06/24/28 | | 437,407 | |
| | | | | | 871,737 | |
| | | | Turkey: 7.4% | | | |
530,000 | | | | Turkey Government Bond, 8.000%, due 02/14/34 | | 569,750 | |
200,000 | | | | Turkey Government International Bond, 9.000%, due 06/30/11 | | 224,000 | |
| | | | | | 793,750 | |
| | | | Ukraine: 5.9% | | | |
460,000 | | | | Ukraine Government Bond, 7.650%, due 06/11/13 | | 480,516 | |
150,000 | | | | Credit Suisse First Boston International for City of Kiev Ukraine, 8.000%, due 11/06/15 | | 151,935 | |
| | | | | | 632,451 | |
| | | | Uruguay: 2.8% | | | |
100,000 | | | | Oriental Republic of Uruguay, 7.625%, due 03/21/36 | | 99,000 | |
180,000 | | | | Uruguay Government International Bond, 9.250%, due 05/17/17 | | 207,225 | |
| | | | | | 306,225 | |
| | | | Venezuela: 9.8% | | | |
400,000 | | | | Republic of Venezuela, 8.500%, due 10/08/14 | | 449,000 | |
480,000 | | | | Venezuela Government Bond, 9.250%, due 09/15/27 | | 605,040 | |
| | | | | | 1,054,040 | |
| | | | Vietnam: 1.0% | | | |
100,000 | | | | Socialist Republic of Vietnam, 6.875%, due 01/15/16 | | 103,147 | |
| | | | | | 103,147 | |
| | | | Total Other Bonds
(Cost $8,676,440) | | 8,693,979 | |
| | | | Total Long-Term Investments
(Cost $10,311,633) | | 10,317,376 | |
| | | | Total Investments In Securities
(Cost $10,311,633)* | 95.7 | % | $ | 10,317,376 | |
| | | | Other Assets and
Liabilities-Net | 4.3 | | 460,093 | |
| | | | Net Assets | 100.0 | % | $ | 10,777,469 | |
| | | | | | | | | | |
| | Securities may have been fair valued in accordance with procedures approved by the Board of Directors/Trustees (Note 2A). |
+ | | Step-up basis bonds. Interest rates shown reflect current coupon rates. |
# | | Securities with purchases pursuant to Rule 144A, under the Securities Act of 1933 and may not be resold subject to that rule except to qualified institutional buyers. These securities have been determined to be liquid under the guidelines established by the Funds’ Board of Directors/Trustees. |
C | | Bond may be called prior to maturity date. |
I | | Illiquid security |
* | | Cost for federal income tax purposes is the same as for financial statement purposes. |
| | Net unrealized appreciation consists of: |
| | Gross Unrealized Appreciation | $ | 181,130 | |
| | Gross Unrealized Depreciation | (175,387 | ) |
| | Net Unrealized Appreciation | $ | 5,743 | |
Information concerning open futures contracts at April 30, 2006 is shown below:
Short Contracts | | No. of
Contracts | | Notional
Market Value | | Expiration
Date | | Unrealized
Gain/(Loss) | |
US 10-year Treasury Note | | 18 | | $(1,900,406 | ) | 06/21/2006 | | $35,695 | |
| | | | $(1,900,406 | ) | | | $35,695 | |
Industry | | Percentage of
Net Assets |
Diversified Financial Services | | 2.3 | % |
Electric | | 4.7 | |
Foreign Government Bonds | | 74.4 | |
Municipal | | 1.4 | |
Oil & Gas | | 7.1 | |
Regional (state/province) | | 4.3 | |
Telecommunications | | 0.9 | |
Other Assets and Liabilities | | 4.9 | |
Net Assets | | 100.0 | % |
| | | | |
See Accompanying Notes to Financial Statements
162
| | PORTFOLIO OF INVESTMENTS |
ING DIVERSIFIED INTERNATIONAL FUND | | AS OF APRIL 30, 2006 (UNAUDITED) |
Shares | | | | | | Value | |
INVESTMENT COMPANIES: 100.0% | | | |
470,968 | | | | ING Emerging Countries Fund- Class I | | $ | 14,067,797 | |
1,279,444 | | | | ING Foreign Fund - Class I | | 23,720,891 | |
3,723,501 | | | | ING Index Plus International Equity Fund - Class I | | 41,777,680 | |
2,274,122 | | | | ING International Capital Appreciation Fund - Class I | | 24,901,644 | |
371,409 | | | | ING International SmallCap Fund - Class I | | 18,080,201 | |
1,348,618 | | | | ING International Value Choice Fund - Class I | | 16,695,897 | |
| | | | | | 139,244,110 | |
| | | | Total Investments In Securities
(Cost $131,497,845) | 100.0 | % | $ | 139,244,110 | |
| | | | Other Assets and
Liabilities-Net | 0.0 | | 36,295 | |
| | | | Net Assets | 100.0 | % | $ | 139,280,405 | |
* | | Cost for federal income tax purposes is $131,501,955 | | | |
| | Net unrealized appreciation consists of: | | | |
| | Gross Unrealized Appreciation | | $ | 7,742,155 | |
| | Gross Unrealized Depreciation | | — | |
| | Net Unrealized Appreciation | | $ | 7,742,155 | |
See Accompanying Notes to Financial Statements
163
ADVISORY CONTRACT APPROVAL DISCUSSION (UNAUDITED)
Section 15 of the Investment Company Act of 1940 mandates that, when a Fund enters into new advisory or sub-advisory arrangements, the Board of Trustees (the “Board”) of ING Mutual Funds (“IMF”), including a majority of the Trustees who have no direct or indirect interest in the Investment Management and Sub-Advisory Agreements governing those arrangements, and who are not “interested persons” of the Funds, as such term is defined under the Investment Company Act of 1940 (the “IMF Non-Interested Trustees”), must approve those Investment Management and Sub-Advisory Agreements. Therefore, in order for a new series of IMF to be launched, the Board must approve an Investment Management Agreement and, if applicable, Sub-Advisory Agreement for that series prior to the commencement of its operations.
At a meeting held on November 10, 2005, the Board considered the approval of new Investment Management Agreements and, in certain cases, Sub-Advisory Agreements, for the following Funds, each of which are series of IMF that recently commenced operations: ING Greater China Fund (“Greater China”); ING Index Plus International Equity Fund (“Index Plus International Equity”); ING International Capital Appreciation Fund (“International Capital Appreciation”); ING Emerging Markets Fixed Income Fund (“Emerging Markets Fixed Income”); and ING Diversified International Fund (“Diversified International”). At a meeting of the Board held on January 19, 2006, the Board approved Investment Management and Sub-Advisory Agreements for ING International Real Estate Fund, also a new Series of IMF (“International Real Estate”).
At the Board’s November 10, 2005 meeting or its January 19, 2006 meeting, as relevant, the Board voted to approve the Investment Management and Sub-Advisory Agreements for each of the Funds listed above for initial terms that end on November 30, 2007. In reaching these decisions, the Board took into account information furnished throughout the year at regular Board meetings with respect to ING Investments, LLC (“ING Investments”), the investment adviser to the Funds listed above, and affiliated Sub-Advisers, as well as information prepared specifically in connection with their deliberations with respect to the approval of the advisory and sub-advisory arrangements for these Funds. The Board’s determination took into account a number of factors that its members believed, in light of the legal advice furnished to them by Kirkpatrick & Lockhart Nicholson Graham LLP (“K&LNG”), their independent legal counsel, and their own business judgment, to be relevant. Further, while the Investment Management Agreements and, as applicable, Sub-Advisory Agreements for each Fund were considered at the same Board meeting, the Trustees considered each Fund’s advisory and sub-advisory relationships separately.
Provided below is a discussion of certain factors the Board considered at the November 10, 2005 and January 19, 2006 meetings in considering the new advisory and sub-advisory arrangements for the new Funds. While the Board gave its attention to the information furnished, at its request, that was most relevant to its consideration, discussed below are a number of the primary factors relevant to the Board’s consideration as to whether to approve the Investment Managements and Sub-Advisory Agreements for the Funds’ initial terms ending November 30, 2007. Each Trustee may have accorded different weight to the various factors in reaching his or her conclusions with respect to the Funds’ advisory and sub-advisory arrangements.
Overview of the Contract Approval Process
In 2003, the Board determined to undertake steps to further enhance the process under which the Board determines whether to approve new advisory and sub-advisory arrangements. Among the measures the Board implemented was to retain the services of an independent consultant with experience in the mutual fund industry to assist the IMF Non-Interested Trustees in working with the personnel employed by ING Investments, the Funds’ investment adviser, or its affiliates who administer the Funds (“Management”) to identify the types of information presented to the Trustees when considering advisory and sub-advisory relationships and to establish the format in which the information requested by the Board in this context is provided to the Board. The end result was the implementation of the current process relied upon by the Board to analyze information in connection with its review and approval of new advisory and sub-advisory relationships.
Since this process was implemented, the Board has continuously reviewed and refined the process. In addition, the Board established a Contracts Committee and two Investment Review Committees, including the International Equity and Fixed Income Funds Investment Review Committee (the “IE & FI IRC”). The type and format of the information provided to the Board or its counsel to inform deliberations with respect to Investment Management and Sub-Advisory Agreements has been codified in the Funds’ 15(c) Methodology Guide (the “Methodology
164
ADVISORY CONTRACT APPROVAL DISCUSSION (UNAUDITED) (CONTINUED)
Guide”). The Methodology Guide was developed under the direction of the Board, and sets out a written blueprint under which the Board requests certain information necessary to facilitate a thorough and informed review in connection with deliberations regarding advisory and sub-advisory relationships. Management provides certain Fund-specific information to the Board based on the Methodology Guide through “Fund Analysis and Comparison Tables” or “FACT” sheets prior to the Board’s review of new Investment Management and Sub-Advisory Agreements.
On its own and as part of a regular on-going process, the Board’s Contracts Committee recommends or considers recommendations from Management for refinements and other changes to the Methodology Guide. The Investment Review Committees, including the IE & FI IRC, also meet regularly with ING Investments.
The Board employed its process for reviewing contracts when considering whether to approve Investment Management and Sub-Advisory Agreements for the new Funds.
Nature, Extent and Quality of Service
In determining whether to approve the Investment Management and Sub-Advisory Agreements for the Funds for their initial terms ending November 30, 2007, the Board received and evaluated such information as it deemed necessary regarding the nature, extent and quality of services to be provided to the Funds by ING Investments and the proposed Sub-Advisers. This included information about ING Investments and affiliated Sub-Advisers provided throughout the year at regular Board meetings in the context of their services to other Funds in the ING Funds complex, as well as information furnished for the November 10, 2005 and January 19, 2006 Board meetings.
The materials requested by and provided to the Board and/or its legal counsel prior to the November 10, 2005 and January 19, 2006 Board meetings included the following items: (1) FACT sheets for each Fund that provide information about the proposed expenses of the Fund and other, similarly managed funds in a selected peer group (“Selected Peer Group”), as well as information about the Fund’s proposed objectives and strategies; (2) responses to a detailed series of questions from K&LNG, legal counsel to the IMF Non-Interested Trustees; (3) copies of each form of proposed Investment Management Agreement and Sub-Advisory Agreement; (4) drafts of narrative summaries addressing key factors the Board could consider in determining whether to approve the new Investment Management and Sub-Advisory Agreements; and (5) other information relevant to the Board’s evaluations.
In arriving at its conclusions with respect to the advisory arrangements with ING Investments, the Board was mindful of the “manager-of-managers” platform of the ING Funds. The Board considered the techniques that ING Investments developed, in response to the direction of the Board, to screen and perform due diligence on Sub-Advisers that are recommended to the Board to manage the Funds in the ING Funds complex.
The Board reviewed the level of staffing, quality and experience of each Fund’s proposed portfolio management team. The Board took into account the respective resources and reputations of ING Investments and the proposed Sub-Advisers to the Funds, and evaluated the ability of ING Investments and the Sub-Advisers to attract and retain qualified investment advisory personnel.
Based on their deliberations and the materials presented to them, the Board concluded that the advisory and related services to be provided by ING Investments and the proposed Sub-Advisers would be appropriate in light of the Funds’ anticipated operations, the competitive landscape of the investment company business, and investor needs, and that the nature and quality of the overall services provided by ING Investments and Sub-Advisers would be appropriate.
Economies of Scale
In considering the reasonableness of the proposed advisory fees, the Board considered whether economies of scale will be realized by ING Investments as a Fund grows larger and the extent to which this is reflected in the level of management fee rates to be charged. In this regard, the Board noted any breakpoints in advisory fee schedules that may result in a lower advisory fee in the future when a Fund achieves sufficient asset levels to receive a breakpoint discount. In the case of sub-advisory fees, the Board considered that any breakpoints would inure to the benefit of ING Investments, except to the extent that these savings are passed through in the form of breakpoints on advisory fees that would result in savings to the Funds.
165
ADVISORY CONTRACT APPROVAL DISCUSSION (UNAUDITED) (CONTINUED)
Fee Rates and Profitability
The Board reviewed and considered each proposed contractual investment advisory fee rate, combined with the administrative fee rate, payable by each Fund to ING Investments. The Board also considered the proposed contractual sub-advisory fee rates payable by ING Investments to each Sub-Adviser for sub-advisory services.
The Board considered the fee structures of the Funds as they relate to the services to be provided under the Agreements, and the potential fall-out benefits to ING Investments and the Funds’ Sub-Advisers, and their respective affiliates, from their association with the Funds. For each Fund, the Board determined that the fees payable to ING Investments and Sub-Advisers are reasonable for the services, which were considered in light of the nature and quality of the services that each is expected to perform through the initial term ending November 30, 2007.
The Board also considered information that it requested and was provided by Management with respect to the profitability of service providers affiliated with ING Investments. In the case of Hansberger Global Investors, Inc., a non-affiliated Sub-Adviser for International Capital Appreciation, the Board gave less weight to profitability considerations, or did not view this data as imperative to its deliberations, given the arms-length nature of the relationship between ING Investments and an unaffiliated Sub-Adviser with respect to the negotiation of sub-advisory fees.
The Board determined that it had requested and received sufficient information to gain a reasonable understanding regarding ING Investments’ and affiliated Sub-Advisers’ profitability. The Board also recognized that profitability analysis is not an exact science and there is no uniform methodology for determining profitability for this purpose. In this context, the Board realized that Management’s calculations regarding its costs incurred in establishing the infrastructure necessary for the Funds’ operations may not be fully reflected in the expenses allocated to each Fund in determining profitability, and that the information presented may not portray all of the costs borne by Management nor capture Management’s entrepreneurial risk associated with offering and managing a mutual fund complex in today’s regulatory environment.
Based on the information on revenues, costs, and ING Investments’ profitability considered by the Board, after considering the factors described in this section the Board concluded that the profits, if any, to be realized by ING Investments would not be excessive.
Fund-by-Fund Analysis
The following paragraphs outline certain of the specific factors that the Board considered, and the conclusions reached, at its November 2005 and January 2006 meetings in relation to approving the Investment Management and Sub-Advisory Agreements for the Funds’ initial terms ending November 30, 2007. These specific factors are in addition to those considerations discussed above. Each Fund’s proposed management fee and estimated expense ratio were compared to the fees and expense ratios of the funds in its Selected Peer Group.
ING Greater China Fund
In determining whether to approve the Investment Management and Sub-Advisory Agreements for Greater China, the Board received and evaluated such information as it deemed necessary for an informed determination of whether each agreement, and the proposed policies and procedures for Greater China, should be approved for the Fund. The materials provided to the Board and/or its legal counsel in support of the proposed advisory and sub-advisory arrangements included the following: (1) a memorandum presenting Management’s rationale for requesting the launch of Greater China that discusses, among other things, the investment attributes and risk return characteristics of equities in the greater China region and the performance of ING Investment Management Asia-Pacific (“ING IM Asia-Pacific”) in managing a representative separate account (the “Representative Account”) in a style substantially similar to that in which Greater China would be managed, with such performance being compared against Morningstar China and Pacific/Asia ex-Japan Category averages and the Fund’s proposed primary benchmark; (2) information about the Fund’s investment objective and strategies and anticipated portfolio characteristics; (3) FACT sheets for the Fund that compare the performance the Representative Account against that of the Fund’s Selected Peer Group and its Morningstar category median; (4) responses from ING Investments and ING IM Asia-Pacific to questions posed by K&LNG, independent legal counsel, on behalf of the
166
ADVISORY CONTRACT APPROVAL DISCUSSION (UNAUDITED) (CONTINUED)
IMF Non-Interested Trustees; (5) supporting documentation, including copies of the forms of Investment Management and Sub-Advisory Agreements for Greater China; and (6) other information relevant to the Board’s evaluation. In addition, the Board considered the information provided periodically throughout the year in presentations to the Board by ING Investments in the context of ING Investments’ oversight of other sub-advisers managing Funds in the ING Funds complex.
At the Board meeting at which the Investment Management and Sub-Advisory Agreements were considered, the Board received and evaluated the report of the IE & FI IRC, which had met with the proposed managers to the new Fund. The Board also considered that Greater China would be subject to the standard policies and procedures of IMF previously approved by the Board for other series of IMF and approved in accordance with Rule 38a-1 under the Investment Company Act of 1940. The Board also noted that, in managing the Fund, ING Investments would be subject to procedures adopted pursuant to Rule 206(4)-7 under the Investment Advisers Act of 1940 that had been previously approved by the Board in connection with other Funds. In the case of ING IM Asia-Pacific, the Board considered, among other things, a representation from IMF’s Chief Compliance Officer that, in his view, INGIM Asia-Pacific’s written policies and procedures are reasonably designed to prevent violation of the Federal securities laws.
The Board’s consideration of whether to approve the Investment Management Agreement with ING Investments on behalf of Greater China took into account several factors including, but not limited to, the following: (1) the nature and quality of the services to be provided by ING Investments to Greater China under the proposed Investment Management Agreement; (2) ING Investments’ experience as a manager-of-managers overseeing sub-advisers to other Funds within the ING Funds complex; (3) ING Investments’ strength and reputation within the industry; (4) the fairness of the compensation under the proposed Investment Management Agreement in light of the services to be provided to Greater China and taking into account the sub-advisory fees payable by ING Investments to ING IM Asia-Pacific; (5) the fairness of ING Investments’ compensation under an Investment Management Agreement with a breakpoint fee schedule where it is unknown whether or when the asset level necessary to achieve a breakpoint discount would be reached by the Fund; (6) the pricing structure (including the estimated expense ratio to be borne by shareholders) of Greater China, including that: (a) the proposed management fee (inclusive of the advisory fee and a 0.10% administration fee) for Greater China is equal to the median and above the average management fees of the funds in Greater China’s Selected Peer Group, and (b) the estimated expense ratio for Greater China is below the median and the average expense ratios of the funds in Greater China’s Selected Peer Group; (7) the projected profitability of ING Investments when sub-advisory fees payable by ING Investments to ING IM Asia-Pacific are taken into account; (8) the personnel, operations, financial condition, and investment management capabilities, methodologies and resources of ING Investments, including its management team’s expertise in the management of other Funds; (9) ING Investments’ compliance capabilities, as demonstrated by, among other things, its policies and procedures designed to prevent violations of the Federal securities laws, which had previously been approved by the Board in connection with their oversight of other Funds in the ING Funds complex; (10) the information that had been provided by ING Investments at regular Board meetings, and in anticipation of the November 2005 meeting, with respect to its capabilities as a manager-of-managers; and (11) “fall-out benefits” to ING Investments and its affiliates that were anticipated to arise from ING Investments’ management of the Fund.
In reviewing the proposed Sub-Advisory Agreement with ING IM Asia-Pacific, the Board considered a number of factors, including, but not limited to, the following: (1) ING Investments’ view of the reputation of ING IM Asia-Pacific as manager to the Representative Account; (2) ING IM Asia-Pacific’s strength and reputation in the industry; (3) the nature and quality of the services to be provided by ING IM Asia-Pacific under the proposed Sub-Advisory Agreement; (4) the prior performance of the Representative Account, compared to Morningstar’s China and Pacific/Asia ex-Japan Category averages, the Morningstar Category median, the Fund’s proposed primary benchmark and the performance of the funds in the Fund’s Selected Peer Group; (5) the personnel, operations, financial condition, and investment management capabilities, methodologies and resources of ING IM Asia-Pacific and its fit among the stable of managers in the ING Funds line-up; (6) the fairness of the compensation under the proposed Sub-Advisory Agreement in light of the services to be provided by and the projected profitability of ING IM Asia-Pacific as Greater China’s sub-adviser; (7) the costs for the services to be provided by ING IM Asia-Pacific, including that it would charge a sub-advisory fee with breakpoints, and that the sub-advisory fee would be
167
ADVISORY CONTRACT APPROVAL DISCUSSION (UNAUDITED) (CONTINUED)
payable out of ING Investments’ advisory fee and, therefore, these breakpoint discounts would affect the fees payable by ING Investments; (8) ING IM Asia-Pacific’s operations and compliance program, including its policies and procedures intended to assure compliance with the Federal securities laws, which had been reviewed and evaluated by IMF’s Chief Compliance Officer; (10) ING IM Asia-Pacific’s financial condition; (11) the appropriateness of the selection of ING IM Asia-Pacific in light of Greater China’s investment objective and prospective investor base; and (12) ING IM Asia-Pacific’s Code of Ethics, presented and approved at the November 2005 meeting, and related procedures for complying with that Code.
In analyzing the performance data of the Representative Account, the Board noted the difficulty in obtaining meaningful performance comparisons given the small universe of China-focused funds that could be included in Morningstar’s China Funds Category average. The Board also noted Management’s representations regarding China Fund’s performance vis-à-vis Morningstar’s Pacific/Asia Category average, including that this Morningstar category includes many funds that have much wider mandates than the narrowly-focused China Fund.
After its deliberation, the Board reached the following conclusions: (1) the Fund’s proposed management fee rate is reasonable in the context of all factors considered by the Board; (2) the Fund’s estimated expense ratio is reasonable in the context of all factors considered by the Board; (3) the sub-advisory fee rate payable by ING Investments to ING IM Asia-Pacific is reasonable in the context of all factors considered by the Board; (4) ING Investments maintains an appropriate compliance program, with this conclusion based upon the Board’s previous and ongoing review of the compliance program; and (5) ING IM Asia-Pacific maintains an appropriate compliance program, with this conclusion based upon, among other things, a representation from IMF’s Chief Compliance Officer that ING IM Asia-Pacific’s compliance policies and procedures are reasonably designed to assure compliance with the Federal securities laws. Based on these conclusions and other factors, the Board voted to approve the Investment Management and Sub-Advisory Agreements for Greater China. During its deliberations, different Board members may have given different weight to different individual factors and related conclusions.
ING Index Plus International Equity Fund
In determining whether to approve the Investment Management and Sub-Advisory Agreements for Index Plus International Equity, the Board received and evaluated such information as it deemed necessary for an informed determination of whether each agreement, and the proposed policies and procedures for Index Plus International Equity, should be approved for the Fund. The materials provided to the Board and/or its legal counsel in support of the proposed advisory and sub-advisory arrangements included the following: (1) a memorandum presenting Management’s rationale for requesting the launch of Index Plus International Equity; (2) information about the Fund’s investment objective and strategies and the anticipated portfolio characteristics; (3) responses from ING Investments and ING Investment Management Advisors B.V. (“IIM BV”), the proposed Sub-Adviser to the Fund, to questions posed by K&LNG, independent legal counsel, on behalf of the IMF Non-Interested Trustees; (4) supporting documentation, including copies of the forms of Investment Management and Sub-Advisory Agreements for Index Plus International Equity; and (5) other information relevant to the Board’s evaluation. In addition, the Board considered the information provided periodically throughout the year in presentations to the Board by ING Investments in the context of ING Investments’ oversight of other sub-advisers managing Funds in the ING Funds complex, and by IIM B.V. in connection with its management of other Funds in the ING Funds complex, including ING Global Equity Dividend Fund, ING VP Global Equity Dividend Portfolio, ING Global Equity Dividend and Premium Opportunity Fund, ING Russia Fund, and ING VP Index Plus International Equity Portfolio.
At the Board meeting at which the Investment Management and Sub-Advisory Agreements were considered, the Board received and evaluated the report of the IE & FI IRC. The Board also considered that Index Plus International Equity would be subject to the standard policies and procedures of IMF previously approved by the Board for other series of IMF and approved in accordance with Rule 38a-1 under the Investment Company Act of 1940. The Board also noted that, in managing the Fund, ING Investments and IIM B.V. each would be subject to procedures adopted pursuant to Rule 206(4)-7 under the Investment Advisers Act of 1940 that had been previously approved by the Board in connection with other Funds.
The Board’s consideration of whether to approve the Investment Management Agreement with ING Investments on behalf of Index Plus International Equity took into account several factors including, but not limited to, the following: (1) the nature and quality of the services to be provided by ING Investments to Index Plus International
168
ADVISORY CONTRACT APPROVAL DISCUSSION (UNAUDITED) (CONTINUED)
Equity under the proposed Investment Management Agreement; (2) ING Investments’ experience as a manager-of-managers overseeing sub-advisers to other Funds within the ING Funds complex; (3) ING Investments’ strength and reputation within the industry, particularly as a manager of other international and enhanced index Funds; (4) the fairness of the compensation under the proposed Investment Management Agreement in light of the services to be provided to Index Plus International Equity and taking into account the sub-advisory fees payable by ING Investments to IIM B.V.; (5) the fairness of ING Investments’ compensation under an Investment Management Agreement with level fees that does not include breakpoints; (6) the pricing structure (including the estimated expense ratio to be borne by shareholders) of Index Plus International Equity, including that: (a) the proposed management fee (inclusive of the advisory fee and a 0.10% administration fee) for Index Plus International Equity is below the median and the average management fees of the funds in Index Plus International Equity’s Selected Peer Group, and (b) the estimated expense ratio for Index Plus International Equity is below the median and the average expense ratios of the funds in Index Plus International Equity’s Selected Peer Group; (7) the projected profitability of ING Investments when sub-advisory fees payable by ING Investments to IIM B.V. are taken into account; (8) the personnel, operations, financial condition, and investment management capabilities, methodologies and resources of ING Investments, including its management team’s expertise in the management of other Funds; (9) ING Investments’ compliance capabilities, as demonstrated by, among other things, its policies and procedures designed to prevent violations of the Federal securities laws, which had previously been approved by the Board in connection with their oversight of other Funds in the ING Funds complex; (10) the information that had been provided by ING Investments at regular Board meetings, and in anticipation of the November meeting, with respect to its capabilities as a manager-of-managers; and (11) “fall-out benefits” to ING Investments and its affiliates that were anticipated to arise from ING Investments’ management of the Fund.
In reviewing the proposed Sub-Advisory Agreement with IIM B.V., the Board considered a number of factors, including, but not limited to, the following: (1) ING Investments’ view of the reputation of IIM B.V. as a manager to other Funds; (2) IIM B.V.’s strength and reputation in the industry; (3) the nature and quality of the services to be provided by IIM B.V. under the proposed Sub-Advisory Agreement; (4) the personnel, operations, financial condition, and investment management capabilities, methodologies and resources of IIM B.V. and its fit among the stable of managers in the ING Funds line-up; (5) the fairness of the compensation under the proposed Sub-Advisory Agreement in light of the services to be provided by and the projected profitability of IIM B.V. as Index Plus International Equity’s sub-adviser; (6) the costs for the services to be provided by IIM B.V., including that it would charge a level sub-advisory fee with no breakpoints; (7) IIM B.V.’s operations and compliance program, including its policies and procedures intended to assure compliance with the Federal securities laws, which had previously been approved by the Board as part of its oversight of other Funds in the ING Funds complex; (8) IIM B.V.’s financial condition; (9) the appropriateness of the selection of IIM B.V. in light of Index Plus International Equity’s proposed investment objective and prospective investor base; and (10) IIM B.V.’s Code of Ethics, which has previously been approved for other ING Funds, and related procedures for complying with that Code.
After its deliberation, the Board reached the following conclusions: (1) the Fund’s proposed management fee rate is reasonable in the context of all factors considered by the Board; (2) the Fund’s estimated expense ratio is reasonable in the context of all factors considered by the Board; (3) the sub-advisory fee rate payable by ING Investments to IIM B.V. is reasonable in the context of all factors considered by the Board; and (4) each of ING Investments and IIM B.V. maintains an appropriate compliance program, with this conclusion based upon the Board’s previous and ongoing review of the compliance program. Based on these conclusions and other factors, the Board voted to approve the Advisory and Sub-Advisory Agreements for Index Plus International Equity. During its deliberations, different Board members may have given different weight to different individual factors and related conclusions.
ING International Capital Appreciation Fund
In determining whether to approve the Investment Management and Sub-Advisory Agreements for ING International Capital Appreciation, the Board received and evaluated such information as it deemed necessary for an informed determination of whether each agreement, and the proposed policies and procedures for International Capital Appreciation, should be approved for the Fund. The materials provided to the Board and/or its legal counsel in support of the proposed advisory and sub-advisory arrangements included the following: (1) a
169
ADVISORY CONTRACT APPROVAL DISCUSSION (UNAUDITED) (CONTINUED)
memorandum presenting Management’s rationale for requesting the launch of International Capital Appreciation that discusses, among other things, the performance of Hansberger Global Investors, Inc. (“HGI”) in managing a proprietary fund in a style substantially similar to that in which International Capital Appreciation would be managed, with such performance being compared against the Fund’s Morningstar Category average and proposed primary benchmark; (2) information about the Fund’s investment objective and strategies and the anticipated portfolio characteristics; (3) FACT sheets for the Fund that compare the performance of HGI’s similarly managed proprietary fund against that of the Fund’s Selected Peer Group and its Morningstar category median; (4) responses from ING Investments and HGI to questions posed by K&LNG, independent legal counsel, on behalf of the IMF Non-Interested Trustees; (5) supporting documentation, including copies of the forms of plans and the forms of Investment Management and Sub-Advisory Agreements for International Capital Appreciation; and (6) other information relevant to the Board’s evaluation. In addition, the Board considered the information provided periodically throughout the year in presentations to the Board by ING Investments in the context of ING Investments’ oversight of other sub-advisers managing Funds in the ING Funds complex.
At the Board meeting at which the Investment Management and Sub-Advisory Agreements were considered, the Board received and evaluated the report of the IE & FI IRC, which had met with the proposed managers to the new Fund. The Board also considered that International Capital Appreciation would be subject to the standard policies and procedures of IMF previously approved by the Board for other series of IMF and approved in accordance with Rule 38a-1 under the Investment Company Act of 1940. The Board also noted that, in managing the Fund, ING Investments would be subject to procedures adopted pursuant to Rule 206(4)-7 under the Investment Advisers Act of 1940 that had been previously approved by the Board in connection with other Funds. In the case of HGI, the Board considered, among other things, a representation from IMF’s Chief Compliance Officer that, in his view, HGI’s written policies and procedures are reasonably designed to prevent violation of the Federal securities laws.
The Board’s consideration of whether to approve the Investment Management Agreement with ING Investments on behalf of International Capital Appreciation took into account several factors including, but not limited to, the following: (1) the nature and quality of the services to be provided by ING Investments to International Capital Appreciation under the proposed Investment Management Agreement; (2) ING Investments’ experience as a manager-of-managers overseeing sub-advisers to other Funds within the ING Funds complex; (3) ING Investments’ strength and reputation within the industry, particularly its experience in overseeing international equity funds; (4) the fairness of the compensation under the proposed Investment Management Agreement in light of the services to be provided to International Capital Appreciation and taking into account the sub-advisory fees payable by ING Investments to HGI; (5) the fairness of ING Investments’ compensation under an Investment Management Agreement with a breakpoint fee schedule where it is unknown whether or when the asset level necessary to achieve a breakpoint discount would be reached by the Fund; (6) the pricing structure (including the estimated expense ratio to be borne by shareholders) of International Capital Appreciation, including that: (a) the proposed management fee (inclusive of the advisory fee and a 0.10% administration fee) for International Capital Appreciation is equal to the median and below the average management fees of the funds in International Capital Appreciation’s Selected Peer Group, and (b) the estimated expense ratio for International Capital Appreciation is below the median and the average expense ratios of the funds in International Capital Appreciation’s Selected Peer Group; (7) the projected profitability of ING Investments when sub-advisory fees payable by ING Investments to HGI are taken into account; (8) the personnel, operations, financial condition, and investment management capabilities, methodologies and resources of ING Investments, including its management team’s expertise in the management of other Funds; (9) ING Investments’ compliance capabilities, as demonstrated by, among other things, its policies and procedures designed to prevent violations of the Federal securities laws, which had previously been approved by the Board in connection with their oversight of other Funds in the ING Funds complex; (10) the information that had been provided by ING Investments at regular Board meetings, and in anticipation of the November meeting, with respect to its capabilities as a manager-of-managers; and (11) “fall-out benefits” to ING Investments and its affiliates that were anticipated to arise from ING Investments’ management of the Fund.
In reviewing the proposed Sub-Advisory Agreement with HGI, the Board considered a number of factors, including, but not limited to, the following: (1) ING Investments’ view of the reputation of HGI as a manager to
170
ADVISORY CONTRACT APPROVAL DISCUSSION (UNAUDITED) (CONTINUED)
an investment portfolio (the “HGI Portfolio”) managed in a style substantially similar to that in which International Capital Appreciation would be managed; (2) HGI’s strength and reputation in the industry; (3) the nature and quality of the services to be provided by HGI under the proposed Sub-Advisory Agreement; (4) the prior performance of the HGI Portfolio, compared to the Fund’s Morningstar Category average, Morningstar Category median, its proposed primary benchmark and the performance of the funds in the Fund’s Selected Peer Group; (5) the personnel, operations, financial condition, and investment management capabilities, methodologies and resources of HGI and its fit among the stable of managers in the ING Funds line-up; (6) the fairness of the compensation under the proposed Sub-Advisory Agreement; (7) the costs for the services to be provided by HGI, including that it would charge a sub-advisory fee with breakpoints, and that the sub-advisory fee would be payable out of ING Investments’ advisory fee and, therefore, these breakpoint discounts would affect the fees payable by ING Investments; (8) HGI’s operations and compliance program, including its policies and procedures intended to assure compliance with the Federal securities laws, which had been reviewed and evaluated by IMF’s Chief Compliance Officer; (10) HGI’s financial condition; (11) the appropriateness of the selection of HGI in light of International Capital Appreciation’s investment objective and prospective investor base; and (12) HGI’s Code of Ethics, presented and approved at the November meeting, and related procedures for complying with that Code.
After its deliberation, the Board reached the following conclusions: (1) the Fund’s proposed management fee rate is reasonable in the context of all factors considered by the Board; (2) the Fund’s estimated expense ratio is reasonable in the context of all factors considered by the Board; (3) the sub-advisory fee rate payable by ING Investments to HGI is reasonable in the context of all factors considered by the Board; (4) ING Investments maintains an appropriate compliance program, with this conclusion based upon the Board’s previous and ongoing review of the compliance program; and (5) HGI maintains an appropriate compliance program, with this conclusion based upon, among other things, a representation from IMF’s Chief Compliance Officer that HGI’s compliance policies and procedures are reasonably designed to assure compliance with the Federal securities laws. Based on these conclusions and other factors, the Board voted to approve the Investment Management and Sub-Advisory Agreements for International Capital Appreciation. During its deliberations, different Board members may have given different weight to different individual factors and related conclusions.
ING International Real Estate Fund
In determining whether to approve the Advisory and Sub-Advisory Agreements for International Real Estate, the Board received and evaluated such information as it deemed necessary for an informed determination of whether each agreement, and the proposed policies and procedures for International Real Estate, should be approved. The materials provided to the Board and/or its legal counsel in support of the proposed advisory and sub-advisory arrangements included the following: (1) a memorandum presenting Management’s rationale for requesting the launch of International Real Estate that discusses, among other things, the expertise of ING Clarion Real Estate Securities L.P. (“Clarion”) with respect to its domestic and global real estate investment products; (2) information about the Fund’s proposed investment objective and strategies and anticipated portfolio characteristics; (3) FACT sheets for International Real Estate that compare the Fund’s fee structure to its Selected Peer Group and its Morningstar Category median; (4) responses from ING Investments and Clarion to questions posed by K&LNG, independent legal counsel, on behalf of the IMF Non-Interested Trustees; (5) supporting documentation, including copies of the forms of Investment Management and Sub-Advisory Agreements for International Real Estate; and (6) other information relevant to the Board’s evaluation. In addition, the Board considered the information provided periodically throughout the year in presentations to the Board by ING Investments in the context of ING Investments’ oversight of other sub-advisers managing Funds in the ING Funds complex, and by Clarion in connection with its management of other Funds in the ING Funds complex, including ING Real Estate Fund and ING Global Real Estate Fund, as well as ING VP Real Estate Portfolio.
At the Board meeting at which the Investment Management and Sub-Advisory Agreements were considered, the Board considered that International Real Estate would be subject to the standard policies and procedures of IMF previously approved by the Board for other series of ING Mutual Funds and approved in accordance with Rule 38a-1 under the Investment Company Act of 1940. The Board also noted that, in managing International Real Estate, ING Investments and Clarion each would be subject to procedures adopted pursuant to Rule 206(4)-7 under
171
ADVISORY CONTRACT APPROVAL DISCUSSION (UNAUDITED) (CONTINUED)
the Investment Advisers Act of 1940 that had been previously approved by the Board in connection with other Funds.
The Board’s consideration of whether to approve the Investment Management Agreement with ING Investments on behalf of International Real Estate took into account several factors including, but not limited to, the following: (1) the nature and quality of the services to be provided by ING Investments to International Real Estate under the proposed Investment Management Agreement; (2) ING Investments’ experience as a manager-of-managers overseeing sub-advisers to other Funds within the ING Funds complex; (3) ING Investments’ strength and reputation within the industry; (4) the fairness of the compensation under the proposed Investment Management Agreement in light of the services to be provided to International Real Estate and taking into account the sub-advisory fees payable by ING Investments to Clarion; (5) the economies of scale benefits to the Fund and its shareholders from breakpoint discounts applicable to the Fund’s advisory fee, which result in lower fees at higher asset levels, taking into account that it would take time to reach these discounts after the Fund is launched; (6) the pricing structure (including the estimated expense ratio to be borne by shareholders) of International Real Estate, as compared to other similarly-managed funds in a comparable selected peer group (“Selected Peer Group”), including Management’s analysis that: (a) the proposed management fee (inclusive of a 0.10% administration fee) is above the median and average management fees of the funds in International Real Estate’s Selected Peer Group, and (b) the estimated expense ratio for International Real Estate is below the median and average expense ratios of the funds in International Real Estate’s Selected Peer Group; (7) the projected profitability of ING Investments when sub-advisory fees payable by ING Investments to Clarion are taken into account; (8) the personnel, operations, financial condition, and investment management capabilities, methodologies and resources of ING Investments, including its management team’s expertise in the management of other Funds; (9) ING Investments’ compliance capabilities, as demonstrated by, among other things, its policies and procedures designed to prevent violations of the Federal securities laws, which had previously been approved by the Board in connection with their oversight of other Funds in the ING Funds complex; (10) the information that had been provided by ING Investments at regular Board meetings, and in anticipation of the January meeting, with respect to its capabilities as a manager-of-managers; and (11) “fall-out benefits” to ING Investments and its affiliates that were anticipated to arise from ING Investments’ management of International Real Estate.
In reviewing the proposed Sub-Advisory Agreement with Clarion, the Board considered a number of factors, including, but not limited to, the following: (1) ING Investments’ view of Clarion’s capabilities in managing in the strategy to be employed by International Real Estate; (2) Clarion’s strength and reputation in the industry; (3) the nature and quality of the services to be provided by Clarion under the proposed Sub-Advisory Agreement; (4) Clarion’s expertise with respect to its domestic and global real estate products, including hypothetical performance of international portfolios managed by Clarion; (5) the personnel, operations, financial condition, and investment management capabilities, methodologies and resources of Clarion, and its fit among the stable of managers in the ING Funds line-up; (6) the fairness of the compensation under the proposed Sub-Advisory Agreement in light of the services to be provided by and the projected profitability of Clarion as International Real Estate’s sub-adviser; (7) the costs for the services to be provided by Clarion, including breakpoints; (8) Clarion’s operations and compliance program, including its policies and procedures intended to assure compliance with the Federal securities laws, which had previously been approved by the Board as part of its oversight of other Funds in the ING Funds complex; (9) Clarion’s financial condition; (10) the appropriateness of the selection of Clarion in light of International Real Estate’s investment objective and prospective investor base; and (11) Clarion’s Code of Ethics, which has previously been approved for other ING Funds, and related procedures for complying with that Code.
After its deliberation, the Board reached the following conclusions: (1) International Real Estate’s proposed management fee rate is reasonable in the context of all factors considered by the Board; (2) International Real Estate’s estimated expense ratio is reasonable in the context of all factors considered by the Board; (3) the sub-advisory fee rate payable by ING Investments to Clarion is reasonable in the context of all factors considered by the Board; and (4) each of ING Investments and Clarion maintains an appropriate compliance program, with this conclusion based upon the Board’s previous and ongoing review of the compliance program. Based on these conclusions and other factors, the Board voted to approve the Investment Management and Sub-Advisory Agreements for International Real Estate. During its deliberations, different Board members may have given different weight to different individual factors and related conclusions.
172
ADVISORY CONTRACT APPROVAL DISCUSSION (UNAUDITED) (CONTINUED)
ING Emerging Markets Fixed Income Fund
In determining whether to approve the Investment Management and Sub-Advisory Agreement for Emerging Markets Fixed Income, the Board received and evaluated such information as it deemed necessary for an informed determination of whether each agreement, and the proposed policies and procedures for Emerging Markets Fixed Income, should be approved for the Fund. The materials provided to the Board and/or its legal counsel in support of the proposed advisory and sub-advisory arrangements included the following: (1) a memorandum presenting Management’s rationale for requesting the launch of Emerging Markets Fixed Income that discusses, among other things, the investment attributes and risk/return characteristics of emerging market debt as an asset class and the performance of ING Investment Advisors, B.V. (“IIM B.V.”) in managing two emerging market fixed income strategies (the “Currency Composites”) that are managed in a manner substantially similar to that in which IIM B.V. would manage the Fund, with such performance being compared against the Fund’s Morningstar category average and the Fund’s proposed primary benchmark; (2) information about the Fund’s proposed investment objective and strategies and anticipated portfolio characteristics; (3) FACT sheets for Emerging Markets Fixed Income that compare the performance of the Currency Composites against that of the Fund’s Selected Peer Group and its Morningstar category median; (4) responses from ING Investments and IIM B.V. to questions posed by K&LNG, independent legal counsel, on behalf of the Non-Interested Trustees; (5) supporting documentation, including copies of the forms of Investment Management and Sub-Advisory Agreements for Emerging Markets Fixed Income; and (6) other information relevant to the Board’s evaluation. In addition, the Board considered the information provided periodically throughout the year in presentations to the Board by ING Investments in the context of its role as a manager of managers, and by IIM B.V. in connection with its management of other Funds in the ING Funds complex, including ING Global Equity Dividend Fund, ING VP Global Equity Dividend Portfolio, ING Global Equity Dividend and Premium Opportunity Fund, ING Russia Fund, and ING VP Index Plus International Equity Portfolio.
At the Board meeting at which the Investment Management and Sub-Advisory Agreements were considered, the Board received and evaluated the report of the IE & FI IRC, which had met with the proposed managers to the new Fund. The Board also considered that Emerging Markets Fixed Income would be subject to the standard policies and procedures of IMF previously approved by the Board for other Series of IMF and approved in accordance with Rule 38a-1 under the Investment Company Act of 1940. The Board also noted that, in managing the Fund, ING Investments and IIM B.V. each would be subject to procedures adopted pursuant to Rule
206(4)-7 under the Investment Advisers Act of 1940 that had been previously approved by the Board.
The Board’s consideration of whether to approve the Investment Management Agreement with ING Investments on behalf of Emerging Markets Fixed Income took into account factors that included the following: (1) the nature and quality of the services to be provided by ING Investments to Emerging Markets Fixed Income under the proposed Investment Management Agreement; (2) ING Investments’ experience as a manager-of-managers overseeing sub-advisers to other Funds within the ING Funds complex; (3) ING Investments’ strength and reputation within the industry, particularly its reputation as a manager of similar emerging markets Funds; (4) the fairness of the compensation under the proposed Investment Management Agreement in light of the services to be provided to Emerging Markets Fixed Income and taking into account the sub-advisory fees payable by ING Investments to IIM B.V.; (5) the fairness of ING Investments’ compensation under an Investment Management Agreement with a breakpoint fee schedule where it is unknown whether or when the asset level necessary to achieve a breakpoint discount would be reached by the Fund; (6) the proposed pricing structure (including the estimated expense ratio to be borne by shareholders) of Emerging Markets Fixed Income, including that: (a) the proposed management fee (inclusive of the advisory fee and a 0.10% administration fee) for Emerging Markets Fixed Income is equal to the median and below the average management fees of the funds in Emerging Markets Fixed Income’s Selected Peer Group, and (b) the proposed expense limit and estimated expense ratio for Emerging Markets Fixed Income is below the median and average expense ratios of the funds in Emerging Markets Fixed Income’s Selected Peer Group; (7) the projected profitability to ING Investments when sub-advisory fees payable by ING Investments to IIM B.V. are taken into account; (8) the personnel, operations, financial condition, and investment management capabilities, methodologies and resources of ING Investments, including its management team’s expertise in the management of other Funds; (9) ING Investments’ compliance capabilities, as demonstrated by, among other things, its policies and procedures designed to prevent violations of the Federal securities laws, which had previously been approved by the Board in connection with their oversight of other
173
ADVISORY CONTRACT APPROVAL DISCUSSION (UNAUDITED) (CONTINUED)
Funds in the ING Funds complex; (10) the information that had been provided by ING Investments at regular Board meetings, and in anticipation of the November meeting, with respect to its capabilities as a manager-of-managers; and (11) “fall-out benefits” to ING Investments and its affiliates that were anticipated to arise from ING Investments’ management of the Fund.
In reviewing the Sub-Advisory Agreement with IIM B.V., the Board considered a number of factors, including, but not limited to, the following: (1) ING Investments’ view of the reputation of IIM B.V. as a manager to similar funds; (2) IIM B.V.’s strength and reputation in the industry; (3) the nature and quality of the services to be provided by IIM B.V. under the proposed Sub-Advisory Contract; (4) the prior performance of the Currency Composites compared to the Fund’s Morningstar Category average, Morningstar Category median, its proposed primary benchmark and the performance of the funds in the Fund’s Selected Peer Group; (5) the personnel, operations, financial condition, and investment management capabilities, methodologies and resources of IIM B.V. and its fit among the stable of managers in the ING Funds line-up; (6) the fairness of the compensation under the proposed Sub-Advisory Agreement in light of the services to be provided by and the projected profitability of IIM B.V. as Emerging Markets Fixed Income’s sub-adviser; (7) the costs for the services to be provided by IIM B.V., including that it would charge a sub-advisory fee with breakpoints, and that the sub-advisory fee would be payable out of ING Investments’ advisory fee and, therefore, these breakpoint discounts would affect the fees payable by ING Investments; (8) IIM B.V.’s operations and compliance program, including its policies and procedures intended to assure compliance with the Federal securities laws, which had previously been approved by the Board as part of its oversight of other Funds in the ING Funds complex; (9) IIM B.V.’s financial condition; (10) the appropriateness of the selection of IIM B.V. in light of Emerging Markets Fixed Income’s investment objective and prospective investor base; and (11) Emerging Markets Fixed Income’s Code of Ethics, which has previously been approved for other ING Funds, and related procedures for complying with that Code.
After its deliberation, the Board reached the following conclusions: (1) the Fund’s proposed management fee rate is reasonable in the context of all factors considered by the Board; (2) the Fund’s estimated expense ratio is reasonable in the context of all factors considered by the Board; (3) the sub-advisory fee rate payable by ING Investments to IIM B.V. is reasonable in the context of all factors considered by the Board; and (4) each of ING Investments and IIM B.V. maintains an appropriate compliance program, with this conclusion based upon the Board’s previous and ongoing review of the compliance program. Based on these conclusions and other factors, the Board voted to approve the Advisory and Sub-Advisory Agreements for Emerging Markets Fixed Income. During its deliberations, different Board members may have given different weight to different individual factors and related conclusions.
ING Diversified International Fund
The Board, including a majority of the IMF Non-Interested Trustees, considered whether to approve the Investment Management Agreement for Diversified International for an initial term that will end on November 30, 2007. In determining whether to approve the Investment Management Agreement for Diversified International, the Board received and evaluated such information as it deemed necessary for an informed determination of whether the Agreement, and the proposed policies and procedures for Diversified International, should be approved for the Fund. The materials provided to the Board and/or its legal counsel in support of the proposed advisory arrangements included the following: (1) information about the Fund’s investment proposed investment objective and strategies, including its operation as a fund-of-funds investing in a universe of underlying ING-affiliated international Funds and its asset allocation strategy; (2) information regarding expense structure for the Fund and the projected profitability of ING Investments from managing Diversified International; (2) responses from ING Investments to questions posed by K&LNG, independent legal counsel, on behalf of the IMF Non-Interested Trustees; (3) supporting documentation, including a copy of the form of Investment Management Agreement for the Fund; and (4) other information relevant to the Board’s evaluation. In addition, the Board considered the information provided periodically throughout the year in presentations to the Board by ING Investments in the context of its operation as a manager to other ING-affiliated funds-of-funds.
At the Board meeting at which the Investment Management Agreement was considered, the Board received and evaluated the report of the IE & FI IRC, which had met with the proposed managers to the new Fund. The Board also considered that the Fund would be subject to the standard policies and procedures of ING Investments
174
ADVISORY CONTRACT APPROVAL DISCUSSION (UNAUDITED) (CONTINUED)
previously approved by the Board for other series of IMF and approved in accordance with Rule 38a-1 under the Investment Company Act of 1940. The Board also noted that, in managing the Fund, ING Investments would be subject to procedures adopted pursuant to Rule 206(4)-7 under the Investment Advisers Act of 1940 that had been previously approved by the Board.
The Board’s consideration of whether to approve the Investment Management Agreement with ING Investments on behalf of the Fund took into account factors that included the following: (1) the nature and quality of the services to be provided by ING Investments to Diversified International under the proposed Investment Management Agreement; (2) the personnel, operations, financial condition, and investment management capabilities, methodologies and resources of ING Investments, including ING Investments’ experience as a manager to funds-of-funds; (3) ING Investments’ strength and reputation within the industry; (4) the fairness of the compensation under the Investment Management Agreement, taking into account the management fees payable by the underlying Funds in which Diversified International would invest; (5) the pricing structure (including the estimated expense ratio to be borne by shareholders) of Diversified International, as compared to other similarly-managed funds in the Fund’s Selected Peer Group, including Management’s analysis that (a) the proposed fund-of-funds level fee (inclusive of a 0.10% administration fee) is below the median and average management fees of the funds in its Selected Peer Group; and (b) the estimated expense ratio of Diversified International is below the median and average expense ratios of the funds in its Selected Peer Group; (6) ING Investments’ compliance capabilities, as demonstrated by, among other things, its policies and procedures designed to prevent violations of the Federal securities laws, which had previously been approved by the Board in connection with their oversight of other Funds in the ING Funds complex; (7) the information that had been provided by ING Investments at regular Board meetings, and in anticipation of the November meeting, with respect to its capabilities as a manager of funds-of-funds; and (8) anticipated “fall-out benefits” to ING Investments and its affiliates arising from its management of Diversified International.
After its deliberation, the Board reached the following conclusions: (1) the Fund’s proposed management fee rate is reasonable in the context of all factors considered by the Board; (2) the Fund’s estimated expense ratio is reasonable in the context of all factors considered by the Board; and (3) ING Investments maintains an appropriate compliance program, with this conclusion based upon the Board’s previous and ongoing review of the compliance program. Based on these conclusions and other factors, the Board voted to approve the Investment Management Agreement with Diversified International. During its deliberations, different Board members may have given different weight to different individual factors and related conclusions.
175
(THIS PAGE INTENTIONALLY LEFT BLANK)
(THIS PAGE INTENTIONALLY LEFT BLANK)
ING Funds Distributor, LLC offers the funds listed below. Before investing in a fund, shareholders should carefully review the fund’s prospectus. Investors may obtain a copy of a prospectus of any ING Fund by calling (800) 992-0180 or by going to www.ingfunds.com.
Domestic Equity and Income Funds
ING Balanced Fund
ING Convertible Fund
ING Equity Income Fund
ING Real Estate Fund
Domestic Equity Growth Funds
ING 130/30 Fundamental Research Fund
ING Disciplined LargeCap Fund
ING Fundamental Research Fund
ING Growth Fund
ING LargeCap Growth Fund
ING MidCap Opportunities Fund
ING Opportunistic LargeCap Fund
ING SmallCap Opportunities Fund
ING Small Company Fund
Domestic Equity Index Funds
ING Index Plus LargeCap Fund
ING Index Plus MidCap Fund
ING Index Plus SmallCap Fund
Domestic Equity Value Funds
ING Financial Services Fund
ING LargeCap Value Fund
ING MagnaCap Fund
ING MidCap Value Fund
ING MidCap Value Choice Fund
ING SmallCap Value Fund
ING SmallCap Value Choice Fund
Fixed-Income Funds
ING GNMA Income Fund
ING High Yield Bond Fund
ING Intermediate Bond Fund
ING National Tax-Exempt Bond Fund
Global Equity Funds
ING Global Equity Dividend Fund
ING Global Real Estate Fund
ING Global Science and Technology Fund
ING Global Value Choice Fund
International Equity Funds
ING Emerging Countries Fund
ING Foreign Fund
ING Greater China Fund
ING Index Plus International Equity Fund
ING International Fund
ING International Capital Appreciation Fund
ING International Growth Fund
ING International Real Estate Fund
ING International SmallCap Fund
ING International Value Fund
ING International Value Choice Fund
ING Precious Metals Fund
ING Russia Fund
International Fixed-Income Fund
ING Emerging Markets Fixed Income Fund
International Fund-of-Funds
ING Diversified International Fund
Loan Participation Fund
ING Senior Income Fund
Money Market Funds*
ING Aeltus Money Market Fund
ING Classic Money Market Fund
Strategic Allocation Funds
ING Strategic Allocation Conservative Fund
ING Strategic Allocation Growth Fund
ING Strategic Allocation Moderate Fund
* An investment in a Fund is not insured or guaranteed by the Federal Deposit Insurance Corporation or any other government agency. Although the Fund seeks to preserve the value of your investment at $1.00 per share, it is possible to lose money by investing in the Fund.
PROXY VOTING INFORMATION
A description of the policies and procedures that the Registrants uses to determine how to vote proxies related to portfolio securities is available (1) without charge, upon request, by calling Shareholder Services toll-free at 800-992-0180; (2) on the Registrant’s website at www.ingfunds.com and (3) on the Securities and Exchange Commission’s (“SEC”) website at www.sec.gov.
Information regarding how the Registrants voted proxies related to portfolio securities during the most recent 12-month period ended June 30 is available without charge on the Registrants’ website at www.ingfunds.com and on the SEC’s website at www.sec.gov.
QUARTERLY PORTFOLIO HOLDINGS
The Registrants files its complete schedule of portfolio holdings with the SEC for the first and third quarters of each fiscal year on Form N-Q. The Registrants’ Forms N-Q are available on the SEC’s website at www.sec.gov. The Registrants’ Forms N-Q may be reviewed and copied at the SEC’s Public Reference Room in Washington, DC, and information on the operation of the Public Reference Room may be obtained by calling 1-800-SEC-0330; and is available upon request from the Registrants by calling Shareholder Services toll-free at 800-992-0180.
Investment Manager
ING Investments, LLC
7337 East Doubletree Ranch Road
Scottsdale, Arizona 85258
Administrator
ING Funds Services, LLC
7337 East Doubletree Ranch Road
Scottsdale, Arizona 85258
Distributor
ING Funds Distributor, LLC
7337 East Doubletree Ranch Road
Scottsdale, Arizona 85258
1-800-334-3444
Transfer Agent
DST Systems, Inc.
P.O. Box 419368
Kansas City, Missouri 64141
Custodian
The Bank of New York
100 Colonial Center Parkway, Suite 300
Lake Mary, Florida 32746
Legal Counsel
Dechert
1775 I Street, N.W.
Washington, D.C. 20006
For more complete information, or to obtain a prospectus on any ING fund, please call your Investment Professional or ING Funds Distributor, LLC at (800) 992-0180 or log on to www.ingfunds.com. The prospectus should be read carefully before investing. Consider the fund’s investment objectives, risks, charges and expenses carefully before investing. The prospectus contains this information and other information about the fund.

| | PRSAR-UINTABCIMQ | (0406-062906) |
ITEM 2. CODE OF ETHICS.
Not required for semi-annual filing.
ITEM 3. AUDIT COMMITTEE FINANCIAL EXPERT.
Not required for semi-annual filing.
ITEM 4. PRINCIPAL ACCOUNTANT FEES AND SERVICES.
Not required for semi-annual filing.
ITEM 5. AUDIT COMMITTEE OF LISTED REGISTRANTS.
Not required for semi-annual filing.
ITEM 6. SCHEDULE OF INVESTMENTS.
Schedule is included as part of the report to shareholders filed under Item 1 of this Form.
ITEM 7. DISCLOSURE OF PROXY VOTING POLICIES AND PROCEDURES FOR CLOSED-END MANAGEMENT INVESTMENT COMPANIES.
Not applicable.
ITEM 8. PORTFOLIO MANAGERS OF CLOSED-END MANAGEMENT INVESTMENT COMPANIES.
Not applicable.
ITEM 9. PURCHASES OF EQUITY SECURITIES BY CLOSED-END MANAGEMENT INVESTMENT COMPANY AND AFFILIATED PURCHASERS.
Not applicable.
ITEM 10. SUBMISSION OF MATTERS TO A VOTE OF SECURITY HOLDERS.
The Board has a Nominating Committee for the purpose of considering and presenting to the Board candidates it proposes for nomination to fill Independent Trustee vacancies on the Board. The Committee currently consists of all Independent Trustees of the Board (6 individuals). The Nominating Committee operates pursuant to a Charter approved by the Board. The primary purpose of the Nominating Committee is to consider and present to the Board the candidates it proposes for nomination to fill vacancies on the Board. In evaluating candidates, the Nominating Committee may consider a variety of factors, but it has not at this time set any specific minimum qualifications that must be met. Specific qualifications of candidates for Board membership will be based on the needs of the Board at the time of nomination.
The Nominating Committee is willing to consider nominations received from shareholders and shall assess shareholder nominees in the same manner as it reviews its own nominees. A shareholder nominee for director should be submitted in writing to the Fund’s Secretary. Any such shareholder nomination should include at a minimum the following information as to each individual proposed for nomination as trustee: such individual’s written consent to be named in the proxy statement as a nominee (if nominated) and to serve as a trustee (if elected), and all information relating to such individual that is required to be disclosed in the solicitation of proxies for election of trustees, or is otherwise required, in each case under applicable federal securities laws, rules and regulations.
The Secretary shall submit all nominations received in a timely manner to the Nominating Committee. To be timely, any such submission must be delivered to the Fund’s Secretary not earlier than the 90th day prior to such meeting and not later than the close of business on the later of the 60th day prior to such meeting or the 10th day following the day on which public announcement of the date of the meeting is first made, by either disclosure in a press release or in a document publicly filed by the Fund with the Securities and Exchange Commission.
ITEM 11. CONTROLS AND PROCEDURES.
(a) Based on our evaluation conducted within 90 days of the filing date, hereof, the design and operation of the registrant’s disclosure controls and procedures are effective to ensure that material information relating to the registrant is made known to the certifying officers by others within the appropriate entities, particularly during the period in which Forms N-CSR are being prepared, and the registrant’s disclosure controls and procedures allow timely preparation and review of the information for the registrant’s Form N-CSR and the officer certifications of such Form N-CSR.
(b) There were no significant changes in the registrant’s internal controls that occurred during the second fiscal quarter of the period covered by this report that has materially affected, or is reasonably likely to materially affect, the registrant’s internal control over financial reporting.
ITEM 12. EXHIBITS.
(a)(1) The Code of Ethics is not required for the semi-annual filing.
(a)(2) A separate certification for each principal executive officer and principal financial officer of the registrant as required by Rule 30a-2 under the Act (17 CFR 270.30a-2) is attached hereto as EX-99.CERT.
(a)(3) Not required for semi-annual filing.
(b) The officer certifications required by Section 906 of the Sarbanes-Oxley Act of 2002 are attached hereto as EX-99.906CERT
SIGNATURES
Pursuant to the requirements of the Securities Exchange Act of 1934 and the Investment Company Act of 1940, the registrant has duly caused this report to be signed on its behalf by the undersigned, thereunto duly authorized.
(Registrant): ING Mayflower Trust |
| |
| |
By | /s/ | James M. Hennessy | |
| | James M. Hennessy | |
| | President and Chief Executive Officer |
|
Date: | July 6, 2006 | |
|
Pursuant to the requirements of the Securities Exchange Act of 1934 and the Investment Company Act of 1940, this report has been signed below by the following persons on behalf of the registrant and in the capacities and on the dates indicated. |
| |
| |
By | /s/ | James M. Hennessy | |
| | James M. Hennessy | |
| | President and Chief Executive Officer |
| |
Date: | July 6, 2006 | |
| |
| |
By | /s/ | Todd Modic | |
| | Todd Modic | |
| | Senior Vice President and Chief Financial Officer |
| |
| |
Date: | July 6, 2006 | |
| | | | | | |