| | OMB APPROVAL |
| | OMB Number: | 3235-0570 |
| | Expires: | August 31, 2010 |
| UNITED STATES | Estimated average burden hours per response. . . . . . . . . . . . . 18.9 |
| SECURITIES AND EXCHANGE COMMISSION | |
| Washington, D.C. 20549 | |
| | | | |
FORM N-CSR
CERTIFIED SHAREHOLDER REPORT OF REGISTERED
MANAGEMENT INVESTMENT COMPANIES
Investment Company Act file number | 811-7986 |
|
The Alger Institutional Funds |
(Exact name of registrant as specified in charter) |
|
111 Fifth Avenue New York, New York | | 10003 |
(Address of principal executive offices) | | (Zip code) |
|
Mr. Hal Liebes
Fred Alger Management, Inc.
111 Fifth Avenue
New York, New York 10003 |
(Name and address of agent for service) |
|
Registrant’s telephone number, including area code: | 212-806-8800 | |
|
Date of fiscal year end: | October 31 | |
|
Date of reporting period: | October 31, 2007 | |
| | | | | | | | |
ITEM 1. REPORTS TO STOCKHOLDERS.
Alger SmallCap Growth Institutional Fund
| Alger MidCap Growth Institutional Fund |
Alger LargeCap Growth Institutional Fund
| Alger Capital Appreciation Institutional Fund |
The Alger
Institutional Funds

ANNUAL REPORT
October 31, 2007

Table Of Contents
THE ALGER INSTITUTIONAL FUNDS
| Letter to Our Shareholders | | | 1 | | |
|
| Fund Highlights (Unaudited) | | | 9 | | |
|
| Portfolio Summary (Unaudited) | | | 13 | | |
|
| Schedules of Investments | | | 14 | | |
|
| Statements of Assets and Liabilities | | | 34 | | |
|
| Statements of Operations | | | 36 | | |
|
| Statements of Changes in Net Assets | | | 38 | | |
|
| Financial Highlights | | | 40 | | |
|
| Notes to Financial Statements | | | 44 | | |
|
| Report of Independent Registered Public Accounting Firm | | | 55 | | |
|
| Additional Information (Unaudited) | | | 56 | | |
|
Go Paperless With Alger Electronic Delivery Service
Alger is pleased to provide you with the ability to access regulatory materials online. When documents such as prospectuses and annual and semi-annual reports are available, we'll send you an e-mail notification with a convenient link that will take you directly to the fund information on our website. To sign up for this free service, simply enroll at www.icsdelivery.com/alger.
Dear Shareholders, November 23, 2007
Roller coaster: it's an apt metaphor for the past fiscal year. With the sharp run-up in the stock market through June, followed by the near-meltdown of those parts of the financial sector exposed to housing and mortgages, there were times when the financial markets felt like a long weekend at Six Flags Great Adventure. Even investors with cast-iron stomachs were wondering: why did this happen? How long can it continue? And is there an upside?
Once again, perceptions were more dramatic than realities. For all the agita in the markets, the indices posted solid gains in the United States, not to mention throughout the world, and the day-to-day volatility was ultimately less than the sum of its parts. Economic growth chugged along and most companies showed decent if not downright good earnings growth — with the notable and glaring exception of the financial sector in the third quarter of 2007. In short, there was noise, drama and even smoke, but not much actual fire. Or back to the initial metaphor, the roller coaster ride was full of sharp turns, shrieks, and moments of fear and anticipation, but the car stayed on the tracks, the ride ended safely, and most people even made some progress along the way.
Black Friday Revisited
In the financial markets it was a year of milestones and anniversaries. Both the S&P 500 Indexi and the Dow Jones Industrial Averageii reached new heights during the year, with the Dow breaking 13,000 and then 14,000 twice. But October 19, 2007 was a more somber milestone: the 20th anniversary of Black Friday on Wall Street. In the days before, pundits didn't hesitate to predict a "curse" coming back to haunt the markets. (Sounds ridiculous, but a surprising number of articles had that exact headline the next morning.) Sure enough, the Dow tumbled by 247 points, but that was nothing compared to that one-day 508-point loss in 1987, especially in percentage terms. In today's market the Dow would have had to shed about 3,100 points in one day to be comparable to the cras h of '87.
Three times this past year U.S. markets fell sharply. On February 27, the Dow lost 314 points, with a total decline of 736 points from February 20 to March 5. The sell-off was triggered by rumors of a possible Chinese government squeeze on credit. Then, the Dow climbed a total of 1,910 points over the following four months to register a new record of 14,000 on July 19. Through the end of July, the markets were turbulent as the sub-prime mortgage debacle unfolded. From July 26 through August 6, the Dow roller coaster went up and down with dizzying speed, with some days showing losses as great as 268 points while others showed gains of up to 169 points. But the true second phase of the market sell-off happened during the headiest days of the credit crunch — from August 8 to August 16 — with the Dow experiencing a total loss of 812 points. That was followed by a September rally that recouped most of the lost ground.
The third sell-off period occurred during the final weeks of the fiscal year, and lasted from October 11 through November 12 — when the Dow shed a total of 1,167 points, as the sub-prime mess erupted into a full-blown credit crisis involving banks and financial institutions. Even the tech sector — one of the strongest performers for
-1-
the year — saw a steep pullback at the end of October. However, after each sell-off, the markets rebounded stronger than ever, and in some cases — as in the February drop — the markets moved into a long period of steady uphill climb.
To push our roller coaster metaphor even further – the number of extreme single day swings was even greater than the sell-off periods. In 2007, the Dow saw no less than eight days of single-day losses of more than 200 points (the largest being 314 points) and six days of gains of more than 169 points (with the largest being 319 points). Most telling, perhaps, is that on three separate days (August 16, 17, and November 8) the day's close showed little movement, yet during the day the Dow had swooned more than 442 points. On November 8, for example, the Dow fell 462 points before climbing back to a 64 point loss at day's end.
We believe the year's turbulence emphasizes a trend that has become more noticeable with each passing year: high-levels of short-term volatility and economic concerns unfolding against a backdrop of unusual global economic stability. The fact that so many people felt so unsettled even while the markets remained up for the year should tell us something about the disconnect between how people feel and what has actually been happening.
Global Growth and Earnings
Fifty years ago it was perfectly fair to say "as goes the U.S. economy, so go U.S. companies and their stocks." Today that no longer holds true. Earnings this year indicate that the trajectory of companies is different and more positive than that of countries and that the United States is no longer the sole guide to the health of U.S. firms. While U.S. GDP grew a paltry 0.6% in the first quarter of 2007, the companies of the S&P 500 Index registered nearly 8% growth. And, while economic data still matters, it is no longer a good idea to use the U.S. economy as an automatic proxy for how U.S. companies, or their stock prices, will perform.
The world economy has grown at a 4% annual pace for the past several years; according to BCA research, this has been the strongest expansion phase since 1960. And earnings for many companies — especially innovative growth companies — continue to benefit from very strong international growth, which has begun to "decouple" from dependence on the U.S. economy. One consumer company recently reported 2% growth in the U.S. market and 17% growth abroad with more than 50% growth in China alone. In fact, global equity markets have been on a tear and many U.S.-listed companies are benefiting from the same global growth trends. Especially for the larger companies of the S&P 500, the U.S. is simply one market, albeit a large and vital aspect of their global business model.
The weakness of the U.S. dollar is yet one more factor that has benefited U.S. companies doing business outside of the United States. Corporate profits have been boosted by a continuing weak dollar which inflates the reported dollar profits of U.S.-listed companies.
At the same time, global interest rates have compressed, with both short-term and long-term rates as well as corporate and government rates converging between 4% and 5%. One negative consequence of that compression is that many fixed-income managers have taken oversize risks in an attempt to generate above average returns, and the consequences of those risks has been nothing short of a debacle for many funds and for financial institutions exposed to housing and mortgage-backed securities.
-2-
The Sub-Prime Mortgage Mess
In August, the mortgage mess transmogrified into a global financial panic that seemed on the verge of draining not just excess liquidity out of the system but all liquidity. If that had happened — and there was some risk that it was about to — financial systems would have ground to a halt. Short-term liquidity in the form of commercial paper is to the financial system what water is to the body. Without it, all bets are — literally — off.
What threatened the financial system was that the leveraged exposure was substantially greater than the actual size of defaults or outstanding low-credit loans. Wall Street didn't simply "securitize" loans by slicing and dicing them. It buried them in packages of other loans and then bundled them with higher credit loans. When mortgage defaults began to rise on the lower end of the spectrum, many Wall Street institutions and hedge funds realized that they didn't really know which of these various loan derivatives were good and which were bad. The result was that trading in almost anything mortgage-related froze in the middle of July, creating a domino effect. Lenders and mortgage brokers tightened lending standards and banks demanded more collateral, not just for home loans, but for credit lines to hedge funds and private equity firms. Suddenly, getting a loan of any sort went from incredibly easy to astonishingly difficult.
That crisis was — at least temporarily — averted by the aggressive action of the Federal Reserve which cut the Fed funds rate by 50 basis points (one-half a percentage point) to 4.75% in mid-September. The rate cut was a welcome and perhaps essential step in preventing the mortgage mess from imperiling the financial system. Whether or not the rate cuts (the Fed cut an additional quarter point on the last day of this fiscal year, October 31) will have any lasting impact, or if they were merely a demonstration that the Fed could and would act if necessary, remains to be seen.
Our conclusion: it will continue to be a painful and dislocating period for real estate and for millions of people exposed to its descent. Low-end consumers, and many in the middle, will feel the pain. As adjustable-rate mortgages reset, there will be substantial numbers of foreclosures. Some Wall Street investment firms will lose money; many already have. But we do not believe that the global financial system is in jeopardy, nor do we think that the housing bust will severely dent corporate profits in those sectors of the economy not directly exposed to housing and mortgage-backed financial instruments. One unintended consequence is that stocks may ultimately benefit from the meltdown if investors find themselves turning to equities as a safe haven.
Portfolio Matters
Alger LargeCap Growth Institutional Fund
The Alger LargeCap Growth Institutional Fund returned 27.32% for the fiscal year ended October 31, 2007, compared with a return of 19.22% for the Russell 1000 Growth Indexiii.
Information Technology represented an average weight of 29.82%. The Fund was overweight compared to the benchmark, but outperformed in this sector. Strong performers included MEMC Electronic Materials, Inc., a global supplier of silicon wafers to the semiconductor industry, electronic game manufacturer Nintendo Co. Ltd., and Apple, Inc.
-3-
In the Consumer Discretionary sector, at an average weight of 12.08%, the Fund was underweight but outperformed the benchmark. XM Satellite Radio Holdings Inc., Las Vegas Sands Corp. and Hilton Hotels Corp. were the top performers in this sector.
The Fund was underweight and underperformed the benchmark in the Industrials sector, at an average weight of 11.70%. ITT Corp., a leading U.S. defense contractor and the world's largest supplier of equipment to move and treat water and wastewater, and General Dynamics Corp., a leading defense industry contractor, were solid performers in this sector.
At an average weight of 11.29% the Fund was underweight the benchmark in the Health Care sector and underperformed. Merck & Co. Inc., the international manufacturer and distributor of pharmaceuticals, Intuitive Surgical Inc., a leader in surgical robotics and Health Net Inc., one of the U.S.'s largest managed health care companies, were solid performers in this sector.
During the fiscal year, the Alger LargeCap Growth Institutional Fund saw underperformance in the Industrials sector from FedEx Corp. and United Airlines Corp. Underperformers in the Health Care sector included Amgen, Inc., a human therapeutics company in the biotechnology industry, and Medco Health Solutions, Inc., a leading pharmacy benefit manager.
Alger SmallCap Growth Institutional Fund
The Alger SmallCap Growth Institutional Fund gained 26.36% for the fiscal year ended October 31, 2007, compared to the Russell 2000 Growth Indexiv which returned 16.72%.
In the Information Technology sector, the Fund, at an average weight of 22.76%, was slightly underweight the benchmark, but outperformed. Top performers in this sector were Synchronoss Technologies, Inc., a provider of on-demand transaction management solutions, DealerTrack Holdings, Inc., a leading provider of on-demand software and data solutions for the automotive retail industry in the United States, and Omniture, Inc., a provider of online business optimization services.
At an average weight of 17.43%, the Fund was underweight but outperformed the benchmark in Health Care. Ventana Medical Systems, Inc., one of the world's leading developers and manufacturers of medical diagnostic instruments and technology was the prominent performer in this sector, followed by PAREXEL International Corp., a leading global bio/pharmaceutical services organization and Onyx Pharmaceuticals, Inc.
In the Consumer Discretionary sector, the Fund, at an average weight of 15.62% was marginally underweight the benchmark but outperformed. Top performers in this sector were Deckers Outdoor Corp., a manufacturer of function-oriented, high-performance outdoor footwear, the travel website Priceline.com, Inc., and Bally Technologies, Inc., a manufacturer of gaming machines and computerized monitoring systems for the gaming industry worldwide.
At an average weight of 13.55%, the Fund was underweight, but significantly outperformed the benchmark in the Industrials sector. Top performers in this sector were: BE Aerospace, Inc., the world's leading manufacturer of cabin interior products for commercial aircraft, FTI Consulting, Inc., a global business advisory firm that provides critical legal, financial and reputational advice and Bucyrus International, Inc., a world leader in the manufacture of draglines, drills and shovels for the surface mining industry.
-4-
Key detractors in the Fund during the fiscal year included Coldwater Creek, Inc., a women's apparel and accessories retailer, DSW, Inc., a footwear retailer, American Reprographics Co., the largest reprographics company in the United States, and McCormick & Schmick's Seafood Restaurants.
Alger MidCap Growth Institutional Fund
For the fiscal year ended October 31, 2007, the Alger MidCap Growth Institutional Fund gained 45.45%, compared to the Russell Midcap Growth Indexv with a return of 19.70%.
The Fund, at an average weight of 23.91%, had a significant exposure in Information Technology. This weighting was overweight the benchmark but outperformed. Nintendo Co. Ltd., was the strongest contributor in this sector, followed by Research in Motion Ltd., a leader in wireless communications, Apple, Inc., and MEMC Electronic Materials, Inc.
In the Consumer Discretionary sector, the Fund had an average weight of 20.10%, slightly underweight the benchmark but outperforming. The auction house Sotheby's, Focus Media Holding, Ltd., the largest outdoor TV advertising network in China, and the retail chain GameStop Corp., were the top performers in this sector.
At an average weight of 14.56%, the Fund was slightly overweight the benchmark in the Health Care sector, but underperformed. Notable contributors included Intuitive Surgical, Inc., and Onyx Pharmaceuticals. Medco Health Solutions, Inc. and Zimmer Holdings, Inc. were key detractors.
The Fund was underweight the benchmark, at an average weight of 11.95%, in the Industrials sector but outperformed. Strong contributors included McDermott International, Inc., a leading worldwide energy services company, BE Aerospace, Inc., and Armor Holdings, a manufacturer and provider of specialized security products.
During the fiscal year, the Fund saw outperformanced across most sectors, but did underperform in companies including Isilon Systems, Inc., a Seattle company that designs storage systems and software for digital content, and retailers Starbucks Corp., and Netflix, Inc.
Alger Capital Appreciation Institutional Fund
The Alger Capital Appreciation Institutional Fund gained 41.31% for the fiscal year ended October 31, 2007, outperforming the Russell 3000 Growth Indexvi return of 18.99%.
Information Technology represented an average weight of 32.27% of the Fund's holdings, and outperformed the benchmark with strong contributions from: MEMC Electronic Materials, Inc., ON Semiconductor Corp., a provider of semiconductor components, Apple Inc. and DealerTrack Holdings, Inc.
In the Health Care sector, the Fund, at an average weight of 13.49%, was underweight compared to the benchmark but outperformed. The top performers were Intuitive Surgical, Inc., Hologic, Inc., a developer and manufacturer of proprietary x-ray systems and Onyx Pharmaceuticals Inc.
At an average weight of 10.92%, the Fund was underweight the benchmark in the Consumer Discretionary sector but outperformed. Focus Media Holding, Ltd. was a top performer as was Bally Technologies, Inc., and Hilton Hotels Corp.
In the Industrial sector, the Fund at an average weight of 8.94% was underweight the benchmark but outperformed. Top performers in this sector were: Armor
-5-
Holdings, JA Solar Holdings Inc., a manufacturer or high-performance solar cells and McDermott International Inc.
While the Fund outperformed overall there were detractors across sectors, including the diet plan provider, NutriSystems, Inc., retailer Urban Outfitters, Inc., Rambus, Inc., a provider of high-speed interface technology, Trident Microsystems, Inc., a supplier of processors for flat panel displays, Amgen, Inc., Sepracor, Inc., and Sunoco, Inc.
In Summary
Wall Street tends to react to sudden changes in the status quo with apocalyptic rhetoric. Though we don't take the psychology of the markets lightly, proprietary indicators that we have used for many decades suggest that while these roller coaster movements may continue, the fundamental picture for many growth companies remains positive.
The early fall pullback was steep, with the S&P losing about 10%, but it is still in the realm of normal given recent trends. There have been much steeper corrections in emerging markets over the past three years, followed by equally steep recoveries and subsequent gains. In each of those previous sell-offs, there was no dearth of commentary that some structural weakness in the markets was being exposed yet predictions of doom and gloom proved either premature or simply wrong.
With continued global expansion, the unwinding of the mortgage mess and what likely will be a hectic and turbulent U.S. election season, 2008 looks to be unsettled in the equity markets. Swoons which came fast and furious in 2007 may happen even faster and be even more furious.
But the fundamentals of the economy, of companies in general, and of the domestic and global equity markets, do not seem to us either weak or overvalued. As bottom-up stock pickers, we believe these market sell-offs offer excellent opportunities to add or increase positions in growth companies whose opportunities are, in fact, just beginning.
Respectfully submitted,
 | |  | |
|
| Daniel C. Chung | | Zachary Karabell | |
|
| Chief Investment Officer | | Chief Economist | |
|
i Standard & Poor's 500 Index is an index of the 500 largest companies in the United States.
ii The Dow Jones Industrial Average is an index of common stocks comprised of major industrial companies and assumes reinvestment of dividends. It is frequently used as a general measure of stock market performance.
iii The Russell 1000 Growth Index is an unmanaged index designed to measure the performance of the largest 1000 companies in the Russell 3000 Index with higher price-to-book ratios and higher forecasted growth values. The Russell 3000 Index measures the performance of the 3000 largest U.S. companies based on the total market capitalization, which represents 98% of the U.S. Equity Market.
-6-
iv The Russell 2000 Growth Index is an unmanaged index designed to measure the performance of the 2000 smallest companies in the Russell 3000 Index with higher price-to-book ratios and higher forecasted growth values.
v The Russell Midcap Growth Index is an unmanaged index designed to measure the performance of the 800 smallest companies in the Russell 1000 Index with higher price-to-book ratios and higher forecasted growth values.
vi The Russell 3000 Growth Index is an unmanaged index designed to measure the performance of those Russell 3000 Index companies with higher price-to-book ratios and higher forecasted growth values.
Investors cannot invest directly in an index. Index performance does not reflect the deduction for fees, expenses or taxes.
This report and the financial statements contained herein are submitted for the general information of shareholders of the Fund. This report is not authorized for distribution to prospective investors in the Funds unless proceeded or accompanied by an effective prospectus for the Funds. Funds returns represent the fiscal 12 month period return of Class I shares. The performance data quoted represents past performance, which is not an indication or guarantee of future results. Standardized performance results can be found on the following page. The investment return and principal value of an investment in a fund will fluctuate so that an investor's shares when redeemed may be worth more or less than their original cost. Current performance may be lower or higher than the performance quoted. Fo r performance data current to the most recent month-end, visit us at www.alger.com, or call us at (800) 992-3863.
The views and opinions of the Funds' management in this report are as of the date of the Shareholders letter and are subject to change at any time subsequent to this date. There is no guarantee that any of the assumptions that formed the basis for the opinions stated herein are accurate or that they will materialize. Moreover, the information forming the basis for such assumptions is from sources believed to be reliable; however, there is no guarantee that such information is accurate. Any securities mentioned should be considered in the context of the construction of an overall portfolio of securities and therefore reference to them should not be construed as a recommendation or offer to purchase or sell any such security. Inclusion of such securities in a fund and transactions in such securities may be for a variety of reasons, including without limitation, in response to cash flows, inclusion in a benchmark and risk control. Please refer to the Schedules of Investments for each fund which is included in this report for a complete list of fund holdings as of October 31, 2007. Securities mentioned in the Shareholders letter, if not found in the Schedule of Investments, were held by the Fund during the Fund's fiscal year.
A Word About Risk
Growth stocks tend to be more volatile than other stocks as the price of growth stocks tends to be higher in relation to their companies' earnings and may be more sensitive to market, political and economic developments. Investing in the stock market involves gains and losses and may not be suitable for all investors. Stocks of small- and mid-sized companies are subject to greater risk than stocks of larger, more established companies owing to such factors as limited liquidity, inexperienced management, and limited financial resources. Funds that participate in leveraging, such as the Capital Appreciation Institutional Fund, are subject to the risk that borrowing money to leverage will exceed the returns for securities purchased or that the securities purchased may actually go down in value; thus, the Funds' net asset value
-7-
can decrease more quickly than if the Funds had not borrowed. For a more detailed discussion of the risks associated with a Funds, please see the Funds' Prospectus.
Before investing, carefully consider a fund's investment objective, risks, charges, and expenses. For a prospectus containing this and other information about The Alger Institutional Funds call us at (800) 992-3863 or visit us at www.alger.com. Read it carefully before investing. Fred Alger & Company, Incorporated, Distributor. Member NYSE, SIPC.
NOT FDIC INSURED. NOT BANK GUARANTEED. MAY LOSE VALUE.
-8-
ALGER LARGECAP GROWTH INSTITUTIONAL FUND
Fund Highlights Through October 31, 2007 (Unaudited)
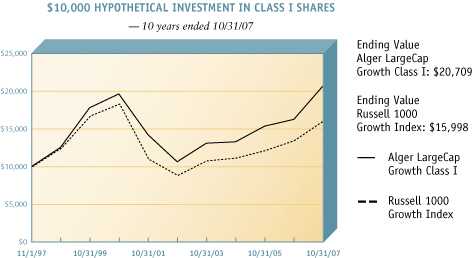
The chart above illustrates the growth in value of a hypothetical $10,000 investment made in the Alger LargeCap Growth Institutional Class I shares and the Russell 1000 Growth Index (an unmanaged index of common stocks) for the ten years ended October 31, 2007. The figures for the Alger LargeCap Growth Institutional Class I shares and the Russell 1000 Growth Index include reinvestment of dividends. Performance for the Alger LargeCap Growth Institutional Class R shares may vary from the results shown above due to differences in expenses the class bears.
PERFORMANCE COMPARISON
AVERAGE ANNUAL TOTAL RETURNS
| | | 1
YEAR | | 5
YEARS | | 10
YEARS | | SINCE
INCEPTION | |
| As of 10/31/07 | |
| Class I (Inception 11/8/93) | | | 27.32 | % | | | 14.23 | % | | | 7.55 | % | | | 10.63 | % | |
| Russell 1000 Growth Index | | | 19.22 | % | | | 12.61 | % | | | 4.81 | % | | | 9.31 | % | |
| Class R (Inception 1/27/03) | | | 26.69 | % | | | N/A | | | | N/A | | | | 16.08 | % | |
| Russell 1000 Growth Index | | | 19.22 | % | | | N/A | | | | N/A | | | | 14.23 | % | |
| As of 9/30/07 | |
| Class I | | | 26.58 | % | | | 14.66 | % | | | 6.57 | % | | | 10.40 | % | |
| Russell 1000 Growth Index | | | 19.36 | % | | | 13.84 | % | | | 4.07 | % | | | 9.11 | % | |
| Class R | | | 25.87 | % | | | N/A | | | | N/A | | | | 15.46 | % | |
| Russell 1000 Growth Index | | | 19.36 | % | | | N/A | | | | N/A | | | | 13.69 | % | |
The performance data quoted represents past performance, which is not an indication or a guarantee of future results. The Fund's average annual total returns include changes in share price and reinvestment of dividends and capital gains. The graph and table above do not reflect the deduction of taxes that a shareholder would have paid on fund distributions or on the redemption of fund shares. Investment return and principal will fluctuate and the Fund's shares, when redeemed, may be worth more or less than their original cost. Current performance may be higher or lower than the performance quoted. For performance current to the most recent month end, visit us at www.alger.com or call us at (800) 992-3863.
-9-
ALGER SMALLCAP GROWTH INSTITUTIONAL FUND
Fund Highlights Through October 31, 2007 (Unaudited)
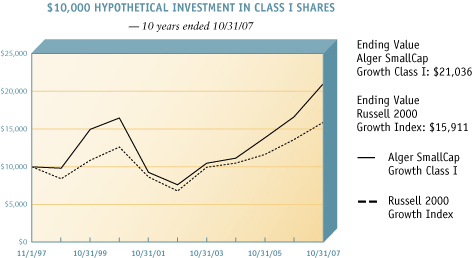
The chart above illustrates the growth in value of a hypothetical $10,000 investment made in the Alger SmallCap Growth Institutional Class I shares and the Russell 2000 Growth Index (an unmanaged index of common stocks) for the ten years ended October 31, 2007. The figures for the Alger SmallCap Growth Institutional Class I shares and the Russell 2000 Growth Index include reinvestment of dividends. Performance for the Alger SmallCap Growth Institutional Class R shares may vary from the results shown above due to differences in expenses the class bears.
PERFORMANCE COMPARISON
AVERAGE ANNUAL TOTAL RETURNS
| | | 1
YEAR | | 5
YEARS | | 10
YEARS | | SINCE
INCEPTION | |
| As of 10/31/07 | |
| Class I (Inception 11/8/93) | | | 26.36 | % | | | 22.53 | % | | | 7.72 | % | | | 12.07 | % | |
| Russell 2000 Growth Index | | | 16.72 | % | | | 18.57 | % | | | 4.75 | % | | | 7.18 | % | |
| Class R (Inception 1/27/03) | | | 25.70 | % | | | N/A | | | | N/A | | | | 23.80 | % | |
| Russell 2000 Growth Index | | | 16.72 | % | | | N/A | | | | N/A | | | | 19.59 | % | |
| As of 9/30/07 | |
| Class I | | | 27.17 | % | | | 22.30 | % | | | 6.22 | % | | | 11.64 | % | |
| Russell 2000 Growth Index | | | 18.93 | % | | | 18.70 | % | | | 3.65 | % | | | 6.88 | % | |
| Class R | | | 26.52 | % | | | N/A | | | | N/A | | | | 22.64 | % | |
| Russell 2000 Growth Index | | | 18.93 | % | | | N/A | | | | N/A | | | | 18.86 | % | |
The performance data quoted represents past performance, which is not an indication or a guarantee of future results. The Fund's average annual total returns include changes in share price and reinvestment of dividends and capital gains. The graph and table above do not reflect the deduction of taxes that a shareholder would have paid on fund distributions or on the redemption of fund shares. Investment return and principal will fluctuate and the Fund's shares, when redeemed, may be worth more or less than their original cost. Current performance may be higher or lower than the performance quoted. For performance current to the most recent month end, visit us at www.alger.com or call us at (800) 992-3863.
-10-
ALGER MIDCAP GROWTH INSTITUTIONAL FUND
Fund Highlights Through October 31, 2007 (Unaudited)
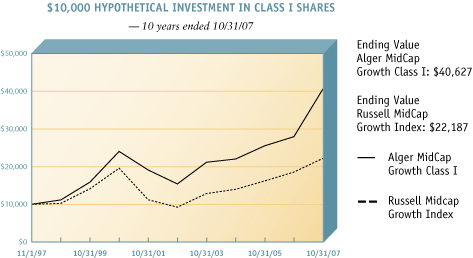
The chart above illustrates the growth in value of a hypothetical $10,000 investment made in the Alger MidCap Growth Institutional Class I shares and the Russell Midcap Growth Index (an unmanaged index of common stocks) for the ten years ended October 31, 2007. Figures for the Alger MidCap Growth Institutional Class I shares and the Russell Midcap Growth Index include reinvestment of dividends. Performance for the Alger MidCap Growth Institutional Class R shares may vary from the results shown above due to differences in expenses the class bears.
PERFORMANCE COMPARISON
AVERAGE ANNUAL TOTAL RETURNS
| | | 1
YEAR | | 5
YEARS | | 10
YEARS | | SINCE
INCEPTION | |
| As of 10/31/07 | |
| Class I (Inception 11/8/93) | | | 45.45 | % | | | 21.42 | % | | | 15.05 | % | | | 17.88 | % | |
| Russell Midcap Growth Index | | | 19.70 | % | | | 19.21 | % | | | 8.30 | % | | | 10.76 | % | |
| Class R (Inception 1/27/03) | | | 44.70 | % | | | N/A | | | | N/A | | | | 23.26 | % | |
| Russell Midcap Growth Index | | | 19.70 | % | | | N/A | | | | N/A | | | | 20.14 | % | |
| As of 9/30/07 | |
| Class I | | | 43.96 | % | | | 21.40 | % | | | 13.86 | % | | | 17.53 | % | |
| Russell MidCap Growth Index | | | 21.22 | % | | | 20.40 | % | | | 7.47 | % | | | 10.63 | % | |
| Class R | | | 43.24 | % | | | N/A | | | | N/A | | | | 22.27 | % | |
| Russell MidCap Growth Index | | | 21.22 | % | | | N/A | | | | N/A | | | | 19.89 | % | |
The performance data quoted represents past performance, which is not an indication or a guarantee of future results. The Fund's average annual total returns include changes in share price and reinvestment of dividends and capital gains. The graph and table above do not reflect the deduction of taxes that a shareholder would have paid on fund distributions or on the redemption of fund shares. Investment return and principal will fluctuate and the Fund's shares, when redeemed, may be worth more or less than their original cost. Current performance may be higher or lower than the performance quoted. For performance current to the most recent month end, visit us at www.alger.com or call us at (800) 992-3863.
-11-
ALGER CAPITAL APPRECIATION INSTITUTIONAL FUND
Fund Highlights Through October 31, 2007 (Unaudited)
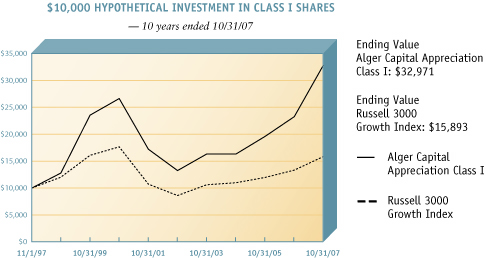
The chart above illustrates the growth in value of a hypothetical $10,000 investment made in the Alger Capital Appreciation Institutional Class I shares and the Russell 3000 Growth Index (an unmanaged index of common stocks) for the ten years ended October 31, 2007. Figures for the Alger Capital Appreciation Institutional Class I shares and the Russell 3000 Growth Index include reinvestment of dividends. Performance for the Alger Capital Appreciation Institutional Class R shares may vary from the results shown above due to differences in expenses the class bears.
PERFORMANCE COMPARISON
AVERAGE ANNUAL TOTAL RETURNS
| | | 1
YEAR | | 5
YEARS | | 10
YEARS | | SINCE
INCEPTION | |
| As of 10/31/07 | |
| Class I shares (Inception 11/8/93) | | | 41.31 | % | | | 19.95 | % | | | 12.67 | % | | | 14.77 | % | |
| Russell 3000 Growth Index | | | 18.99 | % | | | 13.02 | % | | | 4.74 | % | | | 9.07 | % | |
| Class R shares (Inception 1/27/03) | | | 40.59 | % | | | N/A | | | | N/A | | | | 22.22 | % | |
| Russell 3000 Growth Index | | | 18.99 | % | | | N/A | | | | N/A | | | | 14.61 | % | |
| As of 9/30/07 | |
| Class I shares | | | 38.75 | % | | | 19.20 | % | | | 11.23 | % | | | 14.35 | % | |
| Russell 3000 Growth Index | | | 19.30 | % | | | 14.18 | % | | | 3.96 | % | | | 8.86 | % | |
| Class R shares | | | 38.04 | % | | | N/A | | | | N/A | | | | 21.04 | % | |
| Russell 3000 Growth Index | | | 19.30 | % | | | N/A | | | | N/A | | | | 14.05 | % | |
The performance data quoted represents past performance, which is not an indication or a guarantee of future results. The Fund's average annual total returns include changes in share price and reinvestment of dividends and capital gains. The graph and table above do not reflect the deduction of taxes that a shareholder would have paid on fund distributions or on the redemption of fund shares. Investment return and principal will fluctuate and the Fund's shares, when redeemed, may be worth more or less than their original cost. Current performance may be higher or lower than the performance quoted. For performance current to the most recent month end, visit us at www.alger.com or call us at (800) 992-3863.
-12-
PORTFOLIO SUMMARY*
October 31, 2007 (Unaudited)
| SECTORS | | LARGECAP
GROWTH
INSTITUTIONAL
FUND | | SMALLCAP
GROWTH
INSTITUTIONAL
FUND | | MIDCAP
GROWTH
INSTITUTIONAL
FUND | | CAPITAL
APPRECIATION
INSTITUTIONAL
FUND | |
| Consumer Discretionary | | | 7.2 | % | | | 13.2 | % | | | 16.7 | % | | | 13.1 | % | |
| Consumer Staples | | | 8.7 | | | | 1.4 | | | | 1.5 | | | | 5.6 | | |
| Energy | | | 8.1 | | | | 8.8 | | | | 10.3 | | | | 7.1 | | |
| Financials | | | 8.1 | | | | 7.8 | | | | 10.9 | | | | 10.1 | | |
| Health Care | | | 16.1 | | | | 17.1 | | | | 14.3 | | | | 10.7 | | |
| Industrials | | | 10.4 | | | | 14.0 | | | | 11.5 | | | | 12.4 | | |
| Information Technology | | | 31.7 | | | | 26.4 | | | | 25.6 | | | | 32.9 | | |
| Materials | | | 3.1 | | | | 3.3 | | | | 2.7 | | | | 3.8 | | |
| Telecommunication Services | | | 0.9 | | | | 2.6 | | | | 2.8 | | | | 2.2 | | |
| Utilities | | | 1.0 | | | | 1.4 | | | | 1.3 | | | | 0.0 | | |
| Cash and Net Other Assets | | | 4.7 | | | | 4.0 | | | | 2.4 | | | | 2.1 | | |
| | | | 100.0 | % | | | 100.0 | % | | | 100.0 | % | | | 100.0 | % | |
* Based on net assets for each Fund.
-13-
THE ALGER INSTITUTIONAL FUNDS | ALGER LARGECAP GROWTH INSTITUTIONAL FUND
Schedule of Investments October 31, 2007
| COMMON STOCKS—95.3% | | SHARES | | VALUE | |
| AEROSPACE & DEFENSE—3.6% | |
| Boeing Company | | | 5,900 | | | $ | 581,681 | | |
| General Dynamics Corporation | | | 17,550 | | | | 1,596,348 | | |
| | | | 2,178,029 | | |
| AUTO EQUIPMENT & SERVICE—1.0% | |
| Cummins Inc. | | | 4,950 | | | | 593,802 | | |
| BEVERAGES—1.8% | |
| PepsiCo, Inc. | | | 14,650 | | | | 1,079,998 | | |
| BIOTECHNOLOGY—1.5% | |
| Celgene Corporation* | | | 5,350 | | | | 353,100 | | |
| Genentech, Inc.* | | | 7,550 | | | | 559,681 | | |
| | | | 912,781 | | |
| CHEMICALS—.7% | |
| Monsanto Company | | | 4,500 | | | | 439,335 | | |
| COMMUNICATION EQUIPMENT—5.2% | |
| Cisco Systems, Inc.* | | | 44,350 | | | | 1,466,211 | | |
| QUALCOMM Inc. | | | 17,550 | | | | 749,912 | | |
| Research In Motion Limited* | | | 7,650 | | | | 952,502 | | |
| | | | 3,168,625 | | |
| COMPUTERS & PERIPHERALS—6.6% | |
| Apple Computer, Inc.* | | | 10,300 | | | | 1,956,485 | | |
| Dell Inc.* | | | 28,600 | | | | 875,160 | | |
| Hewlett-Packard Company | | | 10,000 | | | | 516,800 | | |
| Memc Electronic Materials, Inc.* | | | 9,500 | | | | 695,590 | | |
| | | | 4,044,035 | | |
| COMPUTER SERVICES—.6% | |
| Akamai Technologies, Inc.* | | | 9,150 | | | | 358,588 | | |
| COMPUTER TECHNOLOGY—1.5% | |
| NAVTEQ* | | | 12,050 | | | | 930,260 | | |
| CONGLOMERATE—1.5% | |
| ITT Corporation | | | 13,850 | | | | 926,842 | | |
| DIVERSIFIED FINANCIAL SERVICES—1.2% | |
| Citigroup Inc. | | | 12,200 | | | | 511,180 | | |
| NYSE Euronext Inc. | | | 2,450 | | | | 229,982 | | |
| | | | 741,162 | | |
| ELECTRONICS—1.4% | |
| Nintendo Co., Ltd. ADR# | | | 10,850 | | | | 845,855 | | |
| ENERGY—.8% | |
| First Solar, Inc.* | | | 3,050 | | | | 484,370 | | |
| ENERGY EQUIPMENT & SERVICES—5.0% | |
| Cameron International Corp.* | | | 5,850 | | | | 569,556 | | |
| National-Oilwell Varco Inc.* | | | 10,450 | | | | 765,358 | | |
| Schlumberger Limited | | | 8,350 | | | | 806,360 | | |
| Transocean Inc.* | | | 7,500 | | | | 895,275 | | |
| | | | 3,036,549 | | |
-14-
THE ALGER INSTITUTIONAL FUNDS | ALGER LARGECAP GROWTH INSTITUTIONAL FUND
Schedule of Investments (Continued) October 31, 2007
| COMMON STOCKS—(CONT.) | | SHARES | | VALUE | |
| FINANCE—.8% | |
| IntercontinentalExchange Inc.* | | | 2,700 | | | $ | 481,140 | | |
| FINANCIAL SERVICES—5.2% | |
| Alibaba.com Corporation* | | | 30,400 | | | | 52,949 | | |
| AllianceBernstein Holding LP | | | 3,550 | | | | 303,276 | | |
| Bovespa Holding SA* | | | 8,050 | | | | 152,467 | | |
| CME Group Inc. | | | 1,250 | | | | 832,812 | | |
| Nymex Holdings Inc. | | | 9,250 | | | | 1,188,810 | | |
| UBS AG | | | 11,350 | | | | 609,382 | | |
| | | | 3,139,696 | | |
| FOOD & STAPLES RETAILING—2.7% | |
| Walgreen Co. | | | 29,450 | | | | 1,167,693 | | |
| Whole Foods Market, Inc. | | | 9,155 | | | | 453,539 | | |
| | | | 1,621,232 | | |
| HEALTH CARE EQUIPMENT & SUPPLIES—5.0% | |
| Beckman Coulter, Inc. | | | 5,050 | | | | 357,641 | | |
| Hologic, Inc.* | | | 11,450 | | | | 777,798 | | |
| Intuitive Surgical, Inc.* | | | 1,300 | | | | 424,931 | | |
| St. Jude Medical, Inc.* | | | 16,700 | | | | 680,191 | | |
| Zimmer Holdings, Inc.* | | | 11,200 | | | | 778,288 | | |
| | | | 3,018,849 | | |
| HEALTH CARE PROVIDERS & SERVICES—2.2% | |
| Health Net Inc.* | | | 8,850 | | | | 474,448 | | |
| Quest Diagnostics Incorporated | | | 8,200 | | | | 436,076 | | |
| UnitedHealth Group Incorporated | | | 8,350 | | | | 410,403 | | |
| | | | 1,320,927 | | |
| HOTELS, RESTAURANTS & LEISURE—2.8% | |
| Accor SA | | | 6,250 | | | | 595,613 | | |
| MGM MIRAGE* | | | 4,800 | | | | 439,728 | | |
| Starbucks Corporation* | | | 24,950 | | | | 665,666 | | |
| | | | 1,701,007 | | |
| HOUSEHOLD DURABLES—.7% | |
| Garmin Ltd. | | | 1,000 | | | | 107,400 | | |
| Harman International Industries, Incorporated | | | 3,550 | | | | 298,910 | | |
| | | | 406,310 | | |
| HOUSEHOLD PRODUCTS—2.1% | |
| Procter & Gamble Company | | | 18,650 | | | | 1,296,548 | | |
| INDUSTRIAL CONGLOMERATES—2.8% | |
| 3M Co. | | | 6,700 | | | | 578,612 | | |
| General Electric Company | | | 27,000 | | | | 1,111,320 | | |
| | | | 1,689,932 | | |
| INFORMATION TECHNOLOGY SERVICES—.8% | |
| Cognizant Technology Solutions Corporation Cl. A* | | | 11,450 | | | | 474,717 | | |
-15-
THE ALGER INSTITUTIONAL FUNDS | ALGER LARGECAP GROWTH INSTITUTIONAL FUND
Schedule of Investments (Continued) October 31, 2007
| COMMON STOCKS—(CONT.) | | SHARES | | VALUE | |
| INSURANCE—1.0% | |
| American International Group, Inc. | | | 9,450 | | | $ | 596,484 | | |
| INTERNET & CATALOG RETAIL—2.0% | |
| eBay Inc.* | | | 34,450 | | | | 1,243,645 | | |
| INTERNET SOFTWARE & SERVICES—4.5% | |
| Google Inc. Cl. A* | | | 2,350 | | | | 1,661,450 | | |
| Yahoo! Inc. * | | | 34,750 | | | | 1,080,725 | | |
| | | | 2,742,175 | | |
| MACHINERY—.7% | |
| Terex Corporation* | | | 6,050 | | | | 449,031 | | |
| MEDIA—1.4% | |
| Comcast Corporation Special Cl. A* | | | 15,700 | | | | 327,659 | | |
| Focus Media Holding Limited ADR*# | | | 8,650 | | | | 536,300 | | |
| | | | 863,959 | | |
| MEDICAL PRODUCTS—.9% | |
| Covidien Limited* | | | 13,600 | | | | 565,760 | | |
| METALS—1.8% | |
| Titanium Metals Corporation* | | | 15,500 | | | | 545,600 | | |
| Uranium One, Inc.* | | | 49,300 | | | | 544,489 | | |
| | | | 1,090,089 | | |
| METALS & MINING—2.4% | |
| Freeport-McMoRan Copper & Gold, Inc. Cl. B | | | 7,602 | | | | 894,603 | | |
| Peabody Energy Corporation | | | 10,450 | | | | 582,588 | | |
| | | | 1,477,191 | | |
| MULTILINE RETAIL—1.6% | |
| Kohl's Corporation* | | | 4,750 | | | | 261,108 | | |
| Macy's Inc. | | | 11,700 | | | | 374,751 | | |
| Penny, (JC) Co. Inc. | | | 5,850 | | | | 329,004 | | |
| | | | 964,863 | | |
| OIL & GAS—1.3% | |
| Exxon Mobil Corporation | | | 8,650 | | | | 795,713 | | |
| PHARMACEUTICALS—6.5% | |
| Abbott Laboratories | | | 16,300 | | | | 890,306 | | |
| Allergan, Inc. | | | 8,900 | | | | 601,462 | | |
| Merck & Co. Inc. | | | 14,500 | | | | 844,770 | | |
| Johnson & Johnson | | | 16,000 | | | | 1,042,720 | | |
| Schering-Plough Corporation | | | 19,700 | | | | 601,244 | | |
| | | | 3,980,502 | | |
| SEMICONDUCTORS & SEMICONDUCTOR EQUIPMENT—3.6% | |
| Intel Corporation | | | 35,850 | | | | 964,365 | | |
| Lam Research Corporation* | | | 9,300 | | | | 466,860 | | |
| Maxim Integrated Products, Inc. | | | 16,800 | | | | 455,280 | | |
| NVIDIA Corporation* | | | 9,325 | | | | 329,919 | | |
| | | | 2,216,424 | | |
-16-
THE ALGER INSTITUTIONAL FUNDS | ALGER LARGECAP GROWTH INSTITUTIONAL FUND
Schedule of Investments (Continued) October 31, 2007
| COMMON STOCKS—(CONT.) | | SHARES | | VALUE | |
| SOFTWARE—5.3% | |
| Adobe Systems Incorporated* | | | 8,700 | | | $ | 416,730 | | |
| Microsoft Corporation | | | 54,900 | | | | 2,020,869 | | |
| TomTom NV* | | | 9,850 | | | | 784,637 | | |
| | | | 3,222,236 | | |
| SPECIALTY RETAIL—.8% | |
| Urban Outfitters, Inc.* | | | 18,854 | | | | 476,441 | | |
| TOBACCO—2.1% | |
| Altria Group, Inc. | | | 17,750 | | | | 1,294,507 | | |
| UTILITIES—1.0% | |
| Veolia Environnement ADR# | | | 7,100 | | | | 637,083 | | |
| WIRELESS TELECOMMUNICATION SERVICES—.9% | |
| NII Holdings Inc. Cl. B* | | | 9,250 | | | | 536,500 | | |
TOTAL COMMON STOCKS
(Cost $49,778,046) | | | | | | | 58,043,192 | | |
| SHORT-TERM INVESTMENTS—6.0% | | PRINCIPAL
AMOUNT | | | |
| U.S. AGENCY OBLIGATIONS | |
Federal Home Loan Banks, 4.25%, 11/1/07
(Cost $3,646,000) | | $ | 3,646,000 | | | | 3,646,000 | | |
Total Investments
(Cost $53,424,046)(a) | | | 101.3 | % | | | 61,689,192 | | |
| Liabilities in Excess of Other Assets | | | (1.3 | ) | | | (815,429 | ) | |
| NET ASSETS | | | 100.0 | % | | $ | 60,873,763 | | |
* Non-income producing security.
# American Depositary Receipts.
(a) At October 31, 2007, the net unrealized appreciation of investments, based on cost for federal income tax purposes of $53,502,840 amounted to $8,186,352 which consisted of aggregate gross unrealized appreciation of $9,492,013 and aggregate gross unrealized depreciation of $1,305,661.
See Notes to Financial Statements.
-17-
THE ALGER INSTITUTIONAL FUNDS | ALGER SMALLCAP GROWTH INSTITUTIONAL FUND
Schedule of Investments October 31, 2007
| COMMON STOCKS—96.0% | | SHARES | | VALUE | |
| AEROSPACE & DEFENSE—3.3% | |
| BE Aerospace, Inc.* | | | 260,355 | | | $ | 12,942,247 | | |
| Esterline Technologies Corporation* | | | 205,125 | | | | 11,236,747 | | |
| SI International Inc.* | | | 248,780 | | | | 7,018,084 | | |
| | | | 31,197,078 | | |
| AIRLINES—.7% | |
| AirTran Holdings, Inc.* | | | 631,840 | | | | 6,577,454 | | |
| AUTO COMPONENTS—1.2% | |
| LKQ Corporation* | | | 293,570 | | | | 11,320,059 | | |
| AUTO EQUIPMENT & SERVICE—.9% | |
| Tenneco Inc.* | | | 290,905 | | | | 8,904,602 | | |
| BIOTECHNOLOGY—3.9% | |
| BioMarin Pharmaceutical Inc.* | | | 209,700 | | | | 5,814,981 | | |
| InterMune, Inc.* | | | 221,855 | | | | 4,419,352 | | |
| Neurocrine Biosciences, Inc.* | | | 429,000 | | | | 3,968,250 | | |
| Onyx Pharmaceuticals, Inc.* | | | 190,900 | | | | 8,916,939 | | |
| Progenics Pharmaceuticals, Inc.* | | | 296,850 | | | | 6,875,046 | | |
| Regeneron Pharmaceuticals, Inc.* | | | 278,390 | | | | 6,124,580 | | |
| Theravance, Inc.* | | | 28,700 | | | | 718,074 | | |
| | | | 36,837,222 | | |
| BUSINESS SERVICES—.8% | |
| TeleTech Holdings Inc.* | | | 295,250 | | | | 7,360,583 | | |
| CASINOS & RESORTS—1.3% | |
| Bally Technologies Inc.* | | | 303,600 | | | | 12,244,188 | | |
| CAPITAL MARKETS—1.2% | |
| Greenhill & Co., Inc. | | | 149,860 | | | | 11,086,643 | | |
| CHEMICALS—1.0% | |
| Zoltek Companies, Inc.* | | | 203,280 | | | | 8,995,140 | | |
| COMMERCIAL BANKS—2.9% | |
| Boston Private Financial Holdings, Inc. | | | 287,805 | | | | 8,277,272 | | |
| First Midwest Bancorp., Inc. | | | 196,350 | | | | 6,613,068 | | |
| Signature Bank* | | | 251,110 | | | | 8,575,407 | | |
| Wintrust Financial Corporation | | | 108,040 | | | | 3,969,390 | | |
| | | | 27,435,137 | | |
| COMMERCIAL SERVICES & SUPPLIES—1.3% | |
| FTI Consulting, Inc.* | | | 218,510 | | | | 11,865,093 | | |
| COMMUNICATION EQUIPMENT—4.1% | |
| Foundry Networks, Inc.* | | | 375,350 | | | | 7,934,899 | | |
| NICE Systems Ltd. ADR*# | | | 291,100 | | | | 11,478,073 | | |
| Polycom, Inc.* | | | 376,255 | | | | 10,527,615 | | |
| Sonus Networks, Inc.* | | | 1,238,485 | | | | 8,545,547 | | |
| | | | 38,486,134 | | |
-18-
THE ALGER INSTITUTIONAL FUNDS | ALGER SMALLCAP GROWTH INSTITUTIONAL FUND
Schedule of Investments (Continued) October 31, 2007
| COMMON STOCKS—(CONT.) | | SHARES | | VALUE | |
| COMMUNICATION TECHNOLOGY—1.5% | |
| Novatel Wireless, Inc.* | | | 372,600 | | | $ | 9,687,600 | | |
| Time Warner Telecom Inc. Cl. A* | | | 194,450 | | | | 4,519,018 | | |
| | | | 14,206,618 | | |
| COMPUTER SERVICES—4.0% | |
| ANSYS, Inc.* | | | 315,150 | | | | 12,230,971 | | |
| Digital River, Inc.* | | | 133,650 | | | | 7,091,469 | | |
| GSI Commerce, Inc.* | | | 407,350 | | | | 11,605,401 | | |
| Internap Network Services Corporation* | | | 380,205 | | | | 6,334,215 | | |
| | | | 37,262,056 | | |
| COMPUTERS & PERIPHERALS—1.2% | |
| Synaptics Incorporated* | | | 215,150 | | | | 11,693,403 | | |
| COMPUTER TECHNOLOGY—1.0% | |
| Atheros Communications* | | | 259,485 | | | | 9,107,923 | | |
| CONSTRUCTION & ENGINEERING—1.2% | |
| URS Corporation* | | | 190,755 | | | | 11,790,567 | | |
| CONTAINERS & PACKAGING—.9% | |
| Clarcor Inc. | | | 236,150 | | | | 8,610,029 | | |
| CORRECTIONAL FACILITIES—1.2% | |
| The Geo Group Inc.* | | | 363,950 | | | | 11,511,738 | | |
| DRUGS & PHARMACEUTICALS—.8% | |
| United Therapeutics Corporation* | | | 113,865 | | | | 7,792,921 | | |
| ELECTRIC SERVICES—1.4% | |
| ITC Holdings Corporation | | | 227,160 | | | | 13,002,638 | | |
| ELECTRONICS: SEMI-CONDUCTORS/COMPONENTS—1.0% | |
| Mellanox Technologies Ltd.* | | | 403,400 | | | | 9,524,274 | | |
| ENERGY—.7% | |
| JA Solar Holdings Co. Ltd. ADR*# | | | 118,350 | | | | 6,816,960 | | |
| ENERGY EQUIPMENT & SERVICES—3.2% | |
| Dril-Quip Inc.* | | | 176,720 | | | | 9,424,478 | | |
| Horizon Offshore, Inc.* | | | 408,855 | | | | 6,582,566 | | |
| North American Energy Partner* | | | 425,450 | | | | 7,896,352 | | |
| T-3 Energy Services, Inc.* | | | 132,450 | | | | 6,294,024 | | |
| | | | 30,197,420 | | |
| ENGINEERING—1.0% | |
| Aecom Technology Corp.* | | | 278,400 | | | | 9,401,568 | | |
| FINANCIAL INFORMATION SERVICES—1.0% | |
| GFI Group Inc.* | | | 108,670 | | | | 9,380,394 | | |
| FINANCIAL SERVICES—1.6% | |
| Cohen & Steers, Inc. | | | 187,700 | | | | 7,057,520 | | |
| Heartland Payment Systems, Inc. | | | 278,100 | | | | 8,343,000 | | |
| | | | 15,400,520 | | |
-19-
THE ALGER INSTITUTIONAL FUNDS | ALGER SMALLCAP GROWTH INSTITUTIONAL FUND
Schedule of Investments (Continued) October 31, 2007
| COMMON STOCKS—(CONT.) | | SHARES | | VALUE | |
| FOOD & BEVERAGES—1.4% | |
| Hain Celestial Group Inc. (The)* | | | 370,565 | | | $ | 12,992,009 | | |
| HEALTH CARE EQUIPMENT & SUPPLIES—3.8% | |
| ArthroCare Corporation* | | | 102,250 | | | | 6,629,890 | | |
| Hologic, Inc.* | | | 168,400 | | | | 11,439,412 | | |
| Illumina, Inc.* | | | 184,530 | | | | 10,361,360 | | |
| Thoratec Corporation* | | | 374,400 | | | | 7,476,768 | | |
| | | | 35,907,430 | | |
| HEALTH CARE PROVIDERS & SERVICES—2.5% | |
| Parexel International Corporation* | | | 261,030 | | | | 12,007,380 | | |
| Psychiatric Solutions, Inc.* | | | 286,420 | | | | 11,342,232 | | |
| | | | 23,349,612 | | |
| HOTELS, RESTAURANTS & LEISURE—.6% | |
| Orient-Express Hotels Ltd. Cl. A. | | | 84,550 | | | | 5,478,840 | | |
| INSURANCE—1.0% | |
| First Mercury Financial Corporation* | | | 446,800 | | | | 9,896,620 | | |
| INTERNET & CATALOG RETAIL—1.3% | |
| Priceline.com Incorporated* | | | 127,160 | | | | 11,838,596 | | |
| INTERNET SOFTWARE & SERVICES—3.8% | |
| Acme Packet, Inc.* | | | 451,650 | | | | 6,485,694 | | |
| Allscripts Healthcare Solutions, Inc.* | | | 398,900 | | | | 11,049,530 | | |
| DealerTrack Holdings Inc.* | | | 238,345 | | | | 11,700,356 | | |
| Omniture Inc.* | | | 199,005 | | | | 6,798,011 | | |
| | | | 36,033,591 | | |
| IT SERVICES—1.1% | |
| Wright Express Corp.* | | | 264,285 | | | | 10,227,830 | | |
| LEISURE EQUIPMENT & PRODUCTS—.9% | |
| LIFE TIME FITNESS, Inc.* | | | 144,195 | | | | 8,743,985 | | |
| MACHINERY—2.4% | |
| Actuant Corporation Cl. A | | | 151,180 | | | | 10,428,396 | | |
| Bucyrus International, Inc. Cl. A | | | 147,080 | | | | 12,134,100 | | |
| | | | 22,562,496 | | |
| MANUFACTURING—1.1% | |
| Silgan Holdings Inc. | | | 190,550 | | | | 10,398,314 | | |
| MEDIA—1.0% | |
| NeuStar, Inc. Cl. A* | | | 271,860 | | | | 9,297,612 | | |
| MEDICAL DEVICES—.5% | |
| Dexcom Inc.* | | | 555,350 | | | | 5,164,755 | | |
| MEDICAL PRODUCTS—2.6% | |
| Inverness Medical Innovations, Inc.* | | | 159,900 | | | | 9,608,391 | | |
| Omrix Biopharmaceuticals, Inc.* | | | 265,250 | | | | 9,241,310 | | |
| Savient Pharmaceuticals Inc.* | | | 376,150 | | | | 5,296,192 | | |
| | | | 24,145,893 | | |
-20-
THE ALGER INSTITUTIONAL FUNDS | ALGER SMALLCAP GROWTH INSTITUTIONAL FUND
Schedule of Investments (Continued) October 31, 2007
| COMMON STOCKS—(CONT.) | | SHARES | | VALUE | |
| MEDICAL TECHNOLOGY—.8% | |
| Acorda Therapeutics Inc.* | | | 350,950 | | | $ | 7,113,756 | | |
| METALS—3.1% | |
| RBC Bearings, Inc.* | | | 266,990 | | | | 10,730,328 | | |
| Thompson Creek Metals Co.,Inc* | | | 457,750 | | | | 12,038,917 | | |
| Uranium One, Inc.* | | | 617,800 | | | | 6,823,230 | | |
| | | | 29,592,475 | | |
| OIL & GAS—2.2% | |
| Carrizo Oil & Gas, Inc.* | | | 211,060 | | | | 10,846,373 | | |
| Mariner Energy Inc.* | | | 411,000 | | | | 10,275,000 | | |
| | | | 21,121,373 | | |
| OIL AND GAS EXPLORATION SERVICES—1.1% | |
| Petrobank Energy and Resources Ltd.* | | | 209,160 | | | | 10,345,681 | | |
| OIL: CRUDE PRODUCERS—1.5% | |
| Concho Resources Inc.* | | | 395,610 | | | | 7,710,439 | | |
| CVR Energy, Inc.* | | | 280,550 | | | | 6,396,540 | | |
| | | | 14,106,979 | | |
| PHARMACEUTICAL PREPARATIONS—1.1% | |
| Adams Respiratory Therapeutics, Inc.* | | | 231,055 | | | | 10,152,557 | | |
| PRINTING—.9% | |
| VistaPrint Limited* | | | 171,950 | | | | 8,179,662 | | |
| REAL ESTATE—.4% | |
| HFF Inc.* | | | 360,250 | | | | 3,620,512 | | |
| RESTAURANTS—.6% | |
| McCormick & Schmick's Seafood Restaurants, Inc.* | | | 306,000 | | | | 5,195,880 | | |
| RETAIL—1.6% | |
| bebe Stores, Inc. | | | 500,900 | | | | 6,967,519 | | |
| Phillips-Van Heusen Corporation | | | 167,070 | | | | 7,985,946 | | |
| | | | 14,953,465 | | |
| SAVINGS & LOANS—.5% | |
| FirstFed Financial Corp.* | | | 114,150 | | | | 4,883,337 | | |
| SEMICONDUCTOR CAPITAL EQUIPMENT—1.6% | |
| FormFactor Inc.* | | | 179,840 | | | | 7,033,542 | | |
| SiRF Technology Holdings, Inc.* | | | 269,065 | | | | 8,020,828 | | |
| | | | 15,054,370 | | |
| SEMICONDUCTORS & SEMICONDUCTOR EQUIPMENT—2.7% | |
| Cirrus Logic, Inc.* | | | 896,350 | | | | 5,512,552 | | |
| ON Semiconductor Corporation* | | | 885,450 | | | | 9,031,590 | | |
| Tessera Technologies Inc.* | | | 269,260 | | | | 10,283,039 | | |
| | | | 24,827,181 | | |
-21-
THE ALGER INSTITUTIONAL FUNDS | ALGER SMALLCAP GROWTH INSTITUTIONAL FUND
Schedule of Investments (Continued) October 31, 2007
| COMMON STOCKS—(CONT.) | | SHARES | | VALUE | |
| SOFTWARE—4.9% | |
| Concur Technologies, Inc.* | | | 197,100 | | | $ | 7,103,484 | | |
| Solera Holdings Inc.* | | | 503,500 | | | | 10,830,285 | | |
| Synchronoss Technologies Inc.* | | | 242,450 | | | | 9,698,000 | | |
| Tibco Software Inc.* | | | 598,030 | | | | 5,489,915 | | |
| VeriFone Holdings Inc.* | | | 266,695 | | | | 13,182,734 | | |
| | | | 46,304,418 | | |
| SPECIALTY RETAIL—1.2% | |
| Carter's, Inc.* | | | 298,800 | | | | 6,597,504 | | |
| DSW Inc. Cl. A* | | | 226,840 | | | | 5,103,900 | | |
| | | | 11,701,404 | | |
| TEXTILES & APPAREL—1.1% | |
| Iconix Brand Group, Inc.* | | | 468,025 | | | | 10,694,371 | | |
| TEXTILES, APPAREL & LUXURY GOODS—1.2% | |
| Deckers Outdoor Corporation* | | | 81,350 | | | | 11,371,916 | | |
| WIRELESS TELECOMMUNICATION SERVICES—1.2% | |
| SBA Communications Corporation Cl. A* | | | 312,775 | | | | 11,134,790 | | |
TOTAL COMMON STOCKS
(Cost $761,785,501) | | | | | | | 904,400,072 | | |
| SHORT-TERM INVESTMENTS—5.2% | | PRINCIPAL
AMOUNT | | | |
| U.S. AGENCY OBLIGATIONS | |
Federal Home Loan Banks, 4.25%,11/1/07
(Cost $48,534,000) | | $ | 48,534,000 | | | | 48,534,000 | | |
Total Investments
(Cost $810,319,501)(a) | | | 101.2 | % | | | 952,934,072 | | |
| Liabilities in Excess of Other Assets | | | (1.2 | ) | | | (11,089,717 | ) | |
| NET ASSETS | | | 100.0 | % | | $ | 941,844,355 | | |
* Non-income producing security.
# American Depositary Receipts.
(a) At October 31, 2007, the net unrealized appreciation of investments, based on cost for federal income tax purposes of $811,547,851 amounted to $141,386,221 which consisted of aggregate gross unrealized appreciation of $164,596,926 and aggregate gross unrealized depreciation of $23,210,705.
See Notes to Financial Statements.
-22-
THE ALGER INSTITUTIONAL FUNDS | ALGER MIDCAP GROWTH INSTITUTIONAL FUND
Schedule of Investments October 31, 2007
| COMMON STOCKS—97.6% | | SHARES | | VALUE | |
| AEROSPACE & DEFENSE—1.6% | |
| BE Aerospace, Inc.* | | | 666,090 | | | $ | 33,111,334 | | |
| AGRICULTURE—.8% | |
| Mosaic Co.* | | | 239,000 | | | | 16,682,200 | | |
| APPAREL—.4% | |
| J Crew Group Inc.* | | | 224,700 | | | | 8,403,780 | | |
| AUTO COMPONENTS—1.0% | |
| LKQ Corporation* | | | 573,400 | | | | 22,110,304 | | |
| BIOTECHNOLOGY—2.7% | |
| Affymetrix Inc.* | | | 990,850 | | | | 25,227,041 | | |
| ImClone Systems Incorporated* | | | 433,800 | | | | 18,718,470 | | |
| Neurocrine Biosciences, Inc.* | | | 103,500 | | | | 957,375 | | |
| Onyx Pharmaceuticals, Inc.* | | | 231,200 | | | | 10,799,352 | | |
| | | | 55,702,238 | | |
| BUSINESS SERVICES—.3% | |
| Endeavor Acquisition Corp.* | | | 495,100 | | | | 6,089,730 | | |
| CAPITAL MARKETS—.9% | |
| Affiliated Managers Group, Inc.* | | | 145,975 | | | | 19,203,011 | | |
| CASINOS & RESORTS—1.4% | |
| Bally Technologies Inc.* | | | 717,600 | | | | 28,940,808 | | |
| COMMERCIAL BANKS—.5% | |
| Boston Private Financial Holdings, Inc. | | | 367,100 | | | | 10,557,796 | | |
| COMMERCIAL SERVICES & SUPPLIES—.5% | |
| Monster Worldwide Inc.* | | | 274,200 | | | | 11,127,036 | | |
| COMMUNICATION EQUIPMENT—1.7% | |
| Research In Motion Limited* | | | 170,095 | | | | 21,178,528 | | |
| NICE Systems Ltd. ADR*# | | | 354,400 | | | | 13,973,992 | | |
| | | | 35,152,520 | | |
| COMPUTER TECHNOLOGY—2.6% | |
| Atheros Communications* | | | 860,635 | | | | 30,208,288 | | |
| NAVTEQ* | | | 327,585 | | | | 25,289,562 | | |
| | | | 55,497,850 | | |
| COMPUTERS & PERIPHERALS—4.4% | |
| Apple Computer, Inc.* | | | 329,900 | | | | 62,664,505 | | |
| Memc Electronic Materials, Inc.* | | | 318,165 | | | | 23,296,041 | | |
| SanDisk Corporation* | | | 143,600 | | | | 6,375,840 | | |
| | | | 92,336,386 | | |
| CONGLOMERATE—1.2% | |
| ITT Corporation | | | 377,000 | | | | 25,228,840 | | |
| CONSTRUCTION & ENGINEERING—2.6% | |
| Chicago Bridge & Iron Company N.V. | | | 591,800 | | | | 29,590,000 | | |
| McDermott International, Inc.* | | | 424,080 | | | | 25,894,325 | | |
| | | | 55,484,325 | | |
-23-
THE ALGER INSTITUTIONAL FUNDS | ALGER MIDCAP GROWTH INSTITUTIONAL FUND
Schedule of Investments (Continued) October 31, 2007
| COMMON STOCKS—(CONT.) | | SHARES | | VALUE | |
| DRUGS & PHARMACEUTICALS—.8% | |
| United Therapeutics Corporation* | | | 237,055 | | | $ | 16,224,044 | | |
| ELECTRIC SERVICES—.5% | |
| ITC Holdings Corporation | | | 181,600 | | | | 10,394,784 | | |
| ELECTRONICS—2.0% | |
| Nintendo Co., Ltd. ADR# | | | 533,730 | | | | 41,609,057 | | |
| ELECTRONICS: SEMI-CONDUCTORS/COMPONENTS—.3% | |
| Spreadtrum Communications, Inc. ADR*# | | | 487,400 | | | | 6,297,208 | | |
| ENERGY—2.3% | |
| First Solar, Inc.* | | | 116,700 | | | | 18,533,127 | | |
| JA Solar Holdings Co. Ltd. ADR*# | | | 515,000 | | | | 29,664,000 | | |
| | | | 48,197,127 | | |
| ENERGY EQUIPMENT & SERVICES—7.4% | |
| Cameron International Corp.* | | | 375,230 | | | | 36,532,393 | | |
| Diamond Offshore Drilling Inc. | | | 251,600 | | | | 28,488,668 | | |
| FMC Technologies, Inc.* | | | 317,000 | | | | 19,219,710 | | |
| National-Oilwell Varco Inc.* | | | 350,970 | | | | 25,705,043 | | |
| Transocean Inc.* | | | 224,400 | | | | 26,786,628 | | |
| Weatherford International Ltd.* | | | 285,500 | | | | 18,531,805 | | |
| | | | 155,264,247 | | |
| FINANCE—1.5% | |
| IntercontinentalExchange Inc.* | | | 180,300 | | | | 32,129,460 | | |
| FINANCIAL INFORMATION SERVICES—.7% | |
| GFI Group Inc.* | | | 171,100 | | | | 14,769,352 | | |
| FINANCIAL SERVICES—7.6% | |
| Alibaba.com Corporation* | | | 1,037,600 | | | | 1,807,246 | | |
| AllianceBernstein Holding LP | | | 286,300 | | | | 24,458,609 | | |
| Bovespa Holding SA* | | | 823,500 | | | | 15,597,129 | | |
| CME Group Inc. | | | 39,600 | | | | 26,383,500 | | |
| Genpact Limited* | | | 1,315,755 | | | | 21,052,080 | | |
| Lazard Ltd. | | | 397,913 | | | | 19,975,233 | | |
| Nymex Holdings Inc. | | | 398,000 | | | | 51,150,960 | | |
| | | | 160,424,757 | | |
| FOOD & BEVERAGES—1.0% | |
| Yum! Brands, Inc. | | | 526,400 | | | | 21,198,128 | | |
| FOOD & STAPLES RETAILING—1.5% | |
| Whole Foods Market, Inc. | | | 630,900 | | | | 31,254,786 | | |
| HEALTH CARE EQUIPMENT & SUPPLIES—4.3% | |
| Hologic, Inc.* | | | 462,800 | | | | 31,438,004 | | |
| Intuitive Surgical, Inc.* | | | 61,700 | | | | 20,167,879 | | |
| Smith & Nephew Plc. ADR# | | | 79,900 | | | | 5,414,823 | | |
| St. Jude Medical, Inc.* | | | 509,100 | | | | 20,735,643 | | |
| Zimmer Holdings, Inc.* | | | 177,900 | | | | 12,362,271 | | |
| | | | 90,118,620 | | |
-24-
THE ALGER INSTITUTIONAL FUNDS | ALGER MIDCAP GROWTH INSTITUTIONAL FUND
Schedule of Investments (Continued) October 31, 2007
| COMMON STOCKS—(CONT.) | | SHARES | | VALUE | |
| HEALTH CARE PROVIDERS & SERVICES—3.7% | |
| Health Net Inc.* | | | 571,900 | | | $ | 30,659,559 | | |
| McKesson Corporation | | | 348,000 | | | | 23,002,800 | | |
| Quest Diagnostics Incorporated | | | 441,300 | | | | 23,468,334 | | |
| | | | 77,130,693 | | |
| HOTELS, RESTAURANTS & LEISURE—4.1% | |
| Accor SA | | | 327,200 | | | | 31,181,516 | | |
| MGM MIRAGE* | | | 203,900 | | | | 18,679,279 | | |
| Orient-Express Hotels Ltd. Cl. A. | | | 323,360 | | | | 20,953,728 | | |
| Scientific Games Corporation* | | | 440,110 | | | | 15,909,977 | | |
| | | | 86,724,500 | | |
| HOUSEHOLD DURABLES—.5% | |
| Harman International Industries, Incorporated | | | 120,800 | | | | 10,171,360 | | |
| INFORMATION TECHNOLOGY SERVICES—1.0% | |
| Cognizant Technology Solutions Corporation Cl. A* | | | 510,900 | | | | 21,181,914 | | |
| INTERNET SOFTWARE & SERVICES—2.9% | |
| Allscripts Healthcare Solutions, Inc.* | | | 1,160,255 | | | | 32,139,063 | | |
| DealerTrack Holdings Inc.* | | | 172,572 | | | | 8,471,559 | | |
| SINA Corp.* | | | 361,600 | | | | 20,730,528 | | |
| | | | 61,341,150 | | |
| LEISURE & ENTERTAINMENT—.5% | |
| Vail Resorts Inc.* | | | 169,900 | | | | 10,311,231 | | |
| LEISURE EQUIPMENT & PRODUCTS—.3% | |
| UbiSoft Entertainment SA* | | | 66,900 | | | | 5,486,923 | | |
| MACHINERY—1.0% | |
| Oshkosh Truck Corporation | | | 376,800 | | | | 20,422,560 | | |
| MEDICAL PRODUCTS—1.0% | |
| Metabolix, Inc.* | | | 705,500 | | | | 20,381,895 | | |
| METALS—2.8% | |
| Thompson Creek Metals Co.,Inc* | | | 383,600 | | | | 10,088,757 | | |
| Titanium Metals Corporation* | | | 829,400 | | | | 29,194,880 | | |
| Uranium One, Inc.* | | | 1,777,175 | | | | 19,627,832 | | |
| | | | 58,911,469 | | |
| METALS & MINING—.6% | |
| Paladin Resources Limited* | | | 1,572,480 | | | | 12,249,619 | | |
| OIL AND GAS EXPLORATION SERVICES—1.1% | |
| Petrobank Energy and Resources Ltd.* | | | 449,400 | | | | 22,228,672 | | |
| OIL: CRUDE PRODUCERS—.3% | |
| Concho Resources Inc.* | | | 377,100 | | | | 7,349,679 | | |
| PHARMACEUTICALS—.5% | |
| Pharmion Corp.* | | | 200,500 | | | | 9,648,060 | | |
-25-
THE ALGER INSTITUTIONAL FUNDS | ALGER MIDCAP GROWTH INSTITUTIONAL FUND
Schedule of Investments (Continued) October 31, 2007
| COMMON STOCKS—(CONT.) | | SHARES | | VALUE | |
| PHOTOGRAPHY—.8% | |
| Shutterfly, Inc.* | | | 511,400 | | | $ | 17,065,418 | | |
| REAL ESTATE—.4% | |
| DuPont Fabros Technology Inc.* | | | 427,300 | | | | 9,178,404 | | |
| RETAIL—1.9% | |
| Sothebys Holdings Inc., Cl. A | | | 742,100 | | | | 40,199,557 | | |
| SEMICONDUCTORS & SEMICONDUCTOR EQUIPMENT—5.8% | |
| Cree, Inc.* | | | 702,000 | | | | 19,656,000 | | |
| Lam Research Corporation* | | | 397,900 | | | | 19,974,580 | | |
| NVIDIA Corporation* | | | 590,500 | | | | 20,891,890 | | |
| ON Semiconductor Corporation* | | | 1,689,325 | | | | 17,231,115 | | |
| Tessera Technologies Inc.* | | | 510,245 | | | | 19,486,257 | | |
| Varian Semiconductor Equipment Associates, Inc.* | | | 555,200 | | | | 25,550,304 | | |
| | | | 122,790,146 | | |
| SPECIALTY RETAIL—4.2% | |
| DSW Inc. Cl. A* | | | 189,600 | | | | 4,266,000 | | |
| Gamestop Corp. Cl. A* | | | 707,516 | | | | 41,899,098 | | |
| PETSMART, Inc. | | | 689,600 | | | | 20,653,520 | | |
| Urban Outfitters, Inc.* | | | 847,500 | | | | 21,416,325 | | |
| | | | 88,234,943 | | |
| SOFTWARE—5.0% | |
| Activision, Inc.* | | | 842,180 | | | | 19,917,557 | | |
| Net 1 UEPS Technologies, Inc.* | | | 892,517 | | | | 28,578,394 | | |
| Solera Holdings Inc.* | | | 1,204,700 | | | | 25,913,097 | | |
| Synchronoss Technologies Inc.* | | | 223,300 | | | | 8,932,000 | | |
| TomTom NV* | | | 287,600 | | | | 22,909,803 | | |
| | | | 106,250,851 | | |
| TEXTILES & APPAREL—.8% | |
| Iconix Brand Group, Inc.* | | | 763,800 | | | | 17,452,830 | | |
| TRANSPORTATION—2.3% | |
| Norfolk Southern Corporation | | | 246,700 | | | | 12,742,055 | | |
| Textron Inc. | | | 517,500 | | | | 35,816,175 | | |
| | | | 48,558,230 | | |
| UTILITIES—.8% | |
| Veolia Environnement ADR# | | | 192,880 | | | | 17,307,122 | | |
| WIRELESS TELECOMMUNICATION SERVICES—2.8% | |
| NII Holdings Inc. Cl. B* | | | 535,945 | | | | 31,084,810 | | |
| SBA Communications Corporation Cl. A* | | | 773,965 | | | | 27,553,154 | | |
| | | | 58,637,964 | | |
TOTAL COMMON STOCKS
(Cost $1,691,796,938) | | | | | | | 2,052,724,918 | | |
-26-
THE ALGER INSTITUTIONAL FUNDS | ALGER MIDCAP GROWTH INSTITUTIONAL FUND
Schedule of Investments (Continued) October 31, 2007
| SHORT-TERM INVESTMENTS—2.7% | | PRINCIPAL
AMOUNT | | VALUE | |
| U.S. AGENCY OBLIGATIONS | |
Federal Home Loan Banks, 4.25%, 11/1/07
(Cost $56,630,000) | | $ | 56,630,000 | | | $ | 56,630,000 | | |
Total Investments
(Cost $1,748,426,938)(a) | | | 100.3 | % | | | 2,109,354,918 | | |
| Liabilities in Excess of Other Assets | | | (0.3 | ) | | | (7,151,457 | ) | |
| NET ASSETS | | | 100.0 | % | | $ | 2,102,203,461 | | |
* Non-income producing security.
# American Depositary Receipts.
(a) At October 31, 2007, the net unrealized appreciation on investments, based on cost for federal income tax purposes of $1,763,415,328 amounted to $345,939,590 which consisted of aggregate gross unrealized appreciation of $376,126,118 and aggregate gross unrealized depreciation of $30,186,528.
See Notes to Financial Statements.
-27-
THE ALGER INSTITUTIONAL FUNDS | ALGER CAPITAL APPRECIATION INSTITUTIONAL FUND
Schedule of Investments October 31, 2007
| COMMON STOCKS—97.6% | | SHARES | | VALUE | |
| AEROSPACE & DEFENSE—3.7% | |
| Boeing Company | | | 48,800 | | | $ | 4,811,192 | | |
| General Dynamics Corporation | | | 184,500 | | | | 16,782,120 | | |
| | | | 21,593,312 | | |
| AUTO COMPONENTS—.2% | |
| LKQ Corporation* | | | 28,200 | | | | 1,087,392 | | |
| AUTO EQUIPMENT & SERVICES—3.1% | |
| Cummins Inc. | | | 150,600 | | | | 18,065,976 | | |
| BIOTECHNOLOGY—1.0% | |
| ImClone Systems Incorporated* | | | 46,400 | | | | 2,002,160 | | |
| InterMune, Inc.* | | | 33,000 | | | | 657,360 | | |
| Onyx Pharmaceuticals, Inc.* | | | 72,000 | | | | 3,363,120 | | |
| | | | 6,022,640 | | |
| BUSINESS SERVICES—.6% | |
| Endeavor Acquisition Corp.* | | | 300,500 | | | | 3,696,150 | | |
| CAPITAL MARKETS—.6% | |
| Goldman Sachs Group, Inc. | | | 14,600 | | | | 3,619,632 | | |
| CASINOS & RESORTS—1.8% | |
| Bally Technologies Inc.* | | | 262,400 | | | | 10,582,592 | | |
| CHEMICALS—.6% | |
| Celanese Corp., Series A | | | 82,600 | | | | 3,465,896 | | |
| COMMERCIAL SERVICES & SUPPLIES—.5% | |
| Monster Worldwide Inc.* | | | 74,500 | | | | 3,023,210 | | |
| COMMUNICATION EQUIPMENT—1.3% | |
| Research In Motion Limited* | | | 20,700 | | | | 2,577,357 | | |
| Sonus Networks, Inc.* | | | 677,400 | | | | 4,674,060 | | |
| | | | 7,251,417 | | |
| COMPUTER SERVICES—2.0% | |
| Satyam Computer Services- ADR# | | | 138,700 | | | | 4,209,545 | | |
| Switch and Data Inc.* | | | 22,200 | | | | 436,896 | | |
| Tele Atlas NV* | | | 168,200 | | | | 6,711,453 | | |
| | | | 11,357,894 | | |
| COMPUTER TECHNOLOGY—3.1% | |
| Atheros Communications* | | | 307,180 | | | | 10,782,018 | | |
| NAVTEQ* | | | 92,100 | | | | 7,110,120 | | |
| | | | 17,892,138 | | |
| COMPUTERS & PERIPHERALS—5.1% | |
| Apple Computer, Inc.* | | | 107,200 | | | | 20,362,640 | | |
| Hewlett-Packard Company | | | 25,800 | | | | 1,333,344 | | |
| Memc Electronic Materials, Inc.* | | | 70,400 | | | | 5,154,688 | | |
| Network Appliance, Inc.* | | | 90,600 | | | | 2,852,994 | | |
| | | | 29,703,666 | | |
-28-
THE ALGER INSTITUTIONAL FUNDS | ALGER CAPITAL APPRECIATION INSTITUTIONAL FUND
Schedule of Investments (Continued) October 31, 2007
| COMMON STOCKS—(CONT.) | | SHARES | | VALUE | |
| CONTAINERS & PACKAGING—2.7% | |
| Pactiv Corporation* | | | 571,400 | | | $ | 15,696,358 | | |
| DRUGS & PHARMACEUTICALS—.9% | |
| United Therapeutics Corporation* | | | 75,200 | | | | 5,146,688 | | |
| ENERGY—2.6% | |
| First Solar, Inc.* | | | 5,600 | | | | 889,336 | | |
| JA Solar Holdings Co. Ltd. ADR*# | | | 248,000 | | | | 14,284,800 | | |
| | | | 15,174,136 | | |
| ENERGY EQUIPMENT & SERVICES—4.3% | |
| National-Oilwell Varco Inc.* | | | 26,200 | | | | 1,918,888 | | |
| Transocean Inc.* | | | 121,500 | | | | 14,503,455 | | |
| Weatherford International Ltd.* | | | 131,900 | | | | 8,561,629 | | |
| | | | 24,983,972 | | |
| FINANCE—.4% | |
| IntercontinentalExchange Inc. * | | | 13,800 | | | | 2,459,160 | | |
| FINANCIAL SERVICES—7.5% | |
| Alibaba.com Corporation* | | | 283,100 | | | | 493,091 | | |
| AllianceBernstein Holding LP | | | 58,500 | | | | 4,997,655 | | |
| CME Group Inc. | | | 17,100 | | | | 11,392,875 | | |
| ICICI Bank Limited ADR# | | | 28,200 | | | | 1,958,208 | | |
| Lazard Ltd. | | | 121,600 | | | | 6,104,320 | | |
| Nymex Holdings Inc. | | | 98,900 | | | | 12,710,628 | | |
| UBS AG | | | 105,100 | | | | 5,642,819 | | |
| | | | 43,299,596 | | |
| FOOD & STAPLES RETAILING—1.3% | |
| CVS Caremark Corporation | | | 179,200 | | | | 7,485,184 | | |
| HEALTH CARE EQUIPMENT & SUPPLIES—2.7% | |
| Hologic, Inc.* | | | 129,248 | | | | 8,779,817 | | |
| Illumina, Inc.* | | | 70,100 | | | | 3,936,115 | | |
| Intuitive Surgical, Inc.* | | | 7,750 | | | | 2,533,243 | | |
| | | | 15,249,175 | | |
| HEALTH CARE PROVIDERS & SERVICES—1.3% | |
| Cardinal Health, Inc. | | | 110,200 | | | | 7,496,906 | | |
| HOTELS, RESTAURANTS & LEISURE—5.9% | |
| Accor SA | | | 181,800 | | | | 17,325,182 | | |
| Ctrip.com International Ltd. ADR# | | | 51,100 | | | | 2,879,996 | | |
| MGM MIRAGE * | | | 51,800 | | | | 4,745,398 | | |
| Penn National Gaming, Inc.* | | | 121,100 | | | | 7,477,925 | | |
| Starbucks Corporation* | | | 64,000 | | | | 1,707,520 | | |
| | | | 34,136,021 | | |
| HOUSEHOLD PRODUCTS—.4% | |
| Procter & Gamble Company | | | 35,402 | | | | 2,461,147 | | |
-29-
THE ALGER INSTITUTIONAL FUNDS | ALGER CAPITAL APPRECIATION INSTITUTIONAL FUND
Schedule of Investments (Continued) October 31, 2007
| COMMON STOCKS—(CONT.) | | SHARES | | VALUE | |
| INDUSTRIAL CONGLOMERATES—.9% | |
| General Electric Company | | | 124,100 | | | $ | 5,107,956 | | |
| INFORMATION TECHNOLOGY SERVICES—.9% | |
| Cognizant Technology Solutions Corporation Cl. A* | | | 120,300 | | | | 4,987,638 | | |
| INSURANCE—.7% | |
| American International Group, Inc. | | | 59,200 | | | | 3,736,704 | | |
| INTERNET & CATALOG RETAIL—2.7% | |
| eBay Inc.* | | | 427,900 | | | | 15,447,190 | | |
| INTERNET SOFTWARE & SERVICES—7.2% | |
| DealerTrack Holdings Inc.* | | | 85,475 | | | | 4,195,968 | | |
| Google Inc. Cl. A* | | | 24,100 | | | | 17,038,700 | | |
| SINA Corp.* | | | 166,200 | | | | 9,528,246 | | |
| Yahoo! Inc.* | | | 352,500 | | | | 10,962,750 | | |
| | | | 41,725,664 | | |
| LEISURE EQUIPMENT & PRODUCTS—.2% | |
| Smith & Wesson Holding Corporation* | | | 77,800 | | | | 940,602 | | |
| MACHINERY—1.5% | |
| Oshkosh Truck Corporation | | | 146,400 | | | | 7,934,880 | | |
| Terex Corporation* | | | 12,100 | | | | 898,062 | | |
| | | | 8,832,942 | | |
| MEDIA—2.0% | |
| Dolby Laboratories Inc. Cl. A* | | | 108,700 | | | | 4,506,702 | | |
| DreamWorks Animation SKG, Inc. Cl. A* | | | 73,400 | | | | 2,389,904 | | |
| Focus Media Holding Limited ADR*# | | | 56,300 | | | | 3,490,600 | | |
| NeuStar, Inc. Cl. A* | | | 28,600 | | | | 978,120 | | |
| | | | 11,365,326 | | |
| MEDICAL PRODUCTS—1.7% | |
| Inverness Medical Innovations, Inc.* | | | 142,000 | | | | 8,532,780 | | |
| Northstar Neuroscience, Inc.* | | | 80,610 | | | | 1,068,083 | | |
| | | | 9,600,863 | | |
| METALS—.2% | |
| Uranium One, Inc.* | | | 116,300 | | | | 1,284,464 | | |
| METALS & MINING—1.1% | |
| Freeport-McMoRan Copper & Gold, Inc. Cl. B | | | 24,800 | | | | 2,918,464 | | |
| Paladin Resources Limited* | | | 419,600 | | | | 3,268,684 | | |
| | | | 6,187,148 | | |
| OIL & GAS—1.3% | |
| Exterran Holdings Inc.* | | | 53,583 | | | | 4,511,646 | | |
| Range Resources Corporation | | | 29,300 | | | | 1,316,449 | | |
| Warren Resources Inc.* | | | 91,900 | | | | 1,395,042 | | |
| | | | 7,223,137 | | |
-30-
THE ALGER INSTITUTIONAL FUNDS | ALGER CAPITAL APPRECIATION INSTITUTIONAL FUND
Schedule of Investments (Continued) October 31, 2007
| COMMON STOCKS—(CONT.) | | SHARES | | VALUE | |
| OIL AND GAS EXPLORATION SERVICES—.8% | |
| Petrobank Energy and Resources Ltd.* | | | 86,700 | | | $ | 4,288,442 | | |
| PHARMACEUTICAL PREPARATIONS—1.0% | |
| Adams Respiratory Therapeutics, Inc.* | | | 129,400 | | | | 5,685,836 | | |
| PHARMACEUTICALS—2.2% | |
| Abbott Laboratories | | | 157,300 | | | | 8,591,726 | | |
| Pharmion Corp.* | | | 82,700 | | | | 3,979,524 | | |
| | | | 12,571,250 | | |
| REAL ESTATE—.3% | |
| Digital Realty Trust, Inc. | | | 41,400 | | | | 1,821,186 | | |
| RETAIL—1.4% | |
| Sothebys Holdings Inc., Cl. A | | | 149,000 | | | | 8,071,330 | | |
| SEMICONDUCTORS & SEMICONDUCTOR EQUIPMENT—5.4% | |
| Intel Corporation | | | 381,200 | | | | 10,254,280 | | |
| Lam Research Corporation* | | | 74,300 | | | | 3,729,860 | | |
| ON Semiconductor Corporation* | | | 577,300 | | | | 5,888,460 | | |
| Tessera Technologies Inc.* | | | 214,400 | | | | 8,187,936 | | |
| Varian Semiconductor Equipment Associates, Inc.* | | | 68,900 | | | | 3,170,778 | | |
| | | | 31,231,314 | | |
| SOFTWARE—5.5% | |
| Adobe Systems Incorporated* | | | 92,400 | | | | 4,425,960 | | |
| Microsoft Corporation | | | 136,700 | | | | 5,031,927 | | |
| Net 1 UEPS Technologies, Inc.* | | | 227,600 | | | | 7,287,752 | | |
| Solera Holdings Inc.* | | | 284,900 | | | | 6,128,199 | | |
| TomTom NV* | | | 110,000 | | | | 8,762,442 | | |
| | | | 31,636,280 | | |
| TEXTILES & APPAREL—.8% | |
| Iconix Brand Group, Inc.* | | | 206,200 | | | | 4,711,670 | | |
| TEXTILES, APPAREL & LUXURY GOODS—.3% | |
| Deckers Outdoor Corporation* | | | 13,800 | | | | 1,929,102 | | |
| TOBACCO—3.8% | |
| Altria Group, Inc. | | | 303,050 | | | | 22,101,436 | | |
| WIRELESS TELECOMMUNICATION SERVICES—2.1% | |
| America Movil S.A. de C.V. Series L ADR# | | | 49,100 | | | | 3,210,649 | | |
| American Tower Corporation Cl. A* | | | 68,469 | | | | 3,024,960 | | |
| NII Holdings Inc. Cl. B* | | | 97,450 | | | | 5,652,100 | | |
| | | | 11,887,709 | | |
TOTAL COMMON STOCKS
(Cost $503,857,726) | | | | | | | 563,325,447 | | |
-31-
THE ALGER INSTITUTIONAL FUNDS | ALGER CAPITAL APPRECIATION INSTITUTIONAL FUND
Schedule of Investments (Continued) October 31, 2007
| CORPORATE CONVERTIBLE BOND—0.3% | | PRINCIPAL
AMOUNT | | VALUE | |
| TEXTILES & APPAREL—0.3% | |
Iconix Brand Group, Inc., 1.875%, 6/30/12 (a)
(Cost $1,475,000) | | $ | 1,475,000 | | | $ | 1,554,281 | | |
| SHORT-TERM INVESTMENTS—2.0% | |
| U.S. AGENCY OBLIGATIONS | |
Federal Home Loan Banks, 4.25% 11/01/07
(Cost $11,655,000) | | | 11,655,000 | | | | 11,655,000 | | |
Total Investments
(Cost $516,987,726)(b) | | | 99.9 | % | | | 576,534,728 | | |
| Other Assets in Excess of Liabilities | | | 0.1 | | | | 835,346 | | |
| NET ASSETS | | | 100.0 | % | | $ | 577,370,074 | | |
* Non-income producing security.
# American Depositary Receipts.
(a) Pursuant to Securities and Exchange Commission Rule 144A, these securities may be sold prior to their maturity only to qualified institutional buyers. These securities are deemed to be liquid and represent 0.3% of the net assets of the fund.
(b) At October 31, 2007, the net unrealized appreciation of investments, based on cost for federal income tax purposes of $518,267,206 amounted to $58,267,522 which consisted of aggregate gross unrealized appreciation of $67,408,304 and aggregate gross unrealized depreciation of $9,140,782.
See Notes to Financial Statements.
-32-
[This page intentionally left blank]
THE ALGER INSTITUTIONAL FUNDS
Statements of Assets and Liabilities October 31, 2007
| | | LargeCap
Growth
Fund | | SmallCap
Growth
Fund | | MidCap
Growth
Fund | | Capital
Appreciation
Fund | |
| ASSETS: | |
Investments in securities, at value (identified cost*)
see accompanying schedules of investments | | $ | 61,689,192 | | | $ | 952,934,072 | | | $ | 2,109,354,918 | | | $ | 576,534,728 | | |
| Cash | | | 4,656 | | | | 10,575 | | | | 5,346,095 | | | | 5,430 | | |
| Receivable for investment securities sold | | | 507,604 | | | | 4,267,412 | | | | 101,563,486 | | | | 12,451,311 | | |
| Receivable for shares of beneficial interest sold | | | 435,437 | | | | 3,513,880 | | | | 12,007,215 | | | | 12,058,353 | | |
| Dividends and interest receivable | | | 23,632 | | | | 27,900 | | | | 463,567 | | | | 137,762 | | |
| Prepaid expenses | | | 15,765 | | | | 68,109 | | | | 142,753 | | | | 35,281 | | |
| Total Assets | | | 62,676,286 | | | | 960,821,948 | | | | 2,228,878,034 | | | | 601,222,865 | | |
| LIABILITES: | |
| Payable for investment securities purchased | | | 1,594,768 | | | | 8,897,638 | | | | 120,787,154 | | | | 22,754,149 | | |
| Payable for shares of beneficial interest redeemed | | | 130,580 | | | | 8,879,362 | | | | 3,729,135 | | | | 504,844 | | |
| Accrued investment advisory fees | | | 37,398 | | | | 665,286 | | | | 1,355,596 | | | | 382,612 | | |
| Accrued transfer agent fees | | | 2,154 | | | | 181,742 | | | | 52,089 | | | | 6,163 | | |
| Accrued distribution fees | | | 3,840 | | | | 19,998 | | | | 29,898 | | | | 15,941 | | |
| Accrued administrative fees | | | 2,107 | | | | 32,854 | | | | 71,347 | | | | 18,894 | | |
| Accrued shareholder servicing fees | | | 13,168 | | | | 190,815 | | | | 445,920 | | | | 118,090 | | |
| Accrued expenses | | | 18,508 | | | | 109,898 | | | | 203,434 | | | | 52,098 | | |
| Total Liabilites | | | 1,802,523 | | | | 18,977,593 | | | | 126,674,573 | | | | 23,852,791 | | |
| NET ASSETS | | $ | 60,873,763 | | | $ | 941,844,355 | | | $ | 2,102,203,461 | | | $ | 577,370,074 | | |
| Net assets consist of: | | | | | |
| Paid in capital | | $ | 58,703,927 | | | $ | 806,112,832 | | | $ | 1,438,535,568 | | | $ | 528,124,495 | | |
| Undistributed net investment income (accumulated loss) | | | — | | | | — | | | | (3,208,220 | ) | | | — | | |
| Undistributed net realized gain (accumulated loss) | | | (6,095,310 | ) | | | (6,883,048 | ) | | | 305,948,133 | | | | (10,301,423 | ) | |
| Net unrealized appreciation on investments | | | 8,265,146 | | | | 142,614,571 | | | | 360,927,980 | | | | 59,547,002 | | |
| NET ASSETS | | $ | 60,873,763 | | | $ | 941,844,355 | | | $ | 2,102,203,461 | | | $ | 577,370,074 | | |
| SHARES OF BENEFICIAL INTEREST OUTSTANDING—NOTE 6 | |
| Class I | | | 3,090,120 | | | | 29,534,937 | | | | 87,446,622 | | | | 24,154,877 | | |
| Class R | | | 529,518 | | | | 1,586,957 | | | | 3,086,945 | | | | 1,813,647 | | |
| Net Asset Value Per Share | | | | | | | | | | | | | | | | | |
| Class I | | $ | 16.87 | | | $ | 30.30 | | | $ | 23.24 | | | $ | 22.27 | | |
| Class R | | $ | 16.52 | | | $ | 29.64 | | | $ | 22.64 | | | $ | 21.75 | | |
| *Identified Cost | | $ | 53,424,046 | | | $ | 810,319,501 | | | $ | 1,748,426,938 | | | $ | 516,987,726 | | |
See Notes to Financial Statements.
-34-
-35-
THE ALGER INSTITUTIONAL FUNDS
Statements of Operations
For the year ended October 31, 2007
| | | LargeCap
Growth
Fund | | SmallCap
Growth
Fund | | MidCap
Growth
Fund | | Capital
Appreciation
Fund | |
| INCOME: | |
| Dividends (net of foreign withholding taxes*) | | $ | 661,978 | | | $ | 1,148,385 | | | $ | 7,594,340 | | | $ | 1,805,091 | | |
| Interest and other | | | 85,533 | | | | 1,968,278 | | | | 2,208,825 | | | | 764,056 | | |
| Total Income | | | 747,511 | | | | 3,116,663 | | | | 9,803,165 | | | | 2,569,147 | | |
| EXPENSES: | |
| Investment advisory fees—Note 3(a) | | | 471,905 | | | | 4,878,481 | | | | 11,804,693 | | | | 2,330,664 | | |
| Distribution fees—Note 3(b) | | | 31,434 | | | | 124,936 | | | | 254,981 | | | | 82,073 | | |
| Shareholder servicing fees—Note 3(e) | | | 165,865 | | | | 1,356,692 | | | | 3,879,643 | | | | 718,935 | | |
| Administrative fees—Note 3(a) | | | 25,689 | | | | 238,405 | | | | 610,166 | | | | 113,714 | | |
| Interest expense | | | 62,720 | | | | — | | | | 83,474 | | | | 3,269 | | |
| Custodian fees | | | 25,142 | | | | 65,824 | | | | 147,515 | | | | 49,223 | | |
| Transfer agent fees and expenses—Note 3(d) | | | 11,090 | | | | 975,295 | | | | 349,528 | | | | 59,645 | | |
| Professional fees | | | 17,322 | | | | 91,422 | | | | 223,600 | | | | 40,767 | | |
| Printing fees | | | 18,470 | | | | 230,450 | | | | 561,397 | | | | 103,695 | | |
| Trustees fees | | | 11,165 | | | | 11,203 | | | | 7,927 | | | | 10,793 | | |
| Registration fees | | | 37,914 | | | | 97,227 | | | | 60,191 | | | | 37,652 | | |
| Miscellaneous | | | 28,425 | | | | 77,751 | | | | 404,825 | | | | 55,245 | | |
| Total Expenses | | | 907,141 | | | | 8,147,686 | | | | 18,387,940 | | | | 3,605,675 | | |
| Less, expense reimbursement | | | — | | | | (191,212 | ) | | | — | | | | — | | |
| Net Expenses | | | 907,141 | | | | 7,956,474 | | | | 18,387,940 | | | | 3,605,675 | | |
| NET INVESTMENT LOSS | | | (159,630 | ) | | | (4,839,811 | ) | | | (8,584,775 | ) | | | (1,036,528 | ) | |
REALIZED AND UNREALIZED GAIN (LOSS)
ON INVESTMENTS AND FOREIGN CURRENCY TRANSACTIONS: | |
| Net realized gain on investments | | | 14,470,652 | | | | 46,281,847 | | | | 333,153,589 | | | | 63,616,517 | | |
| Net realized gain (loss) on foreign currency transactions | | | 32,477 | | | | — | | | | 1,098,327 | | | | (13,828 | ) | |
Net change in unrealized appreciation (depreciation)
on investments and foreign currency translations | | | 1,792,315 | | | | 112,536,968 | | | | 275,497,572 | | | | 47,211,518 | | |
Net realized and unrealized gain on investments
and foreign currency | | | 16,295,444 | | | | 158,818,815 | | | | 609,749,488 | | | | 110,814,207 | | |
| NET INCREASE IN NET ASSETS RESULTING FROM OPERATIONS | | $ | 16,135,814 | | | $ | 153,979,004 | | | $ | 601,164,713 | | | $ | 109,777,679 | | |
| *Foreign withholding taxes | | $ | 8,651 | | | | — | | | $ | 19,626 | | | $ | 1,405 | | |
See Notes to Financial Statements.
-36-
-37-
THE ALGER INSTITUTIONAL FUNDS
Statements of Changes in Net Assets
| | | LargeCap Growth Fund | | SmallCap Growth Fund | |
| | | For the
Year Ended
October 31
2007 | | For the
Year Ended
October 31
2006 | | For the
Year Ended
October 31
2007 | | For the
Year Ended
October 31
2006 | |
| Net investment loss | | $ | (159,630 | ) | | $ | (102,108 | ) | | $ | (4,839,811 | ) | | $ | (1,057,966 | ) | |
Net realized gain on investments and foreign
currency transactions | | | 14,503,129 | | | | 4,641,071 | | | | 46,281,847 | | | | 9,465,333 | | |
Net change in unrealized appreciation (depreciation)
on investments and foreign currency translations | | | 1,792,315 | | | | 398,233 | | | | 112,536,968 | | | | 21,907,507 | | |
| Net increase in net assets resulting from operations | | | 16,135,814 | | | | 4,937,196 | | | | 153,979,004 | | | | 30,314,874 | | |
| Dividends and distributions to shareholders from: | |
| Net investment income | |
| Class I | | | — | | | | (274,583 | ) | | | — | | | | — | | |
| Class R | | | — | | | | — | | | | — | | | | — | | |
| Net realized gains | |
| Class I | | | — | | | | — | | | | — | | | | — | | |
| Class R | | | — | | | | — | | | | — | | | | — | | |
| Total dividends and distributions to shareholders | | | — | | | | (274,583 | ) | | | — | | | | — | | |
| Increase (decrease) from shares of beneficial interest transactions: | |
| Class I | | | (68,755,483 | ) | | | 15,167,055 | | | | 441,527,169 | | | | 205,029,616 | | |
| Class R | | | 1,786,330 | | | | 1,326,484 | | | | 32,476,922 | | | | 4,805,444 | | |
Net increase (decrease) from shares of beneficial
interest transactions—Note 6 | | | (66,969,153 | ) | | | 16,493,539 | | | | 474,004,091 | | | | 209,835,060 | | |
| Total increase (decrease) | | | (50,833,339 | ) | | | 21,156,152 | | | | 627,983,095 | | | | 240,149,934 | | |
| Net Assets: | |
| Beginning of year | | | 111,707,102 | | | | 90,550,950 | | | | 313,861,260 | | | | 73,711,326 | | |
| END OF YEAR | | $ | 60,873,763 | | | $ | 111,707,102 | | | $ | 941,844,355 | | | $ | 313,861,260 | | |
| Undistributed net investment income | | $ | — | | | $ | — | | | $ | — | | | $ | — | | |
See Notes to Financial Statements.
-38-
| | | MidCap Growth Fund | | Capital Appreciation Fund | |
| | | For the
Year Ended
October 31
2007 | | For the
Year Ended
October 31
2006 | | For the
Year Ended
October 31
2007 | | For the
Year Ended
October 31
2006 | |
| Net investment loss | | $ | (8,584,775 | ) | | $ | (7,222,413 | ) | | $ | (1,036,528 | ) | | $ | (602,484 | ) | |
Net realized gain on investments and foreign
currency transactions | | | 334,251,916 | | | | 100,386,957 | | | | 63,602,689 | | | | 28,622,869 | | |
Net change in unrealized appreciation (depreciation)
on investments and foreign currency translations | | | 275,497,572 | | | | 13,901,396 | | | | 47,211,518 | | | | (2,086,159 | ) | |
| Net increase in net assets resulting from operations | | | 601,164,713 | | | | 107,065,940 | | | | 109,777,679 | | | | 25,934,226 | | |
| Dividends and distributions to shareholders from: | |
| Net investment income | |
| Class I | | | — | | | | — | | | | — | | | | (46,486 | ) | |
| Class R | | | — | | | | — | | | | — | | | | — | | |
| Net realized gains | |
| Class I | | | (105,905,536 | ) | | | (120,622,354 | ) | | | — | | | | — | | |
| Class R | | | (3,494,730 | ) | | | (2,632,250 | ) | | | — | | | | — | | |
| Total dividends and distributions to shareholders | | | (109,400,266 | ) | | | (123,254,604 | ) | | | — | | | | (46,486 | ) | |
| Increase (decrease) from shares of beneficial interest transactions: | |
| Class I | | | 207,121,687 | | | | 271,608,898 | | | | 269,214,084 | | | | 11,370,464 | | |
| Class R | | | 10,462,384 | | | | 21,821,311 | | | | 26,986,851 | | | | 4,414,281 | | |
Net increase (decrease) from shares of beneficial
interest transactions—Note 6 | | | 217,584,071 | | | | 293,430,209 | | | | 296,200,935 | | | | 15,784,745 | | |
| Total increase (decrease) | | | 709,348,518 | | | | 277,241,545 | | | | 405,978,614 | | | | 41,672,485 | | |
| Net Assets: | |
| Beginning of year | | | 1,392,854,943 | | | | 1,115,613,398 | | | | 171,391,460 | | | | 129,718,975 | | |
| END OF YEAR | | $ | 2,102,203,461 | | | $ | 1,392,854,943 | | | $ | 577,370,074 | | | $ | 171,391,460 | | |
| Undistributed net investment income | | $ | — | | | | — | | | $ | — | | | | — | | |
-39-
THE ALGER INSTITUTIONAL FUNDS
Financial Highlights for a share outstanding throughout the period
| ALGER LARGECAP GROWTH INSTITUTIONAL FUND | | CLASS I | |
| | | Year ended
10/31/07 | | Year ended
10/31/06 | | Year ended
10/31/05 | | Year ended
10/31/04 | | Year ended
10/31/03 | |
| INCOME FROM INVESTMENT OPERATIONS | |
| Net asset value, beginning of period | | $ | 13.25 | | | $ | 12.56 | | | $ | 10.86 | | | $ | 10.71 | | | $ | 8.70 | | |
| Net investment income (loss) (ii) | | | (0.03 | ) | | | (0.01 | ) | | | 0.04 | | | | (0.06 | ) | | | (0.03 | ) | |
Net realized and unrealized gain
(loss) on investments | | | 3.65 | | | | 0.74 | | | | 1.66 | | | | 0.21 | | | | 2.04 | | |
| Total from investment operations | | | 3.62 | | | | 0.73 | | | | 1.70 | | | | 0.15 | | | | 2.01 | | |
| Dividend from net investment income | | | — | | | | (0.04 | ) | | | — | | | | — | | | | — | | |
| Net asset value, end of period | | $ | 16.87 | | | $ | 13.25 | | | $ | 12.56 | | | $ | 10.86 | | | $ | 10.71 | | |
| Total return | | | 27.3 | % | | | 5.8 | % | | | 15.7 | % | | | 1.4 | % | | | 23.1 | % | |
| RATIOS/SUPPLEMENTAL DATA: | |
| Net assets, end of period (000's omitted) | | $ | 52,127 | | | $ | 106,335 | | | $ | 86,725 | | | $ | 88,098 | | | $ | 91,588 | | |
| Ratio of expenses to average net assets | | | 1.32 | % | | | 1.21 | % | | | 1.08 | % | | | 1.13 | % | | | 1.14 | % | |
Ratio of net investment income (loss)
to average net assets | | | (0.19 | )% | | | (0.08 | )% | | | 0.31 | % | | | (0.51 | )% | | | (0.31 | )% | |
| Portfolio turnover rate | | | 192.18 | % | | | 322.72 | % | | | 249.06 | % | | | 191.48 | % | | | 255.49 | % | |
| ALGER SMALLCAP GROWTH INSTITUTIONAL FUND | | CLASS I | |
| | | Year ended
10/31/07 | | Year ended
10/31/06 | | Year ended
10/31/05 | | Year ended
10/31/04 | | Year ended
10/31/03 | |
| INCOME FROM INVESTMENT OPERATIONS | |
| Net asset value, beginning of period | | $ | 23.98 | | | $ | 19.97 | | | $ | 16.07 | | | $ | 15.10 | | | $ | 10.97 | | |
| Net investment income (loss) (ii) | | | (0.21 | ) | | | (0.16 | ) | | | (0.14 | ) | | | (0.16 | ) | | | (0.12 | ) | |
Net realized and unrealized gain
(loss) on investments | | | 6.53 | | | | 4.17 | | | | 4.04 | | | | 1.13 | | | | 4.25 | | |
| Total from investment operations | | | 6.32 | | | | 4.01 | | | | 3.90 | | | | 0.97 | | | | 4.13 | | |
| Net asset value, end of period | | $ | 30.30 | | | $ | 23.98 | | | $ | 19.97 | | | $ | 16.07 | | | $ | 15.10 | | |
| Total return | | | 26.4 | % | | | 20.1 | % | | | 24.3 | % | | | 6.4 | % | | | 37.7 | % | |
| RATIOS/SUPPLEMENTAL DATA: | |
| Net assets, end of period (000's omitted) | | $ | 894,802 | | | $ | 305,843 | | | $ | 71,224 | | | $ | 69,788 | | | $ | 93,300 | | |
| Ratio of expenses to average net assets | | | 1.30 | %(iv) | | | 1.31 | % | | | 1.20 | % | | | 1.25 | % | | | 1.24 | % | |
Ratio of net investment income (loss)
to average net assets | | | (0.78 | )% | | | (0.74 | )% | | | (0.77 | )% | | | (1.03 | )% | | | (0.99 | )% | |
| Portfolio turnover rate | | | 67.53 | % | | | 88.67 | % | | | 116.16 | % | | | 135.80 | % | | | 139.97 | % | |
(i) Commenced operations January 27, 2003.
(ii) Amount was computed based on average shares outstanding during the period.
(iii) Ratios have been annualized; total return has not been annualized.
(iv) Amount has been reduced by 0.03% due to expense reimbursement.
See Notes to Financial Statements.
-40-
| ALGER LARGECAP GROWTH INSTITUTIONAL FUND | | CLASS R | |
| | | Year ended
10/31/07 | | Year ended
10/31/06 | | Year ended
10/31/05 | | Year ended
10/31/04 | | From
1/27/03 to
10/31/03(i)(iii) | |
| INCOME FROM INVESTMENT OPERATIONS | |
| Net asset value, beginning of period | | $ | 13.04 | | | $ | 12.39 | | | $ | 10.76 | | | $ | 10.66 | | | $ | 8.12 | | |
| Net investment income (loss) (ii) | | | (0.10 | ) | | | (0.08 | ) | | | (0.03 | ) | | | (0.12 | ) | | | (0.06 | ) | |
Net realized and unrealized gain
(loss) on investments | | | 3.58 | | | | 0.73 | | | | 1.66 | | | | 0.22 | | | | 2.60 | | |
| Total from investment operations | | | 3.48 | | | | 0.65 | | | | 1.63 | | | | 0.10 | | | | 2.54 | | |
| Dividend from net investment income | | | — | | | | — | | | | — | | | | — | | | | — | | |
| Net asset value, end of period | | $ | 16.52 | | | $ | 13.04 | | | $ | 12.39 | | | $ | 10.76 | | | $ | 10.66 | | |
| Total return | | | 26.7 | % | | | 5.3 | % | | | 15.2 | % | | | 0.9 | % | | | 31.3 | % | |
| RATIOS/SUPPLEMENTAL DATA: | |
| Net assets, end of period (000's omitted) | | $ | 8,747 | | | $ | 5,372 | | | $ | 3,826 | | | $ | 2,493 | | | $ | 133 | | |
| Ratio of expenses to average net assets | | | 1.81 | % | | | 1.71 | % | | | 1.57 | % | | | 1.64 | % | | | 1.62 | % | |
Ratio of net investment income (loss)
to average net assets | | | (0.72 | )% | | | (0.59 | )% | | | (0.29 | )% | | | (1.05 | )% | | | (0.84 | )% | |
| Portfolio turnover rate | | | 192.18 | % | | | 322.72 | % | | | 249.06 | % | | | 191.48 | % | | | 255.49 | % | |
| ALGER SMALLCAP GROWTH INSTITUTIONAL FUND | | CLASS R | |
| | | Year ended
10/31/07 | | Year ended
10/31/06 | | Year ended
10/31/05 | | Year ended
10/31/04 | | From
1/27/03 to
10/31/03(i)(iii) | |
| INCOME FROM INVESTMENT OPERATIONS | |
| Net asset value, beginning of period | | $ | 23.58 | | | $ | 19.74 | | | $ | 15.93 | | | $ | 15.05 | | | $ | 10.72 | | |
| Net investment income (loss) (ii) | | | (0.35 | ) | | | (0.28 | ) | | | (0.22 | ) | | | (0.25 | ) | | | (0.14 | ) | |
Net realized and unrealized gain
(loss) on investments | | | 6.41 | | | | 4.12 | | | | 4.03 | | | | 1.13 | | | | 4.47 | | |
| Total from investment operations | | | 6.06 | | | | 3.84 | | | | 3.81 | | | | 0.88 | | | | 4.33 | | |
| Net asset value, end of period | | $ | 29.64 | | | $ | 23.58 | | | $ | 19.74 | | | $ | 15.93 | | | $ | 15.05 | | |
| Total return | | | 25.7 | % | | | 19.5 | % | | | 23.9 | % | | | 5.8 | % | | | 40.4 | % | |
| RATIOS/SUPPLEMENTAL DATA: | |
| Net assets, end of period (000's omitted) | | $ | 47,042 | | | $ | 8,018 | | | $ | 2,487 | | | $ | 284 | | | $ | 70 | | |
| Ratio of expenses to average net assets | | | 1.83 | %(iv) | | | 1.83 | % | | | 1.68 | % | | | 1.75 | % | | | 1.74 | % | |
Ratio of net investment income (loss)
to average net assets | | | (1.32 | )% | | | (1.26 | )% | | | (1.20 | )% | | | (1.55 | )% | | | (1.49 | )% | |
| Portfolio turnover rate | | | 67.53 | % | | | 88.67 | % | | | 116.16 | % | | | 135.0 | % | | | 139.97 | % | |
-41-
THE ALGER INSTITUTIONAL FUNDS
Financial Highlights for a share outstanding throughout the period
| ALGER MIDCAP GROWTH INSTITUTIONAL FUND | | CLASS I | |
| | | Year ended
10/31/07 | | Year ended
10/31/06 | | Year ended
10/31/05 | | Year ended
10/31/04 | | Year ended
10/31/03 | |
| INCOME FROM INVESTMENT OPERATIONS | |
| Net asset value, beginning of period | | $ | 17.29 | | | $ | 17.57 | | | $ | 15.38 | | | $ | 14.78 | | | $ | 10.76 | | |
| Net investment income (loss) (ii) | | | (0.11 | ) | | | (0.09 | ) | | | (0.11 | ) | | | (0.13 | ) | | | (0.11 | ) | |
Net realized and unrealized gain
(loss) on investments | | | 7.44 | | | | 1.69 | | | | 2.55 | | | | 0.73 | | | | 4.13 | | |
| Total from investment operations | | | 7.33 | | | | 1.60 | | | | 2.44 | | | | 0.60 | | | | 4.02 | | |
| Distributions from net realized gains | | | (1.38 | ) | | | (1.88 | ) | | | (0.25 | ) | | | — | | | | — | | |
| Net asset value, end of period | | $ | 23.24 | | | $ | 17.29 | | | $ | 17.57 | | | $ | 15.38 | | | $ | 14.78 | | |
| Total return | | | 45.5 | % | | | 9.5 | % | | | 16.0 | % | | | 4.1 | % | | | 37.4 | % | |
| RATIOS/SUPPLEMENTAL DATA: | |
Net assets, end of period
(000's omitted) | | $ | 2,032,326 | | | $ | 1,349,500 | | | $ | 1,093,486 | | | $ | 839,273 | | | $ | 540,742 | | |
| Ratio of expenses to average net assets | | | 1.17 | % | | | 1.13 | % | | | 1.10 | % | | | 1.15 | % | | | 1.17 | % | |
Ratio of net investment income (loss)
to average net assets | | | (0.54 | )% | | | (0.54 | )% | | | (0.64 | )% | | | (0.87 | )% | | | (0.89 | )% | |
| Portfolio turnover rate | | | 274.32 | % | | | 253.59 | % | | | 237.74 | % | | | 190.93 | % | | | 217.33 | % | |
| ALGER CAPITAL APPRECIATION INSTITUTIONAL FUND | | CLASS I | |
| | | Year ended
10/31/07 | | Year ended
10/31/06 | | Year ended
10/31/05 | | Year ended
10/31/04 | | Year ended
10/31/03 | |
| INCOME FROM INVESTMENT OPERATIONS | |
| Net asset value, beginning of period | | $ | 15.77 | | | $ | 13.28 | | | $ | 11.05 | | | $ | 11.06 | | | $ | 8.97 | | |
| Net investment income (loss) (ii) | | | (0.06 | ) | | | (0.06 | ) | | | — | | | | (0.10 | ) | | | (0.06 | ) | |
Net realized and unrealized gain
(loss) on investments | | | 6.56 | | | | 2.55 | | | | 2.23 | | | | 0.09 | | | | 2.15 | | |
| Total from investment operations | | | 6.50 | | | | 2.49 | | | | 2.23 | | | | (0.01 | ) | | | 2.09 | | |
| Net asset value, end of period | | $ | 22.27 | | | $ | 15.77 | | | $ | 13.28 | | | $ | 11.05 | | | $ | 11.06 | | |
| Total return | | | 41.3 | % | | | 18.7 | % | | | 20.2 | % | | | (0.1 | )% | | | 23.3 | % | |
| RATIOS/SUPPLEMENTAL DATA: | |
| Net assets, end of period (000's omitted) | | $ | 537,928 | | | $ | 165,422 | | | $ | 128,646 | | | $ | 124,889 | | | $ | 160,569 | | |
| Ratio of expenses to average net assets | | | 1.23 | % | | | 1.27 | % | | | 1.17 | % | | | 1.23 | % | | | 1.23 | % | |
Ratio of net investment income (loss)
to average net assets | | | (0.33 | )% | | | (0.38 | )% | | | 0.04 | % | | | (0.87 | )% | | | (0.59 | )% | |
| Portfolio turnover rate | | | 232.13 | % | | | 225.25 | % | | | 148.91 | % | | | 160.00 | % | | | 187.72 | % | |
(i) Commenced operations January 27, 2003.
(ii) Amount was computed based on average shares outstanding during the period.
(iii) Ratios have been annualized; total return has not been annualized.
See Notes to Financial Statements.
-42-
| ALGER MIDCAP GROWTH INSTITUTIONAL FUND | | CLASS R | |
| | | Year ended
10/31/07 | | Year ended
10/31/06 | | Year ended
10/31/05 | | Year ended
10/31/04 | | From
1/27/03 to
10/31/03(i)(iii) | |
| INCOME FROM INVESTMENT OPERATIONS | |
| Net asset value, beginning of period | | $ | 16.95 | | | $ | 17.34 | | | $ | 15.25 | | | $ | 14.73 | | | $ | 10.25 | | |
| Net investment income (loss) (ii) | | | (0.20 | ) | | | (0.18 | ) | | | (0.19 | ) | | | (0.21 | ) | | | (0.14 | ) | |
Net realized and unrealized gain
(loss) on investments | | | 7.27 | | | | 1.67 | | | | 2.53 | | | | 0.73 | | | | 4.62 | | |
| Total from investment operations | | | 7.07 | | | | 1.49 | | | | 2.34 | | | | 0.52 | | | | 4.48 | | |
| Distributions from net realized gains | | | (1.38 | ) | | | (1.88 | ) | | | (0.25 | ) | | | — | | | | — | | |
| Net asset value, end of period | | $ | 22.64 | | | $ | 16.95 | | | $ | 17.34 | | | $ | 15.25 | | | $ | 14.73 | | |
| Total return | | | 44.7 | % | | | 9.0 | % | | | 15.4 | % | | | 3.5 | % | | | 43.7 | % | |
| RATIOS/SUPPLEMENTAL DATA: | |
Net assets, end of period
(000's omitted) | | $ | 69,877 | | | $ | 43,355 | | | $ | 22,127 | | | $ | 12,000 | | | $ | 790 | | |
| Ratio of expenses to average net assets | | | 1.67 | % | | | 1.63 | % | | | 1.60 | % | | | 1.65 | % | | | 1.66 | % | |
Ratio of net investment income (loss)
to average net assets | | | (1.04 | )% | | | (1.05 | )% | | | (1.15 | )% | | | (1.37 | )% | | | (1.40 | )% | |
| Portfolio turnover rate | | | 274.32 | % | | | 253.59 | % | | | 237.74 | % | | | 190.93 | % | | | 217.33 | % | |
| ALGER CAPITAL APPRECIATION INSTITUTIONAL FUND | | CLASS R | |
| | | Year ended
10/31/07 | | Year ended
10/31/06 | | Year ended
10/31/05 | | Year ended
10/31/04 | | From
1/27/03 to
10/31/03(i)(iii) | |
| INCOME FROM INVESTMENT OPERATIONS | |
| Net asset value, beginning of period | | $ | 15.47 | | | $ | 13.09 | | | $ | 10.95 | | | $ | 11.01 | | | $ | 8.36 | | |
| Net investment income (loss) (ii) | | | (0.16 | ) | | | (0.15 | ) | | | (0.06 | ) | | | (0.16 | ) | | | (0.08 | ) | |
Net realized and unrealized gain
(loss) on investments | | | 6.44 | | | | 2.53 | | | | 2.20 | | | | 0.10 | | | | 2.73 | | |
| Total from investment operations | | | 6.28 | | | | 2.38 | | | | 2.14 | | | | (0.06 | ) | | | 2.65 | | |
| Net asset value, end of period | | $ | 21.75 | | | $ | 15.47 | | | $ | 13.09 | | | $ | 10.95 | | | $ | 11.01 | | |
| Total return | | | 40.6 | % | | | 18.2 | % | | | 19.5 | % | | | (0.5 | )% | | | 31.7 | % | |
| RATIOS/SUPPLEMENTAL DATA: | |
| Net assets, end of period (000's omitted) | | $ | 39,442 | | | $ | 5,969 | | | $ | 1,073 | | | $ | 706 | | | $ | 66 | | |
| Ratio of expenses to average net assets | | | 1.72 | % | | | 1.79 | % | | | 1.67 | % | | | 1.73 | % | | | 1.72 | % | |
Ratio of net investment income (loss)
to average net assets | | | (0.86 | )% | | | (0.90 | )% | | | (0.51 | )% | | | (1.39 | )% | | | (1.01 | )% | |
| Portfolio turnover rate | | | 232.13 | % | | | 225.25 | % | | | 148.91 | % | | | 160.00 | % | | | 187.72 | % | |
-43-
THE ALGER INSTITUTIONAL FUNDS |
NOTES TO FINANCIAL STATEMENTS
NOTE 1 — General:
The Alger Institutional Funds (formerly The Alger Institutional Fund) (the "Trust"), is a diversified, open-end registered investment company organized as a business trust under the laws of the Commonwealth of Massachusetts. The Trust operates as a series company and currently issues an unlimited number of shares of beneficial interest in four funds—LargeCap Growth Fund, SmallCap Growth Fund, MidCap Growth Fund and Capital Appreciation Fund (collectively, the "Funds" or individually, each a "Fund"). The LargeCap Growth Fund, SmallCap Growth Fund, MidCap Growth Fund and Capital Appreciation Fund normally invest primarily in equity securities and each has an investment objective of long-term capital appreciation.
Each Fund offers Class I and Class R shares. Class R shares were first offered January 27, 2003. Each class has identical rights to assets and earnings except that only Class R shares have a plan of distribution and bear the related expenses.
NOTE 2 — Significant Accounting Policies:
(a) Investment Valuation: Investments of the Funds are valued on each day the New York Stock Exchange (the "NYSE") is open as of the close of the NYSE (currently 4:00 p.m. Eastern time). Securities for which such information is readily available are valued at the last reported sales price or official closing price as reported by an independent pricing service on the primary market or exchange on which they are traded. In the absence of reported sales, securities are valued at a price within the bid and asked price or, in the absence of a recent bid or asked price, the equivalent as obtained from one or more of the major market makers for the securities to be valued.
Securities for which market quotations are not readily available are valued at fair value, as determined in good faith pursuant to procedures established by the Board of Trustees.
Securities in which the Funds invest may be traded in markets that close before the close of the NYSE. Developments that occur between the close of the foreign markets and the close of the NYSE (normally 4:00 p.m. Eastern time) may result in adjustments to the closing prices to reflect what the investment manager, pursuant to policies established by the Board of Trustees, believes to be the fair values of these securities as of the close of the NYSE. The Funds may also fair value securities in other situations, for example, when a particular foreign market is closed but the Funds are open.
Short-term securities having a remaining maturity of sixty days or less are valued at amortized cost which approximates market value. Shares of mutual funds are valued at the net asset value of the underlying mutual fund.
In September 2006, the Financial Accounting Standards Board (FASB) issued Statement on Financial Accounting Standards No. 157, "Fair Value Measurements" (FAS 157). This standard clarifies the definition of fair value for financial reporting,
-44-
THE ALGER INSTITUTIONAL FUNDS |
NOTES TO FINANCIAL STATEMENTS (Continued)
establishes a framework for measuring fair value and requires additional disclosures about the use of fair value measurements. FAS 157 is effective for financial statements issued for fiscal years beginning after November 15, 2007 and interim periods within those fiscal years. The Funds do not believe the adoption of FAS 157 will impact the amounts reported in the financial statements, however, additional disclosures will be required about the inputs used to develop the measurements of fair value and the effect of certain of the measurements reported in the Statement of Operations for a fiscal period.
(b) Securities Transactions and Investment Income: Securities transactions are recorded on a trade date basis. Realized gains and losses from securities transactions are recorded on the identified cost basis. Dividend income is recognized on the ex-dividend date and interest income is recognized on the accrual basis.
Premiums and discounts on debt securities purchased are amortized or accreted over the lives of the respective securities.
(c) Foreign Currency Translations: The books and records of the Funds are maintained in U.S. dollars. Foreign currencies, investments and other assets and liabilities are translated into U.S. dollars at the prevailing rates of exchange on the valuation date. Purchases and sales of investment securities and income and expenses are translated into U.S. dollars at the prevailing exchange rates on the respective dates of such transactions.
Net realized gains and losses on foreign currency transactions represent net gains and losses from the disposition of foreign currencies, currency gains and losses realized between the trade dates and settlement dates of security transactions, and the difference between the amount of net investment income accrued and the U.S. dollar amount actually received. The effects of changes in foreign currency exchange rates on investments in securities are included in realized and unrealized gain or loss on investments in the Statements of Operations.
(d) Repurchase Agreements: The Funds may enter into repurchase agreements with institutions approved by the Board of Trustees. The repurchase agreements are collateralized by U.S. Government and agency securities, which are either received and held in physical possession by the custodian or received by such custodian in book-entry form through the Federal Reserve book-entry system. The collateral is valued on a daily basis during the term of the agreement to ensure that its value equals or exceeds the agreed-upon repurchase price to be repaid to the Funds. Additional collateral is obtained when necessary.
(e) Lending of Fund Securities: The Funds may lend their securities to financial institutions, provided that the market value of the securities loaned will not at any time exceed one third of a Fund's total assets, as defined. The Funds earn fees on the securities loaned. In order to protect against the risk of failure by the borrower to return the securities loaned or any delay in the delivery of such securities, the loan is collateralized by cash, letters of credit or U.S. Government securities that are
-45-
THE ALGER INSTITUTIONAL FUNDS |
NOTES TO FINANCIAL STATEMENTS (Continued)
maintained in an amount equal to at least 100 percent of the current market value of the loaned securities. The market value of the loaned securities is determined at the close of business of the Funds and any required additional collateral is delivered to the Funds on the next business day. There were no securities on loan during the year ended October 31, 2007.
(f) Dividends to Shareholders: Dividends payable to shareholders are recorded on the ex-dividend date. With respect to all Funds, dividends from net investment income and distributions from net realized gains, offset by any loss carry forward, are declared and paid annually after the end of the fiscal year in which earned.
Each class is treated separately in determining the amounts of dividends of net investment income payable to holders of its shares.
The characterization of distributions to shareholders for financial reporting purposes is determined in accordance with federal income tax rules. Therefore, the source of the Funds' distributions may be shown in the accompanying financial statements as either from, or in excess of net investment income, net realized gain on investment transactions or return of capital, depending on the type of book/tax differences that may exist. Capital accounts within the financial statements are adjusted for permanent book/tax differences. Reclassifications result primarily from the differences in tax treatment of net operating losses, foreign currency transactions and amortization adjustments on debt securities. The reclassifications had no impact on the net asset values of the Funds and are designed to present the Funds' capital accounts on a tax basis.
(g) Federal Income Taxes: It is each Fund's policy to comply with the requirements of the Internal Revenue Code applicable to regulated investment companies and to distribute all of its investment company taxable income to its shareholders. Provided a Fund maintains such compliance, no federal income tax provision is required. Each Fund is treated as a separate entity for the purpose of determining such compliance.
The Funds have adopted the Financial Accounting Standards Board Interpretation No. 48 "Accounting for Uncertainty in Income Taxes" (FIN 48). FIN 48 provides guidance for how uncertain tax positions should be recognized, measured, presented and disclosed in the financial statements. FIN 48 requires the evaluation of tax positions taken or expected to be taken in the course of preparing the Funds' tax returns to determine whether the tax positions are "more-likely-than-not" of being sustained by the applicable tax authority. Tax positions not deemed to meet the more-likely-than-not threshold would be recorded as a tax benefit or expense in the current year. As result of FIN 48 adoption, there were no positions that required a tax benefit or expense to be recorded in the current year.
(h) Allocation Methods: The Trust accounts separately for the assets, liabilities and operations of each Fund. Expenses directly attributable to each Fund are charged to that Fund's operations; expenses which are applicable to all Funds are
-46-
THE ALGER INSTITUTIONAL FUNDS |
NOTES TO FINANCIAL STATEMENTS (Continued)
allocated among them based on net assets. Income, realized and unrealized gains and losses, and expenses of each Fund, are allocated among the Fund's classes based on relative net assets, with the exception of distribution fees, which are only applicable to Class R shares.
(i) Indemnification: The Trust enters into contracts that contain a variety of indemnification provisions. The Trust's maximum exposure under these arrangements is unknown. The Trust does not anticipate recognizing any loss related to these arrangements.
(j) Other: These financial statements have been prepared in accordance with U.S. generally accepted accounting principles, which require using estimates and assumptions that affect the reported amounts therein. Actual results may differ from those estimates.
NOTE 3 — Investment Advisory Fees and Other Transactions with Affiliates:
(a) Investment Advisory and Administration Fees: Fees incurred by each Fund, pursuant to the provisions of its Investment Advisory Agreement and Administration Agreement with Fred Alger Management, Inc. (Alger Management), are payable monthly and computed based on the value of the average daily net assets of each Fund, at the following rates:
| | | Advisory Fee | | Administration Fee | |
| LargeCap Growth Fund | | | .71 | % | | | .04 | % | |
| SmallCap Growth Fund | | | .81 | | | | .04 | | |
| MidCap Growth Fund | | | .76 | | | | .04 | | |
| Capital Appreciation Fund | | | .81 | | | | .04 | | |
Prior to September 12, 2006, Alger Management provided both advisory services and administrative services to each Fund pursuant to a separate investment management agreement with each Fund.
(b) Distribution Fees: Class R Shares: The Funds have adopted a Distribution Plan pursuant to which Class R shares of each Fund pays Fred Alger & Company, Incorporated, the Trust's distributor (the "Distributor") and an affiliate of Alger Management, a fee at the annual rate of .50% of the respective average daily net assets of the Class R shares of the designated Funds to compensate the Distributor for its activities and expenses incurred in distributing the Class R shares. The fees charged may be more or less than the expenses incurred by the Distributor.
(c) Brokerage Commissions: During the year ended October 31, 2007, the LargeCap Growth Fund, the SmallCap Growth Fund, the MidCap Growth Fund and the Capital Appreciation Fund paid the Distributor commissions of $200,155, $500,758, $3,891,500 and $621,319, respectively, in connection with securities transactions.
-47-
THE ALGER INSTITUTIONAL FUNDS |
NOTES TO FINANCIAL STATEMENTS (Continued)
(d) Shareholder Administrative Fees: The Trust has entered into a shareholder administrative services agreement with Alger Shareholder Services, Inc. ("Alger Services") to compensate Alger Services on a per account basis for its liaison and administrative oversight of Boston Financial Data Services, Inc., the transfer agent and other related services. On June 30, 2007, the shareholder administrative services agreement was assigned to Alger Management. During the year ended October 31, 2007, the LargeCap Growth Fund, the SmallCap Growth Fund, the MidCap Growth Fund and the Capital Appreciation Fund incurred fees of $241, $109,647, $6,261 and $1,208 respectively, for these services provided by Alger Services which are included in Transfer Agent fees and expenses.
(e) Shareholder Servicing Fees: Effective June 1, 2007, the Trust has entered into a shareholder servicing agreement with Alger Inc. whereby Alger Inc. provides the Trust with ongoing servicing of shareholder accounts. As Compensation for such services, each Fund pays Alger Inc. a monthly fee at an annual rate of .25% of the value of its average daily net assets. During the year ended October 31, 2007 Alger Inc. waived $191,212 of its shareholder service fees for the SmallCap Growth Fund.
(f) Trustee Fees: Each Fund pays each trustee who is not affiliated with Alger Management or its affiliates $500 for each meeting attended, to a maximum of $2,000 per annum. The Chairman of the Board of Trustees receives an additional annual fee of $10,000 which is paid, pro rata, by all funds managed by Alger Management. Additionally, each member of the audit committee receives an additional $50 from each Fund for each audit committee meeting attended, to a maximum of $200 per annum.
(g) Other Transactions With Affiliates: Certain trustees and officers of the Trust are directors and officers of Alger Management, the Distributor and Alger Services.
NOTE 4 — Securities Transactions:
The following summarizes the securities transactions by the Funds, other than short-term securities, for the year ended October 31, 2007:
| | | PURCHASES | | SALES | |
| LargeCap Growth Fund | | $ | 130,078,082 | | | $ | 199,078,405 | | |
| SmallCap Growth Fund | | | 835,523,100 | | | | 381,468,083 | | |
| MidCap Growth Fund | | | 4,272,243,614 | | | | 4,187,408,104 | | |
| Capital Appreciation Fund | | | 932,132,938 | | | | 647,049,348 | | |
NOTE 5 — Lines of Credit:
The Trust participates in $50 million committed lines of credit with other mutual funds managed by Alger Management. All borrowings have variable interest rates and are payable on demand.
-48-
THE ALGER INSTITUTIONAL FUNDS |
NOTES TO FINANCIAL STATEMENTS (Continued)
With the exception of the Capital Appreciation Fund, the Trust borrows under such lines of credit exclusively for temporary or emergency purposes. The Capital Appreciation Fund may borrow under these lines up to 1/3 of the value of its assets, to purchase additional securities. To the extent the Capital Appreciation Fund borrows under these lines, it must pledge securities with a total value of at least twice the amount borrowed. For the year ended October 31, 2007, the Trust had the following borrowings:
| | | AVERAGE
BORROWING | | WEIGHTED AVERAGE
INTEREST RATE | |
| LargeCap Growth Fund | | $ | 416,866 | | | | 5.87 | % | |
| MidCap Growth Fund | | | 684,187 | | | | 5.86 | | |
| Capital Appreciation Fund | | | 55,979 | | | | 5.84 | | |
NOTE 6 — Share Capital:
The Trust has an unlimited number of authorized shares of beneficial interest of $.001 par value which are presently divided into four series. Each series is divided into two separate classes.
During the year ended October 31, 2007, transactions of shares of beneficial interest were as follows:
| | | SHARES | | AMOUNT | |
| LARGECAP GROWTH FUND | |
| Class I | |
| Shares sold | | | 1,570,277 | | | $ | 23,081,729 | | |
| Shares redeemed | | | (6,507,676 | ) | | | (91,837,212 | ) | |
| Net decrease | | | (4,937,399 | ) | | $ | (68,755,483 | ) | |
| Class R | |
| Shares sold | | | 303,055 | | | $ | 4,427,270 | | |
| Shares redeemed | | | (185,509 | ) | | | (2,640,940 | ) | |
| Net increase | | | 117,546 | | | $ | 1,786,330 | | |
| SMALLCAP GROWTH FUND | |
| Class I | |
| Shares sold | | | 23,138,022 | | | $ | 612,294,019 | | |
| Shares redeemed | | | (6,357,696 | ) | | | (170,766,850 | ) | |
| Net increase | | | 16,780,326 | | | $ | 441,527,169 | | |
| Class R | |
| Shares sold | | | 1,560,038 | | | $ | 40,720,126 | | |
| Shares redeemed | | | (313,081 | ) | | | (8,243,204 | ) | |
| Net increase | | | 1,246,957 | | | $ | 32,476,922 | | |
-49-
THE ALGER INSTITUTIONAL FUNDS |
NOTES TO FINANCIAL STATEMENTS (Continued)
| | | SHARES | | AMOUNT | |
| MIDCAP GROWTH FUND | |
| Class I | |
| Shares sold | | | 36,433,129 | | | $ | 720,986,230 | | |
| Dividends reinvested | | | 5,120,164 | | | | 86,991,587 | | |
| Shares redeemed | | | (32,166,978 | ) | | | (600,856,130 | ) | |
| Net increase | | | 9,386,315 | | | $ | 207,121,687 | | |
| Class R | |
| Shares sold | | | 1,665,514 | | | $ | 31,680,100 | | |
| Dividends reinvested | | | 82,715 | | | | 1,374,727 | | |
| Shares redeemed | | | (1,218,937 | ) | | | (22,592,443 | ) | |
| Net increase | | | 529,292 | | | $ | 10,462,384 | | |
| CAPITAL APPRECIATION FUND | |
| Class I | |
| Shares sold | | | 16,699,383 | | | $ | 324,186,877 | | |
| Shares redeemed | | | (3,037,507 | ) | | | (54,972,793 | ) | |
| Net increase | | | 13,661,876 | | | $ | 269,214,084 | | |
| Class R | |
| Shares sold | | | 1,724,940 | | | $ | 32,565,363 | | |
| Shares redeemed | | | (297,044 | ) | | | (5,578,512 | ) | |
| Net increase | | | 1,427,896 | | | $ | 26,986,851 | | |
During the year ended October 31, 2006, transactions of shares of beneficial interest were as follows:
| | | SHARES | | AMOUNT | |
| LARGECAP GROWTH FUND | |
| Class I | |
| Shares sold | | | 3,921,109 | | | $ | 51,683,461 | | |
| Dividends reinvested | | | 20,722 | | | | 273,536 | | |
| Shares redeemed | | | (2,817,147 | ) | | | (36,789,942 | ) | |
| Net increase | | | 1,124,684 | | | $ | 15,167,055 | | |
| Class R | |
| Shares sold | | | 219,484 | | | $ | 2,803,283 | | |
| Shares redeemed | | | (116,309 | ) | | | (1,476,799 | ) | |
| Net increase | | | 103,175 | | | $ | 1,326,484 | | |
-50-
THE ALGER INSTITUTIONAL FUNDS |
NOTES TO FINANCIAL STATEMENTS (Continued)
| | | SHARES | | AMOUNT | |
| SMALLCAP GROWTH FUND | |
| Class I | |
| Shares sold | | | 12,642,855 | | | $ | 281,936,224 | | |
| Shares redeemed | | | (3,454,359 | ) | | | (76,906,608 | ) | |
| Net increase | | | 9,188,496 | | | $ | 205,029,616 | | |
| Class R | |
| Shares sold | | | 298,488 | | | $ | 6,671,538 | | |
| Shares redeemed | | | (84,486 | ) | | | (1,866,094 | ) | |
| Net increase | | | 214,002 | | | $ | 4,805,444 | | |
| MIDCAP GROWTH FUND | |
| Class I | |
| Shares sold | | | 32,177,723 | | | $ | 552,880,702 | | |
| Dividends reinvested | | | 7,207,281 | | | | 119,857,101 | | |
| Shares redeemed | | | (23,558,169 | ) | | | (401,128,905 | ) | |
| Net increase | | | 15,826,835 | | | $ | 271,608,898 | | |
| Class R | |
| Shares sold | | | 1,899,043 | | | $ | 32,142,686 | | |
| Dividends reinvested | | | 160,761 | | | | 2,631,661 | | |
| Shares redeemed | | | (778,583 | ) | | | (12,953,036 | ) | |
| Net increase | | | 1,281,221 | | | $ | 21,821,311 | | |
| CAPITAL APPRECIATION FUND | |
| Class I | |
| Shares sold | | | 4,726,152 | | | $ | 68,538,809 | | |
| Dividends reinvested | | | 3,291 | | | | 46,419 | | |
| Shares redeemed | | | (3,925,581 | ) | | | (57,214,764 | ) | |
| Net increase | | | 803,862 | | | $ | 11,370,464 | | |
| Class R | |
| Shares sold | | | 388,014 | | | $ | 5,631,245 | | |
| Shares redeemed | | | (84,179 | ) | | | (1,216,964 | ) | |
| Net increase | | | 303,835 | | | $ | 4,414,281 | | |
-51-
THE ALGER INSTITUTIONAL FUNDS |
NOTES TO FINANCIAL STATEMENTS (Continued)
NOTE 7 — Tax Character of Distributions to Shareholders:
The tax character of distributions paid during the year ended October 31, 2007 and the year ended October 31, 2006 were as follows:
| | | YEAR ENDED
OCTOBER 31, 2007 | | YEAR ENDED
OCTOBER 31, 2006 | |
| LARGECAP GROWTH FUND | |
| Distributions paid from: | |
| Ordinary Income | | $ | — | | | $ | 274,583 | | |
| Long-term capital gain | | | — | | | | — | | |
| Total distributions paid | | $ | — | | | $ | 274,583 | | |
| MIDCAP GROWTH FUND | |
| Distributions paid from: | |
| Ordinary income | | $ | 48,716,257 | | | $ | 93,050,670 | | |
| Long-term capital gain | | | 60,684,009 | | | | 30,203,934 | | |
| Total distributions paid | | $ | 109,400,266 | | | $ | 123,254,604 | | |
| CAPITAL APPRECIATION FUND | |
| Distributions paid from: | |
| Ordinary income | | $ | — | | | $ | 46,486 | | |
| Long-term capital gain | | | — | | | | — | | |
| Total distributions paid | | $ | — | | | $ | 46,486 | | |
As of October 31, 2007, the components of distributable earnings on a tax basis were as follows:
| LARGECAP GROWTH FUND | |
| Undistributed ordinary income | | $ | — | | |
| Undistributed long-term gain | | | — | | |
| Unrealized appreciation | | $ | 8,186,352 | | |
| SMALLCAP GROWTH FUND | |
| Undistributed ordinary income | | $ | — | | |
| Undistributed long-term gain | | | — | | |
| Unrealized appreciation | | | 141,386,221 | | |
| MIDCAP GROWTH FUND | |
| Undistributed ordinary income | | $ | 295,570,615 | | |
| Undistributed long-term gain | | | 22,157,687 | | |
| Unrealized appreciation | | | 345,939,590 | | |
| CAPITAL APPRECIATION FUND | |
| Undistributed ordinary income | | $ | — | | |
| Undistributed long-term gain | | | — | | |
| Unrealized appreciation | | | 58,267,522 | | |
The differences between book basis and tax basis unrealized appreciation is determined annually and is attributable primarily to the tax deferral of losses on wash sales.
-52-
THE ALGER INSTITUTIONAL FUNDS |
NOTES TO FINANCIAL STATEMENTS (Continued)
At October 31, 2007, the Funds, for federal income tax purposes, had capital loss carryforwards which expire as set forth in the table below. These amounts may be applied against future net realized gains until the earlier of their utilization or expiration.
EXPIRATION DATE
| | | 2010 | | 2011 | | 2012 | | 2013 | | 2014 | | TOTAL | |
| LargeCap Growth Fund | | $ | 945,854 | | | $ | 5,070,663 | | | | — | | | | — | | | | — | | | $ | 6,016,517 | | |
| SmallCap Growth Fund | | $ | 5,654,698 | | | | — | | | | — | | | | — | | | | — | | | $ | 5,654,698 | | |
| Capital Appreciation Fund | | $ | 9,021,946 | | | | — | | | | — | | | | — | | | | — | | | $ | 9,021,946 | | |
NOTE 8 — Litigation:
Alger Management has responded to inquiries, document requests and/or subpoenas from various regulatory authorities, in connection with their investigations of practices in the mutual fund industry identified as "market timing" and "late trading." On October 11, 2006, Alger Management, Alger Inc. and Alger Shareholder Services, Inc. executed an Assurance of Discontinuance with the Office of the New York State Attorney General ("NYAG"). On January 18, 2007 the Securities and Exchange Commission issued an order implementing settlements reached with Alger Management and Alger Inc. As part of the settlements with the Commission and the NYAG, without admitting or denying liability, the firms paid $30 million to reimburse fund shareholders and a fine of $10 million; and agreed to certain other remedial measures including a reduction in management fees of $1 million per year for five years. The entire $40 million and fee reduction will be available for the benefit of investors. Alger Management has advised the Funds that the settlement has not adversely affected the operations of Alger Management, Alger Inc. or their affiliates, or adversely affected their ability to continue to provide services to the Funds.
On August 31, 2005, the West Virginia Securities Commissioner (the "WVSC") in an ex parte Summary Order to Cease and Desist and Notice of Right to Hearing concluded that Alger Management and Alger Inc. had violated the West Virginia Uniform Securities Act (the "WVUSA"), and ordered Alger Management and Alger Inc. to cease and desist from further violations of the WVUSA by engaging in the market-timing related conduct described in the order. The ex parte order provided notice of their right to a hearing with respect to the violations of law asserted by the WVSC. Other firms unaffiliated with Alger Management were served with similar orders. Alger Management and Alger Inc. intend to request a hearing for the purpose of seeking to vacate or modify the order.
In addition, in 2003 and 2004 several purported class actions and shareholder derivative suits were filed against various parties in the mutual fund industry, including Alger Management, certain mutual funds managed by Alger Management (the "Alger Mutual Funds"), and certain current and former Alger Mutual Fund trustees and officers, alleging wrongful conduct related to market-timing and
-53-
THE ALGER INSTITUTIONAL FUNDS |
NOTES TO FINANCIAL STATEMENTS (Continued)
late-trading by mutual fund shareholders. These cases were transferred to the U.S. District Court of Maryland by the Judicial Panel on Multidistrict Litigation for consolidated pre-trial proceedings. In September 2004, consolidated amended complaints involving these cases — a Consolidated Amended Fund Derivative Complaint (the "Derivative Complaint") and two substantially identical Consolidated Amended Class Action Complaints (together, the "Class Action Complaint") — were filed in the Maryland federal district court under the caption number 1:04-MD-15863 (JFM). In April 2005, a civil lawsuit involving similar allegations was filed by the West Virginia Attorney General and also transferred to the Maryland District Court, but such lawsuit has since been withdrawn.
The Derivative Complaint alleged (i) violations, by Alger Management and, depending on the specific offense alleged, by Alger Inc. and/or the fund trustee defendants, of Sections 36(a), 36(b), 47, and 48 of the Investment Company Act of 1940, as amended, (the "Investment Company Act") and of Sections 206 and 215 of the Investment Advisers Act of 1940, as amended, breach of fiduciary duty, and breach of contract, (ii) various offenses by other third-party defendants, and (iii) unjust enrichment by all the named defendants. The Class Action Complaint alleged, in addition to the offenses listed above, (i) violations, by Alger Management, Alger Inc., their affiliates, the funds named as defendants, including the Funds, and the current and former fund trustees and officers, of Sections 11, 12(a)(2), and 15 of the Securities Act of 1933, as amended, Sections 10(b) (and Rule 10b-5 thereunder) and 20(a) of the Securities Exchange Act of 1934, as ame nded, (the "1934 Act"), and Section 34(b) of the Investment Company Act, (ii) breach of contract by the funds named as defendants, and (iii) unjust enrichment of the defendants.
Motions to dismiss the Class Action Complaint and the Derivative Complaint were subsequently filed.
As a result of a series of court orders, all claims in the Class Action Complaint and the Derivative Complaint have been dismissed, other than claims under the 1934 Act against Alger Management, Alger Inc., Alger Associates, Inc. and Alger Shareholder Services, Inc., and certain present and former members of the senior management of Alger Management and/or Alger Inc., and claims under Section 36(b) of the Investment Company Act against Alger Management, Alger Inc., Alger Associates, Inc. and Alger Shareholder Services, Inc.
-54-
REPORT OF INDEPENDENT REGISTERED PUBLIC ACCOUNTING FIRM
To the Shareholders and Board of Trustees of
The Alger Institutional Funds:
We have audited the accompanying statements of assets and liabilities, including the schedules of investments, of The Alger Institutional Funds (comprising the LargeCap Growth Institutional Fund, SmallCap Growth Institutional Fund, MidCap Growth Institutional Fund and Capital Appreciation Institutional Fund) (collectively, the "Funds"), as of October 31, 2007, and the related statements of operations for the year then ended, and the statements of changes in net assets and the financial highlights for each of the periods indicated therein. These financial statements and financial highlights are the responsibility of the Funds' management. Our responsibility is to express an opinion on these financial statements and financial highlights based on our audits.
We conducted our audits in accordance with the standards of the Public Company Accounting Oversight Board (United States). Those standards require that we plan and perform the audit to obtain reasonable assurance about whether the financial statements and financial highlights are free of material misstatement. We were not engaged to perform an audit of the Funds' internal control over financial reporting. Our audits included consideration of internal control over financial reporting as a basis for designing audit procedures that are appropriate in the circumstances, but not for the purpose of expressing an opinion on the effectiveness of the Funds' internal control over financial reporting. Accordingly, we express no such opinion. An audit also includes examining, on a test basis, evidence supporting the amounts and disclosures in the financial statements and financial highlights, assessing the accounting principles used and significant esti mates made by management, and evaluating the overall financial statement presentation. Our procedures included confirmation of securities owned as of October 31, 2007, by correspondence with the custodian and brokers. We believe that our audits provide a reasonable basis for our opinion.
In our opinion, the financial statements and financial highlights referred to above present fairly, in all material respects, the financial position of The Alger Institutional Funds at October 31, 2007, the results of its operations for the year then ended, and the changes in its net assets and the financial highlights for each of the indicated periods, in conformity with U.S. generally accepted accounting principles.

December 14, 2007
-55-
THE ALGER INSTITUTIONAL FUNDS
ADDITIONAL INFORMATION (Unaudited)
Shareholder Expense Example
As a shareholder of the Funds, you incur two types of costs: transaction costs, if applicable, and ongoing costs, including management fees, distribution (12b-1) fees, if applicable, and other fund expenses. This example is intended to help you understand your ongoing costs (in dollars) of investing in the Funds and to compare these costs with the ongoing costs of investing in other mutual funds.
The example below is based on an investment of $1,000 invested at the beginning of the six-month period starting May 1, 2007 and ending October 31, 2007.
Actual Expenses
The first line for each class of shares in the table below provides information about actual account values and actual expenses. You may use the information in this line, together with the amount you invested, to estimate the expenses that you would have paid over the period. Simply divide your account value by $1,000 (for example, an $8,600 account value divided by $1,000 = 8.6), then multiply the result by the number in the first line under the heading entitled "Expenses Paid During the Period" to estimate the expenses you paid on your account during this period.
Hypothetical Example for Comparison Purposes
The second line for each class of shares in the table below provides information about hypothetical account values and hypothetical expenses based on the Fund's actual expense ratios for each class of shares and an assumed rate of return of 5% per year before expenses, which is not the Fund's actual return. The hypothetical account values and expenses may not be used to estimate the actual ending account balance or expenses you paid for the period. You may use this information to compare the ongoing costs of investing in the Funds and other funds. To do so, compare this 5% hypothetical example with the 5% hypothetical examples that appear in the shareholder reports of other funds.
Please note that the expenses shown in the table are meant to highlight your ongoing costs only and do not reflect any transaction costs. Therefore, the second line under each class of shares in the table is useful in comparing ongoing costs only, and will not help you determine the relative total costs of owning different funds. In addition, if these transactional costs were included, your costs would have been higher.
-56-
THE ALGER INSTITUTIONAL FUNDS
ADDITIONAL INFORMATION (Unaudited) (Continued)
Shareholder Expense Example (Continued)
| | | | Beginning
Account
Value
May 1,
2007 | | Ending
Account
Value
October 31,
2007 | | Expenses
Paid During
the Period
May 1, 2007
to October 31,
2007(b) | | Ratio of
Expenses to
Average
Net Assets
For the
Six Months
Ended
October 31,
2007(c) | |
| ALGER LARGECAP GROWTH INSTITUTIONAL FUND | |
| Class I | | Actual | | $ | 1,000.00 | | | $ | 1,159.50 | | | $ | 7.18 | | | | 1.32 | % | |
| | | Hypothetical(a) | | | 1,000.00 | | | | 1,018.55 | | | | 6.72 | | | | 1.32 | | |
| Class R | | Actual | | | 1,000.00 | | | | 1,156.10 | | | | 9.84 | | | | 1.81 | | |
| | | Hypothetical(a) | | | 1,000.00 | | | | 1,016.08 | | | | 9.20 | | | | 1.81 | | |
| ALGER SMALLCAP GROWTH INSTITUTIONAL FUND | |
| Class I | | Actual | | $ | 1,000.00 | | | $ | 1,147.70 | | | $ | 7.04 | | | | 1.30 | % | |
| | | Hypothetical(a) | | | 1,000.00 | | | | 1,018.65 | | | | 6.61 | | | | 1.30 | | |
| Class R | | Actual | | | 1,000.00 | | | | 1,144.40 | | | | 9.89 | | | | 1.83 | | |
| | | Hypothetical(a) | | | 1,000.00 | | | | 1,015.98 | | | | 9.30 | | | | 1.83 | | |
| ALGER MIDCAP GROWTH INSTITUTIONAL FUND | |
| Class I | | Actual | | $ | 1,000.00 | | | $ | 1,247.50 | | | $ | 6.63 | | | | 1.17 | % | |
| | | Hypothetical(a) | | | 1,000.00 | | | | 1,019.31 | | | | 5.96 | | | | 1.17 | | |
| Class R | | Actual | | | 1,000.00 | | | | 1,244.60 | | | | 9.45 | | | | 1.67 | | |
| | | Hypothetical(a) | | | 1,000.00 | | | | 1,016.79 | | | | 8.49 | | | | 1.67 | | |
| ALGER CAPITAL APPRECIATION INSTITUTIONAL FUND | |
| Class I | | Actual | | $ | 1,000.00 | | | $ | 1,211.00 | | | $ | 6.85 | | | | 1.23 | % | |
| | | Hypothetical(a) | | | 1,000.00 | | | | 1,019.00 | | | | 6.26 | | | | 1.23 | | |
| Class R | | Actual | | | 1,000.00 | | | | 1,207.70 | | | | 9.57 | | | | 1.72 | | |
| | | Hypothetical(a) | | | 1,000.00 | | | | 1,016.53 | | | | 8.74 | | | | 1.72 | | |
(a) 5% annual return before expenses.
(b) Expenses are equal to the annualized expense ratio of the respective share class, multiplied by the average account value over the period, multiplied by 184/365 (to reflect the one-half year period).
(c) Annualized.
Tax Information (Unaudited)
In accordance with subchapter M of the Internal Revenue Code of 1986, as amended, for the year ended October 31, 2007, 9.33%, of the MidCap Growth Funds ordinary dividend, respectively, qualified for the dividends received deduction for corporations. For the year ended October 31, 2007, certain dividends paid by the funds may be subject to a maximum rate of 15%, as provided by the Jobs and Growth Tax Relief Reconciliation Act of 2003. Of the distributions paid during the fiscal year, the following represents the maximum amount that may be considered qualified dividend income:
| MidCap Growth Fund | | $ | 4,417,894 | | |
-57-
THE ALGER INSTITUTIONAL FUNDS
ADDITIONAL INFORMATION (Unaudited) (Continued)
Shareholders should not use the above information to prepare their tax returns. Since the Trust's fiscal year is not the calendar year, another notification will be sent with respect to calendar year 2007. Such notification, which will reflect the amount to be used by taxpayers on their federal income tax returns, will be made in conjunction with Form 1099 DIV and will be mailed in January 2008. Shareholders are advised to consult their own tax advisers with respect to the tax consequences of their investment in the Trust.
Trustees and Officers of the Funds (Unaudited)
Information about the Trustees and officers of the Funds is set forth below. In the table the term "Alger Fund Complex" refers to the Funds, The Alger Funds, The Alger American Fund, The Spectra Funds, The China-U.S. Growth Fund and Castle Convertible Fund, Inc., each of which is a registered investment company managed by Fred Alger Management, Inc. ("Alger Management"). Each Trustee serves until an event of termination, such as death or resignation, or until his successor is duly elected; each officer's term of office is one year. Unless otherwise noted, the address of each person named below is 111 Fifth Avenue, New York, NY 10003.
Name, Age,
Position with the Fund | | Principal Occupations | | Trustee
and/or
Officer Since | | Number of
Portfolios in the
Alger Fund
Complex which
are Overseen
by Trustee | |
| INTERESTED TRUSTEE | |
|
| Hilary M. Alger, CFA (45) | | Director of Development, Pennsylvania Ballet since 2004; Associate Director of Development, College of Arts and Sciences and Graduate School, University of Virginia 1999–2003. | | | 2003 | | | | 27 | | |
|
| NON-INTERESTED TRUSTEES | |
|
| Charles F. Baird, Jr. (54) | | Managing Partner of North Castle Partners, a private equity securities group; Chairman of Leiner Health Products, Enzymatic Therapy and Caleel & Hayden (skincare business); former Chairman of Elizabeth Arden Day Spas, Naked Juice, Equinox (fitness company) and EAS (manufacturer of nutritional products). Formerly Managing Director of AEA Investors, Inc. | | | 2000 | | | | 27 | | |
|
-58-
THE ALGER INSTITUTIONAL FUNDS
ADDITIONAL INFORMATION (Unaudited) (Continued)
Name, Age,
Position with the Fund | | Principal Occupations | | Trustee
and/or
Officer Since | | Number of
Portfolios in the
Alger Fund
Complex which
are Overseen
by Trustee | |
| NON-INTERESTED TRUSTEES (Continued) | |
|
| Roger P. Cheever (62) | | Senior Associate Dean of Development, Harvard University. Formerly Deputy Director of the Harvard College Fund. | | | 2000 | | | | 27 | | |
|
| Lester L. Colbert, Jr. (73) | | Private investor since 1988. Formerly, Chairman of the Board, President and Chief Executive Officer of Xidex Corporation (manufacturer of computer information media). | | | 2000 | | | | 27 | | |
|
| Stephen E. O'Neil (75) | | Attorney; Private investor since 1981. Formerly of Counsel to the law firm of Kohler & Barnes. | | | 1993 | | | | 27 | | |
|
| David Rosenberg (45) | | Associate Professor of Law since January 2006 (Assistant Professor 2000-2005), Zicklin School of Business, Baruch College, City University of New York. | | | 2007 | | | | 27 | | |
|
| Nathan E. Saint-Amand, M.D. (69) | | Medical doctor in private practice; Member of the Board of the Manhattan Institute (non-profit policy research) since 1988. Formerly Co-Chairman, Special Projects Committee, Memorial Sloan Kettering. | | | 1993 | | | | 27 | | |
|
| OFFICERS | |
|
Daniel C. Chung (45)
President | | President since September 2003 and Chief Investment Officer and Director since 2001 of Alger Management; President since 2003 and Director since 2001 of Alger Associates, Fred Alger International Advisory S.A. (Director since 2003) and Analysts Resources, Inc. ("ARI"). Formerly, Director of the Fund from 2001-2006. | | | 2001 | | | | N/A | | |
|
-59-
THE ALGER INSTITUTIONAL FUNDS
ADDITIONAL INFORMATION (Unaudited) (Continued)
Name, Age,
Position with the Fund | | Principal Occupations | | Trustee
and/or
Officer Since | | Number of
Portfolios in the
Alger Fund
Complex which
are Overseen
by Trustee | |
| OFFICERS (Continued) | |
|
Hal Liebes (43)
Secretary | | Executive Vice President, Director, Chief Legal Officer, Chief Operating Officer, and Secretary of Fred Alger & Company, Incorporated and Alger Management; Director since 2006 of Alger Associates, and ARI. Formerly Chief Compliance Officer of AMVESCAP PLC from 2004-2005; U.S. General Counsel from 1994-2002 and Global General Counsel from 2002-2004 of Credit Suisse Asset Management. | | | 2005 | | | N/A | |
|
| Michael D. Martins (42) Treasurer | | Senior Vice President of Alger Management; Assistant Treasurer from 2005 to 2006 of the Fund. Formerly Vice President, Brown Brothers Harriman & Co. from 1997–2004. | | | 2005 | | | N/A | |
|
| Lisa A. Moss (42) Assistant Secretary | | Vice President and Assistant General Counsel of Alger Management since June 2006. Formerly, Director of Merrill Lynch Investment Managers, L.P. from 2005–2006; Assistant General Counsel of AIM Management, Inc. from 1995–2005. | | | 2006 | | | N/A | |
|
| Barry J. Mullen (54) Chief Compliance Officer | | Senior Vice President and Director of Compliance of Alger Management since May 2006. Formerly, Director of BlackRock, Inc. from 2004–2006; Vice President of J.P. Morgan Investment Management from 1996–2004. | | | 2006 | | | N/A | |
|
| Anthony S. Caputo (52) Assistant Treasurer | | Employed by Alger Management since 1986, currently serving as Vice President. | | | 2007 | | | N/A | |
|
| Sergio M. Pavone (46) Assistant Treasurer | | Employed by Alger Management since 2002, currently serving as Vice President. | | | 2007 | | | N/A | |
|
Ms. Alger and Mr. Chung are "interested persons" (as defined in the Investment Company Act) of the Fund because of their affiliations with Alger Management. No Trustee is a director of any public company except as may be indicated under "Principal Occupations."
The Statement of Additional Information contains additional information about the Funds' Trustees and is available without charge upon request by calling (800) 992-3863.
-60-
THE ALGER INSTITUTIONAL FUNDS
ADDITIONAL INFORMATION (Unaudited) (Continued)
Investment Management Agreement Renewal (Unaudited)
At an in-person meeting held on September 12, 2007, the Trustees, including the Independent Trustees, unanimously approved renewal of the Investment Advisory Agreement between the Trust and Alger Management (the "Agreement"). The Independent Trustees were assisted in their review by independent legal counsel and met with counsel in executive session separate from representatives of Alger Management.
In evaluating the Agreement, the Trustees drew on materials that they had requested and which were provided to them in advance of the meeting by Alger Management and by counsel. The materials covered, among other matters, (i) the nature, extent and quality of the services provided by Alger Management under the Agreement, (ii) the investment performance of the Trust's portfolios (each a "Fund"), (iii) the costs to Alger Management of its services and the profits realized by Alger Management and Alger Inc. from their relationship with the Trust, and (iv) the extent to which economies of scale would be realized if and as the Funds grow and whether the fee levels in the Agreement reflect these economies of scale. These materials included an analysis of the Funds and Alger Management's services by Callan Associates Inc. ("Callan"), an independent consulting firm whose specialties include assistance to fund trustees and directors in their review o f advisory contracts pursuant to section 15(c) of the 1940 Act. At the meeting, senior Callan personnel provided a presentation to the Trustees based on the Callan materials.
In deciding whether to approve renewal of the Agreement, the Trustees considered various factors, including those enumerated above. They also considered other direct and indirect benefits to Alger Management and its affiliates from their relationship with the Trust.
NATURE, EXTENT AND QUALITY OF SERVICES
In considering the nature, extent and quality of the services provided by Alger Management pursuant to the Agreement, the Trustees relied on their prior experience as Trustees of the Trust, their familiarity with the personnel and resources of Alger Management and its affiliates, and the materials provided at the meeting. They noted that under the Agreement Alger Management is responsible for managing the investment operations of the Funds. They also noted that administrative, compliance, reporting and accounting services necessary for the conduct of the Trust's affairs are provided under the separate Administration Agreement. The Trustees reviewed the background and experience of Alger Management's senior investment management personnel, including the individuals currently responsible for the investment operations of the Funds. They also considered the resources, operational structures and practices of Alger Management in managing each Fund 's portfolio and administering the Trust's affairs, as well as Alger Management's overall investment management business. They noted especially Alger Management's history of expertise in managing portfolios of "growth" stocks. They also noted the history of favorable reviews of Alger Management's shareholder-relations representatives by an independent rating concern. The Trustees concluded that Alger Management's experience, resources and strength
-61-
THE ALGER INSTITUTIONAL FUNDS
ADDITIONAL INFORMATION (Unaudited) (Continued)
in the areas of importance to the Funds are considerable. The Trustees considered the level and depth of Alger Management's ability to execute portfolio transactions to effect investment decisions, including those through Alger Inc. The Trustees also considered the ongoing enhancements to the control and compliance environment at Alger Management and within the Trust.
INVESTMENT PERFORMANCE OF THE FUNDS
Drawing upon information provided at the meeting by Alger Management as well as Callan and upon reports provided to the Trustees by Alger Management throughout the preceding year, the Trustees noted that the performance of each of the Trust's four Funds for the year-to-date (at August 31, 2007), 1-year and 3-year periods was excellent, with each portfolio placing well above the median relative to its peers and in most cases above its benchmark as well.
FUND FEES AND EXPENSE RATIOS; PROFITABILITY TO ALGER MANAGEMENT AND ITS AFFILIATES
The Trustees considered the profitability of the Investment Advisory Agreement to Alger Management and its affiliates, and the methodology used by Alger Management in determining such profitability. The Trustees reviewed previously-provided data on each Fund's profitability to Alger Management and its affiliates for the year ended June 30, 2007. In addition, the Trustees reviewed each Fund's management fee and expense ratio and compared them with a group of comparable funds. In order to assist the Trustees in this comparison, Callan had provided the Trustees with comparative information with respect to fees paid, and expense ratios incurred, by similar funds. That information indicated that while some fees and expense ratios were approximately at or below the median, the fees and expense ratios of the Capital Appreciation Fund and the expense ratios of the LargeCap Fund (I Shares) and all of the R shares were above the median. In the latter cases, the Trustees determined that such information should be taken into account in weighing the size of the fee against the nature, extent and quality of the services provided. After discussing with representatives of the Adviser and Callan the methodologies used in computing the costs that formed the bases of the profitability calculations, the Trustees turned to the profitability data provided. After analysis and discussion, they concluded that, to the extent that Alger Management's and its affiliates' relationships with the Funds had been profitable to either or both of those entities, the profit margin in each case was not unacceptable.
ECONOMIES OF SCALE
On the basis of their discussions with management and their analysis of information provided at the meeting, the Trustees determined that the nature of the Funds and their operations is such that Alger Management is likely to realize economies of scale in the management of the Funds at some point as each grows in size, but that adoption of breakpoints in one or more advisory fees, while possibly appropriate at a later date, could await further analysis of the sources and potential scale of the economies and the fee structure that would best reflect them. Accordingly, the Trustees requested that Alger Management address this topic with the Trustees at future meetings.
-62-
THE ALGER INSTITUTIONAL FUNDS
ADDITIONAL INFORMATION (Unaudited) (Continued)
OTHER BENEFITS TO ALGER MANAGEMENT
The Trustees considered whether Alger Management benefits in other ways from its relationship with the Trust. They noted that Alger Management maintains soft-dollar arrangements in connection with the Funds' brokerage transactions, reports on which are regularly supplied to the Trustees at their quarterly meetings. The Trustees also noted that Alger, Inc. provides a substantial portion of the Funds' equity brokerage and receives shareholder servicing fees from the Funds as well, and that Alger Shareholder Services, Inc. receives fees from the Funds under a shareholder services agreement. The Trustees had been provided with information regarding, and had considered, the brokerage and shareholder servicing fee benefits in connection with their review of the profitability to Alger Management and its affiliates of their relationships with the Funds. As to other benefits received, the Trustees decided that none were so significant as to render Al ger Management's fees excessive.
CONCLUSIONS AND DETERMINATIONS
At the conclusion of these discussions, each of the Independent Trustees expressed the opinion that he had been furnished with sufficient information to make an informed business decision with respect to renewal of the Investment Advisory Agreement. Based on its discussions and considerations as described above, the Board made the following conclusions and determinations:
The Board concluded that the nature, extent and quality of the services provided to each Fund by Alger Management are adequate and appropriate.
The Board determined that the performance of each of the Funds had been excellent.
The Board concluded that each advisory fee paid to Alger Management was reasonable in light of comparative performance and expense and advisory fee information, costs of the services provided and profits to be realized and benefits derived or to be derived by Alger Management from the relationship with the Fund.
The Board determined that there were not at this time significant economies of scale to be realized by Alger Management in managing the Funds' assets but that, to the extent that material economies of scale should be realized in the future, the Board would seek to ensure that they were shared with the applicable Fund.
The Board considered these conclusions and determinations and, without any one factor being dispositive, determined with respect to each Fund that renewal of the Investment Advisory Agreement was in the best interests of the Fund and its shareholders.
Proxy Voting Results
Special meetings of the funds' shareholders were held on May 24, 2007, July 23, 2007, July 31, 2007, August 3, 2007, August 8, 2007, August 10, 2007, August 17, 2007, August 31, 2007, and September 12, 2007. The results of votes taken among shareholders on the proposal before them are reported below. Each vote represents one share held on the record date for the meeting.
-63-
THE ALGER INSTITUTIONAL FUNDS
ADDITIONAL INFORMATION (Unaudited) (Continued)
Proposal 2 — To approve an Investment Advisory Agreement with Fred Alger Management, Inc.
| Alger LargeCap Institutional Fund | | # of Votes | | % of Votes | |
| For | | | 4,726,598 | | | | 97.0 | % | |
| Against | | | 40,217 | | | | 0.8 | % | |
| Abstain/Broker No Votes | | | 108,804 | | | | 2.2 | % | |
| Total | | | 4,875,619 | | | | 100.0 | % | |
| Alger SmallCap Growth Institutional Fund | | # of Votes | | % of Votes | |
| For | | | 6,540,110 | | | | 52.9 | % | |
| Against | | | 124,864 | | | | 1.0 | % | |
| Abstain/Broker No Votes | | | 5,708,470 | | | | 46.1 | % | |
| Total | | | 12,373,444 | | | | 100.0 | % | |
| Alger MidCap Growth Institutional Fund | | # of Votes | | % of Votes | |
| For | | | 41,758,814 | | | | 65.8 | % | |
| Against | | | 568,220 | | | | 0.9 | % | |
| Abstain/Broker No Votes | | | 21,169,944 | | | | 33.3 | % | |
| Total | | | 63,496,978 | | | | 100.0 | % | |
| Alger Capital Appreciation Institutional Fund | | # of Votes | | % of Votes | |
| For | | | 5,818,826 | | | | 55.6 | % | |
| Against | | | 107,958 | | | | 1.0 | % | |
| Abstain/Broker No Votes | | | 4,541,145 | | | | 43.4 | % | |
| Total | | | 10,467,929 | | | | 100.0 | % | |
Proxy Voting Policies
A description of the policies and procedures the Trust uses to determine how to vote proxies relating to portfolio securities and the proxy voting record is available, without charge, by calling (800) 992-3362 or online on the Funds' website at http://www.alger.com or on the SEC's website at http://www.sec.gov.
Fund Holdings
The Funds' most recent month end portfolio holdings are available approximately sixty days after month end on the Funds' website at www.alger.com. The Funds also file their complete schedule of portfolio holdings with the SEC for the first and third quarter of each fiscal year on Form N-Q. The Funds' Forms N-Q is available online on the SEC's website at www.sec.gov or may be reviewed and copied at the SEC's Public Reference Room in Washington, D.C. Information regarding the operation of the SEC's Public Reference Room may be obtained by calling 1-800-SEC-0330. A copy of the most recent quarterly holdings may also be obtained from the Funds by calling (800) 992-3362.
-64-
THE ALGER INSTITUTIONAL FUNDS
111 Fifth Avenue
New York, NY 10003
(800) 992-3362
www.alger.com
Investment Manager
Fred Alger Management, Inc.
111 Fifth Avenue
New York, NY 10003
Transfer Agent and Dividend Disbursing Agent
Boston Financial Data Services, Inc.
P.O. Box 8480
Boston, MA 02266
This report is submitted for the general information of the shareholders of The Alger Institutional Funds. It is not authorized for distribution to prospective investors unless accompanied by an effective Prospectus for the Trust, which contains information concerning the Trust's investment policies, fees and expenses as well as other pertinent information.


SAIF 103107

ITEM 2. CODE OF ETHICS.
(a) The Registrant has adopted a code of ethics (the “Code of Ethics”) that applies to its principal executive officer, principal financial officer, principal accounting officer or controller, or persons performing similar functions.
(b) Not applicable.
(c) The Registrant has not amended its Code of Ethics during the period covered by the shareholder report presented in Item 1 hereto.
(d) The Registrant has not granted a waiver or an implicit waiver from a provision of its Code of Ethics during the period covered by the shareholder report presented in Item 1 hereto.
(e) Not applicable.
(f) The Registrant’s Code of Ethics is attached as an Exhibit hereto.
ITEM 3. AUDIT COMMITTEE FINANCIAL EXPERT.
The Board of Trustees of the Registrant determined that Stephen E. O’Neil is an audit committee financial expert (within the meaning of that phrase specified in the instructions to Form N-CSR) on the Registrant’s audit committee. Mr. O’Neil is an “independent” trustee – i.e., he is not an interested person of the Registrant as defined in the Investment Company Act of 1940, nor has he accepted directly or indirectly any consulting, advisory or other compensatory fee from the Registrant, other than in his capacity as Trustee.
ITEM 4. PRINCIPAL ACCOUNTANT FEES AND SERVICES.
a) Audit Fees:
October 31, 2007 | | $ | 100,000 | |
October 31, 2006 | | $ | 163,520 | |
b) Audit-Related Fees: NONE
c) Tax Fees for tax advice, tax compliance and tax planning:
October 31, 2007 | | $ | 52,270 | |
October 31, 2006 | | $ | 26,545 | |
d) All Other Fees:
October 31, 2007 | | $ | 10,600 | |
October 31, 2006 | | $ | 23,800 | |
Other fees include a review and consent for Registrants registration statement filing and a review of the semi-annual financial statements.
e) 1) Audit Committee Pre-Approval Policies And Procedures:
Audit and non-audit services provided by the Registrant’s independent registered public accounting firm (the “Auditors”) on behalf the Registrant must be pre-approved by the Audit Committee. Non-audit services provided by the Auditors on behalf of the Registrant’s Investment Adviser or any entity controlling, controlled by, or under common control with the Investment Adviser must be pre-approved by the Audit Committee if such non-audit services directly relate to the operations or financial reporting of the Registrant.
2) All fees in item 4(b) through 4(d) above were approved by the Registrants’ Audit Committee.
f) Not Applicable
g) Non-Audit Fees:
October 31, 2007 | | $ | 282,811 and 70,773 Euros | |
October 31, 2006 | | $ | 217,212 and 26,884 Euros | |
h) The audit committee of the board of trustees has considered whether the provision of the non-audit services that were rendered to the registrant’s investment adviser and any entity controlling, controlled by, or under common control, with the adviser that provides ongoing services to the registrant that were not approved pursuant to (c)(7)(ii) of Rule 2-01 of Regulation S-X is compatible with maintaining the principle accountant’s independence.
ITEM 5. AUDIT COMMITTEE OF LISTED REGISTRANTS.
Not applicable
ITEM 6. SCHEDULE OF INVESTMENTS.
Not applicable
ITEM 7. DISCLOSURE OF PROXY VOTING POLICIES AND PROCEDURES FOR CLOSED END MANAGEMENT INVESTMENT COMPANIES.
Not applicable
ITEM 8. PORTFOLIO MANAGERS OF CLOSED-END MANAGEMENT INVESTMENT COMPANIES.
Not applicable
ITEM 9. PURCHASES OF EQUITY SECURITIES BY CLOSED-END MANAGEMENT INVESTMENT COMPANY AND AFFILIATED PURCHASERS.
Not applicable
ITEM 10. SUBMISSION OF MATTERS TO A VOTE OF SECURITY HOLDERS.
None
ITEM 11. CONTROLS AND PROCEDURES.
(a) The Registrant’s principal executive officer and principal financial officer have concluded that the Registrant’s disclosure controls and procedures (as defined in Rule 30a-3(c) under the Investment Company Act of 1940, as amended) are effective based on their evaluation of the disclosure controls and procedures as of a date within 90 days of the filing date of this document.
(b) No changes in the Registrant’s internal control over financial reporting occurred during the Registrant’s second fiscal half-year that materially affected, or are reasonably likely to materially affect, the Registrant’s internal control over financial
reporting.
ITEM 12. EXHIBITS.
(a) (1) Code of Ethics as Exhibit 99.CODE ETH
(a) (2) Certifications of principal executive officer and principal financial officer as required by rule 30a-2(a) under the Investment Company Act of 1940 are attached as Exhibit 99.CERT
(b) Certifications of principal executive officer and principal financial officer as required by rule 30a-2(b) under the Investment Company Act of 1940 are attached as Exhibit 99.906CERT
SIGNATURES
Pursuant to the requirements of the Securities Exchange Act of 1934 and the Investment Company Act of 1940, the registrant has duly caused this report to be signed on its behalf by the undersigned, thereunto duly authorized.
The Alger Institutional Funds | |
| |
By: | /s/Dan C. Chung | | |
| | |
| Dan C. Chung | |
| | |
| President | |
| |
Date: December 19, 2007 | |
| | | |
Pursuant to the requirements of the Securities Exchange Act of 1934 and the Investment Company Act of 1940, this report has been signed below by the following persons on behalf of the registrant and in the capacities and on the dates indicated.
By: | /s/Dan C. Chung | | | |
| | | |
| Dan C. Chung | | |
| | | |
| President | | |
| |
Date: December 19, 2007 | |
| |
By: | /s/ Michael D. Martins | | |
| | | |
| Michael D. Martins | |
| | |
| Treasurer | |
| |
Date: December 19, 2007 | |
| | | | | | |