UNITED STATES
SECURITIES AND EXCHANGE COMMISSION
Washington, D.C. 20549
FORM N-CSR
CERTIFIED SHAREHOLDER REPORT OF REGISTERED MANAGEMENT INVESTMENT COMPANIES
Investment Company Act file number
The Alger Institutional Funds
(Exact name of registrant as specified in charter)
100 Pearl Street, New York, New York 10004
Registrant's telephone number, including area code:
Date of reporting period:
Item 1. Report to Stockholders.
(a) The registrant’s annual report transmitted to shareholders pursuant to Rule 30e-1 under the Investment Company Act of 1940 is as follows:
Alger Capital Appreciation Institutional Fund
Class I / ALARX
Annual SHAREHOLDER REPORT | October 31, 2024
This annual shareholder report contains important information about the Alger Capital Appreciation Institutional Fund (“Fund”) for the period of November 1, 2023 to October 31, 2024. You can find additional information about the Fund at https://connect.rightprospectus.com/Alger. You can also request a copy of the annual report by contacting us at (800) 992-3863.
This report describes material changes to the Fund that occurred during the reporting period.
What were the Fund costs for the last year?
(Based on a hypothetical $10,000 investment)
| Fund (Class/Ticker) | Costs of a $10,000 investment | Costs paid as a percentage of a $10,000 investment |
Alger Capital Appreciation Institutional Fund
(Class I / ALARX) | $160 | 1.24% |
Management's Discussion of Fund Performance
What impacted Fund performance over the reporting period?
The Alger Capital Appreciation Institutional Fund Class I returned 57.90% for the fiscal twelve-month period ended October 31, 2024, compared to the 43.77% return of the Russell 1000 Growth Index. During the reporting period, the largest sector weightings were Information Technology and Communication Services. The largest sector overweight was Industrials and the largest sector underweight was Consumer Staples.
Contributors to Performance
The Information Technology and Health Care sectors provided the largest contributions to relative performance. NVIDIA Corp.; Meta Platforms Inc.; Microsoft Corp.; Amazon.com, Inc.; and Natera, Inc. were the top five contributors to absolute performance.
Detractors from Performance
The Consumer Staples and Financials sectors were the largest detractors from relative performance. Humana Inc.; Snowflake, Inc.; Schlumberger Ltd.; HubSpot, Inc.; and Snap, Inc. were the top five detractors from absolute performance.
| U.S. FACTOR | IMPACT | SUMMARY |
| Resilient Corporate Earnings | Positive | Strong corporate earnings were driven by profit margin improvement and robust consumer spending. Themes such as AI proliferation, waning cloud optimization pressure, and profit margin expansion from increased productivity and expense control also supported market sentiment. |
| Federal Reserve Rate Cuts | Positive | In September 2024, the Federal Reserve initiated a rate-cutting cycle with a 50-basis point reduction, aiming to bolster economic growth amid a strong but softening labor market and easing inflation, creating a favorable backdrop for equities. |
| Rising Geopolitical Tensions | Negative | Geopolitical conflicts and trade disputes created some uncertainty ahead of the 2024 U.S. presidential election. |
| Weakening U.S. Labor Market | Negative | In August 2024, equity markets experienced a brief sell-off due to growth concerns following a weaker-than-expected July payrolls report, which raised fears that the Federal Reserve might be slow to respond to slowing economic conditions. The unemployment rate increased to 4.3%, triggering the Sahm rule—a recession indicator that signals a likely recession when the three-month moving average of the unemployment rate rises by at least 50 basis points from its twelve-month low. |
Fund Performance
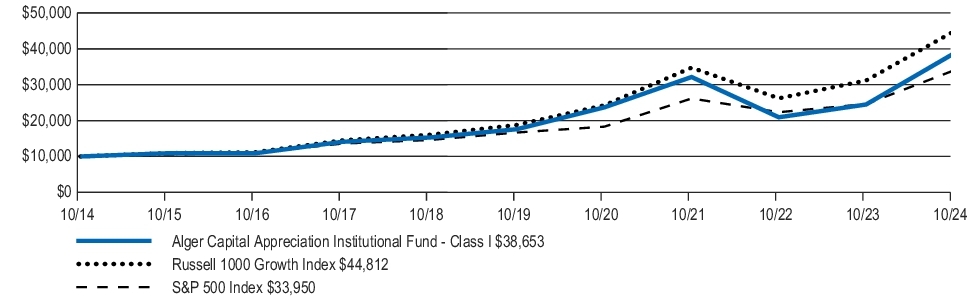
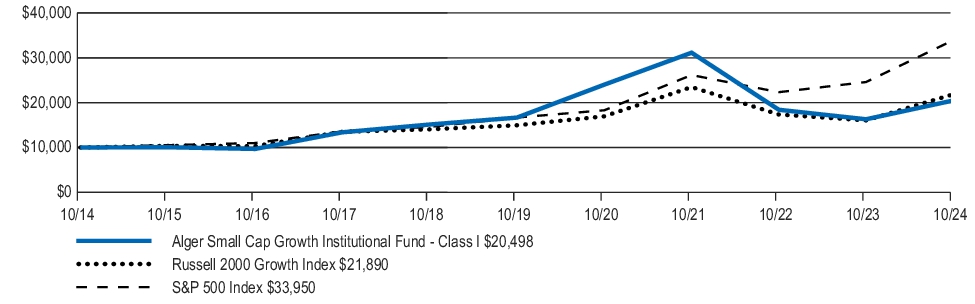
The following graph compares the initial and subsequent account values at the end of each of the most recently completed ten fiscal years of Class I shares of the Fund. The graph assumes a $10,000 initial investment at the beginning of the first annual period in an appropriate, broad-based securities market index and a more narrowly based index that reflects the market sector in which the Fund invests for the same period.
INITIAL INVESTMENT OF $10,000
| Average Annual Total Returns (As of October 31, 2024) | 1 Year | 5 Years | 10 Years |
| Alger Capital Appreciation Institutional Fund Class I | 57.90% | 17.04% | 14.48% |
| Russell 1000 Growth Index | 43.77% | 19.00% | 16.18% |
| S&P 500 Index | 38.02% | 15.27% | 13.00% |
Keep in mind that the Fund’s past performance is not a good predictor of how the Fund will perform in the future.
Visit https://www.alger.com/Pages/StrategyFinder.aspx?vehicle=mf for the most recent performance information. The graph and table do not reflect the deduction of taxes that a shareholder would pay on Fund distributions or redemption of Fund shares. All performance figures assume reinvestment of distributions.
Key Fund Statistics
The following table outlines key fund statistics as of the fiscal year ended October 31, 2024.
| Fund net assets | $2,120,603,780 |
| Total number of portfolio holdings1 | 70 |
| Portfolio turnover rate as of the end of the reporting period | 59.80% |
| Total advisory fees paid | $17,002,298 |
1 | Excludes Money Market Funds. |
| Communication Services | 15.2% |
| Consumer Discretionary | 12.8% |
| Energy | 0.5% |
| Financials | 3.9% |
| Healthcare | 9.3% |
| Industrials | 8.4% |
| Information Technology | 47.3% |
| Materials | 0.2% |
| Real Estate | 0.8% |
| Utilities | 1.6% |
| Short-Term Investments and Other Net Assets | 0.0% |
| 100.0% |
Material and Other Fund Changes
Effective January 29, 2024, the Fund's custodian and administrator transitioned from Brown Brothers Harriman & Company to The Bank of New York.
On August 16, 2024, at a joint special meeting of shareholders, shareholders of the Fund elected three new trustees and one current trustee to the Board.
This is a summary of certain changes to the Fund since November 1, 2023. For more complete information, you may review the Fund's next prospectus, which we expect to be available by February 28, 2025 at https://connect.rightprospectus.com/Alger or upon request at (800) 992-3863.
Availability of Additional Information
Householding
To reduce expenses, only one copy of the most recent financial reports and prospectus may be mailed to households, even if more than one person in a household holds shares of a Fund. Call an Alger Funds Representative at (800) 992-3863 if you need additional copies of financial reports or prospectuses, or download them at https://connect.rightprospectus.com/Alger. If you do not want the mailing of these documents to be combined with those for other members of your household, contact your broker-dealer or other financial intermediary or Alger Institutional Funds in writing at Alger Family of Funds, c/o UMB Fund Services, Inc. 235 W. Galena Street Milwaukee, WI 53212.
Alger Capital Appreciation Institutional Fund
Class R / ACARX
Annual SHAREHOLDER REPORT | October 31, 2024
This annual shareholder report contains important information about the Alger Capital Appreciation Institutional Fund (“Fund”) for the period of November 1, 2023 to October 31, 2024. You can find additional information about the Fund at https://connect.rightprospectus.com/Alger. You can also request a copy of the annual report by contacting us at (800) 992-3863.
This report describes material changes to the Fund that occurred during the reporting period.
What were the Fund costs for the last year?
(Based on a hypothetical $10,000 investment)
| Fund (Class/Ticker) | Costs of a $10,000 investment | Costs paid as a percentage of a $10,000 investment |
Alger Capital Appreciation Institutional Fund
(Class R / ACARX) | $217 | 1.69% |
Management's Discussion of Fund Performance
What impacted Fund performance over the reporting period?
The Alger Capital Appreciation Institutional Fund Class R returned 57.21% for the fiscal twelve-month period ended October 31, 2024, compared to the 43.77% return of the Russell 1000 Growth Index. During the reporting period, the largest sector weightings were Information Technology and Communication Services. The largest sector overweight was Industrials and the largest sector underweight was Consumer Staples.
Contributors to Performance
The Information Technology and Health Care sectors provided the largest contributions to relative performance. NVIDIA Corp.; Meta Platforms Inc.; Microsoft Corp.; Amazon.com, Inc.; and Natera, Inc. were the top five contributors to absolute performance.
Detractors from Performance
The Consumer Staples and Financials sectors were the largest detractors from relative performance. Humana Inc.; Snowflake, Inc.; Schlumberger Ltd.; HubSpot, Inc.; and Snap, Inc. were the top five detractors from absolute performance.
| U.S. FACTOR | IMPACT | SUMMARY |
| Resilient Corporate Earnings | Positive | Strong corporate earnings were driven by profit margin improvement and robust consumer spending. Themes such as AI proliferation, waning cloud optimization pressure, and profit margin expansion from increased productivity and expense control also supported market sentiment. |
| Federal Reserve Rate Cuts | Positive | In September 2024, the Federal Reserve initiated a rate-cutting cycle with a 50-basis point reduction, aiming to bolster economic growth amid a strong but softening labor market and easing inflation, creating a favorable backdrop for equities. |
| Rising Geopolitical Tensions | Negative | Geopolitical conflicts and trade disputes created some uncertainty ahead of the 2024 U.S. presidential election. |
| Weakening U.S. Labor Market | Negative | In August 2024, equity markets experienced a brief sell-off due to growth concerns following a weaker-than-expected July payrolls report, which raised fears that the Federal Reserve might be slow to respond to slowing economic conditions. The unemployment rate increased to 4.3%, triggering the Sahm rule—a recession indicator that signals a likely recession when the three-month moving average of the unemployment rate rises by at least 50 basis points from its twelve-month low. |
Fund Performance
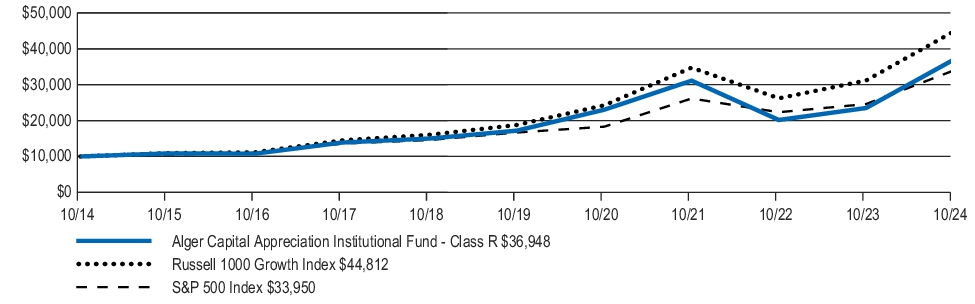
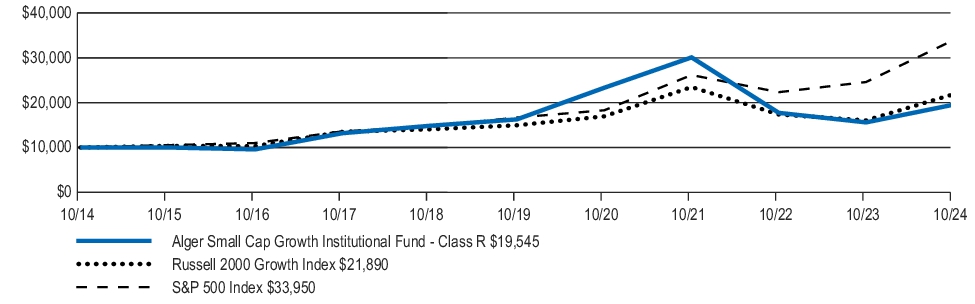
The following graph compares the initial and subsequent account values at the end of each of the most recently completed ten fiscal years of Class R shares of the Fund. The graph assumes a $10,000 initial investment at the beginning of the first annual period in an appropriate, broad-based securities market index and a more narrowly based index that reflects the market sector in which the Fund invests for the same period.
INITIAL INVESTMENT OF $10,000
| Average Annual Total Returns (As of October 31, 2024) | 1 Year | 5 Years | 10 Years |
| Alger Capital Appreciation Institutional Fund Class R | 57.21% | 16.53% | 13.96% |
| Russell 1000 Growth Index | 43.77% | 19.00% | 16.18% |
| S&P 500 Index | 38.02% | 15.27% | 13.00% |
Keep in mind that the Fund’s past performance is not a good predictor of how the Fund will perform in the future.
Visit https://www.alger.com/Pages/StrategyFinder.aspx?vehicle=mf for the most recent performance information. The graph and table do not reflect the deduction of taxes that a shareholder would pay on Fund distributions or redemption of Fund shares. All performance figures assume reinvestment of distributions.
Key Fund Statistics
The following table outlines key fund statistics as of the fiscal year ended October 31, 2024.
| Fund net assets | $2,120,603,780 |
| Total number of portfolio holdings1 | 70 |
| Portfolio turnover rate as of the end of the reporting period | 59.80% |
| Total advisory fees paid | $17,002,298 |
1 | Excludes Money Market Funds. |
| Communication Services | 15.2% |
| Consumer Discretionary | 12.8% |
| Energy | 0.5% |
| Financials | 3.9% |
| Healthcare | 9.3% |
| Industrials | 8.4% |
| Information Technology | 47.3% |
| Materials | 0.2% |
| Real Estate | 0.8% |
| Utilities | 1.6% |
| Short-Term Investments and Other Net Assets | 0.0% |
| 100.0% |
Material and Other Fund Changes
Effective January 29, 2024, the Fund's custodian and administrator transitioned from Brown Brothers Harriman & Company to The Bank of New York.
On August 16, 2024, at a joint special meeting of shareholders, shareholders of the Fund elected three new trustees and one current trustee to the Board.
This is a summary of certain changes to the Fund since November 1, 2023. For more complete information, you may review the Fund's next prospectus, which we expect to be available by February 28, 2025 at https://connect.rightprospectus.com/Alger or upon request at (800) 992-3863.
Availability of Additional Information
Householding
To reduce expenses, only one copy of the most recent financial reports and prospectus may be mailed to households, even if more than one person in a household holds shares of a Fund. Call an Alger Funds Representative at (800) 992-3863 if you need additional copies of financial reports or prospectuses, or download them at https://connect.rightprospectus.com/Alger. If you do not want the mailing of these documents to be combined with those for other members of your household, contact your broker-dealer or other financial intermediary or Alger Institutional Funds in writing at Alger Family of Funds, c/o UMB Fund Services, Inc. 235 W. Galena Street Milwaukee, WI 53212.
Alger Capital Appreciation Institutional Fund
Class Y / ACAYX
Annual SHAREHOLDER REPORT | October 31, 2024
This annual shareholder report contains important information about the Alger Capital Appreciation Institutional Fund (“Fund”) for the period of November 1, 2023 to October 31, 2024. You can find additional information about the Fund at https://connect.rightprospectus.com/Alger. You can also request a copy of the annual report by contacting us at (800) 992-3863.
This report describes material changes to the Fund that occurred during the reporting period.
What were the Fund costs for the last year?
(Based on a hypothetical $10,000 investment)
| Fund (Class/Ticker) | Costs of a $10,000 investment | Costs paid as a percentage of a $10,000 investment |
Alger Capital Appreciation Institutional Fund
(Class Y / ACAYX) | $111 | 0.86% |
Management's Discussion of Fund Performance
What impacted Fund performance over the reporting period?
The Alger Capital Appreciation Institutional Fund Class Y returned 58.48% for the fiscal twelve-month period ended October 31, 2024, compared to the 43.77% return of the Russell 1000 Growth Index. During the reporting period, the largest sector weightings were Information Technology and Communication Services. The largest sector overweight was Industrials and the largest sector underweight was Consumer Staples.
Contributors to Performance
The Information Technology and Health Care sectors provided the largest contributions to relative performance. NVIDIA Corp.; Meta Platforms Inc.; Microsoft Corp.; Amazon.com, Inc.; and Natera, Inc. were the top five contributors to absolute performance.
Detractors from Performance
The Consumer Staples and Financials sectors were the largest detractors from relative performance. Humana Inc.; Snowflake, Inc.; Schlumberger Ltd.; HubSpot, Inc.; and Snap, Inc. were the top five detractors from absolute performance.
| U.S. FACTOR | IMPACT | SUMMARY |
| Resilient Corporate Earnings | Positive | Strong corporate earnings were driven by profit margin improvement and robust consumer spending. Themes such as AI proliferation, waning cloud optimization pressure, and profit margin expansion from increased productivity and expense control also supported market sentiment. |
| Federal Reserve Rate Cuts | Positive | In September 2024, the Federal Reserve initiated a rate-cutting cycle with a 50-basis point reduction, aiming to bolster economic growth amid a strong but softening labor market and easing inflation, creating a favorable backdrop for equities. |
| Rising Geopolitical Tensions | Negative | Geopolitical conflicts and trade disputes created some uncertainty ahead of the 2024 U.S. presidential election. |
| Weakening U.S. Labor Market | Negative | In August 2024, equity markets experienced a brief sell-off due to growth concerns following a weaker-than-expected July payrolls report, which raised fears that the Federal Reserve might be slow to respond to slowing economic conditions. The unemployment rate increased to 4.3%, triggering the Sahm rule—a recession indicator that signals a likely recession when the three-month moving average of the unemployment rate rises by at least 50 basis points from its twelve-month low. |
Fund Performance
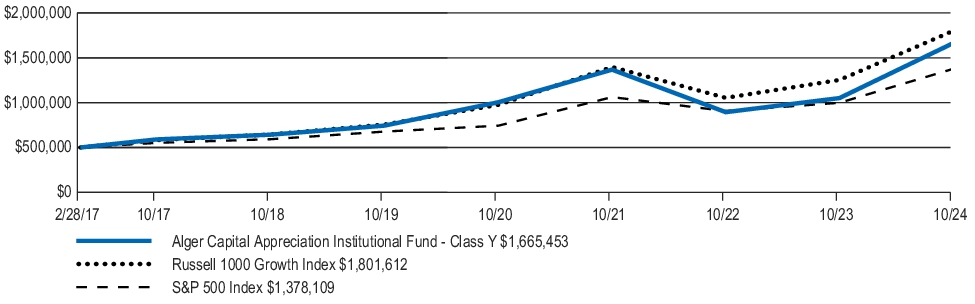
The following graph compares the initial and subsequent account values at the end of each of the most recently completed annual periods for the life of Class Y shares of the Fund since its inception. The graph assumes a $500,000 initial investment at net asset value at the inception date of the Fund in an appropriate, broad-based securities market index and a more narrowly based index that reflects the market sector in which the Fund invests for the same period.
INITIAL INVESTMENT OF $500,000
| Average Annual Total Returns (As of October 31, 2024) | 1 Year | 5 Years | Since Inception
2/28/17 |
| Alger Capital Appreciation Institutional Fund Class Y | 58.48% | 17.51% | 16.98% |
| Russell 1000 Growth Index | 43.77% | 19.00% | 18.19% |
| S&P 500 Index | 38.02% | 15.27% | 14.13% |
Keep in mind that the Fund’s past performance is not a good predictor of how the Fund will perform in the future.
Visit https://www.alger.com/Pages/StrategyFinder.aspx?vehicle=mf for the most recent performance information. The graph and table do not reflect the deduction of taxes that a shareholder would pay on Fund distributions or redemption of Fund shares. All performance figures assume reinvestment of distributions.
Key Fund Statistics
The following table outlines key fund statistics as of the fiscal year ended October 31, 2024.
| Fund net assets | $2,120,603,780 |
| Total number of portfolio holdings1 | 70 |
| Portfolio turnover rate as of the end of the reporting period | 59.80% |
| Total advisory fees paid | $17,002,298 |
1 | Excludes Money Market Funds. |
| Communication Services | 15.2% |
| Consumer Discretionary | 12.8% |
| Energy | 0.5% |
| Financials | 3.9% |
| Healthcare | 9.3% |
| Industrials | 8.4% |
| Information Technology | 47.3% |
| Materials | 0.2% |
| Real Estate | 0.8% |
| Utilities | 1.6% |
| Short-Term Investments and Other Net Assets | 0.0% |
| 100.0% |
Material and Other Fund Changes
Effective January 29, 2024, the Fund's custodian and administrator transitioned from Brown Brothers Harriman & Company to The Bank of New York.
On August 16, 2024, at a joint special meeting of shareholders, shareholders of the Fund elected three new trustees and one current trustee to the Board.
This is a summary of certain changes to the Fund since November 1, 2023. For more complete information, you may review the Fund's next prospectus, which we expect to be available by February 28, 2025 at https://connect.rightprospectus.com/Alger or upon request at (800) 992-3863.
Availability of Additional Information
Householding
To reduce expenses, only one copy of the most recent financial reports and prospectus may be mailed to households, even if more than one person in a household holds shares of a Fund. Call an Alger Funds Representative at (800) 992-3863 if you need additional copies of financial reports or prospectuses, or download them at https://connect.rightprospectus.com/Alger. If you do not want the mailing of these documents to be combined with those for other members of your household, contact your broker-dealer or other financial intermediary or Alger Institutional Funds in writing at Alger Family of Funds, c/o UMB Fund Services, Inc. 235 W. Galena Street Milwaukee, WI 53212.
Alger Capital Appreciation Institutional Fund
Class Z-2 / ACIZX
Annual SHAREHOLDER REPORT | October 31, 2024
This annual shareholder report contains important information about the Alger Capital Appreciation Institutional Fund (“Fund”) for the period of November 1, 2023 to October 31, 2024. You can find additional information about the Fund at https://connect.rightprospectus.com/Alger. You can also request a copy of the annual report by contacting us at (800) 992-3863.
This report describes material changes to the Fund that occurred during the reporting period.
What were the Fund costs for the last year?
(Based on a hypothetical $10,000 investment)
| Fund (Class/Ticker) | Costs of a $10,000 investment | Costs paid as a percentage of a $10,000 investment |
Alger Capital Appreciation Institutional Fund
(Class Z-2 / ACIZX) | $114 | 0.88% |
Management's Discussion of Fund Performance
What impacted Fund performance over the reporting period?
The Alger Capital Appreciation Institutional Fund Class Z-2 returned 58.44% for the fiscal twelve-month period ended October 31, 2024, compared to the 43.77% return of the Russell 1000 Growth Index. During the reporting period, the largest sector weightings were Information Technology and Communication Services. The largest sector overweight was Industrials and the largest sector underweight was Consumer Staples.
Contributors to Performance
The Information Technology and Health Care sectors provided the largest contributions to relative performance. NVIDIA Corp.; Meta Platforms Inc.; Microsoft Corp.; Amazon.com, Inc.; and Natera, Inc. were the top five contributors to absolute performance.
Detractors from Performance
The Consumer Staples and Financials sectors were the largest detractors from relative performance. Humana Inc.; Snowflake, Inc.; Schlumberger Ltd.; HubSpot, Inc.; and Snap, Inc. were the top five detractors from absolute performance.
| U.S. FACTOR | IMPACT | SUMMARY |
| Resilient Corporate Earnings | Positive | Strong corporate earnings were driven by profit margin improvement and robust consumer spending. Themes such as AI proliferation, waning cloud optimization pressure, and profit margin expansion from increased productivity and expense control also supported market sentiment. |
| Federal Reserve Rate Cuts | Positive | In September 2024, the Federal Reserve initiated a rate-cutting cycle with a 50-basis point reduction, aiming to bolster economic growth amid a strong but softening labor market and easing inflation, creating a favorable backdrop for equities. |
| Rising Geopolitical Tensions | Negative | Geopolitical conflicts and trade disputes created some uncertainty ahead of the 2024 U.S. presidential election. |
| Weakening U.S. Labor Market | Negative | In August 2024, equity markets experienced a brief sell-off due to growth concerns following a weaker-than-expected July payrolls report, which raised fears that the Federal Reserve might be slow to respond to slowing economic conditions. The unemployment rate increased to 4.3%, triggering the Sahm rule—a recession indicator that signals a likely recession when the three-month moving average of the unemployment rate rises by at least 50 basis points from its twelve-month low. |
Fund Performance
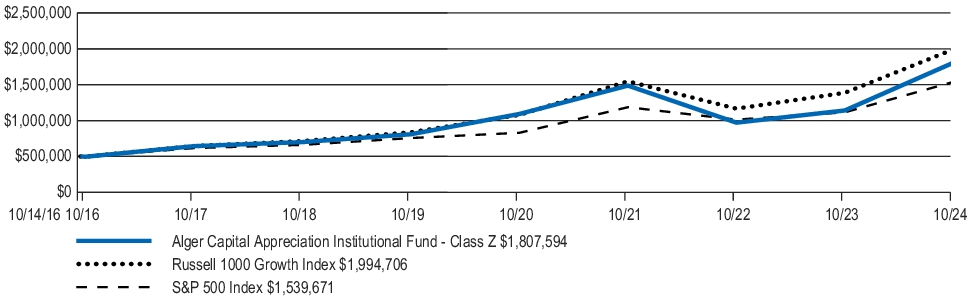
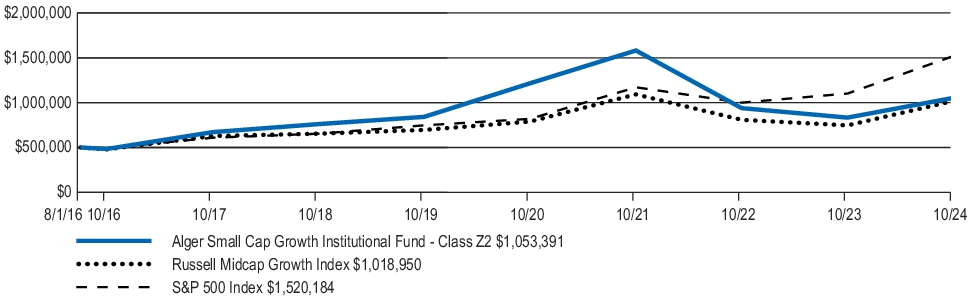
The following graph compares the initial and subsequent account values at the end of each of the most recently completed annual periods for the life of Class Z-2 shares of the Fund since its inception. The graph assumes a $500,000 initial investment at net asset value at the inception date of the Fund in an appropriate, broad-based securities market index and a more narrowly based index that reflects the market sector in which the Fund invests for the same period.
INITIAL INVESTMENT OF $500,000
| Average Annual Total Returns (As of October 31, 2024) | 1 Year | 5 Years | Since Inception
10/14/16 |
| Alger Capital Appreciation Institutional Fund Class Z-2 | 58.44% | 17.44% | 17.32% |
| Russell 1000 Growth Index | 43.77% | 19.00% | 18.19% |
| S&P 500 Index | 38.02% | 15.27% | 14.13% |
Keep in mind that the Fund’s past performance is not a good predictor of how the Fund will perform in the future.
Visit https://www.alger.com/Pages/StrategyFinder.aspx?vehicle=mf for the most recent performance information. The graph and table do not reflect the deduction of taxes that a shareholder would pay on Fund distributions or redemption of Fund shares. All performance figures assume reinvestment of distributions.
Key Fund Statistics
The following table outlines key fund statistics as of the fiscal year ended October 31, 2024.
| Fund net assets | $2,120,603,780 |
| Total number of portfolio holdings1 | 70 |
| Portfolio turnover rate as of the end of the reporting period | 59.80% |
| Total advisory fees paid | $17,002,298 |
1 | Excludes Money Market Funds. |
| Communication Services | 15.2% |
| Consumer Discretionary | 12.8% |
| Energy | 0.5% |
| Financials | 3.9% |
| Healthcare | 9.3% |
| Industrials | 8.4% |
| Information Technology | 47.3% |
| Materials | 0.2% |
| Real Estate | 0.8% |
| Utilities | 1.6% |
| Short-Term Investments and Other Net Assets | 0.0% |
| 100.0% |
Material and Other Fund Changes
Effective January 29, 2024, the Fund's custodian and administrator transitioned from Brown Brothers Harriman & Company to The Bank of New York.
On August 16, 2024, at a joint special meeting of shareholders, shareholders of the Fund elected three new trustees and one current trustee to the Board.
Effective March 1, 2024, Alger Management has contractually agreed to waive fees or to reimburse Fund expenses (excluding custody fees, acquired fund fees and expenses, dividend expense on short sales, net borrowing costs, interest, taxes, brokerage and extraordinary expenses, to the extent applicable) through October 31, 2025 to the extent necessary to limit the Other Expenses of the Class Z-2 Shares of the Fund to 0.05% of the class’s average daily net assets. On October 22, 2024, the Board approved that any fees incurred as a result of the joint special meeting of shareholders would be excluded from the expense reimbursement.
This is a summary of certain changes to the Fund since November 1, 2023. For more complete information, you may review the Fund's next prospectus, which we expect to be available by February 28, 2025 at https://connect.rightprospectus.com/Alger or upon request at (800) 992-3863.
Availability of Additional Information
Householding
To reduce expenses, only one copy of the most recent financial reports and prospectus may be mailed to households, even if more than one person in a household holds shares of a Fund. Call an Alger Funds Representative at (800) 992-3863 if you need additional copies of financial reports or prospectuses, or download them at https://connect.rightprospectus.com/Alger. If you do not want the mailing of these documents to be combined with those for other members of your household, contact your broker-dealer or other financial intermediary or Alger Institutional Funds in writing at Alger Family of Funds, c/o UMB Fund Services, Inc. 235 W. Galena Street Milwaukee, WI 53212.
Alger Focus Equity Fund
Class A / ALAFX
Annual SHAREHOLDER REPORT | October 31, 2024
This annual shareholder report contains important information about the Alger Focus Equity Fund (“Fund”) for the period of November 1, 2023 to October 31, 2024. You can find additional information about the Fund at https://connect.rightprospectus.com/Alger. You can also request a copy of the annual report by contacting us at (800) 992-3863.
This report describes material changes to the Fund that occurred during the reporting period.
What were the Fund costs for the last year?
(Based on a hypothetical $10,000 investment)
| Fund (Class/Ticker) | Costs of a $10,000 investment | Costs paid as a percentage of a $10,000 investment |
Alger Focus Equity Fund
(Class A / ALAFX) | $124 | 0.95% |
Management's Discussion of Fund Performance
What impacted Fund performance over the reporting period?
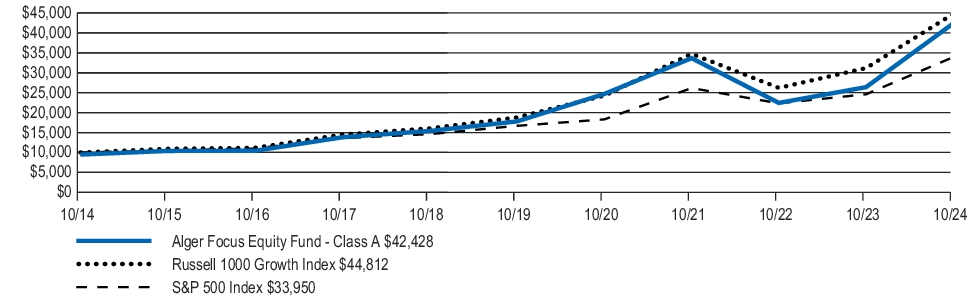
The Alger Focus Equity Fund Class A returned 60.77%, excluding sales load, for the fiscal twelve-month period ended October 31, 2024, compared to the 43.77% return of the Russell 1000 Growth Index. During the reporting period, the largest sector weightings were Information Technology and Communication Services. The largest sector overweight was Industrials and the largest sector underweight was Consumer Staples.
Contributors to Performance
The Information Technology and Health Care sectors provided the largest contributions to relative performance. NVIDIA Corp.; Meta Platforms Inc.; Microsoft Corp.; Natera, Inc.; and AppLovin Corp. were the top five contributors to absolute performance.
Detractors from Performance
The Consumer Staples and Financials sectors were the largest detractors from relative performance. Snowflake, Inc.; ASML Holding; Schlumberger Ltd.; EOG Resources, Inc.; and Fluence Energy, Inc. were the top five detractors from absolute performance.
| U.S. FACTOR | IMPACT | SUMMARY |
| Resilient Corporate Earnings | Positive | Strong corporate earnings were driven by profit margin improvement and robust consumer spending. Themes such as AI proliferation, waning cloud optimization pressure, and profit margin expansion from increased productivity and expense control also supported market sentiment. |
| Federal Reserve Rate Cuts | Positive | In September 2024, the Federal Reserve initiated a rate-cutting cycle with a 50-basis point reduction, aiming to bolster economic growth amid a strong but softening labor market and easing inflation, creating a favorable backdrop for equities. |
| Rising Geopolitical Tensions | Negative | Geopolitical conflicts and trade disputes created some uncertainty ahead of the 2024 U.S. presidential election. |
| Weakening U.S. Labor Market | Negative | In August 2024, equity markets experienced a brief sell-off due to growth concerns following a weaker-than-expected July payrolls report, which raised fears that the Federal Reserve might be slow to respond to slowing economic conditions. The unemployment rate increased to 4.3%, triggering the Sahm rule—a recession indicator that signals a likely recession when the three-month moving average of the unemployment rate rises by at least 50 basis points from its twelve-month low. |
Fund Performance
The following graph compares the initial and subsequent account values at the end of each of the most recently completed ten fiscal years of Class A shares of the Fund. The graph assumes a $10,000 initial investment at the beginning of the first annual period in an appropriate, broad-based securities market index and a more narrowly based index that reflects the market sector in which the Fund invests for the same period.
INITIAL INVESTMENT OF $10,000
| Average Annual Total Returns (As of October 31, 2024) | 1 Year | 5 Years | 10 Years |
| Alger Focus Equity Fund Class A | 52.32% | 17.71% | 15.55% |
| Alger Focus Equity Fund Class A—excluding sales load | 60.77% | 18.99% | 16.17% |
| Russell 1000 Growth Index | 43.77% | 19.00% | 16.18% |
| S&P 500 Index | 38.02% | 15.27% | 13.00% |
Keep in mind that the Fund’s past performance is not a good predictor of how the Fund will perform in the future.
Visit https://www.alger.com/Pages/StrategyFinder.aspx?vehicle=mf for the most recent performance information. The graph and table do not reflect the deduction of taxes that a shareholder would pay on Fund distributions or redemption of Fund shares. All performance figures assume reinvestment of distributions.
Key Fund Statistics
The following table outlines key fund statistics as of the fiscal year ended October 31, 2024.
| Fund net assets | $1,791,352,839 |
| Total number of portfolio holdings1 | 51 |
| Portfolio turnover rate as of the end of the reporting period | 92.43% |
| Total advisory fees paid | $7,683,585 |
1 | Excludes Money Market Funds. |
| Communication Services | 14.0% |
| Consumer Discretionary | 12.1% |
| Energy | 1.0% |
| Financials | 3.1% |
| Healthcare | 7.4% |
| Industrials | 10.8% |
| Information Technology | 43.7% |
| Materials | 0.3% |
| Real Estate | 0.9% |
| Utilities | 2.3% |
| Short-Term Investments and Other Net Assets | 4.4% |
| 100.0% |
Material and Other Fund Changes
Effective January 29, 2024, the Fund's custodian and administrator transitioned from Brown Brothers Harriman & Company to The Bank of New York.
On August 16, 2024, at a joint special meeting of shareholders, shareholders of the Fund elected three new trustees and one current trustee to the Board.
This is a summary of certain changes to the Fund since November 1, 2023. For more complete information, you may review the Fund's next prospectus, which we expect to be available by February 28, 2025 at https://connect.rightprospectus.com/Alger or upon request at (800) 992-3863.
Availability of Additional Information
Householding
To reduce expenses, only one copy of the most recent financial reports and prospectus may be mailed to households, even if more than one person in a household holds shares of a Fund. Call an Alger Funds Representative at (800) 992-3863 if you need additional copies of financial reports or prospectuses, or download them at https://connect.rightprospectus.com/Alger. If you do not want the mailing of these documents to be combined with those for other members of your household, contact your broker-dealer or other financial intermediary or Alger Institutional Funds in writing at Alger Family of Funds, c/o UMB Fund Services, Inc. 235 W. Galena Street Milwaukee, WI 53212.
Alger Focus Equity Fund
Class C / ALCFX
Annual SHAREHOLDER REPORT | October 31, 2024
This annual shareholder report contains important information about the Alger Focus Equity Fund (“Fund”) for the period of November 1, 2023 to October 31, 2024. You can find additional information about the Fund at https://connect.rightprospectus.com/Alger. You can also request a copy of the annual report by contacting us at (800) 992-3863.
This report describes material changes to the Fund that occurred during the reporting period.
What were the Fund costs for the last year?
(Based on a hypothetical $10,000 investment)
| Fund (Class/Ticker) | Costs of a $10,000 investment | Costs paid as a percentage of a $10,000 investment |
Alger Focus Equity Fund
(Class C / ALCFX) | $223 | 1.72% |
Management's Discussion of Fund Performance
What impacted Fund performance over the reporting period?
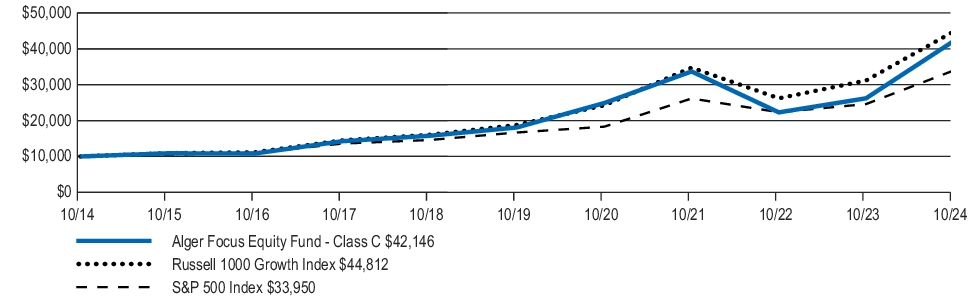
The Alger Focus Equity Fund Class C returned 59.55%, excluding contingent deferred sales charge for the fiscal twelve-month period ended October 31, 2024, compared to the 43.77% return of the Russell 1000 Growth Index. During the reporting period, the largest sector weightings were Information Technology and Communication Services. The largest sector overweight was Industrials and the largest sector underweight was Consumer Staples.
Contributors to Performance
The Information Technology and Health Care sectors provided the largest contributions to relative performance. NVIDIA Corp.; Meta Platforms Inc.; Microsoft Corp.; Natera, Inc.; and AppLovin Corp. were the top five contributors to absolute performance.
Detractors from Performance
The Consumer Staples and Financials sectors were the largest detractors from relative performance. Snowflake, Inc.; ASML Holding; Schlumberger Ltd.; EOG Resources, Inc.; and Fluence Energy, Inc. were the top five detractors from absolute performance.
| U.S. FACTOR | IMPACT | SUMMARY |
| Resilient Corporate Earnings | Positive | Strong corporate earnings were driven by profit margin improvement and robust consumer spending. Themes such as AI proliferation, waning cloud optimization pressure, and profit margin expansion from increased productivity and expense control also supported market sentiment. |
| Federal Reserve Rate Cuts | Positive | In September 2024, the Federal Reserve initiated a rate-cutting cycle with a 50-basis point reduction, aiming to bolster economic growth amid a strong but softening labor market and easing inflation, creating a favorable backdrop for equities. |
| Rising Geopolitical Tensions | Negative | Geopolitical conflicts and trade disputes created some uncertainty ahead of the 2024 U.S. presidential election. |
| Weakening U.S. Labor Market | Negative | In August 2024, equity markets experienced a brief sell-off due to growth concerns following a weaker-than-expected July payrolls report, which raised fears that the Federal Reserve might be slow to respond to slowing economic conditions. The unemployment rate increased to 4.3%, triggering the Sahm rule—a recession indicator that signals a likely recession when the three-month moving average of the unemployment rate rises by at least 50 basis points from its twelve-month low. |
Fund Performance
The following graph compares the initial and subsequent account values at the end of each of the most recently completed ten fiscal years of Class C shares of the Fund. The graph assumes a $10,000 initial investment at the beginning of the first annual period in an appropriate, broad-based securities market index and a more narrowly based index that reflects the market sector in which the Fund invests for the same period.
INITIAL INVESTMENT OF $10,000
| Average Annual Total Returns (As of October 31, 2024) | 1 Year | 5 Years | 10 Years |
| Alger Focus Equity Fund Class C | 58.55% | 18.08% | 15.47% |
| Alger Focus Equity Fund Class C—excluding contingent deferred sales charges | 59.55% | 18.08% | 15.47% |
| Russell 1000 Growth Index | 43.77% | 19.00% | 16.18% |
| S&P 500 Index | 38.02% | 15.27% | 13.00% |
Keep in mind that the Fund’s past performance is not a good predictor of how the Fund will perform in the future.
Visit https://www.alger.com/Pages/StrategyFinder.aspx?vehicle=mf for the most recent performance information. The graph and table do not reflect the deduction of taxes that a shareholder would pay on Fund distributions or redemption of Fund shares. All performance figures assume reinvestment of distributions.
Key Fund Statistics
The following table outlines key fund statistics as of the fiscal year ended October 31, 2024.
| Fund net assets | $1,791,352,839 |
| Total number of portfolio holdings1 | 51 |
| Portfolio turnover rate as of the end of the reporting period | 92.43% |
| Total advisory fees paid | $7,683,585 |
1 | Excludes Money Market Funds. |
| Communication Services | 14.0% |
| Consumer Discretionary | 12.1% |
| Energy | 1.0% |
| Financials | 3.1% |
| Healthcare | 7.4% |
| Industrials | 10.8% |
| Information Technology | 43.7% |
| Materials | 0.3% |
| Real Estate | 0.9% |
| Utilities | 2.3% |
| Short-Term Investments and Other Net Assets | 4.4% |
| 100.0% |
Material and Other Fund Changes
Effective January 29, 2024, the Fund's custodian and administrator transitioned from Brown Brothers Harriman & Company to The Bank of New York.
On August 16, 2024, at a joint special meeting of shareholders, shareholders of the Fund elected three new trustees and one current trustee to the Board.
This is a summary of certain changes to the Fund since November 1, 2023. For more complete information, you may review the Fund's next prospectus, which we expect to be available by February 28, 2025 at https://connect.rightprospectus.com/Alger or upon request at (800) 992-3863.
Availability of Additional Information
Householding
To reduce expenses, only one copy of the most recent financial reports and prospectus may be mailed to households, even if more than one person in a household holds shares of a Fund. Call an Alger Funds Representative at (800) 992-3863 if you need additional copies of financial reports or prospectuses, or download them at https://connect.rightprospectus.com/Alger. If you do not want the mailing of these documents to be combined with those for other members of your household, contact your broker-dealer or other financial intermediary or Alger Institutional Funds in writing at Alger Family of Funds, c/o UMB Fund Services, Inc. 235 W. Galena Street Milwaukee, WI 53212.
Alger Focus Equity Fund
Class I / ALGRX
Annual SHAREHOLDER REPORT | October 31, 2024
This annual shareholder report contains important information about the Alger Focus Equity Fund (“Fund”) for the period of November 1, 2023 to October 31, 2024. You can find additional information about the Fund at https://connect.rightprospectus.com/Alger. You can also request a copy of the annual report by contacting us at (800) 992-3863.
This report describes material changes to the Fund that occurred during the reporting period.
What were the Fund costs for the last year?
(Based on a hypothetical $10,000 investment)
| Fund (Class/Ticker) | Costs of a $10,000 investment | Costs paid as a percentage of a $10,000 investment |
Alger Focus Equity Fund
(Class I / ALGRX) | $123 | 0.94% |
Management's Discussion of Fund Performance
What impacted Fund performance over the reporting period?
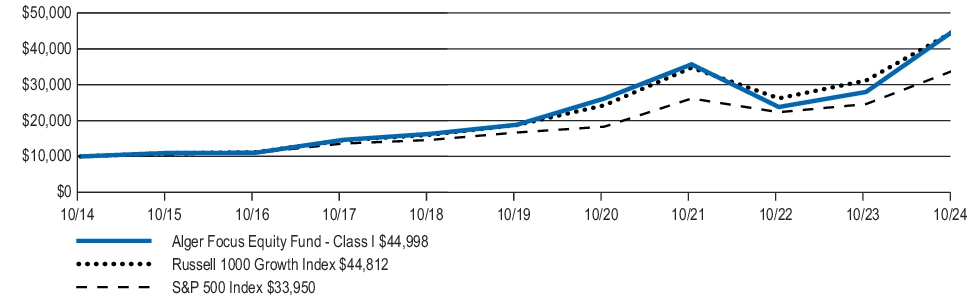
The Alger Focus Equity Fund Class I returned 60.84% for the fiscal twelve-month period ended October 31, 2024, compared to the 43.77% return of the Russell 1000 Growth Index. During the reporting period, the largest sector weightings were Information Technology and Communication Services. The largest sector overweight was Industrials and the largest sector underweight was Consumer Staples.
Contributors to Performance
The Information Technology and Health Care sectors provided the largest contributions to relative performance. NVIDIA Corp.; Meta Platforms Inc.; Microsoft Corp.; Natera, Inc.; and AppLovin Corp. were the top five contributors to absolute performance.
Detractors from Performance
The Consumer Staples and Financials sectors were the largest detractors from relative performance. Snowflake, Inc.; ASML Holding; Schlumberger Ltd.; EOG Resources, Inc.; and Fluence Energy, Inc. were the top five detractors from absolute performance.
| U.S. FACTOR | IMPACT | SUMMARY |
| Resilient Corporate Earnings | Positive | Strong corporate earnings were driven by profit margin improvement and robust consumer spending. Themes such as AI proliferation, waning cloud optimization pressure, and profit margin expansion from increased productivity and expense control also supported market sentiment. |
| Federal Reserve Rate Cuts | Positive | In September 2024, the Federal Reserve initiated a rate-cutting cycle with a 50-basis point reduction, aiming to bolster economic growth amid a strong but softening labor market and easing inflation, creating a favorable backdrop for equities. |
| Rising Geopolitical Tensions | Negative | Geopolitical conflicts and trade disputes created some uncertainty ahead of the 2024 U.S. presidential election. |
| Weakening U.S. Labor Market | Negative | In August 2024, equity markets experienced a brief sell-off due to growth concerns following a weaker-than-expected July payrolls report, which raised fears that the Federal Reserve might be slow to respond to slowing economic conditions. The unemployment rate increased to 4.3%, triggering the Sahm rule—a recession indicator that signals a likely recession when the three-month moving average of the unemployment rate rises by at least 50 basis points from its twelve-month low. |
Fund Performance
The following graph compares the initial and subsequent account values at the end of each of the most recently completed ten fiscal years of Class I shares of the Fund. The graph assumes a $10,000 initial investment at the beginning of the first annual period in an appropriate, broad-based securities market index and a more narrowly based index that reflects the market sector in which the Fund invests for the same period.
INITIAL INVESTMENT OF $10,000
| Average Annual Total Returns (As of October 31, 2024) | 1 Year | 5 Years | 10 Years |
| Alger Focus Equity Fund Class I | 60.84% | 19.03% | 16.23% |
| Russell 1000 Growth Index | 43.77% | 19.00% | 16.18% |
| S&P 500 Index | 38.02% | 15.27% | 13.00% |
Keep in mind that the Fund’s past performance is not a good predictor of how the Fund will perform in the future.
Visit https://www.alger.com/Pages/StrategyFinder.aspx?vehicle=mf for the most recent performance information. The graph and table do not reflect the deduction of taxes that a shareholder would pay on Fund distributions or redemption of Fund shares. All performance figures assume reinvestment of distributions.
Key Fund Statistics
The following table outlines key fund statistics as of the fiscal year ended October 31, 2024.
| Fund net assets | $1,791,352,839 |
| Total number of portfolio holdings1 | 51 |
| Portfolio turnover rate as of the end of the reporting period | 92.43% |
| Total advisory fees paid | $7,683,585 |
1 | Excludes Money Market Funds. |
| Communication Services | 14.0% |
| Consumer Discretionary | 12.1% |
| Energy | 1.0% |
| Financials | 3.1% |
| Healthcare | 7.4% |
| Industrials | 10.8% |
| Information Technology | 43.7% |
| Materials | 0.3% |
| Real Estate | 0.9% |
| Utilities | 2.3% |
| Short-Term Investments and Other Net Assets | 4.4% |
| 100.0% |
Material and Other Fund Changes
Effective January 29, 2024, the Fund's custodian and administrator transitioned from Brown Brothers Harriman & Company to The Bank of New York.
On August 16, 2024, at a joint special meeting of shareholders, shareholders of the Fund elected three new trustees and one current trustee to the Board.
This is a summary of certain changes to the Fund since November 1, 2023. For more complete information, you may review the Fund's next prospectus, which we expect to be available by February 28, 2025 at https://connect.rightprospectus.com/Alger or upon request at (800) 992-3863.
Availability of Additional Information
Householding
To reduce expenses, only one copy of the most recent financial reports and prospectus may be mailed to households, even if more than one person in a household holds shares of a Fund. Call an Alger Funds Representative at (800) 992-3863 if you need additional copies of financial reports or prospectuses, or download them at https://connect.rightprospectus.com/Alger. If you do not want the mailing of these documents to be combined with those for other members of your household, contact your broker-dealer or other financial intermediary or Alger Institutional Funds in writing at Alger Family of Funds, c/o UMB Fund Services, Inc. 235 W. Galena Street Milwaukee, WI 53212.
Alger Focus Equity Fund
Class Y / ALGYX
Annual SHAREHOLDER REPORT | October 31, 2024
This annual shareholder report contains important information about the Alger Focus Equity Fund (“Fund”) for the period of November 1, 2023 to October 31, 2024. You can find additional information about the Fund at https://connect.rightprospectus.com/Alger. You can also request a copy of the annual report by contacting us at (800) 992-3863.
This report describes material changes to the Fund that occurred during the reporting period.
What were the Fund costs for the last year?
(Based on a hypothetical $10,000 investment)
| Fund (Class/Ticker) | Costs of a $10,000 investment | Costs paid as a percentage of a $10,000 investment |
Alger Focus Equity Fund
(Class Y / ALGYX) | $76 | 0.58% |
Management's Discussion of Fund Performance
What impacted Fund performance over the reporting period?
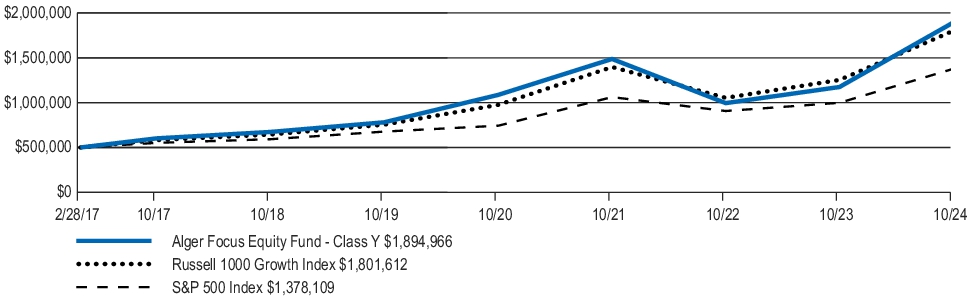
The Alger Focus Equity Fund Class Y returned 61.36% for the fiscal twelve-month period ended October 31, 2024, compared to the 43.77% return of the Russell 1000 Growth Index. During the reporting period, the largest sector weightings were Information Technology and Communication Services. The largest sector overweight was Industrials and the largest sector underweight was Consumer Staples.
Contributors to Performance
The Information Technology and Health Care sectors provided the largest contributions to relative performance. NVIDIA Corp.; Meta Platforms Inc.; Microsoft Corp.; Natera, Inc.; and AppLovin Corp. were the top five contributors to absolute performance.
Detractors from Performance
The Consumer Staples and Financials sectors were the largest detractors from relative performance. Snowflake, Inc.; ASML Holding; Schlumberger Ltd.; EOG Resources, Inc.; and Fluence Energy, Inc. were the top five detractors from absolute performance.
| U.S. FACTOR | IMPACT | SUMMARY |
| Resilient Corporate Earnings | Positive | Strong corporate earnings were driven by profit margin improvement and robust consumer spending. Themes such as AI proliferation, waning cloud optimization pressure, and profit margin expansion from increased productivity and expense control also supported market sentiment. |
| Federal Reserve Rate Cuts | Positive | In September 2024, the Federal Reserve initiated a rate-cutting cycle with a 50-basis point reduction, aiming to bolster economic growth amid a strong but softening labor market and easing inflation, creating a favorable backdrop for equities. |
| Rising Geopolitical Tensions | Negative | Geopolitical conflicts and trade disputes created some uncertainty ahead of the 2024 U.S. presidential election. |
| Weakening U.S. Labor Market | Negative | In August 2024, equity markets experienced a brief sell-off due to growth concerns following a weaker-than-expected July payrolls report, which raised fears that the Federal Reserve might be slow to respond to slowing economic conditions. The unemployment rate increased to 4.3%, triggering the Sahm rule—a recession indicator that signals a likely recession when the three-month moving average of the unemployment rate rises by at least 50 basis points from its twelve-month low. |
Fund Performance
The following graph compares the initial and subsequent account values at the end of each of the most recently completed annual periods for the life of Class Y shares of the Fund since its inception. The graph assumes a $500,000 initial investment at net asset value at the inception date of the Fund in an appropriate, broad-based securities market index and a more narrowly based index that reflects the market sector in which the Fund invests for the same period.
INITIAL INVESTMENT OF $500,000
| Average Annual Total Returns (As of October 31, 2024) | 1 Year | 5 Years | Since Inception
2/28/17 |
| Alger Focus Equity Fund Class Y | 61.36% | 19.40% | 18.97% |
| Russell 1000 Growth Index | 43.77% | 19.00% | 18.19% |
| S&P 500 Index | 38.02% | 15.27% | 14.13% |
Keep in mind that the Fund’s past performance is not a good predictor of how the Fund will perform in the future.
Visit https://www.alger.com/Pages/StrategyFinder.aspx?vehicle=mf for the most recent performance information. The graph and table do not reflect the deduction of taxes that a shareholder would pay on Fund distributions or redemption of Fund shares. All performance figures assume reinvestment of distributions.
Key Fund Statistics
The following table outlines key fund statistics as of the fiscal year ended October 31, 2024.
| Fund net assets | $1,791,352,839 |
| Total number of portfolio holdings1 | 51 |
| Portfolio turnover rate as of the end of the reporting period | 92.43% |
| Total advisory fees paid | $7,683,585 |
1 | Excludes Money Market Funds. |
| Communication Services | 14.0% |
| Consumer Discretionary | 12.1% |
| Energy | 1.0% |
| Financials | 3.1% |
| Healthcare | 7.4% |
| Industrials | 10.8% |
| Information Technology | 43.7% |
| Materials | 0.3% |
| Real Estate | 0.9% |
| Utilities | 2.3% |
| Short-Term Investments and Other Net Assets | 4.4% |
| 100.0% |
Material and Other Fund Changes
Effective January 29, 2024, the Fund's custodian and administrator transitioned from Brown Brothers Harriman & Company to The Bank of New York.
On August 16, 2024, at a joint special meeting of shareholders, shareholders of the Fund elected three new trustees and one current trustee to the Board.
Effective March 1, 2024, Alger Management has contractually agreed to waive and/or reimburse Fund expenses (excluding custody fees, acquired fund fees and expenses, dividend expense on short sales, net borrowing costs, interest, taxes, brokerage and extraordinary expenses, to the extent applicable) through October 31, 2025 to the extent necessary to limit other expenses and any other applicable share class-specific expenses of the Class Y Shares of the Fund to 0.06% of the class’s average daily net assets. On October 22, 2024, the Board approved that any fees incurred as a result of the joint special meeting of shareholders would be excluded from the expense reimbursement.
This is a summary of certain changes to the Fund since November 1, 2023. For more complete information, you may review the Fund's next prospectus, which we expect to be available by February 28, 2025 at https://connect.rightprospectus.com/Alger or upon request at (800) 992-3863.
Availability of Additional Information
Householding
To reduce expenses, only one copy of the most recent financial reports and prospectus may be mailed to households, even if more than one person in a household holds shares of a Fund. Call an Alger Funds Representative at (800) 992-3863 if you need additional copies of financial reports or prospectuses, or download them at https://connect.rightprospectus.com/Alger. If you do not want the mailing of these documents to be combined with those for other members of your household, contact your broker-dealer or other financial intermediary or Alger Institutional Funds in writing at Alger Family of Funds, c/o UMB Fund Services, Inc. 235 W. Galena Street Milwaukee, WI 53212.
Alger Focus Equity Fund
Class Z / ALZFX
Annual SHAREHOLDER REPORT | October 31, 2024
This annual shareholder report contains important information about the Alger Focus Equity Fund (“Fund”) for the period of November 1, 2023 to October 31, 2024. You can find additional information about the Fund at https://connect.rightprospectus.com/Alger. You can also request a copy of the annual report by contacting us at (800) 992-3863.
This report describes material changes to the Fund that occurred during the reporting period.
What were the Fund costs for the last year?
(Based on a hypothetical $10,000 investment)
| Fund (Class/Ticker) | Costs of a $10,000 investment | Costs paid as a percentage of a $10,000 investment |
Alger Focus Equity Fund
(Class Z / ALZFX) | $82 | 0.63% |
Management's Discussion of Fund Performance
What impacted Fund performance over the reporting period?
The Alger Focus Equity Fund Class Z returned 61.29% for the fiscal twelve-month period ended October 31, 2024, compared to the 43.77% return of the Russell 1000 Growth Index. During the reporting period, the largest sector weightings were Information Technology and Communication Services. The largest sector overweight was Industrials and the largest sector underweight was Consumer Staples.
Contributors to Performance
The Information Technology and Health Care sectors provided the largest contributions to relative performance. NVIDIA Corp.; Meta Platforms Inc.; Microsoft Corp.; Natera, Inc.; and AppLovin Corp. were the top five contributors to absolute performance.
Detractors from Performance
The Consumer Staples and Financials sectors were the largest detractors from relative performance. Snowflake, Inc.; ASML Holding; Schlumberger Ltd.; EOG Resources, Inc.; and Fluence Energy, Inc. were the top five detractors from absolute performance.
| U.S. FACTOR | IMPACT | SUMMARY |
| Resilient Corporate Earnings | Positive | Strong corporate earnings were driven by profit margin improvement and robust consumer spending. Themes such as AI proliferation, waning cloud optimization pressure, and profit margin expansion from increased productivity and expense control also supported market sentiment. |
| Federal Reserve Rate Cuts | Positive | In September 2024, the Federal Reserve initiated a rate-cutting cycle with a 50-basis point reduction, aiming to bolster economic growth amid a strong but softening labor market and easing inflation, creating a favorable backdrop for equities. |
| Rising Geopolitical Tensions | Negative | Geopolitical conflicts and trade disputes created some uncertainty ahead of the 2024 U.S. presidential election. |
| Weakening U.S. Labor Market | Negative | In August 2024, equity markets experienced a brief sell-off due to growth concerns following a weaker-than-expected July payrolls report, which raised fears that the Federal Reserve might be slow to respond to slowing economic conditions. The unemployment rate increased to 4.3%, triggering the Sahm rule—a recession indicator that signals a likely recession when the three-month moving average of the unemployment rate rises by at least 50 basis points from its twelve-month low. |
Fund Performance
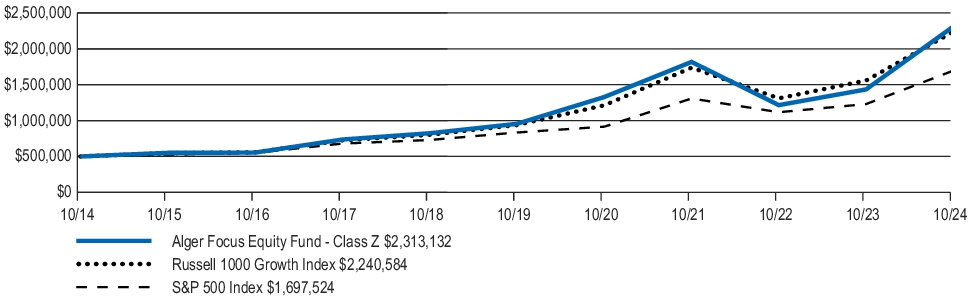
The following graph compares the initial and subsequent account values at the end of each of the most recently completed ten fiscal years of Class Z shares of the Fund. The graph assumes a $500,000 initial investment at the beginning of the first annual period in an appropriate, broad-based securities market index and a more narrowly based index that reflects the market sector in which the Fund invests for the same period.
INITIAL INVESTMENT OF $500,000
| Average Annual Total Returns (As of October 31, 2024) | 1 Year | 5 Years | 10 Years |
| Alger Focus Equity Fund Class Z | 61.29% | 19.37% | 16.55% |
| Russell 1000 Growth Index | 43.77% | 19.00% | 16.18% |
| S&P 500 Index | 38.02% | 15.27% | 13.00% |
Keep in mind that the Fund’s past performance is not a good predictor of how the Fund will perform in the future.
Visit https://www.alger.com/Pages/StrategyFinder.aspx?vehicle=mf for the most recent performance information. The graph and table do not reflect the deduction of taxes that a shareholder would pay on Fund distributions or redemption of Fund shares. All performance figures assume reinvestment of distributions.
Key Fund Statistics
The following table outlines key fund statistics as of the fiscal year ended October 31, 2024.
| Fund net assets | $1,791,352,839 |
| Total number of portfolio holdings1 | 51 |
| Portfolio turnover rate as of the end of the reporting period | 92.43% |
| Total advisory fees paid | $7,683,585 |
1 | Excludes Money Market Funds. |
| Communication Services | 14.0% |
| Consumer Discretionary | 12.1% |
| Energy | 1.0% |
| Financials | 3.1% |
| Healthcare | 7.4% |
| Industrials | 10.8% |
| Information Technology | 43.7% |
| Materials | 0.3% |
| Real Estate | 0.9% |
| Utilities | 2.3% |
| Short-Term Investments and Other Net Assets | 4.4% |
| 100.0% |
Material and Other Fund Changes
Effective January 29, 2024, the Fund's custodian and administrator transitioned from Brown Brothers Harriman & Company to The Bank of New York.
On August 16, 2024, at a joint special meeting of shareholders, shareholders of the Fund elected three new trustees and one current trustee to the Board.
Effective March 1, 2024, Alger Management has contractually agreed to waive and/or reimburse Fund expenses (excluding custody fees, acquired fund fees and expenses, dividend expense on short sales, net borrowing costs, interest, taxes, brokerage and extraordinary expenses, to the extent applicable) through October 31, 2025 to the extent necessary to limit other expenses and any other applicable share class-specific expenses of the Class Z Shares of the Fund to 0.11% of the class’s average daily net assets. On October 22, 2024, the Board approved that any fees incurred as a result of the joint special meeting of shareholders would be excluded from the expense reimbursement.
This is a summary of certain changes to the Fund since November 1, 2023. For more complete information, you may review the Fund's next prospectus, which we expect to be available by February 28, 2025 at https://connect.rightprospectus.com/Alger or upon request at (800) 992-3863.
Availability of Additional Information
Householding
To reduce expenses, only one copy of the most recent financial reports and prospectus may be mailed to households, even if more than one person in a household holds shares of a Fund. Call an Alger Funds Representative at (800) 992-3863 if you need additional copies of financial reports or prospectuses, or download them at https://connect.rightprospectus.com/Alger. If you do not want the mailing of these documents to be combined with those for other members of your household, contact your broker-dealer or other financial intermediary or Alger Institutional Funds in writing at Alger Family of Funds, c/o UMB Fund Services, Inc. 235 W. Galena Street Milwaukee, WI 53212.
Alger Mid Cap Growth Institutional Fund
Class I / ALMRX
Annual SHAREHOLDER REPORT | October 31, 2024
This annual shareholder report contains important information about the Alger Mid Cap Growth Institutional Fund (“Fund”) for the period of November 1, 2023 to October 31, 2024. You can find additional information about the Fund at https://connect.rightprospectus.com/Alger. You can also request a copy of the annual report by contacting us at (800) 992-3863.
This report describes material changes to the Fund that occurred during the reporting period.
What were the Fund costs for the last year?
(Based on a hypothetical $10,000 investment)
| Fund (Class/Ticker) | Costs of a $10,000 investment | Costs paid as a percentage of a $10,000 investment |
Alger Mid Cap Growth Institutional Fund
(Class I / ALMRX) | $154 | 1.31% |
Management's Discussion of Fund Performance
What impacted Fund performance over the reporting period?
The Alger Mid Cap Growth Institutional Fund Class I returned 35.83% for the fiscal twelve-month period ended October 31, 2024, compared to the 38.67% return of the Russell Midcap Growth Index. During the reporting period, the largest sector weightings were Information Technology and Industrials. The largest sector overweight was Information Technology and the largest sector underweight was Financials.
Contributors to Performance
The Information Technology and Health Care sectors provided the largest contributions to relative performance. Natera, Inc.; Vertiv Holdings Co.; Spotify Technology; AppLovin Corp.; and Constellation Software Inc. were the top five contributors to absolute performance.
Detractors from Performance
The Consumer Discretionary and Financials sectors were the largest detractors from relative performance. Super Micro Computer, Inc.; Lattice Semiconductor Corp.; Wayfair, Inc.; Five Below, Inc.; and Paycom Software, Inc. were the top five detractors from absolute performance.
| U.S. FACTOR | IMPACT | SUMMARY |
| Resilient Corporate Earnings | Positive | Strong corporate earnings were driven by profit margin improvement and robust consumer spending. Themes such as AI proliferation, waning cloud optimization pressure, and profit margin expansion from increased productivity and expense control also supported market sentiment. |
| Federal Reserve Rate Cuts | Positive | In September 2024, the Federal Reserve initiated a rate-cutting cycle with a 50-basis point reduction, aiming to bolster economic growth amid a strong but softening labor market and easing inflation, creating a favorable backdrop for equities. |
| Rising Geopolitical Tensions | Negative | Geopolitical conflicts and trade disputes created some uncertainty ahead of the 2024 U.S. presidential election. |
| Weakening U.S. Labor Market | Negative | In August 2024, equity markets experienced a brief sell-off due to growth concerns following a weaker-than-expected July payrolls report, which raised fears that the Federal Reserve might be slow to respond to slowing economic conditions. The unemployment rate increased to 4.3%, triggering the Sahm rule—a recession indicator that signals a likely recession when the three-month moving average of the unemployment rate rises by at least 50 basis points from its twelve-month low. |
Fund Performance
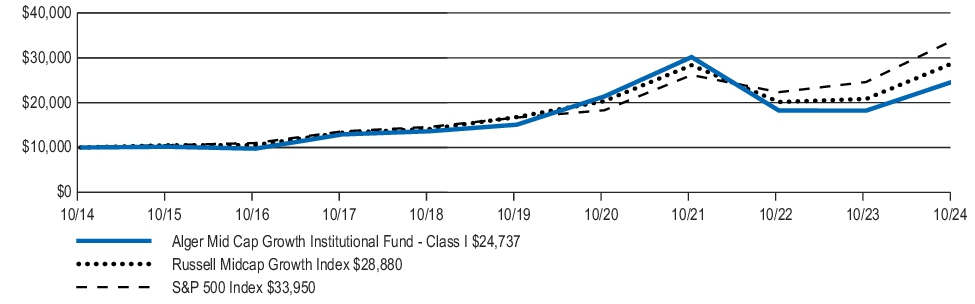
The following graph compares the initial and subsequent account values at the end of each of the most recently completed ten fiscal years of Class I shares of the Fund. The graph assumes a $10,000 initial investment at the beginning of the first annual period in an appropriate, broad-based securities market index and a more narrowly based index that reflects the market sector in which the Fund invests for the same period.
INITIAL INVESTMENT OF $10,000
| Average Annual Total Returns (As of October 31, 2024) | 1 Year | 5 Years | 10 Years |
| Alger Mid Cap Growth Institutional Fund Class I | 35.83% | 10.40% | 9.48% |
| Russell Midcap Growth Index | 38.67% | 11.46% | 11.19% |
| S&P 500 Index | 38.02% | 15.27% | 13.00% |
Keep in mind that the Fund’s past performance is not a good predictor of how the Fund will perform in the future.
Visit https://www.alger.com/Pages/StrategyFinder.aspx?vehicle=mf for the most recent performance information. The graph and table do not reflect the deduction of taxes that a shareholder would pay on Fund distributions or redemption of Fund shares. All performance figures assume reinvestment of distributions.
Key Fund Statistics
The following table outlines key fund statistics as of the fiscal year ended October 31, 2024.
| Fund net assets | $65,737,384 |
| Total number of portfolio holdings1 | 64 |
| Portfolio turnover rate as of the end of the reporting period | 56.01% |
| Total advisory fees paid | $491,165 |
1 | Excludes Money Market Funds. |
| Communication Services | 7.8% |
| Consumer Discretionary | 10.8% |
| Consumer Staples | 0.4% |
| Energy | 2.2% |
| Financials | 10.1% |
| Healthcare | 10.8% |
| Industrials | 23.1% |
| Information Technology | 29.9% |
| Materials | 1.8% |
| Real Estate | 3.8% |
| Short-Term Investments and Other Net Assets | (0.7)% |
| 100.0% |
Material and Other Fund Changes
Effective January 29, 2024, the Fund's custodian and administrator transitioned from Brown Brothers Harriman & Company to The Bank of New York.
On August 16, 2024, at a joint special meeting of shareholders, shareholders of the Fund elected three new trustees and one current trustee to the Board.
Effective February 29, 2024, Fred Alger Management, LLC has contractually agreed to waive and/or reimburse Fund expenses (excluding custody fees, acquired fund fees and expenses, dividend expense on short sales, net borrowing costs, interest, taxes, brokerage and extraordinary expenses, to the extent applicable) through October 31, 2025 to the extent necessary to limit other expenses and any other applicable share class-specific expenses of the Class I Shares of the Fund to 0.48% of the class’s average daily net assets.
This is a summary of certain changes to the Fund since November 1, 2023. For more complete information, you may review the Fund's next prospectus, which we expect to be available by February 28, 2025 at https://connect.rightprospectus.com/Alger or upon request at (800) 992-3863.
Availability of Additional Information
Householding
To reduce expenses, only one copy of the most recent financial reports and prospectus may be mailed to households, even if more than one person in a household holds shares of a Fund. Call an Alger Funds Representative at (800) 992-3863 if you need additional copies of financial reports or prospectuses, or download them at https://connect.rightprospectus.com/Alger. If you do not want the mailing of these documents to be combined with those for other members of your household, contact your broker-dealer or other financial intermediary or Alger Institutional Funds in writing at Alger Family of Funds, c/o UMB Fund Services, Inc. 235 W. Galena Street Milwaukee, WI 53212.
Alger Mid Cap Growth Institutional Fund
Class R / AGIRX
Annual SHAREHOLDER REPORT | October 31, 2024
This annual shareholder report contains important information about the Alger Mid Cap Growth Institutional Fund (“Fund”) for the period of November 1, 2023 to October 31, 2024. You can find additional information about the Fund at https://connect.rightprospectus.com/Alger. You can also request a copy of the annual report by contacting us at (800) 992-3863.
This report describes material changes to the Fund that occurred during the reporting period.
What were the Fund costs for the last year?
(Based on a hypothetical $10,000 investment)
| Fund (Class/Ticker) | Costs of a $10,000 investment | Costs paid as a percentage of a $10,000 investment |
Alger Mid Cap Growth Institutional Fund
(Class R / AGIRX) | $217 | 1.85% |
Management's Discussion of Fund Performance
What impacted Fund performance over the reporting period?
The Alger Mid Cap Growth Institutional Fund Class R returned 35.12% for the fiscal twelve-month period ended October 31, 2024, compared to the 38.67% return of the Russell Midcap Growth Index. During the reporting period, the largest sector weightings were Information Technology and Industrials. The largest sector overweight was Information Technology and the largest sector underweight was Financials.
Contributors to Performance
The Information Technology and Health Care sectors provided the largest contributions to relative performance. Natera, Inc.; Vertiv Holdings Co.; Spotify Technology; AppLovin Corp.; and Constellation Software Inc. were the top five contributors to absolute performance.
Detractors from Performance
The Consumer Discretionary and Financials sectors were the largest detractors from relative performance. Super Micro Computer, Inc.; Lattice Semiconductor Corp.; Wayfair, Inc.; Five Below, Inc.; and Paycom Software, Inc. were the top five detractors from absolute performance.
| U.S. FACTOR | IMPACT | SUMMARY |
| Resilient Corporate Earnings | Positive | Strong corporate earnings were driven by profit margin improvement and robust consumer spending. Themes such as AI proliferation, waning cloud optimization pressure, and profit margin expansion from increased productivity and expense control also supported market sentiment. |
| Federal Reserve Rate Cuts | Positive | In September 2024, the Federal Reserve initiated a rate-cutting cycle with a 50-basis point reduction, aiming to bolster economic growth amid a strong but softening labor market and easing inflation, creating a favorable backdrop for equities. |
| Rising Geopolitical Tensions | Negative | Geopolitical conflicts and trade disputes created some uncertainty ahead of the 2024 U.S. presidential election. |
| Weakening U.S. Labor Market | Negative | In August 2024, equity markets experienced a brief sell-off due to growth concerns following a weaker-than-expected July payrolls report, which raised fears that the Federal Reserve might be slow to respond to slowing economic conditions. The unemployment rate increased to 4.3%, triggering the Sahm rule—a recession indicator that signals a likely recession when the three-month moving average of the unemployment rate rises by at least 50 basis points from its twelve-month low. |
Fund Performance
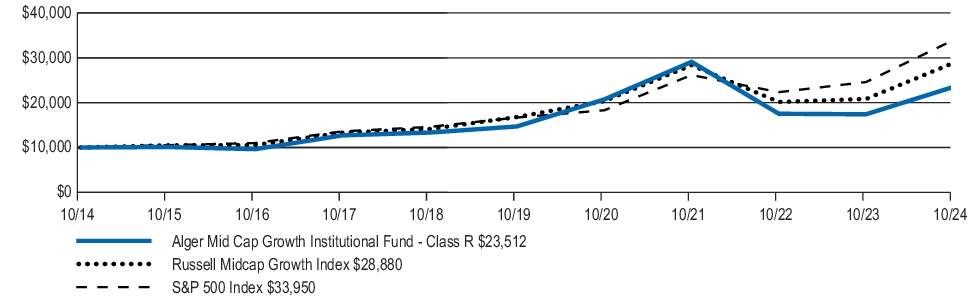
The following graph compares the initial and subsequent account values at the end of each of the most recently completed ten fiscal years of Class R shares of the Fund. The graph assumes a $10,000 initial investment at the beginning of the first annual period in an appropriate, broad-based securities market index and a more narrowly based index that reflects the market sector in which the Fund invests for the same period.
INITIAL INVESTMENT OF $10,000
| Average Annual Total Returns (As of October 31, 2024) | 1 Year | 5 Years | 10 Years |
| Alger Mid Cap Growth Institutional Fund Class R | 35.12% | 9.86% | 8.93% |
| Russell Midcap Growth Index | 38.67% | 11.46% | 11.19% |
| S&P 500 Index | 38.02% | 15.27% | 13.00% |
Keep in mind that the Fund’s past performance is not a good predictor of how the Fund will perform in the future.
Visit https://www.alger.com/Pages/StrategyFinder.aspx?vehicle=mf for the most recent performance information. The graph and table do not reflect the deduction of taxes that a shareholder would pay on Fund distributions or redemption of Fund shares. All performance figures assume reinvestment of distributions.
Key Fund Statistics
The following table outlines key fund statistics as of the fiscal year ended October 31, 2024.
| Fund net assets | $65,737,384 |
| Total number of portfolio holdings1 | 64 |
| Portfolio turnover rate as of the end of the reporting period | 56.01% |
| Total advisory fees paid | $491,165 |
1 | Excludes Money Market Funds. |
| Communication Services | 7.8% |
| Consumer Discretionary | 10.8% |
| Consumer Staples | 0.4% |
| Energy | 2.2% |
| Financials | 10.1% |
| Healthcare | 10.8% |
| Industrials | 23.1% |
| Information Technology | 29.9% |
| Materials | 1.8% |
| Real Estate | 3.8% |
| Short-Term Investments and Other Net Assets | (0.7)% |
| 100.0% |
Material and Other Fund Changes
Effective January 29, 2024, the Fund's custodian and administrator transitioned from Brown Brothers Harriman & Company to The Bank of New York.
On August 16, 2024, at a joint special meeting of shareholders, shareholders of the Fund elected three new trustees and one current trustee to the Board.
This is a summary of certain changes to the Fund since November 1, 2023. For more complete information, you may review the Fund's next prospectus, which we expect to be available by February 28, 2025 at https://connect.rightprospectus.com/Alger or upon request at (800) 992-3863.
Availability of Additional Information
Householding
To reduce expenses, only one copy of the most recent financial reports and prospectus may be mailed to households, even if more than one person in a household holds shares of a Fund. Call an Alger Funds Representative at (800) 992-3863 if you need additional copies of financial reports or prospectuses, or download them at https://connect.rightprospectus.com/Alger. If you do not want the mailing of these documents to be combined with those for other members of your household, contact your broker-dealer or other financial intermediary or Alger Institutional Funds in writing at Alger Family of Funds, c/o UMB Fund Services, Inc. 235 W. Galena Street Milwaukee, WI 53212.
Alger Mid Cap Growth Institutional Fund
Class Z-2 / ALMZX
Annual SHAREHOLDER REPORT | October 31, 2024
This annual shareholder report contains important information about the Alger Mid Cap Growth Institutional Fund (“Fund”) for the period of November 1, 2023 to October 31, 2024. You can find additional information about the Fund at https://connect.rightprospectus.com/Alger. You can also request a copy of the annual report by contacting us at (800) 992-3863.
This report describes material changes to the Fund that occurred during the reporting period.
What were the Fund costs for the last year?
(Based on a hypothetical $10,000 investment)
| Fund (Class/Ticker) | Costs of a $10,000 investment | Costs paid as a percentage of a $10,000 investment |
Alger Mid Cap Growth Institutional Fund
(Class Z-2 / ALMZX) | $118 | 1.00% |
Management's Discussion of Fund Performance
What impacted Fund performance over the reporting period?
The Alger Mid Cap Growth Institutional Fund Class Z-2 returned 36.22% for the fiscal twelve-month period ended October 31, 2024, compared to the 38.67% return of the Russell Midcap Growth Index. During the reporting period, the largest sector weightings were Information Technology and Industrials. The largest sector overweight was Information Technology and the largest sector underweight was Financials.
Contributors to Performance
The Information Technology and Health Care sectors provided the largest contributions to relative performance. Natera, Inc.; Vertiv Holdings Co.; Spotify Technology; AppLovin Corp.; and Constellation Software Inc. were the top five contributors to absolute performance.
Detractors from Performance
The Consumer Discretionary and Financials sectors were the largest detractors from relative performance. Super Micro Computer, Inc.; Lattice Semiconductor Corp.; Wayfair, Inc.; Five Below, Inc.; and Paycom Software, Inc. were the top five detractors from absolute performance.
| U.S. FACTOR | IMPACT | SUMMARY |
| Resilient Corporate Earnings | Positive | Strong corporate earnings were driven by profit margin improvement and robust consumer spending. Themes such as AI proliferation, waning cloud optimization pressure, and profit margin expansion from increased productivity and expense control also supported market sentiment. |
| Federal Reserve Rate Cuts | Positive | In September 2024, the Federal Reserve initiated a rate-cutting cycle with a 50-basis point reduction, aiming to bolster economic growth amid a strong but softening labor market and easing inflation, creating a favorable backdrop for equities. |
| Rising Geopolitical Tensions | Negative | Geopolitical conflicts and trade disputes created some uncertainty ahead of the 2024 U.S. presidential election. |
| Weakening U.S. Labor Market | Negative | In August 2024, equity markets experienced a brief sell-off due to growth concerns following a weaker-than-expected July payrolls report, which raised fears that the Federal Reserve might be slow to respond to slowing economic conditions. The unemployment rate increased to 4.3%, triggering the Sahm rule—a recession indicator that signals a likely recession when the three-month moving average of the unemployment rate rises by at least 50 basis points from its twelve-month low. |
Fund Performance
The following graph compares the initial and subsequent account values at the end of each of the most recently completed annual periods for the life of Class Z-2 shares of the Fund since its inception. The graph assumes a $500,000 initial investment at net asset value at the inception date of the Fund in an appropriate, broad-based securities market index and a more narrowly based index that reflects the market sector in which the Fund invests for the same period.
INITIAL INVESTMENT OF $500,000
| Average Annual Total Returns (As of October 31, 2024) | 1 Year | 5 Years | Since Inception
10/14/16 |
| Alger Mid Cap Growth Institutional Fund Class Z-2 | 36.22% | 10.80% | 12.43% |
| Russell Midcap Growth Index | 38.67% | 11.46% | 13.19% |
| S&P 500 Index | 38.02% | 15.27% | 15.00% |
Keep in mind that the Fund’s past performance is not a good predictor of how the Fund will perform in the future.
Visit https://www.alger.com/Pages/StrategyFinder.aspx?vehicle=mf for the most recent performance information. The graph and table do not reflect the deduction of taxes that a shareholder would pay on Fund distributions or redemption of Fund shares. All performance figures assume reinvestment of distributions.
Key Fund Statistics
The following table outlines key fund statistics as of the fiscal year ended October 31, 2024.
| Fund net assets | $65,737,384 |
| Total number of portfolio holdings1 | 64 |
| Portfolio turnover rate as of the end of the reporting period | 56.01% |
| Total advisory fees paid | $491,165 |
1 | Excludes Money Market Funds. |
| Communication Services | 7.8% |
| Consumer Discretionary | 10.8% |
| Consumer Staples | 0.4% |
| Energy | 2.2% |
| Financials | 10.1% |
| Healthcare | 10.8% |
| Industrials | 23.1% |
| Information Technology | 29.9% |
| Materials | 1.8% |
| Real Estate | 3.8% |
| Short-Term Investments and Other Net Assets | (0.7)% |
| 100.0% |
Material and Other Fund Changes
Effective January 29, 2024, the Fund's custodian and administrator transitioned from Brown Brothers Harriman & Company to The Bank of New York.
On August 16, 2024, at a joint special meeting of shareholders, shareholders of the Fund elected three new trustees and one current trustee to the Board.
This is a summary of certain changes to the Fund since November 1, 2023. For more complete information, you may review the Fund's next prospectus, which we expect to be available by February 28, 2025 at https://connect.rightprospectus.com/Alger or upon request at (800) 992-3863.
Availability of Additional Information
Householding
To reduce expenses, only one copy of the most recent financial reports and prospectus may be mailed to households, even if more than one person in a household holds shares of a Fund. Call an Alger Funds Representative at (800) 992-3863 if you need additional copies of financial reports or prospectuses, or download them at https://connect.rightprospectus.com/Alger. If you do not want the mailing of these documents to be combined with those for other members of your household, contact your broker-dealer or other financial intermediary or Alger Institutional Funds in writing at Alger Family of Funds, c/o UMB Fund Services, Inc. 235 W. Galena Street Milwaukee, WI 53212.
Alger Small Cap Growth Institutional Fund
Class I / ALSRX
Annual SHAREHOLDER REPORT | October 31, 2024
This annual shareholder report contains important information about the Alger Small Cap Growth Institutional Fund (“Fund”) for the period of November 1, 2023 to October 31, 2024. You can find additional information about the Fund at https://connect.rightprospectus.com/Alger. You can also request a copy of the annual report by contacting us at (800) 992-3863.
This report describes material changes to the Fund that occurred during the reporting period.
What were the Fund costs for the last year?
(Based on a hypothetical $10,000 investment)
| Fund (Class/Ticker) | Costs of a $10,000 investment | Costs paid as a percentage of a $10,000 investment |
Alger Small Cap Growth Institutional Fund
(Class I / ALSRX) | $159 | 1.41% |
Management's Discussion of Fund Performance
What impacted Fund performance over the reporting period?
The Alger Small Cap Growth Institutional Fund Class I returned 25.82% for the fiscal twelve-month period ended October 31, 2024, compared to the 36.49% return of the Russell 2000 Growth Index. During the reporting period, the largest sector weightings were Information Technology and Health Care. The largest sector overweight was Consumer Discretionary and the largest sector underweight was Industrials.
Contributors to Performance
The Consumer Discretionary and Communication Services sectors provided the largest contributions to relative performance. Q2 Holdings, Inc.; Wingstop, Inc.; Shake Shack, Inc.; Guidewire Software, Inc.; and Manhattan Associates, Inc. were the top five contributors to absolute performance.
Detractors from Performance
The Health Care and Industrials sectors were the largest detractors from relative performance. Cabaletta Bio, Inc.; Structure Therapeutics, Inc.; Capri Holdings Ltd.; DLocal Ltd.; and 908 Devices Inc. were the top five detractors from absolute performance.
| U.S. FACTOR | IMPACT | SUMMARY |
| Resilient Corporate Earnings | Positive | Strong corporate earnings were driven by profit margin improvement and robust consumer spending. Themes such as AI proliferation, waning cloud optimization pressure, and profit margin expansion from increased productivity and expense control also supported market sentiment. |
| Federal Reserve Rate Cuts | Positive | In September 2024, the Federal Reserve initiated a rate-cutting cycle with a 50-basis point reduction, aiming to bolster economic growth amid a strong but softening labor market and easing inflation, creating a favorable backdrop for equities. |
| Rising Geopolitical Tensions | Negative | Geopolitical conflicts and trade disputes created some uncertainty ahead of the 2024 U.S. presidential election. |
| Weakening U.S. Labor Market | Negative | In August 2024, equity markets experienced a brief sell-off due to growth concerns following a weaker-than-expected July payrolls report, which raised fears that the Federal Reserve might be slow to respond to slowing economic conditions. The unemployment rate increased to 4.3%, triggering the Sahm rule—a recession indicator that signals a likely recession when the three-month moving average of the unemployment rate rises by at least 50 basis points from its twelve-month low. |
Fund Performance
The following graph compares the initial and subsequent account values at the end of each of the most recently completed ten fiscal years of Class I shares of the Fund. The graph assumes a $10,000 initial investment at the beginning of the first annual period in an appropriate, broad-based securities market index and a more narrowly based index that reflects the market sector in which the Fund invests for the same period.
INITIAL INVESTMENT OF $10,000
| Average Annual Total Returns (As of October 31, 2024) | 1 Year | 5 Years | 10 Years |
| Alger Small Cap Growth Institutional Fund Class I | 25.82% | 4.23% | 7.44% |
| Russell 2000 Growth Index | 36.49% | 7.92% | 8.15% |
| S&P 500 Index | 38.02% | 15.27% | 13.00% |
Keep in mind that the Fund’s past performance is not a good predictor of how the Fund will perform in the future.
Visit https://www.alger.com/Pages/StrategyFinder.aspx?vehicle=mf for the most recent performance information. The graph and table do not reflect the deduction of taxes that a shareholder would pay on Fund distributions or redemption of Fund shares. All performance figures assume reinvestment of distributions.
Key Fund Statistics
The following table outlines key fund statistics as of the fiscal year ended October 31, 2024.
| Fund net assets | $89,675,156 |
| Total number of portfolio holdings1 | 104 |
| Portfolio turnover rate as of the end of the reporting period | 48.95% |
| Total advisory fees paid | $877,483 |
1 | Excludes Money Market Funds. |
| Communication Services | 0.5% |
| Consumer Discretionary | 18.2% |
| Consumer Staples | 2.1% |
| Energy | 0.7% |
| Financials | 1.4% |
| Healthcare | 29.4% |
| Industrials | 12.2% |
| Information Technology | 34.9% |
| Materials | 0.1% |
| Short-Term Investments and Other Net Assets | 0.5% |
| 100.0% |
Material and Other Fund Changes
Effective January 29, 2024, the Fund's custodian and administrator transitioned from Brown Brothers Harriman & Company to The Bank of New York.
On August 16, 2024, at a joint special meeting of shareholders, shareholders of the Fund elected three new trustees and one current trustee to the Board.
This is a summary of certain changes to the Fund since November 1, 2023. For more complete information, you may review the Fund's next prospectus, which we expect to be available by February 28, 2025 at https://connect.rightprospectus.com/Alger or upon request at (800) 992-3863.
Availability of Additional Information
Householding
To reduce expenses, only one copy of the most recent financial reports and prospectus may be mailed to households, even if more than one person in a household holds shares of a Fund. Call an Alger Funds Representative at (800) 992-3863 if you need additional copies of financial reports or prospectuses, or download them at https://connect.rightprospectus.com/Alger. If you do not want the mailing of these documents to be combined with those for other members of your household, contact your broker-dealer or other financial intermediary or Alger Institutional Funds in writing at Alger Family of Funds, c/o UMB Fund Services, Inc. 235 W. Galena Street Milwaukee, WI 53212.
Alger Small Cap Growth Institutional Fund
Class R / ASIRX
Annual SHAREHOLDER REPORT | October 31, 2024
This annual shareholder report contains important information about the Alger Small Cap Growth Institutional Fund (“Fund”) for the period of November 1, 2023 to October 31, 2024. You can find additional information about the Fund at https://connect.rightprospectus.com/Alger. You can also request a copy of the annual report by contacting us at (800) 992-3863.
This report describes material changes to the Fund that occurred during the reporting period.
What were the Fund costs for the last year?
(Based on a hypothetical $10,000 investment)
| Fund (Class/Ticker) | Costs of a $10,000 investment | Costs paid as a percentage of a $10,000 investment |
Alger Small Cap Growth Institutional Fund
(Class R / ASIRX) | $212 | 1.88% |
Management's Discussion of Fund Performance
What impacted Fund performance over the reporting period?
The Alger Small Cap Growth Institutional Fund Class R returned 25.33% for the fiscal twelve-month period ended October 31, 2024, compared to the 36.49% return of the Russell 2000 Growth Index. During the reporting period, the largest sector weightings were Information Technology and Health Care. The largest sector overweight was Consumer Discretionary and the largest sector underweight was Industrials.
Contributors to Performance
The Consumer Discretionary and Communication Services sectors provided the largest contributions to relative performance. Q2 Holdings, Inc.; Wingstop, Inc.; Shake Shack, Inc.; Guidewire Software, Inc.; and Manhattan Associates, Inc. were the top five contributors to absolute performance.
Detractors from Performance
The Health Care and Industrials sectors were the largest detractors from relative performance. Cabaletta Bio, Inc.; Structure Therapeutics, Inc.; Capri Holdings Ltd.; DLocal Ltd.; and 908 Devices Inc. were the top five detractors from absolute performance.
| U.S. FACTOR | IMPACT | SUMMARY |
| Resilient Corporate Earnings | Positive | Strong corporate earnings were driven by profit margin improvement and robust consumer spending. Themes such as AI proliferation, waning cloud optimization pressure, and profit margin expansion from increased productivity and expense control also supported market sentiment. |
| Federal Reserve Rate Cuts | Positive | In September 2024, the Federal Reserve initiated a rate-cutting cycle with a 50-basis point reduction, aiming to bolster economic growth amid a strong but softening labor market and easing inflation, creating a favorable backdrop for equities. |
| Rising Geopolitical Tensions | Negative | Geopolitical conflicts and trade disputes created some uncertainty ahead of the 2024 U.S. presidential election. |
| Weakening U.S. Labor Market | Negative | In August 2024, equity markets experienced a brief sell-off due to growth concerns following a weaker-than-expected July payrolls report, which raised fears that the Federal Reserve might be slow to respond to slowing economic conditions. The unemployment rate increased to 4.3%, triggering the Sahm rule—a recession indicator that signals a likely recession when the three-month moving average of the unemployment rate rises by at least 50 basis points from its twelve-month low. |
Fund Performance
The following graph compares the initial and subsequent account values at the end of each of the most recently completed ten fiscal years of Class R shares of the Fund. The graph assumes a $10,000 initial investment at the beginning of the first annual period in an appropriate, broad-based securities market index and a more narrowly based index that reflects the market sector in which the Fund invests for the same period.
INITIAL INVESTMENT OF $10,000
| Average Annual Total Returns (As of October 31, 2024) | 1 Year | 5 Years | 10 Years |
| Alger Small Cap Growth Institutional Fund Class R | 25.33% | 3.74% | 6.93% |
| Russell 2000 Growth Index | 36.49% | 7.92% | 8.15% |
| S&P 500 Index | 38.02% | 15.27% | 13.00% |
Keep in mind that the Fund’s past performance is not a good predictor of how the Fund will perform in the future.
Visit https://www.alger.com/Pages/StrategyFinder.aspx?vehicle=mf for the most recent performance information. The graph and table do not reflect the deduction of taxes that a shareholder would pay on Fund distributions or redemption of Fund shares. All performance figures assume reinvestment of distributions.
Key Fund Statistics
The following table outlines key fund statistics as of the fiscal year ended October 31, 2024.
| Fund net assets | $89,675,156 |
| Total number of portfolio holdings1 | 104 |
| Portfolio turnover rate as of the end of the reporting period | 48.95% |
| Total advisory fees paid | $877,483 |
1 | Excludes Money Market Funds. |
| Communication Services | 0.5% |
| Consumer Discretionary | 18.2% |
| Consumer Staples | 2.1% |
| Energy | 0.7% |
| Financials | 1.4% |
| Healthcare | 29.4% |
| Industrials | 12.2% |
| Information Technology | 34.9% |
| Materials | 0.1% |
| Short-Term Investments and Other Net Assets | 0.5% |
| 100.0% |
Material and Other Fund Changes
Effective January 29, 2024, the Fund's custodian and administrator transitioned from Brown Brothers Harriman & Company to The Bank of New York.
On August 16, 2024, at a joint special meeting of shareholders, shareholders of the Fund elected three new trustees and one current trustee to the Board.
This is a summary of certain changes to the Fund since November 1, 2023. For more complete information, you may review the Fund's next prospectus, which we expect to be available by February 28, 2025 at https://connect.rightprospectus.com/Alger or upon request at (800) 992-3863.
Availability of Additional Information
Householding
To reduce expenses, only one copy of the most recent financial reports and prospectus may be mailed to households, even if more than one person in a household holds shares of a Fund. Call an Alger Funds Representative at (800) 992-3863 if you need additional copies of financial reports or prospectuses, or download them at https://connect.rightprospectus.com/Alger. If you do not want the mailing of these documents to be combined with those for other members of your household, contact your broker-dealer or other financial intermediary or Alger Institutional Funds in writing at Alger Family of Funds, c/o UMB Fund Services, Inc. 235 W. Galena Street Milwaukee, WI 53212.
Alger Small Cap Growth Institutional Fund
Class Z-2 / AISZX
Annual SHAREHOLDER REPORT | October 31, 2024
This annual shareholder report contains important information about the Alger Small Cap Growth Institutional Fund (“Fund”) for the period of November 1, 2023 to October 31, 2024. You can find additional information about the Fund at https://connect.rightprospectus.com/Alger. You can also request a copy of the annual report by contacting us at (800) 992-3863.
This report describes material changes to the Fund that occurred during the reporting period.
What were the Fund costs for the last year?
(Based on a hypothetical $10,000 investment)
| Fund (Class/Ticker) | Costs of a $10,000 investment | Costs paid as a percentage of a $10,000 investment |
Alger Small Cap Growth Institutional Fund
(Class Z-2 / AISZX) | $114 | 1.01% |
Management's Discussion of Fund Performance
What impacted Fund performance over the reporting period?
The Alger Small Cap Growth Institutional Fund Class Z-2 returned 26.44% for the fiscal twelve-month period ended October 31, 2024, compared to the 36.49% return of the Russell 2000 Growth Index. During the reporting period, the largest sector weightings were Information Technology and Health Care. The largest sector overweight was Consumer Discretionary and the largest sector underweight was Industrials.
Contributors to Performance
The Consumer Discretionary and Communication Services sectors provided the largest contributions to relative performance. Q2 Holdings, Inc.; Wingstop, Inc.; Shake Shack, Inc.; Guidewire Software, Inc.; and Manhattan Associates, Inc. were the top five contributors to absolute performance.
Detractors from Performance
The Health Care and Industrials sectors were the largest detractors from relative performance. Cabaletta Bio, Inc.; Structure Therapeutics, Inc.; Capri Holdings Ltd.; DLocal Ltd.; and 908 Devices Inc. were the top five detractors from absolute performance.
| U.S. FACTOR | IMPACT | SUMMARY |
| Resilient Corporate Earnings | Positive | Strong corporate earnings were driven by profit margin improvement and robust consumer spending. Themes such as AI proliferation, waning cloud optimization pressure, and profit margin expansion from increased productivity and expense control also supported market sentiment. |
| Federal Reserve Rate Cuts | Positive | In September 2024, the Federal Reserve initiated a rate-cutting cycle with a 50-basis point reduction, aiming to bolster economic growth amid a strong but softening labor market and easing inflation, creating a favorable backdrop for equities. |
| Rising Geopolitical Tensions | Negative | Geopolitical conflicts and trade disputes created some uncertainty ahead of the 2024 U.S. presidential election. |
| Weakening U.S. Labor Market | Negative | In August 2024, equity markets experienced a brief sell-off due to growth concerns following a weaker-than-expected July payrolls report, which raised fears that the Federal Reserve might be slow to respond to slowing economic conditions. The unemployment rate increased to 4.3%, triggering the Sahm rule—a recession indicator that signals a likely recession when the three-month moving average of the unemployment rate rises by at least 50 basis points from its twelve-month low. |
Fund Performance
The following graph compares the initial and subsequent account values at the end of each of the most recently completed annual periods for the life of Class Z-2 shares of the Fund since its inception. The graph assumes a $500,000 initial investment at net asset value at the inception date of the Fund in an appropriate, broad-based securities market index and a more narrowly based index that reflects the market sector in which the Fund invests for the same period.
INITIAL INVESTMENT OF $500,000
| Average Annual Total Returns (As of October 31, 2024) | 1 Year | 5 Years | Since Inception
8/1/16 |
| Alger Small Cap Growth Institutional Fund Class Z-2 | 26.44% | 4.60% | 9.45% |
| Russell 2000 Growth Index | 36.49% | 7.92% | 9.01% |
| S&P 500 Index | 38.02% | 15.27% | 14.43% |
Keep in mind that the Fund’s past performance is not a good predictor of how the Fund will perform in the future.
Visit https://www.alger.com/Pages/StrategyFinder.aspx?vehicle=mf for the most recent performance information. The graph and table do not reflect the deduction of taxes that a shareholder would pay on Fund distributions or redemption of Fund shares. All performance figures assume reinvestment of distributions.
Key Fund Statistics
The following table outlines key fund statistics as of the fiscal year ended October 31, 2024.
| Fund net assets | $89,675,156 |
| Total number of portfolio holdings1 | 104 |
| Portfolio turnover rate as of the end of the reporting period | 48.95% |
| Total advisory fees paid | $877,483 |
1 | Excludes Money Market Funds. |
| Communication Services | 0.5% |
| Consumer Discretionary | 18.2% |
| Consumer Staples | 2.1% |
| Energy | 0.7% |
| Financials | 1.4% |
| Healthcare | 29.4% |
| Industrials | 12.2% |
| Information Technology | 34.9% |
| Materials | 0.1% |
| Short-Term Investments and Other Net Assets | 0.5% |
| 100.0% |
Material and Other Fund Changes
Effective January 29, 2024, the Fund's custodian and administrator transitioned from Brown Brothers Harriman & Company to The Bank of New York.
On August 16, 2024, at a joint special meeting of shareholders, shareholders of the Fund elected three new trustees and one current trustee to the Board.
This is a summary of certain changes to the Fund since November 1, 2023. For more complete information, you may review the Fund's next prospectus, which we expect to be available by February 28, 2025 at https://connect.rightprospectus.com/Alger or upon request at (800) 992-3863.
Availability of Additional Information
Householding
To reduce expenses, only one copy of the most recent financial reports and prospectus may be mailed to households, even if more than one person in a household holds shares of a Fund. Call an Alger Funds Representative at (800) 992-3863 if you need additional copies of financial reports or prospectuses, or download them at https://connect.rightprospectus.com/Alger. If you do not want the mailing of these documents to be combined with those for other members of your household, contact your broker-dealer or other financial intermediary or Alger Institutional Funds in writing at Alger Family of Funds, c/o UMB Fund Services, Inc. 235 W. Galena Street Milwaukee, WI 53212.
ITEM 2. CODE OF ETHICS.
| (a) | The Registrant has adopted a code of ethics (the “Code of Ethics”) that applies to its principal executive officer, principal financial officer, principal accounting officer or controller, or persons performing similar functions. |
| (c) | The Registrant has not amended its Code of Ethics during the period covered by the shareholder report presented in Item 1 hereto. |
| (d) | The Registrant has not granted a waiver or an implicit waiver from a provision of its Code of Ethics during the period covered by the shareholder report presented in Item 1 hereto. |
| (f) | The Registrant’s Code of Ethics is attached as an Exhibit hereto. |
ITEM 3. AUDIT COMMITTEE FINANCIAL EXPERT.
The Board of Trustees of the Registrant determined that Charles F. Baird Jr. is an audit committee financial expert (within the meaning of that phrase specified in the instructions to Form N-CSR) on the Registrant's audit committee. Mr. Baird is an “independent” trustee – i.e., he is not an interested person of the Registrant as defined in the 1940 Act, nor has he accepted directly or indirectly any consulting, advisory or other compensatory fee from the Registrant, other than in his capacity as Trustee
ITEM 4. PRINCIPAL ACCOUNTANT FEES AND SERVICES.
(a) Audit Fees:
| | October 31, 2024 | $107,450 | |
| | October 31, 2023 | $103,800 | |
(b) Audit-Related Fees: NONE
(c) Tax Fees for tax advice, tax compliance and tax planning:
| | October 31, 2024 | $17,800 | |
| | October 31, 2023 | $17,653 | |
(d) All Other Fees:
| | October 31, 2024 | $27,551 | |
| | October 31, 2023 | $20,651 | |
Other fees include a review and consent for Registrants registration statement filing and a review of the semi-annual financial statements.
(e) 1) Audit Committee Pre-Approval Policies And Procedures:
Audit and non-audit services provided by the Registrant’s independent registered public accounting firm (the “Auditors”) on behalf the Registrant must be pre-approved by the Audit Committee. Non-audit services provided by the Auditors on behalf of the Registrant’s Investment Adviser or any entity controlling, controlled by, or under common control with the Investment Adviser must be pre-approved by the Audit Committee if such non-audit services directly relate to the operations or financial reporting of the Registrant.
2) All fees in item 4(b) through 4(d) above were approved by the Registrants’ Audit Committee.
(f) Not Applicable
(g) Non-Audit Fees:
| | October 31, 2024 | $351,512, | €106,362 | |
| | October 31, 2023 | $260,680, | €105,649 | |
(h) The audit committee of the board of trustees has considered whether the provision of the non-audit services that were rendered to the registrant’s investment adviser and any entity controlling, controlled by, or under common control, with the adviser that provides ongoing services to the registrant that were not approved pursuant to (c)(7)(ii) of Rule 2-01 of Regulation S-X is compatible with maintaining the principal accountant’s independence.
(i) Not Applicable
(j) Not Applicable
ITEM 5. AUDIT COMMITTEE OF LISTED REGISTRANTS.
Not applicable.
ITEM 6. INVESTMENTS.
(a) A Schedule of Investments in securities of unaffiliated issuers as of the close of the Reporting Period is included as part of the report to shareholders filed under Item 7 of this Form N-CSR.
(b) Not applicable.
Item 7. Financial Statements and Financial Highlights for Open-End Management Investment Companies
THE ALGER INSTITUTIONAL FUNDS
ANNUAL FINANCIAL STATEMENTS AND OTHER INFORMATION
Table of Contents
THE ALGER INSTITUTIONAL FUNDS
THE ALGER INSTITUTIONAL FUNDSALGER CAPITAL APPRECIATION INSTITUTIONAL FUNDSchedule of Investments October 31, 2024
| | |
|
|
| | |
| | |
| | |
|
|
| | | | |
|
| | |
APPLICATION SOFTWARE—4.8% |
| | |
| | |
Cadence Design Systems, Inc.* | | |
|
|
| | | | |
AUTOMOBILE MANUFACTURERS—1.2% |
| | |
|
| | |
| | |
| | |
Madrigal Pharmaceuticals, Inc.* | | |
| | |
| | |
Sarepta Therapeutics, Inc.* | | |
| | |
Vertex Pharmaceuticals, Inc.* | | |
|
|
| | | | |
|
| | |
| | |
| | |
| | |
|
|
| | | | |
|
Builders FirstSource, Inc.* | | |
|
| | |
Flutter Entertainment PLC* | | |
|
|
| | | | |
COAL & CONSUMABLE FUELS—0.5% |
| | |
CONSTRUCTION & ENGINEERING—0.6% |
| | |
See Notes to Financial Statements.
THE ALGER INSTITUTIONAL FUNDSALGER CAPITAL APPRECIATION INSTITUTIONAL FUNDSchedule of Investments October 31, 2024 (Continued)
| | |
COMMON STOCKS—98.7% (CONT.) |
CONSTRUCTION MACHINERY & HEAVY TRANSPORTATION EQUIPMENT—0.1% |
| | |
CONSTRUCTION MATERIALS—0.1% |
Martin Marietta Materials, Inc. | | |
|
| | |
|
Constellation Energy Corp. | | |
| | |
|
|
| | | | |
ELECTRICAL COMPONENTS & EQUIPMENT—2.4% |
| | |
Vertiv Holdings Co., Cl. A | | |
|
|
| | | | |
ENVIRONMENTAL & FACILITIES SERVICES—2.5% |
| | |
FINANCIAL EXCHANGES & DATA—1.3% |
| | |
|
| | |
HEALTHCARE EQUIPMENT—2.5% |
| | |
Intuitive Surgical, Inc.* | | |
|
|
| | | | |
INDEPENDENT POWER PRODUCERS & ENERGY TRADERS—0.5% |
| | |
INTERACTIVE HOME ENTERTAINMENT—0.4% |
| | |
Take-Two Interactive Software, Inc.* | | |
|
|
| | | | |
INTERACTIVE MEDIA & SERVICES—11.3% |
| | |
Meta Platforms, Inc., Cl. A | | |
| | |
|
|
| | | | |
INTERNET SERVICES & INFRASTRUCTURE—0.3% |
| | |
LIFE SCIENCES TOOLS & SERVICES—0.7% |
| | |
See Notes to Financial Statements.
THE ALGER INSTITUTIONAL FUNDSALGER CAPITAL APPRECIATION INSTITUTIONAL FUNDSchedule of Investments October 31, 2024 (Continued)
| | |
COMMON STOCKS—98.7% (CONT.) |
|
| | |
MOVIES & ENTERTAINMENT—3.5% |
Liberty Media Corp. Series C Liberty Formula One* | | |
| | |
| | |
|
|
| | | | |
PASSENGER GROUND TRANSPORTATION—0.0% |
| | |
|
| | |
|
Advanced Micro Devices, Inc.* | | |
| | |
| | |
| | |
| | |
| | |
Taiwan Semiconductor Manufacturing Co., Ltd. ADR | | |
|
|
| | | | |
|
| | |
|
| | |
| | |
|
|
| | | | |
TECHNOLOGY HARDWARE STORAGE & PERIPHERALS—7.2% |
| | |
Dell Technologies, Inc., Cl. C | | |
|
|
| | | | |
TRANSACTION & PAYMENT PROCESSING SERVICES—2.6% |
| | |
| | |
|
|
| | | | |
TOTAL COMMON STOCKS
(Cost $764,550,908) | | |
|
APPLICATION SOFTWARE—0.3% |
SB Technology, Inc. Series E(a),*,@ | | |
See Notes to Financial Statements.
THE ALGER INSTITUTIONAL FUNDSALGER CAPITAL APPRECIATION INSTITUTIONAL FUNDSchedule of Investments October 31, 2024 (Continued)
| | |
PREFERRED STOCKS—0.4% (CONT.) |
DATA PROCESSING & OUTSOURCED SERVICES—0.1% |
Chime Financial, Inc.,Series G(a),*,@ | | |
TOTAL PREFERRED STOCKS
(Cost $8,970,569) | | |
REAL ESTATE INVESTMENT TRUST—0.8% |
|
| | |
| | |
SPECIAL PURPOSE VEHICLE—0.1% |
DATA PROCESSING & OUTSOURCED SERVICES—0.1% |
Crosslink Ventures C, LLC, Cl. A(a),(b),*,@ | | |
| | |
|
|
Total Investments
(Cost $791,043,128) | | |
Affiliated Securities (Cost $3,075,000) | | |
Unaffiliated Securities (Cost $787,968,128) | | |
Other Assets in Excess of Liabilities | | |
| | |
| American Depositary Receipts |
| Security is valued in good faith at fair value determined using significant unobservable inputs pursuant to procedures approved by the Board of Trustees. |
| Deemed an affiliate of the Fund in accordance with Section 2(a)(3) of the Investment Company Act of 1940. See Note 11 - Affiliated Securities. |
| Non-income producing security. |
| Restricted security - Investment in security not registered under the Securities Act of 1933. Sales or transfers of the investment may be restricted only to qualified buyers. |
| | | | % of net assets
as of
10/31/2024 |
Chime Financial, Inc.,Series G | | | | |
Crosslink Ventures C, LLC, Cl. A | | | | |
SB Technology, Inc. Series E | | | | |
| | | | |
See Notes to Financial Statements.
THE ALGER INSTITUTIONAL FUNDS | ALGER FOCUS EQUITY FUNDSchedule of Investments October 31, 2024
| | |
|
|
| | |
| | |
|
|
| | | | |
|
| | |
APPLICATION SOFTWARE—5.1% |
| | |
| | |
Cadence Design Systems, Inc.* | | |
|
|
| | | | |
AUTOMOBILE MANUFACTURERS—1.3% |
| | |
|
| | |
| | |
| | |
| | |
|
|
| | | | |
|
| | |
| | |
| | |
| | |
|
|
| | | | |
|
| | |
|
| | |
COAL & CONSUMABLE FUELS—1.0% |
| | |
CONSTRUCTION MATERIALS—0.3% |
Martin Marietta Materials, Inc. | | |
|
Constellation Energy Corp. | | |
| | |
|
|
| | | | |
ELECTRICAL COMPONENTS & EQUIPMENT—3.0% |
| | |
Vertiv Holdings Co., Cl. A | | |
|
|
| | | | |
See Notes to Financial Statements.
THE ALGER INSTITUTIONAL FUNDS | ALGER FOCUS EQUITY FUNDSchedule of Investments October 31, 2024 (Continued)
| | |
COMMON STOCKS—93.9% (CONT.) |
ENVIRONMENTAL & FACILITIES SERVICES—4.3% |
| | |
FINANCIAL EXCHANGES & DATA—1.6% |
| | |
HEALTHCARE EQUIPMENT—1.0% |
| | |
INDEPENDENT POWER PRODUCERS & ENERGY TRADERS—0.8% |
| | |
INTERACTIVE MEDIA & SERVICES—9.2% |
| | |
Meta Platforms, Inc., Cl. A | | |
| | |
|
|
| | | | |
LIFE SCIENCES TOOLS & SERVICES—1.3% |
| | |
|
| | |
MOVIES & ENTERTAINMENT—4.8% |
Liberty Media Corp. Series C Liberty Formula One* | | |
| | |
| | |
|
|
| | | | |
PASSENGER GROUND TRANSPORTATION—0.3% |
Grab Holdings, Ltd., Cl. A* | | |
|
| | |
|
Advanced Micro Devices, Inc.* | | |
| | |
| | |
| | |
| | |
Taiwan Semiconductor Manufacturing Co., Ltd. ADR | | |
|
|
| | | | |
|
| | |
| | |
|
|
| | | | |
TECHNOLOGY HARDWARE STORAGE & PERIPHERALS—6.0% |
| | |
See Notes to Financial Statements.
THE ALGER INSTITUTIONAL FUNDS | ALGER FOCUS EQUITY FUNDSchedule of Investments October 31, 2024 (Continued)
| | |
COMMON STOCKS—93.9% (CONT.) |
TECHNOLOGY HARDWARE STORAGE & PERIPHERALS—6.0% (CONT.) |
Dell Technologies, Inc., Cl. C | | |
|
|
| | | | |
TRANSACTION & PAYMENT PROCESSING SERVICES—1.5% |
| | |
TOTAL COMMON STOCKS
(Cost $911,256,055) | | |
|
APPLICATION SOFTWARE—0.8% |
SB Technology, Inc. Series E(a),*,@ | | |
|
Prosetta Biosciences, Inc., Series D(a),*,@ | | |
TOTAL PREFERRED STOCKS
(Cost $15,185,190) | | |
REAL ESTATE INVESTMENT TRUST—0.9% |
|
| | |
| | |
SHORT-TERM SECURITIES—4.4% |
|
Dreyfus Treasury Obligations Cash Management Fund,
Institutional Shares, 4.72%(b) | | |
| | |
|
|
Total Investments
(Cost $1,018,935,908) | | |
Unaffiliated Securities (Cost $1,018,935,908) | | |
Liabilities in Excess of Other Assets | | |
| | |
| American Depositary Receipts |
| Security is valued in good faith at fair value determined using significant unobservable inputs pursuant to procedures approved by the Board of Trustees. |
| Rate shown reflects 7-day effective yield as of October 31, 2024. |
| Non-income producing security. |
| Restricted security - Investment in security not registered under the Securities Act of 1933. Sales or transfers of the investment may be restricted only to qualified buyers. |
| | | | % of net assets
as of
10/31/2024 |
Prosetta Biosciences, Inc., Series D | | | | |
SB Technology, Inc. Series E | | | | |
| | | | |
See Notes to Financial Statements.
THE ALGER INSTITUTIONAL FUNDS | ALGER MID CAP GROWTH INSTITUTIONAL FUNDSchedule of Investments October 31, 2024
| | |
|
|
The Trade Desk, Inc., Cl. A* | | |
|
| | |
| | |
|
|
| | | | |
APPLICATION SOFTWARE—17.3% |
| | |
Clearwater Analytics Holdings, Inc., Cl. A* | | |
Constellation Software, Inc. | | |
| | |
Guidewire Software, Inc.* | | |
Manhattan Associates, Inc.* | | |
Palantir Technologies, Inc., Cl. A* | | |
Procore Technologies, Inc.* | | |
The Descartes Systems Group, Inc.* | | |
|
|
| | | | |
ASSET MANAGEMENT & CUSTODY BANKS—5.1% |
Ares Management Corp., Cl. A | | |
Blue Owl Capital, Inc., Cl. A | | |
|
|
| | | | |
|
| | |
|
| | |
| | |
|
|
| | | | |
|
| | |
|
Builders FirstSource, Inc.* | | |
| | |
|
|
| | | | |
CARGO GROUND TRANSPORTATION—2.7% |
Old Dominion Freight Line, Inc. | | |
CONSTRUCTION MATERIALS—1.8% |
Martin Marietta Materials, Inc. | | |
ELECTRICAL COMPONENTS & EQUIPMENT—4.0% |
Vertiv Holdings Co., Cl. A | | |
ELECTRONIC COMPONENTS—2.0% |
| | |
See Notes to Financial Statements.
THE ALGER INSTITUTIONAL FUNDS | ALGER MID CAP GROWTH INSTITUTIONAL FUNDSchedule of Investments October 31, 2024 (Continued)
| | |
COMMON STOCKS—99.1% (CONT.) |
ENVIRONMENTAL & FACILITIES SERVICES—4.6% |
| | |
FINANCIAL EXCHANGES & DATA—2.0% |
| | |
HEALTHCARE EQUIPMENT—1.6% |
IDEXX Laboratories, Inc.* | | |
HEALTHCARE TECHNOLOGY—1.7% |
Veeva Systems, Inc., Cl. A* | | |
HOME IMPROVEMENT RETAIL—0.7% |
Floor & Decor Holdings, Inc., Cl. A* | | |
|
| | |
HOMEFURNISHING RETAIL—0.8% |
| | |
HOTELS RESORTS & CRUISE LINES—2.0% |
Hilton Worldwide Holdings, Inc. | | |
HUMAN RESOURCE & EMPLOYMENT SERVICES—0.8% |
| | |
|
Ryan Specialty Holdings, Inc., Cl. A | | |
INTERACTIVE HOME ENTERTAINMENT—0.7% |
| | |
INTERACTIVE MEDIA & SERVICES—2.6% |
| | |
INTERNET SERVICES & INFRASTRUCTURE—1.9% |
| | |
| | |
|
|
| | | | |
IT CONSULTING & OTHER SERVICES—2.0% |
| | |
LIFE SCIENCES TOOLS & SERVICES—3.7% |
Mettler-Toledo International, Inc.* | | |
| | |
West Pharmaceutical Services, Inc. | | |
|
|
| | | | |
MOVIES & ENTERTAINMENT—2.6% |
| | |
OIL & GAS EXPLORATION & PRODUCTION—2.2% |
| | |
PROPERTY & CASUALTY INSURANCE—2.1% |
| | |
See Notes to Financial Statements.
THE ALGER INSTITUTIONAL FUNDS | ALGER MID CAP GROWTH INSTITUTIONAL FUNDSchedule of Investments October 31, 2024 (Continued)
| | |
COMMON STOCKS—99.1% (CONT.) |
REAL ESTATE SERVICES—3.8% |
| | |
| | |
|
|
| | | | |
RESEARCH & CONSULTING SERVICES—3.5% |
| | |
| | |
|
|
| | | | |
|
Chipotle Mexican Grill, Inc.* | | |
| | |
|
|
| | | | |
SEMICONDUCTOR MATERIALS & EQUIPMENT—0.6% |
| | |
|
| | |
Lattice Semiconductor Corp.* | | |
| | |
Monolithic Power Systems, Inc. | | |
|
|
| | | | |
SOFT DRINKS & NON-ALCOHOLIC BEVERAGES—0.4% |
| | |
TRADING COMPANIES & DISTRIBUTORS—2.6% |
Ferguson Enterprises, Inc. | | |
TOTAL COMMON STOCKS
(Cost $47,280,836) | | |
|
APPLICATION SOFTWARE—0.4% |
SB Technology, Inc. Series E(a),*,@ | | |
|
Prosetta Biosciences, Inc., Series D(a),*,@ | | |
TOTAL PREFERRED STOCKS
(Cost $1,027,237) | | |
|
|
| | |
| | |
SPECIAL PURPOSE VEHICLE—1.0% |
DATA PROCESSING & OUTSOURCED SERVICES—1.0% |
Crosslink Ventures C, LLC, Cl. A(a),(b),*,@ | | |
See Notes to Financial Statements.
THE ALGER INSTITUTIONAL FUNDS | ALGER MID CAP GROWTH INSTITUTIONAL FUNDSchedule of Investments October 31, 2024 (Continued)
| | |
SPECIAL PURPOSE VEHICLE—1.0% (CONT.) |
DATA PROCESSING & OUTSOURCED SERVICES—1.0% (CONT.) |
Crosslink Ventures C, LLC, Cl. B(a),(b),*,@ | | |
|
|
| | | | |
TOTAL SPECIAL PURPOSE VEHICLE
(Cost $775,000) | | |
|
APPLICATION SOFTWARE—0.0% |
Constellation Software, Inc., 3/31/40(a),* | | |
| | |
|
|
Total Investments
(Cost $49,309,259) | | |
Affiliated Securities (Cost $775,000) | | |
Unaffiliated Securities (Cost $48,534,259) | | |
Liabilities in Excess of Other Assets | | |
| | |
| Contingent Deferred Rights |
| Security is valued in good faith at fair value determined using significant unobservable inputs pursuant to procedures approved by the Board of Trustees. |
| Deemed an affiliate of the Fund in accordance with Section 2(a)(3) of the Investment Company Act of 1940. See Note 11 - Affiliated Securities. |
| Non-income producing security. |
| Restricted security - Investment in security not registered under the Securities Act of 1933. Sales or transfers of the investment may be restricted only to qualified buyers. |
| | | | % of net assets
as of
10/31/2024 |
Crosslink Ventures C, LLC, Cl. A | | | | |
Crosslink Ventures C, LLC, Cl. B | | | | |
Prosetta Biosciences, Inc., Series D | | | | |
SB Technology, Inc. Series E | | | | |
| | | | |
| | | | |
See Notes to Financial Statements.
THE ALGER INSTITUTIONAL FUNDS | ALGER SMALL CAP GROWTH INSTITUTIONAL FUNDSchedule of Investments October 31, 2024
| | |
|
|
| | |
| | |
| | |
|
|
| | | | |
|
Abercrombie & Fitch Co., Cl. A* | | |
| | |
| | |
|
|
| | | | |
APPLICATION SOFTWARE—21.6% |
| | |
Altair Engineering, Inc., Cl. A* | | |
| | |
| | |
| | |
| | |
Guidewire Software, Inc.* | | |
| | |
Manhattan Associates, Inc.* | | |
| | |
| | |
| | |
| | |
|
|
| | | | |
|
| | |
Akero Therapeutics, Inc.* | | |
| | |
Blueprint Medicines Corp.* | | |
| | |
| | |
Centessa Pharmaceuticals PLC ADR* | | |
Denali Therapeutics, Inc.* | | |
| | |
| | |
Keros Therapeutics, Inc.* | | |
Larimar Therapeutics, Inc.* | | |
| | |
MoonLake Immunotherapeutics* | | |
| | |
Nurix Therapeutics, Inc.* | | |
| | |
ORIC Pharmaceuticals, Inc.* | | |
See Notes to Financial Statements.
THE ALGER INSTITUTIONAL FUNDS | ALGER SMALL CAP GROWTH INSTITUTIONAL FUNDSchedule of Investments October 31, 2024 (Continued)
| | |
COMMON STOCKS—93.0% (CONT.) |
BIOTECHNOLOGY—17.8% (CONT.) |
Revolution Medicines, Inc.* | | |
| | |
| | |
Viking Therapeutics, Inc.* | | |
|
|
| | | | |
|
| | |
The AZEK Co., Inc., Cl. A* | | |
|
|
| | | | |
CONSTRUCTION & ENGINEERING—1.4% |
Construction Partners, Inc., Cl. A* | | |
| | |
|
|
| | | | |
CONSUMER STAPLES MERCHANDISE RETAIL—1.0% |
BJ's Wholesale Club Holdings, Inc.* | | |
|
| | |
KinderCare Learning Cos., Inc.* | | |
|
|
| | | | |
ELECTRICAL COMPONENTS & EQUIPMENT—0.8% |
| | |
ELECTRONIC EQUIPMENT & INSTRUMENTS—0.5% |
| | |
ELECTRONIC MANUFACTURING SERVICES—0.9% |
| | |
|
Grocery Outlet Holding Corp.* | | |
|
| | |
HEALTHCARE EQUIPMENT—3.5% |
| | |
| | |
Impulse Dynamics PLC, Series A(a),*,@ | | |
Tandem Diabetes Care, Inc.* | | |
|
|
| | | | |
|
| | |
| | |
|
|
| | | | |
See Notes to Financial Statements.
THE ALGER INSTITUTIONAL FUNDS | ALGER SMALL CAP GROWTH INSTITUTIONAL FUNDSchedule of Investments October 31, 2024 (Continued)
| | |
COMMON STOCKS—93.0% (CONT.) |
|
| | |
HEALTHCARE TECHNOLOGY—0.5% |
| | |
HOMEFURNISHING RETAIL—0.8% |
| | |
INDUSTRIAL MACHINERY & SUPPLIES & COMPONENTS—4.5% |
Gates Industrial Corp. PLC* | | |
| | |
|
|
| | | | |
INTERACTIVE MEDIA & SERVICES—0.5% |
| | |
INTERNET SERVICES & INFRASTRUCTURE—1.1% |
| | |
INVESTMENT BANKING & BROKERAGE—0.3% |
| | |
|
Planet Fitness, Inc., Cl. A* | | |
LIFE & HEALTH INSURANCE—0.5% |
Oscar Health, Inc., Cl. A* | | |
LIFE SCIENCES TOOLS & SERVICES—5.0% |
10X Genomics, Inc., Cl. A* | | |
| | |
| | |
| | |
| | |
| | |
|
|
| | | | |
OIL & GAS EQUIPMENT & SERVICES—0.6% |
Weatherford International PLC | | |
OTHER SPECIALTY RETAIL—0.7% |
| | |
|
| | |
PERSONAL CARE PRODUCTS—0.5% |
Oddity Tech, Ltd., Cl. A* | | |
|
Structure Therapeutics, Inc. ADR* | | |
|
| | |
Kura Sushi USA, Inc., Cl. A* | | |
See Notes to Financial Statements.
THE ALGER INSTITUTIONAL FUNDS | ALGER SMALL CAP GROWTH INSTITUTIONAL FUNDSchedule of Investments October 31, 2024 (Continued)
| | |
COMMON STOCKS—93.0% (CONT.) |
|
Shake Shack, Inc., Cl. A* | | |
The Cheesecake Factory, Inc. | | |
| | |
|
|
| | | | |
|
| | |
| | |
| | |
|
|
| | | | |
SOFT DRINKS & NON-ALCOHOLIC BEVERAGES—0.3% |
| | |
SPECIALIZED CONSUMER SERVICES—0.3% |
European Wax Center, Inc., Cl. A* | | |
|
| | |
|
| | |
| | |
| | |
|
|
| | | | |
TRADING COMPANIES & DISTRIBUTORS—0.8% |
| | |
TRANSACTION & PAYMENT PROCESSING SERVICES—0.6% |
| | |
TOTAL COMMON STOCKS
(Cost $61,282,844) | | |
|
|
Prosetta Biosciences, Inc., Series D(a),*,@ | | |
DATA PROCESSING & OUTSOURCED SERVICES—4.6% |
Chime Financial, Inc.,Series G(a),*,@ | | |
HEALTHCARE EQUIPMENT—0.2% |
Impulse Dynamics PLC, Series F-1(a),*,@ | | |
TOTAL PREFERRED STOCKS
(Cost $8,653,651) | | |
|
|
Mirati Therapeutics, Inc. CVR(a),*,@ | | |
| | |
|
|
| | | | |
See Notes to Financial Statements.
THE ALGER INSTITUTIONAL FUNDS | ALGER SMALL CAP GROWTH INSTITUTIONAL FUNDSchedule of Investments October 31, 2024 (Continued)
| | |
|
|
Fusion Pharmaceuticals, Inc. CVR(a),*,@ | | |
TOTAL RIGHTS
(Cost $285,726) | | |
SPECIAL PURPOSE VEHICLE—1.5% |
DATA PROCESSING & OUTSOURCED SERVICES—1.5% |
Crosslink Ventures C, LLC, Cl. A(a),(b),*,@ | | |
Crosslink Ventures C, LLC, Cl. B(a),(b),*,@ | | |
|
|
| | | | |
TOTAL SPECIAL PURPOSE VEHICLE
(Cost $1,600,000) | | |
SHORT-TERM SECURITIES—0.0% |
|
Dreyfus Treasury Obligations Cash Management Fund,
Institutional Shares, 4.72%(c) | | |
| | |
|
|
Total Investments
(Cost $71,822,770) | | |
Affiliated Securities (Cost $1,600,000) | | |
Unaffiliated Securities (Cost $70,222,770) | | |
Other Assets in Excess of Liabilities | | |
| | |
| American Depositary Receipts |
| Contingent Deferred Rights |
| |
| Security is valued in good faith at fair value determined using significant unobservable inputs pursuant to procedures approved by the Board of Trustees. |
| Deemed an affiliate of the Fund in accordance with Section 2(a)(3) of the Investment Company Act of 1940. See Note 11 - Affiliated Securities. |
| Rate shown reflects 7-day effective yield as of October 31, 2024. |
| Non-income producing security. |
| Restricted security - Investment in security not registered under the Securities Act of 1933. Sales or transfers of the investment may be restricted only to qualified buyers. |
See Notes to Financial Statements.
THE ALGER INSTITUTIONAL FUNDS | ALGER SMALL CAP GROWTH INSTITUTIONAL FUNDSchedule of Investments October 31, 2024 (Continued)
| | | | % of net assets
as of
10/31/2024 |
Chime Financial, Inc.,Series G | | | | |
Crosslink Ventures C, LLC, Cl. A | | | | |
Crosslink Ventures C, LLC, Cl. B | | | | |
Fusion Pharmaceuticals, Inc. CVR | | | | |
Impulse Dynamics PLC, Series A | | | | |
Impulse Dynamics PLC, Series F-1 | | | | |
Mirati Therapeutics, Inc. CVR | | | | |
Prosetta Biosciences, Inc., Series D | | | | |
| | | | |
| | | | |
See Notes to Financial Statements.
THE ALGER INSTITUTIONAL FUNDSStatements of Assets and Liabilities October 31, 2024
| Alger Capital
Appreciation
Institutional Fund | |
|
Investments in unaffiliated securities, at value (Identified cost below)* see accompanying schedules of investments | | |
Investments in affiliated securities, at value (Identified cost below)** see accompanying schedules of investments | | |
Receivable for investment securities sold | | |
Receivable for shares of beneficial interest sold | | |
Dividends and interest receivable | | |
Receivable from Investment Manager | | |
| | |
|
Payable for investment securities purchased | | |
Payable for shares of beneficial interest redeemed | | |
Payable for interfund loans | | |
| | |
Accrued investment advisory fees | | |
Accrued distribution fees — Note 3 | | |
Accrued shareholder servicing fees | | |
Accrued shareholder administrative fees | | |
Accrued administrative fees | | |
Accrued transfer agent fees | | |
Accrued fund accounting fees | | |
| | |
| | |
Accrued professional fees | | |
| | |
| | |
| | |
| | |
|
Paid in capital (par value of $.001 per share) | | |
| | |
| | |
| | |
| | |
| | |
See Notes to Financial Statements.
THE ALGER INSTITUTIONAL FUNDSStatements of Assets and Liabilities October 31, 2024 (Continued)
| Alger Capital Appreciation Institutional Fund | |
|
| | |
| | |
| | |
| | |
| | |
| | |
| | |
SHARES OF BENEFICIAL INTEREST OUTSTANDING — Note 6: |
| | |
| | |
| | |
| | |
| | |
| | |
| | |
NET ASSET VALUE PER SHARE: |
| | |
Class A - Offering Price Per Share (includes a 5.25% sales charge) | | |
| | |
| | |
| | |
| | |
| | |
| | |
| At October 31, 2024, the net unrealized appreciation on investments, based on cost for federal income tax purposes of $806,864,476, amounted to $1,313,542,852, which consisted of aggregate gross unrealized appreciation of $1,331,358,614, and aggregate gross unrealized depreciation of $17,815,762. |
| At October 31, 2024, the net unrealized appreciation on investments, based on cost for federal income tax purposes of $1,033,884,628, amounted to $757,681,365, which consisted of aggregate gross unrealized appreciation of $773,296,161, and aggregate gross unrealized depreciation of $15,614,796. |
See Notes to Financial Statements.
THE ALGER INSTITUTIONAL FUNDSStatements of Assets and Liabilities October 31, 2024 (Continued)
| Alger Mid Cap Growth
Institutional Fund | Alger Small Cap
Growth Institutional
Fund |
|
Investments in unaffiliated securities, at value (Identified cost below)* see accompanying schedules of investments | | |
Investments in affiliated securities, at value (Identified cost below)** see accompanying schedules of investments | | |
| | |
Receivable for investment securities sold | | |
Receivable for shares of beneficial interest sold | | |
Dividends and interest receivable | | |
Receivable from Investment Manager | | |
| | |
| | |
|
Payable for investment securities purchased | | |
Payable for shares of beneficial interest redeemed | | |
Payable for interfund loans | | |
| | |
Accrued investment advisory fees | | |
Accrued distribution fees — Note 3 | | |
Accrued shareholder servicing fees | | |
Accrued shareholder administrative fees | | |
Accrued administrative fees | | |
Accrued transfer agent fees | | |
Accrued fund accounting fees | | |
| | |
| | |
Accrued professional fees | | |
| | |
| | |
| | |
| | |
|
Paid in capital (par value of $.001 per share) | | |
Distributable earnings (Distributions in excess of earnings) | | |
| | |
| | |
| | |
| | |
See Notes to Financial Statements.
THE ALGER INSTITUTIONAL FUNDSStatements of Assets and Liabilities October 31, 2024 (Continued)
| Alger Mid Cap Growth Institutional Fund | Alger Small Cap Growth Institutional Fund |
|
| | |
| | |
| | |
SHARES OF BENEFICIAL INTEREST OUTSTANDING — Note 6: |
| | |
| | |
| | |
NET ASSET VALUE PER SHARE: |
| | |
| | |
| | |
| At October 31, 2024, the net unrealized appreciation on investments, based on cost for federal income tax purposes of $50,065,637, amounted to $16,131,012, which consisted of aggregate gross unrealized appreciation of $19,072,017, and aggregate gross unrealized depreciation of $2,941,005. |
| At October 31, 2024, the net unrealized appreciation on investments, based on cost for federal income tax purposes of $73,092,372, amounted to $16,162,039, which consisted of aggregate gross unrealized appreciation of $27,600,819, and aggregate gross unrealized depreciation of $11,438,780. |
See Notes to Financial Statements.
THE ALGER INSTITUTIONAL FUNDSStatements of Operations for the year ended October 31, 2024
| Alger Capital
Appreciation
Institutional Fund | |
|
Dividends (net of foreign withholding taxes*) | | |
| | |
| | |
|
Investment advisory fees — Note 3 | | |
Distribution fees — Note 3 | | |
| | |
| | |
| | |
Shareholder servicing fees — Note 3 | | |
Shareholder administrative fees — Note 3 | | |
Administration fees — Note 3 | | |
Transfer agent fees — Note 3 | | |
Interest expense — Note 3 | | |
Fund accounting fees — Note 3 | | |
| | |
| | |
| | |
| | |
| | |
| | |
| | |
Less, expense reimbursements/waivers — Note 3 | | |
| | |
| | |
REALIZED AND UNREALIZED GAIN (LOSS) ON INVESTMENTS AND FOREIGN CURRENCY: |
Net realized gain on unaffiliated investments | | |
Net realized gain on in-kind transactions | | |
Net realized (loss) on foreign currency transactions | | |
Net realized gain on investments and foreign currency | | |
See Notes to Financial Statements.
THE ALGER INSTITUTIONAL FUNDSStatements of Operations for the year ended October 31, 2024 (Continued)
| Alger Capital Appreciation Institutional Fund | |
Net change in unrealized appreciation on unaffiliated investments | | |
Net change in unrealized appreciation (depreciation) on affiliated investments | | |
Net change in unrealized appreciation on foreign currency | | |
Net change in unrealized appreciation on investments and foreign currency | | |
Net realized and unrealized gain on investments and foreign currency | | |
NET INCREASE IN NET ASSETS RESULTING FROM OPERATIONS | | |
* Foreign withholding taxes | | |
See Notes to Financial Statements.
THE ALGER INSTITUTIONAL FUNDSStatements of Operations for the year ended October 31, 2024 (Continued)
| Alger Mid Cap Growth
Institutional Fund | Alger Small Cap
Growth Institutional
Fund |
|
Dividends (net of foreign withholding taxes*) | | |
| | |
| | |
|
Investment advisory fees — Note 3 | | |
Distribution fees — Note 3 | | |
| | |
Shareholder servicing fees — Note 3 | | |
Shareholder administrative fees — Note 3 | | |
Administration fees — Note 3 | | |
Transfer agent fees — Note 3 | | |
Interest expense — Note 3 | | |
Fund accounting fees — Note 3 | | |
| | |
| | |
| | |
| | |
| | |
| | |
| | |
Less, expense reimbursements/waivers — Note 3 | | |
| | |
| | |
REALIZED AND UNREALIZED GAIN (LOSS) ON INVESTMENTS AND FOREIGN CURRENCY: |
Net realized gain on unaffiliated investments | | |
Net realized (loss) on foreign currency transactions | | |
Net realized gain on investments and foreign currency | | |
See Notes to Financial Statements.
THE ALGER INSTITUTIONAL FUNDSStatements of Operations for the year ended October 31, 2024 (Continued)
| Alger Mid Cap Growth Institutional Fund | Alger Small Cap Growth Institutional Fund |
Net change in unrealized appreciation on unaffiliated investments | | |
Net change in unrealized appreciation on affiliated investments | | |
Net change in unrealized appreciation on foreign currency | | |
Net change in unrealized appreciation on investments and foreign currency | | |
Net realized and unrealized gain on investments and foreign currency | | |
NET INCREASE IN NET ASSETS RESULTING FROM OPERATIONS | | |
* Foreign withholding taxes | | |
See Notes to Financial Statements.
THE ALGER INSTITUTIONAL FUNDSStatements of Changes in Net Assets
| Alger Capital Appreciation Institutional Fund |
| For the
Year Ended
October 31, 2024 | For the
Year Ended
October 31, 2023 |
| | |
Net realized gain on investments and foreign currency | | |
Net change in unrealized appreciation on investments and foreign currency | | |
Net increase in net assets resulting from operations | | |
Dividends and distributions to shareholders: |
| | |
| | |
| | |
| | |
Total dividends and distributions to shareholders | | |
Decrease from shares of beneficial interest transactions: |
| | |
| | |
| | |
| | |
Net decrease from shares of beneficial interest transactions — Note 6 | | |
Total increase (decrease) | | |
|
| | |
| | |
See Notes to Financial Statements.
THE ALGER INSTITUTIONAL FUNDSStatements of Changes in Net Assets (Continued)
| |
| For the
Year Ended
October 31, 2024 | For the
Year Ended
October 31, 2023 |
Net investment income (loss) | | |
Net realized gain on investments and foreign currency | | |
Net change in unrealized appreciation on investments and foreign currency | | |
Net increase in net assets resulting from operations | | |
Dividends and distributions to shareholders: |
| | |
| | |
| | |
| | |
| | |
Total dividends and distributions to shareholders | | |
Increase (decrease) from shares of beneficial interest transactions: |
| | |
| | |
| | |
| | |
| | |
Net increase (decrease) from shares of beneficial interest transactions — Note 6 | | |
| | |
|
| | |
| | |
See Notes to Financial Statements.
THE ALGER INSTITUTIONAL FUNDSStatements of Changes in Net Assets (Continued)
| Alger Mid Cap Growth Institutional Fund |
| For the
Year Ended
October 31, 2024 | For the
Year Ended
October 31, 2023 |
| | |
Net realized gain (loss) on investments and foreign currency | | |
Net change in unrealized appreciation on investments and foreign currency | | |
Net increase in net assets resulting from operations | | |
Dividends and distributions to shareholders: |
| | |
| | |
| | |
Total dividends and distributions to shareholders | | |
Increase (decrease) from shares of beneficial interest transactions: |
| | |
| | |
| | |
Net decrease from shares of beneficial interest transactions — Note 6 | | |
Total increase (decrease) | | |
|
| | |
| | |
See Notes to Financial Statements.
THE ALGER INSTITUTIONAL FUNDSStatements of Changes in Net Assets (Continued)
| Alger Small Cap Growth Institutional Fund |
| For the
Year Ended
October 31, 2024 | For the
Year Ended
October 31, 2023 |
| | |
Net realized gain (loss) on investments and foreign currency | | |
Net change in unrealized appreciation on investments and foreign currency | | |
Net increase (decrease) in net assets resulting from operations | | |
Dividends and distributions to shareholders: |
| | |
| | |
| | |
Total dividends and distributions to shareholders | | |
Decrease from shares of beneficial interest transactions: |
| | |
| | |
| | |
Net decrease from shares of beneficial interest transactions — Note 6 | | |
| | |
|
| | |
| | |
See Notes to Financial Statements.
THE ALGER INSTITUTIONAL FUNDSFinancial Highlights for a share outstanding throughout the period
Alger Capital Appreciation Institutional Fund | |
| | | | | |
Net asset value, beginning of period | | | | | |
INCOME FROM INVESTMENT OPERATIONS: |
| | | | | |
Net realized and unrealized gain (loss) on investments | | | | | |
Total from investment operations | | | | | |
Distributions from net realized gains | | | | | |
Net asset value, end of period | | | | | |
| | | | | |
RATIOS/SUPPLEMENTAL DATA: |
Net assets, end of period (000's omitted) | | | | | |
Ratio of net expenses to average net assets | | | | | |
Ratio of net investment loss to average net assets | | | | | |
| | | | | |
| Amount was computed based on average shares outstanding during the period. |
| Does not reflect the effect of sales charges, if applicable. |
| Portfolio turnover excludes the value of portfolio securities received or delivered as a result of in-kind fund share transactions. |
See Notes to Financial Statements.
THE ALGER INSTITUTIONAL FUNDSFinancial Highlights for a share outstanding throughout the period
Alger Capital Appreciation Institutional Fund | |
| | | | | |
Net asset value, beginning of period | | | | | |
INCOME FROM INVESTMENT OPERATIONS: |
| | | | | |
Net realized and unrealized gain (loss) on investments | | | | | |
Total from investment operations | | | | | |
Distributions from net realized gains | | | | | |
Net asset value, end of period | | | | | |
| | | | | |
RATIOS/SUPPLEMENTAL DATA: |
Net assets, end of period (000's omitted) | | | | | |
Ratio of gross expenses to average net assets | | | | | |
Ratio of expense reimbursements to average net assets | | | | | |
Ratio of net expenses to average net assets | | | | | |
Ratio of net investment loss to average net assets | | | | | |
| | | | | |
| Amount was computed based on average shares outstanding during the period. |
| Amount was less than $0.005 per share. |
| Does not reflect the effect of sales charges, if applicable. |
| Portfolio turnover excludes the value of portfolio securities received or delivered as a result of in-kind fund share transactions. |
See Notes to Financial Statements.
THE ALGER INSTITUTIONAL FUNDSFinancial Highlights for a share outstanding throughout the period
Alger Capital Appreciation Institutional Fund | |
| | | | | |
Net asset value, beginning of period | | | | | |
INCOME FROM INVESTMENT OPERATIONS: |
| | | | | |
Net realized and unrealized gain (loss) on investments | | | | | |
Total from investment operations | | | | | |
Distributions from net realized gains | | | | | |
Net asset value, end of period | | | | | |
| | | | | |
RATIOS/SUPPLEMENTAL DATA: |
Net assets, end of period (000's omitted) | | | | | |
Ratio of gross expenses to average net assets | | | | | |
Ratio of expense reimbursements to average net assets | | | | | |
Ratio of net expenses to average net assets | | | | | |
Ratio of net investment loss to average net assets | | | | | |
| | | | | |
| Amount was computed based on average shares outstanding during the period. |
| Does not reflect the effect of sales charges, if applicable. |
See Notes to Financial Statements.
THE ALGER INSTITUTIONAL FUNDSFinancial Highlights for a share outstanding throughout the period
| |
| | | | | |
Net asset value, beginning of period | | | | | |
INCOME FROM INVESTMENT OPERATIONS: |
| | | | | |
Net realized and unrealized gain (loss) on investments | | | | | |
Total from investment operations | | | | | |
Dividends from net investment income | | | | | |
Distributions from net realized gains | | | | | |
Net asset value, end of period | | | | | |
| | | | | |
RATIOS/SUPPLEMENTAL DATA: |
Net assets, end of period (000's omitted) | | | | | |
Ratio of net expenses to average net assets | | | | | |
Ratio of net investment loss to average net assets | | | | | |
| | | | | |
| Amount was computed based on average shares outstanding during the period. |
| Does not reflect the effect of sales charges, if applicable. |
| Portfolio turnover excludes the value of portfolio securities received or delivered as a result of in-kind fund share transactions. |
See Notes to Financial Statements.
THE ALGER INSTITUTIONAL FUNDSFinancial Highlights for a share outstanding throughout the period
| |
| | | | | |
Net asset value, beginning of period | | | | | |
INCOME FROM INVESTMENT OPERATIONS: |
| | | | | |
Net realized and unrealized gain (loss) on investments | | | | | |
Total from investment operations | | | | | |
Dividends from net investment income | | | | | |
Distributions from net realized gains | | | | | |
Net asset value, end of period | | | | | |
| | | | | |
RATIOS/SUPPLEMENTAL DATA: |
Net assets, end of period (000's omitted) | | | | | |
Ratio of gross expenses to average net assets | | | | | |
Ratio of expense reimbursements to average net assets | | | | | |
Ratio of net expenses to average net assets | | | | | |
Ratio of net investment loss to average net assets | | | | | |
| | | | | |
| Amount was computed based on average shares outstanding during the period. |
| Amount was less than $0.005 per share. |
| Does not reflect the effect of sales charges, if applicable. |
| Portfolio turnover excludes the value of portfolio securities received or delivered as a result of in-kind fund share transactions. |
See Notes to Financial Statements.
THE ALGER INSTITUTIONAL FUNDSFinancial Highlights for a share outstanding throughout the period
| |
| | | | | |
Net asset value, beginning of period | | | | | |
INCOME FROM INVESTMENT OPERATIONS: |
Net investment income (loss)(a) | | | | | |
Net realized and unrealized gain (loss) on investments | | | | | |
Total from investment operations | | | | | |
Dividends from net investment income | | | | | |
Distributions from net realized gains | | | | | |
Net asset value, end of period | | | | | |
| | | | | |
RATIOS/SUPPLEMENTAL DATA: |
Net assets, end of period (000's omitted) | | | | | |
Ratio of gross expenses to average net assets | | | | | |
Ratio of expense reimbursements to average net assets | | | | | |
Ratio of net expenses to average net assets | | | | | |
Ratio of net investment income (loss) to average net assets | | | | | |
| | | | | |
| Amount was computed based on average shares outstanding during the period. |
| Does not reflect the effect of sales charges, if applicable. |
| Portfolio turnover excludes the value of portfolio securities received or delivered as a result of in-kind fund share transactions. |
See Notes to Financial Statements.
THE ALGER INSTITUTIONAL FUNDSFinancial Highlights for a share outstanding throughout the period
Alger Mid Cap Growth Institutional Fund | |
| | | | | |
Net asset value, beginning of period | | | | | |
INCOME FROM INVESTMENT OPERATIONS: |
| | | | | |
Net realized and unrealized gain (loss) on investments | | | | | |
Total from investment operations | | | | | |
Distributions from net realized gains | | | | | |
Net asset value, end of period | | | | | |
| | | | | |
RATIOS/SUPPLEMENTAL DATA: |
Net assets, end of period (000's omitted) | | | | | |
Ratio of gross expenses to average net assets | | | | | |
Ratio of expense reimbursements to average net assets | | | | | |
Ratio of net expenses to average net assets | | | | | |
Ratio of net investment loss to average net assets | | | | | |
| | | | | |
| Amount was computed based on average shares outstanding during the period. |
| Does not reflect the effect of sales charges, if applicable. |
See Notes to Financial Statements.
THE ALGER INSTITUTIONAL FUNDSFinancial Highlights for a share outstanding throughout the period
Alger Mid Cap Growth Institutional Fund | |
| | | | | |
Net asset value, beginning of period | | | | | |
INCOME FROM INVESTMENT OPERATIONS: |
| | | | | |
Net realized and unrealized gain (loss) on investments | | | | | |
Total from investment operations | | | | | |
Distributions from net realized gains | | | | | |
Net asset value, end of period | | | | | |
| | | | | |
RATIOS/SUPPLEMENTAL DATA: |
Net assets, end of period (000's omitted) | | | | | |
Ratio of gross expenses to average net assets | | | | | |
Ratio of expense reimbursements to average net assets | | | | | |
Ratio of net expenses to average net assets | | | | | |
Ratio of net investment loss to average net assets | | | | | |
| | | | | |
| Amount was computed based on average shares outstanding during the period. |
| Does not reflect the effect of sales charges, if applicable. |
See Notes to Financial Statements.
THE ALGER INSTITUTIONAL FUNDSFinancial Highlights for a share outstanding throughout the period
Alger Small Cap Growth Institutional Fund | |
| | | | | |
Net asset value, beginning of period | | | | | |
INCOME FROM INVESTMENT OPERATIONS: |
| | | | | |
Net realized and unrealized gain (loss) on investments | | | | | |
Total from investment operations | | | | | |
Dividends from net investment income | | | | | |
Distributions from net realized gains | | | | | |
Net asset value, end of period | | | | | |
| | | | | |
RATIOS/SUPPLEMENTAL DATA: |
Net assets, end of period (000's omitted) | | | | | |
Ratio of net expenses to average net assets | | | | | |
Ratio of net investment loss to average net assets | | | | | |
| | | | | |
| Amount was computed based on average shares outstanding during the period. |
| Does not reflect the effect of sales charges, if applicable. |
See Notes to Financial Statements.
THE ALGER INSTITUTIONAL FUNDSFinancial Highlights for a share outstanding throughout the period
Alger Small Cap Growth Institutional Fund | |
| | | | | |
Net asset value, beginning of period | | | | | |
INCOME FROM INVESTMENT OPERATIONS: |
| | | | | |
Net realized and unrealized gain (loss) on investments | | | | | |
Total from investment operations | | | | | |
Dividends from net investment income | | | | | |
Distributions from net realized gains | | | | | |
Net asset value, end of period | | | | | |
| | | | | |
RATIOS/SUPPLEMENTAL DATA: |
Net assets, end of period (000's omitted) | | | | | |
Ratio of gross expenses to average net assets | | | | | |
Ratio of expense reimbursements to average net assets | | | | | |
Ratio of net expenses to average net assets | | | | | |
Ratio of net investment loss to average net assets | | | | | |
| | | | | |
| Amount was computed based on average shares outstanding during the period. |
| Does not reflect the effect of sales charges, if applicable. |
See Notes to Financial Statements.
THE ALGER INSTITUTIONAL FUNDSNOTES TO FINANCIAL STATEMENTS
NOTE 1 — General:
The Alger Institutional Funds (the “Trust”) is an open-end registered investment company organized as a business trust under the laws of the Commonwealth of Massachusetts. The Trust qualifies as an investment company as defined in Financial Accounting Standards Board (“FASB”) Accounting Standards Codification 946 – Financial Services – Investment Companies. The Trust operates as a series company currently offering an unlimited number of shares of beneficial interest in four series – Alger Capital Appreciation Institutional Fund, Alger Focus Equity Fund, Alger Mid Cap Growth Institutional Fund and Alger Small Cap Growth Institutional Fund (collectively, the “Funds” or individually, each a “Fund”). The Funds normally invest primarily in equity securities and each has an investment objective of long-term capital appreciation.
Each Fund offers one or more of the following share classes: Class A, C, I, R, Y, Z and Z-2. Class A shares are generally subject to an initial sales charge while Class C shares are generally subject to a deferred sales charge. Class I, R, Y, Z and Z-2 shares are generally sold to institutional investors and are sold without an initial or deferred sales charge and Class Y, Z and Z-2 shares are generally subject to a minimum initial investment of $500,000. Class C shares will automatically convert to Class A shares on the fifth business day of the month following the eighth anniversary of the purchase date of a shareholder’s Class C shares, without the imposition of any sales load, fee or other charge. Class C shares held at certain dealers may not convert to Class A shares or may be converted on a different schedule. At conversion, a proportionate amount of shares representing reinvested dividends and distributions will also be converted into Class A shares. Effective August 27, 2019, Class C shares were closed to direct shareholders and are only available for purchase through certain financial intermediaries and group retirement plan recordkeeping platforms. Each class has identical rights to assets and earnings, except that each share class bears the pro rata allocation of the Fund’s expenses other than a class expense (not including advisory or custodial fees or other expenses related to the management of the Fund’s assets).
Effective January 29, 2024, the Funds' custodian and administrator transitioned from Brown Brothers Harriman & Company to The Bank of New York (collectively, the "Custodian").
NOTE 2 — Significant Accounting Policies:
(a) Investment Valuation: The Funds value their financial instruments at fair value using independent dealers or pricing services under policies approved by the Board. Investments held by the Funds are valued on each day the New York Stock Exchange (the “NYSE”) is open, as of the close of the NYSE (normally 4:00 p.m. Eastern Time).
THE ALGER INSTITUTIONAL FUNDSNOTES TO FINANCIAL STATEMENTS (Continued)
The Board of Trustees of the Trust (the "Board") has designated, pursuant to Rule 2a-5 under the Investment Company Act of 1940, as amended (the “1940 Act”), the Funds' investment adviser, Fred Alger Management, LLC (“Alger Management” or the “Investment Manager”) as its valuation designee (the “Valuation Designee”) to make fair value determinations subject to the Board’s review and oversight. The Valuation Designee has established a Valuation Committee (“Committee”) comprised of representatives of the Investment Manager and officers of the Funds to assist in performing the duties and responsibilities of the Valuation Designee.
The Valuation Designee has established valuation processes including but not limited to: (i) making fair value determinations when market quotations for financial instruments are not readily available in accordance with valuation policies and procedures adopted by the Board; (ii) assessing and managing material risks associated with fair valuation determinations; (iii) selecting, applying and testing fair valuation methodologies; and (iv) overseeing and evaluating pricing services used by the Funds. The Valuation Designee regularly reports its fair valuation determinations and related valuation information to the Board. The Committee generally meets quarterly and on an as-needed basis to review and evaluate the effectiveness of the valuation policies and procedures in accordance with the requirements of Rule 2a-5.
Investments in short-term securities held by the Funds having a remaining maturity of sixty days or less are valued at amortized cost which approximates market value. Investments in other open-end investment companies registered under the 1940 Act, including money market funds, are valued at such investment companies' net asset value per share.
Equity securities, including traded rights, warrants and option contracts for which valuation information is readily available, are valued at the last quoted sales price or official closing price on the primary market or exchange on which they are traded as reported by an independent pricing service. In the absence of quoted sales, such securities are generally valued at the bid price or, in the absence of a recent bid price, the equivalent as obtained from one or more of the major market makers for the securities to be valued.
Securities in which the Funds invest may be traded in foreign markets that close before the close of the NYSE. Developments that occur between the close of the foreign markets and the close of the NYSE may result in adjustments to the closing foreign prices to reflect what the Valuation Designee, through its Committee, believes to be the fair value of these securities as of the close of the NYSE. The Funds may also fair value securities in other situations, for example, when a particular foreign market is closed but the NYSE is open.
THE ALGER INSTITUTIONAL FUNDSNOTES TO FINANCIAL STATEMENTS (Continued)
FASB Accounting Standards Codification 820 – Fair Value Measurements and Disclosures (“ASC 820”) defines fair value as the price that the Funds would receive upon selling an investment in a timely transaction to an independent buyer in the principal or most advantageous market of the investment. ASC 820 established a three-tier hierarchy to maximize the use of observable market data and minimize the use of unobservable inputs and to establish classification of fair value measurements for disclosure purposes. Inputs refer broadly to the assumptions that market participants would use in pricing the asset or liability and may be observable or unobservable. Observable inputs are based on market data obtained from sources independent of the Funds. Unobservable inputs are inputs that reflect the Funds' own assumptions based on the best information available in the circumstances. The three-tier hierarchy of inputs is summarized in the three broad Levels listed below. Each Fund's quantitative summary by Level can be found in Note 8.
• Level 1 – quoted prices in active markets for identical investments
• Level 2 – significant other observable inputs (including quoted prices for similar or identical investments, amortized cost, interest rates, prepayment speeds, credit risk, etc.)
• Level 3 – significant unobservable inputs (including the Funds' own assumptions in determining the fair value of investments)
The Funds' valuation techniques are generally consistent with either the market or the income approach to fair value. The market approach considers prices and other relevant information generated by market transactions involving identical or comparable assets to measure fair value. The income approach converts future amounts to a current, or discounted, single amount. These fair value measurements are determined on the basis of the value indicated by current market expectations about such future events. Inputs for Level 1 include exchange-listed prices and broker quotes in an active market. Inputs for Level 2 include the last trade price in the case of a halted security, an exchange-listed price which has been adjusted for fair value factors, and prices of closely related securities. Additional Level 2 inputs include an evaluated price which is based upon a compilation of observable market information such as spreads for fixed income and preferred securities. Inputs for Level 3 include, but are not limited to, revenue multiples, earnings before interest, taxes, depreciation and amortization (“EBITDA”) multiples, discount rates, time to exit and the probabilities of success of certain outcomes. Such unobservable market information may be obtained from a company’s financial statements and from industry studies, market data, and market indicators such as benchmarks and indexes. Because of the inherent uncertainty and often limited markets for restricted securities, the valuations assigned to such securities by the Funds may significantly differ from the valuations that would have been assigned by the Funds had there been an active market for such securities.
THE ALGER INSTITUTIONAL FUNDSNOTES TO FINANCIAL STATEMENTS (Continued)
(b) Cash and Cash Equivalents: Cash and cash equivalents include U.S. dollars and foreign cash.
(c) Securities Transactions and Investment Income: Securities transactions are recorded on a trade date basis. Realized gains and losses from securities transactions are recorded on the identified cost basis. Dividend income is recognized on the ex-dividend date and interest income is recognized on the accrual basis.
(d) Foreign Currency Transactions: The books and records of the Funds are maintained in U.S. dollars. Foreign currencies, investments, and other assets and liabilities are translated into U.S. dollars at the prevailing rates of exchange on the valuation date. Purchases and sales of investment securities and income and expenses are translated into U.S. dollars at the prevailing exchange rates on the respective dates of such transactions.
Net realized gains and losses on foreign currency transactions represent net gains and losses from the disposition of foreign currencies, currency gains and losses realized between the trade dates and settlement dates of security transactions, and the difference between the amount of net investment income accrued and the U.S. dollar amount actually received. The effects of changes in foreign currency exchange rates on investments in securities are included in realized and unrealized gain or loss on investments in the accompanying Statements of Operations.
(e) Dividends to Shareholders: Dividends and distributions payable to shareholders are recorded by the Funds on the ex-dividend date. Dividends from net investment income, if available, and distributions from net realized gains, offset by any loss carryforward, are declared and paid annually after the end of the fiscal year in which earned. Each share class is treated separately in determining the amount of dividends from net investment income payable to holders of its shares.
The characterization of distributions to shareholders for financial reporting purposes is determined in accordance with federal income tax rules. Therefore, the source of a Fund’s distributions may be shown in the accompanying financial statements as either from, or in excess of, net investment income, net realized gain on investment transactions, or return of capital, depending on the type of book/tax differences that may exist. Capital accounts within the financial statements are adjusted for permanent book/tax differences. Reclassifications result primarily from the differences in tax treatment of net operating losses, passive foreign investment companies, and foreign currency transactions. The reclassifications are done annually at year-end and have no impact on the net asset values of the Funds and are designed to present each Fund’s capital accounts on a tax basis.
THE ALGER INSTITUTIONAL FUNDSNOTES TO FINANCIAL STATEMENTS (Continued)
(f) Federal Income Taxes: It is each Fund’s policy to comply with the requirements of the Internal Revenue Code Subchapter M applicable to regulated investment companies and to distribute all of its taxable income to its shareholders. Provided that the Funds maintain such compliance, no federal income tax provision is required. Each Fund is treated as a separate entity for the purpose of determining such compliance.
FASB Accounting Standards Codification 740 – Income Taxes (“ASC 740”) requires the Funds to measure and recognize in their financial statements the benefit of a tax position taken (or expected to be taken) on an income tax return if such position will more likely than not be sustained upon examination based on the technical merits of the position. No tax years are currently under investigation. The Funds file income tax returns in the U.S. Federal jurisdiction, as well as the New York State and New York City jurisdictions. The statute of limitations on the Funds' tax returns remains open for the tax years 2020-2023. Alger Management does not believe there are any uncertain tax positions that require recognition of a tax liability.
(g) Allocation Methods: The Trust accounts separately for the assets, liabilities and operations of each Fund. Expenses directly attributable to each Fund are charged to that Fund’s operations; expenses which are applicable to all Funds are allocated among them based on net assets. Income, realized and unrealized gains and losses, and expenses of each Fund are allocated among the Fund’s classes based on relative net assets, with the exception of distribution fees, transfer agency fees, and shareholder servicing and related fees.
(h) Estimates: These financial statements have been prepared in accordance with accounting principles generally accepted in the United States of America, which require using estimates and assumptions that affect the reported amounts therein. Actual results may differ from those estimates. All such estimates are of a normal recurring nature.
NOTE 3 — Investment Advisory Fees and Other Transactions with Affiliates:
(a) Investment Advisory Fees: Fees incurred by each Fund, pursuant to the provisions of the Trust's Investment Advisory Agreement with the Investment Manager, are payable monthly and computed based on the following annual rates. The actual rate paid as a percentage of average daily net assets, for the year ended October 31, 2024, is set forth below under the heading “Actual Rate”:
THE ALGER INSTITUTIONAL FUNDSNOTES TO FINANCIAL STATEMENTS (Continued)
| | | | | | |
Alger Capital Appreciation | | | | | | |
| | | | | | |
| | | | | | |
Alger Small Cap Growth Institutional | | | | | | |
| Tier 1 rate is paid on assets up to $2 billion, Tier 2 rate is paid on assets between $2 billion and $3 billion, Tier 3 rate is paid on assets between $3 billion and $4 billion, Tier 4 rate is paid on assets between $4 billion and $5 billion, and Tier 5 rate is paid on assets in excess of $5 billion. |
| Tier 1 rate is paid on all assets. |
| Tier 1 rate is paid on assets up to $1 billion and Tier 2 rate is paid on assets in excess of $1 billion. |
Alger Management has contractually agreed to waive and/or reimburse Fund expenses (excluding custody fees, acquired fund fees and expenses, dividend expense on short sales, net borrowing costs, interest, taxes, brokerage and extraordinary expenses, to the extent applicable) through October 31, 2025 to the extent necessary to limit other expenses and any other applicable share class-specific expenses to the rates, based on average daily net assets, as listed in the table below. On October 22, 2024, the Board approved exclusion of all cost related to the August 16, 2024 joint special meeting of shareholders from the expense reimbursement with Alger Management.
| | FEES WAIVED /
REIMBURSED FOR THE
YEAR ENDED
OCTOBER 31,
2024 |
| | | | | | | |
Alger Capital Appreciation Institutional Fund | | | | | | | | |
| | | | | | | | |
Alger Mid Cap Growth Institutional Fund | | | | | | | | |
Alger Small Cap Growth Institutional Fund | | | | | | | | |
| | | | | | | | |
| Prior to February 29, 2024, this share class did not have a contractual agreement in place to waive and/or reimburse Fund expenses. |
Alger Management may recoup any fees waived or expenses reimbursed pursuant to the contract; however, a Fund will only make repayments to the Investment Manager if such repayment does not cause a Fund’s expense ratio, after the repayment is taken into account, to exceed both (i) the expense cap in
THE ALGER INSTITUTIONAL FUNDSNOTES TO FINANCIAL STATEMENTS (Continued)
place at the time such amounts were waived or reimbursed, and (ii) a Fund’s current expense cap. Such recoupment is limited to two years from the date the amount is initially waived or reimbursed. For the year ended October 31, 2024, the recoupments made by the Alger Focus Equity Fund and Alger Mid Cap Growth Institutional Fund to the Investment Manager were $10,920 and $9,262, respectively. There were no recoupments made by the Alger Capital Appreciation Institutional Fund or Alger Small Cap Institutional Fund to the Investment Manager.
(b) Administration Fees: Fees incurred by each Fund, pursuant to the provisions of the Trust's Fund Administration Agreement with Alger Management, are payable monthly and computed based on the average daily net assets of each Fund at the annual rate of 0.0275%.
Class A Shares: The Trust has adopted a Distribution Plan pursuant to which Class A shares of Alger Focus Equity Fund pay Fred Alger & Company, LLC, the Trust’s distributor and an affiliate of the Investment Manager (the “Distributor” or “Alger LLC”), a fee at the annual rate of 0.25% of the respective average daily net assets of the Class A shares of the Fund to compensate Alger LLC for its activities and expenses incurred in distributing and/or administering Class A shares and/or shareholder servicing. The fees paid may be more or less than the expenses incurred by Alger LLC.
Class C Shares: The Trust has adopted a Distribution Plan pursuant to which Class C shares of Alger Focus Equity Fund pays Alger LLC a fee at the annual rate of 1% of the average daily net assets of the Class C shares of the Fund to compensate Alger LLC for its activities and expenses incurred in distributing and/or servicing the Class C shares. The fees paid may be more or less than the expenses incurred by Alger LLC.
Class R Shares: The Trust has adopted a Distribution Plan pursuant to which Class R shares of each Fund issuing such shares pays Alger LLC a fee at the annual rate of 0.50% of the respective average daily net assets of the Class R shares of the designated Fund to compensate Alger LLC for its activities and expenses incurred in distributing the Class R shares. The fees paid may be more or less than the expenses incurred by Alger LLC.
(d) Sales Charges: Sales of shares of the Funds may be subject to contingent deferred sales charges. The contingent deferred sales charges are used by Alger LLC to offset distribution expenses previously incurred. Sales charges do not represent expenses of the Trust. For the year ended October 31, 2024, contingent deferred sales charges imposed, all of which were retained by Alger LLC, were as follows:
THE ALGER INSTITUTIONAL FUNDSNOTES TO FINANCIAL STATEMENTS (Continued)
| CONTINGENT
DEFERRED SALES
CHARGES |
| |
(e) Brokerage Commissions: During the year ended October 31, 2024, Alger Capital Appreciation Institutional Fund, Alger Focus Equity Fund, Alger Mid Cap Growth Institutional Fund and Alger Small Cap Growth Institutional Fund paid Alger LLC commissions of $95,083, $60,988, $7,849 and $13,128, respectively, in connection with securities transactions.
(f) Shareholder Administrative Fees: The Trust has entered into a Shareholder Administrative Services Agreement with Alger Management to compensate Alger Management for its liaising with, and providing administrative oversight of, the Trust’s transfer agent, and for other related services. The Funds compensate Alger Management at the annual rate of 0.0165% of their respective average daily net assets for the Class A and Class C shares and 0.01% of their respective average daily net assets for the Class I, Class R, Class Y, Class Z and Class Z-2 shares for these services.
Alger Management makes payments to intermediaries that provide sub-accounting services to omnibus accounts invested in the Funds. A portion of the fees paid by Alger Management to intermediaries that provide sub-accounting services are charged back to the appropriate Fund, subject to certain limitations, as approved by the Board. For the year ended October 31, 2024, Alger Management charged back to Alger Capital Appreciation Institutional Fund, Alger Focus Equity Fund, Alger Mid Cap Growth Institutional Fund, and Alger Small Cap Growth Institutional Fund, $628,087, $79,025, $26,778 and $32,046, respectively, for these services, which are included in transfer agent fees in the accompanying Statements of Operations.
(g) Trustee Fees: Each trustee who is not an “interested person” of the Trust, as defined in the 1940 Act (“Independent Trustee”), receives a fee of $165,400 per annum, paid pro rata based on net assets by each fund in the Alger Fund Complex, plus travel expenses incurred for attending board meetings. Prior to January 1, 2024, each Independent Trustee received $156,000 per annum, paid pro rata based on net assets by each fund in the Alger Fund Complex, plus travel expenses incurred for attending board meetings. The term “Alger Fund Complex” refers to the Trust, The Alger Funds, The Alger Funds II, The Alger Portfolios, Alger Global Equity Fund (formerly Alger Global Focus Fund) and The Alger ETF Trust, each of which is a registered investment company managed by Alger Management. The Independent Trustee appointed as Chairman of the Board receives additional compensation of $22,000 per annum paid pro rata based on net assets by each fund in the Alger Fund Complex. Additionally, each
THE ALGER INSTITUTIONAL FUNDSNOTES TO FINANCIAL STATEMENTS (Continued)
member of the Audit Committee receives a fee of $13,000 per annum, paid pro rata based on net assets by each fund in the Alger Fund Complex.
The Board has adopted a policy requiring Independent Trustees to receive a minimum of 10% of their annual compensation in shares of one or more of the funds in the Alger Fund Complex.
(h) Interfund Trades: The Funds may engage in purchase and sale transactions with other funds advised by Alger Management or sub-advised by Weatherbie Capital, LLC or Redwood Investments, LLC, affiliates of Alger Management. For the year ended October 31, 2024, there were no interfund trades.
(i) Interfund Loans: The Funds, along with other funds in the Alger Fund Complex, may borrow money from and lend money to each other for temporary or emergency purposes. To the extent permitted under its investment restrictions, each Fund may lend uninvested cash in an amount up to 15% of its net assets to other funds in the Alger Fund Complex. If a Fund has borrowed from other funds in the Alger Fund Complex and has aggregate borrowings from all sources that exceed 10% of the Fund’s total assets, such Fund will secure all of its loans from other funds in the Alger Fund Complex. The interest rate charged on interfund loans is equal to the average of the overnight U.S. Treasury money market rate and bank loan rate available to the Funds. As of October 31, 2024 Alger Capital Appreciation Institutional Fund borrowed $8,320,880, including interest, from Alger Growth & Income Fund, an affiliated fund, at a rate of 5.77%, which was payable November 1, 2024. In addition, Alger Small Cap Institutional Fund borrowed $168,027, including interest, from Alger Growth & Income Fund, an affiliated fund, at a rate of 5.77%, which was payable November 1, 2024.
For the year ended October 31, 2024, Alger Capital Appreciation Institutional Fund, Alger Focus Equity Fund, Alger Mid Cap Growth Institutional Fund and Alger Small Cap Growth Institutional Fund incurred interfund loan interest expenses of $405,973, $16,103, $432 and $6,446, respectively, which are included in interest expense in the accompanying Statements of Operations.
(j) Other Transactions with Affiliates: Certain officers and one Trustee of the Trust are directors and/or officers of Alger Management, the Distributor, or their affiliates. At October 31, 2024, Alger Management and its affiliated entities owned the following shares:
| |
| | | | | | |
Alger Capital Appreciation Institutional Fund | | | | | | |
| | | | | | |
Alger Mid Cap Growth Institutional Fund | | | | | | |
Alger Small Cap Growth Institutional Fund | | | | | | |
THE ALGER INSTITUTIONAL FUNDSNOTES TO FINANCIAL STATEMENTS (Continued)
(k) Shareholder Servicing Fees:The Trust has entered into a shareholder servicing agreement with Alger LLC whereby Alger LLC provides Class I and Class R shares of the applicable Funds with ongoing servicing of shareholder accounts. As compensation for such services, the Class I and Class R shares of each applicable Fund pay Alger LLC a fee at an annual rate of 0.25% of the value of the average daily net assets of those classes. The fees paid may be more or less than the expenses incurred by Alger LLC.
NOTE 4 — Securities Transactions:
The following summarizes the securities transactions by each Fund, other than U.S. Government securities, in-kind transactions, and short-term securities, for the year ended October 31, 2024:
| | |
Alger Capital Appreciation Institutional Fund | | |
| | |
Alger Mid Cap Growth Institutional Fund | | |
Alger Small Cap Growth Institutional Fund | | |
The Funds may borrow from the Custodian, on an uncommitted basis. Each Fund pays the Custodian a market rate of interest, generally based upon a rate of return with respect to each respective currency borrowed, taking into consideration relevant overnight and short-term reference rates and the range of distribution between and among the interest rates paid on deposits to other institutions, less applicable commissions, if any. Borrowings from the Custodian, if any, are included in Bank overdraft in the Statements of Assets and Liabilities. The Funds may also borrow from other funds in the Alger Fund Complex, as discussed in Note 3(i). For the year ended October 31, 2024, the Funds had the following borrowings from the Custodian and other funds in the Alger Fund Complex:
| | WEIGHTED AVERAGE
INTEREST RATE |
Alger Capital Appreciation Institutional Fund | | |
| | |
Alger Mid Cap Growth Institutional Fund | | |
Alger Small Cap Growth Institutional Fund | | |
THE ALGER INSTITUTIONAL FUNDSNOTES TO FINANCIAL STATEMENTS (Continued)
The highest amount borrowed from the Custodian and other funds in the Alger Fund Complex during the year ended October 31, 2024 by each Fund was as follows:
| |
Alger Capital Appreciation Institutional Fund | |
| |
Alger Mid Cap Growth Institutional Fund | |
Alger Small Cap Growth Institutional Fund | |
The Trust has an unlimited number of authorized shares of beneficial interest of $.001 par value which are presently divided into four series. Each series is divided into separate classes. During the year ended October 31, 2024, and the year ended October 31, 2023, transactions of shares of beneficial interest were as follows:
| FOR THE YEAR ENDED
October 31, 2024 | FOR THE YEAR ENDED
October 31, 2023 |
| | | | |
Alger Capital Appreciation Institutional Fund |
| | | | |
| | | | |
| | | | |
| | | | |
| | | | |
| | | | |
| | | | |
| | | | |
| | | | |
| | | | |
| | | | |
| | | | |
| | | | |
| | | | |
| | | | |
| | | | |
| | | | |
| | | | |
| | | | |
| | | | |
| | | | |
THE ALGER INSTITUTIONAL FUNDSNOTES TO FINANCIAL STATEMENTS (Continued)
| FOR THE YEAR ENDED
October 31, 2024 | FOR THE YEAR ENDED
October 31, 2023 |
| | | | |
|
| | | | |
| | | | |
Shares converted from Class C | | | | |
| | | | |
| | | | |
| | | | |
| | | | |
| | | | |
Shares converted to Class A | | | | |
| | | | |
| | | | |
| | | | |
| | | | |
| | | | |
| | | | |
| | | | |
| | | | |
| | | | |
| | | | |
| | | | |
| | | | |
| | | | |
| | | | |
| | | | |
| | | | |
| | | | |
| | | | |
THE ALGER INSTITUTIONAL FUNDSNOTES TO FINANCIAL STATEMENTS (Continued)
| FOR THE YEAR ENDED
October 31, 2024 | FOR THE YEAR ENDED
October 31, 2023 |
| | | | |
Alger Mid Cap Growth Institutional Fund |
| | | | |
| | | | |
| | | | |
| | | | |
| | | | |
| | | | |
| | | | |
| | | | |
| | | | |
| | | | |
| | | | |
| | | | |
| | | | |
| | | | |
| | | | |
Alger Small Cap Growth Institutional Fund |
| | | | |
| | | | |
| | | | |
| | | | |
| | | | |
| | | | |
| | | | |
| | | | |
| | | | |
| | | | |
| | | | |
| | | | |
| | | | |
| | | | |
| | | | |
| Certain shareholders of the Fund redeemed shares in-kind. |
Redemptions In-Kind: A Fund may make payment for Fund shares redeemed wholly or in part by transferring portfolio securities to shareholders. For the year ended October 31, 2024, the Alger Capital Appreciation Institutional Fund had redemptions in-kind with total proceeds in the amount of $84,101,911. The net realized gains on these redemptions in-kind amounted to $57,776,347, which are not considered taxable for federal income tax purposes.
THE ALGER INSTITUTIONAL FUNDSNOTES TO FINANCIAL STATEMENTS (Continued)
NOTE 7 — Income Tax Information:
The tax character of distributions paid during the year ended October 31, 2024 and the year ended October 31, 2023 was as follows:
| FOR THE YEAR ENDED
October 31, 2024 | FOR THE YEAR ENDED
October 31, 2023 |
Alger Capital Appreciation Institutional Fund |
| | |
| | |
| | |
| | |
|
| | |
| | |
| | |
| | |
Alger Mid Cap Growth Institutional Fund |
| | |
| | |
| | |
| | |
Alger Small Cap Growth Institutional Fund |
| | |
| | |
| | |
| | |
As of October 31, 2024, the components of accumulated earnings (losses) on a tax basis were as follows:
Alger Capital Appreciation Institutional Fund | |
Undistributed ordinary income | |
Undistributed long-term gains | |
| |
Capital loss carryforwards | |
Late year ordinary income losses | |
Net unrealized appreciation | |
Total accumulated earnings | |
| |
Undistributed ordinary income | |
Undistributed long-term gains | |
| |
Capital loss carryforwards | |
THE ALGER INSTITUTIONAL FUNDSNOTES TO FINANCIAL STATEMENTS (Continued)
| |
Late year ordinary income losses | |
Net unrealized appreciation | |
Total accumulated earnings | |
Alger Mid Cap Growth Institutional Fund | |
Undistributed ordinary income | |
Undistributed long-term gains | |
| |
Capital loss carryforwards | |
Late year ordinary income losses | |
Net unrealized appreciation | |
Total accumulated earnings | |
Alger Small Cap Growth Institutional Fund | |
Undistributed ordinary income | |
Undistributed long-term gains | |
| |
Capital loss carryforwards | |
Late year ordinary income losses | |
Net unrealized appreciation | |
Total accumulated earnings | |
During the year ended October 31, 2024, the Alger Focus Equity Fund, the Alger Mid Cap Growth Institutional Fund and the Alger Small Cap Growth Institutional Fund, utilized capital loss carryforwards of $170,142,571, $3,661,397 and $16,747,691, respectively.
During the year ended October 31, 2024, the Alger Focus Equity Fund and the Alger Mid Cap Growth Institutional Fund, for federal income tax purposes, had capital loss carryforwards of $28,637,842 and $17,598,729, respectively. These amounts will not be subject to expiration under the Regulated Investment Company Modernization Act of 2010, and these amounts may be applied against future net realized gains until their utilization.
The difference between book-basis and tax-basis unrealized appreciation (depreciation) is determined annually and is attributable primarily to the tax deferral of losses on wash sales, U.S. Internal Revenue Code Section 988 currency transactions, tax treatment of partnership investments, the realization of unrealized appreciation of passive foreign investment companies, and the return of capital from real estate investment trust investments.
The Funds accrue tax on unrealized gains in foreign jurisdictions that impose a foreign capital tax, if applicable.
THE ALGER INSTITUTIONAL FUNDSNOTES TO FINANCIAL STATEMENTS (Continued)
Permanent differences, primarily from net operating losses and real estate investment trusts and partnership investments sold by the Funds, resulted in the following reclassifications among the Funds’ components of net assets at October 31, 2024:
Alger Capital Appreciation Institutional Fund | |
| |
| |
Alger Mid Cap Growth Institutional Fund | |
| |
| |
Alger Small Cap Growth Institutional Fund | |
| |
| |
NOTE 8 — Fair Value Measurements:
The following is a summary of the inputs used as of October 31, 2024 in valuing the Funds' investments carried at fair value on a recurring basis. Based upon the nature, characteristics, and risks associated with their investments, the Funds have determined that presenting them by security type and sector is appropriate.
Alger Capital Appreciation Institutional Fund | | | | |
| | | | |
| | | | |
| | | | |
| | | | |
| | | | |
| | | | |
| | | | |
| | | | |
| | | | |
| | | | |
| | | | |
| | | | |
| | | | |
REAL ESTATE INVESTMENT TRUST | | | | |
| | | | |
THE ALGER INSTITUTIONAL FUNDSNOTES TO FINANCIAL STATEMENTS (Continued)
Alger Capital Appreciation Institutional Fund | | | | |
| | | | |
| | | | |
TOTAL INVESTMENTS IN SECURITIES | | | | |
| | | | |
| | | | |
| | | | |
| | | | |
| | | | |
| | | | |
| | | | |
| | | | |
| | | | |
| | | | |
| | | | |
| | | | |
| | | | |
| | | | |
| | | | |
| | | | |
REAL ESTATE INVESTMENT TRUST | | | | |
| | | | |
| | | | |
| | | | |
TOTAL INVESTMENTS IN SECURITIES | | | | |
Alger Mid Cap Growth Institutional Fund | | | | |
| | | | |
| | | | |
| | | | |
| | | | |
| | | | |
| | | | |
| | | | |
| | | | |
| | | | |
| | | | |
| | | | |
| | | | |
| | | | |
| | | | |
THE ALGER INSTITUTIONAL FUNDSNOTES TO FINANCIAL STATEMENTS (Continued)
Alger Mid Cap Growth Institutional Fund | | | | |
| | | | |
| | | | |
| | | | |
| | | | |
| | | | |
| | | | |
| | | | |
| | | | |
TOTAL INVESTMENTS IN SECURITIES | | | | |
Alger Small Cap Growth Institutional Fund | | | | |
| | | | |
| | | | |
| | | | |
| | | | |
| | | | |
| | | | |
| | | | |
| | | | |
| | | | |
| | | | |
| | | | |
| | | | |
| | | | |
| | | | |
| | | | |
| | | | |
| | | | |
| | | | |
| | | | |
| | | | |
| | | | |
TOTAL INVESTMENTS IN SECURITIES | | | | |
| Alger Focus Equity Fund's, Alger Mid Cap Growth Institutional Fund's and Alger Small Cap Growth Institutional Fund's holdings of Prosetta Biosciences, Inc., Series D shares are classified as a Level 3 investment and are fair valued at zero as of October 31, 2024. |
| Alger Mid Cap Growth Institutional Fund's holdings of Constellation Software, Inc. warrants expiring March 31, 2040, are classified as a Level 2 investment and are fair valued at zero as of October 31, 2024. |
THE ALGER INSTITUTIONAL FUNDSNOTES TO FINANCIAL STATEMENTS (Continued)
| FAIR VALUE
MEASUREMENTS
USING SIGNIFICANT
UNOBSERVABLE
INPUTS (LEVEL 3) |
Alger Capital Appreciation Institutional Fund | |
Opening balance at November 1, 2023 | |
| |
| |
| |
Included in net realized gain (loss) on investments | |
Included in net change in unrealized appreciation (depreciation) on investments | |
Purchases and Sales/Distributions | |
| |
| |
Closing balance at October 31, 2024 | |
Net change in unrealized appreciation (depreciation) attributable to investments
still held at October 31, 2024** | |
THE ALGER INSTITUTIONAL FUNDSNOTES TO FINANCIAL STATEMENTS (Continued)
| FAIR VALUE
MEASUREMENTS
USING SIGNIFICANT
UNOBSERVABLE
INPUTS (LEVEL 3) |
| |
Opening balance at November 1, 2023 | |
| |
| |
| |
Included in net realized gain (loss) on investments | |
Included in net change in unrealized appreciation (depreciation) on investments | |
Purchases and Sales/Distributions | |
| |
| |
Closing balance at October 31, 2024 | |
Net change in unrealized appreciation (depreciation) attributable to investments
still held at October 31, 2024** | |
| FAIR VALUE
MEASUREMENTS
USING SIGNIFICANT
UNOBSERVABLE
INPUTS (LEVEL 3) |
Alger Mid Cap Growth Institutional Fund | |
Opening balance at November 1, 2023 | |
| |
| |
| |
Included in net realized gain (loss) on investments | |
Included in net change in unrealized appreciation (depreciation) on investments | |
Purchases and Sales/Distributions | |
| |
| |
Closing balance at October 31, 2024 | |
Net change in unrealized appreciation (depreciation) attributable to investments
still held at October 31, 2024** | |
THE ALGER INSTITUTIONAL FUNDSNOTES TO FINANCIAL STATEMENTS (Continued)
| FAIR VALUE
MEASUREMENTS
USING SIGNIFICANT
UNOBSERVABLE
INPUTS (LEVEL 3) |
Alger Mid Cap Growth Institutional Fund | |
Opening balance at November 1, 2023 | |
| |
| |
| |
Included in net realized gain (loss) on investments | |
Included in net change in unrealized appreciation (depreciation) on investments | |
Purchases and Sales/Distributions | |
| |
| |
Closing balance at October 31, 2024 | |
Net change in unrealized appreciation (depreciation) attributable to investments
still held at October 31, 2024** | |
THE ALGER INSTITUTIONAL FUNDSNOTES TO FINANCIAL STATEMENTS (Continued)
| FAIR VALUE
MEASUREMENTS
USING SIGNIFICANT
UNOBSERVABLE
INPUTS (LEVEL 3) |
Alger Small Cap Growth Institutional Fund | |
Opening balance at November 1, 2023 | |
| |
| |
| |
Included in net realized gain (loss) on investments | |
Included in net change in unrealized appreciation (depreciation) on investments | |
Purchases and Sales/Distributions | |
| |
| |
Closing balance at October 31, 2024 | |
Net change in unrealized appreciation (depreciation) attributable to investments
still held at October 31, 2024** | |
| Includes securities that are fair valued at zero. |
| Net change in unrealized appreciation (depreciation) is included in the net change in unrealized appreciation
(depreciation) on investments in the accompanying Statement of Operations. |
The following table provides quantitative information about each Fund's Level 3 fair value measurements of its investments as of October 31, 2024. The table below is not intended to be all-inclusive, but rather provides information on the Level 3 inputs as they relate to each Fund's fair value measurements.
THE ALGER INSTITUTIONAL FUNDSNOTES TO FINANCIAL STATEMENTS (Continued)
| Fair Value
October 31,
2024 | | | | |
Alger Capital Appreciation Institutional Fund |
| | | | | |
| | | | | |
| | | | | |
|
| | | | | |
| | | | | |
Alger Mid Cap Growth Institutional Fund |
| | | | | |
| | | | | |
| | | Discount Rate
Probability of Success | | |
| | | | | |
Alger Small Cap Growth Institutional Fund |
| | | | | |
| | | | | |
| | | | | |
| | | | | |
| | | Discount Rate
Probability of Success | | |
| | | | | |
| Each security type listed and respective valuation methodology and unobservable input, represents only one investment. |
| Prosetta Biosciences, Inc., Series D shares are classified as a Level 3 investment and are fair valued at zero as of October 31, 2024. |
| Fair value was determined based on the recent acquisition price (transaction price) as a best measure of fair value with no material changes in valuation assumptions since the acquisition date of October 23, 2024. |
The significant unobservable inputs used in the fair value measurement of each Fund's securities are revenue and EBITDA multiples, discount rates, and the probability of success of certain outcomes. Significant increases and decreases in these inputs in isolation and interrelationships between these inputs would
THE ALGER INSTITUTIONAL FUNDSNOTES TO FINANCIAL STATEMENTS (Continued)
have resulted in significantly higher or lower fair value measurements than those noted in the table above. Generally, all other things being equal, increases in revenue and EBITDA multiples, decreases in discount rates, and increases in the probability of success result in higher fair value measurements, whereas decreases in revenues and EBITDA multiples, increases in discount rates, and decreases in the probability of success result in lower fair value measurements. For the year ended October 31, 2024, there were no changes in valuation methodology on Level 3 investments.
FASB Accounting Standards Codification 815 – Derivatives and Hedging (“ASC 815”) requires qualitative disclosures about objectives and strategies for using derivatives, quantitative disclosures about fair value amounts of and gains and losses on derivative instruments, and disclosures about credit-risk-related contingent features in derivative agreements.
There were no derivative instruments held by the Funds throughout the year or as of October 31, 2024.
NOTE 10 — Principal Risks:
Alger Capital Appreciation Institutional Fund — Investing in the stock market involves risks, including the potential loss of principal. The value of these securities, like other investments, may move up or down, sometimes rapidly and unpredictably. Fund shares at any point in time may be worth less than what was invested, even after taking into account the reinvestment of Fund dividends and distributions. Local, regional or global events such as environmental or natural disasters, war, terrorism, pandemics, outbreaks of infectious diseases and similar public health threats, recessions, or other events could have a significant impact on investments. Growth stocks may be more volatile than other stocks as their prices tend to be higher in relation to their companies’ earnings and may be more sensitive to market, political, and economic developments. A significant portion of assets may be invested in securities of companies in related sectors, and may be similarly affected by economic, political, or market events and conditions and may be more vulnerable to unfavorable sector developments. Foreign securities involve special risks including currency fluctuations, inefficient trading, political and economic instability, and increased volatility. At times, the Fund may hold a large cash or cash equivalent position, which may underperform relative to equity securities.
Alger Focus Equity Fund — Investing in the stock market involves risks, including the potential loss of principal. The value of these securities, like other investments, may move up or down, sometimes rapidly and unpredictably. Fund shares at any point in time may be worth less than what was invested, even after taking into account the reinvestment of Fund dividends and distributions. Local, regional or global events such as environmental or natural disasters, war,
THE ALGER INSTITUTIONAL FUNDSNOTES TO FINANCIAL STATEMENTS (Continued)
terrorism, pandemics, outbreaks of infectious diseases and similar public health threats, recessions, or other events could have a significant impact on investments. Growth stocks may be more volatile than other stocks as their prices tend to be higher in relation to their companies’ earnings and may be more sensitive to market, political, and economic developments. A significant portion of assets may be invested in securities of companies in related sectors, and may be similarly affected by economic, political, or market events and conditions and may be more vulnerable to unfavorable sector developments. Foreign securities involve special risks including currency fluctuations, inefficient trading, political and economic instability, and increased volatility. Assets may be focused in a small number of holdings, making them susceptible to risks associated with a single economic, political or regulatory event than a more diversified portfolio. Active trading may increase transaction costs, brokerage commissions, and taxes, which can lower the return on investment. At times, the Fund may hold a large cash or cash equivalent position, which may underperform relative to equity securities.
Alger Mid Cap Growth Institutional Fund — Investing in the stock market involves risks, including the potential loss of principal. The value of these securities, like other investments, may move up or down, sometimes rapidly and unpredictably. Fund shares at any point in time may be worth less than what was invested, even after taking into account the reinvestment of Fund dividends and distributions. Local, regional or global events such as environmental or natural disasters, war, terrorism, pandemics, outbreaks of infectious diseases and similar public health threats, recessions, or other events could have a significant impact on investments. Growth stocks may be more volatile than other stocks as their prices tend to be higher in relation to their companies’ earnings and may be more sensitive to market, political, and economic developments. A significant portion of assets may be invested in securities of companies in related sectors, and may be similarly affected by economic, political, or market events and conditions and may be more vulnerable to unfavorable sector developments. Investing in companies of medium capitalizations involves the risk that such issuers may have limited product lines or financial resources, lack management depth, or have limited liquidity. Foreign securities involve special risks including currency fluctuations, inefficient trading, political and economic instability, and increased volatility. Active trading may increase transaction costs, brokerage commissions, and taxes, which can lower the return on investment. At times, the Fund may hold a large cash or cash equivalent position, which may underperform relative to equity securities.
Alger Small Cap Growth Institutional Fund — Investing in the stock market involves risks, including the potential loss of principal. The value of these securities, like other investments, may move up or down, sometimes rapidly and unpredictably. Fund shares at any point in time may be worth less than what was invested, even after taking into account the reinvestment of Fund dividends and
THE ALGER INSTITUTIONAL FUNDSNOTES TO FINANCIAL STATEMENTS (Continued)
distributions. Local, regional or global events such as environmental or natural disasters, war, terrorism, pandemics, outbreaks of infectious diseases and similar public health threats, recessions, or other events could have a significant impact on investments. Growth stocks may be more volatile than other stocks as their prices tend to be higher in relation to their companies’ earnings and may be more sensitive to market, political, and economic developments. A significant portion of assets may be invested in securities of companies in related sectors, and may be similarly affected by economic, political, or market events and conditions and may be more vulnerable to unfavorable sector developments. Investing in companies of small and medium capitalizations involves the risk that such issuers may have limited product lines or financial resources, lack management depth, or have limited liquidity. Foreign securities involve special risks including currency fluctuations, inefficient trading, political and economic instability, and increased volatility. At times, the Fund may hold a large cash or cash equivalent position, which may underperform relative to equity securities.
NOTE 11 — Affiliated Securities:
During the year ended October 31, 2024, as disclosed in the following table, certain Funds held 5% or more of the outstanding voting securities of the issuers listed below. As such, these issuers were “affiliated persons” of the applicable Fund(s) for purposes of the 1940 Act. Transactions during the year ended October 31, 2024 with such affiliated persons are summarized below. During this year, other Funds in the Trust may also have held voting shares of the issuers at levels below 5%.
| Shares
Held at
October 31,
2023 | | | Shares
Held at
October 31,
2024 | | | Net Change
in
Unrealized
App (Dep) | |
Alger Capital Appreciation Institutional Fund |
|
| | | | | | | | |
| | | | | | | | |
| Shares
Held at
October 31,
2023 | | | Shares
Held at
October 31,
2024 | | | Net Change
in
Unrealized
App (Dep) | |
|
|
| | | | | | | | |
| | | | | | | | |
THE ALGER INSTITUTIONAL FUNDSNOTES TO FINANCIAL STATEMENTS (Continued)
| Shares
Held at
October 31,
2023 | | | Shares
Held at
October 31,
2024 | | | Net Change
in
Unrealized
App (Dep) | |
Alger Mid Cap Growth Institutional Fund |
|
| | | | | | | | |
|
| | | | | | | | |
| | | | | | | | |
| | | | | | | | |
| Shares
Held at
October 31,
2023 | | | Shares
Held at
October 31,
2024 | | | Net Change
in
Unrealized
App (Dep) | |
Alger Small Cap Growth Institutional Fund |
|
| | | | | | | | |
|
| | | | | | | | |
| | | | | | | | |
| | | | | | | | |
| The Alger Fund Complex and other entities managed by Alger Management fully own Crosslink Ventures C, LLC, Class A and Crosslink Ventures C, LLC, Class B. There were no capital increases or decreases for the year ended October 31, 2024. |
| Prosetta Biosciences, Inc. Series D is no longer to be deemed an affiliate of the Funds because the Funds and Prosetta Biosciences Inc., Series D is no longer under common control. |
NOTE 12 — Subsequent Events:
Alger Management of each Fund has evaluated events that have occurred subsequent to October 31, 2024, through the issuance date of the Financial Statements. No material events have been identified which require recognition and/or disclosure.
REPORT OF INDEPENDENT REGISTERED PUBLIC ACCOUNTING FIRM
To the Shareholders and the Board of Trustees of The Alger Institutional Funds:
Opinion on the Financial Statements and Financial Highlights
We have audited the accompanying statements of assets and liabilities of The Alger Institutional Funds comprised of Alger Capital Appreciation Institutional Fund, Alger Focus Equity Fund, Alger Mid Cap Growth Institutional Fund, and Alger Small Cap Growth Institutional Fund (collectively, the “Funds”), including the schedules of investments, as of October 31, 2024, the related statements of operations for the year then ended, the statements of changes in net assets for each of the two years in the period then ended, the financial highlights for each of the five years in the period then ended and the related notes. In our opinion, the financial statements and financial highlights present fairly, in all material respects, the financial position of each of the funds constituting The Alger Institutional Funds as of October 31, 2024, and the results of their operations for the year then ended, the changes in their net assets for each of the two years in the period then ended, and the financial highlights for each of the five years in the period then ended in conformity with accounting principles generally accepted in the United States of America.
These financial statements and financial highlights are the responsibility of the Funds' management. Our responsibility is to express an opinion on the Funds' financial statements and financial highlights based on our audits. We are a public accounting firm registered with the Public Company Accounting Oversight Board (United States) (PCAOB) and are required to be independent with respect to the Funds in accordance with the U.S. federal securities laws and the applicable rules and regulations of the Securities and Exchange Commission and the PCAOB.
We conducted our audits in accordance with the standards of the PCAOB. Those standards require that we plan and perform the audit to obtain reasonable assurance about whether the financial statements and financial highlights are free of material misstatement, whether due to error or fraud. The Funds are not required to have, nor were we engaged to perform, an audit of their internal control over financial reporting. As part of our audits we are required to obtain an understanding of internal control over financial reporting but not for the purpose of expressing an opinion on the effectiveness of the Funds' internal control over financial reporting. Accordingly, we express no such opinion.
Our audits included performing procedures to assess the risks of material misstatement of the financial statements and financial highlights, whether due to error or fraud, and performing procedures that respond to those risks. Such procedures included examining, on a test basis, evidence regarding the amounts and disclosures in the financial statements and financial highlights. Our audits also included evaluating the accounting principles used and significant estimates
REPORT OF INDEPENDENT REGISTERED PUBLIC ACCOUNTING FIRM
made by management, as well as evaluating the overall presentation of the financial statements and financial highlights. Our procedures included confirmation of securities owned as of October 31, 2024, by correspondence with the custodian and brokers; when replies were not received from brokers, we performed other auditing procedures. We believe that our audits provide a reasonable basis for our opinion.
/s/ Deloitte & Touche LLP
We have served as the auditor of one or more investment companies within the Alger group of investment companies since 2009.
THE ALGER INSTITUTIONAL FUNDSOTHER INFORMATION (Unaudited)
Tax information
Alger Capital Appreciation Institutional Fund designates $159,723,043 as approximate amounts of capital gain dividend for the purpose of the dividends paid deduction. In accordance with subchapter M of the Internal Revenue Code of 1986, as amended, for the year ended October 31, 2024, 36.31% of Alger Capital Appreciation Institutional Fund's,100.00% of Alger Focus Equity Fund's and 11.82% of Alger Small Cap Institutional Fund's dividends qualified for the dividends deduction for corporations, respectively. For the year ended October 31, 2024, certain dividends paid by the Funds may be subject to a maximum rate of 15%, as provided by the Jobs and Growth Tax Relief Reconciliation Act of 2003. Of the distributions paid during the fiscal year, 41.24%, 100.00% and 12.04% of Alger Capital Appreciation Institutional Fund, Alger Focus Equity Fund and Alger Small Cap Growth Institutional Fund's dividends may be considered qualified dividend income, respectively.
Shareholders should not use the above information to prepare their tax returns. Since the Funds' fiscal year is not the calendar year, another notification will be sent with respect to calendar year 2024. Such notification, which will reflect the amount to be used by tax payers on their federal income tax returns, will be made in conjunction with Form 1099 DIV and will be mailed in January 2025. Shareholders are advised to consult their own tax advisers with respect to the tax consequences of their investment in a Fund.
THE ALGER INSTITUTIONAL FUNDSOTHER INFORMATION (Unaudited) (Continued)
Proxy Voting Policies
A description of the policies and procedures the Funds use to determine how to vote proxies relating to portfolio securities and the proxy voting record is available, without charge, by calling (800) 992-3863 or online on the Funds' website at http://www.alger.com or on the SEC’s website at http://www.sec.gov.
The Board has adopted policies and procedures relating to disclosure of the Funds' portfolio securities. These policies and procedures recognize that there may be legitimate business reasons for holdings to be disclosed and seek to balance those interests to protect the proprietary nature of the trading strategies and implementation thereof by the Funds.
Generally, the policies prohibit the release of information concerning portfolio holdings, which have not previously been made public, to individual investors, institutional investors, intermediaries that distribute the Funds' shares and other parties which are not employed by the Investment Manager or its affiliates except when the legitimate business purposes for selective disclosure and other conditions (designed to protect the Funds) are acceptable.
The Funds file their complete schedules of portfolio holdings with the SEC semi-annually in shareholder reports on Form N-CSR and after the first and third fiscal quarters as an exhibit to its reports on Form N-PORT. The Funds' Forms N-CSR and N-PORT are available online on the SEC’s website at www.sec.gov.
In addition, the Funds make publicly available their month-end top 10 holdings with a 10 day lag and their month-end full portfolio with a 60 day lag on their website www.alger.com and through other marketing communications (including printed advertising/sales literature and/or shareholder telephone customer service centers). No compensation or other consideration is received for the non-public disclosure of portfolio holdings information.
In accordance with the foregoing, the Funds provide portfolio holdings information to third parties including financial intermediaries and service providers who need access to this information in the performance of their services and are subject to duties of confidentiality (1) imposed by law, including a duty not to trade on non-public information, and/or (2) pursuant to an agreement that confidential information is not to be disclosed or used (including trading on such information) other than as required by law. From time to time, the Funds will communicate with these third parties to confirm that they understand the Funds' policies and procedures regarding such disclosure. These agreements must be approved by the Trust's Chief Compliance Officer.
The Board periodically reviews a report disclosing the third parties to whom each Fund's holdings information has been disclosed and the purpose for such
THE ALGER INSTITUTIONAL FUNDSOTHER INFORMATION (Unaudited) (Continued)
disclosure, and it considers whether or not the release of information to such third parties is in the best interest of the Funds and its shareholders.
In addition to material the Funds routinely provides to shareholders, the Investment Manager may make additional statistical information available regarding the Alger Family of Funds.
Such information may include, but not be limited to, relative weightings and characteristics of the a Fund versus an index (such as P/E ratio, alpha, beta, capture ratio, maximum drawdown, standard deviation, EPS forecasts, Sharpe ratio, information ratio, R-squared, and market cap analysis), security specific impact on overall portfolio performance, month-end top ten contributors to and detractors from performance, portfolio turnover, and other similar information. Shareholders should visit www.alger.com or may also contact the Funds at (800) 992-3863 to obtain such information.
THE ALGER INSTITUTIONAL FUNDS
100 Pearl Street, 27th Floor
New York, NY 10004
(800) 992-3863
www.alger.com
Fred Alger Management, LLC
100 Pearl Street, 27th Floor
New York, NY 10004
Fred Alger & Company, LLC
100 Pearl Street, 27th Floor
New York, NY 10004
Transfer Agent and Dividend Disbursing Agent
UMB Fund Services, Inc.
235 W. Galena Street
Milwaukee, WI 53212
The Bank of New York
240 Greenwich Street
New York, NY 10286
Independent Registered Public Accounting Firm
Deloitte & Touche LLP
30 Rockefeller Plaza
New York, NY 10112
This report is submitted for the general information of the shareholders of the series of The Alger Institutional Funds. It is not authorized for distribution to prospective investors unless accompanied by an effective Prospectus for the Fund, which contains information concerning the Fund’s investment policies, fees and expenses as well as other pertinent information.
Inspired by Change, Driven by Growth.
Item 8. Changes in and Disagreements with Accountants for Open-End Management Investment Companies
Item 9. Proxy Disclosures for Open-End Management Investment Companies
The Alger Institutional Funds – Proxy Results
A special meeting of shareholders was held on August 16, 2024, for shareholders of record as of June 13, 2024, to elect Trustees to the Trust’s Board.
Shareholders approved the Trustees* as follows:
* Denotes Trust-wide proposal and voting results.
The other Trustees of the Trust had previously been elected by shareholders and, therefore, were not seeking election at the special meeting. These Trustees are Hilary M. Alger, Charles F. Baird, Jr., and Nathan E. Saint-Amand.
Item 10. Remuneration Paid to Directors,Officers, and Others of Open-End Management Investment Companies
Remuneration paid to directors, officers and others is included in the Statementof Operations under the line items “Trustee fees” and “Investment advisory fees”as part of the financial statements filed under Item 7 of this Form N-CSR.
Item 11. Statement Regarding Basis for Approval of Investment Advisory Contract
BOARD APPROVAL OF INVESTMENT ADVISORY AGREEMENT
At a meeting held on September 17, 2024 (the “Meeting”), the Board of Trustees (the “Board”) of The Alger Institutional Funds (the “Trust”), including a majority of the trustees who are not “interested persons” (as defined in the Investment Company Act of 1940, as amended) of the Trust (the “Independent Trustees”), reviewed and approved the continuation of the investment advisory agreement between Fred Alger Management, LLC (“Alger” or the “Manager”) and the Trust, on behalf of Alger Capital Appreciation Institutional Fund, Alger Focus Equity Fund, Alger Mid Cap Growth Institutional Fund and Alger Small Cap Growth Institutional Fund, (each, a “Fund”), (the “Management Agreement”), for an additional one-year period.
In considering the continuation of the Management Agreement, the Board reviewed and considered information provided by the Manager and its representatives at the Meeting and throughout the year at meetings of the Board and its committees. The Board also reviewed and considered information the Manager provided in response to a request for information Independent Trustee counsel submitted to the Manager on behalf of the Independent Trustees in connection with the Board’s annual contract consideration, as well as information provided in response to a supplemental request from Independent Trustee counsel on behalf of the Independent Trustees. The materials for the Meeting included reports that included extensive analyses of the Funds and the Manager from FUSE Research Network LLC (“FUSE”), an independent consulting firm. The Board also received a presentation from FUSE representatives at the Meeting and, among other things, received a description of the methodology FUSE used to select the mutual funds included in each Fund’s Peer Universe and Peer Group (as described below). At a prior meeting held on September 3, 2024, the Independent Trustees met with representatives from FUSE to discuss an overview and the methodology of the reports prepared by FUSE.
The Independent Trustees received advice from, and met separately with, their Independent Trustee counsel in considering whether to approve the continuation of the Management Agreement. The Independent Trustees also received a memorandum from Independent Trustee counsel discussing the legal standards and their duties in considering the continuation of the Management Agreements, and counsel reviewed those standards with the Independent Trustees during their separate meeting. The Independent Trustees also met separately with senior management of Alger, during which time the Independent Trustees discussed various matters related to proposed continuation of the Management Agreements.
The Board reviewed the materials provided and considered all of the factors it deemed relevant in approving the continuance of the Management Agreement, including, but not limited to: (i) the nature, extent and quality of the services provided by the Manager; (ii) the short- and long-term investment performance of
Item 11. Statement Regarding Basis for Approval of Investment Advisory Contract
each Fund; (iii) the costs of the services the Manager provided and profits it realized; (iv) the extent to which the Manager realizes economies of scale as a Fund grows; and (v) whether fee levels reflect these economies of scale for the benefit of Fund shareholders. The Board did not identify any one factor as dispositive, and each Board member may have attributed different weights to the factors considered. The Board considered the information provided to it about the Funds together, and with respect to each Fund separately, as the Board deemed appropriate.
In the discussions that follow, reference is made to the “median” in the Peer Group and Peer Universe categories. With respect to performance, below median performance represents performance that is worse relative to the median, and above median performance represents performance that is better relative to the median of the funds in the relevant Performance Universe. With respect to expenses, below median fees or expenses represent fees or expenses that are lower relative to the median, and above median fees or expenses represent fees or expenses that are higher relative to the median of the funds in the relevant Expense Group (as described below). FUSE information is calculated on a share class basis. References appearing below with regard to a Fund’s performance results and comparative fees and expenses generally relate to Class I shares of the Fund (each Fund’s oldest share class).
In particular, in approving the continuance of the Management Agreement, the Board considered the following factors:
Nature, Extent and Quality of Services
The Board reviewed and considered information regarding the nature, extent and quality of investment management services provided by the Manager to the Funds. This information included, among other things, the qualifications, background and experience of the professional personnel who perform services for the Funds; the structure of investment professional compensation; oversight of third-party service providers; short- and long-term investment performance, fee and expense information; fees and payments to affiliates and intermediaries for fund administration, transfer agency and shareholder services; legal and compliance matters; risk controls; pricing and other services provided by the Manager; and the range of advisory fees the Manager charges to other funds and accounts under its management, including the Manager’s explanation of differences among such funds and accounts and the Funds, where relevant. The Board noted that it received information at regular meetings throughout the year regarding the services rendered by the Manager concerning the management of each Fund’s affairs, including certain portfolio manager presentations, and Alger’s role in coordinating and overseeing providers of other services to the Funds. The Board also noted the work undertaken by the Manager with respect to implementing new regulatory requirements applicable to the Funds.
Item 11. Statement Regarding Basis for Approval of Investment Advisory Contract
The Board noted Alger’s history and expertise in the “growth” style of investment management, as well as Alger’s consistency in applying its “growth” style investment philosophy and process. The Board noted the length of time the Manager has provided services as an investment adviser to each Fund.
The Board also reviewed and considered the benefits provided to Fund shareholders of investing in a Fund that is part of the Alger Family of Funds. The Board noted the continuing strong financial position of the Manager and its commitment to its fund, and overall, business.
Following consideration of such information, the Trustees determined that they remain satisfied with the nature, extent and quality of services provided by the Manager to the Funds under the Management Agreement.
The Board reviewed and considered the performance results of each Fund over various time periods ended June 30, 2024. The Board considered the performance returns for each Fund in comparison to the performance returns of a universe of mutual funds deemed comparable to the Fund based on various investment, operational, and pricing characteristics (“Peer Universe”), and a group of mutual funds from within such Peer Universe deemed comparable to the Fund based primarily on investment strategy similarity (“Peer Group”), each as selected by FUSE, as well as to the Fund’s benchmark index. The Board noted the Manager’s statement that long-term performance could be impacted by one period of significant outperformance or underperformance.
The Board also reviewed and considered Fund performance reports provided by management and discussions that occurred with investment personnel and Alger senior management at Board meetings throughout the year. The Board further noted that representatives of Alger review with the Trustees the recent and longer-term performance of each Fund, including contributors to, and detractors from, Fund performance at every quarterly meeting of the Board throughout the year. In considering the Funds’ performance generally, the Board observed the Manager’s consistency in implementing its growth style investment process and philosophy for the Funds and considered how a strategy’s “growthiness” as compared to peers can impact relative performance results, even among comparisons that either FUSE or the Manager already have identified as having growth characteristics. In this regard, the Board considered information provided by FUSE on a Fund’s “style factor,” reflecting a three-year average of Morningstar's Raw Growth-Value score to indicate a value or growth bias as compared to the Fund’s Peer Group and benchmark.
The Trustees concluded that each Fund’s performance was acceptable, noting their discussions with senior management of Alger related to Fund performance and the factors that impacted Fund performance, where applicable. Further
Item 11. Statement Regarding Basis for Approval of Investment Advisory Contract
discussion of the Board’s considerations with respect to each Fund’s performance is set forth below.
Alger Capital Appreciation Institutional Fund. The Board noted that the Fund’s annualized total return for the one-, three-, five-, and 10-year periods outperformed the median of its Peer Group. The Board also noted that the Fund’s annualized total return for the one-year period was in the first quartile of its Peer Universe and for the three-, five-, and 10-year periods was in the second quartile of its Peer Universe.
Alger Focus Equity Fund. The Board noted that the Fund’s annualized total return for the one-, three-, five-, and 10-year periods outperformed the median of its Peer Group. The Board also noted that Fund’s annualized total return for the one-, five-, and 10-year periods was in the first quartile of its Peer Universe, and for the three-year period was in the second quartile of its Peer Universe.
Alger Mid Cap Growth Institutional Fund. The Board noted that the Fund’s annualized total return for the one-, three-, and five-year periods underperformed the median of its Peer Group, and for the 10-year period outperformed the median of its Peer Group. The Board also noted that the Fund’s annualized total return for the one-year period was in the second quartile of its Peer Universe, for the three-year period was in the fourth quartile of its Peer Universe, and for the five- and 10-year periods was in the third quartile of its Peer Universe. In this regard, the Board considered FUSE’s commentary that the Fund is among the “growthiest” funds in its Peer Universe and that there was a direct correlation to outperformance for mid cap growth funds with a lower growth style factor.
Alger Small Cap Growth Institutional Fund. The Board noted that the Fund’s annualized total return for the one-, three-, five-, and 10-year periods underperformed the median of its Peer Group. The Board also noted that the Fund’s annualized total return for the one-year period was in the third quartile of its Peer Universe and for the three-, five-, and 10-year periods was in the fourth quartile of its Peer Universe. The Board considered FUSE’s commentary that (i) sector bets and a growth bias contributed to the Fund’s underperformance and (ii) during the last three years, the Fund ranked above average in terms of “growthiness” among its peers and funds with a lower growth bias have outperformed peers during the last three years. The Board further considered its discussions with senior management of Alger related to the Fund’s performance and the factors that impacted the Fund’s performance.
Comparative Fees and Expenses
For each Fund, the Board reviewed and considered the contractual management fee (the “Contractual Management Fee”) payable by the Fund to Alger in light of the nature, extent and quality of the services provided by Alger pursuant to the Management Agreement and considered the actual fee rate (after taking any waivers and reimbursements into account) payable by the Fund (the “Actual
Item 11. Statement Regarding Basis for Approval of Investment Advisory Contract
Management Fee”). The Board also reviewed and considered fee waiver and/or expense reimbursement arrangements for each Fund, and specific share classes thereof, as applicable, including representations from Alger that any such waivers and/or reimbursements do not, and are not currently expected to, result in cross-subsidization by one share class of another share class of a Fund. Additionally, the Board received and considered information comparing each Fund’s Contractual Management Fee, Actual Management Fee and overall expenses, including administrative fees payable to Alger, with those of the funds in the Peer Group provided by FUSE. The Board reviewed the methodology used by FUSE in calculating expense information, including that, for purposes of the comparisons below, the Contractual Management Fee used by FUSE for the Fund and peers includes the advisory fee and administrative fee (if a fund reports both). The Board considered limitations with respect to the comparative fee and expense information included in the reports prepared by FUSE, including that the reports reflected information for a specific period and that historical asset levels and expenses may differ from current levels.
The Board discussed the factors that could contribute to each Fund’s Contractual Management Fee, Actual Management Fee or total expenses being above or below the median of the Fund’s Peer Group, including, for example, the specialized nature of a Fund’s strategy. The Board concluded that the Contractual Management Fee charged to each Fund, is reasonable in relation to the services rendered by the Manager and is the product of arm’s length negotiations. Further discussion of the Board’s considerations with respect to each Fund’s comparative fees and expenses is set forth below.
Alger Capital Appreciation Institutional Fund. The Board noted that the Fund’s Contractual Management Fee and total expenses were above the median and in the fourth (most expensive) quartile of its Peer Group. In this regard, the Board considered the Fund’s top quartile performance.
Alger Focus Equity Fund. The Board noted that the Fund’s Contractual Management Fee and total expenses were below the median and in the first (least expensive) quartile of its Peer Group.
Alger Mid Cap Growth Institutional Fund. The Board noted that the Fund’s Contractual Management Fee and total expenses were above the median and in the third quartile and fourth (most expensive) quartile of its Peer Group, respectively. In this regard, the Board considered that the contractual advisory fee for the Fund was 0.01% above the median of its Peer Group.
Alger Small Cap Growth Institutional Fund. The Board noted that the Fund’s Contractual Management Fee was below the median and in the second quartile of its Peer Group, and that total expenses were above the median and in the fourth (most expensive) quartile of its Peer Group.
Item 11. Statement Regarding Basis for Approval of Investment Advisory Contract
In connection with its consideration of each Fund’s fees payable under the Management Agreement, the Board also received information on the range of fees charged by the Manager for funds and accounts of a similar investment strategy to each Fund that are under its management. The Board noted management’s explanation that comparisons with such accounts may be of limited relevance given the different structures and regulatory requirements of mutual funds, such as the Funds, versus those accounts and the differences in the levels of services required by the Funds as compared to those accounts.
The Board reviewed and considered information regarding the profits realized by Alger in connection with the operation of each Fund. In this respect, the Board considered overall profitability as well as the profits of Alger in providing investment management and other services to each Fund during the year ended June 30, 2024. The Board also reviewed the profitability methodology and any changes thereto, noting that management maintains a consistent methodology year to year. The Board considered FUSE’s view that Alger’s expense allocation policies are reasonable and align with accepted industry practices. The Board also reviewed Alger’s profitability in comparison to certain investment advisory peers, noting related limitations with respect to such comparison.
The Board also considered the extent to which the Manager might derive ancillary benefits from Fund operations, including, for example, through soft dollar arrangements. Based upon its consideration of all these factors, the Trustees concluded that the level of profits realized by Alger and its affiliates from providing services to each Fund was not excessive in view of the nature, extent and quality of services provided to each Fund.
For each Fund, the Board reviewed and considered the extent to which the Manager may realize economies of scale, if any, as the Fund grows larger and whether the Fund’s management fee structure reflects any economies of scale for the benefit of Fund shareholders. The Board noted the existence of management fee breakpoints for Alger Capital Appreciation Institutional Fund, Alger Mid Cap Growth Institutional Fund, and Alger Small Cap Growth Institutional Fund, which are designed to share economies of scale with a Fund’s shareholders by reducing the Fund’s effective management fees as the Fund grows in size. The Board considered the Manager’s view that the overall size of Alger allows it to realize other economies of scale, such as with office space, purchases of technology, and other general business expenses, including with respect to Funds that did not have management fee breakpoints.
The Trustees concluded that for each Fund, to the extent economies of scale may be realized by Alger, the benefits of such economies of scale would be
Item 11. Statement Regarding Basis for Approval of Investment Advisory Contract
shared with the Fund and its shareholders as the Fund grows, including through the management fee breakpoints in place for applicable Funds.
The Board’s consideration of the Management Agreement for each Fund also had the benefit of a number of years of reviews of the Management Agreement, during which lengthy discussions took place between the Board and representatives of the Manager. Certain aspects of the arrangements may receive greater scrutiny in some years than in others, and the Board’s conclusions may be based, in part, on its consideration of the Fund’s arrangements in prior years.
Based on its review, consideration and evaluation of all factors it believed relevant, including the above-described factors and conclusions, the Board, including the Independent Trustees voting separately, unanimously approved the continuation of the Management Agreement for an additional one-year period.
ITEM 12. DISCLOSURE OF PROXY VOTING POLICIES AND PROCEDURES FOR CLOSED-END MANAGEMENT INVESTMENT COMPANIES.
Not applicable.
ITEM 13. PORTFOLIO MANAGERS OF CLOSED-END MANAGEMENT INVESTMENT COMPANIES.
Not applicable.
ITEM 14. PURCHASES OF EQUITY SECURITIES BY CLOSED-END MANAGEMENT INVESTMENT COMPANY AND AFFILIATED PURCHASERS.
Not applicable.
ITEM 15. SUBMISSION OF MATTERS TO A VOTE OF SECURITY HOLDERS.
There have been no material changes to these procedures.
ITEM 16. CONTROLS AND PROCEDURES.
(a) The Registrant’s principal executive officer and principal financial officer have concluded that the Registrant’s disclosure controls and procedures (as defined in Rule 30a-3(c) under the 1940 Act) are effective based on their evaluation of the disclosure controls and procedures as of a date within 90 days of the filing date of this document.
(b) There were no changes in the Registrant's internal control over financial reporting (as defined in Rule 30a-3(d) under the 1940 Act) that occurred during the period covered by this Form N-CSR, that have materially affected, or are reasonably likely to materially affect, the Registrant's internal control over financial reporting.
ITEM 17. DISCLOSURE OF SECURITIES LENDING ACTIVITIES FOR CLOSED-END MANAGEMENT INVESTMENT COMPANIES.
Not applicable.
ITEM 18. RECOVERY OF ERRONEOUSLY AWARDED COMPENSATION
Not applicable.
ITEM 19. EXHIBITS.
(a) (1) Code of Ethics
(a) (2) Not applicable.
(a) (3) Certifications required by Rule 30a-2(a) under the 1940 Act and Section 302 of the Sarbanes-Oxley Act of 2002 are filed as Exhibit 19(a)(3) to this Form N-CSR.
SIGNATURES
Pursuant to the requirements of the Securities Exchange Act of 1934 and the Investment Company Act of 1940, the registrant has duly caused this report to be signed on its behalf by the undersigned, thereunto duly authorized.
The Alger Institutional Funds
| By: | /s/ Hal Liebes | |
| Name: | Hal Liebes | |
| Title: | Principal Executive Officer | |
| Date: | December 19, 2024 | |
Pursuant to the requirements of the Securities Exchange Act of 1934 and the Investment Company Act of 1940, this report has been signed below by the following persons on behalf of the registrant and in the capacities and on the dates indicated.
| By: | /s/ Hal Liebes | |
| Name: | Hal Liebes | |
| Title: | Principal Executive Officer | |
| Date: | December 19, 2024 | |
| By: | /s/ Michael D. Martins | |
| Name: | Michael D. Martins | |
| Title: | Principal Financial Officer | |
| Date: | December 19, 2024 | |