 Analyst Day September 26, 2012 Exhibit 99.1 |
 Agenda 9:00 a.m. Welcome Paul Jones, Chairman & CEO Global Business Ajita Rajendra, President & COO Ashland City Plant Preview Steve Anderson, SVP Manufacturing & Supply Chain 9:55 a.m. Break 10:00 a.m. Ashland City tour 11:00 a.m. Global Manufacturing Steve Anderson Strategic Aspirations & Acquisitions Paul Jones Financial Aspirations John Kita, EVP & CFO 12:00 Noon Lunch 12:30 p.m. Depart for Lochinvar 1:30 p.m. Introduction to Lochinvar Bill Vallett, President, Lochinvar Tour Lochinvar plant 3:15 p.m. Wrap Up Paul Jones 2 |
 3 Forward Looking Statements This presentation contains statements that we believe are “forward-looking statements” within the meaning of the Private Securities Litigation Reform Act of 1995. Forward-looking statements generally can be identified by the use of words such as “may,” “will,” “expect,” “intend,” “estimate,” “anticipate,” “believe,” “continue,” “guidance”, or words of similar meaning. All statements regarding 2015 aspirations are forward-looking statements. These forward-looking statements are subject to risks and uncertainties that could cause actual results to differ materially from those anticipated as of the date of this presentation. Important factors that could cause actual results to differ materially from these expectations include, among other things, the following: difficulties in achieving the disclosed accretion from the Lochinvar acquisition, cost synergies or global expansion opportunities related to the acquisition; weakening in the high efficiency boiler segment in the U.S.; the ability to execute our acquisition strategy; significant volatility in raw material prices; competitive pressures on the company’s businesses; inability to implement pricing actions; instability in the company’s replacement markets; further weakening in U. S. residential and commercial construction; timing of any recoveries in U. S. residential or commercial construction; a slowdown in the Chinese economy; foreign currency fluctuations and adverse general economic conditions and capital market deterioration. Forward-looking statements included in this presentation are made only as of the date of this presentation, and the company is under no obligation to update these statements to reflect subsequent events or circumstances. All subsequent written and oral forward-looking statements attributed to the company, or persons acting on its behalf, are qualified entirely by these cautionary statements. |
 Investment Case Leader in water heaters In North America and China, platform to become leader in India Stable North American replacement market; operating leverage when new construction recovers Strong balance sheet and cash flow to support future growth Strength of our China distribution, manufacturing and brand provide clear market advantage in Asia Energy efficient products and new geographies are drivers for growth 4 |
 A. O. Smith History Founded in Milwaukee, Wisconsin (1874) A legacy of engineering excellence Commitment to integrity and ethical business conduct 5 |
 6 A. O. Smith History For over 134 years, A. O. Smith Corporation has grown through diversity, innovation and its steadfast commitment to the customer 1936 – Company patents process for glass lining water heater tanks 1950 – AOS introduces cathode protection for water heater tanks 1995 – AOS enters China 1997 – AOS sold automotive company for $775 million • Consolidator in water heaters; bought State and American • Consolidator in electric motors; bought five motor companies 2011 – AOS sold electric motor company for $890 million 2011 – AOS purchased Lochinvar for $418 million – the largest acquisition in company history |
 Global Business Strategy Ajita Rajendra, President and COO |
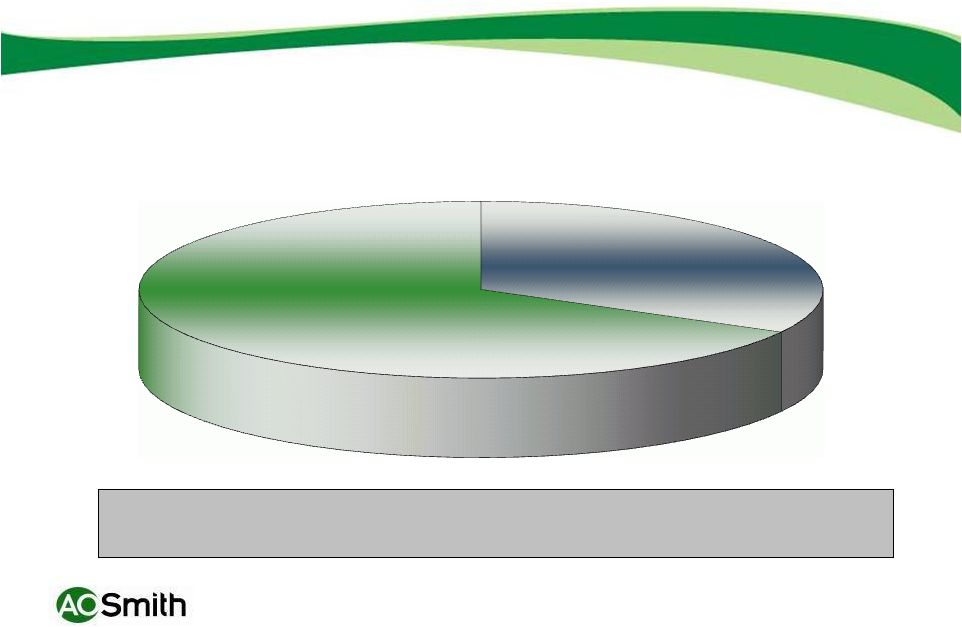
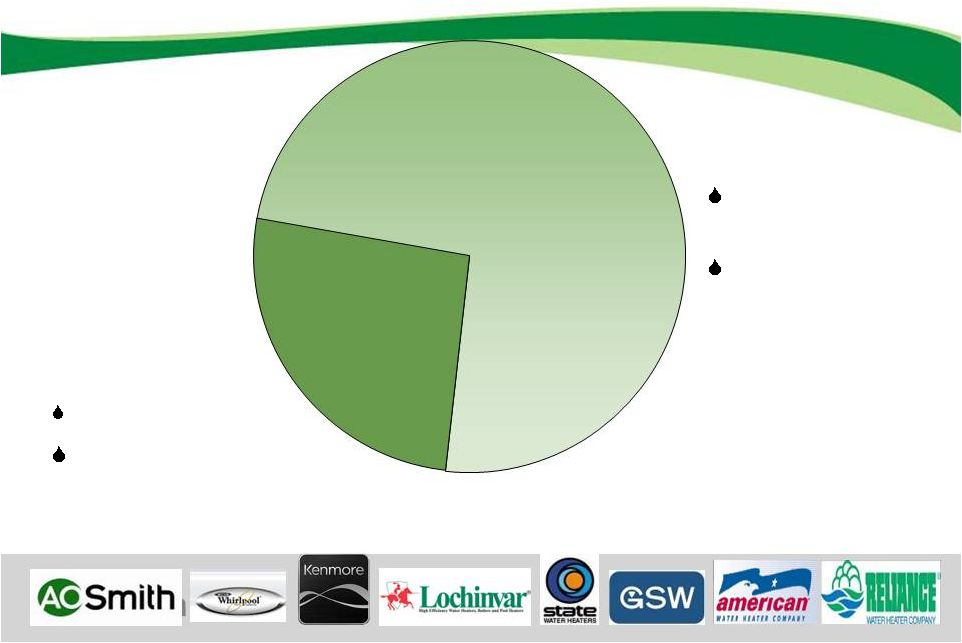 Segment Revenue ROW China/India = 91% Europe/Middle East = 9% NA 2012 Second Quarter North America 74% Rest of World 26% Largely stable replacement Lochinvar 10+% growth in 2012 |
 North America Residential 9 |
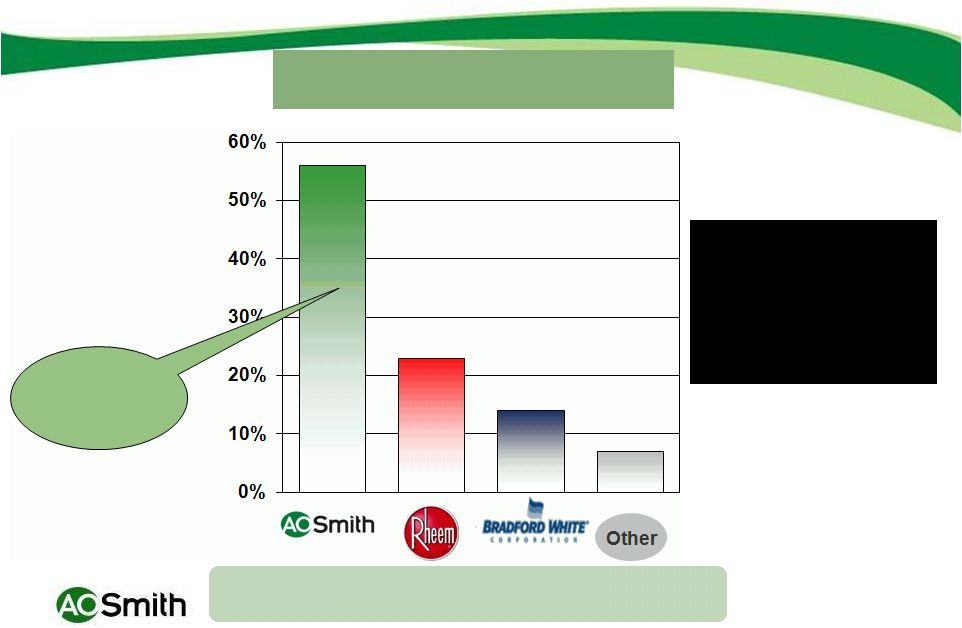
 U. S. Water Heater Market Segment Residential Market 0% 10% 20% 30% 40% 50% Includes Lochinvar pro forma AHRI data: AOS actual shipments and AOS estimates of competitors’ shipments 10 |
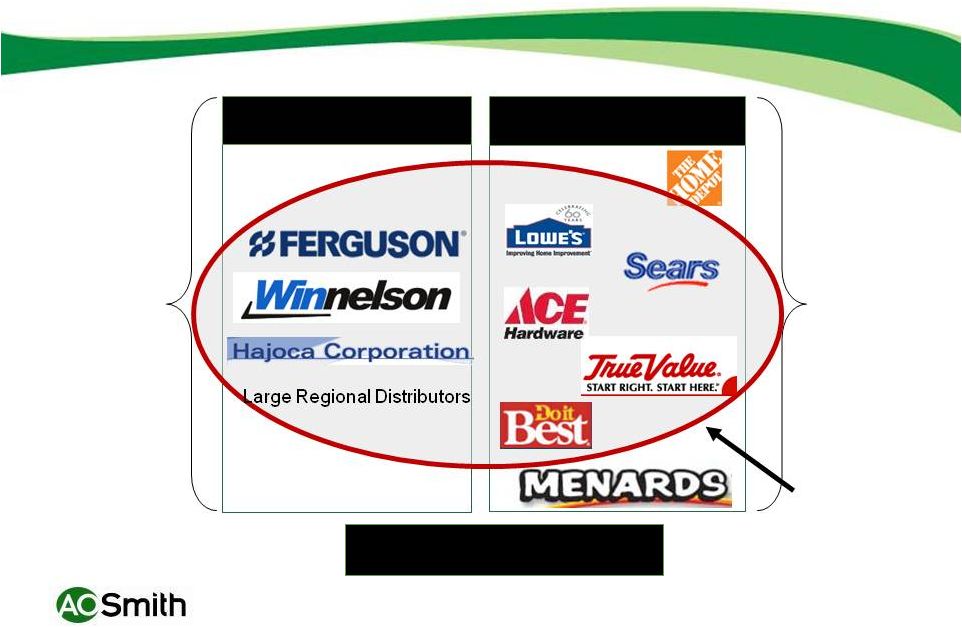 11 U.S. Residential Water Heater Market Segment 2011 – 8.1 mm Units Wholesale channel is “50%” of the market Retail channel is “50%” of the market A. O. Smith’s Customers Retail Wholesale |
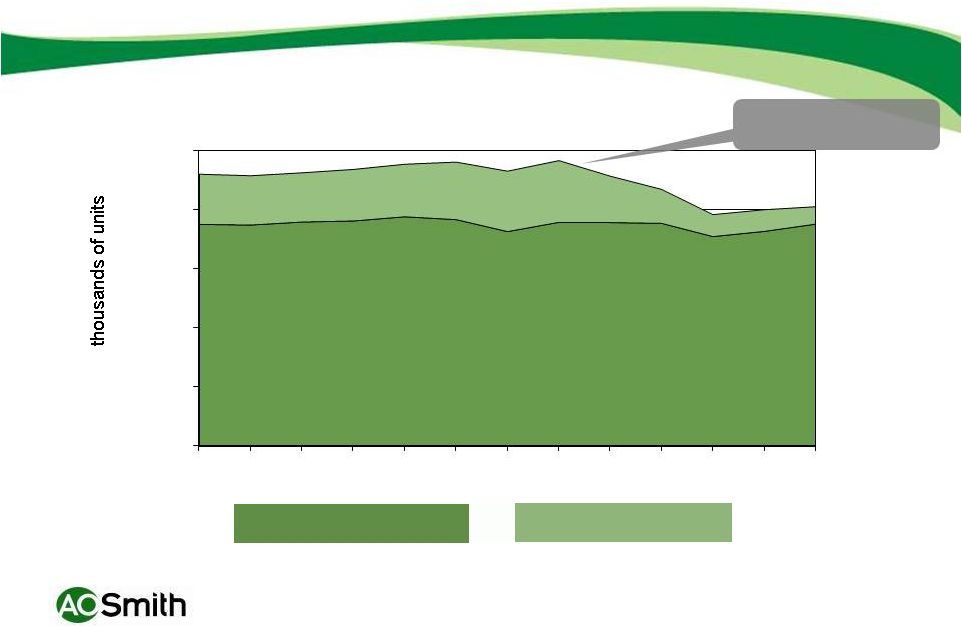 12 Water Heaters Strong Replacement Sales North American Residential Water Heaters Note: Includes tankless 0 2,000 4,000 6,000 8,000 10,000 1999 2000 2001 2002 2003 2004 2005 2006 2007 2008 2009 2010 2011 New Construction Replacement Peak housing starts: 2.1 million |
 13 North America Residential Strategic Priorities 2012 to 2015 Influence decision makers Nurture Key customer Enhance digital marketing Continue to emphasize lean manufacturing and continuous improvement programs |
 14 Brand Building – Sustained Investment New High Efficiency Products National Advertising Public Relations |
 15 Web Strategy Dominant visibility in search engines for our brands and downstream channel partners Cultivate positively impactful recommendations Inspire and facilitate visitor goals Drive measurable downstream value “Very Sleek Model & has great features” Discover New Products Find a Spec Sheet Drive leads to contractors |
 16 Social Media Strategy Retail - Reduce complaints, increase praise • Engage publicly. Resolve privately. Confirm publicly. • Cultivate and showcase positive reviews Goal: Improve published sentiment on Lowes.com & Google Wholesale - Increase awareness and preference • Publish blog on hotwater.com, syndicate to Facebook and Twitter • Post and Tweet about marketplace events • Goal: Encourage engagement, improve search engine rankings • Engage publicly. Resolve privately. Confirm publicly. |
 17 North America Commercial |
 18 U. S. Water Heater Market Segment Commercial Market* AHRI data: AOS actual shipments and AOS estimates of competitors’ shipments Includes Lochinvar pro forma *Commercial water heater segment as defined by AHRI, total 2011 commercial units as reported by AHRI = 145,000 |
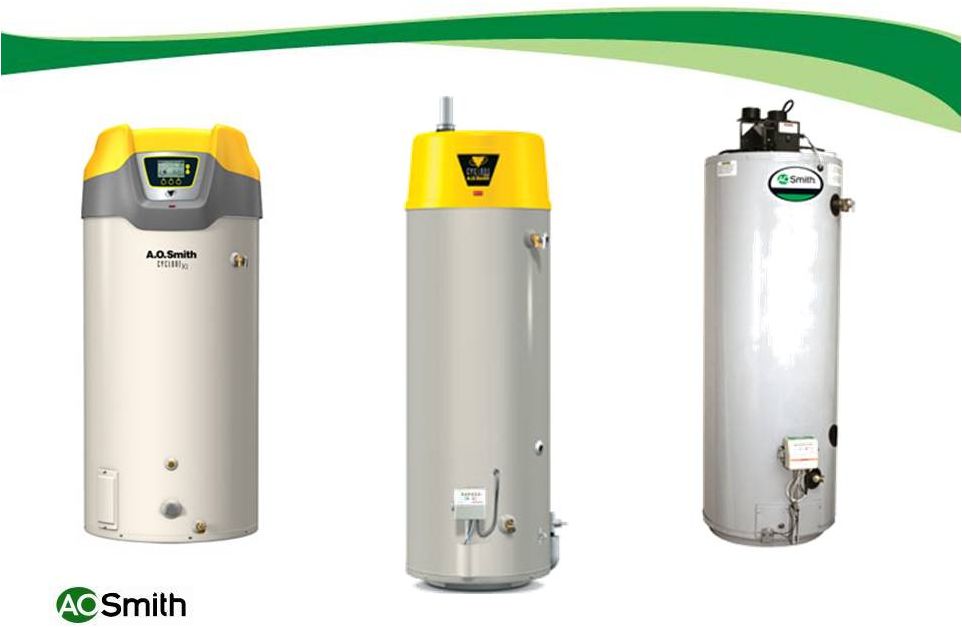
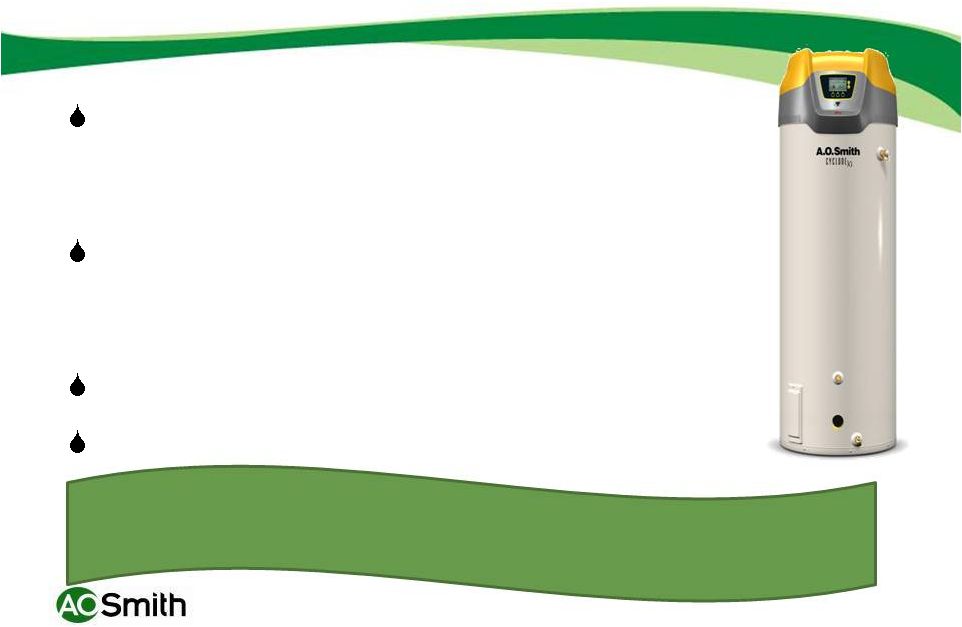 Energy Efficient Cyclone Game changing energy efficient commercial product launched in 1997 and upgraded frequently Up to 96% thermal efficiency dramatically lowers operating costs offering short payback Achieved 13% CAGR since its launch Represents 18% of AOS commercial units 19 Innovation, training and 24/7 National account customer service drive market leadership |
 20 North America Commercial Strategic Priorities 2012 to 2015 Sustain investment in high efficiency products and innovation leadership Develop delivery of hot water solutions Improve inventory and delivery programs Maintain technical and applications expertise |
 Lochinvar |
 Lochinvar 22 |
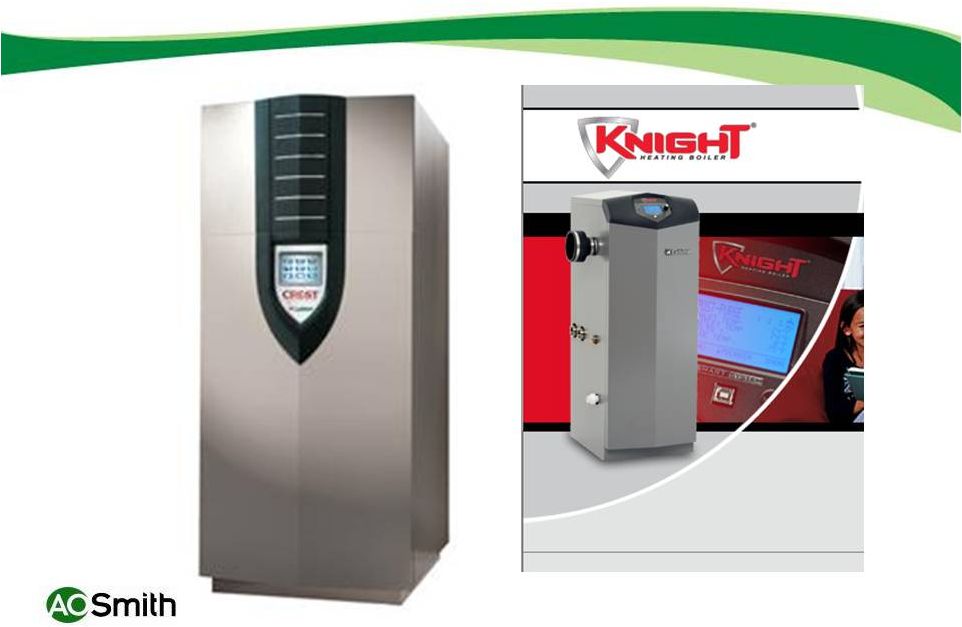
 Acquisition Fits Squarely within Strategic Objectives Core product expansion ~ Lochinvar: Complementary product line up to 3.5 million BTUs ~ Lochinvar: approximately 50% hydronic heating application and 50% other hot water applications Higher growth, energy efficient products ~ Leader in high efficiency condensing boilers ~ Trend to condensing technology underway in North America Geographic expansion Opportunities ~ China first on the list Geographic Expansion Core Product Expansion Adjacencies New Technologies 23 |
 24 Combination Creates Compelling Value Purchase price of $418 million plus earnout, paid in cash • 7.5 times adjusted EBITDA including tax benefits Lochinvar’s complementary product offerings are a logical expansion of AOS global water heating platform • One of the leading North American manufacturers of higher growth, higher efficiency, condensing boilers Synergies expected to be $10 to 15 million in the next few years: • Purchasing economies • Logistical economies • Global expansion opportunities Accretive and exceeded cost of capital in year 1 • $.07 per share in fourth quarter 2011, including one-time purchase accounting charges and professional fees • Expect incremental $.40 to $.50 per share in 2012 Global expansion opportunities; China first on the list |
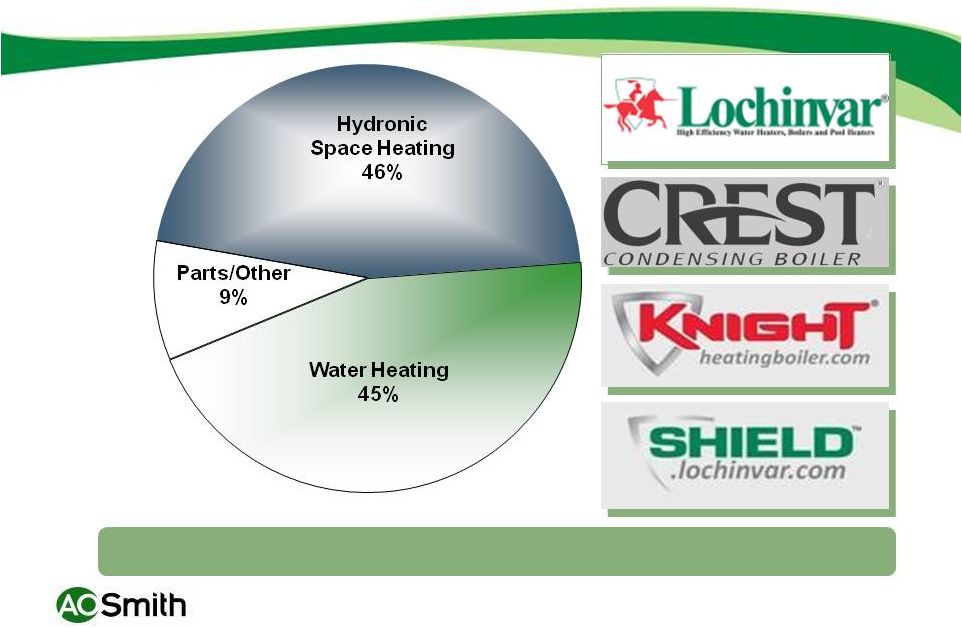 Lochinvar End Markets 2/3 commercial end markets; 1/3 residential end markets 25 |
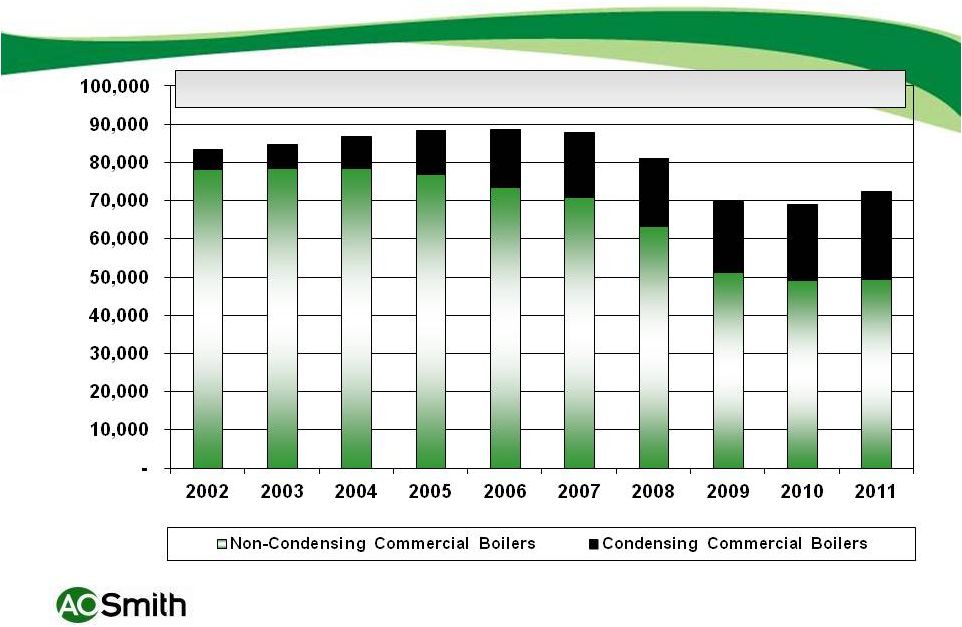 Trend to Higher Efficiency, Condensing Boilers Source: BRG North American Commercial Boiler Volume (Units) 26 |
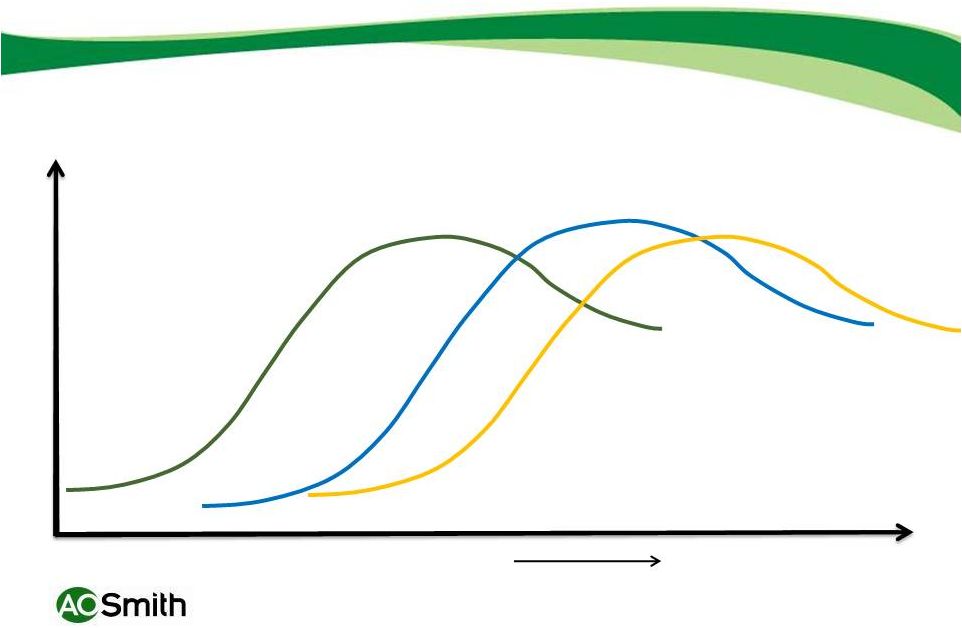 27 High Efficiency Portfolio Lifecycle U.S. Conversion to Condensing Technology Other Emerging Markets Time China High Efficiency Boilers x |
 28 Lochinvar Strategic Priorities 2012 to 2015 Sustain investment in innovation and technology leadership Further leverage training Continue to invest in new product development Maximize China boiler opportunity |
 China Water Heating 29 |
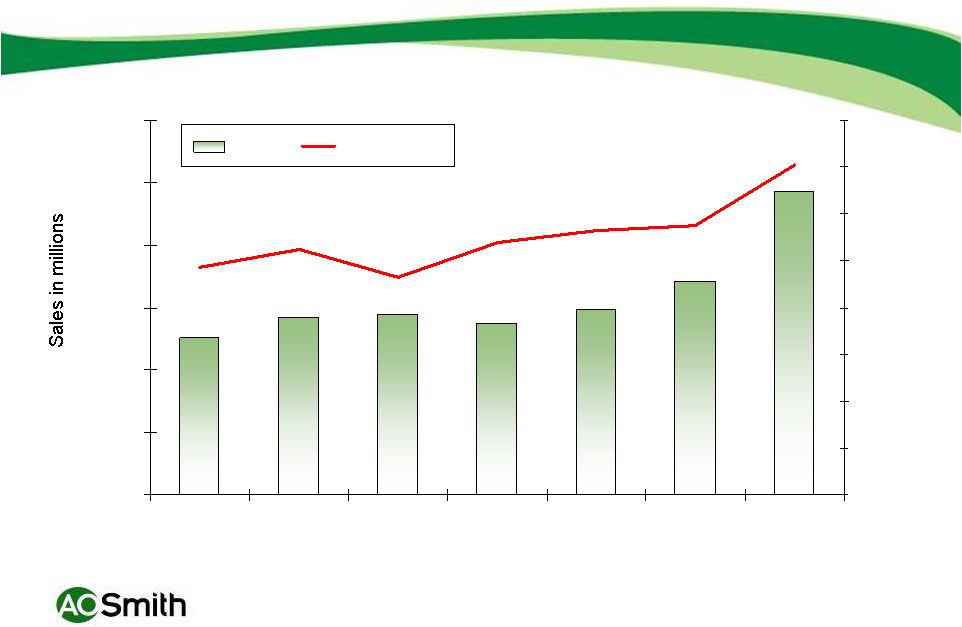
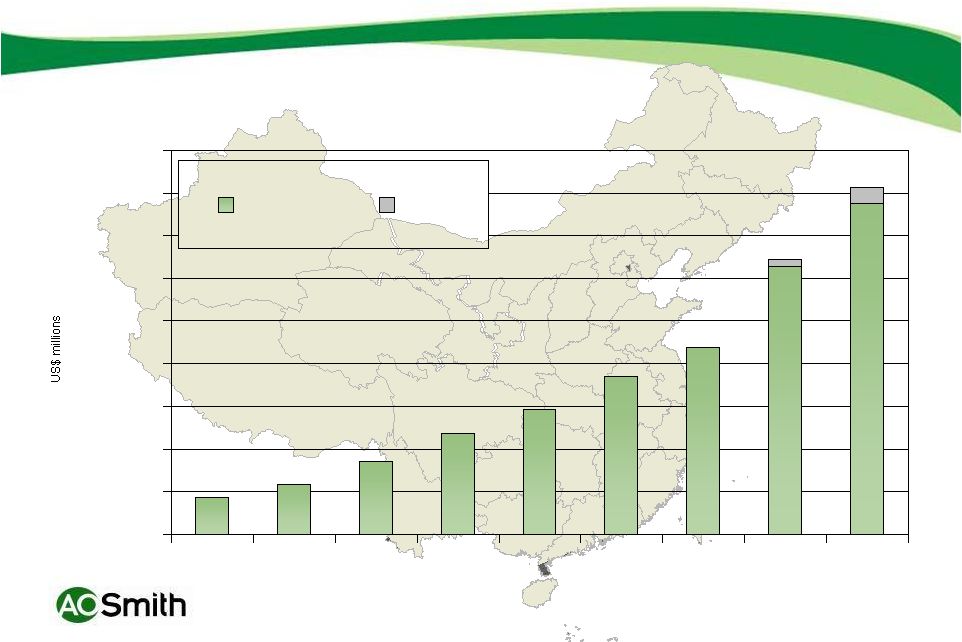 30 China/Asia now 24% of Sales & Growing China sales have grown over 25% (CAGR) over the last 9 years 0 50 100 150 200 250 300 350 400 450 2003 2004 2005 2006 2007 2008 2009 2010 2011 China India |
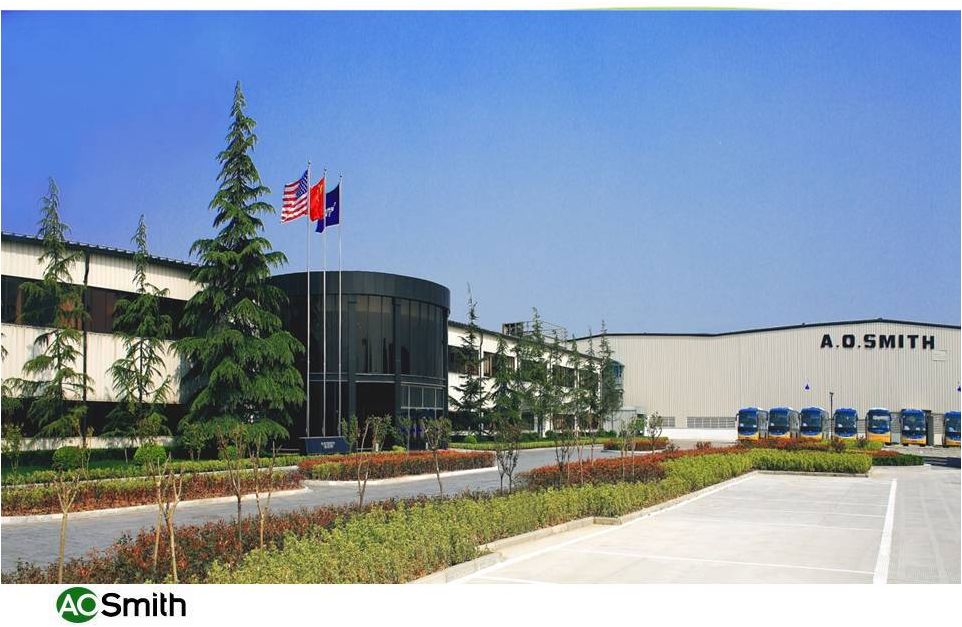
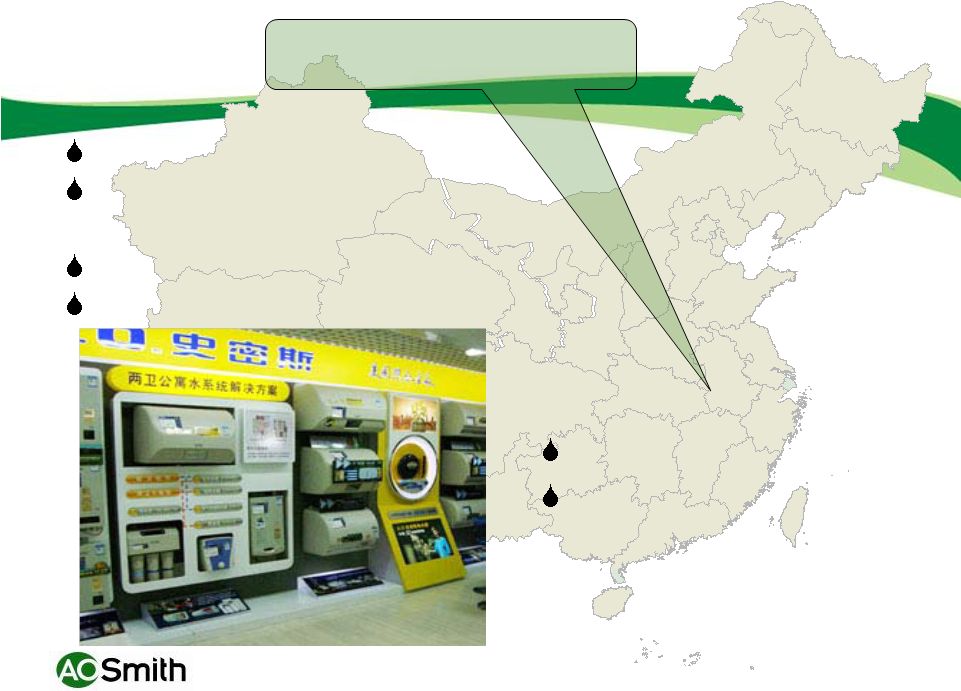 31 Nanjing, China Since 1995 Products designed for Chinese consumers Experienced Chinese managers Strong retail presence Consistently strong growth Second manufacturing site will increase capacity to 3 million units in 2014 (50% increase) |
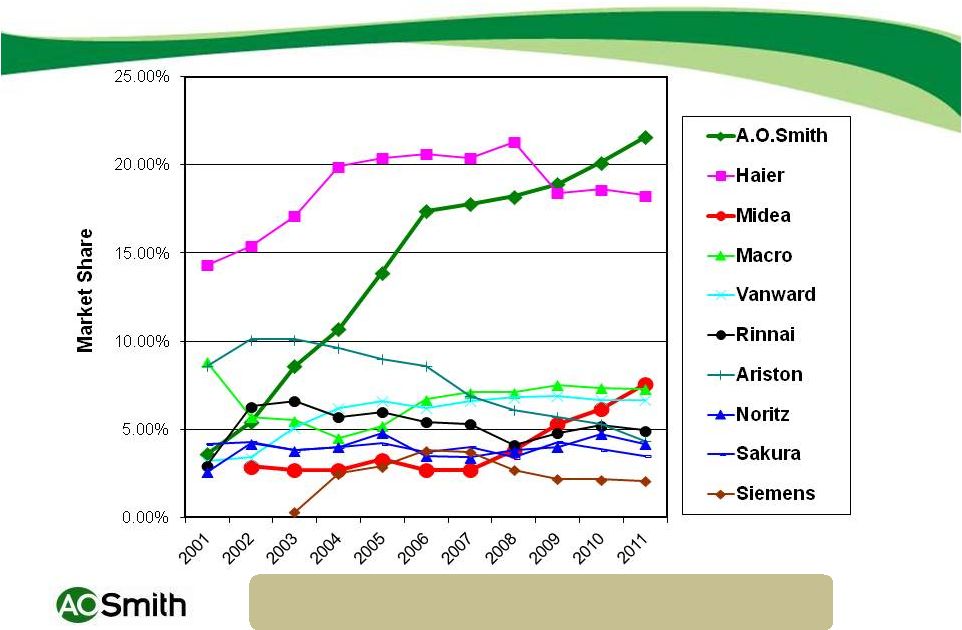 Leading residential brands measured in currency; Tier One Market: GFK - CMM data sampling several thousand largest retail stores Ten-Year Market Share Trend 32 |
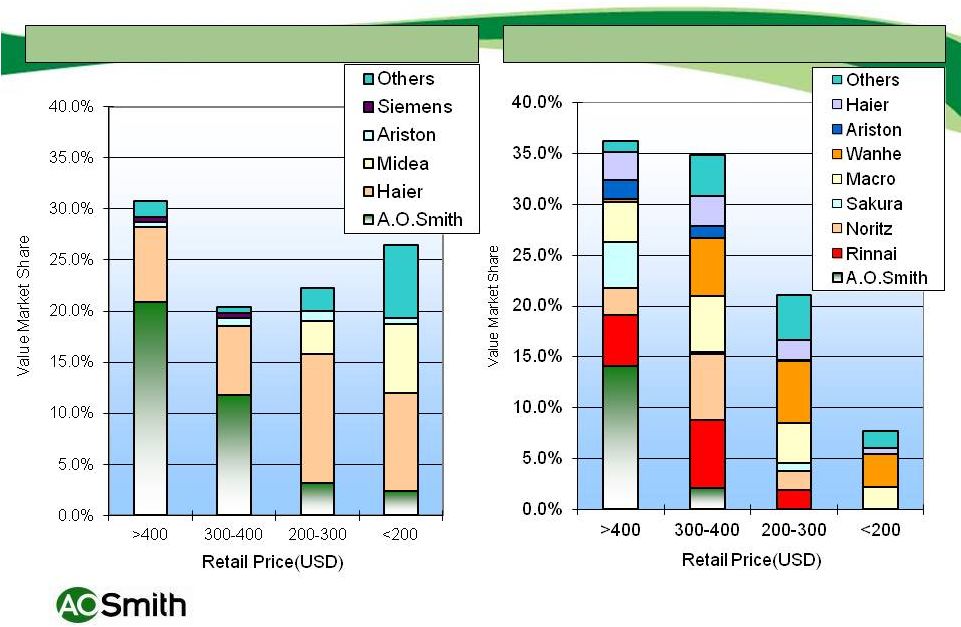 Data Source: CMM Retail Survey January 2012 -150 Best Selling Models Market Share by Price Category Electric Market Share Gas Market Share 33 |
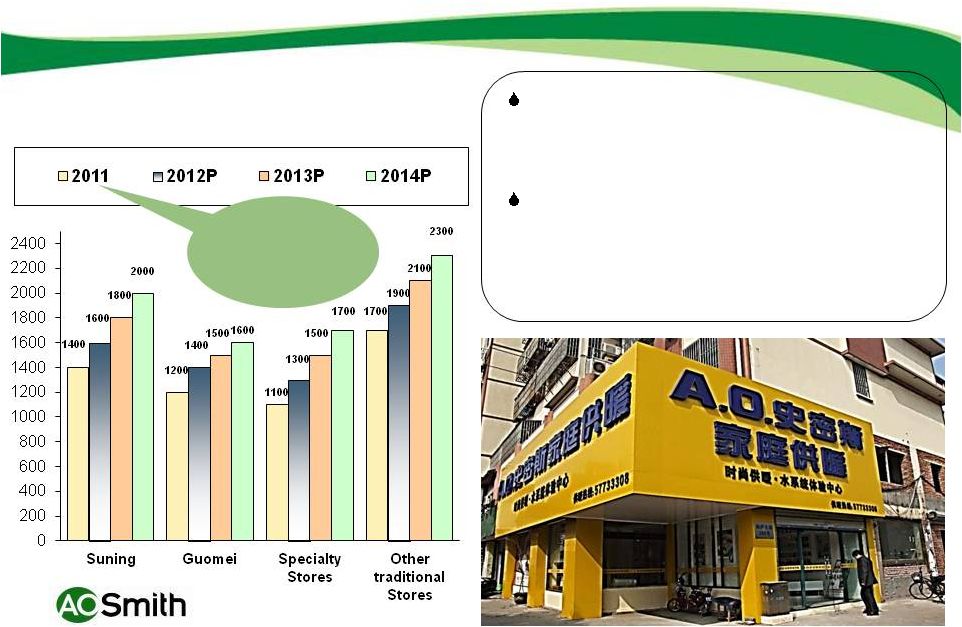 We are selling currently in 5,400 stores and plan to add 600 retail stores in 2012, largely in tier 2 cities. We have been assisting distributors to open A. O. Smith specialty stores. We plan to add 200 new stores each year, reaching 1,700 A. O. Smith stores at the end of 2014. Three Year Plan (AOS Presence) 2011 to 2014 Distribution Channel Expansion AOS selling in 5,400 outlets! |
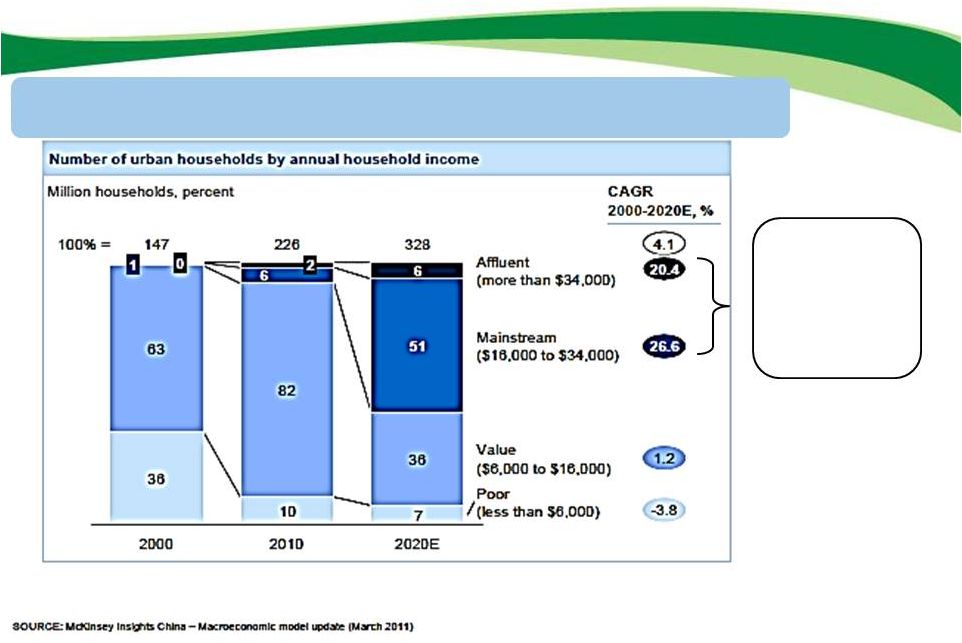 A. O. Smith customer demographic expected to continue to grow rapidly Mega Trends - China Significant growth in AOS target demographic 35 |
 China’s Megatrends and Company Specific Factors Driving AOS Growth Urbanization and Growing Middle Class Expect Tier 2 and Tier 3 market and cities to further develop Green and Safe (more money for cleaning up environment, saving energy, health) Strong A. O. Smith brand, capable local managers, key distribution relationships and engineering innovation expected to propel A. O. Smith growth to at least 2 times China GDP rate 36 |
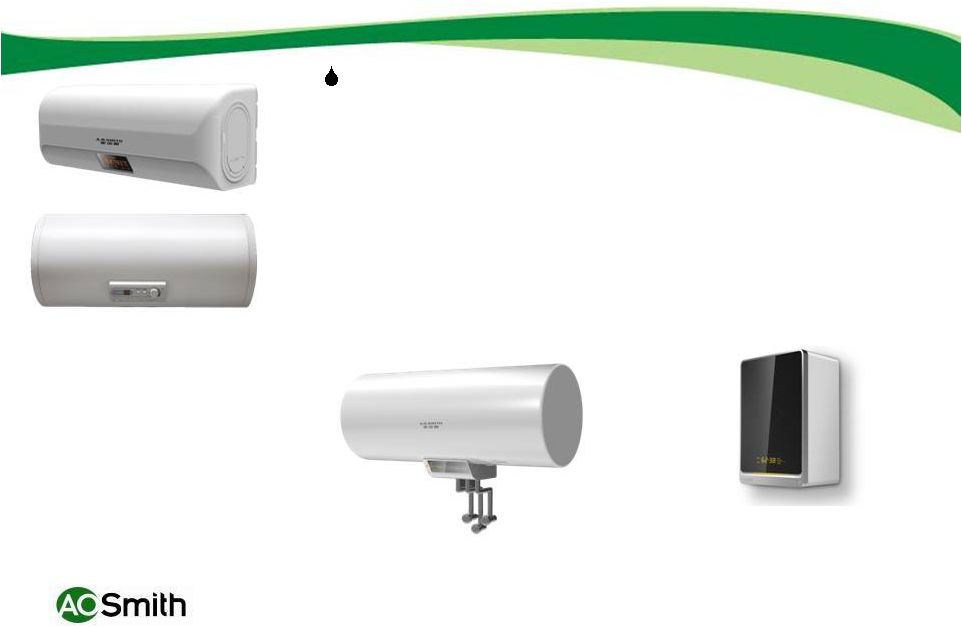 Wall-hung Electric Good/Better/Best • Mechanical / Electronic Controls • Steel / Plastic Jacket • Single / Dual heating elements • Single / Dual power input 1.5/2.0/3.0KW/5.0KW • Solar and gas auto-switch • Dual tank slim model Dual tank slim model Solar and gas auto-switch 37 |
 Good/Better/Best (Natural gas) • 8L/10L/11L/12L/13L/16L/20L/28L • Non-modulating / Modulating • Non-condensing / condensing • Power venting / Balance Flue • Indoor/Outdoor • CO Sensor interlock Gas Tankless 38 |
 60L/80L integrated Wall-hung 150L/200L Split/integrated Floor-standing 240L/300L Split/Integrated floor-standing 2KW/3KW compressor $50 dollar per unit savings compared with using copper coils. Heat Pump 39 Launched aluminum “micro-channel” cost-down split floor-standing heat pump. |
 Solar-Assist Electric 60L/80L/100L/120L/150L/200L Roof-top / balcony mount Pressurized tank Cost reduction in 2012 40 |
 41 AOS China Brand Strategic Priorities 2012 to 2015 Continue to build brand and expand distribution Grow commercial markets, including hydronic Continue cost reduction processes Develop web based sales and marketing strategy Improve tankless and heat pump capabilities Exploit developing replacement/upgrade market |
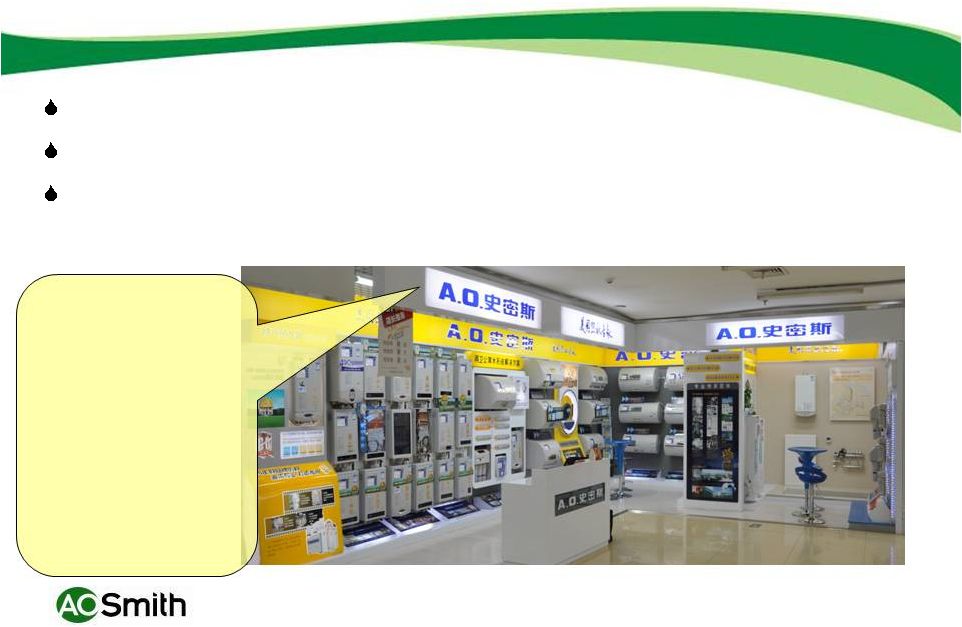
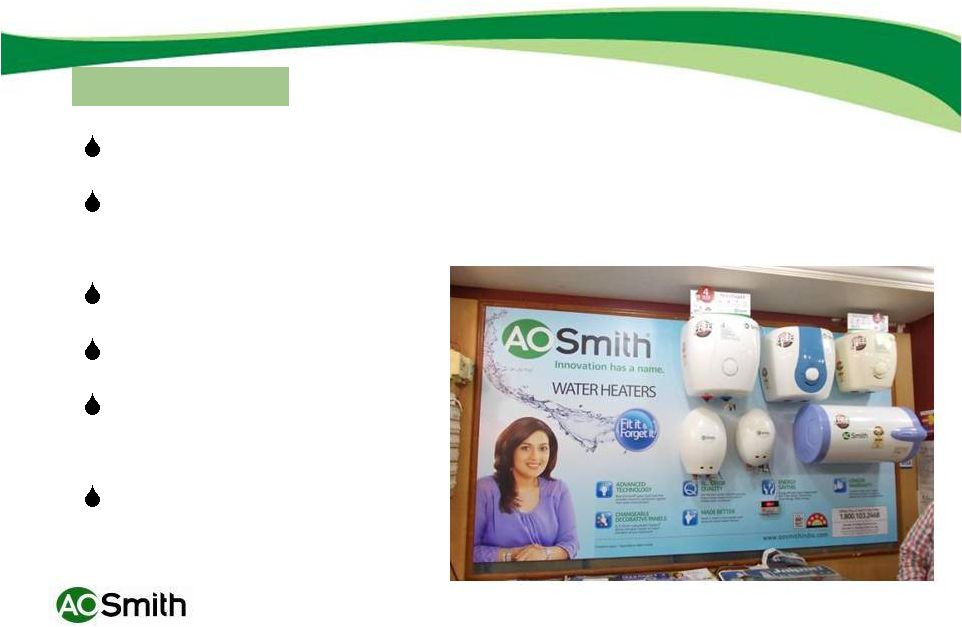
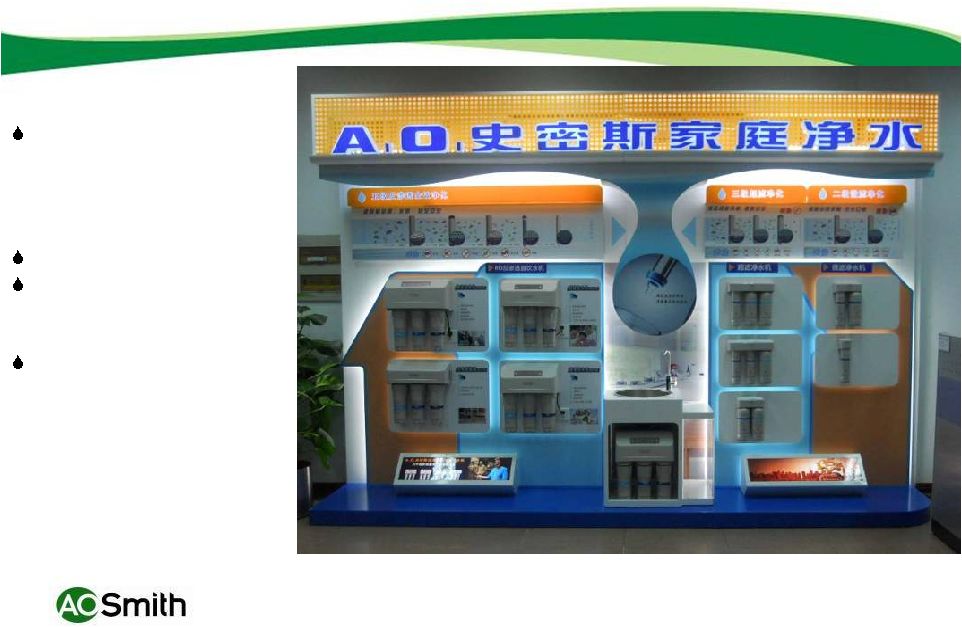 42 Leverage the A.O. Smith brand in our existing water heater channels • 1,100 retail stores at the end of 2011 RO main focus Product development focused at customer needs and technical improvements Highly fragmented, $300 million market A. O. Smith Branded Water Treatment Systems: Retail Channel Display |
 400 GPD tankless; power and pump; USB interface for monitoring filter; Leakage detector 75 and 50 GPD with tank, power and pump; USB interface for monitoring filter; Leakage detector 125 GPD with tank; No pump and thus no power needed! AOS Branded Point of Use Products 2011: 900 stores in tier 1 cities and 200 in tier 2 cities; 2012: adding 200 tier 1 and 200 tier 2 retail outlets 43 |
 44 SWT Strategic Priorities 2012 to 2015 Expand customer base and drive sales growth Invest in AOS brand Improve profitability Achieve best in class quality and delivery Maximize replacement filter opportunity |
 45 INDIA |
 46 Products Designed for India Market |
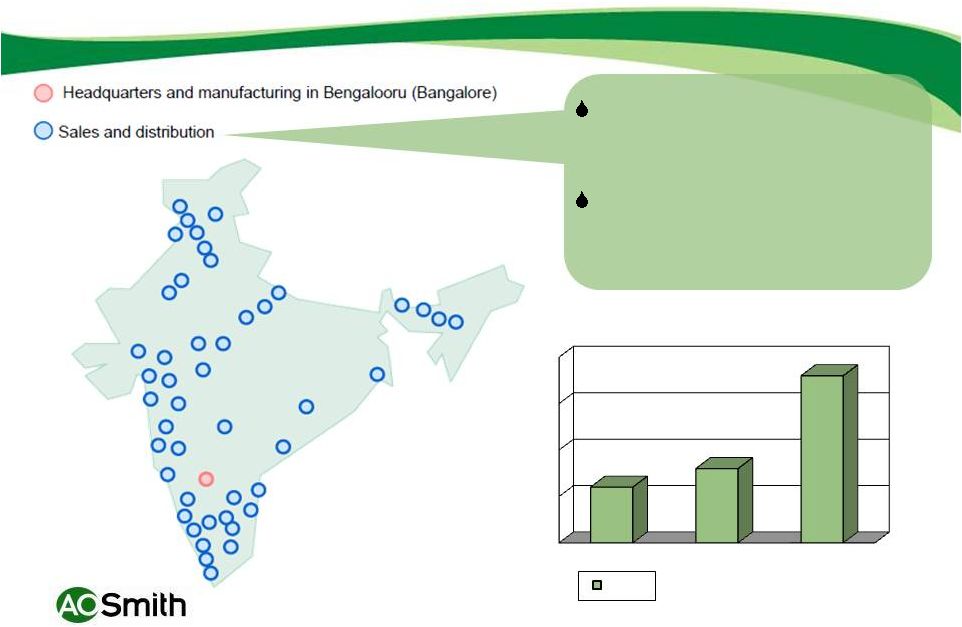 India Geographic Expansion +800 outlets in 2012, totaling 1,700 at year end (AOS brand water heaters) +100 Jaquar dealers in 2012, totaling 1,100 at year end (co-branded water heaters) $0 $5 $10 $15 $20 2009 2010 2011 Millions Sales 47 |
 48 India Strategic Priorities 2012 to 2015 Build brand Establish manufacturing center of excellence Introduce new products Expand distribution Enter water treatment market Explore commercial opportunity |
 49 Energy Efficiency/Clean Water |
 50 A. O. Smith’s Vision To be a leading, globally diversified provider of innovative, energy efficient products used to heat and clean water, providing extraordinary value to customers and maximizing returns to our shareholders. |
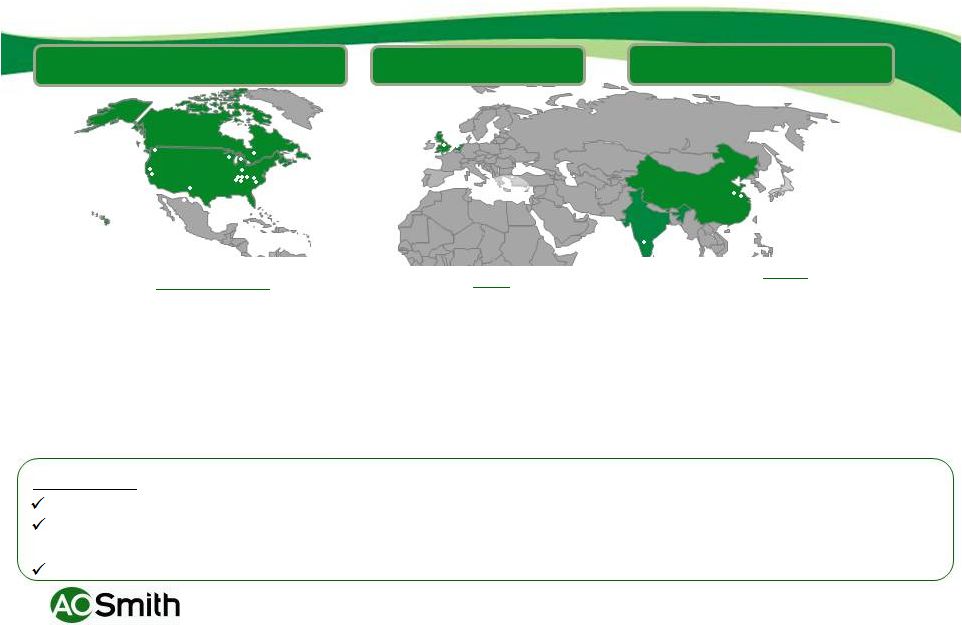
 Achieving Our Vision 450+ Engineers • North America • China • India • Europe 10 Engineering Centers • Specific Product Engineering • Global Engineering • Corporate Technology Focused Innovation Center 51 |
 Global Engineering Centers Fergus, Canada Veldhoven, Netherlands Shanghai, China Nanjing, China Bangalore, India McBee, SC Johnson City, TN Lebanon, TN Milwaukee, WI Lishui, China 52 |
 53 Technological Capabilities Electric tank-type Gas tank-type Gas tankless Heat pumps Solar Boilers and industrial water heaters Water treatment Enabling electronics Materials Simulation |
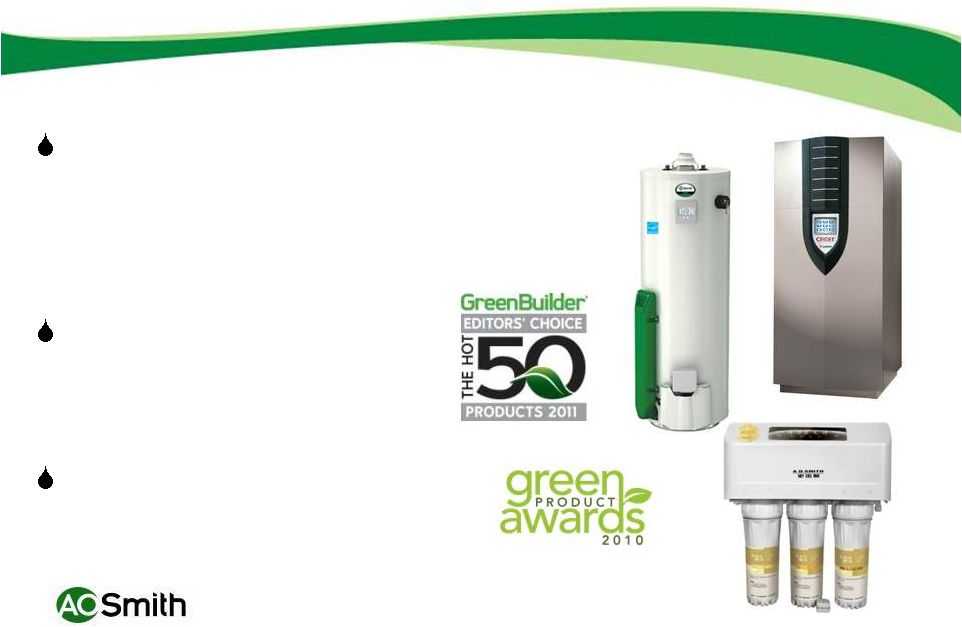 54 Innovative Products Awards Appliance DESIGN Magazine • 2011 Excellence in Design Award • Silver Medal - Next Hybrid ® • Bronze Medal - Cirrex ® Green Builder Magazine • Hot 50 Products of 2011 • Next Hybrid ® Building Products Magazine • 2010 Green Product Award • Voltex ® Company Confidential |
 55 |
 56 |
 57 New Products Voltex Effex NEXT Hybrid Cirrex Tankless TM TM TM TM |
 2015 Strategic Aspirations and Acquisitions Paul Jones, Chairman and CEO |
 59 Vision Performance Aspiration A. O. Smith Grow faster than the market and achieve greater than $3 billion in sales, with more than $1 billion from emerging regions and, with a return of 14% EBIT in 2015. To be a leading, globally diversified provider of innovative, energy efficient products used to heat and clean water, providing extraordinary value to customers and maximizing returns to our shareholders. To simultaneously reposition A. O. Smith as a portfolio of global water based businesses with higher returns (EBIT and ROIC) and a greater share of revenue in high growth regions and businesses. |
 Values A. O. Smith Enterprise Strategy Framework Conduct business with integrity- Live our Values every day Build our brand reputation and deliver our brand promise. Emphasize high growth markets worldwide. Leading market share position for every segment of our business. Bring to market a continuous flow of innovative, energy efficient and reliable products that have a compelling value proposition to our customers. Operate world class facilities and highly efficient processes to manufacture and distribute technologically superior products / services. Earn customer loyalty by providing best in class value and outstanding customer service and responsiveness. Develop a high performance environment that attracts, develops and retains top talent around the world. Operations Products Markets Talent Brand 60 |
 61 Our Geographic Environment North America • Slow GDP growth • Large but mature market • 2015 Regulatory changes – electric product • Strong brands • Boiler industry transition to 55% condensing by 2016 China • GDP projected at 7-8% range • Sluggish economy at present / transitional issues • Middle and affluent classes growing • AOS brand is the market leader • Very bullish on long term growth India • GDP growth projected at 6-7% range • Volatile currency • An evolving water heater market • AOS brand gaining recognition China India North America Mega trends- Global political and governmental fiscal issues are major headwinds to economic expansion. E commerce and digital marketplaces are rapidly expanding and could change the purchase decision dynamics. Global procurement programs – China is becoming less attractive, Mexico is becoming more attractive. |
 A. O. Smith’s Capital Allocation Options 62 Organic growth (capital expenditures) Acquisitions Return cash to shareholders • Dividends • Share repurchase |
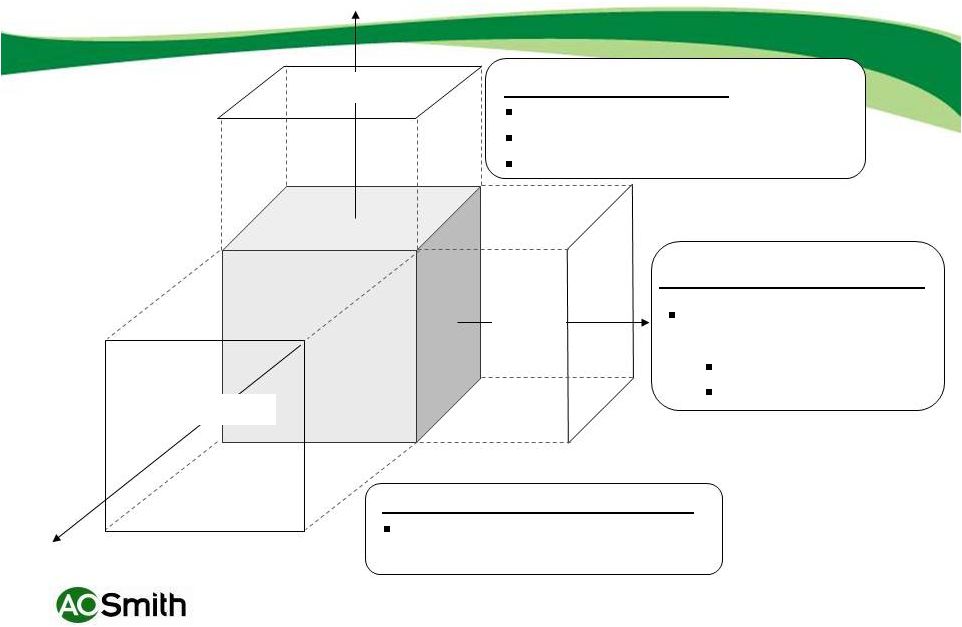 Water-Themed Adjacencies Acquire new platforms for growth A. O. Smith Growth Strategy Adjacencies Geography Expand/ Grow the Core New Products & New Technologies Water Heating Water Treatment Geographic Growth China India Other High Growth GDP markets Core 63 |
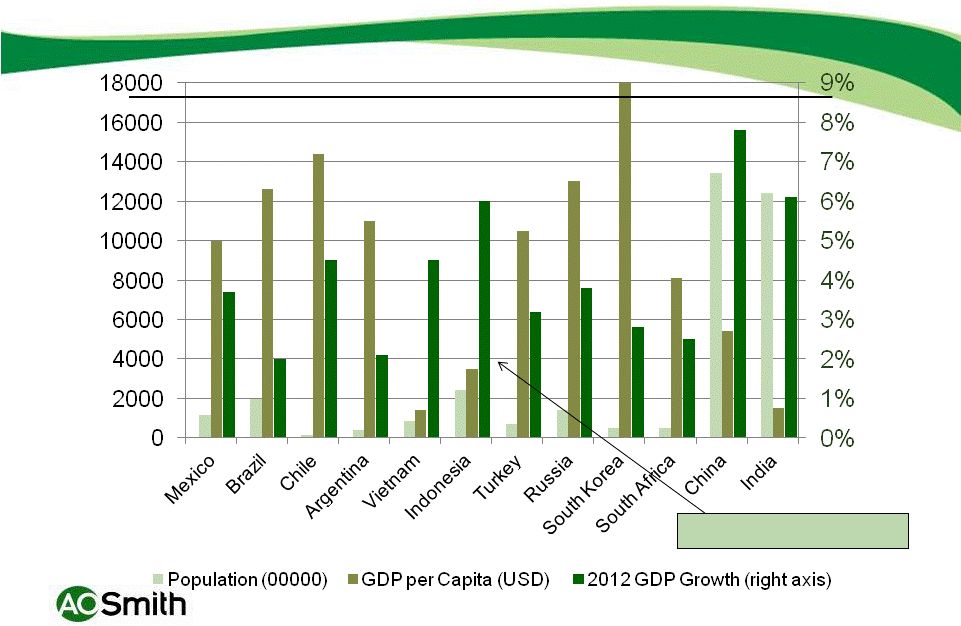 64 Geographic Expansion: Higher Growth Regions Source: World Bank, Economist US 2012 GDP Growth |
 65 Investment Criteria Value creation opportunities ROIC in excess of cost of capital by second or third year Meet risk adjusted IRR hurdle rates Margin accretion with growth rates higher than US GDP Accretive to earnings in the first year |
 66 Alignment and Execution Alignment Clearly defined strategy and goals Clear definition of what we will and will not do Clearly identified priorities Disciplined process • Clear financial metrics • Continuously challenge assumptions • Develop/monitor execution ability (People) • Continuously monitor performance • Develop/deploy counter measures early |
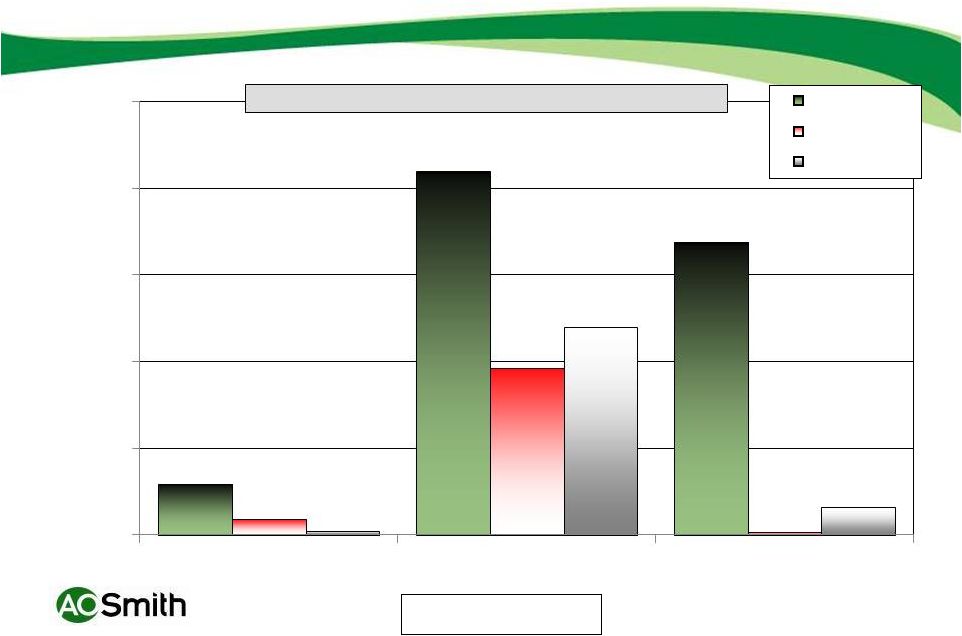 67 Total Stock Return Cumulative returns*, period ending 6/30/12 * includes dividends 17% 126% 101% 5.45% 58% 1% 1% 72% 10% 0% 30% 60% 90% 120% 150% 1 year 3 year 5 year AOS S&P 500 S&P 600 |
 2015 Financial Aspirations John Kita, Executive Vice President and CFO |
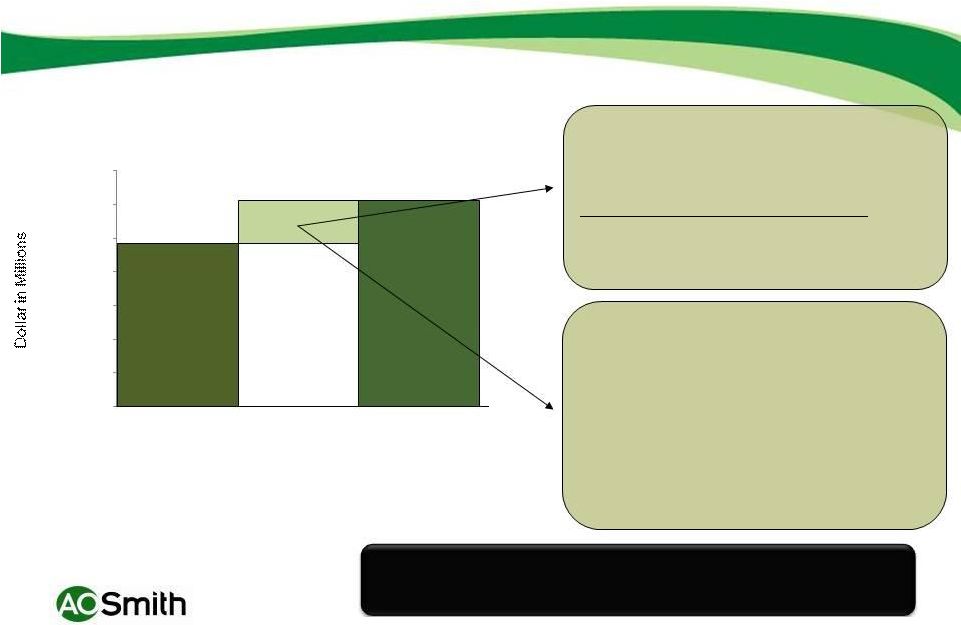
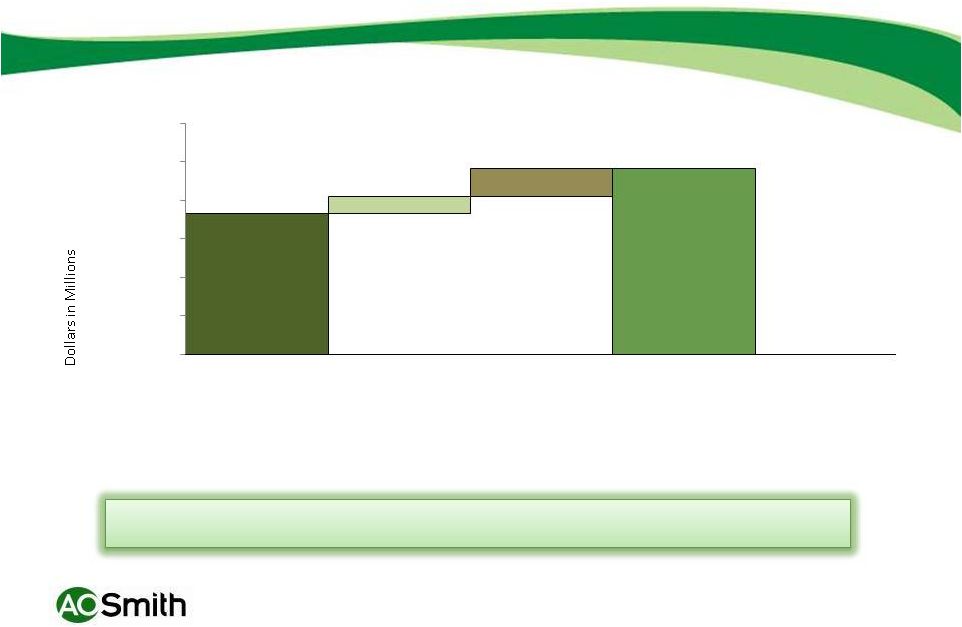 69 Path to Achieve 2015 Revenue Growth Aspirations $1,835* $215 $375 $2,425 $0 $500 $1,000 $1,500 $2,000 $2,500 $3,000 2011 NA Organic ROW Organic 2015 * Includes full year Lochinvar (proforma) This suggests annual organic revenue growth in excess of 7 percent |
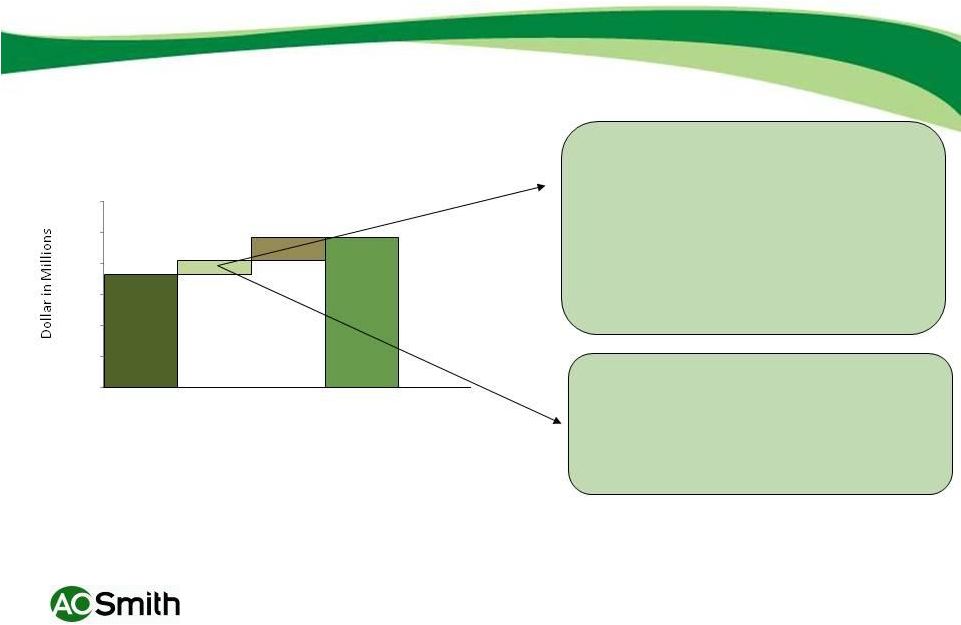 70 North America Organic Revenue Growth US housing starts to1.2 million by 2015 Commercial Industry units to 150,000 by 2015 Grow approximately 10 percent per year North America Water Heaters $1.1 billion to $1.2 billion Lochinvar $200 million to $290 million $1,835* $215 $375 $2,425 $0 $500 $1,000 $1,500 $2,000 $2,500 $3,000 2011 NA Organic ROW Organic 2015 * Includes full year Lochinvar (proforma) • • • |
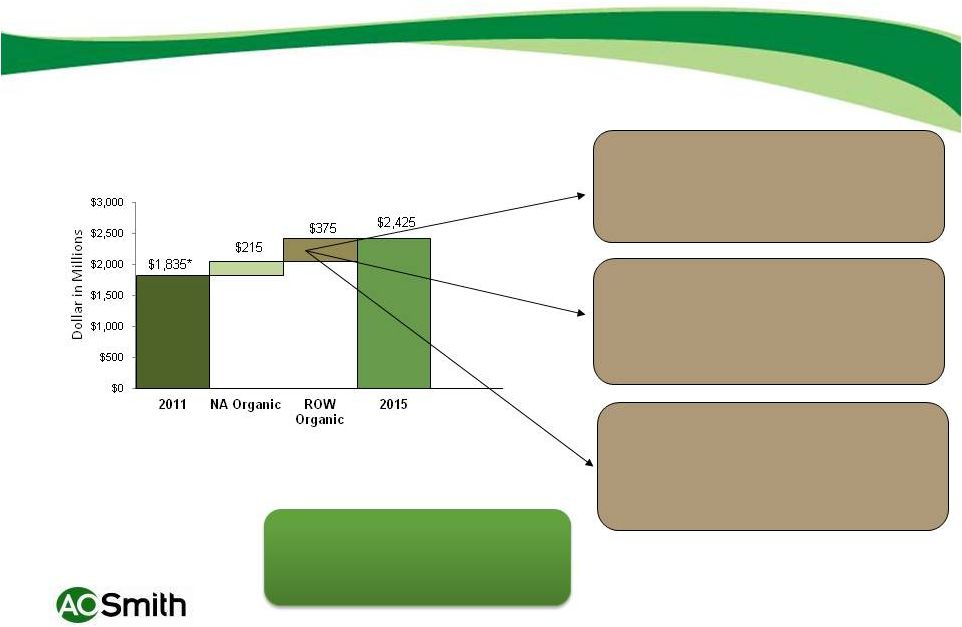 Rest of World Organic Revenue Growth AOS Branded Sales $372 million to $650 million India $18 million to $85 million 2015 Global Water Treatment revenues over $100 million • 15% (2X China GDP) • Grow > 30 percent per year • Enter water treatment Grow at least 25 percent per year SWT $16 million to $40 million 71 * Includes full year Lochinvar (proforma) • |
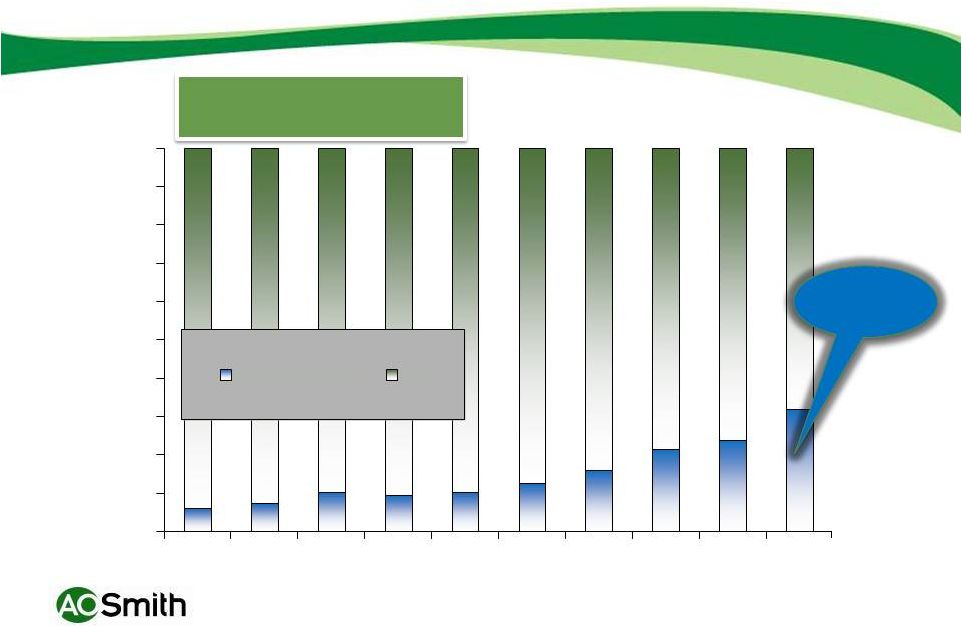 China/India 24% of Sales in 2011 & Growing to 32% by 2015 6% 7% 10% 9% 10% 13% 16% 22% 24% 32% 0% 10% 20% 30% 40% 50% 60% 70% 80% 90% 100% 2003 2004 2005 2006 2007 2008 2009 2010 2011 2015 China/India NA 72 $775 million Organic Growth |
 73 Organic Growth Provides Premium Returns $- $500 $1,000 $1,500 $2,000 $2,500 $3,000 2006 2007 2008 2009 2010** 2011 2015 Aspiration 0% 2% 4% 6% 8% 10% 12% 14% 16% Sales EBIT Margin ** 2010 EBIT excludes $35.4 million in flood costs * excludes corporate expenses |
 74 Organic 2015 EBIT Aspirations 14.5% 13% 14% 0% 2% 4% 6% 8% 10% 12% 14% 16% 18% North America Rest of World Total excl Corporate |
 75 Acquisitions Dry Powder for acquisitions*: Appr $400 million cash offshore Appr $400 million borrowing capacity Appr $800 million available for acquisitions Assumptions for acquisitions: Purchase Price of $800mm = 1.25 Revenue, or approximately $640 million Purchase Price = EBITDA multiple of approximately 8.5 times and EBIT multiple of 10 times $2,425 $640 $3,065 $0 $500 $1,000 $1,500 $2,000 $2,500 $3,000 $3,500 2015 Organic Growth Acquisitions 2015 * Excludes over $300 million organic cash generation (estimate for 2013 to 2015 timeframe) |
 76 Emerging Regions over 33% of Revenues in 2015 > $2 Billion Developed Regions > $1 Billion Emerging Regions Including acquisitions, achieve greater than $3 Billion in sales, with over $1 Billion from emerging regions Composition of revenues based on organic growth and acquisition aspirations |
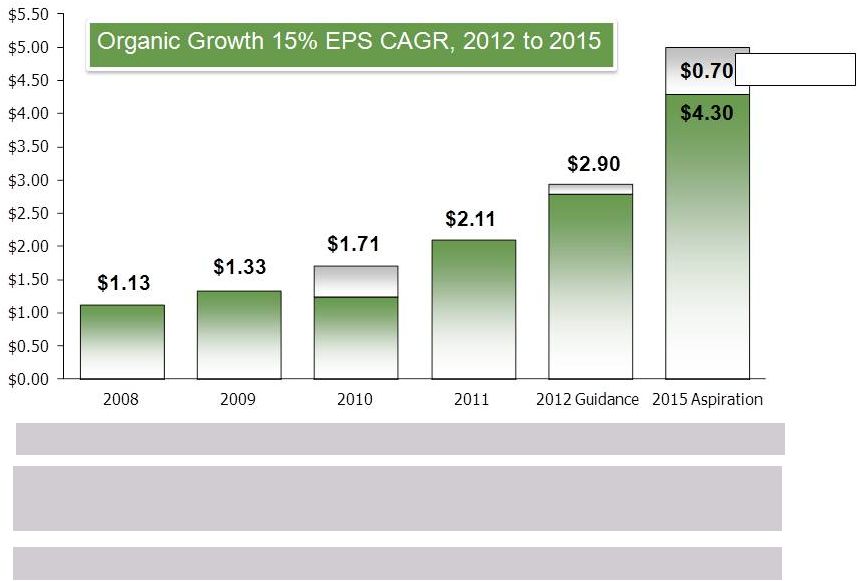 77 Reaffirming 2012 EPS Guidance; Introducing 2015 EPS Aspirations 2008, 2009 and 2010 are Non-GAAP, EPS all periods is Continuing Operations Only 2011 excludes the impact from the second quarter one-time settlement and increase to the warranty reserve and the hedged RBC shares. 2012 excludes the impact from future acquisitions and the gain on the sale of RBC shares. $5.00 $2.80 2015 assumes 46.5 million shares outstanding and pension expense is unchanged from 2012 Acquisitions |
 Thank you! |