EXOR Analyst and Investor Presentation October 5, 2017

Safe Harbor This presentation may contain, and PartnerRe may from time to time make statements, whether written or oral, that may be considered forward-looking statements. In some cases, you can identify these statements by forward-looking words such as “may,” “might,” “will,” “should,” “expects,” “plans,” “anticipates,” “believes,” “estimates,” “predicts,” “potential,” or “continue,” the negative of these terms and other comparable terminology. Forward-looking statements contained in this presentation are based on the Company's assumptions and expectations concerning future events and financial performance and are made pursuant to the safe harbor provisions of the Private Securities Litigation Reform Act of 1995. Such statements are subject to significant business, economic and competitive risks and uncertainties that could cause actual results, to differ materially from those reflected in the forward-looking statements. PartnerRe's forward-looking statements could be affected by numerous foreseeable and unforeseeable events and developments, such as exposure to catastrophe or other large property and casualty losses, adequacy of reserves, credit, interest, currency and other risks associated with the Company's investment portfolio, risks associated with implementing business strategies, levels and pricing of new and renewal business achieved, changes in accounting policies and other factors identified in the Company’s filings with the Securities and Exchange Commission. Although we believe the expectations reflected in the forward-looking statements are reasonable, we cannot guarantee future results, level of activity, performance or achievements. Moreover, neither we nor any other person assumes responsibility for the accuracy and completeness of any of these forward-looking statements. We are under no duty to update any of these forward-looking statements after the date on which they are made. In addition to the GAAP financial measures set forth in this presentation, PartnerRe may include and refer to certain non- GAAP financial measures within the meaning of Regulation G. PartnerRe believes that these non-GAAP financial measures are important to investors, analysts, rating agencies and others who use the Company’s financial information. A definition of such measures and a reconciliation of such measures to the most comparable GAAP figures in accordance with Regulation G is included in the Company’s filings with the Securities and Exchange Commission. This disclaimer forms an important part of this presentation and must not, under any circumstances, be separated from the other contents of this presentation. 2 EXOR Analyst and Investor Presentation October 5, 2017
Agenda October 5, 2017 EXOR Analyst and Investor Presentation 3 Industry overview and PartnerRe positioning Achievements of the past 12 months 2017 Financial outlook
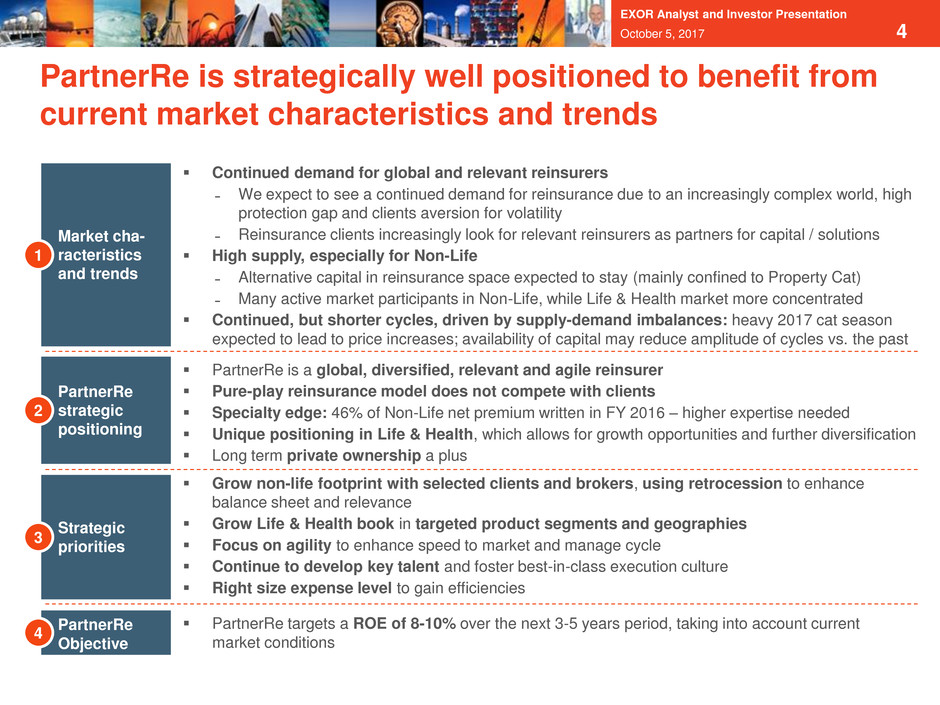
October 5, 2017 EXOR Analyst and Investor Presentation 4 PartnerRe is strategically well positioned to benefit from current market characteristics and trends Market cha- racteristics and trends 1 Continued demand for global and relevant reinsurers ̵ We expect to see a continued demand for reinsurance due to an increasingly complex world, high protection gap and clients aversion for volatility ̵ Reinsurance clients increasingly look for relevant reinsurers as partners for capital / solutions High supply, especially for Non-Life ̵ Alternative capital in reinsurance space expected to stay (mainly confined to Property Cat) ̵ Many active market participants in Non-Life, while Life & Health market more concentrated Continued, but shorter cycles, driven by supply-demand imbalances: heavy 2017 cat season expected to lead to price increases; availability of capital may reduce amplitude of cycles vs. the past PartnerRe Objective 4 PartnerRe targets a ROE of 8-10% over the next 3-5 years period, taking into account current market conditions PartnerRe strategic positioning 2 PartnerRe is a global, diversified, relevant and agile reinsurer Pure-play reinsurance model does not compete with clients Specialty edge: 46% of Non-Life net premium written in FY 2016 – higher expertise needed Unique positioning in Life & Health, which allows for growth opportunities and further diversification Long term private ownership a plus Strategic priorities 3 Grow non-life footprint with selected clients and brokers, using retrocession to enhance balance sheet and relevance Grow Life & Health book in targeted product segments and geographies Focus on agility to enhance speed to market and manage cycle Continue to develop key talent and foster best-in-class execution culture Right size expense level to gain efficiencies
More complex environment: Traditional forms of risk increasingly exposed to globalization and urbanization, and new forms of risk develop (e.g,. cyber risk, supply chain risk) High protection gap in Non-Life (e.g. Harvey low percentage of insured losses), in Life reinsurance markets (eg. mortality, longevity) and in emerging markets Distaste for volatility with primary insurers: Shareholders pay premium for stable earnings and predictable dividends, while primary insurers focus on distribution, risk selection and product development Alternative capital has been growing, but cannot replace traditional reinsurer balance sheet, especially in medium and long tail lines of business 5 There will continue to be a need for well-diversified, relevant reinsurers 1 October 5, 2017 EXOR Analyst and Investor Presentation Distinctive Reinsurance offering Access to a balance sheet that can absorb risk efficiently as a result of broader underwriting diversification and contribution from investment income Specialist expertise in risk evaluation and risk management Greater shareholder tolerance for volatility if appropriately priced
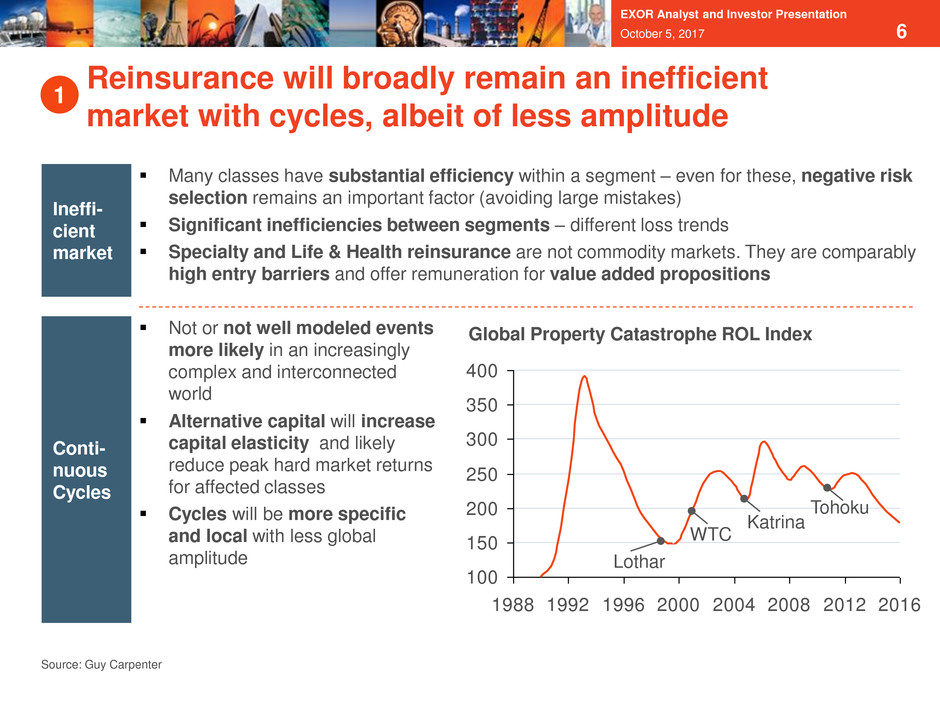
October 5, 2017 6 Reinsurance will broadly remain an inefficient market with cycles, albeit of less amplitude 1 Many classes have substantial efficiency within a segment – even for these, negative risk selection remains an important factor (avoiding large mistakes) Significant inefficiencies between segments – different loss trends Specialty and Life & Health reinsurance are not commodity markets. They are comparably high entry barriers and offer remuneration for value added propositions EXOR Analyst and Investor Presentation Not or not well modeled events more likely in an increasingly complex and interconnected world Alternative capital will increase capital elasticity and likely reduce peak hard market returns for affected classes Cycles will be more specific and local with less global amplitude Conti- nuous Cycles Ineffi- cient market Source: Guy Carpenter 100 150 200 250 300 350 400 1988 1992 1996 2000 2004 2008 2012 2016 Global Property Catastrophe ROL Index WTC Katrina Tohoku Lothar

Global: Global reach to access risks where they are. Broad access to business enabled by its own expertise and strong client & broker relationships Diversified: Highly diversified book of Life and Non-Life risks Relevant: Impactful capacity (line size) coupled with insightful solutions (focused specifically on what matters to the client) Agile: Speed of action (outperforming scale players); dynamic portfolio, leveraging our size; financial flexibility Reinsurer: Focused on “reinsurance-like” business (risk driven, not distribution / process driven, not competing with our clients) 7 PartnerRe is a global, diversified, relevant and agile reinsurer 2 October 5, 2017 EXOR Analyst and Investor Presentation

8 PartnerRe is well positioned to achieve its strategic goals and differentiate from its peers 2 October 5, 2017 EXOR Analyst and Investor Presentation Positioned to be core reinsurance partner to clients and brokers: ̵ Strength: $8B total capital and commitment to “AAA” level of capitalization – can provide meaningful capacity ̵ Pure reinsurer – will not compete with clients ̵ Global reach and presence: 2000 clients with long-standing relationships in 150 countries ̵ Experienced underwriters with above average industry track record and that can add value to clients’ underwriting decisions ̵ Market leader in several Specialty segments with high entry barriers One of the most diversified underwriting portfolios (by geography and line of business) in the industry ̵ Focus on Specialty lines (46% of Non-Life NPW in 2016), a segment with higher long term profitability ̵ Life & Health strategy providing sizeable and profitable diversification with opportunities for growth ̵ Low reliance on Property Cat – only ~4% of total net premium written in 2016 Private ownership – underwriting and investment discipline; focus and invest for the long term (no quarterly earnings distraction), ability to attract and retain talent
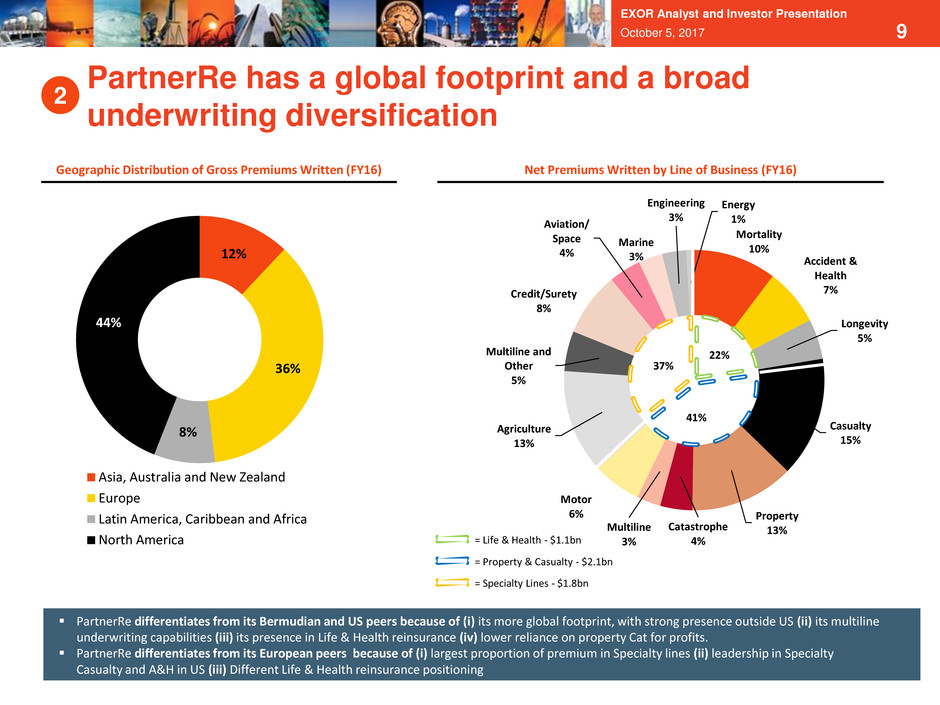
9 12% 36% 8% 44% Asia, Australia and New Zealand Europe Latin America, Caribbean and Africa North America Geographic Distribution of Gross Premiums Written (FY16) Net Premiums Written by Line of Business (FY16) PartnerRe differentiates from its Bermudian and US peers because of (i) its more global footprint, with strong presence outside US (ii) its multiline underwriting capabilities (iii) its presence in Life & Health reinsurance (iv) lower reliance on property Cat for profits. PartnerRe differentiates from its European peers because of (i) largest proportion of premium in Specialty lines (ii) leadership in Specialty Casualty and A&H in US (iii) Different Life & Health reinsurance positioning = Property & Casualty - $2.1bn = Life & Health - $1.1bn = Specialty Lines - $1.8bn Mortality 10% Accident & Health 7% Longevity 5% Casualty 15% Property 13%Catastrophe 4% Multiline 3% Motor 6% Agriculture 13% Multiline and Other 5% Credit/Surety 8% Aviation/ Space 4% Marine 3% Engineering 3% Energy 1% 22% 41% 37% PartnerRe has a global footprint and a broad underwriting diversification 2 October 5, 2017 EXOR Analyst and Investor Presentation
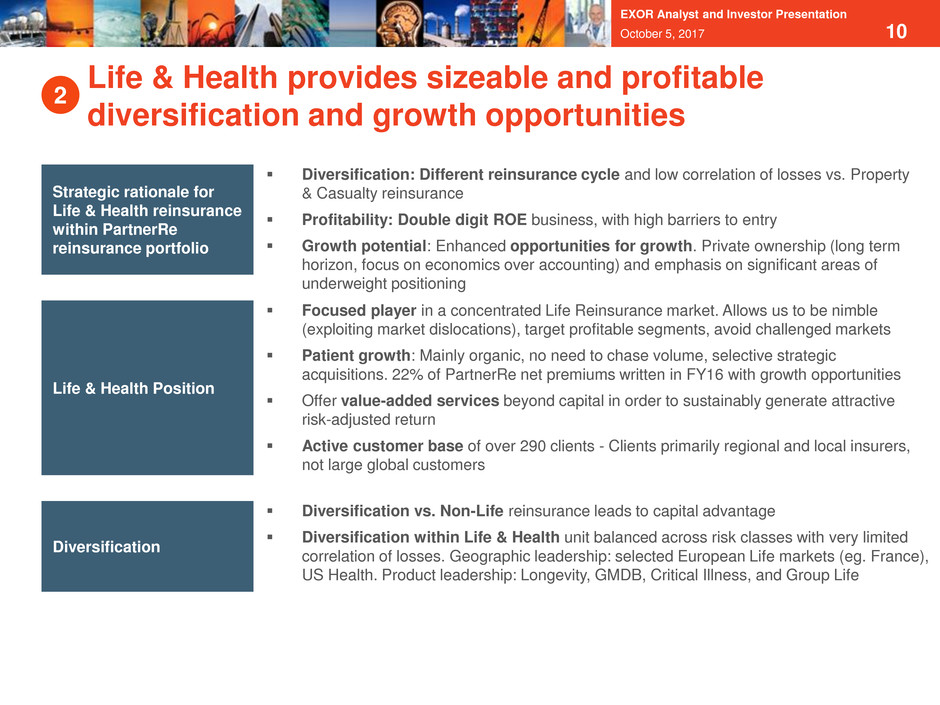
10 Life & Health provides sizeable and profitable diversification and growth opportunities 2 October 5, 2017 EXOR Analyst and Investor Presentation Diversification: Different reinsurance cycle and low correlation of losses vs. Property & Casualty reinsurance Profitability: Double digit ROE business, with high barriers to entry Growth potential: Enhanced opportunities for growth. Private ownership (long term horizon, focus on economics over accounting) and emphasis on significant areas of underweight positioning Strategic rationale for Life & Health reinsurance within PartnerRe reinsurance portfolio Life & Health Position Diversification Focused player in a concentrated Life Reinsurance market. Allows us to be nimble (exploiting market dislocations), target profitable segments, avoid challenged markets Patient growth: Mainly organic, no need to chase volume, selective strategic acquisitions. 22% of PartnerRe net premiums written in FY16 with growth opportunities Offer value-added services beyond capital in order to sustainably generate attractive risk-adjusted return Active customer base of over 290 clients - Clients primarily regional and local insurers, not large global customers Diversification vs. Non-Life reinsurance leads to capital advantage Diversification within Life & Health unit balanced across risk classes with very limited correlation of losses. Geographic leadership: selected European Life markets (eg. France), US Health. Product leadership: Longevity, GMDB, Critical Illness, and Group Life

October 5, 2017 EXOR Analyst and Investor Presentation 11 Business Access Increase footprint with key clients and brokers for sustained access to better business and readiness to participate with potential market opportunities Grow selectively Life & Health book PartnerRe strategic priorities3 Strike the right balance between top down and bottom up risk selection by broadening scope and client penetration for well-understood, efficient risk classes and keeping selective approach for less predictable risk patterns Use of data analytics for better risk assessment Risk selection Leverage Portfolio Construction Framework to optimize underwriting risk-adjusted return Identify selective pockets of growth in current market Grow selectively in Asia Pacific and Latin America Pro-actively manage reinsurance cycle Portfolio Optimization Continual emphasis on a lean and cost effective operations infrastructureOperations Build up the right talent base for the future (including replacements for two Executive Team members) Evolve agility, collaboration, empowerment and high performance Talent and culture
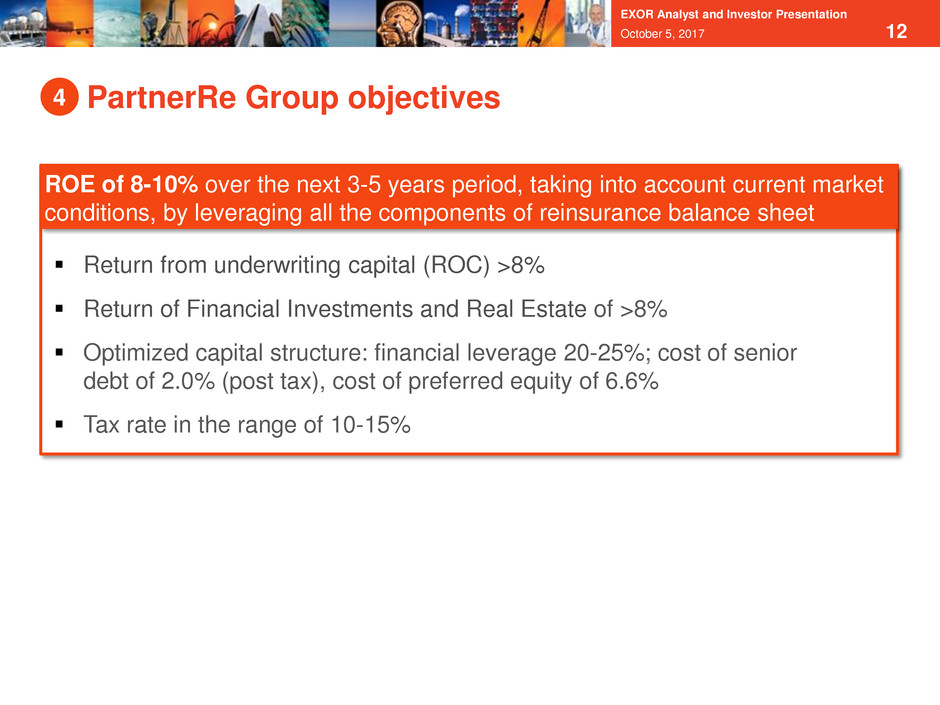
12 PartnerRe Group objectives ROC > 8% over any 3-5 year period on Underwriting Operations ROE of 8-10% over the next 3-5 years period, taking into account current market conditions, by leveraging all the components of reinsurance balance sheet October 5, 2017 4 Return from underwriting capital (ROC) >8% Return of Financial Investments and Real Estate of >8% Optimized capital structure: financial leverage 20-25%; cost of senior debt of 2.0% (post tax), cost of preferred equity of 6.6% Tax rate in the range of 10-15% EXOR Analyst and Investor Presentation
Agenda October 5, 2017 EXOR Analyst and Investor Presentation 13 Industry overview and PartnerRe positioning Achievements of the past 12 months 2017 Financial outlook

14 Key accomplishments of the past 12 months October 5, 2017 Underwriting Operations New worldwide organizational structure, aligned with how our clients buy reinsurance; strengthened Global Accounts function Added and promoted new talent in Underwriting areas (e.g., new heads for Life & Health, APAC and LatAm) Disposed non-strategic businesses (Wholesale, E&S) Accelerated our development in Life & Health through acquisition of Aurigen Optimized underwriting portfolio to provide the most attractive risk-adjusted return over a 3-5y period Dynamically managed capital deployed to property Cat through use of retrocession Operations and Capital Structure Investments EXOR Analyst and Investor Presentation Achieved > $60m of operational cost savings Reinvested > $10m in growth initiatives (e.g., for Life & Health and Global Accounts) Issued a 1.34% yield 10-year Eurobond (first time ever for a Bermuda (re)-insurer to access EUR bond market), which resulted in a capital structure optimization and reduction of financing costs Re-allocated portfolio to improve its risk-adjusted returns (e.g., added real estate as new asset class) Defined new operating model, managing in-house Standard Fixed Income and leveraging external managers (incl. EXOR) for financial investments and real estate Simplified organization and right-sized support teams to reflect a leaner operating model A B C
15 Designed an effective organizational structure, aligned with client needs A October 5, 2017 EXOR Analyst and Investor Presentation Reorganized business operations with new worldwide organizational structure designed by products and client segments (P&C, Specialty, Life and Health) – better leveraging our worldwide expertise and better positioned to respond to evolving clients’ needs Strengthened Global Account unit serving key global clients and brokers Created the Global CUO position reporting to CEO to complement bottom-up underwriting in the Business Units with top-down view of the underwriting to optimize portfolio construction and provide a more comprehensive view of underwriting risks Strengthened Risk and Actuarial unit by adding new Chief Risk & Actuarial Officer position within Executive Committee, reporting directly to CEO Exited SME Insurance business not aligned to our Pure Reinsurer model Hired new CEO of Life & Health to help manage and grow segment Merged CFO and COO functions to improve efficiency

October 5, 2017 EXOR Analyst and Investor Presentation 16 Strengthened Life & Health platform through Aurigen acquisition A Acquisition of a life reinsurer serving Canada (9% market share) and the US (5% market share), the largest regional market in the world where PartnerRe had virtually no presence Increased exposure to yearly renewable term life product where mortality risk is actuarially predictable and provides attractive risk/reward proposition PartnerRe was uniquely well-positioned given our long time horizon, complementary footprint, and economic, rather than accounting, view on the business Attractive purchase price of CAD $375m, below embedded value Integration of the business and 50 new colleagues is underway with expected completion by end of first quarter of 2018 Significant opportunity to leverage PartnerRe’s financial strength to grow Aurigen E 16% B 32% A 20%C 12% 9% D 5% Canada Life Reinsurance market share (2015) E Aurigen 5% A 20% 24% D 18% 17% 10% B C 5% Others U.S. Life Reinsurance market share (2015)
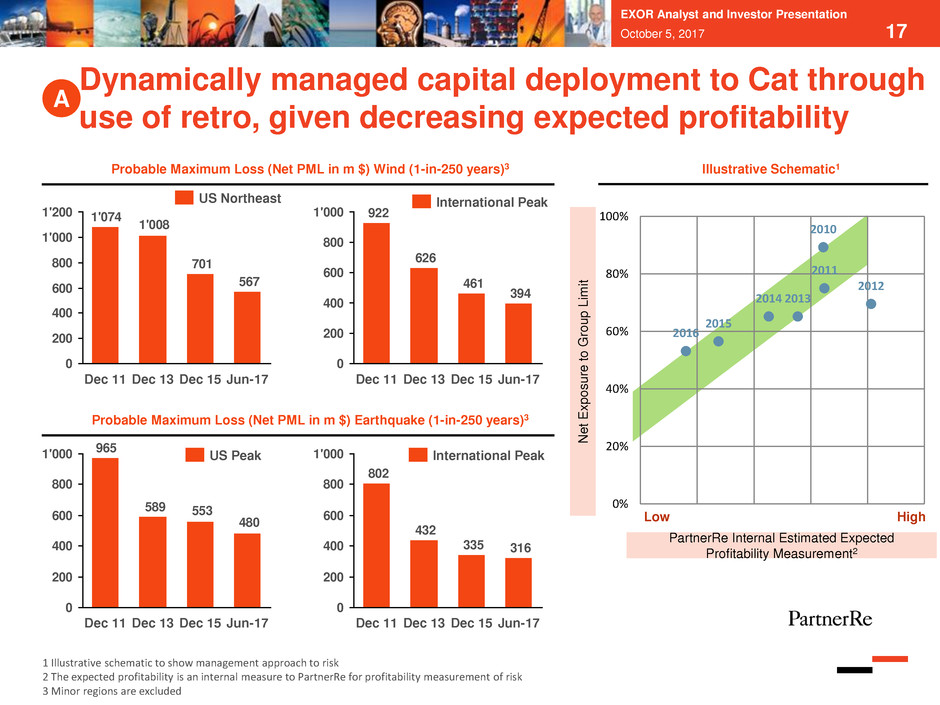
2010 2011 2012 20132014 2015 2016 0% 20% 40% 60% 80% 100% 17 1 Illustrative schematic to show management approach to risk 2 The expected profitability is an internal measure to PartnerRe for profitability measurement of risk 3 Minor regions are excluded PartnerRe Internal Estimated Expected Profitability Measurement2 Low High Illustrative Schematic1 Dynamically managed capital deployment to Cat through use of retro, given decreasing expected profitability A EXOR Analyst and Investor Presentation October 5, 2017 567 701 1'008 1'074 0 200 400 600 800 1'000 1'200 Dec 11 Dec 15 Jun-17Dec 13 US Northeast 394 461 626 922 0 200 400 600 800 1'000 Dec 11 Dec 15 Jun-17Dec 13 International Peak 480 553589 965 0 200 400 600 800 1'000 Dec 11 Dec 15 Jun-17Dec 13 US Peak 316335 432 802 0 200 400 600 800 1'000 Dec 11 Dec 15 Jun-17Dec 13 International Peak Probable Maximum Loss (Net PML in m $) Wind (1-in-250 years)3 Probable Maximum Loss (Net PML in m $) Earthquake (1-in-250 years)3 Net E x p o s ure to G ro u p L im it

18 Achieved > $60m of savings compared to the 2015 cost baseline H1 2017 operating costs 4% below budget Implementing additional cost actions during the course of 2017 Reinvested > $10m of savings in growth initiatives Reduced operating costs Issued a 10-years EUR 750 million senior bond (Eurobond) with maturity September 2026 at 1.34% yield – First Eurobond ever issued by a Bermuda insurer and reinsurer Used proceeds to redeem $150m of preferred shares and $250m of 2018 senior bond Dual objective: strengthening company capital while decreasing company financing cost ($19m pre-tax) and cost of capital Reduced financing costs and optimized capital structure Undertook actions to reduce operating costs and improve cost of capital B EXOR Analyst and Investor Presentation October 5, 2017

$bn 30-Sep-15 31-Dec-16 30-Jun-17 $bn % $bn % $bn % Standard Fixed Income 13.2 82.3% 15.2 89.5% 14.8 86.6% - Cash & Cash Equivalents 0.7 4.4% 1.5 8.6% 0.8 4.7% - Government Subtotal 3.4 21.2% 5.0 29.3% 4.5 26.4% - Corporate Subtotal 5.0 31.2% 5.6 32.9% 6.3 36.8% - MBS Subtotal 3.5 21.7% 2.6 15.4% 2.6 15.4% - US Munis 0.6 3.8% 0.6 3.3% 0.6 3.3% Real Estate - 0.0% 0.5 2.7% 0.5 2.9% Financial Investments 2.8 17.7% 1.3 7.8% 1.8 10.5% - Public Equity 0.9 5.5% 0.1 0.4% 0.6 3.5% - Alternative Credit 0.8 5.2% 0.4 2.6% 0.4 2.5% - Private Equity 0.2 1.4% 0.4 2.4% 0.4 2.4% - ILS 0.4 2.2% 0.4 2.2% 0.3 1.9% - Strategic Ventures 0.1 0.6% 0.0 0.2% 0.0 0.2% - HY / EM Debt / Other 0.4 2.6% Total 16.0 100.0% 17.0 100.0% 17.1 100.0% $bn 30-Sep-15 31-Dec-16 30-Jun-17 $bn % $bn % $bn % Standard Fixed Income 13.2 82.3% 15.2 89.5% 14.8 86.6% - Cash & Cash Equivalents 0.7 4.4% 1.5 8.6% 0.8 4.7% - Government Subtotal 3.4 21.2% 5.0 29.3% 4.5 26.4% - Corporate Subtotal 5.0 31.2% 5.6 32.9% 6.3 36.8% - MBS Subtotal 3.5 21.7% 2.6 15.4% 2.6 15.4% - US Munis 0.6 3.8% 0.6 3.3% 0.6 3.3% Real Estate - 0.0% 0.5 2.7% 0.5 2.9% Financial Investments 2.8 17.7% 1.3 7.8% 1.8 10.5% - Public Equity 0.9 5.5% 0.1 0.4% 0.6 3.5% - Alternative Credit 0.8 5.2% 0.4 2.6% 0.4 2.5% - Private Equity 0.2 1.4% 0.4 2.4% 0.4 2.4% - ILS 0.4 2.2% 0.4 2.2% 0.3 1.9% - Strategic Ventures 0.1 0.6% 0.0 0.2% 0.0 0.2% - HY / EM Debt / Other 0.4 2.6% Total 16.0 100.0% 17.0 100.0% 17.1 100.0% 19October 5, 2017 Standard Fixed Income managed in-house, Financial Investments and Real Estate through Third Party managers (including EXOR) Reduced number of strategies; added Real Estate as asset class to optimize risk-adjusted return Simplified portfolio and lower complexity led to $22.5m expense savings Current portfolio expected to generate annual net total return of ~$500m (ca. 2.9% on average plan assets) under current market conditions: ̵ ~$390-$400m as net investment income, mostly from Standard Fixed Income portfolio ̵ ~$100-$110m as mark-to-market gains, mostly from Financial Investments and Real Estate (excluding any contribution of gains and losses on the fixed income portfolio due to interest rate and credit spreads movements) EXOR Analyst and Investor Presentation Re-designed Investments operating model and optimized portfolio C
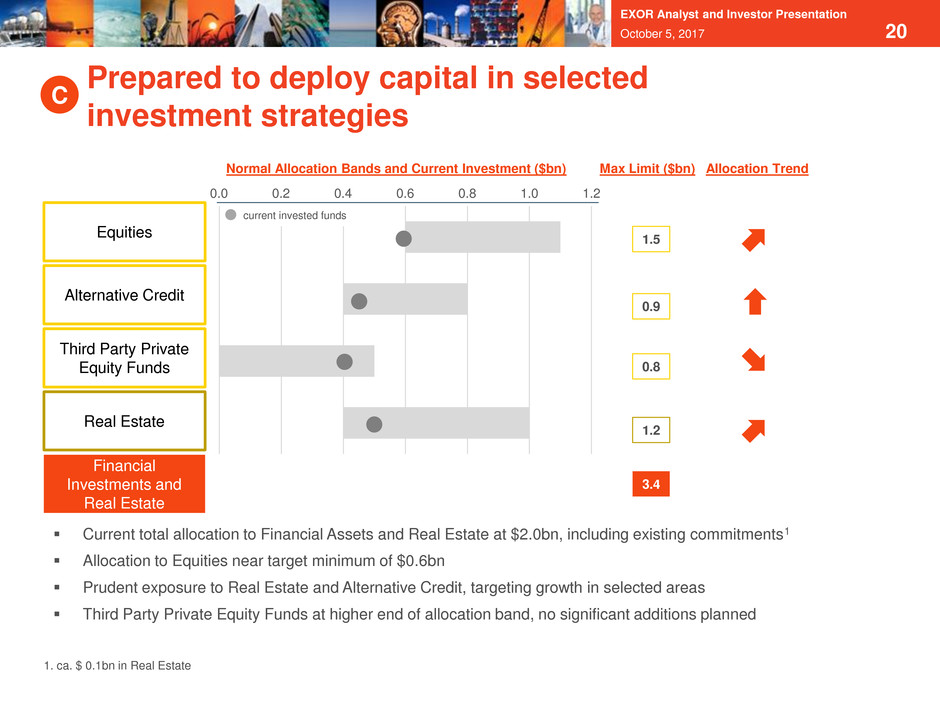
20October 5, 2017 Max Limit ($bn) 1.5 0.9 0.8 1.2 Alternative Credit Real Estate Equities Third Party Private Equity Funds Financial Investments and Real Estate 3.4 Normal Allocation Bands and Current Investment ($bn) Allocation Trend Current total allocation to Financial Assets and Real Estate at $2.0bn, including existing commitments1 Allocation to Equities near target minimum of $0.6bn Prudent exposure to Real Estate and Alternative Credit, targeting growth in selected areas Third Party Private Equity Funds at higher end of allocation band, no significant additions planned current invested funds 1. ca. $ 0.1bn in Real Estate EXOR Analyst and Investor Presentation Prepared to deploy capital in selected investment strategies C 0.0 1.0 1.20.80.60.40.2
Agenda October 5, 2017 EXOR Analyst and Investor Presentation 21 Industry overview and PartnerRe positioning Achievements of the past 12 months 2017 Financial outlook
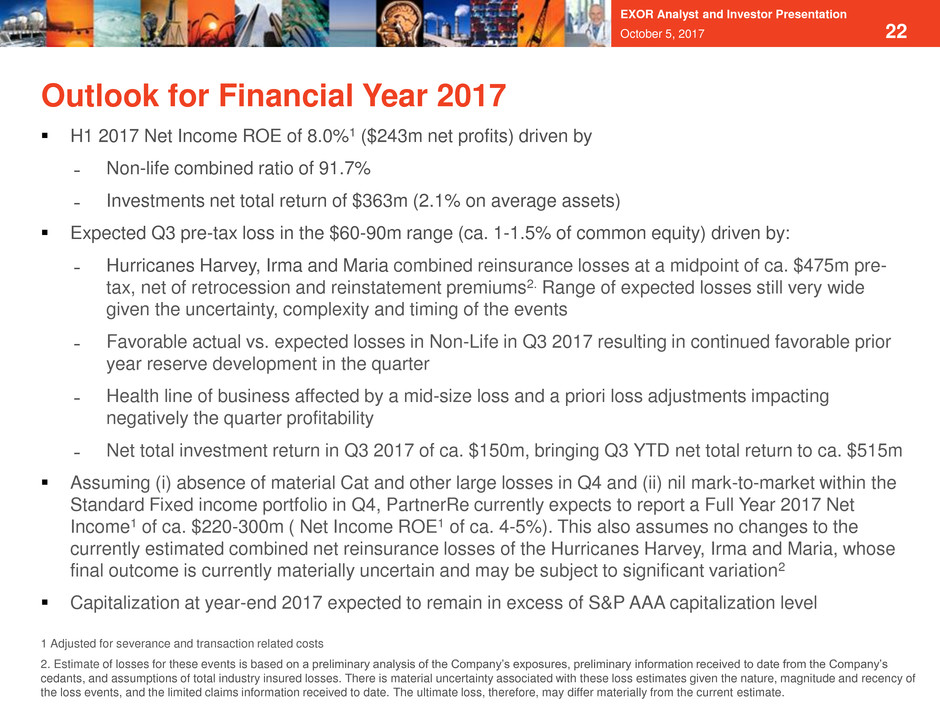
22 Outlook for Financial Year 2017 October 5, 2017 EXOR Analyst and Investor Presentation H1 2017 Net Income ROE of 8.0%1 ($243m net profits) driven by ̵ Non-life combined ratio of 91.7% ̵ Investments net total return of $363m (2.1% on average assets) Expected Q3 pre-tax loss in the $60-90m range (ca. 1-1.5% of common equity) driven by: ̵ Hurricanes Harvey, Irma and Maria combined reinsurance losses at a midpoint of ca. $475m pre- tax, net of retrocession and reinstatement premiums2. Range of expected losses still very wide given the uncertainty, complexity and timing of the events ̵ Favorable actual vs. expected losses in Non-Life in Q3 2017 resulting in continued favorable prior year reserve development in the quarter ̵ Health line of business affected by a mid-size loss and a priori loss adjustments impacting negatively the quarter profitability ̵ Net total investment return in Q3 2017 of ca. $150m, bringing Q3 YTD net total return to ca. $515m Assuming (i) absence of material Cat and other large losses in Q4 and (ii) nil mark-to-market within the Standard Fixed income portfolio in Q4, PartnerRe currently expects to report a Full Year 2017 Net Income1 of ca. $220-300m ( Net Income ROE1 of ca. 4-5%). This also assumes no changes to the currently estimated combined net reinsurance losses of the Hurricanes Harvey, Irma and Maria, whose final outcome is currently materially uncertain and may be subject to significant variation2 Capitalization at year-end 2017 expected to remain in excess of S&P AAA capitalization level 1 Adjusted for severance and transaction related costs 2. Estimate of losses for these events is based on a preliminary analysis of the Company’s exposures, preliminary information received to date from the Company’s cedants, and assumptions of total industry insured losses. There is material uncertainty associated with these loss estimates given the nature, magnitude and recency of the loss events, and the limited claims information received to date. The ultimate loss, therefore, may differ materially from the current estimate.

October 5, 2017 EXOR Analyst and Investor Presentation 23 APPENDIX

PartnerRe Business Profile Company History Founded in 1993 Strong, diversified franchise built on successful organic growth and 3 strategic acquisitions: ̵ SAFR in 1997 ̵ WinterthurRe in 1998 ̵ Paris Re in 2009 Approximately 1,000 employees Business Units3 Three business units (2016 figures) ̵ Specialty Lines ($1.8bn in NWP) ̵ Property & Casualty ($2.1bn in NWP) – including catastrophe ̵ Life & Health ($1.1bn in NWP) Financial Metrics $6.9bn total shareholder’s equity (June 30, 2016) $5.4bn in Gross Written Premium (“GWP”, 2016) 9th largest reinsurer worldwide1 Solid financial strength ratings2: ̵ A+ (stable) by S&P ̵ A1 (stable) by Moody’s ̵ A (stable) by A.M. Best Global Reach Headquarter in Bermuda Principal offices in the US (Stamford, Minneapolis, Kansas City, San Francisco, Miami), Switzerland, France, Bermuda, Ireland, Canada, Hong Kong and Singapore, with key representative offices worldwide 2000 clients with long lasting relationships (77% 3 years or longer) in 150 countries 1 Source: AM Best’s 2015 Ranking 2 As of June 2017 3 The Business Units are based on current internal product split EXOR Analyst and Investor Presentation October 5, 2017 24

PartnerRe Business Mix: Edge in Specialty Lines, Low Exposure to Property Catastrophe Our clients are global insurers, Lloyds syndicates, or monoliners Requires dedicated underwriting expertise (low modelling capabilities). PartnerRe is a recognized leader High barriers to entry Our clients are global and regional/local multiline insurers Property business provides reinsurance coverage to insurers for property damage or business interruption losses, including catastrophe exposure Casualty business includes third party liability, employer’s liability, workers’ compensation and personal accident coverage Our clients are life insurers and self-funded employers, hospitals, health insurers in the US Covers mainly mortality, longevity and medical expense risk; avoids investment risk Diversification to Property & Casualty as limited correlation Specialty Lines Property & Casualty Life & Health EXOR Analyst and Investor Presentation October 5, 2017 25
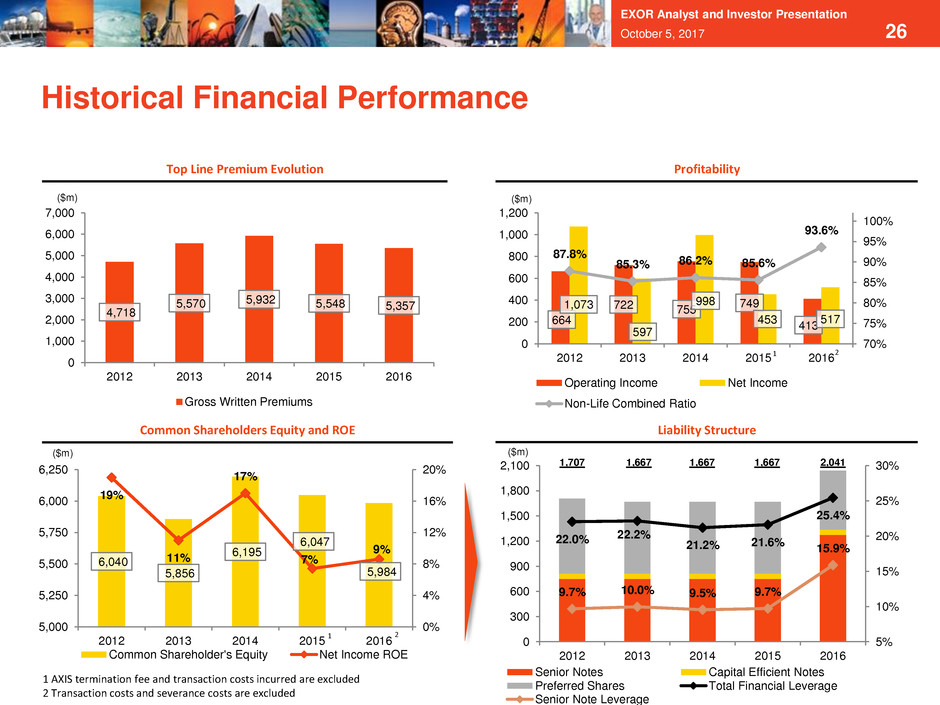
Historical Financial Performance 4,718 5,570 5,932 5,548 5,357 0 1,000 2,000 3,000 4,000 5,000 6,000 7,000 2012 2013 2014 2015 2016 Gross Written Premiums 664 722 755 749 413 1,073 597 998 453 517 87.8% 85.3% 86.2% 85.6% 93.6% 70% 75% 80% 85% 90% 95% 100% 0 200 400 600 800 1,000 1,200 2012 2013 2014 2015 2016 Operating Income Net Income Non-Life Combined Ratio 6,040 5,856 6,195 6,047 5,984 19% 11% 17% 7% 9% 0% 4% 8% 12% 16% 20% 5,000 5,250 5,500 5,750 6,000 6,250 2012 2013 2014 2015 2016 Common Shareholder's Equity Net Income ROE 22.0% 22.2% 21.2% 21.6% 25.4% 9.7% 10.0% 9.5% 9.7% 15.9% 5% 10% 15% 20% 25% 30% 0 300 600 900 1,200 1,500 1,800 2,100 2012 2013 2014 2015 2016 Senior Notes Capital Efficient Notes Preferred Shares Total Financial Leverage Senior Note Leverage ($m) ($m) ($m) Common Shareholders Equity and ROE Liability Structure ($m) 1,707 1,667 1,667 1,667 2,041 1 AXIS termination fee and transaction costs incurred are excluded 2 Transaction costs and severance costs are excluded 1 2 Top Line Premium Evolution Profitability 1 2 EXOR Analyst and Investor Presentation October 5, 2017 26


