UNITED STATES
SECURITIES AND EXCHANGE COMMISSION
Washington, D.C. 20549
FORM N-CSR
CERTIFIED SHAREHOLDER REPORT OF REGISTERED
MANAGEMENT INVESTMENT COMPANIES
Investment Company Act File Number: 811-07988
LORD aBBETT INVESTMENT TRUST
(Exact name of Registrant as specified in charter)
90 Hudson Street, Jersey City, NJ 07302
(Address of principal executive offices) (Zip code)
John T. Fitzgerald, Esq., Vice President & Assistant Secretary
90 Hudson Street, Jersey City, NJ 07302
(Name and address of agent for service)
Registrant’s telephone number, including area code: (888) 522-2388
Date of fiscal year end: 11/30
Date of reporting period: 11/30/2021
| Item 1: | Report(s) to Shareholders. |
![]()
LORD ABBETT
ANNUAL REPORT
Lord Abbett
Multi-Asset Balanced Opportunity Fund
Multi-Asset Income Fund
For the fiscal year ended November 30, 2021
Table of Contents
Lord Abbett Multi-Asset Balanced Opportunity Fund
and Lord Abbett Multi-Asset Income Fund
Annual Report
For the fiscal year ended November 30, 2021
From left to right: James L.L. Tullis, Independent Chairman of the Lord Abbett Funds and Douglas B. Sieg, Trustee, President, and Chief Executive Officer of the Lord Abbett Funds. | Dear Shareholders: We are pleased to provide you with this overview of the performance of the Funds for the fiscal year ended November 30, 2021. On this page and the following pages, we discuss the major factors that influenced fiscal year performance. For detailed and more timely information about the Funds, please visit our website at www.lordabbett.com, where you also can access the quarterly commentaries that provide updates on each Fund’s performance and other portfolio related updates. Thank you for investing in Lord Abbett mutual funds. We value the trust that you place in us and look forward to serving your investment needs in the years to come.
Best regards,
Douglas B. Sieg Trustee, President and Chief Executive Officer | |


Lord Abbett Multi-Asset Balanced Opportunity Fund
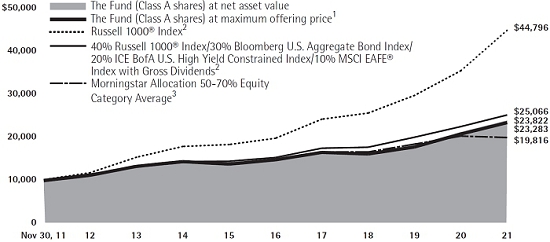
For the fiscal year ended November 30, 2021, the Fund returned 12.89%, reflecting performance at the net asset value (“NAV”) of Class A shares, with all distributions reinvested, compared to its benchmark, the Russell 1000® Index1, which returned 26.67% over the same period.
The twelve-month period ending November 30, 2021 was primarily a story of the dramatic economic and market recovery that occurred within the U.S. Despite the persistent presence of COVID-19, U.S. risk assets largely outperformed their higher quality counterparts over the period. U.S. Treasuries2 returned -2.05% amid rising yields across all maturities; Investment grade corporate bonds3 returned -0.53% as
1
spreads remained rangebound at near all-time tight levels throughout the period.
High yield bonds4 and leveraged loans5 returned 5.38% and 6.12%, respectively, over the period. Within high yield, lower quality segments of the market outperformed higher quality tiers. Within equities, the S&P 500® Index6 and the tech heavy Nasdaq Composite Index7 returned 27.92% and 28.20%, respectively. Large cap stocks8 outperformed small cap stocks9 (26.67% vs. 22.03%), while growth10 outperformed value11 (29.39% vs. 22.92%).
The strong overall market performance was mainly attributed to vaccine approvals and a bipartisan compromise on a fifth pandemic relief package. Additionally, the U.S. Federal Reserve (the “Fed”) cleared banks to resume share buybacks in the first quarter of 2021, subject to a limit, after the industry fared well in the second round of stress tests- which was a notable development considering the industry had mostly struggled throughout 2020.
To start the new year, various factors impacted markets, although the longstanding bullish narrative surrounding stimulus and vaccine optimism remained largely intact. Momentum continued behind the pro-cyclical and value rotation on the back of the Democrats’ surprise victory in the Georgia U.S. Senate runoff elections. Inflation fears and renewed concerns over variants of the coronavirus did little to slow the market down during the second quarter of 2021, as the S&P 500® Index and Nasdaq Composite Index
both breached all-time highs. Second quarter reported earnings were even stronger than the first quarter, with the blended growth rate for the S&P 500® Index at 88%, which was the highest year-over-year growth since fourth quarter of 2009. In aggregate, companies were reporting earnings 17.1% ahead of consensus in the second quarter, the fourth highest on record, and revenues 4.9% ahead of consensus, the highest on record.
The bullish narrative continued into the start of the third quarter. For most of July and August, investor focus was largely centered around themes, such as a central bank liquidity tailwind, continued vaccine progress, upside in corporate earnings surprises, and reopening momentum. However, U.S. markets were met with increasing headwinds toward the latter half of the quarter, which included the increased spread of the Delta variant, and rising concerns over supply chain and input price pressures on corporate earnings. This was reflected by consumer prices rising 5.4% year-over-year, in both June and July (the fastest pace since August 2008). Inflation maintained its record pace in August as consumer prices rose 5.3% year-over-year, albeit below economist expectations for the month. Uncertainty around the Fed tapering presented additional headwinds to the market. Toward the end of the third quarter, the Fed indicated that a reduction in its $120 billion per month asset-
2
purchase plan might soon be warranted. U.S. markets were also affected by negative headlines overseas, most notably China’s regulatory crackdown of the private education and technology sectors and broad worries about a default by Chinese real estate developer Evergrande. These headwinds culminated in a volatile September, with all major U.S. indices finishing in negative territory. Specifically, the S&P 500® Index snapped a streak of seven consecutive months of positive returns and had its worst performing month since March 2020.
Markets remained resilient to start the fourth quarter amid strong consumer demand, underpinned by robust corporate and consumer balance sheets, which helped keep operating leverage and margins elevated for corporations, despite increased supply chain and input price pressures. However, the Friday following Thanksgiving in the U.S. saw a big market selloff with all the major indexes down over 2% on concerns that the emergence of the new Omicron variant could derail the last bout of economic normalization traction. This added to continued concerns around the shift in the transient versus persistent inflation debate.
The Fund is a “fund of funds” that invests in affiliated mutual funds managed by Lord Abbett. Under normal conditions, through the underlying funds, the Fund indirectly invests in fixed income securities of various types, select U.S. equity securities across all market capitalization
ranges and all investment styles, and foreign (including emerging market) securities. The Fund tactically allocates among these asset classes in response to market conditions or to seek to capitalize on investment opportunities.
Over the period, despite the asset class generating positive returns, the portfolio’s allocation to high yield corporate bonds within the Lord Abbett High Yield Fund was the largest detractor from performance relative to the Russell 1000® Index, as below investment grade bonds largely underperformed equities. The portfolio’s allocation to emerging market corporate and sovereign bonds within the Lord Abbett Emerging Markets Bond Fund also detracted from relative performance over the period, as the asset class significantly underperformed the U.S. equity market due to virus and global supply chain concerns, as well as a stronger U.S. dollar.
In addition, the portfolio’s weightings in domestic mid- and large-cap growth stocks within the Lord Abbett Growth Opportunities Fund and the Lord Abbett Growth Leaders Fund were also notable detractors from relative performance, as concerns about Fed policy, inflation, and risk appetite skewed capital towards lower valuation, more mature companies. This shift hurt the equity performance of faster-growing companies with higher-multiple stocks. Conversely, the portfolio’s weightings in domestic value stocks within the Lord Abbett Focused Large Cap Value Fund, the Lord Abbett Focused Small Cap
3
Value Fund, and the Lord Abbett Fundamental Equity Fund were the largest contributors to relative performance.
Lord Abbett Multi-Asset Income Fund
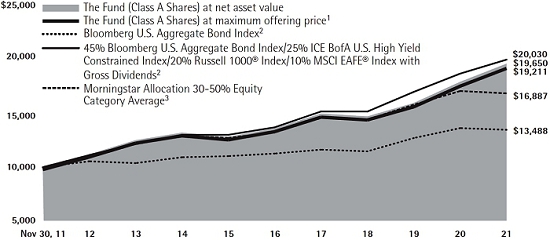
For the fiscal year ended November 30, 2021, the Fund returned 9.43%, reflecting performance at the net asset value (“NAV”) of Class A shares with all distributions reinvested, compared to its benchmark, the Bloomberg U.S. Aggregate Bond Index12, which returned -1.15% over the same period.
The twelve-month period ending November 30, 2021 was primarily a story of the dramatic economic and market recovery that occurred within the U.S. Despite the persistent presence of COVID-19, U.S. risk assets largely outperformed their higher quality counterparts over the period. U.S. Treasuries2 returned -2.05% amid rising yields across all maturities; Investment grade corporate bonds3 returned -0.53% as spreads remained rangebound at near all-time tight levels throughout the period.
High yield bonds4 and leveraged loans5 returned 5.38% and 6.12%, respectively, over the period. Within high yield, lower quality segments of the market outperformed higher quality tiers. Within equities, the S&P 500® Index6 and the tech heavy Nasdaq Composite Index7 returned 27.92% and 28.20%, respectively. Large cap stocks8 outperformed small cap stocks9 (26.67% vs. 22.03%), while growth10 outperformed value11 (29.39% vs. 22.92%).
The strong overall market performance was mainly attributed to vaccine approvals and a bipartisan compromise on a fifth pandemic relief package. Additionally, the U.S. Federal Reserve (the “Fed”) cleared banks to resume share buybacks in the first quarter of 2021, subject to a limit, after the industry fared well in the second round of stress tests – which was a notable development considering the industry had mostly struggled throughout 2020.
To start the new year, various factors impacted markets, although the longstanding bullish narrative surrounding stimulus and vaccine optimism remained largely intact. Momentum continued behind the pro-cyclical and value rotation on the back of the Democrats’ surprise victory in the Georgia U.S. Senate runoff elections. Inflation fears and renewed concerns over variants of the coronavirus did little to slow the market down during the second quarter of 2021, as the S&P 500® Index and Nasdaq Composite Index both breached all-time highs. Second quarter reported earnings were even stronger than the first quarter, with the blended growth rate for the S&P 500® Index at 88%, which was the highest year-over-year growth since fourth quarter of 2009. In aggregate, companies were reporting earnings 17.1% ahead of consensus in the second quarter, the fourth highest on record, and revenues 4.9% ahead of consensus, the highest on record.
4
The bullish narrative continued into the start of the third quarter. For most of July and August, investor focus was largely centered around themes, such as a central bank liquidity tailwind, continued vaccine progress, upside in corporate earnings surprises, and reopening momentum. However, U.S. markets were met with increasing headwinds toward the latter half of the quarter, which included the increased spread of the Delta variant, and rising concerns over supply chain and input price pressures on corporate earnings. This was reflected by consumer prices rising 5.4% year-over-year, in both June and July (the fastest pace since August 2008). Inflation maintained its record pace in August as consumer prices rose 5.3% year-over-year, albeit below economist expectations for the month. Uncertainty around the Fed tapering presented additional headwinds to the market. Toward the end of the third quarter, the Fed indicated that a reduction in its $120 billion per month asset-purchase plan might soon be warranted. U.S. markets were also affected by negative headlines overseas, most notably China’s regulatory crackdown of the private education and technology sectors and broad worries about a default by Chinese real estate developer Evergrande. These headwinds culminated in a volatile September, with all major U.S. indices finishing in negative territory. Specifically, the S&P 500® Index snapped a streak of seven consecutive months of positive
returns and had its worst performing month since March 2020.
Markets remained resilient to start the fourth quarter amid strong consumer demand, underpinned by robust corporate and consumer balance sheets, which helped keep operating leverage and margins elevated for corporations, despite increased supply chain and input price pressures. However, the Friday following Thanksgiving in the U.S. saw a big market selloff with all the major indexes down over 2% on concerns that the emergence of the new Omicron variant could derail the last bout of economic normalization traction. This added to continued concerns around the shift in the transient versus persistent inflation debate.
The Fund is a “fund of funds” that invests in affiliated mutual funds managed by Lord Abbett. Under normal conditions, through the underlying funds, the Fund indirectly invests in fixed income securities of various types, select U.S. equity securities across all market capitalization ranges and all investment styles, and foreign (including emerging market) securities. The Fund tactically allocates among these asset classes in response to market conditions or to seek to capitalize on investment opportunities.
Over the period, the Fund’s weightings in domestic mid- and large-cap stocks within the Lord Abbett Growth Leaders Fund, the Lord Abbett Durable Growth Fund, the Lord Abbett Growth Opportunities Fund, the Lord Abbett Mid
5
Cap Stock Fund, the Lord Abbett Fundamental Equity Fund, and the Lord Abbett Focused Large Cap Value Fund were the largest contributors to relative performance, as vaccine progress and the gradual reopening of the economy sparked a dramatic economic and market recovery – resulting in equities largely outperforming the broader bond market.
The Fund’s allocation to U.S. high yield corporate bonds within the Lord Abbett High Yield Fund was another notable contributor to relative performance, as risk assets largely outperformed their
high-quality counterparts – partly as a result of high-quality spreads remaining rangebound at near all-time tight levels throughout the period.
Relative to the Fund’s benchmark, the Bloomberg U.S. Aggregate Bond Index, there were no notable detractors from relative performance over the period.
The Funds’ portfolios are actively managed and, therefore, holdings and the weightings of a particular issuer or particular sector as a percentage of portfolio assets are subject to change. Sectors may include many industries.
1 The Russell 1000® Index measures the performance of the 1,000 largest companies in the Russell 3000® Index, which represents approximately 92% of the total market capitalization of the Russell 3000® Index.
2 As represented by the U.S. Treasury component of the Barclays U.S. Government Index as of 11/30/2021.
3 As represented by the Bloomberg US Corp Investment Grade Index as of 11/30/2021.
4 As represented by the ICE BofA U.S. High Yield Constrained Index as of 11/30/2021.
5 As represented by the Credit Suisse Leveraged Loan Index as of 11/30/2021.
6 The S&P 500® Index is widely regarded as the standard for measuring large cap U.S. stock market performance and includes a representative sample of leading companies in leading industries.
7 The Nasdaq Composite Index is the market capitalization-weighted index of over 2,500 common equities listed on the Nasdaq stock exchange.
8 As represented by the Russell 1000® Index as of 11/30/2021.
9 As represented by the Russell 2000® Index as of 11/30/2021.
10 As represented by the Russell 3000® Growth Index as of 11/30/2021.
11 As represented by the Russell 3000® Value Index as of 11/30/2021.
12 The Bloomberg U.S. Aggregate Bond Index is an index of U.S dollar-denominated, investment-grade
U.S. government and corporate securities, and mortgage pass-through securities, and asset-backed securities. Indexes are unmanaged, do not reflect the deduction of fees or expenses, and an investor cannot invest directly in an index.
Unless otherwise specified, indexes reflect total return, with all dividends reinvested. Indexes are unmanaged, do not reflect the deduction of fees or expenses, and are not available for direct investment.
Important Performance and Other Information
Performance data quoted in the following pages reflect past performance and are no guarantee of future results. Current performance may be higher or lower than the performance quoted. The investment return and principal value of an investment in the Funds will fluctuate so that shares, on any given day or when redeemed, may be worth more or less than their original cost. You can obtain performance data current to the most recent month end by calling Lord Abbett at 888-522-2388 or referring to www.lordabbett.com.
Except where noted, comparative Fund performance does not account for the deduction of sales charges and would be different if sales charges were included. Each Fund offers classes of shares with distinct pricing options. For a full description of the differences in pricing alternatives, please see each Fund’s prospectus.
6
During certain periods shown, expense waivers and reimbursements were in place. Without such waivers and expense reimbursements, the Funds’ returns would have been lower.
The annual commentary above discusses the views of the Funds’ management and various portfolio holdings of the Funds as of November 30, 2021. These views and portfolio holdings may have changed after this date. Information provided in the commentary is not a recommendation to buy or sell securities. Because the Funds’ portfolios are actively managed and may change significantly, the Funds may no
longer own the securities described above or may have otherwise changed their positions in the securities. For more recent information about the Funds’ portfolio holdings, please visit www.lordabbett.com.
A Note about Risk: See Notes to Financial Statements for a discussion of investment risks. For a more detailed discussion of the risks associated with each Fund, please see each Fund’s prospectus.
Mutual funds are not insured by the FDIC, are not deposits or other obligations of, or guaranteed by, banks, and are subject to investment risks including possible loss of principal amount invested.
7
Multi-Asset Balanced Opportunity Fund
Below is a comparison of a $10,000 investment in Class A shares with the same investment in the Russell 1000® Index, 40% Russell 1000® Index/30% Bloomberg U.S. Aggregate Bond Index/20% ICE BofA U.S. High Yield Constrained Index/10% MSCI EAFE® Index with Gross Dividends and the Morningstar Allocation 50-70% Equity Category Average, assuming reinvestment of all dividends and distributions. The performance of the other classes will be greater than or less than the performance shown in the graph below due to different sales loads and expenses applicable to such classes. The graph and performance table below do not reflect the deduction of taxes that a shareholder would pay on Fund distributions or the redemption of Fund shares. During certain periods, expenses of the Fund have been waived or reimbursed by Lord Abbett and reimbursed by the Underlying Funds; without such waiver or reimbursement of expenses, the Fund’s returns would have been lower. Past performance is no guarantee of future results.
8
| Average Annual Total Returns at Maximum Applicable Sales Charge for the Periods Ended November 30, 2021 | |||||||||
| 1 Year | 5 Year | 10 Year | Life of Class | ||||||
| Class A4 | 10.37% | 9.24% | 8.82% | – | |||||
| Class C5 | 11.01% | 8.93% | 8.25% | – | |||||
| Class F6 | 13.06% | 9.93% | 9.23% | – | |||||
| Class F37 | 13.25% | – | – | 9.73% | |||||
| Class I6 | 13.26% | 10.03% | 9.34% | – | |||||
| Class P6 | 12.72% | 9.54% | 8.85% | – | |||||
| Class R26 | 12.55% | 9.38% | 8.69% | – | |||||
| Class R36 | 12.62% | 9.49% | 8.80% | – | |||||
| Class R48 | 12.88% | 9.75% | – | 7.92% | |||||
| Class R58 | 13.15% | 10.02% | – | 8.19% | |||||
| Class R68 | 13.26% | 10.10% | – | 8.24% | |||||
1 Reflects the deduction of the maximum initial sales charge of 2.25%.
2 Performance for the unmanaged index does not reflect any fees or expenses. The performance of the index is not necessarily representative of the Fund’s performance.
3 Source: Morningstar, Inc. The performance of the average is not necessarily representative of the Fund’s performance.
4 Total return, which is the percentage change in net asset value, after deduction of the maximum initial sales charge of 2.25% applicable to Class A shares, with all dividends and distributions reinvested for the periods shown ended
November 30, 2021, is calculated using the SEC-required uniform method to compute such return.
5 The 1% CDSC for Class C shares normally applies before the first anniversary of the purchase date. Performance for other periods is at net asset value.
6 Performance is at net asset value.
7 Commenced operations and performance for the class began on April 4, 2017. Performance is at net asset value.
8 Commenced operations and performance for the class began on June 30, 2015. Performance is at net asset value.
9
Multi-Asset Income Fund
Investment Comparison
Below is a comparison of a $10,000 investment in Class A shares with the same investment in the Bloomberg U.S. Aggregate Bond Index, 45% Bloomberg U.S. Aggregate Bond Index/25% ICE BofA U.S. High Yield Constrained Index/20% Russell 1000® Index/10% MSCI EAFE® Index with Gross Dividends and the Morningstar Allocation 30-50% Equity Category Average, assuming reinvestment of all dividends and distributions. The graph and performance table below do not reflect the deduction of taxes that a shareholder would pay on Fund distributions or the redemption of Fund shares. During certain periods, expenses of the Fund have been waived or reimbursed by Lord Abbett and reimbursed by the Underlying Funds; without such waiver or reimbursement of expenses, the Fund’s returns would have been lower. Past performance is no guarantee of future results.
10
| Average Annual Total Returns at Maximum Applicable Sales Charge for the Periods Ended November 30, 2021 | |||||||||
| 1 Year | 5 Year | 10 Year | Life of Class | ||||||
| Class A4 | 6.96% | 7.11% | 6.75% | – | |||||
| Class C5 | 7.66% | 6.80% | 6.19% | – | |||||
| Class F6 | 9.59% | 7.77% | 7.15% | – | |||||
| Class F37 | 9.76% | – | – | 7.58% | |||||
| Class I6 | 9.70% | 7.87% | 7.25% | – | |||||
| Class R26 | 9.06% | 7.23% | 6.61% | – | |||||
| Class R36 | 9.15% | 7.34% | 6.72% | – | |||||
| Class R48 | 9.43% | 7.60% | – | 6.26% | |||||
| Class R58 | 9.76% | 7.88% | – | 6.53% | |||||
| Class R68 | 9.76% | 7.94% | – | 6.57% | |||||
1 Reflects the deduction of the maximum initial sales charge of 2.25%.
2 Performance for the unmanaged index does not reflect any fees or expenses. The performance of the index is not necessarily representative of the Fund’s performance.
3 Source: Morningstar, Inc. The performance of the average is not necessarily representative of the Fund’s performance.
4 Total return, which is the percentage change in net asset value, after deduction of the maximum initial sales charge of 2.25% applicable to Class A shares, with all dividends and distributions reinvested for the periods shown ended
November 30, 2021, is calculated using the SEC-required uniform method to compute such return.
5 The 1% CDSC for Class C shares normally applies before the first anniversary of the purchase date. Performance for other periods is at net asset value.
6 Performance is at net asset value.
7 Commenced operations and performance for the class began on April 4, 2017. Performance is at net asset value.
8 Commenced operations and performance for the class began on June 30, 2015. Performance is at net asset value.
11
As a shareholder of a Fund, you incur two types of costs: (1) transaction costs, including sales charges (loads) on purchase payments (these charges vary among the share classes); and (2) ongoing costs, including management fees; distribution and service (12b-1) fees (these charges vary among the share classes); and other Fund expenses. This Example is intended to help you understand your ongoing costs (in dollars) of investing in each Fund and to compare these costs with the ongoing costs of investing in other mutual funds.
The Example is based on an investment of $1,000 invested at the beginning of the period and held for the entire period (June 1, 2021 through November 30, 2021).
Actual Expenses
For each class of each Fund, the first line of the applicable table on the following pages provides information about actual account values and actual expenses. You may use the information in this line, together with the amount you invested, to estimate the expenses that you paid over the period. Simply divide your account value by $1,000 (for example, an $8,600 account value divided by $1,000 = 8.6), then multiply the result by the number in the first line under the heading entitled “Expenses Paid During Period 6/1/21 – 11/30/21” to estimate the expenses you paid on your account during this period.
Hypothetical Example for Comparison Purposes
For each class of each Fund, the second line of the applicable table on the following pages provides information about hypothetical account values and hypothetical expenses based on the Fund’s actual expense ratio and an assumed rate of return of 5% per year before expenses, which is not the Fund’s actual return. The hypothetical account values and expenses may not be used to estimate the actual ending account balance or expenses you paid for the period. You may use this information to compare the ongoing costs of investing in each Fund and other funds. To do so, compare this 5% hypothetical example with the 5% hypothetical examples that appear in the shareholder reports of the other funds.
12
Multi-Asset Balanced Opportunity Fund
Please note that the expenses shown in the table are meant to highlight your ongoing costs only and do not reflect any transactional costs, such as sales charges (loads). Therefore, the second line of the table is useful in comparing ongoing costs only, and will not help you determine the relative total costs of owning different funds. In addition, if these transactional costs were included, your costs would have been higher.
| Beginning Account Value | Ending Account Value | Expenses Paid During Period†# | |||||
| 6/1/21 | 11/30/21 | 6/1/21 - 11/30/21 | |||||
| Class A | |||||||
| Actual | $1,000.00 | $ 999.70 | $2.46 | ||||
| Hypothetical (5% Return Before Expenses) | $1,000.00 | $1,022.61 | $2.48 | ||||
| Class C | |||||||
| Actual | $1,000.00 | $ 995.30 | $6.20 | ||||
| Hypothetical (5% Return Before Expenses) | $1,000.00 | $1,018.85 | $6.28 | ||||
| Class F | |||||||
| Actual | $1,000.00 | $1,000.50 | $1.71 | ||||
| Hypothetical (5% Return Before Expenses) | $1,000.00 | $1,023.36 | $1.72 | ||||
| Class F3 | |||||||
| Actual | $1,000.00 | $1,001.10 | $0.80 | ||||
| Hypothetical (5% Return Before Expenses) | $1,000.00 | $1,024.27 | $0.81 | ||||
| Class I | |||||||
| Actual | $1,000.00 | $1,001.00 | $1.20 | ||||
| Hypothetical (5% Return Before Expenses) | $1,000.00 | $1,023.87 | $1.22 | ||||
| Class P | |||||||
| Actual | $1,000.00 | $ 998.70 | $3.46 | ||||
| Hypothetical (5% Return Before Expenses) | $1,000.00 | $1,021.61 | $3.50 | ||||
| Class R2 | |||||||
| Actual | $1,000.00 | $ 997.90 | $4.21 | ||||
| Hypothetical (5% Return Before Expenses) | $1,000.00 | $1,020.86 | $4.26 | ||||
| Class R3 | |||||||
| Actual | $1,000.00 | $ 998.40 | $3.71 | ||||
| Hypothetical (5% Return Before Expenses) | $1,000.00 | $1,021.36 | $3.75 | ||||
| Class R4 | |||||||
| Actual | $1,000.00 | $ 999.70 | $2.46 | ||||
| Hypothetical (5% Return Before Expenses) | $1,000.00 | $1,022.61 | $2.48 | ||||
| Class R5 | |||||||
| Actual | $1,000.00 | $1,000.30 | $1.20 | ||||
| Hypothetical (5% Return Before Expenses) | $1,000.00 | $1,023.87 | $1.22 | ||||
| Class R6 | |||||||
| Actual | $1,000.00 | $1,001.10 | $0.80 | ||||
| Hypothetical (5% Return Before Expenses) | $1,000.00 | $1,024.27 | $0.81 |
| † | For each class of the Fund, net expenses are equal to the annualized expense ratio for such class (0.49% for Class A, 1.24% for Class C, 0.34% for Class F, 0.16% for Class F3, 0.24% for Class I, 0.69% for Class P, 0.84% for Class R2, 0.74% for Class R3, 0.49% for Class R4, 0.24% for Class R5 and 0.16% for Class R6) multiplied by the average account value over the period, multiplied by 183/365 (to reflect one-half year period). |
| # | Does not include expenses of the Underlying Funds in which Multi-Asset Balanced Opportunity Fund invests. |
13
Portfolio Holdings Presented by Portfolio Allocation
November 30, 2021
| Underlying Fund Name | %* | |||
| Lord Abbett Investment Trust-Convertible Fund-Class I | 1.41 | % | ||
| Lord Abbett Investment Trust-Core Fixed Income Fund-Class I | 3.23 | % | ||
| Lord Abbett Securities Trust-Durable Growth Fund-Class I | 6.54 | % | ||
| Lord Abbett Global Fund, Inc.-Emerging Markets Bond Fund-Class I | 4.38 | % | ||
| Lord Abbett Investment Trust-Floating Rate Fund-Class I | 0.42 | % | ||
| Lord Abbett Securities Trust-Focused Large Cap Value Fund-Class I | 18.12 | % | ||
| Lord Abbett Securities Trust-Focused Small Cap Value Fund-Class I | 0.52 | % | ||
| Lord Abbett Securities Trust-Fundamental Equity Fund-Class I | 6.14 | % | ||
| Lord Abbett Securities Trust-Growth Leaders Fund-Class I | 11.05 | % | ||
| Lord Abbett Research Fund, Inc.-Growth Opportunities Fund-Class I | 5.83 | % | ||
| Lord Abbett Investment Trust-High Yield Fund-Class I | 16.62 | % | ||
| Lord Abbett Investment Trust-Inflation Focused Fund-Class I | 5.05 | % | ||
| Lord Abbett Securities Trust-International Equity Fund-Class I | 3.91 | % | ||
| Lord Abbett Securities Trust-International Value Fund-Class I | 7.74 | % | ||
| Lord Abbett Mid Cap Stock Fund, Inc.-Class I | 4.44 | % | ||
| Lord Abbett Investment Trust-Short Duration Income Fund-Class I | 0.58 | % | ||
| Lord Abbett Securities Trust-Value Opportunities Fund-Class I | 3.98 | % | ||
| Repurchase Agreements | 0.04 | % | ||
| Total | 100.00 | % | ||
| * | Represents percent of total investments. |
14
Multi-Asset Income Fund
Please note that the expenses shown in the table are meant to highlight your ongoing costs only and do not reflect any transactional costs, such as sales charges (loads). Therefore, the second line of the table is useful in comparing ongoing costs only, and will not help you determine the relative total costs of owning different funds. In addition, if these transactional costs were included, your costs would have been higher.
| Beginning Account Value | Ending Account Value | Expenses Paid During Period†# | |||||
| 6/1/21 | 11/30/21 | 6/1/21 - 11/30/21 | |||||
| Class A | |||||||
| Actual | $1,000.00 | $ 993.20 | $2.40 | ||||
| Hypothetical (5% Return Before Expenses) | $1,000.00 | $1,022.66 | $2.43 | ||||
| Class C | |||||||
| Actual | $1,000.00 | $ 989.90 | $6.14 | ||||
| Hypothetical (5% Return Before Expenses) | $1,000.00 | $1,018.90 | $6.23 | ||||
| Class F | |||||||
| Actual | $1,000.00 | $ 994.00 | $1.65 | ||||
| Hypothetical (5% Return Before Expenses) | $1,000.00 | $1,023.41 | $1.67 | ||||
| Class F3 | |||||||
| Actual | $1,000.00 | $ 994.50 | $0.85 | ||||
| Hypothetical (5% Return Before Expenses) | $1,000.00 | $1,024.22 | $0.86 | ||||
| Class I | |||||||
| Actual | $1,000.00 | $ 994.50 | $1.15 | ||||
| Hypothetical (5% Return Before Expenses) | $1,000.00 | $1,023.92 | $1.17 | ||||
| Class R2 | |||||||
| Actual | $1,000.00 | $ 991.60 | $4.14 | ||||
| Hypothetical (5% Return Before Expenses) | $1,000.00 | $1,020.91 | $4.20 | ||||
| Class R3 | |||||||
| Actual | $1,000.00 | $ 991.90 | $3.65 | ||||
| Hypothetical (5% Return Before Expenses) | $1,000.00 | $1,021.41 | $3.70 | ||||
| Class R4 | |||||||
| Actual | $1,000.00 | $ 993.20 | $2.40 | ||||
| Hypothetical (5% Return Before Expenses) | $1,000.00 | $1,022.66 | $2.43 | ||||
| Class R5 | |||||||
| Actual | $1,000.00 | $ 994.50 | $1.15 | ||||
| Hypothetical (5% Return Before Expenses) | $1,000.00 | $1,023.92 | $1.17 | ||||
| Class R6 | |||||||
| Actual | $1,000.00 | $ 995.10 | $0.85 | ||||
| Hypothetical (5% Return Before Expenses) | $1,000.00 | $1,024.22 | $0.86 |
| † | For each class of the Fund, net expenses are equal to the annualized expense ratio for such class (0.48% for Class A, 1.23% for Class C, 0.33% for Class F, 0.17% for Class F3, 0.23% for Class I, 0.83% for Class R2, 0.73% for Class R3, 0.48% for Class R4, 0.23% for Class R5 and 0.17% for Class R6) multiplied by the average account value over the period, multiplied by 183/365 (to reflect one-half year period). |
| # | Does not include expenses of the Underlying Funds in which Multi-Asset Income Fund invests. |
15
Portfolio Holdings Presented by Portfolio Allocation
November 30, 2021
| Underlying Fund Name | %* | |||
| Lord Abbett Investment Trust-Convertible Fund-Class I | 1.01 | % | ||
| Lord Abbett Investment Trust-Core Fixed Income Fund-Class I | 12.78 | % | ||
| Lord Abbett Securities Trust-Durable Growth Fund-Class I | 5.24 | % | ||
| Lord Abbett Global Fund, Inc.-Emerging Markets Bond Fund-Class I | 4.89 | % | ||
| Lord Abbett Investment Trust-Floating Rate Fund-Class I | 2.97 | % | ||
| Lord Abbett Securities Trust-Focused Large Cap Value Fund-Class I | 11.46 | % | ||
| Lord Abbett Securities Trust-Focused Small Cap Value Fund-Class I | 0.42 | % | ||
| Lord Abbett Securities Trust-Fundamental Equity Fund-Class I | 4.47 | % | ||
| Lord Abbett Securities Trust-Growth Leaders Fund-Class I | 6.93 | % | ||
| Lord Abbett Research Fund, Inc.-Growth Opportunities Fund-Class I | 3.84 | % | ||
| Lord Abbett Investment Trust-High Yield Fund-Class I | 18.10 | % | ||
| Lord Abbett Investment Trust-Inflation Focused Fund-Class I | 8.35 | % | ||
| Lord Abbett Municipal Income Fund-Intermediate Tax-Free Fund-Class I | 1.70 | % | ||
| Lord Abbett Securities Trust-International Equity Fund-Class I | 4.21 | % | ||
| Lord Abbett Securities Trust-International Value Fund-Class I | 7.04 | % | ||
| Lord Abbett Mid Cap Stock Fund, Inc.-Class I | 2.92 | % | ||
| Lord Abbett Investment Trust-Short Duration Income Fund-Class I | 1.02 | % | ||
| Lord Abbett Securities Trust-Value Opportunities Fund-Class I | 2.62 | % | ||
| Repurchase Agreements | 0.03 | % | ||
| Total | 100.00 | % | ||
| * | Represents percent of total investments. |
16
MULTI-ASSET BALANCED OPPORTUNITY FUND November 30, 2021
| Investments | Shares | Fair Value (000) | ||||||
| LONG-TERM INVESTMENTS 99.75% | ||||||||
| INVESTMENTS IN UNDERLYING FUNDS(a)(b) 99.75% | ||||||||
| Lord Abbett Investment Trust-Convertible Fund-Class I(c) | 1,967,065 | $ | 38,141 | |||||
| Lord Abbett Investment Trust-Core Fixed Income Fund-Class I(d) | 7,881,543 | 87,722 | ||||||
| Lord Abbett Securities Trust-Durable Growth Fund-Class I(e) | 8,362,322 | 177,699 | ||||||
| Lord Abbett Global Fund, Inc.-Emerging Markets Bond Fund-Class I(f) | 24,388,702 | 119,017 | ||||||
| Lord Abbett Investment Trust-Floating Rate Fund-Class I(g) | 1,370,636 | 11,472 | ||||||
| Lord Abbett Securities Trust-Focused Large Cap Value Fund-Class I(h) | 33,933,249 | 492,032 | ||||||
| Lord Abbett Securities Trust-Focused Small Cap Value Fund-Class I(h) | 481,273 | 13,971 | ||||||
| Lord Abbett Securities Trust-Fundamental Equity Fund-Class I(i) | 12,700,890 | 166,763 | ||||||
| Lord Abbett Securities Trust-Growth Leaders Fund-Class I*(e) | 6,786,969 | 299,984 | ||||||
| Lord Abbett Research Fund, Inc.-Growth Opportunities Fund-Class I*(e) | 4,280,742 | 158,388 | ||||||
| Lord Abbett Investment Trust-High Yield Fund-Class I(j) | 60,504,965 | 451,367 | ||||||
| Lord Abbett Investment Trust-Inflation Focused Fund-Class I(k) | 11,033,142 | 137,252 | ||||||
| Lord Abbett Securities Trust-International Equity Fund-Class I(h) | 6,188,296 | 106,068 | ||||||
| Lord Abbett Securities Trust-International Value Fund-Class I(l) | 27,569,113 | 210,077 | ||||||
| Lord Abbett Mid Cap Stock Fund, Inc.-Class I(m) | 3,453,396 | 120,558 | ||||||
| Lord Abbett Investment Trust-Short Duration Income Fund-Class I(n) | 3,766,915 | 15,670 | ||||||
| Lord Abbett Securities Trust-Value Opportunities Fund-Class I(h) | 5,017,184 | 108,120 | ||||||
| Total Investments in Underlying Funds (cost 2,583,082,024) | 2,714,301 | |||||||
| Principal Amount (000) | ||||||||
| SHORT-TERM INVESTMENTS 0.04% | ||||||||
| REPURCHASE AGREEMENTS 0.04% | ||||||||
| Repurchase Agreement dated 11/30/2021, 0.00% due 12/1/2021 with Fixed Income Clearing Corp. collateralized by $1,032,700 of U.S. Treasury Note at 0.50% due 11/30/2023; value: $1,032,378; proceeds: $1,012,088 (cost $1,012,088) | $1,012 | 1,012 | ||||||
| Total Investments in Securities 99.79% (cost $2,584,094,112) | 2,715,313 | |||||||
| Other Assets and Liabilities – Net(o) 0.21% | 5,722 | |||||||
| Net Assets 100.00% | $ | 2,721,035 | ||||||
| * | Non-income producing security. | |
| (a) | Affiliated issuers (See Note 11). | |
| (b) | These investments offer daily redemptions. | |
| (c) | Fund investment objective is to seek current income and the opportunity for capital appreciation to produce a high total return. |
| See Notes to Financial Statements. | 17 |
Schedule of Investments (continued)
MULTI-ASSET BALANCED OPPORTUNITY FUND November 30, 2021
| (d) | Fund investment objective is to seek income and capital appreciation to produce a high total return. | |
| (e) | Fund investment objective is to seek capital appreciation. | |
| (f) | Fund investment objective is to seek high total return. | |
| (g) | Fund investment objective is to seek a high level of current income. | |
| (h) | Fund investment objective is to seek long-term capital appreciation. | |
| (i) | Fund investment objective is long-term growth of capital and income without excessive fluctuations in market value. | |
| (j) | Fund investment objective is to seek a high current income and the opportunity for capital appreciation to produce a high total return. | |
| (k) | Fund investment objective is to provide investment returns that exceed the rate of inflation in the U.S. economy over a full economic cycle and to seek current income. | |
| (l) | Fund investment objective is to seek a high level of total return. | |
| (m) | Fund investment objective is to seek capital appreciation through investments, primarily in equity securities, which are believed to be undervalued in the marketplace. | |
| (n) | Fund investment objective is to seek a high level of income consistent with preservation of capital. | |
| (o) | Other Assets and Liabilities - Net include net unrealized appreciation on futures contracts and swaps as follows: |
Open Total Return Swap Contracts at November 30, 2021:
| Swap Counterparty | Referenced Index | Referenced Spread | Units | Position | Termination Date | Notional Amount | Notional Value | Unrealized Appreciation | ||||||||||||||
| Citibank | RU10GRTR* | SOFR | 26,550 | Long | 6/2/2022 | $ | 80,400,056 | $ | 80,400,056 | $– | ||||||||||||
| Swap Counterparty | Referenced Index | Referenced Spread | Units | Position | Termination Date | Notional Amount | Notional Value | Unrealized Depreciation | ||||||||||||||
| Citibank | RU10VATR** | SOFR | 36,894 | Short | 6/2/2022 | $ | (80,401,202 | ) | $ | (80,401,202 | ) | $– | ||||||||||
| * | Russell 1000 Growth Total Return Index. | |
| ** | Russell 1000 Total Return Index. | |
| SOFR | Secured Over Night Financing Rate. |
Open Futures Contracts at November 30, 2021:
| Type | Expiration | Contracts | Position | Notional Amount | Notional Value | Unrealized Appreciation | ||||||||||||
| E-Mini Russell 2000 | December 2021 | 367 | Short | $(41,210,056 | ) | $(40,320,455 | ) | $ 889,601 | ||||||||||
| E-Mini S&P 500 | December 2021 | 296 | Short | (68,544,160 | ) | (67,580,500 | ) | 963,660 | ||||||||||
| Total Unrealized Appreciation on Open Futures Contracts | $1,853,261 | |||||||||||||||||
| 18 | See Notes to Financial Statements. |
Schedule of Investments (concluded)
MULTI-ASSET BALANCED OPPORTUNITY FUND November 30, 2021
The following is a summary of the inputs used as of November 30, 2021 in valuing the Fund’s investments carried at fair value(1):
| Investment Type(2) | Level 1 (000) | Level 2 (000) | Level 3 (000) | Total (000) | ||||||||||||
| Long-Term Investments | ||||||||||||||||
| Investments in Underlying Funds | $ | 2,714,301 | $ | – | $ | – | $ | 2,714,301 | ||||||||
| Short-Term Investments | ||||||||||||||||
| Repurchase Agreements | – | 1,012 | – | 1,012 | ||||||||||||
| Total | $ | 2,714,301 | $ | 1,012 | $ | – | $ | 2,715,313 | ||||||||
| Other Financial Instruments | ||||||||||||||||
| Total Return Swap Contracts | ||||||||||||||||
| Assets | $ | – | $ | – | $ | – | $ | – | ||||||||
| Liabilities | – | – | – | – | ||||||||||||
| Futures Contracts | ||||||||||||||||
| Assets | 1,853 | – | – | 1,853 | ||||||||||||
| Liabilities | – | – | – | – | ||||||||||||
| Total | $ | 1,853 | $ | – | $ | – | $ | 1,853 | ||||||||
| (1) | Refer to Note 2(m) for a description of fair value measurements and the three-tier hierarchy of inputs. | |
| (2) | See Schedule of Investments for fair values in each industry and identification of foreign issuers and/or geography. |
A reconciliation of Level 3 investments is presented when the Fund has a material amount of Level 3 investments at the beginning or end of the year in relation to the Fund’s net assets.
| See Notes to Financial Statements. | 19 |
Schedule of Investments
MULTI-ASSET INCOME FUND November 30, 2021
| Investments | Shares | Fair Value (000) | ||||||
| LONG-TERM INVESTMENTS 99.76% | ||||||||
| INVESTMENTS IN UNDERLYING FUNDS(a)(b) 99.76% | ||||||||
| Lord Abbett Investment Trust-Convertible Fund-Class I(c) | 667,097 | $ | 12,935 | |||||
| Lord Abbett Investment Trust-Core Fixed Income Fund-Class I(d) | 14,740,419 | 164,061 | ||||||
| Lord Abbett Securities Trust-Durable Growth Fund-Class I(e) | 3,169,796 | 67,358 | ||||||
| Lord Abbett Global Fund, Inc.-Emerging Markets Bond Fund-Class I(f) | 12,860,935 | 62,761 | ||||||
| Lord Abbett Investment Trust-Floating Rate Fund-Class I(g) | 4,562,103 | 38,185 | ||||||
| Lord Abbett Securities Trust-Focused Large Cap Value Fund-Class I(h) | 10,144,538 | 147,096 | ||||||
| Lord Abbett Securities Trust-Focused Small Cap Value Fund-Class I(h) | 184,397 | 5,353 | ||||||
| Lord Abbett Securities Trust-Fundamental Equity Fund-Class I(i) | 4,374,220 | 57,434 | ||||||
| Lord Abbett Securities Trust-Growth Leaders Fund-Class I*(e) | 2,014,119 | 89,024 | ||||||
| Lord Abbett Research Fund, Inc.-Growth Opportunities Fund-Class I*(e) | 1,331,031 | 49,248 | ||||||
| Lord Abbett Investment Trust-High Yield Fund-Class I(j) | 31,137,764 | 232,288 | ||||||
| Lord Abbett Investment Trust-Inflation Focused Fund-Class I(k) | 8,613,118 | 107,147 | ||||||
| Lord Abbett Municipal Income Fund, Inc.-Intermediate Tax-Free Fund-Class I(l) | 1,920,890 | 21,821 | ||||||
| Lord Abbett Securities Trust-International Equity Fund-Class I(h) | 3,154,784 | 54,073 | ||||||
| Lord Abbett Securities Trust-International Value Fund-Class I(m) | 11,865,300 | 90,414 | ||||||
| Lord Abbett Mid Cap Stock Fund, Inc.-Class I(n) | 1,072,818 | 37,452 | ||||||
| Lord Abbett Investment Trust-Short Duration Income Fund-Class I(o) | 3,145,733 | 13,086 | ||||||
| Lord Abbett Securities Trust-Value Opportunities Fund-Class I(h) | 1,558,292 | 33,581 | ||||||
| Total Investments in Underlying Funds (cost 1,241,241,447) | 1,283,317 | |||||||
| Principal Amount (000) | ||||||||
| SHORT-TERM INVESTMENTS 0.03% | ||||||||
| REPURCHASE AGREEMENTS 0.03% | ||||||||
| Repurchase Agreement dated 11/30/2021, 0.00% due 12/1/2021 with Fixed Income Clearing Corp. collateralized by $395,000 of U.S. Treasury Note at 0.50% due 11/30/2023; value: $394,877; proceeds: $387,082 (cost $387,082) | $387 | 387 | ||||||
| Total Investments in Securities 99.79% (cost $1,241,628,529) | 1,283,704 | |||||||
| Other Assets and Liabilities – Net(p) 0.21% | 2,751 | |||||||
| Net Assets 100.00% | $ | 1,286,455 | ||||||
| * | Non-income producing security. | |
| (a) | Affiliated issuers (See Note 11). | |
| (b) | These investments offer daily redemptions. |
| 20 | See Notes to Financial Statements. |
Schedule of Investments (continued)
MULTI-ASSET INCOME FUND November 30, 2021
| (c) | Fund investment objective is to seek current income and the opportunity for capital appreciation to produce a high total return. | |
| (d) | Fund investment objective is to seek income and capital appreciation to produce a high total return. | |
| (e) | Fund investment objective is to seek capital appreciation. | |
| (f) | Fund investment objective is to seek high total return. | |
| (g) | Fund investment objective is to seek a high level of current income. | |
| (h) | Fund investment objective is to seek long-term capital appreciation. | |
| (i) | Fund investment objective is long-term growth of capital and income without excessive fluctuations in market value. | |
| (j) | Fund investment objective is to seek a high current income and the opportunity for capital appreciation to produce a high total return. | |
| (k) | Fund investment objective is to provide investment returns that exceed the rate of inflation in the U.S. economy over a full economic cycle and to seek current income. | |
| (l) | Fund investment objective is to seek the maximum amount of interest income exempt from federal income tax as is consistent with reasonable risk. | |
| (m) | Fund investment objective is to seek a high level of total return. | |
| (n) | Fund investment objective is to seek capital appreciation through investments, primarily in equity securities, which are believed to be undervalued in the marketplace. | |
| (o) | Fund investment objective is to seek a high level of income consistent with preservation of capital. | |
| (p) | Other Assets and Liabilities - Net include net unrealized appreciation on futures contracts and swaps as follows: |
Open Total Return Swap Contracts at November 30, 2021:
| Swap Counterparty | Referenced Index | Referenced Spread | Units | Position | Termination Date | Notional Amount | Notional Value | Unrealized Appreciation | ||||||||||||||
| Citibank | RU10GRTR* | SOFR | 13,077 | Long | 6/2/2022 | $ | 39,600,434 | $ | 39,600,434 | $– | ||||||||||||
| Swap Counterparty | Referenced Index | Referenced Spread | Units | Position | Termination Date | Notional Amount | Notional Value | Unrealized Depreciation | ||||||||||||||
| Citibank | RU10VATR** | SOFR | 18,171 | Short | 6/2/2022 | $ | (39,599,128 | ) | $ | (39,599,128 | ) | $– | ||||||||||
| * | Russell 1000 Growth Total Return Index. | |
| ** | Russell 1000 Total Return Index. | |
| SOFR | Secured Over Night Financing Rate. |
Open Futures Contracts at November 30, 2021:
| Type | Expiration | Contracts | Position | Notional Amount | Notional Value | Unrealized Appreciation | ||||||||||||
| E-Mini Russell 2000 | December 2021 | 173 | Short | $(19,425,993 | ) | $(19,006,645 | ) | $419,348 | ||||||||||
| E-Mini S&P 500 | December 2021 | 139 | Short | (32,187,967 | ) | (31,735,437 | ) | 452,530 | ||||||||||
| Total Unrealized Appreciation on Open Futures Contracts | $871,878 | |||||||||||||||||
| See Notes to Financial Statements. | 21 |
Schedule of Investments (concluded)
MULTI-ASSET INCOME FUND November 30, 2021
The following is a summary of the inputs used as of November 30, 2021 in valuing the Fund’s investments carried at fair value(1):
| Investment Type(2) | Level 1 (000) | Level 2 (000) | Level 3 (000) | Total (000) | ||||||||||||
| Long-Term Investments | ||||||||||||||||
| Investments in Underlying Funds | $ | 1,283,317 | $ | – | $ | – | $ | 1,283,317 | ||||||||
| Short-Term Investments | ||||||||||||||||
| Repurchase Agreements | – | 387 | – | 387 | ||||||||||||
| Total | $ | 1,283,317 | $ | 387 | $ | – | $ | 1,283,704 | ||||||||
| Other Financial Instruments | ||||||||||||||||
| Total Return Swap Contracts | ||||||||||||||||
| Assets | $ | – | $ | – | $ | – | $ | – | ||||||||
| Liabilities | – | – | – | – | ||||||||||||
| Futures Contracts | ||||||||||||||||
| Assets | 872 | – | – | 872 | ||||||||||||
| Liabilities | – | – | – | – | ||||||||||||
| Total | $ | 872 | $ | – | $ | – | $ | 872 | ||||||||
| (1) | Refer to Note 2(m) for a description of fair value measurements and the three-tier hierarchy of inputs. | |
| (2) | See Schedule of Investments for fair values in each industry and identification of foreign issuers and/or geography. |
A reconciliation of Level 3 investments is presented when the Fund has a material amount of Level 3 investments at the beginning or end of the year in relation to the Fund’s net assets.
| 22 | See Notes to Financial Statements. |
Statements of Assets and Liabilities
November 30, 2021
| Multi-Asset Balanced Opportunity Fund | Multi-Asset Income Fund | |||||||
| ASSETS: | ||||||||
| Investments in securities, at cost | $ | 1,012,088 | $ | 387,082 | ||||
| Investments in Underlying Funds, at cost | 2,583,082,024 | 1,241,241,447 | ||||||
| Investments in securities, at fair value | $ | 1,012,088 | $ | 387,082 | ||||
| Investments in Underlying Funds, at value | 2,714,301,121 | 1,283,317,064 | ||||||
| Deposits with brokers for futures collateral | 5,789,500 | 2,723,000 | ||||||
| Deposits with brokers for swaps collateral | 770,003 | 620,003 | ||||||
| Receivables: | ||||||||
| Capital shares sold | 15,865,154 | 5,697,077 | ||||||
| Interest and dividends | 2,931,983 | 1,879,097 | ||||||
| Investments in Underlying Funds sold | 1,866,554 | 932,301 | ||||||
| Variation margin for futures contracts | 1,573,512 | 741,719 | ||||||
| From broker | 982,864 | 486,338 | ||||||
| Premiums for OTC written options sold | 356,971 | 178,485 | ||||||
| Prepaid expenses and other assets | 66,690 | 58,335 | ||||||
| Total assets | 2,745,516,440 | 1,297,020,501 | ||||||
| LIABILITIES: | ||||||||
| Payables: | ||||||||
| Investments in Underlying Funds purchased | 2,927,805 | 1,876,983 | ||||||
| Capital shares reacquired | 4,927,720 | 2,023,221 | ||||||
| 12b-1 distribution plan | 566,622 | 359,127 | ||||||
| To bank | 529,953 | 520,000 | ||||||
| Trustees’ fees | 439,229 | 197,388 | ||||||
| Premiums for options purchased | 356,971 | 178,485 | ||||||
| Management fee | 231,493 | 108,513 | ||||||
| Fund administration | 92,597 | 43,407 | ||||||
| Variation margin for futures contracts | 77,762 | 39,068 | ||||||
| Foreign currency overdraft (cost $220 and $533, respectively) | 213 | 575 | ||||||
| Distributions payable | 13,910,975 | 5,017,286 | ||||||
| Accrued expenses and other liabilities | 420,038 | 201,079 | ||||||
| Total liabilities | 24,481,378 | 10,565,132 | ||||||
| Commitments and contingent liabilities | ||||||||
| NET ASSETS | $ | 2,721,035,062 | $ | 1,286,455,369 | ||||
| COMPOSITION OF NET ASSETS: | ||||||||
| Paid-in capital | $ | 2,247,461,053 | $ | 1,242,650,473 | ||||
| Total distributable earnings (loss) | 473,574,009 | 43,804,896 | ||||||
| Net Assets | $ | 2,721,035,062 | $ | 1,286,455,369 | ||||
| See Notes to Financial Statements. | 23 |
Statements of Assets and Liabilities (concluded)
November 30, 2021
| Multi-Asset Balanced Opportunity Fund | Multi-Asset Income Fund | |||||||
| Net assets by class: | ||||||||
| Class A Shares | $ | 2,293,946,845 | $ | 855,806,215 | ||||
| Class C Shares | $ | 223,712,654 | $ | 188,841,840 | ||||
| Class F Shares | $ | 84,161,502 | $ | 176,727,247 | ||||
| Class F3 Shares | $ | 57,630 | $ | 1,734,801 | ||||
| Class I Shares | $ | 41,327,070 | $ | 37,859,772 | ||||
| Class P Shares | $ | 820,454 | – | |||||
| Class R2 Shares | $ | 686,301 | $ | 139,613 | ||||
| Class R3 Shares | $ | 49,825,111 | $ | 20,698,782 | ||||
| Class R4 Shares | $ | 14,342,618 | $ | 3,435,283 | ||||
| Class R5 Shares | $ | 186,027 | $ | 52,846 | ||||
| Class R6 Shares | $ | 11,968,850 | $ | 1,158,970 | ||||
| Outstanding shares by class (unlimited number of authorized shares of beneficial interest): | ||||||||
| Class A Shares | 163,775,536 | 49,218,565 | ||||||
| Class C Shares | 16,091,708 | 10,678,544 | ||||||
| Class F Shares | 6,008,973 | 10,165,019 | ||||||
| Class F3 Shares | 4,101 | 100,178 | ||||||
| Class I Shares | 2,951,031 | 2,191,229 | ||||||
| Class P Shares | 58,878 | – | ||||||
| Class R2 Shares | 47,777 | 7,794 | ||||||
| Class R3 Shares | 3,563,952 | 1,190,302 | ||||||
| Class R4 Shares | 1,023,898 | 197,581 | ||||||
| Class R5 Shares | 13,258 | 3,057 | ||||||
| Class R6 Shares | 852,616 | 66,931 | ||||||
| Net Asset Value, offering and redemption price per share (Net assets divided by outstanding shares): | ||||||||
| Class A Shares-Net asset value | $14.01 | $17.39 | ||||||
| Class A Shares-Maximum offering price (Net asset value plus sales charge of 2.25%) | $14.33 | $17.79 | ||||||
| Class C Shares-Net asset value | $13.90 | $17.68 | ||||||
| Class F Shares-Net asset value | $14.01 | $17.39 | ||||||
| Class F3 Shares-Net asset value | $14.05 | $17.32 | ||||||
| Class I Shares-Net asset value | $14.00 | $17.28 | ||||||
| Class P Shares-Net asset value | $13.93 | – | ||||||
| Class R2 Shares-Net asset value* | $14.36 | $17.92 | ||||||
| Class R3 Shares-Net asset value | $13.98 | $17.39 | ||||||
| Class R4 Shares-Net asset value | $14.01 | $17.39 | ||||||
| Class R5 Shares-Net asset value* | $14.03 | $17.28 | ||||||
| Class R6 Shares-Net asset value | $14.04 | $17.32 | ||||||
* Net asset value may not recalculate due to rounding of fractional shares.
| 24 | See Notes to Financial Statements. |
For the Year Ended November 30, 2021
| Multi-Asset Balanced Opportunity Fund | Multi-Asset Income Fund | |||||||
| Investment income: | ||||||||
| Dividends | $ | 55,773,967 | $ | 29,509,933 | ||||
| Interest and other | 4,896 | 2,077 | ||||||
| Total investment income | 55,778,863 | 29,512,010 | ||||||
| Expenses: | ||||||||
| Management fee | 2,724,186 | 1,289,982 | ||||||
| 12b-1 distribution plan-Class A | 5,690,639 | 2,057,050 | ||||||
| 12b-1 distribution plan-Class C | 2,492,937 | 2,249,430 | ||||||
| 12b-1 distribution plan-Class F | 78,909 | 177,395 | ||||||
| 12b-1 distribution plan-Class P | 3,562 | – | ||||||
| 12b-1 distribution plan-Class R2 | 3,905 | 820 | ||||||
| 12b-1 distribution plan-Class R3 | 249,326 | 101,003 | ||||||
| 12b-1 distribution plan-Class R4 | 37,025 | 8,347 | ||||||
| Shareholder servicing | 2,331,328 | 890,087 | ||||||
| Fund administration | 1,089,674 | 515,993 | ||||||
| Registration | 190,777 | 165,446 | ||||||
| Trustees’ fees | 105,503 | 57,549 | ||||||
| Reports to shareholders | 66,032 | 25,306 | ||||||
| Custody | 56,778 | 43,923 | ||||||
| Professional | 51,128 | 41,079 | ||||||
| Other | 32,464 | 22,414 | ||||||
| Gross expenses | 15,204,173 | 7,645,824 | ||||||
| Expense reductions (See Note 9) | (2,454 | ) | (1,166 | ) | ||||
| Fees waived and expenses reimbursed (See Note 3) | (56,778 | ) | (43,923 | ) | ||||
| Net expenses | 15,144,941 | 7,600,735 | ||||||
| Net investment income | 40,633,922 | 21,911,275 | ||||||
| Net realized and unrealized gain (loss): | ||||||||
| Capital gain distributions received from Underlying Funds | 254,567,055 | 84,875,690 | ||||||
| Net realized gain (loss) on Investments in Underlying Funds | 248,232,403 | 94,294,119 | ||||||
| Net realized gain (loss) on Investments | (61,773,106 | ) | (26,159,384 | ) | ||||
| Net realized gain (loss) on futures contracts | (41,942,948 | ) | (23,026,397 | ) | ||||
| Net realized gain (loss) on forward foreign currency exchange contracts | (857 | ) | (857 | ) | ||||
| Net realized gain (loss) on OTC written options | 31,934,829 | 14,328,361 | ||||||
| Net realized gain (loss) on swap contracts | (345,469 | ) | 675,757 | |||||
| Net realized gain (loss) on foreign currency related transactions | (19,069 | ) | (9,684 | ) | ||||
| Net change in unrealized appreciation/depreciation in Underlying Funds | (169,067,489 | ) | (63,099,650 | ) | ||||
| Net change in unrealized appreciation/depreciation on Investments | 46,274,383 | 19,980,930 | ||||||
| Net change in unrealized appreciation/depreciation on futures contracts | (2,784,760 | ) | (169,005 | ) | ||||
| Net change in unrealized appreciation/depreciation on forward foreign currency exchange contracts | 851 | 851 | ||||||
| Net change in unrealized appreciation/depreciation on OTC written options | (25,746,802 | ) | (11,760,042 | ) | ||||
| Net change in unrealized appreciation/depreciation on swap contracts | (1,072,525 | ) | (528,243 | ) | ||||
| Net change in unrealized appreciation/depreciation on translation of assets and liabilities denominated in foreign currencies | 166,240 | 166,216 | ||||||
| Net realized and unrealized gain (loss) | 278,422,736 | 89,568,662 | ||||||
| Net Increase in Net Assets Resulting From Operations | $ | 319,056,658 | $ | 111,479,937 | ||||
| See Notes to Financial Statements. | 25 |
Statements of Changes in Net Assets
| Multi-Asset Balanced Opportunity Fund | ||||||||||
| INCREASE (DECREASE) IN NET ASSETS | For the Year Ended November 30, 2021 | For the Year Ended November 30, 2020 | ||||||||
| Operations: | ||||||||||
| Net investment income | $ | 40,633,922 | $ | 40,156,580 | ||||||
| Capital gain distributions received from Underlying Funds | 254,567,055 | 86,475,454 | ||||||||
| Net realized gain (loss) on Investments in Underlying Funds | 248,232,403 | 9,512,911 | ||||||||
| Net realized (loss) on investments | (61,773,106 | ) | (7,235,778 | ) | ||||||
| Net realized (loss) on futures contracts, forward foreign currency exchange contracts, OTC written options, swaps and foreign currency related transactions | (10,373,514 | ) | (17,124,748 | ) | ||||||
| Net change in unrealized appreciation/depreciation on Investments in Underlying Funds | (169,067,489 | ) | 261,894,039 | |||||||
| Net change in unrealized appreciation/depreciation on Investments | 46,274,383 | (46,274,383 | ) | |||||||
| Net change in unrealized appreciation/depreciation on futures contracts, forward foreign currency exchange contracts, OTC written options, swaps and translation of assets and liabilities denominated in foreign currencies | (29,436,996 | ) | 32,822,992 | |||||||
| Net increase in net assets resulting from operations | 319,056,658 | 360,227,067 | ||||||||
| Distributions to shareholders: | ||||||||||
| Class A | (124,302,535 | ) | (63,141,333 | ) | ||||||
| Class C | (12,860,442 | ) | (8,012,384 | ) | ||||||
| Class F | (4,341,328 | ) | (2,348,286 | ) | ||||||
| Class F3 | (7,409 | ) | (1,809 | ) | ||||||
| Class I | (2,331,007 | ) | (1,063,213 | ) | ||||||
| Class P | (42,190 | ) | (18,781 | ) | ||||||
| Class R2 | (32,515 | ) | (21,299 | ) | ||||||
| Class R3 | (2,655,325 | ) | (1,464,731 | ) | ||||||
| Class R4 | (814,103 | ) | (403,633 | ) | ||||||
| Class R5 | (10,816 | ) | (8,941 | ) | ||||||
| Class R6 | (665,262 | ) | (496,087 | ) | ||||||
| Total distributions to shareholders | (148,062,932 | ) | (76,980,497 | ) | ||||||
| Capital share transactions (Net of share conversions) (See Note 14): | ||||||||||
| Net proceeds from sales of shares | 278,728,776 | 183,969,392 | ||||||||
| Reinvestment of distributions | 143,736,619 | 75,069,227 | ||||||||
| Cost of shares reacquired | (396,771,892 | ) | (514,582,678 | ) | ||||||
| Net increase (decrease) in net assets resulting from capital share transactions | 25,693,503 | (255,544,059 | ) | |||||||
| Net increase (decrease) in net assets | 196,687,229 | 27,702,511 | ||||||||
| NET ASSETS: | ||||||||||
| Beginning of year | $ | 2,524,347,833 | $ | 2,496,645,322 | ||||||
| End of year | $ | 2,721,035,062 | $ | 2,524,347,833 | ||||||
| 26 | See Notes to Financial Statements. |
Statements of Changes in Net Assets (concluded)
| Multi-Asset Income Fund | ||||||||||
| INCREASE (DECREASE) IN NET ASSETS | For the Year Ended November 30, 2021 | For the Year Ended November 30, 2020 | ||||||||
| Operations: | ||||||||||
| Net investment income | $ | 21,911,275 | $ | 24,100,213 | ||||||
| Capital gain distributions received from Underlying Funds | 84,875,690 | 31,334,183 | ||||||||
| Net realized gain (loss) on Investments in Underlying Funds | 94,294,119 | (193,068 | ) | |||||||
| Net realized (loss) on investments | (26,159,384 | ) | (7,235,778 | ) | ||||||
| Net realized (loss) on futures contracts, forward foreign currency exchange contracts, OTC written options, swaps and foreign currency related transactions | (8,032,820 | ) | (10,652,546 | ) | ||||||
| Net change in unrealized appreciation/depreciation on Investments in Underlying Funds | (63,099,650 | ) | 96,241,032 | |||||||
| Net change in unrealized appreciation/depreciation on Investments | 19,980,930 | (19,980,930 | ) | |||||||
| Net change in unrealized appreciation/depreciation on futures contracts, forward foreign currency exchange contracts, OTC written options, swaps and translation of assets and liabilities denominated in foreign currencies | (12,290,223 | ) | 13,970,647 | |||||||
| Net increase in net assets resulting from operations | 111,479,937 | 127,583,753 | ||||||||
| Distributions to shareholders: | ||||||||||
| Class A | (28,277,347 | ) | (16,082,638 | ) | ||||||
| Class C | (6,337,598 | ) | (4,729,009 | ) | ||||||
| Class F | (6,415,992 | ) | (4,568,847 | ) | ||||||
| Class F3 | (75,006 | ) | (58,861 | ) | ||||||
| Class I | (1,426,865 | ) | (1,015,424 | ) | ||||||
| Class P | – | – | ||||||||
| Class R2 | (4,068 | ) | (2,452 | ) | ||||||
| Class R3 | (650,165 | ) | (423,860 | ) | ||||||
| Class R4 | (113,809 | ) | (62,614 | ) | ||||||
| Class R5 | (1,907 | ) | (1,074 | ) | ||||||
| Class R6 | (42,452 | ) | (54,611 | ) | ||||||
| Total distributions to shareholders | (43,345,209 | ) | (26,999,390 | ) | ||||||
| Capital share transactions (Net of share conversions) (See Note 14): | ||||||||||
| Net proceeds from sales of shares | 187,643,881 | 117,383,469 | ||||||||
| Reinvestment of distributions | 40,142,084 | 25,100,919 | ||||||||
| Cost of shares reacquired | (221,884,544 | ) | (323,495,816 | ) | ||||||
| Net increase (decrease) in net assets resulting from capital share transactions | 5,901,421 | (181,011,428 | ) | |||||||
| Net increase (decrease) in net assets | 74,036,149 | (80,427,065 | ) | |||||||
| NET ASSETS: | ||||||||||
| Beginning of year | $ | 1,212,419,220 | $ | 1,292,846,285 | ||||||
| End of year | $ | 1,286,455,369 | $ | 1,212,419,220 | ||||||
| See Notes to Financial Statements. | 27 |
MULTI-ASSET BALANCED OPPORTUNITY FUND
| Per Share Operating Performance: | ||||||||||||||||||||||||||||
| Distributions to | ||||||||||||||||||||||||||||
| Investment Operations: | shareholders from: | |||||||||||||||||||||||||||
| Total | ||||||||||||||||||||||||||||
| Net | from | |||||||||||||||||||||||||||
| Net asset | Net | realized | invest- | |||||||||||||||||||||||||
| value, | invest- | and | ment | Net | Net | Total | ||||||||||||||||||||||
| beginning | ment | unrealized | opera- | investment | realized | distri- | ||||||||||||||||||||||
| of period | income(b) | gain (loss) | tions | income | gain | butions | ||||||||||||||||||||||
| Class A | ||||||||||||||||||||||||||||
| 11/30/2021 | $ | 13.15 | $ | 0.22 | $ | 1.42 | $ | 1.64 | $ | (0.51 | ) | $ | (0.27 | ) | $ | (0.78 | ) | |||||||||||
| 11/30/2020 | 11.60 | 0.21 | 1.66 | 1.87 | (0.18 | ) | (0.14 | ) | (0.32 | ) | ||||||||||||||||||
| 11/30/2019 | 11.28 | 0.24 | 0.80 | 1.04 | (0.38 | ) | (0.34 | ) | (0.72 | ) | ||||||||||||||||||
| 11/30/2018 | 12.19 | 0.25 | (0.50 | ) | (0.25 | ) | (0.42 | ) | (0.24 | ) | (0.66 | ) | ||||||||||||||||
| 11/30/2017 | 11.23 | 0.33 | 0.97 | 1.30 | (0.34 | ) | – | (0.34 | ) | |||||||||||||||||||
| Class C | ||||||||||||||||||||||||||||
| 11/30/2021 | 13.06 | 0.11 | 1.41 | 1.52 | (0.41 | ) | (0.27 | ) | (0.68 | ) | ||||||||||||||||||
| 11/30/2020 | 11.53 | 0.12 | 1.65 | 1.77 | (0.10 | ) | (0.14 | ) | (0.24 | ) | ||||||||||||||||||
| 11/30/2019 | 11.22 | 0.16 | 0.79 | 0.95 | (0.30 | ) | (0.34 | ) | (0.64 | ) | ||||||||||||||||||
| 11/30/2018 | 12.12 | 0.16 | (0.49 | ) | (0.33 | ) | (0.33 | ) | (0.24 | ) | (0.57 | ) | ||||||||||||||||
| 11/30/2017 | 11.16 | 0.24 | 0.97 | 1.21 | (0.25 | ) | – | (0.25 | ) | |||||||||||||||||||
| Class F | ||||||||||||||||||||||||||||
| 11/30/2021 | 13.15 | 0.24 | 1.42 | 1.66 | (0.53 | ) | (0.27 | ) | (0.80 | ) | ||||||||||||||||||
| 11/30/2020 | 11.60 | 0.23 | 1.66 | 1.89 | (0.20 | ) | (0.14 | ) | (0.34 | ) | ||||||||||||||||||
| 11/30/2019 | 11.28 | 0.26 | 0.80 | 1.06 | (0.40 | ) | (0.34 | ) | (0.74 | ) | ||||||||||||||||||
| 11/30/2018 | 12.18 | 0.27 | (0.49 | ) | (0.22 | ) | (0.44 | ) | (0.24 | ) | (0.68 | ) | ||||||||||||||||
| 11/30/2017 | 11.22 | 0.36 | 0.99 | 1.32 | (0.36 | ) | – | (0.36 | ) | |||||||||||||||||||
| Class F3 | ||||||||||||||||||||||||||||
| 11/30/2021 | 13.18 | 0.17 | 1.52 | 1.69 | (0.55 | ) | (0.27 | ) | (0.82 | ) | ||||||||||||||||||
| 11/30/2020 | 11.62 | 0.26 | 1.65 | 1.91 | (0.21 | ) | (0.14 | ) | (0.35 | ) | ||||||||||||||||||
| 11/30/2019 | 11.29 | 0.27 | 0.81 | 1.08 | (0.41 | ) | (0.34 | ) | (0.75 | ) | ||||||||||||||||||
| 11/30/2018 | 12.19 | 0.28 | (0.49 | ) | (0.21 | ) | (0.45 | ) | (0.24 | ) | (0.69 | ) | ||||||||||||||||
| 4/4/2017 to 11/30/2017(d) | 11.62 | 0.21 | 0.56 | 0.77 | (0.20 | ) | – | (0.20 | ) | |||||||||||||||||||
| Class I | ||||||||||||||||||||||||||||
| 11/30/2021 | 13.15 | 0.25 | 1.41 | 1.66 | (0.54 | ) | (0.27 | ) | (0.81 | ) | ||||||||||||||||||
| 11/30/2020 | 11.60 | 0.24 | 1.66 | 1.90 | (0.21 | ) | (0.14 | ) | (0.35 | ) | ||||||||||||||||||
| 11/30/2019 | 11.28 | 0.28 | 0.79 | 1.07 | (0.41 | ) | (0.34 | ) | (0.75 | ) | ||||||||||||||||||
| 11/30/2018 | 12.19 | 0.28 | (0.50 | ) | (0.22 | ) | (0.45 | ) | (0.24 | ) | (0.69 | ) | ||||||||||||||||
| 11/30/2017 | 11.22 | 0.45 | 0.89 | 1.34 | (0.37 | ) | – | (0.37 | ) | |||||||||||||||||||
| Class P | ||||||||||||||||||||||||||||
| 11/30/2021 | 13.08 | 0.19 | 1.41 | 1.60 | (0.48 | ) | (0.27 | ) | (0.75 | ) | ||||||||||||||||||
| 11/30/2020 | 11.55 | 0.19 | 1.64 | 1.83 | (0.16 | ) | (0.14 | ) | (0.30 | ) | ||||||||||||||||||
| 11/30/2019 | 11.23 | 0.21 | 0.81 | 1.02 | (0.36 | ) | (0.34 | ) | (0.70 | ) | ||||||||||||||||||
| 11/30/2018 | 12.14 | 0.22 | (0.49 | ) | (0.27 | ) | (0.40 | ) | (0.24 | ) | (0.64 | ) | ||||||||||||||||
| 11/30/2017 | 11.18 | 0.31 | 0.97 | 1.28 | (0.32 | ) | – | (0.32 | ) | |||||||||||||||||||
| Class R2 | ||||||||||||||||||||||||||||
| 11/30/2021 | 13.46 | 0.18 | 1.45 | 1.63 | (0.46 | ) | (0.27 | ) | (0.73 | ) | ||||||||||||||||||
| 11/30/2020 | 11.87 | 0.17 | 1.70 | 1.87 | (0.14 | ) | (0.14 | ) | (0.28 | ) | ||||||||||||||||||
| 11/30/2019 | 11.52 | 0.20 | 0.83 | 1.03 | (0.34 | ) | (0.34 | ) | (0.68 | ) | ||||||||||||||||||
| 11/30/2018 | 12.43 | 0.22 | (0.51 | ) | (0.29 | ) | (0.38 | ) | (0.24 | ) | (0.62 | ) | ||||||||||||||||
| 11/30/2017 | 11.44 | 0.29 | 0.99 | 1.28 | (0.29 | ) | – | (0.29 | ) | |||||||||||||||||||
| 28 | See Notes to Financial Statements. |
| Ratios to Average Net Assets:(a) | Supplemental Data: | |||||||||||||||||||||||||
| Total | ||||||||||||||||||||||||||
| expenses | ||||||||||||||||||||||||||
| after | ||||||||||||||||||||||||||
| Net | waivers | Net | Net | |||||||||||||||||||||||
| asset | and/or | invest- | assets, | Portfolio | ||||||||||||||||||||||
| value, | Total | reimburse- | Total | ment | end of | turnover | ||||||||||||||||||||
| end of | return | ments | expenses | income | period | rate | ||||||||||||||||||||
| period | (%)(c) | (%) | (%) | (%) | (000) | (%) | ||||||||||||||||||||
| $ | 14.01 | 12.89 | 0.49 | 0.49 | 1.56 | $ | 2,293,947 | 47 | ||||||||||||||||||
| 13.15 | 17.09 | 0.52 | 0.52 | 1.81 | 2,087,948 | 60 | ||||||||||||||||||||
| 11.60 | 10.19 | 0.52 | 0.52 | 2.15 | 1,974,100 | 25 | ||||||||||||||||||||
| 11.28 | (2.18 | ) | 0.51 | 0.51 | 2.12 | 1,214,155 | 31 | |||||||||||||||||||
| 12.19 | 11.73 | 0.50 | 0.51 | 2.82 | 1,398,075 | 47 | ||||||||||||||||||||
| 13.90 | 12.01 | 1.24 | 1.24 | 0.78 | 223,713 | 47 | ||||||||||||||||||||
| 13.06 | 16.17 | 1.27 | 1.27 | 1.03 | 254,523 | 60 | ||||||||||||||||||||
| 11.53 | 9.35 | 1.27 | 1.27 | 1.41 | 337,420 | 25 | ||||||||||||||||||||
| 11.22 | (2.85 | ) | 1.26 | 1.26 | 1.35 | 223,823 | 31 | |||||||||||||||||||
| 12.12 | 10.96 | 1.24 | 1.26 | 2.08 | 318,697 | 47 | ||||||||||||||||||||
| 14.01 | 13.06 | 0.34 | 0.34 | 1.73 | 84,162 | 47 | ||||||||||||||||||||
| 13.15 | 17.26 | 0.37 | 0.37 | 1.97 | 70,406 | 60 | ||||||||||||||||||||
| 11.60 | 10.35 | 0.37 | 0.37 | 2.31 | 73,256 | 25 | ||||||||||||||||||||
| 11.28 | (1.95 | ) | 0.36 | 0.36 | 2.27 | 46,998 | 31 | |||||||||||||||||||
| 12.18 | 11.91 | 0.35 | 0.36 | 2.84 | 63,871 | 47 | ||||||||||||||||||||
| 14.05 | 13.25 | 0.17 | 0.17 | 1.18 | 58 | 47 | ||||||||||||||||||||
| 13.18 | 17.47 | 0.18 | 0.18 | 2.23 | 75 | 60 | ||||||||||||||||||||
| 11.62 | 10.56 | 0.19 | 0.19 | 2.40 | 47 | 25 | ||||||||||||||||||||
| 11.29 | (1.83 | ) | 0.22 | 0.22 | 2.38 | 10 | 31 | |||||||||||||||||||
| 12.19 | 6.72 | (e) | 0.21 | (f) | 0.21 | (f) | 2.68 | (f) | 11 | 47 | ||||||||||||||||
| 14.00 | 13.26 | 0.24 | 0.24 | 1.81 | 41,327 | 47 | ||||||||||||||||||||
| 13.15 | 17.29 | 0.27 | 0.27 | 2.08 | 37,220 | 60 | ||||||||||||||||||||
| 11.60 | 10.45 | 0.26 | 0.26 | 2.47 | 29,487 | 25 | ||||||||||||||||||||
| 11.28 | (1.93 | ) | 0.26 | 0.26 | 2.38 | 14,440 | 31 | |||||||||||||||||||
| 12.19 | 12.10 | 0.24 | 0.26 | 3.81 | 17,835 | 47 | ||||||||||||||||||||
| 13.93 | 12.72 | 0.69 | 0.69 | 1.37 | 820 | 47 | ||||||||||||||||||||
| 13.08 | 16.86 | 0.72 | 0.72 | 1.61 | 725 | 60 | ||||||||||||||||||||
| 11.55 | 9.93 | 0.72 | 0.72 | 1.93 | 588 | 25 | ||||||||||||||||||||
| 11.23 | (2.38 | ) | 0.71 | 0.71 | 1.85 | 512 | 31 | |||||||||||||||||||
| 12.14 | 11.56 | 0.70 | 0.71 | 2.65 | 664 | 47 | ||||||||||||||||||||
| 14.36 | 12.55 | 0.84 | 0.84 | 1.23 | 686 | 47 | ||||||||||||||||||||
| 13.46 | 16.58 | 0.87 | 0.87 | 1.44 | 594 | 60 | ||||||||||||||||||||
| 11.87 | 9.85 | 0.87 | 0.87 | 1.77 | 837 | 25 | ||||||||||||||||||||
| 11.52 | (2.49 | ) | 0.86 | 0.86 | 1.83 | 360 | 31 | |||||||||||||||||||
| 12.43 | 11.37 | 0.85 | 0.86 | 2.44 | 465 | 47 | ||||||||||||||||||||
| See Notes to Financial Statements. | 29 |
Financial Highlights (concluded)
MULTI-ASSET BALANCED OPPORTUNITY FUND
| Per Share Operating Performance: | ||||||||||||||||||||||||||||
| Distributions to | ||||||||||||||||||||||||||||
| Investment Operations: | shareholders from: | |||||||||||||||||||||||||||
| Total | ||||||||||||||||||||||||||||
| Net | from | |||||||||||||||||||||||||||
| Net asset | Net | realized | invest- | |||||||||||||||||||||||||
| value, | invest- | and | ment | Net | Net | Total | ||||||||||||||||||||||
| beginning | ment | unrealized | opera- | investment | realized | distri- | ||||||||||||||||||||||
| of period | income(b) | gain (loss) | tions | income | gain | butions | ||||||||||||||||||||||
| Class R3 | ||||||||||||||||||||||||||||
| 11/30/2021 | $ | 13.12 | $ | 0.18 | $ | 1.42 | $ | 1.60 | $ | (0.47 | ) | $ | (0.27 | ) | $ | (0.74 | ) | |||||||||||
| 11/30/2020 | 11.58 | 0.18 | 1.65 | 1.83 | (0.15 | ) | (0.14 | ) | (0.29 | ) | ||||||||||||||||||
| 11/30/2019 | 11.26 | 0.21 | 0.80 | 1.01 | (0.35 | ) | (0.34 | ) | (0.69 | ) | ||||||||||||||||||
| 11/30/2018 | 12.16 | 0.22 | (0.49 | ) | (0.27 | ) | (0.39 | ) | (0.24 | ) | (0.63 | ) | ||||||||||||||||
| 11/30/2017 | 11.20 | 0.31 | 0.96 | 1.27 | (0.31 | ) | – | (0.31 | ) | |||||||||||||||||||
| Class R4 | ||||||||||||||||||||||||||||
| 11/30/2021 | 13.15 | 0.21 | 1.43 | 1.64 | (0.51 | ) | (0.27 | ) | (0.78 | ) | ||||||||||||||||||
| 11/30/2020 | 11.60 | 0.21 | 1.66 | 1.87 | (0.18 | ) | (0.14 | ) | (0.32 | ) | ||||||||||||||||||
| 11/30/2019 | 11.29 | 0.24 | 0.79 | 1.03 | (0.38 | ) | (0.34 | ) | (0.72 | ) | ||||||||||||||||||
| 11/30/2018 | 12.19 | 0.24 | (0.48 | ) | (0.24 | ) | (0.42 | ) | (0.24 | ) | (0.66 | ) | ||||||||||||||||
| 11/30/2017 | 11.23 | 0.32 | 0.98 | 1.30 | (0.34 | ) | – | (0.34 | ) | |||||||||||||||||||
| Class R5 | ||||||||||||||||||||||||||||
| 11/30/2021 | 13.17 | 0.25 | 1.42 | 1.67 | (0.54 | ) | (0.27 | ) | (0.81 | ) | ||||||||||||||||||
| 11/30/2020 | 11.62 | 0.20 | 1.70 | 1.90 | (0.21 | ) | (0.14 | ) | (0.35 | ) | ||||||||||||||||||
| 11/30/2019 | 11.30 | 0.27 | 0.80 | 1.07 | (0.41 | ) | (0.34 | ) | (0.75 | ) | ||||||||||||||||||
| 11/30/2018 | 12.20 | 0.29 | (0.50 | ) | (0.21 | ) | (0.45 | ) | (0.24 | ) | (0.69 | ) | ||||||||||||||||
| 11/30/2017 | 11.24 | 0.33 | 1.00 | 1.33 | (0.37 | ) | – | (0.37 | ) | |||||||||||||||||||
| Class R6 | ||||||||||||||||||||||||||||
| 11/30/2021 | 13.17 | 0.26 | 1.43 | 1.69 | (0.55 | ) | (0.27 | ) | (0.82 | ) | ||||||||||||||||||
| 11/30/2020 | 11.61 | 0.24 | 1.67 | 1.91 | (0.21 | ) | (0.14 | ) | (0.35 | ) | ||||||||||||||||||
| 11/30/2019 | 11.29 | 0.30 | 0.77 | 1.07 | (0.41 | ) | (0.34 | ) | (0.75 | ) | ||||||||||||||||||
| 11/30/2018 | 12.19 | 0.24 | (0.45 | ) | (0.21 | ) | (0.45 | ) | (0.24 | ) | (0.69 | ) | ||||||||||||||||
| 11/30/2017 | 11.22 | 0.33 | 1.01 | 1.34 | (0.37 | ) | – | (0.37 | ) | |||||||||||||||||||
| (a) | Does not include expenses of the Underlying Funds in which the Fund invests. |
| (b) | Calculated using average shares outstanding during the period. |
| (c) | Total return for Classes A and C does not consider the effects of sales loads and assumes the reinvestment of all distributions. Total return for all other classes assumes the reinvestment of all distributions. |
| (d) | Commenced on April 4, 2017. |
| (e) | Not annualized. |
| (f) | Annualized. |
| 30 | See Notes to Financial Statements. |
| Ratios to Average Net Assets:(a) | Supplemental Data: | |||||||||||||||||||||||||
| Total | ||||||||||||||||||||||||||
| expenses | ||||||||||||||||||||||||||
| after | ||||||||||||||||||||||||||
| Net | waivers | Net | Net | |||||||||||||||||||||||
| asset | and/or | invest- | assets, | Portfolio | ||||||||||||||||||||||
| value, | Total | reimburse- | Total | ment | end of | turnover | ||||||||||||||||||||
| end of | return | ments | expenses | income | period | rate | ||||||||||||||||||||
| period | (%)(c) | (%) | (%) | (%) | (000) | (%) | ||||||||||||||||||||
| $ | 13.98 | 12.62 | 0.74 | 0.74 | 1.30 | $49,825 | 47 | |||||||||||||||||||
| 13.12 | 16.74 | 0.77 | 0.77 | 1.56 | 48,308 | 60 | ||||||||||||||||||||
| 11.58 | 9.94 | 0.76 | 0.76 | 1.91 | 52,554 | 25 | ||||||||||||||||||||
| 11.26 | (2.34 | ) | 0.76 | 0.76 | 1.84 | 27,258 | 31 | |||||||||||||||||||
| 12.16 | 11.49 | 0.73 | 0.74 | 2.63 | 33,772 | 47 | ||||||||||||||||||||
| 14.01 | 12.88 | 0.49 | 0.49 | 1.54 | 14,343 | 47 | ||||||||||||||||||||
| 13.15 | 17.09 | 0.52 | 0.52 | 1.79 | 13,893 | 60 | ||||||||||||||||||||
| 11.60 | 10.19 | 0.52 | 0.52 | 2.12 | 12,167 | 25 | ||||||||||||||||||||
| 11.29 | (2.17 | ) | 0.51 | 0.51 | 2.07 | 4,971 | 31 | |||||||||||||||||||
| 12.19 | 11.77 | 0.49 | 0.49 | 2.73 | 2,474 | 47 | ||||||||||||||||||||
| 14.03 | 13.15 | 0.24 | 0.24 | 1.78 | 186 | 47 | ||||||||||||||||||||
| 13.17 | 17.34 | 0.28 | 0.28 | 1.79 | 178 | 60 | ||||||||||||||||||||
| 11.62 | 10.44 | 0.27 | 0.27 | 2.38 | 204 | 25 | ||||||||||||||||||||
| 11.30 | (1.85 | ) | 0.26 | 0.26 | 2.45 | 121 | 31 | |||||||||||||||||||
| 12.20 | 11.99 | 0.24 | 0.25 | 2.77 | 102 | 47 | ||||||||||||||||||||
| 14.04 | 13.26 | 0.17 | 0.17 | 1.88 | 11,969 | 47 | ||||||||||||||||||||
| 13.17 | 17.48 | 0.19 | 0.19 | 2.13 | 10,480 | 60 | ||||||||||||||||||||
| 11.61 | 10.47 | 0.19 | 0.19 | 2.61 | 15,985 | 25 | ||||||||||||||||||||
| 11.29 | (1.83 | ) | 0.18 | 0.18 | 2.01 | 5,451 | 31 | |||||||||||||||||||
| 12.19 | 12.13 | 0.18 | 0.18 | 2.77 | 5,587 | 47 | ||||||||||||||||||||
| See Notes to Financial Statements. | 31 |
Financial Highlights
MULTI-ASSET INCOME FUND
| Per Share Operating Performance: | ||||||||||||||||||||||||
| Distributions to | ||||||||||||||||||||||||
| shareholders | ||||||||||||||||||||||||
| Investment Operations: | from: | |||||||||||||||||||||||
| Net asset | Net | Net asset | ||||||||||||||||||||||
| value, | Net | realized and | Total from | Net | value, | |||||||||||||||||||
| beginning | investment | unrealized | investment | investment | end of | |||||||||||||||||||
| of period | income(b) | gain (loss) | operations | income | period | |||||||||||||||||||
| Class A | ||||||||||||||||||||||||
| 11/30/2021 | $ | 16.47 | $ | 0.32 | $ | 1.21 | $ | 1.53 | $(0.61 | ) | $ | 17.39 | ||||||||||||
| 11/30/2020 | 15.02 | 0.33 | 1.43 | 1.76 | (0.31 | ) | 16.47 | |||||||||||||||||
| 11/30/2019 | 14.34 | 0.40 | 0.78 | 1.18 | (0.50 | ) | 15.02 | |||||||||||||||||
| 11/30/2018 | 15.08 | 0.36 | (0.62 | ) | (0.26 | ) | (0.48 | ) | 14.34 | |||||||||||||||
| 11/30/2017 | 14.14 | 0.48 | 0.93 | 1.41 | (0.47 | ) | 15.08 | |||||||||||||||||
| Class C | ||||||||||||||||||||||||
| 11/30/2021 | 16.74 | 0.18 | 1.23 | 1.41 | (0.47 | ) | 17.68 | |||||||||||||||||
| 11/30/2020 | 15.25 | 0.22 | 1.47 | 1.69 | (0.20 | ) | 16.74 | |||||||||||||||||
| 11/30/2019 | 14.55 | 0.30 | 0.79 | 1.09 | (0.39 | ) | 15.25 | |||||||||||||||||
| 11/30/2018 | 15.29 | 0.26 | (0.63 | ) | (0.37 | ) | (0.37 | ) | 14.55 | |||||||||||||||
| 11/30/2017 | 14.34 | 0.38 | 0.93 | 1.31 | (0.36 | ) | 15.29 | |||||||||||||||||
| Class F | ||||||||||||||||||||||||
| 11/30/2021 | 16.47 | 0.34 | 1.22 | 1.56 | (0.64 | ) | 17.39 | |||||||||||||||||
| 11/30/2020 | 15.02 | 0.35 | 1.43 | 1.78 | (0.33 | ) | 16.47 | |||||||||||||||||
| 11/30/2019 | 14.34 | 0.42 | 0.78 | 1.20 | (0.52 | ) | 15.02 | |||||||||||||||||
| 11/30/2018 | 15.08 | 0.38 | (0.62 | ) | (0.24 | ) | (0.50 | ) | 14.34 | |||||||||||||||
| 11/30/2017 | 14.14 | 0.50 | 0.93 | 1.43 | (0.49 | ) | 15.08 | |||||||||||||||||
| Class F3 | ||||||||||||||||||||||||
| 11/30/2021 | 16.40 | 0.37 | 1.21 | 1.58 | (0.66 | ) | 17.32 | |||||||||||||||||
| 11/30/2020 | 14.95 | 0.39 | 1.40 | 1.79 | (0.34 | ) | 16.40 | |||||||||||||||||
| 11/30/2019 | 14.27 | 0.44 | 0.78 | 1.22 | (0.54 | ) | 14.95 | |||||||||||||||||
| 11/30/2018 | 15.00 | 0.40 | (0.61 | ) | (0.21 | ) | (0.52 | ) | 14.27 | |||||||||||||||
| 4/4/2017 to 11/30/2017(d) | 14.42 | 0.29 | 0.56 | 0.85 | (0.27 | ) | 15.00 | |||||||||||||||||
| Class I | ||||||||||||||||||||||||
| 11/30/2021 | 16.37 | 0.36 | 1.20 | 1.56 | (0.65 | ) | 17.28 | |||||||||||||||||
| 11/30/2020 | 14.93 | 0.36 | 1.42 | 1.78 | (0.34 | ) | 16.37 | |||||||||||||||||
| 11/30/2019 | 14.26 | 0.44 | 0.77 | 1.21 | (0.54 | ) | 14.93 | |||||||||||||||||
| 11/30/2018 | 14.99 | 0.40 | (0.61 | ) | (0.21 | ) | (0.52 | ) | 14.26 | |||||||||||||||
| 11/30/2017 | 14.07 | 0.54 | 0.89 | 1.43 | (0.51 | ) | 14.99 | |||||||||||||||||
| Class R2 | ||||||||||||||||||||||||
| 11/30/2021 | 16.95 | 0.26 | 1.25 | 1.51 | (0.54 | ) | 17.92 | |||||||||||||||||
| 11/30/2020 | 15.44 | 0.29 | 1.47 | 1.76 | (0.25 | ) | 16.95 | |||||||||||||||||
| 11/30/2019 | 14.73 | 0.35 | 0.81 | 1.16 | (0.45 | ) | 15.44 | |||||||||||||||||
| 11/30/2018 | 15.47 | 0.32 | (0.63 | ) | (0.31 | ) | (0.43 | ) | 14.73 | |||||||||||||||
| 11/30/2017 | 14.50 | 0.45 | 0.94 | 1.39 | (0.42 | ) | 15.47 | |||||||||||||||||
| Class R3 | ||||||||||||||||||||||||
| 11/30/2021 | 16.47 | 0.27 | 1.21 | 1.48 | (0.56 | ) | 17.39 | |||||||||||||||||
| 11/30/2020 | 15.02 | 0.29 | 1.43 | 1.72 | (0.27 | ) | 16.47 | |||||||||||||||||
| 11/30/2019 | 14.34 | 0.35 | 0.80 | 1.15 | (0.47 | ) | 15.02 | |||||||||||||||||
| 11/30/2018 | 15.08 | 0.33 | (0.63 | ) | (0.30 | ) | (0.44 | ) | 14.34 | |||||||||||||||
| 11/30/2017 | 14.14 | 0.44 | 0.94 | 1.38 | (0.44 | ) | 15.08 | |||||||||||||||||
| 32 | See Notes to Financial Statements. |
| Ratios to Average Net Assets:(a) | Supplemental Data: | |||||||||||||||||||||
| Total expenses after | Net | Net assets, | Portfolio | |||||||||||||||||||
| Total | waivers and/or | Total | investment | end of | turnover | |||||||||||||||||
| return | reimbursements | expenses | income | period | rate | |||||||||||||||||
| (%)(c) | (%) | (%) | (%) | (000) | (%) | |||||||||||||||||
| 9.43 | 0.48 | 0.49 | 1.81 | $855,806 | 40 | |||||||||||||||||
| 12.33 | 0.50 | 0.50 | 2.19 | 745,462 | 75 | |||||||||||||||||
| 8.50 | 0.50 | 0.50 | 2.74 | 678,178 | 27 | |||||||||||||||||
| (1.79 | ) | 0.50 | 0.50 | 2.43 | 716,679 | 41 | ||||||||||||||||
| 10.15 | 0.48 | 0.49 | 3.30 | 799,727 | 55 | |||||||||||||||||
| 8.66 | 1.23 | 1.24 | 1.03 | 188,842 | 40 | |||||||||||||||||
| 11.46 | 1.25 | 1.25 | 1.44 | 240,404 | 75 | |||||||||||||||||
| 7.70 | 1.25 | 1.25 | 2.00 | 340,786 | 27 | |||||||||||||||||
| (2.51 | ) | 1.25 | 1.25 | 1.69 | 410,332 | 41 | ||||||||||||||||
| 9.25 | 1.23 | 1.24 | 2.57 | 518,727 | 55 | |||||||||||||||||
| 9.59 | 0.33 | 0.34 | 1.95 | 176,727 | 40 | |||||||||||||||||
| 12.49 | 0.35 | 0.35 | 2.35 | 165,707 | 75 | |||||||||||||||||
| 8.66 | 0.35 | 0.35 | 2.91 | 200,060 | 27 | |||||||||||||||||
| (1.64 | ) | 0.35 | 0.35 | 2.57 | 227,804 | 41 | ||||||||||||||||
| 10.32 | 0.33 | 0.34 | 3.39 | 259,296 | 55 | |||||||||||||||||
| 9.76 | 0.17 | 0.18 | 2.11 | 1,735 | 40 | |||||||||||||||||
| 12.68 | 0.18 | 0.18 | 2.61 | 2,013 | 75 | |||||||||||||||||
| 8.83 | 0.19 | 0.19 | 3.01 | 3,527 | 27 | |||||||||||||||||
| (1.47 | ) | 0.18 | 0.18 | 2.70 | 4,077 | 41 | ||||||||||||||||
| 5.96 | (e) | 0.18 | (f) | 0.18 | (f) | 2.99 | (f) | 3,519 | 55 | |||||||||||||
| 9.70 | 0.23 | 0.24 | 2.05 | 37,860 | 40 | |||||||||||||||||
| 12.61 | 0.25 | 0.25 | 2.45 | 35,613 | 75 | |||||||||||||||||
| 8.75 | 0.25 | 0.25 | 3.03 | 43,319 | 27 | |||||||||||||||||
| (1.48 | ) | 0.25 | 0.25 | 2.70 | 54,171 | 41 | ||||||||||||||||
| 10.34 | 0.22 | 0.23 | 3.70 | 56,927 | 55 | |||||||||||||||||
| 9.06 | 0.83 | 0.83 | 1.46 | 140 | 40 | |||||||||||||||||
| 11.97 | 0.85 | 0.85 | 1.87 | 124 | 75 | |||||||||||||||||
| 8.10 | 0.85 | 0.85 | 2.36 | 138 | 27 | |||||||||||||||||
| (2.09 | ) | 0.84 | 0.84 | 2.08 | 122 | 41 | ||||||||||||||||
| 9.70 | 0.83 | 0.84 | 3.02 | 118 | 55 | |||||||||||||||||
| 9.15 | 0.73 | 0.74 | 1.56 | 20,699 | 40 | |||||||||||||||||
| 12.04 | 0.75 | 0.75 | 1.94 | 19,031 | 75 | |||||||||||||||||
| 8.24 | 0.75 | 0.75 | 2.41 | 21,508 | 27 | |||||||||||||||||
| (2.03 | ) | 0.74 | 0.74 | 2.20 | 18,400 | 41 | ||||||||||||||||
| 9.88 | 0.73 | 0.74 | 3.03 | 19,564 | 55 | |||||||||||||||||
| See Notes to Financial Statements. | 33 |
Financial Highlights (concluded)
MULTI-ASSET INCOME FUND
| Per Share Operating Performance: | ||||||||||||||||||||||||
| Distributions to | ||||||||||||||||||||||||
| shareholders | ||||||||||||||||||||||||
| Investment Operations: | from: | |||||||||||||||||||||||
| Net asset | Net | Net asset | ||||||||||||||||||||||
| value, | Net | realized and | Total from | Net | value, | |||||||||||||||||||
| beginning | investment | unrealized | investment | investment | end of | |||||||||||||||||||
| of period | income(b) | gain (loss) | operations | income | period | |||||||||||||||||||
| Class R4 | ||||||||||||||||||||||||
| 11/30/2021 | $ | 16.47 | $ | 0.31 | $ | 1.22 | $ | 1.53 | $(0.61 | ) | $ | 17.39 | ||||||||||||
| 11/30/2020 | 15.02 | 0.33 | 1.43 | 1.76 | (0.31 | ) | 16.47 | |||||||||||||||||
| 11/30/2019 | 14.34 | 0.38 | 0.80 | 1.18 | (0.50 | ) | 15.02 | |||||||||||||||||
| 11/30/2018 | 15.08 | 0.34 | (0.60 | ) | (0.26 | ) | (0.48 | ) | 14.34 | |||||||||||||||
| 11/30/2017 | 14.15 | 0.40 | 1.01 | 1.41 | (0.48 | ) | 15.08 | |||||||||||||||||
| Class R5 | ||||||||||||||||||||||||
| 11/30/2021 | 16.38 | 0.36 | 1.19 | 1.55 | (0.65 | ) | 17.28 | |||||||||||||||||
| 11/30/2020 | 14.93 | 0.36 | 1.43 | 1.79 | (0.34 | ) | 16.38 | |||||||||||||||||
| 11/30/2019 | 14.26 | 0.42 | 0.79 | 1.21 | (0.54 | ) | 14.93 | |||||||||||||||||
| 11/30/2018 | 14.99 | 0.39 | (0.60 | ) | (0.21 | ) | (0.52 | ) | 14.26 | |||||||||||||||
| 11/30/2017 | 14.07 | 0.48 | 0.95 | 1.43 | (0.51 | ) | 14.99 | |||||||||||||||||
| Class R6 | ||||||||||||||||||||||||
| 11/30/2021 | 16.40 | 0.37 | 1.21 | 1.58 | (0.66 | ) | 17.32 | |||||||||||||||||
| 11/30/2020 | 14.95 | 0.38 | 1.41 | 1.79 | (0.34 | ) | 16.40 | |||||||||||||||||
| 11/30/2019 | 14.27 | 0.44 | 0.78 | 1.22 | (0.54 | ) | 14.95 | |||||||||||||||||
| 11/30/2018 | 15.00 | 0.38 | (0.59 | ) | (0.21 | ) | (0.52 | ) | 14.27 | |||||||||||||||
| 11/30/2017 | 14.06 | 0.44 | 1.01 | 1.45 | (0.51 | ) | 15.00 | |||||||||||||||||
| (a) | Does not include expenses of the Underlying Funds in which the Fund invests. |
| (b) | Calculated using average shares outstanding during the period. |
| (c) | Total return for Classes A and C does not consider the effects of sales loads and assumes the reinvestment of all distributions. Total return for all other classes assumes the reinvestment of all distributions. |
| (d) | Commenced on April 4, 2017. |
| (e) | Not annualized. |
| (f) | Annualized. |
| 34 | See Notes to Financial Statements. |
| Ratios to Average Net Assets:(a) | Supplemental Data: | |||||||||||||||||||||
| Total expenses after | Net | Net assets, | Portfolio | |||||||||||||||||||
| Total | waivers and/or | Total | investment | end of | turnover | |||||||||||||||||
| return | reimbursements | expenses | income | period | rate | |||||||||||||||||
| (%)(c) | (%) | (%) | (%) | (000) | (%) | |||||||||||||||||
| 9.43 | 0.48 | 0.49 | 1.80 | $3,435 | 40 | |||||||||||||||||
| 12.33 | 0.50 | 0.50 | 2.18 | 2,988 | 75 | |||||||||||||||||
| 8.50 | 0.50 | 0.50 | 2.62 | 2,421 | 27 | |||||||||||||||||
| (1.77 | ) | 0.49 | 0.49 | 2.31 | 1,756 | 41 | ||||||||||||||||
| 10.11 | 0.48 | 0.48 | 2.74 | 569 | 55 | |||||||||||||||||
| 9.76 | 0.23 | 0.23 | 2.06 | 53 | 40 | |||||||||||||||||
| 12.61 | 0.24 | 0.24 | 2.42 | 47 | 75 | |||||||||||||||||
| 8.75 | 0.24 | 0.24 | 2.89 | 36 | 27 | |||||||||||||||||
| (1.55 | ) | 0.24 | 0.24 | 2.64 | 28 | 41 | ||||||||||||||||
| 10.41 | 0.22 | 0.23 | 3.28 | 23 | 55 | |||||||||||||||||
| 9.76 | 0.17 | 0.18 | 2.11 | 1,159 | 40 | |||||||||||||||||
| 12.68 | 0.18 | 0.18 | 2.55 | 1,030 | 75 | |||||||||||||||||
| 8.83 | 0.19 | 0.19 | 3.02 | 2,873 | 27 | |||||||||||||||||
| (1.47 | ) | 0.18 | 0.18 | 2.58 | 2,807 | 41 | ||||||||||||||||
| 10.50 | 0.18 | 0.18 | 2.99 | 1,119 | 55 | |||||||||||||||||
| See Notes to Financial Statements. | 35 |
| 1. | ORGANIZATION |
Lord Abbett Investment Trust (the “Trust”) is registered under the Investment Company Act of 1940, as amended (the “Act”), as a diversified, open-end management investment company and was organized as a Delaware statutory trust on August 16, 1993. The Trust consists of fourteen funds. This report covers the following two funds (separately, a “Fund” and collectively, the “Funds”) and their respective active share classes:
| Funds | Classes |
| Lord Abbett Multi-Asset Balanced Opportunity Fund (“Multi-Asset Balanced Opportunity Fund”) | A, C, F, F3, I, P, R2, R3, R4, R5 and R6 |
| Lord Abbett Multi-Asset Income Fund (“Multi-Asset Income Fund”) | A, C, F, F3, I, R2, R3, R4, R5 and R6 |
The Funds’ Class P shares are closed to substantially all new investors, with certain exceptions as set forth in the Funds’ prospectus.
Multi-Asset Balanced Opportunity Fund’s investment objective is to seek current income and capital growth. Multi-Asset Income Fund’s investment objective is to seek a high level of current income. The Funds invest principally in other mutual funds (“Underlying Funds”) managed by Lord, Abbett & Co. LLC (“Lord Abbett”).
Each class of shares has different expenses and dividends. A front-end sales charge is normally added to the net asset value (“NAV”) for Class A shares. There is no front-end sales charge in the case of Class C, F, F3, I, P, R2, R3, R4, R5 and R6 shares, although there may be a contingent deferred sales charge (“CDSC”) in certain cases as follows: Class A shares purchased without a sales charge and redeemed before the first day of the month in which the one-year anniversary of the purchase falls (subject to certain exceptions as set forth in each Fund’s prospectus); Class C shares redeemed before the first anniversary of purchase. Class C shares automatically convert to Class A shares on the 25th day of the month (or, if the 25th day is not a business day, the next business day thereafter) following the eighth anniversary of the month on which the purchase order was accepted, provided that the Fund or financial intermediary through which a shareholder purchased Class C shares has records verifying that the C shares have been held at least eight years.
The preparation of the financial statements in conformity with accounting principles generally accepted in the United States of America (“U.S. GAAP”) requires management to make certain estimates and assumptions that affect the reported amounts of assets and liabilities and disclosure of contingent assets and liabilities at the date of the financial statements and the reported amounts of increases and decreases in net assets from operations during the reporting period. Actual results could differ from those estimates. These Funds are considered investment companies under U.S. GAAP and follow the accounting and reporting guidance applicable to investment companies.
| 2. | SIGNIFICANT ACCOUNTING POLICIES |
| (a) | Investment Valuation–Under procedures approved by the Funds’ Board of Trustees (the “Board”), Lord Abbett, the Funds’ investment manager, has formed a Pricing Committee to administer the pricing and valuation of portfolio investments and to ensure that prices utilized reasonably reflect fair value. Among other things, these procedures allow the Funds to utilize independent pricing services, quotations from securities and financial instrument dealers and other market sources to determine fair value. |
36
Notes to Financial Statements (continued)
| Investments in the Underlying Funds are valued at their NAV each business day at the close of regular trading on the New York Stock Exchange, normally 4:00 p.m. Eastern time. Exchange traded futures contracts are valued at the last sales price in the market in which they are principally traded. If no sale has occurred, the mean between the most recently quoted bid and ask prices is used. Forward foreign currency exchange contracts are valued using daily forward exchange rates. Swaps, options and options on swaps (“swaptions”) are valued daily using independent pricing services or quotations from broker/dealers to the extent available. | |
| Securities for which prices are not readily available are valued at fair value as determined by the Pricing Committee. The Pricing Committee considers a number of factors, including observable and unobservable inputs, when arriving at fair value. The Pricing Committee may use related or comparable assets or liabilities, recent transactions, market multiples, book values and other relevant information to determine the fair value of portfolio investments. The Board or a designated committee thereof regularly reviews fair value determinations made by the Pricing Committee and may employ techniques such as reviewing related market activity, reviewing inputs and assumptions, and retrospectively comparing prices of subsequent purchases and sales transactions to fair value determinations made by the Pricing Committee. | |
| Short-term securities with 60 days or less remaining to maturity are valued using the amortized cost method, which approximates fair value. | |
| (b) | Security Transactions–Security transactions are recorded as of the date that the securities are purchased or sold (trade date). Realized gains and losses on sales of portfolio securities are calculated using the identified-cost method. Realized and unrealized gains (losses) are allocated to each class of shares based upon the relative proportion of net assets at the beginning of the day. |
| (c) | Investment Income–Dividend income and capital gain distributions are recorded on the ex-dividend date. Interest income is recorded on the accrual basis as earned. Discounts are accreted and premiums are amortized using the effective interest method and are included in Interest and other income on the Statements of Operations. Investment income is allocated to each class of shares based upon the relative proportion of net assets at the beginning of the day. |
| (d) | Income Taxes–It is the policy of each Fund to meet the requirements of Subchapter M of the Internal Revenue Code applicable to regulated investment companies and to distribute substantially all taxable income and capital gains to its shareholders. Therefore, no income tax provision is required. |
| Each Fund files U.S. federal and various state and local tax returns. No income tax returns are currently under examination. The statute of limitations on each Fund’s filed U.S. federal tax returns remains open for the fiscal years ended November 30, 2018 through November 30, 2021. The statutes of limitations on the Trust’s state and local tax returns may remain open for an additional year depending upon the jurisdiction. | |
| (e) | Expenses–Expenses incurred by the Trust that do not specifically relate to an individual fund are generally allocated to the Funds within the Trust on a pro rata basis by relative net assets. Expenses, excluding class-specific expenses, are allocated to each class of shares based upon the relative proportion of net assets at the beginning of the day. In addition, Class F3 and R6 bear only their class-specific shareholder servicing expenses. Class A, C, F, P, R2, R3 and R4 shares bear their class-specific share of all expenses and fees relating to the Funds’ 12b-1 Distribution Plan. |
37
Notes to Financial Statements (continued)
| (f) | Foreign Transactions–The books and records of each Fund are maintained in U.S. dollars and transactions denominated in foreign currencies are recorded in each Fund’s records at the rate prevailing when earned or recorded. Asset and liability accounts that are denominated in foreign currencies are adjusted daily to reflect current exchange rates and any unrealized gain (loss), if applicable, is included in Net change in unrealized appreciation/depreciation on translation of assets and liabilities denominated in foreign currencies in each Fund’s Statement of Operations. The resultant exchange gains and losses upon settlement of such transactions, if applicable, are included in Net realized gain (loss) on foreign currency related transactions in each Fund’s Statement of Operations. The Funds do not isolate that portion of the results of operations arising as a result of changes in the foreign exchange rates from the changes in market prices of the securities. |
| The Funds use foreign currency exchange contracts to facilitate transactions in foreign-denominated securities. Losses from these transactions may arise from changes in the value of the foreign currency or if the counterparties do not perform under the contracts’ terms. | |
| (g) | Forward Foreign Currency Exchange Contracts–Each Fund may enter into forward foreign currency exchange contracts in order to reduce its exposure to changes in foreign currency exchange rates on their foreign portfolio holdings, or gain or reduce exposure to foreign currency solely for investment purposes. A forward foreign currency exchange contract is a commitment to purchase or sell a foreign currency at a future date at a negotiated rate. The contracts are valued daily at forward exchange rates and any unrealized gain (loss) is included in Net change in unrealized appreciation/depreciation on foreign currency exchange contracts in each Fund’s Statement of Operations. The gain (loss) arising from the difference between the U.S. dollar cost of the original contract and the value of the foreign currency in U.S. dollars upon closing of such contracts is included in Net realized gain (loss) on foreign currency exchange contracts in each Fund’s Statement of Operations. |
| (h) | Futures Contracts–Each Fund may purchase and sell futures contracts to manage cash, to adjust exposure to the direction of interest rates or as a substitute position in lieu of holding the underlying asset on which the instrument is based. At the time of entering into a futures transaction, an investor is required to deposit and maintain a specified amount of cash or eligible securities called “initial margin.” Subsequent payments made or received by a Fund called “variation margin” are made on a daily basis as the market price of the futures contract fluctuates. Each Fund will record an unrealized gain (loss) based on the amount of variation margin. When a contract is closed, a realized gain (loss) is recorded equal to the difference between the opening and closing value of the contract. |
| (i) | Credit Default Swaps–Each Fund may enter into credit default swap contracts in order to hedge credit risk or for speculation purposes. As a seller of a credit default swap contract (“seller of protection”), a Fund is required to pay the notional amount or other agreed-upon value of a referenced debt obligation to the counterparty in the event of a default by or other credit event involving the referenced issuer, obligation or index. In return, a Fund receives from the counterparty a periodic stream of payments over the term of the contract. |
| As a purchaser of a credit default swap contract (“buyer of protection”), a Fund would receive the notional amount or other agreed upon value of a referenced debt obligation from the counterparty in the event of default by or other credit event involving the referenced issuer, obligation or index. In return, a Fund would make periodic payments to the counterparty over the term of the contracts, provided no event of default has occurred. |
38
Notes to Financial Statements (continued)
| These credit default swaps may have as a reference obligation corporate or sovereign issuers or credit indices. These credit indices are comprised of a basket of securities representing a particular sector of the market. | |
| Credit default swaps are fair valued based upon quotations from counterparties, brokers or market-makers and the change in value, if any, is recorded as an unrealized appreciation or depreciation. Daily changes in valuation of centrally cleared swaps, if any, are recorded as a receivable or payable for the change in value as appropriate (“variation margin”) on the Statements of Assets and Liabilities. For a credit default swap sold by a Fund, payment of the agreed-upon amount made by a Fund in the event of default of the referenced debt obligation is recorded as the cost of the referenced debt obligation purchased/received. For a credit default swap purchased by a Fund, the agreed-upon amount received by a Fund in the event of default of the referenced debt obligation is recorded as proceeds from sale/delivery of the referenced debt obligation and the resulting gain or loss realized on the referenced debt obligation is recorded as such by a Fund. | |
| Any upfront payments made or received upon entering a credit default swap contract would be amortized or accreted over the life of the swap and recorded as realized gains or losses. Collateral, in the form of cash or securities, may be required to be held in segregated accounts with the custodian bank or broker in accordance with the swap agreement. The value and credit rating of each credit default swap where a Fund is the seller of protection, are both measures of the current payment/performance risk of the swap. As the value of the swap changes as a positive or negative percentage of the total notional amount, the payment/performance risk may decrease or increase, respectively. The maximum potential amount of future payments (undiscounted) that a Fund as a seller of protection could be required to make under a credit default swap agreement would be an amount equal to the notional amount of the agreement. These potential amounts would be partially offset by any recovery values of the respective referenced obligations, upfront payments received upon entering into the agreement, or net amounts received from the settlement of buy protection credit default swap agreements entered into by the Funds for the same referenced entity or entities. | |
| Entering into credit default swaps involves credit and market risk. Such risks involve the possibility that there will be no liquid market for these agreements, that there may be unfavorable changes in interest rates, and that Lord Abbett does not correctly predict the creditworthiness of the issuers of the reference obligation on which the credit default swap is based. | |
| (j) | Options–Each Fund may purchase and write exchange-listed and over-the-counter put or call options on securities, stock indices, currencies and other financial instruments for hedging purposes, to enhance portfolio returns and reduce overall volatility. |
| When a Fund writes (sells) an option, an amount equal to the premium received by the Fund is recorded as a liability in the Statement of Assets and Liabilities. The amount of the liability is subsequently marked-to-market to reflect the current market value of the option written. When an option expires, the Fund realizes a gain on the option to the extent of the premium received. Premiums received from writing options which are exercised or closed are added to or offset against the proceeds or amount paid on the transaction to determine the realized gain or loss. If a put option on a security is exercised, the premium reduces the cost basis of the security purchased by the Fund. If a call option is exercised, the premium is added to the proceeds of the security sold to determine the realized gain or loss. The Fund, as writer of an option, bears the market risk of an unfavorable change in the price of the underlying |
39
Notes to Financial Statements (continued)
| investment. Other risks include the possibility of an illiquid options market or the inability of the counterparties to fulfill their obligations under the contracts. | |
| Put and call options purchased are accounted for in the same manner as portfolio securities. Premiums paid for purchasing options which expire are treated as realized losses. Premiums paid for purchasing options which are exercised or closed are added to the amounts paid or offset against the proceeds on the underlying investment transaction to determine the realized gain or loss when the underlying transaction is executed. The risk associated with purchasing an option is that the Fund pays a premium whether or not the option is exercised. Additionally, the Fund bears the risk of loss of the premium and change in market value should the counterparty not perform under the contract. Realized and Change in Unrealized gains and losses on purchased options are included in realized and change in unrealized gains and losses on investments. | |
| (k) | Total Return Swaps–Each Fund may enter into total return swap agreements to obtain exposure to a security or market without owning such security or investing directly in that market. Each Fund may agree to make payments that are the equivalent of interest in exchange for the right to receive payments equivalent to any appreciation in the value of an underlying security, index or other asset, as well as receive payments equivalent to any distributions made on that asset, over the term of the swap. If the value of the asset underlying a total return swap declines over the term of the swap, each Fund also may be required to pay an amount equal to that decline in value to their counterparty. |
| (l) | Repurchase Agreements–Each Fund may enter into repurchase agreements with respect to securities. A repurchase agreement is a transaction in which a fund acquires a security and simultaneously commits to resell that security to the seller (a bank or securities dealer) at an agreed-upon price on an agreed-upon date. Each Fund requires at all times that the repurchase agreement be collateralized by cash, or by securities of the U.S. Government, its agencies, its instrumentalities, or U.S. Government sponsored enterprises having a value equal to, or in excess of, the value of the repurchase agreement (including accrued interest). If the seller of the agreement defaults on its obligation to repurchase the underlying securities at a time when the fair value of these securities has declined, a Fund may incur a loss upon disposition of the securities. |
| (m) | Fair Value Measurements–Fair value is defined as the price that each Fund would receive upon selling an investment or transferring a liability in an orderly transaction to an independent buyer in the principal or most advantageous market of the investment. A three-tier hierarchy is used to maximize the use of observable market data and minimize the use of unobservable inputs and to establish classification of fair value measurements for disclosure purposes. Inputs refer broadly to the assumptions that market participants would use in pricing the asset or liability, including assumptions about risk–for example, the risk inherent in a particular valuation technique used to measure fair value (such as a pricing model) and/or the risk inherent in the inputs to the valuation technique. Inputs may be observable or unobservable. Observable inputs reflect the assumptions market participants would use in pricing the asset or liability. Observable inputs are based on market data obtained from sources independent of the reporting entity. Unobservable inputs reflect the reporting entity’s own assumptions about the assumptions market participants would use in pricing the asset or liability. Unobservable inputs are based on the best information available in the circumstances. The three-tier hierarchy classification is determined based on the lowest level of inputs that is significant to the fair value measurement, and is summarized in the three broad Levels listed below: |
40
Notes to Financial Statements (continued)
| • | Level 1 – | unadjusted quoted prices in active markets for identical investments; |
| • | Level 2 – | other significant observable inputs (including quoted prices for similar investments, interest rates, prepayment speeds, credit risk, etc.); and |
| • | Level 3 – | significant unobservable inputs (including each Fund’s own assumptions in determining the fair value of investments). |
A summary of inputs used in valuing each Fund’s investments and other financial instruments as of November 30, 2021 and, if applicable, Level 3 rollforwards for the fiscal year then ended is included in each Fund’s Schedule of Investments.
Changes in valuation techniques may result in transfers into or out of an assigned level within the three-tier hierarchy. The inputs or methodology used for valuing securities are not necessarily an indication of the risk associated with investing in those securities.
| 3. | MANAGEMENT FEE AND OTHER TRANSACTIONS WITH AFFILIATES |
Management Fee
The Trust has a management agreement with Lord Abbett, pursuant to which Lord Abbett provides each Fund with investment management services and executive and other personnel, provides office space and pays for ordinary and necessary office and clerical expenses relating to research and statistical work and supervision of each Fund’s investment portfolio.
The management fee is based on each Fund’s average daily net assets at an annual rate of .10%.
For the fiscal year ended November 30, 2021, the effective management fee, net of waivers, was based on each Fund’s average daily net assets at the following annualized rates:
| Net Effective Management Fee | ||
| Multi-Asset Balanced Opportunity Fund | .10% | |
| Multi-Asset Income Fund | .10% |
In addition, Lord Abbett provides certain administrative services to each Fund pursuant to an Administrative Services Agreement in return for a fee at an annual rate of .04% of each Funds’ average daily net assets. Lord Abbett voluntarily waived the following Funds’ administration fees during the fiscal year ended November 30, 2021:
| Fund |
| Fund Administration Fee |
| Multi-Asset Balanced Opportunity Fund | $56,778 | |
| Multi-Asset Income Fund | 43,923 |
12b-1 Distribution Plan
Each Fund has adopted a distribution plan with respect to Class A, C, F, P, R2, R3 and R4 shares pursuant to Rule 12b-1 under the Act, which provides for the payment of ongoing distribution and service fees to Lord Abbett Distributor LLC (the “Distributor”), an affiliate of Lord Abbett. The following annual rates have been authorized by the Board pursuant to the plan:
| Fees* | Class A | Class C | Class F(1) | Class P | Class R2 | Class R3 | Class R4 | |||||||
| Service | .25% | .25% | – | .25% | .25% | .25% | .25% | |||||||
| Distribution | – | .75% | .10% | .20% | .35% | .25% | – |
| * | The Funds may designate a portion of the aggregate fee as attributable to service activities for purposes of calculating Financial Industry Regulatory Authority, Inc. (“FINRA”) sales charge limitations. |
| (1) | The Class F Share Rule 12b-1 fee may be designated as a service fee in limited circumstances as described in the Funds’ prospectus. |
41
Notes to Financial Statements (continued)
Class F3, Class I, Class R5 and Class R6 shares do not have a distribution plan.
Commissions
Distributor received the following commissions on sales of shares of the Funds, after concessions were paid to authorized dealers, for the fiscal year ended November 30, 2021:
| Distributor Commissions | Dealers’ Concessions | |||||||
| Multi-Asset Balanced Opportunity Fund | $ | 245,500 | $ | 1,586,279 | ||||
| Multi-Asset Income Fund | 110,133 | 705,133 | ||||||
Distributor received the following amount of CDSCs for the fiscal year ended November 30, 2021:
| Class A | Class C | |||||||
| Multi-Asset Balanced Opportunity Fund | $ | 7,387 | $ | 9,574 | ||||
| Multi-Asset Income Fund | 4,384 | 5,351 | ||||||
One Trustee and certain of the Trust’s officers have an interest in Lord Abbett.
| 4. | DISTRIBUTIONS AND CAPITAL LOSS CARRYFORWARDS |
Dividends from net investment income, if any, are declared and paid monthly for Multi-Asset Balanced Opportunity Fund and Multi-Asset Income Fund. Taxable net realized gains from investment transactions, reduced by allowable capital loss carryforwards, if any, are declared and distributed to shareholders at least annually. The capital loss carryforward amount, if any, is available to offset future net capital gains. Dividends and distributions to shareholders are recorded on the ex-dividend date. The amounts of dividends and distributions from net investment income and net realized capital gains are determined in accordance with federal income tax regulations, which may differ from U.S. GAAP. These book/tax differences are either considered temporary or permanent in nature. To the extent these differences are permanent in nature, such amounts are reclassified within the components of net assets based on their federal tax basis treatment; temporary differences do not require reclassification. Dividends and distributions, which exceed earnings and profits for tax purposes, are reported as a tax return of capital.
The tax character of distributions paid during the fiscal year ended November 30, 2021 and fiscal year ended November 30, 2020 was as follows:
| Multi-Asset Balanced Opportunity Fund | Multi-Asset Income Fund | |||||||||||||||
| Year Ended 11/30/2021 | Year Ended 11/30/2020 | Year Ended 11/30/2021 | Year Ended 11/30/2020 | |||||||||||||
| Distributions paid from: | ||||||||||||||||
| Tax Exempt Income | $ | 324,743 | $ | 783,207 | $ | 1,454,134 | $ | 1,133,710 | ||||||||
| Ordinary income | 93,819,030 | 45,820,935 | 41,891,075 | 25,865,680 | ||||||||||||
| Net long-term capital gains | 53,919,159 | 30,376,355 | – | – | ||||||||||||
| Total distributions paid | $ | 148,062,932 | $ | 76,980,497 | $ | 43,345,209 | $ | 26,999,390 | ||||||||
42
Notes to Financial Statements (continued)
As of November 30, 2021, the components of accumulated gains (losses) on a tax-basis were as follows:
| Multi-Asset Balanced Opportunity Fund | Multi-Asset Income Fund | |||||||
| Undistributed ordinary income – net | $ | 127,896,173 | $ | 38,681,107 | ||||
| Undistributed long-term capital gains | 271,701,274 | – | ||||||
| Total undistributed earnings | 399,597,447 | 38,681,107 | ||||||
| Capital loss carryforwards* | (6,383,073 | ) | (8,440,777 | ) | ||||
| Temporary differences | (439,230 | ) | (197,386 | ) | ||||
| Unrealized gains (losses) – net | 80,798,865 | 13,761,952 | ||||||
| Total accumulated gains (losses) - net | $ | 473,574,009 | $ | 43,804,896 | ||||
| * | The capital losses will carry forward indefinitely. |
As of November 30, 2021, the aggregate unrealized security gains and losses on investments and other financial instruments based on cost for U.S. federal income tax purposes were as follows:
| Multi-Asset Balanced Opportunity Fund | Multi-Asset Income Fund | |||||||
| Tax cost | $ | 2,636,367,611 | $ | 1,270,814,030 | ||||
| Gross unrealized gain | 102,095,135 | 25,378,167 | ||||||
| Gross unrealized loss | (21,296,276 | ) | (11,616,173 | ) | ||||
| Net unrealized security gain (loss) | $ | 80,798,859 | $ | 13,761,994 | ||||
The difference between book-basis and tax-basis unrealized gains (losses) is attributable to the tax treatment of certain distributions, other financial instruments and wash sales.
| 5. | PORTFOLIO SECURITIES TRANSACTIONS |
Purchases and sales of investment securities (excluding short-term investments) for the fiscal year ended November 30, 2021 were as follows:
| Purchases | Sales | |||||||
| Multi-Asset Balanced Opportunity Fund | $ | 1,366,842,901 | $ | 1,247,872,536 | ||||
| Multi-Asset Income Fund | 545,945,506 | 503,852,978 | ||||||
There were no purchases or sales of U.S. Government securities for the fiscal year ended November 30, 2021.
| 6. | DISCLOSURES ABOUT DERIVATIVE INSTRUMENTS AND HEDGING ACTIVITIES |
The Funds entered into forward foreign currency exchange contracts for the fiscal year ended November 30, 2021 (as described in Note 2(g)). A forward foreign currency exchange contract reduces each Fund’s exposure to changes in the value of the currency it will deliver (or settle in cash) and increases its exposure to changes in the value of the currency it will receive (or settle in cash) for the duration of the contract. Each Fund’s use of forward foreign currency exchange contracts involves the risk that Lord Abbett will not accurately predict currency movements, and each Fund’s returns could be reduced as a result. Forward foreign currency exchange contracts are subject to the risk that those currencies will decline in value relative to the U.S. dollar, or, in the case of hedged positions, that the U.S. dollar will decline relative to the currency being hedged. Currency rates in foreign countries may fluctuate significantly over short periods of time. Each Fund’s risk of loss from counterparty credit risk is the unrealized appreciation on forward foreign currency exchange contracts.
43
Notes to Financial Statements (continued)
The Funds entered into domestic and foreign equity index futures contracts for the fiscal year ended November 30, 2021 (as described in Note 2(h)) to manage cash and economically hedge against changes in interest rates. The Funds bear the risk of interest rates moving unexpectedly, in which case the Funds may not achieve the anticipated benefits of the futures contracts and realize a loss. There is minimal counterparty credit risk to the Funds since futures are exchange traded and the exchange’s clearinghouse, as counterparty to all exchange traded futures, guarantees futures against default.
The Funds entered into swaptions and options on indexes and foreign currencies for the fiscal year ended November 30, 2021 (as described in Note 2(j)) to obtain exposure to an issuer (the Reference Entity). The Funds’ use of swaptions and options involves the risk that Lord Abbett will not accurately predict expectations of market value of the Reference Entity, and the Funds’ returns could be reduced as a result. The Funds’ risk of loss from counterparty credit risk is the notional value of the contract.
The Funds entered into total return swaps on indexes and foreign currencies for the fiscal year ended November 30, 2021 (as described in Note 2(k)) to hedge credit risk. The Funds may enter into total return swap agreements to obtain exposure to a security or market without owning such security or investing directly in that market. The Funds may agree to make payments that are the equivalent of interest in exchange for the right to receive payments equivalent to any appreciation in the value of an underlying security, index or other asset, as well as receive payments equivalent to any distributions made on that asset, over the term of the swap. If the value of the asset underlying a total return swap declines over the term of the swap, the Funds also may be required to pay an amount equal to that decline in value to their counterparty.
The Funds entered into credit default swaps for the fiscal year ended November 30, 2021 (as described in Note 2(i)) for investment purposes, to economically hedge credit risk or for speculative purposes. Credit default swaps involve the exchange of a fixed rate premium for protection against the loss in value of an underlying security in the event of a defined credit event, such as payment default or bankruptcy. Under a credit default swap one party acts as a guarantor by receiving the fixed periodic payment in exchange for the commitment to purchase the underlying security at par if the defined credit event occurs. Upon the occurrence of a defined credit event, the difference between the value of the reference obligation and the swap’s notional amount is recorded as realized gain or loss on swap transactions in the Statements of Operations. Each Fund’s maximum risk of loss from counterparty risk, either as the protection seller or as the protection buyer, is the fair value of the contract. For the centrally cleared credit default swaps, there is minimal counterparty credit risk to the Funds since these credit default swaps are traded through a central clearinghouse. As a counterparty to all centrally cleared credit default swaps, the clearinghouse guarantees credit default swaps against default.
As of November 30, 2021 the Funds had the following derivatives at fair value, grouped into risk categories that illustrate the Funds’ use of derivative instruments:
| Multi-Asset Balanced Opportunity Fund | |
| Asset Derivatives | Equity Contracts |
| Futures Contracts(1) | $1,853,261 |
| Multi-Asset Income Fund | |
| Asset Derivatives | Equity Contracts |
| Futures Contracts(1) | $ 871,878 |
44
Notes to Financial Statements (continued)
| (1) | Statements of Assets and Liabilities location: Includes cumulative unrealized appreciation/depreciation on futures contracts as reported in the Schedule of Investments. Only current day’s variation margin reported is within the Statements of Assets and Liabilities. |
Transactions in derivative instruments for the fiscal year ended November 30, 2021 were as follows:
| Multi-Asset Balanced Opportunity Fund | ||||||||||||||||||||
| Equity Contracts | Inflation Linked/ Interest Rate Contracts | Foreign Currency Contracts | Credit Contracts | Index Contracts | ||||||||||||||||
| Net Realized Gain (Loss) | ||||||||||||||||||||
| Credit Default Swaps Contracts(1) | – | – | – | $ | (166,180 | ) | – | |||||||||||||
| Forward Foreign Currency Exchange Contracts(2) | – | – | $ | (857 | ) | – | – | |||||||||||||
| Futures Contracts(3) | $ | (22,386,014 | ) | $ | (11,070,971 | ) | – | – | $ | (8,485,963 | ) | |||||||||
| Interest Rate Swaps Contracts(1) | – | $ | (2,890,854 | ) | – | – | – | |||||||||||||
| Purchased Options(4) | $ | (54,218,551 | ) | – | $ | (6,938,188 | ) | – | – | |||||||||||
| OTC Written Options(5) | $ | 27,934,791 | – | $ | 4,000,038 | – | – | |||||||||||||
| Total Return Swaps Contracts(1) | $ | 34,591,684 | $ | (31,880,119 | ) | – | – | – | ||||||||||||
| Net Change in Unrealized Appreciation/Depreciation | ||||||||||||||||||||
| Forward Foreign Currency Exchange Contracts(6) | – | – | $ | 851 | – | – | ||||||||||||||
| Futures Contracts(7) | $ | (2,179,957 | ) | $ | (604,803 | ) | – | – | – | |||||||||||
| Purchased Options(8) | $ | 40,636,049 | – | $ | 5,638,334 | – | – | |||||||||||||
| Total Return Swap Contracts(9) | $ | (1,184,295 | ) | $ | 111,770 | – | – | – | ||||||||||||
| OTC Written Options(10) | $ | (21,754,443 | ) | – | $ | (3,992,359 | ) | – | – | |||||||||||
| Average Number of Contracts/Notional Amounts* | ||||||||||||||||||||
| CPI/Interest Rate Swap Contracts(11) | – | 42,307,692 | – | – | – | |||||||||||||||
| Credit Default Swap Contracts(11) | – | – | – | 6,447,692 | – | |||||||||||||||
| Total Return Swap Contracts(11) | 6,781,080 | 140,766,618 | – | – | – | |||||||||||||||
| Forward Foreign Currency Exchange Contracts(12) | – | – | $ | 669,547 | – | – | ||||||||||||||
| Futures Contracts(11) | 785 | 1,080 | – | – | 251 | |||||||||||||||
| Purchased Options(11) | 121,302 | – | 37,500,000 | – | – | |||||||||||||||
| OTC Written Options(11) | 121,302 | – | 40,429,577 | – | – | |||||||||||||||
45
Notes to Financial Statements (continued)
| Multi-Asset Income Fund | ||||||||||||||||||||
| Equity Contracts | Inflation Linked/ Interest Rate Contracts | Foreign Currency Contracts | Credit Contracts | Index Contracts | ||||||||||||||||
| Net Realized Gain (Loss) | ||||||||||||||||||||
| Credit Default Swaps Contracts(1) | – | – | – | $ | (78,235 | ) | – | |||||||||||||
| Forward Foreign Currency Exchange Contracts(2) | – | – | $ | (857 | ) | – | – | |||||||||||||
| Futures Contracts(3) | $ | (13,591,081 | ) | $ | (5,397,653 | ) | – | – | $ | (4,037,663 | ) | |||||||||
| Interest Rate Swap Contracts(1) | – | $ | (1,419,146 | ) | – | – | – | |||||||||||||
| Purchased Options(4) | $ | (19,916,116 | ) | – | $ | (5,949,835 | ) | – | – | |||||||||||
| OTC Written Options(5) | $ | 9,847,432 | – | $ | 4,480,929 | – | – | |||||||||||||
| Total Return Swap Contracts(1) | $ | 16,907,896 | $ | (14,734,758 | ) | – | – | – | ||||||||||||
| Net Change in Unrealized Appreciation/Depreciation | ||||||||||||||||||||
| Forward Foreign Currency Exchange Contracts(6) | – | – | $ | 851 | – | – | ||||||||||||||
| Futures Contracts(7) | $ | 127,496 | $ | (296,501 | ) | – | – | – | ||||||||||||
| Purchased Options(8) | $ | 14,342,596 | – | $ | 5,638,334 | – | – | |||||||||||||
| Total Return Swap Contracts(9) | $ | (583,294 | ) | $ | 55,051 | – | – | – | ||||||||||||
| OTC Written Options(10) | $ | (7,767,683 | ) | – | $ | (3,992,359 | ) | – | – | |||||||||||
| Average Number of Contracts/Notional Amounts* | ||||||||||||||||||||
| CPI/Interest Rate Swap Contracts(11) | – | 20,769,231 | – | – | – | |||||||||||||||
| Credit Default Swap Contracts(11) | – | – | – | 3,045,692 | – | |||||||||||||||
| Total Return Swap Contracts(11) | 3,342,457 | 65,525,962 | – | – | – | |||||||||||||||
| Forward Foreign Currency Exchange Contracts(12) | – | – | $ | 669,547 | – | – | ||||||||||||||
| Futures Contracts(11) | 340 | 511 | – | – | 119 | |||||||||||||||
| Purchased Options(11) | 43,743 | – | 42,700,251 | – | – | |||||||||||||||
| OTC Written Options(11) | 43,743 | – | 40,429,577 | – | – | |||||||||||||||
| * | Calculated based on the number of contracts or notional amounts for the fiscal year ended November 30, 2021. |
| (1) | Statements of Operations location: Net realized gain (loss) on swap contracts. |
| (2) | Statements of Operations location: Net realized gain (loss) on forward foreign currency exchange contracts. |
| (3) | Statements of Operations location: Net realized gain (loss) on futures contracts. |
| (4) | Statements of Operations location: Net realized gain (loss) on investments includes options purchased. |
| (5) | Statements of Operations location: Net realized gain (loss) on OTC written options. |
| (6) | Statements of Operations location: Net change in unrealized appreciation/depreciation on forward foreign currency exchange contracts. |
| (7) | Statements of Operations location: Net change in unrealized appreciation/depreciation on futures contracts. |
| (8) | Statements of Operations location: Net change in unrealized appreciation/depreciation on investments includes options purchased. |
| (9) | Statements of Operations location: Net change in unrealized appreciation/depreciation on swap contracts. |
| (10) | Statements of Operations location: Net change in unrealized appreciation/depreciation on OTC written options. |
| (11) | Amount represents number of contracts. |
| (12) | Amount represents notional amounts in U.S. dollars. |
46
Notes to Financial Statements (continued)
| 7. | DISCLOSURES ABOUT OFFSETTING ASSETS AND LIABILITIES |
The Financial Accounting Standards Board (“FASB”) requires disclosures intended to help better assess the effect or potential effect of offsetting arrangements on a fund’s financial position. The following tables illustrate gross and net information about recognized assets and liabilities eligible for offset in the Statements of Assets and Liabilities; and disclose such amounts subject to an enforceable master netting agreement or similar agreement, by a counterparty. A master netting agreement is an agreement between a fund and a counterparty which provides for the net settlement of amounts owed under all contracts traded under that agreement, as well as cash collateral, through a single payment by one party to the other in the event of default on or termination of any one contract. The Funds’ accounting policy with respect to balance sheet offsetting is that, absent an event of default by the counterparty or a termination of the agreement, the master netting agreement does not result in an offset of reported amounts of financial assets and liabilities in the Statements of Assets and Liabilities across transactions between the Funds and the applicable counterparty:
| Multi-Asset Balanced Opportunity Fund | ||||||||||||
| Description | Gross Amounts of Recognized Assets | Gross Amounts Offset in the Statement of Assets and Liabilities | Net Amounts of Assets Presented in the Statement of Assets and Liabilities | |||||||||
| Repurchase Agreements | $ | 1,012,088 | $ | – | $ | 1,012,088 | ||||||
| Total | $ | 1,012,088 | $ | – | $ | 1,012,088 | ||||||
| Net Amount of | Amounts Not Offset in the Statement of Assets and Liabilities | |||||||||||||||||||
| Counterparty | Assets Presented in the Statement of Assets and Liabilities | Financial Instruments | Cash Collateral Received(a) | Securities Collateral Received(a) | Net Amount(b) | |||||||||||||||
| Fixed Income Clearing Corp. | $ | 1,012,088 | $ | – | $ | – | $ | (1,012,088 | ) | $ | – | |||||||||
| Total | $ | 1,012,088 | $ | – | $ | – | $ | (1,012,088 | ) | $ | – | |||||||||
| Multi-Asset Income Fund | ||||||||||||
| Description | Gross Amounts of Recognized Assets | Gross Amounts Offset in the Statement of Assets and Liabilities | Net Amounts of Assets Presented in the Statement of Assets and Liabilities | |||||||||
| Repurchase Agreements | $ | 387,082 | $ | – | $ | 387,082 | ||||||
| Total | $ | 387,082 | $ | – | $ | 387,082 | ||||||
| Net Amount of | Amounts Not Offset in the Statement of Assets and Liabilities | |||||||||||||||||||
| Counterparty | Assets Presented in the Statement of Assets and Liabilities | Financial Instruments | Cash Collateral Received(a) | Securities Collateral Received(a) | Net Amount(b) | |||||||||||||||
| Fixed Income Clearing Corp. | $ | 387,082 | $ | – | $ | – | $ | (387,082 | ) | $ | – | |||||||||
| Total | $ | 387,082 | $ | – | $ | – | $ | (387,082 | ) | $ | – | |||||||||
| (a) | Collateral disclosed is limited to an amount not to exceed 100% of the net amount of assets (liabilities) presented in the Statements of Assets and Liabilities, for each respective counterparty. |
| (b) | Net amount represents the amount owed to the Fund by the counterparty as of November 30, 2021. |
47
Notes to Financial Statements (continued)
| 8. | TRUSTEES’ REMUNERATION |
The Trust’s officers and one Trustee, who are associated with Lord Abbett, do not receive any compensation from the Trust for serving in such capacities. Independent Trustees’ fees are allocated among all Lord Abbett-sponsored funds based on the net assets of each fund. There is an equity-based plan available to all Independent Trustees under which Independent Trustees must defer receipt of a portion of, and may elect to defer receipt of an additional portion of Trustees’ fees. The deferred amounts are treated as though equivalent dollar amounts had been invested in the funds. Such amounts and earnings accrued thereon are included in Trustees’ fees on the Statements of Operations and in Trustees’ fees payable on the Statements of Assets and Liabilities and are not deductible for U.S. federal income tax purposes until such amounts are paid.
| 9. | EXPENSE REDUCTIONS |
The Trust has entered into an arrangement with its transfer agent and custodian, whereby credits realized as a result of uninvested cash balances are used to reduce a portion of each Fund’s expenses.
| 10. | INTERFUND LENDING PROGRAM |
Pursuant to an exemptive order issued by the U.S. Securities and Exchange Commission (“SEC exemptive order”) certain registered open-end management investment companies managed by Lord Abbett, including each Fund, participate in a joint lending and borrowing program (the “Interfund Lending Program”). The SEC exemptive order allows the Funds to borrow money from and lend money to each other for temporary or emergency purposes subject to the limitations and conditions.
For the fiscal year ended November 30, 2021, the Funds did not participate as a borrower or lender in the Interfund Lending Program.
| 11. | TRANSACTIONS WITH AFFILIATED ISSUERS |
An affiliated issuer is one in which a Fund has ownership of at least 5% of the outstanding voting securities of the underlying issuer at any point during the fiscal year or any company which is under common ownership or control. Multi-Asset Balanced Opportunity Fund and Multi-Asset Income Fund had the following transactions with affiliated issuers during the fiscal year ended November 30, 2021:
48
Notes to Financial Statements (continued)
| Multi-Asset Balanced Opportunity Fund | ||||||||||||||||||||||||||||||||
| Affiliated Issuer | Value at 11/30/2020 | Purchases at Cost | Proceeds from Sales | Net Realized Gain (Loss | ) | Change in Appreciation (Depreciation | ) | Value at 11/30/2021 | Shares as of 11/30/2021 | Dividend Income | ||||||||||||||||||||||
| Lord Abbett Convertible Fund–Class I | $ | 100,197,430 | $ | 17,744,611 | $ | (75,274,783 | ) | $ | 40,021,347 | (a) | $ | (30,664,108 | ) | $ | 38,141,381 | 1,967,065 | $ | 861,496 | ||||||||||||||
| Lord Abbett Core Fixed Income Fund–Class I | 72,451,949 | 42,414,477 | (23,608,828 | ) | 2,095,395 | (b) | (3,428,952 | ) | 87,721,578 | 7,881,543 | 1,066,485 | |||||||||||||||||||||
| Lord Abbett Durable Growth Fund–Class I | 138,510,505 | 138,777,343 | (101,192,323 | ) | 59,148,527 | (c) | (27,578,815 | ) | 177,699,338 | 8,362,322 | – | |||||||||||||||||||||
| Lord Abbett Emerging Markets Bond Fund–Class I | 186,825,204 | 6,777,888 | (64,401,300 | ) | (3,379,120 | ) | (6,805,803 | ) | 119,016,869 | 24,388,702 | 6,242,664 | |||||||||||||||||||||
| Lord Abbett Floating Rate Loan Fund–Class I | 49,064,070 | 10,080,331 | (48,932,390 | ) | 1,460,609 | (200,396 | ) | 11,472,224 | 1,370,636 | 1,488,896 | ||||||||||||||||||||||
| Lord Abbett Focused Large Cap Value Fund–Class I | 438,857,261 | 250,011,632 | (209,918,159 | ) | 193,151,398 | (d) | (76,100,299 | ) | 492,032,108 | 33,933,249 | 9,906,683 | |||||||||||||||||||||
| Lord Abbett Focused Small Cap Value Fund–Class I | – | 46,742,643 | (43,681,433 | ) | 11,059,789 | (e) | 1,226,896 | 13,971,351 | 481,273 | 29,409 | ||||||||||||||||||||||
| Lord Abbett Fundamental Equity Fund–Class I | 202,672,063 | 45,646,652 | (100,968,764 | ) | 23,683,357 | (f) | 13,476,269 | 166,762,679 | 12,700,890 | 2,011,547 | ||||||||||||||||||||||
| Lord Abbett Growth Leaders Fund–Class I | 334,403,698 | 88,348,983 | (126,928,283 | ) | 115,076,694 | (g) | (55,484,583 | ) | 299,984,032 | 6,786,969 | – | |||||||||||||||||||||
| Lord Abbett Growth Opportunities Fund–Class I | 141,506,517 | 72,529,800 | (52,006,977 | ) | 35,256,336 | (h) | (21,700,305 | ) | 158,387,442 | 4,280,742 | – | |||||||||||||||||||||
| Lord Abbett High Yield Fund–Class I | 357,137,949 | 105,105,410 | (16,017,750 | ) | (479,842 | ) | 5,621,270 | 451,367,037 | 60,504,965 | 20,998,715 | ||||||||||||||||||||||
| Lord Abbett Inflation Focused Fund–Class I | 67,895,463 | 82,009,284 | (20,428,657 | ) | 469,284 | 7,306,915 | 137,252,289 | 11,033,142 | 2,689,386 | |||||||||||||||||||||||
| Lord Abbett Intermediate Tax Free–Class I | 39,023,370 | 1,160,869 | (40,367,926 | ) | 1,021,851 | (838,164 | ) | – | – | 390,987 | ||||||||||||||||||||||
| Lord Abbett International Equity Fund–Class I | 133,084,907 | 1,862,489 | (43,906,720 | ) | 7,223,563 | 7,803,155 | 106,067,394 | 6,188,296 | 1,862,489 | |||||||||||||||||||||||
| Lord Abbett International Value Fund–Class I | 141,905,738 | 86,995,045 | (23,040,011 | ) | 2,051,498 | 2,164,371 | 210,076,641 | 27,569,113 | 5,935,312 | |||||||||||||||||||||||
| Lord Abbett Mid Cap Stock Fund–Class I | 113,248,950 | 1,678,229 | (22,374,127 | ) | 2,319,691 | 25,685,325 | 120,558,068 | 3,453,396 | 1,678,228 | |||||||||||||||||||||||
| Lord Abbett Short Duration Income Fund–Class I | – | 237,589,439 | (221,701,516 | ) | (172,923 | ) | (44,634 | ) | 15,670,366 | 3,766,915 | 371,662 | |||||||||||||||||||||
| Lord Abbett Value Opportunities Fund–Class I | – | 117,625,955 | – | 12,792,004 | (i) | (9,505,631 | ) | 108,120,324 | 5,017,184 | 240,008 | ||||||||||||||||||||||
| Total | $ | 502,799,458 | $ | (169,067,489 | ) | $ | 2,714,301,121 | $ | 55,773,967 | |||||||||||||||||||||||
| (a) | Includes $13,883,116 of distributed capital gains. |
| (b) | Includes $2,202,463 of distributed capital gains. |
| (c) | Includes $29,965,899 of distributed capital gains. |
| (d) | Includes $103,969,725 of distributed capital gains. |
| (e) | Includes $1,376,544 of distributed capital gains. |
| (f) | Includes $17,746,898 of distributed capital gains. |
| (g) | Includes $55,432,477 of distributed capital gains. |
| (h) | Includes $17,197,929 of distributed capital gains. |
| (i) | Includes $12,792,004 of distributed capital gains. |
49
Notes to Financial Statements (continued)
| Multi-Asset Income Fund | ||||||||||||||||||||||||||||||||
| Affiliated Issuer | Value at 11/30/2020 | Purchases at Cost | Proceeds from Sales | Net Realized Gain (Loss | ) | Change in Appreciation (Depreciation | ) | Value at 11/30/2021 | Shares as of 11/30/2021 | Dividend Income | ||||||||||||||||||||||
| Lord Abbett Convertible Fund–Class I | $ | 37,508,242 | $ | 6,650,408 | $ | (29,748,360 | ) | $ | 14,618,179 | (a) | $ | (10,896,410 | ) | $ | 12,935,007 | 667,097 | $ | 298,491 | ||||||||||||||
| Lord Abbett Core Fixed Income Fund–Class I | 150,689,362 | 29,280,261 | (8,560,526 | ) | 4,898,167 | (b) | (7,411,364 | ) | 164,060,863 | 14,740,419 | 2,355,932 | |||||||||||||||||||||
| Lord Abbett Durable Growth Fund–Class I | 42,273,949 | 62,117,064 | (37,282,333 | ) | 23,454,107 | (c) | (11,845,837 | ) | 67,358,168 | 3,169,796 | – | |||||||||||||||||||||
| Lord Abbett Emerging Markets Bond Fund–Class I | 85,644,633 | 3,039,900 | (21,012,414 | ) | (1,331,795 | ) | (3,578,959 | ) | 62,761,365 | 12,860,935 | 3,047,553 | |||||||||||||||||||||
| Lord Abbett Floating Rate Loan Fund–Class I | 23,806,638 | 24,225,106 | (10,307,317 | ) | 289,356 | 171,019 | 38,184,802 | 4,562,103 | 1,339,868 | |||||||||||||||||||||||
| Lord Abbett Focused Large Cap Value Fund–Class I | 164,189,573 | 61,836,575 | (90,151,085 | ) | 69,914,016 | (d) | (27,610,927 | ) | 147,095,808 | 10,144,538 | 3,013,637 | |||||||||||||||||||||
| Lord Abbett Focused Small Cap Value Fund–Class I | – | 12,702,032 | (9,780,414 | ) | 2,461,971 | (e) | 496,860 | 5,353,035 | 184,397 | 11,268 | ||||||||||||||||||||||
| Lord Abbett Fundamental Equity Fund–Class I | 47,162,659 | 15,560,087 | (9,075,869 | ) | 6,349,265 | (f) | 3,549,442 | 57,433,506 | 4,374,220 | 692,783 | ||||||||||||||||||||||
| Lord Abbett Growth Leaders Fund–Class I | 101,241,583 | 30,587,866 | (44,720,938 | ) | 32,691,825 | (g) | (14,325,970 | ) | 89,024,074 | 2,014,119 | – | |||||||||||||||||||||
| Lord Abbett Growth Opportunities Fund–Class I | 43,934,930 | 31,444,244 | (24,363,792 | ) | 13,273,650 | (h) | (9,701,288 | ) | 49,248,133 | 1,331,031 | – | |||||||||||||||||||||
| Lord Abbett High Yield Fund–Class I | 185,846,007 | 49,583,957 | (5,847,026 | ) | (186,145 | ) | 2,890,925 | 232,287,718 | 31,137,764 | 10,621,953 | ||||||||||||||||||||||
| Lord Abbett Inflation Focused Fund–Class I | 61,409,479 | 44,151,894 | (4,915,475 | ) | 120,435 | 6,380,852 | 107,147,185 | 8,613,118 | 2,153,270 | |||||||||||||||||||||||
| Lord Abbett Intermediate Tax Free–Class I | 95,365,566 | 1,579,047 | (75,924,755 | ) | 2,974,473 | (2,173,022 | ) | 21,821,309 | 1,920,890 | 1,613,896 | ||||||||||||||||||||||
| Lord Abbett International Equity Fund–Class I | 66,271,678 | 909,482 | (20,585,718 | ) | 4,907,360 | 2,570,197 | 54,072,999 | 3,154,784 | 909,482 | |||||||||||||||||||||||
| Lord Abbett International Value Fund–Class I | 68,496,306 | 28,876,913 | (10,156,815 | ) | (408,169 | ) | 3,605,352 | 90,413,587 | 11,865,300 | 2,611,053 | ||||||||||||||||||||||
| Lord Abbett Mid Cap Stock Fund–Class I | 36,482,855 | 540,637 | (8,611,614 | ) | 1,207,005 | 7,833,177 | 37,452,060 | 1,072,818 | 540,637 | |||||||||||||||||||||||
| Lord Abbett Short Duration Income Fund–Class I | – | 99,813,252 | (86,590,179 | ) | (36,971 | ) | (99,852 | ) | 13,086,250 | 3,145,733 | 225,565 | |||||||||||||||||||||
| Lord Abbett Value Opportunities Fund–Class I | – | 36,535,040 | – | 3,973,080 | (i) | (2,953,845 | ) | 33,581,195 | 1,558,292 | 74,545 | ||||||||||||||||||||||
| Total | $ | 179,169,809 | $ | (63,099,650 | ) | $ | 1,283,317,064 | $ | 29,509,933 | |||||||||||||||||||||||
| (a) | Includes $5,197,052 of distributed capital gains. |
| (b) | Includes $4,835,037 of distributed capital gains. |
| (c) | Includes $11,358,782 of distributed capital gains. |
| (d) | Includes $31,082,344 of distributed capital gains. |
| (e) | Includes $527,414 of distributed capital gains. |
| (f) | Includes $6,112,078 of distributed capital gains. |
| (g) | Includes $5,339,611 of distributed capital gains. |
| (h) | Includes $16,450,292 of distributed capital gains. |
| (i) | Includes $3,973,080 of distributed capital gains. |
50
Notes to Financial Statements (continued)
| 12. | CUSTODIAN AND ACCOUNTING AGENT |
State Street Bank and Trust Company (“SSB”) is the Trust’s custodian and accounting agent. SSB performs custodial, accounting and recordkeeping functions relating to portfolio transactions and calculating each Fund’s NAV.
| 13. | INVESTMENT RISKS |
The Funds invest principally in the Underlying Funds and, as a result, a Fund’s performance is directly related to the Underlying Fund’s performance. Each Fund’s ability to meet its investment objective depends on the ability of the Underlying Funds to achieve their investment objectives and on the Fund’s particular allocation of assets among the Underlying Funds and the asset classes they represent. Consequently, a Fund is subject to the particular risks of the Underlying Funds in the proportion in which the Fund invests in them. The value of the Underlying Funds’ investments and the NAVs of the shares of both the Funds and their Underlying Funds will fluctuate in response to various market and economic factors related to the domestic and foreign equity and fixed income markets, as well as the financial condition and prospects of issuers in which the Underlying Funds invest.
Certain instruments in which the Funds may invest may rely in some fashion upon LIBOR. On March 5, 2021 the United Kingdom Financial Conduct Authority (FCA) and LIBOR’s administrator, ICE Benchmark Administration (IBA), announced that most LIBOR settings will no longer be published after the end of 2021 and a majority of U.S. dollar LIBOR settings will no longer be published after June 30, 2023. Abandonment of or modification to LIBOR could have adverse impacts on newly issued financial instruments and existing financial instruments which reference LIBOR and lead to significant short-term and long-term uncertainty and market instability.
Multi-Asset Balanced Opportunity Fund and Multi-Asset Income Fund are subject to the general risks and considerations associated with investing in fixed income securities. The value of an investment will change as interest rates fluctuate and in response to market movements. When interest rates rise, the prices of fixed income securities are likely to decline; when rates fall, such prices tend to rise. Longer-term securities are usually more sensitive to interest rate changes. There is also the risk that an issuer of a fixed income security will fail to make timely payments of principal and/or interest to an Underlying Fund, a risk that is greater with high-yield bonds (sometimes called “junk bonds”) in which one or more of the Underlying Funds may invest. Some issuers, particularly of high-yield bonds, may default as to principal and/or interest payments after an Underlying Fund purchases their securities. A default, or concerns in the market about an increase in risk of default, may result in losses to the Underlying Fund. High- yield bonds are subject to greater price fluctuations, as well as additional risks. The market for below investment grade securities may be less liquid due to such factors as interest rate sensitivity, negative perceptions of the junk bond markets generally, and less secondary market liquidity. This may make such securities more difficult to sell at an acceptable price, especially during periods of financial distress, increased market volatility, or significant market decline.
Each Fund is subject to the general risks and considerations associated with equity investing. The value of an investment will fluctuate in response to movements in the equity securities market in general, a particular industry or sector, or to the changing prospects of individual companies in which the Underlying Funds invest. If an Underlying Fund’s assessment of market conditions or companies held in the Underlying Fund fails to produce the intended result, a Fund could suffer losses or produce poor performance relative to other funds, even in a rising market. Each Fund’s investment exposure to foreign (which may include emerging market) companies generally is
51
Notes to Financial Statements (continued)
subject to the risk that the value of securities issued by foreign companies may be adversely affected by political, economic and social volatility and subject to less government supervision, lack of transparency, or inadequate regulatory and accounting standards, inadequate exchange control regulations, foreign taxes, higher transaction and other costs, and delays in settlement.
The cost of a Fund’s potential use of forward currency exchange contracts varies with factors such as the currencies involved, the length of the contract period and the market conditions prevailing. The Underlying Fund’s investments in emerging market companies generally are subject to more risks than investments in developed market companies.
Because Multi-Asset Income Fund will be more heavily invested in fixed income funds than equity funds, it will be more affected by the risks associated with fixed income securities. Given Multi-Asset Balanced Opportunity Fund’s more balanced allocation among fixed income funds and equity funds, each will be affected by risks associated with both equity and fixed income investments.
Each Fund may invest in derivatives, either directly or through its Underlying Funds. Each Fund is subject to the risks associated with derivatives, which may be different from and greater than the risks associated with investing directly in securities and other investments. Derivatives may be subject to risks such as liquidity risk, leveraging risk, interest rate risk, market risk, heightened counterparty risk, credit risk, and volatility. Illiquid securities may lower the Funds’ returns since the Funds may be unable to sell these securities at their desired time or price. Derivatives also may involve the risk of mispricing or improper valuation and the risk that changes in the value of the derivative may not correlate perfectly with the value of the underlying asset, rate or index. Whether a Fund’s use of derivatives is successful will depend on, among other things, the Fund’s ability to correctly forecast market movements, changes in foreign exchange and interest rates, and other factors. If a Fund incorrectly forecasts these and other factors, its performance could suffer. A Fund’s use of derivatives could result in a loss exceeding the amount of the Fund’s investment in these instruments.
Geopolitical and other events (e.g., wars, terrorism, natural disasters, epidemics or pandemics such as the COVID-19 outbreak which began in late 2019) may disrupt securities markets and adversely affect global economies and markets, thereby decreasing the value of each Fund’s investments. Market disruptions can also prevent the Funds from implementing their investment strategies and achieving their investment objectives.
The transmission of COVID-19 and efforts to contain its spread have resulted in, among other things, border closings and other significant travel restrictions and disruptions, significant disruptions to business operations, supply chains and customer activity, lower consumer demand for goods and services, event cancellations and restrictions, service cancellations, reductions and other changes, significant challenges in healthcare service preparation and delivery, and prolonged quarantines, as well as general concern and uncertainty. The impact of the COVID-19 outbreak could negatively affect the global economy, the economies of individual countries, and the financial performance of individual issuers, sectors, industries, asset classes, and markets in significant and unforeseen ways.
The COVID-19 pandemic and its effects may last for an extended period of time, and in either case could result in significant market volatility, exchange trading suspensions and closures, declines in global financial markets, higher default rates, and a substantial economic downturn or recession.
52
Notes to Financial Statements (continued)
The foregoing could disrupt the operations of each Fund and its service providers, adversely affect the value and liquidity of each Fund’s investments, and negatively impact each Fund’s performance and your investment in each Fund.
These factors, and others, can affect each Fund’s performance.
| 14. | SUMMARY OF CAPITAL TRANSACTIONS |
Transactions in shares of beneficial interest were as follows:
| Multi-Asset Balanced Opportunity Fund | Year Ended November 30, 2021 | Year Ended November 30, 2020 | ||||||||||||||
| Class A Shares | Shares | Amount | Shares | Amount | ||||||||||||
| Shares sold | 15,718,373 | $ | 219,093,643 | 11,691,588 | $ | 134,775,665 | ||||||||||
| Converted from Class C* | 1,813,202 | 25,251,677 | 5,206,781 | 61,124,085 | ||||||||||||
| Reinvestment of distributions | 9,172,348 | 121,436,320 | 5,294,475 | 62,047,591 | ||||||||||||
| Shares reacquired | (21,736,270 | ) | (301,735,617 | ) | (33,568,230 | ) | (378,469,363 | ) | ||||||||
| Increase (decrease) | 4,967,653 | $ | 64,046,023 | (11,375,386 | ) | $ | (120,522,022 | ) | ||||||||
| Class C Shares | ||||||||||||||||
| Shares sold | 1,591,251 | $ | 21,981,160 | 1,483,646 | $ | 16,941,994 | ||||||||||
| Reinvestment of distributions | 980,150 | 12,783,991 | 668,460 | 7,795,530 | ||||||||||||
| Shares reacquired | (4,142,411 | ) | (57,084,175 | ) | (6,690,342 | ) | (75,546,252 | ) | ||||||||
| Converted to Class A* | (1,827,445 | ) | (25,251,677 | ) | (5,245,720 | ) | (61,124,085 | ) | ||||||||
| Decrease | (3,398,455 | ) | $ | (47,570,701 | ) | (9,783,956 | ) | $ | (111,932,813 | ) | ||||||
| Class F Shares | ||||||||||||||||
| Shares sold | 1,588,190 | $ | 22,203,336 | 1,182,438 | $ | 13,842,080 | ||||||||||
| Reinvestment of distributions | 321,440 | 4,264,437 | 197,262 | 2,308,512 | ||||||||||||
| Shares reacquired | (1,255,877 | ) | (17,384,631 | ) | (2,340,195 | ) | (26,277,009 | ) | ||||||||
| Increase (decrease) | 653,753 | $ | 9,083,142 | (960,495 | ) | $ | (10,126,417 | ) | ||||||||
| Class F3 Shares | ||||||||||||||||
| Shares sold | 137,517 | $ | 1,887,594 | 1,560 | $ | 19,006 | ||||||||||
| Reinvestment of distributions | 293 | 4,059 | 108 | 1,253 | ||||||||||||
| Shares reacquired | (139,369 | ) | (1,964,324 | ) | (11 | ) | (137 | ) | ||||||||
| Increase (decrease) | (1,559 | ) | $ | (72,671 | ) | 1,657 | $ | 20,122 | ||||||||
| Class I Shares | ||||||||||||||||
| Shares sold | 267,686 | $ | 3,705,542 | 667,086 | $ | 7,940,349 | ||||||||||
| Reinvestment of distributions | 104,562 | 1,379,207 | 58,255 | 680,608 | ||||||||||||
| Shares reacquired | (252,535 | ) | (3,512,697 | ) | (436,374 | ) | (4,871,749 | ) | ||||||||
| Increase | 119,713 | $ | 1,572,052 | 288,967 | $ | 3,749,208 | ||||||||||
| Class P Shares | ||||||||||||||||
| Shares sold | 4,640 | $ | 64,269 | 4,200 | $ | 48,055 | ||||||||||
| Reinvestment of distributions | 3,207 | 42,190 | 1,605 | 18,781 | ||||||||||||
| Shares reacquired | (4,346 | ) | (58,636 | ) | (1,353 | ) | (13,627 | ) | ||||||||
| Increase | 3,501 | $ | 47,823 | 4,452 | $ | 53,209 | ||||||||||
| Class R2 Shares | ||||||||||||||||
| Shares sold | 4,536 | $ | 65,309 | 3,160 | $ | 36,787 | ||||||||||
| Reinvestment of distributions | 2,401 | 32,495 | 1,777 | 21,262 | ||||||||||||
| Shares reacquired | (3,292 | ) | (46,418 | ) | (31,360 | ) | (373,591 | ) | ||||||||
| Increase (decrease) | 3,645 | $ | 51,386 | (26,423 | ) | $ | (315,542 | ) | ||||||||
53
Notes to Financial Statements (continued)
| Multi-Asset Balanced Opportunity Fund | Year Ended November 30, 2021 | Year Ended November 30, 2020 | ||||||||||||||
| Class R3 Shares | Shares | Amount | Shares | Amount | ||||||||||||
| Shares sold | 442,079 | $ | 6,133,938 | 473,149 | $ | 5,339,277 | ||||||||||
| Reinvestment of distributions | 201,349 | 2,654,458 | 125,156 | 1,464,205 | ||||||||||||
| Shares reacquired | (760,649 | ) | (10,480,650 | ) | (1,456,070 | ) | (16,551,665 | ) | ||||||||
| Decrease | (117,221 | ) | $ | (1,692,254 | ) | (857,765 | ) | $ | (9,748,183 | ) | ||||||
| Class R4 Shares | ||||||||||||||||
| Shares sold | 186,341 | $ | 2,581,625 | 294,189 | $ | 3,378,470 | ||||||||||
| Reinvestment of distributions | 61,262 | 810,680 | 34,358 | 402,700 | ||||||||||||
| Shares reacquired | (280,367 | ) | (3,908,608 | ) | (320,713 | ) | (3,642,900 | ) | ||||||||
| Increase (decrease) | (32,764 | ) | $ | (516,303 | ) | 7,834 | $ | 138,270 | ||||||||
| Class R5 Shares | ||||||||||||||||
| Shares sold | 1,014 | $ | 13,711 | 31,373 | $ | 376,697 | ||||||||||
| Reinvestment of distributions | 813 | 10,816 | 781 | 8,941 | ||||||||||||
| Shares reacquired | (2,104 | ) | (29,641 | ) | (36,186 | ) | (418,900 | ) | ||||||||
| Decrease | (277 | ) | $ | (5,114 | ) | (4,032 | ) | $ | (33,262 | ) | ||||||
| Class R6 Shares | ||||||||||||||||
| Shares sold | 73,060 | $ | 998,649 | 110,870 | $ | 1,271,012 | ||||||||||
| Reinvestment of distributions | 23,894 | 317,966 | 27,549 | 319,844 | ||||||||||||
| Shares reacquired | (40,122 | ) | (566,495 | ) | (719,679 | ) | (8,417,485 | ) | ||||||||
| Increase (decrease) | 56,832 | $ | 750,120 | (581,260 | ) | $ | (6,826,629 | ) | ||||||||
| Multi-Asset Income Fund | Year Ended November 30, 2021 | Year Ended November 30, 2020 | ||||||||||||||
| Class A Shares | Shares | Amount | Shares | Amount | ||||||||||||
| Shares sold | 7,457,828 | $ | 130,130,309 | 5,353,420 | $ | 80,839,530 | ||||||||||
| Converted from Class C* | 2,175,517 | 37,996,319 | 3,913,724 | 59,706,716 | ||||||||||||
| Reinvestment of distributions | 1,545,618 | 26,231,442 | 1,014,056 | 15,295,085 | ||||||||||||
| Shares reacquired | (7,219,942 | ) | (125,560,967 | ) | (10,174,760 | ) | (149,884,930 | ) | ||||||||
| Increase | 3,959,021 | $ | 68,797,103 | 106,440 | $ | 5,956,401 | ||||||||||
| Class C Shares | ||||||||||||||||
| Shares sold | 858,462 | $ | 15,189,649 | 656,960 | $ | 9,967,968 | ||||||||||
| Reinvestment of distributions | 364,735 | 6,232,416 | 291,117 | 4,456,012 | ||||||||||||
| Shares reacquired | (2,768,395 | ) | (48,922,317 | ) | (5,074,397 | ) | (76,259,978 | ) | ||||||||
| Converted to Class A* | (2,140,904 | ) | (37,996,319 | ) | (3,853,689 | ) | (59,706,716 | ) | ||||||||
| Decrease | (3,686,102 | ) | $ | (65,496,571 | ) | (7,980,009 | ) | $ | (121,542,714 | ) | ||||||
| Class F Shares | ||||||||||||||||
| Shares sold | 1,903,789 | $ | 33,202,909 | 1,356,269 | $ | 20,574,817 | ||||||||||
| Reinvestment of distributions | 317,538 | 5,391,024 | 252,352 | 3,789,872 | ||||||||||||
| Shares reacquired | (2,118,074 | ) | (36,836,058 | ) | (4,868,625 | ) | (71,842,526 | ) | ||||||||
| Increase (decrease) | 103,253 | $ | 1,757,875 | (3,260,004 | ) | $ | (47,477,837 | ) | ||||||||
| Class F3 Shares | ||||||||||||||||
| Shares sold | – | $ | – | 1,338 | $ | 18,115 | ||||||||||
| Reinvestment of distributions | 4,445 | 75,006 | 3,918 | 58,861 | ||||||||||||
| Shares reacquired | (27,021 | ) | (469,109 | ) | (118,480 | ) | (1,796,489 | ) | ||||||||
| Decrease | (22,576 | ) | $ | (394,103 | ) | (113,224 | ) | $ | (1,719,513 | ) | ||||||
54
Notes to Financial Statements (concluded)
| Multi-Asset Income Fund | Year Ended November 30, 2021 | Year Ended November 30, 2020 | ||||||||||||||
| Class I Shares | Shares | Amount | Shares | Amount | ||||||||||||
| Shares sold | 301,493 | $ | 5,206,794 | 172,402 | $ | 2,584,452 | ||||||||||
| Reinvestment of distributions | 83,323 | 1,406,639 | 64,257 | 960,922 | ||||||||||||
| Shares reacquired | (368,965 | ) | (6,366,664 | ) | (962,789 | ) | (14,080,418 | ) | ||||||||
| Increase (decrease) | 15,851 | $ | 246,769 | (726,130 | ) | $ | (10,535,044 | ) | ||||||||
| Class R2 Shares | ||||||||||||||||
| Shares sold | 246 | $ | 4,388 | 186 | $ | 2,808 | ||||||||||
| Reinvestment of distributions | 234 | 4,068 | 158 | 2,452 | ||||||||||||
| Shares reacquired | (5 | ) | (92 | ) | (1,963 | ) | (26,635 | ) | ||||||||
| Increase (decrease) | 475 | $ | 8,364 | (1,619 | ) | $ | (21,375 | ) | ||||||||
| Class R3 Shares | ||||||||||||||||
| Shares sold | 177,658 | $ | 3,100,204 | 151,218 | $ | 2,255,111 | ||||||||||
| Reinvestment of distributions | 38,389 | 650,157 | 28,104 | 423,592 | ||||||||||||
| Shares reacquired | (181,132 | ) | (3,117,936 | ) | (455,970 | ) | (6,663,135 | ) | ||||||||
| Increase (decrease) | 34,915 | $ | 632,425 | (276,648 | ) | $ | (3,984,432 | ) | ||||||||
| Class R4 Shares | ||||||||||||||||
| Shares sold | 42,548 | $ | 739,053 | 63,570 | $ | 927,308 | ||||||||||
| Reinvestment of distributions | 6,706 | 113,809 | 4,153 | 62,614 | ||||||||||||
| Shares reacquired | (33,077 | ) | (576,138 | ) | (47,528 | ) | (715,578 | ) | ||||||||
| Increase | 16,177 | $ | 276,724 | 20,195 | $ | 274,344 | ||||||||||
| Class R5 Shares | ||||||||||||||||
| Shares sold | 149 | $ | 2,592 | 399 | $ | 5,998 | ||||||||||
| Reinvestment of distributions | 81 | 1,368 | 61 | 914 | ||||||||||||
| Shares reacquired | (19 | ) | (335 | ) | (29 | ) | (437 | ) | ||||||||
| Increase | 211 | $ | 3,625 | 431 | $ | 6,475 | ||||||||||
| Class R6 Shares | ||||||||||||||||
| Shares sold | 3,972 | $ | 67,983 | 14,011 | $ | 207,362 | ||||||||||
| Reinvestment of distributions | 2,137 | 36,155 | 3,415 | 50,595 | ||||||||||||
| Shares reacquired | (1,979 | ) | (34,928 | ) | (146,850 | ) | (2,225,690 | ) | ||||||||
| Increase (decrease) | 4,130 | $ | 69,210 | (129,424 | ) | $ | (1,967,733 | ) | ||||||||
| * | Automatic conversion of Class C shares occurs on the 25th day of the month (or, if the 25th day was not a business day, the next business day thereafter) following the eighth anniversary of the day on which the purchase order was accepted. Prior to June 30, 2020, conversion occurred following the tenth anniversary of the day on which the purchase was accepted. |
55
Report of Independent Registered Public Accounting Firm
To the shareholders and the Board of Trustees of Lord Abbett Investment Trust
Opinion on the Financial Statements and Financial Highlights
We have audited the accompanying statements of assets and liabilities, including the schedules of investments, of Lord Abbett Multi-Asset Balanced Opportunity Fund and Lord Abbett Multi-Asset Income Fund, two of the funds constituting the Lord Abbett Investment Trust (the “Trust”), as of November 30, 2021, the related statements of operations for the year then ended, the statements of changes in net assets for each of the two years in the period then ended, the financial highlights for each of the five years in the period then ended, and the related notes. In our opinion, the financial statements and financial highlights present fairly, in all material respects, the financial position of each of the funds listed above constituting the Trust as of November 30, 2021, and the results of their operations for the year then ended, the changes in their net assets for each of the two years in the period then ended, and the financial highlights for each of the five years in the period then ended in conformity with accounting principles generally accepted in the United States of America.
Basis for Opinion
These financial statements and financial highlights are the responsibility of the Trust’s management. Our responsibility is to express an opinion on the Trust’s financial statements and financial highlights based on our audits. We are a public accounting firm registered with the Public Company Accounting Oversight Board (United States) (PCAOB) and are required to be independent with respect to the Trust in accordance with the U.S. federal securities laws and the applicable rules and regulations of the Securities and Exchange Commission and the PCAOB.
We conducted our audits in accordance with the standards of the PCAOB. Those standards require that we plan and perform the audit to obtain reasonable assurance about whether the financial statements and financial highlights are free of material misstatement, whether due to error or fraud. The Trust is not required to have, nor were we engaged to perform, an audit of its internal control over financial reporting. As part of our audits we are required to obtain an understanding of internal control over financial reporting but not for the purpose of expressing an opinion on the effectiveness of the Trust’s internal control over financial reporting. Accordingly, we express no such opinion.
Our audits included performing procedures to assess the risks of material misstatement of the financial statements and financial highlights, whether due to error or fraud, and performing procedures that respond to those risks. Such procedures included examining, on a test basis, evidence regarding the amounts and disclosures in the financial statements and financial highlights. Our audits also included evaluating the accounting principles used and significant estimates made by management, as well as evaluating the overall presentation of the financial statements and financial highlights. Our procedures included confirmation of securities owned as of November 30, 2021, by correspondence with the custodian and brokers; when replies were not received from brokers, we performed other auditing procedures. We believe that our audits provide a reasonable basis for our opinion.
DELOITTE & TOUCHE LLP
New York, New York
January 28, 2022
We have served as the auditor of one or more Lord Abbett Family of Funds’ investment companies since 1932.
56
Investments in Underlying Funds (unaudited)
The Funds invest in Underlying Funds managed by Lord Abbett. As of November 30, 2021, each Fund’s long-term investments were allocated among the Underlying Funds as follows:
Multi-Asset Balanced Opportunity Fund
| Underlying Fund Name | % of Investments | |
| Lord Abbett Investment Trust – Convertible Fund – Class I | 1.41% | |
| Lord Abbett Investment Trust – Core Fixed Income Fund – Class I | 3.23% | |
| Lord Abbett Securities Trust – Durable Growth Fund – Class I | 6.55% | |
| Lord Abbett Global Fund, Inc. – Emerging Markets Bond Fund – Class I | 4.38% | |
| Lord Abbett Investment Trust – Floating Rate Fund – Class I | 0.42% | |
| Lord Abbett Securities Trust – Focused Large Cap Value Fund – Class I | 18.13% | |
| Lord Abbett Securities Trust – Focused Small Cap Value Fund – Class I | 0.51% | |
| Lord Abbett Securities Trust – Fundamental Equity Fund – Class I | 6.14% | |
| Lord Abbett Securities Trust – Growth Leaders Fund – Class I | 11.05% | |
| Lord Abbett Research Fund, Inc. – Growth Opportunities Fund – Class I | 5.84% | |
| Lord Abbett Investment Trust – High Yield Fund – Class I | 16.63% | |
| Lord Abbett Investment Trust – Inflation Focused Fund – Class I | 5.06% | |
| Lord Abbett Securities Trust – International Equity Fund – Class I | 3.91% | |
| Lord Abbett Securities Trust – International Value Fund – Class I | 7.74% | |
| Lord Abbett Mid Cap Stock Fund, Inc. – Class I | 4.44% | |
| Lord Abbett Investment Trust – Short Duration Income Fund – Class I | 0.58% | |
| Lord Abbett Securities Trust – Value Opportunities Fund – Class I | 3.98% | |
Multi-Asset Income Fund | ||
| Underlying Fund Name | % of Investments | |
| Lord Abbett Investment Trust – Convertible Fund – Class I | 1.01% | |
| Lord Abbett Investment Trust – Core Fixed Income Fund – Class I | 12.78% | |
| Lord Abbett Securities Trust – Durable Growth Fund – Class I | 5.25% | |
| Lord Abbett Global Fund, Inc. – Emerging Markets Bond Fund – Class I | 4.89% | |
| Lord Abbett Investment Trust – Floating Rate Fund – Class I | 2.98% | |
| Lord Abbett Securities Trust – Focused Large Cap Value Fund – Class I | 11.46% | |
| Lord Abbett Securities Trust – Focused Small Cap Value Fund – Class I | 0.42% | |
| Lord Abbett Securities Trust – Fundamental Equity Fund – Class I | 4.47% | |
| Lord Abbett Securities Trust – Growth Leaders Fund – Class I | 6.94% | |
| Lord Abbett Research Fund, Inc. – Growth Opportunities Fund – Class I | 3.84% | |
| Lord Abbett Investment Trust – High Yield Fund – Class I | 18.10% | |
| Lord Abbett Investment Trust – Inflation Focused Fund – Class I | 8.35% | |
| Lord Abbett Municipal Income Fund, Inc. - Intermediate Tax-Free Fund – Class I | 1.70% | |
| Lord Abbett Securities Trust – International Equity Fund – Class I | 4.21% | |
| Lord Abbett Securities Trust – International Value Fund – Class I | 7.04% | |
| Lord Abbett Mid Cap Stock Fund, Inc. – Class I | 2.92% | |
| Lord Abbett Investment Trust – Short Duration Income Fund – Class I | 1.02% | |
| Lord Abbett Securities Trust – Value Opportunities Fund – Class I | 2.62% |
57
Investments in Underlying Funds (unaudited) (continued)
The Ten Largest Holdings and the Holdings by Sector or Credit Rating, as of November 30, 2021, for each Underlying Fund are presented below. Each Underlying Fund’s annual and semiannual reports, which are sent to shareholders and filed with the SEC, contain information about the Underlying Fund’s portfolio holdings, including a complete schedule of holdings. A complete schedule of holdings for each Underlying Fund is also filed with the SEC on Form N-PORT as of the end of each respective Underlying Fund’s first and third quarters. In addition, on or about the first day of the second month following each calendar quarter-end, each Fund makes publicly available a complete schedule of its portfolio holdings as of the last day of each such quarter. The information for the most recently ended calendar quarter may be viewed at www.lordabbett.com or requested at no charge by calling Lord Abbett at 888-522-2388.
Lord Abbett Investment Trust – Convertible Fund
| Ten Largest Holdings | % of Investments | |
| Canopy Growth Corp., 4.250%, 7/15/2023 | 3.43% | |
| Broadcom, Inc., 8.000%, 9/30/2022 | 3.04% | |
| Scorpio Tankers, Inc., 3.000%, 5/15/2025 | 2.77% | |
| Etsy, Inc., 0.250%, 6/15/2028 | 2.74% | |
| NextEra Energy, Inc., 4.872%, 9/1/2022 | 2.65% | |
| Danaher Corp., 4.750%, 4/15/2022 | 2.61% | |
| Western Digital Corp., 1.500%, 2/1/2024 | 2.33% | |
| Mandiant, Inc., 1.625%, 6/1/2035 | 2.26% | |
| Airbnb, Inc., Zero Coupon, 3/15/2026 | 2.19% | |
| Dexcom, Inc., 0.750%, 12/1/2023 | 2.12% | |
| Holdings by Sector* | % of Investments | |
| Basic Materials | 1.01% | |
| Communications | 19.12% | |
| Consumer Cyclical | 12.46% | |
| Consumer Non-Cyclical | 22.18% | |
| Energy | 6.10% | |
| Financials | 3.85% | |
| Industrials | 9.89% | |
| Technology | 17.55% | |
| Utilities | 2.65% | |
| Repurchase Agreements | 4.61% | |
| Time Deposits | 0.06% | |
| Money Markets | 0.52% | |
| Total | 100.00% |
| * | A sector may comprise several industries. |
58
Investments in Underlying Funds (unaudited) (continued)
Lord Abbett Investment Trust – Core Fixed Income Fund
| Ten Largest Holdings | % of Investments | |
| U.S. Treasury Note, 1.125%, 10/31/2026 | 11.46% | |
| U.S. Treasury Bill, Zer Coupon, 4/21/2022 | 7.13% | |
| Fannie Mae or Freddie Mac, 3.000%, 12/13/2051 | 5.98% | |
| U.S. Treasury Note, 0.125%, 8/31/2023 | 5.04% | |
| U.S. Treasury Bill, Zero Coupon, 1/27/2022 | 4.84% | |
| U.S. Treasury Note, 0.750%, 11/15/2024 | 4.21% | |
| U.S. Treasury Note, 1.250%, 8/15/2031 | 3.62% | |
| U.S. Treasury Note, 0.375%, 10/31/2023 | 3.22% | |
| U.S. Treasury Bond, 1.750%, 8/15/2041 | 2.37% | |
| U.S. Treasury Bond, 2.000%, 8/15/2051 | 2.23% | |
| Holdings by Sector* | % of Investments | |
| Asset Backed Securities | 14.28% | |
| Basic Materials | 0.82% | |
| Communications | 1.62% | |
| Consumer Cyclical | 1.85% | |
| Consumer Non-Cyclical | 1.12% | |
| Energy | 3.20% | |
| Financials | 9.13% | |
| Health Care | 0.26% | |
| Industrial | 1.18% | |
| Mortgage-Backed Securities | 12.45% | |
| Technology | 1.75% | |
| U.S. Government | 47.01% | |
| Utilities | 2.32% | |
| Repurchase Agreement | 3.01% | |
| Total | 100.00% |
| * | A sector may comprise several industries. |
Lord Abbett Securities Trust – Durable Growth Fund
| Ten Largest Holdings | % of Investments | |
| Microsoft Corp. | 10.86% | |
| Amazon.com, Inc. | 7.62% | |
| Alphabet, Inc. | 7.34% | |
| Apple, Inc. | 5.32% | |
| NVIDIA Corp. | 4.72% | |
| Tesla, Inc. | 3.95% | |
| Meta Platforms, Inc. | 3.66% | |
| Home Depot, Inc. (The) | 2.36% | |
| NIKE, Inc. | 1.96% | |
| salesforce.com, Inc. | 1.89% |
59
Investments in Underlying Funds (unaudited) (continued)
| Holdings by Sector* | % of Investments | |
| Communication Services | 14.58% | |
| Consumer Discretionary | 19.36% | |
| Consumer Staples | 4.11% | |
| Financials | 1.82% | |
| Health Care | 12.22% | |
| Industrials | 6.19% | |
| Information Technology | 35.18% | |
| Materials | 3.28% | |
| Real Estate | 1.56% | |
| Repurchase Agreements | 1.70% | |
| Total | 100.00% |
| * | A sector may comprise several industries. |
Lord Abbett Global Fund, Inc. – Emerging Markets Bond Fund
| Ten Largest Holdings | % of Investments | |
| Petroleos Mexicanos, 5.350%, 2/12/2028 | 1.86% | |
| Oman Government International Bond, 4.750%, 6/15/2026 | 1.78% | |
| Republic of Egypt, 3.875%, 2/16/2026 | 1.53% | |
| Republic of South Africa, 4.300%, 10/12/2028 | 1.42% | |
| Saudi International Bond, 3.450%, 2/2/2061 | 1.33% | |
| Philippine Government International Bond, 2.650%, 12/10/2045 | 1.28% | |
| Russian Federation, 5.250%, 6/23/2047 | 1.25% | |
| State of Qatar, 3.250%, 6/2/2026 | 1.25% | |
| Petronas Capital Ltd., 3.404%, 4/28/2061 | 1.13% | |
| Republic of Angola, 8.250%, 5/9/2028 | 1.12% | |
| Holdings by Sector* | % of Investments | |
| Basic Materials | 1.53% | |
| Communications | 0.40% | |
| Consumer Non-Cyclical | 1.83% | |
| Energy | 14.56% | |
| Financials | 5.55% | |
| Foreign Government | 70.10% | |
| Industrial | 0.97% | |
| Technology | 0.61% | |
| Utilities | 3.67% | |
| Repurchase Agreements | 0.78% | |
| Total | 100.00% |
| * | A sector may comprise several industries. |
60
Investments in Underlying Funds (unaudited) (continued)
Lord Abbett Investment Trust – Floating Rate Fund
| Ten Largest Holdings | % of Investments | |
| ICON Luxembourg S.A.R.L., 3.000%, 7/3/2028 | 0.78% | |
| AAdvantage Loyalty IP Ltd., 5.500%, 4/20/2028 | 0.59% | |
| Invesco Senior Loan ETF | 0.57% | |
| Medline Industries, Inc., 3.750%, 10/23/2028 | 0.52% | |
| WP CityMD Bidco LLC, 4.500%, 8/13/2026 | 0.51% | |
| Univision Communications, Inc., 5/5/2028 | 0.51% | |
| United Airlines, Inc., 4.500%, 4/21/2028 | 0.47% | |
| Jazz Financing Lux S.a.r.l., 4.000%, 5/5/2028 | 0.46% | |
| Parexel International Corporation, 11/15/2028 | 0.46% | |
| Cornerstone OnDemand, Inc., 4.250%, 10/16/2028 | 0.45% | |
| Holdings by Sector* | % of Investments | |
| Aerospace | 4.79% | |
| Chemicals | 1.71% | |
| Consumer Discretionary | 0.27% | |
| Consumer Durables | 0.13% | |
| Consumer Non-Durables | 1.13% | |
| Energy | 3.90% | |
| Financial | 7.53% | |
| Food/Tobacco | 1.23% | |
| Gaming/Leisure | 6.25% | |
| Healthcare | 14.85% | |
| Housing | 2.45% | |
| Information Technology | 13.96% | |
| Manufacturing | 9.73% | |
| Media/Telecom | 2.72% | |
| Metals/Minerals | 1.36% | |
| Retail | 3.97% | |
| Service | 8.5% | |
| Transportation | 1.88% | |
| Utility | 1.93% | |
| Repurchase Agreement | 11.71% | |
| Total | 100.00% |
| * | A sector may comprise several industries. |
Lord Abbett Securities Trust – Focused Large Cap Value Fund
| Ten Largest Holdings | % of Investments | |
| Ameriprise Financial, Inc. | 4.17% | |
| KKR & Co., Inc. | 4.01% | |
| Alphabet, Inc. | 3.80% | |
| Lowe’s Cos., Inc. | 3.74% | |
| Wells Fargo & Co. | 3.56% | |
| Fidelity National Financial, Inc. | 3.54% | |
| Raytheon Technologies Corp. | 3.51% | |
| CIT Group, Inc. | 3.48% | |
| Caesars Entertainment, Inc. | 3.33% | |
| General Motors Co. | 3.28% |
61
Investments in Underlying Funds (unaudited) (continued)
| Holdings by Sector* | % of Investments | |
| Communication Services | 9.35% | |
| Consumer Discretionary | 12.95% | |
| Consumer Staples | 5.73% | |
| Energy | 7.15% | |
| Financials | 24.21% | |
| Health Care | 13.24% | |
| Industrials | 13.54% | |
| Information Technology | 7.01% | |
| Materials | 2.49% | |
| Utilities | 3.01% | |
| Repurchase Agreements | 1.32% | |
| Total | 100.00% |
| * | A sector may comprise several industries. |
Lord Abbett Securities Trust – Focused Small Cap Value Fund
| Ten Largest Holdings | % of Investments | |
| Customers Bancorp, Inc. | 3.32% | |
| Eagle Materials, Inc. | 3.26% | |
| Victory Capital Holdings, Inc. | 2.97% | |
| RR Donnelley & Sons Co. | 2.94% | |
| Silicon Motion Technology Corp. | 2.77% | |
| Cars.com, Inc. | 2.73% | |
| Axos Financial, Inc. | 2.70% | |
| International Money Express, Inc. | 2.70% | |
| Stewart Information Services Corp. | 2.66% | |
| Sally Beauty Holdings, Inc. | 2.61% | |
| Holdings by Sector* | % of Investments | |
| Communication Services | 5.28% | |
| Consumer Discretionary | 7.54% | |
| Consumer Staples | 4.25% | |
| Energy | 10.15% | |
| Financials | 30.18% | |
| Health Care | 4.85% | |
| Industrials | 16.33% | |
| Information Technology | 8.33% | |
| Materials | 7.24% | |
| Real Estate | 5.63% | |
| Repurchase Agreements | 0.22% | |
| Total | 100.00% |
| * | A sector may comprise several industries. |
62
Investments in Underlying Funds (unaudited) (continued)
Lord Abbett Securities Trust – Fundamental Equity Fund
| Ten Largest Holdings | % of Investments | |
| UnitedHealth Group, Inc. | 3.77% | |
| Alphabet, Inc. | 3.26% | |
| Procter & Gamble Co. (The) | 3.08% | |
| Pfizer, Inc. | 2.65% | |
| General Motors Co. | 2.20% | |
| Microsoft Corp. | 2.11% | |
| Comcast Corp. | 2.07% | |
| Wells Fargo & Co. | 2.04% | |
| Raytheon Technologies Corp. | 2.00% | |
| BJ’s Wholesale Club Holdings, Inc. | 1.99% | |
| Holdings by Sector* | % of Investments | |
| Communication Services | 6.14% | |
| Consumer Discretionary | 6.97% | |
| Consumer Staples | 6.36% | |
| Energy | 6.29% | |
| Financials | 22.81% | |
| Health Care | 15.57% | |
| Industrials | 12.22% | |
| Information Technology | 12.73% | |
| Materials | 4.96% | |
| Real Estate | 3.26% | |
| Utilities | 2.48% | |
| Repurchase Agreements | 0.21% | |
| Total | 100.00% |
| * | A sector may comprise several industries. |
Lord Abbett Securities Trust – Growth Leaders Fund
| Ten Largest Holdings | % of Investments | |
| Microsoft Corp. | 7.94% | |
| Tesla, Inc. | 7.33% | |
| Alphabet, Inc. | 5.87% | |
| NVIDIA Corp. | 4.97% | |
| Apple, Inc. | 4.57% | |
| Advanced Micro Devices, Inc. | 2.65% | |
| Netflix, Inc. | 2.63% | |
| Coinbase Global, Inc. | 2.07% | |
| SVB Financial Group | 1.91% | |
| Applied Materials, Inc. | 1.80% |
63
Investments in Underlying Funds (unaudited) (continued)
| Holdings by Sector* | % of Investments | |
| Communication Services | 11.89% | |
| Consumer Discretionary | 15.34% | |
| Consumer Staples | 0.53% | |
| Financials | 7.10% | |
| Health Care | 8.22% | |
| Industrials | 3.02% | |
| Information Technology | 51.57% | |
| Materials | 1.06% | |
| Repurchase Agreements | 1.27% | |
| Total | 100.00% |
| * | A sector may comprise several industries. |
Lord Abbett Research Fund, Inc. – Growth Opportunities Fund
| Ten Largest Holdings | % of Investments | |
| Cadence Design Systems, Inc. | 2.65% | |
| Palo Alto Networks, Inc. | 2.32% | |
| Old Dominion Freight Line, Inc. | 2.26% | |
| DexCom, Inc. | 2.16% | |
| Etsy, Inc. | 2.08% | |
| Datadog, Inc. | 1.93% | |
| Amphenol Corp. | 1.91% | |
| HubSpot, Inc. | 1.91% | |
| Chipotle Mexican Grill, Inc. | 1.88% | |
| Enphase Energy, Inc. | 1.84% | |
| Holdings by Sector* | % of Investments | |
| Communication Services | 3.82% | |
| Consumer Discretionary | 13.30% | |
| Consumer Staples | 3.70% | |
| Financials | 4.51% | |
| Health Care | 19.91% | |
| Industrials | 12.24% | |
| Information Technology | 34.58% | |
| Materials | 3.91% | |
| Real Estate | 1.71% | |
| Repurchase Agreements | 2.32% | |
| Total | 100.00% |
| * | A sector may comprise several industries. |
64
Investments in Underlying Funds (unaudited) (continued)
Lord Abbett Investment Trust – High Yield Fund
| Ten Largest Holdings | % of Investments | |
| Sprint Capital Corp., 6.875%, 11/15/2028 | 0.98% | |
| Occidental Petroleum Corp., 6.125%, 1/1/2031 | 0.82% | |
| Kraft Heinz Foods Co., 4.375%, 6/1/2046 | 0.70% | |
| Kraft Heinz Foods Co., 4.875%, 10/1/2049 | 0.70% | |
| CCO Holdings LLC/CCO Holdings Capital Corp., 4.750%, 3/1/2030 | 0.54% | |
| Netflix, Inc., 4.625%, 5/15/2029 | 0.51% | |
| Centennial Resource Production LLC, 5.375%, 1/15/2026 | 0.47% | |
| OneMain Finance Corp., 4.000%, 9/15/2030 | 0.45% | |
| Ford Motor Co., 4.750%, 1/15/2043 | 0.44% | |
| Matador Resources Co., 5.875%, 9/15/2026 | 0.43% | |
| Holdings by Sector* | % of Investments | |
| Asset Backed Securities | 1.33% | |
| Automotive | 0.02% | |
| Basic Material | 7.13% | |
| Communications | 8.16% | |
| Consumer Cyclical | 22.69% | |
| Consumer Non Cyclical | 11.54% | |
| Energy | 21.51% | |
| Financials | 10.21% | |
| Healthcare | 0.29% | |
| Industrials | 7.87% | |
| Mortgage Backed Securities | 1.39% | |
| Technology | 5.44% | |
| Transportation | 0.15% | |
| Service | 0.10% | |
| U.S. Government | 0.24% | |
| Utilities | 1.67% | |
| Repurchase Agreements | 0.16% | |
| Money Markets | 0.01% | |
| Time Deposits | 0.09% | |
| Total | 100.00% |
| * | A sector may comprise several industries. |
Lord Abbett Investment Trust – Inflation Focused Fund
| Ten Largest Holdings | % of Investments | |
| U.S. Treasury Note, 0.375%, 10/31/2023 | 5.54% | |
| U.S. Treasury Inflation Indexed Note, 0.125%, 10/15/2026 | 2.07% | |
| U.S. Treasury Bill, Zero Coupon, 1/27/2022 | 1.73% | |
| U.S. Treasury Note, 1.125%, 10/31/2026 | 1.46% | |
| MRA Issuance Trust 2021-8, Zer Coupon, 5/15/2022 | 0.85% | |
| UBS AG, 5.125%, 5/15/2024 | 0.53% | |
| Danske Bank A/S, 5.375%, 1/12/2024 | 0.48% | |
| Flagship Credit Auto Trust 2021-2, 0.370%, 12/15/2026 | 0.45% | |
| Credit Suisse Mortgage Capital Certificates, 1.240%, 11/15/2038 | 0.44% | |
| New Economy Assets Phase 1 Sponsor LLC 2021-1, 1.910%, 10/20/2061 | 0.44% |
65
Investments in Underlying Funds (unaudited) (continued)
| Holdings by Sector* | % of Investments | |
| Asset Backed Securities | 18.37% | |
| Basic Materials | 2.08% | |
| Communications | 3.00% | |
| Consumer Cyclical | 0.14% | |
| Consumer, Cyclical | 6.41% | |
| Consumer, Non-Cyclical | 4.44% | |
| Energy | 6.85% | |
| Financial | 19.34% | |
| Government | 11.51% | |
| Health Care | 0.20% | |
| Industrial | 2.14% | |
| Materials and Processing | 0.21% | |
| Mortgage Securities | 16.51% | |
| Technology | 1.96% | |
| Utilities | 3.96% | |
| Repurchase Agreements | 2.88% | |
| Total | 100.00% |
| * | A sector may comprise several industries. |
Lord Abbett Municipal Bond Fund, Inc. – Intermediate Tax Free Fund
| Ten Largest Holdings | % of Investments | |
| Buckeye Tobacco, 5.000%, 6/1/2055 | 0.89% | |
| NYC Muni Water, 0.020%, 6/15/2045 | 0.78% | |
| NJ Trans Trust Fund, 5.000%, 12/15/2033 | 0.65% | |
| PEFA Gas - Goldman Sachs, 5.000%, 9/1/2049 | 0.56% | |
| TEAC - Goldman Sachs, 5.000%, 5/1/2052 | 0.48% | |
| KY Public Energy Auth – Peak Energy, 4.000%, 2/1/2050 | 0.45% | |
| Tennergy Corp – Morgan Stanley, 4.000%, 12/1/2051 | 0.40% | |
| CA State GO, 4.000%, 3/1/2036 | 0.38% | |
| PR Corp Sales Tax, 4.329%, 7/1/2040 | 0.38% | |
| Atlanta Arpt – PFC AMT, 4.000%, 7/1/2034 | 0.36% |
66
Investments in Underlying Funds (unaudited) (continued)
| Holding by Credit Rating | % of Investments | |
| AAA | 2.96% | |
| AA+ | 4.33% | |
| AA | 10.56% | |
| AA- | 8.32% | |
| A+ | 14.60% | |
| A | 17.07% | |
| A- | 8.93% | |
| BBB+ | 9.79% | |
| BBB- | 4.60% | |
| BBB | 8.92% | |
| BB+ | 1.54% | |
| BB | 1.38% | |
| BB- | 0.99% | |
| B+ | 0.25% | |
| B | 0.85% | |
| B- | 0.17% | |
| CCC | 0.04% | |
| NR | 4.70% | |
| Total | 100.00% |
Lord Abbett Securities Trust – International Equity Fund
| Ten Largest Holdings | % of Investments | |
| Nestle SA | 2.27% | |
| ASML Holding NV | 1.90% | |
| Novo Nordisk A/S | 1.86% | |
| LVMH Moet Hennessy Louis Vuitton SE | 1.80% | |
| Roche Holding AG | 1.79% | |
| Sony Group Corp. | 1.78% | |
| L’Oreal SA | 1.70% | |
| Toyota Motor Corp. | 1.62% | |
| Lonza Group AG | 1.50% | |
| Taiwan Semiconductor Manufacturing Co. Ltd. | 1.50% | |
| Holdings by Sector* | % of Investments | |
| Communication Services | 3.14% | |
| Consumer Discretionary | 13.76% | |
| Consumer Staples | 7.89% | |
| Energy | 4.37% | |
| Financials | 18.87% | |
| Health Care | 10.46% | |
| Industrials | 17.15% | |
| Information Technology | 11.79% | |
| Materials | 5.76% | |
| Real Estate | 1.23% | |
| Utilities | 2.68% | |
| Repurchase Agreements | 2.90% | |
| Total | 100.00% |
| * | A sector may comprise several industries. |
67
Investments in Underlying Funds (unaudited) (continued)
Lord Abbett Securities Trust – International Value Fund
| Ten Largest Holdings | % of Investments | |
| Royal Dutch Shell plc | 2.83% | |
| Sanofi | 2.43% | |
| UBS Group AG | 2.25% | |
| GlaxoSmithKline plc | 2.04% | |
| Koninklijke Ahold Delhaize NV | 1.89% | |
| AXA SA | 1.87% | |
| Sumitomo Mitsui Financial Group, Inc. | 1.86% | |
| Sony Group Corp. | 1.82% | |
| BHP Group Ltd. | 1.81% | |
| Roche Holding AG | 1.76% | |
| Holdings by Sector* | % of Investments | |
| Communication Services | 1.55% | |
| Consumer Discretionary | 11.36% | |
| Consumer Staples | 6.91% | |
| Energy | 6.84% | |
| Financials | 24.57% | |
| Health Care | 8.98% | |
| Industrials | 15.73% | |
| Information Technology | 5.02% | |
| Materials | 5.08% | |
| Real Estate | 5.23% | |
| Utilities | 4.95% | |
| Repurchase Agreements | 3.78% | |
| Total | 100.00% |
| * | A sector may comprise several industries. |
Lord Abbett Mid Cap Stock Fund, Inc.
| Ten Largest Holdings | % of Investments | |
| Pioneer Natural Resources Co. | 2.02% | |
| NetApp, Inc. | 2.01% | |
| Ameriprise Financial, Inc. | 2.00% | |
| Masco Corp. | 1.99% | |
| BJ’s Wholesale Club Holdings, Inc. | 1.92% | |
| Valvoline, Inc. | 1.91% | |
| KKR & Co., Inc. | 1.86% | |
| Williams-Sonoma, Inc. | 1.85% | |
| F5 Networks, Inc. | 1.83% | |
| CIT Group, Inc. | 1.78% |
68
Investments in Underlying Funds (unaudited) (continued)
| Holdings by Sector* | % of Investments | |
| Communication Services | 0.98% | |
| Consumer Discretionary | 9.72% | |
| Consumer Staples | 4.66% | |
| Energy | 6.01% | |
| Financials | 20.64% | |
| Health Care | 9.54% | |
| Industrials | 16.01% | |
| Information Technology | 10.63% | |
| Materials | 8.07% | |
| Real Estate | 7.19% | |
| Utilities | 5.17% | |
| Repurchase Agreements | 1.38% | |
| Total | 100.00% |
| * | A sector may comprise several industries. |
Lord Abbett Investment Trust – Short Duration Income Fund
| Ten Largest Holdings | % of Investments | |
| U.S. Treasury Note, 0.375%, 10/31/2023 | 3.17% | |
| U.S. Treasury Note, 0.125%, 8/31/2023 | 1.90% | |
| U.S. Treasury Bill, Zero Coupon, 1/27/2022 | 1.61% | |
| U.S. Treasury Note, 0.750%, 11/15/2024 | 1.10% | |
| MRA Issuance Trust 2021-4, 1.286%, 4/7/2022 | 0.63% | |
| MRA Issuance Trust 2021-4, 1.286%, 4/7/2022 | 0.55% | |
| Comcast Hulu Holdings, LLC, 0.965%, 3/15/2024 | 0.43% | |
| DBWF Mortgage Trust 2018-AMXP, 3.873%, 5/5/2035 | 0.42% | |
| Citigroup, Inc., 3.106%, 4/8/2026 | 0.40% | |
| Invitation Homes Operating Partnership LP, 1.090%, 1/31/2025 | 0.39% | |
| Holdings by Sector* | % of Investments | |
| Asset Backed Securities | 23.73% | |
| Basic Materials | 1.92% | |
| Communications | 3.33% | |
| Consumer, Cyclical | 6.41% | |
| Consumer, Non-cyclical | 4.46% | |
| Diversified | 0.02% | |
| Energy | 6.12% | |
| Financial | 17.17% | |
| Health Care | 0.13% | |
| Industrial | 2.00% | |
| Materials and Processing | 0.21% | |
| Mortgage Securities | 17.91% | |
| Other | 0.01% | |
| Technology | 1.62% | |
| U.S. Government | 9.47% | |
| Utilities | 2.74% | |
| Repurchase Agreement | 2.75% | |
| Total | 100.00% |
| * | A sector may comprise several industries. |
69
Investments in Underlying Funds (unaudited) (concluded)
Lord Abbett Securities Trust – Value Opportunities Fund
| Ten Largest Holdings | % of Investments | |
| Entegris, Inc. | 2.35% | |
| BJ’s Wholesale Club Holdings, Inc. | 2.16% | |
| Valvoline, Inc. | 2.12% | |
| Saia, Inc. | 2.09% | |
| Carlisle Cos., Inc. | 2.09% | |
| Stewart Information Services Corp. | 2.02% | |
| Crane Co. | 1.91% | |
| Signature Bank | 1.89% | |
| Williams-Sonoma, Inc. | 1.88% | |
| Generac Holdings, Inc. | 1.86% | |
| Holdings by Sector* | % of Investments | |
| Communication Services | 3.27% | |
| Consumer Discretionary | 10.29% | |
| Consumer Staples | 3.18% | |
| Energy | 3.75% | |
| Financials | 15.06% | |
| Health Care | 11.51% | |
| Industrials | 17.41% | |
| Information Technology | 15.99% | |
| Materials | 9.90% | |
| Real Estate | 6.74% | |
| Utilities | 2.13% | |
| Repurchase Agreements | 0.77% | |
| Total | 100.00% |
| * | A sector may comprise several industries. |
70
Basic Information About Management
The Board is responsible for the management of the business and affairs of the Fund in accordance with the laws of the state of organization. The Board elects officers who are responsible for the day-to-day operations of the Fund and who execute policies authorized by the Board. The Board also approves an investment adviser to the Fund and continues to monitor the cost and quality of the services the investment adviser provides, and annually considers whether to renew the contract with the investment adviser. Generally, each Board member holds office until his/her successor is elected and qualified or until his/her earlier resignation or removal, as provided in the Fund’s organizational documents.
Lord, Abbett & Co. LLC (“Lord Abbett”), a Delaware limited liability company, is the Fund’s investment adviser. Designated Lord Abbett personnel are responsible for the day-to-day management of the Fund.
Independent Board Members
The following Independent Board Members also are board members of each of the 14 investment companies in the Lord Abbett Family of Funds, which consist of 63 investment portfolios.
| Name, Address and Year of Birth | Current Position and Length of Service with the Fund | Principal Occupation and Other Directorships During the Past Five Years | ||
| Evelyn E. Guernsey Lord, Abbett & Co. LLC c/o Legal Dept. 90 Hudson Street Jersey City, NJ 07302 (1955) | Board member since 2011 | Principal Occupation: None.
Other Directorships: None.
| ||
| Julie A. Hill Lord, Abbett & Co. LLC c/o Legal Dept. 90 Hudson Street Jersey City, NJ 07302 (1946) | Board member since 2004 | Principal Occupation: Owner and CEO of The Hill Company, a business consulting firm (since 1998).
Other Directorships: Currently serves as director of Anthem, Inc., a health benefits company (since 1994).
| ||
| Kathleen M. Lutito Lord, Abbett & Co. LLC c/o Legal Dept. 90 Hudson Street Jersey City, NJ 07302 (1963) | Board member since 2017 | Principal Occupation: President and Chief Investment Officer of CenturyLink Investment Management Company (since 2006).
Other Directorships: None.
| ||
| James M. McTaggart Lord, Abbett & Co. LLC c/o Legal Dept. 90 Hudson Street Jersey City, NJ 07302 (1947) | Board member since 2012 | Principal Occupation: Independent management advisor and consultant (since 2012).
Other Directorships: Blyth, Inc., a home products company (2004–2015).
| ||
| Charles O. Prince Lord, Abbett & Co. LLC c/o Legal Dept. 90 Hudson Street Jersey City, NJ 07302 (1950) | Board member since 2019 | Principal Occupation: None. Formerly Chairman and Chief Executive Officer, Citigroup, Inc. (Retired 2007).
Other Directorships: Currently serves as director of Johnson & Johnson (2006–Present). Previously served as director of Xerox Corporation (2008–2018). |
71
Basic Information About Management (continued)
| Name, Address and Year of Birth | Current Position and Length of Service with the Fund | Principal Occupation and Other Directorships During the Past Five Years | ||
| Karla M. Rabusch Lord, Abbett & Co. LLC c/o Legal Dept. 90 Hudson Street Jersey City, NJ 07302 (1959) | Board member since 2017 | Principal Occupation: President and Director of Wells Fargo Funds Management, LLC (2003–2017); President of Wells Fargo Funds (2003–2016).
Other Directorships: None.
| ||
| Lorin Patrick Taylor Radtke Lord, Abbett & Co. LLC c/o Legal Dept. 90 Hudson Street Jersey City, NJ 07302 (1968) | Board member since 2021 | Principal Occupation: Partner and Co-Founder of M Seven 8 Partners LLC, a venture capital firm (since 2016). Formerly partner, Goldman Sachs.
Other Directorships: Currently serves as director of Assured Guaranty (2021–Present).
| ||
| Leah Song Richardson Lord, Abbett & Co. LLC c/o Legal Dept. 90 Hudson Street Jersey City, NJ 07302 (1966) | Board member since 2021 | Principal Occupation: President of Colorado College (since 2021) and was formerly Dean at University of California, Irvine-School of Law (2017-2021) and formerly Professor of Law at University of California, Irvine (2014–2017).
Other Directorships: None.
| ||
| Mark A. Schmid Lord, Abbett & Co. LLC c/o Legal Dept. 90 Hudson Street Jersey City, NJ 07302 (1959) | Board member since 2016 | Principal Occupation: None.
Other Directorships: None.
| ||
| James L.L. Tullis Lord, Abbett & Co. LLC c/o Legal Dept. 90 Hudson Street Jersey City, NJ 07302 (1947) | Board member since 2006; Chairman since 2017 | Principal Occupation: Chairman of Tullis Health Investors – FL LLC (since 2018); CEO of Tullis-Dickerson and Co. Inc., a venture capital management firm (1990–2016).
Other Directorships: Currently serves as director of Crane Co. (since 1998), Alphatec Spine (since 2018), electroCore, Inc. (since 2018), and Exagen Inc. (since 2019).
|
Interested Board Members
Mr. Sieg is affiliated with Lord Abbett and is an “interested person” of the Fund as defined in the Act. Mr. Sieg is a board member of each of the 14 investment companies in the Lord Abbett Family of Funds, which consist of 63 investment portfolios. Mr. Sieg is an officer of the Lord Abbett Family of Funds.
| Name, Address and Year of Birth | Current Position and Length of Service with the Fund | Principal Occupation and Other Directorships During the Past Five Years | ||
| Douglas B. Sieg Lord, Abbett & Co. LLC 90 Hudson Street Jersey City, NJ 07302 (1969) | Board member since 2016; President and Chief Executive Officer since 2018 | Principal Occupation: Managing Partner (since 2018) and was formerly Head of Client Services, joined Lord Abbett in 1994.
Other Directorships: None.
|
72
Basic Information About Management (continued)
Officers
None of the officers listed below have received compensation from the Fund. All of the officers of the Fund also may be officers of the other Lord Abbett Funds and maintain offices at 90 Hudson Street, Jersey City, NJ 07302. Unless otherwise indicated, the position(s) and title(s) listed under the “Principal Occupation During the Past Five Years” column indicate each officer’s position(s) and title(s) with Lord Abbett. Each officer serves for an indefinite term (i.e., until his or her death, resignation, retirement, or removal).
| Name and Year of Birth | Current Position with the Fund | Length of Service of Current Position | Principal Occupation During the Past Five Years | |||
| Douglas B. Sieg (1969) | President and Chief Executive Officer | Elected as President and Chief Executive Officer in 2018 | Managing Partner of Lord Abbett (since 2018) and was formerly Head of Client Services, joined Lord Abbett in 1994. | |||
| Jackson C. Chan (1964) | AML Compliance Officer | Elected in 2018 | Deputy Chief Compliance Officer and Director of Regulatory Affairs, joined Lord Abbett in 2014. | |||
| Pamela P. Chen (1978) | Vice President, Assistant Secretary and Privacy Officer | Elected as Vice President and Assistant Secretary in 2018 and Privacy Officer in 2019 | Associate General Counsel, joined Lord Abbett in 2017 and was formerly Special Counsel at Schulte, Roth & Zabel LLP (2005–2017). | |||
| John T. Fitzgerald (1975) | Vice President and Assistant Secretary | Elected in 2018 | Deputy General Counsel, joined Lord Abbett in 2018 and was formerly Deputy Head of U.S. Funds Legal, Executive Director and Assistant General Counsel at JPMorgan Chase (2005–2018). | |||
| Vito A. Fronda (1969) | Vice President and Assistant Treasurer | Elected as Vice President and Assistant Treasurer in 2021 | Partner and Director of U.S. Fund Treasury & Global Taxation, joined Lord Abbett in 2003. | |||
| Michael J. Hebert (1976) | Chief Financial Officer and Treasurer | Elected as Chief Financial Officer and Treasurer in 2021 | Head of Global Fund Finance, joined Lord Abbett in 2021 and was formerly Vice President at Eaton Vance Management (EVM) (2014–2021) and Calvert Research & Management (CRM) (2016-2021), and Assistant Treasurer of registered investment companies managed, advised or administered by EVM and CRM during such years. |
73
Basic Information About Management (concluded)
| Name and Year of Birth | Current Position with the Fund | Length of Service of Current Position | Principal Occupation During the Past Five Years | |||
| Linda Y. Kim (1980) | Vice President and Assistant Secretary | Elected in 2016 | Counsel, joined Lord Abbett in 2015. | |||
| Joseph M. McGill (1962) | Chief Compliance Officer | Elected in 2014 | Partner and Chief Compliance Officer, joined Lord Abbett in 2014. | |||
| Amanda S. Ryan (1978) | Vice President and Assistant Secretary | Elected in 2018 | Counsel, joined Lord Abbett in 2016. | |||
| Lawrence B. Stoller (1963) | Vice President, Secretary and Chief Legal Officer | Elected as Vice President and Secretary in 2007 and Chief Legal Officer in 2019 | Partner and General Counsel, joined Lord Abbett in 2007. |
Please call 888-522-2388 for a copy of the statement of additional information, which contains further information about the Fund’s Board members. It is available free upon request.
74
Approval of Advisory Contract
The Board, including all of the Trustees who are not “interested persons” of the Company or of Lord Abbett, as defined in the Investment Company Act of 1940, as amended (the “Independent Trustees”), annually considers whether to approve the continuation of the existing management agreement between each Fund and Lord Abbett (the “Agreement”). In connection with its most recent approval, the Board reviewed materials relating specifically to the Agreement, as well as numerous materials received throughout the course of the year, including information about each Fund’s investment performance compared to the performance of an appropriate benchmark. Before making its decision as to each Fund, the Board had the opportunity to ask questions and request further information, taking into account its knowledge of Lord Abbett gained through its meetings and discussions. These meetings and discussions included reviews of Fund performance conducted by members of the Contract Committee, the deliberations of the Contract Committee, and discussions between the Contract Committee and Lord Abbett’s management. The Independent Trustees also met with their independent legal counsel in various private sessions at which no representatives of management were present.
The materials received by the Board as to each Fund included, but were not limited to: (1) information provided by Broadridge Financial Solutions (“Broadridge”) regarding the investment performance of the Fund compared to the investment performance of certain funds with similar investment styles as determined by Broadridge, based, in part, on the Fund’s Morningstar category (the “performance peer group”), and the investment performance of one or more appropriate benchmarks; (2) information provided by Broadridge regarding the expense ratios, contractual and actual management fee rates, and other expense components for the Fund and certain funds-of-funds in the same Morningstar category, with generally the same or similar share classes and operational characteristics, including asset size (the “expense peer group”); (3) certain supplemental investment performance information provided by Lord Abbett; (4) information provided by Lord Abbett on the expense ratios, management fee rates, and other expense components for the Fund; (5) sales and redemption information for the Fund; (6) information regarding Lord Abbett’s financial condition; (7) an analysis of the relative profitability of the Agreement to Lord Abbett; and (8) information regarding the personnel and other resources devoted by Lord Abbett to managing the Fund.
Investment Management and Related Services Generally. The Board considered the services provided by Lord Abbett to each Fund, including investment research, portfolio management, and trading, and Lord Abbett’s commitment to compliance with all applicable legal requirements. The Board also observed that Lord Abbett was solely engaged in the investment management business and accordingly did not experience the conflicts of interest that may result from being engaged in other lines of business. The Board considered the investment advisory services provided by Lord Abbett to other clients, the fees charged for the services, and the differences in the nature of the services provided to each Fund and other Lord Abbett Funds, on the one hand, and the services provided to other clients, on the other. After reviewing these and related factors, the Board concluded that each Fund was likely to continue to benefit from the nature, extent and quality of the investment services provided by Lord Abbett under the Agreement.
Investment Performance. The Board reviewed each Fund’s investment performance in relation to that of its performance peer group and one or more appropriate benchmarks as of various periods ended June 30, 2021. As to Multi-Asset Balanced Opportunity Fund, the Board observed that the Fund’s investment performance was below the median of the performance peer group for the ten-year period, but above the median of the performance peer group for the one, three-, and five-year periods. As to Multi-Asset Income Fund, the Board observed that the Fund’s investment
75
Approval of Advisory Contract (continued)
performance was above the median of the performance peer group for the one-, three- five-, and ten-year periods. With respect to each Fund, the Board took into account actions taken by Lord Abbett to attempt to improve fund performance of other Lord Abbett Funds, which would benefit the Funds through their investments in those Funds. The Board further considered Lord Abbett’s performance and reputation generally, the performance of other Lord Abbett-managed funds overseen by the Board, and the willingness of Lord Abbett to take steps intended to improve performance when appropriate. After reviewing these and other factors, including those described below, the Board concluded that each Fund’s Agreement should be continued.
Lord Abbett’s Personnel and Methods. The Board considered the qualifications of the personnel providing investment management services to each Fund, in light of its investment objective and discipline, and other services provided to each Fund by Lord Abbett. Among other things, the Board considered the size, experience, and turnover of Lord Abbett’s staff, Lord Abbett’s investment methodology and philosophy, and Lord Abbett’s approach to recruiting, training, and retaining personnel.
Nature and Quality of Other Services. The Board considered the nature, quality, and extent of compliance, administrative, and other services performed by Lord Abbett and the nature and extent of Lord Abbett’s supervision of third party service providers, including each Fund’s transfer agent and custodian.
Expenses. The Board considered the expense level of each Fund, including the contractual and actual management fee rates, and the expense levels of the Fund’s expense peer group. It also considered how the expense level of each Fund related to those of the expense peer group and the amount and nature of the fees paid by shareholders. As to each Fund, the Board observed that while the net total expense ratio of the Fund was above the median of the expense peer group, the Fund’s advisory fee (excluding underlying fund fees) was below the median of the expense peer group. After reviewing these and related factors, the Board concluded, within the context of its overall approval of the Agreement, that the management fees paid by, and expense level of, each Fund were reasonable in light of all of the factors it considered and supported the continuation of the Agreement on behalf of each Fund.
Profitability. As to each Fund, the Board considered the level of Lord Abbett’s operating margin in managing the Fund, including a review of Lord Abbett’s methodology for allocating its costs to its management of the Fund. It considered whether each Fund was profitable to Lord Abbett in connection with the Fund’s operation, including the fee that Lord Abbett receives from the Fund for providing administrative services to the Fund. The Board considered Lord Abbett’s profit margins excluding Lord Abbett’s marketing and distribution expenses. The Board also considered Lord Abbett’s profit margins, without those exclusions, in comparison with available industry data and how those profit margins could affect Lord Abbett’s ability to recruit and retain personnel. The Board recognized that Lord Abbett’s overall profitability was a factor in enabling it to attract and retain qualified personnel to provide services to each Fund. After reviewing these and related factors, the Board concluded, within the context of its overall approval of the Agreement, that Lord Abbett’s profitability with respect to each Fund was not excessive.
Economies of Scale. As to each Fund, the Board considered the extent to which there had been economies of scale in managing the Fund, whether the Fund’s shareholders had appropriately benefited from such economies of scale, and whether there was potential for realization of any further economies of scale. The Board also considered information provided by Lord Abbett
76
Approval of Advisory Contract (concluded)
regarding how it shares any potential economies of scale through its investments in its businesses supporting the Funds. The Board also considered each Fund’s existing management fee schedule. Based on these considerations, the Board concluded that economies of scale were adequately addressed in respect of each Fund.
Other Benefits to Lord Abbett. As to each Fund, the Board considered the amount and nature of the fees paid by the Fund and the Fund’s shareholders to Lord Abbett and the Distributor for services other than investment advisory services, such as the fee that Lord Abbett receives from each Fund for providing administrative services to the Fund. The Board also considered the revenues and profitability of Lord Abbett’s investment advisory business apart from its mutual fund business, and the intangible benefits enjoyed by Lord Abbett by virtue of its relationship with each Fund. The Board observed that the Distributor receives 12b-1 fees from certain of the Lord Abbett Funds as to shares held in accounts for which there is no other broker of record, may retain a portion of the 12b-1 fees it receives, and receives a portion of the sales charges on sales and redemptions of some classes of shares of the Lord Abbett Funds. In addition, the Board observed that Lord Abbett accrues certain benefits for its business of providing investment advice to clients other than the Lord Abbett Funds, but that business also benefits the Funds. The Board also considered that Lord Abbett accrues certain benefits from sponsoring funds that invest in other Lord Abbett Funds and the fees that Lord Abbett receives from the underlying Funds. The Board also noted that Lord Abbett, as disclosed in the prospectus of each Fund, has entered into revenue sharing arrangements with certain entities that distribute shares of the Lord Abbett Funds. The Board also took into consideration the investment research that Lord Abbett receives as a result of client brokerage transactions.
Alternative Arrangements. As to each Fund, the Board considered whether, instead of approving continuation of the Agreement, it might be in the best interests of the Fund to implement one or more alternative arrangements, such as continuing to employ Lord Abbett, but on different terms. After considering all of the relevant factors, the Board unanimously found that continuation of the Agreement was in the best interests of each Fund and its shareholders and voted unanimously to approve the continuation of the Agreement on behalf of each Fund. As to each Fund, in considering whether to approve the continuation of the Agreement, the Board did not identify any single factor as paramount or controlling. Individual Trustees may have evaluated the information presented differently from one another, giving different weights to various factors. This summary does not discuss in detail all matters considered.
77
Liquidity Risk Management Program
Pursuant to Rule 22e-4 under the 1940 Act, each Fund has adopted a Liquidity Risk Management Program and Policy (“Program”). The Program is designed to assess, manage and periodically review the Fund’s liquidity risk. Liquidity risk is defined under Rule 22e-4 as the risk that the Fund could not meet redemption requests without significant dilution of remaining investors’ interests in the Fund. The Board has appointed Lord Abbett as the administrator for the Fund’s Program. At the June 2-3, 2021 meeting, Lord Abbett provided the Board with a report addressing the operation of the Program and assessing its adequacy and effectiveness of implementation for the period March 1, 2020 through March 1, 2021. Lord Abbett reported that the Program operated effectively during the period. In particular, Lord Abbett reported that: the Fund did not breach its 15% limit on illiquid investments at any point during the period and all regulatory reporting related to Rule 22e-4 was completed on time and without issue during the period. There can be no assurance that the Program will achieve its objectives in the future. Please refer to the Fund’s prospectus for more information regarding the Fund’s exposure to liquidity risk and other principal risks to which an investment in the Fund may be subject.
Householding
The Trust has adopted a policy that allows it to send only one copy of each Fund’s prospectus, proxy material, annual report and semiannual report (or related notice of internet availability of annual report and semiannual report) to certain shareholders residing at the same “household.” This reduces Fund expenses, which benefits you and other shareholders. If you need additional copies or do not want your mailings to be “householded,” please call Lord Abbett at 888-522-2388 or send a written request with your name, the name of your fund or funds and your account number or numbers to Lord Abbett Family of Funds, P.O. Box 219336, Kansas City, MO 64121.
Proxy Voting Policies, Procedures and Records
A description of the policies and procedures that Lord Abbett uses to vote proxies related to each Fund’s portfolio securities, and information on how Lord Abbett voted each Fund’s proxies during the 12-month period ended June 30 are available without charge, upon request, (i) by calling 888-522-2388; (ii) on Lord Abbett’s Website at www.lordabbett.com; and (iii) on the Securities and Exchange Commission’s (“SEC”) Website at www.sec.gov.
Shareholder Reports and Quarterly Portfolio Disclosure
The Funds are required to file their complete schedule of portfolio holdings with the SEC for their first and third fiscal quarters as an attachment to Form N-PORT. Copies of the filings are available without charge, upon request on the SEC’s Website at www.sec.gov and may be available by calling Lord Abbett at 888-522-2388.
78
Tax Information (unaudited)
The percentages below reflect the portion of ordinary income distributions that are eligible for the corporate dividend received deduction (DRD) and qualified dividend income (QDI) for individual shareholders:
| Fund Name | DRD | QDI | ||
| Multi-Asset Balanced Opportunity Fund | 14% | 19% | ||
| Multi-Asset Income Fund | 11% | 16% |
Additionally, of the distributions paid to the shareholders during the fiscal year ended November 30, 2021, the following amount represent long-term capital gains:
| Fund Name | |
| Multi-Asset Balanced Opportunity Fund | $53,919,159 |
Each fund intends to pass through foreign source income and foreign taxes as follows:
| Fund Name | Foreign Source Income | Foreign Taxes | ||||
| Multi-Asset Balanced Opportunity Fund | $ | 6,234,405 | $ | 412,117 | ||
| Multi-Asset Income Fund | 2,809,951 | 196,435 | ||||
The percentages below reflect the portion of net investment income distributions paid during the fiscal year ended November 30, 2021 that is tax-exempt dividend income.
| Multi-Asset Balanced Opportunity Fund | 0.34% |
| Multi-Asset Income Fund | 3.35% |
79


This report, when not used for the general information of shareholders of the Fund, is to be distributed only if preceded or accompanied by a current fund prospectus.
Lord Abbett mutual fund shares are distributed by | Lord Abbett Investment Trust
Lord Abbett Multi-Asset Balanced Opportunity Fund
Lord Abbett Multi-Asset Income Fund | LASAF-2 (01/22) |
![]()
LORD ABBETT
ANNUAL REPORT
Lord Abbett
Convertible Fund
Core Fixed Income Fund
Core Plus Bond Fund
Corporate Bond Fund
Floating Rate Fund
High Yield Fund
Income Fund
Inflation Focused Fund
Short Duration Core Bond Fund
Short Duration Income Fund
Total Return Fund
Ultra Short Bond Fund
For the fiscal year ended November 30, 2021
Table of Contents
Lord Abbett Convertible Fund, Lord Abbett Core Fixed Income Fund, Lord Abbett Core Plus Bond Fund, Lord Abbett Corporate Bond Fund, Lord Abbett Floating Rate Fund, Lord Abbett High Yield Fund, Lord Abbett Income Fund, Lord Abbett Inflation Focused Fund, Lord Abbett Short Duration Core Bond Fund, Lord Abbett Short Duration Income Fund, Lord Abbett Total Return Fund, and Lord Abbett Ultra Short Bond Fund
Annual Report
For the fiscal year ended November 30, 2021
From left to right: James L.L. Tullis, Independent Chairman of the Lord Abbett Funds and Douglas B. Sieg Trustee, President, and Chief Executive Officer of the Lord Abbett Funds. | Dear Shareholders: We are pleased to provide you with this overview of the performance of the Funds for the fiscal year ended November 30, 2021. On this page and the following pages, we discuss the major factors that influenced fiscal year performance. For detailed and more timely information about the Funds, please visit our website at www.lordabbett.com, where you also can access the quarterly commentaries that provide updates on each Fund’s performance and other portfolio related updates. Thank you for investing in Lord Abbett mutual funds. We value the trust that you place in us and look forward to serving your investment needs in the years to come.
Best regards,
Douglas B. Sieg Trustee, President and Chief Executive Officer |


Lord Abbett Convertible Fund
For the fiscal year ended November 30, 2021, the Fund returned 8.83%, reflecting performance at the net asset value (“NAV”) of Class A shares with all distributions reinvested, compared to its benchmark, the
ICE BofA All Convertibles Index,1 which returned 13.76% over the same period.
The twelve-month period ending November 30, 2021 was primarily a story of the dramatic economic and market recovery that occurred within the U.S., despite the persistent presence of
1
COVID-19. The S&P 500® Index2 and the tech heavy Nasdaq Composite3 returned 27.92% and 28.20%, respectively. Large cap stocks4 outperformed small cap stocks5 (26.67% vs. 22.03%), while growth6 outperformed value7 (29.39% vs. 22.92%).
Following volatility throughout the fall of 2020, markets rallied in the month of December, with the S&P 500 Index gaining 3.84%. The Dow Jones Industrial Average also continued its push through the 30,000 level. The strong overall market performance was mainly attributed to vaccine approvals and a bipartisan compromise on a fifth pandemic relief package. Additionally, the U.S. Federal Reserve (“Fed”) cleared banks to resume share buybacks in the first quarter of 2021, subject to a limit, after the industry fared well in the second round of stress tests. This was a notable development considering the industry had mostly struggled throughout 2020.
To start the new year, various factors impacted markets, although the longstanding bullish narrative surrounding stimulus and vaccine optimism remained largely intact. Momentum continued behind the pro-cyclical and pro-value rotation on the back of the Democrats’ surprise victory in the Georgia U.S. Senate runoff elections. As such, value outperformed growth during the first quarter by the largest margin in two decades. Overall, the S&P 500® Index reported growth in earnings of 52% during the first quarter of 2021.
Inflation fears and renewed concerns over variants of the coronavirus did little to slow the market down during the second quarter of 2021, as the S&P 500® Index and Nasdaq Composite returned 8.55% and 9.68%, respectively, with both indexes
breaching all-time highs. After lagging meaningfully since the announcement of the vaccine news, growth outperformed value during the quarter. Second quarter reported earnings were even stronger than the first quarter, with the blended growth rate for the S&P 500® Index at 88%, which was the highest year-over-year growth since the fourth quarter of 2009. In aggregate, companies were reporting earnings 17.1% ahead of consensus in the second quarter, the fourth highest on record, and revenues 4.9% ahead of consensus, the highest on record.
The bullish narrative continued into the start of the third quarter. For most of July and August, investor focus was largely centered around themes, such as a central bank liquidity tailwind, continued vaccine progress, upside in corporate earnings surprises, and reopening momentum. However, U.S. markets were met with increasing headwinds toward the latter half of the quarter, which included the increased spread of the Delta variant, and rising concerns over supply chain and input price pressures on corporate earnings. This was reflected by consumer prices rising 5.4% year-over-year, in both June and July (the fastest pace since August 2008). Inflation maintained its record pace in August as consumer prices rose 5.3% year-over-year, albeit below economist expectations for the month. Uncertainty around the Fed tapering presented additional headwinds to the market. Toward the end of the third quarter, the Fed indicated that a reduction in its $120 billion per month asset-purchase plan might soon be warranted. U.S. markets were also affected by negative headlines overseas, most notably China’s regulatory crackdown of the private
2
education and technology sectors and broad worries about a default by Chinese real estate developer Evergrande. These headwinds culminated in a volatile September, with all major U.S. indices finishing in negative territory. Specifically, the S&P 500® Index snapped a streak of seven consecutive months of positive returns and had its worst performing month since March 2020.
The U.S. equity market continued to be strong during the fourth quarter as all major indices exhibited positive performance. The S&P 500® Index and the Nasdaq Composite returned 6.26% and 7.65%, respectively, through November. Strong consumer demand, underpinned by robust corporate and consumer balance sheets, has helped keep operating leverage and margins elevated for corporations, despite increased supply chain and input price pressures. The Friday following Thanksgiving in the U.S. saw a big market selloff with all the major indexes down over 2% on concerns that the emergence of the new Omicron variant could derail the last bout of economic normalization traction. This added to continued concerns around the shift in the transient versus persistent inflation debate.
Convertibles proved to be rather resilient despite increased volatility and large swings in both the equity and credit markets in 2021. The asset class’ exposure to growth companies detracted from performance earlier in the year when interest rates rose, and its exposure to the travel and leisure industries negatively impacted returns during the middle of the year as the spread of the Delta variant reduced demand for these services. Despite this volatility, the convertible market continued to see robust issuance, with volumes just shy of the record observed in
2020, as well as strong demand from both investors and issuers.
Among the largest detractors from the Fund’s relative performance during the period was security selection within the leisure sector, which was disproportionately impacted by novel variants of the COVID-19 spreading across the world. Underweight exposures to the technology and electronics sectors also detracted from relative performance, as interest rates stabilized and growth companies rallied in the spring of 2021.
Security selection within the retail sector was among the largest contributors to the Fund’s relative performance during the period, as companies were able to successfully grow their businesses despite global supply chain concerns. Security selection within the capital goods and real estate sectors also contributed to relative performance.
Lord Abbett Core Fixed Income Fund
For the fiscal year ended November 30, 2021, the Fund returned -0.30%, reflecting performance at the net asset value (“NAV”) of Class A shares with all distributions reinvested, compared to its benchmark, the Bloomberg U.S. Aggregate Bond Index,8 which returned -1.15%.
The twelve-month period ending November 30, 2021 was primarily a story of the dramatic economic and market recovery that occurred within the U.S. Despite the persistent presence of COVID-19, U.S. risk assets largely outperformed their higher quality counterparts over the period. U.S. Treasuries9 returned -2.05% amid rising yields across all maturities, while investment grade corporate bonds10 returned -0.53% as spreads remained
3
rangebound and near all-time tight levels throughout the period.
Conversely, high yield bonds11 and leveraged loans12 returned 5.38% and 6.12%, respectively, over the period. Within high yield, lower quality segments of the market outperformed higher quality tiers. The strong market performance was mainly attributed to vaccine approvals and a bipartisan compromise on a fifth pandemic relief package, leading to improving credit fundamentals and low default rates.
To start the new year, various factors impacted markets. Momentum continued behind the pro-cyclical and value rotation on the back of the Democrats’ surprise victory in the Georgia U.S. Senate runoff elections. Inflation fears and renewed concerns over variants of the coronavirus did little to slow the market down during the second quarter of 2021, as the S&P 500® Index2 and Nasdaq3 both breached all-time highs. Second quarter reported earnings were even stronger than the first quarter, with the blended growth rate for earnings in the S&P 500® Index at 88%, which was the highest year-over-year growth since fourth quarter of 2009. In aggregate, companies were reporting earnings 17.1% ahead of consensus in the second quarter, the fourth highest on record, and revenues 4.9% ahead of consensus, the highest on record.
Risk assets continued to perform well into the third quarter, boosted by the reopening of the economy and strong corporate earnings. However, U.S. markets were met with increasing headwinds toward the latter half of the quarter, which included the increased spread of the Delta variant, rising concerns over supply chain issues and input price pressures on corporate earnings. This was reflected by consumer prices rising materially over the
period. Uncertainty around the Fed tapering presented additional headwinds to the market. Toward the end of the third quarter, the Fed indicated that a reduction in its $120 billion per month asset-purchase plan might soon be warranted. U.S. markets were also affected by negative headlines overseas, most notably China’s regulatory crackdown of the private education and technology sectors and broad worries about a default by Chinese real estate developer Evergrande. These headwinds culminated in a volatile September, with all major U.S. indices finishing in negative territory. Specifically, the S&P 500® Index snapped a streak of seven consecutive months of positive returns and had its worst performing month since March 2020.
Markets remained resilient to start the fourth quarter amid strong consumer demand, underpinned by robust corporate and consumer balance sheets, which helped keep operating leverage and margins elevated for corporations, despite increased supply chain and input price pressures. However, the Friday following Thanksgiving in the U.S. saw a big market selloff with all the major indexes down over 2% on concerns that the emergence of the new Omicron variant could derail the last bout of economic normalization. This added to continued concerns around the shift in the transient versus persistent inflation debate.
For the 12-month period ended November 2021, the Fund’s security selection within investment grade corporate bonds was the largest contributor to performance. Specifically, security selection within investment grade financial issues drove positive performance over the period. We favored financials and, more specifically, domestic banks, as we
4
saw improving fundamentals in the U.S. banking sector with strong management teams and healthy balance sheets.
Security selection within and an overweight allocation to commercial mortgage-backed securities (CMBS) also contributed to performance over the period. Commercial real estate valuations have been driven higher by the distribution of the COVID-19 vaccine and a shift in momentum to sectors more leveraged to the return of normalcy. We remain constructive on idiosyncratic single-asset / single-borrower (SASB) opportunities and the Fund remains underweight agency CMBS.
Lastly, an underweight allocation to agency mortgage-backed securities (MBS) contributed to performance. The asset class posted negative returns over the period as 30-year MBS spreads widened materially in November, driven by stronger inflation prints and shifts in Fed commentary that led investors to expect an accelerated taper of agency MBS purchases going into 2022.
Detracting from performance over the period was an allocation to high quality asset-backed securities (ABS) and a moderate allocation to cash and cash equivalents. These sectors underperformed risk assets over the period.
Lord Abbett Core Plus Bond Fund
For the fiscal year ended November 30, 2021, the Fund returned 1.23%, reflecting performance at the net asset value (“NAV”) of Class A shares with all distributions reinvested, compared to its benchmark, the Bloomberg U.S. Aggregate Bond Index,8 which returned -1.15%.
The twelve-month period ending November 30, 2021 was primarily a story of the dramatic economic and market
recovery that occurred within the U.S. Despite the persistent presence of COVID-19, U.S. risk assets largely outperformed their higher quality counterparts over the period. U.S. Treasuries9 returned -2.05% amid rising yields across all maturities, while investment grade corporate bonds10 returned -0.53% as spreads remained rangebound and near all-time tight levels throughout the period.
Conversely, high yield bonds11 and leveraged loans12 returned 5.38% and 6.12%, respectively, over the period. Within high yield, lower quality segments of the market outperformed higher quality tiers. The strong market performance was mainly attributed to vaccine approvals and a bipartisan compromise on a fifth pandemic relief package, leading to improving credit fundamentals and low default rates.
To start the new year, various factors impacted markets. Momentum continued behind the pro-cyclical and value rotation on the back of the Democrats’ surprise victory in the Georgia U.S. Senate runoff elections. Inflation fears and renewed concerns over variants of the coronavirus did little to slow the market down during the second quarter of 2021, as the S&P 500® Index2 and Nasdaq3 both breached all-time highs. Second quarter reported earnings were even stronger than the first quarter, with the blended growth rate for earnings in the S&P 500® Index at 88%, which was the highest year-over-year growth since fourth quarter of 2009. In aggregate, companies were reporting earnings 17.1% ahead of consensus in the second quarter, the fourth highest on record, and revenues 4.9% ahead of consensus, the highest on record.
Risk assets continued to perform well into the third quarter, boosted by the
5
reopening of the economy and strong corporate earnings. However, U.S. markets were met with increasing headwinds toward the latter half of the quarter, which included the increased spread of the Delta variant, rising concerns over supply chain issues and input price pressures on corporate earnings. This was reflected by consumer prices rising materially over the period. Uncertainty around the U.S. Federal Reserve (the “Fed”) tapering presented additional headwinds to the market. Toward the end of the third quarter, the Fed indicated that a reduction in its $120B per month asset-purchase plan might soon be warranted. U.S. markets were also affected by negative headlines overseas, most notably China’s regulatory crackdown of the private education and technology sectors and broad worries about a default by Chinese real estate developer Evergrande. These headwinds culminated in a volatile September, with all major U.S. indices finishing in negative territory. Specifically, the S&P 500® Index snapped a streak of seven consecutive months of positive returns and had its worst performing month since March 2020.
Markets remained resilient to start the fourth quarter amid strong consumer demand, underpinned by robust corporate and consumer balance sheets, which helped keep operating leverage and margins elevated for corporations, despite increased supply chain and input price pressures. However, the Friday following Thanksgiving in the U.S. saw a big market selloff with all the major indexes down over 2% on concerns that the emergence of the new Omicron variant could derail the last bout of economic normalization. This added to continued concerns around the shift in the transient versus persistent inflation debate.
For the 12-month period ended November 2021, the Fund’s allocation to high yield corporate bonds was the largest contributor to performance. Specifically, high yield allocations within the energy and consumer cyclical industries contributed to performance.
Security selection within and an overweight allocation to commercial mortgage-backed securities (CMBS) also contributed to performance over the period. Commercial real estate valuations have been driven higher by the distribution of the COVID-19 vaccine and a shift in momentum to sectors more leveraged to the return of normalcy. We remain constructive on idiosyncratic single-asset / single-borrower (SASB) opportunities and are underweight agency CMBS.
Lastly, underweight allocations to agency mortgage-backed securities (MBS) and U.S. Treasuries contributed to performance. These asset classes both posted negative returns over the period as risk assets outperformed and rates rose across the curve.
Detractors over the period included an allocation to high quality asset-backed securities (ABS) and a moderate allocation to cash and cash equivalents, as these sectors underperformed risk assets over the period.
Lord Abbett Corporate Bond Fund
For the fiscal year ended November 30, 2021, the Fund returned 0.95%, reflecting performance at the net asset value (“NAV”) of Class A shares with all distributions reinvested, compared to its benchmark, the Bloomberg U.S. Corporate Investment Grade Index,10 which returned -0.53% over the period.
6
The twelve-month period ending November 30, 2021 was primarily a story of the dramatic economic and market recovery that occurred within the U.S. Despite the persistent presence of COVID-19, U.S. Risk assets largely outperformed their higher quality counterparts over the period, as U.S. Treasuries9 returned -2.05% amid rising yields across all maturities.
Conversely, high yield bonds11 and leveraged loans12 returned 5.38% and 6.12%, respectively, over the period. Within high yield, lower quality segments of the market outperformed higher quality tiers. The strong market performance was mainly attributed to vaccine approvals and a bipartisan compromise on a fifth pandemic relief package. Additionally, the U.S. Federal Reserve (“Fed”) cleared banks to resume share buybacks in the first quarter of 2021, subject to a limit, after the industry fared well in the second round of stress tests-which was a notable development considering the industry had mostly struggled throughout 2020.
To start the new year, various factors impacted markets, although the longstanding bullish narrative surrounding stimulus and vaccine optimism remained largely intact. Momentum continued behind the pro-cyclical and value rotation on the back of the Democrats’ surprise victory in the Georgia U.S. Senate runoff elections. Inflation fears and renewed concerns over variants of the coronavirus did little to slow the market down during the second quarter of 2021, as the S&P 500® Index2 and Nasdaq Composite3 both breached all-time highs. Second quarter reported earnings were even stronger than the first quarter, with the blended growth rate for the S&P 500® Index at 88%, which was the highest year-over-year growth
since fourth quarter of 2009. In aggregate, companies were reporting earnings 17.1% ahead of consensus in the second quarter, the fourth highest on record, and revenues 4.9% ahead of consensus, the highest on record.
The bullish narrative continued into the start of the third quarter. For most of July and August, investor focus was largely centered around themes, such as a central bank liquidity tailwind, continued vaccine progress, upside in corporate earnings surprises, and reopening momentum. However, U.S. markets were met with increasing headwinds toward the latter half of the quarter, which included the increased spread of the Delta variant, rising concerns over supply chain and input price pressures on corporate earnings. This was reflected by consumer prices rising 5.4% year-over-year, in both June and July (the fastest pace since August 2008). Inflation maintained its record pace in August as consumer prices rose 5.3% year-over-year, albeit below economist expectations for the month. Uncertainty around the Fed tapering presented additional headwinds to the market. Toward the end of the third quarter, the Fed indicated that a reduction in its $120 billion per month asset-purchase plan might soon be warranted. U.S. markets were also affected by negative headlines overseas, most notably China’s regulatory crackdown of the private education and technology sectors, and broad worries about a default by Chinese real estate developer, Evergrande. These headwinds culminated in a volatile September, with all major U.S. indices finishing in negative territory. Specifically, the S&P 500® Index snapped a streak of seven consecutive months of positive
7
returns and had its worst performing month since March 2020.
Markets remained resilient to start the fourth quarter amid strong consumer demand, underpinned by robust corporate and consumer balance sheets, which helped keep operating leverage and margins elevated for corporations, despite increased supply chain and input price pressures. However, the Friday following Thanksgiving in the U.S. saw a big market selloff with all the major indexes down over 2% on concerns that the emergence of the new Omicron variant could derail the last bout of economic normalization traction. This added to continued concerns around the shift in the transient versus persistent inflation debate.
Over the trailing 12-month period, security selection within investment grade corporate bonds was the Fund’s primary contributor to relative performance, as risk assets continued to rally on the back of improving economic fundamentals and increased vaccine distribution. Performance was driven by an overweight to BBB-rated credit, as well as banking, insurance, and consumer cyclical exposures. An underweight to A and AA-rated credit also contributed to performance, as lower rated segments of the investment grade market outperformed higher quality tiers over the course of the period.
Although we believe corporate issuers have healthy balance sheets, we felt that valuations had remained full throughout most of the period - resulting in few significant compression opportunities. Therefore, given tight valuations, our focus was on idiosyncratic risks and the avoidance of drawdowns resulting from them. Towards the end of the period, we began to rotate out of lower-quality
pandemic winners, margin squeezed industries, and high event risk names where we thought valuations looked compressed, into higher quality names - to seek to optimize carry per unit of risk.
The Fund’s modest off-benchmark allocation to U.S. Treasuries was the primary detractor over the period, as the rising interest rate environment led to negative returns within the asset class.
Lord Abbett Floating Rate Fund
For the fiscal year ended November 30, 2021, the Fund returned 6.07%, reflecting performance at the net asset value (“NAV”) of Class A shares with all distributions reinvested, compared to its benchmark, the Credit Suisse Leveraged Loan Index,12 which returned 6.12% over the same period.
The twelve-month period ending November 30, 2021 yielded heightened market volatility as the U.S. continued its steady recovery from the onset of the COVID-19 pandemic. Despite spurs of instability throughout the year, risk assets generally exhibited positive performance. Within credit, high yield bonds, as represented by the ICE BofA US High Yield Constrained Index11, returned 5.38% for the period, compared to investment grade bonds, as represented by the ICE BofA US Corporate Index13, which returned -0.29%. Investment grade bonds faced headwinds throughout the period amid rising U.S. Treasury yields.
U.S. risk assets began the period on a high note with a strong December 2020, and all major U.S. indices finished the calendar year higher. This followed a big November rally in which all the major U.S. indices posted double-digit percentage gains, with the Dow Jones Industrial
8
Average14 (DJIA), in particular, having its best month since 1987. The bullish finish to 2020 was driven largely by the official authorization for emergency use of two coronavirus vaccines with efficacy rates near 95%, one from Pfizer and BioNTech and the other from Moderna. Positive market sentiment was also bolstered by additional fiscal policy in the form of a $900 billion pandemic relief plan that extended many of the initial CARES Act support measures.
The bullish narrative continued into the turn of the calendar year, despite COVID-19 remaining a dominant headline across all global markets. Sentiment around the virus, however, was mostly positive as coronavirus case and hospitalization trends improved throughout much of the first quarter of 2021 and vaccine distribution ramped up following nationwide approval. This momentum led to increased focus on the U.S. economic recovery and markets moving into a more cyclical posture, highlighted by the U.S. 10-Year Treasury yield climbing up to over 1.7% by mid-March. High yield credit outperformed investment grade credit during this episode of rising U.S. Treasury yields.
One key theme around U.S. markets was the ongoing support from the U.S. Federal Reserve (“Fed”) via the central bank liquidity tailwind and additional fiscal stimulus. Markets also received a boost in the second quarter of 2021 from robust equity inflows, which were supported by a strong corporate profit backdrop. However, these tailwinds were partially offset by increased concerns regarding an inflation overshoot. Following a relatively modest increase in the first quarter of 2020, consumer prices accelerated higher, averaging gains of approximately 5.3%
year-over-year from April to September, the fastest annual increase since 2008. This upward pressure on prices was mainly caused by supply chain disruptions, higher raw-materials costs, shipping constraints and an unusually tight labor market. Despite this upward pressure, the Fed remained mostly consistent in its messaging on inflationary expectations throughout the spring and summer of 2021. The Fed indicated that price pressures would be transitory, and the peak inflation theme gained traction as the summer months progressed, despite economists’ suggestions that ‘transitory’ may be longer than expected.
Focus on inflationary expectations was the primary influence for volatility in U.S. markets until midway through the third quarter, when COVID-19 reentered the forefront of global headlines. The Delta variant of the virus caused new waves of positive cases and increased hospitalizations around the world, and this new headwind, combined with continued supply chain issues and uncertainty around Fed tapering, increased market volatility. This was evident in equity markets, as the three major U.S. indices faced their largest monthly pullbacks in September since the onset of the pandemic in March 2020. High yield credit, however, was resilient during this stretch of increased Delta cases. High yield returns were flat in September relative to other risk assets, such as investment grade credit and equities, both of which exhibited pullbacks for the month. While the Delta wave weighed on the speed of recovery in the U.S. economy, it ultimately proved less impactful overall compared to the initial onset of COVID-19. Economic fundamentals remained strong throughout the third quarter of 2021, and
9
U.S. Gross Domestic Product returned to, and remained, at pre-pandemic levels.
The fourth quarter began with investors shifting focus back to the debate of whether inflation may be more persistent than transitory. Despite the lack of hawkish surprises from the early November Federal Open Market Committee (FOMC) meeting, there was a notable shift in tone from the Fed as the month of November progressed. The Fed’s quick shift toward the possibility of a more aggressive taper was largely chalked up to another round of hotter-than-expected inflation data. The October Consumer Price Index (CPI) report, which saw headline consumer prices up 0.9% month-over-month and 6.2% year-over-year, came in at the highest reading in over 30 years. Fed Chair Jerome Powell, who was re-nominated by President Biden just before Thanksgiving, indicated that it may be appropriate for the Fed to consider wrapping up its taper a few months sooner than initially envisioned. However, the period culminated with a sell-off in risk assets due to the Omicron variant which was discovered in various parts of the U.S. The new variant caused a risk-off shift as investors were skeptical about the limited data available on the transmissibility and severity of the mutation. Major indices experienced their worst performing trading sessions, highlighted by the DJIA which had its worst session since October 2020.
Security selection within the utilities sector was among the largest detractors from the Fund’s relative performance. The Fund’s position in several power generation companies underperformed during the period as they faced ongoing uncertainty in the rate of recovery for power demand. An underweight allocation and security selection within the consumer non-
durables sector also detracted from relative performance. Specifically, the Fund held an underweight position in select issuers that specialized in beauty and personal care and apparel, which benefited from stronger consumer spending throughout the year. Security selection within the housing sector also detracted from relative performance. Within the sector, underperformance was primarily in the home building subsector, where builders struggled to manage surging costs for lumber and other materials throughout the year.
Security selection within the aerospace sector was among the largest contributors to the Fund’s relative performance. The Fund held securities from several U.S.-based airlines that outperformed as demand for domestic and international travel gradually recovered from 2020 levels throughout the year. Security selection within the retail sector also contributed to relative performance. The sector exhibited solid growth throughout the year as retail sales gradually increased, driven by strong U.S. households holding a record amount of cash. The Fund also benefited from an overweight allocation to and security selection within the energy sector. Specifically, the Fund’s overweight exposure to exploration and production contributed significantly behind increased global energy demand as economies continued to reopen.
Lord Abbett High Yield Fund
For the fiscal year ended November 30, 2021, the Fund returned 6.74%, reflecting performance at the net asset value (“NAV”) of Class A shares with all distributions reinvested, compared to its benchmark, the ICE BofA U.S. High Yield Constrained
10
Index,11 which returned 5.38% over the same period.
The twelve-month period ending November 30, 2021 yielded heightened market volatility as the U.S. continued its steady recovery from the onset of the COVID-19 pandemic. Despite spurs of instability throughout the year, risk assets generally exhibited positive performance. Within credit, high yield bonds, as represented by the ICE BofA US High Yield Constrained Index11, returned 5.38% for the period, compared to investment grade bonds, as represented by the ICE BofA US Corporate Index13, which returned -0.29%. Investment grade bonds faced headwinds throughout the period amid rising U.S. Treasury yields.
U.S. risk assets began the period on a high note with a strong December 2020, and all major U.S. indices finished the calendar year higher. This followed a big November rally in which all the major U.S. indices posted double-digit percentage gains, with the Dow Jones Industrial Average (DJIA)14, in particular, having its best month since 1987. The bullish finish to 2020 was driven largely by the official authorization for emergency use of two coronavirus vaccines with efficacy rates near 95%, one from Pfizer and BioNTech and the other from Moderna. Positive market sentiment was also bolstered by additional fiscal policy in the form of a $900 billion pandemic relief plan that extended many of the initial CARES Act support measures.
The bullish narrative continued into the turn of the calendar year, despite COVID-19 remaining a dominant headline across all global markets. Sentiment around the virus, however, was mostly positive as coronavirus case and hospitalization trends improved
throughout much of the first quarter of 2021 and vaccine distribution ramped up following nationwide approval. This momentum led to increased focus on the U.S. economic recovery and markets moving into a more cyclical posture, highlighted by the U.S. 10-Year Treasury yield climbing up to over 1.7% by mid-March. High yield credit outperformed investment grade credit during this episode of rising U.S. Treasury yields.
One key theme around U.S. markets was the ongoing support from the U.S. Federal Reserve (the “Fed”) via the central bank liquidity tailwind and additional fiscal stimulus. Markets also received a boost in the second quarter of 2021 from robust equity inflows, which were supported by a strong corporate profit backdrop. However, these tailwinds were partially offset by increased concerns regarding an inflation overshoot. Following a relatively modest increase in the first quarter of 2020, consumer prices accelerated higher, averaging gains of approximately 5.3% year-over-year from April to September, the fastest annual increase since 2008. This upward pressure on prices was mainly caused by supply chain disruptions, higher raw-materials costs, shipping constraints and an unusually tight labor market. Despite this upward pressure, the Fed remained mostly consistent in its messaging on inflationary expectations throughout the spring and summer of 2021. The Fed indicated that price pressures would be transitory, and the peak inflation theme gained traction as the summer months progressed, despite economists’ suggestions that ‘transitory’ may be longer than expected.
Focus on inflationary expectations was the primary influence for volatility in U.S. markets until midway through the third
11
quarter, when COVID-19 reentered the forefront of global headlines. The Delta variant of the virus caused new waves of positive cases and increased hospitalizations around the world, and this new headwind, combined with continued supply chain issues and uncertainty around Fed tapering, increased market volatility. This was evident in equity markets, as the three major U.S. indices faced their largest monthly pullbacks in September since the onset of the pandemic in March 2020. High yield credit, however, was resilient during this stretch of increased Delta cases. High yield returns were flat in September relative to other risk assets, such as investment grade credit and equities, both of which exhibited pullbacks for the month. While the Delta wave weighed on the speed of recovery in the U.S. economy, it ultimately proved less impactful overall compared to the initial onset of the COVID-19 pandemic. Economic fundamentals remained strong throughout the third quarter of 2021, and U.S. Gross Domestic Product returned to, and remained, at pre-pandemic levels.
The fourth quarter began with investors shifting focus back to the debate of whether inflation may be more persistent than transitory. Despite the lack of hawkish surprises from the early November Federal Open Market Committee (FOMC) meeting, there was a notable shift in tone from the Fed as the month of November progressed. The Fed’s quick shift toward the possibility of a more aggressive taper was largely chalked up to another round of hotter-than-expected inflation data. The October Consumer Price Index (CPI) report, which saw headline consumer prices up 0.9% month-over-month and 6.2% year-over-year, came in at the highest reading in over 30 years. Fed Chair
Jerome Powell, who was re-nominated by President Biden just before Thanksgiving, indicated that it may be appropriate for the Fed to consider wrapping up its taper a few months sooner than initially envisioned. However, the period culminated with a sell-off in risk assets due to the Omicron variant which was discovered in various parts of the U.S. The new variant caused a risk-off shift as investors were skeptical about the limited data available on the transmissibility and severity of the mutation. Major indices experienced their worst performing trading sessions, highlighted by the DJIA which had its worst session since October 2020.
Security selection within and an overweight allocation to the energy sector were among the largest contributors to the Fund’s relative performance. Within the energy sector, the Fund’s overweight exposure to exploration and production contributed significantly due to increased global energy demand as economies continued to reopen. The Fund’s security selection within the automotive sector also contributed to relative performance. Generally, U.S. auto sales rebounded incredibly well during the period, posting record months of sales between March and May, despite declining meaningfully during the third quarter of 2021 due the ongoing shortage of semiconductor chips for new vehicles. This followed a dip in auto sales a year ago due to the COVID-19 pandemic. While an overweight to CCC-rated credits was a positive, the Fund benefitted from positive security selection across the ratings spectrum.
Security selection within the health care sector was among the largest detractors from the Fund’s relative performance. More specifically, the Fund’s exposure to growth companies in the
12
biotech space was achieved in large part through equities and convertible bonds, asset classes that had a tough year due to rate volatility as well as big swings in equity style performance. The Fund’s exposure to select media content issuers also detracted from relative performance due to headwinds to economic re-openings after nation-wide shelter-in-place mandates. Additionally, security selection within the utilities sector detracted from relative performance. This was primarily due to select issuers within the electric integrated subsector, which underperformed the broader sector for the period.
Lord Abbett Income Fund
For the fiscal year ended November 30, 2021, the Fund returned 2.38%, reflecting performance at the net asset value (“NAV”) of Class A shares with all distributions reinvested, compared to its benchmark, the Bloomberg U.S. Credit Bond Index,19 which returned -0.55% over the same period.
The twelve-month period ending November 30, 2021 was primarily a story of the dramatic economic and market recovery that occurred within the U.S. Despite the persistent presence of COVID-19, U.S. Risk assets largely outperformed their higher quality counterparts over the period. U.S. Treasuries9 returned -2.05% amid rising yields across all maturities; investment grade corporate bonds10 returned -0.53% as spreads remained rangebound at near all-time tight levels throughout the period.
Conversely, high yield bonds11 and leveraged loans12 returned 5.38% and 6.12%, respectively, over the period. Within high yield, lower quality segments of the market outperformed higher quality tiers. The strong market performance was mainly attributed to vaccine approvals and a
bipartisan compromise on a fifth pandemic relief package. Additionally, the U.S. Federal Reserve (“Fed”) cleared banks to resume share buybacks in the first quarter of 2021, subject to a limit, after the industry fared well in the second round of stress tests –which was a notable development considering the industry had mostly struggled throughout 2020.
To start the new year, various factors impacted markets, although the longstanding bullish narrative surrounding stimulus and vaccine optimism remained largely intact. Momentum continued behind the pro-cyclical and value rotation on the back of the Democrats’ surprise victory in the Georgia U.S. Senate runoff elections. Inflation fears and renewed concerns over variants of the coronavirus did little to slow the market down during the second quarter of 2021, as the S&P 500® Index2 and Nasdaq Composite3 both breached all-time highs. Second quarter reported earnings were even stronger than the first quarter, with the blended growth rate for the S&P 500® Index at 88%, which was the highest year-over-year growth since fourth quarter of 2009. In aggregate, companies were reporting earnings 17.1% ahead of consensus in the second quarter, the fourth highest on record, and revenues 4.9% ahead of consensus, the highest on record.
The bullish narrative continued into the start of the third quarter. For most of July and August, investor focus was largely centered around themes, such as a central bank liquidity tailwind, continued vaccine progress, upside in corporate earnings surprises, and reopening momentum. However, U.S. markets were met with increasing headwinds toward the latter half of the quarter, which included the increased spread of the Delta variant, rising concerns over supply chain and input price
13
pressures on corporate earnings. This was reflected by consumer prices rising 5.4% year-over-year, in both June and July (the fastest pace since August 2008). Inflation maintained its record pace in August as consumer prices rose 5.3% year-over-year, albeit below economist expectations for the month. Uncertainty around the Fed tapering presented additional headwinds to the market. Toward the end of the third quarter, the Fed indicated that a reduction in its $120B per month asset-purchase plan might soon be warranted. U.S. markets were also affected by negative headlines overseas, most notably China’s regulatory crackdown of the private education and technology sectors, and broad worries about a default by Chinese real estate developer, Evergrande. These headwinds culminated in a volatile September, with all major U.S. indices finishing in negative territory. Specifically, the S&P 500® Index snapped a streak of seven consecutive months of positive returns and had its worst performing month since March 2020.
Markets remained resilient to start the fourth quarter amid strong consumer demand, underpinned by robust corporate and consumer balance sheets, which helped keep operating leverage and margins elevated for corporations, despite increased supply chain and input price pressures. However, the Friday following Thanksgiving in the U.S. saw a big market selloff with all the major indexes down over 2% on concerns that the emergence of the new Omicron variant could derail the last bout of economic normalization traction. This added to continued concerns around the shift in the transient versus persistent inflation debate.
Over the trailing 12-month period, security selection within investment grade corporate bonds was the main contributor
to relative performance, as risk assets continued to rally on the back of improving economic fundamentals and increased vaccine distribution. The Fund’s positive contribution from security selection was driven by banking, technology, and consumer cyclical sector exposures.
Although we believe corporate issuers have healthy balance sheets, we felt that valuations had remained full throughout most of the period – resulting in few significant compression opportunities. Therefore, given tight valuations, our focus was on idiosyncratic risks and the avoidance of drawdowns resulting from them. Towards the end of the period, we began to rotate out of lower-quality pandemic winners, margin squeezed industries, and high event risk names where we thought valuations looked compressed, into higher quality names in an effort to optimize carry per unit of risk.
Additionally, the Fund’s overweight to BBB-rated credit, as well as an off-benchmark allocation to high yield corporate bonds, contributed to relative performance over the period as rising U.S. Treasury yields caused lower rated credits to outperform their higher quality counterparts.
The Fund’s modest off-benchmark allocation to U.S. Treasuries was the primary detractor over the period, as the rising interest rate environment led to negative returns within the asset class.
Lord Abbett Inflation Focused Fund
For the fiscal year ended November 30, 2021, the Fund returned 12.59%, reflecting performance at the net asset value (NAV) of Class A shares with all distributions reinvested, compared to its benchmark, the Bloomberg U.S. 1-5 Year TIPS Index,15
14
which returned 6.22% over the same period.
The twelve-month period ending November 30, 2021 was primarily a story of the dramatic economic and market recovery that occurred within the U.S. Despite the persistent presence of COVID-19, U.S. Risk assets largely outperformed their higher quality counterparts over the period. U.S. Treasuries9 returned -2.05% amid rising yields across all maturities; investment grade corporate bonds10 returned -0.53% as spreads remained rangebound at near all-time tight levels throughout the period.
Conversely, high yield bonds11 and leveraged loans12 returned 5.38% and 6.12%, respectively, over the period. Within high yield, lower quality segments of the market outperformed higher quality tiers. The strong market performance was mainly attributed to vaccine approvals and a bipartisan compromise on a fifth pandemic relief package. Additionally, the U.S. Federal Reserve (“Fed”) cleared banks to resume share buybacks in the first quarter of 2021, subject to a limit, after the industry fared well in the second round of stress tests; which was a notable development considering the industry had mostly struggled throughout 2020.
To start the new year, various factors impacted markets, although the longstanding bullish narrative surrounding stimulus and vaccine optimism remained largely intact. Momentum continued behind the pro-cyclical and value rotation on the back of the Democrats’ surprise victory in the Georgia U.S. Senate runoff elections. Inflation fears and renewed concerns over variants of the coronavirus did little to slow the market down during the second quarter of 2021, as the S&P 5002 Index and Nasdaq3 both breached all-
time highs. Second quarter reported earnings were even stronger than the first quarter, with the blended growth rate for the S&P 500® Index at 88%, which was the highest year-over-year growth since fourth quarter of 2009. In aggregate, companies were reporting earnings 17.1% ahead of consensus in the second quarter, the fourth highest on record, and revenues 4.9% ahead of consensus, the highest on record.
The bullish narrative continued into the start of the third quarter. For most of July and August, investor focus was largely centered around themes, such as a central bank liquidity tailwind, continued vaccine progress, upside in corporate earnings surprises, and reopening momentum. However, U.S. markets were met with increasing headwinds toward the latter half of the quarter, which included the increased spread of the Delta variant, rising concerns over supply chain and input price pressures on corporate earnings. This was reflected by consumer prices rising 5.4% year-over-year, in both June and July (the fastest pace since August 2008). Inflation maintained its record pace in August as consumer prices rose 5.3% year-over-year, albeit below economist expectations for the month. Uncertainty around the Fed tapering presented additional headwinds to the market. Toward the end of the third quarter, the Fed indicated that a reduction in its $120 billion per month asset-purchase plan might soon be warranted. U.S. markets were also affected by negative headlines overseas, most notably China’s regulatory crackdown of the private education and technology sectors and broad worries about a default by Chinese real estate developer Evergrande. These headwinds culminated in a volatile September, with all major U.S. indices
15
finishing in negative territory. Specifically, the S&P 500® Index snapped a streak of seven consecutive months of positive returns and had its worst performing month since March 2020.
Markets remained resilient to start the fourth quarter amid strong consumer demand, underpinned by robust corporate and consumer balance sheets, which helped keep operating leverage and margins elevated for corporations, despite increased supply chain and input price pressures. However, the Friday following Thanksgiving in the U.S. saw a big market selloff with all the major indexes down over 2% on concerns that the emergence of the new Omicron variant could derail the last bout of economic normalization traction. This added to continued concerns around the shift in the transient versus persistent inflation debate.
The Fund takes a different approach to inflation protection than its benchmark, which is comprised entirely of U.S. Treasury Inflation-Protected Securities (“TIPS”). This strategy combines a short-term bond portfolio with an overlay of consumer price index (“CPI”) swaps through which the Fund seeks to hedge against inflation over a full market cycle.
The Fund’s CPI swap overlay was a strong contributor to relative performance. Inflation expectations rose sharply over the 12-month period, driven by supply chain issues and the reopening of the economy. Rising wage growth caused longer-term inflation concerns as demand outstripped pandemic-afflicted supply during the period.
Within the underlying bond portfolio, the Fund’s allocation to short-term, high yield corporate bonds was the largest contributor to relative performance over the period. High yield as an asset class
posted strong positive returns over the period as the market continued to rally on vaccine distributions and the re-opening of the economy. The low duration high yield corporate bond allocation, though modest relative to the predominantly investment grade portfolio, continues to be a key driver of alpha in the Fund.
The Fund’s allocation to commercial mortgage-backed securities (CMBS) also contributed to performance. We believe the asset class offers attractive carry and has been supported by economic growth and a supportive federal government. Specifically, performance was driven by floating rate single-asset, single-borrower deals with high quality tenants in strong geographic areas.
Security selection within investment grade corporate bonds was another main contributor to relative performance over the period. Specifically, selection within the energy and financial industries drove positive performance. The Financials sector continues to be a notable overweight in the portfolio, as we favor the industry given what we believe to be strong management teams and healthy balance sheets. We also believe that the energy industry has focused heavily on capital discipline and ESG factors, thus, we have found idiosyncratic issues with relatively strong performance.
The single detractor from performance over the period was a modest allocation to short-term U.S. Treasuries. Short-term Treasury yields rose over the period, acting as headwind to Treasury bond prices.
Lord Abbett Short Duration Core Bond Fund
For the fiscal year ended November 30, 2021, the Fund returned 0.48%, reflecting performance at the net asset
16
value (“NAV”) of Class A shares with all distributions reinvested, compared to its benchmark, the Bloomberg 1-3 Year U.S. Government/Credit Bond Index,16 which returned -0.23% over the same period.
The twelve-month period ending November 30, 2021 was primarily a story of the dramatic economic and market recovery that occurred within the U.S. Despite the persistent presence of COVID-19, U.S. risk assets largely outperformed their higher quality counterparts over the period. U.S. Treasuries9 returned -2.05% amid rising yields across all maturities, while investment grade corporate bonds10 returned -0.53% as spreads remained rangebound and near all-time tight levels throughout the period.
Conversely, high yield bonds11 and leveraged loans12 returned 5.38% and 6.12%, respectively, over the period. Within high yield, lower quality segments of the market outperformed higher quality tiers. The strong market performance was mainly attributed to vaccine approvals and a bipartisan compromise on a fifth pandemic relief package, which led to improving credit fundamentals and declining default rates amid a strong economic backdrop.
To start the new year, momentum continued behind the pro-cyclical and value rotation on the back of the Democrats’ surprise victory in the Georgia U.S. Senate runoff elections. Inflation fears and renewed concerns over variants of the coronavirus did little to slow the market down during the second quarter of 2021, as the S&P 500® Index2 and Nasdaq3 both breached all-time highs. Second quarter reported earnings were even stronger than the first quarter, with the blended growth rate for earnings in the S&P 500® Index at 88%, which was the highest year-over-
year growth since fourth quarter of 2009. In aggregate, companies were reporting earnings 17.1% ahead of consensus in the second quarter, the fourth highest on record, and revenues 4.9% ahead of consensus, the highest on record.
Risk assets continued to perform well into the third quarter, boosted by the reopening of the economy and strong corporate earnings. However, U.S. markets were met with increasing headwinds toward the latter half of the quarter, which included the increased spread of the Delta variant, rising concerns over supply chain issues and input price pressures on corporate earnings. Inflation become a headline concern as the market saw inflation prints rising year-over-year its fastest pace since 2008. Uncertainty around the U.S. Federal Reserve (the “Fed”) tapering presented additional headwinds to the market. Toward the end of the third quarter, the Fed indicated that a reduction in its $120 billion per month asset-purchase plan might soon be warranted. U.S. markets were also affected by negative headlines overseas, most notably China’s regulatory crackdown of the private education and technology sectors and broad worries about a default by Chinese real estate developer Evergrande. These headwinds culminated in a volatile September, with all major U.S. indices finishing in negative territory. Specifically, the S&P 500® Index snapped a streak of seven consecutive months of positive returns and had its worst performing month since March 2020.
Markets remained resilient to start the fourth quarter amid strong consumer demand, underpinned by robust corporate and consumer balance sheets, which helped keep operating leverage and margins elevated for corporations, despite
17
increased supply chain and input price pressures. However, the Friday following Thanksgiving in the U.S. saw a big market selloff with all the major indices down over 2% on concerns that the emergence of the new Omicron variant could derail the last bout of economic normalization. This added to continued concerns around the shift in the transient versus persistent inflation debate.
Consistent with the Fund’s strategy, the Fund maintained exposure to a variety of fixed income sectors in addition to the investment-grade corporate and government-related securities that are predominantly represented in the Fund’s benchmark. We believe this approach provides portfolio diversification and allows for the flexibility to take advantage of relative value opportunities across sectors.
The largest contributor to the Fund over the period was an allocation to commercial mortgage-backed securities (CMBS). We believe the asset class offers attractive carry and has benefitted from strong economic growth, a reopening of the US economy, and accommodative monetary and fiscal policies. Specifically, performance was driven by exposures to floating rate single-asset, single-borrower deals with high quality tenants in strong geographic areas.
Security selection within investment grade corporate bonds was another main contributor to relative performance over the period. More specifically, security selection within the energy and financial industries drove positive performance. The Financials sector continues to be a notable overweight in the portfolio, as we favor the industry given what we believe to be strong management teams and healthy balance sheets. We also believe that the
energy industry has focused heavily on capital discipline and ESG factors and, thus, we have found idiosyncratic issues with relatively strong performance.
The Fund’s allocation to asset-backed securities (ABS) also contributed to performance. The Fund’s ABS allocation is comprised of high-quality bonds, mainly collateralized by consumer and auto loans. We are constructive on the asset class, as the U.S. consumer balance sheet remains healthy and wage pressure and a tight labor market should bode well for middle-income consumers, thereby creating a positive tailwind for ABS credit fundamentals. Additionally, investor appetite remains strong as investors seek high quality assets with additional carry over U.S. Treasuries.
A modest allocation to cash and cash equivalents, which provides a source of liquidity in the portfolio, acted as a drag on the Fund’s positive performance during the period.
Lord Abbett Short Duration Income Fund
For the fiscal year ended November 30, 2021, the Fund returned 1.40%, reflecting performance at the net asset value (“NAV”) of Class A shares with all distributions reinvested, compared to its benchmark, the ICE BofA 1-3 Year U.S. Corporate Index,17 which returned 0.27% over the same period.
The twelve-month period ending November 30, 2021 was primarily a story of the dramatic economic and market recovery that occurred within the U.S. Despite the persistent presence of COVID-19, U.S. Risk assets largely outperformed their higher quality counterparts over the period. U.S. Treasuries9 returned -2.05% amid rising
18
yields across all maturities; investment grade corporate bonds10 returned -0.53% as spreads remained rangebound at near all-time tight levels throughout the period.
Conversely, high yield bonds11 and leveraged loans12 returned 5.38% and 6.12%, respectively, over the period. Within high yield, lower quality segments of the market outperformed higher quality tiers. The strong market performance was mainly attributed to vaccine approvals and a bipartisan compromise on a fifth pandemic relief package. Additionally, the U.S. Federal Reserve (“Fed”) cleared banks to resume share buybacks in the first quarter of 2021, subject to a limit, after the industry fared well in the second round of stress tests; which was a notable development considering the industry had mostly struggled throughout 2020.
To start the new year, various factors impacted markets, although the longstanding bullish narrative surrounding stimulus and vaccine optimism remained largely intact. Momentum continued behind the pro-cyclical and value rotation on the back of the Democrats’ surprise victory in the Georgia U.S. Senate runoff elections. Inflation fears and renewed concerns over variants of the coronavirus did little to slow the market down during the second quarter of 2021, as the S&P 5002 Index and Nasdaq3 both breached all-time highs. Second quarter reported earnings were even stronger than the first quarter, with the blended growth rate for the S&P 500® Index at 88%, which was the highest year-over-year growth since fourth quarter of 2009. In aggregate, companies were reporting earnings 17.1% ahead of consensus in the second quarter, the fourth highest on record, and revenues 4.9% ahead of consensus, the highest on record.
The bullish narrative continued into the start of the third quarter. For most of July and August, investor focus was largely centered around themes, such as a central bank liquidity tailwind, continued vaccine progress, upside in corporate earnings surprises, and reopening momentum. However, U.S. markets were met with increasing headwinds toward the latter half of the quarter, which included the increased spread of the Delta variant, rising concerns over supply chain and input price pressures on corporate earnings. This was reflected by consumer prices rising 5.4% year-over-year, in both June and July (the fastest pace since August 2008). Inflation maintained its record pace in August as consumer prices rose 5.3% year-over-year, albeit below economist expectations for the month. Uncertainty around the Fed tapering presented additional headwinds to the market. Toward the end of the third quarter, the Fed indicated that a reduction in its $120 billion per month asset-purchase plan might soon be warranted. U.S. markets were also affected by negative headlines overseas, most notably China’s regulatory crackdown of the private education and technology sectors and broad worries about a default by Chinese real estate developer Evergrande. These headwinds culminated in a volatile September, with all major U.S. indices finishing in negative territory. Specifically, the S&P 500® Index snapped a streak of seven consecutive months of positive returns and had its worst performing month since March 2020.
Markets remained resilient to start the fourth quarter amid strong consumer demand, underpinned by robust corporate and consumer balance sheets, which helped keep operating leverage and margins elevated for corporations, despite
19
increased supply chain and input price pressures. However, the Friday following Thanksgiving in the U.S. saw a big market selloff with all the major indexes down over 2% on concerns that the emergence of the new Omicron variant could derail the last bout of economic normalization traction. This added to continued concerns around the shift in the transient versus persistent inflation debate.
Consistent with the Fund’s strategy, the Fund continues to maintain exposure to a variety of bond market sectors in addition to the investment grade corporate bonds represented in the benchmark. This provides portfolio diversification and allows for the flexibility to pursue relative value opportunities across sectors.
The Fund’s allocation to short-term, high yield corporate bonds was the largest contributor to relative performance over the period. High yield as an asset class posted strong positive returns over the period as the market continued to rally on vaccine distributions and the re-opening of the economy. The low duration high yield corporate bond allocation, though modest relative to the predominantly investment grade portfolio, continues to be a key driver of alpha in the Fund.
The Fund’s allocation to commercial mortgage-backed securities (CMBS) also contributed to performance. We believe the asset class offers attractive carry and has been supported by economic growth and a supportive federal government. Specifically, performance was driven by floating rate single-asset, single-borrower deals with high quality tenants in strong geographic areas.
Security selection within investment grade corporate bonds was another main contributor to relative performance over the period. Specifically, selection within the
energy and financial industries drove positive performance. The Financials sector continues to be a notable overweight in the portfolio, as we favor the industry given what we believe to be strong management teams and healthy balance sheets. We also believe that the energy industry has focused heavily on capital discipline and ESG factors, thus, we have found idiosyncratic issues with relatively strong performance.
The single detractor from performance over the period was a modest allocation to short-term U.S. Treasuries. Short-term Treasury yields rose over the period, acting as headwind to Treasury bond prices.
Lord Abbett Total Return Fund
For the fiscal year ended November 30, 2021, the Fund returned 0.68%, reflecting performance at the net asset value (“NAV”) of Class A shares with all distributions reinvested, compared to its benchmark, the Bloomberg U.S. Aggregate Bond Index,8 which returned -1.15%.
The twelve-month period ending November 30, 2021 was primarily a story of the dramatic economic and market recovery that occurred within the U.S. Despite the persistent presence of COVID-19, U.S. risk assets largely outperformed their higher quality counterparts over the period. U.S. Treasuries9 returned -2.05% amid rising yields across all maturities, while investment grade corporate bonds10 returned -0.53% as spreads remained rangebound and near all-time tight levels throughout the period.
Conversely, high yield bonds11 and leveraged loans12 returned 5.38% and 6.12%, respectively, over the period. Within high yield, lower quality segments of the
20
market outperformed higher quality tiers. The strong market performance was mainly attributed to vaccine approvals and a bipartisan compromise on a fifth pandemic relief package, leading to improving credit fundamentals and low default rates.
To start the new year, various factors impacted markets. Momentum continued behind the pro-cyclical and value rotation on the back of the Democrats’ surprise victory in the Georgia U.S. Senate runoff elections. Inflation fears and renewed concerns over variants of the coronavirus did little to slow the market down during the second quarter of 2021, as the S&P 500® Index2 and Nasdaq3 both breached all-time highs. Second quarter reported earnings were even stronger than the first quarter, with the blended growth rate for earnings in the S&P 500® Index at 88%, which was the highest year-over-year growth since fourth quarter of 2009. In aggregate, companies were reporting earnings 17.1% ahead of consensus in the second quarter, the fourth highest on record, and revenues 4.9% ahead of consensus, the highest on record.
Risk assets continued to perform well into the third quarter, boosted by the reopening of the economy and strong corporate earnings. However, U.S. markets were met with increasing headwinds toward the latter half of the quarter, which included the increased spread of the Delta variant, rising concerns over supply chain issues and input price pressures on corporate earnings. This was reflected by consumer prices rising materially over the period. Uncertainty around the U.S. Federal Reserve (the “Fed”) tapering presented additional headwinds to the market. Toward the end of the third quarter, the Fed indicated that a reduction in its $120 billion per month asset-purchase plan might soon
be warranted. U.S. markets were also affected by negative headlines overseas, most notably China’s regulatory crackdown of the private education and technology sectors and broad worries about a default by Chinese real estate developer Evergrande. These headwinds culminated in a volatile September, with all major U.S. indices finishing in negative territory. Specifically, the S&P 500® Index snapped a streak of seven consecutive months of positive returns and had its worst performing month since March 2020.
Markets remained resilient to start the fourth quarter amid strong consumer demand, underpinned by robust corporate and consumer balance sheets, which helped keep operating leverage and margins elevated for corporations, despite increased supply chain and input price pressures. However, the Friday following Thanksgiving in the U.S. saw a big market selloff with all the major indices down over 2% on concerns that the emergence of the new Omicron variant could derail the last bout of economic normalization. This added to continued concerns around the shift in the transient versus persistent inflation debate.
For the 12-month period ended November 30, 2021, the Fund’s allocation to high yield corporate bonds was the largest contributor to performance. Specifically, high yield allocations within the energy and consumer cyclical industries contributed to performance.
Security selection within and an overweight allocation to commercial mortgage-backed securities (CMBS) also contributed to performance over the period. Commercial real estate valuations have been driven higher by the distribution of the COVID-19 vaccine and a shift in momentum to sectors more leveraged to
21
the return of normalcy. We remain constructive on idiosyncratic single-asset / single-borrower (SASB) opportunities and are underweight agency CMBS.
Lastly, underweight allocations to agency mortgage-backed securities (MBS) and U.S. Treasuries contributed to performance. These asset classes both posted negative returns over the period as risk assets outperformed and rates rose across the curve.
Detractors included an allocation to high quality asset-backed securities (ABS) and a moderate allocation to cash and cash equivalents, as these sectors underperformed risk assets over the period.
Lord Abbett Ultra Short Bond Fund
For the fiscal year ended November 30, 2021, the Fund returned -0.03%, reflecting performance at the net asset value (“NAV”) of Class A shares with all distributions reinvested, compared to its benchmark, the ICE BofA U.S. Treasury Bill Index,18 which returned 0.05% over the same period.
The twelve-month period ending November 30, 2021 was primarily a story of the dramatic economic and market recovery that occurred within the U.S. Despite the persistent presence of COVID-19, U.S. risk assets largely outperformed their higher quality counterparts over the period. U.S. Treasuries9 returned -2.05% amid rising yields across all maturities, while investment grade corporate bonds10 returned -0.53% as spreads remained rangebound and near all-time tight levels throughout the period.
Conversely, high yield bonds11 and leveraged loans12 returned 5.38% and 6.12%, respectively, over the period. Within high yield, lower quality segments of the
market outperformed higher quality tiers. The strong market performance was mainly attributed to vaccine approvals and a bipartisan compromise on a fifth pandemic relief package, which led to improving credit fundamentals and declining default rates amid a strong economic backdrop.
To start the new year, momentum continued behind the pro-cyclical and value rotation on the back of the Democrats’ surprise victory in the Georgia U.S. Senate runoff elections. Inflation fears and renewed concerns over variants of the coronavirus did little to slow the market down during the second quarter of 2021, as the S&P 500 Index2 and Nasdaq3 both breached all-time highs. Second quarter reported earnings were even stronger than the first quarter, with the blended growth rate for earnings in the S&P 500® Index at 88%, which was the highest year-over-year growth since fourth quarter of 2009. In aggregate, companies were reporting earnings 17.1% ahead of consensus in the second quarter, the fourth highest on record, and revenues 4.9% ahead of consensus, the highest on record.
Risk assets continued to perform well into the third quarter, boosted by the reopening of the economy and strong corporate earnings. However, U.S. markets were met with increasing headwinds toward the latter half of the quarter, which included the increased spread of the Delta variant, rising concerns over supply chain issues and input price pressures on corporate earnings. Inflation become a headline concern as the market saw inflation prints rising year-over-year, its fastest pace since 2008. Uncertainty around the U.S. Federal Reserve (“Fed”) tapering presented additional headwinds to the market. Toward the end of the third
22
quarter, the Fed indicated that a reduction in its $120 billion per month asset-purchase plan might soon be warranted. U.S. markets were also affected by negative headlines overseas, most notably China’s regulatory crackdown of the private education and technology sectors and broad worries about a default by Chinese real estate developer Evergrande. These headwinds culminated in a volatile September, with all major U.S. indices finishing in negative territory. Specifically, the S&P 500® Index snapped a streak of seven consecutive months of positive returns and had its worst performing month since March 2020.
Markets remained resilient to start the fourth quarter amid strong consumer demand, underpinned by robust corporate and consumer balance sheets, which helped keep operating leverage and margins elevated for corporations, despite increased supply chain and input price pressures. However, the Friday following Thanksgiving in the U.S. saw a big market selloff with all the major indices down over 2% on concerns that the emergence of the new Omicron variant could derail the last bout of economic normalization. This added to continued concerns around the shift in the transient versus persistent inflation debate.
Consistent with the Fund’s design, the Fund maintained exposure to a variety of short maturity, investment grade bond sectors in addition to the U.S. Treasury Bills represented in the benchmark, including short-term investment grade bonds with floating and fixed rate coupons, asset-backed securities (“ABS”), commercial mortgage-backed securities (“CMBS”), and other ultra-short investment grade fixed income securities. We believe this approach
provides diversification and provides the potential for higher income and total return compared to other short term U.S. government-related securities and money market funds.
The Fund’s allocation to high quality floating rate notes was the primary contributor to relative performance. Floating rate notes presented attractive carry opportunities during the period, allowing the Fund to capture higher yield over traditional short-term U.S. Treasury Bills. The majority of this allocation was in the financials sector, which we believe largely consists of companies with strong management teams and healthy balance sheets.
Also contributing to performance were allocations to securitized sectors - mainly floating rate commercial mortgage-backed securities (CMBS) and collateralized loan obligations (CLO). High quality issues within securitized sectors performed well on the back of a healthy consumer balance sheet, the reopening of the economy, and a supportive Federal Government.
Cash and cash equivalents, short-term U.S. Treasuries, and asset-backed securities (ABS) all acted as relative drags to the portfolio’s overall performance during the period.
The Funds’ portfolios are actively managed and, therefore, holdings and the weightings of a particular issuer or particular sector as a percentage of portfolio assets are subject to change. Sectors may include many industries.
23
1 The ICE BofA All Convertibles Index contains issues that have a greater than $50 million aggregate market value. The issues are U.S. dollar-denominated, sold into the U.S. market and publicly traded in the United States.
2 The S&P 500® Index is widely regarded as the standard for measuring large cap U.S. stock market performance and includes a representative sample of leading companies in leading industries.
3 The Nasdaq Composite Index is the market capitalization-weighted index of over 2,500 common equities listed on the Nasdaq stock exchange.
4 As represented by the Russell 1000® Index as of 11/30/2021.
5 As represented by the Russell 2000® Index as of 11/30/2021.
6 As represented by the Russell 3000® Growth Index as of 11/30/2021.
7 As represented by the Russell 3000® Value Index as of 11/30/2021.
8 The Bloomberg U.S. Aggregate Bond Index represents securities that are SEC-registered, taxable, and dollar denominated. The index covers the U.S. investment grade fixed rate bond market, with index components for government and corporate securities, mortgage pass-through securities, and asset-backed securities. Total return comprises price appreciation/depreciation and income as a percentage of the original investment.
9 As represented by the U.S. Treasury component of the Bloomberg U.S. Government Index as of 11/30/2021
10 As represented by the Bloomberg US Corporate Investment Grade Index as of 11/30/2021. The Bloomberg U.S. Corporate Investment Grade Index is the corporate component of the U.S. Credit index. The U.S. Credit index is defined as publicly issued U.S. corporate and specified foreign debentures and secured notes that meet the specified maturity, liquidity, and quality requirements. To qualify, bonds must be SEC-registered. The index includes both corporate and non-corporate sectors. Bonds must be an investment grade credit security and have at least $250 million par amount outstanding.
11 As represented by the ICE BofA U.S. High Yield Constrained Index as of 11/30/2021. The ICE BofA U.S. High Yield Constrained Index is a capitalization weighted index of all U.S. dollar denominated below
investment grade corporate debt publicly issued in the U.S. domestic market.
12 As represented by the Credit Suisse Leveraged Loan Index as of 11/30/2021. The Credit Suisse Leveraged Loan Index is designed to mirror the investable universe of the U.S. dollar-denominated leveraged loan market. The Credit Suisse Leveraged Loan Index, which includes reinvested dividends, has been taken from published sources.
13 The ICE BofA U.S. Corporate Index tracks the performance of U.S. dollar-denominated investment-grade corporate debt publicly issued in the U.S. domestic market. Qualifying securities must have an investment-grade rating (based on an average of Moody’s, S&P and Fitch) and an investment-grade rated country of risk (based on an average of Moody’s, S&P and Fitch foreign currency long term sovereign debt ratings).
14 The Dow Jones Industrial Average® Index is a price-weighted measure of 30 U.S. blue-chip companies. The index covers all industries except transportation and utilities.
15 The Bloomberg U.S. 1-5 Year TIPS Index (also known as 1-5 Year U.S. Inflation-Linked Treasury Index) is an unmanaged index comprised of U.S. Treasury Inflation Protected Securities with at least $1 billion in outstanding face value and a remaining term to final maturity of at least one year and less than five years.
16 The Bloomberg 1-3 Year U.S. Government/Credit Bond Index is an unmanaged index that is designed to represent a combination of the Government Bond Index and the Corporate Bond Index and includes U.S. government Treasury and agency securities, corporate bonds, and Yankee bonds.
17 The ICE BofA U.S. Corporate 1-3 Year Index is an unmanaged index comprised of U.S. dollar-denominated investment grade corporate debt securities publicly issued in the U.S. domestic market with between one and three years remaining to final maturity.
18 The ICE BofA U.S. Treasury Bill Index tracks the performance of U.S. dollar denominated sovereign debt publicly issued by the US government in its domestic market. Qualifying securities must have at least one year remaining term to final maturity, a fixed coupon schedule and a minimum amount outstanding of $1 billion.
24
19 The Bloomberg U.S. Credit Bond Index is the U.S. Credit component of the U.S. Government/Credit Index. The index includes publicly issued U.S. corporate and specified foreign debentures and secured notes that meet the specified maturity, liquidity, and quality requirements. To qualify, bonds must be SEC-registered. The index includes both corporate and non-corporate sectors. The corporate sectors are Industrial, Utility, and Finance, which include both U.S. and non-U.S. corporations. The non-corporate sectors are Sovereign, Supranational, Foreign Agency, and Foreign Local Government. All returns are market value-weighted inclusive of accrued interest.
Unless otherwise specified, indexes reflect total return, with all dividends reinvested. Indexes are unmanaged, do not reflect the deduction of fees or expenses, and are not available for direct investment.
Important Performance and Other Information
Performance data quoted in the following pages reflect past performance and are no guarantee of future results. Current performance may be higher or lower than the performance quoted. The investment return and principal value of an investment in the Funds will fluctuate so that shares, on any given day or when redeemed, may be worth more or less than their original cost. You can obtain performance data current to the most recent month end by calling Lord Abbett at 888-522-2388 or referring to www.lordabbett.com.
Except where noted, comparative Fund performance does not account for the deduction of sales charges and would be different if sales charges were included. Each Fund offers classes of shares with distinct pricing options. For a full description of the differences in pricing alternatives, please see each Fund’s prospectus.
During certain periods shown, expense waivers and reimbursements were in place. Without such waivers and expense reimbursements, the Funds’ returns would have been lower.
The annual commentary above discusses the views of the Funds’ management and various portfolio holdings of the Funds as of November 30, 2021. These views and portfolio holdings may have changed after this date. Information provided in the commentary is not a recommendation to buy or sell securities. Because the Funds’ portfolios are actively managed and may change significantly, the Funds may no longer own the securities described above or may have otherwise changed their positions in the securities. For more recent information about the Funds’ portfolio holdings, please visit www.lordabbett.com.
A Note about Risk: See Notes to Financial Statements for a discussion of investment risks. For a more detailed discussion of the risks associated with each Fund, please see each Fund’s prospectus.
Mutual funds are not insured by the FDIC, are not deposits or other obligations of, or guaranteed by, banks, and are subject to investment risks including possible loss of principal amount invested.
25
Convertible Fund
Below is a comparison of a $10,000 investment in Class A shares with the same investment in the ICE BofA All U.S. Convertibles Index, assuming reinvestment of all dividends and distributions. The performance of the other classes will be greater than or less than the performance shown in the graph below due to different sales loads and expenses applicable to such classes. The graph and performance table below do not reflect the deduction of taxes that a shareholder would pay on Fund distributions or the redemption of Fund shares. During certain periods, expenses of the Fund have been waived or reimbursed by Lord Abbett; without such waiver or reimbursement of expenses, the Fund’s returns would have been lower. Past performance is no guarantee of future results.
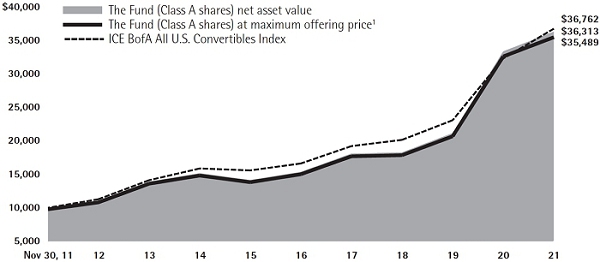
| Average Annual Total Returns at Maximum Applicable Sales Charge for the Periods Ended November 30, 2021 | |||||||||
| 1 Year | 5 Years | 10 Years | Life of Class | ||||||
| Class A3 | 6.39% | 18.23% | 13.50% | – | |||||
| Class C4 | 7.14% | 18.03% | 13.04% | – | |||||
| Class F5 | 8.98% | 18.90% | 13.88% | – | |||||
| Class F36 | 9.18% | – | – | 18.78% | |||||
| Class I5 | 9.02% | 19.01% | 13.99% | – | |||||
| Class P5 | 8.57% | 18.49% | 13.51% | – | |||||
| Class R25 | 8.43% | 18.33% | 13.31% | – | |||||
| Class R35 | 8.52% | 18.44% | 13.43% | – | |||||
| Class R47 | 8.80% | 18.74% | – | 14.37% | |||||
| Class R57 | 9.08% | 19.03% | – | 14.66% | |||||
| Class R67 | 9.12% | 19.07% | – | 14.70% | |||||
26
1 Reflects the deduction of the maximum initial sales charge of 2.25%.
2 Performance for the unmanaged index does not reflect any fees or expenses. The performance of the index is not necessarily representative of the Fund’s performance.
3 Total return, which is the percentage change in net asset value, after deduction of the maximum initial sales charge of 2.25% applicable to Class A shares, with all dividends and distributions reinvested for the periods shown ended November 30, 2021, is calculated using the SEC-required uniform method to compute such return.
4 The 1% CDSC for Class C shares normally applies before the first anniversary of the purchase date. Performance for other periods is at net asset value.
5 Performance is at net asset value.
6 Commenced operations and performance for the Class began on April 4, 2017. Performance is at net asset value.
7 Commenced operations and performance for the Class began on June 30, 2015. Performance is at net asset value.
27
Core Fixed Income Fund
Investment Comparison
Below is a comparison of a $10,000 investment in Class A shares with the same investment in the Bloomberg U.S. Aggregate Bond Index, assuming reinvestment of all dividends and distributions. The performance of the other classes will be greater than or less than the performance shown in the graph below due to different sales loads and expenses applicable to such classes. The graph and performance table below do not reflect the deduction of taxes that a shareholder would pay on Fund distributions or the redemption of Fund shares. During certain periods, expenses of the Fund have been waived or reimbursed by Lord Abbett; without such waiver or reimbursement of expenses, the Fund’s returns would have been lower. Past performance is no guarantee of future results.
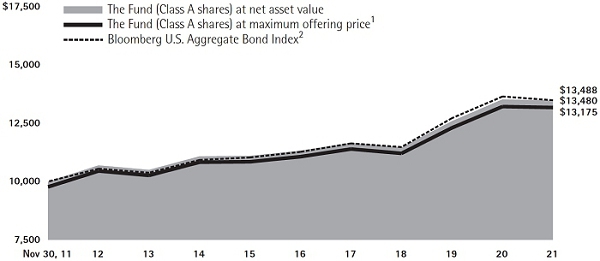
| Average Annual Total Returns at Maximum Applicable Sales Charge for the Periods Ended November 30, 2021 | |||||||||
| 1 Year | 5 Years | 10 Years | Life of Class | ||||||
| Class A3 | –2.55% | 3.08% | 2.80% | – | |||||
| Class C4 | –1.91% | 2.89% | 2.38% | – | |||||
| Class F5 | –0.21% | 3.63% | 3.13% | – | |||||
| Class F36 | –0.12% | – | – | 3.82% | |||||
| Class I5 | –0.07% | 3.76% | 3.25% | – | |||||
| Class R25 | –0.70% | 3.14% | 2.62% | – | |||||
| Class R35 | –0.60% | 3.24% | 2.73% | – | |||||
| Class R47 | –0.36% | 3.48% | – | 3.07% | |||||
| Class R57 | –0.10% | 3.76% | – | 3.35% | |||||
| Class R67 | –0.03% | 3.82% | – | 3.42% | |||||
28
1 Reflects the deduction of the maximum initial sales charge of 2.25%.
2 Performance for the unmanaged index does not reflect any fees or expenses. The performance of the index is not necessarily representative of the Fund’s performance.
3 Total return, which is the percentage change in net asset value, after deduction of the maximum initial sales charge of 2.25% applicable to Class A shares, with all dividends and distributions reinvested for the periods shown ended November 30, 2021, is calculated using the SEC-required uniform method to compute such return.
4 The 1% CDSC for Class C shares normally applies before the first anniversary of the purchase date. Performance for other periods is at net asset value.
5 Performance is at net asset value.
6 Commenced operations and performance for the Class began on April 4, 2017. Performance is at net asset value.
7 Commenced operations and performance for the Class began on June 30, 2015. Performance is at net asset value.
29
Core Plus Bond Fund
Investment Comparison
Below is a comparison of a $10,000 investment in Class A shares with the same investment in the Bloomberg U.S. Aggregate Bond Index, assuming reinvestment of all dividends and distributions. The performance of the other classes will be greater than or less than the performance shown in the graph below due to different sales loads and expenses applicable to such classes. The graph and performance table below do not reflect the deduction of taxes that a shareholder would pay on Fund distributions or the redemption of Fund shares. During certain periods, expenses of the Fund have been waived or reimbursed by Lord Abbett; without such waiver or reimbursement of expenses, the Fund’s returns would have been lower. Past performance is no guarantee of future results.

| Average Annual Total Returns at Maximum Applicable Sales Charge for the Periods Ended November 30, 2021 |
| 1 Year | 5 Years | Life of Class | |||||
| Class A3 | –1.03% | 3.79% | 3.93% | ||||
| Class C4 | –0.40% | 3.56% | 3.61% | ||||
| Class F5 | 1.32% | 4.34% | 4.40% | ||||
| Class F36 | 1.51% | – | 4.37% | ||||
| Class I5 | 1.42% | 4.47% | 4.52% | ||||
| Class R35 | 0.93% | 3.96% | 4.01% | ||||
| Class R45 | 1.18% | 4.21% | 4.27% | ||||
| Class R55 | 1.49% | 4.48% | 4.54% | ||||
| Class R65 | 1.53% | 4.55% | 4.62% |
30
1 Reflects the deduction of the maximum initial sales charge of 2.25%.
2 Performance for the unmanaged index does not reflect any fees or expenses. The performance of the index is not necessarily representative of the Fund’s performance.
3 Commenced operations on December 2, 2015 and performance for the Class began on December 8, 2015. Total return, which is the percentage change in net asset value, after deduction of the maximum initial sales charge of 2.25% applicable to Class A shares, with all dividends and distributions reinvested for the period shown ended November 30, 2021, is calculated using the SEC-required uniform method to compute such return.
4 Commenced operations on December 2, 2015 and performance for the Class began on December 8, 2015. The 1% CDSC for Class C shares normally applies before the first anniversary of the purchase date.
5 Commenced operations on December 2, 2015 and performance for the Class began on December 8, 2015. Performance is at net asset value.
6 Commenced operations and performance for the Class began on April 4, 2017. Performance is at net asset value.
31
Corporate Bond Fund
Investment Comparison
Below is a comparison of a $10,000 investment in Class A shares with the same investment in the Bloomberg U.S. Corporate Investment Grade Index, assuming reinvestment of all dividends and distributions. The performance of the other classes will be greater than or less than the performance shown in the graph below due to different sales loads and expenses applicable to such classes. The graph and performance table below do not reflect the deduction of taxes that a shareholder would pay on Fund distributions or the redemption of Fund shares. During certain periods, expenses of the Fund have been waived or reimbursed by Lord Abbett; without such waiver or reimbursement of expenses, the Fund’s returns would have been lower. Past performance is no guarantee of future results.
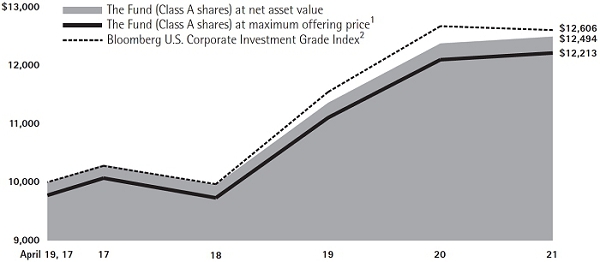
| Average Annual Total Returns at Maximum Applicable Sales Charge for the Periods Ended November 30, 2021 |
| 1 Year | Life of Class | ||||
| Class A3 | –1.34% | 4.43% | |||
| Class C4 | –0.67% | 4.20% | |||
| Class F5 | 1.06% | 5.06% | |||
| Class F35 | 1.20% | 5.22% | |||
| Class I5 | 1.16% | 5.13% | |||
| Class R25 | 0.65% | 4.53% | |||
| Class R35 | 0.65% | 4.61% | |||
| Class R45 | 0.91% | 4.89% | |||
| Class R55 | 1.16% | 5.15% | |||
| Class R65 | 1.20% | 5.22% |
32
1 Reflects the deduction of the maximum initial sales charge of 2.25%.
2 Performance for the unmanaged index does not reflect any fees or expenses. The performance of the index is not necessarily representative of the Fund’s performance.
3 Commenced operations and performance for the Class began on April 19, 2017. Total return, which is the percentage change in net asset value, after deduction of the maximum initial sales charge of 2.25% applicable to Class A shares, with all dividends and distributions reinvested for the period
shown ended November 30, 2021, is calculated using the SEC-required uniform method to compute such return.
4 Commenced operations and performance for the Class began on April 19, 2017. The 1% CDSC for Class C shares normally applies before the first anniversary of the purchase date.
5 Commenced operations and performance for the Class began on April 19, 2017. Performance is at net asset value.
33
Floating Rate Fund
Investment Comparison
Below is a comparison of a $10,000 investment in Class A shares with the same investment in the Credit Suisse Leveraged Loan Index, assuming reinvestment of all dividends and distributions. The performance of the other classes will be greater than or less than the performance shown in the graph below due to different sales loads and expenses applicable to such classes. The graph and performance table below do not reflect the deduction of taxes that a shareholder would pay on Fund distributions or the redemption of Fund shares. During certain periods, expenses of the Fund have been waived or reimbursed by Lord Abbett; without such waiver or reimbursement of expenses, the Fund’s returns would have been lower. Past performance is no guarantee of future results.
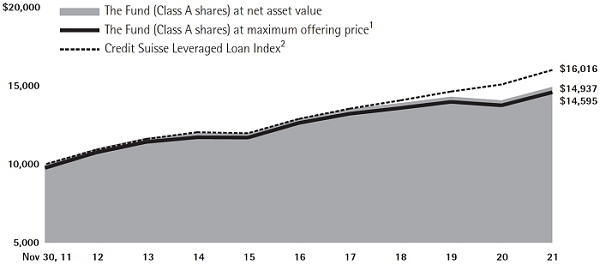
| Average Annual Total Returns at Maximum Applicable Sales Charge for the Periods Ended November 30, 2021 | |||||||||
| 1 Year | 5 Years | 10 Years | Life of Class | ||||||
| Class A3 | 3.67% | 2.46% | 3.85% | – | |||||
| Class C4 | 4.42% | 2.28% | 3.43% | – | |||||
| Class F5 | 6.17% | 3.02% | 4.19% | – | |||||
| Class F36 | 6.34% | – | – | 2.95% | |||||
| Class I5 | 6.28% | 3.12% | 4.30% | – | |||||
| Class R25 | 5.78% | 2.52% | 3.69% | – | |||||
| Class R35 | 5.76% | 2.62% | 3.79% | – | |||||
| Class R47 | 6.02% | 2.87% | – | 3.18% | |||||
| Class R57 | 6.28% | 3.14% | – | 3.44% | |||||
| Class R67 | 6.48% | 3.19% | – | 3.49% | |||||
34
1 Reflects the deduction of the maximum initial sales charge of 2.25%.
2 Performance for the unmanaged index does not reflect any fees or expenses. The performance of the index is not necessarily representative of the Fund’s performance.
3 Total return, which is the percentage change in net asset value, after deduction of the maximum initial sales charge of 2.25% applicable to Class A shares, with all dividends and distributions reinvested for the periods shown ended November 30, 2021, is calculated using the SEC–required uniform method to compute such return.
4 The 1% CDSC for Class C shares normally applies before the first anniversary of the purchase date. Performance for other periods is at net asset value.
5 Performance is at net asset value.
6 Commenced operations and performance for the Class began on April 4, 2017. Performance is at net asset value.
7 Commenced operations and performance for the Class began on June 30, 2015. Performance is at net asset value.
35
High Yield Fund
Investment Comparison
Below is a comparison of a $10,000 investment in Class A shares with the same investment in the ICE BofA U.S. High Yield Constrained Index, assuming reinvestment of all dividends and distributions. The performance of the other classes will be greater than or less than the performance shown in the graph below due to different sales loads and expenses applicable to such classes. The graph and performance table below do not reflect the deduction of taxes that a shareholder would pay on Fund distributions or the redemption of Fund shares. During certain periods, expenses of the Fund have been waived or reimbursed by Lord Abbett; without such waiver or reimbursement of expenses, the Fund’s returns would have been lower. Past performance is no guarantee of future results.
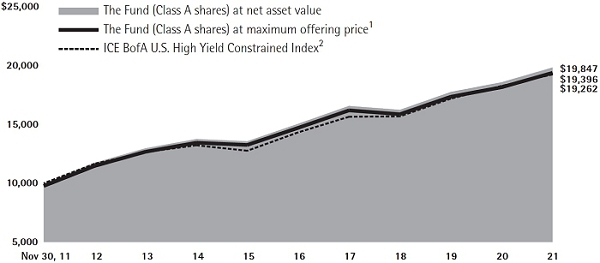
| Average Annual Total Returns at Maximum Applicable Sales Charge for the Periods Ended November 30, 2021 | |||||||||
| 1 Year | 5 Years | 10 Years | Life of Class | ||||||
| Class A3 | 4.31% | 5.20% | 6.85% | – | |||||
| Class C4 | 4.94% | 4.98% | 6.40% | – | |||||
| Class F5 | 6.70% | 5.75% | 7.18% | – | |||||
| Class F36 | 6.90% | – | – | 5.33% | |||||
| Class I5 | 6.80% | 5.86% | 7.30% | – | |||||
| Class P5 | 6.46% | 5.43% | 6.84% | – | |||||
| Class R25 | 6.17% | 5.24% | 6.66% | – | |||||
| Class R35 | 6.27% | 5.34% | 6.77% | – | |||||
| Class R47 | 6.69% | 5.64% | – | 5.46% | |||||
| Class R57 | 6.95% | 5.90% | – | 5.72% | |||||
| Class R67 | 6.90% | 5.96% | – | 5.81% | |||||
36
1 Reflects the deduction of the maximum initial sales charge of 2.25%.
2 Performance for the unmanaged index does not reflect any fees or expenses. The performance of the index is not necessarily representative of the Fund’s performance.
3 Total return, which is the percentage change in net asset value, after deduction of the maximum initial sales charge of 2.25% applicable to Class A shares, with all dividends and distributions reinvested for the periods shown ended November 30, 2021, is calculated using the SEC-required uniform method to compute such return.
4 The 1% CDSC for Class C shares normally applies before the first anniversary of the purchase date. Performance for other periods is at net asset value.
5 Performance is at net asset value.
6 Commenced operations and performance for the Class began on April 4, 2017. Performance is at net asset value.
7 Commenced operations and performance for the Class began on June 30, 2015. Performance is at net asset value.
37
Income Fund
Investment Comparison
Below is a comparison of a $10,000 investment in Class A shares with the same investment in the Bloomberg U.S. Credit Bond Index, the Bloomberg Baa Corporate Bond Index and the Bloomberg U.S. Aggregate Bond Index, assuming reinvestment of all dividends and distributions. The performance of the other classes will be greater than or less than the performance shown in the graph below due to different sales loads and expenses applicable to such classes. The graph and performance table below do not reflect the deduction of taxes that a shareholder would pay on Fund distributions or the redemption of Fund shares. During certain periods, expenses of the Fund have been waived or reimbursed by Lord Abbett; without such waiver or reimbursement of expenses, the Fund’s returns would have been lower. Past performance is no guarantee of future results.
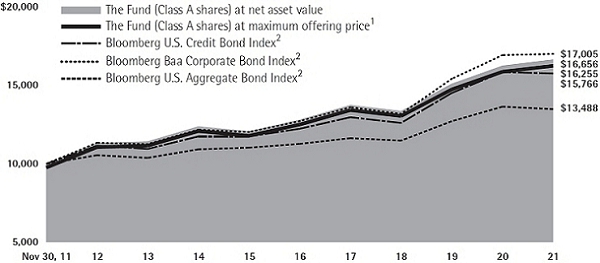
| Average Annual Total Returns at Maximum Applicable Sales Charge for the Periods Ended November 30, 2021 | |||||||||
| 1 Year | 5 Years | 10 Years | Life of Class | ||||||
| Class A3 | 0.05% | 4.93% | 4.98% | – | |||||
| Class C4 | 0.75% | 4.65% | 4.56% | – | |||||
| Class F5 | 2.48% | 5.48% | 5.33% | – | |||||
| Class F36 | 2.66% | – | – | 5.32% | |||||
| Class I5 | 2.58% | 5.59% | 5.44% | – | |||||
| Class R25 | 1.98% | 4.88% | 4.81% | – | |||||
| Class R35 | 2.08% | 5.07% | 4.92% | – | |||||
| Class R47 | 2.33% | 5.26% | – | 4.79% | |||||
| Class R57 | 2.59% | 5.60% | – | 5.06% | |||||
| Class R67 | 2.67% | 5.69% | – | 5.15% | |||||
38
1 Reflects the deduction of the maximum initial sales charge of 2.25%.
2 Performance for each unmanaged index does not reflect any fees or expenses. The performance of each index is not necessarily representative of the Fund’s performance.
3 Total return, which is the percentage change in net asset value, after deduction of the maximum initial sales charge of 2.25% applicable to Class A shares, with all dividends and distributions reinvested for the periods shown ended November 30, 2021, is calculated using the SEC-required uniform method to compute such return.
4 The 1% CDSC for Class C shares normally applies before the first anniversary of the purchase date. Performance for other periods is at net asset value.
5 Performance is at net asset value.
6 Commenced operations and performance for the Class began on April 4, 2017. Performance is at net asset value.
7 Commenced operations and performance for the Class began on June 30, 2015. Performance is at net asset value.
39
Inflation Focused Fund
Investment Comparison
Below is a comparison of a $10,000 investment in Class A shares to the same investment in the Bloomberg U.S. 1–5 Year TIPS Index, the Consumer Price Index for All Urban Consumers (“CPI-U”) and the ICE BofA 1–3 Year U.S. Corporate Index, assuming reinvestment of all dividends and distributions. The performance of the other classes will be greater than or less than the performance shown in the graph below due to different sales loads and expenses applicable to such classes. The graph and performance table below do not reflect the deduction of taxes that a shareholder would pay on Fund distributions or the redemption of Fund shares. During certain periods, expenses of the Fund have been waived or reimbursed by Lord Abbett; without such waiver or reimbursement of expenses, the Fund’s returns would have been lower. Past performance is no guarantee of future results.
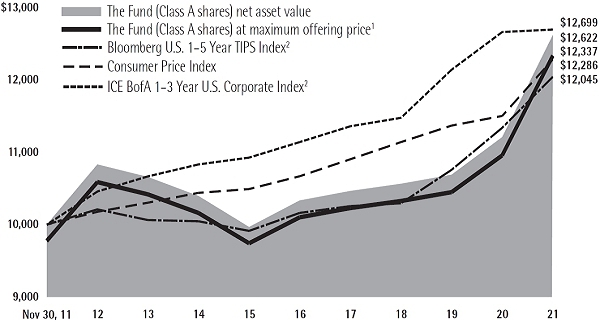
| Average Annual Total Returns at Maximum Applicable Sales Charge for the Periods Ended November 30, 2021 | |||||||||
| 1 Year | 5 Years | 10 Years | Life of Class | ||||||
| Class A3 | 10.07% | 3.61% | 2.12% | – | |||||
| Class C4 | 10.85% | 3.42% | 1.68% | – | |||||
| Class F5 | 12.68% | 4.19% | 2.46% | – | |||||
| Class F36 | 12.86% | – | – | 4.44% | |||||
| Class I5 | 12.73% | 4.27% | 2.57% | – | |||||
| Class R25 | 11.96% | 3.60% | 1.97% | – | |||||
| Class R35 | 12.17% | 3.78% | 2.09% | – | |||||
| Class R47 | 12.46% | 4.04% | – | 3.21% | |||||
| Class R57 | 12.75% | 4.28% | – | 3.46% | |||||
| Class R67 | 12.71% | 4.38% | – | 3.57% | |||||
40
1 Reflects the deduction of the maximum initial sales charge of 2.25%.
2 Performance for the unmanaged index does not reflect any fees or expenses. The performance of the index is not necessarily representative of the Fund’s performance.
3 Commenced operations on April 20, 2011. Performance for the Class began April 29, 2011. Total return, which is the percent change in value, after deduction of the maximum initial sales charge of 2.25% applicable to Class A shares, with all dividends and distributions reinvested for period shown ended November 30, 2021, is calculated using the SEC required uniform method to compute such return.
4 Commenced operations on April 20, 2011. The 1% CDSC for Class C shares normally applies before the first anniversary of the purchase date. Performance for the Class began April 29, 2011. Performance for other periods is at net asset value.
5 Commenced operations on April 20, 2011. Performance for the Class began April 29, 2011. Performance is at net asset value.
6 Commenced operations and performance for the Class began on April 4, 2017. Performance is at net asset value.
7 Commenced operations and performance for the Class began on June 30, 2015. Performance is at net asset value.
41
Short Duration Core Bond Fund
Investment Comparison
Below is a comparison of a $10,000 investment in Class A shares with the same investment in the Bloomberg 1-3 Year U.S. Government/Credit Bond Index, assuming reinvestment of all dividends and distributions. The performance of the other classes will be greater than or less than the performance shown in the graph below due to different sales loads and expenses applicable to such classes. The graph and performance table below do not reflect the deduction of taxes that a shareholder would pay on Fund distributions or the redemption of Fund shares. During certain periods, expenses of the Fund have been waived or reimbursed by Lord Abbett; without such waiver or reimbursement of expenses, the Fund’s returns would have been lower. Past performance is no guarantee of future results.
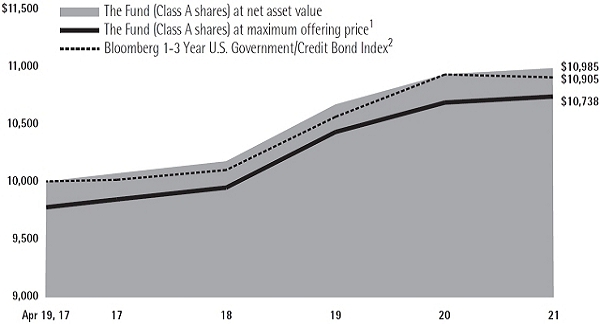
| Average Annual Total Returns at Maximum Applicable Sales Charge for the Periods Ended November 30, 2021 |
| 1 Year | Life of Class | ||||
| Class A3 | –1.78% | 1.55% | |||
| Class C4 | –1.28% | 1.31% | |||
| Class F5 | 0.48% | 2.13% | |||
| Class F35 | 0.80% | 2.33% | |||
| Class I5 | 0.68% | 2.26% | |||
| Class R35 | 0.09% | 1.74% | |||
| Class R45 | 0.44% | 2.01% | |||
| Class R55 | 0.68% | 2.26% | |||
| Class R65 | 0.65% | 2.32% |
42
1 Reflects the deduction of the maximum initial sales charge of 2.25%.
2 Performance for the unmanaged index does not reflect any fees or expenses. The performance of the index is not necessarily representative of the Fund’s performance.
3 Commenced operations and performance for the Class began on April 19, 2017. Total return, which is the percentage change in net asset value, after deduction of the maximum initial sales charge of 2.25% applicable to Class A shares, with all dividends and distributions reinvested for the period
shown ended November 30, 2021, is calculated using the SEC-required uniform method to compute such return.
4 Commenced operations and performance for the Class began on April 19, 2017. The 1% CDSC for Class C shares normally applies before the first anniversary of the purchase date.
5 Commenced operations and performance for the Class began on April 19, 2017. Performance is at net asset value.
43
Short Duration Income Fund
Investment Comparison
Below is a comparison of a $10,000 investment in Class A shares with the same investment in the ICE BofA 1–3 Year U.S. Corporate Index, assuming reinvestment of all dividends and distributions. The performance of the other classes will be greater than or less than the performance shown in the graph below due to different sales loads and expenses applicable to such classes. The graph and performance table below do not reflect the deduction of taxes that a shareholder would pay on Fund distributions or the redemption of Fund shares. During certain periods, expenses of the Fund have been waived or reimbursed by Lord Abbett; without such waiver or reimbursement of expenses, the Fund’s returns would have been lower. Past performance is no guarantee of future results.

| Average Annual Total Returns at Maximum Applicable Sales Charge for the Periods Ended November 30, 2021 | |||||||||
| 1 Year | 5 Years | 10 Years | Life of Class | ||||||
| Class A3 | –0.95% | 2.15% | 2.55% | – | |||||
| Class C4 | 0.00% | 1.98% | 2.13% | – | |||||
| Class F5 | 1.74% | 2.72% | 2.89% | – | |||||
| Class F36 | 1.91% | – | – | 2.90% | |||||
| Class I5 | 1.85% | 2.82% | 2.99% | – | |||||
| Class R25 | 1.00% | 2.21% | 2.37% | – | |||||
| Class R35 | 1.10% | 2.32% | 2.47% | – | |||||
| Class R47 | 1.67% | 2.59% | – | 2.45% | |||||
| Class R57 | 1.67% | 2.84% | – | 2.66% | |||||
| Class R67 | 1.91% | 2.89% | – | 2.75% | |||||
44
1 Reflects the deduction of the maximum initial sales charge of 2.25%.
2 Performance of the unmanaged index does not reflect any fees or expenses. The performance of the index is not necessarily representative of the Fund’s performance.
3 Total return, which is the percentage change in net asset value, after deduction of the maximum initial sales charge of 2.25% applicable to Class A shares, with all dividends and distributions reinvested for the periods shown ended November 30, 2021, is calculated using the SEC-required uniform method to compute such return.
4 The 1% CDSC for Class C shares normally applies before the first anniversary of the purchase date. Performance for other periods is at net asset value.
5 Performance is at net asset value.
6 Commenced operations and performance for the Class began on April 4, 2017. Performance is at net asset value.
7 Commenced operations and performance for the Class began on June 30, 2015. Performance is at net asset value.
45
Total Return Fund
Investment Comparison
Below is a comparison of a $10,000 investment in Class A shares with the same investment in the Bloomberg U.S. Aggregate Bond Index, assuming reinvestment of all dividends and distributions. The performance of the other classes will be greater than or less than performance shown in the graph below due to different sales loads and expenses applicable to such classes. The graph and performance table below do not reflect the deduction of taxes that a shareholder would pay on Fund distributions or the redemption of Fund shares. During certain periods, expenses of the Fund have been waived or reimbursed by Lord Abbett; without such waiver or reimbursement of expenses, the Fund’s returns would have been lower. Past performance is no guarantee of future results.

| Average Annual Total Returns at Maximum Applicable Sales Charge for the Periods Ended November 30, 2021 | |||||||||
| 1 Year | 5 Years | 10 Years | Life of Class | ||||||
| Class A3 | –1.58% | 3.22% | 3.27% | – | |||||
| Class C4 | –0.93% | 3.05% | 2.85% | – | |||||
| Class F5 | 0.78% | 3.79% | 3.60% | – | |||||
| Class F36 | 0.97% | – | – | 3.93% | |||||
| Class I5 | 0.92% | 3.93% | 3.72% | – | |||||
| Class P5 | 0.43% | 3.43% | 3.24% | – | |||||
| Class R25 | 0.37% | 3.28% | 3.09% | – | |||||
| Class R35 | 0.47% | 3.38% | 3.19% | – | |||||
| Class R47 | 0.63% | 3.64% | – | 3.30% | |||||
| Class R57 | 0.88% | 3.90% | – | 3.53% | |||||
| Class R67 | 0.97% | 4.01% | – | 3.65% | |||||
46
1 Reflects the deduction of the maximum initial sales charge of 2.25%.
2 Performance for each unmanaged index does not reflect any fees or expenses. The performance of each index is not necessarily representative of the Fund’s performance.
3 Total return, which is the percentage change in net asset value, after deduction of the maximum initial sales charge of 2.25% applicable to Class A shares, with all dividends and distributions reinvested for the periods shown ended November 30, 2021, is calculated using the SEC-required uniform method to compute such return.
4 The 1% CDSC for Class C shares normally applies before the first anniversary of the purchase date. Performance for other periods is at net asset value.
5 Performance is at net asset value.
6 Commenced operations and performance for the Class began on April 4, 2017. Performance is at net asset value.
7 Commenced operations and performance for the Class began on June 30, 2015. Performance is at net asset value.
47
Ultra Short Bond Fund
Investment Comparison
Below is a comparison of a $10,000 investment in Class A shares with the same investment in the ICE BofA U.S. Treasury Bill Index, assuming reinvestment of all dividends and distributions. The performance of the other classes will be greater than or less than the performance shown in the graph below due to different sales loads and expenses applicable to such classes. The graph and performance table below do not reflect the deduction of taxes that a shareholder would pay on Fund distributions or the redemption of Fund shares. During certain periods, expenses of the Fund have been waived or reimbursed by Lord Abbett; without such waiver or reimbursement of expenses, the Fund’s returns would have been lower. Past performance is no guarantee of future results.
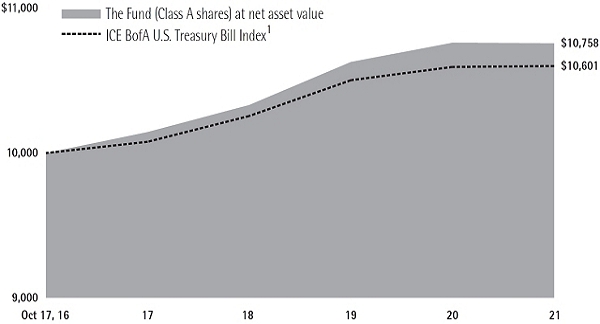
| Average Annual Total Returns at Maximum Applicable Sales Charge for the Periods Ended November 30, 2021 |
| 1 Year | 5 Years | Life of Class | |||||
| Class A2 | –0.03% | 1.44% | 1.44% | ||||
| Class A13 | –1.60% | – | 0.14% | ||||
| Class F2 | 0.02% | 1.49% | 1.48% | ||||
| Class F34 | 0.16% | – | 1.64% | ||||
| Class I2 | 0.12% | 1.60% | 1.59% | ||||
| Class R52 | 0.12% | 1.61% | 1.60% | ||||
| Class R62 | 0.16% | 1.64% | 1.64% |
1 Performance for the unmanaged index does not reflect any fees or expenses. The performance of the index is not necessarily representative of the Fund’s performance.
2 Commenced operations on October 12, 2016 and performance for the Class began on October 17, 2016. Performance is at net asset value.
3 Total return, which is the percentage change in net asset value, after deduction of the maximum initial sales charge of
1.50% applicable to Class A1 shares, with all dividends and distributions reinvested for the periods shown ended November 30, 2021, is calculated using the SEC-required uniform method to compute such return. Commenced operations and performance for the Class began on July 31, 2019.
4 Commenced operations and performance for the Class began on April 4, 2017. Performance is at net asset value.
48
As a shareholder of a Fund, you incur two types of costs: (1) transaction costs, including sales charges (loads) on purchase payments (these charges vary among the share classes); and (2) ongoing costs, including management fees; distribution and service (12b-1) fees (these charges vary among the share classes); and other Fund expenses. This Example is intended to help you understand your ongoing costs (in dollars) of investing in each Fund and to compare these costs with the ongoing costs of investing in other mutual funds.
The Example is based on an investment of $1,000 invested at the beginning of the period and held for the entire period (June 1, 2021 through November 30, 2021).
Actual Expenses
For each class of each Fund, the first line of the applicable table on the following pages provides information about actual account values and actual expenses. You may use the information in this line, together with the amount you invested, to estimate the expenses that you paid over the period. Simply divide your account value by $1,000 (for example, an $8,600 account value divided by $1,000 = 8.6), then multiply the result by the number in the first line under the heading titled “Expenses Paid During Period 6/1/21 -11/30/21” to estimate the expenses you paid on your account during this period.
Hypothetical Example for Comparison Purposes
For each class of each Fund, the second line of the applicable table on the following pages provides information about hypothetical account values and hypothetical expenses based on the Fund’s actual expense ratio and an assumed rate of return of 5% per year before expenses, which is not the Fund’s actual return. The hypothetical account values and expenses may not be used to estimate the actual ending account balance or expenses you paid for the period. You may use this information to compare the ongoing costs of investing in each Fund and other funds. To do so, compare this 5% hypothetical example with the 5% hypothetical examples that appear in the shareholder reports of the other funds.
49
Convertible Fund
Please note that the expenses shown in the table are meant to highlight your ongoing costs only and do not reflect any transactional costs, such as sales charges (loads). Therefore, the second line of the table is useful in comparing ongoing costs only, and will not help you determine the relative total costs of owning different funds. In addition, if these transactional costs were included, your costs would have been higher.
| Beginning Account Value | Ending Account Value | Expenses Paid During Period† | |||||
| 6/1/21 | 11/30/21 | 6/1/21 – 11/30/21 | |||||
| Class A | |||||||
| Actual | $1,000.00 | $1,012.20 | $5.30 | ||||
| Hypothetical (5% Return Before Expenses) | $1,000.00 | $1,019.80 | $5.32 | ||||
| Class C | |||||||
| Actual | $1,000.00 | $1,008.50 | $8.76 | ||||
| Hypothetical (5% Return Before Expenses) | $1,000.00 | $1,016.34 | $8.80 | ||||
| Class F | |||||||
| Actual | $1,000.00 | $1,012.70 | $4.79 | ||||
| Hypothetical (5% Return Before Expenses) | $1,000.00 | $1,020.31 | $4.81 | ||||
| Class F3 | |||||||
| Actual | $1,000.00 | $1,013.70 | $3.79 | ||||
| Hypothetical (5% Return Before Expenses) | $1,000.00 | $1,021.31 | $3.80 | ||||
| Class I | |||||||
| Actual | $1,000.00 | $1,013.10 | $4.29 | ||||
| Hypothetical (5% Return Before Expenses) | $1,000.00 | $1,020.81 | $4.31 | ||||
| Class P | |||||||
| Actual | $1,000.00 | $1,011.10 | $6.55 | ||||
| Hypothetical (5% Return Before Expenses) | $1,000.00 | $1,018.55 | $6.58 | ||||
| Class R2 | |||||||
| Actual | $1,000.00 | $1,010.20 | $7.31 | ||||
| Hypothetical (5% Return Before Expenses) | $1,000.00 | $1,017.80 | $7.33 | ||||
| Class R3 | |||||||
| Actual | $1,000.00 | $1,010.80 | $6.81 | ||||
| Hypothetical (5% Return Before Expenses) | $1,000.00 | $1,018.30 | $6.83 | ||||
| Class R4 | |||||||
| Actual | $1,000.00 | $1,012.10 | $5.55 | ||||
| Hypothetical (5% Return Before Expenses) | $1,000.00 | $1,019.55 | $5.57 | ||||
| Class R5 | |||||||
| Actual | $1,000.00 | $1,013.70 | $4.29 | ||||
| Hypothetical (5% Return Before Expenses) | $1,000.00 | $1,020.81 | $4.31 | ||||
| Class R6 | |||||||
| Actual | $1,000.00 | $1,013.70 | $3.79 | ||||
| Hypothetical (5% Return Before Expenses) | $1,000.00 | $1,021.31 | $3.80 |
| † | For each class of the Fund, net expenses are equal to the annualized expense ratio for such class (1.05% for Class A, 1.74% for Class C, 0.95% for Class F, 0.75% for Class F3, 0.85% for Class I, 1.30% for Class P, 1.45% for Class R2, 1.35% for Class R3, 1.10% for Class R4, 0.85% for Class R5 and 0.75% for Class R6) multiplied by the average account value over the period, multiplied by 183/365 (to reflect one-half year period). |
50
Portfolio Holdings Presented by Sector
November 30, 2021
| Sector* | %** | |||
| Basic Materials | 1.02 | % | ||
| Communications | 19.11 | % | ||
| Consumer, Cyclical | 12.46 | % | ||
| Consumer, Non-cyclical | 22.18 | % | ||
| Energy | 6.10 | % | ||
| Financial | 3.85 | % | ||
| Industrial | 9.89 | % | ||
| Sector* | %** | |||
| Technology | 17.55 | % | ||
| Utilities | 2.65 | % | ||
| Repurchase Agreements | 4.61 | % | ||
| Money Market Funds(a) | 0.52 | % | ||
| Time Deposits(a) | 0.06 | % | ||
| Total | 100.00 | % | ||
| * | A sector may comprise several industries. | |
| ** | Represents percent of total investments. | |
| (a) | Securities were purchased with the cash collateral from loaned securities. |
51
Core Fixed Income Fund
Please note that the expenses shown in the table are meant to highlight your ongoing costs only and do not reflect any transactional costs, such as sales charges (loads). Therefore, the second line of the table is useful in comparing ongoing costs only, and will not help you determine the relative total costs of owning different funds. In addition, if these transactional costs were included, your costs would have been higher.
| Beginning Account Value | Ending Account Value | Expenses Paid During Period† | |||||
| 6/1/21 | 11/30/21 | 6/1/21 – 11/30/21 | |||||
| Class A | |||||||
| Actual | $1,000.00 | $1,010.30 | $2.87 | ||||
| Hypothetical (5% Return Before Expenses) | $1,000.00 | $1,022.21 | $2.89 | ||||
| Class C | |||||||
| Actual | $1,000.00 | $1,006.20 | $6.14 | ||||
| Hypothetical (5% Return Before Expenses) | $1,000.00 | $1,018.95 | $6.17 | ||||
| Class F | |||||||
| Actual | $1,000.00 | $1,010.80 | $2.37 | ||||
| Hypothetical (5% Return Before Expenses) | $1,000.00 | $1,022.71 | $2.38 | ||||
| Class F3 | |||||||
| Actual | $1,000.00 | $1,010.80 | $1.46 | ||||
| Hypothetical (5% Return Before Expenses) | $1,000.00 | $1,023.61 | $1.47 | ||||
| Class I | |||||||
| Actual | $1,000.00 | $1,011.50 | $1.66 | ||||
| Hypothetical (5% Return Before Expenses) | $1,000.00 | $1,023.41 | $1.67 | ||||
| Class R2 | |||||||
| Actual | $1,000.00 | $1,008.30 | $4.88 | ||||
| Hypothetical (5% Return Before Expenses) | $1,000.00 | $1,020.21 | $4.91 | ||||
| Class R3 | |||||||
| Actual | $1,000.00 | $1,008.80 | $4.38 | ||||
| Hypothetical (5% Return Before Expenses) | $1,000.00 | $1,020.71 | $4.41 | ||||
| Class R4 | |||||||
| Actual | $1,000.00 | $1,010.10 | $3.12 | ||||
| Hypothetical (5% Return Before Expenses) | $1,000.00 | $1,021.96 | $3.14 | ||||
| Class R5 | |||||||
| Actual | $1,000.00 | $1,011.30 | $1.87 | ||||
| Hypothetical (5% Return Before Expenses) | $1,000.00 | $1,023.21 | $1.88 | ||||
| Class R6 | |||||||
| Actual | $1,000.00 | $1,011.80 | $1.46 | ||||
| Hypothetical (5% Return Before Expenses) | $1,000.00 | $1,023.61 | $1.47 |
| † | For each class of the Fund, net expenses are equal to the annualized expense ratio for such class (0.57% for Class A, 1.22% for Class C, 0.47% for Class F, 0.29% for Class F3, 0.33% for Class I, 0.97% for Class R2, 0.87% for Class R3, 0.62% for Class R4, 0.37% for Class R5 and 0.29% for Class R6) multiplied by the average account value over the period, multiplied by 183/365 (to reflect one-half year period). |
52
Portfolio Holdings Presented by Sector
November 30, 2021
| Sector* | %** | |||
| Asset Backed Securities | 14.28 | % | ||
| Basic Materials | 0.82 | % | ||
| Communications | 1.62 | % | ||
| Consumer, Cyclical | 1.85 | % | ||
| Consumer, Non-cyclical | 1.12 | % | ||
| Energy | 3.20 | % | ||
| Financial | 9.13 | % | ||
| Health Care | 0.26 | % | ||
| Sector* | %** | |||
| Industrial | 1.18 | % | ||
| Mortgage Securities | 12.45 | % | ||
| Technology | 1.75 | % | ||
| U.S. Government | 47.01 | % | ||
| Utilities | 2.32 | % | ||
| Repurchase Agreements | 3.01 | % | ||
| Total | 100.00 | % | ||
| * | A sector may comprise several industries. | |
| ** | Represents percent of total investments. |
53
Core Plus Bond Fund
Please note that the expenses shown in the table are meant to highlight your ongoing costs only and do not reflect any transactional costs, such as sales charges (loads). Therefore, the second line of the table is useful in comparing ongoing costs only, and will not help you determine the relative total costs of owning different funds. In addition, if these transactional costs were included, your costs would have been higher.
| Beginning Account Value | Ending Account Value | Expenses Paid During Period† | |||||
| 6/1/21 | 11/30/21 | 6/1/21 – 11/30/21 | |||||
| Class A | |||||||
| Actual | $1,000.00 | $1,011.00 | $3.43 | ||||
| Hypothetical (5% Return Before Expenses) | $1,000.00 | $1,021.66 | $3.45 | ||||
| Class C | |||||||
| Actual | $1,000.00 | $1,007.80 | $6.64 | ||||
| Hypothetical (5% Return Before Expenses) | $1,000.00 | $1,018.45 | $6.68 | ||||
| Class F | |||||||
| Actual | $1,000.00 | $1,010.80 | $2.92 | ||||
| Hypothetical (5% Return Before Expenses) | $1,000.00 | $1,022.16 | $2.94 | ||||
| Class F3 | |||||||
| Actual | $1,000.00 | $1,011.80 | $1.92 | ||||
| Hypothetical (5% Return Before Expenses) | $1,000.00 | $1,023.16 | $1.93 | ||||
| Class I | |||||||
| Actual | $1,000.00 | $1,012.00 | $2.42 | ||||
| Hypothetical (5% Return Before Expenses) | $1,000.00 | $1,022.66 | $2.43 | ||||
| Class R3 | |||||||
| Actual | $1,000.00 | $1,009.50 | $4.94 | ||||
| Hypothetical (5% Return Before Expenses) | $1,000.00 | $1,020.16 | $4.96 | ||||
| Class R4 | |||||||
| Actual | $1,000.00 | $1,010.10 | $3.68 | ||||
| Hypothetical (5% Return Before Expenses) | $1,000.00 | $1,021.41 | $3.70 | ||||
| Class R5 | |||||||
| Actual | $1,000.00 | $1,011.90 | $2.42 | ||||
| Hypothetical (5% Return Before Expenses) | $1,000.00 | $1,022.66 | $2.43 | ||||
| Class R6 | |||||||
| Actual | $1,000.00 | $1,012.50 | $1.92 | ||||
| Hypothetical (5% Return Before Expenses) | $1,000.00 | $1,023.16 | $1.93 |
| † | For each class of the Fund, net expenses are equal to the annualized expense ratio for such class (0.68% for Class A, 1.32% for Class C, 0.58% for Class F, 0.38% for Class F3, 0.48% for Class I, 0.98% for Class R3, 0.73% for Class R4, 0.48% for Class R5 and 0.38% for Class R6) multiplied by the average account value over the period, multiplied by 183/365 (to reflect one-half year period). |
54
Portfolio Holdings Presented by Sector
November 30, 2021
| Sector* | %** | |||
| Asset Backed Securities | 15.66 | % | ||
| Basic Materials | 2.66 | % | ||
| Communications | 2.66 | % | ||
| Consumer, Cyclical | 6.28 | % | ||
| Consumer, Non-cyclical | 4.03 | % | ||
| Energy | 6.67 | % | ||
| Financial | 11.87 | % | ||
| Sector* | %** | |||
| Government | 29.64 | % | ||
| Industrial | 2.83 | % | ||
| Mortgage Securities | 11.69 | % | ||
| Technology | 2.05 | % | ||
| Utilities | 1.71 | % | ||
| Repurchase Agreements | 2.25 | % | ||
| Total | 100.00 | % | ||
| * | A sector may comprise several industries. | |
| ** | Represents percent of total investments. |
55
Corporate Bond Fund
Please note that the expenses shown in the table are meant to highlight your ongoing costs only and do not reflect any transactional costs, such as sales charges (loads). Therefore, the second line of the table is useful in comparing ongoing costs only, and will not help you determine the relative total costs of owning different funds. In addition, if these transactional costs were included, your costs would have been higher.
| Beginning Account Value | Ending Account Value | Expenses Paid During Period† | |||||
| 6/1/21 | 11/30/21 | 6/1/21 – 11/30/21 | |||||
| Class A | |||||||
| Actual | $1,000.00 | $1,025.50 | $3.45 | ||||
| Hypothetical (5% Return Before Expenses) | $1,000.00 | $1,021.66 | $3.45 | ||||
| Class C | |||||||
| Actual | $1,000.00 | $1,022.20 | $6.79 | ||||
| Hypothetical (5% Return Before Expenses) | $1,000.00 | $1,018.35 | $6.78 | ||||
| Class F | |||||||
| Actual | $1,000.00 | $1,026.00 | $2.95 | ||||
| Hypothetical (5% Return Before Expenses) | $1,000.00 | $1,022.16 | $2.94 | ||||
| Class F3 | |||||||
| Actual | $1,000.00 | $1,026.80 | $2.24 | ||||
| Hypothetical (5% Return Before Expenses) | $1,000.00 | $1,022.86 | $2.23 | ||||
| Class I | |||||||
| Actual | $1,000.00 | $1,026.60 | $2.44 | ||||
| Hypothetical (5% Return Before Expenses) | $1,000.00 | $1,022.66 | $2.43 | ||||
| Class R2 | |||||||
| Actual | $1,000.00 | $1,023.50 | $5.48 | ||||
| Hypothetical (5% Return Before Expenses) | $1,000.00 | $1,019.65 | $5.47 | ||||
| Class R3 | |||||||
| Actual | $1,000.00 | $1,023.10 | $4.97 | ||||
| Hypothetical (5% Return Before Expenses) | $1,000.00 | $1,020.16 | $4.96 | ||||
| Class R4 | |||||||
| Actual | $1,000.00 | $1,025.30 | $3.71 | ||||
| Hypothetical (5% Return Before Expenses) | $1,000.00 | $1,021.41 | $3.70 | ||||
| Class R5 | |||||||
| Actual | $1,000.00 | $1,026.60 | $2.44 | ||||
| Hypothetical (5% Return Before Expenses) | $1,000.00 | $1,022.66 | $2.43 | ||||
| Class R6 | |||||||
| Actual | $1,000.00 | $1,026.80 | $2.24 | ||||
| Hypothetical (5% Return Before Expenses) | $1,000.00 | $1,022.86 | $2.23 |
| † | For each class of the Fund, net expenses are equal to the annualized expense ratio for such class (0.68% for Class A, 1.34% for Class C, 0.58% for Class F, 0.44% for Class F3, 0.48% for Class I, 1.08% for Class R2, 0.98% for Class R3, 0.73% for Class R4, 0.48% for Class R5 and 0.44% for Class R6) multiplied by the average account value over the period, multiplied by 183/365 (to reflect one-half year period). |
56
Portfolio Holdings Presented by Sector
November 30, 2021
| Sector* | %** | |||
| Basic Materials | 1.00 | % | ||
| Communications | 10.07 | % | ||
| Consumer, Cyclical | 5.68 | % | ||
| Consumer, Non-cyclical | 8.55 | % | ||
| Energy | 9.93 | % | ||
| Financial | 36.42 | % | ||
| Sector* | %** | |||
| Government | 6.12 | % | ||
| Industrial | 3.01 | % | ||
| Technology | 5.37 | % | ||
| Utilities | 11.14 | % | ||
| Repurchase Agreements | 2.71 | % | ||
| Total | 100.00 | % | ||
| * | A sector may comprise several industries. | |
| ** | Represents percent of total investments. |
57
Floating Rate Fund
Please note that the expenses shown in the table are meant to highlight your ongoing costs only and do not reflect any transactional costs, such as sales charges (loads). Therefore, the second line of the table is useful in comparing ongoing costs only, and will not help you determine the relative total costs of owning different funds. In addition, if these transactional costs were included, your costs would have been higher.
| Beginning Account Value | Ending Account Value | Expenses Paid During Period† | |||||
| 6/1/21 | 11/30/21 | 6/1/21 – 11/30/21 | |||||
| Class A | |||||||
| Actual | $1,000.00 | $1,014.50 | $3.94 | ||||
| Hypothetical (5% Return Before Expenses) | $1,000.00 | $1,021.16 | $3.95 | ||||
| Class C | |||||||
| Actual | $1,000.00 | $1,010.20 | $7.00 | ||||
| Hypothetical (5% Return Before Expenses) | $1,000.00 | $1,018.10 | $7.03 | ||||
| Class F | |||||||
| Actual | $1,000.00 | $1,013.80 | $3.43 | ||||
| Hypothetical (5% Return Before Expenses) | $1,000.00 | $1,021.66 | $3.45 | ||||
| Class F3 | |||||||
| Actual | $1,000.00 | $1,014.60 | $2.63 | ||||
| Hypothetical (5% Return Before Expenses) | $1,000.00 | $1,022.46 | $2.64 | ||||
| Class I | |||||||
| Actual | $1,000.00 | $1,014.30 | $2.93 | ||||
| Hypothetical (5% Return Before Expenses) | $1,000.00 | $1,022.16 | $2.94 | ||||
| Class R2 | |||||||
| Actual | $1,000.00 | $1,012.50 | $5.95 | ||||
| Hypothetical (5% Return Before Expenses) | $1,000.00 | $1,019.15 | $5.97 | ||||
| Class R3 | |||||||
| Actual | $1,000.00 | $1,011.80 | $5.45 | ||||
| Hypothetical (5% Return Before Expenses) | $1,000.00 | $1,019.65 | $5.47 | ||||
| Class R4 | |||||||
| Actual | $1,000.00 | $1,014.30 | $4.19 | ||||
| Hypothetical (5% Return Before Expenses) | $1,000.00 | $1,020.91 | $4.20 | ||||
| Class R5 | |||||||
| Actual | $1,000.00 | $1,014.40 | $2.93 | ||||
| Hypothetical (5% Return Before Expenses) | $1,000.00 | $1,022.16 | $2.94 | ||||
| Class R6 | |||||||
| Actual | $1,000.00 | $1,015.90 | $2.63 | ||||
| Hypothetical (5% Return Before Expenses) | $1,000.00 | $1,022.46 | $2.64 |
| † | For each class of the Fund, net expenses are equal to the annualized expense ratio for such class (0.78% for Class A, 1.39% for Class C, 0.68% for Class F, 0.52% for Class F3, 0.58% for Class I, 1.18% for Class R2, 1.08% for Class R3, 0.83% for Class R4, 0.58% for Class R5 and 0.52% for Class R6) multiplied by the average account value over the period, multiplied by 183/365 (to reflect one-half year period). |
58
Portfolio Holdings Presented by Sector
November 30, 2021
| Sector* | %** | |||
| Aerospace | 4.82 | % | ||
| Chemicals | 1.72 | % | ||
| Consumer Discretionary | 0.28 | % | ||
| Consumer Durables | 0.13 | % | ||
| Consumer Non-Durables | 1.13 | % | ||
| Energy | 3.92 | % | ||
| Financial | 7.57 | % | ||
| Food/Tobacco | 1.24 | % | ||
| Gaming/Leisure | 6.30 | % | ||
| Healthcare | 14.86 | % | ||
| * | A sector may comprise several industries. | |
| ** | Represents percent of total investments. |
| Sector* | %** | |||
| Housing | 2.41 | % | ||
| Information Technology | 14.05 | % | ||
| Manufacturing | 9.57 | % | ||
| Media/Telecom | 2.73 | % | ||
| Metals/Minerals | 1.37 | % | ||
| Retail | 4.00 | % | ||
| Service | 8.29 | % | ||
| Transportation | 1.88 | % | ||
| Utilities | 1.94 | % | ||
| Repurchase Agreements | 11.79 | % | ||
| Total | 100.00 | % | ||
59
High Yield Fund
Please note that the expenses shown in the table are meant to highlight your ongoing costs only and do not reflect any transactional costs, such as sales charges (loads). Therefore, the second line of the table is useful in comparing ongoing costs only, and will not help you determine the relative total costs of owning different funds. In addition, if these transactional costs were included, your costs would have been higher.
| Beginning Account Value | Ending Account Value | Expenses Paid During Period† | |||||
| 6/1/21 | 11/30/21 | 6/1/21 – 11/30/21 | |||||
| Class A | |||||||
| Actual | $1,000.00 | $1,012.00 | $4.39 | ||||
| Hypothetical (5% Return Before Expenses) | $1,000.00 | $1,020.71 | $4.41 | ||||
| Class C | |||||||
| Actual | $1,000.00 | $1,008.70 | $7.55 | ||||
| Hypothetical (5% Return Before Expenses) | $1,000.00 | $1,017.55 | $7.59 | ||||
| Class F | |||||||
| Actual | $1,000.00 | $1,012.40 | $3.88 | ||||
| Hypothetical (5% Return Before Expenses) | $1,000.00 | $1,021.21 | $3.90 | ||||
| Class F3 | |||||||
| Actual | $1,000.00 | $1,012.20 | $2.93 | ||||
| Hypothetical (5% Return Before Expenses) | $1,000.00 | $1,022.16 | $2.94 | ||||
| Class I | |||||||
| Actual | $1,000.00 | $1,013.00 | $3.38 | ||||
| Hypothetical (5% Return Before Expenses) | $1,000.00 | $1,021.71 | $3.40 | ||||
| Class P | |||||||
| Actual | $1,000.00 | $1,010.90 | $5.65 | ||||
| Hypothetical (5% Return Before Expenses) | $1,000.00 | $1,019.45 | $5.67 | ||||
| Class R2 | |||||||
| Actual | $1,000.00 | $1,008.70 | $6.40 | ||||
| Hypothetical (5% Return Before Expenses) | $1,000.00 | $1,018.70 | $6.43 | ||||
| Class R3 | |||||||
| Actual | $1,000.00 | $1,010.50 | $5.90 | ||||
| Hypothetical (5% Return Before Expenses) | $1,000.00 | $1,019.20 | $5.92 | ||||
| Class R4 | |||||||
| Actual | $1,000.00 | $1,011.70 | $4.64 | ||||
| Hypothetical (5% Return Before Expenses) | $1,000.00 | $1,020.46 | $4.66 | ||||
| Class R5 | |||||||
| Actual | $1,000.00 | $1,013.00 | $3.38 | ||||
| Hypothetical (5% Return Before Expenses) | $1,000.00 | $1,021.71 | $3.40 | ||||
| Class R6 | |||||||
| Actual | $1,000.00 | $1,012.20 | $2.93 | ||||
| Hypothetical (5% Return Before Expenses) | $1,000.00 | $1,022.16 | $2.94 |
| † | For each class of the Fund, net expenses are equal to the annualized expense ratio for such class (0.87% for Class A, 1.50% for Class C, 0.77% for Class F, 0.58% for Class F3, 0.67% for Class I, 1.12% for Class P, 1.27% for Class R2, 1.17% for Class R3, 0.92% for Class R4, 0.67% for Class R5 and 0.58% for Class R6) multiplied by the average account value over the period, multiplied by 183/365 (to reflect one-half year period). |
60
Portfolio Holdings Presented by Sector
November 30, 2021
| Sector* | %** | |||
| Asset Backed Securities | 1.33 | % | ||
| Automotive | 0.02 | % | ||
| Basic Materials | 7.13 | % | ||
| Communications | 8.16 | % | ||
| Consumer, Cyclical | 22.69 | % | ||
| Consumer, Non-cyclical | 11.54 | % | ||
| Energy | 21.51 | % | ||
| Financial | 10.21 | % | ||
| Health Care | 0.29 | % | ||
| Industrial | 7.87 | % | ||
| Sector* | %** | |||
| Mortgage Securities | 1.39 | % | ||
| Service | 0.10 | % | ||
| Technology | 5.44 | % | ||
| Transportation | 0.15 | % | ||
| Government | 0.24 | % | ||
| Utilities | 1.67 | % | ||
| Repurchase Agreements | 0.16 | % | ||
| Money Market Funds(a) | 0.09 | % | ||
| Time Deposits(a) | 0.01 | % | ||
| Total | 100.00 | % | ||
| * | A sector may comprise several industries. | |
| ** | Represents percent of total investments. | |
| (a) | Securities were purchased with the cash collateral from loaned securities. |
61
Income Fund
Please note that the expenses shown in the table are meant to highlight your ongoing costs only and do not reflect any transactional costs, such as sales charges (loads). Therefore, the second line of the table is useful in comparing ongoing costs only, and will not help you determine the relative total costs of owning different funds. In addition, if these transactional costs were included, your costs would have been higher.
| Beginning Account Value | Ending Account Value | Expenses Paid During Period† | |||||
| 6/1/21 | 11/30/21 | 6/1/21 – 11/30/21 | |||||
| Class A | |||||||
| Actual | $1,000.00 | $1,021.60 | $3.65 | ||||
| Hypothetical (5% Return Before Expenses) | $1,000.00 | $1,021.46 | $3.65 | ||||
| Class C | |||||||
| Actual | $1,000.00 | $1,018.40 | $6.83 | ||||
| Hypothetical (5% Return Before Expenses) | $1,000.00 | $1,018.30 | $6.83 | ||||
| Class F | |||||||
| Actual | $1,000.00 | $1,022.10 | $3.14 | ||||
| Hypothetical (5% Return Before Expenses) | $1,000.00 | $1,021.96 | $3.14 | ||||
| Class F3 | |||||||
| Actual | $1,000.00 | $1,023.00 | $2.23 | ||||
| Hypothetical (5% Return Before Expenses) | $1,000.00 | $1,022.86 | $2.23 | ||||
| Class I | |||||||
| Actual | $1,000.00 | $1,022.60 | $2.64 | ||||
| Hypothetical (5% Return Before Expenses) | $1,000.00 | $1,022.46 | $2.64 | ||||
| Class R2 | |||||||
| Actual | $1,000.00 | $1,019.50 | $5.67 | ||||
| Hypothetical (5% Return Before Expenses) | $1,000.00 | $1,019.45 | $5.67 | ||||
| Class R3 | |||||||
| Actual | $1,000.00 | $1,020.10 | $5.17 | ||||
| Hypothetical (5% Return Before Expenses) | $1,000.00 | $1,019.95 | $5.16 | ||||
| Class R4 | |||||||
| Actual | $1,000.00 | $1,021.40 | $3.90 | ||||
| Hypothetical (5% Return Before Expenses) | $1,000.00 | $1,021.21 | $3.90 | ||||
| Class R5 | |||||||
| Actual | $1,000.00 | $1,022.60 | $2.64 | ||||
| Hypothetical (5% Return Before Expenses) | $1,000.00 | $1,022.46 | $2.64 | ||||
| Class R6 | |||||||
| Actual | $1,000.00 | $1,023.10 | $2.23 | ||||
| Hypothetical (5% Return Before Expenses) | $1,000.00 | $1,022.86 | $2.23 |
| † | For each class of the Fund, net expenses are equal to the annualized expense ratio for such class (0.72% for Class A, 1.35% for Class C, 0.62% for Class F, 0.44% for Class F3, 0.52% for Class I, 1.12% for Class R2, 1.02% for Class R3, 0.77% for Class R4, 0.52% for Class R5 and 0.44% for Class R6) multiplied by the average account value over the period, multiplied by 183/365 (to reflect one-half year period). |
62
Portfolio Holdings Presented by Sector
November 30, 2021
| Sector* | %** | |||
| Asset Backed Securities | 10.08 | % | ||
| Basic Materials | 3.57 | % | ||
| Communications | 5.93 | % | ||
| Consumer, Cyclical | 6.22 | % | ||
| Consumer, Non-cyclical | 6.37 | % | ||
| Energy | 11.44 | % | ||
| Financial | 20.09 | % | ||
| Sector* | %** | |||
| Government | 13.22 | % | ||
| Industrial | 4.62 | % | ||
| Mortgage Securities | 4.52 | % | ||
| Technology | 3.67 | % | ||
| Utilities | 6.55 | % | ||
| Repurchase Agreements | 3.72 | % | ||
| Total | 100.00 | % | ||
| * | A sector may comprise several industries. | |
| ** | Represents percent of total investments. |
63
Inflation Focused Fund
Please note that the expenses shown in the table are meant to highlight your ongoing costs only and do not reflect any transactional costs, such as sales charges (loads). Therefore, the second line of the table is useful in comparing ongoing costs only, and will not help you determine the relative total costs of owning different funds. In addition, if these transactional costs were included, your costs would have been higher.
| Beginning Account Value | Ending Account Value | Expenses Paid During Period† | |||||
| 6/1/21 | 11/30/21 | 6/1/21 – 11/30/21 | |||||
| Class A | |||||||
| Actual | $1,000.00 | $1,030.20 | $3.26 | ||||
| Hypothetical (5% Return Before Expenses) | $1,000.00 | $1,021.86 | $3.24 | ||||
| Class C | |||||||
| Actual | $1,000.00 | $1,026.60 | $6.76 | ||||
| Hypothetical (5% Return Before Expenses) | $1,000.00 | $1,018.40 | $6.73 | ||||
| Class F | |||||||
| Actual | $1,000.00 | $1,030.70 | $2.75 | ||||
| Hypothetical (5% Return Before Expenses) | $1,000.00 | $1,022.36 | $2.74 | ||||
| Class F3 | |||||||
| Actual | $1,000.00 | $1,031.50 | $1.94 | ||||
| Hypothetical (5% Return Before Expenses) | $1,000.00 | $1,023.16 | $1.93 | ||||
| Class I | |||||||
| Actual | $1,000.00 | $1,031.30 | $2.29 | ||||
| Hypothetical (5% Return Before Expenses) | $1,000.00 | $1,022.81 | $2.28 | ||||
| Class R2 | |||||||
| Actual | $1,000.00 | $1,026.10 | $5.18 | ||||
| Hypothetical (5% Return Before Expenses) | $1,000.00 | $1,019.95 | $5.16 | ||||
| Class R3 | |||||||
| Actual | $1,000.00 | $1,029.50 | $4.78 | ||||
| Hypothetical (5% Return Before Expenses) | $1,000.00 | $1,020.36 | $4.76 | ||||
| Class R4 | |||||||
| Actual | $1,000.00 | $1,030.00 | $3.51 | ||||
| Hypothetical (5% Return Before Expenses) | $1,000.00 | $1,021.61 | $3.50 | ||||
| Class R5 | |||||||
| Actual | $1,000.00 | $1,031.30 | $2.29 | ||||
| Hypothetical (5% Return Before Expenses) | $1,000.00 | $1,022.81 | $2.28 | ||||
| Class R6 | |||||||
| Actual | $1,000.00 | $1,030.80 | $1.93 | ||||
| Hypothetical (5% Return Before Expenses) | $1,000.00 | $1,023.16 | $1.93 |
| † | For each class of the Fund, net expenses are equal to the annualized expense ratio for such class (0.64% for Class A, 1.33% for Class C, 0.54% for Class F, 0.38% for Class F3, 0.45% for Class I, 1.02% for Class R2, 0.94% for Class R3, 0.69% for Class R4, 0.45% for Class R5 and 0.38% for Class R6) multiplied by the average account value over the period, multiplied by 183/365 (to reflect one-half year period). |
64
Portfolio Holdings Presented by Sector
November 30, 2021
| Sector* | %** | |||
| Asset Backed Securities | 18.37 | % | ||
| Basic Materials | 2.08 | % | ||
| Communications | 3.00 | % | ||
| Consumer Cyclical | 6.55 | % | ||
| Consumer, Non-cyclical | 4.44 | % | ||
| Energy | 6.85 | % | ||
| Financial | 19.34 | % | ||
| Government | 11.51 | % | ||
| Sector* | %** | |||
| Health Care | 0.20 | % | ||
| Industrial | 2.14 | % | ||
| Materials and Processing | 0.21 | % | ||
| Mortgage Securities | 16.51 | % | ||
| Technology | 1.96 | % | ||
| Utilities | 3.96 | % | ||
| Repurchase Agreements | 2.88 | % | ||
| Total | 100.00 | % | ||
| * | A sector may comprise several industries. | |
| ** | Represents percent of total investments. |
65
Short Duration Core Bond Fund
Please note that the expenses shown in the table are meant to highlight your ongoing costs only and do not reflect any transactional costs, such as sales charges (loads). Therefore, the second line of the table is useful in comparing ongoing costs only, and will not help you determine the relative total costs of owning different funds. In addition, if these transactional costs were included, your costs would have been higher.
| Beginning Account Value | Ending Account Value | Expenses Paid During Period† | |||||||
| 6/1/21 | 11/30/21 | 6/1/21 – 11/30/21 | |||||||
| Class A | |||||||||
| Actual | $1,000.00 | $ | 997.40 | $3.00 | |||||
| Hypothetical (5% Return Before Expenses) | $1,000.00 | $ | 1,022.06 | $3.04 | |||||
| Class C | |||||||||
| Actual | $1,000.00 | $ | 994.00 | $6.45 | |||||
| Hypothetical (5% Return Before Expenses) | $1,000.00 | $ | 1,018.60 | $6.53 | |||||
| Class F | |||||||||
| Actual | $1,000.00 | $ | 997.90 | $2.50 | |||||
| Hypothetical (5% Return Before Expenses) | $1,000.00 | $ | 1,022.56 | $2.54 | |||||
| Class F3 | |||||||||
| Actual | $1,000.00 | $ | 998.90 | $1.70 | |||||
| Hypothetical (5% Return Before Expenses) | $1,000.00 | $ | 1,023.36 | $1.72 | |||||
| Class I | |||||||||
| Actual | $1,000.00 | $ | 999.40 | $2.00 | |||||
| Hypothetical (5% Return Before Expenses) | $1,000.00 | $ | 1,023.06 | $2.03 | |||||
| Class R3 | |||||||||
| Actual | $1,000.00 | $ | 995.90 | $4.50 | |||||
| Hypothetical (5% Return Before Expenses) | $1,000.00 | $ | 1,020.56 | $4.56 | |||||
| Class R4 | |||||||||
| Actual | $1,000.00 | $ | 998.20 | $3.26 | |||||
| Hypothetical (5% Return Before Expenses) | $1,000.00 | $ | 1,021.81 | $3.29 | |||||
| Class R5 | |||||||||
| Actual | $1,000.00 | $ | 999.40 | $2.00 | |||||
| Hypothetical (5% Return Before Expenses) | $1,000.00 | $ | 1,023.06 | $2.03 | |||||
| Class R6 | |||||||||
| Actual | $1,000.00 | $ | 998.70 | $1.70 | |||||
| Hypothetical (5% Return Before Expenses) | $1,000.00 | $ | 1,023.36 | $1.72 | |||||
| † | For each class of the Fund, net expenses are equal to the annualized expense ratio for such class (0.60% for Class A, 1.29% for Class C, 0.50% for Class F, 0.34% for Class F3, 0.40% for Class I, 0.90% for Class R3, 0.65% for Class R4, 0.40% for Class R5 and 0.34% for Class R6) multiplied by the average account value over the period, multiplied by 183/365 (to reflect one-half year period). |
66
Portfolio Holdings Presented by Sector
November 30, 2021
| Sector* | %** | |||
| Asset Backed Securities | 26.48 | % | ||
| Basic Materials | 1.35 | % | ||
| Communications | 1.31 | % | ||
| Consumer, Cyclical | 2.48 | % | ||
| Consumer, Non-cyclical | 3.04 | % | ||
| Energy | 5.12 | % | ||
| Financial | 12.36 | % | ||
| Sector* | %** | |||
| Government | 18.35 | % | ||
| Industrial | 0.86 | % | ||
| Mortgage Securities | 19.44 | % | ||
| Technology | 1.69 | % | ||
| Utilities | 4.31 | % | ||
| Repurchase Agreements | 3.21 | % | ||
| Total | 100.00 | % | ||
| * | A sector may comprise several industries. | |
| ** | Represents percent of total investments. |
67
Short Duration Income Fund
Please note that the expenses shown in the table are meant to highlight your ongoing costs only and do not reflect any transactional costs, such as sales charges (loads). Therefore, the second line of the table is useful in comparing ongoing costs only, and will not help you determine the relative total costs of owning different funds. In addition, if these transactional costs were included, your costs would have been higher.
| Beginning Account Value | Ending Account Value | Expenses Paid During Period† | |||||||
| 6/1/21 | 11/30/21 | 6/1/21 – 11/30/21 | |||||||
| Class A | |||||||||
| Actual | $1,000.00 | $ | 999.30 | $2.86 | |||||
| Hypothetical (5% Return Before Expenses) | $1,000.00 | $ | 1,022.21 | $2.89 | |||||
| Class C | |||||||||
| Actual | $1,000.00 | $ | 996.10 | $6.10 | |||||
| Hypothetical (5% Return Before Expenses) | $1,000.00 | $ | 1,018.95 | $6.17 | |||||
| Class F | |||||||||
| Actual | $1,000.00 | $ | 999.80 | $2.36 | |||||
| Hypothetical (5% Return Before Expenses) | $1,000.00 | $ | 1,022.71 | $2.38 | |||||
| Class F3 | |||||||||
| Actual | $1,000.00 | $ | 1,000.60 | $1.55 | |||||
| Hypothetical (5% Return Before Expenses) | $1,000.00 | $ | 1,023.51 | $1.57 | |||||
| Class I | |||||||||
| Actual | $1,000.00 | $ | 1,000.30 | $1.86 | |||||
| Hypothetical (5% Return Before Expenses) | $1,000.00 | $ | 1,023.21 | $1.88 | |||||
| Class R2 | |||||||||
| Actual | $1,000.00 | $ | 997.30 | $4.86 | |||||
| Hypothetical (5% Return Before Expenses) | $1,000.00 | $ | 1,020.21 | $4.91 | |||||
| Class R3 | |||||||||
| Actual | $1,000.00 | $ | 995.40 | $4.35 | |||||
| Hypothetical (5% Return Before Expenses) | $1,000.00 | $ | 1,020.71 | $4.41 | |||||
| Class R4 | |||||||||
| Actual | $1,000.00 | $ | 999.40 | $3.11 | |||||
| Hypothetical (5% Return Before Expenses) | $1,000.00 | $ | 1,022.31 | $3.14 | |||||
| Class R5 | |||||||||
| Actual | $1,000.00 | $ | 1,000.60 | $1.86 | |||||
| Hypothetical (5% Return Before Expenses) | $1,000.00 | $ | 1,023.56 | $1.88 | |||||
| Class R6 | |||||||||
| Actual | $1,000.00 | $ | 1,000.60 | $1.55 | |||||
| Hypothetical (5% Return Before Expenses) | $1,000.00 | $ | 1,023.51 | $1.57 | |||||
| † | For each class of the Fund, net expenses are equal to the annualized expense ratio for such class (0.57% for Class A, 1.22% for Class C, 0.47% for Class F, 0.31% for Class F3, 0.37% for Class I, 0.97% for Class R2, 0.87% for Class R3, 0.62% for Class R4, 0.37% for Class R5 and 0.31% for Class R6) multiplied by the average account value over the period, multiplied by 183/365 (to reflect one-half year period). |
68
Portfolio Holdings Presented by Sector
November 30, 2021
| Sector* | %** | |||
| Asset Backed Securities | 23.73 | % | ||
| Basic Materials | 1.92 | % | ||
| Communications | 3.33 | % | ||
| Consumer, Cyclical | 6.41 | % | ||
| Consumer, Non-cyclical | 4.46 | % | ||
| Diversified | 0.02 | % | ||
| Energy | 6.12 | % | ||
| Financial | 17.17 | % | ||
| * | A sector may comprise several industries. | |
| ** | Represents percent of total investments. |
| Sector* | %** | |||
| Health Care | 0.13 | % | ||
| Industrial | 2.00 | % | ||
| Materials and Processing | 0.21 | % | ||
| Mortgage Securities | 17.91 | % | ||
| Other | 0.01 | % | ||
| Technology | 1.62 | % | ||
| U.S. Government | 9.47 | % | ||
| Utilities | 2.74 | % | ||
| Repurchase Agreements | 2.75 | % | ||
| Total | 100.00 | % | ||
69
Total Return Fund
Please note that the expenses shown in the table are meant to highlight your ongoing costs only and do not reflect any transactional costs, such as sales charges (loads). Therefore, the second line of the table is useful in comparing ongoing costs only, and will not help you determine the relative total costs of owning different funds. In addition, if these transactional costs were included, your costs would have been higher.
| Beginning Account Value | Ending Account Value | Expenses Paid During Period† | |||||
| 6/1/21 | 11/30/21 | 6/1/21 – 11/30/21 | |||||
| Class A | |||||||
| Actual | $1,000.00 | $1,011.30 | $3.18 | ||||
| Hypothetical (5% Return Before Expenses) | $1,000.00 | $1,021.91 | $3.19 | ||||
| Class C | |||||||
| Actual | $1,000.00 | $1,008.20 | $6.34 | ||||
| Hypothetical (5% Return Before Expenses) | $1,000.00 | $1,018.75 | $6.38 | ||||
| Class F | |||||||
| Actual | $1,000.00 | $1,011.80 | $2.67 | ||||
| Hypothetical (5% Return Before Expenses) | $1,000.00 | $1,022.41 | $2.69 | ||||
| Class F3 | |||||||
| Actual | $1,000.00 | $1,011.90 | $1.71 | ||||
| Hypothetical (5% Return Before Expenses) | $1,000.00 | $1,023.36 | $1.72 | ||||
| Class I | |||||||
| Actual | $1,000.00 | $1,012.60 | $1.97 | ||||
| Hypothetical (5% Return Before Expenses) | $1,000.00 | $1,023.11 | $1.98 | ||||
| Class P | |||||||
| Actual | $1,000.00 | $1,010.10 | $4.43 | ||||
| Hypothetical (5% Return Before Expenses) | $1,000.00 | $1,020.66 | $4.46 | ||||
| Class R2 | |||||||
| Actual | $1,000.00 | $1,009.30 | $5.19 | ||||
| Hypothetical (5% Return Before Expenses) | $1,000.00 | $1,019.90 | $5.22 | ||||
| Class R3 | |||||||
| Actual | $1,000.00 | $1,009.80 | $4.74 | ||||
| Hypothetical (5% Return Before Expenses) | $1,000.00 | $1,020.36 | $4.76 | ||||
| Class R4 | |||||||
| Actual | $1,000.00 | $1,011.10 | $3.43 | ||||
| Hypothetical (5% Return Before Expenses) | $1,000.00 | $1,021.66 | $3.45 | ||||
| Class R5 | |||||||
| Actual | $1,000.00 | $1,011.40 | $2.17 | ||||
| Hypothetical (5% Return Before Expenses) | $1,000.00 | $1,022.91 | $2.18 | ||||
| Class R6 | |||||||
| Actual | $1,000.00 | $1,012.80 | $1.72 | ||||
| Hypothetical (5% Return Before Expenses) | $1,000.00 | $1,023.36 | $1.72 |
| † | For each class of the Fund, net expenses are equal to the annualized expense ratio for such class (0.63% for Class A, 1.26% for Class C, 0.53% for Class F, 0.34% for Class F3, 0.39% for Class I, 0.88% for Class P, 1.03% for Class R2, 0.94% for Class R3, 0.68% for Class R4, 0.43% for Class R5 and 0.34% for Class R6) multiplied by the average account value over the period, multiplied by 183/365 (to reflect one-half year period). |
70
Portfolio Holdings Presented by Sector
November 30, 2021
| Sector* | %** | |||
| Asset Backed Securities | 15.64 | % | ||
| Basic Materials | 1.98 | % | ||
| Communications | 2.11 | % | ||
| Consumer, Cyclical | 4.95 | % | ||
| Consumer, Non-cyclical | 2.48 | % | ||
| Energy | 5.09 | % | ||
| Financial | 11.31 | % | ||
| Sector* | %** | |||
| Government | 34.29 | % | ||
| Industrial | 1.14 | % | ||
| Mortgage Securities | 14.50 | % | ||
| Technology | 2.02 | % | ||
| Utilities | 2.48 | % | ||
| Repurchase Agreements | 2.01 | % | ||
| Total | 100.00 | % | ||
| * | A sector may comprise several industries. | |
| ** | Represents percent of total investments. |
71
Ultra Short Bond Fund
Please note that the expenses shown in the table are meant to highlight your ongoing costs only and do not reflect any transactional costs, such as sales charges (loads). Therefore, the second line of the table is useful in comparing ongoing costs only, and will not help you determine the relative total costs of owning different funds. In addition, if these transactional costs were included, your costs would have been higher.
| Beginning Account Value | Ending Account Value | Expenses Paid During Period† | |||||||
| 6/1/21 | 11/30/21 | 6/1/21 – 11/30/21 | |||||||
| Class A | |||||||||
| Actual | $1,000.00 | $ | 999.00 | $2.15 | |||||
| Hypothetical (5% Return Before Expenses) | $1,000.00 | $ | 1,022.91 | $2.18 | |||||
| Class A1 | |||||||||
| Actual | $1,000.00 | $ | 997.50 | $2.65 | |||||
| Hypothetical (5% Return Before Expenses) | $1,000.00 | $ | 1,022.41 | $2.69 | |||||
| Class F | |||||||||
| Actual | $1,000.00 | $ | 998.30 | $1.90 | |||||
| Hypothetical (5% Return Before Expenses) | $1,000.00 | $ | 1,023.16 | $1.93 | |||||
| Class F3 | |||||||||
| Actual | $1,000.00 | $ | 1,000.00 | $1.15 | |||||
| Hypothetical (5% Return Before Expenses) | $1,000.00 | $ | 1,023.92 | $1.17 | |||||
| Class I | |||||||||
| Actual | $1,000.00 | $ | 999.70 | $1.40 | |||||
| Hypothetical (5% Return Before Expenses) | $1,000.00 | $ | 1,023.66 | $1.42 | |||||
| Class R5 | |||||||||
| Actual | $1,000.00 | $ | 998.80 | $1.40 | |||||
| Hypothetical (5% Return Before Expenses) | $1,000.00 | $ | 1,023.66 | $1.42 | |||||
| Class R6 | |||||||||
| Actual | $1,000.00 | $ | 999.00 | $1.15 | |||||
| Hypothetical (5% Return Before Expenses) | $1,000.00 | $ | 1,023.92 | $1.17 | |||||
| † | For each class of the Fund, net expenses are equal to the annualized expense ratio for such class (0.43% for Class A, 0.53% for Class A1, 0.38% for Class F, 0.23% for Class F3, 0.28% for Class I, 0.28% for Class R5 and 0.23% for Class R6) multiplied by the average account value over the period, multiplied by 183/365 (to reflect one-half year period). |
72
Portfolio Holdings Presented by Sector
November 30, 2021
| Sector* | %** | |||
| Asset Backed Securities | 25.38 | % | ||
| Basic Materials | 1.39 | % | ||
| Communications | 2.42 | % | ||
| Consumer, Cyclical | 7.15 | % | ||
| Consumer, Non-cyclical | 4.49 | % | ||
| Energy | 1.88 | % | ||
| Financial | 37.04 | % | ||
| Sector* | %** | |||
| Government | 2.56 | % | ||
| Industrial | 2.37 | % | ||
| Mortgage Securities | 10.72 | % | ||
| Technology | 0.77 | % | ||
| Utilities | 3.28 | % | ||
| Repurchase Agreements | 0.55 | % | ||
| Total | 100.00 | % | ||
| * | A sector may comprise several industries. | |
| ** | Represents percent of total investments. |
73
This page is intentionally left blank.
74
CONVERTIBLE FUND November 30, 2021
| Shares | Fair | |||||||||||||
| Investments | (000) | Value | ||||||||||||
| LONG-TERM INVESTMENTS 95.22% | ||||||||||||||
| COMMON STOCKS 1.47% | ||||||||||||||
| Biotechnology 1.16% | ||||||||||||||
| Arena Pharmaceuticals, Inc.* | 139 | $ | 7,574,110 | |||||||||||
| Mirati Therapeutics, Inc.* | 46 | 6,356,386 | ||||||||||||
| Rocket Pharmaceuticals, Inc.* | 191 | 4,657,091 | ||||||||||||
| Total | 18,587,587 | |||||||||||||
| Software 0.31% | ||||||||||||||
| ServiceNow, Inc.* | 8 | 5,074,729 | ||||||||||||
| Total Common Stocks (cost $27,123,589) | 23,662,316 | |||||||||||||
| Principal | ||||||||||||||
| Interest | Maturity | Amount | ||||||||||||
| Rate | Date | (000) | ||||||||||||
| CONVERTIBLE BONDS 82.95% | ||||||||||||||
| Airlines 2.64% | ||||||||||||||
| JetBlue Airways Corp.† | 0.50% | 4/1/2026 | $ | 17,240 | 16,309,040 | |||||||||
| Southwest Airlines Co. | 1.25% | 5/1/2025 | 19,355 | 26,068,766 | ||||||||||
| Total | 42,377,806 | |||||||||||||
| Apparel 0.86% | ||||||||||||||
| Kering SA(a) | Zero Coupon | 9/30/2022 | EUR | 10,300 | 13,878,885 | |||||||||
| Auto Manufacturers 3.43% | ||||||||||||||
| Ford Motor Co.† | Zero Coupon | 3/15/2026 | $ | 21,330 | 27,755,662 | |||||||||
| Tesla, Inc. | 2.00% | 5/15/2024 | 1,482 | 27,330,209 | ||||||||||
| Total | 55,085,871 | |||||||||||||
| Beverages 0.71% | ||||||||||||||
| MGP Ingredients, Inc.† | 1.875% | 11/15/2041 | 10,530 | 11,396,270 | ||||||||||
| Biotechnology 2.81% | ||||||||||||||
| Bridgebio Pharma, Inc.† | 2.25% | 2/1/2029 | 22,165 | 17,676,587 | ||||||||||
| Gossamer Bio, Inc. | 5.00% | 6/1/2027 | 7,630 | 7,446,880 | ||||||||||
| Insmed, Inc. | 0.75% | 6/1/2028 | 18,225 | 20,115,844 | ||||||||||
| Total | 45,239,311 | |||||||||||||
| See Notes to Financial Statements. | 75 |
Schedule of Investments (continued)
CONVERTIBLE FUND November 30, 2021
| Principal | ||||||||||||||
| Interest | Maturity | Amount | Fair | |||||||||||
| Investments | Rate | Date | (000 | ) | Value | |||||||||
| Commercial Services 4.11% | ||||||||||||||
| Affirm Holdings, Inc.† | Zero Coupon | 11/15/2026 | $ | 10,499 | $ | 10,352,609 | ||||||||
| Chegg, Inc. | Zero Coupon | 9/1/2026 | 40,330 | 33,211,755 | ||||||||||
| Square, Inc. | 0.25% | 11/1/2027 | 20,205 | 22,591,716 | ||||||||||
| Total | 66,156,080 | |||||||||||||
| Computers 5.47% | ||||||||||||||
| Rapid7, Inc.† | 0.25% | 3/15/2027 | 20,970 | 28,046,990 | ||||||||||
| Western Digital Corp. | 1.50% | 2/1/2024 | 37,455 | 37,642,275 | ||||||||||
| Zscaler, Inc. | 0.125% | 7/1/2025 | 9,445 | 22,214,640 | ||||||||||
| Total | 87,903,905 | |||||||||||||
| Cosmetics/Personal Care 0.70% | ||||||||||||||
| Beauty Health Co. (The)† | 1.25% | 10/1/2026 | 10,208 | 11,305,360 | ||||||||||
| Diversified Financial Services 1.03% | ||||||||||||||
| Coinbase Global, Inc.† | 0.50% | 6/1/2026 | 13,945 | 16,469,045 | ||||||||||
| Energy-Alternate Sources 5.93% | ||||||||||||||
| Enphase Energy, Inc.† | Zero Coupon | 3/1/2028 | 18,120 | 21,001,080 | ||||||||||
| Green Plains, Inc. | 2.25% | 3/15/2027 | 9,550 | 13,747,609 | ||||||||||
| Plug Power, Inc. | 3.75% | 6/1/2025 | 2,065 | 16,365,331 | ||||||||||
| SolarEdge Technologies, Inc. (Israel)(b) | Zero Coupon | 9/15/2025 | 13,980 | 19,138,620 | ||||||||||
| SunPower Corp. | 4.00% | 1/15/2023 | 6,550 | 8,846,594 | ||||||||||
| Sunrun, Inc.† | Zero Coupon | 2/1/2026 | 18,740 | 16,302,075 | ||||||||||
| Total | 95,401,309 | |||||||||||||
| Engineering & Construction 0.86% | ||||||||||||||
| Granite Construction, Inc. | 2.75% | 11/1/2024 | 10,165 | 13,808,269 | ||||||||||
| Entertainment 3.67% | ||||||||||||||
| Live Nation Entertainment, Inc. | 2.50% | 3/15/2023 | 14,910 | 24,309,790 | ||||||||||
| Marriott Vacations Worldwide Corp. | 1.50% | 9/15/2022 | 17,095 | 19,552,406 | ||||||||||
| Vail Resorts, Inc.† | Zero Coupon | 1/1/2026 | 14,145 | 15,161,672 | ||||||||||
| Total | 59,023,868 | |||||||||||||
| Health Care-Products 3.91% | ||||||||||||||
| CONMED Corp. | 2.625% | 2/1/2024 | 9,245 | 14,491,538 | ||||||||||
| Insulet Corp. | 0.375% | 9/1/2026 | 18,615 | 26,026,097 | ||||||||||
| Natera, Inc. | 2.25% | 5/1/2027 | 3,510 | 8,838,619 | ||||||||||
| Repligen Corp. | 0.375% | 7/15/2024 | 5,345 | 13,561,944 | ||||||||||
| Total | 62,918,198 | |||||||||||||
| 76 | See Notes to Financial Statements. |
Schedule of Investments (continued)
CONVERTIBLE FUND November 30, 2021
| Principal | ||||||||||||||
| Interest | Maturity | Amount | Fair | |||||||||||
| Investments | Rate | Date | (000) | Value | ||||||||||
| Internet 17.26% | ||||||||||||||
| Airbnb, Inc.† | Zero Coupon | 3/15/2026 | $ | 35,605 | $ | 35,337,963 | ||||||||
| Booking Holdings, Inc. | 0.75% | 5/1/2025 | 9,145 | 12,350,323 | ||||||||||
| Etsy, Inc.† | 0.25% | 6/15/2028 | 33,185 | 44,219,012 | ||||||||||
| Expedia Group, Inc.† | Zero Coupon | 2/15/2026 | 18,580 | 20,010,660 | ||||||||||
| fuboTV, Inc.† | 3.25% | 2/15/2026 | 13,220 | 11,437,989 | ||||||||||
| MakeMyTrip Ltd. (India)†(b) | Zero Coupon | 2/15/2028 | 15,310 | 14,636,378 | ||||||||||
| Mandiant, Inc. | 1.625% | 6/1/2035 | 36,345 | 36,461,780 | ||||||||||
| Match Group Financeco 2, Inc.† | 0.875% | 6/15/2026 | 11,890 | 18,934,825 | ||||||||||
| MercadoLibre, Inc. (Argentina)(b) | 2.00% | 8/15/2028 | 2,470 | 6,819,917 | ||||||||||
| Palo Alto Networks, Inc. | 0.375% | 6/1/2025 | 16,540 | 30,888,450 | ||||||||||
| RealReal, Inc. (The)† | 1.00% | 3/1/2028 | 13,040 | 11,636,896 | ||||||||||
| Sea Ltd. (Singapore)(b) | 2.375% | 12/1/2025 | 3,350 | 10,799,563 | ||||||||||
| Shopify, Inc. (Canada)(b) | 0.125% | 11/1/2025 | 12,305 | 15,742,709 | ||||||||||
| Snap, Inc. | 0.75% | 8/1/2026 | 3,825 | 8,358,765 | ||||||||||
| Total | 277,635,230 | |||||||||||||
| Leisure Time 1.93% | ||||||||||||||
| Royal Caribbean Cruises Ltd. | 4.25% | 6/15/2023 | 25,890 | 30,958,656 | ||||||||||
| Machinery-Diversified 2.05% | ||||||||||||||
| Chart Industries, Inc.† | 1.00% | 11/15/2024 | 5,700 | 17,164,125 | ||||||||||
| Middleby Corp. (The) | 1.00% | 9/1/2025 | 10,895 | 15,759,618 | ||||||||||
| Total | 32,923,743 | |||||||||||||
| Media 1.38% | ||||||||||||||
| Liberty Media Corp-Liberty Formula One | 1.00% | 1/30/2023 | 13,300 | 22,200,972 | ||||||||||
| Mining 1.02% | ||||||||||||||
| Livent Corp. | 4.125% | 7/15/2025 | 4,585 | 16,402,838 | ||||||||||
| Miscellaneous Manufacturing 1.23% | ||||||||||||||
| John Bean Technologies Corp.† | 0.25% | 5/15/2026 | 17,591 | 19,737,102 | ||||||||||
| Pharmaceuticals 6.25% | ||||||||||||||
| Canopy Growth Corp.†(a) | 4.25% | 7/15/2023 | CAD | 73,805 | 55,464,245 | (e) | ||||||||
| Dexcom, Inc. | 0.75% | 12/1/2023 | $ | 9,995 | 34,220,381 | |||||||||
| Sarepta Therapeutics, Inc. | 1.50% | 11/15/2024 | 7,960 | 10,855,450 | ||||||||||
| Total | 100,540,076 | |||||||||||||
| See Notes to Financial Statements. | 77 |
Schedule of Investments (continued)
CONVERTIBLE FUND November 30, 2021
| Principal | ||||||||||||||
| Interest | Maturity | Amount | Fair | |||||||||||
| Investments | Rate | Date | (000 | ) | Value | |||||||||
| REITS 1.66% | ||||||||||||||
| IH Merger Sub LLC | 3.50% | 1/15/2022 | $ | 7,370 | $ | 13,081,785 | ||||||||
| IIP Operating Partnership LP† | 3.75% | 2/21/2024 | 3,495 | 13,674,190 | ||||||||||
| Total | 26,755,975 | |||||||||||||
| Semiconductors 1.24% | ||||||||||||||
| ON Semiconductor Corp.† | Zero Coupon | 5/1/2027 | 8,874 | 12,199,616 | ||||||||||
| ON Semiconductor Corp. | 1.625% | 10/15/2023 | 2,625 | 7,801,172 | ||||||||||
| Total | 20,000,788 | |||||||||||||
| Software 7.55% | ||||||||||||||
| Alteryx, Inc. | 0.50% | 8/1/2024 | 17,500 | 16,662,620 | ||||||||||
| Avalara, Inc.† | 0.25% | 8/1/2026 | 20,225 | 19,335,100 | ||||||||||
| Bill.com Holdings, Inc.† | Zero Coupon | 4/1/2027 | 11,445 | 12,429,270 | ||||||||||
| HubSpot, Inc. | 0.375% | 6/1/2025 | 8,315 | 24,524,053 | ||||||||||
| MongoDB, Inc. | 0.25% | 1/15/2026 | 13,015 | 31,323,208 | ||||||||||
| ServiceNow, Inc. | Zero Coupon | 6/1/2022 | 3,580 | 17,195,844 | ||||||||||
| Total | 121,470,095 | |||||||||||||
| Transportation 4.62% | ||||||||||||||
| Atlas Air Worldwide Holdings, Inc. | 1.875% | 6/1/2024 | 9,580 | 14,825,050 | ||||||||||
| CryoPort, Inc.† | 0.75% | 12/1/2026 | 15,230 | 14,666,917 | ||||||||||
| Scorpio Tankers, Inc. (Monaco)†(b) | 3.00% | 5/15/2025 | 44,558 | 44,852,989 | ||||||||||
| Total | 74,344,956 | |||||||||||||
| Trucking & Leasing 0.63% | ||||||||||||||
| Greenbrier Cos., Inc. (The)† | 2.875% | 4/15/2028 | 9,770 | 10,111,950 | ||||||||||
| Total Convertible Bonds (cost $1,258,226,008) | 1,334,046,558 | |||||||||||||
| Dividend | Shares | |||||||||||||
| Rate | (000) | |||||||||||||
| CONVERTIBLE PREFERRED STOCKS 10.61% | ||||||||||||||
| Commercial Banks 1.18% | ||||||||||||||
| Bank of America Corp. | 7.25% | 13 | 19,001,200 | |||||||||||
| Electric: Utilities 2.66% | ||||||||||||||
| NextEra Energy, Inc. | 4.872% | 676 | 42,866,809 | |||||||||||
| Health Care Equipment & Supplies 2.62% | ||||||||||||||
| Danaher Corp. | 4.75% | 20 | 42,067,286 | |||||||||||
| 78 | See Notes to Financial Statements. |
Schedule of Investments (continued)
CONVERTIBLE FUND November 30, 2021
| Dividend | Shares | Fair | ||||||||||||
| Investments | Rate | (000) | Value | |||||||||||
| Media 0.55% | ||||||||||||||
| ViacomCBS, Inc.(c) | 5.75% | 170 | $ | 8,789,174 | ||||||||||
| Metals & Mining 0.55% | ||||||||||||||
| RBC Bearings, Inc. | 5.00% | 84 | 8,778,537 | |||||||||||
| Semiconductors & Semiconductor Equipment 3.05% | ||||||||||||||
| Broadcom, Inc. | 8.00% | 28 | 49,058,430 | |||||||||||
| Total Convertible Preferred Stocks (cost $149,443,676) | 170,561,436 | |||||||||||||
| Principal | ||||||||||||||
| Interest | Maturity | Amount | ||||||||||||
| Rate | Date | (000) | ||||||||||||
| CORPORATE BONDS 0.19% | ||||||||||||||
| Oil & Gas | ||||||||||||||
| Nabors Industries, Inc. (cost $3,124,800) | 5.75 | % | 2/1/2025 | $ | 3,720 | 3,116,951 | ||||||||
| Total Long-Term Investments (cost $1,437,918,073) | 1,531,387,261 | |||||||||||||
| SHORT-TERM INVESTMENTS 5.22% | ||||||||||||||
| Repurchase Agreements 4.64% | ||||||||||||||
| Repurchase Agreement dated 11/30/2021, 0.00% due 12/1/2021 with Fixed Income Clearing Corp. collateralized by $73,396,900 of U.S. Treasury Note at 2.75% due 4/30/2023; value: $76,055,630; proceeds: $74,564,305 (cost $74,564,305) | 74,564 | 74,564,305 | ||||||||||||
| Shares | ||||||||||||||
| (000) | ||||||||||||||
| Money Market Funds 0.52% | ||||||||||||||
| Fidelity Government Portfolio(d) (cost $8,367,601) | 8,368 | 8,367,601 | ||||||||||||
| Time Deposits 0.06% | ||||||||||||||
| CitiBank N.A.(d) (cost $929,734) | 930 | 929,734 | ||||||||||||
| Total Short-Term Investments (cost $83,861,640) | 83,861,640 | |||||||||||||
| Total Investments in Securities 100.44% (cost $1,521,779,713) | 1,615,248,901 | |||||||||||||
| Other Assets and Liabilities – Net(f) (0.44)% | (7,040,044 | ) | ||||||||||||
| Net Assets 100.00% | $ | 1,608,208,857 | ||||||||||||
| See Notes to Financial Statements. | 79 |
Schedule of Investments (continued)
CONVERTIBLE FUND November 30, 2021
| CAD | Canadian Dollar. | |
| EUR | Euro. | |
| * | Non-income producing security. | |
| † | Security was purchased pursuant to Rule 144A under the Securities Act of 1933 and, unless registered under such Act or exempted from registration, may only be resold to qualified institutional buyers. At November 30, 2021, the total value of Rule 144A securities was $567,625,617, which represents 35.31% of net assets. | |
| (a) | Investment in non-U.S. dollar denominated securities. | |
| (b) | Foreign security traded in U.S. dollars. | |
| (c) | All or a portion of this security is temporarily on loan to unaffiliated broker/dealers. | |
| (d) | Security was purchased with the cash collateral from loaned securities. | |
| (e) | Level 3 Investment as described in Note 2(t) in the Notes to Financials. Security valued utilizing third party pricing information without adjustment. Such valuations are based on unobservable inputs. A significant change in third party information could result in a significantly lower or higher value of such Level 3 investments. | |
| (f) | Other Assets and Liabilities – Net include net unrealized appreciation/depreciation on forward foreign currency exchange contracts as follows: |
Open Forward Foreign Currency Exchange Contracts at November 30, 2021:
| Forward | ||||||||||||||||||||||
| Foreign | U.S. $ | |||||||||||||||||||||
| Currency | Cost on | U.S. $ | ||||||||||||||||||||
| Exchange | Transaction | Expiration | Foreign | Origination | Current | Unrealized | ||||||||||||||||
| Contracts | Type | Counterparty | Date | Currency | Date | Value | Appreciation | |||||||||||||||
| Canadian dollar | Sell | Morgan Stanley | 1/20/2022 | 2,119,000 | $ | 1,694,187 | $ | 1,659,569 | $ | 34,618 | ||||||||||||
| Canadian dollar | Sell | State Street Bank and Trust | 1/20/2022 | 662,000 | 535,238 | 518,469 | 16,769 | |||||||||||||||
| Canadian dollar | Sell | State Street Bank and Trust | 1/20/2022 | 1,461,000 | 1,177,867 | 1,144,233 | 33,634 | |||||||||||||||
| Canadian dollar | Sell | State Street Bank and Trust | 1/20/2022 | 4,629,000 | 3,660,453 | 3,625,364 | 35,089 | |||||||||||||||
| Canadian dollar | Sell | Toronto Dominion Bank | 1/20/2022 | 65,288,000 | 52,805,643 | 51,132,586 | 1,673,057 | |||||||||||||||
| Euro | Sell | State Street Bank and Trust | 12/10/2021 | 10,624,000 | 12,582,503 | 12,050,852 | 531,651 | |||||||||||||||
| Euro | Sell | State Street Bank and Trust | 12/10/2021 | 1,663,000 | 1,931,361 | 1,886,348 | 45,013 | |||||||||||||||
| Unrealized Appreciation on Forward Foreign Currency Exchange Contracts | $ | 2,369,831 | ||||||||||||||||||||
| Forward | ||||||||||||||||||||||
| Foreign | U.S. $ | |||||||||||||||||||||
| Currency | Cost on | U.S. $ | ||||||||||||||||||||
| Exchange | Transaction | Expiration | Foreign | Origination | Current | Unrealized | ||||||||||||||||
| Contracts | Type | Counterparty | Date | Currency | Date | Value | Depreciation | |||||||||||||||
| Canadian dollar | Buy | State Street Bank and Trust | 1/20/2022 | 2,337,000 | $ | 1,848,264 | $ | 1,830,303 | $ | (17,961 | ) | |||||||||||
| 80 | See Notes to Financial Statements. |
Schedule of Investments (concluded)
CONVERTIBLE FUND November 30, 2021
The following is a summary of the inputs used as of November 30, 2021 in valuing the Fund’s investments carried at fair value(1):
| Investment Type | Level 1 | Level 2 | Level 3 | Total | ||||||||||||
| Long-Term Investments | ||||||||||||||||
| Common Stocks | $ | 23,662,316 | $ | – | $ | – | $ | 23,662,316 | ||||||||
| Convertible Bonds | – | 1,278,582,313 | 55,464,245 | 1,334,046,558 | ||||||||||||
| Convertible Preferred Stocks | 108,693,427 | 61,868,009 | – | 170,561,436 | ||||||||||||
| Corporate Bonds | – | 3,116,951 | – | 3,116,951 | ||||||||||||
| Short-Term Investments | ||||||||||||||||
| Repurchase Agreements | – | 74,564,305 | – | 74,564,305 | ||||||||||||
| Money Market Funds | 8,367,601 | – | – | 8,367,601 | ||||||||||||
| Time Deposits | – | 929,734 | – | 929,734 | ||||||||||||
| Total | $ | 140,723,344 | $ | 1,419,061,312 | $ | 55,464,245 | $ | 1,615,248,901 | ||||||||
| Other Financial Instruments | ||||||||||||||||
| Forward Foreign Currency Exchange Contracts | ||||||||||||||||
| Assets | $ | – | $ | 2,369,831 | $ | – | $ | 2,369,831 | ||||||||
| Liabilities | – | (17,961 | ) | – | (17,961 | ) | ||||||||||
| Total | $ | – | $ | 2,351,870 | $ | – | $ | 2,351,870 | ||||||||
| (1) | Refer to Note 2(t) for a description of fair value measurements and the three-tier hierarchy of inputs. |
| (2) | See Schedule of Investments for fair values in each industry and identification of foreign issuers and/or geography. The table above is presented by Investment Type. Industries are presented within an Investment Type should such Investment Type include securities classified as two or more levels within the three-tier fair value hierarchy. When applicable each Level 3 security is identified on the Schedule of Investments along with the valuation technique utilized. |
A reconciliation of Level 3 investments is presented when the Fund has a material amount of Level 3 investments at the beginning or end of the year in relation to the Fund’s net assets.
The following is a reconciliation of investments with unobservable inputs (Level 3) that were used in determining fair value:
| Convertible | ||||
| Investment Type | Bonds | |||
| Balance as of December 1, 2020 | $ | – | ||
| Accrued Discounts (Premiums) | 1,111,888 | |||
| Realized Gain (Loss) | 8,505,534 | |||
| Change in Unrealized Appreciation (Depreciation) | (10,273,998 | ) | ||
| Purchases | 30,804,913 | |||
| Sales | (33,168,615 | ) | ||
| Transfers into Level 3 | 58,484,523 | |||
| Transfers out of Level 3 | – | |||
| Balance as of November 30, 2021 | $ | 55,464,245 | ||
| Change in unrealized appreciation/depreciation for the year ended November 30, 2021, related to Level 3 investments held at November 30, 2021 | $ | (10,273,998 | ) | |
| See Notes to Financial Statements. | 81 |
Schedule of Investments
CORE FIXED INCOME FUND November 30, 2021
| Investments | Interest Rate | Maturity Date | Principal Amount (000) | Fair Value | ||||||||
| LONG-TERM INVESTMENTS 106.23% | ||||||||||||
| ASSET-BACKED SECURITIES 15.29% | ||||||||||||
| Auto Floor Plan 0.24% | ||||||||||||
| Ford Credit Floorplan Master Owner Trust 2018-4 A | 4.06% | 11/15/2030 | $ | 4,263 | $ | 4,813,913 | ||||||
| Automobiles 4.09% | ||||||||||||
| Avid Automobile Receivables Trust 2019-1 A† | 2.62% | 2/15/2024 | 11 | 11,239 | ||||||||
| Avid Automobile Receivables Trust 2019-1 B† | 2.82% | 7/15/2026 | 653 | 659,053 | ||||||||
| Carmax Auto Owner Trust 2021-1 A2A | 0.22% | 2/15/2024 | 8,831 | 8,828,531 | ||||||||
| CPS Auto Receivables Trust 2018-B D† | 4.26% | 3/15/2024 | 603 | 611,599 | ||||||||
| Flagship Credit Auto Trust 2020-2 A† | 1.49% | 7/15/2024 | 394 | 394,517 | ||||||||
| Flagship Credit Auto Trust 2021-1 A† | 0.31% | 6/16/2025 | 3,324 | 3,316,726 | ||||||||
| Ford Credit Auto Lease Trust 2021-A A2 | 0.19% | 7/15/2023 | 9,492 | 9,490,392 | ||||||||
| Ford Credit Auto Owner Trust 2020-B A2 | 0.50% | 2/15/2023 | 110 | 109,557 | ||||||||
| Ford Credit Auto Owner Trust REV1 2021-1 C† | 1.91% | 10/17/2033 | 1,800 | 1,788,577 | ||||||||
| Foursight Capital Automobile Receivables Trust 2018-1 C† | 3.68% | 8/15/2023 | 406 | 406,481 | ||||||||
| GM Financial Consumer Automobile Receivables Trust 2018-4 A3 | 3.21% | 10/16/2023 | 889 | 895,006 | ||||||||
| Hertz Vehicle Financing III LP 2021-2A A† | 1.68% | 12/27/2027 | 13,526 | 13,518,769 | ||||||||
| Honda Auto Receivables Owner Trust 2020-2 A2 | 0.74% | 11/15/2022 | 37 | 37,316 | ||||||||
| Mercedes-Benz Auto Lease Trust 2021-A A2 | 0.18% | 3/15/2023 | 7,846 | 7,844,799 | ||||||||
| OneMain Direct Auto Receivables Trust 2019-1A B† | 3.95% | 11/14/2028 | 3,150 | 3,388,297 | ||||||||
| Santander Drive Auto Receivables Trust 2021-1 A2 | 0.29% | 11/15/2023 | 2,566 | 2,566,176 | ||||||||
| Toyota Auto Receivables Owner Trust 2021-A A2 | 0.16% | 7/17/2023 | 12,124 | 12,119,946 | ||||||||
| Westlake Automobile Receivables Trust 2019-2A D† | 3.20% | 11/15/2024 | 1,285 | 1,311,542 | ||||||||
| Westlake Automobile Receivables Trust 2020-2A A2A† | 0.93% | 2/15/2024 | 2,913 | 2,916,321 | ||||||||
| Westlake Automobile Receivables Trust 2020-3A E† | 3.34% | 6/15/2026 | 3,875 | 3,962,479 | ||||||||
| World Omni Auto Receivables Trust 2018-B A3 | 2.87% | 7/17/2023 | 269 | 269,460 | ||||||||
| World Omni Auto Receivables Trust 2021-A A2 | 0.17% | 2/15/2024 | 9,256 | 9,252,005 | ||||||||
| Total | 83,698,788 | |||||||||||
| 82 | See Notes to Financial Statements. |
Schedule of Investments (continued)
CORE FIXED INCOME FUND November 30, 2021
| Investments | Interest Rate | Maturity Date | Principal Amount (000) | Fair Value | ||||||||
| Credit Card 0.77% | ||||||||||||
| Capital One Multi-Asset Execution Trust 2005-B3 B3 | 0.674% (3 Mo. LIBOR + .55% | )# | 5/15/2028 | $ | 2,677 | $ | 2,661,509 | |||||
| Continental Finance Credit Card ABS Master Trust 2020-1A A† | 2.24% | 12/15/2028 | 9,100 | 9,085,796 | ||||||||
| Genesis Sales Finance Master Trust 2020-AA B† | 2.24% | 9/22/2025 | 4,000 | 4,015,378 | ||||||||
| Total | 15,762,683 | |||||||||||
| Other 10.00% | ||||||||||||
| AMMC CLO Ltd. 2020-23A CR† | 2.123% (3 Mo. LIBOR + 2.00% | )# | 10/17/2031 | 3,200 | 3,200,692 | |||||||
| AMMC CLO Ltd. 2021-24A B†(a) | Zero Coupon | #(b) | 1/20/2035 | 4,250 | 4,250,000 | |||||||
| Apidos CLO XXXV 2021-35A A† | 1.182% (3 Mo. LIBOR + 1.05% | )# | 4/20/2034 | 2,250 | 2,250,277 | |||||||
| Aqua Finance Trust 2021-A C† | 3.14% | 7/17/2046 | 9,564 | 9,534,858 | ||||||||
| Arbor Realty Collateralized Loan Obligation Ltd. 2021-FL2 AS† | 1.49% (1 Mo. LIBOR + 1.40% | )# | 5/15/2036 | 5,760 | 5,737,651 | |||||||
| Arbor Realty Commercial Real Estate Notes Ltd. 2021-FL3 D† | 2.29% (1 Mo. LIBOR + 2.20% | )# | 8/15/2034 | 3,805 | 3,779,640 | |||||||
| Ares LVII CLO Ltd. 2020-57A D† | 4.474% (3 Mo. LIBOR + 4.35% | )# | 10/25/2031 | 2,000 | 2,005,285 | |||||||
| Bain Capital Credit CLO 2019-2A AR† | 1.222% (3 Mo. LIBOR + 1.10% | )# | 10/17/2032 | 5,160 | 5,163,857 | |||||||
| Barings CLO Ltd. 2019-3A BR† | 1.732% (3 Mo. LIBOR + 1.60% | )# | 4/20/2031 | 3,080 | 3,082,508 | |||||||
| BlueMountain CLO Ltd. 2015-2A A1R† | 1.052% (3 Mo. LIBOR + .93% | )# | 7/18/2027 | 239 | 239,285 | |||||||
| Carlyle Global Market Strategies CLO Ltd. 2015-5A BRR† | 2.432% (3 Mo. LIBOR + 2.30% | )# | 1/20/2032 | 2,400 | 2,403,615 | |||||||
| CBAM Ltd. 2017-1A D† | 3.882% (3 Mo. LIBOR + 3.75% | )# | 7/20/2030 | 2,850 | 2,854,851 | |||||||
| CIFC Funding I Ltd. 2021-1A A1† | 1.234% (3 Mo. LIBOR + 1.11% | )# | 4/25/2033 | 8,040 | 8,044,013 | |||||||
| Dell Equipment Finance Trust 2019-2 A3† | 1.91% | 10/22/2024 | 3,345 | 3,361,392 | ||||||||
| Diamond Resorts Owner Trust 2017-1A B† | 4.11% | 10/22/2029 | 335 | 336,641 | ||||||||
| Dryden 61 CLO Ltd. 2018-61A A1R† | 1.112% (3 Mo. LIBOR + .99% | )# | 1/17/2032 | 5,060 | 5,058,906 | |||||||
| Dryden Senior Loan Fund 2017-47A BR† | 1.594% (3 Mo. LIBOR + 1.47% | )# | 4/15/2028 | 6,200 | 6,210,985 | |||||||
| Eaton Vance CLO Ltd. 2013-1A A13R† | 1.374% (3 Mo. LIBOR + 1.25% | )# | 1/15/2034 | 4,510 | 4,523,088 | |||||||
| See Notes to Financial Statements. | 83 |
Schedule of Investments (continued)
CORE FIXED INCOME FUND November 30, 2021
| Investments | Interest Rate | Maturity Date | Principal Amount (000) | Fair Value | ||||||||
| Other (continued) | ||||||||||||
| Elmwood CLO VIII Ltd. 2021-1A A1† | 1.372% (3 Mo. LIBOR + 1.24% | )# | 1/20/2034 | $ | 3,490 | $ | 3,503,300 | |||||
| Encina Equipment Finance LLC 2021-1A D† | 1.69% | 11/15/2027 | 4,500 | 4,475,009 | ||||||||
| Galaxy XXI CLO Ltd. 2015-21A AR† | 1.152% (3 Mo. LIBOR + 1.02% | )# | 4/20/2031 | 485 | 485,281 | |||||||
| Hardee’s Funding LLC 2018-1A A2II† | 4.959% | 6/20/2048 | 693 | 733,421 | ||||||||
| HGI CRE CLO Ltd. 2021-FL2 B† | 1.589% (1 Mo. LIBOR + 1.50% | )# | 9/17/2036 | 5,900 | 5,904,508 | |||||||
| Invesco CLO Ltd. 2021-3A B†(a) | Zero Coupon | #(b) | 10/22/2034 | 1,890 | 1,890,000 | (c) | ||||||
| Kayne CLO 5 Ltd. 2019-5A A† | 1.474% (3 Mo. LIBOR + 1.35% | )# | 7/24/2032 | 4,000 | 4,004,992 | |||||||
| Kayne CLO Ltd. 2020-7A A1† | 1.322% (3 Mo. LIBOR + 1.20% | )# | 4/17/2033 | 4,578 | 4,585,141 | |||||||
| Kayne CLO Ltd. 2021-10A A† | Zero Coupon | #(b) | 4/23/2034 | 6,640 | 6,664,443 | |||||||
| KKR CLO Ltd.18 D† | 3.722% (3 Mo. LIBOR + 3.60% | )# | 7/18/2030 | 332 | 332,855 | |||||||
| KKR CLO Ltd.-29A A† | 1.324% (3 Mo. LIBOR + 1.20% | )# | 1/15/2032 | 2,950 | 2,955,960 | |||||||
| Lending Funding Trust 2020-2A A† | 2.32% | 4/21/2031 | 5,712 | 5,749,487 | ||||||||
| Lendmark Funding Trust 2021-1A C† | 3.41% | 11/20/2031 | 2,000 | 2,046,554 | ||||||||
| Lendmark Funding Trust 2021-2A B† | 2.37% | 4/20/2032 | 6,945 | 6,984,981 | ||||||||
| Marble Point CLO XVII Ltd. 2020-1A A† | 1.432% (3 Mo. LIBOR + 1.30% | )# | 4/20/2033 | 2,824 | 2,824,058 | |||||||
| Mariner Finance Issuance Trust 2021-AA D† | 3.83% | 3/20/2036 | 2,600 | 2,644,665 | ||||||||
| Marlette Funding Trust 2020-2A D† | 4.65% | 9/16/2030 | 5,750 | 6,015,254 | ||||||||
| ME Funding LLC 2019-1 A2† | 6.448% | 7/30/2049 | 5,503 | 5,810,485 | ||||||||
| Mountain View CLO 2014-1 Ltd. 2014-1A CRR† | 2.124% (3 Mo. LIBOR + 2.00% | )# | 10/15/2026 | 1,700 | 1,701,541 | |||||||
| Mountain View CLO LLC 2017-1A AR† | 1.212% (3 Mo. LIBOR + 1.09% | )# | 10/16/2029 | 2,645 | 2,646,184 | |||||||
| Mountain View CLO X Ltd. 2015-10A AR† | 0.942% (3 Mo. LIBOR + .82% | )# | 10/13/2027 | 749 | 750,193 | |||||||
| Oaktree CLO Ltd. 2019-4A CR† | 4.169% (3 Mo. LIBOR + 2.25% | )# | 10/20/2032 | 3,360 | 3,328,920 | |||||||
| OCP CLO Ltd. 2019-16A AR† | 1.121% (3 Mo. LIBOR + 1.00% | )# | 4/10/2033 | 4,860 | 4,863,313 | |||||||
| OCP CLO Ltd. 2019-17A A1R† | 1.172% (3 Mo. LIBOR + 1.04% | )# | 7/20/2032 | 5,030 | 5,036,286 | |||||||
| OneMain Financial Issuance Trust 2018-2A A† | 3.57% | 3/14/2033 | 5,645 | 5,857,174 | ||||||||
| 84 | See Notes to Financial Statements. |
Schedule of Investments (continued)
CORE FIXED INCOME FUND November 30, 2021
| Investments | Interest Rate | Maturity Date | Principal Amount (000) | Fair Value | ||||||||
| Other (continued) | ||||||||||||
| Palmer Square CLO Ltd. 2021-2A A† | 1.274% (3 Mo. LIBOR + 1.15% | )# | 7/15/2034 | $ | 5,340 | $ | 5,343,913 | |||||
| Planet Fitness Master Issuer LLC 2019-1A A2† | 3.858% | 12/5/2049 | 1,397 | 1,452,094 | ||||||||
| SCF Equipment Leasing LLC 2019-2A B† | 2.76% | 8/20/2026 | 3,285 | 3,359,063 | ||||||||
| SCF Equipment Leasing LLC 2021-1A C† | 1.54% | 10/21/2030 | 4,325 | 4,239,987 | ||||||||
| Sunrun Demeter Issuer 2021-2A A† | 2.27% | 1/30/2057 | 2,307 | 2,310,398 | (c) | |||||||
| TCI-Flatiron CLO Ltd. 2016-1A AR2† | 1.272% (3 Mo. LIBOR + 1.15% | )# | 1/17/2032 | 4,410 | 4,414,954 | |||||||
| THL Credit Wind River Clo Ltd. 2017-3A DR† | 3.974% (3 Mo. LIBOR + 3.85% | )# | 4/15/2035 | 2,000 | 2,014,730 | |||||||
| Upstart Securitization Trust 2021-2 B† | 1.75% | 6/20/2031 | 3,898 | 3,877,076 | ||||||||
| VERDE CLO Ltd. 2019-1A AR† | 1.224% (3 Mo. LIBOR + 1.10% | )# | 4/15/2032 | 5,340 | 5,340,668 | |||||||
| Voya CLO Ltd. 2019-3A BR†(a) | 1.763% (3 Mo. LIBOR + 1.65% | )# | 10/17/2032 | 5,460 | 5,460,000 | |||||||
| Westgate Resorts LLC 2018-1A A† | 3.38% | 12/20/2031 | 251 | 252,251 | ||||||||
| Wind River CLO Ltd. 2021-4A B†(a) | Zero Coupon | #(b) | 1/20/2035 | 2,970 | 2,970,147 | |||||||
| Total | 204,866,830 | |||||||||||
| Student Loan 0.19% | ||||||||||||
| Massachusetts Educational Financing Authority 2008-1 A1 | 1.074% (3 Mo. LIBOR + .95% | )# | 4/25/2038 | 699 | 700,655 | |||||||
| Pennsylvania Higher Education Assistance Agency 2006-1 B | 0.394% (3 Mo. LIBOR + .27% | )# | 4/25/2038 | 552 | 527,169 | |||||||
| SLC Student Loan Trust 2008-1 A4A | 1.716% (3 Mo. LIBOR + 1.60% | )# | 12/15/2032 | 1,872 | 1,907,510 | |||||||
| Towd Point Asset Trust 2018-SL1 A† | 0.689% (1 Mo. LIBOR + .60% | )# | 1/25/2046 | 785 | 781,995 | |||||||
| Total | 3,917,329 | |||||||||||
| Total Asset-Backed Securities (cost $312,078,158) | 313,059,543 | |||||||||||
| CORPORATE BONDS 21.53% | ||||||||||||
| Airlines 0.43% | ||||||||||||
| American Airlines 2021-1 Class A Pass Through Trust | 2.875% | 7/11/2034 | 5,602 | 5,456,669 | ||||||||
| British Airways 2020-1 Class A Pass Through Trust (United Kingdom)†(d) | 4.25% | 11/15/2032 | 3,088 | 3,341,142 | ||||||||
| Total | 8,797,811 | |||||||||||
| See Notes to Financial Statements. | 85 |
Schedule of Investments (continued)
CORE FIXED INCOME FUND November 30, 2021
| Investments | Interest Rate | Maturity Date | Principal Amount (000) | Fair Value | ||||||||
| Auto Manufacturers 0.45% | ||||||||||||
| Ford Motor Co. | 3.25% | 2/12/2032 | $ | 4,121 | $ | 4,127,758 | ||||||
| General Motors Co. | 6.60% | 4/1/2036 | 3,723 | 5,008,209 | ||||||||
| Total | 9,135,967 | |||||||||||
| Banks 6.03% | ||||||||||||
| Bank of America Corp. | 2.687% (SOFR + 1.32% | )# | 4/22/2032 | 14,182 | 14,369,462 | |||||||
| Bank of America Corp. | 3.593% (3 Mo. LIBOR + 1.37% | )# | 7/21/2028 | 4,807 | 5,172,494 | |||||||
| Bank of America Corp. | 3.97% (3 Mo. LIBOR + 1.07% | )# | 3/5/2029 | 1,698 | 1,868,206 | |||||||
| Bank of America Corp. | 4.00% | 1/22/2025 | 1,716 | 1,836,572 | ||||||||
| Bank of America Corp. | 4.45% | 3/3/2026 | 5,231 | 5,759,993 | ||||||||
| BNP Paribas SA (France)†(d) | 4.375% (5 Yr. Swap rate + 1.48% | )# | 3/1/2033 | 4,783 | 5,214,375 | |||||||
| Citigroup, Inc. | 2.666% (SOFR + 1.15% | )# | 1/29/2031 | 9,393 | 9,544,199 | |||||||
| Citigroup, Inc. | 3.887% (3 Mo. LIBOR + 1.56% | )# | 1/10/2028 | 7,031 | 7,627,990 | |||||||
| Citigroup, Inc. | 3.98% (3 Mo. LIBOR + 1.34% | )# | 3/20/2030 | 6,228 | 6,904,118 | |||||||
| Goldman Sachs Group, Inc. (The) | 2.383% (SOFR + 1.25% | )# | 7/21/2032 | 7,749 | 7,608,840 | |||||||
| Goldman Sachs Group, Inc. (The) | 6.75% | 10/1/2037 | 1,071 | 1,513,963 | ||||||||
| JPMorgan Chase & Co. | 2.58% (SOFR + 1.25% | )# | 4/22/2032 | 7,324 | 7,390,116 | |||||||
| JPMorgan Chase & Co. | 3.782% (3 Mo. LIBOR + 1.34% | )# | 2/1/2028 | 12,969 | 14,064,515 | |||||||
| Macquarie Bank Ltd. (Australia)†(d) | 3.052% (5 Yr. Treasury CMT + 1.70% | )# | 3/3/2036 | 4,585 | 4,529,889 | |||||||
| Macquarie Group Ltd. (Australia)†(d) | 4.654% (3 Mo. LIBOR + 1.73% | )# | 3/27/2029 | 3,121 | 3,537,924 | |||||||
| Morgan Stanley | 2.239% (SOFR + 1.18% | )# | 7/21/2032 | 4,126 | 4,046,472 | |||||||
| Morgan Stanley | 2.484% (SOFR + 1.36% | )# | 9/16/2036 | 3,165 | 3,065,040 | |||||||
| Morgan Stanley | 3.625% | 1/20/2027 | 1,033 | 1,118,888 | ||||||||
| Morgan Stanley | 4.431% (3 Mo. LIBOR + 1.63% | )# | 1/23/2030 | 2,424 | 2,767,118 | |||||||
| National Australia Bank Ltd. (Australia)†(d) | 2.99% | 5/21/2031 | 2,374 | 2,390,121 | ||||||||
| Santander Holdings USA, Inc. | 4.40% | 7/13/2027 | 3,813 | 4,208,433 | ||||||||
| 86 | See Notes to Financial Statements. |
Schedule of Investments (continued)
CORE FIXED INCOME FUND November 30, 2021
| Investments | Interest Rate | Maturity Date | Principal Amount (000) | Fair Value | ||||||||
| Banks (continued) | ||||||||||||
| UBS AG (Switzerland)(d) | 5.125% | 5/15/2024 | $ | 1,694 | $ | 1,823,167 | ||||||
| Wells Fargo Bank NA | 5.85% | 2/1/2037 | 5,275 | 7,055,022 | ||||||||
| Total | 123,416,917 | |||||||||||
| Building Materials 0.10% | ||||||||||||
| Builders FirstSource, Inc.† | 4.25% | 2/1/2032 | 2,032 | 2,044,039 | ||||||||
| Computers 0.50% | ||||||||||||
| Crowdstrike Holdings, Inc. | 3.00% | 2/15/2029 | 2,030 | 1,960,269 | ||||||||
| Dell International LLC/EMC Corp. | 8.35% | 7/15/2046 | 4,948 | 8,270,526 | ||||||||
| Total | 10,230,795 | |||||||||||
| Diversified Financial Services 2.21% | ||||||||||||
| AerCap Ireland Capital DAC/AerCap Global Aviation Trust (Ireland)(d) | 3.50% | 1/15/2025 | 2,732 | 2,856,351 | ||||||||
| AerCap Ireland Capital DAC/AerCap Global Aviation Trust (Ireland)(d) | 3.875% | 1/23/2028 | 6,194 | 6,595,010 | ||||||||
| Aircastle Ltd.† | 2.85% | 1/26/2028 | 6,257 | 6,294,298 | ||||||||
| Ally Financial, Inc. | 8.00% | 11/1/2031 | 5,040 | 7,134,431 | ||||||||
| Aviation Capital Group LLC† | 1.95% | 1/30/2026 | 3,877 | 3,807,243 | ||||||||
| Avolon Holdings Funding Ltd. (Ireland)†(d) | 5.25% | 5/15/2024 | 4,791 | 5,157,782 | ||||||||
| Navient Corp. | 6.75% | 6/15/2026 | 1,795 | 1,943,249 | ||||||||
| Neuberger Berman Group LLC/Neuberger Berman Finance Corp.† | 4.50% | 3/15/2027 | 1,164 | 1,297,632 | ||||||||
| Neuberger Berman Group LLC/Neuberger Berman Finance Corp.† | 4.875% | 4/15/2045 | 690 | 831,651 | ||||||||
| OneMain Finance Corp. | 6.125% | 3/15/2024 | 1,755 | 1,844,935 | ||||||||
| Park Aerospace Holdings Ltd. (Ireland)†(d) | 5.50% | 2/15/2024 | 3,956 | 4,261,665 | ||||||||
| Rocket Mortgage LLC/Rocket Mortgage Co-Issuer, Inc.† | 3.625% | 3/1/2029 | 1,239 | 1,213,569 | ||||||||
| Rocket Mortgage LLC/Rocket Mortgage Co-Issuer, Inc.† | 3.875% | 3/1/2031 | 2,053 | 2,030,520 | ||||||||
| Total | 45,268,336 | |||||||||||
| Electric 2.17% | ||||||||||||
| AES Corp. (The)† | 3.95% | 7/15/2030 | 2,586 | 2,794,522 | ||||||||
| Alfa Desarrollo S.p.A. (Chile)†(d) | 4.55% | 9/27/2051 | 2,892 | 2,759,474 | ||||||||
| American Transmission Systems, Inc. | 2.65% | 1/15/2032 | 4,221 | 4,269,438 | ||||||||
| Calpine Corp.† | 5.00% | 2/1/2031 | 1,850 | 1,783,271 | ||||||||
| Emera US Finance LP | 4.75% | 6/15/2046 | 3,338 | 3,969,839 | ||||||||
| See Notes to Financial Statements. | 87 |
Schedule of Investments (continued)
CORE FIXED INCOME FUND November 30, 2021
| Investments | Interest Rate | Maturity Date | Principal Amount (000) | Fair Value | ||||||||
| Electric (continued) | ||||||||||||
| Exelon Generation Co. LLC | 6.25% | 10/1/2039 | $ | 4,321 | $ | 5,545,807 | ||||||
| IPALCO Enterprises, Inc. | 4.25% | 5/1/2030 | 3,909 | 4,346,009 | ||||||||
| Minejesa Capital BV (Netherlands)†(d) | 4.625% | 8/10/2030 | 3,750 | 3,890,625 | ||||||||
| Oglethorpe Power Corp. | 5.95% | 11/1/2039 | 3,719 | 5,007,274 | ||||||||
| Ohio Edison Co. | 8.25% | 10/15/2038 | 2,655 | 4,343,448 | ||||||||
| Pacific Gas and Electric Co. | 4.55% | 7/1/2030 | 3,676 | 4,017,541 | ||||||||
| Pennsylvania Electric Co.† | 3.60% | 6/1/2029 | 1,682 | 1,780,517 | ||||||||
| Total | 44,507,765 | |||||||||||
| Engineering & Construction 0.21% | ||||||||||||
| Cellnex Finance Co. S.A. (Spain)†(d) | 3.875% | 7/7/2041 | 4,365 | 4,254,915 | ||||||||
| Food 0.05% | ||||||||||||
| Albertsons Cos., Inc./Safeway, Inc./New Albertsons LP/Albertsons LLC† | 4.625% | 1/15/2027 | 938 | 973,616 | ||||||||
| Gas 0.37% | ||||||||||||
| National Fuel Gas Co. | 3.95% | 9/15/2027 | 7,200 | 7,565,480 | ||||||||
| Health Care-Services 0.22% | ||||||||||||
| Centene Corp. | 2.45% | 7/15/2028 | 1,541 | 1,514,587 | ||||||||
| Centene Corp. | 2.625% | 8/1/2031 | 1,299 | 1,254,685 | ||||||||
| DaVita, Inc.† | 3.75% | 2/15/2031 | 1,990 | 1,848,710 | ||||||||
| Total | 4,617,982 | |||||||||||
| Home Builders 0.47% | ||||||||||||
| NVR, Inc. | 3.00% | 5/15/2030 | 2,664 | 2,778,478 | ||||||||
| PulteGroup, Inc. | 6.375% | 5/15/2033 | 2,137 | 2,780,130 | ||||||||
| Shea Homes LP/Shea Homes Funding Corp.† | 4.75% | 4/1/2029 | 1,965 | 1,958,054 | ||||||||
| Toll Brothers Finance Corp. | 3.80% | 11/1/2029 | 1,916 | 2,028,268 | ||||||||
| Total | 9,544,930 | |||||||||||
| Insurance 0.21% | ||||||||||||
| Assurant, Inc. | 2.65% | 1/15/2032 | 1,685 | 1,664,205 | ||||||||
| First American Financial Corp. | 2.40% | 8/15/2031 | 2,703 | 2,633,894 | ||||||||
| Total | 4,298,099 | |||||||||||
| Internet 0.30% | ||||||||||||
| Netflix, Inc.† | 4.875% | 6/15/2030 | 2,158 | 2,502,471 | ||||||||
| Netflix, Inc. | 6.375% | 5/15/2029 | 2,971 | 3,690,576 | ||||||||
| Total | 6,193,047 | |||||||||||
| 88 | See Notes to Financial Statements. |
Schedule of Investments (continued)
CORE FIXED INCOME FUND November 30, 2021
| Investments | Interest Rate | Maturity Date | Principal Amount (000) | Fair Value | ||||||||
| Investment Companies 0.11% | ||||||||||||
| Owl Rock Capital Corp. | 2.875% | 6/11/2028 | $ | 2,396 | $ | 2,342,684 | ||||||
| Machinery-Diversified 0.36% | ||||||||||||
| nVent Finance Sarl (Luxembourg)(d) | 4.55% | 4/15/2028 | 6,513 | 7,282,823 | ||||||||
| Media 0.33% | ||||||||||||
| CCO Holdings LLC/CCO Holdings Capital Corp.† | 4.75% | 3/1/2030 | 1,875 | 1,923,872 | ||||||||
| Time Warner Cable LLC | 7.30% | 7/1/2038 | 3,385 | 4,863,308 | ||||||||
| Total | 6,787,180 | |||||||||||
| Mining 0.64% | ||||||||||||
| Alcoa Nederland Holding BV (Netherlands)†(d) | 4.125% | 3/31/2029 | 1,986 | 2,028,560 | ||||||||
| Freeport-McMoRan, Inc. | 4.25% | 3/1/2030 | 1,940 | 2,014,447 | ||||||||
| Freeport-McMoRan, Inc. | 4.625% | 8/1/2030 | 1,903 | 2,012,765 | ||||||||
| Glencore Finance Canada Ltd. (Canada)†(d) | 5.55% | 10/25/2042 | 3,084 | 3,914,213 | ||||||||
| Glencore Funding LLC† | 2.85% | 4/27/2031 | 3,165 | 3,151,708 | ||||||||
| Total | 13,121,693 | |||||||||||
| Oil & Gas 1.82% | ||||||||||||
| Apache Corp. | 4.75% | 4/15/2043 | 4,176 | 4,458,298 | ||||||||
| Continental Resources, Inc. | 4.90% | 6/1/2044 | 4,782 | 5,312,539 | ||||||||
| Diamondback Energy, Inc. | 3.50% | 12/1/2029 | 4,851 | 5,094,972 | ||||||||
| Diamondback Energy, Inc. | 4.75% | 5/31/2025 | 3,700 | 4,056,770 | ||||||||
| Eni S.p.A. (Italy)†(d) | 5.70% | 10/1/2040 | 5,053 | 6,569,088 | ||||||||
| Helmerich & Payne, Inc.† | 2.90% | 9/29/2031 | 2,691 | 2,633,092 | ||||||||
| Qatar Petroleum (Qatar)†(d) | 3.125% | 7/12/2041 | 2,800 | 2,814,154 | ||||||||
| SA Global Sukuk Ltd.† | 2.694% | 6/17/2031 | 5,000 | 5,001,530 | ||||||||
| Tengizchevroil Finance Co. International Ltd. (Kazakhstan)†(d) | 3.25% | 8/15/2030 | 1,400 | 1,384,012 | ||||||||
| Total | 37,324,455 | |||||||||||
| Oil & Gas Services 0.85% | ||||||||||||
| Halliburton Co. | 5.00% | 11/15/2045 | 3,601 | 4,413,305 | ||||||||
| Halliburton Co. | 7.45% | 9/15/2039 | 2,595 | 3,834,263 | ||||||||
| NOV, Inc. | 3.60% | 12/1/2029 | 8,885 | 9,130,802 | ||||||||
| Total | 17,378,370 | |||||||||||
| Pharmaceuticals 0.39% | ||||||||||||
| Bayer Corp.† | 6.65% | 2/15/2028 | 1,425 | 1,739,375 | ||||||||
| Bayer US Finance II LLC† | 4.375% | 12/15/2028 | 5,525 | 6,210,312 | ||||||||
| Total | 7,949,687 | |||||||||||
| See Notes to Financial Statements. | 89 |
Schedule of Investments (continued)
CORE FIXED INCOME FUND November 30, 2021
| Investments | Interest Rate | Maturity Date | Principal Amount (000) | Fair Value | ||||||||
| Pipelines 0.83% | ||||||||||||
| Abu Dhabi Crude Oil Pipeline LLC (United Arab Emirates)†(d) | 4.60% | 11/2/2047 | $ | 3,460 | $ | 4,046,297 | ||||||
| Eastern Gas Transmission & Storage, Inc.† | 3.00% | 11/15/2029 | 4,411 | 4,598,000 | ||||||||
| Galaxy Pipeline Assets Bidco Ltd. (United Arab Emirates)†(d) | 3.25% | 9/30/2040 | 4,400 | 4,411,920 | ||||||||
| NGPL PipeCo LLC† | 3.25% | 7/15/2031 | 3,973 | 4,029,636 | ||||||||
| Total | 17,085,853 | |||||||||||
| REITS 1.07% | ||||||||||||
| American Campus Communities Operating Partnership LP | 3.875% | 1/30/2031 | 5,489 | 6,104,807 | ||||||||
| American Homes 4 Rent LP | 2.375% | 7/15/2031 | 2,457 | 2,433,951 | ||||||||
| EPR Properties | 3.75% | 8/15/2029 | 4,303 | 4,411,650 | ||||||||
| Invitation Homes Operating Partnership LP | 2.00% | 8/15/2031 | 5,218 | 4,954,849 | ||||||||
| Physicians Realty LP | 2.625% | 11/1/2031 | 3,938 | 3,939,008 | ||||||||
| Total | 21,844,265 | |||||||||||
| Retail 0.10% | ||||||||||||
| Gap, Inc. (The)† | 3.875% | 10/1/2031 | 2,110 | 2,022,583 | ||||||||
| Semiconductors 0.32% | ||||||||||||
| Skyworks Solutions, Inc. | 3.00% | 6/1/2031 | 4,155 | 4,218,387 | ||||||||
| TSMC Arizona Corp. | 3.25% | 10/25/2051 | 2,150 | 2,316,605 | ||||||||
| Total | 6,534,992 | |||||||||||
| Software 0.72% | ||||||||||||
| MSCI, Inc.† | 3.25% | 8/15/2033 | 2,034 | 2,031,417 | ||||||||
| Oracle Corp. | 2.875% | 3/25/2031 | 2,500 | 2,560,399 | ||||||||
| Oracle Corp. | 6.125% | 7/8/2039 | 1,391 | 1,899,594 | ||||||||
| Twilio, Inc. | 3.875% | 3/15/2031 | 1,955 | 1,944,336 | ||||||||
| VMware, Inc. | 4.70% | 5/15/2030 | 5,527 | 6,422,556 | ||||||||
| Total | 14,858,302 | |||||||||||
| Telecommunications 0.27% | ||||||||||||
| AT&T, Inc. | 3.50% | 9/15/2053 | 5,532 | 5,598,059 | ||||||||
| Total Corporate Bonds (cost $432,032,672) | 440,980,645 | |||||||||||
| FLOATING RATE LOANS(e) 4.19% | ||||||||||||
| Advertising 0.35% | ||||||||||||
| Lamar Media Corporation 2020 Term Loan B | 1.589% 1 Mo. Libor + 1.50% | ) | 2/5/2027 | 7,263 | 7,233,800 | |||||||
| 90 | See Notes to Financial Statements. |
Schedule of Investments (continued)
CORE FIXED INCOME FUND November 30, 2021
| Investments | Interest Rate | Maturity Date | Principal Amount (000) | Fair Value | ||||||||
| Chemicals 0.25% | ||||||||||||
| Nutrition & Biosciences, Inc. 5 Year Delayed Draw Term Loan | – | (f) | 1/17/2025 | $ | 5,150 | $ | 5,146,781 | |||||
| Computer Software 0.37% | ||||||||||||
| Vmware, Inc. 3 Year Term Loan | – | (f) | 9/2/2024 | 7,619 | 7,611,940 | |||||||
| Drugs 0.20% | ||||||||||||
| Horizon Therapeutics USA Inc. 2021 Term Loan B | 2.50% (1 Mo. LIBOR + 2.00% | ) | 3/15/2028 | 4,090 | 4,073,305 | |||||||
| Entertainment 0.21% | ||||||||||||
| Churchill Downs Incorporated 2021 Incremental Term Loan B1 | 2.10% (1 Mo. LIBOR + 2.00% | ) | 3/17/2028 | 4,390 | 4,360,676 | |||||||
| Financial Services 0.37% | ||||||||||||
| Avolon TLB Borrower 1 (US) LLC 2021 Term Loan B5 | – | (f) | 12/1/2027 | 7,619 | 7,612,931 | |||||||
| Food 0.37% | ||||||||||||
| JBS USA Lux S.A. 2019 Term Loan B | – | (f) | 5/1/2026 | 7,619 | 7,591,452 | |||||||
| Government 0.26% | ||||||||||||
| Seminole Tribe of Florida 2018 Term Loan B | – | (f) | 7/8/2024 | 5,333 | 5,323,722 | |||||||
| Health Care Services 0.29% | ||||||||||||
| Humana Inc. Term Loan | – | (f) | 10/30/2023 | 6,000 | 5,921,280 | (g) | ||||||
| Leasing 0.37% | ||||||||||||
| Setanta Aircraft Leasing Designated Activity | ||||||||||||
| Company Term Loan B (Ireland)(d) | – | (f) | 11/5/2028 | 7,619 | 7,615,902 | |||||||
| Lodging 0.37% | ||||||||||||
| Hilton Worldwide Finance, LLC 2019 Term Loan B | – | (f) | 6/22/2026 | 7,619 | 7,522,614 | |||||||
| Miscellaneous 0.52% | ||||||||||||
| Charter Communications Operating, LLC 2019 | ||||||||||||
| Term Loan B1 | – | (f) | 4/30/2025 | 10,576 | 10,539,688 | |||||||
| Transportation: Miscellaneous 0.26% | ||||||||||||
| XPO Logistics, Inc. 2018 Term Loan B | 1.831% (1 Mo. LIBOR + 1.75% | ) | 2/24/2025 | 5,333 | 5,299,402 | |||||||
| Total Floating Rate Loans (cost $86,201,085) | 85,853,493 | |||||||||||
| See Notes to Financial Statements. | 91 |
Schedule of Investments (continued)
CORE FIXED INCOME FUND November 30, 2021
| Investments | Interest Rate | Maturity Date | Principal Amount (000) | Fair Value | ||||||||
| FOREIGN GOVERNMENT OBLIGATIONS(d) 0.74% | ||||||||||||
| Japan 0.46% | ||||||||||||
| Japan Finance Organization for Municipalities | 2.00% | 4/21/2022 | $ | 9,350 | $ | 9,423,398 | ||||||
| Qatar 0.28% | ||||||||||||
| State of Qatar† | 4.00% | 3/14/2029 | 5,175 | 5,817,362 | ||||||||
| Total Foreign Government Obligations (cost $15,396,479) | 15,240,760 | |||||||||||
| GOVERNMENT SPONSORED ENTERPRISES COLLATERALIZED MORTGAGE OBLIGATIONS 0.07% | ||||||||||||
| Federal Home Loan Mortgage Corp. Q001 XA | 2.141% | #(h) | 2/25/2032 | 11,311 | 1,193,988 | |||||||
| Government National Mortgage Assoc. 2015-73 AC | 2.90% | #(h) | 2/16/2053 | 210 | 215,028 | |||||||
| Total Government Sponsored Enterprises Collateralized Mortgage Obligations (cost $1,412,260) | 1,409,016 | |||||||||||
| GOVERNMENT SPONSORED ENTERPRISES PASS-THROUGHS 7.42% | ||||||||||||
| Fannie Mae or Freddie Mac(i) | 3.00% | TBA | 129,176 | 134,141,204 | ||||||||
| Federal National Mortgage Assoc. | 3.50% | 9/1/2047 | 10,286 | 10,971,203 | ||||||||
| Federal National Mortgage Assoc. | 3.50% | 3/1/2050 | 6,397 | 6,833,217 | ||||||||
| Total Government Sponsored Enterprises Pass-Throughs (cost $151,663,365) | 151,945,624 | |||||||||||
| MUNICIPAL BONDS 0.78% | ||||||||||||
| Miscellaneous | ||||||||||||
| County of Miami-Dade FL | 2.786% | 10/1/2037 | 1,295 | 1,308,018 | ||||||||
| Foothill-Eastern Transportation Corridor Agency | 4.094% | 1/15/2049 | 1,567 | 1,701,361 | ||||||||
| New Jersey Educational Facilities Authority | 3.636% | 9/1/2029 | 1,319 | 1,437,778 | ||||||||
| New Jersey Educational Facilities Authority | 3.836% | 9/1/2036 | 1,592 | 1,713,000 | ||||||||
| New York City Transitional Finance Authority Future Tax Secured Revenue | 2.69% | 5/1/2033 | 8,450 | 8,784,499 | ||||||||
| Regents of the University of California Medical Ce | 3.006% | 5/15/2050 | 950 | 1,006,238 | ||||||||
| Total Municipal Bonds (cost $15,728,386) | 15,950,894 | |||||||||||
| NON-AGENCY COMMERCIAL MORTGAGE-BACKED SECURITIES 6.50% | ||||||||||||
| Angel Oak Mortgage Trust 2020-1 A1† | 2.466% | #(h) | 12/25/2059 | 344 | 344,986 | |||||||
| Atrium Hotel Portfolio Trust 2018-ATRM A† | 1.04% (1 Mo. LIBOR + .95% | )# | 6/15/2035 | 1,141 | 1,140,302 | |||||||
| BBCMS Mortgage Trust 2019-BWAY A† | 1.046% (1 Mo. LIBOR + .96% | )# | 11/15/2034 | 1,510 | 1,507,760 | |||||||
| BBCMS Mortgage Trust 2019-BWAY B† | 1.40% (1 Mo. LIBOR + 1.31% | )# | 11/15/2034 | 664 | 660,836 | |||||||
| BHMS 2018-ATLS A† | 1.34% (1 Mo. LIBOR + 1.25% | )# | 7/15/2035 | 3,290 | 3,295,805 | |||||||
| BX Trust 2018-GW A† | 0.89% (1 Mo. LIBOR + .80% | )# | 5/15/2035 | 5,060 | 5,058,069 | |||||||
| 92 | See Notes to Financial Statements. |
Schedule of Investments (continued)
CORE FIXED INCOME FUND November 30, 2021
| Investments | Interest Rate | Maturity Date | Principal Amount (000) | Fair Value | ||||||||
| NON-AGENCY COMMERCIAL MORTGAGE-BACKED SECURITIES (continued) | ||||||||||||
| BX Trust 2021-ARIA E† | 2.335% (1 Mo. LIBOR + 2.24% | )# | 10/15/2036 | $ | 4,120 | $ | 4,107,745 | |||||
| CF Trust 2019-BOSS A1 | 4.75% (1 Mo. LIBOR + 3.25% | ) | 12/15/2021 | 1,690 | 1,560,614 | (c) | ||||||
| Citigroup Commercial Mortgage Trust 2014-GC21 XA IO | 1.315% | #(h) | 5/10/2047 | 15,345 | 365,798 | |||||||
| Citigroup Commercial Mortgage Trust 2016-GC36 D† | 2.85% | 2/10/2049 | 3,025 | 2,167,023 | ||||||||
| Citigroup Commercial Mortgage Trust 2016-P3 D† | 2.804% | #(h) | 4/15/2049 | 709 | 586,517 | |||||||
| Commercial Mortgage Pass-Through Certificates 2014-CR19 XA IO | 1.111% | #(h) | 8/10/2047 | 2,735 | 57,587 | |||||||
| Commercial Mortgage Pass-Through Certificates 2014-UBS4 D† | 4.869% | #(h) | 8/10/2047 | 4,440 | 3,969,731 | |||||||
| Commercial Mortgage Pass-Through Certificates 2015-DC1 D† | 4.451% | #(h) | 2/10/2048 | 3,741 | 3,216,304 | |||||||
| Commercial Mortgage Pass-Through Certificates 2015-PC1 B | 4.463% | #(h) | 7/10/2050 | 620 | 661,517 | |||||||
| Commercial Mortgage Pass-Through Certificates 2015-PC1 C | 4.463% | #(h) | 7/10/2050 | 3,385 | 3,534,783 | |||||||
| Commercial Mortgage Pass-Through Certificates 2015-PC1 D | 4.463% | #(h) | 7/10/2050 | 1,471 | 1,340,320 | |||||||
| Connecticut Avenue Securities Trust 2021-R01 1M2† | 1.60% (1 Mo. SOFR + 1.55% | )# | 10/25/2041 | 2,570 | 2,585,272 | |||||||
| Credit Suisse Mortgage Capital Certificates | 1.59% | 11/15/2038 | 5,635 | 5,690,248 | ||||||||
| Credit Suisse Mortgage Capital Certificates 2020-AFC1 A1† | 2.24% | #(h) | 2/25/2050 | 1,167 | 1,172,180 | |||||||
| Credit Suisse Mortgage Capital Certificates 2020-SPT1 A1† | 1.616% | 4/25/2065 | 1,675 | 1,679,684 | ||||||||
| CSAIL Commercial Mortgage Trust 2015-C2 C | 4.327% | #(h) | 6/15/2057 | 325 | 312,458 | |||||||
| CSAIL Commercial Mortgage Trust 2016-C7 D† | 4.529% | #(h) | 11/15/2049 | 1,875 | 1,483,823 | |||||||
| DBWF Mortgage Trust 2018-GLKS A† | 1.119% (1 Mo. LIBOR + 1.03% | )# | 12/19/2030 | 2,000 | 2,003,074 | |||||||
| Deephaven Residential Mortgage Trust 2020-1 A1† | 2.339% | #(h) | 1/25/2060 | 499 | 499,995 | |||||||
| Deephaven Residential Mortgage Trust 2020-2 A1† | 1.692% | 5/25/2065 | 1,083 | 1,084,174 | ||||||||
| Deephaven Residential Mortgage Trust 2021-3 A1† | 1.194% | #(h) | 8/25/2066 | 5,025 | 5,000,775 | |||||||
| Ellington Financial Mortgage Trust 2020-1 A1† | 2.006% | #(h) | 5/25/2065 | 1,632 | 1,640,500 | |||||||
| See Notes to Financial Statements. | 93 |
Schedule of Investments (continued)
CORE FIXED INCOME FUND November 30, 2021
| Investments | Interest Rate | Maturity Date | Principal Amount (000) | Fair Value | ||||||||
| NON-AGENCY COMMERCIAL MORTGAGE-BACKED SECURITIES (continued) | ||||||||||||
| Extended Stay America Trust 2021-ESH C† | 1.79% (1 Mo. LIBOR + 1.70% | )# | 7/15/2038 | $ | 3,492 | $ | 3,497,740 | |||||
| Fannie Mae Connecticut Avenue Securities 2021-R02 2M2† | 2.05% (1 Mo. SOFR + 2.00% | )# | 11/25/2041 | 2,460 | 2,464,613 | |||||||
| Freddie Mac STACR REMIC Trust 2021-DNA6 M2† | 1.55% (1 Mo. SOFR + 1.50% | )# | 10/25/2041 | 3,080 | 3,087,756 | |||||||
| Freddie Mac STACR REMIC Trust 2021-HQA3 M2† | 2.15% (1 Mo. SOFR + 2.10% | )# | 9/25/2041 | 6,085 | 6,090,262 | |||||||
| Freddie Mac Structured Agency Credit Risk Debt Notes 2021-DNA7 M2† | 1.848% (1 Mo. SOFR + 1.80% | )# | 11/25/2041 | 3,100 | 3,109,673 | |||||||
| GCAT Trust 2020-NQM1 A1† | 2.247% | 1/25/2060 | 285 | 286,158 | ||||||||
| GCAT Trust 2020-NQM2 A1† | 1.555% | 4/25/2065 | 1,844 | 1,850,002 | ||||||||
| Great Wolf Trust 2019-WOLF A† | 1.124% (1 Mo. LIBOR + 1.03% | )# | 12/15/2036 | 6,000 | 5,995,375 | |||||||
| GS Mortgage Securities Corp. Trust 2018-RIVR A† | 1.04% (1 Mo. LIBOR + .95% | )# | 7/15/2035 | 1,346 | 1,337,546 | |||||||
| GS Mortgage Securities Trust 2015-GC32 C | 4.574% | #(h) | 7/10/2048 | 685 | 715,547 | |||||||
| Hilton Orlando Trust 2018-ORL A† | 1.01% (1 Mo. LIBOR + .92% | )# | 12/15/2034 | 2,060 | 2,058,309 | |||||||
| HONO Mortgage Trust 2021-LULU B† | 1.54% (1 Mo. LIBOR + 1.45% | )# | 10/15/2036 | 1,490 | 1,492,876 | |||||||
| HONO Mortgage Trust 2021-LULU C† | 1.94% (1 Mo. LIBOR + 1.85% | )# | 10/15/2036 | 916 | 917,999 | |||||||
| Hudsons Bay Simon JV Trust 2015-HB7 B7† | 4.666% | 8/5/2034 | 2,410 | 2,189,840 | ||||||||
| Hudsons Bay Simon JV Trust 2015-HB7 D7† | 5.331% | #(h) | 8/5/2034 | 2,231 | 1,696,495 | |||||||
| JPMorgan Chase Commercial Mortgage Securities Trust 2015-C30 C | 4.406% | #(h) | 7/15/2048 | 2,629 | 2,687,182 | |||||||
| JPMorgan Chase Commercial Mortgage Securities Trust 2018-LAQ B† | 1.39% (1 Mo. LIBOR + 1.30% | )# | 6/15/2032 | 2,290 | 2,290,025 | |||||||
| JPMorgan Chase Commercial Mortgage Securities Trust 2018-MINN A† | 2.27% (1 Mo. LIBOR + 1.02% | )# | 11/15/2035 | 1,026 | 1,030,374 | |||||||
| JPMorgan Chase Commercial Mortgage Securities Trust 2018-WPT AFL† | 1.286% (1 Mo. LIBOR + 1.20% | )# | 7/5/2033 | 4,703 | 4,710,244 | |||||||
| 94 | See Notes to Financial Statements. |
Schedule of Investments (continued)
CORE FIXED INCOME FUND November 30, 2021
| Investments | Interest Rate | Maturity Date | Principal Amount (000) | Fair Value | ||||||||
| NON-AGENCY COMMERCIAL MORTGAGE-BACKED SECURITIES (continued) | ||||||||||||
| MF1 Ltd. 2020-FL3 B† | 3.912% (1 Mo. SOFR + 3.86% | )# | 7/15/2035 | $ | 6,610 | $ | 6,692,263 | |||||
| New Residential Mortgage Loan Trust 2020-NQM1 A1† | 2.464% | #(h) | 1/26/2060 | 314 | 316,162 | |||||||
| PFP Ltd. 2019-6 A† | 1.141% (1 Mo. LIBOR + 1.05% | )# | 4/14/2037 | 675 | 672,758 | |||||||
| ReadyCap Commercial Mortgage Trust 2019-6 A† | 2.833% | 10/25/2052 | 839 | 849,087 | ||||||||
| Residential Mortgage Loan Trust 2020-1 A1† | 2.376% | #(h) | 1/26/2060 | 253 | 254,336 | |||||||
| Starwood Mortgage Residential Trust 2020-1 A1† | 2.275% | #(h) | 2/25/2050 | 417 | 419,853 | |||||||
| Starwood Mortgage Residential Trust 2020-3 A1† | 1.486% | #(h) | 4/25/2065 | 2,515 | 2,524,893 | |||||||
| Verus Securitization Trust 2020-1 A1† | 2.417% | 1/25/2060 | 846 | 851,396 | ||||||||
| Verus Securitization Trust 2020-4 A1† | 1.502% | 5/25/2065 | 2,261 | 2,263,356 | ||||||||
| Verus Securitization Trust 2020-INV1 A1† | 1.977% | #(h) | 3/25/2060 | 1,827 | 1,836,246 | |||||||
| Vista Point Securitization Trust 2020-1 A1† | 1.763% | #(h) | 3/25/2065 | 1,928 | 1,936,227 | |||||||
| Vista Point Securitization Trust 2020-2 A1† | 1.475% | #(h) | 4/25/2065 | 1,734 | 1,735,196 | |||||||
| Wells Fargo Commercial Mortgage Trust 2016-C35 C | 4.176% | #(h) | 7/15/2048 | 2,139 | 2,178,029 | |||||||
| WFRBS Commercial Mortgage Trust 2014-C23 XA | 0.708% | #(h) | 10/15/2057 | 19,833 | 266,482 | |||||||
| ZH Trust 2021-2 A† | 2.349% | 10/17/2027 | 6,070 | 6,018,193 | (c) | |||||||
| Total Non-Agency Commercial Mortgage-Backed Securities (cost $133,254,872) | 133,050,373 | |||||||||||
| U.S. TREASURY OBLIGATIONS 49.71% | ||||||||||||
| U.S. Treasury Bill | Zero Coupon | 1/27/2022 | 108,517 | 108,509,698 | ||||||||
| U.S. Treasury Bill | Zero Coupon | 4/21/2022 | 160,044 | 160,001,688 | ||||||||
| U.S. Treasury Bond | 1.125% | 5/15/2040 | 21,393 | 18,981,273 | ||||||||
| U.S. Treasury Bond | 1.75% | 8/15/2041 | 54,081 | 53,109,232 | ||||||||
| U.S. Treasury Bond | 2.00% | 8/15/2051 | 47,765 | 50,033,837 | ||||||||
| U.S. Treasury Bond | 2.25% | 8/15/2049 | 8,310 | 9,138,079 | ||||||||
| U.S. Treasury Note | 0.125% | 8/31/2023 | 113,792 | 113,098,580 | ||||||||
| U.S. Treasury Note | 0.375% | 10/31/2023 | 72,404 | 72,211,677 | ||||||||
| U.S. Treasury Note | 0.75% | 11/15/2024 | 94,745 | 94,526,642 | ||||||||
| U.S. Treasury Note | 1.125% | 10/31/2026 | 257,383 | 257,061,271 | ||||||||
| U.S. Treasury Note | 1.25% | 8/15/2031 | 82,490 | 81,181,760 | ||||||||
| Total U.S. Treasury Obligations (cost $1,015,555,807) | 1,017,853,737 | |||||||||||
| Total Long-Term Investments (cost $2,163,323,084) | 2,175,344,085 | |||||||||||
| See Notes to Financial Statements. | 95 |
Schedule of Investments (continued)
CORE FIXED INCOME FUND November 30, 2021
| Investments | Principal Amount (000) | Fair Value | ||||||||||
| SHORT-TERM INVESTMENTS 3.30% | ||||||||||||
| REPURCHASE AGREEMENTS 3.30% | ||||||||||||
| Repurchase Agreement dated 11/30/2021, 0.00% due 12/1/2021 with Fixed Income Clearing Corp. collateralized by $14,182,000 of U.S. Treasury Note at 0.125% due 05/15/2023; $20,095,200 of U.S. Treasury Note at 0.125% due 04/30/2023;$34,000,000 of U.S. Treasury Note at 1.625% due 04/30/2023; value: $68,837,256; proceeds: $67,487,439 (cost $67,487,439) | $ | 67,487 | $ | 67,487,439 | ||||||||
| Total Investments in Securities 109.53% (cost $2,230,810,523) | 2,242,831,524 | |||||||||||
| Other Assets and Liabilities – Net(j) (9.53)% | (195,082,230 | ) | ||||||||||
| Net Assets 100.00% | $ | 2,047,749,294 | ||||||||||
| CMT | Constant Maturity Rate. |
| IO | Interest Only. |
| LIBOR | London Interbank Offered Rate. |
| SOFR | Secured Over Night Financing Rate. |
| † | Security was purchased pursuant to Rule 144A under the Securities Act of 1933 and, unless registered under such Act or exempted from registration, may only be resold to qualified institutional buyers. At November 30, 2021, the total value of Rule 144A securities was $499,540,563, which represents 24.39% of net assets. |
| # | Variable rate security. The interest rate represents the rate in effect at November 30, 2021. |
| (a) | Securities purchased on a when-issued basis (See Note 2(j)). |
| (b) | Variable Rate is Fixed to Float: Rate remains fixed or at Zero Coupon until designated future date. |
| (c) | Level 3 Investment as described in Note 2(t) in the Notes to Financials. Security valued utilizing third party pricing information without adjustment. Such valuations are based on unobservable inputs. A significant change in third party information could result in a significantly lower or higher value of such Level 3 investments. |
| (d) | Foreign security traded in U.S. dollars. |
| (e) | Floating Rate Loans in which the Fund invests generally pay interest at rates which are periodically re-determined at a margin above the London Interbank Offered Rate (“LIBOR”) or the prime rate offered by major U.S. banks. The rate(s) shown is the rate(s) in effect at November 30, 2021. |
| (f) | Interest rate to be determined. |
| (g) | Level 3 Investment as described in Note 2(t) in the Notes to Financials. Floating Rate Loans categorized as Level 3 are valued based on a single quotation obtained from a dealer. Accounting principles generally accepted in the United States of America do not require the Fund to create quantitative unobservable inputs that were not developed by the Fund. Therefore, the Fund does not have access to unobservable inputs and cannot disclose such inputs in the valuation. |
| (h) | Interest rate is based on the weighted average interest rates of the underlying mortgages within the mortgage pool. |
| (i) | To-be-announced (“TBA”). Security purchased on a forward commitment basis with an approximate principal and maturity date. Actual principal and maturity will be determined upon settlement when the specific mortgage pools are assigned. |
| (j) | Other Assets and Liabilities – Net include net unrealized appreciation/depreciation on futures contracts and swaps as follows: |
| 96 | See Notes to Financial Statements. |
Schedule of Investments (continued)
CORE FIXED INCOME FUND November 30, 2021
Credit Default Swaps on Indexes - Sell Protection at November 30, 2021(1):
| Referenced Index* | Swap Counterparty | Fund Receives (Quarterly | ) | Termination Date | Notional Amount | Payments Upfront(2) | Unrealized Appreciation/ (Depreciation) | (3) | Credit Default Swap Agreements Payable at Fair Value(4) | |||||||||||||
| Markit CMBX.NA.BBB-.10 | Citibank | 3.000% | 11/17/2059 | $ | 6,600,000 | $ | (579,024 | ) | $ (84,143 | ) | $ | (663,167 | ) | |||||||||
| Markit CMBX.NA.BBB-.12 | Goldman Sachs | 3.000% | 8/17/2061 | 2,050,000 | (180,229 | ) | 45,316 | (134,913 | ) | |||||||||||||
| Markit CMBX.NA.BBB-.12 | Goldman Sachs | 3.000% | 8/17/2061 | 2,050,000 | (167,963 | ) | 33,050 | (134,913 | ) | |||||||||||||
| Markit CMBX.NA.BBB-.12 | Morgan Stanley | 3.000% | 8/17/2061 | 5,700,000 | (460,169 | ) | 85,046 | (375,123 | ) | |||||||||||||
| Markit CMBX.NA.BBB-.12 | Morgan Stanley | 3.000% | 8/17/2061 | 4,100,000 | (335,725 | ) | 65,899 | (269,826 | ) | |||||||||||||
| Markit CMBX.NA.BBB-.12 | Morgan Stanley | 3.000% | 8/17/2061 | 2,000,000 | (160,055 | ) | 28,432 | (131,623 | ) | |||||||||||||
| Total | $ | (1,883,165 | ) | $173,600 | $ | (1,709,565 | ) | |||||||||||||||
| * | The Referenced Index is for the Credit Default Swaps on Indexes, which is comprised of a basket of commercial mortgage-backed securities. | |
| (1) | If the Fund is a seller of protection and a credit event occurs, as defined under the terms of that particular swap agreement, the Fund will either (i) pay to the buyer of protection an amount equal to the notional amount of the swap and take delivery of the referenced obligation or underlying securities comprising the referenced index or (ii) pay a net settlement amount in the form of cash or securities equal to the notional amount of the swap less the recovery value of the referenced obligation or underlying securities. | |
| (2) | Upfront payments received/paid are presented net of amortization. | |
| (3) | Total unrealized appreciation on Credit Default Swaps on Indexes amounted to $257,743. Total unrealized depreciation on Credit Default Swaps on Indexes amounted to $84,143. | |
| (4) | Includes upfront payments received. |
Open Futures Contracts at November 30, 2021:
| Type | Expiration | Contracts | Position | Notional Amount | Notional Value | Unrealized Appreciation | ||||||||||||
| U.S. 10-Year Ultra Treasury Bond | March 2022 | 105 | Long | $ | 15,158,756 | $ | 15,423,515 | $ | 264,759 | |||||||||
| U.S. Ultra Treasury Bond | March 2022 | 764 | Long | 148,265,217 | 153,229,750 | 4,964,533 | ||||||||||||
| Total Unrealized Appreciation on Open Futures Contracts | $ | 5,229,292 | ||||||||||||||||
| See Notes to Financial Statements. | 97 |
Schedule of Investments (concluded)
CORE FIXED INCOME FUND November 30, 2021
| Type | Expiration | Contracts | Position | Notional Amount | Notional Value | Unrealized Depreciation | ||||||||||||
| U.S. 2-Year Treasury Note | March 2022 | 219 | Short | $ | (47,815,149 | ) | $ | (47,902,828 | ) | $ | (87,679 | ) | ||||||
| U.S. 5-Year Treasury Note | March 2022 | 384 | Short | (46,259,408 | ) | (46,617,000 | ) | (357,592 | ) | |||||||||
| U.S. Long Bond | March 2022 | 301 | Short | (47,801,472 | ) | (48,799,625 | ) | (998,153 | ) | |||||||||
| Total Unrealized Depreciation on Open Futures Contracts | $ | (1,443,424 | ) | |||||||||||||||
The following is a summary of the inputs used as of November 30, 2021 in valuing the Fund’s investments carried at fair value(1):
| Investment Type(2) | Level 1 | Level 2 | Level 3 | Total | ||||||||||||
| Long-Term Investments | ||||||||||||||||
| Asset-Backed Securities | ||||||||||||||||
| Other | $ | – | $ | 200,666,432 | $ | 4,200,398 | $ | 204,866,830 | ||||||||
| Remaining Industries | – | 108,192,713 | – | 108,192,713 | ||||||||||||
| Corporate Bonds | – | 440,980,645 | – | 440,980,645 | ||||||||||||
| Floating Rate Loans | ||||||||||||||||
| Health Care Services | – | – | 5,921,280 | 5,921,280 | ||||||||||||
| Remaining Industries | – | 79,932,213 | – | 79,932,213 | ||||||||||||
| Foreign Government Obligations | – | 15,240,760 | – | 15,240,760 | ||||||||||||
| Government Sponsored Enterprises Collateralized Mortgage Obligations | – | 1,409,016 | – | 1,409,016 | ||||||||||||
| Government Sponsored Enterprises Pass-Throughs | – | 151,945,624 | – | 151,945,624 | ||||||||||||
| Municipal Bonds | – | 15,950,894 | – | 15,950,894 | ||||||||||||
| Non-Agency Commercial Mortgage-Backed Securities | – | 125,471,566 | 7,578,807 | 133,050,373 | ||||||||||||
| U.S. Treasury Obligations | – | 1,017,853,737 | – | 1,017,853,737 | ||||||||||||
| Short-Term Investments | ||||||||||||||||
| Repurchase Agreements | – | 67,487,439 | – | 67,487,439 | ||||||||||||
| Total | $ | – | $ | 2,225,131,039 | $ | 17,700,485 | $ | 2,242,831,524 | ||||||||
| Other Financial Instruments | ||||||||||||||||
| Credit Default Swap Contracts | ||||||||||||||||
| Assets | $ | – | $ | – | $ | – | $ | – | ||||||||
| Liabilities | – | (1,709,565 | ) | – | (1,709,565 | ) | ||||||||||
| Futures Contracts | ||||||||||||||||
| Assets | 5,229,292 | – | – | 5,229,292 | ||||||||||||
| Liabilities | (1,443,424 | ) | – | – | (1,443,424 | ) | ||||||||||
| Total | $ | 3,785,868 | $ | (1,709,565 | ) | $ | – | $ | 2,076,303 | |||||||
| (1) | Refer to Note 2(t) for a description of fair value measurements and the three-tier hierarchy of inputs. | |
| (2) | See Schedule of Investments for fair values in each industry and identification of foreign issuer and/or geography. The table above is presented by Investment Type. Industries are presented within an Investment Type should such Investment Type include securities classified as two or more levels within the three- tier fair value hierarchy. When applicable each Level 3 security is identified on the Schedule of Investments along with the valuation technique utilized. |
A reconciliation of Level 3 investments is presented when the Fund has a material amount of Level 3 investments at the beginning or end of the year in relation to the Fund’s net assets. Management has determined not to provide a reconciliation as the balance of Level 3 investments was not considered to be material to the Fund’s net assets at the beginning or end of the year.
| 98 | See Notes to Financial Statements. |
Schedule of Investments
CORE PLUS BOND FUND November 30, 2021
| Investments | Interest Rate | Maturity Date | Principal Amount (000) | Fair Value | ||||||||
| LONG-TERM INVESTMENTS 100.85% | ||||||||||||
| ASSET-BACKED SECURITIES 16.14% | ||||||||||||
| Auto Floor Plan 0.17% | ||||||||||||
| Ford Credit Floorplan Master Owner Trust 2018-4 A | 4.06% | 11/15/2030 | $ | 603 | $ | 680,926 | ||||||
| Automobiles 6.09% | ||||||||||||
| ACC Trust 2019-1 B† | 4.47% | 10/20/2022 | 35 | 35,016 | ||||||||
| Avid Automobile Receivables Trust 2019-1 A† | 2.62% | 2/15/2024 | 3 | 2,563 | ||||||||
| Avid Automobile Receivables Trust 2019-1 B† | 2.82% | 7/15/2026 | 500 | 504,635 | ||||||||
| Avid Automobile Receivables Trust 2019-1 C† | 3.14% | 7/15/2026 | 500 | 509,247 | ||||||||
| Avid Automobile Receivables Trust 2021-1 E† | 3.39% | 4/17/2028 | 950 | 944,022 | ||||||||
| Carmax Auto Owner Trust 2021-1 A2A | 0.22% | 2/15/2024 | 1,295 | 1,294,851 | ||||||||
| Carvana Auto Receivables Trust 2020-P1† | 2.84% | 9/8/2027 | 35 | 34,563 | ||||||||
| Carvana Auto Receivables Trust 2021-P1† | 2.16% | 12/10/2027 | 123 | 123,430 | ||||||||
| Chesapeake Funding II LLC 2019-1A A1† | 2.94% | 4/15/2031 | �� | 347 | 350,595 | |||||||
| CPS Auto Receivables Trust 2017-C D† | 3.79% | 6/15/2023 | 7 | 6,948 | ||||||||
| CPS Auto Receivables Trust 2019-D C† | 2.54% | 8/15/2024 | 361 | 363,080 | ||||||||
| CPS Auto Receivables Trust 2020-B D† | 4.75% | 4/15/2026 | 293 | 306,104 | ||||||||
| CPS Auto Receivables Trust 2020-B E† | 7.38% | 6/15/2027 | 1,300 | 1,422,712 | ||||||||
| Drive Auto Receivables Trust 2017-3 D† | 3.53% | 12/15/2023 | 9 | 9,290 | ||||||||
| Drive Auto Receivables Trust 2019-1 D | 4.09% | 6/15/2026 | 797 | 815,695 | ||||||||
| Drive Auto Receivables Trust 2019-4 C | 2.51% | 11/17/2025 | 243 | 244,533 | ||||||||
| First Investors Auto Owner Trust 2019-2A A† | 2.21% | 9/16/2024 | 39 | 39,159 | ||||||||
| Flagship Credit Auto Trust 2019-3 E† | 3.84% | 12/15/2026 | 800 | 820,838 | ||||||||
| Flagship Credit Auto Trust 2020-3 E† | 4.98% | 12/15/2027 | 422 | 445,428 | ||||||||
| Flagship Credit Auto Trust 2021-1 A† | 0.31% | 6/16/2025 | 475 | 473,818 | ||||||||
| Ford Credit Auto Lease Trust 2021-A A2 | 0.19% | 7/15/2023 | 1,378 | 1,377,638 | ||||||||
| Foursight Capital Automobile Receivables Trust 2018-1 E† | 5.56% | 1/16/2024 | 451 | 451,978 | ||||||||
| Hertz Vehicle Financing III LP 2021-2A A† | 1.68% | 12/27/2027 | 880 | 879,530 | ||||||||
| Mercedes-Benz Auto Lease Trust 2021-A A2 | 0.18% | 3/15/2023 | 1,139 | 1,138,761 | ||||||||
| OneMain Direct Auto Receivables Trust 2019-1A C† | 4.19% | 11/14/2028 | 1,487 | 1,600,124 | ||||||||
| Prestige Auto Receivables Trust 2017-1A D† | 3.61% | 10/16/2023 | 290 | 290,424 | ||||||||
| Prestige Auto Receivables Trust 2021-1A E† | 3.47% | 3/15/2029 | 1,620 | 1,617,961 | ||||||||
| Santander Consumer Auto Receivables Trust 2020-BA F† | 7.03% | 8/15/2028 | 1,738 | 1,894,926 | ||||||||
| Santander Consumer Auto Receivables Trust 2021-AA F† | 5.79% | 8/15/2028 | 750 | 790,528 | ||||||||
| Santander Drive Auto Receivables Trust 2021-1 A2 | 0.29% | 11/15/2023 | 374 | 373,813 | ||||||||
| See Notes to Financial Statements. | 99 |
Schedule of Investments (continued)
CORE PLUS BOND FUND November 30, 2021
| Investments | Interest Rate | Maturity Date | Principal Amount (000) | Fair Value | ||||||||
| Automobiles (continued) | ||||||||||||
| Toyota Auto Receivables Owner Trust 2021-A A2 | 0.16% | 7/17/2023 | $ | 1,724 | $ | 1,723,215 | ||||||
| Tricolor Auto Securitization Trust 2021-1A E† | 3.23% | 9/15/2026 | 500 | 496,057 | ||||||||
| Westlake Automobile Receivables Trust 2018-2A D† | 4.00% | 1/16/2024 | 202 | 202,552 | ||||||||
| Westlake Automobile Receivables Trust 2019-1A C† | 3.45% | 3/15/2024 | 42 | 42,099 | ||||||||
| Westlake Automobile Receivables Trust 2019-2A D† | 3.20% | 11/15/2024 | 57 | 58,177 | ||||||||
| Westlake Automobile Receivables Trust 2019-3A B† | 2.41% | 10/15/2024 | 125 | 124,863 | ||||||||
| Westlake Automobile Receivables Trust 2020-3A E† | 3.34% | 6/15/2026 | 500 | 511,288 | ||||||||
| Westlake Automobile Receivables Trust 2021-1A F† | 3.91% | 9/15/2027 | 1,100 | 1,096,689 | ||||||||
| World Omni Auto Receivables Trust 2021-A A2 | 0.17% | 2/15/2024 | 1,331 | 1,330,354 | ||||||||
| Total | 24,747,504 | |||||||||||
| Credit Card 0.56% | ||||||||||||
| Genesis Sales Finance Master Trust 2020-AA B† | 2.24% | 9/22/2025 | 1,000 | 1,003,845 | ||||||||
| Perimeter Master Note Business Trust 2019-2A C† | 7.06% | 5/15/2024 | 750 | 776,008 | (a) | |||||||
| Perimeter Master Note Business Trust 2021-1A B† | 4.17% | 5/15/2024 | 500 | 498,135 | (a) | |||||||
| Total | 2,277,988 | |||||||||||
| Other 9.31% | ||||||||||||
| AMMC CLO Ltd. 2016-19A BR† | 1.924% (3 Mo. LIBOR + 1.80% | )# | 10/16/2028 | 500 | 500,437 | |||||||
| AMMC CLO Ltd. 2016-19A CR† | 2.674% (3 Mo. LIBOR + 2.55% | )# | 10/16/2028 | 500 | 500,690 | |||||||
| AMMC CLO Ltd. 2020-23A CR† | 2.123% (3 Mo. LIBOR + 2.00% | )# | 10/17/2031 | 610 | 610,132 | |||||||
| AMMC CLO Ltd. 2021-24A B†(b) | Zero Coupon | #(c) | 1/20/2035 | 840 | 840,000 | |||||||
| Amur Equipment Finance Receivables IX LLC 2021-1A D† | 2.30% | 11/22/2027 | 1,000 | 995,532 | ||||||||
| Arbor Realty Collateralized Loan Obligation Ltd. 2021-FL2 D† | 2.59% (1 Mo. LIBOR + 2.50% | )# | 5/15/2036 | 510 | 507,539 | |||||||
| Arbor Realty Collateralized Loan Obligation Ltd. 2021-FL2 E† | 3.04% (1 Mo. LIBOR + 2.95% | )# | 5/15/2036 | 130 | 129,297 | |||||||
| Arbor Realty Commercial Real Estate Notes Ltd. 2021-FL3 D† | 2.29% (1 Mo. LIBOR + 2.20% | )# | 8/15/2034 | 630 | 625,801 | |||||||
| Arbor Realty Commercial Real Estate Notes Ltd. 2021-FL4 D†(b) | 2.99% (1 Mo. LIBOR + 2.90% | )# | 11/15/2036 | 800 | 801,136 | |||||||
| Avant Loans Funding Trust 2021-REV1 D† | 4.30% | 7/15/2030 | 825 | 824,531 | ||||||||
| Bain Capital Credit CLO 2018-2A A1† | 1.204% (3 Mo. LIBOR + 1.08% | )# | 7/19/2031 | 1,000 | 1,000,538 | |||||||
| 100 | See Notes to Financial Statements. |
Schedule of Investments (continued)
CORE PLUS BOND FUND November 30, 2021
| Investments | Interest Rate | Maturity Date | Principal Amount (000) | Fair Value | ||||||||
| Other (continued) | ||||||||||||
| Bain Capital Credit CLO 2019-2A AR† | 1.222% (3 Mo. LIBOR + 1.10% | )# |
10/17/2032 | $ | 870 | $ | 870,650 | |||||
| Barings CLO Ltd. 2018-3A D† | 3.032% (3 Mo. LIBOR + 2.90% | )# | 7/20/2029 | 350 | 345,430 | |||||||
| Carlyle Global Market Strategies CLO Ltd. 2015-5A BRR† | 2.432% (3 Mo. LIBOR + 2.30% | )# | 1/20/2032 | 400 | 400,603 | |||||||
| CARLYLE US CLO Ltd. 2019-1A CR† | 3.482% (3 Mo. LIBOR + 3.35% | )# | 4/20/2031 | 440 | 438,204 | |||||||
| CARLYLE US CLO Ltd. 2019-3A C2† | 4.332% (3 Mo. LIBOR + 4.20% | )# | 10/20/2032 | 1,000 | 998,750 | |||||||
| CBAM Ltd. 2017-1A D† | 3.882% (3 Mo. LIBOR + 3.75% | )# | 7/20/2030 | 800 | 801,362 | |||||||
| CIFC Funding I Ltd. 2021-1A A1† | 1.234% (3 Mo. LIBOR + 1.11% | )# | 4/25/2033 | 1,180 | 1,180,589 | |||||||
| CoreVest American Finance Trust 2018-1 A† | 3.804% | 6/15/2051 | 56 | 57,411 | ||||||||
| Diamond Resorts Owner Trust 2017-1A B† | 4.11% | 10/22/2029 | 17 | 16,790 | ||||||||
| Dryden 61 CLO Ltd. 2018-61A A1R† | 1.112% (3 Mo. LIBOR + .99% | )# | 1/17/2032 | 740 | 739,840 | |||||||
| Fairstone Financial Issuance Trust I 2020-1A D†(d) | 6.873% | 10/20/2039 | CAD | 781 | 646,240 | (a) | ||||||
| GreatAmerica Leasing Receivables Funding LLC Series 2019-1 A4† | 3.21% | 2/18/2025 | $ | 110 | 111,927 | |||||||
| HGI CRE CLO Ltd. 2021-FL2 B† | 1.589% (1 Mo. LIBOR + 1.50% | )# | 9/17/2036 | 980 | 980,749 | |||||||
| Invesco CLO Ltd. 2021-3A B†(b) | Zero Coupon | #(c) | 10/22/2034 | 360 | 360,000 | (a) | ||||||
| Jamestown CLO VI-R Ltd. 2018-6RA A1† | 1.274% (3 Mo. LIBOR + 1.15% | )# | 4/25/2030 | 400 | 399,709 | |||||||
| Kayne CLO Ltd. 2020-7A A1† | 1.322% (3 Mo. LIBOR + 1.20% | )# | 4/17/2033 | 721 | 721,886 | |||||||
| Kayne CLO Ltd. 2021-10A A† | Zero Coupon | #(c) | 4/23/2034 | 960 | 963,534 | |||||||
| KKR CLO Ltd. 10 BR† | 1.816% (3 Mo. LIBOR + 1.70% | )# | 9/15/2029 | 1,250 | 1,249,815 | |||||||
| KKR CLO Ltd. 30A CR† | 3.246% (3 Mo. LIBOR + 2.00% | )# | 10/17/2031 | 2,000 | 1,999,285 | |||||||
| Lending Funding Trust 2020-2A D† | 6.77% | 4/21/2031 | 315 | 345,657 | ||||||||
| Lendmark Funding Trust 2019-1A D† | 5.34% | 12/20/2027 | 675 | 687,590 | ||||||||
| Lendmark Funding Trust 2021-2A D† | 4.46% | 4/20/2032 | 725 | 733,006 | ||||||||
| M360 LLC 2019-CRE2 AS† | 2.012% (1 Mo. SOFR + 1.96% | )# | 9/15/2034 | 519 | 519,749 | |||||||
| M360 LLC 2019-CRE2 B† | 2.412% (1 Mo. SOFR + 2.36% | )# | 9/15/2034 | 258 | 258,383 | |||||||
| See Notes to Financial Statements. | 101 |
Schedule of Investments (continued)
CORE PLUS BOND FUND November 30, 2021
| Investments | Interest Rate | Maturity Date | Principal Amount (000) | Fair Value | ||||||||
| Other (continued) | ||||||||||||
| Marble Point CLO XVII Ltd. 2020-1A A† | 1.432% (3 Mo. LIBOR + 1.30% | )# | 4/20/2033 | $ | 429 | $ | 428,920 | |||||
| Mariner Finance Issuance Trust 2021-AA E† | 5.40% | 3/20/2036 | 550 | 583,438 | ||||||||
| Mariner Finance Issuance Trust 2021-BA E† | 4.68% | 11/20/2036 | 400 | 401,763 | ||||||||
| ME Funding LLC 2019-1 A2† | 6.448% | 7/30/2049 | 825 | 871,314 | ||||||||
| Mountain View CLO LLC 2017-1A BR† | 1.872% (3 Mo. LIBOR + 1.75% | )# | 10/16/2029 | 250 | 250,511 | |||||||
| Niagara Park Clo Ltd. 2019-1A BR† | 1.722% (3 Mo. LIBOR + 1.60% | )# | 7/17/2032 | 850 | 850,115 | |||||||
| Oaktree CLO Ltd. 2019-4A CR† | 4.169% (3 Mo. LIBOR + 2.25% | )# | 10/20/2032 | 570 | 564,728 | |||||||
| OCP CLO Ltd. 2019-17A A1R† | 1.172% (3 Mo. LIBOR + 1.04% | )# | 7/20/2032 | 940 | 941,175 | |||||||
| OCP CLO Ltd. 2019-17A BR† | 1.732% (3 Mo. LIBOR + 1.60% | )# | 7/20/2032 | 720 | 719,115 | |||||||
| OneMain Financial Issuance Trust 2018-2A A† | 3.57% | 3/14/2033 | 100 | 103,759 | ||||||||
| OneMain Financial Issuance Trust 2019-1A A† | 3.48% | 2/14/2031 | 39 | 38,735 | ||||||||
| OneMain Financial Issuance Trust 2020-2A D† | 3.45% | 9/14/2035 | 280 | 292,966 | ||||||||
| Orange Lake Timeshare Trust 2015-AA A† | 2.88% | 9/8/2027 | 5 | 4,560 | ||||||||
| Orange Lake Timeshare Trust 2019-A A† | 3.06% | 4/9/2038 | 22 | 22,201 | ||||||||
| Planet Fitness Master Issuer LLC 2018-1A A2II† | 4.666% | 9/5/2048 | 102 | 104,603 | ||||||||
| Romark CLO Ltd. 2017-1A A2R† | 1.774% (3 Mo. LIBOR + 1.65% | )# | 10/23/2030 | 830 | 828,465 | |||||||
| SCF Equipment Leasing LLC 2019-2A B† | 2.76% | 8/20/2026 | 402 | 411,063 | ||||||||
| SCF Equipment Leasing LLC 2021-1A E† | 3.56% | 8/20/2032 | 1,000 | 976,117 | ||||||||
| SEB Funding LLC 2021-1A A2† | 4.969% | 1/30/2052 | 850 | 853,046 | ||||||||
| Signal Peak CLO 2 LLC 2015-1A DR2† | 2.982% (3 Mo. LIBOR + 2.85% | )# | 4/20/2029 | 250 | 249,539 | |||||||
| Sunrun Demeter Issuer 2021-2A A† | 2.27% | 1/30/2057 | 700 | 701,031 | (a) | |||||||
| THL Credit Wind River Clo Ltd. 2017-3A DR† | 3.974% (3 Mo. LIBOR + 3.85% | )# | 4/15/2035 | 800 | 805,892 | |||||||
| TRTX Issuer Ltd. 2019-FL3 C† | 2.262% (1 Mo. SOFR + 2.21% | )# | 10/15/2034 | 411 | 408,966 | |||||||
| Upstart Securitization Trust 2021-2 B† | 1.75% | 6/20/2031 | 500 | 497,316 | ||||||||
| VERDE CLO Ltd. 2019-1A AR† | 1.224% (3 Mo. LIBOR + 1.10% | )# | 4/15/2032 | 1,040 | 1,040,130 | |||||||
| Voya CLO Ltd. 2019-3A DR†(b) | 3.263% (3 Mo. LIBOR + 3.15% | )# | 10/17/2032 | 1,120 | 1,120,000 | |||||||
| Wind River CLO Ltd. 2021-4A B†(b) | Zero Coupon | #(c) | 1/20/2035 | 590 | 590,029 | |||||||
| Total | 37,822,289 | |||||||||||
| 102 | See Notes to Financial Statements. |
Schedule of Investments (continued)
CORE PLUS BOND FUND November 30, 2021
| Investments | Interest Rate | Maturity Date | Principal Amount (000) | Fair Value | ||||||||
| Student Loan 0.01% | ||||||||||||
| Pennsylvania Higher Education Assistance Agency 2006-1 B | 0.394% (3 Mo. LIBOR + .27% | )# | 4/25/2038 | $ | 24 | $ | 22,587 | |||||
| Total Asset-Backed Securities (cost $65,545,963) | 65,551,294 | |||||||||||
| CORPORATE BONDS 39.11% | ||||||||||||
| Advertising 0.17% | ||||||||||||
| Clear Channel Outdoor Holdings, Inc.† | 7.75% | 4/15/2028 | 292 | 305,049 | ||||||||
| National CineMedia LLC† | 5.875% | 4/15/2028 | 431 | 386,512 | ||||||||
| Total | 691,561 | |||||||||||
| Aerospace/Defense 0.89% | ||||||||||||
| Boeing Co. (The) | 4.875% | 5/1/2025 | 1,230 | 1,348,912 | ||||||||
| Boeing Co. (The) | 5.04% | 5/1/2027 | 794 | 894,798 | ||||||||
| Boeing Co. (The) | 5.15% | 5/1/2030 | 451 | 523,837 | ||||||||
| Bombardier, Inc. (Canada)†(e) | 6.00% | 2/15/2028 | 597 | 593,573 | ||||||||
| TransDigm, Inc. | 6.375% | 6/15/2026 | 239 | 246,148 | ||||||||
| Total | 3,607,268 | |||||||||||
| Agriculture 0.32% | ||||||||||||
| MHP Lux SA (Luxembourg)†(e) | 6.25% | 9/19/2029 | 400 | 377,000 | ||||||||
| MHP Lux SA (Luxembourg)†(e) | 6.95% | 4/3/2026 | 200 | 200,213 | ||||||||
| Viterra Finance BV (Netherlands)†(e) | 3.20% | 4/21/2031 | 708 | 722,308 | ||||||||
| Total | 1,299,521 | |||||||||||
| Airlines 0.75% | ||||||||||||
| Air Canada (Canada)†(e) | 3.875% | 8/15/2026 | 348 | 345,698 | ||||||||
| American Airlines Group, Inc.† | 3.75% | 3/1/2025 | 297 | 265,010 | ||||||||
| American Airlines, Inc.† | 11.75% | 7/15/2025 | 458 | 556,184 | ||||||||
| British Airways 2020-1 Class A Pass Through Trust (United Kingdom)†(e) | 4.25% | 5/15/2034 | 469 | 506,949 | ||||||||
| Delta Air Lines, Inc.† | 7.00% | 5/1/2025 | 517 | 594,359 | ||||||||
| Delta Air Lines, Inc./SkyMiles IP Ltd.† | 4.50% | 10/20/2025 | 247 | 259,061 | ||||||||
| Delta Air Lines, Inc./SkyMiles IP Ltd.† | 4.75% | 10/20/2028 | 251 | 275,300 | ||||||||
| Hawaiian Brand Intellectual Property Ltd./HawaiianMiles Loyalty Ltd.† | 5.75% | 1/20/2026 | 249 | 254,973 | ||||||||
| Total | 3,057,534 | |||||||||||
| Apparel 0.07% | ||||||||||||
| Levi Strauss & Co.† | 3.50% | 3/1/2031 | 293 | 298,318 | ||||||||
| See Notes to Financial Statements. | 103 |
Schedule of Investments (continued)
CORE PLUS BOND FUND November 30, 2021
| Investments | Interest Rate | Maturity Date | Principal Amount (000) | Fair Value | ||||||||
| Auto Manufacturers 0.96% | ||||||||||||
| Ford Motor Co. | 3.25% | 2/12/2032 | $ | 1,817 | $ | 1,819,980 | ||||||
| General Motors Financial Co., Inc. | 3.60% | 6/21/2030 | 1,938 | 2,056,890 | ||||||||
| Total | 3,876,870 | |||||||||||
| Auto Parts & Equipment 0.13% | ||||||||||||
| American Axle & Manufacturing, Inc. | 6.50% | 4/1/2027 | 270 | 280,462 | ||||||||
| Tenneco, Inc. | 5.375% | 12/15/2024 | 257 | 254,541 | ||||||||
| Total | 535,003 | |||||||||||
| Banks 6.49% | ||||||||||||
| AIB Group plc (Ireland)†(e) | 4.75% | 10/12/2023 | 1,050 | 1,116,534 | ||||||||
| Bank of America Corp. | 2.087% (SOFR + 1.06% | )# | 6/14/2029 | 609 | 601,170 | |||||||
| Bank of America Corp. | 2.687% (SOFR + 1.32% | )# | 4/22/2032 | 1,032 | 1,045,641 | |||||||
| Bank of America Corp. | 3.593% (3 Mo. LIBOR + 1.37% | )# | 7/21/2028 | 1,956 | 2,104,722 | |||||||
| Bank of America Corp. | 3.97% (3 Mo. LIBOR + 1.07% | )# | 3/5/2029 | 1,014 | 1,115,642 | |||||||
| BankUnited, Inc. | 5.125% | 6/11/2030 | 962 | 1,106,651 | ||||||||
| BNP Paribas SA (France)†(e) | 4.375% (5 Yr. Swap rate + 1.48% | )# | 3/1/2033 | 815 | 888,504 | |||||||
| CIT Group, Inc. | 6.125% | 3/9/2028 | 230 | 271,668 | ||||||||
| Citigroup, Inc. | 3.887% (3 Mo. LIBOR + 1.56% | )# | 1/10/2028 | 1,040 | 1,128,305 | |||||||
| Citigroup, Inc. | 3.98% (3 Mo. LIBOR + 1.34% | )# | 3/20/2030 | 1,539 | 1,706,075 | |||||||
| Danske Bank A/S (Denmark)†(e) | 5.375% | 1/12/2024 | 200 | 216,202 | ||||||||
| Discover Bank | 4.682% (5 Yr. Swap rate + 1.73% | )# | 8/9/2028 | 750 | 787,253 | |||||||
| Goldman Sachs Group, Inc. (The) | 2.383% (SOFR + 1.25% | )# | 7/21/2032 | 1,451 | 1,424,755 | |||||||
| Macquarie Bank Ltd. (Australia)†(e) | 3.624% | 6/3/2030 | 696 | 722,089 | ||||||||
| Macquarie Group Ltd. (Australia)†(e) | 2.691% (SOFR + 1.44% | )# | 6/23/2032 | 980 | 976,253 | |||||||
| Macquarie Group Ltd. (Australia)†(e) | 4.654% (3 Mo. LIBOR + 1.73% | )# | 3/27/2029 | 284 | 321,939 | |||||||
| Morgan Stanley | 2.239% (SOFR + 1.18% | )# | 7/21/2032 | 579 | 567,840 | |||||||
| Morgan Stanley | 2.484% (SOFR + 1.36% | )# | 9/16/2036 | 1,170 | 1,133,048 | |||||||
| 104 | See Notes to Financial Statements. |
Schedule of Investments (continued)
CORE PLUS BOND FUND November 30, 2021
| Investments | Interest Rate | Maturity Date | Principal Amount (000) | Fair Value | ||||||||
| Banks (continued) | ||||||||||||
| Morgan Stanley | 4.431% (3 Mo. LIBOR + 1.63% | )# | 1/23/2030 | $ | 1,046 | $ | 1,194,062 | |||||
| Morgan Stanley | 5.875% (3 Mo. LIBOR + 4.44% | )# | – | (f) | 306 | 345,057 | ||||||
| National Australia Bank Ltd. (Australia)†(e) | 2.99% | 5/21/2031 | 394 | 396,675 | ||||||||
| National Australia Bank Ltd. (Australia)†(e) | 3.933% (5 Yr. Treasury CMT + 1.88% | )# | 8/2/2034 | 925 | 992,295 | |||||||
| Santander Holdings USA, Inc. | 4.40% | 7/13/2027 | 1,025 | 1,131,299 | ||||||||
| UBS AG (Switzerland)(e) | 5.125% | 5/15/2024 | 2,045 | 2,200,931 | ||||||||
| Western Alliance Bancorp | 3.00% (SOFR + 2.25% | )# | 6/15/2031 | 595 | 608,895 | |||||||
| Westpac Banking Corp. (Australia)(e) | 2.894% (5 Yr. Treasury CMT + 1.35% | )# | 2/4/2030 | 458 | 469,010 | |||||||
| Westpac Banking Corp. (Australia)(e) | 4.11% (5 Yr. Treasury CMT + 2.00% | )# | 7/24/2034 | 550 | 596,976 | |||||||
| Westpac Banking Corp. (Australia)(e) | 4.322% (5 Yr. ICE Swap rate + 2.24% | )# | 11/23/2031 | 1,088 | 1,181,077 | |||||||
| Total | 26,350,568 | |||||||||||
| Beverages 0.10% | ||||||||||||
| Triton Water Holdings, Inc.† | 6.25% | 4/1/2029 | 408 | 396,923 | ||||||||
| Building Materials 0.21% | ||||||||||||
| Builders FirstSource, Inc.† | 4.25% | 2/1/2032 | 397 | 399,352 | ||||||||
| Cemex SAB de CV (Mexico)†(e) | 5.45% | 11/19/2029 | 410 | 430,107 | ||||||||
| Total | 829,459 | |||||||||||
| Chemicals 0.77% | ||||||||||||
| Ashland LLC | 6.875% | 5/15/2043 | 60 | 75,882 | ||||||||
| Braskem Netherlands Finance BV (Netherlands)†(e) | 4.50% | 1/31/2030 | 380 | 380,648 | ||||||||
| CVR Partners LP/CVR Nitrogen Finance Corp.† | 6.125% | 6/15/2028 | 487 | 505,974 | ||||||||
| OCP SA (Malaysia)†(e) | 3.75% | 6/23/2031 | 590 | 570,471 | ||||||||
| Phosagro OAO Via Phosagro Bond Funding DAC (Ireland)†(e) | 2.60% | 9/16/2028 | 1,230 | 1,207,225 | ||||||||
| Unifrax Escrow Issuer Corp.† | 7.50% | 9/30/2029 | 408 | 396,343 | ||||||||
| Total | 3,136,543 | |||||||||||
| Coal 0.18% | ||||||||||||
| SunCoke Energy, Inc.† | 4.875% | 6/30/2029 | 617 | 600,508 | ||||||||
| Warrior Met Coal, Inc.† | 8.00% | 11/1/2024 | 111 | 113,611 | ||||||||
| Total | 714,119 | |||||||||||
| See Notes to Financial Statements. | 105 |
Schedule of Investments (continued)
CORE PLUS BOND FUND November 30, 2021
| Investments | Interest Rate | Maturity Date | Principal Amount (000) | Fair Value | ||||||||
| Commercial Services 0.42% | ||||||||||||
| Avis Budget Car Rental LLC/Avis Budget Finance, Inc.† | 5.375% | 3/1/2029 | $ | 334 | $ | 342,293 | ||||||
| Rent-A-Center, Inc.† | 6.375% | 2/15/2029 | 538 | 552,677 | ||||||||
| United Rentals North America, Inc. | 3.875% | 11/15/2027 | 525 | 545,330 | ||||||||
| United Rentals North America, Inc. | 4.00% | 7/15/2030 | 268 | 273,403 | ||||||||
| Total | 1,713,703 | |||||||||||
| Computers 0.53% | ||||||||||||
| CA Magnum Holdings (Mauritius)†(e) | 5.375% | 10/31/2026 | 380 | 389,025 | ||||||||
| Dell International LLC/EMC Corp. | 6.02% | 6/15/2026 | 115 | 133,957 | ||||||||
| Dell International LLC/EMC Corp. | 8.35% | 7/15/2046 | 972 | 1,624,687 | ||||||||
| Total | 2,147,669 | |||||||||||
| Cosmetics/Personal Care 0.10% | ||||||||||||
| Coty, Inc.† | 5.00% | 4/15/2026 | 387 | 395,005 | ||||||||
| Diversified Financial Services 3.24% | ||||||||||||
| AerCap Ireland Capital DAC/AerCap Global Aviation Trust (Ireland)(e) | 3.30% | 1/30/2032 | 308 | 310,586 | ||||||||
| AerCap Ireland Capital DAC/AerCap Global Aviation Trust (Ireland)(e) | 4.875% | 1/16/2024 | 1,050 | 1,122,467 | ||||||||
| Aircastle Ltd.† | 2.85% | 1/26/2028 | 1,551 | 1,560,246 | ||||||||
| Ally Financial, Inc. | 4.70% (5 Yr. Treasury CMT + 3.87% | )# | 5/15/2026 | 263 | 272,041 | |||||||
| Ally Financial, Inc. | 8.00% | 11/1/2031 | 1,282 | 1,814,750 | ||||||||
| Aviation Capital Group LLC† | 1.95% | 1/30/2026 | 315 | 309,332 | ||||||||
| Aviation Capital Group LLC† | 5.50% | 12/15/2024 | 1,177 | 1,296,531 | ||||||||
| Avolon Holdings Funding Ltd. (Ireland)†(e) | 2.125% | 2/21/2026 | 660 | 646,564 | ||||||||
| Avolon Holdings Funding Ltd. (Ireland)†(e) | 3.95% | 7/1/2024 | 500 | 524,447 | ||||||||
| Avolon Holdings Funding Ltd. (Ireland)†(e) | 4.25% | 4/15/2026 | 1,084 | 1,158,190 | ||||||||
| Avolon Holdings Funding Ltd. (Ireland)†(e) | 5.25% | 5/15/2024 | 418 | 450,001 | ||||||||
| Brightsphere Investment Group, Inc. | 4.80% | 7/27/2026 | 87 | 90,220 | ||||||||
| Coinbase Global, Inc.† | 3.375% | 10/1/2028 | 409 | 385,121 | ||||||||
| Global Aircraft Leasing Co. Ltd. PIK 7.25%† | 6.50% | 9/15/2024 | 412 | 394,344 | ||||||||
| Nationstar Mortgage Holdings, Inc.† | 5.50% | 8/15/2028 | 269 | 268,416 | ||||||||
| Navient Corp. | 6.75% | 6/25/2025 | 879 | 949,149 | ||||||||
| Neuberger Berman Group LLC/Neuberger Berman Finance Corp.† | 4.50% | 3/15/2027 | 20 | 22,296 | ||||||||
| Neuberger Berman Group LLC/Neuberger Berman Finance Corp.† | 4.875% | 4/15/2045 | 303 | 365,203 | ||||||||
| OneMain Finance Corp. | 5.375% | 11/15/2029 | 345 | 363,759 | ||||||||
| 106 | See Notes to Financial Statements. |
Schedule of Investments (continued)
CORE PLUS BOND FUND November 30, 2021
| Investments | Interest Rate | Maturity Date | Principal Amount (000) | Fair Value | ||||||||
| Diversified Financial Services (continued) | ||||||||||||
| Park Aerospace Holdings Ltd. (Ireland)†(e) | 5.50% | 2/15/2024 | $ | 382 | $ | 411,516 | ||||||
| Rocket Mortgage LLC/Rocket Mortgage Co-Issuer, Inc.† | 3.625% | 3/1/2029 | 429 | 420,195 | ||||||||
| Total | 13,135,374 | |||||||||||
| Electric 1.43% | ||||||||||||
| Alfa Desarrollo S.p.A. (Chile)†(e) | 4.55% | 9/27/2051 | 469 | 447,508 | ||||||||
| Ausgrid Finance Pty Ltd. (Australia)†(e) | 4.35% | 8/1/2028 | 772 | 872,247 | ||||||||
| Calpine Corp.† | 5.00% | 2/1/2031 | 439 | 423,165 | ||||||||
| Cikarang Listrindo Tbk PT (Indonesia)†(e) | 4.95% | 9/14/2026 | 550 | 560,797 | ||||||||
| FirstEnergy Corp. | 4.40% | 7/15/2027 | 556 | 594,954 | ||||||||
| IPALCO Enterprises, Inc. | 4.25% | 5/1/2030 | 779 | 866,089 | ||||||||
| NRG Energy, Inc.† | 4.45% | 6/15/2029 | 1,100 | 1,201,043 | ||||||||
| Oglethorpe Power Corp. | 5.95% | 11/1/2039 | 340 | 457,777 | ||||||||
| Pennsylvania Electric Co.† | 3.60% | 6/1/2029 | 375 | 396,964 | ||||||||
| Total | 5,820,544 | |||||||||||
| Energy-Alternate Sources 0.16% | ||||||||||||
| Renewable Energy Group, Inc.† | 5.875% | 6/1/2028 | 375 | 382,222 | ||||||||
| TerraForm Power Operating LLC† | 4.75% | 1/15/2030 | 245 | 249,211 | ||||||||
| Total | 631,433 | |||||||||||
| Engineering & Construction 0.47% | ||||||||||||
| Cellnex Finance Co. S.A. (Spain)†(e) | 3.875% | 7/7/2041 | 500 | 487,390 | ||||||||
| Fluor Corp. | 4.25% | 9/15/2028 | 1,015 | 1,036,929 | ||||||||
| IEA Energy Services LLC† | 6.625% | 8/15/2029 | 409 | 397,654 | ||||||||
| Total | 1,921,973 | |||||||||||
| Entertainment 0.68% | ||||||||||||
| Affinity Gaming† | 6.875% | 12/15/2027 | 540 | 554,710 | ||||||||
| Caesars Entertainment, Inc.† | 4.625% | 10/15/2029 | 271 | 264,607 | ||||||||
| Caesars Entertainment, Inc.† | 8.125% | 7/1/2027 | 456 | 500,950 | ||||||||
| Live Nation Entertainment, Inc.† | 3.75% | 1/15/2028 | 404 | 389,052 | ||||||||
| Live Nation Entertainment, Inc.† | 4.75% | 10/15/2027 | 283 | 283,320 | ||||||||
| Mohegan Gaming & Entertainment† | 8.00% | 2/1/2026 | 251 | 254,813 | ||||||||
| Scientific Games International, Inc.† | 7.25% | 11/15/2029 | 336 | 371,088 | ||||||||
| Scientific Games International, Inc.† | 8.25% | 3/15/2026 | 145 | 152,803 | ||||||||
| Total | 2,771,343 | |||||||||||
| See Notes to Financial Statements. | 107 |
Schedule of Investments (continued)
CORE PLUS BOND FUND November 30, 2021
| Investments | Interest Rate | Maturity Date | Principal Amount (000) | Fair Value | ||||||||
| Environmental Control 0.20% | ||||||||||||
| Madison IAQ LLC† | 5.875% | 6/30/2029 | $ | 598 | $ | 576,269 | ||||||
| Stericycle, Inc.† | 3.875% | 1/15/2029 | 226 | 220,671 | ||||||||
| Total | 796,940 | |||||||||||
| Food 0.36% | ||||||||||||
| Albertsons Cos., Inc./Safeway, Inc./New Albertsons LP/Albertsons LLC† | 4.875% | 2/15/2030 | 263 | 280,013 | ||||||||
| FAGE International SA/FAGE USA Dairy Industry, Inc. (Luxembourg)†(b)(e) | 5.625% | 8/15/2026 | 200 | 204,130 | ||||||||
| Kraft Heinz Foods Co. | 4.375% | 6/1/2046 | 510 | 591,012 | ||||||||
| SEG Holding LLC/SEG Finance Corp.† | 5.625% | 10/15/2028 | 375 | 394,204 | ||||||||
| Total | 1,469,359 | |||||||||||
| Forest Products & Paper 0.09% | ||||||||||||
| Mercer International, Inc. (Canada)(e) | 5.125% | 2/1/2029 | 346 | 342,381 | ||||||||
| Gas 0.33% | ||||||||||||
| National Fuel Gas Co. | 3.95% | 9/15/2027 | 689 | 723,974 | ||||||||
| National Fuel Gas Co. | 5.50% | 1/15/2026 | 558 | 632,683 | ||||||||
| Total | 1,356,657 | |||||||||||
| Health Care-Services 1.34% | ||||||||||||
| Acadia Healthcare Co., Inc.† | 5.00% | 4/15/2029 | 253 | 257,304 | ||||||||
| Centene Corp. | 2.45% | 7/15/2028 | 218 | 214,263 | ||||||||
| Centene Corp. | 2.625% | 8/1/2031 | 182 | 175,791 | ||||||||
| Centene Corp. | 3.375% | 2/15/2030 | 271 | 273,287 | ||||||||
| Centene Corp. | 4.25% | 12/15/2027 | 292 | 303,302 | ||||||||
| CHS/Community Health Systems, Inc.† | 4.75% | 2/15/2031 | 331 | 326,552 | ||||||||
| DaVita, Inc.† | 3.75% | 2/15/2031 | 298 | 276,842 | ||||||||
| Encompass Health Corp. | 4.50% | 2/1/2028 | 270 | 273,212 | ||||||||
| HCA, Inc. | 4.125% | 6/15/2029 | 888 | 977,043 | ||||||||
| HCA, Inc. | 4.50% | 2/15/2027 | 354 | 389,750 | ||||||||
| HCA, Inc. | 5.25% | 6/15/2026 | 130 | 146,364 | ||||||||
| Radiology Partners, Inc.† | 9.25% | 2/1/2028 | 713 | 728,016 | ||||||||
| Surgery Center Holdings, Inc.† | 6.75% | 7/1/2025 | 44 | 44,478 | ||||||||
| Surgery Center Holdings, Inc.† | 10.00% | 4/15/2027 | 197 | 210,205 | ||||||||
| Tenet Healthcare Corp.† | 6.25% | 2/1/2027 | 223 | 231,340 | ||||||||
| Tenet Healthcare Corp. | 6.75% | 6/15/2023 | 140 | 149,013 | ||||||||
| Universal Health Services, Inc.† | 2.65% | 10/15/2030 | 489 | 474,968 | ||||||||
| Total | 5,451,730 | |||||||||||
| 108 | See Notes to Financial Statements. |
Schedule of Investments (continued)
CORE PLUS BOND FUND November 30, 2021
| Investments | Interest Rate | Maturity Date | Principal Amount (000) | Fair Value | ||||||||
| Home Builders 0.70% | ||||||||||||
| Century Communities, Inc. | 6.75% | 6/1/2027 | $ | 260 | $ | 273,244 | ||||||
| Installed Building Products, Inc.† | 5.75% | 2/1/2028 | 266 | 278,815 | ||||||||
| NVR, Inc. | 3.00% | 5/15/2030 | 754 | 786,401 | ||||||||
| PulteGroup, Inc. | 6.375% | 5/15/2033 | 597 | 776,667 | ||||||||
| Toll Brothers Finance Corp. | 3.80% | 11/1/2029 | 530 | 561,055 | ||||||||
| Toll Brothers Finance Corp. | 4.35% | 2/15/2028 | 121 | 130,996 | ||||||||
| Toll Brothers Finance Corp. | 4.875% | 3/15/2027 | 43 | 47,493 | ||||||||
| Total | 2,854,671 | |||||||||||
| Housewares 0.16% | ||||||||||||
| Newell Brands, Inc. | 5.875% | 4/1/2036 | 207 | 253,114 | ||||||||
| SWF Escrow Issuer Corp.† | 6.50% | 10/1/2029 | 421 | 404,760 | ||||||||
| Total | 657,874 | |||||||||||
| Insurance 0.39% | ||||||||||||
| Assurant, Inc. | 2.65% | 1/15/2032 | 283 | 279,508 | ||||||||
| Assurant, Inc. | 3.70% | 2/22/2030 | 312 | 337,692 | ||||||||
| First American Financial Corp. | 2.40% | 8/15/2031 | 529 | 515,475 | ||||||||
| Protective Life Corp. | 8.45% | 10/15/2039 | 275 | 444,390 | ||||||||
| Total | 1,577,065 | |||||||||||
| Internet 0.69% | ||||||||||||
| GrubHub Holdings, Inc.† | 5.50% | 7/1/2027 | 527 | 529,498 | ||||||||
| Match Group Holdings II LLC† | 4.125% | 8/1/2030 | 520 | 516,675 | ||||||||
| Match Group Holdings II LLC† | 5.625% | 2/15/2029 | 156 | 167,235 | ||||||||
| Netflix, Inc.† | 4.875% | 6/15/2030 | 234 | 271,352 | ||||||||
| Netflix, Inc. | 6.375% | 5/15/2029 | 559 | 694,390 | ||||||||
| Uber Technologies, Inc.† | 4.50% | 8/15/2029 | 351 | 348,148 | ||||||||
| Uber Technologies, Inc.† | 8.00% | 11/1/2026 | 270 | 287,825 | ||||||||
| Total | 2,815,123 | |||||||||||
| Investment Companies 0.12% | ||||||||||||
| Owl Rock Capital Corp. | 2.875% | 6/11/2028 | 492 | 481,052 | ||||||||
| Iron-Steel 0.41% | ||||||||||||
| Steel Dynamics, Inc. | 5.00% | 12/15/2026 | 990 | 1,011,686 | ||||||||
| United States Steel Corp. | 6.875% | 3/1/2029 | 631 | 662,250 | ||||||||
| Total | 1,673,936 | |||||||||||
| See Notes to Financial Statements. | 109 |
Schedule of Investments (continued)
CORE PLUS BOND FUND November 30, 2021
| Investments | Interest Rate | Maturity Date | Principal Amount (000) | Fair Value | ||||||||
| Leisure Time 0.28% | ||||||||||||
| Life Time, Inc.† | 5.75% | 1/15/2026 | $ | 589 | $ | 597,791 | ||||||
| NCL Finance Ltd.† | 6.125% | 3/15/2028 | 379 | 370,323 | ||||||||
| Royal Caribbean Cruises Ltd.† | 11.50% | 6/1/2025 | 141 | 157,614 | ||||||||
| Total | 1,125,728 | |||||||||||
| Lodging 0.22% | ||||||||||||
| Boyd Gaming Corp. | 4.75% | 12/1/2027 | 162 | 164,643 | ||||||||
| Boyd Gaming Corp.† | 4.75% | 6/15/2031 | 215 | 214,194 | ||||||||
| Hilton Domestic Operating Co., Inc. | 4.875% | 1/15/2030 | 114 | 119,871 | ||||||||
| Wynn Las Vegas LLC/Wynn Las Vegas Capital Corp.† | 5.25% | 5/15/2027 | 390 | 383,229 | ||||||||
| Total | 881,937 | |||||||||||
| Machinery: Construction & Mining 0.10% | ||||||||||||
| Vertiv Group Corp.† | 4.125% | 11/15/2028 | 409 | 408,585 | ||||||||
| Machinery-Diversified 0.50% | ||||||||||||
| nVent Finance Sarl (Luxembourg)(e) | 4.55% | 4/15/2028 | 1,279 | 1,430,175 | ||||||||
| TK Elevator US Newco, Inc.† | 5.25% | 7/15/2027 | 582 | 592,747 | ||||||||
| Total | 2,022,922 | |||||||||||
| Media 1.04% | ||||||||||||
| CCO Holdings LLC/CCO Holdings Capital Corp.† | 4.75% | 3/1/2030 | 413 | 423,765 | ||||||||
| Charter Communications Operating LLC/Charter Communications Operating Capital | 2.25% | 1/15/2029 | 1,925 | 1,867,150 | ||||||||
| Diamond Sports Group LLC/Diamond Sports Finance Co.† | 5.375% | 8/15/2026 | 621 | 276,305 | ||||||||
| Nexstar Media, Inc.† | 5.625% | 7/15/2027 | 247 | 256,556 | ||||||||
| Time Warner Cable LLC | 7.30% | 7/1/2038 | 981 | 1,409,426 | ||||||||
| Total | 4,233,202 | |||||||||||
| Mining 1.47% | ||||||||||||
| Alcoa Nederland Holding BV (Netherlands)†(e) | 4.125% | 3/31/2029 | 381 | 389,165 | ||||||||
| FMG Resources August 2006 Pty Ltd. (Australia)†(e) | 4.375% | 4/1/2031 | 438 | 444,649 | ||||||||
| FMG Resources August 2006 Pty Ltd. (Australia)†(e) | 4.50% | 9/15/2027 | 320 | 332,202 | ||||||||
| Freeport-McMoRan, Inc. | 4.125% | 3/1/2028 | 673 | 692,217 | ||||||||
| Freeport-McMoRan, Inc. | 4.625% | 8/1/2030 | 543 | 574,320 | ||||||||
| Glencore Funding LLC† | 2.85% | 4/27/2031 | 621 | 618,392 | ||||||||
| Glencore Funding LLC† | 4.875% | 3/12/2029 | 2,071 | 2,358,412 | ||||||||
| Hecla Mining Co. | 7.25% | 2/15/2028 | 164 | 175,781 | ||||||||
| Novelis Corp.† | 3.875% | 8/15/2031 | 414 | 400,162 | ||||||||
| Total | 5,985,300 | |||||||||||
| 110 | See Notes to Financial Statements. |
Schedule of Investments (continued)
CORE PLUS BOND FUND November 30, 2021
| Investments | Interest Rate | Maturity Date | Principal Amount (000) | Fair Value | ||||||||
| Miscellaneous Manufacturing 0.08% | ||||||||||||
| Amsted Industries, Inc.† | 4.625% | 5/15/2030 | $ | 312 | $ | 315,278 | ||||||
| Oil & Gas 4.55% | ||||||||||||
| Apache Corp. | 4.375% | 10/15/2028 | 345 | 364,216 | ||||||||
| Apache Corp. | 4.625% | 11/15/2025 | 273 | 288,999 | ||||||||
| California Resources Corp.† | 7.125% | 2/1/2026 | 296 | 305,516 | ||||||||
| Callon Petroleum Co.† | 8.00% | 8/1/2028 | 567 | 556,094 | ||||||||
| Cenovus Energy, Inc. (Canada)(e) | 3.75% | 2/15/2052 | 384 | 377,686 | ||||||||
| Civitas Resources, Inc.† | 5.00% | 10/15/2026 | 400 | 396,000 | ||||||||
| Colgate Energy Partners III LLC† | 7.75% | 2/15/2026 | 560 | 596,439 | ||||||||
| Comstock Resources, Inc.† | 6.75% | 3/1/2029 | 474 | 493,939 | ||||||||
| Continental Resources, Inc.† | 5.75% | 1/15/2031 | 333 | 388,533 | ||||||||
| Diamondback Energy, Inc. | 3.50% | 12/1/2029 | 1,838 | 1,930,439 | ||||||||
| Diamondback Energy, Inc. | 4.75% | 5/31/2025 | 103 | 112,932 | ||||||||
| Eni S.p.A. (Italy)†(e) | 5.70% | 10/1/2040 | 300 | 390,011 | ||||||||
| Gulfport Energy Operating Corp.† | 8.00% | 5/17/2026 | 704 | 757,836 | ||||||||
| Helmerich & Payne, Inc.† | 2.90% | 9/29/2031 | 644 | 630,142 | ||||||||
| Hilcorp Energy I LP/Hilcorp Finance Co.† | 5.75% | 2/1/2029 | 637 | 628,044 | ||||||||
| Hilcorp Energy I LP/Hilcorp Finance Co.† | 6.25% | 11/1/2028 | 163 | 165,812 | ||||||||
| Laredo Petroleum, Inc. | 9.50% | 1/15/2025 | 920 | 917,291 | ||||||||
| Lundin Energy Finance BV (Netherlands)†(e) | 3.10% | 7/15/2031 | 300 | 303,529 | ||||||||
| MEG Energy Corp. (Canada)†(e) | 5.875% | 2/1/2029 | 585 | 581,388 | ||||||||
| MEG Energy Corp. (Canada)†(e) | 7.125% | 2/1/2027 | 715 | 732,231 | ||||||||
| Murphy Oil Corp. | 5.875% | 12/1/2027 | 436 | 444,722 | ||||||||
| Occidental Petroleum Corp. | 6.125% | 1/1/2031 | 788 | 919,478 | ||||||||
| Ovintiv, Inc. | 6.50% | 2/1/2038 | 363 | 463,179 | ||||||||
| PBF Holding Co. LLC/PBF Finance Corp.† | 9.25% | 5/15/2025 | 408 | 381,480 | ||||||||
| Petroleos Mexicanos (Mexico)(e) | 4.50% | 1/23/2026 | 614 | 602,392 | ||||||||
| Petroleos Mexicanos (Mexico)(e) | 5.35% | 2/12/2028 | 346 | 333,395 | ||||||||
| Qatar Petroleum (Qatar)†(e) | 3.125% | 7/12/2041 | 800 | 804,044 | ||||||||
| Range Resources Corp.† | 8.25% | 1/15/2029 | 595 | 656,600 | ||||||||
| SA Global Sukuk Ltd.† | 2.694% | 6/17/2031 | 800 | 800,245 | ||||||||
| SM Energy Co. | 5.625% | 6/1/2025 | 334 | 331,450 | ||||||||
| SM Energy Co. | 6.75% | 9/15/2026 | 178 | 178,845 | ||||||||
| Southwestern Energy Co. | 7.75% | 10/1/2027 | 340 | 365,075 | ||||||||
| Tengizchevroil Finance Co. International Ltd. (Kazakhstan)†(e) | 3.25% | 8/15/2030 | 450 | 444,861 | ||||||||
| Transocean Guardian Ltd.† | 5.875% | 1/15/2024 | 304 | 286,598 | ||||||||
| Viper Energy Partners LP† | 5.375% | 11/1/2027 | 531 | 548,080 | ||||||||
| Total | 18,477,521 | |||||||||||
| See Notes to Financial Statements. | 111 |
Schedule of Investments (continued)
CORE PLUS BOND FUND November 30, 2021
| Investments | Interest Rate | Maturity Date | Principal Amount (000) | Fair Value | ||||||||
| Oil & Gas Services 0.27% | ||||||||||||
| NOV, Inc. | 3.60% | 12/1/2029 | $ | 671 | $ | 689,563 | ||||||
| Weatherford International Ltd.† | 8.625% | 4/30/2030 | 400 | 392,740 | ||||||||
| Total | 1,082,303 | |||||||||||
| Packaging & Containers 0.15% | ||||||||||||
| Ball Corp. | 2.875% | 8/15/2030 | 657 | 625,218 | ||||||||
| Pharmaceuticals 1.09% | ||||||||||||
| 180 Medical, Inc.† | 3.875% | 10/15/2029 | 616 | 605,824 | ||||||||
| Bayer Corp.† | 6.65% | 2/15/2028 | 203 | 247,785 | ||||||||
| Bayer US Finance II LLC† | 4.25% | 12/15/2025 | 1,694 | 1,845,213 | ||||||||
| Bayer US Finance II LLC† | 4.375% | 12/15/2028 | 992 | 1,115,046 | ||||||||
| Becton Dickinson & Co. | 1.148% (3 Mo. LIBOR + 1.03% | )# | 6/6/2022 | 617 | 619,920 | |||||||
| Total | 4,433,788 | |||||||||||
| Pipelines 1.46% | ||||||||||||
| Buckeye Partners LP | 6.375% (3 Mo. LIBOR + 4.02% | )# | 1/22/2078 | 361 | 319,714 | |||||||
| Cheniere Corpus Christi Holdings LLC | 3.70% | 11/15/2029 | 511 | 546,323 | ||||||||
| Galaxy Pipeline Assets Bidco Ltd. (United Arab Emirates)†(e) | 3.25% | 9/30/2040 | 802 | 804,173 | ||||||||
| NGPL PipeCo LLC† | 3.25% | 7/15/2031 | 805 | 816,475 | ||||||||
| NGPL PipeCo LLC† | 4.875% | 8/15/2027 | 600 | 670,347 | ||||||||
| Sabine Pass Liquefaction LLC | 5.875% | 6/30/2026 | 1,578 | 1,815,753 | ||||||||
| Venture Global Calcasieu Pass LLC† | 4.125% | 8/15/2031 | 386 | 395,419 | ||||||||
| Western Midstream Operating LP | 5.30% | 2/1/2030 | 521 | 561,534 | ||||||||
| Total | 5,929,738 | |||||||||||
| REITS 2.01% | ||||||||||||
| American Campus Communities Operating Partnership LP | 3.875% | 1/30/2031 | 1,005 | 1,117,750 | ||||||||
| American Homes 4 Rent LP | 2.375% | 7/15/2031 | 597 | 591,400 | ||||||||
| Blackstone Mortgage Trust, Inc.† | 3.75% | 1/15/2027 | 618 | 609,614 | ||||||||
| EPR Properties | 3.75% | 8/15/2029 | 748 | 766,887 | ||||||||
| EPR Properties | 4.95% | 4/15/2028 | 823 | 901,717 | ||||||||
| Goodman US Finance Three LLC† | 3.70% | 3/15/2028 | 1,120 | 1,213,628 | ||||||||
| Invitation Homes Operating Partnership LP | 2.00% | 8/15/2031 | 937 | 889,746 | ||||||||
| Invitation Homes Operating Partnership LP | 2.30% | 11/15/2028 | 399 | 396,172 | ||||||||
| MPT Operating Partnership LP/MPT Finance Corp. | 4.625% | 8/1/2029 | 879 | 918,946 | ||||||||
| Physicians Realty LP | 2.625% | 11/1/2031 | 735 | 735,188 | ||||||||
| Total | 8,141,048 | |||||||||||
| 112 | See Notes to Financial Statements. |
Schedule of Investments (continued)
CORE PLUS BOND FUND November 30, 2021
| Investments | Interest Rate | Maturity Date | Principal Amount (000) | Fair Value | ||||||||
| Retail 1.06% | ||||||||||||
| Carvana Co.† | 5.875% | 10/1/2028 | $ | 626 | $ | 629,346 | ||||||
| CEC Entertainment LLC† | 6.75% | 5/1/2026 | 569 | 555,438 | ||||||||
| Gap, Inc. (The)† | 3.875% | 10/1/2031 | 395 | 378,635 | ||||||||
| L Brands, Inc.† | 6.625% | 10/1/2030 | 262 | 291,064 | ||||||||
| LBM Acquisition LLC† | 6.25% | 1/15/2029 | 399 | 382,613 | ||||||||
| Macy’s Retail Holdings LLC | 4.50% | 12/15/2034 | 400 | 394,014 | ||||||||
| Murphy Oil USA, Inc. | 4.75% | 9/15/2029 | 500 | 519,323 | ||||||||
| Party City Holdings, Inc.† | 8.75% | 2/15/2026 | 506 | 511,156 | ||||||||
| Staples, Inc.† | 7.50% | 4/15/2026 | 395 | 392,780 | ||||||||
| Yum! Brands, Inc.† | 7.75% | 4/1/2025 | 235 | 247,961 | ||||||||
| Total | 4,302,330 | |||||||||||
| Semiconductors 0.48% | ||||||||||||
| Microchip Technology, Inc. | 4.333% | 6/1/2023 | 598 | 626,307 | ||||||||
| Skyworks Solutions, Inc. | 3.00% | 6/1/2031 | 872 | 885,303 | ||||||||
| TSMC Arizona Corp. | 3.25% | 10/25/2051 | 410 | 441,771 | ||||||||
| Total | 1,953,381 | |||||||||||
| Software 0.70% | ||||||||||||
| MSCI, Inc.† | 3.625% | 11/1/2031 | 397 | 404,539 | ||||||||
| Oracle Corp. | 2.875% | 3/25/2031 | 1,110 | 1,136,817 | ||||||||
| Twilio, Inc. | 3.875% | 3/15/2031 | 260 | 258,582 | ||||||||
| VMware, Inc. | 4.70% | 5/15/2030 | 905 | 1,051,640 | ||||||||
| Total | 2,851,578 | |||||||||||
| Telecommunications 0.39% | ||||||||||||
| Frontier Communications Holdings LLC† | 5.00% | 5/1/2028 | 475 | 477,209 | ||||||||
| LogMeIn, Inc.† | 5.50% | 9/1/2027 | 270 | 269,047 | ||||||||
| Sprint Capital Corp. | 6.875% | 11/15/2028 | 212 | 262,066 | ||||||||
| Xiaomi Best Time International Ltd. (Hong Kong)†(e) | 4.10% | 7/14/2051 | 570 | 591,916 | ||||||||
| Total | 1,600,238 | |||||||||||
| Toys/Games/Hobbies 0.14% | ||||||||||||
| Hasbro, Inc. | 3.00% | 11/19/2024 | 395 | 412,929 | ||||||||
| Mattel, Inc. | 5.45% | 11/1/2041 | 137 | 161,822 | ||||||||
| Total | 574,751 | |||||||||||
| See Notes to Financial Statements. | 113 |
Schedule of Investments (continued)
CORE PLUS BOND FUND November 30, 2021
| Investments | Interest Rate | Maturity Date | Principal Amount (000) | Fair Value | ||||||||
| Transportation 0.16% | ||||||||||||
| Seaspan Corp. (Hong Kong)†(e) | 5.50% | 8/1/2029 | $ | 409 | $ | 406,522 | ||||||
| Watco Cos LLC/Watco Finance Corp.† | 6.50% | 6/15/2027 | 238 | 249,871 | ||||||||
| Total | 656,393 | |||||||||||
| Trucking & Leasing 0.10% | ||||||||||||
| Fortress Transportation and Infrastructure Investors LLC† | 5.50% | 5/1/2028 | 415 | 407,605 | ||||||||
| Total Corporate Bonds (cost $158,231,102) | 158,816,363 | |||||||||||
| FLOATING RATE LOANS(g) 3.00% | ||||||||||||
| Advertising 0.34% | ||||||||||||
| Lamar Media Corporation 2020 Term Loan B | 1.589% (1 Mo. LIBOR + 1.5% | ) | 2/5/2027 | 1,397 | 1,391,694 | |||||||
| Aerospace/Defense 0.07% | ||||||||||||
| WP CPP Holdings, LLC 2018 Term Loan | 4.75% (3 Mo. LIBOR + 3.75% (3 Mo. LIBOR + 3.75% | ) ) | 4/30/2025 | 288 | 277,707 | |||||||
| Air Transportation 0.27% | ||||||||||||
| AAdvantage Loyalty IP Ltd. 2021 Term Loan | 5.50% (3 Mo. LIBOR + 4.75% | ) | 4/20/2028 | 515 | 530,128 | |||||||
| United Airlines, Inc. 2021 Term Loan B | 4.50% (3 Mo. LIBOR + 3.75% | ) | 4/21/2028 | 578 | 578,059 | |||||||
| Total | 1,108,187 | |||||||||||
| Auto Parts: Original Equipment 0.15% | ||||||||||||
| Truck Hero, Inc. 2021 Term Loan B | 4.00% (1 Mo. LIBOR + 3.25% | ) | 1/31/2028 | 600 | 596,304 | |||||||
| Automotive 0.07% | ||||||||||||
| American Trailer World Corp. Term Loan B | 4.50% (1 Mo. LIBOR + 3.75% | ) | 3/3/2028 | 274 | 272,027 | |||||||
| Business Services 0.29% | ||||||||||||
| Employbridge LLC 2021 Term Loan B | 5.50% (3 Mo. LIBOR + 4.75% | ) | 7/14/2028 | 734 | 725,948 | |||||||
| Trans Union, LLC 2021 2nd Lien Term Loan | – | (h) | 11/16/2029 | 99 | 98,806 | (i) | ||||||
| Trans Union, LLC 2021 Term Loan B6(j) | – | (h) | 11/16/2028 | 368 | 365,868 | |||||||
| Total | 1,190,622 | |||||||||||
| 114 | See Notes to Financial Statements. |
Schedule of Investments (continued)
CORE PLUS BOND FUND November 30, 2021
| Investments | Interest Rate | Maturity Date | Principal Amount (000) | Fair Value | ||||||||
| Computer Software 0.25% | ||||||||||||
| Polaris Newco LLC USD Term Loan B | 4.50% (6 Mo. LIBOR + 4.00% | ) | 6/2/2028 | $ | 415 | $ | 414,439 | |||||
| Red Planet Borrower, LLC Term Loan B | 4.25% (3 Mo. LIBOR + 3.75% | ) | 10/2/2028 | 590 | 586,165 | |||||||
| Total | 1,000,604 | |||||||||||
| Entertainment 0.34% | ||||||||||||
| Playtika Holding Corp 2021 Term Loan | 2.84% (1 Mo. LIBOR + 2.75% | ) | 3/13/2028 | 619 | 616,371 | |||||||
| Scientific Games International, Inc. 2018 Term Loan B5 | – | (h) | 8/14/2024 | 790 | 785,228 | |||||||
| Total | 1,401,599 | |||||||||||
| Gaming 0.10% | ||||||||||||
| Twin River Worldwide Holdings, Inc. 2021 Term Loan B | 3.75% (6 Mo. LIBOR + 3.25% | ) | 8/6/2028 | 400 | 398,500 | |||||||
| Health Care Services 0.07% | ||||||||||||
| MED ParentCo LP 1st Lien Term Loan | 4.34% (1 Mo. LIBOR + 4.25% | ) | 8/31/2026 | 300 | 298,925 | |||||||
| Household Furnishings 0.10% | ||||||||||||
| Springs Windows Fashions, LLC 2021 Term Loan B | 4.75% (1 Mo. LIBOR + 4.00% | ) | 10/6/2028 | 400 | 395,334 | |||||||
| Oil 0.15% | ||||||||||||
| Brazos Delaware II, LLC Term Loan B | 4.091% (1 Mo. LIBOR + 4.00% | ) | 5/21/2025 | 621 | 607,827 | |||||||
| Oil: Integrated Domestic 0.12% | ||||||||||||
| BCP Raptor II, LLC 1st Lien Term Loan | 4.84% (1 Mo. LIBOR + 4.75% | ) | 11/3/2025 | 479 | 477,862 | |||||||
| Retail 0.29% | ||||||||||||
| Foundation Building Materials Holding Company LLC 2021 Term Loan | – | (h) | 2/3/2028 | 600 | 593,925 | |||||||
| Harbor Freight Tools USA, Inc. 2021 Term Loan B | 3.25% (1 Mo. LIBOR + 2.75% | ) | 10/19/2027 | 598 | 594,153 | |||||||
| Total | 1,188,078 | |||||||||||
| Retail: Specialty 0.15% | ||||||||||||
| Restoration Hardware, Inc. Term Loan B | – | (h) | 10/20/2028 | 600 | 597,498 | |||||||
| See Notes to Financial Statements. | 115 |
Schedule of Investments (continued)
CORE PLUS BOND FUND November 30, 2021
| Investments | Interest Rate | Maturity Date | Principal Amount (000) | Fair Value | ||||||||
| Services 0.07% | ||||||||||||
| KUEHG Corp. 2018 Incremental Term Loan | 4.75% (3 Mo. LIBOR + 3.75% | ) | 2/21/2025 | $ | 301 | $ | 295,871 | |||||
| Technology 0.10% | ||||||||||||
| PUG LLC USD Term Loan | 3.59% (1 Mo. LIBOR + 3.50% | ) | 2/12/2027 | 400 | 394,000 | |||||||
| Telecommunications 0.07% | ||||||||||||
| SSH Group Holdings, Inc. 2018 1st Lien Term Loan | 4.382% (3 Mo. LIBOR + 4.25% | ) | 7/30/2025 | 304 | 292,269 | |||||||
| Total Floating Rate Loans (cost $12,177,501) | 12,184,908 | |||||||||||
| FOREIGN GOVERNMENT OBLIGATIONS(e) 1.25% | ||||||||||||
| Egypt 0.21% | ||||||||||||
| Egypt Government International Bond† | 5.80% | 9/30/2027 | 930 | 867,783 | ||||||||
| Nigeria 0.19% | ||||||||||||
| Republic of Nigeria† | 7.143% | 2/23/2030 | 800 | 762,328 | ||||||||
| Qatar 0.55% | ||||||||||||
| Qatar Government International Bond† | 3.75% | 4/16/2030 | 2,000 | 2,229,680 | ||||||||
| Saudi Arabia 0.24% | ||||||||||||
| Saudi International Bond† | 3.625% | 3/4/2028 | 900 | 980,151 | ||||||||
| Sri Lanka 0.06% | ||||||||||||
| Republic of Sri Lanka† | 5.875% | 7/25/2022 | 290 | 220,035 | ||||||||
| Total Foreign Government Obligations (cost $5,211,474) | 5,059,977 | |||||||||||
| GOVERNMENT SPONSORED ENTERPRISES COLLATERALIZED MORTGAGE OBLIGATIONS 0.00% | ||||||||||||
| Government National Mortgage Assoc. 2017-76 AS (cost $7,980) | 2.65% | 11/16/2050 | 8 | 8,186 | ||||||||
| GOVERNMENT SPONSORED ENTERPRISES PASS-THROUGHS 2.72% | ||||||||||||
| Fannie Mae or Freddie Mac(k) | 3.00% | TBA | 7,997 | 8,304,385 | ||||||||
| Federal National Mortgage Assoc. | 3.50% | 9/1/2047 | 1,588 | 1,693,622 | ||||||||
| Federal National Mortgage Assoc. | 3.50% | 3/1/2050 | 961 | 1,026,793 | ||||||||
| Total Government Sponsored Enterprises Pass-Throughs (cost $10,948,959) | 11,024,800 | |||||||||||
| MUNICIPAL BONDS 0.39% | ||||||||||||
| Miscellaneous | ||||||||||||
| County of Miami-Dade FL | 2.786% | 10/1/2037 | 315 | 318,167 | ||||||||
| Foothill-Eastern Transportation Corridor Agency | 4.094% | 1/15/2049 | 221 | 239,950 | ||||||||
| 116 | See Notes to Financial Statements. |
Schedule of Investments (continued)
CORE PLUS BOND FUND November 30, 2021
| Investments | Interest Rate | Maturity Date | Principal Amount (000) | Fair Value | ||||||||
| Miscellaneous (continued) | ||||||||||||
| New Jersey Educational Facilities Authority | 3.636% | 9/1/2029 | $ | 182 | $ | 198,389 | ||||||
| State of Illinois | 5.10% | 6/1/2033 | 710 | 830,660 | ||||||||
| Total Municipal Bonds (cost $1,492,498) | 1,587,166 | |||||||||||
| NON-AGENCY COMMERCIAL MORTGAGE-BACKED SECURITIES 9.33% | ||||||||||||
| 1345 Avenue of the Americas & Park Avenue Plaza Trust 2005-1 A3† | 5.278% | 8/10/2035 | 34 | 36,459 | ||||||||
| Angel Oak Mortgage Trust 2020-1 A1† | 2.466% | #(l) | 12/25/2059 | 51 | 51,062 | |||||||
| Atrium Hotel Portfolio Trust 2018-ATRM A† | 1.04% (1 Mo. LIBOR + .95% | )# | 6/15/2035 | 450 | 449,725 | |||||||
| BAMLL Commercial Mortgage Securities Trust 2019-AHT B† | 1.69% (1 Mo. LIBOR + 1.60% | )# | 3/15/2034 | 100 | 100,013 | |||||||
| BBCMS Mortgage Trust 2018-TALL E† | 2.527% (1 Mo. LIBOR + 2.44% | )# | 3/15/2037 | 64 | 61,369 | |||||||
| BBCMS Mortgage Trust 2019-BWAY A† | 1.046% (1 Mo. LIBOR + .96% | )# | 11/15/2034 | 311 | 310,539 | |||||||
| BBCMS Mortgage Trust 2019-BWAY B† | 1.40% (1 Mo. LIBOR + 1.31% | )# | 11/15/2034 | 87 | 86,585 | |||||||
| BBCMS Mortgage Trust 2019-BWAY C† | 1.70% (1 Mo. LIBOR + 1.61% | )# | 11/15/2034 | 350 | 345,765 | |||||||
| BB-UBS Trust 2012-SHOW A† | 3.43% | 11/5/2036 | 175 | 182,064 | ||||||||
| BFLD 2019-DPLO E† | 2.33% (1 Mo. LIBOR + 2.24% | )# | 10/15/2034 | 650 | 638,236 | |||||||
| BFLD 2019-DPLO F† | 2.63% (1 Mo. LIBOR + 2.54% | )# | 10/15/2034 | 410 | 399,945 | |||||||
| BHMS 2018-ATLS A† | 1.34% (1 Mo. LIBOR + 1.25% | )# | 7/15/2035 | 550 | 550,970 | |||||||
| BHMS 2018-ATLS C† | 1.99% (1 Mo. LIBOR + 1.90% | )# | 7/15/2035 | 2,000 | 1,994,904 | |||||||
| BX Commercial Mortgage Trust 2019-XL C† | 1.34% (1 Mo. LIBOR + 1.25% | )# | 10/15/2036 | 128 | 127,286 | |||||||
| BX Commercial Mortgage Trust 2019-XL D† | 1.54% (1 Mo. LIBOR + 1.45% | )# | 10/15/2036 | 145 | 144,183 | |||||||
| BX Commercial Mortgage Trust 2019-XL E† | 1.89% (1 Mo. LIBOR + 1.80% | )# | 10/15/2036 | 85 | 84,770 | |||||||
| BX Commercial Mortgage Trust 2021-VOLT A† | 0.79% (1 Mo. LIBOR + .70% | )# | 9/15/2036 | 690 | 687,532 | |||||||
| BX Trust 2018-GW A† | 0.89% (1 Mo. LIBOR + .80% | )# | 5/15/2035 | 55 | 54,979 | |||||||
| BX Trust 2021-ARIA E† | 2.335% (1 Mo. LIBOR + 2.24% | )# | 10/15/2036 | 2,000 | 1,994,051 | |||||||
| See Notes to Financial Statements. | 117 |
Schedule of Investments (continued)
CORE PLUS BOND FUND November 30, 2021
| Investments | Interest Rate | Maturity Date | Principal Amount (000) | Fair Value | ||||||||
| NON-AGENCY COMMERCIAL MORTGAGE-BACKED SECURITIES (continued) | ||||||||||||
| BX Trust 2021-ARIA F† | 2.684% (1 Mo. LIBOR + 2.59% | )# | 10/15/2036 | $ | 1,000 | $ | 997,362 | |||||
| CF Trust 2019-BOSS A1 | 4.75% (1 Mo. LIBOR + 3.25% | ) | 12/15/2021 | 222 | 205,004 | (a) | ||||||
| CHT 2017-COSMO Mortgage Trust F† | 3.831% (1 Mo. LIBOR + 3.74% | )# | 11/15/2036 | 1,000 | 1,002,756 | |||||||
| CIM Retail Portfolio Trust 2021-RETL E† | 3.84% (1 Mo. LIBOR + 3.75% | )# | 8/15/2036 | 1,150 | 1,144,319 | |||||||
| Citigroup Commercial Mortgage Trust 2016-GC36 AS | 3.849% | 2/10/2049 | 98 | 104,183 | ||||||||
| Citigroup Commercial Mortgage Trust 2016-GC36 D† | 2.85% | 2/10/2049 | 485 | 347,440 | ||||||||
| Citigroup Commercial Mortgage Trust 2016-P3 D† | 2.804% | #(l) | 4/15/2049 | 25 | 20,681 | |||||||
| Commercial Mortgage Pass-Through Certificates 2012-LTRT A2† | 3.40% | 10/5/2030 | 100 | 99,497 | ||||||||
| Commercial Mortgage Pass-Through Certificates 2014-UBS4 D† | 4.869% | #(l) | 8/10/2047 | 835 | 746,560 | |||||||
| Commercial Mortgage Pass-Through Certificates 2014-UBS6 B | 4.349% | #(l) | 12/10/2047 | 50 | 52,840 | |||||||
| Commercial Mortgage Pass-Through Certificates 2015-DC1 D† | 4.451% | #(l) | 2/10/2048 | 707 | 607,780 | |||||||
| Commercial Mortgage Pass-Through Certificates 2015-PC1 AM | 4.29% | #(l) | 7/10/2050 | 53 | 56,912 | |||||||
| Commercial Mortgage Pass-Through Certificates 2015-PC1 B | 4.463% | #(l) | 7/10/2050 | 50 | 53,348 | |||||||
| Commercial Mortgage Pass-Through Certificates 2015-PC1 C | 4.463% | #(l) | 7/10/2050 | 10 | 10,443 | |||||||
| Commercial Mortgage Pass-Through Certificates 2015-PC1 D | 4.463% | #(l) | 7/10/2050 | 425 | 387,244 | |||||||
| Connecticut Avenue Securities Trust 2021-R01 1B1† | 3.15% (1 Mo. SOFR + 3.10% | )# | 10/25/2041 | 400 | 402,122 | |||||||
| Credit Suisse Commercial Mortgage Securities Corp. | 2.09% | 11/15/2038 | 1,020 | 1,030,001 | ||||||||
| Credit Suisse Commercial Mortgage Securities Corp. 2019-SKLZ A† | 1.34% (1 Mo. LIBOR + 1.25% | )# | 1/15/2034 | 116 | 116,850 | |||||||
| Credit Suisse Mortgage Capital Certificates 2020-AFC1 A1† | 2.24% | #(l) | 2/25/2050 | 148 | 148,404 | |||||||
| Credit Suisse Mortgage Capital Certificates 2020-SPT1 A1† | 1.616% | 4/25/2065 | 235 | 235,511 | ||||||||
| 118 | See Notes to Financial Statements. |
Schedule of Investments (continued)
CORE PLUS BOND FUND November 30, 2021
| Investments | Interest Rate | Maturity Date | Principal Amount (000) | Fair Value | ||||||||
| NON-AGENCY COMMERCIAL MORTGAGE-BACKED SECURITIES (continued) | ||||||||||||
| CS Master Trust 2021-AHP A† | 4.449% (1 Mo. LIBOR + 3.95% | )# | 4/15/2025 | $ | 400 | $ | 401,190 | (a) | ||||
| CS Master Trust 2021-BLUF A† | 4.527% (1 Mo. LIBOR + 4.18% | )# | 4/15/2023 | 200 | 201,951 | (a) | ||||||
| CSAIL Commercial Mortgage Trust 2016-C7 D† | 4.529% | #(l) | 11/15/2049 | 1,250 | 989,215 | |||||||
| CSAIL Commercial Mortgage Trust 2019-C18 AS | 3.321% | 12/15/2052 | 214 | 228,785 | ||||||||
| DBWF Mortgage Trust 2018-GLKS A† | 1.119% (1 Mo. LIBOR + 1.03% | )# | 12/19/2030 | 500 | 500,768 | |||||||
| Deephaven Residential Mortgage Trust 2020-1 A1† | 2.339% | #(l) | 1/25/2060 | 76 | 76,332 | |||||||
| Deephaven Residential Mortgage Trust 2021-3 A1† | 1.194% | #(l) | 8/25/2066 | 847 | 843,043 | |||||||
| Ellington Financial Mortgage Trust 2020-2 A1† | 1.178% | #(l) | 10/25/2065 | 94 | 94,643 | |||||||
| Extended Stay America Trust 2021-ESH C† | 1.79% (1 Mo. LIBOR + 1.70% | )# | 7/15/2038 | 487 | 488,289 | |||||||
| Fannie Mae Connecticut Avenue Securities R02 2B1†(b) | 3.35% (1 Mo. SOFR + 3.30% | )# | 11/25/2041 | 400 | 401,500 | |||||||
| Fontainebleau Miami Beach Trust 2019-FBLU A† | 3.144% | 12/10/2036 | 614 | 632,431 | ||||||||
| Fontainebleau Miami Beach Trust 2019-FBLU B† | 3.447% | 12/10/2036 | 600 | 615,908 | ||||||||
| Freddie Mac STACR REMIC Trust 2021-DNA6 B1† | 3.45% (1 Mo. SOFR + 3.40% | )# | 10/25/2041 | 790 | 792,047 | |||||||
| Freddie Mac STACR REMIC Trust 2021-HQA3 M2† | 2.15% (1 Mo. SOFR + 2.10% | )# | 9/25/2041 | 1,070 | 1,070,925 | |||||||
| Freddie Mac Structured Agency Credit Risk Debt Notes B1† | 3.698% (1 Mo. SOFR + 3.65% | )# | 11/25/2041 | 680 | 684,460 | |||||||
| GCAT Trust 2020-NQM1 A1† | 2.247% | 1/25/2060 | 45 | 45,101 | ||||||||
| Great Wolf Trust 2019-WOLF A† | 1.124% (1 Mo. LIBOR + 1.03% | )# | 12/15/2036 | 512 | 511,605 | |||||||
| GS Mortgage Securities Corp. II 2021-ARDN B† | 1.75% (1 Mo. LIBOR + 1.65% | )# | 11/15/2026 | 870 | 871,088 | |||||||
| GS Mortgage Securities Corp. Trust 2018-RIVR A† | 1.04% (1 Mo. LIBOR + .95% | )# | 7/15/2035 | 100 | 99,224 | |||||||
| GS Mortgage Securities Corp. Trust 2019-70P B† | 1.41% (1 Mo. LIBOR + 1.32% | )# | 10/15/2036 | 813 | 797,597 | |||||||
| GS Mortgage Securities Corp. Trust 2019-70P XCP IO† | Zero Coupon | #(l) | 10/15/2036 | 86,776 | 1,736 | |||||||
| GS Mortgage Securities Corp. Trust 2019-SMP B† | 1.59% (1 Mo. LIBOR + 1.50% | )# | 8/15/2032 | 525 | 525,471 | |||||||
| GS Mortgage Securities Corp. Trust 2019-SMP XCP IO† | Zero Coupon | #(l) | 8/15/2032 | 36,803 | 784 | |||||||
| GS Mortgage Securities Trust 2013-G1 A2† | 3.557% | #(l) | 4/10/2031 | 154 | 154,127 | |||||||
| See Notes to Financial Statements. | 119 |
Schedule of Investments (continued)
CORE PLUS BOND FUND November 30, 2021
| Investments | Interest Rate | Maturity Date | Principal Amount (000) | Fair Value | ||||||||
| NON-AGENCY COMMERCIAL MORTGAGE-BACKED SECURITIES (continued) | ||||||||||||
| GS Mortgage Securities Trust 2014-GC26 C | 4.66% | #(l) | 11/10/2047 | $ | 50 | $ | 49,038 | |||||
| HONO Mortgage Trust 2021-LULU B† | 1.54% (1 Mo. LIBOR + 1.45% | )# | 10/15/2036 | 250 | 250,483 | |||||||
| HONO Mortgage Trust 2021-LULU C† | 1.94% (1 Mo. LIBOR + 1.85% | )# | 10/15/2036 | 150 | 150,327 | |||||||
| JP Morgan Chase Commercial Mortgage Securities Trust 2020-MKST E† | 2.34% (1 Mo. LIBOR + 2.25% | )# | 12/15/2036 | 1,000 | 971,764 | |||||||
| JPMorgan Chase Commercial Mortgage Securities Trust | 1.84% | 9/15/2029 | 244 | 242,832 | ||||||||
| JPMorgan Chase Commercial Mortgage Securities Trust | 2.74% | 9/15/2029 | 325 | 323,554 | ||||||||
| JPMorgan Chase Commercial Mortgage Securities Trust | 3.44% | 9/15/2029 | 325 | 323,000 | ||||||||
| JPMorgan Chase Commercial Mortgage Securities Trust | 4.44% | 9/15/2029 | 325 | 322,428 | ||||||||
| JPMorgan Chase Commercial Mortgage Securities Trust | 5.44% | 9/15/2029 | 325 | 323,690 | (a) | |||||||
| JPMorgan Chase Commercial Mortgage Securities Trust 2014-DSTY D† | 3.931% | #(l) | 6/10/2027 | 100 | 6,825 | |||||||
| JPMorgan Chase Commercial Mortgage Securities Trust 2015-C30 C | 4.406% | #(l) | 7/15/2048 | 10 | 10,221 | |||||||
| JPMorgan Chase Commercial Mortgage Securities Trust 2017-MARK A† | 3.392% | 6/5/2032 | 275 | 276,374 | ||||||||
| JPMorgan Chase Commercial Mortgage Securities Trust 2018-LAQ B† | 1.39% (1 Mo. LIBOR + 1.30% | )# | 6/15/2032 | 293 | 293,347 | |||||||
| JPMorgan Chase Commercial Mortgage Securities Trust 2018-LAQ C† | 1.69% (1 Mo. LIBOR + 1.60% | )# | 6/15/2032 | 30 | 29,600 | |||||||
| JPMorgan Chase Commercial Mortgage Securities Trust 2018-MINN A† | 2.27% (1 Mo. LIBOR + 1.02% | )# | 11/15/2035 | 10 | 10,043 | |||||||
| JPMorgan Chase Commercial Mortgage Securities Trust 2018-MINN B† | 2.60% (1 Mo. LIBOR + 1.35% | )# | 11/15/2035 | 10 | 9,471 | |||||||
| JPMorgan Chase Commercial Mortgage Securities Trust 2018-WPT AFL† | 1.286% (1 Mo. LIBOR + 1.20% | )# | 7/5/2033 | 10 | 9,694 | |||||||
| JPMorgan Chase Commercial Mortgage Securities Trust 2018-WPT BFL† | 1.586% (1 Mo. LIBOR + 1.50% | )# | 7/5/2033 | 26 | 26,062 | |||||||
| JPMorgan Chase Commercial Mortgage Securities Trust 2018-WPT BFX† | 4.549% | 7/5/2033 | 10 | 10,384 | ||||||||
| JPMorgan Chase Commercial Mortgage Securities Trust 2018-WPT CFX† | 4.95% | 7/5/2033 | 10 | 10,384 | ||||||||
| KIND Trust 2021-KIND D† | 2.39% (1 Mo. LIBOR + 2.30% | )# | 8/15/2038 | 470 | 469,154 | |||||||
| 120 | See Notes to Financial Statements. |
Schedule of Investments (continued)
CORE PLUS BOND FUND November 30, 2021
| Investments | Interest Rate | Maturity Date | Principal Amount (000) | Fair Value | ||||||||
| NON-AGENCY COMMERCIAL MORTGAGE-BACKED SECURITIES (continued) | ||||||||||||
| Natixis Commercial Mortgage Securities Trust 2018-285M A† | 3.917% | #(l) | 11/15/2032 | $ | 50 | $ | 50,921 | |||||
| Natixis Commercial Mortgage Securities Trust 2018-285M B† | 3.917% | #(l) | 11/15/2032 | 50 | 50,869 | |||||||
| Natixis Commercial Mortgage Securities Trust 2019-1776 XCP† | 0.634% | #(l) | 10/15/2036 | 36,272 | 19,224 | |||||||
| New Residential Mortgage Loan Trust 2020-NQM1 A1† | 2.464% | #(l) | 1/26/2060 | 46 | 46,254 | |||||||
| PFP Ltd. 2019-6 C† | 2.191% (1 Mo. LIBOR + 2.10% | )# | 4/14/2037 | 332 | 331,502 | |||||||
| Prima Capital CRE Securitization Ltd. 2019-RK1 AG† | 4.00% | 4/15/2038 | 165 | 169,321 | (a) | |||||||
| Prima Capital CRE Securitization Ltd. 2019-RK1 AT† | 4.45% | 4/15/2038 | 100 | 98,145 | ||||||||
| ReadyCap Commercial Mortgage Trust 2018-4 A† | 3.39% | 2/27/2051 | 14 | 13,933 | ||||||||
| ReadyCap Commercial Mortgage Trust 2019-6 A† | 2.833% | 10/25/2052 | 583 | 589,355 | ||||||||
| Residential Mortgage Loan Trust 2020-1 A1† | 2.376% | #(l) | 1/26/2060 | 43 | 43,555 | |||||||
| SG Commercial Mortgage Securities Trust 2019-787E X† | 0.456% | #(l) | 2/15/2041 | 1,217 | 28,180 | |||||||
| Starwood Mortgage Residential Trust 2020-1 A1† | 2.275% | #(l) | 2/25/2050 | 63 | 63,768 | |||||||
| Verus Securitization Trust 2020-1 A1† | 2.417% | 1/25/2060 | 120 | 120,896 | ||||||||
| Verus Securitization Trust 2020-5 A1† | 1.218% | 5/25/2065 | 397 | 397,113 | ||||||||
| Vista Point Securitization Trust 2020-2 A1† | 1.475% | #(l) | 4/25/2065 | 243 | 243,475 | |||||||
| VMC Finance LLC 2019-FL3 A† | 1.189% (1 Mo. LIBOR + 1.10% | )# | 9/15/2036 | 985 | 985,336 | |||||||
| Wells Fargo Commercial Mortgage Trust 2013-LC12 B | 4.441% | #(l) | 7/15/2046 | 494 | 492,360 | |||||||
| Wells Fargo Commercial Mortgage Trust 2015-C28 D | 4.23% | #(l) | 5/15/2048 | 60 | 57,838 | |||||||
| Wells Fargo Commercial Mortgage Trust 2016-C35 C | 4.176% | #(l) | 7/15/2048 | 1,270 | 1,293,173 | |||||||
| Wells Fargo Commercial Mortgage Trust 2017-C41 AS | 3.785% | #(l) | 11/15/2050 | 146 | 156,737 | |||||||
| Wells Fargo Commercial Mortgage Trust 2017-HSDB A† | 0.94% (1 Mo. LIBOR + .85% | )# | 12/13/2031 | 200 | 198,629 | |||||||
| West Town Mall Trust 2017-KNOX A† | 3.823% | 7/5/2030 | 95 | 95,366 | ||||||||
| WF-RBS Commercial Mortgage Trust 2012-C8 C | 5.046% | #(l) | 8/15/2045 | 50 | 50,546 | |||||||
| WF-RBS Commercial Mortgage Trust 2013-C12 B | 3.863% | #(l) | 3/15/2048 | 25 | 25,642 | |||||||
| WF-RBS Commercial Mortgage Trust 2013-C12 C | 4.437% | #(l) | 3/15/2048 | 50 | 51,217 | |||||||
| ZH Trust 2021-2 A† | 2.349% | 10/17/2027 | 1,020 | 1,011,294 | (a) | |||||||
| Total Non-Agency Commercial Mortgage-Backed Securities (cost $38,283,577) | 37,901,238 | |||||||||||
| See Notes to Financial Statements. | 121 |
Schedule of Investments (continued)
CORE PLUS BOND FUND November 30, 2021
| Investments | Interest Rate | Maturity Date | Principal Amount (000) | Fair Value | ||||||||
| U.S. TREASURY OBLIGATIONS 28.91% | ||||||||||||
| U.S. Treasury Bill | Zero Coupon | 1/27/2022 | $ | 6,070 | $ | 6,069,592 | ||||||
| U.S. Treasury Bill | Zero Coupon | 4/21/2022 | 15,851 | 15,846,809 | ||||||||
| U.S. Treasury Bond | 1.125% | 5/15/2040 | 5,757 | 5,107,988 | ||||||||
| U.S. Treasury Bond | 1.75% | 8/15/2041 | 19,951 | 19,592,505 | ||||||||
| U.S. Treasury Bond | 2.00% | 8/15/2051 | 12,234 | 12,815,115 | ||||||||
| U.S. Treasury Bond | 2.25% | 8/15/2049 | 2,543 | 2,796,406 | ||||||||
| U.S. Treasury Note | 0.125% | 8/31/2023 | 15,720 | 15,624,206 | ||||||||
| U.S. Treasury Note | 0.375% | 10/31/2023 | 2,504 | 2,497,349 | ||||||||
| U.S. Treasury Note | 0.75% | 11/15/2024 | 7,000 | 6,983,867 | ||||||||
| U.S. Treasury Note | 1.125% | 10/31/2026 | 18,604 | 18,580,745 | ||||||||
| U.S. Treasury Note | 1.25% | 8/15/2031 | 11,696 | 11,510,509 | ||||||||
| Total U.S. Treasury Obligations (cost $116,551,726) | 117,425,091 | |||||||||||
| Total Long-Term Investments (cost $408,450,780) | 409,559,023 | |||||||||||
| SHORT-TERM INVESTMENTS 2.32% | ||||||||||||
| REPURCHASE AGREEMENTS 2.32% | ||||||||||||
| Repurchase Agreement dated 11/30/2021, 0.00% due 12/1/2021 with Fixed Income Clearing Corp. collateralized by $9,270,400 of U.S. Treasury Note at 2.75% due 04/30/2023; value: $9,606,211; proceeds: $9,417,831 (cost $9,417,831) | 9,418 | 9,417,831 | ||||||||||
| Total Investments in Securities 103.17% (cost $417,868,611) | 418,976,854 | |||||||||||
| Less Unfunded Loan Commitments (0.09%) (cost $366,671)(m) | (365,868 | ) | ||||||||||
| Net Investments in Securities 103.08% (cost $417,501,940) | 418,610,986 | |||||||||||
| Other Assets and Liabilities – Net(n) (3.08)% | (12,499,013 | ) | ||||||||||
| Net Assets 100.00% | $ | 406,111,973 | ||||||||||
| CAD | Canadian dollar. | |
| CMT | Constant Maturity Rate. | |
| IO | Interest Only. | |
| LIBOR | London Interbank Offered Rate. | |
| PIK | Payment-in-kind. | |
| SOFR | Secured Over Night Financing Rate. | |
| † | Security was purchased pursuant to Rule 144A under the Securities Act of 1933 and, unless registered under such Act or exempted from registration, may only be resold to qualified institutional buyers. At November 30, 2021, the total value of Rule 144A securities was $169,640,263, which represents 41.77% of net assets. | |
| # | Variable rate security. The interest rate represents the rate in effect at November 30, 2021. | |
| (a) | Level 3 Investment as described in Note 2(t) in the Notes to Financials. Security valued utilizing third party pricing information without adjustment. Such valuations are based on unobservable inputs. A significant change in third party information could result in a significantly lower or higher value of such Level 3 investments. | |
| (b) | Securities purchased on a when-issued basis (See Note 2(j)). | |
| (c) | Variable Rate is Fixed to Float: Rate remains fixed or at Zero Coupon until designated future date. | |
| (d) | Investment in non-U.S. dollar denominated securities. |
| 122 | See Notes to Financial Statements. |
Schedule of Investments (continued)
CORE PLUS BOND FUND November 30, 2021
| (e) | Foreign security traded in U.S. dollars. | |
| (f) | Security is perpetual in nature and has no stated maturity. | |
| (g) | Floating Rate Loans in which the Fund invests generally pay interest at rates which are periodically re-determined at a margin above the London Interbank Offered Rate (“LIBOR”) or the prime rate offered by major U.S. banks. The rate(s) shown is the rate(s) in effect at November 30, 2021. | |
| (h) | Interest rate to be determined. | |
| (i) | Level 3 Investment as described in Note 2(t) in the Notes to Financials. Floating Rate Loans categorized as Level 3 are valued based on a single quotation obtained from a dealer. Accounting principles generally accepted in the United States of America do not require the Fund to create quantitative unobservable inputs that were not developed by the Fund. Therefore, the Fund does not have access to unobservable inputs and cannot disclose such inputs in the valuation. | |
| (j) | Security partially/fully unfunded. See Note (2(o)). | |
| (k) | To-be-announced (“TBA”). Security purchased on a forward commitment basis with an approximate principal and maturity date. Actual principal and maturity will be determined upon settlement when the specific mortgage pools are assigned. | |
| (l) | Interest rate is based on the weighted average interest rates of the underlying mortgages within the mortgage pool. | |
| (m) | See Note (2(o)). | |
| (n) | Other Assets and Liabilities - Net include net unrealized appreciation/depreciation on forward foreign currency exchange contracts, futures contracts and swaps as follows: |
Credit Default Swaps on Indexes - Sell Protection at November 30, 2021(1):
| Credit | ||||||||||||||||||||||
| Default | ||||||||||||||||||||||
| Swap | ||||||||||||||||||||||
| Fund | Unrealized | Agreements | ||||||||||||||||||||
| Referenced | Swap | Receives | Termination | Notional | Payments | Appreciation/ | Payable at | |||||||||||||||
| Index* | Counterparty | (Quarterly | ) | Date | Amount | Upfront(2) | (Depreciation | )(3) | Fair Value(4) | |||||||||||||
| Markit CMBX.NA.BBB-9 | Citibank | 3.000% | 9/17/2058 | $875,000 | $ | (68,616 | ) | $ | (14,571 | ) | $ | (83,187 | ) | |||||||||
| Markit CMBX.NA.BBB-.12 | Goldman Sachs | 3.000% | 8/17/2061 | 750,000 | (28,910 | ) | (20,448 | ) | (49,358 | ) | ||||||||||||
| Markit CMBX.NA.BBB-9 | Morgan Stanley | 3.000% | 9/17/2058 | 625,000 | (49,387 | ) | (10,032 | ) | (59,419 | ) | ||||||||||||
| Markit CMBX.NA.BBB-9 | Morgan Stanley | 3.000% | 9/17/2058 | 750,000 | (62,121 | ) | (9,182 | ) | (71,303 | ) | ||||||||||||
| Markit CMBX.NA.BBB-.9 | Citibank | 3.000% | 9/17/2058 | 300,000 | (23,835 | ) | (4,687 | ) | (28,522 | ) | ||||||||||||
| Markit CMBX.NA.BBB-.9 | Citibank | 3.000% | 9/17/2058 | 750,000 | (62,385 | ) | (8,918 | ) | (71,303 | ) | ||||||||||||
| Markit CMBX.NA.BBB-.12 | Morgan Stanley | 3.000% | 8/17/2061 | 350,000 | (17,029 | ) | (6,004 | ) | (23,033 | ) | ||||||||||||
| Markit CMBX.NA.BBB-.10 | Morgan Stanley | 3.000% | 11/17/2059 | 650,000 | (56,393 | ) | (8,919 | ) | (65,312 | ) | ||||||||||||
| $ | (368,676 | ) | $ | (82,761 | ) | $ | (451,437 | ) | ||||||||||||||
| * | The Referenced Index is for the Credit Default Swaps on Indexes, which is comprised of a basket of commercial mortgage-backed securities. | |
| (1) | If the Fund is a seller of protection and a credit event occurs, as defined under the terms of that particular swap agreement, the Fund will either (i) pay to the buyer of protection an amount equal to the notional amount of the swap and take delivery of the referenced obligation or underlying securities comprising the referenced index or (ii) pay a net settlement amount in the form of cash or securities equal to the notional amount of the swap less the recovery value of the referenced obligation or underlying securities. |
| See Notes to Financial Statements. | 123 |
Schedule of Investments (continued)
CORE PLUS BOND FUND November 30, 2021
| (2) | Upfront payments received/paid are presented net of amortization. | |
| (3) | Total unrealized appreciation on Credit Default Swaps on Indexes amounted to $0. Total unrealized depreciation on Credit Default Swaps on Indexes amounted to $82,761. | |
| (4) | Includes upfront payments received. |
Open Forward Foreign Currency Exchange Contracts at November 30, 2021:
| Forward | |||||||||||||||||||||
| Foreign | U.S. $ | ||||||||||||||||||||
| Currency | Cost on | U.S. $ | |||||||||||||||||||
| Exchange | Transaction | Expiration | Foreign | Origination | Current | Unrealized | |||||||||||||||
| Contracts | Type | Counterparty | Date | Currency | Date | Value | Appreciation | ||||||||||||||
| Canadian dollar | Sell | Toronto Dominion Bank | 1/20/2022 | 832,000 | $ | 672,931 | $ | 651,610 | $ | 21,321 | |||||||||||
| Euro | Sell | State Street Bank and Trust | 12/10/2021 | 270,000 | 319,773 | 306,262 | 13,511 | ||||||||||||||
| Unrealized Appreciation on Forward Foreign Currency Exchange Contracts | $ | 34,832 | |||||||||||||||||||
| Forward | |||||||||||||||||||||
| Foreign | U.S. $ | ||||||||||||||||||||
| Currency | Cost on | U.S. $ | |||||||||||||||||||
| Exchange | Transaction | Expiration | Foreign | Origination | Current | Unrealized | |||||||||||||||
| Contracts | Type | Counterparty | Date | Currency | Date | Value | Depreciation | ||||||||||||||
| Euro | Buy | Bank of America | 12/10/2021 | 120,000 | $ | 139,314 | $ | 136,117 | $ | (3,197 | ) | ||||||||||
| Euro | Buy | Morgan Stanley | 12/10/2021 | 150,000 | $ | 173,510 | $ | 170,146 | $ | (3,364 | ) | ||||||||||
| Unrealized Depreciation on Forward Foreign Currency Exchange Contracts | $ | (6,561 | ) | ||||||||||||||||||
| Open Futures Contracts at November 30, 2021: | |||||||||||||
| Notional | Notional | Unrealized | |||||||||||
| Type | Expiration | Contracts | Position | Amount | Value | Appreciation | |||||||
| U.S. Ultra Treasury Bond | March 2022 | 58 | Long | 11,255,736 | 11,632,625 | 376,889 | |||||||
| 124 | See Notes to Financial Statements. |
Schedule of Investments (continued)
CORE PLUS BOND FUND November 30, 2021
The following is a summary of the inputs used as of November 30, 2021 in valuing the Fund’s investments carried at fair value(1):
| Investment Type(2) | Level 1 | Level 2 | Level 3 | Total | ||||||||||||
| Long-Term Investments | ||||||||||||||||
| Asset-Backed Securities | ||||||||||||||||
| Credit Card | $ | – | $ | 1,003,845 | $ | 1,274,143 | $ | 2,277,988 | ||||||||
| Others | – | 36,115,018 | 1,707,271 | 37,822,289 | ||||||||||||
| Remaining Industries | – | 25,451,017 | – | 25,451,017 | ||||||||||||
| Corporate Bonds | – | 158,816,363 | – | 158,816,363 | ||||||||||||
| Floating Rate Loans | ||||||||||||||||
| Business Services | – | 1,091,816 | 98,806 | 1,190,622 | ||||||||||||
| Remaining Industries | – | 10,994,286 | – | 10,994,286 | ||||||||||||
| Less Unfunded Commitments | – | (365,868 | ) | – | (365,868 | ) | ||||||||||
| Foreign Government Obligations | – | 5,059,977 | – | 5,059,977 | ||||||||||||
| Government Sponsored Enterprises Collateralized Mortgage Obligations | – | 8,186 | – | 8,186 | ||||||||||||
| Government Sponsored Enterprises Pass-Throughs | – | 11,024,800 | – | 11,024,800 | ||||||||||||
| Municipal Bonds | – | 1,587,166 | – | 1,587,166 | ||||||||||||
| Non-Agency Commercial Mortgage-Backed Securities | – | 35,588,788 | 2,312,450 | 37,901,238 | ||||||||||||
| U.S. Treasury Obligations | – | 117,425,091 | – | 117,425,091 | ||||||||||||
| Short-Term Investments | ||||||||||||||||
| Repurchase Agreements | – | 9,417,831 | – | 9,417,831 | ||||||||||||
| Total | $ | – | $ | 413,218,316 | $ | 5,392,670 | $ | 418,610,986 | ||||||||
| Other Financial Instruments | ||||||||||||||||
| Credit Default Swap Contracts | ||||||||||||||||
| Assets | $ | – | $ | – | $ | – | $ | – | ||||||||
| Liabilities | – | (451,437 | ) | – | (451,437 | ) | ||||||||||
| Forward Foreign Currency Exchange Contracts | ||||||||||||||||
| Assets | – | 34,832 | – | 34,832 | ||||||||||||
| Liabilities | – | (6,561 | ) | – | (6,561 | ) | ||||||||||
| Futures Contracts | ||||||||||||||||
| Assets | 376,889 | – | – | 376,889 | ||||||||||||
| Liabilities | – | – | – | – | ||||||||||||
| Total | $ | 376,889 | $ | (423,166 | ) | $ | – | $ | (46,277 | ) | ||||||
| (1) | Refer to Note 2(t) for a description of fair value measurements and the three-tier hierarchy of inputs. | |
| (2) | See Schedule of Investments for fair values in each industry and identification of foreign issuer and/or geography. The table above is presented by Investment Type. Industries are presented within an Investment Type should such Investment Type include securities classified as two or more levels within the three- tier fair value hierarchy. When applicable each Level 3 security is identified on the Schedule of Investments along with the valuation technique utilized. |
| See Notes to Financial Statements. | 125 |
Schedule of Investments (concluded)
CORE PLUS BOND FUND November 30, 2021
A reconciliation of Level 3 investments is presented when the Fund has a material amount of Level 3 investments at the beginning or end of the year in relation to the Fund’s net assets.
The following is a reconciliation of investments with unobservable inputs (Level 3) that were used in determining fair value:
| Non-Agency | ||||||||||||
| Commercial | ||||||||||||
| Asset-Backed | Floating | Mortgage-Backed | ||||||||||
| Investment Type | Securities | Rate Loans | Securities | |||||||||
| Balance as of December 1, 2020 | $ | 718,162 | $ | – | $ | 2,280,591 | ||||||
| Accrued Discounts (Premiums) | (1,707 | ) | – | (388) | ||||||||
| Realized Gain (Loss) | 7,477 | – | – | |||||||||
| Change in Unrealized Appreciation (Depreciation) | 59,648 | 494 | 25,278 | |||||||||
| Purchases | 1,559,602 | 98,312 | 1,619,999 | |||||||||
| Sales | (119,832 | ) | – | – | ||||||||
| Transfers into Level 3 | 758,064 | – | 170,333 | |||||||||
| Transfers out of Level 3 | – | – | (1,783,363) | |||||||||
| Balance as of November 30, 2021 | $ | 2,981,414 | $ | 98,806 | $ | 2,312,450 | ||||||
| Change in unrealized appreciation/depreciation for the year ended November 30, 2021, related to Level 3 investments held at November 30, 2021 | $ | 64,271 | $ | 494 | $ | 25,278 | ||||||
| 126 | See Notes to Financial Statements. |
Schedule of Investments
CORPORATE BOND FUND November 30, 2021
| Investments | Interest Rate | Maturity Date | Principal Amount (000) | Fair Value | ||||||||
| LONG-TERM INVESTMENTS 96.92% | ||||||||||||
| CORPORATE BONDS 81.45% | ||||||||||||
| Aerospace/Defense 0.63% | ||||||||||||
| Boeing Co. (The) | 5.805% | 5/1/2050 | $ | 54 | $ | 72,943 | ||||||
| Airlines 0.89% | ||||||||||||
| American Airlines 2021-1 Class A Pass Through Trust | 2.875% | 1/11/2036 | 63 | 61,366 | ||||||||
| British Airways 2020-1 Class A Pass Through Trust (United Kingdom)†(a) | 4.25% | 5/15/2034 | 38 | 41,601 | ||||||||
| Total | 102,967 | |||||||||||
| Auto Manufacturers 1.77% | ||||||||||||
| American Honda Finance Corp. | 0.406% (3 Mo. LIBOR + .29% | )# | 12/10/2021 | 115 | 115,005 | |||||||
| General Motors Co. | 6.75% | 4/1/2046 | 63 | 91,290 | ||||||||
| Total | 206,295 | |||||||||||
| Banks 21.66% | ||||||||||||
| Bank of America Corp. | 2.482% (5 Yr. Treasury CMT + 1.20% | )# | 9/21/2036 | 20 | 19,327 | |||||||
| Bank of America Corp. | 2.687% (SOFR + 1.32% | )# | 4/22/2032 | 69 | 69,912 | |||||||
| Bank of America Corp. | 3.593% (3 Mo. LIBOR + 1.37% | )# | 7/21/2028 | 274 | 294,833 | |||||||
| Bank of Montreal (Canada)(a) | 3.803% (5 Yr. Swap rate + 1.43% | )# | 12/15/2032 | 96 | 103,320 | |||||||
| BankUnited, Inc. | 5.125% | 6/11/2030 | 53 | 60,969 | ||||||||
| Citigroup, Inc. | 2.561% (SOFR + 1.17% | )# | 5/1/2032 | 99 | 99,494 | |||||||
| Citigroup, Inc. | 3.668% (3 Mo. LIBOR + 1.39% | )# | 7/24/2028 | 145 | 156,116 | |||||||
| Commonwealth Bank of Australia (Australia)†(a) | 1.875% | 9/15/2031 | 75 | 73,263 | ||||||||
| Goldman Sachs Group, Inc. (The) | 2.383% (SOFR + 1.25% | )# | 7/21/2032 | 70 | 68,734 | |||||||
| Goldman Sachs Group, Inc. (The) | 6.75% | 10/1/2037 | 60 | 84,816 | ||||||||
| JPMorgan Chase & Co. | 2.58% (SOFR + 1.25% | )# | 4/22/2032 | 140 | 141,264 | |||||||
| JPMorgan Chase & Co. | 8.00% | 4/29/2027 | 120 | 156,374 | ||||||||
| Macquarie Group Ltd. (Australia)†(a) | 4.654% (3 Mo. LIBOR + 1.73% | )# | 3/27/2029 | 100 | 113,359 | |||||||
| Morgan Stanley | 2.484% (SOFR + 1.36% | )# | 9/16/2036 | 48 | 46,484 | |||||||
| Morgan Stanley | 4.431% (3 Mo. LIBOR + 1.63% | )# | 1/23/2030 | 164 | 187,214 | |||||||
| Santander Holdings USA, Inc. | 4.40% | 7/13/2027 | 107 | 118,097 | ||||||||
| SVB Financial Group | 1.80% | 2/2/2031 | 54 | 51,269 | ||||||||
| UBS AG (Switzerland)(a) | 5.125% | 5/15/2024 | 200 | 215,250 | ||||||||
| See Notes to Financial Statements. | 127 |
Schedule of Investments (continued)
CORPORATE BOND FUND November 30, 2021
| Investments | Interest Rate | Maturity Date | Principal Amount (000) | Fair Value | ||||||||
| Banks (continued) | ||||||||||||
| Wells Fargo & Co. | 2.393% (SOFR + 2.10% | )# | 6/2/2028 | $ | 260 | $ | 263,547 | |||||
| Western Alliance Bancorp | 3.00% (SOFR + 2.25% | )# | 6/15/2031 | 74 | 75,728 | |||||||
| Westpac Banking Corp. (Australia)(a) | 4.11% (5 Yr. Treasury CMT + 2.00% | )# | 7/24/2034 | 69 | 74,893 | |||||||
| Westpac Banking Corp. (Australia)(a) | 4.322% (5 Yr. ICE Swap rate + 2.24% | )# | 11/23/2031 | 41 | 44,508 | |||||||
| Total | 2,518,771 | |||||||||||
| Biotechnology 1.90% | ||||||||||||
| Amgen, Inc. | 6.375% | 6/1/2037 | 80 | 113,320 | ||||||||
| Gilead Sciences, Inc. | 4.80% | 4/1/2044 | 85 | 107,178 | ||||||||
| Total | 220,498 | |||||||||||
| Commercial Services 0.39% | ||||||||||||
| CoStar Group, Inc.† | 2.80% | 7/15/2030 | 45 | 45,691 | ||||||||
| Computers 1.55% | ||||||||||||
| Dell International LLC/EMC Corp. | 6.02% | 6/15/2026 | 82 | 95,517 | ||||||||
| Dell International LLC/EMC Corp. | 8.35% | 7/15/2046 | 24 | 40,116 | ||||||||
| Leidos Holdings, Inc. | 5.95% | 12/1/2040 | 35 | 44,522 | ||||||||
| Total | 180,155 | |||||||||||
| Diversified Financial Services 3.40% | ||||||||||||
| Air Lease Corp. | 3.125% | 12/1/2030 | 55 | 56,086 | ||||||||
| Aircastle Ltd.† | 2.85% | 1/26/2028 | 46 | 46,274 | ||||||||
| Ally Financial, Inc. | 8.00% | 11/1/2031 | 53 | 75,025 | ||||||||
| Aviation Capital Group LLC† | 1.95% | 1/30/2026 | 56 | 54,992 | ||||||||
| Brightsphere Investment Group, Inc. | 4.80% | 7/27/2026 | 17 | 17,629 | ||||||||
| Charles Schwab Corp. (The) | 5.375% (5 Yr. Treasury CMT + 4.97% | )# | – | (b) | 16 | 17,346 | ||||||
| Neuberger Berman Group LLC/Neuberger Berman Finance Corp.† | 4.50% | 3/15/2027 | 38 | 42,362 | ||||||||
| Neuberger Berman Group LLC/Neuberger Berman Finance Corp.† | 4.875% | 4/15/2045 | 26 | 31,338 | ||||||||
| Park Aerospace Holdings Ltd. (Ireland)†(a) | 5.50% | 2/15/2024 | 50 | 53,863 | ||||||||
| Total | 394,915 | |||||||||||
| Electric 8.71% | ||||||||||||
| AES Corp. (The) | 2.45% | 1/15/2031 | 20 | 19,606 | ||||||||
| Ausgrid Finance Pty Ltd. (Australia)†(a) | 4.35% | 8/1/2028 | 46 | 51,973 | ||||||||
| Cleco Power LLC | 6.00% | 12/1/2040 | 20 | 27,878 | ||||||||
| Duquesne Light Holdings, Inc.† | 2.775% | 1/7/2032 | 38 | 38,036 | ||||||||
| 128 | See Notes to Financial Statements. |
Schedule of Investments (continued)
CORPORATE BOND FUND November 30, 2021
| Investments | Interest Rate | Maturity Date | Principal Amount (000) | Fair Value | ||||||||
| Electric (continued) | ||||||||||||
| El Paso Electric Co. | 6.00% | 5/15/2035 | $ | 35 | $ | 46,684 | ||||||
| Emera US Finance LP | 4.75% | 6/15/2046 | 35 | 41,625 | ||||||||
| Entergy Texas, Inc. | 1.75% | 3/15/2031 | 90 | 85,032 | ||||||||
| Exelon Generation Co. LLC | 6.25% | 10/1/2039 | 75 | 96,259 | ||||||||
| FirstEnergy Transmission LLC† | 4.55% | 4/1/2049 | 10 | 11,716 | ||||||||
| Georgia Power Co. | 4.75% | 9/1/2040 | 80 | 94,897 | ||||||||
| IPALCO Enterprises, Inc. | 4.25% | 5/1/2030 | 44 | 48,919 | ||||||||
| NRG Energy, Inc.† | 4.45% | 6/15/2029 | 44 | 48,042 | ||||||||
| Oglethorpe Power Corp. | 5.95% | 11/1/2039 | 55 | 74,052 | ||||||||
| Ohio Edison Co. | 8.25% | 10/15/2038 | 33 | 53,986 | ||||||||
| Pacific Gas and Electric Co. | 4.55% | 7/1/2030 | 115 | 125,682 | ||||||||
| Puget Energy, Inc. | 4.10% | 6/15/2030 | 50 | 54,386 | ||||||||
| Puget Sound Energy, Inc. | 5.764% | 7/15/2040 | 18 | 24,867 | ||||||||
| San Diego Gas & Electric Co. | 1.914% | 2/1/2022 | 1 | 1,074 | ||||||||
| Tampa Electric Co. | 6.15% | 5/15/2037 | 12 | 16,562 | ||||||||
| Vistra Operations Co. LLC† | 3.55% | 7/15/2024 | 50 | 51,859 | ||||||||
| Total | 1,013,135 | |||||||||||
| Engineering & Construction 0.44% | ||||||||||||
| Fluor Corp. | 4.25% | 9/15/2028 | 50 | 51,080 | ||||||||
| Gas 2.38% | ||||||||||||
| National Fuel Gas Co. | 3.95% | 9/15/2027 | 54 | 56,741 | ||||||||
| National Fuel Gas Co. | 7.395% | 3/30/2023 | 15 | 15,915 | ||||||||
| NiSource, Inc. | 5.95% | 6/15/2041 | 36 | 49,816 | ||||||||
| Piedmont Natural Gas Co., Inc. | 2.50% | 3/15/2031 | 115 | 114,753 | ||||||||
| Southwest Gas Corp. | 4.15% | 6/1/2049 | 34 | 40,022 | ||||||||
| Total | 277,247 | |||||||||||
| Health Care-Products 0.66% | ||||||||||||
| Abbott Laboratories | 4.75% | 11/30/2036 | 60 | 77,095 | ||||||||
| Health Care-Services 0.90% | ||||||||||||
| Centene Corp. | 4.25% | 12/15/2027 | 33 | 34,277 | ||||||||
| Centene Corp. | 4.625% | 12/15/2029 | 20 | 21,430 | ||||||||
| Universal Health Services, Inc.† | 2.65% | 10/15/2030 | 50 | 48,565 | ||||||||
| Total | 104,272 | |||||||||||
| See Notes to Financial Statements. | 129 |
Schedule of Investments (continued)
CORPORATE BOND FUND November 30, 2021
| Investments | Interest Rate | Maturity Date | Principal Amount (000) | Fair Value | ||||||||
| Home Builders 0.70% | ||||||||||||
| NVR, Inc. | 3.00% | 5/15/2030 | $ | 44 | $ | 45,891 | ||||||
| Toll Brothers Finance Corp. | 3.80% | 11/1/2029 | 16 | 16,938 | ||||||||
| Toll Brothers Finance Corp. | 4.875% | 3/15/2027 | 17 | 18,776 | ||||||||
| Total | 81,605 | |||||||||||
| Insurance 4.28% | ||||||||||||
| Assurant, Inc. | 3.70% | 2/22/2030 | 57 | 61,694 | ||||||||
| CNO Financial Group, Inc. | 5.25% | 5/30/2025 | 40 | 44,622 | ||||||||
| CNO Financial Group, Inc. | 5.25% | 5/30/2029 | 35 | 40,482 | ||||||||
| First American Financial Corp. | 2.40% | 8/15/2031 | 34 | 33,131 | ||||||||
| New York Life Insurance Co.† | 4.45% | 5/15/2069 | 60 | 79,017 | ||||||||
| Protective Life Corp. | 8.45% | 10/15/2039 | 33 | 53,327 | ||||||||
| Securian Financial Group, Inc.† | 4.80% | 4/15/2048 | 26 | 32,818 | ||||||||
| Selective Insurance Group, Inc. | 5.375% | 3/1/2049 | 39 | 53,469 | ||||||||
| Teachers Insurance & Annuity Association of America† | 4.90% | 9/15/2044 | 45 | 59,329 | ||||||||
| Transatlantic Holdings, Inc. | 8.00% | 11/30/2039 | 25 | 39,832 | ||||||||
| Total | 497,721 | |||||||||||
| Internet 0.67% | ||||||||||||
| Expedia Group, Inc. | 2.95% | 3/15/2031 | 19 | 19,207 | ||||||||
| Netflix, Inc.† | 5.375% | 11/15/2029 | 50 | 59,228 | ||||||||
| Total | 78,435 | |||||||||||
| Iron-Steel 0.13% | ||||||||||||
| Steel Dynamics, Inc. | 5.00% | 12/15/2026 | 15 | 15,329 | ||||||||
| Machinery-Diversified 1.03% | ||||||||||||
| Flowserve Corp. | 2.80% | 1/15/2032 | 50 | 49,287 | ||||||||
| nVent Finance Sarl (Luxembourg)(a) | 4.55% | 4/15/2028 | 63 | 70,446 | ||||||||
| Total | 119,733 | |||||||||||
| Media 1.73% | ||||||||||||
| Charter Communications Operating LLC/Charter Communications Operating Capital | 6.484% | 10/23/2045 | 111 | 151,965 | ||||||||
| Comcast Corp.† | 2.887% | 11/1/2051 | 50 | 48,962 | ||||||||
| Total | 200,927 | |||||||||||
| Mining 0.57% | ||||||||||||
| Glencore Finance Canada Ltd. (Canada)†(a) | 5.55% | 10/25/2042 | 52 | 65,998 | ||||||||
| 130 | See Notes to Financial Statements. |
Schedule of Investments (continued)
CORPORATE BOND FUND November 30, 2021
| Investments | Interest Rate | Maturity Date | Principal Amount (000) | Fair Value | ||||||||
| Miscellaneous Manufacturing 0.26% | ||||||||||||
| Pentair Finance Sarl (Luxembourg)(a) | 3.15% | 9/15/2022 | $ | 30 | $ | 30,375 | ||||||
| Oil & Gas 5.07% | ||||||||||||
| Apache Corp. | 5.10% | 9/1/2040 | 15 | 16,297 | ||||||||
| Canadian Natural Resources Ltd. (Canada)(a) | 7.20% | 1/15/2032 | 31 | 41,722 | ||||||||
| Cenovus Energy, Inc. (Canada)(a) | 3.75% | 2/15/2052 | 26 | 25,573 | ||||||||
| Continental Resources, Inc. | 4.90% | 6/1/2044 | 42 | 46,660 | ||||||||
| Diamondback Energy, Inc. | 3.50% | 12/1/2029 | 47 | 49,364 | ||||||||
| Diamondback Energy, Inc. | 4.75% | 5/31/2025 | 3 | 3,289 | ||||||||
| Endeavor Energy Resources LP/EER Finance, Inc.† | 5.75% | 1/30/2028 | 4 | 4,166 | ||||||||
| Eni USA, Inc. | 7.30% | 11/15/2027 | 50 | 63,971 | ||||||||
| Helmerich & Payne, Inc.† | 2.90% | 9/29/2031 | 83 | 81,214 | ||||||||
| Hess Corp. | 5.60% | 2/15/2041 | 57 | 70,371 | ||||||||
| Ovintiv, Inc. | 6.625% | 8/15/2037 | 10 | 12,738 | ||||||||
| Patterson-UTI Energy, Inc. | 3.95% | 2/1/2028 | 71 | 69,419 | ||||||||
| Suncor Energy Ventures Corp. (Canada)†(a) | 4.50% | 4/1/2022 | 10 | 10,033 | ||||||||
| Suncor Energy, Inc. (Canada)(a) | 7.875% | 6/15/2026 | 23 | 28,289 | ||||||||
| Viper Energy Partners LP† | 5.375% | 11/1/2027 | 65 | 67,091 | ||||||||
| Total | 590,197 | |||||||||||
| Oil & Gas Services 1.48% | ||||||||||||
| Halliburton Co. | 7.45% | 9/15/2039 | 61 | 90,131 | ||||||||
| NOV, Inc. | 3.60% | 12/1/2029 | 80 | 82,213 | ||||||||
| Total | 172,344 | |||||||||||
| Pharmaceuticals 2.79% | ||||||||||||
| Bayer Corp.† | 6.65% | 2/15/2028 | 63 | 76,899 | ||||||||
| Cigna Corp. | 6.125% | 11/15/2041 | 75 | 106,936 | ||||||||
| CVS Health Corp. | 4.875% | 7/20/2035 | 115 | 141,242 | ||||||||
| Total | 325,077 | |||||||||||
| Pipelines 3.00% | ||||||||||||
| Eastern Gas Transmission & Storage, Inc.† | 3.00% | 11/15/2029 | 60 | 62,544 | ||||||||
| Eastern Gas Transmission & Storage, Inc.† | 4.60% | 12/15/2044 | 55 | 66,218 | ||||||||
| NGPL PipeCo LLC† | 4.875% | 8/15/2027 | 77 | 86,028 | ||||||||
| Sabal Trail Transmission LLC† | 4.246% | 5/1/2028 | 43 | 48,433 | ||||||||
| Sabine Pass Liquefaction LLC | 5.875% | 6/30/2026 | 75 | 86,300 | ||||||||
| Total | 349,523 | |||||||||||
| See Notes to Financial Statements. | 131 |
Schedule of Investments (continued)
CORPORATE BOND FUND November 30, 2021
| Investments | Interest Rate | Maturity Date | Principal Amount (000) | Fair Value | ||||||||
| REITS 5.10% | ||||||||||||
| American Campus Communities Operating Partnership LP | 2.25% | 1/15/2029 | $ | 10 | $ | 9,920 | ||||||
| American Campus Communities Operating Partnership LP | 3.875% | 1/30/2031 | 50 | 55,609 | ||||||||
| American Homes 4 Rent LP | 4.25% | 2/15/2028 | 23 | 25,673 | ||||||||
| American Homes 4 Rent LP | 4.90% | 2/15/2029 | 45 | 52,665 | ||||||||
| American Tower Corp. | 3.80% | 8/15/2029 | 55 | 59,754 | ||||||||
| CyrusOne LP/CyrusOne Finance Corp. | 3.45% | 11/15/2029 | 65 | 69,411 | ||||||||
| EPR Properties | 4.95% | 4/15/2028 | 64 | 70,121 | ||||||||
| GLP Capital LP/GLP Financing II, Inc. | 5.75% | 6/1/2028 | 50 | 57,825 | ||||||||
| Goodman US Finance Three LLC† | 3.70% | 3/15/2028 | 80 | 86,688 | ||||||||
| Invitation Homes Operating Partnership LP | 2.00% | 8/15/2031 | 33 | 31,336 | ||||||||
| Invitation Homes Operating Partnership LP | 2.30% | 11/15/2028 | 12 | 11,915 | ||||||||
| MPT Operating Partnership LP/MPT Finance Corp. | 4.625% | 8/1/2029 | 37 | 38,682 | ||||||||
| Physicians Realty LP | 2.625% | 11/1/2031 | 24 | 24,006 | ||||||||
| Total | 593,605 | |||||||||||
| Semiconductors 1.22% | ||||||||||||
| Broadcom, Inc. | 4.15% | 11/15/2030 | 95 | 103,955 | ||||||||
| Skyworks Solutions, Inc. | 3.00% | 6/1/2031 | 37 | 37,565 | ||||||||
| Total | 141,520 | |||||||||||
| Software 2.59% | ||||||||||||
| MSCI, Inc.† | 3.25% | 8/15/2033 | 40 | 39,949 | ||||||||
| Oracle Corp. | 6.125% | 7/8/2039 | 145 | 198,017 | ||||||||
| VMware, Inc. | 4.70% | 5/15/2030 | 54 | 62,750 | ||||||||
| Total | 300,716 | |||||||||||
| Telecommunications 5.55% | ||||||||||||
| AT&T, Inc. | 3.50% | 9/15/2053 | 25 | 25,299 | ||||||||
| AT&T, Inc. | 4.30% | 2/15/2030 | 263 | 297,163 | ||||||||
| Orange SA (France)(a) | 9.00% | 3/1/2031 | 65 | 100,033 | ||||||||
| Verizon Communications, Inc.† | 2.355% | 3/15/2032 | 225 | 222,891 | ||||||||
| Total | 645,386 | |||||||||||
| Total Corporate Bonds (cost $9,336,309) | 9,473,555 | |||||||||||
| FLOATING RATE LOANS(c) 10.70% | ||||||||||||
| Advertising 0.43% | ||||||||||||
| Lamar Media Corporation 2020 Term Loan B | 1.589% (1 Mo. LIBOR + 1.5% | ) | 2/5/2027 | 50 | 49,800 | |||||||
| 132 | See Notes to Financial Statements. |
Schedule of Investments (continued)
CORPORATE BOND FUND November 30, 2021
| Investments | Interest Rate | Maturity Date | Principal Amount (000) | Fair Value | ||||||||
| Business Services 0.75% | ||||||||||||
| Global Payments Inc. 2019 Term Loan | 1.467% (1 Mo. LIBOR + 1.38% | ) | 7/9/2024 | $ | 21 | $ | 21,078 | |||||
| Trans Union, LLC 2019 Term Loan B5 | 1.84% (1 Mo. LIBOR + 1.75% | ) | 11/16/2026 | 67 | 65,932 | |||||||
| Total | 87,010 | |||||||||||
| Chemicals 0.30% | ||||||||||||
| Nutrition & Biosciences, Inc. 3 Year Delayed Draw Term Loan | 1.407% (3 Mo. LIBOR + 1.25% | ) | 1/17/2023 | 7 | 7,467 | |||||||
| Nutrition & Biosciences, Inc. 5 Year Delayed Draw Term Loan | 1.41% (3 Mo. LIBOR + 1.25% | ) | 1/17/2025 | 27 | 27,069 | |||||||
| Total | 34,536 | |||||||||||
| Entertainment 0.56% | ||||||||||||
| Churchill Downs Incorporated 2021 Incremental Term Loan B1 | 2.10% (1 Mo. LIBOR + 2.00% | ) | 3/17/2028 | 65 | 64,703 | |||||||
| Financial Services 1.59% | ||||||||||||
| Avolon TLB Borrower 1 (US) LLC 2021 Term Loan B5 | – | (d) | 12/1/2027 | 115 | 114,832 | |||||||
| Delos Finance Sarl 2018 Term Loan B (Luxembourg)(a) | 1.882% (3 Mo. LIBOR + 1.75% | ) | 10/6/2023 | 70 | 69,944 | |||||||
| Total | 184,776 | |||||||||||
| Food 0.80% | ||||||||||||
| JBS USA Lux S.A. 2019 Term Loan B (Luxembourg)(a) | 2.092% (1 Mo. LIBOR + 2.00% | ) | 5/1/2026 | 93 | 92,960 | |||||||
| Gaming 0.26% | ||||||||||||
| GLP Capital L.P. 2020 Term Loan A2 | 1.589% (1 Mo. LIBOR + 1.50% | ) | 5/21/2023 | 30 | 29,775 | (e) | ||||||
| Government 1.33% | ||||||||||||
| Seminole Tribe of Florida 2018 Term Loan B | 1.84% (1 Mo. LIBOR + 1.75% | ) | 7/8/2024 | 155 | 154,276 | |||||||
| Leasing 0.64% | ||||||||||||
| Setanta Aircraft Leasing Designated Activity Company Term Loan B (Ireland)(a) | 2.14% (3 Mo. LIBOR + 2.00% | ) | 11/5/2028 | 75 | 74,969 | |||||||
| Lodging 0.86% | ||||||||||||
| Hilton Worldwide Finance, LLC 2019 Term Loan B2 | 1.842% (1 Mo. LIBOR + 1.75% | ) | 6/22/2026 | 101 | 100,121 | |||||||
| See Notes to Financial Statements. | 133 |
Schedule of Investments (continued)
CORPORATE BOND FUND November 30, 2021
| Investments | Interest Rate | Maturity Date | Principal Amount (000) | Fair Value | ||||||||
| Media 0.86% | ||||||||||||
| Nielsen Finance LLC USD Term Loan B4 | 2.089% (1 Mo. LIBOR + 2.00% | ) | 10/4/2023 | $ | 100 | $ | 99,875 | |||||
| Miscellaneous 0.49% | ||||||||||||
| Charter Communications Operating, LLC 2019 Term Loan B1 | 1.85% (1 Mo. LIBOR + 1.75% | ) | 4/30/2025 | 19 | 18,972 | |||||||
| HCA Inc. 2021 Term Loan B14 | 1.84% (1 Mo. LIBOR + 1.75% | ) | 6/30/2028 | 38 | 38,100 | |||||||
| Total | 57,072 | |||||||||||
| Oil: Crude Producers 0.32% | ||||||||||||
| Cheniere Corpus Christi Holdings, LLC Delayed Draw Term Loan Tranche 2 | – | (d) | 6/30/2024 | 38 | 37,869 | |||||||
| Retail 0.88% | ||||||||||||
| Murphy USA Inc. Term Loan B | 2.25% (1 Mo. LIBOR + 1.75% | ) | 1/31/2028 | 102 | 102,756 | |||||||
| Technology 0.43% | ||||||||||||
| Comcast Hulu Holdings, LLC Term Loan A | 0.965% (1 Mo. LIBOR + .88% | ) | 3/15/2024 | 50 | 49,563 | |||||||
| Telecommunications 0.20% | ||||||||||||
| CenturyLink, Inc. 2020 Term Loan A | 2.09% (1 Mo. LIBOR + 2.00% | ) | 1/31/2025 | 24 | 23,904 | |||||||
| Total Floating Rate Loans (cost $1,247,743) | 1,243,965 | |||||||||||
| MUNICIPAL BONDS 1.95% | ||||||||||||
| Miscellaneous | ||||||||||||
| California State University | 3.899% | 11/1/2047 | 25 | 29,609 | ||||||||
| City of Chicago IL | 6.314% | 1/1/2044 | 20 | 27,245 | ||||||||
| County of Miami-Dade FL | 2.786% | 10/1/2037 | 10 | 10,100 | ||||||||
| County of Miami-Dade FL Aviation Revenue | 4.28% | 10/1/2041 | 25 | 27,602 | ||||||||
| Metropolitan Transportation Authority | 6.668% | 11/15/2039 | 20 | 28,734 | ||||||||
| New Jersey Transportation Trust Fund Authority | 4.131% | 6/15/2042 | 15 | 17,515 | ||||||||
| New York City Transitional Finance Authority Futur | 1.95% | 8/1/2034 | 40 | 38,196 | ||||||||
| Regents of the University of California Medical Ce | 3.006% | 5/15/2050 | 15 | 15,888 | ||||||||
| State of Illinois | 4.95% | 6/1/2023 | 3 | 2,663 | ||||||||
| State of Illinois | 5.10% | 6/1/2033 | 25 | 29,249 | ||||||||
| Total Municipal Bonds (cost $215,128) | 226,801 | |||||||||||
| 134 | See Notes to Financial Statements. |
Schedule of Investments (continued)
CORPORATE BOND FUND November 30, 2021
| Investments | Interest Rate | Maturity Date | Principal Amount (000) | Fair Value | ||||||||
| U. S. TREASURY OBLIGATIONS 2.82% | ||||||||||||
| U. S. Treasury Bond (cost $315,071) | 2.00% | 8/15/2051 | $ | 313 | $ | 327,867 | ||||||
| Total Long-Term Investments (cost $11,114,251) | 11,272,188 | |||||||||||
| SHORT-TERM INVESTMENTS 2.70% | ||||||||||||
| REPURCHASE AGREEMENTS 2.70% | ||||||||||||
| Repurchase Agreement dated 11/30/2021, 0.00% due 12/1/2021 with Fixed Income Clearing Corp. collateralized by $309,400 of U.S. Treasury Note at 2.75% due 4/30/2023; value: $320,608; proceeds: $314,281 (cost $314,281) | 314 | 314,281 | ||||||||||
| Total Investments in Securities 99.62% (cost $11,428,532) | 11,586,469 | |||||||||||
| Other Assets and Liabilities – Net(f) 0.38% | 43,968 | |||||||||||
| Net Assets 100.00% | $ | 11,630,437 | ||||||||||
| CMT | Constant Maturity Rate. | |
| LIBOR | London Interbank Offered Rate. | |
| SOFR | Secured Over Night Financing Rate. | |
| † | Security was purchased pursuant to Rule 144A under the Securities Act of 1933 and, unless registered under such Act or exempted from registration, may only be resold to qualified institutional buyers. At November 30, 2021, the total value of Rule 144A securities was $1,950,441, which represents 16.77% of net assets. | |
| # | Variable rate security. The interest rate represents the rate in effect at November 30, 2021. | |
| (a) | Foreign security traded in U.S. dollars. | |
| (b) | Security is perpetual in nature and has no stated maturity. | |
| (c) | Floating Rate Loans in which the Fund invests generally pay interest at rates which are periodically re-determined at a margin above the London Interbank Offered Rate (“LIBOR”) or the prime rate offered by major U.S. banks. The rate(s) shown is the rate(s) in effect at November 30, 2021. | |
| (d) | Interest rate to be determined. | |
| (e) | Level 3 Investment as described in Note 2(t) in the Notes to Financials. Floating Rate Loans categorized as Level 3 are valued based on a single quotation obtained from a dealer. Accounting principles generally accepted in the United States of America do not require the Fund to create quantitative unobservable inputs that were not developed by the Fund. Therefore, the Fund does not have access to unobservable inputs and cannot disclose such inputs in the valuation. | |
| (f) | Other Assets and Liabilities - Net include net unrealized appreciation/depreciation on futures contracts as follows: | |
Open Futures Contracts at November 30, 2021:
| Type | Expiration | Contracts | Position | Notional Amount | Notional Value | Unrealized Appreciation | ||||||||||||
| U.S. 2-Year Treasury Note | March 2022 | 4 | Long | $ | 873,330 | $ | 874,937 | $ | 1,607 | |||||||||
| U.S. 5-Year Treasury Note | March 2022 | 5 | Long | 602,627 | 606,992 | 4,365 | ||||||||||||
| U.S. Ultra Treasury Bond | March 2022 | 5 | Long | 970,322 | 1,002,813 | 32,491 | ||||||||||||
| Total Unrealized Appreciation on Open Futures Contracts | $ | 38,463 | ||||||||||||||||
| See Notes to Financial Statements. | 135 |
Schedule of Investments (concluded)
CORPORATE BOND FUND November 30, 2021
| Type | Expiration | Contracts | Position | Notional Amount | Notional Value | Unrealized Depreciation | ||||||||||||
| U.S. 10-Year Treasury Note | March 2022 | 12 | Short | $ | (1,547,789 | ) | $ | (1,569,750 | ) | $ | (21,961 | ) | ||||||
| U.S. 10-Year Ultra Treasury Note | March 2022 | 2 | Short | (288,715 | ) | (293,781 | ) | (5,066 | ) | |||||||||
| U.S. Long Bond | March 2022 | 1 | Short | (158,809 | ) | (162,125 | ) | (3,316 | ) | |||||||||
| Total Unrealized Depreciation on Open Futures Contracts | $ | (30,343 | ) | |||||||||||||||
The following is a summary of the inputs used as of November 30, 2021 in valuing the Fund’s investments carried at fair value(1):
| Investment Type(2) | Level 1 | Level 2 | Level 3 | Total | ||||||||||||
| Long-Term Investments | ||||||||||||||||
| Corporate Bonds | $ | – | $ | 9,473,555 | $ | – | $ | 9,473,555 | ||||||||
| Floating Rate Loans | ||||||||||||||||
| Gaming | – | – | 29,775 | 29,775 | ||||||||||||
| Remaining Industries | – | 1,214,190 | – | 1,214,190 | ||||||||||||
| Municipal Bonds | – | 226,801 | – | 226,801 | ||||||||||||
| U.S. Treasury Obligations | – | 327,867 | – | 327,867 | ||||||||||||
| Short-Term Investments | ||||||||||||||||
| Repurchase Agreements | – | 314,281 | – | 314,281 | ||||||||||||
| Total | $ | – | $ | 11,556,694 | $ | 29,775 | $ | 11,586,469 | ||||||||
| Other Financial Instruments | ||||||||||||||||
| Futures Contracts | ||||||||||||||||
| Assets | $ | 38,463 | $ | – | $ | – | $ | 38,463 | ||||||||
| Liabilities | (30,343 | ) | – | – | (30,343 | ) | ||||||||||
| Total | $ | 8,120 | $ | – | $ | – | $ | 8,120 | ||||||||
| (1) | Refer to Note 2(t) for a description of fair value measurements and the three-tier hierarchy of inputs. | |
| (2) | See Schedule of Investments for fair values in each industry and identification of foreign issuers and/or geography. The table above is presented by Investment Type. Industries are presented within an Investment Type should such Investment Type include securities classified as two or more levels within the three-tier fair value hierarchy. When applicable each Level 3 security is identified on the Schedule of Investments along with the valuation technique utilized. |
A reconciliation of Level 3 investments is presented when the Fund has a material amount of Level 3 investments at the beginning or end of the year in relation to the Fund’s net assets. Management has determined not to provide a reconciliation as the balance of Level 3 investments was not considered to be material to the Fund’s net assets at the beginning or end of the year.
| 136 | See Notes to Financial Statements. |
Schedule of Investments
FLOATING RATE FUND November 30, 2021
| Investments | Interest Rate | Maturity Date | Principal Amount (000) | Fair Value | ||||||||||
| LONG-TERM INVESTMENTS 93.77% | ||||||||||||||
| ASSET-BACKED SECURITIES 0.18% | ||||||||||||||
| Other | ||||||||||||||
| AMMC CLO Ltd. 2021-24A D†(a) | Zero Coupon | #(b) | 1/20/2035 | $ | 10,000 | $ | 10,000,000 | |||||||
| Signal Peak CLO Ltd. 2018-5A E† | 5.774% (3 Mo. LIBOR + 5.65% | )# | 4/25/2031 | 1,050 | 1,032,671 | |||||||||
| THL Credit Wind River CLO Ltd. 2018-3A D† | 3.082% (3 Mo. LIBOR + 2.95% | )# | 1/20/2031 | 1,736 | 1,712,532 | |||||||||
| Total Asset-Backed Securities (cost $12,764,965) | 12,745,203 | |||||||||||||
| Shares (000) | ||||||||||||||
| COMMON STOCKS 0.76% | ||||||||||||||
| Electric-Generation 0.01% | ||||||||||||||
| Frontera Generation | 210 | 458,673 | ||||||||||||
| Machinery 0.14% | ||||||||||||||
| TNT Crane & Rigging, Inc. | 529 | 9,892,435 | ||||||||||||
| Media 0.07% | ||||||||||||||
| iHeartMedia, Inc. Class A* | 250 | 4,911,285 | ||||||||||||
| Miscellaneous Financials 0.21% | ||||||||||||||
| UTEX Industries, Inc. | 298 | 14,281,680 | ||||||||||||
| Specialty Retail 0.29% | ||||||||||||||
| Chinos Intermediate | 1,169 | 18,991,017 | ||||||||||||
| Chinos Intermediate | 147 | 1,031,380 | ||||||||||||
| Total | 20,022,397 | |||||||||||||
| Transportation Infrastructure 0.04% | ||||||||||||||
| ACBL Holdings Corp. | 95 | 2,642,078 | ||||||||||||
| Total Common Stocks (cost $42,439,686) | 52,208,548 | |||||||||||||
| Interest Rate | Maturity Date | Principal Amount (000) | ||||||||||||
| CONVERTIBLE BONDS 0.69% | ||||||||||||||
| Entertainment 0.10% | ||||||||||||||
| Vail Resorts, Inc.† | Zero Coupon | 1/1/2026 | $ | 6,103 | 6,541,653 | |||||||||
| See Notes to Financial Statements. | 137 |
Schedule of Investments (continued)
FLOATING RATE FUND November 30, 2021
| Investments | Interest Rate | Maturity Date | Principal Amount (000) | Fair Value | |||||||||
| Internet 0.30% | |||||||||||||
| Airbnb, Inc.† | Zero Coupon | 3/15/2026 | $ | 6,782 | $ | 6,731,135 | |||||||
| Etsy, Inc.† | 0.25% | 6/15/2028 | 5,153 | 6,866,373 | |||||||||
| RealReal, Inc. (The)† | 1.00% | 3/1/2028 | 7,863 | 7,016,941 | |||||||||
| Total | 20,614,449 | ||||||||||||
| Miscellaneous Manufacturing 0.10% | |||||||||||||
| John Bean Technologies Corp.† | 0.25% | 5/15/2026 | 6,212 | 6,969,864 | |||||||||
| Pharmaceuticals 0.10% | |||||||||||||
| Dexcom, Inc. | 0.25% | 11/15/2025 | 5,755 | 6,967,147 | |||||||||
| Trucking & Leasing 0.09% | |||||||||||||
| Greenbrier Cos., Inc. (The)† | 2.875% | 4/15/2028 | 6,250 | 6,468,750 | |||||||||
| Total Convertible Bonds (cost $46,876,654) | 47,561,863 | ||||||||||||
| CORPORATE BONDS 11.16% | |||||||||||||
| Advertising 0.41% | |||||||||||||
| Clear Channel Outdoor Holdings, Inc.† | 7.50% | 6/1/2029 | 5,254 | 5,407,390 | |||||||||
| Clear Channel Outdoor Holdings, Inc.† | 7.75% | 4/15/2028 | 1,910 | 1,995,353 | |||||||||
| Midas OpCo Holdings LLC† | 5.625% | 8/15/2029 | 11,152 | 11,250,305 | |||||||||
| National CineMedia LLC† | 5.875% | 4/15/2028 | 11,024 | 9,886,103 | |||||||||
| Total | 28,539,151 | ||||||||||||
| Auto Parts & Equipment 0.05% | |||||||||||||
| Dornoch Debt Merger Sub, Inc.† | 6.625% | 10/15/2029 | 3,356 | 3,309,855 | |||||||||
| Beverages 0.12% | |||||||||||||
| Triton Water Holdings, Inc.† | 6.25% | 4/1/2029 | 8,624 | 8,389,858 | |||||||||
| Chemicals 0.55% | |||||||||||||
| CVR Partners LP/CVR Nitrogen Finance Corp.† | 6.125% | 6/15/2028 | 9,445 | 9,812,977 | |||||||||
| EverArc Escrow Sarl (Luxembourg)†(c) | 5.00% | 10/30/2029 | 7,149 | 6,978,746 | |||||||||
| LSF11 A5 HoldCo LLC† | 6.625% | 10/15/2029 | 4,903 | 4,780,646 | |||||||||
| Unifrax Escrow Issuer Corp.† | 5.25% | 9/30/2028 | 11,360 | 11,186,050 | |||||||||
| Unifrax Escrow Issuer Corp.† | 7.50% | 9/30/2029 | 5,741 | 5,576,980 | |||||||||
| Total | 38,335,399 | ||||||||||||
| Coal 0.30% | |||||||||||||
| SunCoke Energy, Inc.† | 4.875% | 6/30/2029 | 5,682 | 5,530,120 | |||||||||
| Warrior Met Coal, Inc.†(a) | 7.875% | 12/1/2028 | 7,576 | 7,659,109 | |||||||||
| Warrior Met Coal, Inc.† | 8.00% | 11/1/2024 | 7,548 | 7,725,566 | |||||||||
| Total | 20,914,795 | ||||||||||||
| 138 | See Notes to Financial Statements. |
Schedule of Investments (continued)
FLOATING RATE FUND November 30, 2021
| Investments | Interest Rate | Maturity Date | Principal Amount (000) | Fair Value | |||||||||
| Commercial Services 0.72% | |||||||||||||
| Ahern Rentals, Inc.† | 7.375% | 5/15/2023 | $ | 10,203 | $ | 9,641,835 | |||||||
| Alta Equipment Group, Inc.† | 5.625% | 4/15/2026 | 7,344 | 7,519,008 | |||||||||
| Metis Merger Sub LLC† | 6.50% | 5/15/2029 | 6,940 | 6,795,509 | |||||||||
| Prime Security Services Borrower LLC/Prime Finance, Inc.† | 3.375% | 8/31/2027 | 10,052 | 9,526,230 | |||||||||
| Team Health Holdings, Inc.† | 6.375% | 2/1/2025 | 6,683 | 5,865,134 | |||||||||
| WASH Multifamily Acquisition, Inc.† | 5.75% | 4/15/2026 | 5,868 | 6,055,424 | |||||||||
| WW International, Inc.† | 4.50% | 4/15/2029 | 5,004 | 4,663,128 | |||||||||
| Total | 50,066,268 | ||||||||||||
| Computers 0.11% | |||||||||||||
| Ahead DB Holdings LLC† | 6.625% | 5/1/2028 | 7,464 | 7,471,613 | |||||||||
| Distribution/Wholesale 0.17% | |||||||||||||
| Resideo Funding, Inc.† | 4.00% | 9/1/2029 | 12,080 | 11,549,990 | |||||||||
| Diversified Financial Services 1.18% | |||||||||||||
| Armor Holdco, Inc.† | 8.50% | 11/15/2029 | 7,474 | 7,694,857 | |||||||||
| Coinbase Global, Inc.† | 3.375% | 10/1/2028 | 14,042 | 13,222,158 | |||||||||
| Global Aircraft Leasing Co. Ltd. PIK 7.25%† | 6.50% | 9/15/2024 | 14,114 | 13,517,785 | |||||||||
| Jefferson Capital Holdings LLC† | 6.00% | 8/15/2026 | 9,237 | 9,209,705 | |||||||||
| Jerrold Finco plc†(d) | 5.25% | 1/15/2027 | GBP | 4,489 | 6,037,608 | ||||||||
| LFS Topco LLC† | 5.875% | 10/15/2026 | $ | 6,464 | 6,701,552 | ||||||||
| Midcap Financial Issuer Trust† | 6.50% | 5/1/2028 | 7,347 | 7,509,258 | |||||||||
| PHH Mortgage Corp.† | 7.875% | 3/15/2026 | 9,089 | 9,315,407 | |||||||||
| PRA Group, Inc.† | 5.00% | 10/1/2029 | 8,240 | 8,151,090 | |||||||||
| Total | 81,359,420 | ||||||||||||
| Electric 0.07% | |||||||||||||
| Pattern Energy Operations LP/Pattern Energy Operations, Inc.† | 4.50% | 8/15/2028 | 1,017 | 1,035,845 | |||||||||
| Talen Energy Supply LLC | 6.50% | 6/1/2025 | 7,270 | 4,087,158 | |||||||||
| Total | 5,123,003 | ||||||||||||
| Energy-Alternate Sources 0.22% | |||||||||||||
| Sunnova Energy Corp.† | 5.875% | 9/1/2026 | 7,464 | 7,572,340 | |||||||||
| TerraForm Power Operating LLC† | 4.75% | 1/15/2030 | 7,583 | 7,713,333 | |||||||||
| Total | 15,285,673 | ||||||||||||
| Entertainment 0.52% | |||||||||||||
| Affinity Gaming† | 6.875% | 12/15/2027 | 8,939 | 9,182,499 | |||||||||
| ASR Media and Sponsorship SpA(d) | 5.125% | 8/1/2024 | EUR | 8,372 | 9,225,894 | ||||||||
| See Notes to Financial Statements. | 139 |
Schedule of Investments (continued)
FLOATING RATE FUND November 30, 2021
| Investments | Interest Rate | Maturity Date | Principal Amount (000) | Fair Value | |||||||||
| Entertainment (continued) | |||||||||||||
| Mohegan Gaming & Entertainment† | 8.00% | 2/1/2026 | $ | 10,027 | $ | 10,179,310 | |||||||
| Peninsula Pacific Entertainment LLC/Peninsula Pacific Entertainment Finance In† | 8.50% | 11/15/2027 | 6,669 | 7,228,529 | |||||||||
| Total | 35,816,232 | ||||||||||||
| Environmental Control 0.08% | |||||||||||||
| Madison IAQ LLC† | 5.875% | 6/30/2029 | 6,007 | 5,788,706 | |||||||||
| Health Care-Services 0.21% | |||||||||||||
| Global Medical Response, Inc.† | 6.50% | 10/1/2025 | 8,790 | 8,808,942 | |||||||||
| US Acute Care Solutions LLC† | 6.375% | 3/1/2026 | 5,363 | 5,501,768 | |||||||||
| Total | 14,310,710 | ||||||||||||
| Home Builders 0.32% | |||||||||||||
| Brookfield Residential Properties, Inc./Brookfield Residential US Corp. (Canada)†(c) | 4.875% | 2/15/2030 | 9,659 | 9,643,908 | |||||||||
| Shea Homes LP/Shea Homes Funding Corp.† | 4.75% | 2/15/2028 | 12,201 | 12,193,557 | |||||||||
| Total | 21,837,465 | ||||||||||||
| Housewares 0.19% | |||||||||||||
| SWF Escrow Issuer Corp.† | 6.50% | 10/1/2029 | 13,454 | 12,935,012 | |||||||||
| Insurance 0.11% | |||||||||||||
| Ardonagh Midco 2 plc PIK 12.75% (United Kingdom)†(c) | 11.50% | 1/15/2027 | 7,008 | 7,349,589 | |||||||||
| Internet 0.14% | |||||||||||||
| Millennium Escrow Corp.† | 6.625% | 8/1/2026 | 9,578 | 9,587,482 | |||||||||
| Investment Companies 0.12% | |||||||||||||
| Hightower Holding LLC† | 6.75% | 4/15/2029 | 8,077 | 8,176,872 | |||||||||
| Iron-Steel 0.33% | |||||||||||||
| Allegheny Technologies, Inc. | 5.125% | 10/1/2031 | 9,615 | 9,508,899 | |||||||||
| Baffinland Iron Mines Corp./Baffinland Iron Mines LP (Canada)†(c) | 8.75% | 7/15/2026 | 6,442 | 6,729,764 | |||||||||
| TMS International Corp/DE† | 6.25% | 4/15/2029 | 6,200 | 6,240,765 | |||||||||
| Total | 22,479,428 | ||||||||||||
| Leisure Time 0.09% | |||||||||||||
| Deuce Finco plc†(d) | 5.50% | 6/15/2027 | GBP | 4,542 | 5,989,940 | ||||||||
| Media 0.10% | |||||||||||||
| Urban One, Inc.† | 7.375% | 2/1/2028 | $ | 7,004 | 7,145,060 | ||||||||
| 140 | See Notes to Financial Statements. |
Schedule of Investments (continued)
FLOATING RATE FUND November 30, 2021
| Investments | Interest Rate | Maturity Date | Principal Amount (000) | Fair Value | |||||||||
| Mining 0.30% | |||||||||||||
| Coeur Mining, Inc.† | 5.125% | 2/15/2029 | $ | 6,250 | $ | 5,986,312 | |||||||
| Hecla Mining Co. | 7.25% | 2/15/2028 | 8,017 | 8,592,901 | |||||||||
| Hudbay Minerals, Inc. (Canada)†(c) | 6.125% | 4/1/2029 | 6,204 | 6,463,948 | |||||||||
| Mirabela Nickel Ltd. (Australia)(c) | 1.00% | 9/10/2044 | 51 | 5 | (e) | ||||||||
| Total | 21,043,166 | ||||||||||||
| Miscellaneous Manufacturing 0.15% | |||||||||||||
| LSB Industries, Inc.† | 6.25% | 10/15/2028 | 10,098 | 10,440,928 | |||||||||
| Oil & Gas 1.66% | |||||||||||||
| Aethon United BR LP/Aethon United Finance Corp.† | 8.25% | 2/15/2026 | 8,535 | 9,045,222 | |||||||||
| Berry Petroleum Co. LLC† | 7.00% | 2/15/2026 | 951 | 910,759 | |||||||||
| California Resources Corp.† | 7.125% | 2/1/2026 | 9,817 | 10,132,617 | |||||||||
| Callon Petroleum Co.† | 8.00% | 8/1/2028 | 9,920 | 9,729,189 | |||||||||
| Centennial Resource Production LLC† | 6.875% | 4/1/2027 | 5,767 | 5,721,008 | |||||||||
| Colgate Energy Partners III LLC† | 7.75% | 2/15/2026 | 7,268 | 7,740,929 | |||||||||
| Comstock Resources, Inc.† | 5.875% | 1/15/2030 | 1,916 | 1,922,294 | |||||||||
| Comstock Resources, Inc.† | 6.75% | 3/1/2029 | 4,050 | 4,220,363 | |||||||||
| Encino Acquisition Partners Holdings LLC† | 8.50% | 5/1/2028 | 7,348 | 7,415,344 | |||||||||
| Gulfport Energy Operating Corp.† | 8.00% | 5/17/2026 | 5,781 | 6,226,858 | |||||||||
| Hilcorp Energy I LP/Hilcorp Finance Co.† | 5.75% | 2/1/2029 | 5,780 | 5,698,733 | |||||||||
| Independence Energy Finance LLC† | 7.25% | 5/1/2026 | 6,106 | 6,345,752 | |||||||||
| Laredo Petroleum, Inc. | 9.50% | 1/15/2025 | 9,713 | 9,684,395 | |||||||||
| Nabors Industries, Inc.† | 7.375% | 5/15/2027 | 6,928 | 6,802,811 | |||||||||
| Precision Drilling Corp. (Canada)†(c) | 6.875% | 1/15/2029 | 6,237 | 6,081,231 | |||||||||
| Rockcliff Energy II LLC† | 5.50% | 10/15/2029 | 7,671 | 7,754,767 | |||||||||
| SM Energy Co. | 6.50% | 7/15/2028 | 2,558 | 2,587,315 | |||||||||
| SM Energy Co. | 6.75% | 9/15/2026 | 6,256 | 6,285,716 | |||||||||
| Total | 114,305,303 | ||||||||||||
| Oil & Gas Services 0.10% | |||||||||||||
| Welltec International ApS (Denmark)†(c) | 8.25% | 10/15/2026 | 5,296 | 5,385,634 | |||||||||
| Welltec International ApS (Denmark)(c) | 8.25% | 10/15/2026 | 1,243 | 1,264,038 | |||||||||
| Total | 6,649,672 | ||||||||||||
| Pipelines 0.15% | |||||||||||||
| Buckeye Partners LP | 6.375% (3 Mo. LIBOR + 4.02% | )# | 1/22/2078 | 11,884 | 10,524,886 | ||||||||
| See Notes to Financial Statements. | 141 |
Schedule of Investments (continued)
FLOATING RATE FUND November 30, 2021
| Investments | Interest Rate | Maturity Date | Principal Amount (000) | Fair Value | |||||||||
| Real Estate 0.34% | |||||||||||||
| Hunt Cos., Inc.† | 5.25% | 4/15/2029 | $ | 9,678 | $ | 9,436,195 | |||||||
| Kennedy-Wilson, Inc. | 4.75% | 3/1/2029 | 4,807 | 4,878,240 | |||||||||
| Kennedy-Wilson, Inc. | 4.75% | 2/1/2030 | 1,923 | 1,934,538 | |||||||||
| Signa Development Finance SCS†(d) | 5.50% | 7/23/2026 | EUR | 7,100 | 7,087,133 | ||||||||
| Total | 23,336,106 | ||||||||||||
| REITS 0.39% | |||||||||||||
| Blackstone Mortgage Trust, Inc.† | 3.75% | 1/15/2027 | $ | 9,228 | 9,102,776 | ||||||||
| IIP Operating Partnership LP | 5.50% | 5/25/2026 | 8,084 | 8,708,478 | |||||||||
| Ladder Capital Finance Holdings LLLP/Ladder Capital Finance Corp.† | 4.25% | 2/1/2027 | 9,506 | 9,469,022 | |||||||||
| Total | 27,280,276 | ||||||||||||
| Retail 1.45% | |||||||||||||
| Asbury Automotive Group, Inc.† | 4.625% | 11/15/2029 | 4,793 | 4,830,769 | |||||||||
| Foundation Building Materials, Inc.† | 6.00% | 3/1/2029 | 6,974 | 6,673,769 | |||||||||
| GPS Hospitality Holding Co. LLC/GPS Finco, Inc.† | 7.00% | 8/15/2028 | 9,592 | 8,702,870 | |||||||||
| Ken Garff Automotive LLC† | 4.875% | 9/15/2028 | 5,952 | 5,915,752 | |||||||||
| LBM Acquisition LLC† | 6.25% | 1/15/2029 | 6,888 | 6,605,110 | |||||||||
| LCM Investments Holdings II LLC† | 4.875% | 5/1/2029 | 6,239 | 6,226,304 | |||||||||
| Maxeda DIY Holding BV†(d) | 5.875% | 10/1/2026 | EUR | 6,942 | 7,983,462 | ||||||||
| Park River Holdings, Inc.† | 6.75% | 8/1/2029 | $ | 9,396 | 9,348,691 | ||||||||
| Party City Holdings, Inc.† | 6.625% | 8/1/2026 | 5,440 | 4,596,800 | |||||||||
| Party City Holdings, Inc.† | 8.75% | 2/15/2026 | 2,407 | 2,431,527 | |||||||||
| Punch Finance plc†(d) | 6.125% | 6/30/2026 | GBP | 5,109 | 6,815,505 | ||||||||
| Punch Finance plc(d) | 6.125% | 6/30/2026 | GBP | 1,800 | 2,401,235 | ||||||||
| SRS Distribution, Inc.† | 6.00% | 12/1/2029 | $ | 13,499 | 13,371,164 | ||||||||
| Staples, Inc.† | 10.75% | 4/15/2027 | 5,321 | 4,854,987 | |||||||||
| Stonegate Pub Co. Financing 2019 plc(d) | 8.25% | 7/31/2025 | GBP | 6,728 | 9,125,161 | ||||||||
| Total | 99,883,106 | ||||||||||||
| Telecommunications 0.14% | |||||||||||||
| Frontier Communications Holdings LLC† | 6.00% | 1/15/2030 | $ | 6,592 | 6,496,713 | ||||||||
| Frontier Communications Holdings LLC† | 6.75% | 5/1/2029 | 3,257 | 3,357,967 | |||||||||
| Total | 9,854,680 | ||||||||||||
| Transportation 0.24% | |||||||||||||
| Carriage Purchaser, Inc.† | 7.875% | 10/15/2029 | 9,775 | 9,289,280 | |||||||||
| Seaspan Corp. (Hong Kong)†(c) | 5.50% | 8/1/2029 | 7,077 | 7,034,114 | |||||||||
| Total | 16,323,394 | ||||||||||||
| 142 | See Notes to Financial Statements. |
Schedule of Investments (continued)
FLOATING RATE FUND November 30, 2021
| Investments | Interest Rate | Maturity Date | Principal Amount (000) | Fair Value | ||||||||||
| Trucking & Leasing 0.13% | ||||||||||||||
| Fortress Transportation and Infrastructure Investors LLC† | 5.50% | 5/1/2028 | $ | 9,230 | $ | 9,065,521 | ||||||||
| Total Corporate Bonds (cost $778,649,459) | 770,468,559 | |||||||||||||
| Shares (000) | ||||||||||||||
| EXCHANGE-TRADED FUNDS 0.61% | ||||||||||||||
| Financials | ||||||||||||||
| Invesco Senior Loan ETF (cost $42,492,664) | 1,921 | 41,877,299 | ||||||||||||
| Interest Rate | Maturity Date | Principal Amount (000) | ||||||||||||
| FLOATING RATE LOANS(f) 80.04% | ||||||||||||||
| Aerospace 5.09% | ||||||||||||||
| AAdvantage Loyalty IP Ltd. 2021 Term Loan | 5.50% (3 Mo. LIBOR + 4.75% | ) | 4/20/2028 | $ | 41,921 | 43,152,432 | ||||||||
| Air Canada 2021 Term Loan B (Canada)(c) | 4.25% (3 Mo. LIBOR + 3.50% | ) | 8/11/2028 | 19,139 | 19,063,705 | |||||||||
| Alloy Finco Limited 2020 USD Term Loan B2 (Jersey)(c) | 8.50% (3 Mo. LIBOR + 6.50% | ) | 3/6/2024 | 7,148 | 7,152,291 | |||||||||
| Alloy Finco Limited USD Holdco Term Loan PIK 13.50% (Jersey)(c) | 0.50% | 3/6/2025 | 15,859 | 15,888,945 | ||||||||||
| Amentum Government Services Holdings LLC 2020 Term Loan B | 5.50% (3 Mo. LIBOR + 4.75% | ) | 1/29/2027 | 13,074 | 13,083,626 | |||||||||
| Amentum Government Services Holdings LLC Term Loan B | 3.59% (1 Mo. LIBOR + 3.50% | ) | 1/29/2027 | 7,224 | 7,169,587 | |||||||||
| Arcline FM Holdings, LLC 2021 1st Lien Term Loan | 5.50% (3 Mo. LIBOR + 4.75% | ) | 6/23/2028 | 20,570 | 20,512,588 | |||||||||
| Atlas CC Acquisition Corp Term Loan B | 5.00% (3 Mo. LIBOR + 4.25% | ) | 5/25/2028 | 20,086 | 20,137,835 | |||||||||
| Atlas CC Acquisition Corp Term Loan C | 5.00% (3 Mo. LIBOR + 4.25% | ) | 5/25/2028 | 4,085 | 4,095,831 | |||||||||
| Bleriot US Bidco, Inc. 2021 Term Loan B | 4.132% (3 Mo. LIBOR + 4.00% | ) | 10/31/2026 | 9,414 | 9,414,792 | |||||||||
| See Notes to Financial Statements. | 143 |
Schedule of Investments (continued)
FLOATING RATE FUND November 30, 2021
| Investments | Interest Rate | Maturity Date | Principal Amount (000) | Fair Value | |||||||||
| Aerospace (continued) | |||||||||||||
| Cobham Ultra SeniorCo. S.a.r.l USD Term Loan B (Luxembourg)(c) | – | (g) | 11/16/2028 | $ | 15,579 | $ | 15,560,022 | ||||||
| Jazz Acquisition, Inc. 2019 1st Lien Term Loan | 4.34% (1 Mo. LIBOR + 4.25% | ) | 6/19/2026 | 14,094 | 13,839,772 | ||||||||
| Jazz Acquisition, Inc. 2019 2nd Lien Term Loan | 8.09% (1 Mo. LIBOR + 8.00% | ) | 6/18/2027 | 5,291 | 4,834,997 | ||||||||
| Kestrel Bidco Inc. Term Loan B (Canada)(c) | 4.00% (6 Mo. LIBOR + 3.00% | ) | 12/11/2026 | 13,000 | 12,626,457 | ||||||||
| KKR Apple Bidco, LLC 2021 2nd Lien Term Loan | 6.25% (1 Mo. LIBOR + 5.75% | ) | 9/21/2029 | 1,436 | 1,455,154 | ||||||||
| KKR Apple Bidco, LLC 2021 Term Loan | 3.50% (1 Mo. LIBOR + 3.00% | ) | 9/22/2028 | 12,436 | 12,353,478 | ||||||||
| MHI Holdings, LLC Term Loan B | 5.092% (1 Mo. LIBOR + 5.00% | ) | 9/21/2026 | 20,215 | 20,272,239 | ||||||||
| Mileage Plus Holdings LLC 2020 Term Loan B | 6.25% (3 Mo. LIBOR + 5.25% | ) | 6/21/2027 | 10,398 | 10,896,879 | ||||||||
| Peraton Corp. 2nd Lien Term Loan B1 | 8.50% (1 Mo. LIBOR + 7.75% | ) | 2/1/2029 | 4,783 | 4,859,150 | ||||||||
| Peraton Corp. Term Loan B | 4.50% (1 Mo. LIBOR + 3.75% | ) | 2/1/2028 | 33,260 | 33,224,041 | ||||||||
| Spirit Aerosystems, Inc. 2021 Term Loan B | – | (g) | 1/15/2025 | 8,022 | 8,029,672 | ||||||||
| United Airlines, Inc. 2021 Term Loan B | 4.50% (3 Mo. LIBOR + 3.75% | ) | 4/21/2028 | 34,875 | 34,884,425 | ||||||||
| WP CPP Holdings, LLC 2018 2nd Lien Term Loan | 8.75% (3 Mo. LIBOR + 7.75% | ) | 4/30/2026 | 4,806 | 4,759,546 | ||||||||
| WP CPP Holdings, LLC 2018 Term Loan | 4.75% (1 Mo. LIBOR + 3.75% (3 Mo. LIBOR + 3.75% | ) ) | 4/30/2025 | 14,661 | 14,143,696 | ||||||||
| Total | 351,411,160 | ||||||||||||
| Automotive 1.44% | |||||||||||||
| American Trailer World Corp. Term Loan B | 4.50% (1 Mo. LIBOR + 3.75% | ) | 3/3/2028 | 10,040 | 9,955,891 | ||||||||
| Autokiniton US Holdings, Inc. 2021 Term Loan B | 5.00% (3 Mo. LIBOR + 4.50% | ) | 4/6/2028 | 9,339 | 9,340,364 | ||||||||
| Avis Budget Car Rental, LLC 2020 Term Loan B | 1.85% (1 Mo. LIBOR + 1.75% | ) | 8/6/2027 | 22,031 | 21,638,560 | ||||||||
| Belron Finance US LLC 2018 Term Loan B | 2.438% (3 Mo. LIBOR + 2.25% | ) | 11/13/2025 | 9,735 | 9,637,713 | (h) | |||||||
| Belron Finance US LLC 2019 USD Term Loan B3 | 2.438% (3 Mo. LIBOR + 2.25% | ) | 10/30/2026 | 7,057 | 6,990,951 | ||||||||
| 144 | See Notes to Financial Statements. |
Schedule of Investments (continued)
FLOATING RATE FUND November 30, 2021
| Investments | Interest Rate | Maturity Date | Principal Amount (000) | Fair Value | |||||||||
| Automotive (continued) | |||||||||||||
| Belron Finance US LLC 2021 USD Term Loan B | 3.25% (3 Mo. LIBOR + 2.75% | ) | 4/13/2028 | $ | 6,762 | $ | 6,752,858 | ||||||
| DexKo Global Inc. 2021 USD Delayed Draw Term Loan(i) | 4.25% (1 Mo. LIBOR + 3.75% | ) | 10/4/2028 | 2,292 | 2,277,332 | ||||||||
| DexKo Global Inc. 2021 USD Term Loan B | 4.25% (3 Mo. LIBOR + 3.75% | ) | 10/4/2028 | 12,035 | 11,955,992 | ||||||||
| Mavis Tire Express Services Corp. 2021 Term Loan B | 4.75% (1 Mo. LIBOR + 4.00% | ) | 5/4/2028 | 3,997 | 3,999,764 | ||||||||
| RVR Dealership Holdings, LLC Term Loan B | 4.75% (3 Mo. LIBOR + 4.00% | ) | 2/8/2028 | 17,125 | 17,072,050 | ||||||||
| Total | 99,621,475 | ||||||||||||
| Chemicals 1.17% | |||||||||||||
| Aruba Investments, Inc. 2020 2nd Lien Term Loan | 8.50% (6 Mo. LIBOR + 7.75% | ) | 11/24/2028 | 3,908 | 3,947,238 | ||||||||
| Aruba Investments, Inc. 2020 USD Term Loan | 4.75% (6 Mo. LIBOR + 4.00% | ) | 11/24/2027 | 9,722 | 9,733,685 | ||||||||
| INEOS Styrolution US Holding LLC 2021 USD Term Loan B | 3.25% (1 Mo. LIBOR + 2.75% | ) | 1/29/2026 | 23,022 | 22,989,408 | ||||||||
| Lonza Group AG USD Term Loan B (Switzerland)(c) | 4.75% (6 Mo. LIBOR + 4.00% | ) | 7/3/2028 | 7,496 | 7,501,996 | ||||||||
| LSF11 A5 Holdco LLC Term Loan | 4.25% (3 Mo. LIBOR + 3.75% | ) | 10/15/2028 | 9,109 | 9,071,795 | ||||||||
| Polar US Borrower, LLC 2018 1st Lien Term Loan | 4.75% - 7.00% (Prime Rate + 3.75% (3 Mo. LIBOR + 4.75% | ) ) | 10/15/2025 | 14,133 | 14,138,527 | ||||||||
| Sparta U.S. HoldCo LLC 2021 Term Loan | 4.25% (3 Mo. LIBOR + 3.50% | ) | 8/2/2028 | 9,746 | 9,755,596 | ||||||||
| Starfruit Finco B.V 2018 USD Term Loan B (Netherlands)(c) | 3.092% (1 Mo. LIBOR + 3.00% | ) | 10/1/2025 | 4,113 | 4,067,910 | ||||||||
| Total | 81,206,155 | ||||||||||||
| Consumer Durables 0.14% | |||||||||||||
| Springs Windows Fashions, LLC 2021 Term Loan B | 4.75% (1 Mo. LIBOR + 4.00% | ) | 10/6/2028 | 9,778 | 9,663,786 | ||||||||
| See Notes to Financial Statements. | 145 |
Schedule of Investments (continued)
FLOATING RATE FUND November 30, 2021
| Investments | Interest Rate | Maturity Date | Principal Amount (000) | Fair Value | |||||||||
| Consumer Non-Durables 0.94% | |||||||||||||
| AI Aqua Merger Sub, Inc. 2021 1st Lien Delayed Draw Term Loan | – | (g) | 7/31/2028 | $ | 2,120 | $ | 2,124,142 | ||||||
| AI Aqua Merger Sub, Inc. 2021 1st Lien Term Loan B | 4.50% (1 Mo. LIBOR + 4.00% | ) | 7/31/2028 | 16,958 | 16,993,135 | ||||||||
| Anastasia Parent, LLC 2018 Term Loan B | 3.882% (3 Mo. LIBOR + 3.75% | ) | 8/11/2025 | 23,883 | 20,756,672 | ||||||||
| Pretium PKG Holdings, Inc. 2021 2nd Lien Term Loan | 7.25% (6 Mo. LIBOR + 6.75% | ) | 10/1/2029 | 9,106 | 9,199,568 | ||||||||
| WW International, Inc. 2021 Term Loan B | 4.00% (1 Mo. LIBOR + 3.50% | ) | 4/13/2028 | 16,114 | 15,946,550 | ||||||||
| Total | 65,020,067 | ||||||||||||
| Energy 2.12% | |||||||||||||
| AL NGPL Holdings, LLC Term Loan B | 4.75% (3 Mo. LIBOR + 3.75% | ) | 4/14/2028 | 19,362 | 19,374,106 | ||||||||
| BCP Raptor II, LLC 1st Lien Term Loan | 4.84% (1 Mo. LIBOR + 4.75% | ) | 11/3/2025 | 18,763 | 18,711,088 | ||||||||
| Brazos Delaware II, LLC Term Loan B | 4.091% (1 Mo. LIBOR + 4.00% | ) | 5/21/2025 | 10,501 | 10,271,496 | ||||||||
| CQP Holdco LP 2021 Term Loan B | 4.25% (1 Mo. LIBOR + 3.75% | ) | 6/5/2028 | 22,436 | 22,374,739 | ||||||||
| Freeport LNG Investments, LLLP Term Loan B | – | (g) | 11/17/2028 | 17,952 | 17,814,567 | ||||||||
| ITT Holdings LLC 2021 Term Loan | 3.25% (1 Mo. LIBOR + 2.75% | ) | 7/10/2028 | 6,534 | 6,528,149 | ||||||||
| Medallion Midland Acquisition, LLC 2021 Term Loan | 4.50% (3 Mo. LIBOR + 3.75% | ) | 10/18/2028 | 15,706 | 15,649,044 | ||||||||
| Oryx Midstream Services Permian Basin LLC Term Loan B | 3.75% (3 Mo. LIBOR + 3.25% | ) | 10/5/2028 | 22,285 | 22,109,526 | ||||||||
| Ulterra Drilling Technologies, LP Term Loan B | 5.34% (1 Mo. LIBOR + 5.25% | ) | 11/26/2025 | 14,856 | 13,908,477 | ||||||||
| Total | 146,741,192 | ||||||||||||
| Financial 4.88% | |||||||||||||
| Advisor Group, Inc. 2021 Term Loan | 4.59% (1 Mo. LIBOR + 4.50% | ) | 7/31/2026 | 23,187 | 23,167,642 | ||||||||
| AllSpring Buyer LLC Term Loan B | 3.75% (2 Mo. LIBOR + 3.25% | ) | 11/1/2028 | 17,211 | 17,196,888 | ||||||||
| AqGen Island Holdings, Inc. Term Loan | 4.00% (3 Mo. LIBOR + 3.50% | ) | 8/2/2028 | 19,131 | 19,019,540 | ||||||||
| 146 | See Notes to Financial Statements. |
Schedule of Investments (continued)
FLOATING RATE FUND November 30, 2021
| Investments | Interest Rate | Maturity Date | Principal Amount (000) | Fair Value | |||||||||
| Financial (continued) | |||||||||||||
| Armor Holding II LLC 2021 Term Loan B | – | (g) | 10/29/2028 | $ | 15,592 | $ | 15,646,010 | ||||||
| Asurion LLC 2021 2nd Lien Term Loan B3 | 5.34% (1 Mo. LIBOR + 5.25% | ) | 1/31/2028 | 12,866 | 12,772,429 | ||||||||
| Asurion LLC 2021 Second Lien Term Loan B4 | 5.34% (1 Mo. LIBOR + 5.25% | ) | 1/20/2029 | 24,144 | 23,944,150 | ||||||||
| Claros Mortgage Trust, Inc. Term Loan B | 6.00% (1 Mo. LIBOR + 5.00% | ) | 8/9/2026 | 11,395 | 11,394,813 | ||||||||
| CoreLogic, Inc. Term Loan | 4.00% (1 Mo. LIBOR + 3.50% | ) | 6/2/2028 | 28,236 | 27,953,935 | ||||||||
| Cushman & Wakefield U.S. Borrower, LLC 2020 Term Loan B | 2.84% (1 Mo. LIBOR + 2.75% | ) | 8/21/2025 | 20,183 | 20,067,931 | ||||||||
| Edelman Financial Center, LLC 2018 2nd Lien Term Loan | 6.84% (1 Mo. LIBOR + 6.75% | ) | 7/20/2026 | 2,915 | 2,919,394 | ||||||||
| Edelman Financial Center, LLC 2021 Term Loan B | 4.25% (1 Mo. LIBOR + 3.50% | ) | 4/7/2028 | 26,214 | 26,134,779 | ||||||||
| HighTower Holdings LLC 2021 Term Loan B | 4.75% (3 Mo. LIBOR + 4.00% | ) | 4/21/2028 | 14,469 | 14,463,516 | ||||||||
| Hudson River Trading LLC 2021 Term Loan | 3.09% (1 Mo. LIBOR + 3.00% | ) | 3/20/2028 | 32,352 | 32,085,154 | ||||||||
| Jane Street Group, LLC 2021 Term Loan | 2.84% (1 Mo. LIBOR + 2.75% | ) | 1/26/2028 | 26,667 | 26,386,928 | ||||||||
| Minotaur Acquisition, Inc. Term Loan B | 4.84% (1 Mo. LIBOR + 4.75% | ) | 3/27/2026 | 24,325 | 24,184,955 | ||||||||
| NEXUS Buyer LLC 2021 Second Lien Term Loan | 6.75% (3 Mo. LIBOR + 6.25% | ) | 10/29/2029 | 11,430 | 11,444,706 | ||||||||
| OneDigital Borrower LLC 2020 Term Loan | 5.25% (3 Mo. LIBOR + 4.50% | ) | 11/16/2027 | 18,434 | 18,391,912 | ||||||||
| Walker & Dunlop, Inc. 2021 Term Loan | – | (g) | 10/13/2028 | 9,542 | 9,559,458 | ||||||||
| Total | 336,734,140 | ||||||||||||
| Food/Tobacco 1.06% | |||||||||||||
| City Brewing Company, LLC Closing Date Term Loan | 4.25% (3 Mo. LIBOR + 3.50% | ) | 4/5/2028 | 8,889 | 8,795,898 | ||||||||
| Flynn Restaurant Group LP 1st Lien Term Loan | 3.59% (1 Mo. LIBOR + 3.50% | ) | 6/27/2025 | 3,890 | 3,863,529 | ||||||||
| Flynn Restaurant Group LP 2nd Lien Term Loan | 9.25% (3 Mo. LIBOR + 6.00% | ) | 6/29/2026 | 6,148 | 6,086,197 | ||||||||
| Miller’s Ale House, Inc. 2018 Term Loan | 4.841% (1 Mo. LIBOR + 4.75% | ) | 5/30/2025 | 10,724 | 10,449,584 | ||||||||
| See Notes to Financial Statements. | 147 |
Schedule of Investments (continued)
FLOATING RATE FUND November 30, 2021
| Investments | Interest Rate | Maturity Date | Principal Amount (000) | Fair Value | |||||||||
| Food/Tobacco (continued) | |||||||||||||
| NPC International, Inc. 2nd Lien Term Loan(j) | – | (g) | 4/18/2025 | $ | 9,531 | $ | 190,620 | (h) | |||||
| Panera Bread Company Term Loan A | 2.375% (1 Mo. LIBOR + 2.25% | ) | 7/18/2022 | 12,049 | 11,928,675 | ||||||||
| Pretium PKG Holdings, Inc. 2021 1st Lien Term Loan | 4.50% (6 Mo. LIBOR + 4.00% | ) | 10/2/2028 | 11,462 | 11,442,504 | ||||||||
| Proampac PG Borrower LLC 2020 Term Loan | 4.50% - 6.00% (Prime Rate + 2.75% (3 Mo. LIBOR + 3.75% | ) ) | 11/3/2025 | 13,620 | 13,586,328 | ||||||||
| Triton Water Holdings, Inc Term Loan (Spain)(c) | 4.00% (3 Mo. LIBOR + 3.50% | ) | 3/31/2028 | 6,627 | 6,607,974 | ||||||||
| Total | 72,951,309 | ||||||||||||
| Gaming/Leisure 6.16% | |||||||||||||
| AVSC Holding Corp. 2018 2nd Lien Term Loan | 8.25% (6 Mo. LIBOR + 7.25% | ) | 9/1/2025 | 5,525 | 4,496,123 | ||||||||
| AVSC Holding Corp. 2020 Term Loan B1 | – | (g) | 3/3/2025 | 6,814 | 6,213,965 | ||||||||
| Caesars Resort Collection, LLC 2017 1st Lien Term Loan B | 2.84% (1 Mo. LIBOR + 2.75% | ) | 12/23/2024 | 26,548 | 26,319,007 | ||||||||
| Carnival Corporation 2021 Incremental Term Loan B | 4.00% (6 Mo. LIBOR + 3.25% | ) | 10/18/2028 | 15,083 | 14,875,571 | ||||||||
| Carnival Corporation USD Term Loan B | 3.75% (1 Mo. LIBOR + 3.00% | ) | 6/30/2025 | 19,241 | 19,014,833 | ||||||||
| City Football Group Limited Term Loan (United Kingdom)(c) | 4.00% (6 Mo. LIBOR + 3.50% | ) | 7/21/2028 | 16,415 | 16,332,710 | ||||||||
| ECL Entertainment, LLC Term Loan | 8.25% (1 Mo. LIBOR + 7.50% | ) | 3/31/2028 | 7,049 | 7,201,774 | ||||||||
| Equinox Holdings, Inc. 2017 1st Lien Term Loan | 4.00% (3 Mo. LIBOR + 3.00% | ) | 3/8/2024 | 5,974 | 5,698,390 | ||||||||
| Equinox Holdings, Inc. 2017 2nd Lien Term Loan | 8.00% (3 Mo. LIBOR + 7.00% | ) | 9/6/2024 | 7,044 | 6,357,645 | ||||||||
| Equinox Holdings, Inc. 2020 Term Loan B2 | 10.00% (3 Mo. LIBOR + 9.00% | ) | 3/8/2024 | 4,667 | 4,713,830 | (h) | |||||||
| Hilton Grand Vacations Borrower LLC 2021 Term Loan B | 3.50% (1 Mo. LIBOR + 3.00% | ) | 8/2/2028 | 16,915 | 16,800,954 | ||||||||
| Hoya Midco, LLC 2017 1st Lien Term Loan | 4.50% (1 Mo. LIBOR + 3.50% | ) | 6/30/2024 | 11,241 | 11,255,045 | ||||||||
| 148 | See Notes to Financial Statements. |
Schedule of Investments (continued)
FLOATING RATE FUND November 30, 2021
| Investments | Interest Rate | Maturity Date | Principal Amount (000) | Fair Value | |||||||||
| Gaming/Leisure (continued) | |||||||||||||
| Kingpin Intermediate Holdings LLC 2018 Term Loan B | 4.50% (1 Mo. LIBOR + 3.50% | ) | 7/3/2024 | $ | 19,734 | $ | 19,635,407 | ||||||
| Life Time Fitness, Inc. 2017 Term Loan B | – | (g) | 6/10/2022 | – | (k) | 6 | |||||||
| Life Time Fitness, Inc. 2021 Term Loan B | 5.75% (3 Mo. LIBOR + 4.75% | ) | 12/16/2024 | 5,422 | 5,472,832 | ||||||||
| Lucid Energy Group II Borrower, LLC 2021 Term Loan | – | (g) | 11/24/2028 | 28,380 | 27,989,286 | ||||||||
| Lucky Bucks, LLC Term Loan | 6.25% (3 Mo. LIBOR + 5.50% | ) | 7/30/2027 | 13,373 | 13,139,321 | ||||||||
| NASCAR Holdings, Inc Term Loan B | 2.59% (1 Mo. LIBOR + 2.50% | ) | 10/19/2026 | 13,977 | 13,835,275 | ||||||||
| PCI Gaming Authority Term Loan | 2.59% (1 Mo. LIBOR + 2.50% | ) | 5/29/2026 | 11,625 | 11,540,866 | ||||||||
| PUG LLC USD Term Loan | 3.59% (1 Mo. LIBOR + 3.50% | ) | 2/12/2027 | 23,133 | 22,786,429 | ||||||||
| Raptor Acquisition Corp. 2021 Term Loan (Canada)(c) | 4.75% (3 Mo. LIBOR + 4.00% | ) | 11/1/2026 | 16,820 | 16,812,491 | ||||||||
| Sabre GLBL Inc. 2021 Term Loan B1 | 4.00% (1 Mo. LIBOR + 3.50% | ) | 12/17/2027 | 6,351 | 6,267,859 | ||||||||
| Sabre GLBL Inc. 2021 Term Loan B2 | 4.00% (1 Mo. LIBOR + 3.50% | ) | 12/17/2027 | 10,124 | 9,991,339 | ||||||||
| Scientific Games International, Inc. 2018 Term Loan B5 | 2.84% (1 Mo. LIBOR + 2.75% | ) | 8/14/2024 | 21,188 | 21,060,332 | ||||||||
| Silk Bidco AS EUR Term Loan B(d) | 4.00% (6 Mo. EURIBOR + 4.00% | ) | 2/24/2025 | EUR | 15,423 | 16,421,639 | |||||||
| Spectacle Gary Holdings LLC 2021 Term Loan B | – | (g) | 11/19/2028 | $ | 14,275 | 14,292,571 | (h) | ||||||
| Spectacle Gary Holdings LLC Delayed Draw Term Loan | 11.00% (1 Mo. LIBOR + 9.00% | ) | 12/23/2025 | 721 | 787,825 | ||||||||
| Spectacle Gary Holdings LLC Term Loan B | 11.00% (1 Mo. LIBOR + 9.00% | ) | 12/23/2025 | 9,944 | 10,871,992 | ||||||||
| The Enterprise Development Authority Term Loan B | 5.00% (1 Mo. LIBOR + 4.25% | ) | 2/18/2028 | 9,478 | 9,513,162 | ||||||||
| Travel Leaders Group, LLC 2018 Term Loan B | 4.09% (1 Mo. LIBOR + 4.00% | ) | 1/25/2024 | 12,568 | 11,782,299 | ||||||||
| Twin River Worldwide Holdings, Inc. 2021 Term Loan B | 3.75% (6 Mo. LIBOR + 3.25% | ) | 8/6/2028 | 23,911 | 23,821,659 | ||||||||
| See Notes to Financial Statements. | 149 |
Schedule of Investments (continued)
FLOATING RATE FUND November 30, 2021
| Investments | Interest Rate | Maturity Date | Principal Amount (000) | Fair Value | |||||||||
| Gaming/Leisure (continued) | |||||||||||||
| UFC Holdings, LLC 2021 Term Loan B | 3.50% (6 Mo. LIBOR + 2.75% | ) | 4/29/2026 | $ | 10,855 | $ | 10,712,941 | ||||||
| United PF Holdings, LLC 2019 1st Lien Term Loan | 4.132% (3 Mo. LIBOR + 4.00% | ) | 12/30/2026 | 16,084 | 15,574,291 | ||||||||
| United PF Holdings, LLC 2019 2nd Lien Term Loan | 8.632% (3 Mo. LIBOR + 8.50% | ) | 12/30/2027 | 4,000 | 4,000,000 | ||||||||
| Total | 425,589,669 | ||||||||||||
| Healthcare 15.38% | |||||||||||||
| ADMI Corp. 2021 Incremental Term Loan B3 | 4.00% (1 Mo. LIBOR + 3.50% | ) | 12/23/2027 | 4,675 | 4,657,949 | ||||||||
| ADMI Corp. 2021 Term Loan B2 | 3.875% (1 Mo. LIBOR + 3.38% | ) | 12/23/2027 | 17,461 | 17,224,540 | ||||||||
| AEA International Holdings S.a.r.l. Term Loan B (Luxembourg)(c) | 4.25% (3 Mo. LIBOR + 3.75% | ) | 9/7/2028 | 14,347 | 14,394,571 | ||||||||
| Air Methods Corporation 2017 Term Loan B | 4.50% (3 Mo. LIBOR + 3.50% | ) | 4/22/2024 | 6,500 | 6,234,573 | ||||||||
| Amneal Pharmaceuticals LLC 2018 Term Loan B | 3.625% (1 Mo. LIBOR + 3.50% | ) | 5/4/2025 | 27,579 | 27,114,207 | ||||||||
| Athenahealth, Inc. 2021 Term Loan B1 | 4.339% - 4.40% (1 Mo. LIBOR + 4.25% (3 Mo. LIBOR + 4.25% | ) ) | 2/11/2026 | 17,774 | 17,780,368 | ||||||||
| Bausch Health Companies Inc. Term Loan B (Canada)(c) | 2.84% (1 Mo. LIBOR + 2.75% | ) | 11/27/2025 | 10,321 | 10,218,901 | ||||||||
| Cano Health LLC Term Loan | 5.25% (3 Mo. LIBOR + 4.50% | ) | 11/23/2027 | 13,772 | 13,796,274 | ||||||||
| Canopy Growth Corporation Term Loan (Canada)(c) | 9.50% (6 Mo. LIBOR + 8.50% | ) | 3/18/2026 | 8,737 | 9,206,144 | ||||||||
| CCRR Parent, Inc Term Loan B | 4.50% (3 Mo. LIBOR + 3.75% | ) | 3/6/2028 | 8,217 | 8,196,044 | ||||||||
| CHG Healthcare Services Inc. 2021 Term Loan | 4.00% (3 Mo. LIBOR + 3.50% | ) | 9/29/2028 | 14,327 | 14,277,768 | ||||||||
| CNT Holdings I Corp 2020 2nd Lien Term Loan | 7.50% (6 Mo. LIBOR + 6.75% | ) | 11/6/2028 | 5,864 | 5,911,768 | ||||||||
| CNT Holdings I Corp 2020 Term Loan | 4.50% (6 Mo. LIBOR + 3.75% | ) | 11/8/2027 | 14,583 | 14,574,831 | ||||||||
| Da Vinci Purchaser Corp. 2019 Term Loan | 5.00% (2 Mo. LIBOR + 4.00% | ) | 1/8/2027 | 24,889 | 24,943,482 | ||||||||
| Dedalus Finance GmbH 2021 EUR Term Loan B2(d) | 3.75% (3 Mo. EURIBOR + 3.75% | ) | 5/4/2027 | EUR | 10,667 | 12,079,397 | |||||||
| 150 | See Notes to Financial Statements. |
Schedule of Investments (continued)
FLOATING RATE FUND November 30, 2021
| Investments | Interest Rate | Maturity Date | Principal Amount (000) | Fair Value | |||||||||
| Healthcare (continued) | |||||||||||||
| Electron BidCo Inc. 2021 Term Loan | 3.75% (3 Mo. LIBOR + 3.25% | ) | 11/1/2028 | $ | 7,022 | $ | 6,993,864 | ||||||
| Emerald TopCo, Inc. Term Loan | 3.59% - 3.63% (1 Mo. LIBOR + 3.50% (3 Mo. LIBOR + 3.50% | ) ) | 7/24/2026 | 18,326 | 18,165,771 | ||||||||
| eResearchTechnology, Inc. 2020 1st Lien Term Loan | 5.50% (1 Mo. LIBOR + 4.50% | ) | 2/4/2027 | 13,664 | 13,692,056 | ||||||||
| EyeCare Partners, LLC 2020 Term Loan | 3.882% (3 Mo. LIBOR + 3.75% | ) | 2/18/2027 | 21,774 | 21,550,573 | ||||||||
| EyeCare Partners, LLC 2021 Delayed Draw Term Loan(i) | – | (g) | 11/15/2028 | 2,315 | 2,308,660 | ||||||||
| EyeCare Partners, LLC 2021 Incremental Term Loan | 4.25% (1 Mo. LIBOR + 3.75% | ) | 11/15/2028 | 9,260 | 9,234,627 | ||||||||
| Gainwell Acquisition Corp. Term Loan B | 4.75% (3 Mo. LIBOR + 4.00% | ) | 10/1/2027 | 31,086 | 31,105,531 | ||||||||
| Global Medical Response, Inc. 2017 Incremental Term Loan | 5.25% (6 Mo. LIBOR + 4.25% | ) | 3/14/2025 | 2,930 | 2,912,969 | ||||||||
| Global Medical Response, Inc. 2020 Term Loan B | 5.25% (3 Mo. LIBOR + 4.25% | ) | 10/2/2025 | 20,695 | 20,591,163 | ||||||||
| Horizon Therapeutics USA Inc. 2021 Term Loan B | 2.50% (1 Mo. LIBOR + 2.00% | ) | 3/15/2028 | 24,662 | 24,558,673 | ||||||||
| Hunter Holdco 3 Limited USD Term Loan B (United Kingdom)(c) | 4.75% (3 Mo. LIBOR + 4.25% | ) | 8/19/2028 | 23,911 | 23,956,278 | ||||||||
| ICON Luxembourg S.A.R.L. LUX Term Loan (Luxembourg)(c) | 3.00% (3 Mo. LIBOR + 2.50% | ) | 7/3/2028 | 57,562 | 57,454,061 | ||||||||
| ICON Luxembourg S.A.R.L. US Term Loan | 3.00% (3 Mo. LIBOR + 2.50% | ) | 7/3/2028 | 14,342 | 14,314,714 | ||||||||
| Insulet Corporation Term Loan B | 3.75% (1 Mo. LIBOR + 3.25% | ) | 5/4/2028 | 10,635 | 10,642,185 | ||||||||
| Jazz Financing Lux S.a.r.l. USD Term Loan (Luxembourg)(c) | 4.00% (1 Mo. LIBOR + 3.50% | ) | 5/5/2028 | 33,868 | 33,847,069 | ||||||||
| Kindred Healthcare LLC 2018 1st Lien Term Loan | 4.625% (1 Mo. LIBOR + 4.50% | ) | 7/2/2025 | 12,208 | 12,210,733 | ||||||||
| LSCS Holdings, Inc. 2021 1st Lien Term Loan | – | (g) | 11/23/2028 | 14,625 | 14,619,184 | ||||||||
| Maravai Intermediate Holdings, LLC 2020 Term Loan B | 4.75% (1 Mo. LIBOR + 3.75% | ) | 10/19/2027 | 6,662 | 6,666,336 | ||||||||
| See Notes to Financial Statements. | 151 |
Schedule of Investments (continued)
FLOATING RATE FUND November 30, 2021
| Investments | Interest Rate | Maturity Date | Principal Amount (000) | Fair Value | |||||||||
| Healthcare (continued) | |||||||||||||
| MDVIP, Inc. 2021 Term Loan | 4.25% (1 Mo. LIBOR + 3.75% | ) | 10/16/2028 | $ | 9,551 | $ | 9,543,319 | ||||||
| MED ParentCo LP 1st Lien Term Loan | 4.34% (1 Mo. LIBOR + 4.25% | ) | 8/31/2026 | 24,636 | 24,576,049 | ||||||||
| MedAssets Software Intermediate Holdings, Inc. 2021 1st Lien Term Loan | 4.50% (3 Mo. LIBOR + 3.75% | ) | 1/28/2028 | 11,667 | 11,683,080 | ||||||||
| MedAssets Software Intermediate Holdings, Inc. 2021 Term Loan | – | (g) | 11/17/2028 | 14,988 | 14,913,522 | ||||||||
| Medical Solutions L.L.C. 2021 2nd Lien Term Loan | 7.50% (3 Mo. LIBOR + 7.00% | ) | 11/1/2029 | 8,000 | 8,146,680 | ||||||||
| Medical Solutions L.L.C. 2021 Delayed Draw Term Loan(i) | – | (g) | 11/1/2028 | 1,656 | 1,649,227 | ||||||||
| Medical Solutions L.L.C. 2021 First Lien Term Loan | 4.00% (3 Mo. LIBOR + 3.50% | ) | 11/1/2028 | 8,696 | 8,658,416 | ||||||||
| Medline Industries, Inc. USD Term Loan B | 3.75% (1 Mo. LIBOR + 3.25% | ) | 10/23/2028 | 38,202 | 38,115,215 | ||||||||
| MedRisk, Inc. 2021 Term Loan B | 4.50% (1 Mo. LIBOR + 3.75% | ) | 5/10/2028 | 16,599 | 16,576,681 | ||||||||
| National Mentor Holdings, Inc. 2021 2nd Lien Term Loan | 8.00% (3 Mo. LIBOR + 7.25% | ) | 3/2/2029 | 5,832 | 5,832,027 | ||||||||
| Navicure, Inc. 2019 Term Loan B | 4.09% (1 Mo. LIBOR + 4.00% | ) | 10/22/2026 | 20,074 | 20,074,387 | ||||||||
| Option Care Health, Inc. 2021 Term Loan B | 3.25% (1 Mo. LIBOR + 2.75% | ) | 10/27/2028 | 10,483 | 10,461,319 | ||||||||
| Organon & Co USD Term Loan | 3.50% (3 Mo. LIBOR + 3.00% | ) | 6/2/2028 | 24,214 | 24,180,949 | ||||||||
| Pacific Dental Services,LLC 2021 Term Loan | 4.00% (1 Mo. LIBOR + 3.25% | ) | 5/5/2028 | 12,578 | 12,567,847 | ||||||||
| Packaging Coordinators Midco, Inc. 2020 1st Lien Term Loan | 4.25% (3 Mo. LIBOR + 3.50% | ) | 11/30/2027 | 24,249 | 24,215,772 | ||||||||
| Parexel International Corporation 2021 1st Lien Term Loan | – | (g) | 11/15/2028 | 33,467 | 33,377,745 | ||||||||
| Pathway Vet Alliance LLC 2021 Term Loan | 3.84% (1 Mo. LIBOR + 3.75% | ) | 3/31/2027 | 21,206 | 21,105,428 | ||||||||
| Press Ganey Holdings, Inc. 2021 Term Loan B | 4.50% (1 Mo. LIBOR + 3.75% (3 Mo. LIBOR + 3.75% | ) ) | 7/24/2026 | 2,901 | 2,898,749 | ||||||||
| 152 | See Notes to Financial Statements. |
Schedule of Investments (continued)
FLOATING RATE FUND November 30, 2021
| Investments | Interest Rate | Maturity Date | Principal Amount (000) | Fair Value | |||||||||
| Healthcare (continued) | |||||||||||||
| RegionalCare Hospital Partners Holdings, Inc. 2018 Term Loan B | 3.842% (1 Mo. LIBOR + 3.75% | ) | 11/16/2025 | $ | 20,373 | $ | 20,232,137 | ||||||
| Revint Intermediate II, LLC 2020 Term Loan B | 4.75% (1 Mo. LIBOR + 4.25% | ) | 10/15/2027 | 11,667 | 11,681,615 | ||||||||
| SCP Eye Care Services, LLC 2021 Delayed Draw Term Loan(i) | 4.50% (3 Mo. LIBOR + 4.50% | ) | 3/16/2028 | 1,493 | 1,492,684 | ||||||||
| SCP Eye Care Services, LLC 2021 Term Loan | 5.25% (6 Mo. LIBOR + 4.50% | ) | 3/16/2028 | 8,590 | 8,590,079 | ||||||||
| Select Medical Corporation 2017 Term Loan B | 2.35% (1 Mo. LIBOR + 2.25% | ) | 3/6/2025 | 10,229 | 10,154,507 | ||||||||
| Southern Veterinary Partners, LLC Delayed Draw Term Loan | 5.00% (6 Mo. LIBOR + 4.00% | ) | 10/5/2027 | 1,638 | 1,642,145 | ||||||||
| Southern Veterinary Partners, LLC Term Loan | 5.00% (3 Mo. LIBOR + 4.00% | ) | 10/5/2027 | 16,566 | 16,612,843 | ||||||||
| Summit Behavioral Healthcare LLC 1st Lien Term Loan | 5.50% (3 Mo. LIBOR + 4.75% | ) | 11/8/2028 | 14,292 | 14,005,860 | ||||||||
| Sunshine Luxembourg VII SARL 2021 Term Loan B3 (Luxembourg)(c) | 4.50% (3 Mo. LIBOR + 3.75% | ) | 10/1/2026 | 10,538 | 10,518,483 | ||||||||
| Surgery Center Holdings, Inc. 2021 Term Loan | 4.50% (1 Mo. LIBOR + 3.75% | ) | 8/31/2026 | 22,862 | 22,806,001 | ||||||||
| Team Health Holdings, Inc. 1st Lien Term Loan | 3.75% (1 Mo. LIBOR + 2.75% | ) | 2/6/2024 | 13,250 | 12,620,794 | ||||||||
| Unified Physician Management, LLC 2020 Term Loan | 5.00% (1 Mo. LIBOR + 4.25% | ) | 12/16/2027 | 13,543 | 13,519,460 | ||||||||
| Verscend Holding Corp. 2021 Term Loan B | 4.09% (1 Mo. LIBOR + 4.00% | ) | 8/27/2025 | 18,253 | 18,251,081 | ||||||||
| Wellpath Holdings, Inc. 2018 1st Lien Term Loan | 5.59% - 5.63% (1 Mo. LIBOR + 5.50% (3 Mo. LIBOR + 5.50% | ) ) | 10/1/2025 | 23,687 | 23,357,925 | ||||||||
| Western Dental Services Inc. 2021 Delayed Draw Term Loan(i) | 5.25% (1 Mo. LIBOR + 4.50% | ) | 8/18/2028 | 1,328 | 1,326,141 | ||||||||
| Western Dental Services Inc. 2021 Term Loan B | 5.25% (1 Mo. LIBOR + 4.50% | ) | 8/18/2028 | 13,015 | 12,996,176 | ||||||||
| See Notes to Financial Statements. | 153 |
Schedule of Investments (continued)
FLOATING RATE FUND November 30, 2021
| Investments | Interest Rate | Maturity Date | Principal Amount (000) | Fair Value | |||||||||
| Healthcare (continued) | |||||||||||||
| WP CityMD Bidco LLC 2021 Term Loan B | 4.50% (6 Mo. LIBOR + 3.75% | ) | 8/13/2026 | $ | 37,834 | $ | 37,723,451 | ||||||
| Zelis Healthcare Corporation 2021 Term Loan | 3.586% (1 Mo. LIBOR + 3.50% | ) | 9/30/2026 | 10,521 | 10,412,333 | ||||||||
| Total | 1,061,955,391 | ||||||||||||
| Housing 1.89% | |||||||||||||
| ACProducts, Inc. 2021 Term Loan B | 4.75% (3 Mo. LIBOR + 4.25% | ) | 5/17/2028 | 19,892 | 19,693,524 | ||||||||
| Foundation Building Materials Holding Company LLC 2021 Term Loan | – | (g) | 2/3/2028 | 11,191 | 11,077,325 | ||||||||
| Groupe Solmax Inc. Term Loan (Canada)(c) | 5.50% (2 Mo. LIBOR + 4.75% (3 Mo. LIBOR + 4.75% | ) ) | 5/29/2028 | 14,352 | 14,333,881 | ||||||||
| GYP Holdings III Corp. 2021 Term Loan B | – | (g) | 6/1/2025 | 4,786 | 4,765,836 | ||||||||
| LBM Acquisition LLC 2021 Incremental Delayed Draw Term Loan B2(i) | – | (g) | 12/17/2027 | 4,801 | 4,734,722 | ||||||||
| LBM Acquisition LLC 2021 Incremental Term Loan B2 | 3.879% (3 Mo. LIBOR + 3.75% | ) | 12/17/2027 | 9,578 | 9,445,710 | ||||||||
| LBM Acquisition LLC Term Loan B | 4.50% (1 Mo. LIBOR + 3.75% | ) | 12/17/2027 | 3,092 | 3,049,577 | ||||||||
| MI Windows and Doors, LLC 2020 Term Loan | 4.50% (1 Mo. LIBOR + 3.75% | ) | 12/18/2027 | 9,681 | 9,672,653 | ||||||||
| Park River Holdings, Inc. Term Loan | 4.00% (3 Mo. LIBOR + 3.25% | ) | 12/28/2027 | 10,090 | 10,017,321 | ||||||||
| Quikrete Holdings, Inc. 2016 1st Lien Term Loan | 2.59% (1 Mo. LIBOR + 2.50% | ) | 2/1/2027 | 5,964 | 5,900,992 | ||||||||
| Quikrete Holdings, Inc. 2021 Term Loan B1 | – | (g) | 6/11/2028 | 28,842 | 28,684,053 | ||||||||
| White Cap Buyer LLC Term Loan B | – | (g) | 10/19/2027 | 9,512 | 9,496,259 | ||||||||
| Total | 130,871,853 | ||||||||||||
| Information Technology 14.48% | |||||||||||||
| Adevinta ASA USD Term Loan B (Norway)(c) | 3.75% (3 Mo. LIBOR + 3.00% | ) | 6/26/2028 | 11,698 | 11,696,074 | ||||||||
| AP Core Holdings, II LLC Amortization Term Loan B1 | 6.25% (1 Mo. LIBOR + 5.50% | ) | 9/1/2027 | 9,672 | 9,661,008 | ||||||||
| AP Core Holdings, II LLC High-Yield Term Loan B2 | 6.25% (1 Mo. LIBOR + 5.50% | ) | 9/1/2027 | 7,180 | 7,174,418 | ||||||||
| Apttus Corporation 2021 Term Loan | 5.00% (3 Mo. LIBOR + 4.25% | ) | 5/8/2028 | 19,219 | 19,206,489 | ||||||||
| 154 | See Notes to Financial Statements. |
Schedule of Investments (continued)
FLOATING RATE FUND November 30, 2021
| Investments | Interest Rate | Maturity Date | Principal Amount (000) | Fair Value | |||||||||
| Information Technology (continued) | |||||||||||||
| Arches Buyer Inc. 2021 Term Loan B | 3.75% (1 Mo. LIBOR + 3.25% | ) | 12/6/2027 | $ | 23,681 | $ | 23,503,041 | ||||||
| Ascend Learning, LLC 2021 Term Loan | – | (g) | 11/18/2028 | 19,035 | 18,951,792 | ||||||||
| Banff Merger Sub Inc 2021 USD 2nd Lien Term Loan | 6.00% (3 Mo. LIBOR + 5.50% | ) | 2/27/2026 | 7,139 | 7,220,860 | ||||||||
| Banff Merger Sub Inc 2021 USD Term Loan | 3.882% (3 Mo. LIBOR + 3.75% | ) | 10/2/2025 | 21,932 | 21,737,042 | ||||||||
| Barracuda Networks, Inc. 2020 2nd Lien Term Loan | 7.50% (3 Mo. LIBOR + 6.75% | ) | 10/30/2028 | 9,772 | 9,903,718 | ||||||||
| Brooks Automation, Inc. 2021 2nd Lien Term Loan | – | (g) | 11/4/2029 | 5,037 | 5,055,812 | ||||||||
| Brooks Automation, Inc. 2021 Term Loan | – | (g) | 11/17/2028 | 18,972 | 18,883,311 | ||||||||
| Castle US Holding Corporation USD Term Loan B | 3.882% (3 Mo. LIBOR + 3.75% | ) | 1/29/2027 | 7,204 | 7,126,301 | ||||||||
| Cloudera, Inc. 2021 Second Lien Term Loan | 6.50% (1 Mo. LIBOR + 6.00% | ) | 10/8/2029 | 8,998 | 9,020,495 | ||||||||
| Cloudera, Inc. 2021 Term Loan | 4.25% (1 Mo. LIBOR + 3.75% | ) | 10/8/2028 | 24,189 | 24,053,535 | ||||||||
| Cologix, Inc. 2021 Term Loan B | 4.50% (1 Mo. LIBOR + 3.75% | ) | 5/1/2028 | 12,106 | 12,123,958 | ||||||||
| ConnectWise, LLC 2021 Term Loan B | 4.00% (3 Mo. LIBOR + 3.50% | ) | 9/29/2028 | 16,715 | 16,607,227 | ||||||||
| Constant Contact, Inc. Second Lien Term Loan | 8.25% (6 Mo. LIBOR + 7.50% | ) | 2/12/2029 | 8,000 | 7,920,000 | ||||||||
| Constant Contact, Inc. Term Loan | 4.75% (3 Mo. LIBOR + 4.00% | ) | 2/10/2028 | 14,326 | 14,281,269 | ||||||||
| Cornerstone OnDemand, Inc. 2021 Term Loan | 4.25% (3 Mo. LIBOR + 3.75% | ) | 10/16/2028 | 33,430 | 33,312,135 | ||||||||
| Cyxtera DC Holdings, Inc. Term Loan B | 4.00% (6 Mo. LIBOR + 3.00% | ) | 5/1/2024 | 13,531 | 13,479,770 | ||||||||
| Delta TopCo, Inc. 2020 2nd Lien Term Loan | 8.00% (3 Mo. LIBOR + 7.25% | ) | 12/1/2028 | 5,429 | 5,482,943 | ||||||||
| Delta TopCo, Inc. 2020 Term Loan B | 4.50% (3 Mo. LIBOR + 3.75% | ) | 12/1/2027 | 12,964 | 12,946,050 | ||||||||
| ECI Macola Max Holdings LLC 2020 Term Loan | 4.50% (3 Mo. LIBOR + 3.75% | ) | 11/9/2027 | 14,547 | 14,533,545 | ||||||||
| Endure Digital Inc. Term Loan | 4.25% (6 Mo. LIBOR + 3.50% | ) | 2/10/2028 | 15,721 | 15,436,160 | ||||||||
| Ensono, LP 2021 Term Loan | 4.75% (1 Mo. LIBOR + 4.00% | ) | 5/19/2028 | 16,109 | 16,079,041 | ||||||||
| See Notes to Financial Statements. | 155 |
Schedule of Investments (continued)
FLOATING RATE FUND November 30, 2021
| Investments | Interest Rate | Maturity Date | Principal Amount (000) | Fair Value | |||||||||
| Information Technology (continued) | |||||||||||||
| Epicor Software Corporation 2020 2nd Lien Term Loan | 8.75% (1 Mo. LIBOR + 7.75% | ) | 7/31/2028 | $ | 3,888 | $ | 3,985,152 | ||||||
| Epicor Software Corporation 2020 Term Loan | 4.00% (1 Mo. LIBOR + 3.25% | ) | 7/30/2027 | 22,336 | 22,271,818 | ||||||||
| Escape Velocity Holdings, Inc. 2021 Term Loan | 4.75% (3 Mo. LIBOR + 4.25% | ) | 10/8/2028 | 12,605 | 12,557,545 | ||||||||
| ETA Australia Holdings III Pty Ltd. Term Loan (Australia)(c) | 4.09% (1 Mo. LIBOR + 4.00% | ) | 5/6/2026 | 11,348 | 11,248,605 | (h) | |||||||
| Finastra USA, Inc. USD 1st Lien Term Loan | 4.50% (6 Mo. LIBOR + 3.50% | ) | 6/13/2024 | 19 | 19,035 | ||||||||
| Flexential Intermediate Corporation 2017 1st Lien Term Loan | 5.75% (3 Mo. LIBOR + 2.50% | ) | 8/1/2024 | 8,702 | 8,619,972 | ||||||||
| Grab Holdings Inc Term Loan B (Singapore)(c) | 5.50% (1 Mo. LIBOR + 4.50% | ) | 1/29/2026 | 11,870 | 11,999,078 | ||||||||
| Greeneden U.S. Holdings II, LLC 2020 USD Term Loan B4 | 4.75% (1 Mo. LIBOR + 4.00% | ) | 12/1/2027 | 21,755 | 21,750,792 | ||||||||
| Imperva, Inc. 1st Lien Term Loan | 5.00% (3 Mo. LIBOR + 4.00% | ) | 1/12/2026 | 17,929 | 17,906,803 | ||||||||
| Imprivata, Inc. Term Loan | 4.00% (3 Mo. LIBOR + 3.50% | ) | 12/1/2027 | 12,634 | 12,630,998 | ||||||||
| Informatica LLC 2021 USD Term Loan B | 2.875% (1 Mo. LIBOR + 2.75% | ) | 10/27/2028 | 19,084 | 19,007,422 | ||||||||
| Ingram Micro Inc. 2021 Term Loan B | 4.00% (3 Mo. LIBOR + 3.50% | ) | 6/30/2028 | 14,528 | 14,532,089 | ||||||||
| ION Trading Finance Limited 2021 USD Term Loan (Ireland)(c) | 4.917% (3 Mo. LIBOR + 4.75% | ) | 4/1/2028 | 12,020 | 12,016,574 | ||||||||
| LogMeIn, Inc. Term Loan B | 4.839% (1 Mo. LIBOR + 4.75% | ) | 8/31/2027 | 29,443 | 29,305,430 | ||||||||
| Magenta Buyer LLC 2021 USD 1st Lien Term Loan | 5.75% (3 Mo. LIBOR + 5.00% | ) | 7/27/2028 | 30,151 | 29,749,576 | ||||||||
| Magenta Buyer LLC 2021 USD 2nd Lien Term Loan | 9.00% (3 Mo. LIBOR + 8.25% | ) | 7/27/2029 | 6,699 | 6,649,147 | ||||||||
| MeridianLink, Inc. 2021 Term Loan B | – | (g) | 10/27/2028 | 16,673 | 16,641,669 | ||||||||
| MH Sub I, LLC 2020 Incremental Term Loan | – | (g) | 9/13/2024 | 11,896 | 11,870,329 | ||||||||
| Perforce Software, Inc. 2020 Term Loan B | 3.84% (1 Mo. LIBOR + 3.75% | ) | 7/1/2026 | 20,234 | 20,023,198 | ||||||||
| 156 | See Notes to Financial Statements. |
Schedule of Investments (continued)
FLOATING RATE FUND November 30, 2021
| Investments | Interest Rate | Maturity Date | Principal Amount (000) | Fair Value | |||||||||
| Information Technology (continued) | |||||||||||||
| Polaris Newco LLC USD Term Loan B | 4.50% (6 Mo. LIBOR + 4.00% | ) | 6/2/2028 | $ | 26,980 | $ | 26,912,887 | ||||||
| Project Alpha Intermediate Holding, Inc. 2021 Term Loan B | 4.10% (1 Mo. LIBOR + 4.00% | ) | 4/26/2024 | 12,273 | 12,242,321 | ||||||||
| Project Boost Purchaser, LLC 2019 Term Loan B | 3.59% (1 Mo. LIBOR + 3.50% | ) | 6/1/2026 | 11,348 | 11,269,765 | ||||||||
| Proofpoint, Inc. 1st Lien Term Loan | 3.75% (3 Mo. LIBOR + 3.25% | ) | 8/31/2028 | 32,430 | 32,164,027 | ||||||||
| RealPage, Inc 1st Lien Term Loan | 3.75% (1 Mo. LIBOR + 3.25% | ) | 4/24/2028 | 23,990 | 23,801,171 | ||||||||
| Rocket Software, Inc. 2018 Term Loan | 4.34% (1 Mo. LIBOR + 4.25% | ) | 11/28/2025 | 8,654 | 8,594,609 | ||||||||
| Rocket Software, Inc. 2021 USD Incremental Term Loan B | 4.75% (1 Mo. LIBOR + 4.25% | ) | 11/28/2025 | 10,601 | 10,562,786 | ||||||||
| Storable, Inc Term Loan B | 3.75% (6 Mo. LIBOR + 3.25% | ) | 4/17/2028 | 12,680 | 12,585,291 | ||||||||
| Surf Holdings, LLC USD Term Loan | 3.616% (3 Mo. LIBOR + 3.50% | ) | 3/5/2027 | 24,971 | 24,757,941 | ||||||||
| Synaptics Incorporated Term Loan B | – | (g) | 10/21/2028 | 17,165 | 17,118,224 | ||||||||
| team.blue Finco SARL EUR Delayed Draw Term Loan(d) | 3.75% (3 Mo. EURIBOR + 3.75% | ) | 3/27/2028 | EUR | 497 | 561,972 | |||||||
| team.blue Finco SARL EUR Term Loan(d) | 3.75% (3 Mo. EURIBOR + 3.75% | ) | 3/27/2028 | EUR | 10,185 | 11,518,067 | |||||||
| Tenable Holdings, Inc. Term Loan B | 3.25% (3 Mo. LIBOR + 2.75% | ) | 7/7/2028 | $ | 9,544 | 9,520,442 | |||||||
| Tibco Software Inc. 2020 Term Loan B3 | 3.85% (1 Mo. LIBOR + 3.75% | ) | 6/30/2026 | 23,678 | 23,445,073 | ||||||||
| Toruk AS 2021 USD Term Loan B (Norway)(c) | – | (g) | 11/2/2028 | 19,061 | 18,715,873 | ||||||||
| Uber Technologies, Inc. 2021 1st Lien Term Loan B | 3.59% (1 Mo. LIBOR + 3.50% | ) | 4/4/2025 | 11,456 | 11,432,077 | ||||||||
| Ultimate Software Group Inc (The) 2020 2nd Lien Incremental Term Loan | 7.50% (3 Mo. LIBOR + 6.75% | ) | 5/3/2027 | 4,453 | 4,505,213 | ||||||||
| Ultimate Software Group Inc (The) 2021 Incremental Term Loan | 4.00% (3 Mo. LIBOR + 3.25% | ) | 5/4/2026 | 14,424 | 14,370,597 | ||||||||
| Ultimate Software Group Inc (The) 2021 Term Loan | – | (g) | 5/4/2026 | 19,035 | 18,965,117 | ||||||||
| Ultimate Software Group Inc (The) Term Loan B | 3.84% (1 Mo. LIBOR + 3.75% | ) | 5/4/2026 | 13,550 | 13,506,476 | ||||||||
| See Notes to Financial Statements. | 157 |
Schedule of Investments (continued)
FLOATING RATE FUND November 30, 2021
| Investments | Interest Rate | Maturity Date | Principal Amount (000) | Fair Value | |||||||||
| Information Technology (continued) | |||||||||||||
| Ultimate Software Group, Inc. (The) 2021 2nd Lien Term Loan | – | (g) | 5/3/2027 | $ | 11,055 | $ | 11,134,651 | ||||||
| Veritas US Inc. 2021 USD Term Loan B | 6.00% (3 Mo. LIBOR + 5.00% | ) | 9/1/2025 | 13,211 | 13,157,507 | ||||||||
| Vertiv Group Corporation 2021 Term Loan B | 2.838% (1 Mo. LIBOR + 2.75% | ) | 3/2/2027 | 18,619 | 18,481,181 | ||||||||
| VS Buyer, LLC Term Loan B | 3.09% (1 Mo. LIBOR + 3.00% | ) | 2/28/2027 | 12,841 | 12,793,354 | ||||||||
| Total | 1,000,297,848 | ||||||||||||
| Manufacturing 9.16% | |||||||||||||
| AMC Entertainment Holdings, Inc. 2019 Term Loan B | 3.09% (1 Mo. LIBOR + 3.00% | ) | 4/22/2026 | 24,616 | 22,240,817 | ||||||||
| Array Technologies, Inc. Term Loan B | 3.75% (3 Mo. LIBOR + 3.25% | ) | 10/14/2027 | 7,821 | 7,742,616 | ||||||||
| ASP Unifrax Holdings Inc. Term Loan B | 3.882% (3 Mo. LIBOR + 3.75% | ) | 12/12/2025 | 10,336 | 10,165,565 | ||||||||
| Banijay Entertainment S.A.S USD Term Loan (France)(c) | 3.838% (1 Mo. LIBOR + 3.75% | ) | 3/1/2025 | 13,398 | 13,335,600 | ||||||||
| Bright Bidco B.V. 2018 Term Loan B (Netherlands)(c) | 4.50% (6 Mo. LIBOR + 3.50% | ) | 6/30/2024 | 8,047 | 6,224,990 | ||||||||
| CenturyLink, Inc. 2020 Term Loan B | 2.34% (1 Mo. LIBOR + 2.25% | ) | 3/15/2027 | 16,709 | 16,400,619 | ||||||||
| Chamberlain Group Inc. Term Loan B | 4.00% (1 Mo. LIBOR + 3.50% | ) | 11/3/2028 | 9,531 | 9,483,307 | ||||||||
| Cinemark USA, Inc. 2018 Term Loan B | 1.85% (1 Mo. LIBOR + 1.75% | ) | 3/31/2025 | 14,204 | 13,617,930 | ||||||||
| Clear Channel Outdoor Holdings, Inc. Term Loan B | 3.601% - 3.63% (2 Mo. LIBOR + 3.50% (3 Mo. LIBOR + 3.50% | ) ) | 8/21/2026 | 23,576 | 23,106,304 | ||||||||
| CMBF LLC Delayed Draw Term Loan(i) | 3.00% (3 Mo. LIBOR + 3.00% | ) | 8/2/2028 | 3,296 | 3,263,282 | ||||||||
| CMBF LLC Term Loan | 6.50% (1 Mo. LIBOR + 6.00% | ) | 8/2/2028 | 11,075 | 10,964,660 | ||||||||
| Consolidated Communications, Inc. 2021 Term Loan B | 4.25% (1 Mo. LIBOR + 3.50% | ) | 10/2/2027 | 14,547 | 14,498,892 | ||||||||
| Crown Finance US, Inc. 2018 USD Term Loan | – | (g) | 2/28/2025 | 11,249 | 9,141,435 | ||||||||
| 158 | See Notes to Financial Statements. |
Schedule of Investments (continued)
FLOATING RATE FUND November 30, 2021
| Investments | Interest Rate | Maturity Date | Principal Amount (000) | Fair Value | |||||||||
| Manufacturing (continued) | |||||||||||||
| CSC Holdings, LLC 2017 Term Loan B1 | 2.339% (1 Mo. LIBOR + 2.25% | ) | 7/17/2025 | $ | 18,285 | $ | 17,964,809 | ||||||
| CSC Holdings, LLC 2018 Incremental Term Loan | 2.339% (1 Mo. LIBOR + 2.25% | ) | 1/15/2026 | 2,372 | 2,329,017 | ||||||||
| Deliver Buyer, Inc. Term Loan B | 5.132% (3 Mo. LIBOR + 5.00% | ) | 5/1/2024 | 10,827 | 10,800,093 | (h) | |||||||
| DirecTV Financing, LLC Term Loan | 5.75% (3 Mo. LIBOR + 5.00% | ) | 8/2/2027 | 23,937 | 23,925,733 | ||||||||
| Dotdash Meredith Inc Term Loan B | – | (g) | 11/22/2026 | 23,662 | 23,528,999 | (h) | |||||||
| E.W. Scripps Company (The) 2019 Term Loan B2 | 3.313% (1 Mo. LIBOR + 2.56% | ) | 5/1/2026 | 18,670 | 18,651,946 | ||||||||
| Electrical Components International, Inc. 2018 1st Lien Term Loan | 4.351% (3 Mo. LIBOR + 4.25% | ) | 6/26/2025 | 8,588 | 8,538,816 | ||||||||
| Electrical Components International, Inc. 2021 Term Loan B | 10.75% (Prime Rate + 7.50% | ) | 6/26/2025 | 4,645 | 4,656,376 | ||||||||
| Engineered Machinery Holdings, Inc. 2021 USD 2nd Lien Incremental Term Loan | 7.25% (3 Mo. LIBOR + 6.50% | ) | 5/21/2029 | 4,633 | 4,665,305 | ||||||||
| Engineered Machinery Holdings, Inc. 2021 USD Incremental Term Loan | 4.50% (3 Mo. LIBOR + 3.75% | ) | 5/19/2028 | 14,346 | 14,338,927 | ||||||||
| Esdec Solar Group B.V. Term Loan B (Netherlands)(c) | 5.75% (6 Mo. LIBOR + 5.00% | ) | 8/30/2028 | 16,329 | 16,328,579 | ||||||||
| Frontier Communications Corp. 2021 DIP Term Loan B | 4.50% (3 Mo. LIBOR + 3.75% | ) | 5/1/2028 | 9,227 | 9,229,622 | ||||||||
| GOGO Intermediate Holdings LLC Term Loan B | 4.50% (3 Mo. LIBOR + 3.75% | ) | 4/30/2028 | 12,095 | 12,065,786 | ||||||||
| Gray Television, Inc. 2018 Term Loan C | 2.586% (1 Mo. LIBOR + 2.50% | ) | 1/2/2026 | 17,852 | 17,688,583 | ||||||||
| Gray Television, Inc. 2021 Second Lien Bridge Term Loan(i) | – | (g) | 8/12/2022 | 9,930 | 9,930,292 | (h) | |||||||
| Gray Television, Inc. 2021 Term Loan D | – | (g) | 10/20/2028 | 21,122 | 21,025,635 | ||||||||
| iHeartCommunications, Inc. 2020 Term Loan | 3.09% (1 Mo. LIBOR + 3.00% | ) | 5/1/2026 | 20,532 | 20,300,918 | ||||||||
| Madison IAQ LLC Term Loan | 3.75% (6 Mo. LIBOR + 3.25% | ) | 6/21/2028 | 19,174 | 19,041,128 | ||||||||
| Nexstar Broadcasting, Inc. 2019 Term Loan B4 | 2.586% (1 Mo. LIBOR + 2.50% | ) | 9/18/2026 | 32,953 | 32,770,232 | ||||||||
| See Notes to Financial Statements. | 159 |
Schedule of Investments (continued)
FLOATING RATE FUND November 30, 2021
| Investments | Interest Rate | Maturity Date | Principal Amount (000) | Fair Value | |||||||||
| Manufacturing (continued) | |||||||||||||
| Playtika Holding Corp 2021 Term Loan (Israel)(c) | 2.84% (1 Mo. LIBOR + 2.75% | ) | 3/13/2028 | $ | 25,972 | $ | 25,842,312 | ||||||
| Refficiency Holdings LLC 2021 Delayed Draw Term Loan(i) | 4.00% (3 Mo. LIBOR + 4.00% | ) | 12/31/2027 | 3,213 | 3,215,344 | ||||||||
| Rexnord LLC 2021 Term Loan B | 2.75% (1 Mo. LIBOR + 2.25% | ) | 10/4/2028 | 9,490 | 9,482,046 | ||||||||
| Tiger Acquisition, LLC 2021 Term Loan | 3.75% (3 Mo. LIBOR + 3.25% | ) | 6/1/2028 | 17,831 | 17,710,207 | ||||||||
| Univision Communications Inc. 2021 Term Loan B | – | (g) | 5/5/2028 | 37,276 | 37,235,955 | ||||||||
| UTEX Industries Inc. 2020 First Out Exit Term Loan A | – | (g) | 12/3/2024 | 1,585 | 1,597,848 | ||||||||
| UTEX Industries Inc. 2020 Second Out Term Loan PIK 5.75% | 5.25% (1 Mo. LIBOR + 3.75% | ) | 12/3/2025 | 1,841 | 1,816,330 | ||||||||
| Vertical US Newco Inc Term Loan B | 4.00% (6 Mo. LIBOR + 3.50% | ) | 7/30/2027 | 23,516 | 23,477,870 | ||||||||
| Virgin Media Bristol LLC USD Term Loan N | 2.589% (1 Mo. LIBOR + 2.50% | ) | 1/31/2028 | 33,146 | 32,751,910 | ||||||||
| Vue International Bidco p.l.c. 2019 EUR Term Loan B(d) | 4.75% (6 Mo. EURIBOR + 4.75% | ) | 7/3/2026 | EUR | 6,500 | 6,858,992 | |||||||
| Watlow Electric Manufacturing Company Term Loan B | 4.50% (3 Mo. LIBOR + 4.00% | ) | 3/2/2028 | $ | 10,053 | 10,023,264 | |||||||
| WideOpenWest Finance LLC 2017 Term Loan B | 4.25% (1 Mo. LIBOR + 3.25% | ) | 8/18/2023 | 6,767 | 6,766,080 | ||||||||
| Windstream Services, LLC 2020 Exit Term Loan B | 7.25% (1 Mo. LIBOR + 6.25% | ) | 9/21/2027 | 7,728 | 7,766,600 | ||||||||
| Total | 632,511,571 | ||||||||||||
| Metals/Minerals 0.65% | |||||||||||||
| Alpha Metallurgical Resources, Inc. 2019 Term Loan | 10.00% (3 Mo. LIBOR + 8.00% | ) | 6/14/2024 | 10,011 | 9,957,909 | ||||||||
| Grinding Media Inc. 2021 Term Loan B | 4.75% (3 Mo. LIBOR + 4.00% | ) | 10/12/2028 | 24,782 | 24,735,557 | ||||||||
| Peabody Energy Corporation 2018 Term Loan | 2.842% (1 Mo. LIBOR + 2.75% | ) | 3/31/2025 | 11,577 | 10,129,784 | ||||||||
| Total | 44,823,250 | ||||||||||||
| 160 | See Notes to Financial Statements. |
Schedule of Investments (continued)
FLOATING RATE FUND November 30, 2021
| Investments | Interest Rate | Maturity Date | Principal Amount (000) | Fair Value | |||||||||
| Retail 3.48% | |||||||||||||
| Academy, Ltd. 2021 Term Loan | 4.50% (1 Mo. LIBOR + 3.75% | ) | 11/5/2027 | $ | 7,981 | $ | 7,993,329 | ||||||
| Amer Sports Oyj EUR Term Loan B(d) | 4.50% (6 Mo. EURIBOR + 4.50% | ) | 3/30/2026 | EUR | 10,771 | 12,223,931 | |||||||
| Birkenstock GmbH & Co. KG USD Term Loan B (Germany)(c) | 3.75% (3 Mo. LIBOR + 3.25% | ) | 4/27/2028 | $ | 15,793 | 15,707,234 | |||||||
| Canada Goose Inc. 2021 Term Loan (Canada)(c) | 4.25% (3 Mo. LIBOR + 3.50% | ) | 10/7/2027 | 11,611 | 11,618,350 | ||||||||
| Chinos Intermediate Holdings A, Inc. Exit Term Loan | 11.00% (3 Mo. LIBOR + 10.00% | ) | 9/10/2027 | 3,665 | 4,002,906 | ||||||||
| Evergreen Acqco 1 LP 2021 USD Term Loan | 6.50% (3 Mo. LIBOR + 5.75% | ) | 4/21/2028 | 13,506 | 13,430,472 | ||||||||
| Great Outdoors Group, LLC 2021 Term Loan B1 | 4.50% (3 Mo. LIBOR + 3.75% | ) | 3/6/2028 | 13,625 | 13,641,695 | ||||||||
| Harbor Freight Tools USA, Inc. 2021 Term Loan B | 3.25% (1 Mo. LIBOR + 2.75% | ) | 10/19/2027 | 24,638 | 24,459,347 | ||||||||
| Petco Health and Wellness Company, Inc. 2021 Term Loan B | 4.00% (3 Mo. LIBOR + 3.25% | ) | 3/3/2028 | 24,189 | 24,093,512 | ||||||||
| PetSmart, Inc. 2021 Term Loan B | 4.50% (3 Mo. LIBOR + 3.75% | ) | 2/11/2028 | 23,694 | 23,625,421 | ||||||||
| Rent-A-Center, Inc. 2021 First Lien Term Loan B | 3.75% (1 Mo. LIBOR + 3.25% | ) | 2/17/2028 | 11,941 | 11,856,036 | ||||||||
| Restoration Hardware, Inc. Term Loan B | – | (g) | 10/20/2028 | 18,129 | 18,053,293 | ||||||||
| Staples, Inc. 7 Year Term Loan | 5.132% (3 Mo. LIBOR + 5.00% | ) | 4/16/2026 | $ | 5,121 | $ | 4,924,305 | ||||||
| Sweetwater Borrower, LLC Term Loan B | 5.50% (3 Mo. LIBOR + 4.75% | ) | 8/7/2028 | 16,738 | 16,716,852 | ||||||||
| Torrid LLC 2021 Term Loan B | 6.25% (1 Mo. LIBOR + 5.50% | ) | 5/19/2028 | 22,124 | 22,261,994 | ||||||||
| Tory Burch LLC Term Loan B | 4.00% (1 Mo. LIBOR + 3.50% | ) | 4/16/2028 | 15,488 | 15,468,997 | ||||||||
| Total | 240,077,674 | ||||||||||||
| Service 8.04% | |||||||||||||
| Aegion Corporation Term Loan | 5.50% (3 Mo. LIBOR + 4.75% | ) | 5/17/2028 | 12,136 | 12,151,495 | ||||||||
| A-L Parent LLC 2016 1st Lien Term Loan | 4.25% (1 Mo. LIBOR + 3.25% | ) | 12/1/2023 | 10,097 | 9,559,012 | ||||||||
| APi Group DE, Inc. 2021 Incremental Term Loan B | – | (g) | 10/7/2028 | 9,549 | 9,523,596 | ||||||||
| See Notes to Financial Statements. | 161 |
Schedule of Investments (continued)
FLOATING RATE FUND November 30, 2021
| Investments | Interest Rate | Maturity Date | Principal Amount (000) | Fair Value | |||||||||
| Service (continued) | |||||||||||||
| AppLovin Corporation 2018 Term Loan B | 3.34% (1 Mo. LIBOR + 3.25% | ) | 8/15/2025 | $ | 8,995 | $ | 8,966,543 | ||||||
| AppLovin Corporation 2021 Term Loan B | – | (g) | 10/25/2028 | 14,303 | 14,228,807 | ||||||||
| Astra Acquisition Corp. 2021 1st Lien Term Loan | 5.75% (1 Mo. LIBOR + 5.25% | ) | 10/25/2028 | 19,062 | 18,585,374 | ||||||||
| BCP V Modular Services Holdings IV Limited EUR Term Loan B(d) | – | (g) | 10/7/2028 | EUR | 17,189 | 19,480,565 | |||||||
| Bingo Industries Ltd. Term Loan (Australia)(c) | 4.00% (3 Mo. LIBOR + 3.50% | ) | 7/8/2028 | $ | 9,545 | 9,496,877 | |||||||
| Blackhawk Network Holdings, Inc. 2018 2nd Lien Term Loan | 7.125% (1 Mo. LIBOR + 7.00% | ) | 6/15/2026 | 6,366 | 6,338,281 | ||||||||
| Brand Energy & Infrastructure Services, Inc. 2017 Term Loan | 5.25% (3 Mo. LIBOR + 4.25% | ) | 6/21/2024 | 14,815 | 14,635,632 | ||||||||
| Cengage Learning, Inc. 2021 Term Loan B | 5.75% (3 Mo. LIBOR + 4.75% | ) | 6/29/2026 | 18,710 | 18,673,583 | ||||||||
| CMI Marketing, Inc. 2021 First Lien Term Loan B | 4.75% (1 Mo. LIBOR + 4.25% | ) | 3/23/2028 | 16,446 | 16,425,935 | ||||||||
| DTI Holdco, Inc. 2018 Term Loan B | 5.75% (2 Mo. LIBOR + 4.75% (3 Mo. LIBOR + 4.75% | ) ) | 9/30/2023 | 19,680 | 19,477,348 | ||||||||
| Employbridge LLC 2021 Term Loan B | 5.50% (3 Mo. LIBOR + 4.75% | ) | 7/14/2028 | 29,810 | 29,493,037 | ||||||||
| Instructure Holdings, Inc. 2021 Term Loan B | 3.25% (1 Mo. LIBOR + 2.75% | ) | 10/30/2028 | 8,105 | 8,064,249 | ||||||||
| KUEHG Corp. 2018 Incremental Term Loan | 4.75% (3 Mo. LIBOR + 3.75% | ) | 2/21/2025 | 28,459 | 27,949,622 | ||||||||
| Learning Care Group, Inc. 2018 1st Lien Term Loan | 4.25% (3 Mo. LIBOR + 3.25% | ) | 3/13/2025 | 16,391 | 16,096,392 | ||||||||
| Liftoff Mobile Inc Term Loan | 4.25% (3 Mo. LIBOR + 3.50% | ) | 3/17/2028 | – | (k) | 2 | |||||||
| Magnite Inc Term Loan | 5.75% (6 Mo. LIBOR + 5.00% | ) | 4/28/2028 | 17,535 | 17,502,061 | ||||||||
| Priority Payment Systems Holdings, LLC 2021 Term Loan | 6.75% (1 Mo. LIBOR + 5.75% (3 Mo. LIBOR + 5.75% | ) ) | 4/27/2027 | 13,736 | 13,701,276 | ||||||||
| Red Planet Borrower, LLC Term Loan B | 4.25% (3 Mo. LIBOR + 3.75% | ) | 10/2/2028 | 23,975 | 23,819,230 | ||||||||
| Refficiency Holdings LLC 2021 Term Loan | 4.50% (1 Mo. LIBOR + 3.75% | ) | 12/16/2027 | 16,581 | 16,594,398 | ||||||||
| 162 | See Notes to Financial Statements. |
Schedule of Investments (continued)
FLOATING RATE FUND November 30, 2021
| Investments | Interest Rate | Maturity Date | Principal Amount (000) | Fair Value | |||||||||
| Service (continued) | |||||||||||||
| Renaissance Holding Corp. 2018 1st Lien Term Loan | 3.34% (1 Mo. LIBOR + 3.25% | ) | 5/30/2025 | $ | 20,962 | $ | 20,755,959 | ||||||
| Renaissance Holding Corp. 2018 2nd Lien Term Loan | 7.09% (1 Mo. LIBOR + 7.00% | ) | 5/29/2026 | 6,000 | 6,032,340 | ||||||||
| Resideo Funding Inc. 2021 Term Loan | 2.75% (2 Mo. LIBOR + 2.25% (3 Mo. LIBOR + 2.25% | ) ) | 2/8/2028 | 6,316 | 6,315,958 | ||||||||
| Service Logic Acquisition, Inc Delayed Draw Term Loan(i) | 4.00% - 4.75% (1 Mo. LIBOR + 4.00% (3 Mo. LIBOR + 4.00% | ) ) | 10/29/2027 | 744 | 743,837 | (h) | |||||||
| Service Logic Acquisition, Inc Term Loan | 4.75% (2 Mo. LIBOR + 4.00% (3 Mo. LIBOR + 4.00% | ) ) | 10/29/2027 | 8,988 | 8,988,338 | ||||||||
| Severin Acquisition, LLC 2018 Term Loan B | 3.341% (1 Mo. LIBOR + 3.25% | ) | 8/1/2025 | 17,576 | 17,491,507 | ||||||||
| Sophia, L.P. 2021 Term Loan B | 4.50% (3 Mo. LIBOR + 3.50% | ) | 10/7/2027 | 13,578 | 13,568,265 | ||||||||
| SSH Group Holdings, Inc. 2018 1st Lien Term Loan | 4.382% (3 Mo. LIBOR + 4.25% | ) | 7/30/2025 | 18,625 | 17,885,777 | ||||||||
| Taboola.com Ltd Term Loan B | 4.50% (3 Mo. LIBOR + 4.00% | ) | 8/17/2028 | 14,326 | 14,236,610 | ||||||||
| Thermostat Purchaser III, Inc. Delayed Draw Term Loan(i) | 2.25% | 8/24/2028 | 2,172 | 2,169,393 | |||||||||
| Thermostat Purchaser III, Inc. Term Loan | 4.675% (3 Mo. LIBOR + 4.50% | ) | 8/31/2028 | 9,289 | 9,277,008 | ||||||||
| Think & Learn Private Limited Term Loan B (India)(c) | – | (g) | 11/5/2026 | 19,197 | 19,184,506 | ||||||||
| Trans Union, LLC 2021 2nd Lien Term Loan | – | (g) | 11/16/2029 | 3,435 | 3,435,083 | (h) | |||||||
| Trans Union, LLC 2021 Term Loan B6(i) | – | (g) | 11/16/2028 | 17,305 | 17,223,543 | ||||||||
| Verifone Systems, Inc. 2018 1st Lien Term Loan | 4.178% (3 Mo. LIBOR + 4.00% | ) | 8/20/2025 | 26,158 | 25,573,730 | ||||||||
| Weld North Education, LLC 2021 Term Loan B | 4.25% (1 Mo. LIBOR + 3.75% | ) | 12/21/2027 | 10,132 | 10,100,771 | ||||||||
| WEX Inc. 2021 Term Loan | 2.34% (1 Mo. LIBOR + 2.25% | ) | 3/31/2028 | 12,083 | 12,002,906 | ||||||||
| Yak Access, LLC 2018 1st Lien Term Loan B | 5.09% - 5.18% (1 Mo. LIBOR + 5.00% (3 Mo. LIBOR + 5.00% | ) ) | 7/11/2025 | 22,247 | 19,311,835 | ||||||||
| Total | 555,060,681 | ||||||||||||
| See Notes to Financial Statements. | 163 |
Schedule of Investments (continued)
FLOATING RATE FUND November 30, 2021
| Investments | Interest Rate | Maturity Date | Principal Amount (000) | Fair Value | |||||||||
| Telecommunications 2.10% | |||||||||||||
| AIT Worldwide Logistics, Inc 2021 Term Loan | 5.50% (3 Mo. LIBOR + 4.75% | ) | 3/31/2028 | $ | 7,986 | $ | 7,998,424 | ||||||
| Carriage Purchaser, Inc. 2021 Term Loan B | 5.00% (2 Mo. LIBOR + 4.25% | ) | 9/30/2028 | 9,962 | 9,983,830 | ||||||||
| Chassix Inc. 2017 1st Lien Term Loan | 6.50% - 7.75% (Prime Rate + 4.50% (6 Mo. LIBOR + 5.50% | ) ) | 11/15/2023 | 14,079 | 13,011,433 | ||||||||
| CWGS Group, LLC 2021 Term Loan B | 3.25% (1 Mo. LIBOR + 2.50% | ) | 6/3/2028 | 19,262 | 19,132,415 | ||||||||
| Drive Chassis HoldCo, LLC 2019 2nd Lien Term Loan | 6.874% (3 Mo. LIBOR + 6.00% | ) | 4/10/2026 | 14,827 | 14,938,116 | (h) | |||||||
| Echo Global Logistics, Inc. Term Loan | 4.25% (3 Mo. LIBOR + 3.75% | ) | 11/4/2028 | 9,100 | 9,068,053 | ||||||||
| Fastlane Parent Company, Inc. 2018 Add On 1st Lien Term Loan | 4.593% (1 Mo. LIBOR + 4.50% | ) | 2/4/2026 | 15,570 | 15,580,839 | ||||||||
| Kenan Advantage Group, Inc. 2021 Term Loan B1 | 4.50% (1 Mo. LIBOR + 3.75% | ) | 3/24/2026 | 12,055 | 12,058,370 | ||||||||
| LaserShip, Inc. 2021 Term Loan | 5.25% (3 Mo. LIBOR + 4.50% | ) | 5/7/2028 | 28,951 | 29,035,494 | ||||||||
| Truck Hero, Inc. 2021 Term Loan B | 4.00% (1 Mo. LIBOR + 3.25% | ) | 1/31/2028 | 14,367 | 14,278,667 | ||||||||
| Total | 145,085,641 | ||||||||||||
| Utility 1.86% | |||||||||||||
| Astoria Energy LLC 2020 Term Loan B | 4.50% (3 Mo. LIBOR + 3.50% | ) | 12/10/2027 | 10,294 | 10,288,565 | ||||||||
| Centuri Group, Inc Term Loan B | 3.00% (1 Mo. LIBOR + 2.50% (3 Mo. LIBOR + 2.50% | ) ) | 8/27/2028 | 19,225 | 19,128,965 | ||||||||
| Edgewater Generation, L.L.C. Term Loan | 3.84% (1 Mo. LIBOR + 3.75% | ) | 12/13/2025 | 10,121 | 9,639,837 | ||||||||
| EFS Cogen Holdings I LLC 2020 Term Loan B | 4.50% (3 Mo. LIBOR + 3.50% | ) | 10/1/2027 | 16,259 | 16,160,264 | ||||||||
| ExGen Renewables IV, LLC 2020 Term Loan | 3.50% (3 Mo. LIBOR + 2.50% | ) | 12/15/2027 | 11,367 | 11,384,571 | ||||||||
| Frontera Generation Holdings LLC 2021 2nd Lien Term Loan | 2.50% (3 Mo. LIBOR + 1.50% | ) | 7/28/2028 | 2,864 | 1,625,314 | ||||||||
| Frontera Generation Holdings LLC 2021 Term Loan | 14.00% (3 Mo. LIBOR + 13.00% | ) | 7/28/2026 | 2,966 | 3,143,501 | (h) | |||||||
| 164 | See Notes to Financial Statements. |
Schedule of Investments (continued)
FLOATING RATE FUND November 30, 2021
| Investments | Interest Rate | Maturity Date | Principal Amount (000) | Fair Value | ||||||||||
| Utility (continued) | ||||||||||||||
| Generation Bridge Acquisition, LLC Term Loan B | – | (g) | 8/5/2028 | $ | 9,369 | $ | 9,416,185 | |||||||
| Generation Bridge Acquisition, LLC Term Loan C | – | (g) | 8/5/2028 | 195 | 196,170 | |||||||||
| Helix Gen Funding, LLC Term Loan B | 4.75% (1 Mo. LIBOR + 3.75% | ) | 6/3/2024 | 10,434 | 10,144,800 | |||||||||
| Pacific Gas & Electric Company 2020 Term Loan | 3.50% (3 Mo. LIBOR + 3.00% | ) | 6/23/2025 | 13,304 | 13,169,282 | |||||||||
| USIC Holdings, Inc. 2021 2nd Lien Term Loan | 7.25% (1 Mo. LIBOR + 6.50% | ) | 5/7/2029 | 6,540 | 6,618,619 | |||||||||
| USIC Holdings, Inc. 2021 Term Loan | 4.25% (1 Mo. LIBOR + 3.50% | ) | 5/12/2028 | 17,487 | 17,429,868 | |||||||||
| Total | 128,345,941 | |||||||||||||
| Total Floating Rate Loans (cost $5,515,462,252) | 5,527,968,803 | |||||||||||||
| Dividend Rate | Shares (000) | |||||||||||||
| PREFERRED STOCKS 0.33% | ||||||||||||||
| Transportation Infrastructure | ||||||||||||||
| ACBL Holdings Corp. Series A | Zero Coupon | 354 | 9,388,155 | |||||||||||
| ACBL Holdings Corp. Series B | Zero Coupon | 445 | 13,564,966 | |||||||||||
| Total Preferred Stocks (cost $19,975,575) | 22,953,121 | |||||||||||||
| Exercise Price | Expiration Date | |||||||||||||
| WARRANTS 0.00% | ||||||||||||||
| Machinery 0.00% | ||||||||||||||
| TNT Crane & Rigging, Inc.* | $ | 4.00 | 10/16/2025 | 13 | 25,302 | |||||||||
| Miscellaneous Financials 0.00% | ||||||||||||||
| UTEX Industries, Inc.* | 114.76 | 12/3/2025 | 57 | 143,350 | ||||||||||
| Total Warrants (cost $136,614) | 168,652 | |||||||||||||
| Total Long-Term Investments (cost $6,458,797,869) | 6,475,952,048 | |||||||||||||
| See Notes to Financial Statements. | 165 |
Schedule of Investments (continued)
FLOATING RATE FUND November 30, 2021
| Investments | Principal Amount (000) | Fair Value | |||||||||||
| SHORT-TERM INVESTMENTS 12.44% | |||||||||||||
| REPURCHASE AGREEMENTS 12.44% | |||||||||||||
| Repurchase Agreement dated 11/30/2021, 0.00% due 12/1/2021 with Fixed Income Clearing Corp. collateralized by $18,000,000 of U.S. Treasury Note at 2.625% due 12/31/2023; $798,536,800 of U.S. Treasury Note at 0.50% due 11/30/2023; $25,000,000 of U.S. Treasury Note at 0.125% due 12/15/2023; $34,222,600 of U.S. Treasury Note at 0.125% due 1/15/2024; value: $875,972,002; proceeds: $858,796,061 (cost $858,796,061) | $ | 858,796 | $ | 858,796,061 | |||||||||
| Total Investments in Securities 106.21% (cost $7,317,593,930) | 7,334,748,109 | ||||||||||||
| Less Unfunded Loan Commitments (0.70%) (cost $48,125,682)(l) | (48,029,379 | ) | |||||||||||
| Net Investments in Securities 105.51% (cost $7,269,468,248) | 7,286,718,730 | ||||||||||||
| Other Assets and Liabilities – Net(m) (5.51)% | (380,599,878 | ) | |||||||||||
| Net Assets 100.00% | $ | 6,906,118,852 | |||||||||||
| EUR | Euro. |
| GBP | British Pound. |
| ETF | Exchange Traded Fund. |
| EURIBOR | Euro Interbank Offered Rate. |
| LIBOR | London Interbank Offered Rate. |
| PIK | Payment-in-kind. |
| † | Security was purchased pursuant to Rule 144A under the Securities Act of 1933 and, unless registered under such Act or exempted from registration, may only be resold to qualified institutional buyers. At November 30, 2021, the total value of Rule 144A securities was $734,999,619, which represents 10.64% of net assets. | |
| # | Variable rate security. The interest rate represents the rate in effect at November 30, 2021. | |
| * | Non-income producing security. | |
| (a) | Securities purchased on a when-issued basis (See Note 2(j)). | |
| (b) | Variable Rate is Fixed to Float: Rate remains fixed or at Zero Coupon until designated future date. | |
| (c) | Foreign security traded in U.S. dollars. | |
| (d) | Investment in non-U.S. dollar denominated securities. | |
| (e) | Level 3 Investment as described in Note 2(t) in the Notes to Financials. Security fair valued by the Pricing Committee. | |
| (f) | Floating Rate Loans in which the Fund invests generally pay interest at rates which are periodically re-determined at a margin above the London Interbank Offered Rate (“LIBOR”) or the prime rate offered by major U.S. banks. The rate(s) shown is the rate(s) in effect at November 30, 2021. | |
| (g) | Interest rate to be determined. | |
| (h) | Level 3 Investment as described in Note 2(t) in the Notes to Financials. Floating Rate Loans categorized as Level 3 are valued based on a single quotation obtained from a dealer. Accounting principles generally accepted in the United States of America do not require the Fund to create quantitative unobservable inputs that were not developed by the Fund. Therefore, the Fund does not have access to unobservable inputs and cannot disclose such inputs in the valuation. |
| 166 | See Notes to Financial Statements. |
Schedule of Investments (continued)
FLOATING RATE FUND November 30, 2021
| (i) | Security partially/fully unfunded. See Note (2(o)). | |
| (j) | Defaulted (non-income producing security). | |
| (k) | Amount is less than $1,000. | |
| (l) | See Note (2(o)). | |
| (m) | Other Assets and Liabilities – Net include net unrealized appreciation/depreciation on forward foreign currency exchange contracts, futures contracts and swaps as follows: |
Centrally Cleared Credit Default Swaps on Indexes - Buy Protection at November 30, 2021(1):
| Referenced Indexes | Central Clearing Party | Fund Pays (Quarterly) | Termination Date | Notional Amount | Payments Upfront(2) | Value/ Unrealized Appreciation(3) | ||||||||||||
| Markit CDX.NA.HY.37(4)(5) | Bank of America | 5.00% | 12/20/2026 | $ | 165,309,000 | $ | (14,398,048 | ) | $1,825,272 | |||||||||
| (1) | If the Fund is a buyer of protection and a credit event occurs, as defined under the terms of that particular swap agreement, the Fund will either (i) receive from the seller of protection an amount equal to the notional amount of the swap and make delivery of the referenced obligation or underlying securities comprising the referenced index or (ii) pay a net settlement amount in the form of cash or securities equal to the notional amount of the swap less the recovery value of the referenced obligation or underlying securities. | |
| (2) | Upfront payments received/paid by Central Clearing Party are presented net of amortization. | |
| (3) | Total unrealized appreciation on Credit Default Swaps on Indexes amounted to $1,825,272. Total unrealized depreciation on Credit Default Swaps on Indexes amounted to $0. | |
| (4) | Central Clearinghouse: Intercontinental Exchange (ICE). | |
| (5) | The Referenced Index is for the Centrally Cleared Credit Default Swaps on Indexes, which is comprised of a basket of high yield securities. |
Centrally Cleared Interest Rate Swap Contracts at November 30, 2021:
| Central Clearingparty | Periodic Payments to be Made By The Fund (Quarterly) | Periodic Payments to be Received By The Fund (Quarterly) | Termination Date | Notional Amount | Value/ Unrealized Appreciation | |||||||||
| Bank of America(1) | 0.619% | 3-Month USD LIBOR Index | 2/15/2028 | $10,017,000 | $ | 451,987 | ||||||||
| Bank of America(1) | 0.611% | 3-Month USD LIBOR Index | 2/15/2028 | 8,594,000 | 392,015 | |||||||||
| Bank of America(1) | 0.493% | 3-Month USD LIBOR Index | 9/15/2024 | 21,286,000 | 308,238 | |||||||||
| Bank of America(1) | 0.451% | 3-Month USD LIBOR Index | 5/15/2023 | 20,744,000 | 31,818 | |||||||||
| Bank of America(1) | 0.184% | 3-Month USD MFEDL Index | 10/21/2025 | 32,990 | 1,007 | |||||||||
| Bank of America(2) | 0.051% | 3-Month USD MFEDL Index | 10/21/2022 | 345,082 | 531 | |||||||||
| Unrealized Appreciation on Centrally Cleared Interest Rate Swap Contracts | $ | 1,185,596 | ||||||||||||
| See Notes to Financial Statements. | 167 |
Schedule of Investments (continued)
FLOATING RATE FUND November 30, 2021
| Central Clearingparty | Periodic Payments to be Made By The Fund (Quarterly) | Periodic Payments to be Received By The Fund (Quarterly) | Termination Date | Notional Amount | Value/ Unrealized Depreciation | |||||||||
| Bank of America(1) | 1.225% | 12-Month USD SOFR Index | 1/15/2030 | $12,445,000 | $ | (33,747 | ) | |||||||
| Bank of America(1) | 1.220% | 12-Month USD SOFR Index | 10/15/2029 | 9,775,000 | (28,616 | ) | ||||||||
| Bank of America(1) | 1.211% | 12-Month USD SOFR Index | 9/1/2029 | 12,080,000 | (30,189 | ) | ||||||||
| Bank of America(1) | 1.209% | 12-Month USD SOFR Index | 8/15/2029 | 11,152,000 | (28,046 | ) | ||||||||
| Bank of America(1) | 1.209% | 12-Month USD SOFR Index | 10/1/2029 | 13,454,000 | (29,503 | ) | ||||||||
| Bank of America(1) | 1.152% | 12-Month USD SOFR Index | 10/15/2028 | 10,098,000 | (6,390 | ) | ||||||||
| Bank of America(1) | 1.150% | 12-Month USD SOFR Index | 9/30/2028 | 11,360,000 | (7,261 | ) | ||||||||
| Bank of America(1) | 1.150% | 12-Month USD SOFR Index | 10/1/2028 | 14,042,000 | (8,626 | ) | ||||||||
| Bank of America(1) | 3-Month USD SOFR Index | 0.173% | 10/21/2025 | 32,990 | (981 | ) | ||||||||
| Bank of America(1) | 3-Month USD SOFR Index | 0.049% | 10/21/2022 | 345,082 | (420 | ) | ||||||||
| Unrealized Depreciation on Centrally Cleared Interest Rate Swap Contracts | $ | (173,779 | ) | |||||||||||
| LIBOR | London Interbank Offered Rate. |
| SOFR | Secured Over Night Financing Rate. |
| (1) | Central clearinghouse: Chicago Mercantile Exchange (CME). | |
| (2) | Central clearinghouse: London Clearing House (LCH). |
| 168 | See Notes to Financial Statements. |
Schedule of Investments (continued)
FLOATING RATE FUND November 30, 2021
Open Total Return Swap Contracts at November 30, 2021:
| Swap Counterparty | Referenced Index* | Referenced Spread | Units | Position | Termination Date | Notional Amount | Value/ Unrealized Depreciation | |||||||||||
| Barclays Bank plc | IBOXX | 3 Mo. LIBOR + .00% | 391,305 | Long | 12/20/2021 | $ | 72,000,000 | $ | (727,337 | ) | ||||||||
| Barclays Bank plc | IBOXX | 3 Mo. LIBOR + .00% | 270,709 | Long | 6/20/2022 | 50,000,000 | (481,862 | ) | ||||||||||
| Barclays Bank plc | IBOXX | 3 Mo. LIBOR + .00% | 259,628 | Long | 6/20/2022 | 48,000,000 | (508,870 | ) | ||||||||||
| Barclays Bank plc | IBOXX | 3 Mo. LIBOR + .00% | 92,091 | Long | 6/20/2022 | 17,000,000 | (154,712 | ) | ||||||||||
| Barclays Bank plc | IBOXX | 3 Mo. LIBOR + .00% | 135,450 | Long | 6/20/2022 | 25,000,000 | (223,493 | ) | ||||||||||
| Barclays Bank plc | IBOXX | 3 Mo. LIBOR + .00% | 70,434 | Long | 6/20/2022 | 13,000,000 | (116,216 | ) | ||||||||||
| Morgan Stanley | IBOXX | 3 Mo. LIBOR + .00% | 136,355 | Long | 12/20/2021 | 24,966,516 | (130,730 | ) | ||||||||||
| Morgan Stanley | IBOXX | 3 Mo. LIBOR + .00% | 361,402 | Long | 3/20/2022 | 66,543,143 | (572,370 | ) | ||||||||||
| Morgan Stanley | IBOXX | 3 Mo. LIBOR + .00% | 278,010 | Long | 3/20/2022 | 51,334,589 | (586,254 | ) | ||||||||||
| Morgan Stanley | IBOXX | 3 Mo. LIBOR + .00% | 97,508 | Long | 6/20/2022 | 18,000,000 | (163,813 | ) | ||||||||||
| Morgan Stanley | IBOXX | 3 Mo. LIBOR + .00% | 264,110 | Long | 6/20/2022 | 48,807,537 | (496,527 | ) | ||||||||||
| Morgan Stanley | IBOXX | 3 Mo. LIBOR + .00% | 264,110 | Long | 6/20/2022 | 48,807,536 | (496,527 | ) | ||||||||||
| Morgan Stanley | IBOXX | 3 Mo. LIBOR + .00% | 134,954 | Long | 6/20/2022 | 24,966,516 | (280,705 | ) | ||||||||||
| Total | $ | 508,425,837 | $ | (4,939,416 | ) | |||||||||||||
| * | iBoxx Leverage Loan Index |
| LIBOR | London Interbank Offered Rate. |
| See Notes to Financial Statements. | 169 |
Schedule of Investments (continued)
FLOATING RATE FUND November 30, 2021
Open Forward Foreign Currency Exchange Contracts at November 30, 2021:
| Forward Foreign Currency Exchange Contracts | Transaction Type | Counterparty | Expiration Date | Foreign Currency | U.S. $ Cost on Origination Date | U.S. $ Current Value | Unrealized Appreciation | |||||||||||||||
| Euro | Buy | Bank of America | 12/10/2021 | 4,976,000 | $ | 5,575,006 | $ | 5,644,300 | $ | 69,294 | ||||||||||||
| British pound | Sell | Bank of America | 12/7/2021 | 2,027,000 | 2,805,925 | 2,695,823 | 110,102 | |||||||||||||||
| British pound | Sell | Barclays Bank plc | 12/7/2021 | 28,281,000 | 39,208,524 | 37,612,516 | 1,596,008 | |||||||||||||||
| Euro | Sell | Bank of America | 12/10/2021 | 2,685,000 | 3,124,097 | 3,045,608 | 78,489 | |||||||||||||||
| Euro | Sell | Morgan Stanley | 12/10/2021 | 314,000 | 362,991 | 356,172 | 6,819 | |||||||||||||||
| Euro | Sell | Morgan Stanley | 12/10/2021 | 1,931,000 | 2,243,774 | 2,190,342 | 53,432 | |||||||||||||||
| Euro | Sell | State Street Bank and Trust | 12/10/2021 | 68,708,000 | 81,374,114 | 77,935,797 | 3,438,317 | |||||||||||||||
| Euro | Sell | State Street Bank and Trust | 12/10/2021 | 6,091,000 | 7,072,493 | 6,909,049 | 163,444 | |||||||||||||||
| Euro | Sell | Toronto Dominion Bank | 12/10/2021 | 3,156,000 | 3,735,389 | 3,579,865 | 155,524 | |||||||||||||||
| Euro | Sell | Toronto Dominion Bank | 12/10/2021 | 1,758,569 | 2,070,014 | 1,994,752 | 75,262 | |||||||||||||||
| Unrealized Appreciation on Forward Foreign Currency Exchange Contracts | $ | 5,746,691 | ||||||||||||||||||||
| Forward Foreign Currency Exchange Contracts | Transaction Type | Counterparty | Expiration Date | Foreign Currency | U.S. $ Cost on Origination Date | U.S. $ Current Value | Unrealized Depreciation | |||||||||||||||
| British pound | Buy | Morgan Stanley | 12/7/2021 | 927,000 | $ | 1,246,604 | $ | 1,232,870 | $ | (13,734 | ) | |||||||||||
| British pound | Buy | State Street Bank and Trust | 12/7/2021 | 2,679,000 | 3,569,026 | 3,562,955 | (6,071 | ) | ||||||||||||||
| British pound | Buy | UBS AG | 12/7/2021 | 3,095,000 | 4,174,746 | 4,116,217 | (58,529 | ) | ||||||||||||||
| Euro | Buy | Bank of America | 12/10/2021 | 620,000 | 720,181 | 703,269 | (16,912 | ) | ||||||||||||||
| Euro | Buy | Morgan Stanley | 12/10/2021 | 4,702,000 | 5,495,793 | 5,333,500 | (162,293 | ) | ||||||||||||||
| Euro | Buy | Standard Chartered Bank | 12/10/2021 | 7,321,000 | 8,611,405 | 8,304,244 | (307,161 | ) | ||||||||||||||
| Euro | Sell | Morgan Stanley | 12/10/2021 | 6,000,000 | 6,760,762 | 6,805,827 | (45,065 | ) | ||||||||||||||
| Unrealized Depreciation on Forward Foreign Currency Exchange Contracts | $ | (609,765 | ) | |||||||||||||||||||
| 170 | See Notes to Financial Statements. |
Schedule of Investments (continued)
FLOATING RATE FUND November 30, 2021
Open Futures Contracts at November 30, 2021:
| Type | Expiration | Contracts | Position | Notional Amount | Notional Value | Unrealized Depreciation | ||||||||||||
| U.S. 5-Year Treasury Note | March 2022 | 3,023 | Short | $ | (364,172,373 | ) | $ | (366,987,478 | ) | $ | (2,815,105 | ) | ||||||
The following is a summary of the inputs used as of November 30, 2021 in valuing the Fund’s investments carried at fair value(1):
| Investment Type(2) | Level 1 | Level 2 | Level 3 | Total | ||||||||||||
| Long-Term Investments | ||||||||||||||||
| Asset-Backed Securities | $ | – | $ | 12,745,203 | $ | – | $ | 12,745,203 | ||||||||
| Common Stocks | ||||||||||||||||
| Media | 4,911,285 | – | – | 4,911,285 | ||||||||||||
| Remaining Industries | – | 47,297,263 | – | 47,297,263 | ||||||||||||
| Convertible Bonds | – | 47,561,863 | – | 47,561,863 | ||||||||||||
| Corporate Bonds | ||||||||||||||||
| Mining | – | 21,043,161 | 5 | 21,043,166 | ||||||||||||
| Remaining Industries | – | 749,425,393 | – | 749,425,393 | ||||||||||||
| Exchange-Traded Funds | 41,877,299 | – | – | 41,877,299 | ||||||||||||
| Floating Rate Loans | ||||||||||||||||
| Automotive | – | 89,983,762 | 9,637,713 | 99,621,475 | ||||||||||||
| Food/Tobacco | – | 72,760,689 | 190,620 | 72,951,309 | ||||||||||||
| Gaming/Leisure | – | 406,583,268 | 19,006,401 | 425,589,669 | ||||||||||||
| Information Technology | – | 989,049,243 | 11,248,605 | 1,000,297,848 | ||||||||||||
| Manufacturing | – | 588,252,187 | 44,259,384 | 632,511,571 | ||||||||||||
| Service | – | 550,881,761 | 4,178,920 | 555,060,681 | ||||||||||||
| Telecommunications | – | 130,147,525 | 14,938,116 | 145,085,641 | ||||||||||||
| Utility | – | 125,202,440 | 3,143,501 | 128,345,941 | ||||||||||||
| Remaining Industries | – | 2,468,504,668 | – | 2,468,504,668 | ||||||||||||
| Less Unfunded Commitments | – | (37,355,250 | ) | (10,674,129 | ) | (48,029,379 | ) | |||||||||
| Preferred Stocks | – | 22,953,121 | – | 22,953,121 | ||||||||||||
| Warrants | – | 168,652 | – | 168,652 | ||||||||||||
| Short-Term Investments | ||||||||||||||||
| Repurchase Agreements | – | 858,796,061 | – | 858,796,061 | ||||||||||||
| Total | $ | 46,788,584 | $ | 7,144,001,010 | $ | 95,929,136 | $ | 7,286,718,730 | ||||||||
| See Notes to Financial Statements. | 171 |
Schedule of Investments (continued)
FLOATING RATE FUND November 30, 2021
| Investment Type(2) | Level 1 | Level 2 | Level 3 | Total | ||||||||||||
| Other Financial Instruments | ||||||||||||||||
| Centrally Cleared Credit Default Swap Contracts | ||||||||||||||||
| Assets | $ | – | $ | 1,825,272 | $ | – | $ | 1,825,272 | ||||||||
| Liabilities | – | – | – | – | ||||||||||||
| Centrally Cleared Interest Rate Swap Contracts | ||||||||||||||||
| Assets | – | 1,185,596 | – | 1,185,596 | ||||||||||||
| Liabilities | – | (173,779 | ) | – | (173,779 | ) | ||||||||||
| Total Return Swap Contracts | ||||||||||||||||
| Assets | – | – | – | – | ||||||||||||
| Liabilities | – | (4,939,416 | ) | – | (4,939,416 | ) | ||||||||||
| Forward Foreign Currency Exchange Contracts | ||||||||||||||||
| Assets | – | 5,746,691 | – | 5,746,691 | ||||||||||||
| Liabilities | – | (609,765 | ) | – | (609,765 | ) | ||||||||||
| Futures Contracts | ||||||||||||||||
| Assets | – | – | – | – | ||||||||||||
| Liabilities | (2,815,105 | ) | – | – | (2,815,105 | ) | ||||||||||
| Total | $ | (2,815,105 | ) | $ | 3,034,599 | $ | – | $ | 219,494 | |||||||
| (1) | Refer to Note 2(t) for a description of fair value measurements and the three-tier hierarchy of inputs. | |
| (2) | See Schedule of Investments for fair values in each industry and identification of foreign issuers and/or geography. The table above is presented by Investment Type. Industries are presented within an Investment Type should such Investment Type include securities classified as two or more levels within the three-tier fair value hierarchy. When applicable each Level 3 security is identified on the Schedule of Investments along with the valuation technique utilized. |
A reconciliation of Level 3 investments is presented when the Fund has a material amount of Level 3 investments at the beginning or end of the year in relation to the Fund’s net assets.
The following is a reconciliation of investments with unobservable inputs (Level 3) that were used in
| 172 | See Notes to Financial Statements. |
Schedule of Investments (concluded)
FLOATING RATE FUND November 30, 2021
determining fair value:
| Investment Type | Asset- Backed Securities | Common Stocks | Corporate Bonds | Floating Rate Loans | Preferred Stocks | Warrants | ||||||||||||||||||
| Balance as of December 1, 2020 | $ | 7,790,465 | $ | 1,963,955 | $ | 5 | $ | 227,870,190 | $ | 25,086,404 | $ | 31,628 | ||||||||||||
| Accrued Discounts (Premiums) | – | – | – | 358,078 | – | – | ||||||||||||||||||
| Realized Gain (Loss) | – | (7,469,305 | ) | – | 1,689,979 | – | – | |||||||||||||||||
| Change in Unrealized Appreciation (Depreciation) | 369,535 | 7,409,550 | – | (392,263 | ) | – | – | |||||||||||||||||
| Purchases | – | – | – | 52,466,492 | – | – | ||||||||||||||||||
| Sales | (8,160,000 | ) | – | – | (112,595,314 | ) | – | – | ||||||||||||||||
| Transfers into Level 3 | – | – | – | 53,962,620 | – | – | ||||||||||||||||||
| Transfers out of Level 3 | – | (1,904,200 | ) | – | (127,430,651 | ) | (25,086,404 | ) | (31,628 | ) | ||||||||||||||
| Balance as of November 30, 2021 | $ | – | $ | – | $ | 5 | $ | 95,929,131 | $ | – | $ | – | ||||||||||||
| Change in unrealized appreciation/ depreciation for the year ended November 30, 2021, related to Level 3 investments held at November 30, 2021 | $ | – | $ | – | $ | $ | 278,697 | $ | – | $ | – | |||||||||||||
| See Notes to Financial Statements. | 173 |
Schedule of Investments
HIGH YIELD FUND November 30, 2021
| Investments | Interest Rate | Maturity Date | Principal Amount (000) | Fair Value | ||||||||
| LONG-TERM INVESTMENTS 99.50% | ||||||||||||
| ASSET-BACKED SECURITIES 1.32% | ||||||||||||
| Other | ||||||||||||
| AMMC CLO Ltd. 24A E†(a) | Zero Coupon | #(b) | 1/20/2035 | $ | 12,000 | $ | 11,850,000 | |||||
| Carlyle US CLO Ltd. 2021-4A E† | 6.732% (3 Mo. LIBOR + 6.60% | )# | 4/20/2034 | 11,750 | 11,639,522 | |||||||
| CIFC Funding III Ltd. 2021-3A D† | 3.124% (3 Mo. LIBOR + 3.00% | )# | 7/15/2036 | 5,800 | 5,807,761 | |||||||
| Neuberger Berman Loan Advisers CLO Ltd. 2021-45A D† | Zero Coupon | #(b) | 10/14/2035 | 11,000 | 10,956,817 | |||||||
| OCP CLO Ltd. 2021-21A D† | 3.082% (3 Mo. LIBOR + 2.95% | )# | 7/20/2034 | 13,000 | 12,902,500 | |||||||
| OCP CLO Ltd. 2021-22A D†(a) | Zero Coupon | #(b) | 12/2/2034 | 10,000 | 9,959,727 | |||||||
| Perimeter Master Note Business | 5.19% | 5/15/2027 | 12,000 | 12,026,172 | (c) | |||||||
| Perimeter Master Note Business | 8.13% | 5/15/2027 | 5,000 | 4,988,225 | (c) | |||||||
| SEB Funding LLC 2021-1A A2† | 4.969% | 1/30/2052 | 15,790 | 15,846,575 | ||||||||
| Total Asset-Backed Securities (cost $96,160,480) | 95,977,299 | |||||||||||
| Shares (000) | ||||||||||||
| COMMON STOCKS 3.01% | ||||||||||||
| Auto Components 0.12% | ||||||||||||
| Chassix Holdings, Inc. | 160 | 1,635,859 | ||||||||||
| Fox Factory Holding Corp.* | 41 | 7,287,600 | ||||||||||
| Total | 8,923,459 | |||||||||||
| Automobiles 0.10% | ||||||||||||
| Ford Motor Co. | 363 | 6,966,834 | ||||||||||
| Banks 0.15% | ||||||||||||
| Byline Bancorp, Inc. | 129 | 3,350,052 | ||||||||||
| Metropolitan Bank Holding Corp.* | 77 | 7,272,018 | ||||||||||
| Total | 10,622,070 | |||||||||||
| Building Products 0.10% | ||||||||||||
| Trex Co., Inc.* | 56 | 7,387,323 | ||||||||||
| Capital Markets 0.19% | ||||||||||||
| Allfunds Group plc*(d) | EUR | 393 | 6,487,367 | |||||||||
| FactSet Research Systems, Inc. | 16 | 7,343,898 | ||||||||||
| Total | 13,831,265 | |||||||||||
| 174 | See Notes to Financial Statements. |
Schedule of Investments (continued)
HIGH YIELD FUND November 30, 2021
| Investments | Shares (000) | Fair Value | ||||||
| Communications Equipment 0.10% | ||||||||
| Arista Networks, Inc.* | 58 | $ | 7,142,382 | |||||
| Construction & Engineering 0.10% | ||||||||
| Ameresco, Inc. Class A* | 77 | 6,995,697 | ||||||
| Consumer Finance 0.09% | ||||||||
| Atlanticus Holdings Corp.* | 113 | 6,742,452 | ||||||
| Electric-Generation 0.00% | ||||||||
| Frontera Generation | 88 | 191,673 | ||||||
| Entertainment 0.10% | ||||||||
| ROBLOX Corp. Class A* | 59 | 7,462,346 | ||||||
| Food & Staples Retailing 0.21% | ||||||||
| Albertsons Cos., Inc. Class A | 211 | 7,427,659 | ||||||
| United Natural Foods, Inc.* | 149 | 7,421,207 | ||||||
| Total | 14,848,866 | |||||||
| Food Products 0.26% | ||||||||
| B&G Foods, Inc.(e) | 247 | 7,434,849 | ||||||
| Hershey Co. (The) | 40 | 7,185,860 | ||||||
| Vital Farms, Inc.* | 230 | 3,895,015 | ||||||
| Total | 18,515,724 | |||||||
| Health Care Providers & Services 0.11% | ||||||||
| Cross Country Healthcare, Inc.* | 302 | 7,890,118 | ||||||
| Machinery 0.10% | ||||||||
| Illinois Tool Works, Inc. | 31 | 7,214,758 | ||||||
| TNT Crane & Rigging, Inc. | 15 | 277,701 | ||||||
| Total | 7,492,459 | |||||||
| Miscellaneous Financials 0.03% | ||||||||
| UTEX Industries, Inc. | 49 | 2,362,512 | ||||||
| Oil, Gas & Consumable Fuels 0.03% | ||||||||
| Civitas Resources, Inc. | 48 | 2,472,446 | ||||||
| Personal Products 0.12% | ||||||||
| Britax Child Safety, Inc. | 2 | – | (f)(g) | |||||
| Gibson Brands, Inc. | 57 | 8,750,673 | ||||||
| Revlon, Inc. Class A | 702 | 134,630 | ||||||
| Total | 8,885,303 | |||||||
| See Notes to Financial Statements. | 175 |
Schedule of Investments (continued)
HIGH YIELD FUND November 30, 2021
| Investments | Shares (000) | Fair Value | ||||||||||
| Road & Rail 0.10% | ||||||||||||
| Old Dominion Freight Line, Inc. | 21 | $ | 7,405,650 | |||||||||
| Semiconductors & Semiconductor Equipment 0.35% | ||||||||||||
| Advanced Micro Devices, Inc.* | 70 | 11,067,371 | ||||||||||
| ASML Holding NV (Netherlands)(h) | 9 | 7,251,815 | ||||||||||
| Synaptics, Inc.* | 26 | 7,277,558 | ||||||||||
| Total | 25,596,744 | |||||||||||
| Software 0.20% | ||||||||||||
| Atlassian Corp. plc Class A (Australia)*(h) | 19 | 7,144,435 | ||||||||||
| Trade Desk, Inc. (The) Class A* | 70 | 7,240,124 | ||||||||||
| Total | 14,384,559 | |||||||||||
| Specialty Retail 0.25% | ||||||||||||
| Chinos Intermediate | 48 | 776,896 | ||||||||||
| Chinos Intermediate | 56 | 393,722 | ||||||||||
| Claires Holdings LLC | 7 | 2,450,227 | (c) | |||||||||
| Murphy USA, Inc. | 41 | 7,116,410 | ||||||||||
| Tractor Supply Co. | 33 | 7,492,673 | ||||||||||
| Total | 18,229,928 | |||||||||||
| Textiles, Apparel & Luxury Goods 0.19% | ||||||||||||
| Canada Goose Holdings, Inc. (Canada)*(h) | 148 | 6,596,422 | ||||||||||
| Lululemon Athletica, Inc. (Canada)*(h) | 16 | 7,309,639 | ||||||||||
| Total | 13,906,061 | |||||||||||
| Transportation Infrastructure 0.01% | ||||||||||||
| ACBL Holdings Corp. | 22 | 616,799 | ||||||||||
| Total Common Stocks (cost $218,567,829) | 218,872,670 | |||||||||||
| Interest Rate | Maturity Date | Principal Amount (000) | ||||||||||
| CONVERTIBLE BONDS 1.92% | ||||||||||||
| Auto Manufacturers 0.31% | ||||||||||||
| Tesla, Inc. | 2.00% | 5/15/2024 | $ | 1,224 | 22,572,318 | |||||||
| Diversified Financial Services 0.10% | ||||||||||||
| Upstart Holdings, Inc.† | 0.25% | 8/15/2026 | 6,715 | 7,299,073 | ||||||||
| Energy-Alternate Sources 0.09% | ||||||||||||
| SolarEdge Technologies, Inc. (Israel)(h) | Zero Coupon | 9/15/2025 | 5,011 | 6,860,059 | ||||||||
| 176 | See Notes to Financial Statements. |
Schedule of Investments (continued)
HIGH YIELD FUND November 30, 2021
| Investments | Interest Rate | Maturity Date | Principal Amount (000) | Fair Value | ||||||||
| Entertainment 0.10% | ||||||||||||
| Vail Resorts, Inc.† | Zero Coupon | 1/1/2026 | $ | 6,737 | $ | 7,221,222 | ||||||
| Internet 0.24% | ||||||||||||
| Airbnb, Inc.† | Zero Coupon | 3/15/2026 | 7,086 | 7,032,855 | ||||||||
| Shopify, Inc. (Canada)(h) | 0.125% | 11/1/2025 | 8,265 | 10,574,034 | ||||||||
| Total | 17,606,889 | |||||||||||
| Mining 0.10% | ||||||||||||
| Livent Corp. | 4.125% | 7/15/2025 | 2,044 | 7,312,410 | ||||||||
| Miscellaneous Manufacturing 0.10% | ||||||||||||
| John Bean Technologies Corp.† | 0.25% | 5/15/2026 | 6,541 | 7,339,002 | ||||||||
| Oil & Gas 0.09% | ||||||||||||
| Centennial Resource Production LLC | 3.25% | 4/1/2028 | 5,222 | 6,684,160 | ||||||||
| Pharmaceuticals 0.10% | ||||||||||||
| Dexcom, Inc. | 0.75% | 12/1/2023 | 2,046 | 7,004,992 | ||||||||
| REITS 0.10% | ||||||||||||
| IIP Operating Partnership LP† | 3.75% | 2/21/2024 | 1,767 | 6,913,389 | ||||||||
| Retail 0.09% | ||||||||||||
| Dick’s Sporting Goods, Inc. | 3.25% | 4/15/2025 | 1,886 | 6,800,209 | ||||||||
| Software 0.40% | ||||||||||||
| Bill.com Holdings, Inc.† | Zero Coupon | 4/1/2027 | 6,818 | 7,404,348 | ||||||||
| Cloudflare, Inc.† | Zero Coupon | 8/15/2026 | 5,766 | 7,142,633 | ||||||||
| HubSpot, Inc. | 0.375% | 6/1/2025 | 2,556 | 7,538,602 | ||||||||
| New Relic, Inc. | 0.50% | 5/1/2023 | 5,967 | 7,097,412 | ||||||||
| Total | 29,182,995 | |||||||||||
| Transportation 0.10% | ||||||||||||
| Atlas Air Worldwide Holdings, Inc. | 1.875% | 6/1/2024 | 4,464 | 6,908,040 | ||||||||
| Total Convertible Bonds (cost $135,258,676) | 139,704,758 | |||||||||||
| CORPORATE BONDS 84.02% | ||||||||||||
| Advertising 0.97% | ||||||||||||
| Clear Channel Outdoor Holdings, Inc.† | 7.50% | 6/1/2029 | 7,369 | 7,584,138 | ||||||||
| Clear Channel Outdoor Holdings, Inc.† | 7.75% | 4/15/2028 | 16,696 | 17,442,103 | ||||||||
| Lamar Media Corp. | 4.875% | 1/15/2029 | 4,210 | 4,376,463 | ||||||||
| Midas OpCo Holdings LLC† | 5.625% | 8/15/2029 | 8,078 | 8,149,208 | ||||||||
| National CineMedia LLC† | 5.875% | 4/15/2028 | 16,685 | 14,962,774 | ||||||||
| See Notes to Financial Statements. | 177 |
Schedule of Investments (continued)
HIGH YIELD FUND November 30, 2021
| Investments | Interest Rate | Maturity Date | Principal Amount (000) | Fair Value | ||||||||
| Advertising (continued) | ||||||||||||
| Outfront Media Capital LLC/Outfront Media Capital Corp.† | 4.25% | 1/15/2029 | $ | 7,315 | $ | 7,122,067 | ||||||
| Summer BC Bidco B LLC† | 5.50% | 10/31/2026 | 3,374 | 3,405,631 | ||||||||
| Summer BC Holdco A Sarl(d) | 9.25% | 10/31/2027 | EUR | 6,317 | 7,717,826 | |||||||
| Total | 70,760,210 | |||||||||||
| Aerospace/Defense 1.13% | ||||||||||||
| Bombardier, Inc. (Canada)†(h) | 6.00% | 2/15/2028 | $ | 14,916 | 14,830,382 | |||||||
| Bombardier, Inc. (Canada)†(h) | 7.125% | 6/15/2026 | 25,061 | 25,928,111 | ||||||||
| TransDigm, Inc. | 4.625% | 1/15/2029 | 11,038 | 10,592,506 | ||||||||
| TransDigm, Inc. | 5.50% | 11/15/2027 | 18,986 | 19,138,458 | ||||||||
| Triumph Group, Inc. | 7.75% | 8/15/2025 | 11,824 | 11,766,772 | ||||||||
| Total | 82,256,229 | |||||||||||
| Agriculture 0.25% | ||||||||||||
| MHP Lux SA (Luxembourg)†(h) | 6.25% | 9/19/2029 | 11,204 | 10,559,770 | ||||||||
| Turning Point Brands, Inc.† | 5.625% | 2/15/2026 | 7,119 | 7,242,088 | ||||||||
| Total | 17,801,858 | |||||||||||
| Airlines 1.32% | ||||||||||||
| Air Canada (Canada)†(h) | 3.875% | 8/15/2026 | 14,865 | 14,766,668 | ||||||||
| American Airlines Group, Inc.† | 3.75% | 3/1/2025 | 17,325 | 15,458,924 | ||||||||
| American Airlines, Inc.† | 11.75% | 7/15/2025 | 22,489 | 27,310,079 | ||||||||
| Azul Investments LLP† | 7.25% | 6/15/2026 | 7,564 | 6,768,986 | ||||||||
| Hawaiian Brand Intellectual Property Ltd./HawaiianMiles Loyalty Ltd.† | 5.75% | 1/20/2026 | 14,231 | 14,572,884 | ||||||||
| Spirit Loyalty Cayman Ltd./Spirit IP Cayman Ltd.† | 8.00% | 9/20/2025 | 7,608 | 8,329,517 | ||||||||
| Transportes Aereos Portugueses SA†(d) | 5.625% | 12/2/2024 | EUR | 2,800 | 2,566,468 | |||||||
| Transportes Aereos Portugueses SA(d) | 5.625% | 12/2/2024 | EUR | 6,700 | 6,141,192 | |||||||
| Total | 95,914,718 | |||||||||||
| Apparel 0.79% | ||||||||||||
| BK LC Lux Finco1 Sarl(d) | 5.25% | 4/30/2029 | EUR | 6,000 | 7,006,190 | |||||||
| Crocs, Inc.† | 4.125% | 8/15/2031 | $ | 7,859 | 7,829,607 | |||||||
| Crocs, Inc.† | 4.25% | 3/15/2029 | 15,024 | 14,983,210 | ||||||||
| Kontoor Brands, Inc.† | 4.125% | 11/15/2029 | 6,677 | 6,670,590 | ||||||||
| Levi Strauss & Co.† | 3.50% | 3/1/2031 | 10,943 | 11,141,616 | ||||||||
| William Carter Co. (The)† | 5.625% | 3/15/2027 | 2,857 | 2,947,410 | ||||||||
| Wolverine World Wide, Inc.† | 4.00% | 8/15/2029 | 7,355 | 7,142,808 | ||||||||
| Total | 57,721,431 | |||||||||||
| 178 | See Notes to Financial Statements. |
Schedule of Investments (continued)
HIGH YIELD FUND November 30, 2021
| Investments | Interest Rate | Maturity Date | Principal Amount (000) | Fair Value | ||||||||
| Auto Manufacturers 1.29% | ||||||||||||
| Allison Transmission, Inc.† | 3.75% | 1/30/2031 | $ | 8,420 | $ | 8,062,150 | ||||||
| Aston Martin Capital Holdings Ltd. (Jersey)†(h) | 10.50% | 11/30/2025 | 10,635 | 11,532,381 | ||||||||
| Ford Motor Co. | 3.25% | 2/12/2032 | 14,615 | 14,638,969 | ||||||||
| Ford Motor Co. | 4.75% | 1/15/2043 | 29,532 | 31,656,089 | ||||||||
| Ford Motor Credit Co. LLC | 4.00% | 11/13/2030 | 6,602 | 6,935,137 | ||||||||
| Jaguar Land Rover Automotive plc (United Kingdom)†(h) | 4.50% | 10/1/2027 | 8,919 | 8,552,162 | ||||||||
| Wabash National Corp.† | 4.50% | 10/15/2028 | 12,958 | 12,650,247 | ||||||||
| Total | 94,027,135 | |||||||||||
| Auto Parts & Equipment 0.88% | �� | |||||||||||
| Dana, Inc. | 4.25% | 9/1/2030 | 9,357 | 9,316,157 | ||||||||
| Dornoch Debt Merger Sub, Inc.† | 6.625% | 10/15/2029 | 7,575 | 7,470,844 | ||||||||
| Goodyear Tire & Rubber Co. | 4.875% | 3/15/2027 | 7,142 | 7,463,390 | ||||||||
| Meritor, Inc.† | 4.50% | 12/15/2028 | 8,162 | 8,139,840 | ||||||||
| Real Hero Merger Sub 2, Inc.† | 6.25% | 2/1/2029 | 14,416 | 14,483,106 | ||||||||
| Tenneco, Inc. | 5.00% | 7/15/2026 | 11,575 | 11,076,002 | ||||||||
| Tenneco, Inc.† | 5.125% | 4/15/2029 | 6,493 | 6,265,745 | ||||||||
| Total | 64,215,084 | |||||||||||
| Banks 1.37% | ||||||||||||
| CIT Group, Inc. | 6.125% | 3/9/2028 | 15,761 | 18,616,341 | ||||||||
| Credit Suisse Group AG (Switzerland)†(h) | 7.25% (5 Yr. U.S. CMT + 4.33% | )# | – | (i) | 10,437 | 11,428,515 | ||||||
| Macquarie Bank Ltd. (United Kingdom)†(h) | 6.125% (5 Yr. Swap rate + 3.70% | )# | – | (i) | 9,021 | 9,626,174 | ||||||
| SVB Financial Group | 4.25% (5 Yr. Treasury CMT + 3.07% | )# | – | (i) | 10,702 | 10,655,179 | ||||||
| Synovus Financial Corp. | 5.90% (5 Yr. Swap rate + 3.38% | )# | 2/7/2029 | 21,205 | 22,538,612 | |||||||
| Texas Capital Bancshares, Inc. | 4.00% (5 Yr. Treasury CMT + 3.15% | )# | 5/6/2031 | 14,075 | 14,766,785 | |||||||
| Texas Capital Bank NA | 5.25% | 1/31/2026 | 10,952 | 11,922,222 | ||||||||
| Total | 99,553,828 | |||||||||||
| Beverages 0.15% | ||||||||||||
| Triton Water Holdings, Inc.† | 6.25% | 4/1/2029 | 11,004 | 10,705,241 | ||||||||
| Building Materials 0.70% | ||||||||||||
| Builders FirstSource, Inc.† | 4.25% | 2/1/2032 | 18,262 | 18,370,202 | ||||||||
| PGT Innovations, Inc.† | 4.375% | 10/1/2029 | 7,573 | 7,516,846 | ||||||||
| See Notes to Financial Statements. | 179 |
Schedule of Investments (continued)
HIGH YIELD FUND November 30, 2021
| Investments | Interest Rate | Maturity Date | Principal Amount (000) | Fair Value | ||||||||
| Building Materials (continued) | ||||||||||||
| SRM Escrow Issuer LLC† | 6.00% | 11/1/2028 | $ | 7,171 | $ | 7,430,877 | ||||||
| Victors Merger Corp.† | 6.375% | 5/15/2029 | 18,437 | 17,283,213 | ||||||||
| Total | 50,601,138 | |||||||||||
| Chemicals 2.45% | ||||||||||||
| Ashland LLC | 6.875% | 5/15/2043 | 6,343 | 8,021,961 | ||||||||
| Braskem Idesa SAPI (Mexico)†(h) | 7.45% | 11/15/2029 | 14,337 | 14,652,414 | ||||||||
| Chemours Co. (The) | 5.375% | 5/15/2027 | 9,094 | 9,523,146 | ||||||||
| CVR Partners LP/CVR Nitrogen Finance Corp.† | 6.125% | 6/15/2028 | 11,291 | 11,730,897 | ||||||||
| Element Solutions, Inc.† | 3.875% | 9/1/2028 | 7,236 | 7,174,603 | ||||||||
| EverArc Escrow Sarl (Luxembourg)†(h) | 5.00% | 10/30/2029 | 7,962 | 7,772,385 | ||||||||
| Illuminate Buyer LLC/Illuminate Holdings IV, Inc.† | 9.00% | 7/1/2028 | 6,660 | 7,105,854 | ||||||||
| Ingevity Corp.† | 3.875% | 11/1/2028 | 11,339 | 10,880,564 | ||||||||
| LSF11 A5 HoldCo LLC† | 6.625% | 10/15/2029 | 11,362 | 11,078,461 | ||||||||
| Minerals Technologies, Inc.† | 5.00% | 7/1/2028 | 7,655 | 7,734,765 | ||||||||
| NOVA Chemicals Corp. (Canada)†(h) | 4.25% | 5/15/2029 | 8,895 | 8,733,867 | ||||||||
| SCIH Salt Holdings, Inc.† | 6.625% | 5/1/2029 | 14,851 | 13,737,175 | ||||||||
| SPCM SA (France)†(h) | 3.375% | 3/15/2030 | 8,255 | 7,901,108 | ||||||||
| Tianqi Finco Co. Ltd. | 3.75% | 11/28/2022 | 17,771 | 16,793,571 | ||||||||
| Trinseo Materials Operating SCA/Trinseo Materials Finance, Inc. (Luxembourg)†(h) | 5.125% | 4/1/2029 | 9,533 | �� | 9,560,455 | |||||||
| Unifrax Escrow Issuer Corp.† | 5.25% | 9/30/2028 | 7,458 | 7,343,799 | ||||||||
| Unifrax Escrow Issuer Corp.† | 7.50% | 9/30/2029 | 11,438 | 11,111,216 | ||||||||
| Valvoline, Inc.† | 4.25% | 2/15/2030 | 7,491 | 7,444,743 | ||||||||
| Total | 178,300,984 | |||||||||||
| Coal 0.95% | ||||||||||||
| Coronado Finance Pty Ltd. (Australia)†(h) | 10.75% | 5/15/2026 | 12,941 | 14,000,803 | ||||||||
| Indika Energy Capital IV Pte Ltd. (Singapore)(h) | 8.25% | 10/22/2025 | 6,910 | 7,115,987 | ||||||||
| Peabody Energy Corp.† | 6.375% | 3/31/2025 | 17,190 | 15,683,039 | ||||||||
| SunCoke Energy, Inc.† | 4.875% | 6/30/2029 | 7,646 | 7,441,622 | ||||||||
| Warrior Met Coal, Inc.†(a) | 7.875% | 12/1/2028 | 8,207 | 8,297,031 | ||||||||
| Warrior Met Coal, Inc.† | 8.00% | 11/1/2024 | 16,387 | 16,772,504 | ||||||||
| Total | 69,310,986 | |||||||||||
| Commercial Services 2.69% | ||||||||||||
| Ahern Rentals, Inc.† | 7.375% | 5/15/2023 | 9,694 | 9,160,830 | ||||||||
| Alta Equipment Group, Inc.† | 5.625% | 4/15/2026 | 9,405 | 9,629,121 | ||||||||
| AMN Healthcare, Inc.† | 4.00% | 4/15/2029 | 7,120 | 7,184,080 | ||||||||
| APi Escrow Corp.† | 4.75% | 10/15/2029 | 8,787 | 8,912,918 | ||||||||
| 180 | See Notes to Financial Statements. |
Schedule of Investments (continued)
HIGH YIELD FUND November 30, 2021
| Investments | Interest Rate | Maturity Date | Principal Amount (000) | Fair Value | ||||||||
| Commercial Services (continued) | ||||||||||||
| APi Group DE, Inc.† | 4.125% | 7/15/2029 | $ | 7,356 | $ | 7,217,523 | ||||||
| Arena Luxembourg Finance Sarl(d) | 1.875% | 2/1/2028 | EUR | 6,215 | 6,616,465 | |||||||
| Avis Budget Car Rental LLC/Avis Budget Finance, Inc.† | 4.75% | 4/1/2028 | $ | 3,874 | 3,944,158 | |||||||
| Avis Budget Car Rental LLC/Avis Budget Finance, Inc.† | 5.375% | 3/1/2029 | 4,320 | 4,427,266 | ||||||||
| CPI CG, Inc.† | 8.625% | 3/15/2026 | 2,100 | 2,235,103 | ||||||||
| Hertz Corp. (The)† | 4.625% | 12/1/2026 | 3,199 | 3,157,029 | ||||||||
| Hertz Corp. (The)† | 5.00% | 12/1/2029 | 11,482 | 11,271,650 | ||||||||
| Hertz Corp. (The) | 6.00% | 1/15/2028 | 6,517 | 456,190 | ||||||||
| Legends Hospitality Holding Co. LLC/Legends Hospitality Co-Issuer, Inc.† | 5.00% | 2/1/2026 | 7,112 | 7,194,961 | ||||||||
| Limak Iskenderun Uluslararasi Liman Isletmeciligi AS (Turkey)†(h) | 9.50% | 7/10/2036 | 15,034 | 14,412,585 | ||||||||
| Metis Merger Sub LLC† | 6.50% | 5/15/2029 | 7,478 | 7,322,308 | ||||||||
| NESCO Holdings II, Inc.† | 5.50% | 4/15/2029 | 7,347 | 7,467,858 | ||||||||
| PeopleCert Wisdom Issuer plc†(d) | 5.75% | 9/15/2026 | EUR | 2,753 | 3,225,445 | |||||||
| PeopleCert Wisdom Issuer plc(d) | 5.75% | 9/15/2026 | EUR | 6,476 | 7,587,353 | |||||||
| Port of Newcastle Investments Financing Pty Ltd. (Australia)†(h) | 5.90% | 11/24/2031 | $ | 9,736 | 9,750,604 | |||||||
| Prime Security Services Borrower LLC/Prime Finance, Inc.† | 3.375% | 8/31/2027 | 8,463 | 8,020,343 | ||||||||
| Rent-A-Center, Inc.† | 6.375% | 2/15/2029 | 9,636 | 9,898,870 | ||||||||
| Sabre GLBL, Inc.† | 9.25% | 4/15/2025 | 10,290 | 11,463,523 | ||||||||
| Square, Inc.† | 3.50% | 6/1/2031 | 11,104 | 11,277,500 | ||||||||
| Team Health Holdings, Inc.† | 6.375% | 2/1/2025 | 8,449 | 7,415,011 | ||||||||
| TransJamaican Highway Ltd. (Jamaica)†(h) | 5.75% | 10/10/2036 | 10,580 | 10,561,858 | ||||||||
| United Rentals North America, Inc. | 4.00% | 7/15/2030 | 5,304 | 5,410,929 | ||||||||
| Total | 195,221,481 | |||||||||||
| Computers 0.81% | ||||||||||||
| Ahead DB Holdings LLC† | 6.625% | 5/1/2028 | 7,112 | 7,119,254 | ||||||||
| Austin BidCo, Inc.† | 7.125% | 12/15/2028 | 8,421 | 8,657,504 | ||||||||
| CA Magnum Holdings (Mauritius)†(h) | 5.375% | 10/31/2026 | 6,532 | 6,687,135 | ||||||||
| Crowdstrike Holdings, Inc. | 3.00% | 2/15/2029 | 22,502 | 21,729,057 | ||||||||
| Science Applications International Corp.† | 4.875% | 4/1/2028 | 8,027 | 8,230,725 | ||||||||
| Western Digital Corp. | 4.75% | 2/15/2026 | 6,274 | 6,783,480 | ||||||||
| Total | 59,207,155 | |||||||||||
| See Notes to Financial Statements. | 181 |
Schedule of Investments (continued)
HIGH YIELD FUND November 30, 2021
| Investments | Interest Rate | Maturity Date | Principal Amount (000) | Fair Value | ||||||||
| Cosmetics/Personal Care 0.09% | ||||||||||||
| Coty, Inc.† | 5.00% | 4/15/2026 | $ | 6,326 | $ | 6,456,853 | ||||||
| Distribution/Wholesale 0.45% | ||||||||||||
| BCPE Empire Holdings, Inc.† | 7.625% | 5/1/2027 | 8,189 | 8,201,120 | ||||||||
| H&E Equipment Services, Inc.† | 3.875% | 12/15/2028 | 10,963 | 10,669,191 | ||||||||
| Resideo Funding, Inc.† | 4.00% | 9/1/2029 | 14,167 | 13,545,423 | ||||||||
| Total | 32,415,734 | |||||||||||
| Diversified Financial Services 4.33% | ||||||||||||
| Advisor Group Holdings, Inc.† | 10.75% | 8/1/2027 | 8,113 | 8,844,428 | ||||||||
| AG Issuer LLC† | 6.25% | 3/1/2028 | 11,113 | 11,497,677 | ||||||||
| Air Lease Corp. | 4.65% (5 Yr. Treasury CMT + 4.07% | )# | – | (i) | 8,408 | 8,618,200 | ||||||
| Aircastle Ltd.† | 5.25% (5 Yr. Treasury CMT + 4.41% | )# | – | (i) | 7,457 | 7,662,068 | ||||||
| Ally Financial, Inc. | 4.70% (5 Yr. Treasury CMT + 3.87% | )# | – | (i) | 13,225 | 13,679,609 | ||||||
| Armor Holdco, Inc.† | 8.50% | 11/15/2029 | 11,178 | 11,508,310 | ||||||||
| Coinbase Global, Inc.† | 3.375% | 10/1/2028 | 10,805 | 10,174,150 | ||||||||
| Coinbase Global, Inc.† | 3.625% | 10/1/2031 | 21,744 | 20,203,764 | ||||||||
| Curo Group Holdings Corp.† | 7.50% | 8/1/2028 | 7,566 | 7,571,107 | ||||||||
| Global Aircraft Leasing Co. Ltd. PIK 7.25%† | 6.50% | 9/15/2024 | 11,834 | 11,333,658 | ||||||||
| Jane Street Group/JSG Finance, Inc.† | 4.50% | 11/15/2029 | 9,036 | 9,035,684 | ||||||||
| Jefferson Capital Holdings LLC† | 6.00% | 8/15/2026 | 9,419 | 9,391,167 | ||||||||
| Jerrold Finco plc†(d) | 5.25% | 1/15/2027 | GBP | 5,266 | 7,082,656 | |||||||
| LFS Topco LLC† | 5.875% | 10/15/2026 | $ | 7,675 | 7,957,056 | |||||||
| Midcap Financial Issuer Trust† | 6.50% | 5/1/2028 | 13,294 | 13,587,598 | ||||||||
| Nationstar Mortgage Holdings, Inc.† | 5.125% | 12/15/2030 | 6,474 | 6,234,462 | ||||||||
| Nationstar Mortgage Holdings, Inc.† | 5.50% | 8/15/2028 | 7,499 | 7,482,727 | ||||||||
| Navient Corp. | 5.00% | 3/15/2027 | 320 | 321,829 | ||||||||
| Navient Corp. | 6.125% | 3/25/2024 | 6,806 | 7,148,308 | ||||||||
| Navient Corp. | 6.75% | 6/25/2025 | 25,699 | 27,749,909 | ||||||||
| Navient Corp. | 6.75% | 6/15/2026 | 10,548 | 11,419,159 | ||||||||
| OneMain Finance Corp. | 4.00% | 9/15/2030 | 33,485 | 32,363,420 | ||||||||
| OneMain Finance Corp. | 5.375% | 11/15/2029 | 14,410 | 15,193,544 | ||||||||
| PHH Mortgage Corp.† | 7.875% | 3/15/2026 | 14,195 | 14,548,597 | ||||||||
| PRA Group, Inc.† | 5.00% | 10/1/2029 | 7,369 | 7,289,488 | ||||||||
| Rocket Mortgage LLC/Rocket Mortgage Co-Issuer, Inc.† | 3.625% | 3/1/2029 | 6,142 | 6,015,935 | ||||||||
| SCF Preferred Equity LLC† | 7.50% (5 Yr. Treasury CMT + 6.73% | )# | – | (i) | 10,000 | 9,959,748 | ||||||
| VistaJet Malta Finance plc/XO Management Holding, Inc. (Malta)†(h) | 10.50% | 6/1/2024 | 10,235 | 10,973,404 | ||||||||
| Total | 314,847,662 | |||||||||||
| 182 | See Notes to Financial Statements. |
Schedule of Investments (continued)
HIGH YIELD FUND November 30, 2021
| Investments | Interest Rate | Maturity Date | Principal Amount (000) | Fair Value | ||||||||
| Electric 1.41% | ||||||||||||
| Calpine Corp.† | 4.625% | 2/1/2029 | $ | 5,762 | $ | 5,525,499 | ||||||
| Calpine Corp.† | 5.00% | 2/1/2031 | 11,188 | 10,784,449 | ||||||||
| Elwood Energy LLC | 8.159% | 7/5/2026 | 4,557 | 4,686,045 | ||||||||
| JSW Hydro Energy Ltd. (India)†(h) | 4.125% | 5/18/2031 | 8,023 | 7,947,072 | ||||||||
| Leeward Renewable Energy Operations LLC† | 4.25% | 7/1/2029 | 7,252 | 7,192,098 | ||||||||
| Mong Duong Finance Holdings BV (Vietnam)†(h) | 5.125% | 5/7/2029 | 11,225 | 10,870,346 | ||||||||
| NextEra Energy Operating Partners LP† | 4.50% | 9/15/2027 | 10,535 | 11,170,419 | ||||||||
| NSG Holdings LLC/NSG Holdings, Inc.† | 7.75% | 12/15/2025 | 6,328 | 6,769,048 | ||||||||
| Pattern Energy Operations LP/Pattern Energy Operations, Inc.† | 4.50% | 8/15/2028 | 16,419 | 16,723,244 | ||||||||
| Pike Corp.† | 5.50% | 9/1/2028 | 10,685 | 10,796,236 | ||||||||
| Talen Energy Supply LLC | 6.50% | 6/1/2025 | 17,841 | 10,030,121 | ||||||||
| Total | 102,494,577 | |||||||||||
| Electrical Components & Equipment 0.10% | ||||||||||||
| EnerSys† | 4.375% | 12/15/2027 | 6,862 | 7,087,863 | ||||||||
| Electronics 0.30% | ||||||||||||
| Atkore, Inc.† | 4.25% | 6/1/2031 | 14,393 | 14,454,746 | ||||||||
| TTM Technologies, Inc.† | 4.00% | 3/1/2029 | 7,427 | 7,218,524 | ||||||||
| Total | 21,673,270 | |||||||||||
| Energy-Alternate Sources 0.83% | ||||||||||||
| Cullinan Holdco Scsp(d) | 4.625% | 10/15/2026 | EUR | 3,241 | 3,692,528 | |||||||
| Cullinan Holdco Scsp†(d) | 4.625% | 10/15/2026 | EUR | 2,959 | 3,371,240 | |||||||
| Empresa Generadora de Electricidad Haina SA (Dominican Republic)†(h) | 5.625% | 11/8/2028 | $ | 7,658 | 7,732,665 | |||||||
| Investment Energy Resources Ltd.† | 6.25% | 4/26/2029 | 8,699 | 9,074,797 | ||||||||
| Renewable Energy Group, Inc.† | 5.875% | 6/1/2028 | 7,970 | 8,123,502 | ||||||||
| Sunnova Energy Corp.† | 5.875% | 9/1/2026 | 8,753 | 8,880,050 | ||||||||
| TerraForm Power Operating LLC† | 4.75% | 1/15/2030 | 13,087 | 13,311,933 | ||||||||
| TerraForm Power Operating LLC† | 5.00% | 1/31/2028 | 6,161 | 6,421,179 | ||||||||
| Total | 60,607,894 | |||||||||||
| Engineering & Construction 0.93% | ||||||||||||
| Arcosa, Inc.† | 4.375% | 4/15/2029 | 8,502 | 8,590,208 | ||||||||
| Brundage-Bone Concrete Pumping Holdings, Inc.† | 6.00% | 2/1/2026 | 6,852 | 7,120,701 | ||||||||
| Dycom Industries, Inc.† | 4.50% | 4/15/2029 | 10,624 | 10,713,295 | ||||||||
| Great Lakes Dredge & Dock Corp.† | 5.25% | 6/1/2029 | 9,388 | 9,597,165 | ||||||||
| IEA Energy Services LLC† | 6.625% | 8/15/2029 | 7,547 | 7,337,646 | ||||||||
| MasTec, Inc.† | 4.50% | 8/15/2028 | 7,035 | 7,257,095 | ||||||||
| See Notes to Financial Statements. | 183 |
Schedule of Investments (continued)
HIGH YIELD FUND November 30, 2021
| Investments | Interest Rate | Maturity Date | Principal Amount (000) | Fair Value | ||||||||
| Engineering & Construction (continued) | ||||||||||||
| Promontoria Holding 264 BV(d) | 6.75% | 8/15/2023 | EUR | 7,633 | $ | 8,530,636 | ||||||
| Weekley Homes LLC/Weekley Finance Corp.† | 4.875% | 9/15/2028 | $ | 8,150 | 8,403,180 | |||||||
| Total | 67,549,926 | |||||||||||
| Entertainment 3.71% | ||||||||||||
| Affinity Gaming† | 6.875% | 12/15/2027 | 12,779 | 13,127,100 | ||||||||
| AMC Entertainment Holdings, Inc. PIK 12.00%† | 12.00% | 6/15/2026 | 7,602 | 7,318,994 | ||||||||
| ASR Media and Sponsorship SpA(d) | 5.125% | 8/1/2024 | EUR | 5,946 | 6,552,905 | |||||||
| Boyne USA, Inc.† | 4.75% | 5/15/2029 | $ | 5,913 | 5,966,306 | |||||||
| Buena Vista Gaming Authority† | 13.00% | 4/1/2023 | 14,440 | 15,597,438 | ||||||||
| Caesars Entertainment, Inc.† | 4.625% | 10/15/2029 | 7,899 | 7,712,663 | ||||||||
| Caesars Entertainment, Inc.† | 8.125% | 7/1/2027 | 6,501 | 7,141,836 | ||||||||
| CCM Merger, Inc.† | 6.375% | 5/1/2026 | 6,531 | 6,813,498 | ||||||||
| Cedar Fair LP | 5.25% | 7/15/2029 | 10,715 | 11,009,984 | ||||||||
| Churchill Downs, Inc.† | 4.75% | 1/15/2028 | 16,191 | 16,500,572 | ||||||||
| Cinemark USA, Inc.† | 5.25% | 7/15/2028 | 11,603 | 11,013,220 | ||||||||
| Empire Resorts, Inc.† | 7.75% | 11/1/2026 | 7,566 | 7,629,176 | ||||||||
| Everi Holdings, Inc.† | 5.00% | 7/15/2029 | 7,310 | 7,314,569 | ||||||||
| International Game Technology plc† | 5.25% | 1/15/2029 | 10,996 | 11,454,808 | ||||||||
| Lions Gate Capital Holdings LLC† | 5.50% | 4/15/2029 | 9,282 | 9,414,268 | ||||||||
| Live Nation Entertainment, Inc.† | 3.75% | 1/15/2028 | 12,739 | 12,267,657 | ||||||||
| Live Nation Entertainment, Inc.† | 4.75% | 10/15/2027 | 8,549 | 8,558,660 | ||||||||
| Merlin Entertainments Ltd. (United Kingdom)†(h) | 5.75% | 6/15/2026 | 6,691 | 6,921,003 | ||||||||
| Midwest Gaming Borrower LLC/Midwest Gaming Finance Corp† | 4.875% | 5/1/2029 | 8,689 | 8,625,570 | ||||||||
| Mohegan Gaming & Entertainment† | 8.00% | 2/1/2026 | 19,309 | 19,602,304 | ||||||||
| Peninsula Pacific Entertainment LLC/Peninsula Pacific Entertainment Finance In† | 8.50% | 11/15/2027 | 7,462 | 8,088,062 | ||||||||
| Pinewood Finance Co. Ltd.(a)(d) | 3.625% | 11/15/2027 | GBP | 2,114 | 2,799,917 | |||||||
| Pinewood Finance Co. Ltd.†(a)(d) | 3.625% | 11/15/2027 | GBP | 3,140 | 4,158,817 | |||||||
| Raptor Acquisition Corp./Raptor Co-Issuer LLC† | 4.875% | 11/1/2026 | $ | 8,194 | 8,315,107 | |||||||
| Resorts World Las Vegas LLC/RWLV Capital, Inc.† | 4.625% | 4/6/2031 | 10,700 | 10,697,365 | ||||||||
| Scientific Games International, Inc.† | 7.25% | 11/15/2029 | 7,549 | 8,337,342 | ||||||||
| SeaWorld Parks & Entertainment, Inc.† | 5.25% | 8/15/2029 | 10,902 | 10,882,267 | ||||||||
| WMG Acquisition Corp.† | 3.00% | 2/15/2031 | 5,605 | 5,287,561 | ||||||||
| WMG Acquisition Corp.† | 3.75% | 12/1/2029 | 10,353 | 10,291,710 | ||||||||
| Total | 269,400,679 | |||||||||||
| 184 | See Notes to Financial Statements. |
Schedule of Investments (continued)
HIGH YIELD FUND November 30, 2021
| Investments | Interest Rate | Maturity Date | Principal Amount (000) | Fair Value | ||||||||
| Environmental Control 0.20% | ||||||||||||
| Madison IAQ LLC† | 5.875% | 6/30/2029 | $ | 14,893 | $ | 14,351,788 | ||||||
| Food 2.36% | ||||||||||||
| Albertsons Cos., Inc./Safeway, Inc./New Albertsons LP/Albertsons LLC† | 3.50% | 3/15/2029 | 15,178 | 15,065,379 | ||||||||
| Arcor SAIC (Argentina)†(h) | 6.00% | 7/6/2023 | 4,047 | 3,987,003 | ||||||||
| Bellis Finco plc(d) | 4.00% | 2/16/2027 | GBP | 9,100 | 11,269,647 | |||||||
| Chobani LLC/ hobani Finance Corp., Inc.† | 4.625% | 11/15/2028 | $ | 8,105 | 8,236,220 | |||||||
| Ingles Markets, Inc.† | 4.00% | 6/15/2031 | 10,986 | 10,968,862 | ||||||||
| Kraft Heinz Foods Co. | 4.375% | 6/1/2046 | 43,764 | 50,715,757 | ||||||||
| Kraft Heinz Foods Co. | 4.875% | 10/1/2049 | 40,462 | 50,515,922 | ||||||||
| SEG Holding LLC/SEG Finance Corp.† | 5.625% | 10/15/2028 | 8,121 | 8,536,877 | ||||||||
| Tonon Luxembourg SA PIK 6.50% (Luxembourg)†(h) | 6.50% | 10/31/2024 | 1,854 | 834 | ||||||||
| Ulker Biskuvi Sanayi AS (Turkey)†(h) | 6.95% | 10/30/2025 | 11,879 | 12,168,254 | ||||||||
| Total | 171,464,755 | |||||||||||
| Forest Products & Paper 0.30% | ||||||||||||
| Resolute Forest Products, Inc. (Canada)†(h) | 4.875% | 3/1/2026 | 8,309 | 8,304,929 | ||||||||
| Sylvamo Corp.† | 7.00% | 9/1/2029 | 13,065 | 13,510,516 | ||||||||
| Total | 21,815,445 | |||||||||||
| Hand/Machine Tools 0.12% | ||||||||||||
| Sofima Holding SPA†(d) | 3.75% | 1/15/2028 | EUR | 7,617 | 8,486,624 | |||||||
| Health Care-Products 0.04% | ||||||||||||
| Mozart Debt Merger Sub, Inc.† | 3.875% | 4/1/2029 | $ | 3,083 | 3,049,133 | |||||||
| Health Care-Services 4.27% | ||||||||||||
| Acadia Healthcare Co., Inc.† | 5.00% | 4/15/2029 | 10,571 | 10,750,813 | ||||||||
| AHP Health Partners, Inc.† | 5.75% | 7/15/2029 | 7,383 | 7,247,559 | ||||||||
| Air Methods Corp.† | 8.00% | 5/15/2025 | 21,417 | 16,677,311 | ||||||||
| Catalent Pharma Solutions, Inc.† | 3.50% | 4/1/2030 | 12,924 | 12,554,891 | ||||||||
| Centene Corp. | 2.50% | 3/1/2031 | 22,452 | 21,553,920 | ||||||||
| Centene Corp. | 2.625% | 8/1/2031 | 5,433 | 5,247,653 | ||||||||
| Centene Corp. | 3.00% | 10/15/2030 | 16,846 | 16,840,736 | ||||||||
| Centene Corp. | 3.375% | 2/15/2030 | 16,584 | 16,723,927 | ||||||||
| Centene Corp. | 4.625% | 12/15/2029 | 14,430 | 15,461,240 | ||||||||
| Charles River Laboratories International, Inc.† | 4.00% | 3/15/2031 | 7,885 | 7,917,210 | ||||||||
| Charles River Laboratories International, Inc.† | 4.25% | 5/1/2028 | 11,503 | 11,675,545 | ||||||||
| CHS/Community Health Systems, Inc.† | 4.75% | 2/15/2031 | 30,864 | 30,449,265 | ||||||||
| CHS/Community Health Systems, Inc.† | 6.125% | 4/1/2030 | 21,617 | 20,752,644 | ||||||||
| See Notes to Financial Statements. | 185 |
Schedule of Investments (continued)
HIGH YIELD FUND November 30, 2021
| Investments | Interest Rate | Maturity Date | Principal Amount (000) | Fair Value | ||||||||
| Health Care-Services (continued) | ||||||||||||
| HCA, Inc. | 5.50% | 6/15/2047 | $ | 8,352 | $ | 11,017,321 | ||||||
| HCA, Inc. | 5.875% | 2/1/2029 | 14,877 | 17,480,921 | ||||||||
| Legacy LifePoint Health LLC† | 4.375% | 2/15/2027 | 7,537 | 7,434,384 | ||||||||
| ModivCare Escrow Issuer, Inc.† | 5.00% | 10/1/2029 | 7,254 | 7,208,082 | ||||||||
| Molina Healthcare, Inc.† | 3.875% | 11/15/2030 | 16,178 | 16,291,650 | ||||||||
| Radiology Partners, Inc.† | 9.25% | 2/1/2028 | 12,320 | 12,579,459 | ||||||||
| Rede D’or Finance Sarl (Luxembourg)†(h) | 4.95% | 1/17/2028 | 6,824 | 6,779,235 | ||||||||
| Tenet Healthcare Corp.† | 6.125% | 10/1/2028 | 21,037 | 21,514,540 | ||||||||
| US Acute Care Solutions LLC† | 6.375% | 3/1/2026 | 8,569 | 8,790,723 | ||||||||
| US Renal Care, Inc.† | 10.625% | 7/15/2027 | 7,492 | 7,676,940 | ||||||||
| Total | 310,625,969 | |||||||||||
| Home Builders 1.32% | ||||||||||||
| Brookfield Residential Properties, Inc./Brookfield Residential US Corp. (Canada)†(h) | 4.875% | 2/15/2030 | 8,270 | 8,257,078 | ||||||||
| Forestar Group, Inc.† | 3.85% | 5/15/2026 | 6,993 | 6,952,685 | ||||||||
| Forestar Group, Inc.† | 5.00% | 3/1/2028 | 10,769 | 10,965,534 | ||||||||
| Installed Building Products, Inc.† | 5.75% | 2/1/2028 | 6,800 | 7,127,590 | ||||||||
| New Home Co., Inc. (The)† | 7.25% | 10/15/2025 | 8,056 | 8,295,626 | ||||||||
| Shea Homes LP/Shea Homes Funding Corp.† | 4.75% | 4/1/2029 | 7,561 | 7,534,272 | ||||||||
| Toll Brothers Finance Corp. | 4.35% | 2/15/2028 | 19,098 | 20,675,686 | ||||||||
| Tri Pointe Homes, Inc. | 5.25% | 6/1/2027 | 11,135 | 11,937,555 | ||||||||
| Tri Pointe Homes, Inc. | 5.70% | 6/15/2028 | 7,602 | 8,187,506 | ||||||||
| Williams Scotsman International, Inc.† | 4.625% | 8/15/2028 | 5,800 | 5,908,112 | ||||||||
| Total | 95,841,644 | |||||||||||
| Household Products/Wares 0.10% | ||||||||||||
| Central Garden & Pet Co. | 4.125% | 10/15/2030 | 7,554 | 7,559,288 | ||||||||
| Housewares 0.48% | ||||||||||||
| Newell Brands, Inc. | 5.875% | 4/1/2036 | 17,651 | 21,583,202 | ||||||||
| SWF Escrow Issuer Corp.† | 6.50% | 10/1/2029 | 14,114 | 13,569,552 | ||||||||
| Total | 35,152,754 | |||||||||||
| Insurance 0.35% | ||||||||||||
| Acrisure LLC/Acrisure Finance, Inc.† | 6.00% | 8/1/2029 | 3,389 | 3,249,204 | ||||||||
| Ardonagh Midco 2 plc PIK 12.75% (United Kingdom)†(h) | 11.50% | 1/15/2027 | 11,933 | 12,513,701 | ||||||||
| Global Atlantic Fin Co.† | 4.70% (5 Yr. Treasury CMT + 3.80% | )# | 10/15/2051 | 9,203 | 9,428,164 | |||||||
| Total | 25,191,069 | |||||||||||
| 186 | See Notes to Financial Statements. |
Schedule of Investments (continued)
HIGH YIELD FUND November 30, 2021
| Investments | Interest Rate | Maturity Date | Principal Amount (000) | Fair Value | ||||||||
| Internet 2.08% | ||||||||||||
| Arches Buyer, Inc.† | 6.125% | 12/1/2028 | $ | 7,139 | $ | 7,224,739 | ||||||
| Cablevision Lightpath LLC† | 3.875% | 9/15/2027 | 3,856 | 3,753,045 | ||||||||
| Cablevision Lightpath LLC† | 5.625% | 9/15/2028 | 5,345 | 5,234,278 | ||||||||
| GrubHub Holdings, Inc.† | 5.50% | 7/1/2027 | 6,914 | 6,946,772 | ||||||||
| Match Group Holdings II LLC† | 4.125% | 8/1/2030 | 14,673 | 14,579,166 | ||||||||
| Mercadolibre, Inc. (Argentina)(h) | 2.375% | 1/14/2026 | 13,203 | 12,654,547 | ||||||||
| Netflix, Inc.(d) | 3.625% | 5/15/2027 | EUR | 7,331 | 9,503,065 | |||||||
| Netflix, Inc.†(d) | 3.625% | 6/15/2030 | EUR | 11,539 | 15,441,989 | |||||||
| Netflix, Inc.(d) | 4.625% | 5/15/2029 | EUR | 26,406 | 37,131,692 | |||||||
| Northwest Fiber LLC/Northwest Fiber Finance Sub, Inc.† | 10.75% | 6/1/2028 | $ | 10,969 | 12,099,246 | |||||||
| Uber Technologies, Inc.† | 4.50% | 8/15/2029 | 18,320 | 18,171,150 | ||||||||
| Uber Technologies, Inc.† | 6.25% | 1/15/2028 | 7,610 | 8,173,406 | ||||||||
| Total | 150,913,095 | |||||||||||
| Investment Companies 0.37% | ||||||||||||
| Compass Group Diversified Holdings LLC† | 5.00% | 1/15/2032 | 9,066 | 9,078,874 | ||||||||
| Compass Group Diversified Holdings LLC† | 5.25% | 4/15/2029 | 10,337 | 10,654,708 | ||||||||
| Hightower Holding LLC† | 6.75% | 4/15/2029 | 7,111 | 7,198,927 | ||||||||
| Total | 26,932,509 | |||||||||||
| Iron-Steel 0.63% | ||||||||||||
| CSN Resources SA (Brazil)†(h) | 4.625% | 6/10/2031 | 7,920 | 7,170,530 | ||||||||
| TMS International Corp/DE† | 6.25% | 4/15/2029 | 8,373 | 8,428,053 | ||||||||
| United States Steel Corp. | 6.65% | 6/1/2037 | 13,709 | 14,664,997 | ||||||||
| United States Steel Corp. | 6.875% | 3/1/2029 | 15,006 | 15,749,172 | ||||||||
| Total | 46,012,752 | |||||||||||
| Leisure Time 1.54% | ||||||||||||
| Carnival Corp.† | 4.00% | 8/1/2028 | 20,015 | 19,498,313 | ||||||||
| Carnival Corp.† | 5.75% | 3/1/2027 | 8,624 | 8,447,424 | ||||||||
| Carnival Corp.† | 9.875% | 8/1/2027 | 12,515 | 14,110,662 | ||||||||
| Life Time, Inc.† | 5.75% | 1/15/2026 | 14,167 | 14,378,442 | ||||||||
| NCL Corp. Ltd.† | 12.25% | 5/15/2024 | 4,531 | 5,360,853 | ||||||||
| NCL Finance Ltd.† | 6.125% | 3/15/2028 | 6,062 | 5,923,211 | ||||||||
| Pinnacle Bidco plc(d) | 6.375% | 2/15/2025 | GBP | 6,558 | 8,799,828 | |||||||
| Royal Caribbean Cruises Ltd. | 3.70% | 3/15/2028 | $ | 19,482 | 17,818,724 | |||||||
| Royal Caribbean Cruises Ltd.† | 9.125% | 6/15/2023 | 6,707 | 7,127,395 | ||||||||
| Vista Outdoor, Inc.† | 4.50% | 3/15/2029 | 10,181 | 10,167,205 | ||||||||
| Total | 111,632,057 | |||||||||||
| See Notes to Financial Statements. | 187 |
Schedule of Investments (continued)
HIGH YIELD FUND November 30, 2021
| Investments | Interest Rate | Maturity Date | Principal Amount (000) | Fair Value | ||||||||
| Lodging 1.62% | ||||||||||||
| Boyd Gaming Corp. | 4.75% | 12/1/2027 | $ | 8,053 | $ | 8,184,385 | ||||||
| Boyd Gaming Corp.† | 4.75% | 6/15/2031 | 6,074 | 6,051,223 | ||||||||
| Full House Resorts, Inc.† | 8.25% | 2/15/2028 | 15,554 | 16,213,645 | ||||||||
| Genting New York LLC/GENNY Capital, Inc.† | 3.30% | 2/15/2026 | 9,360 | 9,259,108 | ||||||||
| Hilton Domestic Operating Co., Inc. | 4.875% | 1/15/2030 | 7,085 | 7,449,877 | ||||||||
| Hilton Grand Vacations Borrower Escrow LLC/Hilton Grand Vacations Borrower Esc† | 5.00% | 6/1/2029 | 7,421 | 7,381,576 | ||||||||
| MGM Resorts International | 4.625% | 9/1/2026 | 10,121 | 10,244,527 | ||||||||
| MGM Resorts International | 5.50% | 4/15/2027 | 9,882 | 10,310,335 | ||||||||
| Sugarhouse HSP Gaming Prop Mezz LP/Sugarhouse HSP Gaming Finance Corp.† | 5.875% | 5/15/2025 | 7,294 | 7,294,000 | ||||||||
| Travel and Leisure Co.† | 6.625% | 7/31/2026 | 12,472 | 13,519,648 | ||||||||
| Wynn Las Vegas LLC/Wynn Las Vegas Capital Corp.† | 5.25% | 5/15/2027 | 22,095 | 21,711,431 | ||||||||
| Total | 117,619,755 | |||||||||||
| Machinery: Construction & Mining 0.21% | ||||||||||||
| Vertiv Group Corp.† | 4.125% | 11/15/2028 | 15,398 | 15,382,371 | ||||||||
| Machinery-Diversified 0.58% | ||||||||||||
| ATS Automation Tooling Systems, Inc. (Canada)†(h) | 4.125% | 12/15/2028 | 7,462 | 7,526,621 | ||||||||
| Mueller Water Products, Inc.† | 4.00% | 6/15/2029 | 13,114 | 13,129,212 | ||||||||
| TK Elevator US Newco, Inc.† | 5.25% | 7/15/2027 | 14,427 | 14,693,395 | ||||||||
| Vertical Holdco GmbH (Germany)†(h) | 7.625% | 7/15/2028 | 6,735 | 7,044,237 | ||||||||
| Total | 42,393,465 | |||||||||||
| Media 2.07% | ||||||||||||
| AMC Networks, Inc. | 4.25% | 2/15/2029 | 7,408 | 7,243,802 | ||||||||
| Belo Corp. | 7.25% | 9/15/2027 | 11,082 | 12,850,909 | ||||||||
| Block Communications, Inc.† | 4.875% | 3/1/2028 | 7,065 | 7,154,266 | ||||||||
| Cable One, Inc.† | 4.00% | 11/15/2030 | 8,152 | 7,858,691 | ||||||||
| CCO Holdings LLC / CCO Holdings Capital Corp.† | 4.75% | 3/1/2030 | 37,995 | 38,985,340 | ||||||||
| Diamond Sports Group LLC/Diamond Sports Finance Co.† | 5.375% | 8/15/2026 | 13,284 | 5,910,516 | ||||||||
| Entercom Media Corp.† | 6.50% | 5/1/2027 | 8,522 | 8,345,254 | ||||||||
| Gray Escrow II, Inc.† | 5.375% | 11/15/2031 | 10,384 | 10,426,055 | ||||||||
| iHeartCommunications, Inc.† | 4.75% | 1/15/2028 | 8,225 | 8,179,516 | ||||||||
| Radiate Holdco LLC/Radiate Finance, Inc.† | 4.50% | 9/15/2026 | 7,833 | 7,798,848 | ||||||||
| Radiate Holdco LLC/Radiate Finance, Inc.† | 6.50% | 9/15/2028 | 7,055 | 6,853,862 | ||||||||
| Urban One, Inc.† | 7.375% | 2/1/2028 | 7,025 | 7,166,483 | ||||||||
| Virgin Media Secured Finance plc (United Kingdom)†(h) | 5.50% | 5/15/2029 | 20,965 | 21,771,943 | ||||||||
| Total | 150,545,485 | |||||||||||
| 188 | See Notes to Financial Statements. |
Schedule of Investments (continued)
HIGH YIELD FUND November 30, 2021
| Investments | Interest Rate | Maturity Date | Principal Amount (000) | Fair Value | ||||||||
| Metal Fabricate-Hardware 0.10% | ||||||||||||
| Roller Bearing Co. of America, Inc.† | 4.375% | 10/15/2029 | $ | 7,406 | $ | 7,398,594 | ||||||
| Mining 3.44% | ||||||||||||
| Alcoa Nederland Holding BV (Netherlands)†(h) | 4.125% | 3/31/2029 | 14,000 | 14,300,020 | ||||||||
| Alcoa Nederland Holding BV (Netherlands)†(h) | 5.50% | 12/15/2027 | 8,837 | 9,396,205 | ||||||||
| Arconic Corp.† | 6.125% | 2/15/2028 | 7,769 | 8,096,036 | ||||||||
| Century Aluminum Co.† | 7.50% | 4/1/2028 | 7,609 | 8,082,813 | ||||||||
| Coeur Mining, Inc.† | 5.125% | 2/15/2029 | 15,689 | 15,027,081 | ||||||||
| Compass Minerals International, Inc.† | 4.875% | 7/15/2024 | 9,384 | 9,566,800 | ||||||||
| Compass Minerals International, Inc.† | 6.75% | 12/1/2027 | 11,682 | 11,955,651 | ||||||||
| FMG Resources August 2006 Pty Ltd. (Australia)†(h) | 4.375% | 4/1/2031 | 6,977 | 7,082,911 | ||||||||
| FMG Resources August 2006 Pty Ltd. (Australia)†(h) | 4.50% | 9/15/2027 | 21,671 | 22,497,315 | ||||||||
| Freeport-McMoRan, Inc. | 4.25% | 3/1/2030 | 27,788 | 28,854,364 | ||||||||
| Freeport-McMoRan, Inc. | 4.375% | 8/1/2028 | 6,504 | 6,792,680 | ||||||||
| Freeport-McMoRan, Inc. | 5.25% | 9/1/2029 | 22,564 | 24,405,335 | ||||||||
| Freeport-McMoRan, Inc. | 5.45% | 3/15/2043 | 8,972 | 11,074,902 | ||||||||
| Hecla Mining Co. | 7.25% | 2/15/2028 | 10,069 | 10,792,307 | ||||||||
| Hudbay Minerals, Inc. (Canada)†(h) | 4.50% | 4/1/2026 | 10,489 | 10,326,893 | ||||||||
| Hudbay Minerals, Inc. (Canada)†(h) | 6.125% | 4/1/2029 | 9,655 | 10,059,545 | ||||||||
| Joseph T Ryerson & Son, Inc.† | 8.50% | 8/1/2028 | 562 | 614,918 | ||||||||
| Minsur SA (Peru)†(h) | 4.50% | 10/28/2031 | 7,744 | 7,679,531 | ||||||||
| Mirabela Nickel Ltd. | 1.00% | 9/10/2044 | 51 | 5 | (f) | |||||||
| Novelis Corp.† | 3.875% | 8/15/2031 | 11,443 | 11,060,518 | ||||||||
| Taseko Mines Ltd. (Canada)†(h) | 7.00% | 2/15/2026 | 7,785 | 7,920,654 | ||||||||
| Vedanta Resources Finance II plc (United Kingdom)†(h) | 8.95% | 3/11/2025 | 15,365 | 14,718,134 | ||||||||
| Total | 250,304,618 | |||||||||||
| Miscellaneous Manufacturing 0.21% | ||||||||||||
| Amsted Industries, Inc.† | 4.625% | 5/15/2030 | 7,138 | 7,212,984 | ||||||||
| LSB Industries, Inc.† | 6.25% | 10/15/2028 | 7,682 | 7,942,881 | ||||||||
| Total | 15,155,865 | |||||||||||
| Oil & Gas 14.59% | ||||||||||||
| Aethon United BR LP/Aethon United Finance Corp.† | 8.25% | 2/15/2026 | 15,246 | 16,157,406 | ||||||||
| Antero Resources Corp.† | 7.625% | 2/1/2029 | 7,309 | 8,027,475 | ||||||||
| Antero Resources Corp.† | 8.375% | 7/15/2026 | 3,898 | 4,326,936 | ||||||||
| Apache Corp. | 4.375% | 10/15/2028 | 22,448 | 23,698,184 | ||||||||
| Apache Corp. | 4.625% | 11/15/2025 | 12,920 | 13,677,177 | ||||||||
| Apache Corp. | 4.75% | 4/15/2043 | 16,923 | 18,066,995 | ||||||||
| Apache Corp. | 5.10% | 9/1/2040 | 14,777 | 16,054,546 | ||||||||
| See Notes to Financial Statements. | 189 |
Schedule of Investments (continued)
HIGH YIELD FUND November 30, 2021
| Investments | Interest Rate | Maturity Date | Principal Amount (000) | Fair Value | ||||||||
| Oil & Gas (continued) | ||||||||||||
| Berry Petroleum Co. LLC† | 7.00% | 2/15/2026 | $ | 7,192 | $ | 6,887,671 | ||||||
| California Resources Corp.† | 7.125% | 2/1/2026 | 14,199 | 14,655,498 | ||||||||
| Callon Petroleum Co. | 6.125% | 10/1/2024 | 5,101 | 4,920,374 | ||||||||
| Callon Petroleum Co. | 6.375% | 7/1/2026 | 9,172 | 8,551,422 | ||||||||
| Callon Petroleum Co.† | 8.00% | 8/1/2028 | 14,565 | 14,284,842 | ||||||||
| Callon Petroleum Co.† | 9.00% | 4/1/2025 | 17,295 | 18,510,666 | ||||||||
| Canacol Energy Ltd. (Canada)†(h) | 5.75% | 11/24/2028 | 7,379 | 7,191,758 | ||||||||
| Cenovus Energy, Inc. (Canada)(h) | 5.40% | 6/15/2047 | 8,804 | 10,870,382 | ||||||||
| Centennial Resource Production LLC† | 5.375% | 1/15/2026 | 34,198 | 33,667,931 | ||||||||
| Centennial Resource Production LLC† | 6.875% | 4/1/2027 | 14,218 | 14,104,611 | ||||||||
| Civitas Resources, Inc.† | 5.00% | 10/15/2026 | 11,771 | 11,653,290 | ||||||||
| CNX Resources Corp.† | 6.00% | 1/15/2029 | 8,198 | 8,403,999 | ||||||||
| Colgate Energy Partners III LLC† | 5.875% | 7/1/2029 | 16,442 | 16,346,472 | ||||||||
| Colgate Energy Partners III LLC† | 7.75% | 2/15/2026 | 8,654 | 9,217,116 | ||||||||
| Comstock Resources, Inc.† | 5.875% | 1/15/2030 | 12,253 | 12,293,251 | ||||||||
| Comstock Resources, Inc.† | 6.75% | 3/1/2029 | 8,634 | 8,997,189 | ||||||||
| Continental Resources, Inc.† | 5.75% | 1/15/2031 | 15,483 | 18,065,022 | ||||||||
| CrownRock LP/CrownRock Finance, Inc.† | 5.00% | 5/1/2029 | 8,523 | 8,587,860 | ||||||||
| Diamondback Energy, Inc. | 3.50% | 12/1/2029 | 7,040 | 7,394,063 | ||||||||
| Encino Acquisition Partners Holdings LLC† | 8.50% | 5/1/2028 | 16,201 | 16,349,482 | ||||||||
| Endeavor Energy Resources LP/EER Finance, Inc.† | 5.75% | 1/30/2028 | 13,223 | 13,770,763 | ||||||||
| EQT Corp. | 5.00% | 1/15/2029 | 8,097 | 8,881,194 | ||||||||
| EQT Corp. | 6.625% | 2/1/2025 | 24,287 | 27,139,387 | ||||||||
| EQT Corp. | 7.50% | 2/1/2030 | 9,609 | 12,141,020 | ||||||||
| Gulfport Energy Operating Corp.† | 8.00% | 5/17/2026 | 13,871 | 14,941,843 | ||||||||
| Hilcorp Energy I LP/Hilcorp Finance Co.† | 5.75% | 2/1/2029 | 8,644 | 8,522,465 | ||||||||
| Hilcorp Energy I LP/Hilcorp Finance Co.† | 6.00% | 2/1/2031 | 8,362 | 8,344,440 | ||||||||
| Hilcorp Energy I LP/Hilcorp Finance Co.† | 6.25% | 11/1/2028 | 10,280 | 10,457,330 | ||||||||
| Independence Energy Finance LLC† | 7.25% | 5/1/2026 | 10,498 | 10,910,204 | ||||||||
| Kosmos Energy Ltd.† | 7.50% | 3/1/2028 | 13,693 | 12,615,635 | ||||||||
| Laredo Petroleum, Inc.† | 7.75% | 7/31/2029 | 10,693 | 10,136,162 | ||||||||
| Laredo Petroleum, Inc. | 10.125% | 1/15/2028 | 23,524 | 24,049,526 | ||||||||
| Magnolia Oil & Gas Operating LLC/Magnolia Oil & Gas Finance Corp.† | 6.00% | 8/1/2026 | 14,161 | 14,511,485 | ||||||||
| Matador Resources Co. | 5.875% | 9/15/2026 | 30,905 | 31,385,542 | ||||||||
| MC Brazil Downstream Trading Sarl (Brazil)†(h) | 7.25% | 6/30/2031 | 10,814 | 10,414,369 | ||||||||
| Medco Bell Pte Ltd. (Singapore)†(h) | 6.375% | 1/30/2027 | 5,690 | 5,491,874 | ||||||||
| Medco Laurel Tree Pte Ltd. (Singapore)†(h) | 6.95% | 11/12/2028 | 8,168 | 7,919,634 | ||||||||
| Medco Oak Tree Pte Ltd. (Singapore)†(h) | 7.375% | 5/14/2026 | 4,959 | 5,056,767 | ||||||||
| 190 | See Notes to Financial Statements. |
Schedule of Investments (continued)
HIGH YIELD FUND November 30, 2021
| Investments | Interest Rate | Maturity Date | Principal Amount (000) | Fair Value | ||||||||
| Oil & Gas (continued) | ||||||||||||
| MEG Energy Corp. (Canada)†(h) | 5.875% | 2/1/2029 | $ | 13,947 | $ | 13,860,877 | ||||||
| MEG Energy Corp. (Canada)†(h) | 7.125% | 2/1/2027 | 29,625 | 30,338,962 | ||||||||
| Murphy Oil Corp. | 5.875% | 12/1/2027 | 25,196 | 25,700,046 | ||||||||
| Murphy Oil Corp. | 6.375% | 7/15/2028 | 8,096 | 8,363,937 | ||||||||
| Nabors Industries Ltd.† | 7.25% | 1/15/2026 | 14,048 | 12,113,239 | ||||||||
| Nabors Industries, Inc. | 5.75% | 2/1/2025 | 11,888 | 9,960,836 | ||||||||
| Nabors Industries, Inc.† | 7.375% | 5/15/2027 | 7,195 | 7,064,986 | ||||||||
| Oasis Petroleum, Inc.† | 6.375% | 6/1/2026 | 10,189 | 10,489,830 | ||||||||
| Occidental Petroleum Corp. | 3.50% | 8/15/2029 | 18,049 | 17,704,806 | ||||||||
| Occidental Petroleum Corp. | 4.10% | 2/15/2047 | 9,791 | 9,351,139 | ||||||||
| Occidental Petroleum Corp. | 4.40% | 8/15/2049 | 5,123 | 5,041,237 | ||||||||
| Occidental Petroleum Corp. | 6.125% | 1/1/2031 | 50,478 | 58,900,254 | ||||||||
| Occidental Petroleum Corp. | 6.45% | 9/15/2036 | 12,879 | 16,012,074 | ||||||||
| Occidental Petroleum Corp. | 6.625% | 9/1/2030 | 4,222 | 5,071,614 | ||||||||
| Occidental Petroleum Corp. | 7.50% | 5/1/2031 | 3,439 | 4,342,116 | ||||||||
| Ovintiv, Inc. | 6.50% | 8/15/2034 | 13,838 | 17,678,620 | ||||||||
| Ovintiv, Inc. | 6.50% | 2/1/2038 | 13,750 | 17,544,657 | ||||||||
| Patterson-UTI Energy, Inc. | 3.95% | 2/1/2028 | 12,862 | 12,575,661 | ||||||||
| PBF Holding Co. LLC/PBF Finance Corp.† | 9.25% | 5/15/2025 | 18,399 | 17,203,065 | ||||||||
| Precision Drilling Corp. (Canada)†(h) | 6.875% | 1/15/2029 | 7,390 | 7,205,435 | ||||||||
| Precision Drilling Corp. (Canada)†(h) | 7.125% | 1/15/2026 | 10,731 | 10,826,721 | ||||||||
| Range Resources Corp. | 4.875% | 5/15/2025 | 14,259 | 14,579,827 | ||||||||
| Range Resources Corp.† | 8.25% | 1/15/2029 | 8,033 | 8,864,656 | ||||||||
| Rockcliff Energy II LLC† | 5.50% | 10/15/2029 | 10,329 | 10,441,793 | ||||||||
| SierraCol Energy Andina LLC† | 6.00% | 6/15/2028 | 11,155 | 10,252,951 | ||||||||
| SM Energy Co. | 5.625% | 6/1/2025 | 8,718 | 8,651,438 | ||||||||
| SM Energy Co. | 6.625% | 1/15/2027 | 8,583 | 8,645,828 | ||||||||
| SM Energy Co. | 6.75% | 9/15/2026 | 14,967 | 15,038,093 | ||||||||
| Southwestern Energy Co. | 5.375% | 2/1/2029 | 11,282 | 11,636,593 | ||||||||
| Southwestern Energy Co. | 6.45% | 1/23/2025 | 10,561 | 11,472,309 | ||||||||
| Southwestern Energy Co. | 8.375% | 9/15/2028 | 15,515 | 17,118,553 | ||||||||
| Tap Rock Resources LLC† | 7.00% | 10/1/2026 | 3,924 | 3,951,586 | ||||||||
| Transocean Guardian Ltd.† | 5.875% | 1/15/2024 | 10,575 | 9,964,029 | ||||||||
| Tullow Oil plc (United Kingdom)†(h) | 10.25% | 5/15/2026 | 9,907 | 9,871,285 | ||||||||
| Viper Energy Partners LP† | 5.375% | 11/1/2027 | 14,224 | 14,681,515 | ||||||||
| Total | 1,060,171,826 | |||||||||||
| See Notes to Financial Statements. | 191 |
Schedule of Investments (continued)
HIGH YIELD FUND November 30, 2021
| Investments | Interest Rate | Maturity Date | Principal Amount (000) | Fair Value | ||||||||
| Oil & Gas Services 0.97% | ||||||||||||
| Bristow Group, Inc.† | 6.875% | 3/1/2028 | $ | 10,728 | $ | 10,835,280 | ||||||
| Oceaneering International, Inc. | 4.65% | 11/15/2024 | 7,706 | 7,836,925 | ||||||||
| Oceaneering International, Inc. | 6.00% | 2/1/2028 | 16,681 | 16,408,432 | ||||||||
| USA Compression Partners LP/USA Compression Finance Corp. | 6.875% | 9/1/2027 | 6,383 | 6,561,373 | ||||||||
| Weatherford International Ltd.† | 6.50% | 9/15/2028 | 8,887 | 9,142,590 | ||||||||
| Weatherford International Ltd.† | 8.625% | 4/30/2030 | 12,056 | 11,837,184 | ||||||||
| Welltec International ApS (Denmark)†(h) | 8.25% | 10/15/2026 | 5,931 | 6,031,382 | ||||||||
| Welltec International ApS (Denmark)(h) | 8.25% | 10/15/2026 | 1,474 | 1,498,947 | ||||||||
| Total | 70,152,113 | |||||||||||
| Packaging & Containers 0.75% | ||||||||||||
| Ball Corp. | 2.875% | 8/15/2030 | 18,672 | 17,768,742 | ||||||||
| Intertape Polymer Group, Inc. (Canada)†(h) | 4.375% | 6/15/2029 | 11,735 | 11,637,834 | ||||||||
| Pactiv LLC | 7.95% | 12/15/2025 | 9,754 | 10,831,915 | ||||||||
| Sealed Air Corp.† | 6.875% | 7/15/2033 | 11,508 | 14,474,302 | ||||||||
| Total | 54,712,793 | |||||||||||
| Pharmaceuticals 0.33% | ||||||||||||
| 180 Medical, Inc.† | 3.875% | 10/15/2029 | 7,320 | 7,199,074 | ||||||||
| Option Care Health, Inc.† | 4.375% | 10/31/2029 | 9,012 | 8,979,827 | ||||||||
| Owens & Minor, Inc.† | 4.50% | 3/31/2029 | 7,652 | 7,764,389 | ||||||||
| Total | 23,943,290 | |||||||||||
| Pipelines 2.53% | ||||||||||||
| Antero Midstream Partners LP/Antero Midstream Finance Corp.† | 5.375% | 6/15/2029 | 7,460 | 7,556,868 | ||||||||
| Antero Midstream Partners LP/Antero Midstream Finance Corp.† | 7.875% | 5/15/2026 | 6,314 | 6,775,175 | ||||||||
| Buckeye Partners LP | 3.95% | 12/1/2026 | 12,394 | 12,184,046 | ||||||||
| Buckeye Partners LP | 4.125% | 12/1/2027 | 9,654 | 9,555,191 | ||||||||
| Buckeye Partners LP | 6.375% (3 Mo. LIBOR + 4.02% | )# | 1/22/2078 | 17,697 | 15,673,083 | |||||||
| Cheniere Energy Partners LP† | 3.25% | 1/31/2032 | 8,324 | 8,098,919 | ||||||||
| CNX Midstream Partners LP† | 4.75% | 4/15/2030 | 7,415 | 7,314,082 | ||||||||
| CQP Holdco LP/BIP-V Chinook Holdco LLC† | 5.50% | 6/15/2031 | 12,891 | 13,086,814 | ||||||||
| Delek Logistics Partners LP/Delek Logistics Finance Corp.† | 7.125% | 6/1/2028 | 7,247 | 7,513,907 | ||||||||
| Energy Transfer LP | 6.50% (5 Yr. Treasury CMT + 5.69% | )# | – | (i) | 7,974 | 8,173,350 | ||||||
| Northriver Midstream Finance LP (Canada)†(h) | 5.625% | 2/15/2026 | 14,046 | 14,512,046 | ||||||||
| Oasis Midstream Partners LP/OMP Finance Corp.† | 8.00% | 4/1/2029 | 10,115 | 10,787,799 | ||||||||
| 192 | See Notes to Financial Statements. |
Schedule of Investments (continued)
HIGH YIELD FUND November 30, 2021
| Investments | Interest Rate | Maturity Date | Principal Amount (000) | Fair Value | ||||||||
| Pipelines (continued) | ||||||||||||
| Plains All American Pipeline LP | 6.125% (3 Mo. LIBOR + 4.11% | )# | – | (i) | $ | 8,854 | $ | 7,520,322 | ||||
| Targa Resources Partners LP/Targa Resources Partners Finance Corp. | 4.875% | 2/1/2031 | 6,899 | 7,411,630 | ||||||||
| Venture Global Calcasieu Pass LLC† | 3.875% | 8/15/2029 | 5,164 | 5,194,080 | ||||||||
| Venture Global Calcasieu Pass LLC† | 3.875% | 11/1/2033 | 6,494 | 6,526,470 | ||||||||
| Venture Global Calcasieu Pass LLC† | 4.125% | 8/15/2031 | 5,164 | 5,290,002 | ||||||||
| Western Midstream Operating LP | 5.30% | 2/1/2030 | 21,385 | 23,048,753 | ||||||||
| Western Midstream Operating LP | 6.50% | 2/1/2050 | 6,394 | 7,315,599 | ||||||||
| Total | 183,538,136 | |||||||||||
| Real Estate 1.37% | ||||||||||||
| Canary Wharf Group Investment Holdings plc†(d) | 3.375% | 4/23/2028 | GBP | 9,006 | 12,254,780 | |||||||
| Country Garden Holdings Co. Ltd. (China)(h) | 4.80% | 8/6/2030 | $ | 8,106 | 7,395,627 | |||||||
| Cushman & Wakefield US Borrower LLC† | 6.75% | 5/15/2028 | 7,019 | 7,521,104 | ||||||||
| Howard Hughes Corp. (The)† | 4.125% | 2/1/2029 | 5,053 | 4,989,964 | ||||||||
| Howard Hughes Corp. (The)† | 4.375% | 2/1/2031 | 4,958 | 4,912,733 | ||||||||
| Howard Hughes Corp. (The)† | 5.375% | 8/1/2028 | 6,370 | 6,668,976 | ||||||||
| Hunt Cos., Inc.† | 5.25% | 4/15/2029 | 12,833 | 12,512,368 | �� | |||||||
| Kennedy-Wilson, Inc. | 4.75% | 3/1/2029 | 5,827 | 5,913,356 | ||||||||
| Kennedy-Wilson, Inc. | 5.00% | 3/1/2031 | 7,262 | 7,430,006 | ||||||||
| Logan Group Co. Ltd. (China)(h) | 4.50% | 1/13/2028 | 10,033 | 8,778,875 | ||||||||
| Shimao Group Holdings Ltd. (Hong Kong)(h) | 5.20% | 1/16/2027 | 8,621 | 6,035,346 | ||||||||
| Signa Development Finance SCS†(d) | 5.50% | 7/23/2026 | EUR | 8,300 | 8,284,958 | |||||||
| Vivion Investments Sarl(d) | 3.00% | 8/8/2024 | EUR | 6,300 | 6,829,532 | |||||||
| Total | 99,527,625 | |||||||||||
| REITS 1.42% | ||||||||||||
| Apollo Commercial Real Estate Finance, Inc.† | 4.625% | 6/15/2029 | $ | 15,160 | 14,421,329 | |||||||
| HAT Holdings I LLC/HAT Holdings II LLC† | 3.375% | 6/15/2026 | 13,038 | 12,852,600 | ||||||||
| HAT Holdings I LLC/HAT Holdings II LLC† | 3.75% | 9/15/2030 | 12,765 | 12,537,783 | ||||||||
| IIP Operating Partnership LP | 5.50% | 5/25/2026 | 10,342 | 11,140,906 | ||||||||
| Ladder Capital Finance Holdings LLLP/Ladder Capital Finance Corp.† | 4.25% | 2/1/2027 | 17,304 | 17,236,687 | ||||||||
| Ladder Capital Finance Holdings LLLP/Ladder Capital Finance Corp.† | 4.75% | 6/15/2029 | 7,445 | 7,420,953 | ||||||||
| Park Intermediate Holdings LLC/PK Domestic Property LLC/PK Finance Co-Issuer† | 5.875% | 10/1/2028 | 6,912 | 7,134,566 | ||||||||
| VICI Properties LP/VICI Note Co., Inc.† | 4.125% | 8/15/2030 | 9,332 | 9,763,885 | ||||||||
| XHR LP† | 4.875% | 6/1/2029 | 10,856 | 10,953,704 | ||||||||
| Total | 103,462,413 | |||||||||||
| See Notes to Financial Statements. | 193 |
Schedule of Investments (continued)
HIGH YIELD FUND November 30, 2021
| Investments | Interest Rate | Maturity Date | Principal Amount (000) | Fair Value | ||||||||
| Retail 6.09% | ||||||||||||
| Asbury Automotive Group, Inc.† | 4.625% | 11/15/2029 | $ | 3,959 | $ | 3,990,197 | ||||||
| Asbury Automotive Group, Inc.† | 5.00% | 2/15/2032 | 4,742 | 4,779,367 | ||||||||
| Bath & Body Works, Inc. | 6.875% | 11/1/2035 | 18,920 | 22,756,314 | ||||||||
| BCPE Ulysses Intermediate, Inc. PIK 8.50%† | 7.75% | 4/1/2027 | 7,103 | 6,880,463 | ||||||||
| BlueLinx Holdings, Inc.† | 6.00% | 11/15/2029 | 11,002 | 10,855,288 | ||||||||
| Carvana Co.† | 5.50% | 4/15/2027 | 9,044 | 9,046,397 | ||||||||
| Carvana Co.† | 5.625% | 10/1/2025 | 3,434 | 3,443,684 | ||||||||
| Carvana Co.† | 5.875% | 10/1/2028 | 5,626 | 5,656,071 | ||||||||
| CEC Entertainment LLC† | 6.75% | 5/1/2026 | 8,248 | 8,051,409 | ||||||||
| Dutch Lion BV(d) | 11.25% | 6/15/2020 | EUR | 9,153 | 1,038 | (f) | ||||||
| Foot Locker, Inc.† | 4.00% | 10/1/2029 | $ | 11,942 | 11,839,717 | |||||||
| Foundation Building Materials, Inc.† | 6.00% | 3/1/2029 | 7,733 | 7,400,094 | ||||||||
| Gap, Inc. (The)† | 3.625% | 10/1/2029 | 3,619 | 3,468,413 | ||||||||
| Gap, Inc. (The)† | 3.875% | 10/1/2031 | 7,160 | 6,863,361 | ||||||||
| Golden Goose SpA†(d) | 4.875% (3 Mo. EURIBOR + 4.88% | )# | 5/14/2027 | EUR | 10,875 | 12,223,824 | ||||||
| GPS Hospitality Holding Co. LLC/GPS Finco, Inc.† | 7.00% | 8/15/2028 | $ | 8,794 | 7,978,840 | |||||||
| Group 1 Automotive, Inc.† | 4.00% | 8/15/2028 | 8,136 | 8,062,898 | ||||||||
| Guitar Center, Inc.† | 8.50% | 1/15/2026 | 11,915 | 12,657,007 | ||||||||
| Ken Garff Automotive LLC† | 4.875% | 9/15/2028 | 8,212 | 8,161,989 | ||||||||
| L Brands, Inc.† | 6.625% | 10/1/2030 | 9,030 | 10,031,698 | ||||||||
| LBM Acquisition LLC† | 6.25% | 1/15/2029 | 19,656 | 18,848,728 | ||||||||
| LCM Investments Holdings II LLC† | 4.875% | 5/1/2029 | 10,461 | 10,439,712 | ||||||||
| Lithia Motors, Inc.† | 3.875% | 6/1/2029 | 7,181 | 7,278,518 | ||||||||
| Macy’s Retail Holdings LLC | 4.50% | 12/15/2034 | 9,115 | 8,978,594 | ||||||||
| Macy’s Retail Holdings LLC† | 5.875% | 4/1/2029 | 8,705 | 9,292,587 | ||||||||
| Magic Mergeco, Inc.† | 7.875% | 5/1/2029 | 17,867 | 17,771,858 | ||||||||
| Murphy Oil USA, Inc.† | 3.75% | 2/15/2031 | 7,956 | 7,677,540 | ||||||||
| Murphy Oil USA, Inc. | 4.75% | 9/15/2029 | 8,530 | 8,859,642 | ||||||||
| NMG Holding Co., Inc./Neiman Marcus Group LLC† | 7.125% | 4/1/2026 | 10,028 | 10,508,843 | ||||||||
| Papa John’s International, Inc.† | 3.875% | 9/15/2029 | 11,485 | 11,270,575 | ||||||||
| Park River Holdings, Inc.† | 5.625% | 2/1/2029 | 11,637 | 11,056,663 | ||||||||
| Park River Holdings, Inc.† | 6.75% | 8/1/2029 | 12,584 | 12,520,639 | ||||||||
| Party City Holdings, Inc.† | 6.625% | 8/1/2026 | 11,500 | 9,717,500 | ||||||||
| Party City Holdings, Inc.† | 8.75% | 2/15/2026 | 19,610 | 19,809,826 | ||||||||
| PetSmart, Inc./PetSmart Finance Corp.† | 4.75% | 2/15/2028 | 10,410 | 10,552,617 | ||||||||
| PetSmart, Inc./PetSmart Finance Corp.† | 7.75% | 2/15/2029 | 8,708 | 9,325,310 | ||||||||
| Punch Finance plc†(d) | 6.125% | 6/30/2026 | GBP | 6,001 | 8,005,450 | |||||||
| 194 | See Notes to Financial Statements. |
Schedule of Investments (continued)
HIGH YIELD FUND November 30, 2021
| Investments | Interest Rate | Maturity Date | Principal Amount (000) | Fair Value | ||||||||
| Retail (continued) | ||||||||||||
| Sonic Automotive, Inc.† | 4.625% | 11/15/2029 | $ | 3,984 | $ | 3,929,578 | ||||||
| Sonic Automotive, Inc.† | 4.875% | 11/15/2031 | 3,984 | 3,910,236 | ||||||||
| SRS Distribution, Inc.† | 6.00% | 12/1/2029 | 13,811 | 13,680,210 | ||||||||
| Staples, Inc.† | 7.50% | 4/15/2026 | 3,894 | 3,872,116 | ||||||||
| Staples, Inc.† | 10.75% | 4/15/2027 | 11,202 | 10,220,929 | ||||||||
| Stonegate Pub Co. Financing 2019 plc(d) | 8.25% | 7/31/2025 | GBP | 10,826 | 14,683,263 | |||||||
| Victoria’s Secret & Co.† | 4.625% | 7/15/2029 | $ | 10,844 | 10,720,704 | |||||||
| Wendy’s International LLC | 7.00% | 12/15/2025 | 8,091 | 9,136,074 | ||||||||
| White Cap Buyer LLC† | 6.875% | 10/15/2028 | 8,027 | 8,206,203 | ||||||||
| Yum! Brands, Inc. | 5.35% | 11/1/2043 | 7,487 | 8,160,680 | ||||||||
| Total | 442,582,664 | |||||||||||
| Savings & Loans 0.00% | ||||||||||||
| Washington Mutual Bank(j) | 6.875% | 6/15/2011 | 10,000 | 1,000 | (f) | |||||||
| Semiconductors 0.56% | ||||||||||||
| Entegris, Inc.† | 3.625% | 5/1/2029 | 11,060 | 10,992,423 | ||||||||
| ON Semiconductor Corp.† | 3.875% | 9/1/2028 | 18,003 | 18,339,566 | ||||||||
| Synaptics, Inc.† | 4.00% | 6/15/2029 | 10,894 | 11,018,464 | ||||||||
| Total | 40,350,453 | |||||||||||
| Software 1.76% | ||||||||||||
| Castle US Holding Corp.† | 9.50% | 2/15/2028 | 6,793 | 7,151,093 | ||||||||
| Elastic NV† | 4.125% | 7/15/2029 | 7,814 | 7,669,832 | ||||||||
| Fair Isaac Corp.† | 4.00% | 6/15/2028 | 7,451 | 7,447,051 | ||||||||
| MSCI, Inc.† | 3.25% | 8/15/2033 | 14,043 | 14,025,166 | ||||||||
| MSCI, Inc.† | 3.625% | 11/1/2031 | 1,184 | 1,206,484 | ||||||||
| MSCI, Inc.† | 3.875% | 2/15/2031 | 13,695 | 14,116,395 | ||||||||
| Playtika Holding Corp. (Israel)†(h) | 4.25% | 3/15/2029 | 11,064 | 10,515,336 | ||||||||
| Rackspace Technology Global, Inc.† | 5.375% | 12/1/2028 | 7,762 | 7,503,254 | ||||||||
| ROBLOX Corp.† | 3.875% | 5/1/2030 | 13,567 | 13,623,574 | ||||||||
| Rocket Software, Inc.† | 6.50% | 2/15/2029 | 2,476 | 2,339,820 | ||||||||
| Twilio, Inc. | 3.625% | 3/15/2029 | 21,359 | 21,519,406 | ||||||||
| Twilio, Inc. | 3.875% | 3/15/2031 | 13,138 | 13,066,332 | ||||||||
| ZoomInfo Technologies LLC/ZoomInfo Finance Corp.† | 3.875% | 2/1/2029 | 7,821 | 7,662,136 | ||||||||
| Total | 127,845,879 | |||||||||||
| See Notes to Financial Statements. | 195 |
Schedule of Investments (continued)
HIGH YIELD FUND November 30, 2021
| Investments | Interest Rate | Maturity Date | Principal Amount (000) | Fair Value | ||||||||
| Telecommunications 2.18% | ||||||||||||
| Avaya, Inc.† | 6.125% | 9/15/2028 | $ | 7,149 | $ | 7,412,369 | ||||||
| Connect Finco SARL/Connect US Finco LLC (Luxembourg)†(h) | 6.75% | 10/1/2026 | 7,150 | 7,464,100 | ||||||||
| Frontier Communications Holdings LLC† | 5.875% | 10/15/2027 | 10,251 | 10,602,404 | ||||||||
| Frontier Communications Holdings LLC† | 6.00% | 1/15/2030 | 7,423 | 7,315,701 | ||||||||
| Frontier Communications Holdings LLC† | 6.75% | 5/1/2029 | 6,913 | 7,127,303 | ||||||||
| LogMeIn, Inc.† | 5.50% | 9/1/2027 | 14,205 | 14,154,856 | ||||||||
| Sprint Capital Corp. | 6.875% | 11/15/2028 | 57,063 | 70,538,998 | ||||||||
| Switch Ltd.† | 3.75% | 9/15/2028 | 14,300 | 14,178,664 | ||||||||
| Viavi Solutions, Inc.† | 3.75% | 10/1/2029 | 4,700 | 4,601,535 | ||||||||
| Vmed O2 UK Financing I plc (United Kingdom)†(h) | 4.75% | 7/15/2031 | 6,780 | 6,726,235 | ||||||||
| Windstream Escrow LLC/Windstream Escrow Finance Corp.† | 7.75% | 8/15/2028 | 8,181 | 8,536,874 | ||||||||
| Total | 158,659,039 | |||||||||||
| Toys/Games/Hobbies 0.15% | ||||||||||||
| Mattel, Inc. | 5.45% | 11/1/2041 | 9,276 | 10,956,672 | ||||||||
| Transportation 0.71% | ||||||||||||
| Carriage Purchaser, Inc.† | 7.875% | 10/15/2029 | 11,217 | 10,659,627 | ||||||||
| Seaspan Corp. (Hong Kong)†(h) | 5.50% | 8/1/2029 | 14,024 | 13,939,015 | ||||||||
| Watco Cos LLC/Watco Finance Corp.† | 6.50% | 6/15/2027 | 6,581 | 6,909,260 | ||||||||
| XPO CNW, Inc. | 6.70% | 5/1/2034 | 16,239 | 19,789,982 | ||||||||
| Total | 51,297,884 | |||||||||||
| Trucking & Leasing 0.20% | ||||||||||||
| Fortress Transportation and Infrastructure Investors LLC† | 5.50% | 5/1/2028 | 14,981 | 14,714,039 | ||||||||
| Water 0.12% | ||||||||||||
| Solaris Midstream Holdings LLC† | 7.625% | 4/1/2026 | 8,402 | 8,802,019 | ||||||||
| Total Corporate Bonds (cost $5,986,036,447) | 6,106,678,816 | |||||||||||
| FLOATING RATE LOANS(k) 7.54% | ||||||||||||
| Aerospace/Defense 0.37% | ||||||||||||
| Alloy Finco Limited 2020 USD Term Loan B2 (Jersey)(h) | 8.50% (3 Mo. LIBOR + 6.50% | ) | 3/6/2024 | 3,857 | 3,859,266 | |||||||
| Alloy Finco Limited USD Holdco PIK Term Loan PIK 13.50% (Jersey)(h) | 0.50% | 3/6/2025 | 6,682 | 6,694,555 | ||||||||
| Cobham Ultra SeniorCo. S.a.r.l USD Term Loan B (Luxembourg)(h) | – | (l) | 11/16/2028 | 8,123 | 8,113,169 | |||||||
| 196 | See Notes to Financial Statements. |
Schedule of Investments (continued)
HIGH YIELD FUND November 30, 2021
| Investments | Interest Rate | Maturity Date | Principal Amount (000) | Fair Value | ||||||||
| Aerospace/Defense (continued) | ||||||||||||
| WP CPP Holdings, LLC 2018 Term Loan | 4.75% (1 Mo. LIBOR + 3.75% (3 Mo. LIBOR + 3.75% | ) ) | 4/30/2025 | $ | 8,270 | $ | 7,977,504 | |||||
| Total | 26,644,494 | |||||||||||
| Automakers 0.25% | ||||||||||||
| Drive Chassis HoldCo, LLC 2019 2nd Lien Term Loan | 6.874% (3 Mo. LIBOR + 6.00% | ) | 4/10/2026 | 18,411 | 18,549,465 | (m) | ||||||
| Building & Construction 0.28% | ||||||||||||
| Aegion Corporation Term Loan | 5.50% (3 Mo. LIBOR + 4.75% | ) | 5/17/2028 | 7,621 | 7,630,842 | |||||||
| Refficiency Holdings LLC 2021 Term Loan | 4.50% (1 Mo. LIBOR + 3.75% | ) | 12/16/2027 | 4,174 | 4,177,246 | |||||||
| Refficiency Holdings LLC 2021 Delayed Draw Term Loan(n) | 4.00% | 12/31/2027 | 809 | 809,392 | ||||||||
| USIC Holdings, Inc. 2021 2nd Lien Term Loan | 7.25% (1 Mo. LIBOR + 6.50% | ) | 5/7/2029 | 7,760 | 7,853,684 | |||||||
| Total | 20,471,164 | |||||||||||
| Building Materials 0.11% | ||||||||||||
| Associated Asphalt Partners, LLC 2017 Term Loan B | 6.25% (1 Mo. LIBOR + 5.25% | ) | 4/5/2024 | 8,996 | 7,848,628 | |||||||
| Chemicals 0.16% | ||||||||||||
| ASP Unifrax Holdings Inc Term Loan B | 3.882% (3 Mo. LIBOR + 3.75% | ) | 12/12/2025 | 11,721 | 11,527,666 | |||||||
| Discount Stores 0.17% | ||||||||||||
| Claire’s Stores, Inc. 2019 Term Loan B | 6.59% (1 Mo. LIBOR + 6.50% | ) | 12/18/2026 | 4,369 | 4,347,799 | |||||||
| Torrid LLC 2021 Term Loan B | 6.25% (1 Mo. LIBOR + 5.50% | ) | 5/19/2028 | 8,123 | 8,173,296 | |||||||
| Total | 12,521,095 | |||||||||||
| Diversified Capital Goods 0.01% | ||||||||||||
| UTEX Industries Inc. 2020 First Out Exit Term Loan A | 8.50% (1 Mo. LIBOR + 7.00% | ) | 12/3/2025 | 284 | 286,395 | |||||||
| UTEX Industries Inc. 2020 Second Out Term Loan PIK 5.75% | 5.25% (1 Mo. LIBOR + 3.75% | ) | 12/3/2025 | 330 | 325,556 | |||||||
| Total | 611,951 | |||||||||||
| See Notes to Financial Statements. | 197 |
Schedule of Investments (continued)
HIGH YIELD FUND November 30, 2021
| Investments | Interest Rate | Maturity Date | Principal Amount (000) | Fair Value | ||||||||
| Electric: Generation 0.03% | ||||||||||||
| Frontera Generation Holdings LLC 2021 Term Loan | 14.00% (3 Mo. LIBOR + 13.00% | ) | 7/28/2026 | $ | 1,239 | $ | 1,313,628 | (m) | ||||
| Frontera Generation Holdings LLC 2021 2nd Lien Term Loan | 2.50% (3 Mo. LIBOR + 1.50% | ) | 7/28/2028 | 1,197 | 679,198 | |||||||
| Total | 1,992,826 | |||||||||||
| Electronics 0.19% | ||||||||||||
| Brooks Automation, Inc. 2021 2nd Lien Term Loan | – | (l) | 11/4/2029 | 5,453 | 5,473,431 | |||||||
| Electrical Components International, Inc. 2018 1st Lien Term Loan | 4.351% (3 Mo. LIBOR + 4.25% | ) | 6/26/2025 | 8,296 | 8,248,500 | |||||||
| Total | 13,721,931 | |||||||||||
| Environmental 0.12% | ||||||||||||
| Robertshaw US Holding Corp 2018 1st Lien Term Loan | 4.50% (6 Mo. LIBOR + 3.50% | ) | 2/28/2025 | 9,461 | 8,994,045 | |||||||
| Gaming 0.46% | ||||||||||||
| Spectacle Gary Holdings LLC Delayed Draw Term Loan | 11.00% (1 Mo. LIBOR + 9.00% | ) | 12/23/2025 | 475 | 519,523 | |||||||
| Spectacle Gary Holdings LLC Term Loan B | 11.00% (1 Mo. LIBOR + 9.00% | ) | 12/23/2025 | 6,557 | 7,169,432 | |||||||
| The Enterprise Development Authority Term Loan B | 5.00% (1 Mo. LIBOR + 4.25% | ) | 2/18/2028 | 11,936 | 11,980,779 | |||||||
| TopGolf International, Inc. Term Loan B | 7.00% (3 Mo. LIBOR + 6.25% | ) | 2/9/2026 | 13,528 | 13,757,927 | |||||||
| Total | 33,427,661 | |||||||||||
| Gas Distribution 0.51% | ||||||||||||
| BCP Raptor II, LLC 1st Lien Term Loan | 4.84% (1 Mo. LIBOR + 4.75% | ) | 11/3/2025 | 9,898 | 9,870,389 | |||||||
| Brazos Delaware II, LLC Term Loan B | 4.091% (1 Mo. LIBOR + 4.00% | ) | 5/21/2025 | 7,524 | 7,359,564 | |||||||
| Freeport LNG Investments, LLLP Term Loan B | – | (l) | 11/17/2028 | 7,691 | 7,631,883 | |||||||
| Lucid Energy Group II Borrower, LLC 2021 Term Loan | – | (l) | 11/24/2028 | 12,030 | 11,865,010 | |||||||
| Total | 36,726,846 | |||||||||||
| 198 | See Notes to Financial Statements. |
Schedule of Investments (continued)
HIGH YIELD FUND November 30, 2021
| Investments | Interest Rate | Maturity Date | Principal Amount (000) | Fair Value | ||||||||
| Health Facilities 0.26% | ||||||||||||
| Electron BidCo Inc. 2021 Term Loan | 3.75% (3 Mo. LIBOR + 3.25% | ) | 11/1/2028 | $ | 7,602 | $ | 7,572,088 | |||||
| Global Medical Response, Inc. 2017 Incremental Term Loan | 5.25% (6 Mo. LIBOR + 4.25% | ) | 3/14/2025 | 2,692 | 2,676,182 | |||||||
| Medical Solutions L.L.C. 2021 Delayed Draw Term Loan(n) | – | (l) | 11/1/2028 | 1,411 | 1,405,302 | |||||||
| Medical Solutions L.L.C. 2021 First Lien Term Loan | 4.00% (3 Mo. LIBOR + 3.50% | ) | 11/1/2028 | 7,410 | 7,377,835 | |||||||
| Total | 19,031,407 | |||||||||||
| Health Services 0.10% | ||||||||||||
| Pathway Vet Alliance LLC 2021 Term Loan | 3.84% (1 Mo. LIBOR + 3.75% | ) | 3/31/2027 | 7,382 | 7,347,051 | |||||||
| Integrated Energy 0.10% | ||||||||||||
| Esdec Solar Group B.V. Term Loan B (Netherlands)(h) | 5.75% (6 Mo. LIBOR + 5.00% | ) | 8/30/2028 | 7,351 | 7,351,381 | |||||||
| Investments & Miscellaneous Financial Services 0.20% | ||||||||||||
| Armor Holding II LLC 2021 Term Loan B | – | (l) | 10/29/2028 | 7,921 | 7,948,148 | |||||||
| Fender Musical Instruments Corporation 2021 Term Loan B | – | (l) | 12/1/2028 | 6,477 | 6,469,288 | (m) | ||||||
| Total | 14,417,436 | |||||||||||
| Machinery 0.21% | ||||||||||||
| Array Technologies, Inc. Term Loan B | 3.75% (3 Mo. LIBOR + 3.25% | ) | 10/14/2027 | 6,825 | 6,756,436 | |||||||
| CMBF LLC Term Loan | 6.50% (1 Mo. LIBOR + 6.00% | ) | 8/2/2028 | 6,584 | 6,517,805 | |||||||
| CMBF LLC Delayed Draw Term Loan(n) | 3.00% | 8/2/2028 | 1,959 | 1,939,824 | ||||||||
| Total | 15,214,065 | |||||||||||
| Media: Content 0.52% | ||||||||||||
| AppLovin Corporation 2021 Term Loan B | – | (l) | 10/25/2028 | 7,465 | 7,426,983 | |||||||
| ECL Entertainment, LLC Term Loan | 8.25% (1 Mo. LIBOR + 7.50% | ) | 3/31/2028 | 8,510 | 8,693,974 | |||||||
| Gray Television, Inc. 2021 Second Lien Bridge Term Loan(n) | – | (l) | 8/12/2022 | $ | 21,523 | 21,523,310 | (m) | |||||
| Total | 37,644,267 | |||||||||||
| See Notes to Financial Statements. | 199 |
Schedule of Investments (continued)
HIGH YIELD FUND November 30, 2021
| Investments | Interest Rate | Maturity Date | Principal Amount (000) | Fair Value | ||||||||
| Media: Diversified 0.11% | ||||||||||||
| Sweetwater Borrower, LLC Term Loan B | 5.50% (3 Mo. LIBOR + 4.75% | ) | 8/7/2028 | $ | 7,731 | $ | 7,721,259 | |||||
| Medical Products 0.22% | ||||||||||||
| Insulet Corporation Term Loan B | 3.75% (1 Mo. LIBOR + 3.25% | ) | 5/4/2028 | 8,407 | 8,412,070 | |||||||
| MedAssets Software Intermediate Holdings, Inc. 2021 Term Loan | – | (l) | 11/17/2028 | 7,438 | 7,400,476 | |||||||
| Total | 15,812,546 | |||||||||||
| Metals/Mining (Excluding Steel) 0.54% | ||||||||||||
| Alpha Metallurgical Resources, Inc. 2019 Term Loan | 10.00% (3 Mo. LIBOR + 8.00% | ) | 6/14/2024 | 19,785 | 19,680,013 | |||||||
| Peabody Energy Corporation 2018 Term Loan | 2.842% (1 Mo. LIBOR + 2.75% | ) | 3/31/2025 | 22,477 | 19,667,596 | |||||||
| Total | 39,347,609 | |||||||||||
| Oil Field Equipment & Services 0.17% | ||||||||||||
| Ulterra Drilling Technologies, LP Term Loan B | 5.34% (1 Mo. LIBOR + 5.25% | ) | 11/26/2025 | 12,847 | 12,027,811 | |||||||
| Personal & Household Products 0.18% | ||||||||||||
| Britax Child Safety, Inc. Junior PIK Term Loan PIK 12.00% | – | (l) | 3/31/2025 | 1,354 | 1,218,593 | (m) | ||||||
| FGI Operating Company, LLC Exit Term Loan | 10.132% (3 Mo. LIBOR + 10.00% | ) | 5/16/2022 | 655 | 82,260 | (m) | ||||||
| MND Holdings III Corp 2018 1st Lien Term Loan | 4.50% (3 Mo. LIBOR + 3.50% | ) | 6/19/2024 | 11,659 | 11,425,425 | |||||||
| Revlon Consumer Products Corporation 2020 Additional Term Loan B2 | 4.25% (3 Mo. LIBOR + 3.50% | ) | 6/30/2025 | 31 | 22,288 | |||||||
| Total | 12,748,566 | |||||||||||
| Pharmaceuticals 0.08% | ||||||||||||
| LSCS Holdings, Inc. 2021 1st Lien Term Loan | – | (l) | 11/23/2028 | 5,969 | 5,966,317 | |||||||
| Real Estate Investment Trusts 0.26% | ||||||||||||
| Claros Mortgage Trust, Inc. Term Loan B | 6.00% (1 Mo. LIBOR + 5.00% | ) | 8/9/2026 | 7,782 | 7,782,016 | |||||||
| Washington Prime Group, L.P. 2018 Revolver(n) | – | (l) | 12/30/2021 | 5,183 | 5,273,314 | (m) | ||||||
| Washington Prime Group, L.P. 2018 Term Loan | – | (l) | 12/30/2022 | 3,654 | 3,685,697 | |||||||
| Washington Prime Group, L.P. Term Loan | – | (l) | 1/10/2023 | 2,404 | 2,425,053 | |||||||
| Total | 19,166,080 | |||||||||||
| 200 | See Notes to Financial Statements. |
Schedule of Investments (continued)
HIGH YIELD FUND November 30, 2021
| Investments | Interest Rate | Maturity Date | Principal Amount (000) | Fair Value | ||||||||
| Software/Services 0.78% | ||||||||||||
| Anastasia Parent, LLC 2018 Term Loan B | 3.882% (3 Mo. LIBOR + 3.75% | ) | 8/11/2025 | $ | 13,080 | $ | 11,367,882 | |||||
| Banff Merger Sub Inc 2021 USD 2nd Lien Term Loan | 6.00% (3 Mo. LIBOR + 5.50% | ) | 2/27/2026 | 7,437 | 7,522,679 | |||||||
| Escape Velocity Holdings, Inc. 2021 Term Loan | 4.75% (3 Mo. LIBOR + 4.25% | ) | 10/8/2028 | 6,261 | 6,237,414 | |||||||
| Grab Holdings Inc Term Loan B | 5.50% (1 Mo. LIBOR + 4.50% | ) | 1/29/2026 | 7,202 | 7,280,000 | |||||||
| Magenta Buyer LLC 2021 USD 1st Lien Term Loan | 5.75% (3 Mo. LIBOR + 5.00% | ) | 7/27/2028 | 9,206 | 9,082,963 | |||||||
| Red Planet Borrower, LLC Term Loan B | 4.25% (3 Mo. LIBOR + 3.75% | ) | 10/2/2028 | 11,686 | 11,610,299 | |||||||
| Ultimate Software Group Inc (The) 2021 2nd Lien Term Loan | – | (l) | 5/3/2027 | 3,503 | 3,528,645 | |||||||
| Total | 56,629,882 | |||||||||||
| Specialty Retail 0.02% | ||||||||||||
| Chinos Intermediate Holdings A, Inc. Exit Term Loan | 11.00% (3 Mo. LIBOR + 10.00% | ) | 9/10/2027 | 1,399 | 1,528,088 | |||||||
| Support: Services 0.41% | ||||||||||||
| AVSC Holding Corp. 2020 Term Loan B1 | – | (l) | 3/3/2025 | 7,368 | 6,718,422 | |||||||
| SSH Group Holdings, Inc. 2018 1st Lien Term Loan | 4.382% (3 Mo. LIBOR + 4.25% | ) | 7/30/2025 | 7,745 | 7,437,523 | |||||||
| Think & Learn Private Limited Term Loan B (India)(h) | – | (l) | 11/5/2026 | 13,600 | 13,591,524 | |||||||
| Trans Union, LLC 2021 2nd Lien Term Loan | – | (l) | 11/16/2029 | 2,183 | 2,183,377 | (m) | ||||||
| Total | 29,930,846 | |||||||||||
| Technology Hardware & Equipment 0.11% | ||||||||||||
| Delta TopCo, Inc. 2020 2nd Lien Term Loan | 8.00% (3 Mo. LIBOR + 7.25% | ) | 12/1/2028 | 8,146 | 8,227,435 | |||||||
| Theaters & Entertainment 0.42% | ||||||||||||
| AMC Entertainment Holdings, Inc. 2019 Term Loan B | 3.09% (1 Mo. LIBOR + 3.00% | ) | 4/22/2026 | 8,307 | 7,505,151 | |||||||
| Cinemark USA, Inc. 2018 Term Loan B | 1.85% (1 Mo. LIBOR + 1.75% | ) | 3/31/2025 | 4,676 | 4,482,696 | |||||||
| City Football Group Limited Term Loan (United Kingdom)(h) | 4.00% (6 Mo. LIBOR + 3.50% | ) | 7/21/2028 | 7,401 | 7,364,136 | |||||||
| Equinox Holdings, Inc. 2017 1st Lien Term Loan | 4.00% (3 Mo. LIBOR + 3.00% | ) | 3/8/2024 | 5,864 | 5,593,673 | |||||||
| Equinox Holdings, Inc. 2020 Term Loan B2 | 10.00% (3 Mo. LIBOR + 9.00% | ) | 3/8/2024 | 5,761 | 5,818,677 | (m) | ||||||
| Total | 30,764,333 | |||||||||||
| See Notes to Financial Statements. | 201 |
Schedule of Investments (continued)
HIGH YIELD FUND November 30, 2021
| Investments | Interest Rate | Maturity Date | Principal Amount (000) | Fair Value | |||||||||
| Transportation: Infrastructure/Services 0.06% | |||||||||||||
| Echo Global Logistics, Inc. Term Loan | 4.25% (3 Mo. LIBOR + 3.75% | ) | 11/4/2028 | $ | 4,725 | $ | 4,707,794 | ||||||
| Trucking & Delivery 0.13% | |||||||||||||
| Carriage Purchaser, Inc. 2021 Term Loan B | 5.00% (2 Mo. LIBOR + 4.25% | ) | 9/30/2028 | 9,093 | 9,112,939 | ||||||||
| Total Floating Rate Loans (cost $530,851,985) | 547,734,884 | ||||||||||||
| FOREIGN GOVERNMENT OBLIGATIONS(h) 0.24% | |||||||||||||
| Bahamas 0.13% | |||||||||||||
| Bahamas Government International Bond† | 8.95% | 10/15/2032 | 9,731 | 9,251,845 | |||||||||
| Sri Lanka 0.11% | |||||||||||||
| Republic of Sri Lanka† | 5.875% | 7/25/2022 | 10,289 | 7,806,676 | |||||||||
| Total Foreign Government Obligations (cost $19,052,746) | 17,058,521 | ||||||||||||
| NON-AGENCY COMMERCIAL MORTGAGE-BACKED SECURITIES 1.38% | |||||||||||||
| BFLD 2019-DPLO F† | 2.63% (1 Mo. LIBOR + 2.54% | )# | 10/15/2034 | 13,940 | 13,598,123 | ||||||||
| Credit Suisse Mortgage Capital Certificates Trust 2021-BPNY A† | 3.804% (1 Mo. LIBOR + 3.71% | )# | 8/15/2023 | 15,000 | 14,982,403 | ||||||||
| Fontainebleau Miami Beach Trust 2019-FBLU F† | 4.095% | #(o) | 12/10/2036 | 16,117 | 16,042,425 | ||||||||
| Great Wolf Trust 2019-WOLF E† | 2.822% (1 Mo. LIBOR + 2.73% | )# | 12/15/2036 | 17,457 | 16,934,184 | ||||||||
| Great Wolf Trust 2019-WOLF F† | 3.221% (1 Mo. LIBOR + 3.13% | )# | 12/15/2036 | 4,399 | 4,277,393 | ||||||||
| GS Mortgage Securities Corp. Trust 2021-RSMZ MZ† | 9.59% (1 Mo. LIBOR + 9.50% | )# | 6/15/2026 | 20,000 | 20,032,934 | ||||||||
| JP Morgan Chase Commercial Mortgage Securities Trust 2021-1440 E† | 3.94% (1 Mo. LIBOR + 3.85% | )# | 3/15/2036 | 14,650 | 14,639,763 | ||||||||
| Total Non-Agency Commercial Mortgage-Backed Securities (cost $100,741,128) | 100,507,225 | ||||||||||||
| Dividend Rate | Shares (000) | ||||||||||||
| PREFERRED STOCKS 0.07% | |||||||||||||
| Transportation Infrastructure | |||||||||||||
| ACBL Holdings Corp. Series A | Zero Coupon | 83 | 2,191,656 | ||||||||||
| ACBL Holdings Corp. Series B | Zero Coupon | 102 | 3,111,427 | ||||||||||
| Total Preferred Stocks (cost $4,617,950) | 5,303,083 | ||||||||||||
| 202 | See Notes to Financial Statements. |
Schedule of Investments (continued)
HIGH YIELD FUND November 30, 2021
| Investments | Exercise Price | Expiration Date | Shares (000) | Fair Value | |||||||||
| WARRANTS 0.00% | |||||||||||||
| Machinery 0.00% | |||||||||||||
| TNT Crane & Rigging, Inc.* | $4.00 | 10/16/2025 | 26 | $ | 52,638 | ||||||||
| Miscellaneous Financials 0.00% | |||||||||||||
| Sable Permian Resources†*(j) | – | (p) | 2/1/2024 | 6 | 163,158 | ||||||||
| Total Warrants (cost $138,888) | 215,796 | ||||||||||||
| Total Long-Term Investments (cost $7,091,426,129) | 7,232,053,052 | ||||||||||||
| Principal Amount (000) | |||||||||||||
| SHORT-TERM INVESTMENTS 0.26% | |||||||||||||
| REPURCHASE AGREEMENTS 0.16% | |||||||||||||
| Repurchase Agreement dated 11/30/2021, 0.00% due 12/1/2021 with Fixed Income Clearing Corp. collateralized by $11,150,400 of U.S. Treasury Note at 2.75% due 04/30/2023; value: $11,554,312; proceeds: $11,327,717 (cost $11,327,717) | $ | 11,328 | 11,327,717 | ||||||||||
| Shares | |||||||||||||
| Money Market Funds 0.09% | |||||||||||||
| Fidelity Government Portfolio(q) (cost $6,675,019) | 6,675,019 | 6,675,019 | |||||||||||
| Time Deposits 0.01% | |||||||||||||
| CitiBank N.A.(q) (cost $741,669) | 741,669 | 741,669 | |||||||||||
| Total Short-Term Investments (cost $18,744,405) | 18,744,405 | ||||||||||||
| Total Investments in Securities 99.76% (cost $7,110,170,534) | 7,250,797,457 | ||||||||||||
| Less Unfunded Loan Commitments (0.35%) (cost $25,720,409)(r) | (25,702,166 | ) | |||||||||||
| Net Investments in Securities 99.41% (cost $7,084,450,125) | 7,225,095,291 | ||||||||||||
| Other Assets and Liabilities – Net(s) 0.59% | 43,230,936 | ||||||||||||
| Net Assets 100.00% | $ | 7,268,326,227 | |||||||||||
| EUR | Euro. | |
| GBP | British Pound. | |
| CMT | Constant Maturity Rate. | |
| EURIBOR | Euro Interbank Offered Rate. | |
| LIBOR | London Interbank Offered Rate. | |
| PIK | Payment-in-kind. |
| See Notes to Financial Statements. | 203 |
Schedule of Investments (continued)
HIGH YIELD FUND November 30, 2021
| † | Security was purchased pursuant to Rule 144A under the Securities Act of 1933 and, unless registered under such Act or exempted from registration, may only be resold to qualified institutional buyers. At November 30, 2021, the total value of Rule 144A securities was $4,416,289,466, which represents 60.76% of net assets. | |
| # | Variable rate security. The interest rate represents the rate in effect at November 30, 2021. | |
| * | Non-income producing security. | |
| (a) | Securities purchased on a when-issued basis (See Note 2(j)). | |
| (b) | Variable Rate is Fixed to Float: Rate remains fixed or at Zero Coupon until designated future date. | |
| (c) | Level 3 Investment as described in Note 2(t) in the Notes to Financials. Security valued utilizing third party pricing information without adjustment. Such valuations are based on unobservable inputs. A significant change in third party information could result in a significantly lower or higher value of such Level 3 investments. | |
| (d) | Investment in non-U.S. dollar denominated securities. | |
| (e) | All or a portion of this security is temporarily on loan to unaffiliated broker/dealers. | |
| (f) | Level 3 Investment as described in Note 2(t) in the Notes to Financials. Security fair valued by the Pricing Committee. | |
| (g) | Amount is less than $1,000. | |
| (h) | Foreign security traded in U.S. dollars. | |
| (i) | Security is perpetual in nature and has no stated maturity. | |
| (j) | Defaulted (non-income producing security). | |
| (k) | Floating Rate Loans in which the Fund invests generally pay interest at rates which are periodically re-determined at a margin above the London Interbank Offered Rate (“LIBOR”) or the prime rate offered by major U.S. banks. The rate(s) shown is the rate(s) in effect at November 30, 2021. | |
| (l) | Interest rate to be determined. | |
| (m) | Level 3 Investment as described in Note 2(t) in the Notes to Financials. Floating Rate Loans categorized as Level 3 are valued based on a single quotation obtained from a dealer. Accounting principles generally accepted in the United States of America do not require the Fund to create quantitative unobservable inputs that were not developed by the Fund. Therefore, the Fund does not have access to unobservable inputs and cannot disclose such inputs in the valuation. | |
| (n) | Security partially/fully unfunded. See Note (2(o)). | |
| (o) | Interest rate is based on the weighted average interest rates of the underlying mortgages within the mortgage pool. | |
| (p) | Cashless strike price. | |
| (q) | Security was purchased with the cash collateral from loaned securities. | |
| (r) | See Note (2(o)). | |
| (s) | Other Assets and Liabilities - Net include net unrealized appreciation/depreciation on forward foreign currency exchange contracts, futures contracts and swaps as follows: |
Centrally Cleared Credit Default Swaps on Indexes - Buy Protection at November 30, 2021(1):
| Referenced Indexes/Issuers | Central Clearing Party | Fund Pays (Quarterly) | Termination Date | Notional Amount | Payments Upfront(2) | Value/ Unrealized Appreciation(3) | ||||||||
| Markit.CDX.NA.EM.36(4)(6) | Bank of America | 1.00% | 12/20/2026 | $302,340,000 | $10,700,151 | $ | 5,456,089 | |||||||
| Republic of Brazil(4)(5) | Bank of America | 1.00% | 12/20/2026 | 31,896,357 | 2,019,287 | 328,374 | ||||||||
| $12,719,438 | $ | 5,784,463 | ||||||||||||
Centrally Cleared Credit Default Swaps on Indexes - Sell Protection at November 30, 2021(1):
| Referenced Indexes | Central Clearing Party | Fund Pays (Quarterly) | Termination Date | Notional Amount | Payments Upfront(2) | Value/ Unrealized Depreciation(3) | ||||||
| Markit.CDX.NA.HY.37(4)(7) | Bank of America | 5.00% | 12/20/2026 | $62,496,000 | $4,818,029 | $(64,820) | ||||||
| 204 | See Notes to Financial Statements. |
Schedule of Investments (continued)
HIGH YIELD FUND November 30, 2021
| (1) | If the Fund is a buyer of protection and a credit event occurs, as defined under the terms of that particular swap agreement, the Fund will either (i) receive from the seller of protection an amount equal to the notional amount of the swap and take delivery of the referenced obligation or underlying securities comprising the referenced index or (ii) pay net settlement amount in the form of cash or securities equal to the notional amount of the swap less the recovery value of the referenced obligation or underlying securities. If the Fund is a seller of protection and a credit event occurs, as defined under the terms of that particular swap agreement, the Fund will either (i) pay to the buyer of protection an amount equal to the notional amount of the swap and take delivery of the referenced obligation or underlying securities comprising the referenced index or (ii) pay a net settlement amount in the form of cash or securities equal to the notional amount of the swap less the recovery value of the referenced obligation or underlying securities. | |
| (2) | Upfront payments received/paid by Central Clearing Party are presented net of amortization. | |
| (3) | Total unrealized appreciation on Credit Default Swaps on Indexes amounted to $5,784,463. Total unrealized depreciation on Credit Default Swaps on Indexes amounted to $64,820. | |
| (4) | Central Clearinghouse: Intercontinental Exchange (ICE). | |
| (5) | Moody’s Credit Rating: Ba2 | |
| (6) | The Referenced Index is for the Centrally Cleared Credit Default Swaps on Indexes, which is comprised of a basket of emerging markets sovereign issuers. | |
| (7) | The Referenced Index is for the Centrally Cleared Credit Default Swaps on Indexes, which is comprised of a basket of high yield securities. |
Credit Default Swaps on Indexes - Sell Protection at November 30, 2021(1):
| Referenced Index* | Swap Counterparty | Fund Receives (Quarterly) | Termination Date | Notional Amount | Payments Upfront(2) | Unrealized Appreciation/ (Depreciation)(3) | Credit Default Swap Agreements Payable at Fair Value(4) | |||||||||||||||
| Markit CMBX.NA.BBB-.10 | Goldman | 3.000% | 11/17/2059 | $ | 5,460,000 | $ | (827,534 | ) | $278,913 | $ | (548,621 | ) | ||||||||||
| Markit CMBX.NA.A.6 | JPMorgan | 2.000% | 5/11/2063 | 10,000,000 | (980,343 | ) | (7,552 | ) | (987,895 | ) | ||||||||||||
| Markit CMBX.NA.A.6 | JPMorgan | 2.000% | 5/11/2063 | 10,000,000 | (980,279 | ) | (7,616 | ) | (987,895 | ) | ||||||||||||
| Markit CMBX.NA.BBB-.10 | Merrill Lynch | 3.000% | 11/17/2059 | 10,000,000 | (1,674,339 | ) | 669,539 | (1,004,800 | ) | |||||||||||||
| Markit CMBX.NA.BBB-.10 | Morgan Stanley | 3.000% | 11/17/2059 | 3,426,000 | (558,143 | ) | 213,899 | (344,244 | ) | |||||||||||||
| Markit CMBX.NA.BBB-.10 | Morgan Stanley | 3.000% | 11/17/2059 | 7,278,000 | (1,200,837 | ) | 469,544 | (731,293 | ) | |||||||||||||
| Markit CMBX.NA.BBB-.10 | Morgan Stanley | 3.000% | 11/17/2059 | 12,055,000 | (2,014,338 | ) | 803,052 | (1,211,286 | ) | |||||||||||||
| Markit CMBX.NA.BBB-.10 | Morgan Stanley | 3.000% | 11/17/2059 | 7,413,000 | (1,338,632 | ) | 593,774 | (744,858 | ) | |||||||||||||
| Markit CMBX.NA.BBB-.10 | Morgan Stanley | 3.000% | 11/17/2059 | 7,214,000 | (962,159 | ) | 237,296 | (724,863 | ) | |||||||||||||
| Markit CMBX.NA.BBB-.10 | Morgan Stanley | 3.000% | 11/17/2059 | 14,423,000 | (1,858,921 | ) | 409,699 | (1,449,222 | ) | |||||||||||||
| Markit CMBX.NA.BBB-.10 | Morgan Stanley | 3.000% | 11/17/2059 | 3,607,000 | (456,103 | ) | 93,672 | (362,431 | ) | |||||||||||||
| Markit CMBX.NA.BBB-.10 | Morgan Stanley | 3.000% | 11/17/2059 | 7,212,000 | (929,525 | ) | 204,864 | (724,661 | ) | |||||||||||||
| Markit CMBX.NA.BBB-.10 | Morgan Stanley | 3.000% | 11/17/2059 | 2,470,000 | (356,928 | ) | 108,742 | (248,186 | ) | |||||||||||||
| See Notes to Financial Statements. | 205 |
Schedule of Investments (continued)
HIGH YIELD FUND November 30, 2021
| Referenced Index* | Swap Counterparty | Fund Receives (Quarterly) | Termination Date | Notional Amount | Payments Upfront(2) | Unrealized Appreciation/ (Depreciation)(3) | Credit Default Swap Agreements Payable at Fair Value(4) | |||||||||||||||
| Markit CMBX.NA.BBB-.9 | Citibank | 3.000% | 9/17/2058 | $ | 9,545,000 | $ | (2,131,630 | ) | $1,224,181 | $ | (907,449 | ) | ||||||||||
| Markit CMBX.NA.BBB-.9 | Citibank | 3.000% | 9/17/2058 | 4,430,000 | (966,879 | ) | 545,716 | (421,163 | ) | |||||||||||||
| Markit CMBX.NA.BBB-.9 | Citibank | 3.000% | 9/17/2058 | 4,350,000 | (566,783 | ) | 153,226 | (413,557 | ) | |||||||||||||
| Markit CMBX.NA.BBB-.9 | Citibank | 3.000% | 9/17/2058 | 4,050,000 | (465,880 | ) | 80,844 | (385,036 | ) | |||||||||||||
| Markit CMBX.NA.BBB-.9 | Citibank | 3.000% | 9/17/2058 | 28,290,000 | (2,218,445 | ) | (471,102 | ) | (2,689,547 | ) | ||||||||||||
| Markit CMBX.NA.BBB-.9 | Goldman | 3.000% | 9/17/2058 | 5,125,000 | (1,135,901 | ) | 648,664 | (487,237 | ) | |||||||||||||
| Markit CMBX.NA.BBB-.9 | Goldman | 3.000% | 9/17/2058 | 1,000,000 | (145,439 | ) | 50,368 | (95,071 | ) | |||||||||||||
| Markit CMBX.NA.BBB-.9 | Goldman | 3.000% | 9/17/2058 | 2,630,000 | (297,481 | ) | 47,445 | (250,036 | ) | |||||||||||||
| Markit CMBX.NA.BBB-.9 | JPMorgan | 3.000% | 9/17/2058 | 15,000,000 | (2,462,789 | ) | 1,036,730 | (1,426,059 | ) | |||||||||||||
| Markit CMBX.NA.BBB-.9 | Morgan Stanley | 3.000% | 9/17/2058 | 4,595,000 | (563,921 | ) | 127,072 | (436,849 | ) | |||||||||||||
| Markit CMBX.NA.BBB-.9 | Morgan Stanley | 3.000% | 9/17/2058 | 7,240,000 | (888,529 | ) | 200,218 | (688,311 | ) | |||||||||||||
| Markit CMBX.NA.BBB-.9 | Morgan Stanley | 3.000% | 9/17/2058 | 10,095,000 | (1,102,918 | ) | 143,180 | (959,738 | ) | |||||||||||||
| Markit CMBX.NA.BBB-.9 | Morgan Stanley | 3.000% | 9/17/2058 | 12,815,000 | (1,792,410 | ) | 574,080 | (1,218,330 | ) | |||||||||||||
| Markit CMBX.NA.BBB-.9 | Morgan Stanley | 3.000% | 9/17/2058 | 10,749,000 | (1,111,811 | ) | 89,897 | (1,021,914 | ) | |||||||||||||
| Markit CMBX.NA.BBB-.9 | Morgan Stanley | 3.000% | 9/17/2058 | 20,210,000 | (1,596,986 | ) | (324,391 | ) | (1,921,377 | ) | ||||||||||||
| Markit CMBX.NA.A.6 | Citibank | 2.000% | 5/11/2063 | 9,361,000 | (917,639 | ) | (7,130 | ) | (924,769 | ) | ||||||||||||
| $ | (32,503,522 | ) | $8,186,824 | $ | (24,316,698 | ) | ||||||||||||||||
| * | The Referenced Index is for the Credit Default Swaps on Indexes, which is comprised of a basket of commercial mortgage-backed securities. | |
| (1) | If the Fund is a seller of protection and a credit event occurs, as defined under the terms of that particular swap agreement, the Fund will either (i) pay to the buyer of protection an amount equal to the notional amount of the swap and take delivery of the referenced obligation or underlying securities comprising the referenced index or (ii) pay a net settlement amount in the form of cash or securities equal to the notional amount of the swap less the recovery value of the referenced obligation or underlying securities. | |
| (2) | Upfront payments received/paid are presented net of amortization. | |
| (3) | Total unrealized appreciation on Credit Default Swaps on Indexes amounted to $9,004,615. Total unrealized depreciation on Credit Default Swaps on Indexes amounted to $817,791. | |
| (4) | Includes upfront payments received. | |
| 206 | See Notes to Financial Statements. |
Schedule of Investments (continued)
HIGH YIELD FUND November 30, 2021
Open Forward Foreign Currency Exchange Contracts at November 30, 2021:
| Forward Foreign Currency Exchange Contracts | Transaction Type | Counterparty | Expiration Date | Foreign Currency | U.S. $ Cost on Origination Date | U.S. $ Current Value | Unrealized Appreciation | |||||||||||||
| Euro | Buy | BNP Paribas S.A. | 12/10/2021 | 1,063,000 | $ | 1,191,239 | $ | 1,205,766 | $ | 14,527 | ||||||||||
| Euro | Buy | Standard Chartered Bank | 12/10/2021 | 6,549,000 | 7,414,571 | 7,428,561 | 13,990 | |||||||||||||
| British pound | Sell | Bank of America | 12/7/2021 | 2,785,000 | 3,729,274 | 3,703,931 | 25,343 | |||||||||||||
| British pound | Sell | Bank of America | 12/7/2021 | 4,664,000 | 6,270,426 | 6,202,920 | 67,506 | |||||||||||||
| British pound | Sell | Barclays Bank plc | 12/7/2021 | 52,485,000 | 72,764,732 | 69,802,798 | 2,961,934 | |||||||||||||
| British pound | Sell | Goldman Sachs | 12/7/2021 | 3,140,000 | 4,238,710 | 4,176,065 | 62,645 | |||||||||||||
| British pound | Sell | Morgan Stanley | 12/7/2021 | 1,306,000 | 1,741,941 | 1,736,924 | 5,017 | |||||||||||||
| British pound | Sell | Morgan Stanley | 12/7/2021 | 1,099,000 | 1,462,075 | 1,461,623 | 452 | |||||||||||||
| Euro | Sell | Goldman Sachs | 12/10/2021 | 3,312,000 | 3,837,053 | 3,756,817 | 80,236 | |||||||||||||
| Euro | Sell | State Street Bank and Trust | 12/10/2021 | 232,000,000 | 274,768,504 | 263,158,657 | 11,609,847 | |||||||||||||
| Unrealized Appreciation on Forward Foreign Currrency Exchange Contracts | $ | 14,841,497 | ||||||||||||||||||
| Forward Foreign Currency Exchange Contracts | Transaction Type | Counterparty | Expiration Date | Foreign Currency | U.S. $ Cost on Origination Date | U.S. $ Current Value |
Unrealized Depreciation | |||||||||||||
| British pound | Buy | Bank of America | 12/7/2021 | 5,494,000 | $ | 7,594,664 | $ | 7,306,784 | $ | (287,880 | ) | |||||||||
| British pound | Buy | Bank of America | 12/7/2021 | 6,221,000 | 8,556,824 | 8,273,663 | (283,161 | ) | ||||||||||||
| British pound | Buy | Morgan Stanley | 12/7/2021 | 1,493,000 | 2,063,776 | 1,985,626 | (78,150 | ) | ||||||||||||
| Euro | Buy | Bank of America | 12/10/2021 | 7,715,000 | 8,965,386 | 8,751,160 | (214,226 | ) | ||||||||||||
| Euro | Buy | Bank of America | 12/10/2021 | 2,596,000 | 3,015,467 | 2,944,655 | (70,812 | ) | ||||||||||||
| Euro | Buy | Bank of America | 12/10/2021 | 9,632,000 | 11,223,062 | 10,925,622 | (297,440 | ) | ||||||||||||
| Euro | Buy | Bank of America | 12/10/2021 | 6,345,000 | 7,402,553 | 7,197,163 | (205,390 | ) | ||||||||||||
| Euro | Buy | Bank of America | 12/10/2021 | 2,110,000 | 2,461,495 | 2,393,383 | (68,112 | ) | ||||||||||||
| Euro | Buy | Bank of America | 12/10/2021 | 3,252,000 | 3,753,743 | 3,688,759 | (64,984 | ) | ||||||||||||
| Euro | Buy | Goldman Sachs | 12/10/2021 | 8,426,000 | 9,802,195 | 9,557,650 | (244,545 | ) | ||||||||||||
| Euro | Buy | Goldman Sachs | 12/10/2021 | 5,872,000 | 6,795,859 | 6,660,636 | (135,223 | ) | ||||||||||||
| Euro | Buy | Goldman Sachs | 12/10/2021 | 11,021,000 | 12,723,759 | 12,501,171 | (222,588 | ) | ||||||||||||
| Euro | Buy | Goldman Sachs | 12/10/2021 | 3,948,000 | 4,489,862 | 4,478,234 | (11,628 | ) | ||||||||||||
| Euro | Buy | Morgan Stanley | 12/10/2021 | 623,000 | 731,602 | 706,672 | (24,930 | ) | ||||||||||||
| Euro | Buy | Morgan Stanley | 12/10/2021 | 9,962,000 | 11,523,351 | 11,299,942 | (223,409 | ) | ||||||||||||
| Euro | Buy | Morgan Stanley | 12/10/2021 | 1,753,000 | 2,049,258 | 1,988,436 | (60,822 | ) | ||||||||||||
| Euro | Buy | State Street Bank and Trust | 12/10/2021 | 3,890,000 | 4,508,785 | 4,412,445 | (96,340 | ) | ||||||||||||
| Euro | Sell | Standard Chartered Bank | 12/10/2021 | 523,000 | 591,614 | 593,241 | (1,627 | ) | ||||||||||||
| Unrealized Depreciation on Forward Foreign Currrency Exchange Contracts | $ | (2,591,267 | ) | |||||||||||||||||
| See Notes to Financial Statements. | 207 |
Schedule of Investments (continued)
HIGH YIELD FUND November 30, 2021
Open Futures Contracts at November 30, 2021:
| Type | Expiration | Contracts | Position | Notional Amount | Notional Value | Unrealized Appreciation | ||||||||||||
| U.S. 10-Year Treasury Note | March 2022 | 2,757 | Long | $355,679,831 | $360,650,062 | $ | 4,970,231 | |||||||||||
| U.S. Treasury Long Bond | March 2022 | 516 | Long | 83,509,464 | 83,656,500 | 147,036 | ||||||||||||
| U.S. Ultra Treasury Bond | March 2022 | 947 | Long | 184,041,506 | 189,932,688 | 5,891,182 | ||||||||||||
| Total Unrealized Appreciation on Open Futures Contracts | $ | 11,008,449 | ||||||||||||||||
| Type | Expiration | Contracts | Position | Notional Amount | Notional Value | Unrealized Depreciation | ||||||||||||
| Euro- Bund | March 2022 | 294 | Short | EUR | (50,995,879) | EUR | (51,182,460) | $ | (211,602 | ) | ||||||||
| U.S. 10-Year Ultra Treasury Note | March 2022 | 1,360 | Short | $ | (196,326,139 | ) | $ | (199,771,250 | ) | (3,445,111 | ) | |||||||
| U.S. 2-Year Treasury Note | March 2022 | 4,473 | Long | 979,955,092 | 978,398,971 | (1,556,121 | ) | |||||||||||
| U.S. 5-Year Treasury Note | March 2022 | 9,168 | Short | (1,104,443,372 | ) | (1,112,980,880 | ) | (8,537,508 | ) | |||||||||
| Total Unrealized Depreciation on Open Futures Contracts | $ | (13,750,342) | ||||||||||||||||
The following is a summary of the inputs used as of November 30, 2021 in valuing the Fund’s investments carried at fair value(1):
| Investment Type(2) | Level 1 | Level 2 | Level 3 | Total | ||||||||||||
| Long-Term Investments | ||||||||||||||||
| Asset-Backed Securities | $ | – | $ | 78,962,902 | $ | 17,014,397 | $ | 95,977,299 | ||||||||
| Common Stocks | ||||||||||||||||
| Auto Components | 7,287,600 | 1,635,859 | – | 8,923,459 | ||||||||||||
| Electric-Generation | – | 191,673 | – | 191,673 | ||||||||||||
| Machinery | 7,214,758 | 277,702 | – | 7,492,460 | ||||||||||||
| Miscellaneous Financials | – | 2,362,512 | – | 2,362,512 | ||||||||||||
| Personal Products | – | 8,885,303 | – | 8,885,303 | ||||||||||||
| Specialty Retail | 14,609,083 | 1,170,618 | 2,450,227 | 18,229,928 | ||||||||||||
| Transportation Infrastructure | – | 616,799 | – | 616,799 | ||||||||||||
| Remaining Industries | 172,170,536 | – | – | 172,170,536 | ||||||||||||
| Convertible Bonds | – | 139,704,758 | – | 139,704,758 | ||||||||||||
| Corporate Bonds | ||||||||||||||||
| Mining | – | 250,304,613 | 5 | 250,304,618 | ||||||||||||
| Retail | – | 442,581,626 | 1,038 | 442,582,664 | ||||||||||||
| Savings & Loans | – | – | 1,000 | 1,000 | ||||||||||||
| Remaining Industries | – | 5,413,790,534 | – | 5,413,790,534 | ||||||||||||
| Floating Rate Loans | ||||||||||||||||
| Automakers | – | – | 18,549,465 | 18,549,465 | ||||||||||||
| Electric: Generation | – | 679,198 | 1,313,628 | 1,992,826 | ||||||||||||
| Investments & Miscellaneous Financial Services | – | 7,948,148 | 6,469,288 | 14,417,436 | ||||||||||||
| Media: Content | – | 16,120,957 | 21,523,310 | 37,644,267 | ||||||||||||
| Personal & Household Products | – | 11,447,713 | 1,300,853 | 12,748,566 | ||||||||||||
| Real Estate Investment Trusts | – | 13,892,766 | 5,273,314 | 19,166,080 | ||||||||||||
| Support: Services | – | 27,747,469 | 2,183,377 | 29,930,846 | ||||||||||||
| Theaters & Entertainment | – | 24,945,656 | 5,818,677 | 30,764,333 | ||||||||||||
| Remaining Industries | – | 382,521,065 | – | 382,521,065 | ||||||||||||
| Less Unfunded Commitments | – | (4,154,518 | ) | (21,547,648 | ) | (25,702,166 | ) | |||||||||
| Foreign Government Obligations | – | 17,058,521 | – | 17,058,521 | ||||||||||||
| Non-Agency Commercial Mortgage-Backed Securities | – | 100,507,225 | – | 100,507,225 | ||||||||||||
| Preferred Stocks | – | 5,303,083 | – | 5,303,083 | ||||||||||||
| Warrants | – | 215,796 | – | 215,796 | ||||||||||||
| Short-Term Investments | ||||||||||||||||
| Repurchase Agreements | – | 11,327,717 | – | 11,327,717 | ||||||||||||
| Money Market Funds | 6,675,019 | – | – | 6,675,019 | ||||||||||||
| Time Deposits | – | 741,669 | – | 741,669 | ||||||||||||
| Total | $ | 207,956,996 | $ | 6,956,787,364 | $ | 60,350,931 | $ | 7,225,095,291 | ||||||||
| 208 | See Notes to Financial Statements. |
Schedule of Investments (concluded)
HIGH YIELD FUND November 30, 2021
| Investment Type(2) | Level 1 | Level 2 | Level 3 | Total | ||||||||||||
| Other Financial Instruments | ||||||||||||||||
| Centrally Cleared Credit Default Swap Contracts | ||||||||||||||||
| Assets | $ | – | $ | 5,784,463 | $ | – | $ | 5,784,463 | ||||||||
| Liabilities | – | (64,820 | ) | – | (64,820 | ) | ||||||||||
| Credit Default Swap Contracts | ||||||||||||||||
| Assets | – | – | – | – | ||||||||||||
| Liabilities | – | (24,316,698 | ) | – | (24,316,698 | ) | ||||||||||
| Forward Foreign Currency Exchange Contracts | ||||||||||||||||
| Assets | – | 14,841,497 | – | 14,841,497 | ||||||||||||
| Liabilities | – | (2,591,267 | ) | – | (2,591,267 | ) | ||||||||||
| Futures Contracts | ||||||||||||||||
| Assets | 11,008,449 | – | – | 11,008,449 | ||||||||||||
| Liabilities | (13,750,342 | ) | – | – | (13,750,342 | ) | ||||||||||
| Total | $ | (2,741,893 | ) | $ | (6,346,825 | ) | $ | – | $ | (9,088,718 | ) | |||||
| (1) | Refer to Note 2(t) for a description of fair value measurements and the three-tier hierarchy of inputs. | |
| (2) | See Schedule of Investments for fair values in each industry and identification of foreign issuer and/or geography. The table above is presented by Investment Type. Industries are presented within an Investment Type should such Investment Type include securities classified as two or more levels within the three- tier fair value hierarchy. When applicable each Level 3 security is identified on the Schedule of Investments along with the valuation technique utilized. |
A reconciliation of Level 3 investments is presented when the Fund has a material amount of Level 3 investments at the beginning or end of the year in relation to the Fund’s net assets. Management has determined not to provide a reconciliation as the balance of Level 3 investments was not considered to be material to the Fund’s net assets at the beginning or end of the year.
| See Notes to Financial Statements. | 209 |
Schedule of Investments
| Investments | Interest Rate | Maturity Date | Principal Amount (000) | Fair Value | ||||||||
| LONG-TERM INVESTMENTS 97.25% | ||||||||||||
| ASSET-BACKED SECURITIES 10.18% | ||||||||||||
| Automobiles 2.02% | ||||||||||||
| Avis Budget Rental Car Funding AESOP LLC 2021-1A D† | 3.71% | 8/20/2027 | $ | 12,750 | $ | 12,663,336 | ||||||
| Carvana Auto Receivables Trust 2019-4A E† | 4.70% | 10/15/2026 | 7,250 | 7,512,802 | ||||||||
| Exeter Automobile Receivables Trust 2020-3A E† | 3.44% | 8/17/2026 | 7,500 | 7,741,493 | ||||||||
| Exeter Automobile Receivables Trust 2020-3A F† | 5.56% | 6/15/2027 | 6,900 | 7,243,752 | ||||||||
| Flagship Credit Auto Trust 2019-1 D† | 4.08% | 2/18/2025 | 4,000 | 4,147,057 | ||||||||
| Foursight Capital Automobile Receivables Trust 2018-1 D† | 4.19% | 11/15/2023 | 3,500 | 3,505,394 | ||||||||
| Hertz Vehicle Financing LLC 2021-1A D† | 3.98% | 12/26/2025 | 5,000 | 4,957,731 | ||||||||
| Santander Consumer Auto Receivables Trust 2020-BA F† | 7.03% | 8/15/2028 | 8,452 | 9,215,143 | ||||||||
| Santander Consumer Auto Receivables Trust 2021-AA F† | 5.79% | 8/15/2028 | 3,100 | 3,267,515 | ||||||||
| Westlake Automobile Receivables Trust 2021-1A F† | 3.91% | 9/15/2027 | 4,150 | 4,137,507 | ||||||||
| Total | 64,391,730 | |||||||||||
| Credit Card 0.28% | ||||||||||||
| Continental Finance Credit Card ABS Master Trust 2020-1A B† | 3.66% | 12/15/2028 | 4,000 | 3,999,267 | ||||||||
| Perimeter Master Note Business Trust 2019-2A A† | 4.23% | 5/15/2024 | 2,831 | 2,913,985 | (a) | |||||||
| Synchrony Credit Card Master Note Trust 2017-2 B | 2.82% | 10/15/2025 | 1,844 | 1,879,727 | ||||||||
| Total | 8,792,979 | |||||||||||
| Other 7.88% | ||||||||||||
| AMMC CLO Ltd. 2020-23A DR† | 3.173% (3 Mo. LIBOR + 3.05% | )# | 10/17/2031 | 4,500 | 4,493,725 | |||||||
| AMMC CLO Ltd. 2021-24A B†(b) | Zero Coupon | #(c) | 1/20/2035 | 6,400 | 6,400,000 | |||||||
| Arbor Realty Collateralized Loan Obligation Ltd. 2021-FL2 AS† | 1.49% (1 Mo. LIBOR + 1.40% | )# | 5/15/2036 | 8,470 | 8,437,136 | |||||||
| Avant Loans Funding Trust 2021-REV1 D† | 4.30% | 7/15/2030 | 7,135 | 7,130,946 | ||||||||
| Bain Capital Credit CLO Ltd. 2017-1A A1R† | 1.102% (3 Mo. LIBOR + .97% | )# | 7/20/2030 | 9,000 | 9,002,573 | |||||||
| Barings CLO Ltd. 2019-3A BR† | 1.732% (3 Mo. LIBOR + 1.60% | )# | 4/20/2031 | 4,480 | 4,483,648 | |||||||
| Benefit Street Partners CLO XII Ltd. 2017-12A C† | 3.174% (3 Mo. LIBOR + 3.05% | )# | 10/15/2030 | 1,950 | 1,930,500 | |||||||
| 210 | See Notes to Financial Statements. |
Schedule of Investments (continued)
INCOME FUND November 30, 2021
| Investments | Interest Rate | Maturity Date | Principal Amount (000) | Fair Value | ||||||||
| Other (continued) | ||||||||||||
| BlueMountain CLO Ltd. 2021-28A B† | 1.624% (3 Mo. LIBOR + 1.50% | )# | 4/15/2034 | $ | 12,000 | $ | 12,011,945 | |||||
| Carlyle Global Market Strategies CLO Ltd. 2015-5A BRR† | 2.432% (3 Mo. LIBOR + 2.30% | )# | 1/20/2032 | 3,600 | 3,605,423 | |||||||
| CARLYLE US CLO Ltd. 2019-1A CR† | 3.482% (3 Mo. LIBOR + 3.35% | )# | 4/20/2031 | 3,870 | 3,854,206 | |||||||
| CBAM Ltd. 2017-1A D† | 3.882% (3 Mo. LIBOR + 3.75% | )# | 7/20/2030 | 8,530 | 8,544,517 | |||||||
| CIFC Funding I Ltd. 2021-1A B† | 1.674% (3 Mo. LIBOR + 1.55% | )# | 4/25/2033 | 13,000 | 13,010,728 | |||||||
| CIFC Funding Ltd. 2021-4A A† | 1.174% (3 Mo. LIBOR + 1.05% | )# | 7/15/2033 | 7,000 | 6,994,799 | |||||||
| Elevation CLO Ltd. 2014-2A DR† | 3.324% (3 Mo. LIBOR + 3.20% | )# | 10/15/2029 | 1,000 | 991,084 | |||||||
| Elmwood CLO VIII Ltd. 2021 1A B1† | 1.682% (3 Mo. LIBOR + 1.55% | )# | 1/20/2034 | 10,000 | 10,001,896 | |||||||
| Fairstone Financial Issuance Trust I 2020-1A C†(d) | 5.162% | 10/20/2039 | CAD | 15,535 | 12,453,159 | (a) | ||||||
| Galaxy XXI CLO Ltd. 2015-21A AR† | 1.152% (3 Mo. LIBOR + 1.02% | )# | 4/20/2031 | $ | 1,012 | 1,012,587 | ||||||
| Hardee’s Funding LLC 2018-1A A2II† | 4.959% | 6/20/2048 | 1,801 | 1,904,289 | ||||||||
| Invesco CLO Ltd. 2021-3A B† | Zero Coupon | #(c) | 10/22/2034 | 2,880 | 2,880,000 | (a) | ||||||
| JFIN CLO Ltd. 2013-1A A1NR† | 1.522% (3 Mo. LIBOR + 1.39% | )# | 1/20/2030 | 2,000 | 2,002,027 | |||||||
| Kayne CLO Ltd. 2018 2A BR† | 1.624% (3 Mo. LIBOR + 1.50% | )# | 10/15/2031 | 6,500 | 6,515,570 | |||||||
| Kayne CLO Ltd. 2020-7A A1† | 1.322% (3 Mo. LIBOR + 1.20% | )# | 4/17/2033 | 7,851 | 7,862,797 | |||||||
| Lending Funding Trust 2020-2A D† | 6.77% | 4/21/2031 | 3,415 | 3,747,365 | ||||||||
| Lendmark Funding Trust 2019-1A D† | 5.34% | 12/20/2027 | 7,413 | 7,551,263 | ||||||||
| Lendmark Funding Trust 2021-2A D† | 4.46% | 4/20/2032 | 5,675 | 5,737,670 | ||||||||
| Madison Park Funding Ltd. 2015-17A BR2† | 1.63% (3 Mo. LIBOR + 1.50% | )# | 7/21/2030 | 10,000 | 10,008,151 | |||||||
| Marble Point CLO XVII Ltd. 2020-1A A† | 1.432% (3 Mo. LIBOR + 1.30% | )# | 4/20/2033 | 4,860 | 4,859,946 | |||||||
| Marble Point CLO XVII Ltd. 2020-1A D† | 3.882% (3 Mo. LIBOR + 3.75% | )# | 4/20/2033 | 5,000 | 5,020,963 | |||||||
| Mariner Finance Issuance Trust 2021-AA E† | 5.40% | 3/20/2036 | 5,340 | 5,664,652 | ||||||||
| Mariner Finance Issuance Trust 2021-BA E† | 4.68% | 11/20/2036 | 3,075 | 3,088,552 | ||||||||
| Mountain View CLO LLC 2017-1A AR† | 1.212% (3 Mo. LIBOR + 1.09% | )# | 10/16/2029 | 4,505 | 4,506,142 | |||||||
| See Notes to Financial Statements. | 211 |
Schedule of Investments (continued)
INCOME FUND November 30, 2021
| Investments | Interest Rate | Maturity Date | Principal Amount (000) | Fair Value | ||||||||
| Other (continued) | ||||||||||||
| Niagara Park Clo Ltd. 2019-1A BR† | 1.722% (3 Mo. LIBOR + 1.60% | )# | 7/17/2032 | $ | 9,150 | $ | 9,151,239 | |||||
| Oaktree CLO Ltd. 2019-4A CR† | 4.169% (3 Mo. LIBOR + 2.25% | )# | 10/20/2032 | 5,070 | 5,023,103 | |||||||
| OCP CLO Ltd. 2019-17A BR† | 1.732% (3 Mo. LIBOR + 1.60% | )# | 7/20/2032 | 7,720 | 7,710,515 | |||||||
| Octagon Loan Funding Ltd. 2014-1A ARR† | 1.34% (3 Mo. LIBOR + 1.18% | )# | 11/18/2031 | 5,000 | 5,006,736 | |||||||
| Planet Fitness Master Issuer LLC 2019-1A A2† | 3.858% | 12/5/2049 | 2,141 | 2,225,114 | ||||||||
| Romark CLO Ltd. 2017-1A A2R† | 1.774% (3 Mo. LIBOR + 1.65% | )# | 10/23/2030 | 8,890 | 8,873,561 | |||||||
| Signal Peak CLO 2 LLC 2015-1A DR2† | 2.982% (3 Mo. LIBOR + 2.85% | )# | 4/20/2029 | 2,000 | 1,996,316 | |||||||
| Voya CLO Ltd. 2018-4A A1AR† | 1.164% (3 Mo. LIBOR + 1.04% | )# | 1/15/2032 | 3,950 | 3,950,435 | |||||||
| Voya CLO Ltd. 2019-3A DR† | 3.263% (3 Mo. LIBOR + 3.15% | )# | 10/17/2032 | 8,660 | 8,660,000 | |||||||
| Wind River CLO Ltd. 2015-2A DR† | 2.724% (3 Mo. LIBOR + 2.60% | )# | 10/15/2027 | 3,750 | 3,757,048 | |||||||
| Wind River CLO Ltd. 2021-4A B†(b) | Zero Coupon | #(c) | 1/20/2035 | 4,570 | 4,570,227 | |||||||
| Zaxby’s Funding LLC 2021-1A A2† | 3.238% | 7/30/2051 | 3,615 | 3,713,596 | ||||||||
| Total | 250,346,149 | |||||||||||
| Total Asset-Backed Securities (cost $322,936,997) | 323,530,858 | |||||||||||
| Shares (000) | ||||||||||||
| COMMON STOCKS 0.08% | ||||||||||||
| Miscellaneous Financials 0.01% | ||||||||||||
| UTEX Industries, Inc. | 7 | 352,704 | ||||||||||
| Oil, Gas & Consumable Fuels 0.07% | ||||||||||||
| Dommo Energia SA*(d) | BRL | 64 | 6,947 | |||||||||
| Oasis Petroleum, Inc. | 18 | 2,098,250 | ||||||||||
| Total | 2,105,197 | |||||||||||
| Total Common Stocks (cost $1,764,346) | 2,457,901 | |||||||||||
| 212 | See Notes to Financial Statements. |
Schedule of Investments (continued)
INCOME FUND November 30, 2021
| Investments | Interest Rate | Maturity Date | Principal Amount (000) | Fair Value | ||||||||
| CORPORATE BONDS 58.78% | ||||||||||||
| Aerospace/Defense 0.87% | ||||||||||||
| Boeing Co. (The) | 5.15% | 5/1/2030 | $ | 9,572 | $ | 11,117,887 | ||||||
| Boeing Co. (The) | 5.705% | 5/1/2040 | 4,000 | 5,114,360 | ||||||||
| Boeing Co. (The) | 5.805% | 5/1/2050 | 6,144 | 8,299,290 | ||||||||
| Bombardier, Inc. (Canada)†(e) | 6.00% | 2/15/2028 | 3,100 | 3,082,206 | ||||||||
| Total | 27,613,743 | |||||||||||
| Agriculture 0.34% | ||||||||||||
| Viterra Finance BV (Netherlands)†(e) | 3.20% | 4/21/2031 | 10,555 | 10,768,309 | ||||||||
| Airlines 0.65% | ||||||||||||
| Air Canada 2015-2 Class B Pass-Through Trust (Canada)†(e) | 5.00% | 6/15/2025 | 1,554 | 1,582,773 | ||||||||
| American Airlines 2014-1 Class B Pass-Through Trust | 4.375% | 4/1/2024 | 4,515 | 4,526,624 | ||||||||
| American Airlines 2021-1 Class A Pass Through Trust | 2.875% | 7/11/2034 | 8,538 | 8,316,501 | ||||||||
| American Airlines Group, Inc.† | 3.75% | 3/1/2025 | 3,424 | 3,055,201 | ||||||||
| Hawaiian Brand Intellectual Property Ltd./HawaiianMiles Loyalty Ltd.† | 5.75% | 1/20/2026 | 3,003 | 3,075,052 | ||||||||
| Total | 20,556,151 | |||||||||||
| Apparel 0.21% | ||||||||||||
| PVH Corp. | 7.75% | 11/15/2023 | 5,967 | 6,728,809 | ||||||||
| Auto Manufacturers 1.00% | ||||||||||||
| Ford Motor Co. | 3.25% | 2/12/2032 | 7,100 | 7,111,644 | ||||||||
| General Motors Co. | 6.75% | 4/1/2046 | 17,093 | 24,768,727 | ||||||||
| Total | 31,880,371 | |||||||||||
| Banks 8.82% | ||||||||||||
| Bank Hapoalim BM (Israel)†(e) | 3.255% (5 Yr. Treasury CMT + 2.16% | )# | 1/21/2032 | 4,800 | 4,798,656 | |||||||
| Bank of America Corp. | 2.482% (5 Yr. Treasury CMT + 1.20% | )# | 9/21/2036 | 10,000 | 9,663,599 | |||||||
| Bank of America Corp. | 2.687% (SOFR + 1.32% | )# | 4/22/2032 | 18,612 | 18,858,019 | |||||||
| Bank of Ireland Group plc (Ireland)(e) | 4.125% (5 Yr. Treasury CMT + 2.50% | )# | 9/19/2027 | 12,794 | 12,962,135 | |||||||
| BankUnited, Inc. | 5.125% | 6/11/2030 | 9,962 | 11,459,933 | ||||||||
| BBVA Bancomer SA† | 5.125% (5 Yr. Treasury CMT + 2.65% | )# | 1/18/2033 | 4,300 | 4,388,795 | |||||||
| See Notes to Financial Statements. | 213 |
Schedule of Investments (continued)
INCOME FUND November 30, 2021
| Investments | Interest Rate | Maturity Date | Principal Amount (000) | Fair Value | ||||||||
| Banks (continued) | ||||||||||||
| BNP Paribas SA (France)†(e) | 4.375% (5 Yr. Swap rate + 1.48% | )# | 3/1/2033 | $ | 7,230 | $ | 7,882,067 | |||||
| BNP Paribas SA (France)†(e) | 4.50% (5 Yr. Treasury CMT + 2.94% | )# | – | (f) | 4,153 | 4,036,280 | ||||||
| BPCE SA (France)†(e) | 3.116% (SOFR + 1.73% | )# | 10/19/2032 | 10,000 | 10,039,863 | |||||||
| Citigroup, Inc. | 2.561% (SOFR + 1.17% | )# | 5/1/2032 | 18,611 | 18,703,956 | |||||||
| Danske Bank A/S (Denmark)†(e) | 4.375% | 6/12/2028 | 875 | 979,789 | ||||||||
| Danske Bank A/S (Denmark)†(e) | 5.375% | 1/12/2024 | 12,000 | 12,972,095 | ||||||||
| Discover Bank | 4.682% (5 Yr. Swap rate + 1.73% | )# | 8/9/2028 | 7,750 | 8,134,945 | |||||||
| Goldman Sachs Group, Inc. (The) | 2.383% (SOFR + 1.25% | )# | 7/21/2032 | 5,104 | 5,011,682 | |||||||
| Goldman Sachs Group, Inc. (The) | 6.75% | 10/1/2037 | 8,237 | 11,643,802 | ||||||||
| Intesa Sanpaolo S.p.A. (Italy)†(e) | 4.198% (1 Yr Treasury CMT+ 2.60% | )# | 6/1/2032 | 2,014 | 2,021,627 | |||||||
| Macquarie Bank Ltd. (Australia)†(e) | 3.052% (5 Yr.Treasury CMT + 1.70% | )# | 3/3/2036 | 9,790 | 9,672,325 | |||||||
| Macquarie Bank Ltd. (Australia)†(e) | 4.875% | 6/10/2025 | 1,850 | 2,033,332 | ||||||||
| Macquarie Group Ltd. (Australia)†(e) | 2.691% (SOFR + 1.44% | )# | 6/23/2032 | 3,724 | 3,709,761 | |||||||
| Morgan Stanley | 2.239% (SOFR + 1.18% | )# | 7/21/2032 | 6,125 | 6,006,942 | |||||||
| Morgan Stanley | 2.484% (SOFR + 1.36% | )# | 9/16/2036 | 9,129 | 8,840,679 | |||||||
| Morgan Stanley | 4.431% (3 Mo. LIBOR + 1.63% | )# | 1/23/2030 | 1,395 | 1,592,462 | |||||||
| Morgan Stanley | 5.00% | 11/24/2025 | 4,496 | 5,029,512 | ||||||||
| Morgan Stanley | 5.875% (3 Mo. LIBOR + 4.44% | )# | – | (f) | 4,747 | 5,352,898 | ||||||
| National Australia Bank Ltd. (Australia)†(e) | 2.99% | 5/21/2031 | 3,443 | 3,466,380 | ||||||||
| National Australia Bank Ltd. (Australia)†(e) | 3.933% (5 Yr. Treasury CMT + 1.88% | )# | 8/2/2034 | 11,000 | 11,800,264 | |||||||
| NatWest Group plc (United Kingdom)(e) | 3.032% (5 Yr. Treasury CMT + 2.35% | )# | 11/28/2035 | 7,000 | 6,936,989 | |||||||
| Santander Holdings USA, Inc. | 4.40% | 7/13/2027 | 9,963 | 10,996,229 | ||||||||
| Texas Capital Bancshares, Inc. | 4.00% (5 Yr. Treasury CMT + 3.15% | )# | 5/6/2031 | 8,000 | 8,393,199 | |||||||
| UBS AG (Switzerland)(e) | 5.125% | 5/15/2024 | 13,800 | 14,852,250 | ||||||||
| UBS AG | 7.625% | 8/17/2022 | 8,750 | 9,140,923 | ||||||||
| 214 | See Notes to Financial Statements. |
Schedule of Investments (continued)
INCOME FUND November 30, 2021
| Investments | Interest Rate | Maturity Date | Principal Amount (000) | Fair Value | ||||||||
| Banks (continued) | ||||||||||||
| Western Alliance Bancorp | 3.00% (SOFR + 2.25% | )# | 6/15/2031 | $ | 7,578 | $ | 7,754,965 | |||||
| Westpac Banking Corp. (Australia)(e) | 2.668% (5 Yr. Treasury CMT + 1.75% | )# | 11/15/2035 | 8,000 | 7,850,685 | |||||||
| Westpac Banking Corp. (Australia)(e) | 4.11% (5 Yr. Treasury CMT + 2.00% | )# | 7/24/2034 | 9,061 | 9,834,909 | |||||||
| Westpac Banking Corp. (Australia)(e) | 4.322% (5 Yr. Treasury CMT + 2.24% | )# | 11/23/2031 | 3,197 | 3,470,500 | |||||||
| Total | 280,292,447 | |||||||||||
| Beverages 0.23% | ||||||||||||
| Central American Bottling Corp. (Guatemala)†(e) | 5.75% | 1/31/2027 | 7,000 | 7,171,395 | ||||||||
| Chemicals 0.47% | ||||||||||||
| Braskem Netherlands Finance BV (Netherland)†(e) | 4.50% | 1/31/2030 | 12,000 | 12,020,460 | ||||||||
| Unifrax Escrow Issuer Corp.† | 7.50% | 9/30/2029 | 3,150 | 3,060,004 | ||||||||
| Total | 15,080,464 | |||||||||||
| Coal 0.14% | ||||||||||||
| Peabody Energy Corp.† | 6.375% | 3/31/2025 | 5,000 | 4,561,675 | ||||||||
| Commercial Services 0.67% | ||||||||||||
| CoStar Group, Inc.† | 2.80% | 7/15/2030 | 5,328 | 5,409,761 | ||||||||
| United Rentals North America, Inc. | 3.875% | 11/15/2027 | 15,375 | 15,970,397 | ||||||||
| Total | 21,380,158 | |||||||||||
| Computers 1.22% | ||||||||||||
| Ahead DB Holdings LLC† | 6.625% | 5/1/2028 | 2,228 | 2,230,273 | ||||||||
| CA Magnum Holdings (Mauritius)†(e) | 5.375% | 10/31/2026 | 2,736 | 2,800,980 | ||||||||
| Dell International LLC/EMC Corp. | 8.35% | 7/15/2046 | 12,237 | 20,454,007 | ||||||||
| Leidos Holdings, Inc. | 5.95% | 12/1/2040 | 1,325 | 1,685,471 | ||||||||
| Leidos, Inc. | 4.375% | 5/15/2030 | 2,052 | 2,307,597 | ||||||||
| Leidos, Inc. | 7.125% | 7/1/2032 | 6,806 | 9,146,549 | ||||||||
| Total | 38,624,877 | |||||||||||
| Diversified Financial Services 4.13% | ||||||||||||
| AerCap Ireland Capital DAC/AerCap Global Aviation Trust (Ireland)(e) | 3.30% | 1/30/2032 | 2,431 | 2,451,412 | ||||||||
| AerCap Ireland Capital DAC/AerCap Global Aviation Trust (Ireland)(e) | 3.50% | 1/15/2025 | 7,107 | 7,430,487 | ||||||||
| AerCap Ireland Capital DAC/AerCap Global Aviation Trust (Ireland)(e) | 3.875% | 1/23/2028 | 5,000 | 5,323,708 | ||||||||
| See Notes to Financial Statements. | 215 |
Schedule of Investments (continued)
INCOME FUND November 30, 2021
| Investments | Interest Rate | Maturity Date | Principal Amount (000) | Fair Value | ||||||||
| Diversified Financial Services (continued) | ||||||||||||
| AerCap Ireland Capital DAC/AerCap Global Aviation Trust (Ireland)(e) | 4.875% | 1/16/2024 | $ | 2,674 | $ | 2,858,549 | ||||||
| Aircastle Ltd.† | 2.85% | 1/26/2028 | 17,689 | 17,794,445 | ||||||||
| Ally Financial, Inc. | 4.70% (5 Yr. Treasury CMT + 3.87% | )# | – | (f) | 3,182 | 3,291,381 | ||||||
| Ally Financial, Inc. | 8.00% | 11/1/2031 | 7,990 | 11,310,337 | ||||||||
| Aviation Capital Group LLC† | 3.50% | 11/1/2027 | 3,918 | 4,075,800 | ||||||||
| Avolon Holdings Funding Ltd. (Ireland)†(e) | 5.125% | 10/1/2023 | 3,587 | 3,798,484 | ||||||||
| Brightsphere Investment Group, Inc. | 4.80% | 7/27/2026 | 2,033 | 2,108,254 | ||||||||
| Charles Schwab Corp. (The) | 5.375% (5 Yr. Treasury CMT + 4.97% | )# | – | (f) | 11,517 | 12,485,580 | ||||||
| Coinbase Global, Inc.† | 3.375% | 10/1/2028 | 12,000 | 11,299,380 | ||||||||
| Global Aircraft Leasing Co. Ltd. PIK 7.25%† | 6.50% | 9/15/2024 | 4,239 | 4,059,940 | ||||||||
| Midcap Financial Issuer Trust† | 6.50% | 5/1/2028 | 4,000 | 4,088,340 | ||||||||
| Nationstar Mortgage Holdings, Inc.† | 5.50% | 8/15/2028 | 2,900 | 2,893,707 | ||||||||
| Navient Corp. | 6.75% | 6/25/2025 | 7,825 | 8,449,474 | ||||||||
| Neuberger Berman Group LLC/Neuberger Berman Finance Corp.† | 4.50% | 3/15/2027 | 6,115 | 6,817,029 | ||||||||
| Neuberger Berman Group LLC/Neuberger Berman Finance Corp.† | 4.875% | 4/15/2045 | 5,679 | 6,844,851 | ||||||||
| OneMain Finance Corp. | 4.00% | 9/15/2030 | 2,955 | 2,856,022 | ||||||||
| Park Aerospace Holdings Ltd. (Ireland)†(e) | 5.50% | 2/15/2024 | 8,146 | 8,775,410 | ||||||||
| VistaJet Malta Finance plc/XO Management Holding, Inc. (Malta)†(e) | 10.50% | 6/1/2024 | 2,181 | 2,338,348 | ||||||||
| Total | 131,350,938 | |||||||||||
| Electric 6.40% | ||||||||||||
| AES Corp. (The) | 2.45% | 1/15/2031 | 5,975 | 5,857,265 | ||||||||
| Alfa Desarrollo S.p.A. (Chile)†(e) | 4.55% | 9/27/2051 | 4,000 | 3,816,700 | ||||||||
| Ausgrid Finance Pty Ltd. (Australia)†(e) | 4.35% | 8/1/2028 | 10,702 | 12,091,693 | ||||||||
| Cleco Power LLC | 6.00% | 12/1/2040 | 4,904 | 6,835,618 | ||||||||
| Duquesne Light Holdings, Inc.† | 2.775% | 1/7/2032 | 9,962 | 9,971,447 | ||||||||
| Duquesne Light Holdings, Inc. | 6.25% | 8/15/2035 | 2,650 | 3,339,808 | ||||||||
| El Paso Electric Co. | 6.00% | 5/15/2035 | 9,281 | 12,379,141 | ||||||||
| Emera US Finance LP | 4.75% | 6/15/2046 | 6,840 | 8,134,721 | ||||||||
| Exelon Generation Co. LLC | 6.25% | 10/1/2039 | 15,191 | 19,496,959 | ||||||||
| FirstEnergy Corp. | 4.40% | 7/15/2027 | 5,500 | 5,885,334 | ||||||||
| FirstEnergy Transmission LLC† | 4.55% | 4/1/2049 | 6,480 | 7,591,691 | ||||||||
| IPALCO Enterprises, Inc. | 4.25% | 5/1/2030 | 10,206 | 11,346,986 | ||||||||
| Metropolitan Edison Co.† | 4.00% | 4/15/2025 | 2,007 | 2,130,426 | ||||||||
| 216 | See Notes to Financial Statements. |
Schedule of Investments (continued)
INCOME FUND November 30, 2021
| Investments | Interest Rate | Maturity Date | Principal Amount (000) | Fair Value | ||||||||
| Electric (continued) | ||||||||||||
| NRG Energy, Inc.† | 4.45% | 6/15/2029 | $ | 14,584 | $ | 15,923,652 | ||||||
| Oglethorpe Power Corp. | 5.95% | 11/1/2039 | 9,881 | 13,303,811 | ||||||||
| Pacific Gas and Electric Co. | 4.55% | 7/1/2030 | 29,451 | 32,186,635 | ||||||||
| Pike Corp.† | 5.50% | 9/1/2028 | 2,799 | 2,828,139 | ||||||||
| Puget Energy, Inc. | 4.10% | 6/15/2030 | 15,309 | 16,651,983 | ||||||||
| Vistra Operations Co. LLC† | 3.55% | 7/15/2024 | 13,009 | 13,492,776 | ||||||||
| Total | 203,264,785 | |||||||||||
| Energy-Alternate Sources 0.13% | ||||||||||||
| Topaz Solar Farms LLC† | 5.75% | 9/30/2039 | 3,395 | 4,100,037 | ||||||||
| Engineering & Construction 0.72% | ||||||||||||
| Cellnex Finance Co. S.A. (Spain)†(e) | 3.875% | 7/7/2041 | 8,563 | 8,347,041 | ||||||||
| Fluor Corp. | 4.25% | 9/15/2028 | 14,240 | 14,547,655 | ||||||||
| Total | 22,894,696 | |||||||||||
| Forest Products & Paper 0.39% | ||||||||||||
| Suzano Austria GmbH (Brazil)(e) | 3.75% | 1/15/2031 | 12,600 | 12,316,752 | ||||||||
| Gas 0.22% | ||||||||||||
| Centrica plc (United Kingdom)†(e) | 5.375% | 10/16/2043 | 5,224 | 6,982,621 | ||||||||
| Hand/Machine Tools 0.21% | ||||||||||||
| Stanley Black & Decker, Inc. | 4.00% (5 Yr. Treasury CMT + 2.66% | )# | 3/15/2060 | 6,548 | 6,653,979 | |||||||
| Health Care-Services 0.96% | ||||||||||||
| Centene Corp. | 4.625% | 12/15/2029 | 12,218 | 13,091,159 | ||||||||
| Fresenius Medical Care US Finance II, Inc.† | 4.75% | 10/15/2024 | 2,208 | 2,394,997 | ||||||||
| Universal Health Services, Inc.† | 2.65% | 10/15/2030 | 12,786 | 12,419,106 | ||||||||
| US Renal Care, Inc.† | 10.625% | 7/15/2027 | 2,404 | 2,463,343 | ||||||||
| Total | 30,368,605 | |||||||||||
| Home Builders 1.09% | ||||||||||||
| NVR, Inc. | 3.00% | 5/15/2030 | 10,854 | 11,320,421 | ||||||||
| PulteGroup, Inc. | 6.375% | 5/15/2033 | 6,069 | 7,895,465 | ||||||||
| Shea Homes LP/Shea Homes Funding Corp.† | 4.75% | 2/15/2028 | 2,400 | 2,398,536 | ||||||||
| Toll Brothers Finance Corp. | 3.80% | 11/1/2029 | 4,224 | 4,471,505 | ||||||||
| Toll Brothers Finance Corp. | 4.875% | 3/15/2027 | 7,738 | 8,546,544 | ||||||||
| Total | 34,632,471 | |||||||||||
| See Notes to Financial Statements. | 217 |
Schedule of Investments (continued)
INCOME FUND November 30, 2021
| Investments | Interest Rate | Maturity Date | Principal Amount (000) | Fair Value | ||||||||
| Insurance 2.61% | ||||||||||||
| Aon Corp. | 8.205% | 1/1/2027 | $ | 5,545 | $ | 7,063,768 | ||||||
| Assurant, Inc. | 2.65% | 1/15/2032 | 3,049 | 3,011,372 | ||||||||
| Assurant, Inc. | 3.70% | 2/22/2030 | 9,896 | 10,710,878 | ||||||||
| CNO Financial Group, Inc. | 5.25% | 5/30/2025 | 10,855 | 12,109,421 | ||||||||
| CNO Financial Group, Inc. | 5.25% | 5/30/2029 | 9,239 | 10,686,183 | ||||||||
| First American Financial Corp. | 2.40% | 8/15/2031 | 8,976 | 8,746,515 | ||||||||
| Global Atlantic Fin Co.† | 4.70% (5 Yr. Treasury CMT + 3.80% | )# | 10/15/2051 | 5,469 | 5,602,807 | |||||||
| Protective Life Corp. | 8.45% | 10/15/2039 | 5,103 | 8,246,269 | ||||||||
| Selective Insurance Group, Inc. | 5.375% | 3/1/2049 | 5,081 | 6,966,012 | ||||||||
| Teachers Insurance & Annuity Association of America† | 4.90% | 9/15/2044 | 7,365 | 9,710,217 | ||||||||
| Total | 82,853,442 | |||||||||||
| Internet 0.75% | ||||||||||||
| Expedia Group, Inc. | 2.95% | 3/15/2031 | 4,981 | 5,035,149 | ||||||||
| Netflix, Inc.† | 5.375% | 11/15/2029 | 13,450 | 15,932,332 | ||||||||
| Uber Technologies, Inc.† | 6.25% | 1/15/2028 | 2,715 | 2,916,005 | ||||||||
| Total | 23,883,486 | |||||||||||
| Iron-Steel 0.16% | ||||||||||||
| Steel Dynamics, Inc. | 5.00% | 12/15/2026 | 4,985 | 5,094,198 | ||||||||
| Leisure Time 0.18% | ||||||||||||
| NCL Corp. Ltd.† | 3.625% | 12/15/2024 | 3,100 | 2,852,589 | ||||||||
| Royal Caribbean Cruises Ltd. | 3.70% | 3/15/2028 | 3,050 | 2,789,606 | ||||||||
| Total | 5,642,195 | |||||||||||
| Machinery-Diversified 0.93% | ||||||||||||
| CNH Industrial Capital LLC | 4.375% | 4/5/2022 | 6,102 | 6,176,013 | ||||||||
| Flowserve Corp. | 2.80% | 1/15/2032 | 8,450 | 8,329,436 | ||||||||
| nVent Finance Sarl (Luxembourg)(e) | 4.55% | 4/15/2028 | 13,500 | 15,095,672 | ||||||||
| Total | 29,601,121 | |||||||||||
| Media 1.41% | ||||||||||||
| Charter Communications Operating LLC/Charter Communications Operating Capital | 6.484% | 10/23/2045 | 11,029 | 15,099,269 | ||||||||
| Time Warner Cable LLC | 7.30% | 7/1/2038 | 15,865 | 22,793,613 | ||||||||
| Time Warner Entertainment Co. LP | 8.375% | 7/15/2033 | 4,675 | 6,899,714 | ||||||||
| Total | 44,792,596 | |||||||||||
| 218 | See Notes to Financial Statements. |
Schedule of Investments (continued)
INCOME FUND November 30, 2021
| Investments | Interest Rate | Maturity Date | Principal Amount (000) | Fair Value | ||||||||
| Mining 2.20% | ||||||||||||
| Alcoa Nederland Holding BV (Netherlands)†(e) | 4.125% | 3/31/2029 | $ | 10,000 | $ | 10,214,300 | ||||||
| Anglo American Capital plc (United Kingdom)†(e) | 5.625% | 4/1/2030 | 9,500 | 11,282,275 | ||||||||
| FMG Resources August 2006 Pty Ltd. (Australia)†(e) | 4.375% | 4/1/2031 | 12,291 | 12,477,578 | ||||||||
| Freeport-McMoRan, Inc. | 4.25% | 3/1/2030 | 3,071 | 3,188,850 | ||||||||
| Freeport-McMoRan, Inc. | 5.25% | 9/1/2029 | 12,250 | 13,249,661 | ||||||||
| Glencore Finance Canada Ltd. (Canada)†(e) | 5.55% | 10/25/2042 | 5,774 | 7,328,361 | ||||||||
| Glencore Funding LLC† | 2.85% | 4/27/2031 | 12,117 | 12,066,113 | ||||||||
| Total | 69,807,138 | |||||||||||
| Oil & Gas 8.45% | ||||||||||||
| Aethon United BR LP/Aethon United Finance Corp.† | 8.25% | 2/15/2026 | 2,770 | 2,935,591 | ||||||||
| Berry Petroleum Co. LLC† | 7.00% | 2/15/2026 | 5,441 | 5,210,764 | ||||||||
| California Resources Corp.† | 7.125% | 2/1/2026 | 2,183 | 2,253,183 | ||||||||
| Callon Petroleum Co.† | 8.00% | 8/1/2028 | 9,000 | 8,826,885 | ||||||||
| Canacol Energy Ltd. (Canada)†(e) | 5.75% | 11/24/2028 | 4,909 | 4,784,434 | ||||||||
| Canadian Natural Resources Ltd. (Canada)(e) | 7.20% | 1/15/2032 | 6,558 | 8,826,325 | ||||||||
| Cenovus Energy, Inc. (Canada)(e) | 3.75% | 2/15/2052 | 1,697 | 1,669,099 | ||||||||
| Cenovus Energy, Inc. (Canada)(e) | 5.375% | 7/15/2025 | 7,184 | 7,986,762 | ||||||||
| Centennial Resource Production LLC† | 6.875% | 4/1/2027 | 5,000 | 4,960,125 | ||||||||
| Continental Resources, Inc.† | 2.875% | 4/1/2032 | 5,000 | 4,850,075 | ||||||||
| Continental Resources, Inc. | 4.90% | 6/1/2044 | 10,404 | 11,558,272 | ||||||||
| Diamondback Energy, Inc. | 3.125% | 3/24/2031 | 5,000 | 5,102,995 | ||||||||
| Diamondback Energy, Inc. | 3.50% | 12/1/2029 | 9,539 | 10,018,746 | ||||||||
| Diamondback Energy, Inc. | 4.75% | 5/31/2025 | 1,354 | 1,484,559 | ||||||||
| Encino Acquisition Partners Holdings LLC† | 8.50% | 5/1/2028 | 5,587 | 5,638,205 | ||||||||
| Endeavor Energy Resources LP/EER Finance, Inc.† | 5.75% | 1/30/2028 | 2,812 | 2,928,487 | ||||||||
| Eni S.p.A. (Italy)†(e) | 5.70% | 10/1/2040 | 11,398 | 14,817,825 | ||||||||
| Gulfport Energy Operating Corp.† | 8.00% | 5/17/2026 | 2,864 | 3,085,129 | ||||||||
| Helmerich & Payne, Inc.† | 2.90% | 9/29/2031 | 9,079 | 8,883,626 | ||||||||
| Hess Corp. | 5.60% | 2/15/2041 | 13,097 | 16,169,225 | ||||||||
| Hilcorp Energy I LP/Hilcorp Finance Co.† | 6.25% | 11/1/2028 | 8,899 | 9,052,508 | ||||||||
| Independence Energy Finance LLC† | 7.25% | 5/1/2026 | 7,000 | 7,274,855 | ||||||||
| Kosmos Energy Ltd.† | 7.75% | 5/1/2027 | 1,750 | 1,622,311 | ||||||||
| Laredo Petroleum, Inc.† | 7.75% | 7/31/2029 | 2,750 | 2,606,794 | ||||||||
| Laredo Petroleum, Inc. | 10.125% | 1/15/2028 | 6,000 | 6,134,040 | ||||||||
| Lundin Energy Finance BV (Netherlands)†(e) | 3.10% | 7/15/2031 | 10,000 | 10,117,640 | ||||||||
| Matador Resources Co. | 5.875% | 9/15/2026 | 3,000 | 3,046,647 | ||||||||
| MEG Energy Corp. (Canada)†(e) | 5.875% | 2/1/2029 | 8,000 | 7,950,600 | ||||||||
| MEG Energy Corp. (Canada)†(e) | 7.125% | 2/1/2027 | 1,943 | 1,989,826 | ||||||||
| See Notes to Financial Statements. | 219 |
Schedule of Investments (continued)
INCOME FUND November 30, 2021
| Investments | Interest Rate | Maturity Date | Principal Amount (000) | Fair Value | ||||||||
| Oil & Gas (continued) | ||||||||||||
| Nabors Industries Ltd.† | 7.25% | 1/15/2026 | $ | 3,210 | $ | 2,767,903 | ||||||
| Occidental Petroleum Corp. | 6.20% | 3/15/2040 | 8,500 | 10,093,878 | ||||||||
| Occidental Petroleum Corp. | 6.625% | 9/1/2030 | 7,433 | 8,928,780 | ||||||||
| OGX Austria GmbH (Brazil)†(e)(g) | 8.50% | 6/1/2018 | 1,800 | 36 | ||||||||
| Ovintiv, Inc. | 6.50% | 2/1/2038 | 2,362 | 3,013,853 | ||||||||
| Ovintiv, Inc. | 6.625% | 8/15/2037 | 4,000 | 5,095,392 | ||||||||
| Patterson-UTI Energy, Inc. | 3.95% | 2/1/2028 | 11,982 | 11,715,252 | ||||||||
| PDC Energy, Inc. | 5.75% | 5/15/2026 | 3,000 | 3,035,640 | ||||||||
| Precision Drilling Corp. (Canada)†(e) | 6.875% | 1/15/2029 | 3,250 | 3,168,831 | ||||||||
| SM Energy Co. | 6.625% | 1/15/2027 | 2,426 | 2,443,758 | ||||||||
| SM Energy Co. | 6.75% | 9/15/2026 | 2,324 | 2,335,039 | ||||||||
| Southwestern Energy Co. | 5.375% | 3/15/2030 | 12,000 | 12,517,620 | ||||||||
| Suncor Energy Ventures Corp. (Canada)†(e) | 4.50% | 4/1/2022 | 8,775 | 8,803,798 | ||||||||
| Suncor Energy, Inc. (Canada)(e) | 7.875% | 6/15/2026 | 8,027 | 9,872,996 | ||||||||
| Viper Energy Partners LP† | 5.375% | 11/1/2027 | 2,935 | 3,029,404 | ||||||||
| Total | 268,607,713 | |||||||||||
| Oil & Gas Services 0.56% | ||||||||||||
| Halliburton Co. | 7.45% | 9/15/2039 | 4,869 | 7,194,229 | ||||||||
| NOV, Inc. | 3.60% | 12/1/2029 | 5,632 | 5,787,809 | ||||||||
| Weatherford International Ltd.† | 8.625% | 4/30/2030 | 5,000 | 4,909,250 | ||||||||
| Total | 17,891,288 | |||||||||||
| Pharmaceuticals 1.62% | ||||||||||||
| Bayer Corp.† | 6.65% | 2/15/2028 | 12,162 | 14,845,109 | ||||||||
| Bayer US Finance II LLC† | 4.375% | 12/15/2028 | 7,450 | 8,374,086 | ||||||||
| Cigna Corp. | 6.125% | 11/15/2041 | 10,439 | 14,884,052 | ||||||||
| CVS Health Corp. | 5.05% | 3/25/2048 | 10,000 | 13,232,015 | ||||||||
| Total | 51,335,262 | |||||||||||
| Pipelines 2.12% | ||||||||||||
| Buckeye Partners LP | 6.375% (3 Mo. LIBOR + 4.02% | )# | 1/22/2078 | 6,000 | 5,313,810 | |||||||
| Cheniere Corpus Christi Holdings LLC | 3.70% | 11/15/2029 | 2,500 | 2,672,812 | ||||||||
| Cheniere Corpus Christi Holdings LLC | 5.125% | 6/30/2027 | 7,707 | 8,732,212 | ||||||||
| Eastern Gas Transmission & Storage, Inc.† | 4.60% | 12/15/2044 | 4,529 | 5,452,748 | ||||||||
| NGPL PipeCo LLC† | 4.875% | 8/15/2027 | 20,258 | 22,633,149 | ||||||||
| Oleoducto Central SA (Colombia)†(e) | 4.00% | 7/14/2027 | 12,000 | 11,978,580 | ||||||||
| Williams Cos., Inc. (The) | 8.75% | 3/15/2032 | 7,000 | 10,510,685 | ||||||||
| Total | 67,293,996 | |||||||||||
| 220 | See Notes to Financial Statements. |
Schedule of Investments (continued)
INCOME FUND November 30, 2021
| Investments | Interest Rate | Maturity Date | Principal Amount (000) | Fair Value | ||||||||
| Real Estate 0.06% | ||||||||||||
| Kennedy-Wilson, Inc. | 4.75% | 3/1/2029 | $ | 2,044 | $ | 2,074,292 | ||||||
| REITS 3.72% | ||||||||||||
| American Campus Communities Operating Partnership LP | 2.25% | 1/15/2029 | 2,605 | 2,584,048 | ||||||||
| American Campus Communities Operating Partnership LP | 3.875% | 1/30/2031 | 12,342 | 13,726,640 | ||||||||
| American Homes 4 Rent LP | 2.375% | 7/15/2031 | 3,712 | 3,677,178 | ||||||||
| American Homes 4 Rent LP | 4.25% | 2/15/2028 | 5,564 | 6,210,647 | ||||||||
| American Homes 4 Rent LP | 4.90% | 2/15/2029 | 3,352 | 3,922,965 | ||||||||
| CyrusOne LP/CyrusOne Finance Corp. | 2.15% | 11/1/2030 | 7,000 | 6,878,480 | ||||||||
| CyrusOne LP/CyrusOne Finance Corp. | 3.45% | 11/15/2029 | 7,200 | 7,688,628 | ||||||||
| EPR Properties | 3.75% | 8/15/2029 | 5,913 | 6,062,302 | ||||||||
| EPR Properties | 4.95% | 4/15/2028 | 10,915 | 11,958,980 | ||||||||
| GLP Capital LP/GLP Financing II, Inc. | 5.75% | 6/1/2028 | 7,325 | 8,471,289 | ||||||||
| Goodman US Finance Three LLC† | 3.70% | 3/15/2028 | 12,900 | 13,978,396 | ||||||||
| HAT Holdings I LLC/HAT Holdings II LLC† | 3.75% | 9/15/2030 | 5,372 | 5,276,378 | ||||||||
| Invitation Homes Operating Partnership LP | 2.00% | 8/15/2031 | 8,674 | 8,236,559 | ||||||||
| Invitation Homes Operating Partnership LP | 2.30% | 11/15/2028 | 3,131 | 3,108,811 | ||||||||
| MPT Operating Partnership LP/MPT Finance Corp. | 4.625% | 8/1/2029 | 9,632 | 10,069,726 | ||||||||
| Physicians Realty LP | 2.625% | 11/1/2031 | 6,495 | 6,496,662 | ||||||||
| Total | 118,347,689 | |||||||||||
| Retail 0.56% | ||||||||||||
| Bath & Body Works, Inc. | 6.875% | 11/1/2035 | 2,345 | 2,820,484 | ||||||||
| Carvana Co.† | 5.625% | 10/1/2025 | 1,592 | 1,596,490 | ||||||||
| Carvana Co.† | 5.875% | 10/1/2028 | 1,613 | 1,621,622 | ||||||||
| CEC Entertainment LLC† | 6.75% | 5/1/2026 | 3,000 | 2,928,495 | ||||||||
| LBM Acquisition LLC† | 6.25% | 1/15/2029 | 3,125 | 2,996,656 | ||||||||
| Party City Holdings, Inc.† | 8.75% | 2/15/2026 | 2,875 | 2,904,296 | ||||||||
| Stonegate Pub Co. Financing 2019 plc(d) | 8.00% | 7/13/2025 | GBP | 2,200 | 2,950,701 | |||||||
| Total | 17,818,744 | |||||||||||
| Semiconductors 0.51% | ||||||||||||
| Broadcom, Inc. | 4.15% | 11/15/2030 | $ | 8,955 | 9,799,165 | |||||||
| Skyworks Solutions, Inc. | 3.00% | 6/1/2031 | 6,174 | 6,268,187 | ||||||||
| Total | 16,067,352 | |||||||||||
| Shipbuilding 0.30% | ||||||||||||
| Huntington Ingalls Industries, Inc. | 3.844% | 5/1/2025 | 9,000 | 9,577,489 | ||||||||
| See Notes to Financial Statements. | 221 |
Schedule of Investments (continued)
INCOME FUND November 30, 2021
| Investments | Interest Rate | Maturity Date | Principal Amount (000) | Fair Value | ||||||||
| Software 1.98% | ||||||||||||
| MSCI, Inc.† | 3.25% | 8/15/2033 | $ | 10,460 | $ | 10,446,716 | ||||||
| Oracle Corp. | 2.875% | 3/25/2031 | 3,614 | 3,701,313 | ||||||||
| Oracle Corp. | 6.125% | 7/8/2039 | 23,745 | 32,426,936 | ||||||||
| Twilio, Inc. | 3.625% | 3/15/2029 | 2,003 | 2,018,042 | ||||||||
| Twilio, Inc. | 3.875% | 3/15/2031 | 2,271 | 2,258,612 | ||||||||
| VMware, Inc. | 4.70% | 5/15/2030 | 10,471 | 12,167,647 | ||||||||
| Total | 63,019,266 | |||||||||||
| Telecommunications 1.59% | ||||||||||||
| AT&T, Inc.(d) | 2.875% (5 Yr. EUR CMT + 3.14% | )# | – | (f) | EUR | 12,500 | 14,142,433 | |||||
| AT&T, Inc. | 3.50% | 9/15/2053 | $ | 33,908 | 34,312,905 | |||||||
| Switch Ltd.† | 3.75% | 9/15/2028 | 2,247 | 2,227,934 | ||||||||
| Total | 50,683,272 | |||||||||||
| Transportation 0.10% | ||||||||||||
| Seaspan Corp. (Hong Kong)†(e) | 5.50% | 8/1/2029 | 3,100 | 3,081,214 | ||||||||
| Trucking & Leasing 0.10% | ||||||||||||
| Fortress Transportation and Infrastructure Investors LLC† | 5.50% | 5/1/2028 | 3,150 | 3,093,867 | ||||||||
| Total Corporate Bonds (cost $1,816,843,261) | 1,867,788,903 | |||||||||||
| FLOATING RATE LOANS(h) 11.59% | ||||||||||||
| Advertising 0.65% | ||||||||||||
| Lamar Media Corporation 2020 Term Loan B | 1.589% (1 Mo. LIBOR + 1.50% | ) | 2/5/2027 | 20,585 | 20,502,909 | |||||||
| Automotive 0.10% | ||||||||||||
| Ford Motor Company Unsecured Term Loan | 1.85% (1 Mo. LIBOR + 1.75% | ) | 12/31/2022 | 3,315 | 3,290,054 | |||||||
| Business Services 0.76% | ||||||||||||
| Global Payments, Inc. 2019 Term Loan | 1.467% (1 Mo. LIBOR + 1.38% | ) | 7/9/2024 | 5,483 | 5,469,788 | |||||||
| Trans Union, LLC 2019 Term Loan B5 | 1.84% (1 Mo. LIBOR + 1.75% | ) | 11/16/2026 | 18,079 | 17,845,430 | |||||||
| Trans Union, LLC 2021 2nd Lien Term Loan | – | (i) | 11/16/2029 | 909 | 909,090 | (j) | ||||||
| Total | 24,224,308 | |||||||||||
| 222 | See Notes to Financial Statements. |
Schedule of Investments (continued)
INCOME FUND November 30, 2021
| Investments | Interest Rate | Maturity Date | Principal Amount (000) | Fair Value | ||||||||
| Chemicals 0.38% | ||||||||||||
| Nutrition & Biosciences, Inc. 5 Year Delayed Draw Term Loan | 1.41% (3 Mo. LIBOR +1.25% | ) | 1/17/2025 | $ | 12,223 | $ | 12,215,275 | |||||
| Containers 0.31% | ||||||||||||
| Owens-Illinois, Inc. 2019 Tranche A Term Loan A | 1.592% (1 Mo. LIBOR + 1.50% | ) | 6/25/2024 | 9,945 | 9,908,017 | |||||||
| Entertainment 0.64% | ||||||||||||
| Churchill Downs Incorporated 2021 Incremental Term Loan B1 | 2.10% (1 Mo. LIBOR + 2.00% | ) | 3/17/2028 | 14,279 | 14,183,899 | |||||||
| Scientific Games International, Inc. 2018 Term Loan B5 | 2.84% (1 Mo. LIBOR + 2.75% | ) | 8/14/2024 | 6,238 | 6,200,784 | |||||||
| Total | 20,384,683 | |||||||||||
| Financial Services 0.73% | ||||||||||||
| Avolon TLB Borrower 1 (US) LLC 2021 Term Loan B5 | – | (i) | 12/1/2027 | 16,947 | 16,933,183 | |||||||
| Delos Finance Sarl 2018 Term Loan B (Luxembourg)(e) | 1.882% (3 Mo. LIBOR + 1.75% | ) | 10/6/2023 | 6,295 | 6,289,978 | |||||||
| Total | 23,223,161 | |||||||||||
| Food 0.93% | ||||||||||||
| JBS USA Lux S.A. 2019 Term Loan B | 2.092% (1 Mo. LIBOR + 2.0% | ) | 5/1/2026 | 29,790 | 29,682,316 | |||||||
| Government 1.30% | ||||||||||||
| Seminole Tribe of Florida 2018 Term Loan B | 1.84% (1 Mo. LIBOR + 1.75% | ) | 7/8/2024 | 41,389 | 41,314,964 | |||||||
| Health Care Services 0.62% | ||||||||||||
| DaVita, Inc. 2019 Delayed Draw Term Loan A | 1.59% (1 Mo. LIBOR + 1.50% | ) | 8/12/2024 | 10,824 | 10,785,385 | |||||||
| DaVita, Inc. 2020 Term Loan B | 1.84% (1 Mo. LIBOR + 1.75% | ) | 8/12/2026 | 8,948 | 8,860,920 | |||||||
| Total | 19,646,305 | |||||||||||
| Leasing 0.63% | ||||||||||||
| Setanta Aircraft Leasing Designated Activity Company Term Loan B (Ireland)(e) | 2.14% (3 Mo. LIBOR + 2.0% | ) | 11/5/2028 | 19,925 | 19,916,731 | |||||||
| See Notes to Financial Statements. | 223 |
Schedule of Investments (continued)
INCOME FUND November 30, 2021
| Investments | Interest Rate | Maturity Date | Principal Amount (000) | Fair Value | ||||||||
| Lodging 0.97% | ||||||||||||
| Hilton Worldwide Finance, LLC 2019 Term Loan B2 | 1.842% (1 Mo. LIBOR + 1.75% | ) | 6/22/2026 | $ | 23,817 | $ | 23,515,236 | |||||
| Resorts World Las Vegas LLC Term Loan A | 1.60% (1 Mo. LIBOR + 1.50% | ) | 4/16/2024 | 1,088 | 1,071,188 | |||||||
| Wyndham Hotels & Resorts, Inc. Term Loan B | 1.84% (1 Mo. LIBOR + 1.75% | ) | 5/30/2025 | 6,336 | 6,238,719 | |||||||
| Total | 30,825,143 | |||||||||||
| Media 0.64% | ||||||||||||
| Banijay Entertainment S.A.S USD Term Loan (France)(e) | 3.838% (1 Mo. LIBOR + 3.75% | ) | 3/1/2025 | 5,742 | 5,715,099 | |||||||
| Nielsen Finance LLC USD Term Loan B4 | 2.089% (1 Mo. LIBOR + 2.00% | ) | 10/4/2023 | 14,575 | 14,556,467 | |||||||
| Total | 20,271,566 | |||||||||||
| Miscellaneous 0.56% | ||||||||||||
| Charter Communications Operating, LLC 2019 Term Loan B1 | 1.85% (1 Mo. LIBOR + 1.75% | ) | 4/30/2025 | 7,947 | 7,920,012 | |||||||
| HCA, Inc. 2021 Term Loan B14 | 1.84% (1 Mo. LIBOR + 1.75% | ) | 6/30/2028 | 9,937 | 9,988,321 | |||||||
| Total | 17,908,333 | |||||||||||
| Oil 0.08% | ||||||||||||
| Hess Corporation Term Loan | 2.10% (1 Mo. LIBOR + 2.00% | ) | 3/16/2023 | 2,500 | 2,493,750 | |||||||
| Real Estate 0.21% | ||||||||||||
| Invitation Homes Operating Partnership LP 2020 Term Loan A | 1.09% (1 Mo. LIBOR + 1.00% | ) | 1/31/2025 | 6,658 | 6,658,380 | |||||||
| Retail 0.88% | ||||||||||||
| Murphy USA, Inc. Term Loan B | 2.25% (1 Mo. LIBOR + 1.75% | ) | 1/31/2028 | 27,783 | 27,863,528 | |||||||
| Technology 0.20% | ||||||||||||
| Comcast Hulu Holdings, LLC Term Loan A | 0.965% (1 Mo. LIBOR + 0.88% | ) | 3/15/2024 | 6,331 | 6,275,164 | |||||||
| 224 | See Notes to Financial Statements. |
Schedule of Investments (continued)
INCOME FUND November 30, 2021
| Investments | Interest Rate | Maturity Date | Principal Amount (000) | Fair Value | ||||||||
| Telecommunications 0.51% | ||||||||||||
| CenturyLink, Inc. 2020 Term Loan A | 2.09% (1 Mo. LIBOR + 2.00% | ) | 1/31/2025 | $ | 8,554 | $ | 8,515,597 | |||||
| LogMeIn, Inc. Term Loan B | 4.839% (1 Mo. LIBOR + 4.75% | ) | 8/31/2027 | 7,579 | 7,543,716 | |||||||
| UTEX Industries Inc. 2020 Second Out Term Loan PIK 5.75% | 5.25% (1 Mo. LIBOR + 5.75% | ) | 12/3/2025 | – | (k) | 204 | ||||||
| Total | 16,059,517 | |||||||||||
| Transportation: Miscellaneous 0.49% | ||||||||||||
| XPO Logistics, Inc. 2018 Term Loan B | 1.831% (1 Mo. LIBOR + 1.75% | ) | 2/24/2025 | 15,814 | 15,713,485 | |||||||
| Total Floating Rate Loans (cost $369,244,074) | 368,377,589 | |||||||||||
| FOREIGN GOVERNMENT OBLIGATIONS 0.07% | ||||||||||||
| Sri Lanka | ||||||||||||
| Republic of Sri Lanka†(e) (cost $2,445,021) | 5.875% | 7/25/2022 | 2,840 | 2,154,822 | ||||||||
| GOVERNMENT SPONSORED ENTERPRISES COLLATERALIZED MORTGAGE OBLIGATIONS 0.01% | ||||||||||||
| Federal Home Loan Mortgage Corp. 1200 IB | 1,007.00% | 2/15/2022 | – | (k) | 1 | (a) | ||||||
| Federal Home Loan Mortgage Corp. 1241 X | 982.654% | 4/15/2022 | – | (k) | 2 | (a) | ||||||
| Federal Home Loan Mortgage Corp. 1363 B Zero Coupon | 8/15/2022 | 2 | 1,584 | |||||||||
| Government National Mortgage Assoc. 2013-48 IO | 0.495% | #(l) | 7/16/2054 | 10,440 | 196,903 | |||||||
| Total Government Sponsored Enterprises Collateralized Mortgage Obligations (cost $373,189) | 198,490 | |||||||||||
| MUNICIPAL BONDS 0.69% | ||||||||||||
| Miscellaneous | ||||||||||||
| Metropolitan Transportation Authority | 6.668% | 11/15/2039 | 6,470 | 9,295,415 | ||||||||
| New Jersey Transportation Trust Fund Authority | 4.081% | 6/15/2039 | 725 | 837,459 | ||||||||
| New Jersey Transportation Trust Fund Authority | 4.131% | 6/15/2042 | 2,665 | 3,111,751 | ||||||||
| State of Illinois | 4.95% | 6/1/2023 | 659 | 689,639 | ||||||||
| State of Illinois | 5.10% | 6/1/2033 | 6,855 | 8,019,967 | ||||||||
| Total Municipal Bonds (cost $20,423,391) | 21,954,231 | |||||||||||
| NON-AGENCY COMMERCIAL MORTGAGE-BACKED SECURITIES 4.56% | ||||||||||||
| Angel Oak Mortgage Trust 2020-1 A1† | 2.466% | #(l) | 12/25/2059 | 607 | 609,692 | |||||||
| Angel Oak Mortgage Trust 2021-7 A1† | 1.978% | #(l) | 10/25/2066 | 3,750 | 3,776,314 | |||||||
| BBCMS Mortgage Trust 2019-BWAY C† | 1.70% (1 Mo. LIBOR + 1.61% | )# | 11/15/2034 | 3,950 | 3,902,203 | |||||||
| Benchmark Mortgage Trust 2020-B22 E† | 2.00% | 1/15/2054 | 5,750 | 4,409,704 | ||||||||
| See Notes to Financial Statements. | 225 |
Schedule of Investments (continued)
INCOME FUND November 30, 2021
| Investments | Interest Rate | Maturity Date | Principal Amount (000) | Fair Value | ||||||||
| NON-AGENCY COMMERCIAL MORTGAGE-BACKED SECURITIES (continued) | ||||||||||||
| BFLD 2019-DPLO E† | 2.33% (1 Mo. LIBOR + 2.24% | )# | 10/15/2034 | $ | 8,000 | $ | 7,855,213 | |||||
| BX Commercial Mortgage Trust 2019-IMC E† | 2.239% (1 Mo. LIBOR + 2.15% | )# | 4/15/2034 | 4,000 | 3,938,196 | |||||||
| BX Commercial Mortgage Trust 2019-XL D† | 1.54% (1 Mo. LIBOR + 1.45% | )# | 10/15/2036 | 5,976 | 5,962,399 | |||||||
| BX Commercial Mortgage Trust 2019-XL E† | 1.89% (1 Mo. LIBOR + 1.80% | )# | 10/15/2036 | 5,058 | 5,043,794 | |||||||
| BX Commercial Mortgage Trust 2019-XL F† | 2.09% (1 Mo. LIBOR + 2.00% | )# | 10/15/2036 | 5,623 | 5,596,070 | |||||||
| Citigroup Commercial Mortgage Trust 2016-P3 C | 5.052% | #(l) | 4/15/2049 | 5,960 | 6,181,200 | |||||||
| Commercial Mortgage Pass-Through Certificates 2015-PC1 C | 4.463% | #(l) | 7/10/2050 | 3,018 | 3,151,161 | |||||||
| Credit Suisse Mortgage Capital Certificates 2020-AFC1 A1† | 2.24% | #(l) | 2/25/2050 | 1,674 | �� | 1,681,514 | ||||||
| CS Master Trust 2021-AHP A† | 4.449% (1 Mo. LIBOR + 3.95% | )# | 4/15/2025 | 4,200 | 4,212,495 | (a) | ||||||
| CS Master Trust 2021-BLUF A† | 4.527% (1 Mo. LIBOR + 4.18% | )# | 4/15/2023 | 2,400 | 2,423,414 | (a) | ||||||
| Deephaven Residential Mortgage Trust 2020-1 A1† | 2.339% | #(l) | 1/25/2060 | 859 | 860,868 | |||||||
| Fannie Mae Connecticut Avenue Securities 2021-R02 2M2†(b) | 2.05% (1 Mo. SOFR + 2.00% | )# | 11/25/2041 | 3,780 | 3,787,088 | |||||||
| Freddie Mac Structured Agency Credit Risk Debt Notes 2021-DNA7 M1† | 0.898% (1 Mo. SOFR + .85% | )# | 11/25/2041 | 9,500 | 9,509,294 | |||||||
| Freddie Mac Structured Agency Credit Risk Debt Notes 2021-DNA7 M2† | 1.848% (1 Mo. SOFR + 1.80% | )# | 11/25/2041 | 4,770 | 4,784,884 | |||||||
| GCAT Trust 2020-NQM1 A1† | 2.247% | 1/25/2060 | 491 | 492,940 | ||||||||
| Great Wolf Trust 2019-WOLF A† | 1.124% (1 Mo. LIBOR + 1.03% | )# | 12/15/2036 | 8,100 | 8,093,756 | |||||||
| Great Wolf Trust 2019-WOLF E† | 2.822% (1 Mo. LIBOR + 2.73% | )# | 12/15/2036 | 1,902 | 1,845,037 | |||||||
| GS Mortgage Securities Corp. Trust 2021-ROSS G† | 4.74% (1 Mo. LIBOR + 4.65% | )# | 5/15/2026 | 5,160 | 5,188,772 | |||||||
| GS Mortgage Securities Trust 2013-GC12 XA IO | 1.531% | #(l) | 6/10/2046 | 20,699 | 300,933 | |||||||
| GS Mortgage Securities Trust 2013-GC12 XB | 0.655% | #(l) | 6/10/2046 | 47,400 | 306,090 | |||||||
| GS Mortgage Securities Trust 2015-GC32 C | 4.574% | #(l) | 7/10/2048 | 1,022 | 1,067,575 | |||||||
| 226 | See Notes to Financial Statements. |
Schedule of Investments (continued)
INCOME FUND November 30, 2021
| Investments | Interest Rate | Maturity Date | Principal Amount (000) | Fair Value | ||||||||
| NON-AGENCY COMMERCIAL MORTGAGE-BACKED SECURITIES (continued) | ||||||||||||
| GS Mortgage Securities Trust 2015-GS1 XB | 0.328% | #(l) | 11/10/2048 | $ | 30,000 | $ | 254,400 | |||||
| HPLY Trust 2019-HIT A† | 1.09% (1 Mo. LIBOR + 1.00% | )# | 11/15/2036 | 3,051 | 3,050,241 | |||||||
| Hudsons Bay Simon JV Trust 2015-HB10 XB10† | 0.723% | #(l) | 8/5/2034 | 16,028 | 322,804 | |||||||
| Hudsons Bay Simon JV Trust 2015-HB7 XB7† | 0.665% | #(l) | 8/5/2034 | 18,308 | 51,446 | |||||||
| JPMorgan Chase Commercial Mortgage Securities Trust 2015-C30 C | 4.406% | #(l) | 7/15/2048 | 1,674 | 1,711,047 | |||||||
| JPMorgan Chase Commercial Mortgage Securities Trust 2017-MARK A† | 3.392% | 6/5/2032 | 2,700 | 2,713,490 | ||||||||
| Merrill Lynch Mortgage Investors Trust 2006-AF2 AF1 | 6.25% | 10/25/2036 | 439 | 273,438 | ||||||||
| New Residential Mortgage Loan Trust 2020-NQM1 A1† | 2.464% | #(l) | 1/26/2060 | 567 | 569,683 | |||||||
| One Bryant Park Trust 2019-OBP A† | 2.516% | 9/15/2054 | 10,000 | 10,253,276 | ||||||||
| One New York Plaza Trust 2020-1NYP B† | 1.59% (1 Mo. LIBOR + 1.50% | )# | 1/15/2026 | 7,330 | 7,355,809 | |||||||
| PFP Ltd. 2019-6 C† | 2.191% (1 Mo. LIBOR + 2.10% | )# | 4/14/2037 | 4,576 | 4,568,637 | |||||||
| Ready Capital Mortgage Financing LLC 2021-FL5 D† | 3.092% (1 Mo. LIBOR + 3.00% | )# | 4/25/2038 | 8,160 | 8,172,036 | |||||||
| Residential Mortgage Loan Trust 2020-1 A1† | 2.376% | #(l) | 1/26/2060 | 435 | 438,222 | |||||||
| Starwood Mortgage Residential Trust 2020-1 A1† | 2.275% | #(l) | 2/25/2050 | 716 | 720,788 | |||||||
| Verus Securitization Trust 2020-1 A1† | 2.417% | 1/25/2060 | 690 | 693,714 | ||||||||
| VMC Finance LLC 2019-FL3 A† | 1.189% (1 Mo. LIBOR + 1.10% | )# | 9/15/2036 | 1,653 | 1,653,302 | |||||||
| Wells Fargo Commercial Mortgage Trust 2013-LC12 D† | 4.441% | #(l) | 7/15/2046 | 2,256 | 1,272,867 | |||||||
| Wells Fargo Commercial Mortgage Trust 2015-SG1 B | 4.603% | #(l) | 9/15/2048 | 3,451 | 3,505,600 | |||||||
| Wells Fargo Commercial Mortgage Trust 2017-C41 AS | 3.785% | #(l) | 11/15/2050 | 2,089 | 2,242,628 | |||||||
| Total Non-Agency Commercial Mortgage-Backed Securities (cost $144,831,478) | 144,804,034 | |||||||||||
| See Notes to Financial Statements. | 227 |
Schedule of Investments (continued)
INCOME FUND November 30, 2021
| Investments | Exercise Price | Expiration Date | Shares (000) | Fair Value | ||||||||
| RIGHTS 0.00% | ||||||||||||
| Oil & Gas | ||||||||||||
| Dommo Energia SA*(d) | $0.70 | 12/23/2021 | BRL 41 | $ | 293 | |||||||
| Interest Rate | Maturity Date | Principal Amount (000) | ||||||||||
| U.S. TREASURY OBLIGATIONS 11.29% | ||||||||||||
| U.S. Treasury Bond | 1.125% | 5/15/2040 | $ | 14,526 | 12,888,420 | |||||||
| U.S. Treasury Bond | 1.75% | 8/15/2041 | 83,129 | 81,635,276 | ||||||||
| U.S. Treasury Bond | 2.00% | 8/15/2051 | 61,182 | 64,088,145 | ||||||||
| U.S. Treasury Bond | 2.25% | 8/15/2049 | 13,950 | 15,340,096 | ||||||||
| U.S. Treasury Note | 1.125% | 10/31/2026 | 104,729 | 104,598,089 | ||||||||
| U.S. Treasury Note | 1.25% | 8/15/2031 | 81,403 | 80,111,999 | ||||||||
| Total U.S. Treasury Obligations (cost $352,092,628) | 358,662,025 | |||||||||||
| Exercise Price | Expiration Date | Shares (000) | ||||||||||
| WARRANTS 0.00% | ||||||||||||
| Miscellaneous Financials | ||||||||||||
| UTEX Industries, Inc.* | $114.76 | 12/3/2025 | 3 | 7,968 | ||||||||
| Total Long-Term Investments (cost $3,030,959,165) | 3,089,937,114 | |||||||||||
| Principal Amount (000) | ||||||||||||
| SHORT-TERM INVESTMENTS 3.76% | ||||||||||||
| REPURCHASE AGREEMENTS 3.76% | ||||||||||||
| Repurchase Agreement dated 11/30/2021, 0.00% due 12/1/2021 with Fixed Income Clearing Corp. collateralized by $122,159,100 of U.S. Treasury Note at 0.125% due 04/30/2023; value: $121,790,007; proceeds: $119,401,923 (cost $119,401,923) | $ | 119,402 | 119,401,923 | |||||||||
| Total Investments in Securities 101.01% (cost $3,150,361,088) | 3,209,339,037 | |||||||||||
| Other Assets and Liabilities – Net(m) (1.01)% | (32,017,354 | ) | ||||||||||
| Net Assets 100.00% | $ | 3,177,321,683 | ||||||||||
| 228 | See Notes to Financial Statements. |
Schedule of Investments (continued)
INCOME FUND November 30, 2021
| BRL | Brazilian Real. | |
| CAD | Canadian Dollar. | |
| EUR | Euro. | |
| GBP | British Pound. | |
| CMT | Constant Maturity Rate. | |
| IO | Interest Only. | |
| LIBOR | London Interbank Offered Rate. | |
| PIK | Payment-in-kind. | |
| SOFR | Secured Over Night Financing Rate. | |
| † | Security was purchased pursuant to Rule 144A under the Securities Act of 1933 and, unless registered under such Act or exempted from registration, may only be resold to qualified institutional buyers. At November 30, 2021, the total value of Rule 144A securities was $1,102,259,575, which represents 34.69% of net assets. | |
| # | Variable rate security. The interest rate represents the rate in effect at November 30, 2021. | |
| * | Non-income producing security. | |
| (a) | Level 3 Investment as described in Note 2(t) in the Notes to Financials. Security valued utilizing third party pricing information without adjustment. Such valuations are based on unobservable inputs. A significant change in third party information could result in a significantly lower or higher value of such Level 3 investments. | |
| (b) | Securities purchased on a when-issued basis (See Note 2(j)). | |
| (c) | Variable Rate is Fixed to Float: Rate remains fixed or at Zero Coupon until designated future date. | |
| (d) | Investment in non-U.S. dollar denominated securities. | |
| (e) | Foreign security traded in U.S. dollars. | |
| (f) | Security is perpetual in nature and has no stated maturity. | |
| (g) | Defaulted (non-income producing security). | |
| (h) | Floating Rate Loans in which the Fund invests generally pay interest at rates which are periodically re-determined at a margin above the London Interbank Offered Rate (“LIBOR”) or the prime rate offered by major U.S. banks. The rate(s) shown is the rate(s) in effect at November 30, 2021. | |
| (i) | Interest rate to be determined. | |
| (j) | Level 3 Investment as described in Note 2(t) in the Notes to Financials. Floating Rate Loans categorized as Level 3 are valued based on a single quotation obtained from a dealer. Accounting principles generally accepted in the United States of America do not require the Fund to create quantitative unobservable inputs that were not developed by the Fund. Therefore, the Fund does not have access to unobservable inputs and cannot disclose such inputs in the valuation. | |
| (k) | Amount is less than $1,000. | |
| (l) | Interest rate is based on the weighted average interest rates of the underlying mortgages within the mortgage pool. | |
| (m) | Other Assets and Liabilities – Net include net unrealized appreciation/depreciation on forward foreign currency exchange contracts, futures contracts and swaps as follows: | |
| See Notes to Financial Statements. | 229 |
Schedule of Investments (continued)
INCOME FUND November 30, 2021
Credit Default Swaps on Indexes - Sell Protection at November 30, 2021(1):
| Referenced Index* | Swap Counterparty | Fund Receives (Quarterly) | Termination Date | Notional Amount | Payments Upfront(2) | Unrealized Appreciation/ (Depreciation) | (3) | Credit Default Swap Agreements Payable at Fair Value(4) | |||||||||||||
| Markit CMBX.NA.BBB-.12 | Morgan Stanley | 3.000% | 8/17/2061 | $ | 3,000,000 | $ | (240,082 | ) | $ | 42,649 | $ | (197,433 | ) | ||||||||
| Markit CMBX.NA.BBB-.10 | Citibank | 3.000% | 11/17/2059 | 9,800,000 | (859,764 | ) | (124,940 | ) | (984,704 | ) | |||||||||||
| Markit CMBX.NA.BBB-.12 | Goldman Sachs | 3.000% | 8/17/2061 | 2,950,000 | (259,353 | ) | 65,210 | (194,143 | ) | ||||||||||||
| Markit CMBX.NA.BBB-.12 | Goldman Sachs | 3.000% | 8/17/2061 | 2,950,000 | (241,703 | ) | 47,560 | (194,143 | ) | ||||||||||||
| Markit CMBX.NA.BBB-.12 | Morgan Stanley | 3.000% | 8/17/2061 | 7,900,000 | (637,779 | ) | 117,871 | (519,908 | ) | ||||||||||||
| Markit CMBX.NA.BBB-.12 | Morgan Stanley | 3.000% | 8/17/2061 | 5,900,000 | (483,116 | ) | 94,830 | (388,286 | ) | ||||||||||||
| $ | (2,721,797 | ) | $ | 243,180 | $ | (2,478,617 | ) | ||||||||||||||
| * | The Referenced Index is for the Credit Default Swaps on Indexes, which is comprised of a basket of commercial mortgage-backed securities. | |
| (1) | If the Fund is a seller of protection and a credit event occurs, as defined under the terms of that particular swap agreement, the Fund will either (i) pay to the buyer of protection an amount equal to the notional amount of the swap and take delivery of the referenced obligation or underlying securities comprising the referenced index or (ii) pay a net settlement amount in the form of cash or securities equal to the notional amount of the swap less the recovery value of the referenced obligation or underlying securities. | |
| (2) | Upfront payments received/paid are presented net of amortization. | |
| (3) | Total unrealized appreciation on Credit Default Swaps on Indexes amounted to $368,120. Total unrealized depreciation on Credit Default Swaps on Indexes amounted to $124,940. | |
| (4) | Includes upfront payments received. |
Open Forward Foreign Currency Exchange Contracts at November 30, 2021:
| Forward Foreign Currency Exchange Contracts | Transaction Type | Counterparty | Expiration Date | Foreign Currency | U.S. $ Cost on Origination Date | U.S. $ Current Value | Unrealized Appreciation | ||||||||||||||
| Euro | Buy | Bank of America | 12/10/2021 | 107,000 | $ | 120,811 | $ | 121,371 | $ | 560 | |||||||||||
| Euro | Buy | Standard Chartered Bank | 12/10/2021 | 8,433,000 | 9,480,196 | 9,565,590 | 85,394 | ||||||||||||||
| British pound | Sell | State Street Bank and Trust | 12/7/2021 | 2,316,000 | 3,154,156 | 3,080,181 | 73,975 | ||||||||||||||
| Canadian dollar | Sell | Toronto Dominion Bank | 1/20/2022 | 16,042,000 | 12,974,944 | 12,563,855 | 411,089 | ||||||||||||||
| Euro | Sell | State Street Bank and Trust | 12/10/2021 | 27,837,000 | 32,968,667 | 31,575,636 | 1,393,031 | ||||||||||||||
| Unrealized Appreciation on Forward Foreign Currency Exchange Contracts | $ | 1,964,049 | |||||||||||||||||||
| 230 | See Notes to Financial Statements. |
Schedule of Investments (continued)
INCOME FUND November 30, 2021
| Forward Foreign Currency Exchange Contracts | Transaction Type | Counterparty | Expiration Date | Foreign Currency | U.S. $ Cost on Origination Date | U.S. $ Current Value | Unrealized Depreciation | ||||||||||||||
| Euro | Buy | Goldman Sachs | 12/10/2021 | 6,771,000 | $7,701,836 | $ | 7,680,376 | $ | (21,460 | ) | |||||||||||
Open Futures Contracts at November 30, 2021:
| Type | Expiration | Contracts | Position | Notional Amount | Notional Value | Unrealized Appreciation | ||||||||||||
| U.S. 2-Year Treasury Note | March 2022 | 1,067 | Long | $232,960,826 | $233,389,579 | $ | 428,753 | |||||||||||
| U.S. 5-Year Treasury Note | March 2022 | 941 | Long | 113,414,361 | 114,235,930 | 821,569 | ||||||||||||
| U.S. Treasury Long Bond | March 2022 | 106 | Long | 16,831,017 | 17,185,250 | 354,233 | ||||||||||||
| U.S. Ultra Treasury Bond | March 2022 | 356 | Long | 69,086,934 | 71,400,250 | 2,313,316 | ||||||||||||
| Total Unrealized Appreciation on Open Futures Contracts | $ | 3,917,871 | ||||||||||||||||
| Type | Expiration | Contracts | Position | Notional Amount | Notional Value | Unrealized Depreciation | ||||||||||||
| Euro-Bobl | March 2022 | 65 | Short | EUR (8,722,875) | EUR (8,729,500) | $(7,513 | ) | |||||||||||
| See Notes to Financial Statements. | 231 |
Schedule of Investments (concluded)
INCOME FUND November 30, 2021
The following is a summary of the inputs used as of November 30, 2021 in valuing the Fund’s investments carried at fair value(1):
| Investment Type(2) | Level 1 | Level 2 | Level 3 | Total | ||||||||||||
| Long-Term Investments | ||||||||||||||||
| Asset-Backed Securities | ||||||||||||||||
| Credit Card | $ | – | $ | 5,878,994 | $ | 2,913,985 | $ | 8,792,979 | ||||||||
| Other | – | 235,012,990 | 15,333,159 | 250,346,149 | ||||||||||||
| Remaining Industries | – | 64,391,730 | – | 64,391,730 | ||||||||||||
| Common Stocks | ||||||||||||||||
| Miscellaneous Financials | – | 352,704 | – | 352,704 | ||||||||||||
| Remaining Industries | 2,105,197 | – | – | 2,105,197 | ||||||||||||
| Corporate Bonds | – | 1,867,788,903 | – | 1,867,788,903 | ||||||||||||
| Floating Rate Loans | ||||||||||||||||
| Business Services | – | 23,315,218 | 909,090 | 24,224,308 | ||||||||||||
| Remaining Industries | – | 344,153,281 | – | 344,153,281 | ||||||||||||
| Foreign Government Obligations | – | 2,154,822 | – | 2,154,822 | ||||||||||||
| Government Sponsored Enterprises Collateralized Mortgage Obligations | – | 198,487 | 3 | 198,490 | ||||||||||||
| Municipal Bonds | – | 21,954,231 | – | 21,954,231 | ||||||||||||
| Non-Agency Commercial Mortgage-Backed Securities | – | 138,168,125 | 6,635,909 | 144,804,034 | ||||||||||||
| Rights | – | 293 | – | 293 | ||||||||||||
| U.S. Treasury Obligations | – | 358,662,025 | – | 358,662,025 | ||||||||||||
| Warrants | – | 7,968 | – | 7,968 | ||||||||||||
| Short-Term Investments | ||||||||||||||||
| Repurchase Agreements | – | 119,401,923 | – | 119,401,923 | ||||||||||||
| Total | $ | 2,105,197 | $ | 3,181,441,694 | $ | 25,792,146 | $ | 3,209,339,037 | ||||||||
| Other Financial Instruments | ||||||||||||||||
| Credit Default Swap Contracts | ||||||||||||||||
| Assets | $ | – | $ | – | $ | – | $ | – | ||||||||
| Liabilities | – | (2,478,617 | ) | – | (2,478,617 | ) | ||||||||||
| Forward Foreign Currency Exchange Contracts | ||||||||||||||||
| Assets | – | 1,964,049 | – | 1,964,049 | ||||||||||||
| Liabilities | – | (21,460 | ) | – | (21,460 | ) | ||||||||||
| Futures Contracts | ||||||||||||||||
| Assets | 3,917,871 | – | – | 3,917,871 | ||||||||||||
| Liabilities | (7,513 | ) | – | – | (7,513 | ) | ||||||||||
| Total | $ | 3,910,358 | $ | (536,028 | ) | $ | – | $ | 3,374,330 | |||||||
| (1) | Refer to Note 2(t) for a description of fair value measurements and the three-tier hierarchy of inputs. | |
| (2) | See Schedule of Investments for fair values in each industry. The table above is presented by Investment Type. Industries are presented within an Investment Type should such Investment Type include securities classified as two or more levels within the three- tier fair value hierarchy. When applicable each Level 3 security is identified on the Schedule of Investments along with the valuation technique utilized. |
A reconciliation of Level 3 investments is presented when the Fund has a material amount of Level 3 investments at the beginning or end of the year in relation to the Fund’s net assets. Management has determined not to provide a reconciliation as the balance of Level 3 investments was not considered to be material to the Fund’s net assets at the beginning or end of the year.
| 232 | See Notes to Financial Statements. |
Schedule of Investments
INFLATION FOCUSED FUND November 30, 2021
| Investments | Interest Rate | Maturity Date | Principal Amount (000) | Fair Value | ||||||||
| LONG-TERM INVESTMENTS 95.50% | ||||||||||||
| ASSET-BACKED SECURITIES 18.26% | ||||||||||||
| Automobiles 6.20% | ||||||||||||
| Ally Auto Receivables Trust 2019-3 A3 | 1.93% | 5/15/2024 | $ | 3,438 | $ | 3,461,088 | ||||||
| American Credit Acceptance Receivables Trust 2020-3 A† | 0.62% | 10/13/2023 | 215 | 215,479 | ||||||||
| AmeriCredit Automobile Receivables Trust 2020-1 B | 1.48% | 1/21/2025 | 583 | 587,900 | ||||||||
| ARI Fleet Lease Trust 2020-A A2† | 1.77% | 8/15/2028 | 207 | 207,563 | ||||||||
| Arivo Acceptance Auto Loan Receivables Trust 2019-1 A† | 2.99% | 7/15/2024 | 160 | 161,027 | ||||||||
| Avis Budget Rental Car Funding AESOP LLC D† | 3.34% | 8/20/2026 | 5,000 | 4,949,185 | ||||||||
| Avis Budget Rental Car Funding AESOP LLC 2019-2A A† | 3.35% | 9/22/2025 | 5,000 | 5,270,723 | ||||||||
| Bank of The West Auto Trust 2017-1 A4† | 2.33% | 9/15/2023 | 293 | 294,089 | ||||||||
| Capital One Prime Auto Receivables Trust 2021-1 A2 | 0.32% | 2/18/2025 | 3,690 | 3,685,915 | ||||||||
| CarMax Auto Owner Trust 2020-2 A3 | 1.70% | 11/15/2024 | 166 | 167,543 | ||||||||
| Carvana Auto Receivables Trust 2019-2A C† | 3.00% | 6/17/2024 | 591 | 596,445 | ||||||||
| Carvana Auto Receivables Trust 2021-N1 A | 0.70% | 1/10/2028 | 470 | 468,365 | ||||||||
| Carvana Auto Receivables Trust 2021-N2 A1 | 0.32% | 3/10/2028 | 3,637 | 3,634,712 | ||||||||
| CPS Auto Receivables Trust 2017-B E† | 5.75% | 12/15/2023 | 313 | 314,986 | ||||||||
| CPS Auto Receivables Trust 2017-D D† | 3.73% | 9/15/2023 | 72 | 72,205 | ||||||||
| CPS Auto Receivables Trust 2019-C C† | 2.84% | 6/16/2025 | 90 | 90,161 | ||||||||
| CPS Auto Receivables Trust 2019-C D† | 3.17% | 6/16/2025 | 281 | 286,505 | ||||||||
| CPS Auto Receivables Trust 2019-D C† | 2.54% | 8/15/2024 | 586 | 589,232 | ||||||||
| CPS Auto Receivables Trust 2020-C B† | 1.01% | 1/15/2025 | 5,500 | 5,506,899 | ||||||||
| Credit Acceptance Auto Loan Trust 2021-3A A† | 1.00% | 5/15/2030 | 1,325 | 1,317,733 | ||||||||
| Donlen Fleet Lease Funding 2 LLC 2021-2 A2† | 0.56% | 12/11/2034 | 6,225 | 6,205,008 | ||||||||
| Drive Auto Receivables Trust 2018-4 D | 4.09% | 1/15/2026 | 515 | 524,728 | ||||||||
| Drive Auto Receivables Trust 2019-2 C | 3.42% | 6/16/2025 | 685 | 690,386 | ||||||||
| Drive Auto Receivables Trust 2019-2 D | 3.69% | 8/17/2026 | 717 | 735,429 | ||||||||
| Drive Auto Receivables Trust 2019-4 C | 2.51% | 11/17/2025 | 1,139 | 1,146,194 | ||||||||
| Drive Auto Receivables Trust 2019-4 D | 2.70% | 2/16/2027 | 1,030 | 1,050,276 | ||||||||
| Drive Auto Receivables Trust 2020-2 D | 3.05% | 5/15/2028 | 1,800 | 1,846,991 | ||||||||
| Drive Auto Receivables Trust 2021-1 C | 1.02% | 6/15/2027 | 875 | 876,641 | ||||||||
| Drive Auto Receivables Trust 2021-1 D | 1.45% | 1/16/2029 | 830 | 828,549 | ||||||||
| Drive Auto Receivables Trust 2021-2 A2 | 0.36% | 5/15/2024 | 4,425 | 4,423,346 | ||||||||
| Drive Auto Receivables Trust 2021-2 D | 1.39% | 3/15/2029 | 3,772 | 3,710,229 | ||||||||
| Exeter Automobile Receivables Trust 2021-2A A2 | 0.27% | 1/16/2024 | 757 | 756,873 | ||||||||
| See Notes to Financial Statements. | 233 |
Schedule of Investments (continued)
INFLATION FOCUSED FUND November 30, 2021
| Investments | Interest Rate | Maturity Date | Principal Amount (000) | Fair Value | ||||||||
| Automobiles (continued) | ||||||||||||
| Exeter Automobile Receivables Trust 2021-2A C | 0.98% | 6/15/2026 | $ | 960 | $ | 958,832 | ||||||
| Exeter Automobile Receivables Trust 2021-2A D | 1.40% | 4/15/2027 | 1,675 | 1,658,944 | ||||||||
| Exeter Automobile Receivables Trust 2021-3A A2 | 0.34% | 1/16/2024 | 3,135 | 3,133,933 | ||||||||
| Exeter Automobile Receivables Trust 2021-3A D | 1.55% | 6/15/2027 | 2,545 | 2,512,076 | ||||||||
| Exeter Automobile Receivables Trust 2021-3A E† | 3.04% | 12/15/2028 | 1,680 | 1,663,535 | ||||||||
| Flagship Credit Auto Trust 2021-2 A† | 0.37% | 12/15/2026 | 16,859 | 16,796,673 | ||||||||
| Ford Credit Auto Lease Trust 2021-A A2 | 0.19% | 7/15/2023 | 1,137 | 1,136,398 | ||||||||
| Ford Credit Auto Lease Trust 2021-A A3 | 0.26% | 2/15/2024 | 1,403 | 1,400,751 | ||||||||
| Ford Credit Auto Lease Trust 2021-A A4 | 0.30% | 4/15/2024 | 2,369 | 2,358,845 | ||||||||
| Ford Credit Auto Owner Trust 2017-2 A† | 2.36% | 3/15/2029 | 1,417 | 1,438,765 | ||||||||
| Ford Credit Auto Owner Trust 2019-REV1 A† | 3.52% | 7/15/2030 | 1,143 | 1,203,756 | ||||||||
| Ford Credit Auto Owner Trust 2020-C A3 | 0.41% | 7/15/2025 | 921 | 918,494 | ||||||||
| Ford Credit Auto Owner Trust 2021-A A2 | 0.17% | 10/15/2023 | 1,596 | 1,595,583 | ||||||||
| Ford Credit Auto Owner Trust REV1 2018-1 A† | 3.19% | 7/15/2031 | 4,225 | 4,466,607 | ||||||||
| Ford Credit Auto Owner Trust REV1 2021-1 A† | 1.37% | 10/17/2033 | 1,785 | 1,776,565 | ||||||||
| Foursight Capital Automobile Receivables Trust 2020-1 A3† | 2.05% | 10/15/2024 | 127 | 128,059 | ||||||||
| GLS Auto Receivables Issuer Trust 2019-4 A† | 2.47% | 11/15/2023 | 1,808 | 1,812,233 | ||||||||
| GLS Auto Receivables Issuer Trust 2021-3A A† | 0.42% | 1/15/2025 | 5,518 | 5,516,623 | ||||||||
| GM Financial Automobile Leasing Trust 2020-2 A3 | 0.80% | 7/20/2023 | 2,000 | 2,004,403 | ||||||||
| GM Financial Consumer Automobile Receivables Trust 2019-1 B | 3.37% | 8/16/2024 | 416 | 424,610 | ||||||||
| GM Financial Consumer Automobile Receivables Trust 2020-4 A3 | 0.38% | 8/18/2025 | 1,187 | 1,184,822 | ||||||||
| GM Financial Consumer Automobile Receivables Trust 2021-1 A2 | 0.23% | 11/16/2023 | 501 | 501,033 | ||||||||
| GM Financial Consumer Automobile Receivables Trust 2021-1 A3 | 0.35% | 10/16/2025 | 823 | 819,939 | ||||||||
| GM Financial Leasing Trust 2021-1 A2 | 0.17% | 4/20/2023 | 1,768 | 1,767,728 | ||||||||
| GM Financial Leasing Trust 2021-1 A3 | 0.26% | 2/20/2024 | 2,017 | 2,012,827 | ||||||||
| Hertz Vehicle Financing III LP 2021-2A A† | 1.68% | 12/27/2027 | 3,397 | 3,395,184 | ||||||||
| Hertz Vehicle Financing LLC 2021-1A A† | 1.21% | 12/26/2025 | 3,385 | 3,364,296 | ||||||||
| Hertz Vehicle Financing LLC 2021-1A D† | 3.98% | 12/26/2025 | 5,000 | 4,957,731 | ||||||||
| Honda Auto Receivables Owner Trust 2020-2 A3 | 0.82% | 7/15/2024 | 510 | 511,353 | ||||||||
| Honda Auto Receivables Owner Trust 2021-1 A2 | 0.16% | 7/21/2023 | 1,184 | 1,183,754 | ||||||||
| Honda Auto Receivables Owner Trust 2021-2 A2 | 0.17% | 11/15/2023 | 4,380 | 4,377,218 | ||||||||
| Hyundai Auto Lease Securitization Trust 2021-A A2† | 0.25% | 4/17/2023 | 484 | 484,245 | ||||||||
| Mercedes-Benz Auto Lease Trust 2021-A A2 | 0.18% | 3/15/2023 | 430 | 430,199 | ||||||||
| 234 | See Notes to Financial Statements. |
Schedule of Investments (continued)
INFLATION FOCUSED FUND November 30, 2021
| Investments | Interest Rate | Maturity Date | Principal Amount (000) | Fair Value | ||||||||
| Automobiles (continued) | ||||||||||||
| Mercedes-Benz Auto Lease Trust 2021-A A3 | 0.25% | 1/16/2024 | $ | 934 | $ | 932,314 | ||||||
| OneMain Direct Auto Receivables Trust 2019-1A B† | 3.95% | 11/14/2028 | 6,674 | 7,178,887 | ||||||||
| OneMain Direct Auto Receivables Trust 2021-1A A† | 0.87% | 7/14/2028 | 5,545 | 5,486,024 | ||||||||
| Santander Drive Auto Receivables Trust 2019-3 C | 2.49% | 10/15/2025 | 943 | 947,454 | ||||||||
| Santander Drive Auto Receivables Trust 2020-4 D | 1.48% | 1/15/2027 | 6,325 | 6,350,335 | ||||||||
| Santander Drive Auto Receivables Trust 2021-1 C | 0.75% | 2/17/2026 | 806 | 806,546 | ||||||||
| Santander Drive Auto Receivables Trust 2021-2 A2 | 0.28% | 4/15/2024 | 2,015 | 2,014,203 | ||||||||
| Santander Drive Auto Receivables Trust 2021-2 C | 0.90% | 6/15/2026 | 8,860 | 8,854,913 | ||||||||
| Santander Drive Auto Receivables Trust 2021-2 D | 1.35% | 7/15/2027 | 4,040 | 4,028,735 | ||||||||
| Santander Drive Auto Receivables Trust 2021-3 A2 | 0.29% | 5/15/2024 | 6,850 | 6,848,435 | ||||||||
| Santander Drive Auto Receivables Trust 2021-4 C | 1.26% | 2/16/2027 | 3,185 | 3,176,395 | ||||||||
| Santander Drive Auto Receivables Trust 2021-4 D | 1.67% | 10/15/2027 | 4,070 | 4,062,382 | ||||||||
| Santander Retail Auto Lease Trust 2019-B D† | 3.31% | 6/20/2024 | 989 | 1,007,427 | ||||||||
| Santander Retail Auto Lease Trust 2021-A A3† | 0.51% | 7/22/2024 | 2,915 | 2,899,444 | ||||||||
| Santander Retail Auto Lease Trust 2021-C A2† | 0.29% | 4/22/2024 | 3,055 | 3,051,576 | ||||||||
| Santander Retail Auto Lease Trust 2021-C A3† | 0.50% | 3/20/2025 | 3,190 | 3,174,733 | ||||||||
| Toyota Auto Receivables Owner Trust 2020-D A2 | 0.23% | 5/15/2023 | 325 | 324,945 | ||||||||
| Toyota Auto Receivables Owner Trust 2020-D A3 | 0.35% | 1/15/2025 | 978 | 976,540 | ||||||||
| Volkswagen Auto Loan Enhanced Trust 2020-1 A3 | 0.98% | 11/20/2024 | 897 | 900,081 | ||||||||
| Westlake Automobile Receivables Trust 2019-2A D† | 3.20% | 11/15/2024 | 1,216 | 1,241,117 | ||||||||
| Westlake Automobile Receivables Trust 2019-3A B† | 2.41% | 10/15/2024 | 519 | 519,886 | ||||||||
| Westlake Automobile Receivables Trust 2019-3A C† | 2.49% | 10/15/2024 | 1,114 | 1,122,880 | ||||||||
| Westlake Automobile Receivables Trust 2020-1A B† | 1.94% | 4/15/2025 | 10,500 | 10,564,359 | ||||||||
| Westlake Automobile Receivables Trust 2020-2A A2A† | 0.93% | 2/15/2024 | 2,388 | 2,391,095 | ||||||||
| Westlake Automobile Receivables Trust 2021-1A C† | 0.95% | 3/16/2026 | 4,175 | 4,156,295 | ||||||||
| Westlake Automobile Receivables Trust 2021-2A A2A† | 0.32% | 4/15/2025 | 5,505 | 5,502,007 | ||||||||
| Westlake Automobile Receivables Trust 2021-2A C† | 0.89% | 7/15/2026 | 1,865 | 1,852,200 | ||||||||
| Westlake Automobile Receivables Trust 2021-2A D† | 1.23% | 12/15/2026 | 6,000 | 5,921,779 | ||||||||
| World Omni Automobile Lease Securitization Trust 2020-B A3 | 0.45% | 2/15/2024 | 554 | 553,224 | ||||||||
| World Omni Select Auto Trust 2018-1A D† | 4.13% | 1/15/2025 | 1,190 | 1,199,697 | ||||||||
| World Omni Select Auto Trust 2019-A C | 2.38% | 12/15/2025 | 226 | 229,944 | ||||||||
| World Omni Select Auto Trust 2019-A D | 2.59% | 12/15/2025 | 572 | 580,056 | ||||||||
| Total | 231,424,327 | |||||||||||
| See Notes to Financial Statements. | 235 |
Schedule of Investments (continued)
INFLATION FOCUSED FUND November 30, 2021
| Investments | Interest Rate | Maturity Date | Principal Amount (000) | Fair Value | ||||||||
| Credit Card 0.22% | ||||||||||||
| Capital One Multi-Asset Execution Trust 2017-A6 A6 | 2.29% | 7/15/2025 | $ | 1,107 | $ | 1,124,026 | ||||||
| Capital One Multi-Asset Execution Trust 2019-A2 A2 | 1.72% | 8/15/2024 | 289 | 291,965 | ||||||||
| Master Credit Card Trust II Series 2018-1A A† | 0.581% (1 Mo. LIBOR + .49% | )# | 7/21/2024 | 1,254 | 1,258,119 | |||||||
| Synchrony Credit Card Master Note Trust 2017-2 B | 2.82% | 10/15/2025 | 999 | 1,018,355 | ||||||||
| World Financial Network Credit Card Master Trust 2019-A A | 3.14% | 12/15/2025 | 939 | 944,657 | ||||||||
| World Financial Network Credit Card Master Trust 2019-B A | 2.49% | 4/15/2026 | 2,551 | 2,579,873 | ||||||||
| World Financial Network Credit Card Master Trust 2019-C A | 2.21% | 7/15/2026 | 1,051 | 1,066,048 | ||||||||
| Total | 8,283,043 | |||||||||||
| Home Equity 0.00% | ||||||||||||
| New Century Home Equity Loan Trust 2005-A A6 | 4.713% | 8/25/2035 | 15 | 15,015 | ||||||||
| Other 11.84% | ||||||||||||
| ACREC Ltd. 2021-FL1 A† | 1.239% (1 Mo. LIBOR + 1.15% | )# | 10/16/2036 | 8,500 | 8,491,562 | |||||||
| Affirm Asset Securitization Trust 2021-B A† | 1.03% | 8/17/2026 | 3,550 | 3,534,918 | ||||||||
| AMMC CLO Ltd. 2016-19A CR† | 2.674% (3 Mo. LIBOR + 2.55% | )# | 10/16/2028 | 750 | 751,035 | |||||||
| AMMC CLO Ltd. 2020-23A A1R† | 1.163% (3 Mo. LIBOR + 1.04% | )# | 10/17/2031 | 15,000 | 15,001,317 | |||||||
| Amur Equipment Finance Receivables VI LLC 2018-2A A2† | 3.89% | 7/20/2022 | 201 | 202,611 | ||||||||
| Amur Equipment Finance Receivables VII LLC 2019-1A A2† | 2.63% | 6/20/2024 | 490 | 494,880 | ||||||||
| Anchorage Capital CLO 3-R Ltd. 2014-3RA A† | 1.186% (3 Mo. LIBOR + 1.05% | )# | 1/28/2031 | 970 | 970,608 | |||||||
| Anchorage Capital CLO 4-R Ltd. 2014-4RA A† | 1.186% (3 Mo. LIBOR + 1.05% | )# | 1/28/2031 | 1,212 | 1,212,306 | |||||||
| Apidos CLO XXIV 2016-24A A1AL† | 1.082% (3 Mo. LIBOR + .95% | )# | 10/20/2030 | 510 | 509,872 | |||||||
| Apidos CLO XXXI 2019-31A A1R† | 1.224% (3 Mo. LIBOR + 1.10% | )# | 4/15/2031 | 5,000 | 5,011,057 | |||||||
| Aqua Finance Trust 2021-A A† | 1.54% | 7/17/2046 | 5,235 | 5,198,924 | ||||||||
| Arbor Realty Commercial Real Estate Notes Ltd. 2018-FL1 A† | 1.24% (1 Mo. LIBOR + 1.15% | )# | 6/15/2028 | 1,020 | 1,020,357 | |||||||
| 236 | See Notes to Financial Statements. |
Schedule of Investments (continued)
INFLATION FOCUSED FUND November 30, 2021
| Investments | Interest Rate | Maturity Date | Principal Amount (000) | Fair Value | ||||||||
| Other (continued) | ||||||||||||
| Arbor Realty Commercial Real Estate Notes Ltd. 2019-FL1 A† | 1.24% (1 Mo. LIBOR + 1.15% | )# | 5/15/2037 | $ | 955 | $ | 954,713 | |||||
| Arbor Realty Commercial Real Estate Notes Ltd. 2021-FL2 A† | 1.19% (1 Mo. LIBOR + 1.10% | )# | 5/15/2036 | 1,980 | 1,976,812 | |||||||
| Arbor Realty Commercial Real Estate Notes Ltd. 2021-FL3 A† | 1.16% (1 Mo. LIBOR + 1.07% | )# | 8/15/2034 | 6,890 | 6,875,212 | |||||||
| Arbor Realty Commercial Real Estate Notes Ltd. 2021-FL4 A†(a) | 1.44% (1 Mo. LIBOR + 1.35% | )# | 11/15/2036 | 10,940 | 10,949,325 | |||||||
| ARES L CLO Ltd. 2018-50A AR† | 1.174% (3 Mo. LIBOR + 1.05% | )# | 1/15/2032 | 4,180 | 4,177,781 | |||||||
| Atalaya Equipment Leasing Trust 2021-1A A2† | 1.23% | 5/15/2026 | 6,250 | 6,264,750 | ||||||||
| Bain Capital Credit CLO 2018-2A A1† | 1.204% (3 Mo. LIBOR + 1.08% | )# | 7/19/2031 | 850 | 850,457 | |||||||
| Bain Capital Credit CLO 2019-2A AR† | 1.222% (3 Mo. LIBOR + 1.10% | )# | 10/17/2032 | 7,000 | 7,005,233 | |||||||
| Bain Capital Credit CLO Ltd. 2017-1A A1R† | 1.102% (3 Mo. LIBOR + .97% | )# | 7/20/2030 | 6,000 | 6,001,716 | |||||||
| Ballyrock CLO Ltd. 2019-1A A1R† | Zero Coupon | #(b) | 7/15/2032 | 10,000 | 9,974,611 | |||||||
| Barings CLO Ltd. 2019-3A A1R† | 1.202% (3 Mo. LIBOR + 1.07% | )# | 4/20/2031 | 3,020 | 3,019,238 | |||||||
| BDS Ltd. 2021-FL7 A† | 1.159% (1 Mo. LIBOR + 1.07% | )# | 6/16/2036 | 5,210 | 5,206,666 | |||||||
| Benefit Street Partners CLO ILtd. 2013-IIIA A1R2† | 1.132% (3 Mo. LIBOR + 1.00% | )# | 7/20/2029 | 3,647 | 3,646,930 | |||||||
| BlueMountain Fuji US CLO I Ltd. 2017-1A A1R† | 1.112% (3 Mo. LIBOR + .98% | )# | 7/20/2029 | 1,190 | 1,189,883 | |||||||
| Carlyle Global Market Strategies CLO Ltd. 2015-1A AR3† | 1.112% (3 Mo. LIBOR + .98% | )# | 7/20/2031 | 2,160 | 2,161,267 | |||||||
| Carlyle US CLO Ltd. 2017-2A A1R† | 1.184% (3 Mo. LIBOR + 1.05% | )# | 7/20/2031 | 4,000 | 4,001,999 | |||||||
| Carlyle US CLO Ltd. 2017-3A A1AR† | 1.032% (3 Mo. LIBOR + .90% | )# | 7/20/2029 | 830 | 830,250 | |||||||
| Carlyle US CLO Ltd. 2019-1A A1AR† | 1.212% (3 Mo. LIBOR + 1.08% | )# | 4/20/2031 | 12,000 | 12,009,167 | |||||||
| Cedar Funding V CLO Ltd. A1R† | 1.222% (3 Mo. LIBOR + 1.10% | )# | 7/17/2031 | 3,400 | 3,401,901 | |||||||
| Cedar Funding X CLO Ltd. 2019-10A AR† | Zero Coupon | #(b) | 10/20/2032 | 4,000 | 4,000,303 | |||||||
| Cedar Funding XI Clo Ltd. 2019-11A A1R† | 1.226% (3 Mo. LIBOR + 1.05% | )# | 5/29/2032 | 3,220 | 3,215,979 | |||||||
| Cedar Funding XIV CLO Ltd. 2021-14A A† | 1.224% (3 Mo. LIBOR + 1.10% | )# | 7/15/2033 | 2,340 | 2,338,011 | |||||||
| See Notes to Financial Statements. | 237 |
Schedule of Investments (continued)
INFLATION FOCUSED FUND November 30, 2021
| Investments | Interest Rate | Maturity Date | Principal Amount (000) | Fair Value | ||||||||
| Other (continued) | ||||||||||||
| CF Hippolyta LLC 2021-1A B1† | 1.98% | 3/15/2061 | $ | 4,757 | $ | 4,718,327 | ||||||
| CIFC Funding II Ltd. 2013-2A A1L2† | Zero Coupon | #(b) | 10/18/2030 | 4,000 | 3,999,605 | |||||||
| Colombia Cent CLO Ltd. 2018-27A A2A† | 1.724% (3 Mo. LIBOR + 1.60% | )# | 10/25/2028 | 281 | 281,490 | |||||||
| Dell Equipment Finance Trust 2021-2 A2† | 0.33% | 12/22/2026 | 2,760 | 2,751,881 | ||||||||
| Diamond Resorts Owner Trust 2018-1 A† | 3.70% | 1/21/2031 | 663 | 682,215 | ||||||||
| Diamond Resorts Owner Trust 2018-1 B† | 4.19% | 1/21/2031 | 397 | 408,417 | ||||||||
| Dryden CLO Ltd. 2019 72A AR† | 1.236% (3 Mo. LIBOR + 1.08% | )# | 5/15/2032 | 13,720 | 13,713,166 | |||||||
| Dryden Senior Loan Fund 2017-47A A1R† | 1.104% (3 Mo. LIBOR + .98% | )# | 4/15/2028 | 6,000 | 5,998,212 | |||||||
| Elmwood CLO X Ltd. 2021-3A A† | 1.13% (3 Mo. LIBOR + 1.04% | )# | 10/20/2034 | 4,880 | 4,881,830 | |||||||
| Galaxy XIX CLO Ltd. 2015-19A A1RR† | 1.074% (3 Mo. LIBOR + .95% | )# | 7/24/2030 | 950 | 949,952 | |||||||
| Grand Avenue CRE 2019-FL1 AS† | 1.589% (1 Mo. LIBOR + 1.50% | )# | 6/15/2037 | 2,055 | 2,057,094 | |||||||
| Greystone Commercial Real Estate Notes Ltd. 2018-HC1 A† | 1.64% (1 Mo. LIBOR + 1.55% | )# | 9/15/2028 | 1,776 | 1,779,244 | |||||||
| Greystone Commercial Real Estate Notes Ltd. 2018-HC1 AS† | 2.24% (1 Mo. LIBOR + 2.15% | )# | 9/15/2028 | 824 | 820,863 | |||||||
| Greystone CRE Notes Ltd. 2021-FL3 A† | 1.11% (1 Mo. LIBOR + 1.02% | )# | 7/15/2039 | 6,150 | 6,130,169 | |||||||
| Halcyon Loan Advisors Funding Ltd. 2015-2A AR† | 1.204% (3 Mo. LIBOR + 1.08% | )# | 7/25/2027 | 30 | 29,656 | |||||||
| Halcyon Loan Advisors Funding Ltd. 2015-2A BR† | 1.774% (3 Mo. LIBOR + 1.65% | )# | 7/25/2027 | 667 | 667,517 | |||||||
| HGI CRE CLO Ltd. 2021-FL2 A† | 1.089% (1 Mo. LIBOR + 1.00% | )# | 9/17/2036 | 6,890 | 6,893,375 | |||||||
| HPEFS Equipment Trust 2020-1A A3† | 1.76% | 2/20/2030 | 786 | 788,773 | ||||||||
| HPEFS Equipment Trust 2020-1A B† | 1.89% | 2/20/2030 | 157 | 158,238 | ||||||||
| Hyundai Floorplan Master Owner Trust 2019-1 A† | 2.68% | 4/15/2024 | 2,664 | 2,686,650 | ||||||||
| JFIN CLO Ltd. 2013-1A A1NR† | 1.522% (3 Mo. LIBOR + 1.39% | )# | 1/20/2030 | 1,380 | 1,381,538 | |||||||
| JFIN CLO Ltd. 2013-1A A2R† | 2.332% (3 Mo. LIBOR + 2.20% | )# | 1/20/2030 | 690 | 691,183 | |||||||
| KKR CLO Ltd. 24 A1R† | 1.212% (3 Mo. LIBOR + 1.08% | )# | 4/20/2032 | 4,980 | 4,981,867 | |||||||
| KKR CLO Ltd. 30A A1R† | 2.266% (3 Mo. LIBOR + 1.02% | )# | 10/17/2031 | 10,000 | 10,004,993 | |||||||
| 238 | See Notes to Financial Statements. |
Schedule of Investments (continued)
INFLATION FOCUSED FUND November 30, 2021
| Investments | Interest Rate | Maturity Date | Principal Amount (000) | Fair Value | ||||||||
| Other (continued) | ||||||||||||
| KREF Ltd. 2021-FL2 A† | 1.159% (1 Mo. LIBOR + 1.07% | )# | 2/15/2039 | $ | 4,930 | $ | 4,930,016 | |||||
| KREF Ltd. 2021-FL2 AS† | 1.389% (1 Mo. LIBOR + 1.30% | )# | 2/15/2039 | 4,830 | 4,836,036 | |||||||
| Lendmark Funding Trust 2021-2A A† | 2.00% | 4/20/2032 | 6,685 | 6,678,213 | ||||||||
| LFT CRE Ltd. 2021-FL1 A† | 1.26% (1 Mo. LIBOR + 1.17% | )# | 6/15/2039 | 2,230 | 2,230,491 | |||||||
| LFT CRE Ltd. 2021-FL1 B† | 1.84% (1 Mo. LIBOR + 1.75% | )# | 6/15/2039 | 3,520 | 3,519,754 | |||||||
| Madison Park Funding XI Ltd. 2013-11A AR2† | 1.024% (3 Mo. LIBOR + .90% | )# | 7/23/2029 | 2,989 | 2,988,839 | |||||||
| Magnetite Ltd. 2021-29A A† | 1.114% (3 Mo. LIBOR + .99% | )# | 1/15/2034 | 1,110 | 1,111,374 | |||||||
| Magnetite XXII Ltd. 2019-22A AR† | 1.184% (3 Mo. LIBOR + 1.06% | )# | 4/15/2031 | 4,000 | 4,000,555 | |||||||
| Mariner Finance Issuance Trust 2021-BA A† | 2.10% | 11/20/2036 | 3,340 | 3,343,178 | ||||||||
| Marlette Funding Trust 2021-3A B† | 1.30% | 12/15/2031 | 5,555 | 5,499,658 | ||||||||
| Mercedes-Benz Master Owner Trust 2019-BA A† | 2.61% | 5/15/2024 | 2,181 | 2,203,321 | ||||||||
| MF1 Ltd. 2021-FL6 AS† | 1.539% (1 Mo. LIBOR + 1.45% | )# | 7/16/2036 | 7,030 | 7,035,694 | |||||||
| MF1 Ltd. 2021-FL7 A† | 1.169% (1 Mo. LIBOR + 1.08% | )# | 10/16/2036 | 5,500 | 5,472,775 | |||||||
| MF1 Ltd. 2021-FL7 AS† | 1.539% (1 Mo. LIBOR + 1.45% | )# | 10/16/2036 | 5,400 | 5,374,890 | |||||||
| Mountain View CLO X Ltd. 2015-10A AR† | 0.942% (3 Mo. LIBOR + .82% | )# | 10/13/2027 | 292 | 292,817 | |||||||
| MVW Owner Trust 2017-1A A† | 2.42% | 12/20/2034 | 75 | 76,044 | ||||||||
| Navient Private Education Refi Loan Trust 2020-FA A† | 1.22% | 7/15/2069 | 834 | 833,776 | ||||||||
| Navient Private Education Refi Loan Trust 2021-CA A† | 1.06% | 10/15/2069 | 4,427 | 4,382,702 | ||||||||
| Navient Private Education Refi Loan Trust 2021-FA A† | 1.11% | 2/18/2070 | 4,508 | 4,449,577 | ||||||||
| Nelnet Student Loan Trust 2021-A APT1† | 1.36% | 4/20/2062 | 5,075 | 5,014,789 | ||||||||
| New Economy Assets Phase 1 Sponsor LLC 2021-1 A1† | 1.91% | 10/20/2061 | 16,590 | 16,330,994 | ||||||||
| Newark BSL CLO 2 Ltd. 2017-1A A1R† | 1.094% (3 Mo. LIBOR + .97% | )# | 7/25/2030 | 3,000 | 2,999,740 | |||||||
| NextGear Floorplan Master Owner Trust 2019-2A A2† | 2.07% | 10/15/2024 | 6,561 | 6,649,642 | ||||||||
| See Notes to Financial Statements. | 239 |
Schedule of Investments (continued)
INFLATION FOCUSED FUND November 30, 2021
| Investments | Interest Rate | Maturity Date | Principal Amount (000) | Fair Value | ||||||||
| Other (continued) | ||||||||||||
| N-Star REL CDO VIII Ltd. 2006-8A B† | 0.506% (1 Mo. LIBOR + .42% | )# | 2/1/2041 | $ | 885 | $ | 853,291 | (c) | ||||
| Oaktree CLO Ltd. 2015-1A A1R† | 1.002% (3 Mo. LIBOR + .87% | )# | 10/20/2027 | 204 | 204,298 | |||||||
| OCP CLO Ltd. 2015-10A A2AR† | 1.425% (3 Mo. LIBOR + 1.30% | )# | 10/26/2027 | 645 | 645,518 | |||||||
| OCP CLO Ltd. 2016-12A A1R† | 1.242% (3 Mo. LIBOR + 1.12% | )# | 10/18/2028 | 1,757 | 1,757,986 | |||||||
| OCP CLO Ltd. 2016-12A A2R† | 1.722% (3 Mo. LIBOR + 1.60% | )# | 10/18/2028 | 1,103 | 1,103,906 | |||||||
| OCP CLO Ltd. 2019-17A A1R† | 1.172% (3 Mo. LIBOR + 1.04% | )# | 7/20/2032 | 5,700 | 5,707,123 | |||||||
| Octagon Investment Partners 32 Ltd. 2017-1A A1R† | 1.074% (3 Mo. LIBOR + .95% | )# | 7/15/2029 | 5,000 | 5,000,501 | |||||||
| Octagon Investment Partners XIV Ltd. 2012-1A AARR† | 1.074% (3 Mo. LIBOR + .95% | )# | 7/15/2029 | 720 | 719,700 | |||||||
| Octagon Investment Partners XXI Ltd. 2014-1A AAR3† | 1.156% (3 Mo. LIBOR + 1.00% | )# | 2/14/2031 | 1,960 | 1,961,765 | |||||||
| Octane Receivables Trust 2021-1A A† | 0.93% | 3/22/2027 | 914 | 911,396 | ||||||||
| OneMain Financial Issuance Trust 2018-2A A† | 3.57% | 3/14/2033 | 210 | 217,893 | ||||||||
| OneMain Financial Issuance Trust 2019-2A A† | 3.14% | 10/14/2036 | 3,060 | 3,239,998 | ||||||||
| Orange Lake Timeshare Trust 2019-A A† | 3.06% | 4/9/2038 | 209 | 213,570 | ||||||||
| OZLM VIII Ltd. 2014-8A A1RR† | 1.292% (3 Mo. LIBOR + 1.17% | )# | 10/17/2029 | 712 | 712,857 | |||||||
| PFS Financing Corp. 2020-E A† | 1.00% | 10/15/2025 | 904 | 903,298 | ||||||||
| PFS Financing Corp. 2020-G A† | 0.97% | 2/15/2026 | 647 | 645,263 | ||||||||
| Planet Fitness Master Issuer LLC 2018-1A A2II† | 4.666% | 9/5/2048 | 635 | 652,524 | ||||||||
| Prima Capital CRE Securitization 2015-5A C† | 4.50% | 12/24/2050 | 710 | 711,656 | ||||||||
| Prima Capital CRE Securitization Ltd. 2013-3A A† | 2.214% | 10/24/2035 | 68 | 67,796 | (c) | |||||||
| Rad CLO Ltd. 2021-15A A†(a) | Zero Coupon | #(b) | 1/20/2034 | 12,610 | 12,610,000 | (c) | ||||||
| Romark CLO Ltd. 2017-1A A1R† | 1.154% (3 Mo. LIBOR + 1.03% | )# | 10/23/2030 | 10,000 | 10,002,604 | |||||||
| Romark CLO Ltd. 2017-1A A2R† | 1.774% (3 Mo. LIBOR + 1.65% | )# | 10/23/2030 | 10,000 | 9,981,509 | |||||||
| SCF Equipment Leasing LLC 2019-2A A1† | 2.22% | 6/20/2024 | 176 | 176,773 | ||||||||
| SCF Equipment Leasing LLC 2019-2A A2† | 2.47% | 4/20/2026 | 2,107 | 2,141,213 | ||||||||
| SCF Equipment Leasing LLC 2019-2A B† | 2.76% | 8/20/2026 | 2,350 | 2,402,983 | ||||||||
| SCF Equipment Leasing LLC 2021-1A A3† | 0.83% | 8/21/2028 | 1,800 | 1,787,166 | ||||||||
| SCF Equipment Leasing LLC 2021-1A B† | 1.37% | 8/20/2029 | 1,000 | 981,887 | ||||||||
| 240 | See Notes to Financial Statements. |
Schedule of Investments (continued)
INFLATION FOCUSED FUND November 30, 2021
| Investments | Interest Rate | Maturity Date | Principal Amount (000) | Fair Value | ||||||||
| Other (continued) | ||||||||||||
| SMB Private Education Loan Trust 2021-A A1† | 0.59% (1 Mo. LIBOR + .50% | )# | 1/15/2053 | $ | 185 | $ | 185,014 | |||||
| TCI-Flatiron CLO Ltd. 2017-1A AR† | 1.118% (3 Mo. LIBOR + .96% | )# | 11/18/2030 | 4,000 | 3,999,146 | |||||||
| TCI-Flatiron CLO Ltd. 2018-1A ANR† | 1.189% (3 Mo. LIBOR + 1.06% | )# | 1/29/2032 | 500 | 500,849 | |||||||
| TICP CLO XIV Ltd. 2019-14A A1R†(a) | Zero Coupon | #(b) | 10/20/2032 | 7,780 | 7,780,000 | |||||||
| Towd Point Asset Trust 2018-SL1 A† | 0.689% (1 Mo. LIBOR + .60% | )# | 1/25/2046 | 814 | 809,977 | |||||||
| Upstart Securitization Trust 2021-2 A† | 0.91% | 6/20/2031 | 1,585 | 1,583,696 | ||||||||
| Upstart Securitization Trust 2021-5 A† | 1.31% | 11/20/2031 | 7,260 | 7,246,734 | ||||||||
| Venture CLO Ltd. 2018-33A A1LR† | 1.184% (3 Mo. LIBOR + 1.06% | )# | 7/15/2031 | 3,500 | 3,500,999 | |||||||
| VERDE CLO Ltd. 2019-1A AR† | 1.224% (3 Mo. LIBOR + 1.10% | )# | 4/15/2032 | 8,660 | 8,661,082 | |||||||
| Verizon Owner Trust 2020-B A | 0.47% | 2/20/2025 | 827 | 826,235 | ||||||||
| Verizon Owner Trust 2020-C A | 0.41% | 4/21/2025 | 1,220 | 1,216,775 | ||||||||
| Voya CLO Ltd. 2018-4A A1AR† | 1.164% (3 Mo. LIBOR + 1.04% | )# | 1/15/2032 | 8,000 | 8,000,881 | |||||||
| Wind River CLO Ltd. 2013-1A A1RR† | 1.112% (3 Mo. LIBOR + .98% | )# | 7/20/2030 | 10,000 | 10,006,478 | |||||||
| York CLO Ltd. 2015-1A AR† | 1.278% (3 Mo. LIBOR + 1.15% | )# | 1/22/2031 | 1,320 | 1,323,215 | |||||||
| Total | 442,118,336 | |||||||||||
| Total Asset-Backed Securities (cost $682,861,754) | 681,840,721 | |||||||||||
| Shares (000) | ||||||||||||
| COMMON STOCKS 0.00% | ||||||||||||
| Miscellaneous Financials 0.00% | ||||||||||||
| UTEX Industries, Inc. | – | (d) | 5,328 | |||||||||
| Oil, Gas & Consumable Fuels 0.00% | ||||||||||||
| Dommo Energia SA*(e) | BRL | 8 | 866 | |||||||||
| Total Common Stocks (cost $5,251) | 6,194 | |||||||||||
| See Notes to Financial Statements. | 241 |
Schedule of Investments (continued)
INFLATION FOCUSED FUND November 30, 2021
| Investments | Interest Rate | Maturity Date | Principal Amount (000) | Fair Value | ||||||||
| CONVERTIBLE BONDS 0.02% | ||||||||||||
| Internet 0.02% | ||||||||||||
| Weibo Corp. (China)(f) (cost $787,634) | 1.25% | 11/15/2022 | $ | 798 | $ | 776,055 | ||||||
| CORPORATE BONDS 42.53% | ||||||||||||
| Advertising 0.10% | ||||||||||||
| Clear Channel International BV (United Kingdom)†(f) | 6.625% | 8/1/2025 | 3,557 | 3,676,088 | ||||||||
| Aerospace/Defense 0.83% | ||||||||||||
| Boeing Co. (The) | 2.196% | 2/4/2026 | 1,200 | 1,198,175 | ||||||||
| Boeing Co. (The) | 4.508% | 5/1/2023 | 2,372 | 2,477,164 | ||||||||
| Boeing Co. (The) | 4.875% | 5/1/2025 | 8,640 | 9,475,282 | ||||||||
| Bombardier, Inc. (Canada)†(f) | 7.125% | 6/15/2026 | 3,107 | 3,214,502 | ||||||||
| Howmet Aerospace, Inc. | 5.125% | 10/1/2024 | 429 | 459,489 | ||||||||
| Howmet Aerospace, Inc. | 6.875% | 5/1/2025 | 2,965 | 3,398,216 | ||||||||
| Kratos Defense & Security Solutions, Inc.† | 6.50% | 11/30/2025 | 615 | 634,428 | ||||||||
| TransDigm, Inc.† | 6.25% | 3/15/2026 | 5,500 | 5,714,170 | ||||||||
| TransDigm, Inc.† | 8.00% | 12/15/2025 | 4,035 | 4,257,288 | ||||||||
| Total | 30,828,714 | |||||||||||
| Agriculture 0.56% | ||||||||||||
| BAT Capital Corp. | 3.222% | 8/15/2024 | 5,957 | 6,207,040 | ||||||||
| Imperial Brands Finance plc (United Kingdom)†(f) | 3.125% | 7/26/2024 | 1,871 | 1,940,644 | ||||||||
| Imperial Brands Finance plc (United Kingdom)†(f) | 3.50% | 2/11/2023 | 3,250 | 3,323,647 | ||||||||
| Reynolds American, Inc. | 4.45% | 6/12/2025 | 1,850 | 2,002,270 | ||||||||
| Viterra Finance BV (Netherlands)†(f) | 2.00% | 4/21/2026 | 7,352 | 7,338,360 | ||||||||
| Total | 20,811,961 | |||||||||||
| Airlines 0.25% | ||||||||||||
| Air Canada 2015-1 Class B Pass-Through Trust (Canada)†(f) | 3.875% | 9/15/2024 | 215 | 216,750 | ||||||||
| Air Canada 2015-2 Class B Pass-Through Trust (Canada)†(f) | 5.00% | 6/15/2025 | 2,667 | 2,716,741 | ||||||||
| American Airlines 2014-1 Class B Pass-Through Trust | 4.375% | 4/1/2024 | 744 | 745,635 | ||||||||
| American Airlines Group, Inc.† | 3.75% | 3/1/2025 | 2,743 | 2,447,551 | ||||||||
| British Airways 2013-1 Class A Pass Through Trust (United Kingdom)†(f) | 4.625% | 12/20/2025 | 903 | 944,884 | ||||||||
| Hawaiian Airlines 2013-1 Class B Pass-Through Certificates | 4.95% | 7/15/2023 | 356 | 356,703 | ||||||||
| 242 | See Notes to Financial Statements. |
Schedule of Investments (continued)
INFLATION FOCUSED FUND November 30, 2021
| Investments | Interest Rate | Maturity Date | Principal Amount (000) | Fair Value | ||||||||
| Airlines (continued) | ||||||||||||
| Spirit Loyalty Cayman Ltd./Spirit IP Cayman Ltd.† | 8.00% | 9/20/2025 | $ | 653 | $ | 714,838 | ||||||
| United Airlines 2014-1 Class B Pass-Through Trust | 4.75% | 10/11/2023 | 114 | 114,993 | ||||||||
| United Airlines, Inc.† | 4.375% | 4/15/2026 | 1,136 | 1,142,731 | ||||||||
| Total | 9,400,826 | |||||||||||
| Apparel 0.21% | ||||||||||||
| PVH Corp. | 4.625% | 7/10/2025 | 5,561 | 6,108,303 | ||||||||
| William Carter Co. (The)† | 5.50% | 5/15/2025 | 1,826 | 1,900,400 | ||||||||
| Total | 8,008,703 | |||||||||||
| Auto Manufacturers 2.91% | ||||||||||||
| Daimler Finance North America LLC† | 3.65% | 2/22/2024 | 2,775 | 2,930,375 | ||||||||
| Ford Motor Credit Co. LLC | 1.221% (3 Mo. LIBOR + 1.08% | )# | 8/3/2022 | 200 | 199,814 | |||||||
| Ford Motor Credit Co. LLC | 2.979% | 8/3/2022 | 5,800 | 5,849,358 | ||||||||
| Ford Motor Credit Co. LLC | 3.087% | 1/9/2023 | 468 | 474,491 | ||||||||
| Ford Motor Credit Co. LLC | 3.219% | 1/9/2022 | 475 | 476,199 | ||||||||
| Ford Motor Credit Co. LLC | 5.584% | 3/18/2024 | 12,461 | 13,320,498 | ||||||||
| Ford Motor Credit Co. LLC | 5.596% | 1/7/2022 | 5,870 | 5,899,291 | ||||||||
| General Motors Co. | 5.40% | 10/2/2023 | 8,747 | 9,426,407 | ||||||||
| General Motors Co. | 6.125% | 10/1/2025 | 6,167 | 7,118,957 | ||||||||
| General Motors Financial Co., Inc. | 2.75% | 6/20/2025 | 1,378 | 1,424,994 | ||||||||
| General Motors Financial Co., Inc. | 3.70% | 5/9/2023 | 557 | 576,382 | ||||||||
| General Motors Financial Co., Inc. | 3.95% | 4/13/2024 | 2,837 | 2,991,574 | ||||||||
| General Motors Financial Co., Inc. | 4.25% | 5/15/2023 | 280 | 293,099 | ||||||||
| General Motors Financial Co., Inc. | 5.10% | 1/17/2024 | 6,578 | 7,081,049 | ||||||||
| General Motors Financial Co., Inc. | 5.25% | 3/1/2026 | 1,639 | 1,843,668 | ||||||||
| Hyundai Capital America† | 0.80% | 1/8/2024 | 1,383 | 1,372,362 | ||||||||
| Hyundai Capital America† | 0.875% | 6/14/2024 | 3,034 | 2,998,407 | ||||||||
| Hyundai Capital America† | 1.00% | 9/17/2024 | 1,088 | 1,074,029 | ||||||||
| Hyundai Capital America† | 1.15% | 11/10/2022 | 10,000 | 10,032,481 | ||||||||
| Hyundai Capital America† | 1.25% | 9/18/2023 | 2,272 | 2,276,915 | ||||||||
| Hyundai Capital America† | 1.30% | 1/8/2026 | 5,478 | 5,334,819 | ||||||||
| Hyundai Capital America† | 1.50% | 6/15/2026 | 1,692 | 1,648,163 | ||||||||
| Hyundai Capital America† | 2.85% | 11/1/2022 | 3,637 | 3,706,102 | ||||||||
| Hyundai Capital America† | 3.00% | 6/20/2022 | 213 | 215,393 | ||||||||
| Hyundai Capital America | 3.40% | 6/20/2024 | 6,181 | 6,489,550 | ||||||||
| Hyundai Capital America† | 5.875% | 4/7/2025 | 960 | 1,088,580 | ||||||||
| Kia Corp. (South Korea)†(f) | 3.00% | 4/25/2023 | 5,000 | 5,152,219 | ||||||||
| See Notes to Financial Statements. | 243 |
Schedule of Investments (continued)
INFLATION FOCUSED FUND November 30, 2021
| Investments | Interest Rate | Maturity Date | Principal Amount (000) | Fair Value | ||||||||
| Auto Manufacturers (continued) | ||||||||||||
| Stellantis N.V. (Netherlands)(f) | 5.25% | 4/15/2023 | $ | 6,090 | $ | 6,449,858 | ||||||
| Volkswagen Group of America Finance LLC† | 2.90% | 5/13/2022 | 861 | 869,905 | ||||||||
| Volkswagen Group of America Finance LLC† | 3.35% | 5/13/2025 | 212 | 223,752 | ||||||||
| Total | 108,838,691 | |||||||||||
| Auto Parts & Equipment 0.16% | ||||||||||||
| IHO Verwaltungs GmbH PIK 5.50% (Germany)†(f) | 4.75% | 9/15/2026 | 2,273 | 2,323,638 | ||||||||
| ZF North America Capital, Inc.† | 4.75% | 4/29/2025 | 3,325 | 3,546,761 | ||||||||
| Total | 5,870,399 | |||||||||||
| Banks 12.17% | ||||||||||||
| ABN AMRO Bank NV (Netherlands)†(f) | 4.75% | 7/28/2025 | 3,635 | 3,979,464 | ||||||||
| ABN AMRO Bank NV (Netherlands)†(f) | 4.80% | 4/18/2026 | 1,000 | 1,108,837 | ||||||||
| ABN AMRO Bank NV (Netherlands)(f) | 6.25% | 4/27/2022 | 2,533 | 2,590,676 | ||||||||
| AIB Group plc (Ireland)†(f) | 4.263% (3 Mo. LIBOR + 1.87% | )# | 4/10/2025 | 6,313 | 6,683,886 | |||||||
| AIB Group plc (Ireland)†(f) | 4.75% | 10/12/2023 | 4,165 | 4,428,920 | ||||||||
| Akbank T.A.S. (Turkey)†(f) | 5.00% | 10/24/2022 | 600 | 606,192 | ||||||||
| ASB Bank Ltd. (New Zealand)†(f) | 3.75% | 6/14/2023 | 1,018 | 1,064,856 | ||||||||
| Australia & New Zealand Banking Group Ltd. (Australia)†(f) | 4.40% | 5/19/2026 | 2,317 | 2,541,876 | ||||||||
| Australia & New Zealand Banking Group Ltd. (Australia)†(f) | 4.50% | 3/19/2024 | 2,516 | 2,694,156 | ||||||||
| Banco Santander Mexico SA Institucion de Banca Multiple Grupo Financiero Santand (Mexico)†(f) | 4.125% | 11/9/2022 | 6,582 | 6,757,838 | ||||||||
| Banco Santander Mexico SA Institucion de Banca Multiple Grupo Financiero Santand (Mexico)†(f) | 5.375% | 4/17/2025 | 5,279 | 5,732,651 | ||||||||
| Bancolombia SA (Colombia)(f) | 3.00% | 1/29/2025 | 407 | 405,207 | ||||||||
| Bank of America Corp. | 0.523% (SOFR + .41% | )# | 6/14/2024 | 2,758 | 2,737,824 | |||||||
| Bank of America Corp. | 1.197% (SOFR + 1.01% | )# | 10/24/2026 | 4,724 | 4,627,744 | |||||||
| Bank of America Corp. | 1.319% (SOFR + 1.15% | )# | 6/19/2026 | 605 | 599,497 | |||||||
| Bank of America Corp. | 2.816% (3 Mo. LIBOR + .93% | )# | 7/21/2023 | 3,978 | 4,028,969 | |||||||
| Bank of America Corp. | 3.124% (3 Mo. LIBOR + 1.16% | )# | 1/20/2023 | 4,228 | 4,242,304 | |||||||
| Bank of America Corp. | 3.95% | 4/21/2025 | 3,513 | 3,771,654 | ||||||||
| Bank of Ireland Group plc (Ireland)†(f) | 2.029% (1 Yr. Treasury CMT + 1.10% | )# | 9/30/2027 | 5,505 | 5,441,237 | |||||||
| 244 | See Notes to Financial Statements. |
Schedule of Investments (continued)
INFLATION FOCUSED FUND November 30, 2021
| Investments | Interest Rate | Maturity Date | Principal Amount (000) | Fair Value | ||||||||
| Banks (continued) | ||||||||||||
| Bank of Ireland Group plc (Ireland)†(f) | 4.50% | 11/25/2023 | $ | 5,242 | $ | 5,578,351 | ||||||
| BankUnited, Inc. | 4.875% | 11/17/2025 | 1,804 | 1,993,997 | ||||||||
| Barclays plc (United Kingdom)(f) | 3.684% | 1/10/2023 | 5,000 | 5,015,844 | ||||||||
| Barclays plc (United Kingdom)(f) | 4.375% | 9/11/2024 | 2,325 | 2,488,986 | ||||||||
| Barclays plc (United Kingdom)(f) | 4.61% (3 Mo. LIBOR + 1.40% | )# | 2/15/2023 | 12,074 | 12,167,924 | |||||||
| Barclays plc (United Kingdom)(f) | 5.20% | 5/12/2026 | 3,881 | 4,365,291 | ||||||||
| BBVA Bancomer SA† | 4.375% | 4/10/2024 | 2,250 | 2,405,340 | ||||||||
| BNP Paribas SA (France)†(f) | 1.323% (SOFR + 1.00% | )# | 1/13/2027 | 246 | 239,792 | |||||||
| BNP Paribas SA (France)†(f) | 3.375% | 1/9/2025 | 934 | 985,157 | ||||||||
| BNP Paribas SA (France)†(f) | 4.375% | 9/28/2025 | 200 | 217,229 | ||||||||
| BNP Paribas SA (France)†(f) | 4.375% | 5/12/2026 | 636 | 692,695 | ||||||||
| BNP Paribas SA (France)†(f) | 4.705% (3 Mo. LIBOR + 2.24% | )# | 1/10/2025 | 1,050 | 1,123,492 | |||||||
| BPCE SA (France)†(f) | 2.375% | 1/14/2025 | 696 | 710,231 | ||||||||
| BPCE SA (France)†(f) | 4.50% | 3/15/2025 | 1,324 | 1,431,121 | ||||||||
| BPCE SA (France)†(f) | 5.15% | 7/21/2024 | 5,000 | 5,450,384 | ||||||||
| CIT Group, Inc. | 3.929% (SOFR + 3.83% | )# | 6/19/2024 | 266 | 274,478 | |||||||
| CIT Group, Inc. | 4.75% | 2/16/2024 | 1,408 | 1,488,143 | ||||||||
| CIT Group, Inc. | 5.00% | 8/15/2022 | 1,054 | 1,083,148 | ||||||||
| CIT Group, Inc. | 5.00% | 8/1/2023 | 3,159 | 3,337,025 | ||||||||
| Citigroup, Inc. | 1.281% (SOFR + .53% | )# | 11/3/2025 | 1,014 | 1,011,759 | |||||||
| Citigroup, Inc. | 3.106% (SOFR + 2.84% | )# | 4/8/2026 | 8,551 | 8,969,292 | |||||||
| Citigroup, Inc. | 3.875% | 3/26/2025 | 2,023 | 2,166,653 | ||||||||
| Citigroup, Inc. | 4.40% | 6/10/2025 | 1,854 | 2,014,717 | ||||||||
| Citigroup, Inc. | 5.50% | 9/13/2025 | 11,700 | 13,249,197 | ||||||||
| Credit Agricole SA (France)†(f) | 4.375% | 3/17/2025 | 2,818 | 3,044,341 | ||||||||
| Credit Suisse AG/New York NY | 3.625% | 9/9/2024 | 4,111 | 4,374,393 | ||||||||
| Credit Suisse Group AG (Switzerland)†(f) | 1.305% (SOFR + .98% | )# | 2/2/2027 | 436 | 422,457 | |||||||
| Credit Suisse Group AG (Switzerland)†(f) | 2.193% (SOFR + 2.04% | )# | 6/5/2026 | 529 | 534,218 | |||||||
| Credit Suisse Group AG (Switzerland)†(f) | 2.593% (SOFR + 1.56% | )# | 9/11/2025 | 2,557 | 2,615,505 | |||||||
| Credit Suisse Group AG (Switzerland)†(f) | 2.997% (3 Mo. LIBOR + 1.20% | )# | 12/14/2023 | 5,000 | 5,096,886 | |||||||
| See Notes to Financial Statements. | 245 |
Schedule of Investments (continued)
INFLATION FOCUSED FUND November 30, 2021
| Investments | Interest Rate | Maturity Date | Principal Amount (000) | Fair Value | ||||||||
| Banks (continued) | ||||||||||||
| Credit Suisse Group AG (Switzerland)†(f) | 3.574% | 1/9/2023 | $ | 6,701 | $ | 6,719,734 | ||||||
| Credit Suisse Group AG (Switzerland)(f) | 3.75% | 3/26/2025 | 1,536 | 1,638,170 | ||||||||
| Credit Suisse Group AG (Switzerland)†(f) | 4.207% (3 Mo. LIBOR + 1.24% | )# | 6/12/2024 | 785 | 820,241 | |||||||
| Danske Bank A/S (Denmark)†(f) | 0.976% (1 Yr. Treasury CMT + .55% | )# | 9/10/2025 | 2,040 | 2,012,896 | |||||||
| Danske Bank A/S (Denmark)†(f) | 1.171% (1 Yr. Treasury CMT + 1.03% | )# | 12/8/2023 | 5,059 | 5,062,588 | |||||||
| Danske Bank A/S (Denmark)†(f) | 1.226% | 6/22/2024 | 3,037 | 3,044,713 | ||||||||
| Danske Bank A/S (Denmark)†(f) | 1.621% (1 Yr. Treasury CMT + 1.35% | )# | 9/11/2026 | 608 | 601,882 | |||||||
| Danske Bank A/S (Denmark)†(f) | 3.244% (3 Mo. LIBOR + 1.59% | )# | 12/20/2025 | 11,328 | 11,798,726 | |||||||
| Danske Bank A/S (Denmark)†(f) | 5.00% | 1/12/2022 | 909 | 913,521 | ||||||||
| Danske Bank A/S (Denmark)†(f) | 5.00% (1 Yr. Treasury CMT + 1.73% | )# | 1/12/2023 | 200 | 200,888 | |||||||
| Danske Bank A/S (Denmark)†(f) | 5.375% | 1/12/2024 | 16,478 | 17,812,849 | ||||||||
| Emirates NBD Bank PJSC (United Arab Emirates)(f) | 3.25% | 11/14/2022 | 1,725 | 1,763,812 | ||||||||
| FNB Corp. | 2.20% | 2/24/2023 | 510 | 516,135 | ||||||||
| Goldman Sachs Group, Inc. (The) | 0.657% (SOFR + .51% | )# | 9/10/2024 | 2,758 | 2,737,285 | |||||||
| Goldman Sachs Group, Inc. (The) | 1.124% (3 Mo. LIBOR + 1.00% | )# | 7/24/2023 | 424 | 425,707 | |||||||
| Goldman Sachs Group, Inc. (The) | 1.948% (SOFR + .91% | )# | 10/21/2027 | 3,494 | 3,487,951 | |||||||
| Goldman Sachs Group, Inc. (The) | 2.905% (3 Mo. LIBOR + .99% | )# | 7/24/2023 | 9,558 | 9,683,419 | |||||||
| Goldman Sachs Group, Inc. (The) | 3.272% (3 Mo. LIBOR + 1.20% | )# | 9/29/2025 | 320 | 335,830 | |||||||
| HSBC Holdings plc (United Kingdom)(f) | 0.732% (SOFR + .53% | )# | 8/17/2024 | 1,219 | 1,210,580 | |||||||
| HSBC Holdings plc (United Kingdom)(f) | 0.976% (SOFR + .71% | )# | 5/24/2025 | 679 | 671,578 | |||||||
| HSBC Holdings plc (United Kingdom)(f) | 3.262% (3 Mo. LIBOR + 1.06% | )# | 3/13/2023 | 4,361 | 4,391,935 | |||||||
| Intesa Sanpaolo SpA (Italy)†(f) | 3.125% | 7/14/2022 | 888 | 900,796 | ||||||||
| Intesa Sanpaolo SpA (Italy)†(f) | 3.25% | 9/23/2024 | 3,928 | 4,103,392 | ||||||||
| Intesa Sanpaolo SpA (Italy)†(f) | 3.375% | 1/12/2023 | 1,966 | 2,016,625 | ||||||||
| Intesa Sanpaolo SpA (Italy)†(f) | 5.017% | 6/26/2024 | 8,728 | 9,326,790 | ||||||||
| Intesa Sanpaolo SpA (Italy)†(f) | 5.71% | 1/15/2026 | 2,302 | 2,553,376 | ||||||||
| Itau Unibanco Holding SA† | 2.90% | 1/24/2023 | 3,200 | 3,234,512 | ||||||||
| 246 | See Notes to Financial Statements. |
Schedule of Investments (continued)
INFLATION FOCUSED FUND November 30, 2021
| Investments | Interest Rate | Maturity Date | Principal Amount (000) | Fair Value | ||||||||
| Banks (continued) | ||||||||||||
| JPMorgan Chase & Co. | 0.768% (SOFR + .49% | )# | 8/9/2025 | $ | 3,156 | $ | 3,113,904 | |||||
| JPMorgan Chase & Co. | 0.824% (SOFR + .54% | )# | 6/1/2025 | 2,899 | 2,865,295 | |||||||
| JPMorgan Chase & Co. | 2.776% (3 Mo. LIBOR + .94% | )# | 4/25/2023 | 5,669 | 5,715,416 | |||||||
| JPMorgan Chase & Co. | 3.875% | 9/10/2024 | 1,015 | 1,083,562 | ||||||||
| Lloyds Banking Group plc (United Kingdom)(f) | 1.326% (1 Yr. Treasury CMT + 1.10% | )# | 6/15/2023 | 14,146 | 14,184,929 | |||||||
| Lloyds Banking Group plc (United Kingdom)(f) | 2.858% (3 Mo. LIBOR + 1.25% | )# | 3/17/2023 | 8,256 | 8,306,960 | |||||||
| Lloyds Banking Group plc (United Kingdom)(f) | 4.582% | 12/10/2025 | 5,156 | 5,658,868 | ||||||||
| Lloyds Banking Group plc (United Kingdom)(f) | 4.65% | 3/24/2026 | 3,048 | 3,366,756 | ||||||||
| Macquarie Group Ltd. (Australia)†(f) | 1.196% (3 Mo. LIBOR + 1.02% | )# | 11/28/2023 | 4,881 | 4,913,607 | |||||||
| Macquarie Group Ltd. (Australia)†(f) | 1.201% (SOFR + .69% | )# | 10/14/2025 | 6,843 | 6,793,301 | |||||||
| Macquarie Group Ltd. (Australia)†(f) | 1.34% (SOFR + 1.07% | )# | 1/12/2027 | 403 | 394,428 | |||||||
| Macquarie Group Ltd. (Australia)†(f) | 3.189% (3 Mo. LIBOR + 1.02% | )# | 11/28/2023 | 871 | 891,743 | |||||||
| Mitsubishi UFJ Financial Group, Inc. (Japan)(f) | 0.953% (1 Yr. Treasury CMT + .55% | )# | 7/19/2025 | 2,237 | 2,215,408 | |||||||
| Morgan Stanley | 0.79% (SOFR + .53% | )# | 5/30/2025 | 2,968 | 2,923,566 | |||||||
| Morgan Stanley | 0.791% (SOFR + .51% | )# | 1/22/2025 | 3,835 | 3,794,111 | |||||||
| Morgan Stanley | 4.10% | 5/22/2023 | 769 | 804,103 | ||||||||
| Morgan Stanley | 5.00% | 11/24/2025 | 500 | 559,332 | ||||||||
| Natwest Group plc (United Kingdom)(f) | 3.498% (3 Mo. LIBOR + 1.48% | )# | 5/15/2023 | 2,602 | 2,633,162 | |||||||
| Natwest Group plc (United Kingdom)(f) | 3.875% | 9/12/2023 | 8,004 | 8,370,113 | ||||||||
| Natwest Group plc (United Kingdom)(f) | 5.125% | 5/28/2024 | 2,528 | 2,735,866 | ||||||||
| NatWest Markets plc (United Kingdom)†(f) | 0.80% | 8/12/2024 | 613 | 604,922 | ||||||||
| Nordea Bank Abp (Finland)†(f) | 4.25% | 9/21/2022 | 505 | 519,468 | ||||||||
| People’s United Bank NA | 4.00% | 7/15/2024 | 1,000 | 1,053,306 | ||||||||
| Popular, Inc. | 6.125% | 9/14/2023 | 504 | 536,853 | ||||||||
| Santander Holdings USA, Inc. | 3.244% | 10/5/2026 | 1,051 | 1,100,668 | ||||||||
| Santander Holdings USA, Inc. | 3.40% | 1/18/2023 | 3,651 | 3,743,133 | ||||||||
| Santander Holdings USA, Inc. | 3.45% | 6/2/2025 | 7,064 | 7,457,987 | ||||||||
| Santander Holdings USA, Inc. | 3.50% | 6/7/2024 | 1,131 | 1,184,114 | ||||||||
| See Notes to Financial Statements. | 247 |
Schedule of Investments (continued)
INFLATION FOCUSED FUND November 30, 2021
| Investments | Interest Rate | Maturity Date | Principal Amount (000) | Fair Value | ||||||||
| Banks (continued) | ||||||||||||
| Santander UK Group Holdings plc (United Kingdom)(f) | 1.089% (SOFR + .79% | )# | 3/15/2025 | $ | 200 | $ | 198,298 | |||||
| Santander UK Group Holdings plc (United Kingdom)(f) | 3.373% (3 Mo. LIBOR + 1.08% | )# | 1/5/2024 | 2,115 | 2,170,025 | |||||||
| Santander UK Group Holdings plc (United Kingdom)†(f) | 4.75% | 9/15/2025 | 200 | 218,692 | ||||||||
| Santander UK Group Holdings plc (United Kingdom)(f) | 4.796% (3 Mo. LIBOR + 1.57% | )# | 11/15/2024 | 5,776 | 6,177,243 | |||||||
| Standard Chartered plc (United Kingdom)†(f) | 0.991% (1 Yr. Treasury CMT + .78% | )# | 1/12/2025 | 2,093 | 2,073,170 | |||||||
| Standard Chartered plc (United Kingdom)†(f) | 1.214% (1 Yr. Treasury CMT + .88% | )# | 3/23/2025 | 200 | 199,112 | |||||||
| Standard Chartered plc (United Kingdom)†(f) | 1.319% (1 Yr. Treasury CMT + 1.17% | )# | 10/14/2023 | 284 | 284,706 | |||||||
| Standard Chartered plc (United Kingdom)†(f) | 2.819% (3 Mo. LIBOR + 1.21% | )# | 1/30/2026 | 2,530 | 2,598,517 | |||||||
| Standard Chartered plc (United Kingdom)†(f) | 3.20% | 4/17/2025 | 3,246 | 3,394,244 | ||||||||
| Standard Chartered plc (United Kingdom)†(f) | 3.785% (3 Mo. LIBOR + 1.56% | )# | 5/21/2025 | 1,940 | 2,044,106 | |||||||
| Standard Chartered plc (United Kingdom)†(f) | 3.885% (3 Mo. LIBOR + 1.08% | )# | 3/15/2024 | 2,377 | 2,457,485 | |||||||
| Standard Chartered plc (United Kingdom)†(f) | 4.247% (3 Mo. LIBOR + 1.15% | )# | 1/20/2023 | 3,568 | 3,584,565 | |||||||
| Standard Chartered plc (United Kingdom)†(f) | 5.20% | 1/26/2024 | 3,559 | 3,810,375 | ||||||||
| Swedbank AB (Sweden)†(f) | 1.30% | 6/2/2023 | 793 | 800,579 | ||||||||
| Swedbank AB (Sweden)†(f) | 2.80% | 3/14/2022 | 837 | 843,079 | ||||||||
| Synovus Bank/Columbus GA | 2.289% (SOFR + .95% | )# | 2/10/2023 | 250 | 250,496 | |||||||
| Synovus Financial Corp. | 3.125% | 11/1/2022 | 2,497 | 2,537,802 | ||||||||
| Turkiye Vakiflar Bankasi TAO (Turkey)†(f) | 5.625% | 5/30/2022 | 1,267 | 1,279,575 | ||||||||
| Turkiye Vakiflar Bankasi TAO (Turkey)†(f) | 5.75% | 1/30/2023 | 364 | 367,940 | ||||||||
| UBS AG (Switzerland)(f) | 5.125% | 5/15/2024 | 18,374 | 19,775,017 | ||||||||
| UBS AG | 7.625% | 8/17/2022 | 6,094 | 6,366,261 | ||||||||
| UBS Group AG (Switzerland)†(f) | 1.008% (1 Yr. Treasury CMT + .83% | )# | 7/30/2024 | 521 | 520,801 | |||||||
| UBS Group AG (Switzerland)†(f) | 1.384% (3 Mo. LIBOR + 1.22% | )# | 5/23/2023 | 1,085 | 1,090,750 | |||||||
| UBS Group AG (Switzerland)†(f) | 3.491% | 5/23/2023 | 4,067 | 4,120,777 | ||||||||
| 248 | See Notes to Financial Statements. |
Schedule of Investments (continued)
INFLATION FOCUSED FUND November 30, 2021
| Investments | Interest Rate | Maturity Date | Principal Amount (000) | Fair Value | ||||||||
| Banks (continued) | ||||||||||||
| UBS Group Funding Switzerland AG (Switzerland)†(f) | 2.859% (3 Mo. LIBOR + .95% | )# | 8/15/2023 | $ | 11,130 | $ | 11,292,355 | |||||
| UniCredit SpA (Italy)†(f) | 4.027% (3 Mo. LIBOR + 3.90% | )# | 1/14/2022 | 1,555 | 1,561,439 | |||||||
| UniCredit SpA (Italy)†(f) | 6.572% | 1/14/2022 | 11,088 | 11,159,919 | ||||||||
| UniCredit SpA (Italy)†(f) | 7.83% | 12/4/2023 | 8,170 | 9,209,511 | ||||||||
| Total | 454,489,485 | |||||||||||
| Beverages 0.14% | ||||||||||||
| Central American Bottling Corp. (Guatemala)†(f) | 5.75% | 1/31/2027 | 5,004 | 5,126,523 | ||||||||
| Biotechnology 0.19% | ||||||||||||
| Gilead Sciences, Inc. | 0.75% | 9/29/2023 | 7,246 | 7,225,144 | ||||||||
| Building Materials 0.16% | ||||||||||||
| Builders FirstSource, Inc.† | 6.75% | 6/1/2027 | 5,785 | 6,094,758 | ||||||||
| Chemicals 0.04% | ||||||||||||
| Braskem Finance Ltd. | 6.45% | 2/3/2024 | 600 | 650,676 | ||||||||
| Orbia Advance Corp. SAB de CV (Mexico)†(f) | 1.875% | 5/11/2026 | 710 | 695,338 | ||||||||
| Total | 1,346,014 | |||||||||||
| Commercial Services 1.13% | ||||||||||||
| Adani Ports & Special Economic Zone Ltd. (India)†(f) | 3.375% | 7/24/2024 | 1,400 | 1,448,603 | ||||||||
| Ashtead Capital, Inc.† | 4.00% | 5/1/2028 | 7,005 | 7,318,885 | ||||||||
| Ashtead Capital, Inc.† | 4.375% | 8/15/2027 | 2,696 | 2,806,819 | ||||||||
| IHS Markit Ltd. (United Kingdom)(f) | 4.125% | 8/1/2023 | 1,523 | 1,594,414 | ||||||||
| IHS Markit Ltd. (United Kingdom)†(f) | 4.75% | 2/15/2025 | 1,304 | 1,425,461 | ||||||||
| Nielsen Co. Luxembourg S.a.r.l. (The) (Luxembourg)†(f) | 5.00% | 2/1/2025 | 1,690 | 1,714,184 | ||||||||
| Ritchie Bros Auctioneers, Inc. (Canada)†(f) | 5.375% | 1/15/2025 | 4,400 | 4,471,500 | ||||||||
| Sabre GLBL, Inc.† | 7.375% | 9/1/2025 | 2,870 | 2,974,784 | ||||||||
| Triton Container International Ltd.† | 0.80% | 8/1/2023 | 3,076 | 3,053,350 | ||||||||
| Triton Container International Ltd.† | 1.15% | 6/7/2024 | 2,518 | 2,490,432 | ||||||||
| Triton Container International Ltd.† | 2.05% | 4/15/2026 | 7,217 | 7,162,040 | ||||||||
| United Rentals North America, Inc. | 3.875% | 11/15/2027 | 5,602 | 5,818,937 | ||||||||
| Total | 42,279,409 | |||||||||||
| Computers 0.41% | ||||||||||||
| CA Magnum Holdings (Mauritius)†(f) | 5.375% | 10/31/2026 | 2,931 | 3,000,611 | ||||||||
| Dell International LLC/EMC Corp. | 4.00% | 7/15/2024 | 1,725 | 1,836,954 | ||||||||
| Dell International LLC/EMC Corp. | 5.45% | 6/15/2023 | 6,079 | 6,449,575 | ||||||||
| See Notes to Financial Statements. | 249 |
Schedule of Investments (continued)
INFLATION FOCUSED FUND November 30, 2021
| Investments | Interest Rate | Maturity Date | Principal Amount (000) | Fair Value | ||||||||
| Computers (continued) | ||||||||||||
| Dell International LLC/EMC Corp. | 5.85% | 7/15/2025 | $ | 1,634 | $ | 1,870,566 | ||||||
| Dell International LLC/EMC Corp. | 6.02% | 6/15/2026 | 1,850 | 2,154,964 | ||||||||
| Total | 15,312,670 | |||||||||||
| Cosmetics/Personal Care 0.07% | ||||||||||||
| Coty, Inc.† | 5.00% | 4/15/2026 | 2,402 | 2,451,685 | ||||||||
| Diversified Financial Services 3.60% | ||||||||||||
| AerCap Ireland Capital DAC/AerCap Global Aviation Trust (Ireland)(f) | 1.75% | 10/29/2024 | 1,596 | 1,594,198 | ||||||||
| AerCap Ireland Capital DAC/AerCap Global Aviation Trust (Ireland)(f) | 3.15% | 2/15/2024 | 1,224 | 1,264,275 | ||||||||
| AerCap Ireland Capital DAC/AerCap Global Aviation Trust (Ireland)(f) | 4.50% | 9/15/2023 | 1,392 | 1,466,878 | ||||||||
| AerCap Ireland Capital DAC/AerCap Global Aviation Trust (Ireland)(f) | 4.875% | 1/16/2024 | 4,400 | 4,703,670 | ||||||||
| AerCap Ireland Capital DAC/AerCap Global Aviation Trust (Ireland)(f) | 6.50% | 7/15/2025 | 5,376 | 6,153,961 | ||||||||
| Air Lease Corp. | 3.00% | 9/15/2023 | 2,000 | 2,057,242 | ||||||||
| Air Lease Corp. | 4.25% | 2/1/2024 | 527 | 558,069 | ||||||||
| Aircastle Ltd. | 4.40% | 9/25/2023 | 2,715 | 2,855,108 | ||||||||
| Aircastle Ltd. | 5.00% | 4/1/2023 | 1,840 | 1,933,019 | ||||||||
| Aircastle Ltd.† | 5.25% | 8/11/2025 | 5,959 | 6,574,973 | ||||||||
| Alliance Data Systems Corp.† | 4.75% | 12/15/2024 | 7,213 | 7,320,329 | ||||||||
| Alliance Data Systems Corp.† | 7.00% | 1/15/2026 | 3,486 | 3,669,799 | ||||||||
| Ally Financial, Inc. | 1.45% | 10/2/2023 | 4,223 | 4,243,639 | ||||||||
| Ally Financial, Inc. | 3.875% | 5/21/2024 | 6,186 | 6,522,996 | ||||||||
| Ally Financial, Inc. | 4.625% | 3/30/2025 | 402 | 439,169 | ||||||||
| Ally Financial, Inc. | 5.125% | 9/30/2024 | 1,504 | 1,648,745 | ||||||||
| Ally Financial, Inc. | 5.75% | 11/20/2025 | 5,200 | 5,892,722 | ||||||||
| Aviation Capital Group LLC† | 1.95% | 1/30/2026 | 346 | 339,775 | ||||||||
| Aviation Capital Group LLC† | 2.875% | 1/20/2022 | 899 | 899,997 | ||||||||
| Aviation Capital Group LLC† | 3.875% | 5/1/2023 | 9,000 | 9,319,786 | ||||||||
| Aviation Capital Group LLC† | 4.375% | 1/30/2024 | 1,000 | 1,055,772 | ||||||||
| Aviation Capital Group LLC† | 5.50% | 12/15/2024 | 2,287 | 2,519,259 | ||||||||
| Avolon Holdings Funding Ltd. (Ireland)†(f) | 3.625% | 5/1/2022 | 170 | 171,678 | ||||||||
| Avolon Holdings Funding Ltd. (Ireland)†(f) | 3.95% | 7/1/2024 | 444 | 465,709 | ||||||||
| Avolon Holdings Funding Ltd. (Ireland)†(f) | 4.25% | 4/15/2026 | 8,247 | 8,811,434 | ||||||||
| Avolon Holdings Funding Ltd. (Ireland)†(f) | 4.375% | 5/1/2026 | 1,000 | 1,072,287 | ||||||||
| Avolon Holdings Funding Ltd. (Ireland)†(f) | 5.125% | 10/1/2023 | 6,298 | 6,669,320 | ||||||||
| 250 | See Notes to Financial Statements. |
Schedule of Investments (continued)
INFLATION FOCUSED FUND November 30, 2021
| Investments | Interest Rate | Maturity Date | Principal Amount (000) | Fair Value | ||||||||
| Diversified Financial Services (continued) | ||||||||||||
| Avolon Holdings Funding Ltd. (Ireland)†(f) | 5.25% | 5/15/2024 | $ | 1,754 | $ | 1,888,280 | ||||||
| Citigroup Global Markets Holdings, Inc. | 0.75% | 6/7/2024 | 2,146 | 2,123,672 | ||||||||
| Global Aircraft Leasing Co. Ltd. PIK 7.25%† | 6.50% | 9/15/2024 | 829 | 794,395 | ||||||||
| Muthoot Finance Ltd. (India)†(f) | 4.40% | 9/2/2023 | 416 | 423,800 | ||||||||
| Muthoot Finance Ltd. (India)†(f) | 6.125% | 10/31/2022 | 500 | 512,500 | ||||||||
| Navient Corp. | 5.50% | 1/25/2023 | 249 | 258,337 | ||||||||
| Navient Corp. | 5.875% | 10/25/2024 | 5,921 | 6,201,123 | ||||||||
| Navient Corp. | 6.125% | 3/25/2024 | 2,510 | 2,636,240 | ||||||||
| Navient Corp. | 6.50% | 6/15/2022 | 1,600 | 1,650,440 | ||||||||
| Navient Corp. | 7.25% | 9/25/2023 | 2,472 | 2,662,233 | ||||||||
| OneMain Finance Corp. | 5.625% | 3/15/2023 | 211 | 219,100 | ||||||||
| OneMain Finance Corp. | 6.125% | 5/15/2022 | 177 | 181,359 | ||||||||
| OneMain Finance Corp. | 6.125% | 3/15/2024 | 2,346 | 2,466,221 | ||||||||
| OneMain Finance Corp. | 8.25% | 10/1/2023 | 1,927 | 2,120,191 | ||||||||
| OneMain Finance Corp. | 8.875% | 6/1/2025 | 1,060 | 1,137,910 | ||||||||
| Park Aerospace Holdings Ltd. (Ireland)†(f) | 4.50% | 3/15/2023 | 4,399 | 4,564,397 | ||||||||
| Park Aerospace Holdings Ltd. (Ireland)†(f) | 5.50% | 2/15/2024 | 8,742 | 9,417,460 | ||||||||
| Rocket Mortgage LLC/Rocket Mortgage Co-Issuer, Inc.† | 2.875% | 10/15/2026 | 5,024 | 4,905,484 | ||||||||
| Total | 134,386,951 | |||||||||||
| Electric 2.78% | ||||||||||||
| AES Corp. (The)† | 3.30% | 7/15/2025 | 4,791 | 5,021,136 | ||||||||
| Alexander Funding Trust† | 1.841% | 11/15/2023 | 2,465 | 2,490,725 | ||||||||
| American Transmission Systems, Inc.† | 5.25% | 1/15/2022 | 6,500 | 6,533,725 | ||||||||
| Ausgrid Finance Pty Ltd. (Australia)†(f) | 3.85% | 5/1/2023 | 2,235 | 2,304,973 | ||||||||
| Calpine Corp.† | 5.25% | 6/1/2026 | 2,720 | 2,787,150 | ||||||||
| Cemig Geracao e Transmissao SA (Brazil)†(f) | 9.25% | 12/5/2024 | 250 | 278,045 | ||||||||
| CenterPoint Energy, Inc. | 0.70% (SOFR + .65% | )# | 5/13/2024 | 1,000 | 1,000,319 | |||||||
| Cikarang Listrindo Tbk PT (Indonesia)†(f) | 4.95% | 9/14/2026 | 4,049 | 4,128,482 | ||||||||
| Cleco Corporate Holdings LLC | 3.743% | 5/1/2026 | 1,009 | 1,076,661 | ||||||||
| Cleco Power LLC† | 0.616% (3 Mo. LIBOR + .50% | )# | 6/15/2023 | 5,308 | 5,307,679 | |||||||
| Cleveland Electric Illuminating Co. (The) | 5.50% | 8/15/2024 | 2,650 | 2,940,901 | ||||||||
| Comision Federal de Electricidad (Mexico)†(f) | 4.875% | 1/15/2024 | 3,002 | 3,192,372 | ||||||||
| Dominion Energy, Inc. | 0.646% (3 Mo. LIBOR + .53% | )# | 9/15/2023 | 4,387 | 4,389,991 | |||||||
| Edison International | 3.125% | 11/15/2022 | 3,845 | 3,910,115 | ||||||||
| FirstEnergy Corp. | 3.35% | 7/15/2022 | 1,917 | 1,927,543 | ||||||||
| See Notes to Financial Statements. | 251 |
Schedule of Investments (continued)
INFLATION FOCUSED FUND November 30, 2021
| Investments | Interest Rate | Maturity Date | Principal Amount (000) | Fair Value | ||||||||
| Electric (continued) | ||||||||||||
| FirstEnergy Transmission LLC† | 4.35% | 1/15/2025 | $ | 3,000 | $ | 3,184,022 | ||||||
| IPALCO Enterprises, Inc. | 3.70% | 9/1/2024 | 1,500 | 1,577,926 | ||||||||
| Israel Electric Corp. Ltd. (Israel)†(f) | 5.00% | 11/12/2024 | 244 | 266,189 | ||||||||
| Israel Electric Corp. Ltd. (Israel)†(f) | 6.875% | 6/21/2023 | 1,135 | 1,233,634 | ||||||||
| Jersey Central Power & Light Co.† | 4.70% | 4/1/2024 | 865 | 921,148 | ||||||||
| Monongahela Power Co.† | 4.10% | 4/15/2024 | 4,000 | 4,234,281 | ||||||||
| NextEra Energy Capital Holdings, Inc. | 0.43% (3 Mo. LIBOR + .27% | )# | 2/22/2023 | 9,600 | 9,587,027 | |||||||
| Niagara Mohawk Power Corp.† | 3.508% | 10/1/2024 | 2,337 | 2,456,813 | ||||||||
| NRG Energy, Inc.† | 3.75% | 6/15/2024 | 4,197 | 4,385,620 | ||||||||
| OGE Energy Corp. | 0.703% | 5/26/2023 | 2,295 | 2,283,839 | ||||||||
| Pacific Gas and Electric Co. | 1.367% | 3/10/2023 | 4,016 | 3,994,785 | ||||||||
| Pacific Gas and Electric Co. | 3.15% | 1/1/2026 | 4,375 | 4,486,516 | ||||||||
| Pacific Gas and Electric Co. | 3.25% | 6/15/2023 | 1,352 | 1,378,229 | ||||||||
| Pacific Gas and Electric Co. | 3.75% | 2/15/2024 | 1,742 | 1,804,464 | ||||||||
| Puget Energy, Inc. | 3.65% | 5/15/2025 | 4,587 | 4,862,031 | ||||||||
| Puget Energy, Inc. | 5.625% | 7/15/2022 | 703 | 716,116 | ||||||||
| San Diego Gas & Electric Co. | 1.914% | 2/1/2022 | 39 | 38,866 | ||||||||
| Sempra Energy | 4.05% | 12/1/2023 | 465 | 492,641 | ||||||||
| Trans-Allegheny Interstate Line Co.† | 3.85% | 6/1/2025 | 2,520 | 2,677,982 | ||||||||
| TransAlta Corp. (Canada)(f) | 4.50% | 11/15/2022 | 1,861 | 1,890,032 | ||||||||
| Vistra Operations Co. LLC† | 3.55% | 7/15/2024 | 3,863 | 4,006,656 | ||||||||
| Total | 103,768,634 | |||||||||||
| Electronics 0.09% | ||||||||||||
| Flex Ltd. | 3.75% | 2/1/2026 | 3,209 | 3,430,716 | ||||||||
| Energy-Alternate Sources 0.05% | ||||||||||||
| Enviva Partners LP/Enviva Partners Finance Corp.† | 6.50% | 1/15/2026 | 472 | 487,755 | ||||||||
| Greenko Dutch BV (Netherlands)†(f) | 3.85% | 3/29/2026 | 609 | 615,700 | ||||||||
| Greenko Mauritius Ltd. (India)†(f) | 6.25% | 2/21/2023 | 695 | 710,645 | ||||||||
| Total | 1,814,100 | |||||||||||
| Engineering & Construction 0.02% | ||||||||||||
| Fluor Corp. | 3.50% | 12/15/2024 | 877 | 900,175 | ||||||||
| Entertainment 0.41% | ||||||||||||
| Caesars Entertainment, Inc.† | 6.25% | 7/1/2025 | 838 | 872,266 | ||||||||
| Caesars Entertainment, Inc.† | 8.125% | 7/1/2027 | 4,535 | 4,982,038 | ||||||||
| Caesars Resort Collection LLC/CRC Finco, Inc.† | 5.75% | 7/1/2025 | 135 | 140,391 | ||||||||
| International Game Technology plc† | 4.125% | 4/15/2026 | 1,729 | 1,762,482 | ||||||||
| 252 | See Notes to Financial Statements. |
Schedule of Investments (continued)
INFLATION FOCUSED FUND November 30, 2021
| Investments | Interest Rate | Maturity Date | Principal Amount (000) | Fair Value | ||||||||
| Entertainment (continued) | ||||||||||||
| International Game Technology plc† | 6.50% | 2/15/2025 | $ | 404 | $ | 438,855 | ||||||
| Live Nation Entertainment, Inc.† | 4.875% | 11/1/2024 | 3,644 | 3,672,733 | ||||||||
| Scientific Games International, Inc.† | 8.625% | 7/1/2025 | 2,552 | 2,719,679 | ||||||||
| Vail Resorts, Inc.† | 6.25% | 5/15/2025 | 775 | 811,495 | ||||||||
| Total | 15,399,939 | |||||||||||
| Food 0.25% | ||||||||||||
| Chobani LLC/Chobani Finance Corp., Inc.† | 7.50% | 4/15/2025 | 2,407 | 2,492,473 | ||||||||
| FAGE International SA/FAGE USA Dairy Industry, Inc. (Luxembourg)†(f) | 5.625% | 8/15/2026 | 1,461 | 1,491,170 | ||||||||
| Fresh Market, Inc. (The)† | 9.75% | 5/1/2023 | 474 | 487,023 | ||||||||
| JBS USA LUX SA/JBS USA Finance, Inc.† | 6.75% | 2/15/2028 | 1,947 | 2,102,244 | ||||||||
| Pilgrim’s Pride Corp.† | 5.875% | 9/30/2027 | 2,237 | 2,351,780 | ||||||||
| US Foods, Inc.† | 6.25% | 4/15/2025 | 485 | 505,724 | ||||||||
| Total | 9,430,414 | |||||||||||
| Food Service 0.07% | ||||||||||||
| Aramark Services, Inc.† | 5.00% | 4/1/2025 | 2,413 | 2,447,759 | ||||||||
| Forest Products & Paper 0.05% | ||||||||||||
| Suzano Austria GmbH (Brazil)†(f) | 5.75% | 7/14/2026 | 984 | 1,110,060 | ||||||||
| West Fraser Timber Co., Ltd. (Canada)†(f) | 4.35% | 10/15/2024 | 871 | 933,676 | ||||||||
| Total | 2,043,736 | |||||||||||
| Gas 1.07% | ||||||||||||
| Atmos Energy Corp. | 0.496% (3 Mo. LIBOR + .38% | )# | 3/9/2023 | 3,053 | 3,053,234 | |||||||
| Atmos Energy Corp. | 0.625% | 3/9/2023 | 10,302 | 10,284,344 | ||||||||
| CenterPoint Energy Resources Corp. | 0.673% (3 Mo. LIBOR + .50% | )# | 3/2/2023 | 2,804 | 2,800,405 | |||||||
| Centrica PLC (United Kingdom)†(f) | 4.00% | 10/16/2023 | 2,450 | 2,557,690 | ||||||||
| National Fuel Gas Co. | 3.75% | 3/1/2023 | 2,802 | 2,877,199 | ||||||||
| National Fuel Gas Co. | 5.50% | 1/15/2026 | 1,183 | 1,341,333 | ||||||||
| ONE Gas, Inc. | 0.724% (3 Mo. LIBOR + .61% | )# | 3/11/2023 | 3,551 | 3,551,099 | |||||||
| ONE Gas, Inc. | 0.85% | 3/11/2023 | 7,323 | 7,313,758 | ||||||||
| ONE Gas, Inc. | 1.10% | 3/11/2024 | 6,389 | 6,301,247 | ||||||||
| Total | 40,080,309 | |||||||||||
| Health Care-Services 0.67% | ||||||||||||
| Centene Corp. | 4.25% | 12/15/2027 | 5,948 | 6,178,217 | ||||||||
| Fresenius Medical Care US Finance II, Inc.† | 5.875% | 1/31/2022 | 3,051 | 3,075,527 | ||||||||
| See Notes to Financial Statements. | 253 |
Schedule of Investments (continued)
INFLATION FOCUSED FUND November 30, 2021
| Investments | Interest Rate | Maturity Date | Principal Amount (000) | Fair Value | ||||||||
| Health Care-Services (continued) | ||||||||||||
| Fresenius Medical Care US Finance III, Inc.† | 1.875% | 12/1/2026 | $ | 872 | $ | 863,236 | ||||||
| HCA, Inc. | 5.00% | 3/15/2024 | 2,724 | 2,940,441 | ||||||||
| HCA, Inc. | 5.25% | 4/15/2025 | 3,416 | 3,800,043 | ||||||||
| HCA, Inc. | 5.375% | 2/1/2025 | 2,391 | 2,610,972 | ||||||||
| HCA, Inc. | 8.36% | 4/15/2024 | 275 | 315,653 | ||||||||
| Humana, Inc. | 0.65% | 8/3/2023 | 904 | 899,506 | ||||||||
| Legacy LifePoint Health LLC† | 6.75% | 4/15/2025 | 1,997 | 2,078,548 | ||||||||
| Select Medical Corp.† | 6.25% | 8/15/2026 | 2,158 | 2,268,500 | ||||||||
| Total | 25,030,643 | |||||||||||
| Holding Companies-Diversified 0.01% | ||||||||||||
| KOC Holding AS (Turkey)†(f) | 5.25% | 3/15/2023 | 212 | 214,216 | ||||||||
| Home Builders 0.40% | ||||||||||||
| Lennar Corp. | 4.50% | 4/30/2024 | 1,610 | 1,719,625 | ||||||||
| Lennar Corp. | 4.75% | 11/15/2022 | 813 | 836,191 | ||||||||
| Lennar Corp. | 4.75% | 5/30/2025 | 2,574 | 2,828,749 | ||||||||
| Lennar Corp. | 4.875% | 12/15/2023 | 66 | 70,303 | ||||||||
| Lennar Corp. | 5.875% | 11/15/2024 | 4,800 | 5,334,888 | ||||||||
| Toll Brothers Finance Corp. | 4.375% | 4/15/2023 | 615 | 637,786 | ||||||||
| Toll Brothers Finance Corp. | 4.875% | 11/15/2025 | 3,067 | 3,364,621 | ||||||||
| Total | 14,792,163 | |||||||||||
| Housewares 0.03% | ||||||||||||
| Newell Brands, Inc. | 4.35% | 4/1/2023 | 926 | 960,318 | ||||||||
| Insurance 0.40% | ||||||||||||
| Aon Corp. | 8.205% | 1/1/2027 | 1,183 | 1,507,022 | ||||||||
| Assurant, Inc. | 4.20% | 9/27/2023 | 830 | 876,126 | ||||||||
| CNO Financial Group, Inc. | 5.25% | 5/30/2025 | 2,103 | 2,346,026 | ||||||||
| CNO Global Funding † | 1.75% | 10/7/2026 | 1,313 | 1,302,174 | ||||||||
| F&G Global Funding† | 0.90% | 9/20/2024 | 1,368 | 1,350,789 | ||||||||
| F&G Global Funding† | 1.75% | 6/30/2026 | 1,080 | 1,077,175 | ||||||||
| GA Global Funding Trust† | 0.80% | 9/13/2024 | 1,032 | 1,016,884 | ||||||||
| Kemper Corp. | 4.35% | 2/15/2025 | 2,101 | 2,255,367 | ||||||||
| Peachtree Corners Funding Trust† | 3.976% | 2/15/2025 | 442 | 475,692 | ||||||||
| USI, Inc.† | 6.875% | 5/1/2025 | 2,834 | 2,847,079 | ||||||||
| Total | 15,054,334 | |||||||||||
| Internet 0.82% | ||||||||||||
| Baidu, Inc. (China)(f) | 3.075% | 4/7/2025 | 200 | 208,558 | ||||||||
| 254 | See Notes to Financial Statements. |
Schedule of Investments (continued)
INFLATION FOCUSED FUND November 30, 2021
| Investments | Interest Rate | Maturity Date | Principal Amount (000) | Fair Value | ||||||||
| Internet (continued) | ||||||||||||
| Baidu, Inc. (China)(f) | 3.875% | 9/29/2023 | $ | 2,248 | $ | 2,357,722 | ||||||
| Baidu, Inc. (China)(f) | 4.375% | 5/14/2024 | 3,200 | 3,429,959 | ||||||||
| Expedia Group, Inc.† | 6.25% | 5/1/2025 | 4,161 | 4,726,210 | ||||||||
| Netflix, Inc.† | 3.625% | 6/15/2025 | 1,025 | 1,082,410 | ||||||||
| Netflix, Inc. | 4.375% | 11/15/2026 | 2,347 | 2,590,302 | ||||||||
| Uber Technologies, Inc.† | 7.50% | 5/15/2025 | 5,262 | 5,550,989 | ||||||||
| Uber Technologies, Inc.† | 8.00% | 11/1/2026 | 739 | 787,789 | ||||||||
| VeriSign, Inc. | 4.75% | 7/15/2027 | 7,645 | 7,966,434 | ||||||||
| VeriSign, Inc. | 5.25% | 4/1/2025 | 646 | 715,232 | ||||||||
| Weibo Corp. (China)(f) | 3.50% | 7/5/2024 | 1,000 | 1,030,749 | ||||||||
| Total | 30,446,354 | |||||||||||
| Iron-Steel 0.25% | ||||||||||||
| Baffinland Iron Mines Corp./Baffinland Iron Mines LP (Canada)†(f) | 8.75% | 7/15/2026 | 2,491 | 2,602,273 | ||||||||
| CSN Resources SA (Brazil)†(f) | 7.625% | 4/17/2026 | 2,899 | 3,000,117 | ||||||||
| POSCO (South Korea)†(f) | 2.375% | 11/12/2022 | 450 | 456,534 | ||||||||
| Steel Dynamics, Inc. | 5.00% | 12/15/2026 | 2,152 | 2,199,140 | ||||||||
| Vale Overseas Ltd. (Brazil)(f) | 6.25% | 8/10/2026 | 1,059 | 1,206,656 | ||||||||
| Total | 9,464,720 | |||||||||||
| Leisure Time 0.16% | ||||||||||||
| NCL Corp. Ltd.† | 5.875% | 3/15/2026 | 3,833 | 3,741,966 | ||||||||
| Royal Caribbean Cruises Ltd.† | 11.50% | 6/1/2025 | 1,851 | 2,069,104 | ||||||||
| Total | 5,811,070 | |||||||||||
| Lodging 0.36% | ||||||||||||
| Hyatt Hotels Corp. | 1.30% | 10/1/2023 | 3,682 | 3,684,258 | ||||||||
| Hyatt Hotels Corp. | 1.80% | 10/1/2024 | 3,213 | 3,216,398 | ||||||||
| MGM Resorts International | 5.75% | 6/15/2025 | 2,573 | 2,720,600 | ||||||||
| MGM Resorts International | 6.75% | 5/1/2025 | 550 | 573,933 | ||||||||
| Travel + Leisure Co. | 6.60% | 10/1/2025 | 550 | 600,696 | ||||||||
| Wynn Las Vegas LLC/Wynn Las Vegas Capital Corp.† | 4.25% | 5/30/2023 | 965 | 967,065 | ||||||||
| Wynn Las Vegas LLC/Wynn Las Vegas Capital Corp.† | 5.50% | 3/1/2025 | 1,669 | 1,674,626 | ||||||||
| Total | 13,437,576 | |||||||||||
| Machinery-Diversified 0.28% | ||||||||||||
| CNH Industrial NV (United Kingdom)(f) | 4.50% | 8/15/2023 | 767 | 809,619 | ||||||||
| Granite US Holdings Corp.† | 11.00% | 10/1/2027 | 2,910 | 3,169,601 | ||||||||
| Nvent Finance S.a.r.l. (Luxembourg)(f) | 3.95% | 4/15/2023 | 1,308 | 1,362,419 | ||||||||
| Wabtec Corp. | 4.375% | 8/15/2023 | 1,937 | 2,023,367 | ||||||||
| See Notes to Financial Statements. | 255 |
Schedule of Investments (continued)
INFLATION FOCUSED FUND November 30, 2021
| Investments | Interest Rate | Maturity Date | Principal Amount (000) | Fair Value | ||||||||
| Machinery-Diversified (continued) | ||||||||||||
| Westinghouse Air Brake Technologies Corp. | 3.20% | 6/15/2025 | $ | 113 | $ | 118,570 | ||||||
| Westinghouse Air Brake Technologies Corp. | 4.40% | 3/15/2024 | 2,724 | 2,901,368 | ||||||||
| Total | 10,384,944 | |||||||||||
| Media 0.45% | ||||||||||||
| CCO Holdings LLC/CCO Holdings Capital Corp.† | 5.125% | 5/1/2027 | 482 | 496,942 | ||||||||
| CCO Holdings LLC/CCO Holdings Capital Corp.† | 5.50% | 5/1/2026 | 47 | 48,581 | ||||||||
| DISH DBS Corp. | 5.875% | 7/15/2022 | 5,149 | 5,219,258 | ||||||||
| iHeartCommunications, Inc. | 6.375% | 5/1/2026 | 440 | 456,265 | ||||||||
| Nexstar Media, Inc.† | 5.625% | 7/15/2027 | 5,189 | 5,389,762 | ||||||||
| Univision Communications, Inc.† | 5.125% | 2/15/2025 | 2,802 | 2,845,291 | ||||||||
| Ziggo BV (Netherlands)†(f) | 5.50% | 1/15/2027 | 2,282 | 2,352,377 | ||||||||
| Total | 16,808,476 | |||||||||||
| Mining 1.51% | ||||||||||||
| Alcoa Nederland Holding BV (Netherlands)†(f) | 5.50% | 12/15/2027 | 3,757 | 3,994,743 | ||||||||
| Alcoa Nederland Holding BV (Netherlands)†(f) | 6.125% | 5/15/2028 | 1,013 | 1,080,344 | ||||||||
| Anglo American Capital plc (United Kingdom)†(f) | 3.625% | 9/11/2024 | 4,500 | 4,750,034 | ||||||||
| Anglo American Capital plc (United Kingdom)†(f) | 4.125% | 9/27/2022 | 2,113 | 2,168,388 | ||||||||
| Anglo American Capital plc (United Kingdom)†(f) | 4.875% | 5/14/2025 | 1,542 | 1,698,817 | ||||||||
| First Quantum Minerals Ltd. (Canada)†(f) | 7.25% | 4/1/2023 | 5,450 | 5,559,082 | ||||||||
| First Quantum Minerals Ltd. (Zambia)†(f) | 7.50% | 4/1/2025 | 293 | 301,371 | ||||||||
| FMG Resources August 2006 Pty Ltd. (Australia)†(f) | 5.125% | 5/15/2024 | 2,501 | 2,639,843 | ||||||||
| Freeport-McMoRan, Inc. | 3.875% | 3/15/2023 | 117 | 120,531 | ||||||||
| Freeport-McMoRan, Inc. | 4.55% | 11/14/2024 | 858 | 919,287 | ||||||||
| Glencore Finance Canada Ltd. (Canada)†(f) | 4.25% | 10/25/2022 | 2,600 | 2,681,276 | ||||||||
| Glencore Funding LLC† | 1.625% | 4/27/2026 | 670 | 658,465 | ||||||||
| Glencore Funding LLC† | 4.00% | 4/16/2025 | 1,567 | 1,673,055 | ||||||||
| Glencore Funding LLC† | 4.00% | 3/27/2027 | 3,214 | 3,463,615 | ||||||||
| Glencore Funding LLC† | 4.125% | 5/30/2023 | 4,134 | 4,323,245 | ||||||||
| Glencore Funding LLC† | 4.125% | 3/12/2024 | 4,797 | 5,065,761 | ||||||||
| Glencore Funding LLC† | 4.625% | 4/29/2024 | 10,553 | 11,293,859 | ||||||||
| Kinross Gold Corp. (Canada)(f) | 5.95% | 3/15/2024 | 1,044 | 1,138,774 | ||||||||
| Novelis Corp.† | 3.25% | 11/15/2026 | 2,714 | 2,715,764 | ||||||||
| Total | 56,246,254 | |||||||||||
| Miscellaneous Manufacturing 0.01% | ||||||||||||
| Gates Global LLC/Gates Corp.† | 6.25% | 1/15/2026 | 270 | 277,274 | ||||||||
| 256 | See Notes to Financial Statements. |
Schedule of Investments (continued)
INFLATION FOCUSED FUND November 30, 2021
| Investments | Interest Rate | Maturity Date | Principal Amount (000) | Fair Value | ||||||||
| Oil & Gas 4.68% | ||||||||||||
| Callon Petroleum Co. | 6.125% | 10/1/2024 | $ | 1,000 | $ | 964,590 | ||||||
| Cenovus Energy, Inc. (Canada)(f) | 5.375% | 7/15/2025 | 2,194 | 2,439,164 | ||||||||
| Comstock Resources, Inc.† | 7.50% | 5/15/2025 | 4,534 | 4,660,453 | ||||||||
| Continental Resources, Inc.† | 2.268% | 11/15/2026 | 2,035 | 2,013,012 | ||||||||
| Continental Resources, Inc. | 3.80% | 6/1/2024 | 7,037 | 7,344,165 | ||||||||
| Continental Resources, Inc. | 4.50% | 4/15/2023 | 2,153 | 2,226,008 | ||||||||
| Coterra Energy, Inc.† | 4.375% | 6/1/2024 | 1,878 | 1,997,096 | ||||||||
| CrownRock LP/CrownRock Finance, Inc.† | 5.625% | 10/15/2025 | 7,239 | 7,281,710 | ||||||||
| Devon Energy Corp.† | 5.25% | 9/15/2024 | 2,711 | 2,942,800 | ||||||||
| Devon Energy Corp.† | 5.25% | 10/15/2027 | 5,729 | 6,056,995 | ||||||||
| Devon Energy Corp.† | 5.875% | 6/15/2028 | 2,055 | 2,242,474 | ||||||||
| Devon Energy Corp.† | 8.25% | 8/1/2023 | 5,532 | 6,090,233 | ||||||||
| Diamondback Energy, Inc. | 2.875% | 12/1/2024 | 4,016 | 4,168,761 | ||||||||
| Diamondback Energy, Inc. | 4.75% | 5/31/2025 | 321 | 351,952 | ||||||||
| Endeavor Energy Resources LP/EER Finance, Inc.† | 6.625% | 7/15/2025 | 3,389 | 3,566,465 | ||||||||
| Eni SpA (Italy)†(f) | 4.00% | 9/12/2023 | 660 | 692,563 | ||||||||
| EQT Corp.† | 3.125% | 5/15/2026 | 486 | 486,452 | ||||||||
| EQT Corp. | 6.625% | 2/1/2025 | 1,980 | 2,212,541 | ||||||||
| Gazprom PJSC Via Gaz Capital SA (Luxembourg)†(f) | 6.51% | 3/7/2022 | 7,397 | 7,507,422 | ||||||||
| Hess Corp. | 3.50% | 7/15/2024 | 1,046 | 1,094,269 | ||||||||
| Laredo Petroleum, Inc. | 9.50% | 1/15/2025 | 3,016 | 3,007,118 | ||||||||
| Lukoil Capital DAC (Ireland)†(f) | 2.80% | 4/26/2027 | 1,200 | 1,187,728 | ||||||||
| Lukoil International Finance BV (Netherlands)†(f) | 4.563% | 4/24/2023 | 3,000 | 3,117,735 | ||||||||
| Lundin Energy Finance BV (Netherlands)†(f) | 2.00% | 7/15/2026 | 6,429 | 6,391,989 | ||||||||
| Magnolia Oil & Gas Operating LLC/Magnolia Oil & Gas Finance Corp.† | 6.00% | 8/1/2026 | 1,750 | 1,793,312 | ||||||||
| Matador Resources Co. | 5.875% | 9/15/2026 | 6,321 | 6,419,285 | ||||||||
| MEG Energy Corp. (Canada)†(f) | 6.50% | 1/15/2025 | 6,742 | 6,833,051 | ||||||||
| Murphy Oil Corp. | 6.875% | 8/15/2024 | 350 | 354,863 | ||||||||
| Newfield Exploration Co. | 5.625% | 7/1/2024 | 554 | 603,100 | ||||||||
| Occidental Petroleum Corp. | 2.90% | 8/15/2024 | 1,878 | 1,885,700 | ||||||||
| Occidental Petroleum Corp. | 5.55% | 3/15/2026 | 4,646 | 4,977,260 | ||||||||
| Occidental Petroleum Corp. | 6.95% | 7/1/2024 | 3,243 | 3,574,791 | ||||||||
| OGX Austria GmbH (Brazil)†(f)(g) | 8.50% | 6/1/2018 | 225 | 4 | ||||||||
| Parsley Energy LLC/Parsley Finance Corp.† | 4.125% | 2/15/2028 | 1,930 | 1,976,465 | ||||||||
| Parsley Energy LLC/Parsley Finance Corp.† | 5.625% | 10/15/2027 | 3,081 | 3,232,601 | ||||||||
| PDC Energy, Inc. | 5.75% | 5/15/2026 | 3,443 | 3,483,903 | ||||||||
| PDC Energy, Inc. | 6.125% | 9/15/2024 | 241 | 243,456 | ||||||||
| See Notes to Financial Statements. | 257 |
Schedule of Investments (continued)
INFLATION FOCUSED FUND November 30, 2021
| Investments | Interest Rate | Maturity Date | Principal Amount (000) | Fair Value | ||||||||
| Oil & Gas (continued) | ||||||||||||
| Petroleos Mexicanos (Mexico)(f) | 3.764% (3 Mo. LIBOR + 3.65% | )# | 3/11/2022 | $ | 2,776 | $ | 2,774,473 | |||||
| Petroleos Mexicanos (Mexico)(f) | 4.25% | 1/15/2025 | 1,650 | 1,643,672 | ||||||||
| Petroleos Mexicanos (Mexico)(f) | 5.375% | 3/13/2022 | 1,827 | 1,839,442 | ||||||||
| Petroleos Mexicanos (Mexico)†(f) | 6.875% | 10/16/2025 | 974 | 1,040,967 | ||||||||
| Petroleos Mexicanos (Mexico)(f) | 6.875% | 8/4/2026 | 3,301 | 3,506,784 | ||||||||
| PT Pertamina Persero (Indonesia)†(f) | 4.875% | 5/3/2022 | 2,000 | 2,032,089 | ||||||||
| Range Resources Corp. | 9.25% | 2/1/2026 | 5,697 | 6,127,893 | ||||||||
| Reliance Industries Ltd. (India)†(f) | 5.40% | 2/14/2022 | 1,350 | 1,361,736 | ||||||||
| Rosneft Oil Co. Via Rosneft International Finance DAC (Ireland)†(f) | 4.199% | 3/6/2022 | 11,950 | 12,024,843 | ||||||||
| Saudi Arabian Oil Co. (South Africa)†(f) | 2.875% | 4/16/2024 | 425 | 440,064 | ||||||||
| SM Energy Co.† | 10.00% | 1/15/2025 | 3,100 | 3,395,879 | ||||||||
| Suncor Energy Ventures Corp. (Canada)†(f) | 4.50% | 4/1/2022 | 12,375 | 12,415,613 | ||||||||
| Suncor Energy, Inc. (Canada)(f) | 7.875% | 6/15/2026 | 1,213 | 1,491,958 | ||||||||
| Tengizchevroil Finance Co. International Ltd. (Kazakhstan)†(f) | 2.625% | 8/15/2025 | 3,500 | 3,527,125 | ||||||||
| Valero Energy Corp. | 2.85% | 4/15/2025 | 2,000 | 2,076,660 | ||||||||
| Viper Energy Partners LP† | 5.375% | 11/1/2027 | 3,480 | 3,591,934 | ||||||||
| Total | 174,712,618 | |||||||||||
| Oil & Gas Services 0.06% | ||||||||||||
| Oceaneering International, Inc. | 4.65% | 11/15/2024 | 2,076 | 2,111,271 | ||||||||
| Pharmaceuticals 0.35% | ||||||||||||
| Bayer US Finance II LLC† | 1.126% (3 Mo. LIBOR + 1.01% | )# | 12/15/2023 | 1,325 | 1,337,914 | |||||||
| Bayer US Finance II LLC† | 3.375% | 7/15/2024 | 3,000 | 3,129,756 | ||||||||
| Bayer US Finance II LLC† | 3.875% | 12/15/2023 | 4,207 | 4,420,378 | ||||||||
| Bayer US Finance II LLC† | 4.25% | 12/15/2025 | 3,750 | 4,084,740 | ||||||||
| Total | 12,972,788 | |||||||||||
| Pipelines 1.71% | ||||||||||||
| Cheniere Corpus Christi Holdings LLC | 5.875% | 3/31/2025 | 10,180 | 11,345,906 | ||||||||
| Cheniere Corpus Christi Holdings LLC | 7.00% | 6/30/2024 | 3,102 | 3,448,421 | ||||||||
| Energy Transfer Operating LP | 4.25% | 3/15/2023 | 2,187 | 2,258,620 | ||||||||
| Energy Transfer Operating LP | 5.875% | 1/15/2024 | 1,193 | 1,286,262 | ||||||||
| Florida Gas Transmission Co. LLC† | 3.875% | 7/15/2022 | 10,740 | 10,869,542 | ||||||||
| MPLX LP | 4.875% | 12/1/2024 | 2,387 | 2,596,427 | ||||||||
| NOVA Gas Transmission Ltd. (Canada)(f) | 7.875% | 4/1/2023 | 500 | 543,988 | ||||||||
| ONEOK, Inc. | 7.50% | 9/1/2023 | 672 | 735,344 | ||||||||
| 258 | See Notes to Financial Statements. |
Schedule of Investments (continued)
INFLATION FOCUSED FUND November 30, 2021
| Investments | Interest Rate | Maturity Date | Principal Amount (000) | Fair Value | ||||||||
| Pipelines (continued) | ||||||||||||
| Plains All American Pipeline LP / PAA Finance Corp. | 3.85% | 10/15/2023 | $ | 2,036 | $ | 2,119,726 | ||||||
| Plains All American Pipeline LP/PAA Finance Corp. | 4.50% | 12/15/2026 | 2,500 | 2,735,235 | ||||||||
| Plains All American Pipeline LP/PAA Finance Corp. | 4.65% | 10/15/2025 | 3,900 | 4,258,880 | ||||||||
| Sabine Pass Liquefaction LLC | 5.625% | 4/15/2023 | 5,665 | 5,956,440 | ||||||||
| Sabine Pass Liquefaction LLC | 5.75% | 5/15/2024 | 3,694 | 4,036,174 | ||||||||
| Sabine Pass Liquefaction LLC | 5.875% | 6/30/2026 | 8,000 | 9,205,340 | ||||||||
| Texas Eastern Transmission LP† | 2.80% | 10/15/2022 | 223 | 225,523 | ||||||||
| Western Midstream Operating LP | 2.222% (3 Mo. LIBOR + 2.10% | )# | 1/13/2023 | 493 | 490,517 | |||||||
| Western Midstream Operating LP | 3.95% | 6/1/2025 | 1,800 | 1,864,710 | ||||||||
| Total | 63,977,055 | |||||||||||
| REITS 1.34% | ||||||||||||
| American Campus Communities Operating Partnership LP | 3.30% | 7/15/2026 | 2,785 | 2,966,495 | ||||||||
| Brixmor Operating Partnership LP | 3.65% | 6/15/2024 | 424 | 447,244 | ||||||||
| CyrusOne LP/CyrusOne Finance Corp. | 2.90% | 11/15/2024 | 2,150 | 2,234,108 | ||||||||
| EPR Properties | 4.50% | 4/1/2025 | 1,620 | 1,733,170 | ||||||||
| EPR Properties | 4.50% | 6/1/2027 | 5,750 | 6,146,483 | ||||||||
| EPR Properties | 4.75% | 12/15/2026 | 4,125 | 4,454,532 | ||||||||
| GLP Capital LP/GLP Financing II, Inc. | 5.25% | 6/1/2025 | 1,275 | 1,404,559 | ||||||||
| HAT Holdings I LLC/HAT Holdings II LLC† | 3.375% | 6/15/2026 | 2,299 | 2,266,308 | ||||||||
| HAT Holdings I LLC/HAT Holdings II LLC† | 6.00% | 4/15/2025 | 1,207 | 1,251,575 | ||||||||
| iStar, Inc. | 5.50% | 2/15/2026 | 4,428 | 4,577,733 | ||||||||
| Ladder Capital Finance Holdings LLLP/Ladder Capital Finance Corp.† | 5.25% | 10/1/2025 | 1,345 | 1,354,751 | ||||||||
| MPT Operating Partnership LP/MPT Finance Corp. | 5.00% | 10/15/2027 | 7,000 | 7,315,805 | ||||||||
| Park Intermediate Holdings LLC/PK Domestic Property LLC/PK Finance Co-Issuer† | 7.50% | 6/1/2025 | 1,416 | 1,489,533 | ||||||||
| SL Green Realty Corp. | 4.50% | 12/1/2022 | 1,530 | 1,566,756 | ||||||||
| Vornado Realty LP | 2.15% | 6/1/2026 | 1,350 | 1,355,985 | ||||||||
| Vornado Realty LP | 3.50% | 1/15/2025 | 3,565 | 3,740,824 | ||||||||
| WEA Finance LLC/Westfield UK & Europe Finance plc† | 3.75% | 9/17/2024 | 5,314 | 5,600,351 | ||||||||
| Total | 49,906,212 | |||||||||||
| Retail 0.22% | ||||||||||||
| Arcos Dorados Holdings, Inc. (Uruguay)†(f) | 5.875% | 4/4/2027 | 300 | 309,877 | ||||||||
| Arcos Dorados Holdings, Inc. (Uruguay)†(f) | 6.625% | 9/27/2023 | 2,640 | 2,800,499 | ||||||||
| Bath & Body Works, Inc.† | 9.375% | 7/1/2025 | 443 | 538,759 | ||||||||
| See Notes to Financial Statements. | 259 |
Schedule of Investments (continued)
INFLATION FOCUSED FUND November 30, 2021
| Investments | Interest Rate | Maturity Date | Principal Amount (000) | Fair Value | ||||||||
| Retail (continued) | ||||||||||||
| Brinker International, Inc.† | 5.00% | 10/1/2024 | $ | 1,574 | $ | 1,659,602 | ||||||
| Carvana Co.† | 5.625% | 10/1/2025 | 2,589 | 2,596,301 | ||||||||
| IRB Holding Corp.† | 6.75% | 2/15/2026 | 466 | 473,922 | ||||||||
| Total | 8,378,960 | |||||||||||
| Savings & Loans 0.09% | ||||||||||||
| People’s United Financial, Inc. | 3.65% | 12/6/2022 | 3,276 | 3,348,451 | ||||||||
| Semiconductors 0.42% | ||||||||||||
| Microchip Technology, Inc.† | 0.972% | 2/15/2024 | 5,640 | 5,589,889 | ||||||||
| Microchip Technology, Inc. | 2.67% | 9/1/2023 | 1,525 | 1,565,289 | ||||||||
| Microchip Technology, Inc. | 4.25% | 9/1/2025 | 579 | 601,509 | ||||||||
| Microchip Technology, Inc. | 4.333% | 6/1/2023 | 4,111 | 4,305,602 | ||||||||
| SK Hynix, Inc. (South Korea)†(f) | 1.00% | 1/19/2024 | 3,090 | 3,067,979 | ||||||||
| SK Hynix, Inc. (South Korea)†(f) | 1.50% | 1/19/2026 | 716 | 704,116 | ||||||||
| Total | 15,834,384 | |||||||||||
| Software 0.16% | ||||||||||||
| Ascend Learning LLC† | 6.875% | 8/1/2025 | 3,677 | 3,748,536 | ||||||||
| Boxer Parent Co., Inc.† | 9.125% | 3/1/2026 | 708 | 740,773 | ||||||||
| VMware, Inc. | 2.95% | 8/21/2022 | 1,652 | 1,675,518 | ||||||||
| Total | 6,164,827 | |||||||||||
| Telecommunications 0.17% | ||||||||||||
| Altice France SA (France)†(f) | 8.125% | 2/1/2027 | 6,033 | 6,441,525 | ||||||||
| Toys/Games/Hobbies 0.05% | ||||||||||||
| Hasbro, Inc. | 3.00% | 11/19/2024 | 188 | 196,533 | ||||||||
| Mattel, Inc. | 3.15% | 3/15/2023 | 1,250 | 1,258,550 | ||||||||
| Mattel, Inc.† | 3.375% | 4/1/2026 | 341 | 346,777 | ||||||||
| Total | 1,801,860 | |||||||||||
| Transportation 0.12% | ||||||||||||
| Indian Railway Finance Corp. Ltd. (India)(f) | 3.73% | 3/29/2024 | 568 | 595,204 | ||||||||
| Pelabuhan Indonesia III Persero PT (Indonesia)†(f) | 4.50% | 5/2/2023 | 1,220 | 1,274,192 | ||||||||
| Rumo Luxembourg S.a.r.l. (Luxembourg)†(f) | 5.875% | 1/18/2025 | 1,772 | 1,818,462 | ||||||||
| XPO Logistics, Inc.† | 6.25% | 5/1/2025 | 750 | 780,840 | ||||||||
| Total | 4,468,698 | |||||||||||
| Trucking & Leasing 0.01% | ||||||||||||
| Fortress Transportation and Infrastructure Investors LLC† | 6.50% | 10/1/2025 | 512 | 522,880 | ||||||||
| 260 | See Notes to Financial Statements. |
Schedule of Investments (continued)
INFLATION FOCUSED FUND November 30, 2021
| Investments | Interest Rate | Maturity Date | Principal Amount (000) | Fair Value | ||||||||
| Water 0.08% | ||||||||||||
| Aquarion Co.† | 4.00% | 8/15/2024 | $ | 2,955 | $ | 3,138,615 | ||||||
| Total Corporate Bonds (cost $1,593,366,916) | 1,588,172,289 | |||||||||||
| FLOATING RATE LOANS(h) 6.49% | ||||||||||||
| Advertising 0.06% | ||||||||||||
| ABG Intermediate Holdings 2 LLC 2021 Term Loan B | 4.00% (3 Mo. LIBOR + 3.25% | ) | 9/27/2024 | 2,421 | 2,415,971 | |||||||
| Air Transportation 0.04% | ||||||||||||
| AAdvantage Loyalty IP Ltd. 2021 Term Loan | 5.50% (3 Mo. LIBOR + 4.75% | ) | 4/20/2028 | 820 | 844,410 | |||||||
| American Airlines, Inc. 2017 Incremental Term Loan | 2.089% (1 Mo. LIBOR + 2.00% | ) | 12/15/2023 | 282 | 275,570 | |||||||
| American Airlines, Inc. 2018 Term Loan B | 1.842% (1 Mo. LIBOR + 1.75% | ) | 6/27/2025 | 379 | 358,235 | |||||||
| Total | 1,478,215 | |||||||||||
| Automotive 0.03% | ||||||||||||
| Ford Motor Company Unsecured Term Loan | 1.85% (1 Mo. LIBOR + 1.75% | ) | 12/31/2022 | 1,194 | 1,185,198 | |||||||
| Building Materials 0.01% | ||||||||||||
| Forterra Finance, LLC 2017 Term Loan B | 4.00% (1 Mo. LIBOR + 3.00% | ) | 10/25/2023 | 367 | 367,227 | |||||||
| Business Services 0.33% | ||||||||||||
| APi Group DE, Inc. 2021 Incremental Term Loan B | – | (i) | 10/7/2028 | 874 | 871,265 | |||||||
| Global Payments, Inc. 2019 Term Loan | 1.467% (1 Mo. LIBOR + 1.38% | ) | 7/9/2024 | 2,495 | 2,488,612 | |||||||
| Syniverse Holdings, Inc. 2018 1st Lien Term Loan | 6.00% (3 Mo. LIBOR + 5.00% | ) | 3/9/2023 | 2,845 | 2,840,366 | |||||||
| Syniverse Holdings, Inc. 2018 2nd Lien Term Loan | – | (i) | 3/11/2024 | 1,920 | 1,922,553 | |||||||
| Trans Union, LLC 2019 Term Loan B5 | 1.84% (1 Mo. LIBOR + 1.75% | ) | 11/16/2026 | 4,084 | 4,030,817 | |||||||
| Total | 12,153,613 | |||||||||||
| Chemicals 0.21% | ||||||||||||
| Axalta Coating Systems US Holdings Inc. USD Term Loan B3 | 1.882% (3 Mo. LIBOR + 1.75% | ) | 6/1/2024 | 4,679 | �� | 4,666,544 | ||||||
| Nutrition & Biosciences, Inc. 3 Year Delayed Draw Term Loan | 1.395% (3 Mo. LIBOR + 1.25% | ) | 1/17/2023 | 496 | 495,379 | |||||||
| See Notes to Financial Statements. | 261 |
Schedule of Investments (continued)
INFLATION FOCUSED FUND November 30, 2021
| Investments | Interest Rate | Maturity Date | Principal Amount (000) | Fair Value | ||||||||
| Chemicals (continued) | ||||||||||||
| Nutrition & Biosciences, Inc. 5 Year Delayed Draw Term Loan | 1.749% (3 Mo. LIBOR + 1.625% | ) | 1/17/2025 | $ | 2,878 | $ | 2,876,084 | |||||
| Total | 8,038,007 | |||||||||||
| Computer Software 0.56% | ||||||||||||
| Applied Systems, Inc. 2017 1st Lien Term Loan | 3.75% (Prime Rate + 2.25% (3Mo. LIBOR + 3.25% | ) ) | 9/19/2024 | 3,940 | 3,932,861 | |||||||
| Athenahealth, Inc. 2021 Term Loan B1 | 4.339% (1 Mo. LIBOR + 4.25% (3 Mo. LIBOR + 4.25% | ) ) | 2/11/2026 | 2,729 | 2,729,938 | |||||||
| McAfee, LLC 2018 USD Term Loan B | – | (i) | 9/30/2024 | 4,909 | 4,908,800 | |||||||
| Vmware, Inc. 3 Year Term Loan | 1.05% (3 Mo. LIBOR + 8.75% | ) | 9/2/2024 | 9,514 | 9,505,420 | |||||||
| Total | 21,077,019 | |||||||||||
| Drugs 0.10% | ||||||||||||
| Change Healthcare Holdings LLC 2017 Term Loan B | 3.50% (1 Mo. LIBOR + 2.50% (3 Mo. LIBOR + 2.50% | ) ) | 3/1/2024 | 3,804 | 3,799,808 | |||||||
| Entertainment 0.24% | ||||||||||||
| Churchill Downs Incorporated 2017 Term Loan B | 2.10% (1 Mo. LIBOR + 2.00% | ) | 12/27/2024 | 995 | 990,485 | |||||||
| Scientific Games International, Inc. 2018 Term Loan B5 | 2.84% (1 Mo. LIBOR + 2.75% | ) | 8/14/2024 | 8,003 | 7,954,737 | |||||||
| Total | 8,945,222 | |||||||||||
| Environmental Services 0.05% | ||||||||||||
| Filtration Group Corporation 2018 1st Lien Term Loan | – | (i) | 3/29/2025 | 2,060 | 2,037,155 | |||||||
| Financial Services 0.28% | ||||||||||||
| Delos Finance Sarl 2018 Term Loan B (Luxembourg)(f) | 1.882% (3 Mo. LIBOR + 1.75% | ) | 10/6/2023 | 10,433 | 10,424,352 | |||||||
| Food 0.14% | ||||||||||||
| JBS USA Lux S.A. 2019 Term Loan B (Luxembourg)(f) | 2.092% (1 Mo. LIBOR + 2.00% | ) | 5/1/2026 | 5,071 | 5,053,121 | |||||||
| 262 | See Notes to Financial Statements. |
Schedule of Investments (continued)
INFLATION FOCUSED FUND November 30, 2021
| Investments | Interest Rate | Maturity Date | Principal Amount (000) | Fair Value | ||||||||
| Gaming 0.07% | ||||||||||||
| GLP Capital L.P. 2020 Term Loan A2 | 1.589% (1 Mo. LIBOR + 1.50% | ) | 5/21/2023 | $ | 2,495 | $ | 2,476,002 | (j) | ||||
| Government 0.11% | ||||||||||||
| Seminole Tribe of Florida 2018 Term Loan B | 1.84% (1 Mo. LIBOR + 1.75% | ) | 7/8/2024 | 4,178 | 4,170,988 | |||||||
| Health Care Services 0.71% | ||||||||||||
| DaVita, Inc. 2020 Term Loan B | 1.84% (1 Mo. LIBOR + 1.75% | ) | 8/12/2026 | 8,104 | 8,025,007 | |||||||
| Humana Inc. Delayed Draw Term Loan | 1.34% (1 Mo. LIBOR + 1.25% | ) | 5/28/2024 | 1,723 | 1,700,301 | (j) | ||||||
| Humana Inc. Term Loan | – | (i) | 10/30/2023 | 7,320 | 7,224,254 | (j) | ||||||
| PPD, Inc. Initial Term Loan | 2.50% (1 Mo. LIBOR + 2.00% | ) | 1/13/2028 | 9,726 | 9,716,250 | |||||||
| Total | 26,665,812 | |||||||||||
| Insurance 0.10% | ||||||||||||
| Asurion LLC 2018 Term Loan B6 | 3.215% (1 Mo. LIBOR + 3.13% | ) | 11/3/2023 | 3,716 | 3,706,589 | |||||||
| Leasing 0.17% | ||||||||||||
| Avolon TLB Borrower 1 (US) LLC Term Loan B3 | 2.50% (1 Mo. LIBOR + 1.75% | ) | 1/15/2025 | 6,538 | 6,520,058 | |||||||
| Leisure 0.10% | ||||||||||||
| Carnival Corporation USD Term Loan B (Panama)(f) | 3.75% (1 Mo. LIBOR + 3.00% | ) | 6/30/2025 | 2,771 | 2,738,927 | |||||||
| Life Time Fitness, Inc. 2021 Term Loan B | 5.75% (3 Mo. LIBOR + 4.75% | ) | 12/16/2024 | 962 | 970,639 | |||||||
| Total | 3,709,566 | |||||||||||
| Lodging 0.56% | ||||||||||||
| Boyd Gaming Corporation Term Loan B3 | 2.328% (1 Wk. LIBOR + 2.25% | ) | 9/15/2023 | 3,753 | 3,749,815 | |||||||
| Caesars Resort Collection, LLC 2017 1st Lien Term Loan B | 2.84% (1 Mo. LIBOR + 2.75% | ) | 12/23/2024 | 5,625 | 5,576,627 | |||||||
| Four Seasons Hotels Limited New 1st Lien Term Loan (Canada)(f) | 2.00% (1 Mo. LIBOR + 2.00% | ) | 11/30/2023 | 4,165 | 4,144,299 | |||||||
| Hilton Worldwide Finance, LLC 2019 Term Loan B2 | 1.842% (1 Mo. LIBOR + 1.75% | ) | 6/22/2026 | 7,375 | 7,281,183 | |||||||
| Total | 20,751,924 | |||||||||||
| See Notes to Financial Statements. | 263 |
Schedule of Investments (continued)
INFLATION FOCUSED FUND November 30, 2021
| Investments | Interest Rate | Maturity Date | Principal Amount (000) | Fair Value | ||||||||
| Machinery: Industrial/Specialty 0.20% | ||||||||||||
| Welbilt, Inc. 2018 Term Loan B | 2.59% (1 Mo. LIBOR + 2.50% | ) | 10/23/2025 | $ | 7,414 | $ | 7,386,936 | |||||
| Media 0.67% | ||||||||||||
| Gray Television, Inc. 2021 Second Lien Bridge Term Loan(k) | – | (i) | 8/12/2022 | 3,956 | 3,956,314 | (j) | ||||||
| Meredith Corporation 2020 Term Loan B2 | 4.75% | 1/31/2025 | 1,093 | 1,093,220 | ||||||||
| Nexstar Broadcasting, Inc. 2018 Term Loan A4 | 1.586% (1 Mo. LIBOR + 1.50% | ) | 10/26/2023 | 1,247 | 1,242,011 | |||||||
| Nexstar Broadcasting, Inc. 2018 Term Loan B3 | 2.34% (1 Mo. LIBOR + 2.25% | ) | 1/17/2024 | 5,195 | 5,180,181 | |||||||
| Nexstar Broadcasting, Inc. Term Loan A5 | 1.586% (1 Mo. LIBOR + 1.50% | ) | 9/19/2024 | 2,256 | 2,246,304 | |||||||
| Nielsen Finance LLC USD Term Loan B4 | 2.089% (1 Mo. LIBOR + 2.00% | ) | 10/4/2023 | 7,126 | 7,117,332 | |||||||
| Univision Communications Inc. Term Loan C5 | 3.75% (1 Mo. LIBOR + 2.75% | ) | 3/15/2024 | 4,044 | 4,037,355 | |||||||
| Total | 24,872,717 | |||||||||||
| Miscellaneous 0.51% | ||||||||||||
| Charter Communications Operating, LLC 2017 Term Loan A2 | 1.60% (1 Mo. LIBOR + 1.50% | ) | 3/31/2023 | 2,578 | 2,578,320 | |||||||
| Charter Communications Operating, LLC 2019 Term Loan B1 | 1.85% (1 Mo. LIBOR + 1.75% | ) | 4/30/2025 | 14,799 | 14,748,203 | |||||||
| Clean Harbors Inc. 2017 Term Loan B | 1.84% (1 Mo. LIBOR + 1.75% | ) | 6/28/2024 | 777 | 776,535 | |||||||
| WideOpenWest Finance LLC 2017 Term Loan B | 4.25% (1 Mo. LIBOR + 3.25% | ) | 8/18/2023 | 783 | 782,497 | |||||||
| Total | 18,885,555 | |||||||||||
| Oil 0.05% | ||||||||||||
| Hess Corporation Term Loan | 2.10% (1 Mo. LIBOR + 2.00% | ) | 3/16/2023 | 2,017 | 2,011,669 | |||||||
| Oil: Crude Producers 0.26% | ||||||||||||
| Buckeye Partners, L.P. 2021 Term Loan B | 2.336% (1 Mo. LIBOR + 2.25% | ) | 11/1/2026 | 3,070 | 3,056,600 | |||||||
| Cheniere Corpus Christi Holdings, LLC Delayed Draw Term Loan Tranche 2 | 1.84% | ) | 6/30/2024 | 6,478 | 6,476,153 | |||||||
| Total | 9,532,753 | |||||||||||
| 264 | See Notes to Financial Statements. |
Schedule of Investments (continued)
INFLATION FOCUSED FUND November 30, 2021
| Investments | Interest Rate | Maturity Date | Principal Amount (000) | Fair Value | ||||||||
| Real Estate 0.11% | ||||||||||||
| Crown Castle International Corporation 2016 Term Loan A | 1.225% (1 Mo. LIBOR + 1.13% | ) | 6/21/2024 | $ | 1,911 | $ | 1,907,912 | |||||
| Invitation Homes Operating Partnership LP 2020 Term Loan A | 1.09% (1 Mo. LIBOR + 1.00% | ) | 1/31/2025 | 2,246 | 2,245,570 | |||||||
| Total | 4,153,482 | |||||||||||
| Retail 0.18% | ||||||||||||
| BJ’s Wholesale Club, Inc. 2017 1st Lien Term Loan | 2.089% (1 Mo. LIBOR + 0.02% | ) | 2/3/2024 | 4,453 | 4,450,248 | |||||||
| Panera Bread Company Term Loan A | 2.375% (1 Mo. LIBOR + 2.25% | ) | 7/18/2022 | 2,257 | 2,234,738 | |||||||
| Total | 6,684,986 | |||||||||||
| Technology 0.10% | ||||||||||||
| ProQuest LLC 2019 Term Loan | 5.75% | 10/23/2026 | 3,691 | 3,691,044 | ||||||||
| Telecommunications 0.24% | ||||||||||||
| AT&T Inc. 2021 Delayed Draw Term Loan | 1.091% (1 Mo. LIBOR + 1.00% | ) | 3/23/2022 | 4,950 | 4,952,648 | (j) | ||||||
| CenturyLink, Inc. 2020 Term Loan A | 2.09% (1 Mo. LIBOR + 2.00% | ) | 1/31/2025 | 3,171 | 3,156,322 | |||||||
| NeuStar, Inc. 2018 Term Loan B4 | – | (i) | 8/8/2024 | 772 | 772,596 | |||||||
| Total | 8,881,566 | |||||||||||
| Transportation: Miscellaneous 0.30% | ||||||||||||
| XPO Logistics, Inc. 2018 Term Loan B | 1.831% (1 Mo. LIBOR + 1.75% | ) | 2/24/2025 | 11,148 | 11,077,460 | |||||||
| Total Floating Rate Loans (cost $242,898,667) | 242,154,015 | |||||||||||
| FOREIGN GOVERNMENT OBLIGATIONS(f) 0.25% | ||||||||||||
| Egypt 0.10% | ||||||||||||
| Republic of Egypt | 6.125% | 1/31/2022 | 375 | 376,187 | ||||||||
| Republic of Egypt† | 6.125% | 1/31/2022 | 3,190 | 3,200,096 | ||||||||
| Total | 3,576,283 | |||||||||||
| Indonesia 0.01% | ||||||||||||
| Perusahaan Penerbit SBSN† | 3.75% | 3/1/2023 | 405 | 420,497 | ||||||||
| Kenya 0.09% | ||||||||||||
| Republic of Kenya† | 6.875% | 6/24/2024 | 3,170 | 3,366,778 | ||||||||
| See Notes to Financial Statements. | 265 |
Schedule of Investments (continued)
INFLATION FOCUSED FUND November 30, 2021
| Investments | Interest Rate | Maturity Date | Principal Amount (000) | Fair Value | ||||||||
| Morocco 0.04% | ||||||||||||
| Morocco Government International Bond† | 4.25% | 12/11/2022 | $ | 1,500 | $ | 1,536,819 | ||||||
| Romania 0.01% | ||||||||||||
| Republic of Romania† | 4.875% | 1/22/2024 | 432 | 460,942 | ||||||||
| Total Foreign Government Obligations (cost $9,443,920) | 9,361,319 | |||||||||||
| �� | ||||||||||||
| GOVERNMENT SPONSORED ENTERPRISES COLLATERALIZED MORTGAGE OBLIGATIONS 0.02% | ||||||||||||
| Federal Home Loan Mortgage Corp. K061 X1 IO | 0.297% | #(l) | 11/25/2026 | 14,837 | 126,511 | |||||||
| Federal Home Loan Mortgage Corp. Q001 XA | 2.141% | #(l) | 2/25/2032 | 1,296 | 136,810 | |||||||
| Government National Mortgage Assoc. 2013-171 IO | 0.545% | #(l) | 6/16/2054 | 370 | 26,229 | |||||||
| Government National Mortgage Assoc. 2013-193 IO | 0.32% | #(l) | 1/16/2055 | 99 | 8,556 | |||||||
| Government National Mortgage Assoc. 2014-112 A | 3.00% | #(l) | 1/16/2048 | 170 | 173,468 | |||||||
| Government National Mortgage Assoc. 2014-15 IO | 0.266% | #(l) | 8/16/2054 | 333 | 17,244 | |||||||
| Government National Mortgage Assoc. 2014-64 IO | 0.794% | #(l) | 12/16/2054 | 2,225 | 128,562 | |||||||
| Government National Mortgage Assoc. 2015-19 AD | 2.90% | 10/16/2055 | 29 | 29,412 | ||||||||
| Total Government Sponsored Enterprises Collateralized Mortgage Obligations (cost $1,292,657) | 646,792 | |||||||||||
| GOVERNMENT SPONSORED ENTERPRISES PASS-THROUGHS 0.06% | ||||||||||||
| Federal Home Loan Mortgage Corp. | 1.89% (12 Mo. LIBOR + 1.64% | )# | 11/1/2043 | 314 | 328,501 | |||||||
| Federal Home Loan Mortgage Corp. | 2.031% (12 Mo. LIBOR + 1.66% | )# | 2/1/2038 | 119 | 125,768 | |||||||
| Federal Home Loan Mortgage Corp. | 2.033% (12 Mo. LIBOR + 1.72% | )# | 4/1/2037 | 31 | 32,999 | |||||||
| Federal Home Loan Mortgage Corp. | 2.051% (12 Mo. LIBOR + 1.78% | )# | 12/1/2036 | 85 | 90,210 | |||||||
| Federal Home Loan Mortgage Corp. | 2.107% (12 Mo. LIBOR + 1.80% | )# | 10/1/2038 | 23 | 23,831 | |||||||
| Federal Home Loan Mortgage Corp. | 2.123% (12 Mo. LIBOR + 1.79% | )# | 5/1/2036 | 27 | 28,779 | |||||||
| Federal Home Loan Mortgage Corp. | 2.217% (12 Mo. LIBOR + 1.92% | )# | 9/1/2036 | 87 | 92,081 | |||||||
| Federal Home Loan Mortgage Corp. | 2.258% (12 Mo. LIBOR + 1.96% | )# | 2/1/2037 | 77 | 81,892 | (c) | ||||||
| Federal National Mortgage Assoc. | 1.786% (12 Mo. LIBOR + 1.52% | )# | 10/1/2035 | 87 | 90,609 | |||||||
| Federal National Mortgage Assoc. | 1.836% (12 Mo. LIBOR + 1.51% | )# | 3/1/2039 | 54 | 56,353 | |||||||
| Federal National Mortgage Assoc. | 1.861% (12 Mo. LIBOR + 1.56% | )# | 6/1/2038 | 68 | 71,928 | |||||||
| Federal National Mortgage Assoc. | 1.911% (12 Mo. LIBOR + 1.64% | )# | 9/1/2038 | 61 | 64,500 | |||||||
| Federal National Mortgage Assoc. | 1.914% (12 Mo. LIBOR + 1.62% | )# | 8/1/2037 | 7 | 7,339 | |||||||
| 266 | See Notes to Financial Statements. |
Schedule of Investments (continued)
INFLATION FOCUSED FUND November 30, 2021
| Investments | Interest Rate | Maturity Date | Principal Amount (000) | Fair Value | ||||||||
| GOVERNMENT SPONSORED ENTERPRISES PASS-THROUGHS (continued) | ||||||||||||
| Federal National Mortgage Assoc. | 1.981% (12 Mo. LIBOR + 1.66% | )# | 8/1/2038 | $ | 18 | $ | 18,431 | |||||
| Federal National Mortgage Assoc. | 2.054% (12 Mo. LIBOR + 1.80% | )# | 10/1/2040 | 20 | 21,235 | |||||||
| Federal National Mortgage Assoc. | 2.075% (12 Mo. LIBOR + 1.79% | )# | 3/1/2042 | 347 | 366,030 | |||||||
| Federal National Mortgage Assoc. | 2.10% (12 Mo. LIBOR + 1.80% | )# | 12/1/2040 | 77 | 81,020 | |||||||
| Federal National Mortgage Assoc. | 2.137% (12 Mo. LIBOR + 1.81% | )# | 12/1/2040 | 33 | 35,114 | |||||||
| Federal National Mortgage Assoc. | 2.17% (12 Mo. LIBOR + 1.81% | )# | 4/1/2040 | 34 | 35,841 | |||||||
| Federal National Mortgage Assoc. | 2.19% (12 Mo. LIBOR + 1.88% | )# | 12/1/2038 | 31 | 33,397 | |||||||
| Federal National Mortgage Assoc. | 2.267% (1 Yr. Treasury CMT + 2.17% | )# | 3/1/2038 | 9 | 9,243 | |||||||
| Federal National Mortgage Assoc. | 2.322% (1 Yr. Treasury CMT + 2.21% | )# | 1/1/2038 | 47 | 50,492 | |||||||
| Federal National Mortgage Assoc. | 2.722% (12 Mo. LIBOR + 1.60% | )# | 12/1/2045 | 117 | 122,508 | |||||||
| Federal National Mortgage Assoc. | 2.735% (12 Mo. LIBOR + 1.60% | )# | 12/1/2045 | 355 | 371,719 | |||||||
| Federal National Mortgage Assoc. | 2.776% (12 Mo. LIBOR + 1.60% | )# | 10/1/2045 | 100 | 104,375 | |||||||
| Total Government Sponsored Enterprises Pass-Throughs (cost $2,317,891) | 2,344,195 | |||||||||||
| MUNICIPAL BONDS 0.02% | ||||||||||||
| Miscellaneous | ||||||||||||
| New York Transportation Development Corp. | 1.36% | 12/1/2021 | 110 | 110,000 | ||||||||
| New York Transportation Development Corp. | 1.61% | 12/1/2022 | 110 | 110,784 | ||||||||
| State of Illinois | 4.95% | 6/1/2023 | 587 | 614,551 | ||||||||
| Total Municipal Bonds (cost $815,800) | 835,335 | |||||||||||
| NON-AGENCY COMMERCIAL MORTGAGE-BACKED SECURITIES 16.78% | ||||||||||||
| Angel Oak Mortgage Trust 2020-1 A1† | 2.466% | #(l) | 12/25/2059 | 216 | 216,450 | |||||||
| Angel Oak Mortgage Trust 2020-6 A1† | 1.261% | #(l) | 5/25/2065 | 242 | 242,197 | |||||||
| Angel Oak Mortgage Trust 2021-4 A1† | 1.035% | #(l) | 1/20/2065 | 3,011 | 2,984,625 | |||||||
| Angel Oak Mortgage Trust 2021-6 A1† | 1.458% | #(l) | 9/25/2066 | 4,946 | 4,915,888 | |||||||
| AOA 2021-1177 Mortgage Trust A† | 0.964% (1 Mo. LIBOR + .87% | )# | 10/15/2038 | 12,075 | 12,079,084 | |||||||
| Atrium Hotel Portfolio Trust 2017-ATRM B† | 1.59% (1 Mo. LIBOR + 1.50% | )# | 12/15/2036 | 842 | 834,775 | |||||||
| See Notes to Financial Statements. | 267 |
Schedule of Investments (continued)
INFLATION FOCUSED FUND November 30, 2021
| Investments | Interest Rate | Maturity Date | Principal Amount (000) | Fair Value | ||||||||
| NON-AGENCY COMMERCIAL MORTGAGE-BACKED SECURITIES (continued) | ||||||||||||
| Atrium Hotel Portfolio Trust 2018-ATRM B† | 1.52% (1 Mo. LIBOR + 1.43% | )# | 6/15/2035 | $ | 907 | $ | 899,365 | |||||
| Atrium Hotel Portfolio Trust 2018-ATRM C† | 1.74% (1 Mo. LIBOR + 1.65% | )# | 6/15/2035 | 288 | 284,907 | |||||||
| Bayview MSR Opportunity Master Fund Trust 2021-INV4 A11† | 0.90% (1 Mo. SOFR + .85% | )# | 10/25/2051 | 9,865 | 9,811,717 | |||||||
| BBCMS Mortgage Trust 2018-TALL A† | 0.812% (1 Mo. LIBOR + .72% | )# | 3/15/2037 | 3,400 | 3,367,873 | |||||||
| BBCMS Mortgage Trust 2018-TALL C† | 1.211% (1 Mo. LIBOR + 1.12% | )# | 3/15/2037 | 3,350 | 3,221,921 | |||||||
| BBCMS Trust 2015-VFM A1† | 2.466% | 3/10/2036 | 246 | 247,671 | ||||||||
| BBCMS Trust 2015-VFM X IO X† | 0.465% | #(l) | 3/12/2036 | 84,801 | 864,967 | |||||||
| BBCMS Trust 2018-BXH A† | 1.089% (1 Mo. LIBOR + 1.00% | )# | 10/15/2037 | 1,492 | 1,494,294 | |||||||
| BB-UBS Trust 2012-TFT B† | 3.678% | #(l) | 6/5/2030 | 2,149 | 2,022,702 | |||||||
| BB-UBS Trust 2012-TFT C† | 3.678% | #(l) | 6/5/2030 | 3,000 | 2,633,902 | |||||||
| BDS Ltd. 2021-FL8 A† | 1.009% (1 Mo. LIBOR + .92% | )# | 1/18/2036 | 4,910 | 4,883,977 | |||||||
| Benchmark Mortgage Trust 2021 B23 A2 | 1.62% | 2/15/2054 | 400 | 397,321 | ||||||||
| BFLD 2019-DPLO A† | 1.18% (1 Mo. LIBOR + 1.09% | )# | 10/15/2034 | 2,780 | 2,779,549 | |||||||
| BFLD 2019-DPLO E† | 2.33% (1 Mo. LIBOR + 2.24% | )# | 10/15/2034 | 6,100 | 5,989,600 | |||||||
| BHMS 2018-ATLS A† | 1.34% (1 Mo. LIBOR + 1.25% | )# | 7/15/2035 | 2,640 | 2,644,560 | |||||||
| BHMS 2018-ATLS C† | 1.99% (1 Mo. LIBOR + 1.90% | )# | 7/15/2035 | 12,254 | 12,222,779 | |||||||
| BHMS 2018-ATLS D† | 2.34% (1 Mo. LIBOR + 2.25% | )# | 7/15/2035 | 8,630 | 8,562,652 | |||||||
| BWAY Mortgage Trust 2013-1515 XB IO† | 0.534% | #(l) | 3/10/2033 | 47,800 | 605,578 | |||||||
| BWAY Mortgage Trust 2015-1740 C† | 3.342% | 1/10/2035 | 3,350 | 3,309,344 | ||||||||
| BX 2021-MFM1 A† | 0.79% (1 Mo. LIBOR + .70% | )# | 1/15/2034 | 140 | 139,604 | |||||||
| BX Commercial Mortgage Trust 2019-IMC A† | 1.089% (1 Mo. LIBOR + 1.00% | )# | 4/15/2034 | 5,881 | 5,874,960 | |||||||
| BX Commercial Mortgage Trust 2019-XL D† | 1.54% (1 Mo. LIBOR + 1.45% | )# | 10/15/2036 | 5,287 | 5,275,409 | |||||||
| BX Commercial Mortgage Trust 2021-ACNT A† | 0.95% (1 Mo. LIBOR + .85% | )# | 11/15/2026 | 6,750 | 6,743,806 | |||||||
| BX Commercial Mortgage Trust 2021-ACNT D† | 1.95% (1 Mo. LIBOR + 1.85% | )# | 11/15/2026 | 2,840 | 2,840,204 | |||||||
| 268 | See Notes to Financial Statements. |
Schedule of Investments (continued)
INFLATION FOCUSED FUND November 30, 2021
| Investments | Interest Rate | Maturity Date | Principal Amount (000) | Fair Value | ||||||||
| NON-AGENCY COMMERCIAL MORTGAGE-BACKED SECURITIES (continued) | ||||||||||||
| BX Commercial Mortgage Trust 2021-XL2 A† | 0.779% (1 Mo. LIBOR + .69% | )# | 10/15/2038 | $ | 6,110 | $ | 6,088,960 | |||||
| BX Trust 2017-SLCT D† | 2.14% (1 Mo. LIBOR + 2.05% | )# | 7/15/2034 | 721 | 722,027 | |||||||
| BX Trust 2017-SLCT F† | 4.34% (1 Mo. LIBOR + 4.25% | )# | 7/15/2034 | 1,939 | 1,953,119 | |||||||
| BX Trust 2018-GW A† | 0.89% (1 Mo. LIBOR + .80% | )# | 5/15/2035 | 8,200 | 8,196,870 | |||||||
| BX Trust 2021-ARIA E† | 2.335% (1 Mo. LIBOR + 2.24% | )# | 10/15/2036 | 10,070 | 10,040,048 | |||||||
| BX Trust 2021-ARIA F† | 2.684% (1 Mo. LIBOR + 2.59% | )# | 10/15/2036 | 3,320 | 3,311,242 | |||||||
| BX Trust 2021-RISE A†(a) | 0.848% (1 Mo. LIBOR + .75% | )# | 11/15/2036 | 14,300 | 14,434,274 | |||||||
| BXHPP Trust 2021-FILM A† | 0.74% (1 Mo. LIBOR + .65% | )# | 8/15/2036 | 13,000 | 12,964,555 | |||||||
| BXHPP Trust 2021-FILM B† | 0.99% (1 Mo. LIBOR + .90% | )# | 8/15/2036 | 6,380 | 6,350,567 | |||||||
| CFCRE Commercial Mortgage Trust 2016-C4 XA IO | 1.798% | #(l) | 5/10/2058 | 937 | 55,004 | |||||||
| CFCRE Commercial Mortgage Trust 2016-C6 XA IO | 1.24% | #(l) | 11/10/2049 | 2,641 | 119,025 | |||||||
| CFCRE Commercial Mortgage Trust 2016-C7 XA IO | 0.828% | #(l) | 12/10/2054 | 3,572 | 110,025 | |||||||
| CFCRE Commercial Mortgage Trust 2018-TAN A† | 4.236% | 2/15/2033 | 3,500 | 3,590,419 | ||||||||
| CGRBS Commercial Mortgage Trust 2013-VN05 A† | 3.369% | 3/13/2035 | 1,000 | 1,022,784 | ||||||||
| CHT 2017-COSMO Mortgage Trust F† | 3.831% (1 Mo. LIBOR + 3.74% | )# | 11/15/2036 | 2,800 | 2,807,718 | |||||||
| CHT Mortgage Trust 2017-CSMO B† | 1.489% (1 Mo. LIBOR + 1.40% | )# | 11/15/2036 | 2,768 | 2,770,749 | |||||||
| Citigroup Commercial Mortgage Trust 2014-GC23 XB IO | 0.304% | #(l) | 7/10/2047 | 3,452 | 19,457 | |||||||
| Citigroup Commercial Mortgage Trust 2015-GC31 XA IO | 0.477% | #(l) | 6/10/2048 | 5,558 | 62,686 | |||||||
| COLT Mortgage Loan Trust 2021-2 A1† | 0.924% | #(l) | 8/25/2066 | 6,900 | 6,847,545 | |||||||
| Commercial Mortgage Pass-Through Certificates 2010-C1 C† | 5.807% | #(l) | 7/10/2046 | 5 | 5,195 | |||||||
| Commercial Mortgage Pass-Through Certificates 2012-CR1 B | 4.612% | 5/15/2045 | 4,600 | 4,617,060 | ||||||||
| Commercial Mortgage Pass-Through Certificates 2012-CR3 B† | 3.922% | 10/15/2045 | 617 | 611,590 | ||||||||
| Commercial Mortgage Pass-Through Certificates 2012-CR4 XA IO | 1.839% | #(l) | 10/15/2045 | 4,259 | 41,223 | |||||||
| Commercial Mortgage Pass-Through Certificates 2012-LTRT A1† | 2.15% | 10/5/2030 | 157 | 156,801 | ||||||||
| See Notes to Financial Statements. | 269 |
Schedule of Investments (continued)
INFLATION FOCUSED FUND November 30, 2021
| Investments | Interest Rate | Maturity Date | Principal Amount (000) | Fair Value | ||||||||
| NON-AGENCY COMMERCIAL MORTGAGE-BACKED SECURITIES (continued) | ||||||||||||
| Commercial Mortgage Pass-Through Certificates 2012-LTRT A2† | 3.40% | 10/5/2030 | $ | 1,080 | $ | 1,074,564 | ||||||
| Commercial Mortgage Pass-Through Certificates 2013-CR7 XA IO | 1.32% | #(l) | 3/10/2046 | 4,281 | 50,243 | |||||||
| Commercial Mortgage Pass-Through Certificates 2013-CR8 XA IO | 0.426% | #(l) | 6/10/2046 | 11,079 | 40,950 | |||||||
| Commercial Mortgage Pass-Through Certificates 2013-GAM A2† | 3.367% | 2/10/2028 | 86 | 85,181 | ||||||||
| Commercial Mortgage Pass-Through Certificates 2013-SFS A1† | 1.873% | 4/12/2035 | 161 | 161,459 | ||||||||
| Commercial Mortgage Pass-Through Certificates 2014-CR19 XA IO | 1.111% | #(l) | 8/10/2047 | 2,251 | 47,406 | |||||||
| Commercial Mortgage Pass-Through Certificates 2016-CD1 XA IO | 1.524% | #(l) | 8/10/2049 | 848 | 43,957 | |||||||
| Commercial Mortgage Pass-Through Certificates 2020-SBX A† | 1.67% | 1/10/2038 | 255 | 254,600 | ||||||||
| Credit Suisse Mortgage Capital Certificates | 1.24% | 11/15/2038 | 16,330 | 16,489,591 | ||||||||
| Credit Suisse Mortgage Capital Certificates 2016-NXSR XB IO XB | 0.248% | #(l) | 12/15/2049 | 20,135 | 240,156 | |||||||
| Credit Suisse Mortgage Capital Certificates 2017-MOON B† | 3.303% | #(l) | 7/10/2034 | 200 | 201,117 | |||||||
| Credit Suisse Mortgage Capital Certificates 2020-AFC1 A1† | 2.24% | #(l) | 2/25/2050 | 576 | 578,504 | |||||||
| Credit Suisse Mortgage Capital Certificates 2020-SPT1 A1† | 1.616% | 4/25/2065 | 292 | 293,098 | ||||||||
| Credit Suisse Mortgage Capital Certificates Trust 2014-USA X1 IO† | 0.686% | #(l) | 9/15/2037 | 39,135 | 691,234 | |||||||
| Credit Suisse Mortgage Capital Certificates Trust 2017-PFHP A† | 1.04% (1 Mo. LIBOR + .95% | )# | 12/15/2030 | 502 | 502,230 | |||||||
| Credit Suisse Mortgage Capital Certificates Trust 2021-ADV A† | 1.49% (1 Mo. LIBOR + 1.40% | )# | 7/15/2038 | 6,130 | 6,141,075 | |||||||
| Credit Suisse Mortgage Capital Certificates Trust 2021-AFC1 A1† | 0.83% | #(l) | 3/25/2056 | 709 | 702,645 | |||||||
| Credit Suisse Mortgage Capital Certificates Trust 2021-NQM1 A1† | 0.809% | #(l) | 5/25/2065 | 3,692 | 3,683,703 | |||||||
| Credit Suisse Mortgage Capital Certificates Trust 2021-NQM3 A1† | 1.015% | #(l) | 4/25/2066 | 1,219 | 1,210,196 | |||||||
| CSAIL Commercial Mortgage Trust 2015-C2 XB IO XB† | 0.119% | #(l) | 6/15/2057 | 82,732 | 142,299 | |||||||
| 270 | See Notes to Financial Statements. |
Schedule of Investments (continued)
INFLATION FOCUSED FUND November 30, 2021
| Investments | Interest Rate | Maturity Date | Principal Amount (000) | Fair Value | ||||||||
| NON-AGENCY COMMERCIAL MORTGAGE-BACKED SECURITIES (continued) | ||||||||||||
| CSAIL Commercial Mortgage Trust 2016-C7 XA IO | 1.09% | #(l) | 11/15/2049 | $ | 4,250 | $ | 155,780 | |||||
| CSMC 2021-NQM6 A1† | 1.174% | #(l) | 7/25/2066 | 6,733 | 6,686,979 | |||||||
| CSMC 2021-NQM6 A2† | 1.379% | #(l) | 7/25/2066 | 4,409 | 4,378,564 | |||||||
| CSMC 2021-NQM7 A1† | 1.756% | #(l) | 10/25/2066 | 3,291 | 3,279,936 | |||||||
| CSMC 2021-NQM7 A3† | 2.064% | #(l) | 10/25/2066 | 1,196 | 1,192,296 | |||||||
| DBGS 2021-W52 Mortgage Trust C† | 2.391% (1 Mo. LIBOR + 2.30% | )# | 10/15/2036 | 9,905 | 10,012,454 | |||||||
| DBGS Mortgage Trust 2018 5BP A† | 0.885% (1 Mo. LIBOR + .80% | )# | 6/15/2033 | 1,120 | 1,119,487 | |||||||
| DBGS Mortgage Trust 2018-BIOD A† | 0.893% (1 Mo. LIBOR + .80% | )# | 5/15/2035 | 1,259 | 1,258,919 | |||||||
| DBGS Mortgage Trust 2021-W52 A† | 1.486% (1 Mo. LIBOR + 1.39% | )# | 10/15/2036 | 4,750 | 4,801,507 | |||||||
| DBJPM Mortgage Trust 2016-C3 XA IO | 1.584% | #(l) | 8/10/2049 | 9,411 | 533,283 | |||||||
| DBWF Mortgage Trust 2015-LCM A1† | 2.998% | 6/10/2034 | 270 | 272,606 | ||||||||
| DBWF Mortgage Trust 2015-LCM XA† | 0.537% | #(l) | 6/10/2034 | 540 | 5,681 | |||||||
| DBWF Mortgage Trust 2016-85T XA IO XA† | 0.116% | #(l) | 12/10/2036 | 61,529 | 150,746 | |||||||
| DBWF Mortgage Trust 2018-AMXP B† | 4.122% | #(l) | 5/5/2035 | 1,500 | 1,501,355 | |||||||
| DBWF Mortgage Trust 2018-AMXP C† | 3.956% | #(l) | 5/5/2035 | 1,000 | 999,005 | |||||||
| DBWF Mortgage Trust 2018-GLKS A† | 1.119% (1 Mo. LIBOR + 1.03% | )# | 12/19/2030 | 2,989 | 2,993,324 | |||||||
| Deephaven Residential Mortgage Trust 2020-1 A1† | 2.339% | #(l) | 1/25/2060 | 296 | 296,646 | |||||||
| Deephaven Residential Mortgage Trust 2021-3 A1† | 1.194% | #(l) | 8/25/2066 | 6,709 | 6,677,280 | |||||||
| Ellington Financial Mortgage Trust 2021-1 A1† | 0.797% | #(l) | 2/25/2066 | 161 | 160,014 | |||||||
| ELP Commercial Mortgage Trust 2021-ELP D† | 1.619% (1 Mo. LIBOR + 1.52% | )# | 11/15/2038 | 2,470 | 2,463,510 | |||||||
| EQUS Mortgage Trust 2021-EQAZ B† | 1.19% (1 Mo. LIBOR + 1.10% | )# | 10/15/2038 | 2,640 | 2,629,978 | |||||||
| EQUS Mortgage Trust 2021-EQAZ C† | 1.44% (1 Mo. LIBOR + 1.35% | )# | 10/15/2038 | 8,270 | 8,239,696 | |||||||
| EQUS Mortgage Trust 2021-EQAZ D† | 1.74% (1 Mo. LIBOR + 1.65% | )# | 10/15/2038 | 3,970 | 3,956,217 | |||||||
| Extended Stay America Trust 2021-ESH E† | 2.94% (1 Mo. LIBOR + 2.85% | )# | 7/15/2038 | 5,472 | 5,497,948 | |||||||
| Fontainebleau Miami Beach Trust 2019-FBLU A† | 3.144% | 12/10/2036 | 761 | 784,383 | ||||||||
| Fontainebleau Miami Beach Trust 2019-FBLU B† | 3.447% | 12/10/2036 | 335 | 344,240 | ||||||||
| Freddie Mac STACR REMIC Trust 2021-DNA5 M2† | 1.70% (1 Mo. SOFR + 1.65% | )# | 1/25/2034 | 5,385 | 5,416,299 | |||||||
| Freddie Mac STACR REMIC Trust 2021-HQA3 M1† | 0.90% (1 Mo. SOFR + .85% | )# | 9/25/2041 | 2,925 | 2,928,023 | |||||||
| See Notes to Financial Statements. | 271 |
Schedule of Investments (continued)
INFLATION FOCUSED FUND November 30, 2021
| Investments | Interest Rate | Maturity Date | Principal Amount (000) | Fair Value | ||||||||
| NON-AGENCY COMMERCIAL MORTGAGE-BACKED SECURITIES (continued) | ||||||||||||
| GCAT Trust 2020-NQM1 A1† | 2.247% | 1/25/2060 | $ | 168 | $ | 168,060 | ||||||
| Great Wolf Trust 2019-WOLF B† | 1.424% (1 Mo. LIBOR + 1.33% | )# | 12/15/2036 | 10,000 | 9,950,261 | |||||||
| Great Wolf Trust 2019-WOLF C† | 1.723% (1 Mo. LIBOR + 1.63% | )# | 12/15/2036 | 2,945 | 2,927,079 | |||||||
| Great Wolf Trust 2019-WOLF E† | 2.822% (1 Mo. LIBOR + 2.73% | )# | 12/15/2036 | 2,620 | 2,541,534 | |||||||
| GS Mortgage Securities Corp. II 2012-TMSQ A† | 3.007% | 12/10/2030 | 1,300 | 1,316,610 | ||||||||
| GS Mortgage Securities Corp. II 2021-ARDN A† | 1.35% (1 Mo. LIBOR + 1.25% | )# | 11/15/2026 | 11,500 | 11,407,926 | |||||||
| GS Mortgage Securities Corp. Trust 2017-GPTX A† | 2.856% | 5/10/2034 | 1,159 | 1,156,139 | ||||||||
| GS Mortgage Securities Corp. Trust 2017-GPTX B† | 3.104% | 5/10/2034 | 1,060 | 1,048,018 | ||||||||
| GS Mortgage Securities Corp. Trust 2017-SLP A† | 3.419% | 10/10/2032 | 1,300 | 1,321,595 | ||||||||
| GS Mortgage Securities Corp. Trust 2017-STAY A† | 1.44% (1 Mo. LIBOR + 1.35% | )# | 7/15/2032 | 888 | 889,699 | |||||||
| GS Mortgage Securities Corp. Trust 2017-STAY B† | 1.69% (1 Mo. LIBOR + 1.60% | )# | 7/15/2032 | 313 | 313,970 | |||||||
| GS Mortgage Securities Corp. Trust 2017-STAY C† | 1.94% (1 Mo. LIBOR + 1.85% | )# | 7/15/2032 | 225 | 225,351 | |||||||
| GS Mortgage Securities Corp. Trust 2018-RIVR A† | 1.04% (1 Mo. LIBOR + .95% | )# | 7/15/2035 | 2,356 | 2,341,697 | |||||||
| GS Mortgage Securities Corp. Trust 2019-70P B† | 1.41% (1 Mo. LIBOR + 1.32% | )# | 10/15/2036 | 657 | 644,292 | |||||||
| GS Mortgage Securities Corp. Trust 2021-RENT B† | 1.191% (1 Mo. LIBOR + 1.10% | )# | 11/21/2035 | 16,021 | 15,963,060 | |||||||
| GS Mortgage Securities Corp. Trust 2021-ROSS A† | 1.24% (1 Mo. LIBOR + 1.15% | )# | 5/15/2026 | 5,000 | 5,013,503 | |||||||
| GS Mortgage Securities Corp. Trust 2021-ROSS H† | 5.99% (1 Mo. LIBOR + 5.90% | )# | 5/15/2026 | 560 | 564,806 | |||||||
| GS Mortgage Securities Trust 2012-GCJ7 B | 4.74% | 5/10/2045 | 259 | 262,122 | ||||||||
| GS Mortgage Securities Trust 2012-GCJ9 XA IO | 2.076% | #(l) | 11/10/2045 | 1,317 | 12,276 | |||||||
| GS Mortgage Securities Trust 2013-G1 A2† | 3.557% | #(l) | 4/10/2031 | 2,584 | 2,586,156 | |||||||
| GS Mortgage Securities Trust 2013-GC12 B | 3.777% | #(l) | 6/10/2046 | 3,450 | 3,548,779 | |||||||
| GS Mortgage Securities Trust 2013-GC12 XA IO | 1.531% | #(l) | 6/10/2046 | 17,531 | 254,869 | |||||||
| GS Mortgage Securities Trust 2015-GS1 XA IO | 0.908% | #(l) | 11/10/2048 | 1,037 | 27,514 | |||||||
| HMH Trust 2017-NSS A† | 3.062% | 7/5/2031 | 974 | 975,694 | ||||||||
| HMH Trust 2017-NSS B† | 3.343% | 7/5/2031 | 629 | 616,970 | ||||||||
| HMH Trust 2017-NSS C† | 3.787% | 7/5/2031 | 469 | 460,490 | ||||||||
| HMH Trust 2017-NSS D† | 4.723% | 7/5/2031 | 618 | 609,012 | ||||||||
| 272 | See Notes to Financial Statements. |
Schedule of Investments (continued)
INFLATION FOCUSED FUND November 30, 2021
| Investments | Interest Rate | Maturity Date | Principal Amount (000) | Fair Value | ||||||||
| NON-AGENCY COMMERCIAL MORTGAGE-BACKED SECURITIES (continued) | ||||||||||||
| HONO Mortgage Trust 2021-LULU A† | 1.24% (1 Mo. LIBOR + 1.15% | )# | 10/15/2036 | $ | 13,950 | $ | 13,974,224 | |||||
| Hudson Yards 2016-10HY Mortgage Trust A† | 2.835% | 8/10/2038 | 6,310 | 6,567,363 | �� | |||||||
| Hudsons Bay Simon JV Trust 2015-HB7 B7† | 4.666% | 8/5/2034 | 1,200 | 1,090,377 | ||||||||
| Hudsons Bay Simon JV Trust 2015-HB7 D7† | 5.331% | #(l) | 8/5/2034 | 559 | 425,074 | |||||||
| Hudsons Bay Simon JV Trust 2015-HBFL CFL† | 2.886% (1 Mo. LIBOR + 2.80% | )# | 8/5/2034 | 1,961 | 1,686,676 | |||||||
| Irvine Core Office Trust 2013-IRV A2† | 3.279% | #(l) | 5/15/2048 | 1,532 | 1,576,172 | |||||||
| JP Morgan Chase Commercial Mortgage Securities Trust 2020-MKST E† | 2.34% | )# | 12/15/2036 | 5,800 | 5,636,229 | |||||||
| JPMorgan Chase Commercial Mortgage Securities Corp. 2018 AON XA IO XA† | 0.639% | #(l) | 7/5/2031 | 129,394 | 965,654 | |||||||
| JPMorgan Chase Commercial Mortgage Securities Corp. 2018 AON XB IO XB† | 0.308% | #(l) | 7/5/2031 | 50,413 | 144,847 | |||||||
| JPMorgan Chase Commercial Mortgage Securities Corp. 2018-AON A† | 4.128% | 7/5/2031 | 9,500 | 9,899,743 | ||||||||
| JPMorgan Chase Commercial Mortgage Securities Trust 2012-C6 B | 4.819% | #(l) | 5/15/2045 | 253 | 255,695 | |||||||
| JPMorgan Chase Commercial Mortgage Securities Trust 2012-WLDN A† | 3.905% | 5/5/2030 | 5,625 | 4,829,843 | ||||||||
| JPMorgan Chase Commercial Mortgage Securities Trust 2012-WLDN B† | 4.488% | #(l) | 5/5/2030 | 1,254 | 899,045 | (c) | ||||||
| JPMorgan Chase Commercial Mortgage Securities Trust 2013-C10 XA IO | 1.076% | #(l) | 12/15/2047 | 7,765 | 61,014 | |||||||
| JPMorgan Chase Commercial Mortgage Securities Trust 2013-C12 XA IO | 0.562% | #(l) | 7/15/2045 | 4,418 | 22,395 | |||||||
| JPMorgan Chase Commercial Mortgage Securities Trust 2013-LC11 XA IO | 1.369% | #(l) | 4/15/2046 | 1,248 | 15,245 | |||||||
| JPMorgan Chase Commercial Mortgage Securities Trust 2014-C24 XA IO | 1.011% | #(l) | 11/15/2047 | 2,406 | 46,984 | |||||||
| JPMorgan Chase Commercial Mortgage Securities Trust 2014-DSTY A† | 3.429% | 6/10/2027 | 5,000 | 2,825,000 | ||||||||
| JPMorgan Chase Commercial Mortgage Securities Trust 2014-DSTY XA IO† | 0.503% | #(l) | 6/10/2027 | 2,906 | 116 | |||||||
| JPMorgan Chase Commercial Mortgage Securities Trust 2014-DSTY XB IO† | 0.16% | #(l) | 6/10/2027 | 1,292 | 13 | |||||||
| JPMorgan Chase Commercial Mortgage Securities Trust 2015-C29 XA IO | 0.759% | #(l) | 5/15/2048 | 1,590 | 27,739 | |||||||
| JPMorgan Chase Commercial Mortgage Securities Trust 2016-JP4 XA IO | 0.765% | #(l) | 12/15/2049 | 3,385 | 78,719 | |||||||
| See Notes to Financial Statements. | 273 |
Schedule of Investments (continued)
INFLATION FOCUSED FUND November 30, 2021
| Investments | Interest Rate | Maturity Date | Principal Amount (000) | Fair Value | ||||||||
| NON-AGENCY COMMERCIAL MORTGAGE-BACKED SECURITIES (continued) | ||||||||||||
| JPMorgan Chase Commercial Mortgage Securities Trust 2016-NINE A† | 2.949% | #(l) | 9/6/2038 | $ | 4,340 | $ | 4,520,226 | |||||
| JPMorgan Chase Commercial Mortgage Securities Trust 2017-JP7 XA IO | 1.184% | #(l) | 9/15/2050 | 8,160 | 347,619 | |||||||
| JPMorgan Chase Commercial Mortgage Securities Trust 2017-MARK B† | 3.795% | 6/5/2032 | 608 | 607,801 | ||||||||
| JPMorgan Chase Commercial Mortgage Securities Trust 2017-MARK C† | 4.171% | #(l) | 6/5/2032 | 452 | 449,410 | |||||||
| JPMorgan Chase Commercial Mortgage Securities Trust 2017-MARK X IO X† | 0.661% | #(l) | 6/5/2032 | 32,692 | 43,281 | |||||||
| JPMorgan Chase Commercial Mortgage Securities Trust 2018 WPT XBFX IO XBFX† | 0.555% | #(l) | 7/5/2033 | 95,152 | 560,445 | |||||||
| JPMorgan Chase Commercial Mortgage Securities Trust 2018-LAQ B† | 1.39% (1 Mo. LIBOR + 1.30% | )# | 6/15/2032 | 997 | 997,539 | |||||||
| JPMorgan Chase Commercial Mortgage Securities Trust 2018-LAQ C† | 1.69% (1 Mo. LIBOR + 1.60% | )# | 6/15/2032 | 804 | 803,999 | |||||||
| JPMorgan Chase Commercial Mortgage Securities Trust 2018-PTC A† | 1.54% (1 Mo. LIBOR + 1.45% | )# | 4/15/2031 | 658 | 651,042 | |||||||
| JPMorgan Chase Commercial Mortgage Securities Trust 2018-PTC B† | 2.24% (1 Mo. LIBOR + 2.15% | )# | 4/15/2031 | 449 | 445,204 | |||||||
| JPMorgan Chase Commercial Mortgage Securities Trust 2018-PTC C† | 2.64% (1 Mo. LIBOR + 2.55% | )# | 4/15/2031 | 332 | 329,637 | |||||||
| JPMorgan Chase Commercial Mortgage Securities Trust 2018-WPT AFL† | 1.286% (1 Mo. LIBOR + 1.20% | )# | 7/5/2033 | 901 | 902,498 | |||||||
| JPMorgan Chase Commercial Mortgage Securities Trust 2018-WPT AFX† | 4.248% | 7/5/2033 | 4,760 | 4,965,441 | ||||||||
| JPMorgan Chase Commercial Mortgage Securities Trust 2018-WPT CFL† | 1.986% (1 Mo. LIBOR + 1.90% | )# | 7/5/2033 | 323 | 323,903 | |||||||
| KIND Trust 2021-KIND A† | 1.04% (1 Mo. LIBOR + .95% | )# | 8/15/2038 | 6,110 | 6,122,169 | |||||||
| KKR Industrial Portfolio Trust 2021-KDIP A† | 0.64% (1 Mo. LIBOR + .55% | )# | 12/15/2037 | 423 | 418,947 | |||||||
| Life 2021-BMR Mortgage Trust 2021-BMR A† | 0.79% (1 Mo. LIBOR + .70% | )# | 3/15/2038 | 5,400 | 5,395,782 | |||||||
| LSTAR Commercial Mortgage Trust 2016-4 XA IO† | 1.92% | #(l) | 3/10/2049 | 1,207 | 44,853 | |||||||
| 274 | See Notes to Financial Statements. |
Schedule of Investments (continued)
INFLATION FOCUSED FUND November 30, 2021
| Investments | Interest Rate | Maturity Date | Principal Amount (000) | Fair Value | ||||||||
| NON-AGENCY COMMERCIAL MORTGAGE-BACKED SECURITIES (continued) | ||||||||||||
| LSTAR Commercial Mortgage Trust 2016-4 XB IO XB† | 0.787% | #(l) | 3/10/2049 | $ | 19,753 | $ | 496,788 | |||||
| LSTAR Commercial Mortgage Trust 2017-5 A2† | 2.776% | 3/10/2050 | 280 | 279,916 | ||||||||
| LSTAR Commercial Mortgage Trust 2017-5 A3† | 4.50% | 3/10/2050 | 2,100 | 2,165,404 | ||||||||
| LUXE Trust 2021-TRIP C† | 1.84% (1 Mo. LIBOR + 1.75% | )# | 10/15/2038 | 1,000 | 1,002,120 | |||||||
| MF1 Ltd. 2020-FL3 B† | 3.912% (1 Mo. SOFR + 3.86% | )# | 7/15/2035 | 2,305 | 2,333,686 | |||||||
| Morgan Stanley Bank of America Merrill Lynch Trust XA | 0.698% | #(l) | 7/15/2050 | 5,559 | 95,711 | |||||||
| Morgan Stanley Bank of America Merrill Lynch Trust 2012-CKSV A2† | 3.277% | 10/15/2030 | 2,090 | 2,079,509 | ||||||||
| Morgan Stanley Bank of America Merrill Lynch Trust 2013-C8 B | 3.659% | #(l) | 12/15/2048 | 1,000 | 1,020,121 | |||||||
| Morgan Stanley Bank of America Merrill Lynch Trust 2016-C29 A4 | 3.325% | 5/15/2049 | 1,000 | 1,063,242 | ||||||||
| Morgan Stanley Bank of America Merrill Lynch Trust 2016-C31 XA IO | 1.462% | #(l) | 11/15/2049 | 4,302 | 214,220 | |||||||
| Morgan Stanley Capital Barclays Bank Trust 2016-MART XCP IO XCP† | Zero Coupon | #(l) | 9/13/2031 | 188,074 | 2 | |||||||
| Morgan Stanley Capital I Trust 2012-C4 XA IO† | 2.002% | #(l) | 3/15/2045 | 3,781 | 185 | |||||||
| Morgan Stanley Capital I Trust 2012-STAR A1† | 2.084% | 8/5/2034 | 142 | 142,409 | ||||||||
| Morgan Stanley Capital I Trust 2014-150E A† | 3.912% | 9/9/2032 | 11,430 | 12,010,754 | ||||||||
| Morgan Stanley Capital I Trust 2016-UB11 XA IO | 1.634% | #(l) | 8/15/2049 | 4,000 | 212,252 | |||||||
| Mortgage Repurchase Agreement Financing Trust Series 2021-S1 A1† | 0.591% (1 Mo. LIBOR + .50% | )# | 9/10/2022 | 9,500 | 9,511,832 | |||||||
| Motel Trust 2021-MTL6 D† | 2.19% (1 Mo. LIBOR + 2.10% | )# | 9/15/2038 | 4,385 | 4,386,334 | |||||||
| Motel Trust 2021-MTL6 E† | 2.79% (1 Mo. LIBOR + 2.70% | )# | 9/15/2038 | 5,150 | 5,152,793 | |||||||
| MRA Issuance Trust 2021-8 A2Y† | Zero Coupon | #(l) | 5/15/2022 | 31,300 | 31,533,091 | (c) | ||||||
| MSCG Trust 2015-ALDR A1† | 2.612% | 6/7/2035 | 262 | 265,965 | ||||||||
| New Residential Mortgage Loan Trust 2020-NQM1 A1† | 2.464% | #(l) | 1/26/2060 | 216 | 217,104 | |||||||
| NYO Commercial Mortgage Trust 2021-1290 A† | 1.175% (1 Mo. LIBOR + 1.10% | )# | 11/15/2038 | 10,340 | 10,321,369 | |||||||
| One New York Plaza Trust 2020-1NYP A† | 1.04% (1 Mo. LIBOR + .95% | )# | 1/15/2026 | 5,000 | 4,996,921 | |||||||
| One New York Plaza Trust 2020-1NYP AJ† | 1.34% (1 Mo. LIBOR + 1.25% | )# | 1/15/2026 | 3,250 | 3,255,837 | |||||||
| See Notes to Financial Statements. | 275 |
Schedule of Investments (continued)
INFLATION FOCUSED FUND November 30, 2021
| Investments | Interest Rate | Maturity Date | Principal Amount (000) | Fair Value | ||||||||
| NON-AGENCY COMMERCIAL MORTGAGE-BACKED SECURITIES (continued) | ||||||||||||
| One New York Plaza Trust 2020-1NYP B† | 1.59% (1 Mo. LIBOR + 1.50% | )# | 1/15/2026 | $ | 1,990 | $ | 1,997,007 | |||||
| PFP Ltd. 2019-6 A† | 1.141% (1 Mo. LIBOR + 1.05% | )# | 4/14/2037 | 513 | 511,864 | |||||||
| PFP Ltd. 2021-7 A† | 0.94% (1 Mo. LIBOR + .85% | )# | 4/14/2038 | 5,790 | 5,764,121 | |||||||
| RBS Commercial Funding, Inc. Trust 2013-GSP A† | 3.961% | #(l) | 1/15/2032 | 592 | 615,878 | |||||||
| Ready Capital Mortgage Financing LLC 2021-FL6 A† | 1.042% (1 Mo. LIBOR + .95% | )# | 7/25/2036 | 6,200 | 6,210,354 | |||||||
| ReadyCap Commercial Mortgage Trust 2018-4 A† | 3.39% | 2/27/2051 | 784 | 798,960 | ||||||||
| ReadyCap Commercial Mortgage Trust 2019-6 A† | 2.833% | 10/25/2052 | 651 | 658,949 | ||||||||
| Residential Mortgage Loan Trust 2020-1 A1† | 2.376% | #(l) | 1/26/2060 | 151 | 151,866 | |||||||
| SFO Commercial Mortgage Trust 2021 555 A† | 1.24% (1 Mo. LIBOR + 1.15% | )# | 5/15/2038 | 1,750 | 1,753,007 | |||||||
| SLIDE 2018-FUN A† | 1.24% (1 Mo. LIBOR + 1.15% | )# | 6/15/2031 | 3,206 | 3,201,410 | |||||||
| SLIDE 2018-FUN B† | 1.59% (1 Mo. LIBOR + 1.50% | )# | 6/15/2031 | 321 | 317,774 | |||||||
| SLIDE 2018-FUN C† | 1.89% (1 Mo. LIBOR + 1.80% | )# | 6/15/2031 | 252 | 248,597 | |||||||
| SLIDE 2018-FUN D† | 2.19% (1 Mo. LIBOR + 2.10% | )# | 6/15/2031 | 7,463 | 7,322,317 | |||||||
| SLIDE 2018-FUN XCP IO XCP† | Zero Coupon | #(l) | 12/15/2020 | 33,631 | 336 | |||||||
| SREIT Trust 2021-MFP A† | 0.831% (1 Mo. LIBOR + .73% | )# | 11/15/2038 | 11,500 | 11,451,618 | |||||||
| SREIT Trust 2021-MFP D† | 1.678% (1 Mo. LIBOR + 1.58% | )# | 11/15/2038 | 2,500 | 2,490,957 | |||||||
| Starwood Mortgage Residential Trust 2020-1 A1† | 2.275% | #(l) | 2/25/2050 | 247 | 248,580 | |||||||
| Starwood Mortgage Residential Trust 2021-2 A1† | 0.943% | #(l) | 5/25/2065 | 2,555 | 2,543,931 | |||||||
| Structured Asset Securities Corp. 2006-3H 1A3 | 5.75% | 12/25/2035 | 34 | 35,310 | ||||||||
| UBS-BAMLL Trust 2012-WRM A† | 3.663% | 6/10/2030 | 1,250 | 1,253,883 | ||||||||
| UBS-Barclays Commercial Mortgage Trust 2012-C2 A4 | 3.525% | 5/10/2063 | 305 | 307,254 | ||||||||
| UBS-Barclays Commercial Mortgage Trust 2013-C5 B† | 3.649% | #(l) | 3/10/2046 | 635 | 638,067 | |||||||
| UBS-Barclays Commercial Mortgage Trust 2013-C5 XA† | 1.038% | #(l) | 3/10/2046 | 8,429 | 52,164 | |||||||
| UBS-Barclays Commercial Mortgage Trust 2013-C6 XA IO† | 1.232% | #(l) | 4/10/2046 | 16,211 | 147,707 | |||||||
| 276 | See Notes to Financial Statements. |
Schedule of Investments (continued)
INFLATION FOCUSED FUND November 30, 2021
| Investments | Interest Rate | Maturity Date | Principal Amount (000) | Fair Value | ||||||||
| NON-AGENCY COMMERCIAL MORTGAGE-BACKED SECURITIES (continued) | ||||||||||||
| VASA Trust 2021-VASA B† | 1.34% (1 Mo. LIBOR + 1.25% | )# | 7/15/2039 | $ | 6,000 | $ | 6,011,394 | |||||
| Verus Securitization Trust 2020-1 A1† | 2.417% | 1/25/2060 | 242 | 243,322 | ||||||||
| Verus Securitization Trust 2020-4 A1† | 1.502% | 5/25/2065 | 311 | 311,497 | ||||||||
| Verus Securitization Trust 2020-5 A1† | 1.218% | 5/25/2065 | 251 | 250,744 | ||||||||
| Verus Securitization Trust 2021-1 A1† | 0.815% | #(l) | 1/25/2066 | 525 | 520,340 | |||||||
| Verus Securitization Trust 2021-3 A1† | 1.046% | #(l) | 6/25/2066 | 3,780 | 3,752,245 | |||||||
| Verus Securitization Trust 2021-5 A1† | 1.013% | #(l) | 9/25/2066 | 3,858 | 3,808,621 | |||||||
| Verus Securitization Trust 2021-R2 A1† | 0.918% | #(l) | 2/25/2064 | 902 | 899,732 | |||||||
| Verus Securitization Trust 2021-R3 A1† | 1.02% | #(l) | 4/25/2064 | 1,611 | 1,604,192 | |||||||
| Waikiki Beach Hotel Trust 2019-WBM D† | 2.119% (1 Mo. LIBOR + 2.03% | )# | 12/15/2033 | 1,100 | 1,093,092 | |||||||
| Wells Fargo Commercial Mortgage Trust 2010-C1 C IO XB | 0.095% | #(l) | 6/15/2048 | 58,000 | 96,187 | |||||||
| Wells Fargo Commercial Mortgage Trust 2015-C29 XA IO | 0.745% | #(l) | 6/15/2048 | 3,373 | 62,824 | |||||||
| Wells Fargo Commercial Mortgage Trust 2016-BNK1 XA IO | 1.863% | #(l) | 8/15/2049 | 1,655 | 109,253 | |||||||
| Wells Fargo Commercial Mortgage Trust 2016-C32 A4 | 3.56% | 1/15/2059 | 1,000 | 1,070,997 | ||||||||
| Wells Fargo Commercial Mortgage Trust 2016-LC24 XB IO XB | 1.127% | #(l) | 10/15/2049 | 7,057 | 308,035 | |||||||
| West Town Mall Trust 2017-KNOX B† | 4.322% | 7/5/2030 | 679 | 680,420 | ||||||||
| West Town Mall Trust 2017-KNOX C† | 4.491% | #(l) | 7/5/2030 | 500 | 497,370 | |||||||
| West Town Mall Trust 2017-KNOX D† | 4.491% | #(l) | 7/5/2030 | 625 | 619,119 | |||||||
| West Town Mall Trust 2017-KNOX B IO X† | 0.515% | #(l) | 7/5/2030 | 33,747 | 14,744 | |||||||
| WF-RBS Commercial Mortgage Trust 2012-C2 XA IO† | 1.436% | #(l) | 6/15/2045 | 9,541 | 12,095 | |||||||
| WF-RBS Commercial Mortgage Trust 2012-C7 A2 | 3.431% | 6/15/2045 | 790 | 794,653 | ||||||||
| WF-RBS Commercial Mortgage Trust 2012-C7 B | 4.881% | #(l) | 6/15/2045 | 300 | 288,629 | |||||||
| WF-RBS Commercial Mortgage Trust 2013-C11 AS | 3.311% | 3/15/2045 | 1,166 | 1,190,003 | ||||||||
| WF-RBS Commercial Mortgage Trust 2013-C13 XA IO† | 1.314% | #(l) | 5/15/2045 | 8,867 | 107,418 | |||||||
| WF-RBS Commercial Mortgage Trust 2014-C21 XB IO | 0.791% | #(l) | 8/15/2047 | 15,000 | 244,531 | |||||||
| ZH Trust 2021-2 A† | 2.349% | 10/17/2027 | 7,790 | 7,723,512 | (c) | |||||||
| Total Non-Agency Commercial Mortgage-Backed Securities (cost $632,584,293) | 626,560,878 | |||||||||||
| See Notes to Financial Statements. | 277 |
Schedule of Investments (continued)
INFLATION FOCUSED FUND November 30, 2021
| Investments | Exercise Price | Expiration Date | Shares (000) | Fair Value | ||||||||
| RIGHTS 0.00% | ||||||||||||
| Oil & Gas | ||||||||||||
| Dommo Energia SA*(e) | 0.70% | 12/23/2021 | BRL | 5 | $ | 37 | ||||||
| Interest Rate | Maturity Date | Principal Amount (000) | ||||||||||
| U.S. TREASURY OBLIGATIONS 11.07% | ||||||||||||
| U.S. Treasury Bill | Zero Coupon | 1/27/2022 | $ | 64,321 | 64,316,672 | |||||||
| U.S. Treasury Inflation Indexed Note | 0.125% | 10/15/2026 | 70,263 | 76,734,271 | ||||||||
| U.S. Treasury Note | 0.125% | 8/31/2023 | 12,380 | 12,304,559 | ||||||||
| U.S. Treasury Note | 0.375% | 10/31/2023 | 206,269 | 205,721,098 | ||||||||
| U.S. Treasury Note | 1.125% | 10/31/2026 | 54,275 | 54,207,156 | ||||||||
| Total U.S. Treasury Obligations (cost $413,798,927) | 413,283,756 | |||||||||||
| Exercise Price | Expiration Date | Shares (000) | ||||||||||
| WARRANTS 0.00% | ||||||||||||
| Miscellaneous Financials | ||||||||||||
| Sable Permian Resources†*(g) | $ – | (m) | 2/1/2024 | – | (d) | 11,592 | ||||||
| UTEX Industries, Inc.* | $114.76 | 12/3/2025 | – | (d) | 695 | |||||||
| Total Warrants (cost $2,805) | 12,287 | |||||||||||
| Total Long-Term Investments (cost $3,580,176,515) | 3,565,993,873 | |||||||||||
| Interest Rate | Maturity Date | Principal Amount (000) | ||||||||||
| SHORT-TERM INVESTMENTS 4.03% | ||||||||||||
| COMMERCIAL PAPER 1.17% | ||||||||||||
| Chemicals 0.21% | ||||||||||||
| FMC Corp. | 0.456% | 12/30/2021 | $ | 4,031 | 4,029,539 | |||||||
| FMC Corp. | 0.507% | 12/30/2021 | 3,846 | 3,844,451 | ||||||||
| Total | 7,873,990 | |||||||||||
| Computers 0.27% | ||||||||||||
| Fidelity National Information Services, Inc. | 0.233% | 12/8/2021 | 10,000 | 9,999,553 | ||||||||
| Electronics 0.36% | ||||||||||||
| Flex Ltd. | 0.385% | 12/7/2021 | 13,633 | 13,632,136 | ||||||||
| 278 | See Notes to Financial Statements. |
Schedule of Investments (continued)
INFLATION FOCUSED FUND November 30, 2021
| Investments | Interest Rate | Maturity Date | Principal Amount (000) | Fair Value | ||||||||
| Finance 0.19% | ||||||||||||
| Brookfield Infrastructure Holdings Canada, Inc. | 0.254% | 12/7/2021 | $ | 7,000 | $ | 6,999,708 | ||||||
| Retail 0.14% | ||||||||||||
| Autonation, Inc | 0.223% | 12/1/2021 | 5,225 | 5,225,000 | ||||||||
| Total Commercial Paper (cost $43,730,387) | 43,730,387 | |||||||||||
| REPURCHASE AGREEMENTS 2.86% | ||||||||||||
| Repurchase Agreement dated 11/30/2021, 0.00% due 12/1/2021 with Fixed Income Clearing Corp. collateralized by $108,975,600 of U.S. Treasury Note at 0.50% due 11/30/2023; value: $108,941,600; proceeds: $106,805,451 (cost $106,805,451) | 106,805 | 106,805,451 | ||||||||||
| Total Short-Term Investments (cost $150,535,838) | 150,535,838 | |||||||||||
| Total Investments in Securities 99.53% (cost $3,730,712,353) | 3,716,529,711 | |||||||||||
| Less Unfunded Loan Commitments (0.11%) (cost $3,956,314)(n) | (3,956,314 | ) | ||||||||||
| Net Investments in Securities 99.42% (cost $3,726,756,039) | 3,712,573,397 | |||||||||||
| Other Assets and Liabilities – Net(o) 0.58% | 21,445,540 | |||||||||||
| Net Assets 100.00% | $ | 3,734,018,937 | ||||||||||
| BRL | Brazilian Real. | |
| CMT | Constant Maturity Rate. | |
| IO | Interest Only. | |
| LIBOR | London Interbank Offered Rate. | |
| PIK | Payment-in-kind. | |
| SOFR | Secured Over Night Financing Rate. | |
| † | Security was purchased pursuant to Rule 144A under the Securities Act of 1933 and, unless registered under such Act or exempted from registration, may only be resold to qualified institutional buyers. At November 30, 2021, the total value of Rule 144A securities was $1,983,958,131, which represents 53.13% of net assets. | |
| # | Variable rate security. The interest rate represents the rate in effect at November 30, 2021. | |
| * | Non-income producing security. | |
| (a) | Securities purchased on a when-issued basis (See Note 2(j)). | |
| (b) | Variable Rate is Fixed to Float: Rate remains fixed or at Zero Coupon until designated future date. | |
| (c) | Level 3 Investment as described in Note 2(t) in the Notes to Financials. Security valued utilizing third party pricing information without adjustment. Such valuations are based on unobservable inputs. A significant change in third party information could result in a significantly lower or higher value of such Level 3 investments. | |
| (d) | Amount represents less than 1,000 shares. | |
| (e) | Investment in non-U.S. dollar denominated securities. | |
| (f) | Foreign security traded in U.S. dollars. | |
| (g) | Defaulted (non-income producing security). | |
| (h) | Floating Rate Loans in which the Fund invests generally pay interest at rates which are periodically re-determined at a margin above the London Interbank Offered Rate (“LIBOR”) or the prime rate offered by major U.S. banks. The rate(s) shown is the rate(s) in effect at November 30, 2021. | |
| (i) | Interest rate to be determined. | |
| (j) | Level 3 Investment as described in Note 2(t) in the Notes to Financials. Floating Rate Loans categorized as Level 3 are valued based on a single quotation obtained from a dealer. Accounting principles generally accepted in the United States of America do not require the Fund to create quantitative unobservable inputs that were not developed by the Fund. Therefore, the Fund does not have access to unobservable inputs and cannot disclose such inputs in the valuation. | |
| See Notes to Financial Statements. | 279 |
Schedule of Investments (continued)
INFLATION FOCUSED FUND November 30, 2021
| (k) | Security partially/fully unfunded. See Note (2(o)). | |
| (l) | Interest rate is based on the weighted average interest rates of the underlying mortgages within the mortgage pool. | |
| (m) | Cashless strike price. | |
| (n) | See Note (2(o)). | |
| (o) | Other Assets and Liabilities - Net include net unrealized appreciation/depreciation on futures contracts and swaps as follows: |
Centrally Cleared Interest Rate Swap Contracts at November 30, 2021:
| Central Clearingparty | Periodic Payments to be Made By The Fund (Quarterly) | Periodic Payments to be Received By The Fund (Quarterly) | Termination Date | Notional Amount | Value/ Unrealized Appreciation | |||||||||
| Bank of America(1) | 0.173% | 3-Month USD SOFR Index | 10/21/2025 | $ | 165,637 | $ | 4,927 | |||||||
| Bank of America(1) | 0.049% | 3-Month USD SOFR Index | 10/21/2022 | 593,263 | 722 | |||||||||
| Unrealized Appreciation on Centrally Cleared Interest Rate Swap Contracts | $ | 5,649 | ||||||||||||
| Central Clearingparty | Periodic Payments to be Made By The Fund (Quarterly) | Periodic Payments to be Received By The Fund (Quarterly) | Termination Date | Notional Amount | Unrealized Depreciation | |||||||||
| Bank of America(1) | 3-Month USD FedFunds Index | 0.051% | 10/21/2022 | $ | 593,263 | $ | (913 | ) | ||||||
| Bank of America(1) | 3-Month USD FedFunds Index | 0.184% | 10/21/2025 | 165,637 | (5,056 | ) | ||||||||
| Unrealized Depreciation on Centrally Cleared Interest Rate Swap Contracts | $ | (5,969 | ) | |||||||||||
| (1) | Central clearinghouse: Chicago Mercantile Exchange (CME). |
| 280 | See Notes to Financial Statements. |
Schedule of Investments (continued)
INFLATION FOCUSED FUND November 30, 2021
Open Consumer Price Index (“CPI”) Centrally Cleared Swaps at November 30, 2021:
| Swap Counterparty | Payments to be Made By The Fund at Termination Date | Payments to be Received By The Fund at Termination Date | Termination Date | Notional Amount | Value/ Unrealized Appreciation | |||||||||
| Bank of America | 0.400% | CPI Urban Consumer NSA | 3/25/2025 | $ | 20,000,000 | $ | 3,003,057 | |||||||
| Bank of America | 0.690% | CPI Urban Consumer NSA | 4/1/2025 | 20,000,000 | 2,714,173 | |||||||||
| Bank of America | 0.760% | CPI Urban Consumer NSA | 3/31/2025 | 15,000,000 | 1,982,581 | |||||||||
| Bank of America | 0.903% | CPI Urban Consumer NSA | 4/7/2025 | 15,000,000 | 1,880,968 | |||||||||
| Bank of America | 1.675% | CPI Urban Consumer NSA | 1/13/2022 | 20,000,000 | 873,576 | |||||||||
| Bank of America | 1.756% | CPI Urban Consumer NSA | 11/15/2024 | 10,000,000 | 827,619 | |||||||||
| Bank of America | 1.888% | CPI Urban Consumer NSA | 10/2/2029 | 5,000,000 | 604,105 | |||||||||
| Bank of America | 1.918% | CPI Urban Consumer NSA | 6/14/2029 | 10,000,000 | 1,089,977 | |||||||||
| Bank of America | 1.935% | CPI Urban Consumer NSA | 9/1/2029 | 5,000,000 | 605,434 | |||||||||
| Bank of America | 1.953% | CPI Urban Consumer NSA | 10/15/2029 | 7,000,000 | 796,525 | |||||||||
| Bank of America | 1.964% | CPI Urban Consumer NSA | 11/27/2029 | 5,000,000 | 559,059 | |||||||||
| Bank of America | 1.976% | CPI Urban Consumer NSA | 12/2/2028 | 10,000,000 | 1,050,748 | |||||||||
| Bank of America | 1.980% | CPI Urban Consumer NSA | 10/14/2029 | 5,000,000 | 556,345 | |||||||||
| Bank of America | 2.030% | CPI Urban Consumer NSA | 5/3/2022 | 15,000,000 | 768,151 | |||||||||
| Bank of America | 2.085% | CPI Urban Consumer NSA | 12/10/2028 | 10,000,000 | 958,467 | |||||||||
| Bank of America | 2.107% | CPI Urban Consumer NSA | 2/21/2031 | 5,000,000 | 487,743 | |||||||||
| Bank of America | 2.112% | CPI Urban Consumer NSA | 12/8/2029 | 5,000,000 | 487,012 | |||||||||
| Bank of America | 2.113% | CPI Urban Consumer NSA | 12/29/2027 | 5,000,000 | 439,113 | |||||||||
| Bank of America | 2.119% | CPI Urban Consumer NSA | 4/12/2022 | 25,000,000 | 1,129,576 | |||||||||
| Bank of America | 2.119% | CPI Urban Consumer NSA | 2/11/2031 | 15,000,000 | 1,422,008 | |||||||||
| Bank of America | 2.229% | CPI Urban Consumer NSA | 1/6/2033 | 5,000,000 | 465,297 | |||||||||
| Bank of America | 2.269% | CPI Urban Consumer NSA | 10/30/2030 | 10,000,000 | 715,263 | |||||||||
| Bank of America | 2.285% | CPI Urban Consumer NSA | 5/31/2028 | 10,000,000 | 624,722 | |||||||||
| Bank of America | 2.295% | CPI Urban Consumer NSA | 1/15/2046 | 5,000,000 | 488,633 | |||||||||
| Bank of America | 2.302% | CPI Urban Consumer NSA | 1/11/2033 | 5,000,000 | 416,659 | |||||||||
| See Notes to Financial Statements. | 281 |
Schedule of Investments (continued)
INFLATION FOCUSED FUND November 30, 2021
| Swap Counterparty | Payments to be Made By The Fund at Termination Date | Payments to be Received By The Fund at Termination Date | Termination Date | Notional Amount | Value/ Unrealized Appreciation | |||||||||
| Bank of America | 2.309% | CPI Urban Consumer NSA | 1/19/2033 | $ | 5,000,000 | $ | 411,176 | |||||||
| Bank of America | 2.310% | CPI Urban Consumer NSA | 6/1/2028 | 10,000,000 | 601,171 | |||||||||
| Bank of America | 2.335% | CPI Urban Consumer NSA | 11/17/2036 | 8,000,000 | 517,975 | |||||||||
| Bank of America | 2.335% | CPI Urban Consumer NSA | 11/21/2036 | 10,000,000 | 646,047 | |||||||||
| Bank of America | 2.340% | CPI Urban Consumer NSA | 3/23/2032 | 5,000,000 | 298,663 | |||||||||
| Bank of America | 2.341% | CPI Urban Consumer NSA | 8/27/2028 | 10,000,000 | 547,069 | |||||||||
| Bank of America | 2.343% | CPI Urban Consumer NSA | 9/11/2028 | 10,000,000 | 549,007 | |||||||||
| Bank of America | 2.344% | CPI Urban Consumer NSA | 3/15/2029 | 5,000,000 | 278,839 | |||||||||
| Bank of America | 2.345% | CPI Urban Consumer NSA | 8/14/2028 | 10,000,000 | 539,400 | |||||||||
| Bank of America | 2.353% | CPI Urban Consumer NSA | 6/6/2028 | 10,000,000 | 551,710 | |||||||||
| Bank of America | 2.355% | CPI Urban Consumer NSA | 3/8/2032 | 10,000,000 | 585,613 | |||||||||
| Bank of America | 2.358% | CPI Urban Consumer NSA | 7/25/2028 | 10,000,000 | 526,748 | |||||||||
| Bank of America | 2.363% | CPI Urban Consumer NSA | 3/21/2032 | 5,000,000 | 279,519 | |||||||||
| Bank of America | 2.363% | CPI Urban Consumer NSA | 1/23/2033 | 5,000,000 | 295,708 | |||||||||
| Bank of America | 2.363% | CPI Urban Consumer NSA | 1/25/2033 | 5,000,000 | 295,908 | |||||||||
| Bank of America | 2.365% | CPI Urban Consumer NSA | 1/30/2038 | 10,000,000 | 564,387 | |||||||||
| Bank of America | 2.370% | CPI Urban Consumer NSA | 4/18/2030 | 25,000,000 | 1,350,123 | |||||||||
| Bank of America | 2.370% | CPI Urban Consumer NSA | 2/28/2038 | 5,000,000 | 276,575 | |||||||||
| Bank of America | 2.375% | CPI Urban Consumer NSA | 8/9/2028 | 10,000,000 | 504,839 | |||||||||
| Bank of America | 2.377% | CPI Urban Consumer NSA | 7/21/2034 | 20,000,000 | 1,094,518 | |||||||||
| Bank of America | 2.379% | CPI Urban Consumer NSA | 9/21/2028 | 15,000,000 | 767,951 | |||||||||
| Bank of America | 2.380% | CPI Urban Consumer NSA | 7/6/2028 | 10,000,000 | 512,206 | |||||||||
| Bank of America | 2.380% | CPI Urban Consumer NSA | 7/17/2028 | 15,000,000 | 759,073 | |||||||||
| Bank of America | 2.384% | CPI Urban Consumer NSA | 10/1/2028 | 10,000,000 | 511,134 | |||||||||
| Bank of America | 2.385% | CPI Urban Consumer NSA | 8/6/2028 | 25,000,000 | 1,232,291 | |||||||||
| Bank of America | 2.390% | CPI Urban Consumer NSA | 6/14/2028 | 45,000,000 | 2,282,818 | |||||||||
| 282 | See Notes to Financial Statements. |
Schedule of Investments (continued)
INFLATION FOCUSED FUND November 30, 2021
| Swap Counterparty | Payments to be Made By The Fund at Termination Date | Payments to be Received By The Fund at Termination Date | Termination Date | Notional Amount | Value/ Unrealized Appreciation | |||||||||
| Bank of America | 2.390% | CPI Urban Consumer NSA | 8/3/2028 | $ | 10,000,000 | $ | 486,046 | |||||||
| Bank of America | 2.393% | CPI Urban Consumer NSA | 5/11/2028 | 10,000,000 | 487,354 | |||||||||
| Bank of America | 2.396% | CPI Urban Consumer NSA | 10/9/2028 | 10,000,000 | 500,757 | |||||||||
| Bank of America | 2.400% | CPI Urban Consumer NSA | 4/26/2030 | 10,000,000 | 495,986 | |||||||||
| Bank of America | 2.408% | CPI Urban Consumer NSA | 5/21/2028 | 5,000,000 | 240,651 | |||||||||
| Bank of America | 2.410% | CPI Urban Consumer NSA | 3/15/2031 | 5,000,000 | 339,372 | |||||||||
| Bank of America | 2.410% | CPI Urban Consumer NSA | 4/12/2036 | 5,000,000 | 313,487 | |||||||||
| Bank of America | 2.420% | CPI Urban Consumer NSA | 9/27/2037 | 15,000,000 | 442,573 | |||||||||
| Bank of America | 2.420% | CPI Urban Consumer NSA | 4/23/2041 | 10,000,000 | 551,849 | |||||||||
| Bank of America | 2.425% | CPI Urban Consumer NSA | 3/16/2031 | 20,000,000 | 1,322,543 | |||||||||
| Bank of America | 2.429% | CPI Urban Consumer NSA | 7/27/2036 | 20,000,000 | 866,044 | |||||||||
| Bank of America | 2.434% | CPI Urban Consumer NSA | 3/23/2031 | 10,000,000 | 648,934 | |||||||||
| Bank of America | 2.437% | CPI Urban Consumer NSA | 9/7/2037 | 10,000,000 | 294,519 | |||||||||
| Bank of America | 2.439% | CPI Urban Consumer NSA | 4/13/2033 | 10,000,000 | 612,996 | |||||||||
| Bank of America | 2.439% | CPI Urban Consumer NSA | 8/17/2041 | 10,000,000 | 288,240 | |||||||||
| Bank of America | 2.440% | CPI Urban Consumer NSA | 3/18/2033 | 15,000,000 | 934,639 | |||||||||
| Bank of America | 2.443% | CPI Urban Consumer NSA | 4/14/2033 | 10,000,000 | 607,585 | |||||||||
| Bank of America | 2.443% | CPI Urban Consumer NSA | 3/26/2036 | 10,000,000 | 576,941 | |||||||||
| Bank of America | 2.446% | CPI Urban Consumer NSA | 4/6/2041 | 5,000,000 | 251,560 | |||||||||
| Bank of America | 2.453% | CPI Urban Consumer NSA | 4/19/2036 | 10,000,000 | 548,474 | |||||||||
| Bank of America | 2.457% | CPI Urban Consumer NSA | 4/9/2031 | 10,000,000 | 615,509 | |||||||||
| Bank of America | 2.459% | CPI Urban Consumer NSA | 3/29/2033 | 10,000,000 | 593,193 | |||||||||
| Bank of America | 2.463% | CPI Urban Consumer NSA | 4/16/2031 | 10,000,000 | 604,791 | |||||||||
| Bank of America | 2.463% | CPI Urban Consumer NSA | 8/27/2033 | 20,000,000 | 680,702 | |||||||||
| Bank of America | 2.468% | CPI Urban Consumer NSA | 4/28/2031 | 10,000,000 | 592,298 | |||||||||
| Bank of America | 2.468% | CPI Urban Consumer NSA | 4/7/2033 | 10,000,000 | 577,987 | |||||||||
| See Notes to Financial Statements. | 283 |
Schedule of Investments (continued)
INFLATION FOCUSED FUND November 30, 2021
| Swap Counterparty | Payments to be Made By The Fund at Termination Date | Payments to be Received By The Fund at Termination Date | Termination Date | Notional Amount | Value/ Unrealized Appreciation | |||||||||
| Bank of America | 2.470% | CPI Urban Consumer NSA | 4/7/2033 | $ | 10,000,000 | $ | 575,281 | |||||||
| Bank of America | 2.474% | CPI Urban Consumer NSA | 3/22/2031 | 10,000,000 | 605,771 | |||||||||
| Bank of America | 2.475% | CPI Urban Consumer NSA | 3/19/2031 | 10,000,000 | 604,323 | |||||||||
| Bank of America | 2.475% | CPI Urban Consumer NSA | 4/21/2036 | 20,000,000 | 1,013,152 | |||||||||
| Bank of America | 2.476% | CPI Urban Consumer NSA | 4/27/2031 | 15,000,000 | 877,265 | |||||||||
| Bank of America | 2.477% | CPI Urban Consumer NSA | 6/11/2036 | 10,000,000 | 445,883 | |||||||||
| Bank of America | 2.480% | CPI Urban Consumer NSA | 4/1/2033 | 5,000,000 | 282,949 | |||||||||
| Bank of America | 2.481% | CPI Urban Consumer NSA | 7/29/2033 | 15,000,000 | 593,030 | |||||||||
| Bank of America | 2.481% | CPI Urban Consumer NSA | 8/12/2036 | 15,000,000 | 448,501 | |||||||||
| Bank of America | 2.483% | CPI Urban Consumer NSA | 4/26/2031 | 10,000,000 | 578,486 | |||||||||
| Bank of America | 2.484% | CPI Urban Consumer NSA | 6/25/2030 | 20,000,000 | 1,000,200 | |||||||||
| Bank of America | 2.484% | CPI Urban Consumer NSA | 4/6/2033 | 15,000,000 | 836,539 | |||||||||
| Bank of America | 2.489% | CPI Urban Consumer NSA | 9/9/2034 | 20,000,000 | 513,773 | |||||||||
| Bank of America | 2.493% | CPI Urban Consumer NSA | 6/28/2030 | 25,000,000 | 1,215,675 | |||||||||
| Bank of America | 2.496% | CPI Urban Consumer NSA | 3/31/2031 | 15,000,000 | 862,701 | |||||||||
| Bank of America | 2.496% | CPI Urban Consumer NSA | 3/30/2033 | 10,000,000 | 542,906 | |||||||||
| Bank of America | 2.498% | CPI Urban Consumer NSA | 9/1/2036 | 20,000,000 | 421,330 | |||||||||
| Bank of America | 2.502% | CPI Urban Consumer NSA | 9/29/2034 | 20,000,000 | 418,479 | |||||||||
| Bank of America | 2.507% | CPI Urban Consumer NSA | 5/10/2041 | 10,000,000 | 328,707 | |||||||||
| Bank of America | 2.510% | CPI Urban Consumer NSA | 6/30/2030 | 20,000,000 | 928,296 | |||||||||
| Bank of America | 2.513% | CPI Urban Consumer NSA | 6/17/2029 | 25,000,000 | 1,213,198 | |||||||||
| Bank of America | 2.513% | CPI Urban Consumer NSA | 6/18/2029 | 30,000,000 | 1,448,595 | |||||||||
| Bank of America | 2.520% | CPI Urban Consumer NSA | 4/29/2031 | 15,000,000 | 801,020 | |||||||||
| Bank of America | 2.521% | CPI Urban Consumer NSA | 5/21/2046 | 13,000,000 | 258,395 | |||||||||
| Bank of America | 2.522% | CPI Urban Consumer NSA | 5/28/2036 | 15,000,000 | 587,903 | |||||||||
| Bank of America | 2.525% | CPI Urban Consumer NSA | 10/1/2035 | 30,000,000 | 438,634 | |||||||||
| 284 | See Notes to Financial Statements. |
Schedule of Investments (continued)
INFLATION FOCUSED FUND November 30, 2021
| Swap Counterparty | Payments to be Made By The Fund at Termination Date | Payments to be Received By The Fund at Termination Date | Termination Date | Notional Amount | Value/ Unrealized Appreciation | |||||||||
| Bank of America | 2.534% | CPI Urban Consumer NSA | 5/5/2032 | $ | 10,000,000 | $ | 492,172 | |||||||
| Bank of America | 2.536% | CPI Urban Consumer NSA | 5/5/2032 | 10,000,000 | 489,391 | |||||||||
| Bank of America | 2.540% | CPI Urban Consumer NSA | 9/15/2034 | 20,000,000 | 346,759 | |||||||||
| Bank of America | 2.545% | CPI Urban Consumer NSA | 9/14/2034 | 15,000,000 | 252,328 | |||||||||
| Bank of America | 2.554% | CPI Urban Consumer NSA | 6/8/2031 | 15,000,000 | 679,370 | |||||||||
| Bank of America | 2.559% | CPI Urban Consumer NSA | 6/1/2030 | 20,000,000 | 941,959 | |||||||||
| Bank of America | 2.560% | CPI Urban Consumer NSA | 4/30/2031 | 15,000,000 | 733,683 | |||||||||
| Bank of America | 2.560% | CPI Urban Consumer NSA | 6/2/2031 | 20,000,000 | 914,573 | |||||||||
| Bank of America | 2.564% | CPI Urban Consumer NSA | 6/15/2029 | 30,000,000 | 1,331,023 | |||||||||
| Bank of America | 2.564% | CPI Urban Consumer NSA | 6/7/2033 | 20,000,000 | 780,642 | |||||||||
| Bank of America | 2.565% | CPI Urban Consumer NSA | 5/6/2031 | 10,000,000 | 478,810 | |||||||||
| Bank of America | 2.566% | CPI Urban Consumer NSA | 5/28/2031 | 15,000,000 | 686,466 | |||||||||
| Bank of America | 2.571% | CPI Urban Consumer NSA | 6/4/2033 | 20,000,000 | 774,783 | |||||||||
| Bank of America | 2.581% | CPI Urban Consumer NSA | 5/4/2031 | 25,000,000 | 1,161,952 | |||||||||
| Bank of America | 2.585% | CPI Urban Consumer NSA | 5/12/2036 | 15,000,000 | 446,924 | |||||||||
| Bank of America | 2.586% | CPI Urban Consumer NSA | 6/3/2031 | 15,000,000 | 639,392 | |||||||||
| Bank of America | 2.593% | CPI Urban Consumer NSA | 5/17/2036 | 10,000,000 | 281,851 | |||||||||
| Bank of America | 2.623% | CPI Urban Consumer NSA | 5/11/2031 | 10,000,000 | 411,101 | |||||||||
| Bank of America | 2.748% | CPI Urban Consumer NSA | 10/8/2027 | 50,000,000 | 579,930 | |||||||||
| Bank of America | 2.854% | CPI Urban Consumer NSA | 10/14/2027 | 50,000,000 | 235,310 | |||||||||
| Bank of America | 2.354% | CPI Urban Consumer NSA | 3/6/2032 | 5,000,000 | 295,370 | |||||||||
| Unrealized Appreciation on CPI Centrally Cleared Swaps | $ | 86,997,090 | ||||||||||||
| See Notes to Financial Statements. | 285 |
Schedule of Investments (continued)
INFLATION FOCUSED FUND November 30, 2021
Open Consumer Price Index (“CPI”) Centrally Cleared Swaps at November 30, 2021:
| Swap Counterparty | Payments to be Made By The Fund at Termination Date | Payments to be Received By The Fund at Termination Date | Termination Date | Notional Amount | Value/ Unrealized Depreciation | |||||||||
| Bank of America | 2.638% | CPI Urban Consumer | 11/15/2051 | $ | 35,000,000 | $ | (2,273,692) | (2) | ||||||
| Bank of America | 2.714% | CPI Urban Consumer | 10/20/2034 | 25,000,000 | (285,050) | |||||||||
| Bank of America | 2.788% | CPI Urban Consumer | 6/8/2026 | 5,000,000 | (514,010) | |||||||||
| Bank of America | 2.823% | CPI Urban Consumer | 10/22/2029 | 50,000,000 | (35,516) | |||||||||
| Bank of America | CPI Urban Consumer | 1.668% | 6/30/2026 | 7,000,000 | (907,675) | |||||||||
| Bank of America | CPI Urban Consumer | 1.818% | 8/28/2022 | 60,000,000 | (4,124,899) | |||||||||
| Bank of America | CPI Urban Consumer | 1.924% | 4/10/2022 | 10,000,000 | (557,857) | |||||||||
| Bank of America | CPI Urban Consumer | 1.935% | 6/9/2022 | 10,000,000 | (589,647) | |||||||||
| Bank of America | CPI Urban Consumer | 2.032% | 11/30/2023 | 30,000,000 | (1,756,382) | |||||||||
| Bank of America | CPI Urban Consumer | 2.036% | 11/21/2022 | 10,000,000 | (530,678) | |||||||||
| Bank of America | CPI Urban Consumer | 2.054% | 12/5/2022 | 10,000,000 | (509,136) | |||||||||
| Unrealized Depreciation on CPI Centrally Cleared Swaps | $ | (12,084,542) | ||||||||||||
| (2) | Includes upfront payment of $54,960. |
Open Consumer Price Index (“CPI”) OTC Swaps at November 30, 2021:
| Swap Counterparty | Payments to be Made By The Fund at Termination Date | Payments to be Received By The Fund at Termination Date | Termination Date | Notional Amount | Value/ Unrealized Appreciation | |||||||||
| Bank of America | 1.676% | CPI Urban Consumer NSA | 8/4/2026 | $ | 15,000,000 | $ | 1,896,094 | |||||||
| Bank of America | 1.747% | CPI Urban Consumer NSA | 8/22/2026 | 20,000,000 | 2,349,997 | |||||||||
| Bank of America | 2.080% | CPI Urban Consumer NSA | 4/22/2025 | 10,000,000 | 660,283 | |||||||||
| Bank of America | 2.100% | CPI Urban Consumer NSA | 4/26/2025 | 10,000,000 | 664,119 | |||||||||
| Bank of America | 2.144% | CPI Urban Consumer NSA | 7/24/2029 | 10,000,000 | 899,350 | |||||||||
| Bank of America | 2.148% | CPI Urban Consumer NSA | 7/31/2029 | 10,000,000 | 897,270 | |||||||||
| Bank of America | 2.213% | CPI Urban Consumer NSA | 10/25/2032 | 5,000,000 | 454,916 | |||||||||
| Bank of America | 2.275% | CPI Urban Consumer NSA | 1/6/2026 | 20,000,000 | 1,122,898 | |||||||||
| Bank of America | 2.298% | CPI Urban Consumer NSA | 4/5/2029 | 5,000,000 | 304,440 | |||||||||
| Bank of America | 2.301% | CPI Urban Consumer NSA | 3/28/2029 | 5,000,000 | 302,986 | |||||||||
| 286 | See Notes to Financial Statements. |
Schedule of Investments (continued)
INFLATION FOCUSED FUND November 30, 2021
| Swap Counterparty | Payments to be Made By The Fund at Termination Date | Payments to be Received By The Fund at Termination Date | Termination Date | Notional Amount | Value/ Unrealized Appreciation | |||||||||
| Bank of America | 2.345% | CPI Urban Consumer NSA | 2/13/2029 | $ | 30,000,000 | $ | 1,716,657 | |||||||
| Bank of America | 2.348% | CPI Urban Consumer NSA | 3/10/2032 | 5,000,000 | 298,072 | |||||||||
| Bank of America | 2.360% | CPI Urban Consumer NSA | 2/8/2029 | 10,000,000 | 552,893 | |||||||||
| Bank of America | 2.360% | CPI Urban Consumer NSA | 2/15/2029 | 10,000,000 | 550,098 | |||||||||
| Bank of America | 2.363% | CPI Urban Consumer NSA | 2/1/2038 | 5,000,000 | 284,049 | |||||||||
| Bank of America | 2.370% | CPI Urban Consumer NSA | 1/26/2029 | 5,000,000 | 269,735 | |||||||||
| Bank of America | 2.370% | CPI Urban Consumer NSA | 2/27/2029 | 10,000,000 | 531,077 | |||||||||
| Bank of America | 2.376% | CPI Urban Consumer NSA | 2/26/2038 | 5,000,000 | 266,577 | |||||||||
| Bank of America | 2.380% | CPI Urban Consumer NSA | 1/13/2029 | 10,000,000 | 518,191 | |||||||||
| Bank of America | 2.380% | CPI Urban Consumer NSA | 1/18/2029 | 10,000,000 | 523,014 | |||||||||
| Bank of America | 2.398% | CPI Urban Consumer NSA | 1/24/2029 | 10,000,000 | 499,666 | |||||||||
| Bank of America | 2.398% | CPI Urban Consumer NSA | 2/12/2033 | 5,000,000 | 261,293 | |||||||||
| Barclays Bank plc | 1.874% | CPI Urban Consumer NSA | 4/11/2026 | 10,000,000 | 1,051,932 | |||||||||
| Barclays Bank plc | 1.944% | CPI Urban Consumer NSA | 3/22/2041 | 5,000,000 | 923,095 | |||||||||
| Barclays Bank plc | 1.960% | CPI Urban Consumer NSA | 2/5/2025 | 10,000,000 | 636,389 | |||||||||
| Barclays Bank plc | 2.128% | CPI Urban Consumer NSA | 6/22/2025 | 10,000,000 | 603,800 | |||||||||
| Barclays Bank plc | 2.158% | CPI Urban Consumer NSA | 12/2/2024 | 10,000,000 | 630,950 | |||||||||
| Barclays Bank plc | 2.159% | CPI Urban Consumer NSA | 11/25/2024 | 15,000,000 | 948,648 | |||||||||
| Barclays Bank plc | 2.205% | CPI Urban Consumer NSA | 12/9/2024 | 15,000,000 | 878,753 | |||||||||
| Barclays Bank plc | 2.207% | CPI Urban Consumer NSA | 1/11/2025 | 20,000,000 | 1,154,858 | |||||||||
| Barclays Bank plc | 2.223% | CPI Urban Consumer NSA | 12/30/2023 | 30,000,000 | 1,511,725 | |||||||||
| Barclays Bank plc | 2.228% | CPI Urban Consumer NSA | 12/5/2024 | 15,000,000 | 849,852 | |||||||||
| Barclays Bank plc | 2.354% | CPI Urban Consumer NSA | 12/23/2031 | 10,000,000 | 599,608 | |||||||||
| Barclays Bank plc | 2.393% | CPI Urban Consumer NSA | 12/13/2031 | 5,000,000 | 266,016 | |||||||||
| Barclays Bank plc | 2.410% | CPI Urban Consumer NSA | 2/1/2032 | 10,000,000 | 499,238 | |||||||||
| Deutsche Bank AG | 1.698% | CPI Urban Consumer NSA | 9/2/2022 | 10,000,000 | 686,097 | |||||||||
| See Notes to Financial Statements. | 287 |
Schedule of Investments (continued)
INFLATION FOCUSED FUND November 30, 2021
| Swap Counterparty | Payments to be Made By The Fund at Termination Date | Payments to be Received By The Fund at Termination Date | Termination Date | Notional Amount | Value/ Unrealized Appreciation | |||||||||
| Deutsche Bank AG | 2.059% | CPI Urban Consumer NSA | 5/21/2025 | $ | 20,000,000 | $ | 1,355,510 | |||||||
| Goldman Sachs | 1.568% | CPI Urban Consumer NSA | 3/2/2024 | 8,000,000 | 874,638 | |||||||||
| Goldman Sachs | 1.649% | CPI Urban Consumer NSA | 3/4/2024 | 5,000,000 | 510,594 | |||||||||
| Goldman Sachs | 2.183% | CPI Urban Consumer NSA | 3/20/2022 | 20,000,000 | 826,294 | |||||||||
| Goldman Sachs | 2.230% | CPI Urban Consumer NSA | 12/14/2024 | 10,000,000 | 560,647 | |||||||||
| Goldman Sachs | 2.317% | CPI Urban Consumer NSA | 3/16/2029 | 5,000,000 | 297,076 | |||||||||
| Goldman Sachs | 2.350% | CPI Urban Consumer NSA | 12/16/2036 | 10,000,000 | 593,976 | |||||||||
| Goldman Sachs | 2.363% | CPI Urban Consumer NSA | 6/21/2027 | 20,000,000 | 1,022,634 | |||||||||
| Goldman Sachs | 2.370% | CPI Urban Consumer NSA | 5/16/2028 | 10,000,000 | 517,636 | |||||||||
| Goldman Sachs | 2.372% | CPI Urban Consumer NSA | 5/3/2030 | 5,000,000 | 268,115 | |||||||||
| Goldman Sachs | 2.378% | CPI Urban Consumer NSA | 4/17/2030 | 5,000,000 | 264,500 | |||||||||
| Goldman Sachs | 2.380% | CPI Urban Consumer NSA | 12/8/2031 | 10,000,000 | 558,563 | |||||||||
| Goldman Sachs | 2.390% | CPI Urban Consumer NSA | 2/7/2032 | 5,000,000 | 265,554 | |||||||||
| J.P. Morgan | 1.950% | CPI Urban Consumer NSA | 10/14/2026 | 10,000,000 | 979,599 | |||||||||
| J.P. Morgan | 2.074% | CPI Urban Consumer NSA | 11/21/2023 | 35,000,000 | 1,113,367 | |||||||||
| Unrealized Appreciation on CPI OTC Swaps | $ | 37,073,339 | ||||||||||||
Open Consumer Price Index (“CPI”) OTC Swaps at November 30, 2021:
| Swap Counterparty | Payments to be Made By The Fund at Termination Date | Payments to be Received By The Fund at Termination Date | Termination Date | Notional Amount | Unrealized Depreciation | |||||||||
| Credit Suisse | 2.671% | CPI Urban Consumer NSA | 4/11/2022 | $ | 30,000,000 | $ | (1,532,737) | |||||||
| Credit Suisse | 2.864% | CPI Urban Consumer NSA | 3/22/2032 | 8,000,000 | (1,196,312) | |||||||||
| Bank of America | 2.445% | CPI Urban Consumer NSA | 4/24/2023 | 40,000,000 | (584,638) | |||||||||
| Bank of America | 2.590% | CPI Urban Consumer NSA | 6/26/2023 | 40,000,000 | (1,259,432) | |||||||||
| Bank of America | CPI Urban Consumer NSA | 1.645% | 10/1/2025 | 15,000,000 | (1,689,392) | |||||||||
| Bank of America | CPI Urban Consumer NSA | 1.813% | 3/31/2026 | 5,000,000 | (551,593) | |||||||||
| Bank of America | CPI Urban Consumer NSA | 1.936% | 5/22/2022 | 10,000,000 | (584,367) | |||||||||
| 288 | See Notes to Financial Statements. |
Schedule of Investments (continued)
INFLATION FOCUSED FUND November 30, 2021
| Swap Counterparty | Payments to be Made By The Fund at Termination Date | Payments to be Received By The Fund at Termination Date | Termination Date | Notional Amount | Value/ Unrealized Depreciation | |||||||||
| Bank of America | CPI Urban Consumer NSA | 2.069% | 11/10/2022 | $ | 15,000,000 | $ | (792,101) | |||||||
| Bank of America | CPI Urban Consumer NSA | 2.140% | 2/10/2022 | 30,000,000 | (1,251,514) | |||||||||
| Bank of America | CPI Urban Consumer NSA | 2.194% | 1/19/2022 | 30,000,000 | (1,036,766) | |||||||||
| Bank of America | CPI Urban Consumer NSA | 2.195% | 2/24/2022 | 25,000,000 | (996,974) | |||||||||
| Bank of America | 2.825% | CPI Urban Consumer NSA | 7/22/2023 | 5,000,000 | (520,063) | |||||||||
| Barclays Bank plc | 2.529% | CPI Urban Consumer NSA | 7/8/2022 | 30,000,000 | (779,205) | |||||||||
| Barclays Bank plc | 2.945% | CPI Urban Consumer NSA | 3/5/2038 | 15,000,000 | (3,283,085) | |||||||||
| Barclays Bank plc | CPI Urban Consumer NSA | 1.562% | 10/22/2022 | 10,000,000 | (814,851) | |||||||||
| Barclays Bank plc | CPI Urban Consumer NSA | 2.150% | 2/10/2023 | 30,000,000 | (1,444,365) | |||||||||
| Barclays Bank plc | CPI Urban Consumer NSA | 2.193% | 1/19/2022 | 40,000,000 | (1,384,540) | |||||||||
| Deutsche Bank AG | 2.465% | CPI Urban Consumer NSA | 11/30/2031 | 5,000,000 | (197,798) | |||||||||
| Deutsche Bank AG | 2.505% | CPI Urban Consumer NSA | 12/7/2031 | 5,000,000 | (252,173) | |||||||||
| Deutsche Bank AG | 2.518% | CPI Urban Consumer NSA | 4/17/2026 | 15,000,000 | (260,513) | |||||||||
| Deutsche Bank AG | 2.745% | CPI Urban Consumer NSA | 3/20/2022 | 30,000,000 | (1,769,502) | |||||||||
| Deutsche Bank AG | 2.748% | CPI Urban Consumer NSA | 2/26/2022 | 30,000,000 | (1,872,210) | |||||||||
| Deutsche Bank AG | 2.750% | CPI Urban Consumer NSA | 3/30/2032 | 6,000,000 | (698,439) | |||||||||
| Deutsche Bank AG | 2.779% | CPI Urban Consumer NSA | 3/12/2022 | 25,000,000 | (1,589,760) | |||||||||
| Deutsche Bank AG | 3.010% | CPI Urban Consumer NSA | 2/15/2033 | 15,000,000 | (2,768,442) | |||||||||
| Deutsche Bank AG | CPI Urban Consumer NSA | 1.618% | 8/25/2023 | 15,000,000 | (1,322,847) | |||||||||
| Deutsche Bank AG | CPI Urban Consumer NSA | 1.650% | 1/20/2026 | 10,000,000 | (1,218,224) | |||||||||
| Deutsche Bank AG | CPI Urban Consumer NSA | 1.667% | 4/20/2023 | 20,000,000 | (1,829,931) | |||||||||
| Deutsche Bank AG | CPI Urban Consumer NSA | 1.673% | 4/20/2023 | 20,000,000 | (1,821,472) | |||||||||
| Deutsche Bank AG | CPI Urban Consumer NSA | 2.105% | 7/10/2025 | 10,000,000 | (626,477) | |||||||||
| Goldman Sachs | 2.448% | CPI Urban Consumer NSA | 4/24/2023 | 30,000,000 | (446,623) | |||||||||
| Goldman Sachs | 2.773% | CPI Urban Consumer NSA | 4/3/2023 | 20,000,000 | (1,352,765) | |||||||||
| Goldman Sachs | 2.945% | CPI Urban Consumer NSA | 1/16/2038 | 15,000,000 | (3,388,767) | |||||||||
| See Notes to Financial Statements. | 289 |
Schedule of Investments (continued)
INFLATION FOCUSED FUND November 30, 2021
| Swap Counterparty | Payments to be Made By The Fund at Termination Date | Payments to be Received By The Fund at Termination Date | Termination Date | Notional Amount | Value/ Unrealized Depreciation | |||||||||
| Goldman Sachs | 2.980% | CPI Urban Consumer NSA | 2/7/2033 | 10,000,000 | $ | (1,763,939) | ||||||||
| Goldman Sachs | CPI Urban Consumer NSA | 1.988% | 5/25/2023 | $ | 10,000,000 | (621,497) | ||||||||
| Goldman Sachs | CPI Urban Consumer NSA | 2.063% | 12/8/2024 | 15,000,000 | (631,211) | |||||||||
| Goldman Sachs | CPI Urban Consumer NSA | 2.313% | 9/30/2024 | 30,000,000 | (174,727) | |||||||||
| J.P. Morgan | 2.756% | CPI Urban Consumer NSA | 3/25/2022 | 30,000,000 | (1,793,805) | |||||||||
| J.P. Morgan | 2.815% | CPI Urban Consumer NSA | 4/5/2032 | 5,000,000 | (676,749) | |||||||||
| J.P. Morgan | 2.955% | CPI Urban Consumer NSA | 7/15/2026 | 5,000,000 | (708,152) | |||||||||
| J.P. Morgan | CPI Urban Consumer NSA | 1.645% | 8/27/2023 | 5,000,000 | (428,914) | |||||||||
| Wells Fargo | 2.745% | CPI Urban Consumer NSA | 2/21/2022 | 25,000,000 | (1,580,623) | |||||||||
| Unrealized Depreciation on CPI OTC Swaps | $ | (49,497,495) | ||||||||||||
Open Futures Contracts at November 30, 2021:
| Type | Expiration | Contracts | Position | Notional Amount | Notional Value | Unrealized Appreciation | |||||||||||||
| U.S. 2-Year Treasury Note | March 2022 | 2,665 | Long | $ | 581,856,235 | $ | 582,927,112 | $ | 1,070,877 | ||||||||||
| 290 | See Notes to Financial Statements. |
Schedule of Investments (continued)
INFLATION FOCUSED FUND November 30, 2021
The following is a summary of the inputs used as of November 30, 2021 in valuing the Fund’s investments carried at fair value(1):
| Investment Type(2) | Level 1 | Level 2 | Level 3 | Total | ||||||||||||
| Long-Term Investments | ||||||||||||||||
| Asset-Backed Securities | ||||||||||||||||
| Other | $ | – | $ | 428,587,249 | $ | 13,531,087 | $ | 442,118,336 | ||||||||
| Remaining Industries | – | 239,722,385 | – | 239,722,385 | ||||||||||||
| Common Stocks | ||||||||||||||||
| Oil, Gas & Consumable Fuels | 866 | – | – | 866 | ||||||||||||
| Remaining Industries | – | 5,328 | – | 5,328 | ||||||||||||
| Convertible Bonds | – | 776,055 | – | 776,055 | ||||||||||||
| Corporate Bonds | – | 1,588,172,289 | – | 1,588,172,289 | ||||||||||||
| Floating Rate Loans | ||||||||||||||||
| Gaming | – | – | 2,476,002 | 2,476,002 | ||||||||||||
| Health Care Services | – | 17,741,257 | 8,924,555 | 26,665,812 | ||||||||||||
| Less Unfunded Commitments | – | – | (3,956,314 | ) | (3,956,314 | ) | ||||||||||
| Media | – | 20,916,403 | 3,956,314 | 24,872,717 | ||||||||||||
| Telecommunications | – | 3,928,918 | 4,952,648 | 8,881,566 | ||||||||||||
| Remaining Industries | – | 179,257,918 | – | 179,257,918 | ||||||||||||
| Foreign Government Obligations | – | 9,361,319 | – | 9,361,319 | ||||||||||||
| Government Sponsored Enterprises Collateralized Mortgage Obligations | – | 646,792 | – | 646,792 | ||||||||||||
| Government Sponsored Enterprises Pass-Throughs | – | 2,262,303 | 81,892 | 2,344,195 | ||||||||||||
| Municipal Bonds | – | 835,335 | – | 835,335 | ||||||||||||
| Non-Agency Commercial Mortgage-Backed Securities | – | 586,405,230 | 40,155,648 | 626,560,878 | ||||||||||||
| Rights | – | 37 | – | 37 | ||||||||||||
| U.S. Treasury Obligations | – | 413,283,756 | – | 413,283,756 | ||||||||||||
| Warrants | – | 12,287 | – | 12,287 | ||||||||||||
| Short-Term Investments | ||||||||||||||||
| Commercial Paper | – | 43,730,387 | – | 43,730,387 | ||||||||||||
| Repurchase Agreements | – | 106,805,451 | – | 106,805,451 | ||||||||||||
| Total | $ | 866 | $ | 3,642,450,699 | $ | 70,121,832 | $ | 3,712,573,397 | ||||||||
| Other Financial Instruments | ||||||||||||||||
| Centrally Cleared Interest Rate Swap Contracts |
| |||||||||||||||
| Assets | $ | – | $ | 5,649 | $ | – | $ | 5,649 | ||||||||
| Liabilities | – | (5,969 | ) | – | (5,969 | ) | ||||||||||
| Centrally Cleared CPI Swap Contracts | ||||||||||||||||
| Assets | – | 86,997,090 | – | 86,997,090 | ||||||||||||
| Liabilities | – | (12,084,542 | ) | – | (12,084,542 | ) | ||||||||||
| OTC CPI Swap Contracts | ||||||||||||||||
| Assets | – | 37,073,339 | – | 37,073,339 | ||||||||||||
| Liabilities | – | (49,497,495 | ) | – | (49,497,495 | ) | ||||||||||
| Futures Contracts | ||||||||||||||||
| Assets | 1,070,877 | – | – | 1,070,877 | ||||||||||||
| Liabilities | – | – | – | – | ||||||||||||
| Total | $ | 1,070,877 | $ | 62,488,072 | $ | – | $ | 63,558,949 | ||||||||
| (1) | Refer to Note 2(t) for a description of fair value measurements and the three-tier hierarchy of inputs. |
| See Notes to Financial Statements. | 291 |
Schedule of Investments (concluded)
INFLATION FOCUSED FUND November 30, 2021
| (2) | See Schedule of Investments for fair values in each industry. The table above is presented by Investment Type. Industries are presented within an Investment Type should such Investment Type include securities classified as two or more levels within the three- tier fair value hierarchy. When applicable each Level 3 security is identified on the Schedule of Investments along with the valuation technique utilized. |
A reconciliation of Level 3 investments is presented when the Fund has a material amount of Level 3 investments at the beginning or end of the year in relation to the Fund’s net assets.
The following is a reconciliation of investments with unobservable inputs (Level 3) that were used in determining fair value:
| Investment Type | Asset- Backed Securities | Common Stocks | Floating Rate Loans | Government Sponsored Enterprises Pass- Throughs | Non-Agency Commercial Mortgage- Backed Securities | |||||||||||||||
| Balance as of December 1, 2020 | $ | 1,865,602 | $ | 825 | $ | 4,570,990 | $ | – | $ | 649,590 | ||||||||||
| Accrued Discounts (Premiums) | 5,858 | – | 11,686 | (189 | ) | (3,398 | ) | |||||||||||||
| Realized Gain (Loss) | 75,886 | (243,905 | ) | 8,350 | (785 | ) | – | |||||||||||||
| Change in Unrealized Appreciation (Depreciation) | (85,842 | ) | 243,080 | (135,365 | ) | 197 | 227,742 | |||||||||||||
| Purchases | 12,610,000 | – | 20,219,728 | – | 39,089,990 | |||||||||||||||
| Sales | (940,417 | ) | – | (5,739,902 | ) | (16,358 | ) | – | ||||||||||||
| Transfers into Level 3 | – | – | – | 99,027 | 841,314 | |||||||||||||||
| Transfers out of Level 3 | – | – | (2,582,282 | ) | – | (649,590 | ||||||||||||||
| Balance as of November 30, 2021 | $ | 13,531,087 | $ | – | $ | 16,353,205 | $ | 81,892 | $ | 40,155,648 | ||||||||||
| Change in unrealized appreciation/depreciation for the year ended November 30, 2021, related to Level 3 investments held at November 30, 2021 | $ | (60,703 | ) | $ | – | $ | (125,614 | ) | $ | 197 | $ | 227,742 | ||||||||
| 292 | See Notes to Financial Statements. |
Schedule of Investments
SHORT DURATION CORE BOND FUND November 30, 2021
| Investments | Interest Rate | Maturity Date | Principal Amount (000) | Fair Value | ||||||||
| LONG-TERM INVESTMENTS 104.26% | ||||||||||||
| ASSET-BACKED SECURITIES 28.60% | ||||||||||||
| Automobiles 8.36% | ||||||||||||
| Arivo Acceptance Auto Loan Receivables Trust 2019-1 A† | 2.99% | 7/15/2024 | $ | 16 | $ | 16,103 | ||||||
| Avid Automobile Receivables Trust 2019-1 A† | 2.62% | 2/15/2024 | – | (a) | 513 | |||||||
| Avid Automobile Receivables Trust 2019-1 B† | 2.82% | 7/15/2026 | 500 | 504,635 | ||||||||
| Avid Automobile Receivables Trust 2021-1 C† | 1.55% | 5/15/2026 | 830 | 825,638 | ||||||||
| Avis Budget Rental Car Funding AESOP LLC 2018-2A A† | 4.00% | 3/20/2025 | 700 | 741,258 | ||||||||
| CarMax Auto Owner Trust 2020-1 D | 2.64% | 7/15/2026 | 125 | 127,686 | ||||||||
| Carvana Auto Receivables Trust 2019-2A C† | 3.00% | 6/17/2024 | 103 | 103,949 | ||||||||
| Carvana Auto Receivables Trust 2020-P1 C | 1.32% | 11/9/2026 | 400 | 397,440 | ||||||||
| CPS Auto Receivables Trust 2017-C D† | 3.79% | 6/15/2023 | 14 | 13,896 | ||||||||
| CPS Auto Receivables Trust 2018-B D† | 4.26% | 3/15/2024 | 118 | 119,226 | ||||||||
| CPS Auto Receivables Trust 2019-D C† | 2.54% | 8/15/2024 | 234 | 235,869 | ||||||||
| Credit Acceptance Auto Loan Trust 2021-3A A† | 1.00% | 5/15/2030 | 825 | 820,475 | ||||||||
| Drive Auto Receivables Trust 2018-4 D | 4.09% | 1/15/2026 | 168 | 170,668 | ||||||||
| Drive Auto Receivables Trust 2018-5 D | 4.30% | 4/15/2026 | 234 | 240,489 | ||||||||
| Drive Auto Receivables Trust 2019-1 D | 4.09% | 6/15/2026 | 237 | 242,559 | ||||||||
| Drive Auto Receivables Trust 2019-4 C | 2.51% | 11/17/2025 | 66 | 66,691 | ||||||||
| Drive Auto Receivables Trust 2020-2 C | 2.28% | 8/17/2026 | 875 | 887,470 | ||||||||
| First Investors Auto Owner Trust 2019-2A A† | 2.21% | 9/16/2024 | 9 | 9,461 | ||||||||
| Ford Credit Auto Owner Trust REV1 2021-1 C† | 1.91% | 10/17/2033 | 600 | 596,192 | ||||||||
| Foursight Capital Automobile Receivables Trust 2018-1 C† | 3.68% | 8/15/2023 | 137 | 137,603 | ||||||||
| Foursight Capital Automobile Receivables Trust 2018-1 E† | 5.56% | 1/16/2024 | 100 | 100,217 | ||||||||
| GLS Auto Receivables Issuer Trust 2021-1A B† | 0.82% | 4/15/2025 | 650 | 650,660 | ||||||||
| GLS Auto Receivables Issuer Trust 2021-1A C† | 1.20% | 1/15/2027 | 650 | 650,165 | ||||||||
| GLS Auto Receivables Issuer Trust 2021-3A B† | 0.78% | 11/17/2025 | 460 | 456,777 | ||||||||
| GLS Auto Receivables Issuer Trust 2021-3A C† | 1.11% | 9/15/2026 | 460 | 455,302 | ||||||||
| GM Financial Revolving Receivables Trust 2021-1 B† | 1.49% | 6/12/2034 | 555 | 547,165 | ||||||||
| GM Financial Revolving Receivables Trust 2021-1 C† | 1.67% | 6/12/2034 | 500 | 492,779 | ||||||||
| Hertz Vehicle Financing III LP 2021-2A A† | 1.68% | 12/27/2027 | 620 | 619,669 | ||||||||
| Hertz Vehicle Financing LLC 2021-1A A† | 1.21% | 12/26/2025 | 265 | 263,379 | ||||||||
| Hyundai Auto Lease Securitization Trust 2020-B A3† | 0.51% | 9/15/2023 | 489 | 489,370 | ||||||||
| See Notes to Financial Statements. | 293 |
Schedule of Investments (continued)
SHORT DURATION CORE BOND FUND November 30, 2021
| Investments | Interest Rate | Maturity Date | Principal Amount (000) | Fair Value | ||||||||
| Automobiles (continued) | ||||||||||||
| Mercedes-Benz Auto Lease Trust 2019-B A3 | 2.00% | 10/17/2022 | $ | 35 | $ | 35,187 | ||||||
| OneMain Direct Auto Receivables Trust 2019-1A B† | 3.95% | 11/14/2028 | 825 | 887,411 | ||||||||
| OneMain Direct Auto Receivables Trust 2019-1A C† | 4.19% | 11/14/2028 | 753 | 810,285 | ||||||||
| OneMain Direct Auto Receivables Trust 2021-1A A† | 0.87% | 7/14/2028 | 340 | 336,384 | ||||||||
| OneMain Direct Auto Receivables Trust 2021-1A B† | 1.26% | 7/14/2028 | 317 | 314,552 | ||||||||
| Prestige Auto Receivables Trust 2017-1A D† | 3.61% | 10/16/2023 | 255 | 255,997 | ||||||||
| Santander Consumer Auto Receivables Trust 2020-BA C† | 1.29% | 4/15/2026 | 681 | 683,984 | ||||||||
| Santander Drive Auto Receivables Trust 2018-1 D | 3.32% | 3/15/2024 | 141 | 141,709 | ||||||||
| Santander Drive Auto Receivables Trust 2019-3 C | 2.49% | 10/15/2025 | 286 | 287,495 | ||||||||
| Westlake Automobile Receivables Trust 2019-1A C† | 3.45% | 3/15/2024 | 34 | 34,227 | ||||||||
| Westlake Automobile Receivables Trust 2019-3A B† | 2.41% | 10/15/2024 | 115 | 115,328 | ||||||||
| Westlake Automobile Receivables Trust 2019-3A C† | 2.49% | 10/15/2024 | 454 | 457,619 | ||||||||
| Total | 15,343,482 | |||||||||||
| Credit Card 1.61% | ||||||||||||
| American Express Credit Account Master Trust 2019-1 B | 3.07% | 10/15/2024 | 142 | 143,113 | ||||||||
| Continental Finance Credit Card ABS Master Trust 2020-1A A† | 2.24% | 12/15/2028 | 600 | 599,064 | ||||||||
| Master Credit Card Trust 2021-1A B† | 0.79% | 11/21/2025 | 1,200 | 1,184,696 | ||||||||
| Newday Funding Master Issuer plc 2021-1A A2† | 1.148% (1Mo. SOFR + 1.10% | )# | 3/15/2029 | 400 | 403,375 | |||||||
| World Financial Network Credit Card Master Trust 2019-A A | 3.14% | 12/15/2025 | 217 | 218,307 | ||||||||
| World Financial Network Credit Card Master Trust 2019-C A | 2.21% | 7/15/2026 | 406 | 411,813 | ||||||||
| Total | 2,960,368 | |||||||||||
| Other 18.01% | ||||||||||||
| ACREC Ltd. 2021-FL1 A† | 1.239% (1 Mo. LIBOR + 1.15% | )# | 10/16/2036 | 450 | 449,553 | |||||||
| AMMC CLO 19 Ltd. 2016-19A AR† | 1.264% (3 Mo. LIBOR + 1.14% | )# | 10/16/2028 | 135 | 135,123 | |||||||
| AMMC CLO Ltd. 2020-23A A1R† | 1.163% (3 Mo. LIBOR + 1.04% | )# | 10/17/2031 | 750 | 750,066 | |||||||
| Amur Equipment Finance Receivables IX LLC 2021-1A D† | 2.30% | 11/22/2027 | 675 | 671,984 | ||||||||
| Amur Equipment Finance Receivables VII LLC 2019-1A C† | 3.09% | 3/20/2025 | 100 | 101,243 | ||||||||
| 294 | See Notes to Financial Statements. |
Schedule of Investments (continued)
SHORT DURATION CORE BOND FUND November 30, 2021
| Principal | ||||||||||||
| Interest | Maturity | Amount | Fair | |||||||||
| Investments | Rate | Date | (000) | Value | ||||||||
| Other (continued) | ||||||||||||
| Apidos CLO XXIV 2016-24A A1AL† | 1.082% (3 Mo. LIBOR + .95% | )# | 10/20/2030 | $ | 250 | $ | 249,938 | |||||
| Aqua Finance Trust 2021-A A† | 1.54% | 7/17/2046 | 328 | 326,185 | ||||||||
| Arbor Realty Commercial Real Estate Notes Ltd. 2021-FL3 A† | 1.16% (1 Mo. LIBOR + 1.07% | )# | 8/15/2034 | 460 | 459,013 | |||||||
| Arbor Realty Commercial Real Estate Notes Ltd. 2021-FL4 A†(b) | 1.44% (1 Mo. LIBOR + 1.35% | )# | 11/15/2036 | 560 | 560,477 | |||||||
| Bain Capital Credit CLO 2018-2A A1† | 1.204% (3 Mo. LIBOR + 1.08% | )# | 7/19/2031 | 750 | 750,403 | |||||||
| Barings CLO II Ltd. 2016-2A AR† | 1.212% (3 Mo. LIBOR + 1.08% | )# | 7/20/2028 | 597 | 597,254 | |||||||
| BDS Ltd. 2020-FL5 A† | 1.312% (1 Mo. SOFR + 1.26% | )# | 2/16/2037 | 450 | 448,875 | |||||||
| BDS Ltd. 2021-FL7 A† | 1.159% (1 Mo. LIBOR + 1.07% | )# | 6/16/2036 | 500 | 499,680 | |||||||
| BlueMountain CLO Ltd. 2015-2A A1R† | 1.052% (3 Mo. LIBOR + .93% | )# | 7/18/2027 | 114 | 114,335 | |||||||
| BlueMountain Fuji US CLO I Ltd. 2017-1A A1R† | 1.112% (3 Mo. LIBOR + .98% | )# | 7/20/2029 | 250 | 249,975 | |||||||
| Carlyle US CLO Ltd. 2017-3A A1AR† | 1.032% (3 Mo. LIBOR + .90% | )# | 7/20/2029 | 250 | 250,075 | |||||||
| Carlyle US CLO Ltd. 2019-1A A1AR† | 1.212% (3 Mo. LIBOR + 1.08% | )# | 4/20/2031 | 750 | 750,573 | |||||||
| CIFC Funding I Ltd. 2021-1A A1† | 1.234% (3 Mo. LIBOR + 1.11% | )# | 4/25/2033 | 570 | 570,285 | |||||||
| CIFC Funding II Ltd. 2013-2A A2L2† | Zero Coupon (3 Mo. LIBOR + 1.50% | )#(c) | 10/18/2030 | 850 | 850,689 | |||||||
| Dell Equipment Finance Trust 2021-2 B† | 0.81% | 12/22/2026 | 460 | 455,430 | ||||||||
| Dell Equipment Finance Trust 2021-2 C† | 0.94% | 12/22/2026 | 460 | 455,811 | ||||||||
| Dell Equipment Finance Trust 2021-2 D† | 1.21% | 6/22/2027 | 460 | 456,061 | ||||||||
| Diamond Resorts Owner Trust 2018-1 B† | 4.19% | 1/21/2031 | 78 | 79,859 | ||||||||
| Dryden 53 CLO Ltd. 2017-53A A† | 1.244% (3 Mo. LIBOR + 1.12% | )# | 1/15/2031 | 400 | 399,900 | |||||||
| Dryden XXVI Senior Loan Fund 2013-26A AR† | 1.024% (3 Mo. LIBOR + .90% | )# | 4/15/2029 | 261 | 261,152 | |||||||
| Encina Equipment Finance LLC 2021-1A B† | 1.21% | 2/16/2027 | 800 | 793,779 | ||||||||
| Galaxy XIX CLO Ltd. 2015-19A A1RR† | 1.074% (3 Mo. LIBOR + .95% | )# | 7/24/2030 | 170 | 169,992 | |||||||
| GreatAmerica Leasing Receivables Funding LLC Series 2021-2 A4† | 1.04% | 9/15/2027 | 1,145 | 1,133,515 | ||||||||
| See Notes to Financial Statements. | 295 |
Schedule of Investments (continued)
SHORT DURATION CORE BOND FUND November 30, 2021
| Investments | Interest Rate | Maturity Date | Principal Amount (000) | Fair Value | ||||||||
| Other (continued) | ||||||||||||
| Greystone Commercial Real Estate Notes Ltd. 2018-HC1 A† | 1.64% (1 Mo. LIBOR + 1.55% | )# | 9/15/2028 | $ | 363 | $ | 364,102 | |||||
| Greystone Commercial Real Estate Notes Ltd. 2018-HC1 AS† | 2.24% (1 Mo. LIBOR + 2.15% | )# | 9/15/2028 | 500 | 498,096 | |||||||
| Greystone CRE Notes Ltd. 2021-FL3 A† | 1.11% (1 Mo. LIBOR + 1.02% | )# | 7/15/2039 | 460 | 458,517 | |||||||
| HGI CRE CLO Ltd. 2021-FL1 A† | 1.139% (1 Mo. LIBOR + 1.05% | )# | 6/16/2036 | 200 | 199,843 | |||||||
| HGI CRE CLO Ltd. 2021-FL1 AS† | 1.489% (1 Mo. LIBOR + 1.40% | )# | 6/16/2036 | 100 | 99,161 | |||||||
| HGI CRE CLO Ltd. 2021-FL1 B† | 1.689% (1 Mo. LIBOR + 1.60% | )# | 6/16/2036 | 100 | 99,974 | |||||||
| Kayne CLO II Ltd. 2018-2A AR† | 1.204% (3 Mo. LIBOR + 1.08% | )# | 10/15/2031 | 270 | 270,374 | |||||||
| Kayne CLO III Ltd. 2019-3A BR† | 1.674% (3 Mo. LIBOR + 1.55% | )# | 4/15/2032 | 610 | 609,500 | |||||||
| KKR CLO Ltd.-29A A† | 1.324% (3 Mo. LIBOR + 1.20% | )# | 1/15/2032 | 250 | 250,505 | |||||||
| KREF Ltd. 2021-FL2 A† | 1.159% (1 Mo. LIBOR + 1.07% | )# | 2/15/2039 | 360 | 360,001 | |||||||
| KREF Ltd. 2021-FL2 AS† | 1.389% (1 Mo. LIBOR + 1.30% | )# | 2/15/2039 | 360 | 360,450 | |||||||
| LCM XXII Ltd. 22A A1R† | 1.292% (3 Mo. LIBOR + 1.16% | )# | 10/20/2028 | 250 | 250,380 | |||||||
| LMREC LLC 2021-CRE4 A† | 1.135% (1 Mo. LIBOR + 1.05% | )# | 4/22/2037 | 820 | 820,066 | |||||||
| LoanCore Issuer Ltd. 2019-CRE2 C† | 2.09% (1 Mo. LIBOR + 2.00% | )# | 5/15/2036 | 630 | 629,339 | |||||||
| Madison Park Funding XI Ltd. 2013-11A AR2† | 1.024% (3 Mo. LIBOR + .90% | )# | 7/23/2029 | 249 | 249,070 | |||||||
| Magnetite Ltd. 2021-29A A† | 1.114% (3 Mo. LIBOR + .99% | )# | 1/15/2034 | 250 | 250,309 | |||||||
| Marlette Funding Trust 2020-2A D† | 4.65% | 9/16/2030 | 500 | 523,066 | ||||||||
| Marlette Funding Trust 2021-1A B† | 1.00% | 6/16/2031 | 1,300 | 1,298,087 | ||||||||
| ME Funding LLC 2019-1 A2† | 6.448% | 7/30/2049 | 485 | 512,233 | ||||||||
| MF1 Ltd. 2021-FL7 A† | 1.169% (1 Mo. LIBOR + 1.08% | )# | 10/16/2036 | 240 | 238,812 | |||||||
| MF1 Ltd. 2021-FL7 AS† | 1.539% (1 Mo. LIBOR + 1.45% | )# | 10/16/2036 | 280 | 278,698 | |||||||
| 296 | See Notes to Financial Statements. |
Schedule of Investments (continued)
SHORT DURATION CORE BOND FUND November 30, 2021
| Investments | Interest Rate | Maturity Date | Principal Amount (000) | Fair Value | ||||||||
| Other (continued) | ||||||||||||
| Mountain View CLO LLC 2017-1A AR† | 1.212% (3 Mo. LIBOR + 1.09% | )# | 10/16/2029 | $ | 500 | $ | 500,168 | |||||
| MVW Owner Trust 2017-1A A† | 2.42% | 12/20/2034 | 228 | 230,993 | ||||||||
| New Economy Assets Phase 1 Sponsor LLC 2021-1 A1† | 1.91% | 10/20/2061 | 930 | 915,481 | ||||||||
| Newark BSL CLO 1 Ltd. 2016-1A A1R† | 1.235% (3 Mo. LIBOR + 1.10% | )# | 12/21/2029 | 500 | 500,626 | |||||||
| OCP CLO Ltd. 2020-18A AR† | 1.222% (3 Mo. LIBOR + 1.09% | )# | 7/20/2032 | 900 | 900,003 | |||||||
| Octagon Investment Partners 30 Ltd. 2017-1A A1R† | 1.132% (3 Mo. LIBOR + 1.00% | )# | 3/17/2030 | 750 | 750,188 | |||||||
| Octagon Investment Partners 49 Ltd. 2020-5A A1† | 1.344% (3 Mo. LIBOR + 1.22% | )# | 1/15/2033 | 400 | 400,336 | |||||||
| Octagon Investment Partners XIV Ltd. 2012-1A AARR† | 1.074% (3 Mo. LIBOR + .95% | )# | 7/15/2029 | 250 | 249,896 | |||||||
| OneMain Financial Issuance Trust 2018-2A A† | 3.57% | 3/14/2033 | 301 | 312,313 | ||||||||
| OneMain Financial Issuance Trust 2019-1A B† | 3.79% | 2/14/2031 | 100 | 100,191 | ||||||||
| OneMain Financial Issuance Trust 2020-2A C† | 2.76% | 9/14/2035 | 690 | 705,342 | ||||||||
| Orange Lake Timeshare Trust 2015-AA A† | 2.88% | 9/8/2027 | 5 | 4,560 | ||||||||
| OZLM VIII Ltd. 2014-8A A1RR† | 1.292% (3 Mo. LIBOR + 1.17% | )# | 10/17/2029 | 397 | 397,135 | |||||||
| Pagaya AI Debt Selection Trust 2021-1 A† | 1.18% | 11/15/2027 | 430 | 429,502 | ||||||||
| PFS Financing Corp. 2020-F A† | 0.93% | 8/15/2024 | 100 | 100,305 | ||||||||
| Progress Residential Trust 2021-SFR8 B† | 1.681% | 10/17/2038 | 460 | 449,913 | ||||||||
| Regatta Funding LP 2013-2A A1R3† | 0.974% (3 Mo. LIBOR + .85% | )# | 1/15/2029 | 325 | 325,181 | |||||||
| SCF Equipment Leasing LLC 2019-2A A1† | 2.22% | 6/20/2024 | 12 | 12,066 | ||||||||
| SCF Equipment Leasing LLC 2019-2A B† | 2.76% | 8/20/2026 | 500 | 511,273 | ||||||||
| SCF Equipment Leasing LLC 2020-1A B† | 2.02% | 3/20/2028 | 547 | 547,864 | ||||||||
| SCF Equipment Leasing LLC 2021-1A A3† | 0.83% | 8/21/2028 | 500 | 496,435 | ||||||||
| SCF Equipment Leasing LLC 2021-1A B† | 1.37% | 8/20/2029 | 1,000 | 981,887 | ||||||||
| Sound Point CLO III-R Ltd. 2013-2RA B† | 1.574% (3 Mo. LIBOR + 1.45% | )# | 4/15/2029 | 250 | 249,331 | |||||||
| TICP CLO XIV Ltd. 2019-14A A1R†(b) | Zero Coupon | #(c) | 10/20/2032 | 400 | 400,000 | |||||||
| TRP LLC 2021-1 A† | 2.07% | 6/19/2051 | 348 | 344,696 | ||||||||
| Upstart Securitization Trust 2021-2 A† | 0.91% | 6/20/2031 | 645 | 644,527 | ||||||||
| Total | 33,072,020 | |||||||||||
| See Notes to Financial Statements. | 297 |
Schedule of Investments (continued)
SHORT DURATION CORE BOND FUND November 30, 2021
| Investments | Interest Rate | Maturity Date | Principal Amount (000) | Fair Value | ||||||||
| Rec Vehicle Loan ABS 0.38% | ||||||||||||
| Octane Receivables Trust 2021-1A A† | 0.93% | 3/22/2027 | $ | 697 | $ | 694,893 | ||||||
| Student Loan 0.24% | ||||||||||||
| Massachusetts Educational Financing Authority 2008-1 A1 | 1.074% (3 Mo. LIBOR + .95% | )# | 4/25/2038 | 74 | 74,530 | |||||||
| Navient Private Education Refi Loan Trust 2020-FA A† | 1.22% | 7/15/2069 | 330 | 329,991 | ||||||||
| Towd Point Asset Trust 2018-SL1 A† | 0.689% (1 Mo. LIBOR + .60% | )# | 1/25/2046 | 30 | 30,088 | |||||||
| Total | 434,609 | |||||||||||
| Total Asset-Backed Securities (cost $52,610,924) | 52,505,372 | |||||||||||
| CORPORATE BONDS 30.10% | ||||||||||||
| Aerospace/Defense 0.30% | ||||||||||||
| Boeing Co. (The) | 4.875% | 5/1/2025 | 500 | 548,338 | ||||||||
| Agriculture 0.57% | ||||||||||||
| Imperial Brands Finance plc (United Kingdom)†(d) | 3.125% | 7/26/2024 | 200 | 207,445 | ||||||||
| Reynolds American, Inc. | 4.45% | 6/12/2025 | 410 | 443,746 | ||||||||
| Viterra Finance BV (Netherlands)†(d) | 2.00% | 4/21/2026 | 400 | 399,258 | ||||||||
| Total | 1,050,449 | |||||||||||
| Apparel 0.11% | ||||||||||||
| PVH Corp. | 7.75% | 11/15/2023 | 186 | 209,747 | ||||||||
| Auto Manufacturers 1.75% | ||||||||||||
| Daimler Finance North America LLC† | 3.40% | 2/22/2022 | 175 | 176,183 | ||||||||
| General Motors Co. | 5.40% | 10/2/2023 | 293 | 315,758 | ||||||||
| General Motors Financial Co., Inc. | 2.75% | 6/20/2025 | 294 | 304,026 | ||||||||
| General Motors Financial Co., Inc. | 3.70% | 5/9/2023 | 167 | 172,811 | ||||||||
| General Motors Financial Co., Inc. | 3.95% | 4/13/2024 | 140 | 147,628 | ||||||||
| General Motors Financial Co., Inc. | 5.10% | 1/17/2024 | 1,122 | 1,207,804 | ||||||||
| Hyundai Capital America† | 1.00% | 9/17/2024 | 73 | 72,063 | ||||||||
| Stellantis N.V. (Netherlands)(d) | 5.25% | 4/15/2023 | 575 | 608,977 | ||||||||
| Volkswagen Group of America Finance LLC† | 2.90% | 5/13/2022 | 200 | 202,069 | ||||||||
| Total | 3,207,319 | |||||||||||
| Banks 8.35% | ||||||||||||
| ABN AMRO Bank NV (Netherlands)(d) | 6.25% | 4/27/2022 | 600 | 613,662 | ||||||||
| AIB Group plc (Ireland)†(d) | 4.75% | 10/12/2023 | 500 | 531,683 | ||||||||
| 298 | See Notes to Financial Statements. |
Schedule of Investments (continued)
SHORT DURATION CORE BOND FUND November 30, 2021
| Investments | Interest Rate | Maturity Date | Principal Amount (000) | Fair Value | ||||||||
| Banks (continued) | ||||||||||||
| Bank of Ireland Group plc (Ireland)†(d) | 4.50% | 11/25/2023 | $ | 488 | $ | 519,312 | ||||||
| Barclays plc (United Kingdom)(d) | 4.375% | 9/11/2024 | 200 | 214,106 | ||||||||
| Barclays plc (United Kingdom)(d) | 4.61% (3 Mo. LIBOR + 1.40% | )# | 2/15/2023 | 727 | 732,655 | |||||||
| BBVA Bancomer SA† | 4.375% | 4/10/2024 | 200 | 213,808 | ||||||||
| CIT Group, Inc. | 5.00% | 8/1/2023 | 407 | 429,936 | ||||||||
| Citigroup, Inc. | 1.281% (SOFR + .53% | )# | 11/3/2025 | 56 | 55,876 | |||||||
| Danske Bank A/S (Denmark)†(d) | 1.171% (1 Yr. Treasury CMT + 1.03% | )# | 12/8/2023 | 200 | 200,142 | |||||||
| Danske Bank A/S (Denmark)†(d) | 5.00% | 1/12/2022 | 983 | 987,889 | ||||||||
| Danske Bank A/S (Denmark)†(d) | 5.375% | 1/12/2024 | 746 | 806,432 | ||||||||
| Emirates NBD Bank PJSC (United Arab Emirates)(d) | 3.25% | 11/14/2022 | 500 | 511,250 | ||||||||
| HSBC Holdings plc (United Kingdom)(d) | 3.262% (3 Mo. LIBOR + 1.06% | )# | 3/13/2023 | 633 | 637,490 | |||||||
| Intesa Sanpaolo SpA (Italy)†(d) | 3.375% | 1/12/2023 | 1,250 | 1,282,188 | ||||||||
| Lloyds Banking Group plc (United Kingdom)(d) | 1.326% (1 Yr. Treasury CMT + 1.10% | )# | 6/15/2023 | 443 | 444,219 | |||||||
| Lloyds Banking Group plc (United Kingdom)(d) | 2.858% (3 Mo. LIBOR + 1.25% | )# | 3/17/2023 | 585 | 588,611 | |||||||
| Macquarie Group Ltd. (Australia)†(d) | 1.196% (3 Mo. LIBOR + 1.02% | )# | 11/28/2023 | 442 | 444,953 | |||||||
| Santander Holdings USA, Inc. | 3.50% | 6/7/2024 | 450 | 471,133 | ||||||||
| Standard Chartered plc (United Kingdom)†(d) | 0.991% (1 Yr. Treasury CMT + .78% | )# | 1/12/2025 | 200 | 198,105 | |||||||
| Standard Chartered plc (United Kingdom)†(d) | 1.214% (1 Yr. Treasury CMT + .88% | )# | 3/23/2025 | 200 | 199,112 | |||||||
| Standard Chartered plc (United Kingdom)†(d) | 5.20% | 1/26/2024 | 236 | 252,669 | ||||||||
| Standard Chartered plc (United Kingdom)(d) | 5.70% | 1/25/2022 | 1,000 | 1,007,218 | ||||||||
| UBS AG (United Kingdom)†(d) | 1.75% | 4/21/2022 | 555 | 557,409 | ||||||||
| UBS AG (Switzerland)(d) | 5.125% | 5/15/2024 | 724 | 779,205 | ||||||||
| UBS AG | 7.625% | 8/17/2022 | 1,286 | 1,343,455 | ||||||||
| UniCredit SpA (Italy)†(d) | 6.572% | 1/14/2022 | 900 | 905,838 | ||||||||
| UniCredit SpA (Italy)†(d) | 7.83% | 12/4/2023 | 350 | 394,532 | ||||||||
| Total | 15,322,888 | |||||||||||
| Chemicals 0.17% | ||||||||||||
| International Flavors & Fragrances, Inc.† | 0.697% | 9/15/2022 | 311 | 311,236 | ||||||||
| See Notes to Financial Statements. | 299 |
Schedule of Investments (continued)
SHORT DURATION CORE BOND FUND November 30, 2021
| Principal | ||||||||||||
| Interest | Maturity | Amount | Fair | |||||||||
| Investments | Rate | Date | (000) | Value | ||||||||
| Commercial Services 0.62% | ||||||||||||
| IHS Markit Ltd. (United Kingdom)†(d) | 5.00% | 11/1/2022 | $ | 250 | $ | 257,664 | ||||||
| Triton Container International Ltd.† | 0.80% | 8/1/2023 | 73 | 72,462 | ||||||||
| United Rentals North America, Inc. | 3.875% | 11/15/2027 | 775 | 805,012 | ||||||||
| Total | 1,135,138 | |||||||||||
| Computers 0.21% | ||||||||||||
| Dell International LLC/EMC Corp. | 5.45% | 6/15/2023 | 365 | 387,250 | ||||||||
| Computer Software 0.47% | ||||||||||||
| VMware, Inc. | 2.95% | 8/21/2022 | 850 | 862,100 | ||||||||
| Diversified Financial Services 2.57% | ||||||||||||
| AerCap Ireland Capital DAC/AerCap Global Aviation Trust (Ireland)(d) | 1.75% | 10/29/2024 | 150 | 149,831 | ||||||||
| AerCap Ireland Capital DAC/AerCap Global Aviation Trust (Ireland)(d) | 4.875% | 1/16/2024 | 900 | 962,114 | ||||||||
| Aircastle Ltd. | 4.40% | 9/25/2023 | 232 | 243,972 | ||||||||
| Aircastle Ltd. | 5.00% | 4/1/2023 | 187 | 196,454 | ||||||||
| Aircastle Ltd.† | 5.25% | 8/11/2025 | 59 | 65,099 | ||||||||
| Aviation Capital Group LLC† | 3.875% | 5/1/2023 | 100 | 103,553 | ||||||||
| Aviation Capital Group LLC† | 5.50% | 12/15/2024 | 347 | 382,240 | ||||||||
| Avolon Holdings Funding Ltd. (Ireland)†(d) | 3.625% | 5/1/2022 | 280 | 282,763 | ||||||||
| Avolon Holdings Funding Ltd. (Ireland)†(d) | 5.125% | 10/1/2023 | 260 | 275,329 | ||||||||
| Avolon Holdings Funding Ltd. (Ireland)†(d) | 5.25% | 5/15/2024 | 749 | 806,341 | ||||||||
| Avolon Holdings Funding Ltd. (Ireland)†(d) | 5.50% | 1/15/2026 | 60 | 66,672 | ||||||||
| Capital One Bank USA NA | 2.014% (SOFR + .62% | )# | 1/27/2023 | 818 | 819,552 | |||||||
| Citigroup Global Markets Holdings, Inc. | 0.75% | 6/7/2024 | 177 | 175,158 | ||||||||
| Park Aerospace Holdings Ltd. (Ireland)†(d) | 4.50% | 3/15/2023 | 187 | 194,031 | ||||||||
| Total | 4,723,109 | |||||||||||
| Electric 3.64% | ||||||||||||
| AES Corp. (The)† | 3.30% | 7/15/2025 | 400 | 419,214 | ||||||||
| American Transmission Systems, Inc.† | 5.25% | 1/15/2022 | 800 | 804,151 | ||||||||
| Ausgrid Finance Pty Ltd. (Australia)†(d) | 3.85% | 5/1/2023 | 56 | 57,753 | ||||||||
| CenterPoint Energy, Inc. | 0.70% (SOFR + .65% | )# | 5/13/2024 | 297 | 297,095 | |||||||
| Cleco Power LLC† | 0.616% (3 Mo. LIBOR + .50% | )# | 6/15/2023 | 304 | 303,982 | |||||||
| Cleveland Electric Illuminating Co. (The) | 5.50% | 8/15/2024 | 225 | 249,699 | ||||||||
| Comision Federal de Electricidad (Mexico)†(d) | 4.875% | 1/15/2024 | 700 | 744,390 | ||||||||
| 300 | See Notes to Financial Statements. |
Schedule of Investments (continued)
SHORT DURATION CORE BOND FUND November 30, 2021
| Principal | ||||||||||||
| Interest | Maturity | Amount | Fair | |||||||||
| Investments | Rate | Date | (000) | Value | ||||||||
| Electric (continued) | ||||||||||||
| Edison International | 3.125% | 11/15/2022 | $ | 450 | $ | 457,621 | ||||||
| FirstEnergy Corp. | 3.35% | 7/15/2022 | 170 | 170,935 | ||||||||
| Jersey Central Power & Light Co.† | 4.70% | 4/1/2024 | 200 | 212,982 | ||||||||
| NRG Energy, Inc.† | 3.75% | 6/15/2024 | 799 | 834,908 | ||||||||
| OGE Energy Corp. | 0.703% | 5/26/2023 | 399 | 397,059 | ||||||||
| Pacific Gas and Electric Co. | 1.367% | 3/10/2023 | 177 | 176,065 | ||||||||
| Pacific Gas and Electric Co. | 3.15% | 1/1/2026 | 482 | 494,769 | ||||||||
| Pacific Gas and Electric Co. | 3.75% | 2/15/2024 | 150 | 155,379 | ||||||||
| Puget Energy, Inc. | 5.625% | 7/15/2022 | 70 | 71,306 | ||||||||
| San Diego Gas & Electric Co. | 1.914% | 2/1/2022 | 3 | 2,505 | ||||||||
| Saudi Electricity Global Sukuk Co. 2 (Saudi Arabia)†(d) | 3.473% | 4/8/2023 | 500 | 517,301 | ||||||||
| Vistra Operations Co. LLC† | 3.55% | 7/15/2024 | 309 | 320,491 | ||||||||
| Total | 6,687,605 | |||||||||||
| Engineering & Construction 0.03% | ||||||||||||
| Fluor Corp. | 3.50% | 12/15/2024 | 62 | 63,638 | ||||||||
| Food 0.19% | ||||||||||||
| Land O’ Lakes, Inc.† | 6.00% | 11/15/2022 | 345 | 357,379 | ||||||||
| Gas 1.02% | ||||||||||||
| Atmos Energy Corp. | 0.625% | 3/9/2023 | 92 | 91,842 | ||||||||
| CenterPoint Energy Resources Corp. | 0.70% | 3/2/2023 | 850 | 847,700 | ||||||||
| Centrica PLC (United Kingdom)†(d) | 4.00% | 10/16/2023 | 400 | 417,582 | ||||||||
| ONE Gas, Inc. | 0.724% (3 Mo. LIBOR + .61% | )# | 3/11/2023 | 280 | 280,008 | |||||||
| ONE Gas, Inc. | 0.85% | 3/11/2023 | 115 | 114,855 | ||||||||
| ONE Gas, Inc. | 1.10% | 3/11/2024 | 115 | 113,421 | ||||||||
| Total | 1,865,408 | |||||||||||
| Health Care-Services 0.35% | ||||||||||||
| Centene Corp. | 4.25% | 12/15/2027 | 300 | 311,612 | ||||||||
| Fresenius Medical Care US Finance II, Inc.† | 5.875% | 1/31/2022 | 336 | 338,701 | ||||||||
| Total | 650,313 | |||||||||||
| Home Builders 0.30% | ||||||||||||
| Lennar Corp. | 4.875% | 12/15/2023 | 478 | 509,168 | ||||||||
| Toll Brothers Finance Corp. | 4.375% | 4/15/2023 | 47 | 48,741 | ||||||||
| Total | 557,909 | |||||||||||
| See Notes to Financial Statements. | 301 |
Schedule of Investments (continued)
SHORT DURATION CORE BOND FUND November 30, 2021
| Principal | ||||||||||||
| Interest | Maturity | Amount | Fair | |||||||||
| Investments | Rate | Date | (000) | Value | ||||||||
| Insurance 0.26% | ||||||||||||
| CNO Financial Group, Inc. | 5.25% | 5/30/2025 | $ | 300 | $ | 334,668 | ||||||
| GA Global Funding Trust† | 0.80% | 9/13/2024 | 150 | 147,803 | ||||||||
| Total | 482,471 | |||||||||||
| Internet 0.08% | ||||||||||||
| E*TRADE Financial Corp. | 2.95% | 8/24/2022 | 5 | 5,080 | ||||||||
| Netflix, Inc. | 4.375% | 11/15/2026 | 121 | 133,544 | ||||||||
| Total | 138,624 | |||||||||||
| Iron-Steel 0.26% | ||||||||||||
| POSCO (South Korea)†(d) | 2.375% | 11/12/2022 | 400 | 405,808 | ||||||||
| Vale Overseas Ltd. (Brazil)(d) | 6.25% | 8/10/2026 | 57 | 64,947 | ||||||||
| Total | 470,755 | |||||||||||
| Lodging 0.11% | ||||||||||||
| Hyatt Hotels Corp. | 1.30% | 10/1/2023 | 114 | 114,070 | ||||||||
| Hyatt Hotels Corp. | 1.80% | 10/1/2024 | 87 | 87,092 | ||||||||
| Total | 201,162 | |||||||||||
| Machinery-Diversified 0.29% | ||||||||||||
| Otis Worldwide Corp. | 0.583% (3 Mo. LIBOR + .45% | )# | 4/5/2023 | 425 | 425,025 | |||||||
| Westinghouse Air Brake Technologies Corp. | 4.40% | 3/15/2024 | 100 | 106,511 | ||||||||
| Total | 531,536 | |||||||||||
| Media 0.30% | ||||||||||||
| RELX, Inc.† | 6.625% | 10/15/2023 | 500 | 547,955 | ||||||||
| Mining 0.76% | ||||||||||||
| Anglo American Capital plc (United Kingdom)†(d) | 4.125% | 9/27/2022 | 200 | 205,243 | ||||||||
| Glencore Funding LLC† | 4.125% | 5/30/2023 | 357 | 373,343 | ||||||||
| Glencore Funding LLC† | 4.625% | 4/29/2024 | 764 | 817,635 | ||||||||
| Total | 1,396,221 | |||||||||||
| Miscellaneous Manufacturing 0.03% | ||||||||||||
| Pentair Finance Sarl (Luxembourg)(d) | 3.15% | 9/15/2022 | 45 | 45,563 | ||||||||
| Oil & Gas 3.64% | ||||||||||||
| Cenovus Energy, Inc. (Canada)(d) | 5.375% | 7/15/2025 | 236 | 262,371 | ||||||||
| Continental Resources, Inc.† | 2.268% | 11/15/2026 | 69 | 68,254 | ||||||||
| Continental Resources, Inc. | 3.80% | 6/1/2024 | 650 | 678,373 | ||||||||
| Continental Resources, Inc. | 4.50% | 4/15/2023 | 229 | 236,765 | ||||||||
| Devon Energy Corp.† | 5.25% | 9/15/2024 | 203 | 220,357 | ||||||||
| 302 | See Notes to Financial Statements. |
Schedule of Investments (continued)
SHORT DURATION CORE BOND FUND November 30, 2021
| Principal | ||||||||||||
| Interest | Maturity | Amount | Fair | |||||||||
| Investments | Rate | Date | (000) | Value | ||||||||
| Oil & Gas (continued) | ||||||||||||
| Devon Energy Corp.† | 5.25% | 10/15/2027 | $ | 673 | $ | 711,530 | ||||||
| Devon Energy Corp.† | 8.25% | 8/1/2023 | 524 | 576,877 | ||||||||
| Diamondback Energy, Inc. | 4.75% | 5/31/2025 | 336 | 368,399 | ||||||||
| Endeavor Energy Resources LP/EER Finance, Inc.† | 6.625% | 7/15/2025 | 78 | 82,084 | ||||||||
| Ovintiv Exploration, Inc. | 5.375% | 1/1/2026 | 500 | 551,475 | ||||||||
| Parsley Energy LLC/Parsley Finance Corp.† | 5.625% | 10/15/2027 | 346 | 363,025 | ||||||||
| Petroleos Mexicanos (Mexico)(d) | 3.764% (3 Mo. LIBOR + 3.65% | )# | 3/11/2022 | 500 | 499,725 | |||||||
| Phillips 66 | 0.776% (3 Mo. LIBOR + .62% | )# | 2/15/2024 | 250 | 250,008 | |||||||
| Suncor Energy Ventures Corp. (Canada)†(d) | 4.50% | 4/1/2022 | 900 | 902,954 | ||||||||
| Tengizchevroil Finance Co. International Ltd. (Kazakhstan)†(d) | 2.625% | 8/15/2025 | 400 | 403,100 | ||||||||
| Viper Energy Partners LP† | 5.375% | 11/1/2027 | 500 | 516,083 | ||||||||
| Total | 6,691,380 | |||||||||||
| Pharmaceuticals 0.40% | ||||||||||||
| Bayer US Finance II LLC† | 3.875% | 12/15/2023 | 700 | 735,504 | ||||||||
| Pipelines 1.59% | ||||||||||||
| Cheniere Corpus Christi Holdings LLC | 5.875% | 3/31/2025 | 289 | 322,099 | ||||||||
| Cheniere Corpus Christi Holdings LLC | 7.00% | 6/30/2024 | 700 | 778,174 | ||||||||
| Florida Gas Transmission Co. LLC† | 3.875% | 7/15/2022 | 500 | 506,031 | ||||||||
| MPLX LP | 3.50% | 12/1/2022 | 50 | 51,231 | ||||||||
| Phillips 66 Partners LP | 3.605% | 2/15/2025 | 150 | 158,887 | ||||||||
| Plains All American Pipeline LP/PAA Finance Corp. | 2.85% | 1/31/2023 | 900 | 917,303 | ||||||||
| Plains All American Pipeline LP/PAA Finance Corp. | 3.60% | 11/1/2024 | 122 | 128,514 | ||||||||
| Texas Eastern Transmission LP† | 2.80% | 10/15/2022 | 50 | 50,565 | ||||||||
| Total | 2,912,804 | |||||||||||
| REITS 0.93% | ||||||||||||
| CyrusOne LP/CyrusOne Finance Corp. | 2.90% | 11/15/2024 | 500 | 519,560 | ||||||||
| GLP Capital LP/GLP Financing II, Inc. | 3.35% | 9/1/2024 | 337 | 350,770 | ||||||||
| GLP Capital LP/GLP Financing II, Inc. | 5.25% | 6/1/2025 | 350 | 385,565 | ||||||||
| MPT Operating Partnership LP/MPT Finance Corp. | 5.00% | 10/15/2027 | 432 | 451,490 | ||||||||
| Total | 1,707,385 | |||||||||||
| Semiconductors 0.52% | ||||||||||||
| Microchip Technology, Inc.† | 0.972% | 2/15/2024 | 542 | 537,184 | ||||||||
| Microchip Technology, Inc. | 2.67% | 9/1/2023 | 400 | 410,568 | ||||||||
| Total | 947,752 | |||||||||||
| See Notes to Financial Statements. | 303 |
Schedule of Investments (continued)
SHORT DURATION CORE BOND FUND November 30, 2021
| Principal | ||||||||||||
| Interest | Maturity | Amount | Fair | |||||||||
| Investments | Rate | Date | (000) | Value | ||||||||
| Transportation 0.28% | ||||||||||||
| Pelabuhan Indonesia III Persero PT (Indonesia)†(d) | 4.50% | 5/2/2023 | $ | 500 | $ | 522,210 | ||||||
| Total Corporate Bonds (cost $55,372,954) | 55,271,148 | |||||||||||
| FLOATING RATE LOANS(e) 5.71% | ||||||||||||
| Chemicals 0.27% | ||||||||||||
| Nutrition & Biosciences, Inc. 5 Year Delayed Draw Term Loan | – | (f) | 1/17/2025 | 500 | 499,687 | |||||||
| Financial Services 0.80% | ||||||||||||
| Delos Finance Sarl 2018 Term Loan B (Luxembourg)(d) | 1.882% (3 Mo. LIBOR + 1.75% | ) | 10/6/2023 | 1,466 | 1,465,195 | |||||||
| Food 0.54% | ||||||||||||
| JBS USA Lux S.A. 2019 Term Loan B | 2.092% (1 Mo. LIBOR + 2.00% | ) | 5/1/2026 | 1,000 | 996,380 | |||||||
| Gaming 0.26% | ||||||||||||
| GLP Capital L.P. 2020 Term Loan A2 | 1.589% (1 Mo. LIBOR + 1.50% | ) | 5/21/2023 | 470 | 466,475 | (g) | ||||||
| Government 0.97% | ||||||||||||
| Seminole Tribe of Florida 2018 Term Loan B | 1.84% (1 Mo. LIBOR + 1.75% | ) | 7/8/2024 | 1,778 | 1,775,070 | |||||||
| Health Care Services 0.60% | ||||||||||||
| Humana Inc. Delayed Draw Term Loan | 1.34% (1 Mo. LIBOR + 1.25% | ) | 5/28/2024 | 115 | 113,534 | (g) | ||||||
| Humana Inc. Term Loan | �� | – | (f) | 10/30/2023 | 1,000 | 986,880 | (g) | |||||
| Total | 1,100,414 | |||||||||||
| Leasing 0.18% | ||||||||||||
| Avolon TLB Borrower 1 (US) LLC Term Loan B3 | 2.50% (1 Mo. LIBOR + 1.75% | ) | 1/15/2025 | 332 | 331,170 | |||||||
| Lodging 0.40% | ||||||||||||
| Hilton Worldwide Finance, LLC 2019 Term Loan B2 | – | (f) | 6/22/2026 | 750 | 740,509 | |||||||
| Media 0.12% | ||||||||||||
| Nielsen Finance LLC USD Term Loan B4 | 2.089% (1 Mo. LIBOR + 2.00% | ) | 10/4/2023 | 214 | 213,440 | |||||||
| Miscellaneous 0.70% | ||||||||||||
| Charter Communications Operating, LLC 2019 Term Loan B1 | 1.85% (1 Mo. LIBOR + 1.75% | ) | 4/30/2025 | 1,287 | 1,282,856 | |||||||
| 304 | See Notes to Financial Statements. |
Schedule of Investments (continued)
SHORT DURATION CORE BOND FUND November 30, 2021
| Principal | ||||||||||||
| Interest | Maturity | Amount | Fair | |||||||||
| Investments | Rate | Date | (000) | Value | ||||||||
| Oil: Crude Producers 0.30% | ||||||||||||
| Cheniere Corpus Christi Holdings, LLC Delayed Draw Term Loan Tranche 2 | – | (f) | 6/30/2024 | $ | 550 | $ | 549,884 | |||||
| Software 0.35% | ||||||||||||
| Vmware, Inc. 3 Year Term Loan | 1.05% (3 Mo. LIBOR + 0.88% | ) | 9/2/2024 | 650 | 648,996 | |||||||
| Telecommunications 0.22% | ||||||||||||
| AT&T Inc. 2021 Delayed Draw Term Loan | 1.091% (1 Mo. LIBOR + 1.00% | ) | 3/23/2022 | 405 | 405,217 | (g) | ||||||
| Total Floating Rate Loans (cost $10,512,614) | 10,475,293 | |||||||||||
| FOREIGN GOVERNMENT OBLIGATIONS 0.79% | ||||||||||||
| Bermuda 0.11% | ||||||||||||
| Government of Bermuda† | 4.138% | 1/3/2023 | 200 | 205,031 | ||||||||
| Japan 0.47% | ||||||||||||
| Japan Finance Organization for Municipalities(d) | 2.00% | 4/21/2022 | 850 | 856,673 | ||||||||
| Romania 0.07% | ||||||||||||
| Republic of Romania†(d) | 4.875% | 1/22/2024 | 120 | 128,039 | ||||||||
| Saudi Arabia 0.14% | ||||||||||||
| Saudi International Bond†(d) | 2.875% | 3/4/2023 | 250 | 256,811 | ||||||||
| Total Foreign Government Obligations (cost $1,448,944) | 1,446,554 | |||||||||||
| GOVERNMENT SPONSORED ENTERPRISES COLLATERALIZED MORTGAGE OBLIGATIONS 0.01% | ||||||||||||
| Government National Mortgage Assoc. 2014-112 A (Cost $10,308) | 3.00% | #(h) | 1/16/2048 | 10 | 10,408 | |||||||
| GOVERNMENT SPONSORED ENTERPRISES PASS-THROUGHS 2.54% | ||||||||||||
| Federal National Mortgage Assoc.(i) (cost $4,671,502) | 3.00% | TBA | 4,460 | 4,666,025 | ||||||||
| MUNICIPAL BONDS 0.08% | ||||||||||||
| Miscellaneous | ||||||||||||
| State of Illinois (cost $151,540) | 4.95% | 6/1/2023 | 148 | 154,969 | ||||||||
| NON-AGENCY COMMERCIAL MORTGAGE-BACKED SECURITIES 18.45% | ||||||||||||
| Angel Oak Mortgage Trust 2020-6 A1† | 1.261% | #(h) | 5/25/2065 | 128 | 128,541 | |||||||
| Angel Oak Mortgage Trust 2021-7 A1† | 1.978% | #(h) | 10/25/2066 | 200 | 201,403 | |||||||
| Atrium Hotel Portfolio Trust 2017-ATRM A† | 1.02% (1 Mo. LIBOR + .93% | )# | 12/15/2036 | 350 | 349,726 | |||||||
| Atrium Hotel Portfolio Trust 2018-ATRM A† | 1.04% (1 Mo. LIBOR + .95% | )# | 6/15/2035 | 450 | 449,725 | |||||||
| See Notes to Financial Statements. | 305 |
Schedule of Investments (continued)
SHORT DURATION CORE BOND FUND November 30, 2021
| Principal | ||||||||||||
| Interest | Maturity | Amount | Fair | |||||||||
| Investments | Rate | Date | (000) | Value | ||||||||
| NON-AGENCY COMMERCIAL MORTGAGE-BACKED SECURITIES (continued) | ||||||||||||
| BAMLL Commercial Mortgage Securities Trust 2013-WBRK A† | 3.652% | #(h) | 3/10/2037 | $ | 230 | $ | 240,279 | |||||
| Bancorp Commercial Mortgage Trust 2019-CRE6 A† | 1.212% (1 Mo. SOFR + 1.16% | )# | 9/15/2036 | 15 | 15,330 | |||||||
| BBCMS Mortgage Trust 2018-TALL A† | 0.812% (1 Mo. LIBOR + .72% | )# | 3/15/2037 | 500 | 495,275 | |||||||
| BBCMS Mortgage Trust 2018-TALL C† | 1.211% (1 Mo. LIBOR + 1.12% | )# | 3/15/2037 | 340 | 327,001 | |||||||
| BBCMS Mortgage Trust 2020-C7 A2 | 2.021% | 4/15/2053 | 250 | 252,424 | ||||||||
| BB-UBS Trust 2012-SHOW A† | 3.43% | 11/5/2036 | 300 | 312,110 | ||||||||
| BDS 2021-FL8 A† | 1.009% (1 Mo. LIBOR + .92% | )# | 1/18/2036 | 360 | 358,092 | |||||||
| Benchmark Mortgage Trust 2021 B23 A2 | 1.62% | 2/15/2054 | 220 | 218,526 | ||||||||
| BFLD 2019-DPLO E† | 2.33% (1 Mo. LIBOR + 2.24% | )# | 10/15/2034 | 520 | 510,589 | |||||||
| BHMS 2018-ATLS A† | 1.34% (1 Mo. LIBOR + 1.25% | )# | 7/15/2035 | 340 | 340,600 | |||||||
| BHMS 2018-ATLS C† | 1.99% (1 Mo. LIBOR + 1.90% | )# | 7/15/2035 | 890 | 887,732 | |||||||
| BHMS 2018-ATLS D† | 2.34% (1 Mo. LIBOR + 2.25% | )# | 7/15/2035 | 570 | 565,552 | |||||||
| BX 2021-MFM1 A† | 0.79% (1 Mo. LIBOR + .70% | )# | 1/15/2034 | 250 | 249,293 | |||||||
| BX Commercial Mortgage Trust 2019-IMC A† | 1.089% (1 Mo. LIBOR + 1.00% | )# | 4/15/2034 | 600 | 599,394 | |||||||
| BX Commercial Mortgage Trust 2019-XL A† | 1.01% (1 Mo. LIBOR + .92% | )# | 10/15/2036 | 168 | 168,196 | |||||||
| BX Commercial Mortgage Trust 2019-XL B† | 1.17% (1 Mo. LIBOR + 1.08% | )# | 10/15/2036 | 85 | 84,903 | |||||||
| BX Commercial Mortgage Trust 2019-XL C† | 1.34% (1 Mo. LIBOR + 1.25% | )# | 10/15/2036 | 85 | 84,857 | |||||||
| BX Commercial Mortgage Trust 2019-XL D† | 1.54% (1 Mo. LIBOR + 1.45% | )# | 10/15/2036 | 774 | 771,804 | |||||||
| 306 | See Notes to Financial Statements. |
Schedule of Investments (continued)
SHORT DURATION CORE BOND FUND November 30, 2021
| Principal | ||||||||||||
| Interest | Maturity | Amount | Fair | |||||||||
| Investments | Rate | Date | (000) | Value | ||||||||
| NON-AGENCY COMMERCIAL MORTGAGE-BACKED SECURITIES (continued) | ||||||||||||
| BX Commercial Mortgage Trust 2019-XL E† | 1.89% (1 Mo. LIBOR + 1.80% | )# | 10/15/2036 | $ | 85 | $ | 84,770 | |||||
| BX Commercial Mortgage Trust 2021-XL2 A† | 0.779% (1 Mo. LIBOR + .69% | )# | 10/15/2038 | 730 | 727,486 | |||||||
| BX Trust 2017-SLCT D† | 2.14% (1 Mo. LIBOR + 2.05% | )# | 7/15/2034 | 7 | 6,782 | |||||||
| BX Trust 2018-GW A† | 0.89% (1 Mo. LIBOR + .80% | )# | 5/15/2035 | 773 | 772,705 | |||||||
| BX Trust 2021-ARIA E† | 2.335% (1 Mo. LIBOR + 2.24% | )# | 10/15/2036 | 610 | 608,186 | |||||||
| BX Trust 2021-RISE A†(b) | 0.848% (1 Mo. LIBOR + .75% | )# | 11/15/2036 | 700 | 706,573 | |||||||
| BXHPP Trust 2021-FILM A† | 0.74% (1 Mo. LIBOR + .65% | )# | 8/15/2036 | 440 | 438,800 | |||||||
| BXHPP Trust 2021-FILM B† | 0.99% (1 Mo. LIBOR + .90% | )# | 8/15/2036 | 460 | 457,878 | |||||||
| BXHPP Trust 2021-FILM XCP† | 0.866% | #(h) | 8/15/2036 | 58,095 | 378,489 | |||||||
| Cantor Commercial Real Estate Lending 2019-CF1 65A† | 4.411% | #(h) | 5/15/2052 | 50 | 51,253 | |||||||
| CFCRE Commercial Mortgage Trust 2018-TAN A† | 4.236% | 2/15/2033 | 78 | 80,015 | ||||||||
| CHT Mortgage Trust 2017-CSMO A† | 1.019% (1 Mo. LIBOR + .93% | )# | 11/15/2036 | 480 | 480,369 | |||||||
| CHT Mortgage Trust 2017-CSMO B† | 1.489% (1 Mo. LIBOR + 1.40% | )# | 11/15/2036 | 890 | 890,884 | |||||||
| CHT Mortgage Trust 2017-CSMO C† | 1.589% (1 Mo. LIBOR + 1.50% | )# | 11/15/2036 | 300 | 300,321 | |||||||
| CIM Retail Portfolio Trust 2021-RETL E† | 3.84% (1 Mo. LIBOR + 3.75% | )# | 8/15/2036 | 500 | 497,530 | |||||||
| Citigroup Commercial Mortgage Trust 2013-375P C† | 3.635% | #(h) | 5/10/2035 | 275 | 277,960 | |||||||
| Citigroup Commercial Mortgage Trust 2015-GC27 AAB | 2.944% | 2/10/2048 | 6 | 6,319 | ||||||||
| Citigroup Commercial Mortgage Trust 2016-GC36 A5 | 3.616% | 2/10/2049 | 100 | 107,263 | ||||||||
| See Notes to Financial Statements. | 307 |
Schedule of Investments (continued)
SHORT DURATION CORE BOND FUND November 30, 2021
| Principal | ||||||||||||
| Interest | Maturity | Amount | Fair | |||||||||
| Investments | Rate | Date | (000) | Value | ||||||||
| NON-AGENCY COMMERCIAL MORTGAGE-BACKED SECURITIES (continued) | ||||||||||||
| Citigroup Commercial Mortgage Trust 2016-GC37 A4 | 3.314% | 4/10/2049 | $ | 225 | $ | 238,793 | ||||||
| Citigroup Commercial Mortgage Trust 2018-B2 A2 | 3.788% | 3/10/2051 | 6 | 6,146 | ||||||||
| Commercial Mortgage Pass-Through Certificates 2012-CR1 B | 4.612% | 5/15/2045 | 608 | 610,255 | ||||||||
| Commercial Mortgage Pass-Through Certificates 2014-277P A† | 3.732% | #(h) | 8/10/2049 | 100 | 105,070 | |||||||
| Commercial Mortgage Pass-Through Certificates 2014-UBS3 A4 | 3.819% | 6/10/2047 | 107 | 113,120 | ||||||||
| Commercial Mortgage Pass-Through Certificates 2014-UBS6 A5 | 3.644% | 12/10/2047 | 17 | 18,422 | ||||||||
| Commercial Mortgage Pass-Through Certificates 2015-DC1 A4 | 3.078% | 2/10/2048 | 280 | 286,307 | ||||||||
| Commercial Mortgage Pass-Through Certificates 2015-PC1 B | 4.463% | #(h) | 7/10/2050 | 10 | 10,670 | |||||||
| Commercial Mortgage Pass-Through Certificates 2020-SBX A† | 1.67% | 1/10/2038 | 185 | 184,710 | ||||||||
| Credit Suisse Mortgage Capital Certificates | 1.24% | 11/15/2038 | 500 | 504,902 | ||||||||
| Credit Suisse Mortgage Capital Certificates 2020-NQM1 A1† | 1.208% | 5/25/2065 | 149 | 148,794 | ||||||||
| Credit Suisse Mortgage Capital Certificates 2020-SPT1 A1† | 1.616% | 4/25/2065 | 66 | 66,093 | ||||||||
| CSMC 2021-ADV A† | 1.49% (1 Mo. LIBOR + 1.40% | )# | 7/15/2038 | 450 | 450,813 | |||||||
| CSMC 2021-NQM7 A1† | 1.756% | #(h) | 10/25/2066 | 356 | 354,588 | |||||||
| DBGS Mortgage Trust 2021-W52 A† | 1.486% (1 Mo. LIBOR + 1.39% | )# | 10/15/2036 | 730 | 737,916 | |||||||
| DBWF Mortgage Trust 2018-GLKS A† | 1.119% (1 Mo. LIBOR + 1.03% | )# | 12/19/2030 | 380 | 380,584 | |||||||
| Deephaven Residential Mortgage Trust 2020-2 A1† | 1.692% | 5/25/2065 | 42 | 41,888 | ||||||||
| Ellington Financial Mortgage Trust 2020-1 A1† | 2.006% | #(h) | 5/25/2065 | 52 | 52,709 | |||||||
| Fontainebleau Miami Beach Trust 2019-FBLU A† | 3.144% | 12/10/2036 | 500 | 515,091 | ||||||||
| GCAT Trust 2020-NQM2 A1† | 1.555% | 4/25/2065 | 73 | 73,225 | ||||||||
| Great Wolf Trust 2019-WOLF B† | 1.424% (1 Mo. LIBOR + 1.33% | )# | 12/15/2036 | 290 | 288,558 | |||||||
| Great Wolf Trust 2019-WOLF C† | 1.723% (1 Mo. LIBOR + 1.63% | )# | 12/15/2036 | 400 | 397,566 | |||||||
| 308 | See Notes to Financial Statements. |
Schedule of Investments (continued)
SHORT DURATION CORE BOND FUND November 30, 2021
| Principal | ||||||||||||
| Interest | Maturity | Amount | Fair | |||||||||
| Investments | Rate | Date | (000) | Value | ||||||||
| NON-AGENCY COMMERCIAL MORTGAGE-BACKED SECURITIES (continued) | ||||||||||||
| GS Mortgage Securities Corp. II 2012-TMSQ A† | 3.007% | 12/10/2030 | $ | 100 | $ | 101,278 | ||||||
| GS Mortgage Securities Corp. Trust 2012-ALOH A† | 3.551% | 4/10/2034 | 160 | 160,698 | ||||||||
| GS Mortgage Securities Corp. Trust 2018-RIVR A† | 1.04% (1 Mo. LIBOR + .95% | )# | 7/15/2035 | 774 | 768,990 | |||||||
| GS Mortgage Securities Corp. Trust 2019-70P XCP IO† | Zero Coupon | #(c)(h) | 10/15/2036 | 21,863 | 437 | |||||||
| GS Mortgage Securities Corp. Trust 2019-BOCA B† | 1.59% (1 Mo. LIBOR + 1.50% | )# | 6/15/2038 | 100 | 99,924 | |||||||
| GS Mortgage Securities Corp. Trust 2019-SMP A† | 1.24% (1 Mo. LIBOR + 1.15% | )# | 8/15/2032 | 385 | 384,935 | |||||||
| GS Mortgage Securities Corp. Trust 2019-SMP B† | 1.59% (1 Mo. LIBOR + 1.50% | )# | 8/15/2032 | 185 | 185,166 | |||||||
| GS Mortgage Securities Corp. Trust 2019-SMP XCP IO† | Zero Coupon | #(c)(h) | 8/15/2032 | 10,131 | 216 | |||||||
| GS Mortgage Securities Corp. Trust 2021-ROSS A† | 1.24% (1 Mo. LIBOR + 1.15% | )# | 5/15/2026 | 270 | 270,729 | |||||||
| GS Mortgage Securities Trust 2013-GC14 A5 | 4.243% | 8/10/2046 | 339 | 354,863 | ||||||||
| GS Mortgage Securities Trust 2015-GC34 A4 | 3.506% | 10/10/2048 | 225 | 239,683 | ||||||||
| GS Mortgage Securities Trust 2016-GS2 A4 | 3.05% | 5/10/2049 | 425 | 446,771 | ||||||||
| HMH Trust 2017-NSS C† | 3.787% | 7/5/2031 | 28 | 27,492 | ||||||||
| HONO Mortgage Trust 2021-LULU A† | 1.24% (1 Mo. LIBOR + 1.15% | )# | 10/15/2036 | 450 | 450,781 | |||||||
| Houston Galleria Mall Trust 2015-HGLR A1A2† | 3.087% | 3/5/2037 | 500 | 509,932 | ||||||||
| HPLY Trust 2019-HIT A† | 1.09% (1 Mo. LIBOR + 1.00% | )# | 11/15/2036 | 151 | 150,479 | |||||||
| Hudsons Bay Simon JV Trust 2015-HB7 A7† | 3.914% | 8/5/2034 | 100 | 97,139 | ||||||||
| Irvine Core Office Trust 2013-IRV A2† | 3.279% | #(h) | 5/15/2048 | 300 | 308,650 | |||||||
| JPMorgan Chase Commercial Mortgage Securities Corp. 2018-AON A† | 4.128% | 7/5/2031 | 225 | 234,468 | ||||||||
| JPMorgan Chase Commercial Mortgage Securities Trust 2017-FL11 D† | 2.23% | |||||||||||
| (1 Mo. LIBOR + 2.14% | )# | 10/15/2032 | 3 | 3,325 | ||||||||
| See Notes to Financial Statements. | 309 |
Schedule of Investments (continued)
SHORT DURATION CORE BOND FUND November 30, 2021
| Principal | ||||||||||||
| Interest | Maturity | Amount | Fair | |||||||||
| Investments | Rate | Date | (000) | Value | ||||||||
| NON-AGENCY COMMERCIAL MORTGAGE-BACKED SECURITIES (continued) | ||||||||||||
| JPMorgan Chase Commercial Mortgage Securities Trust 2018-LAQ B† | 1.39% (1 Mo. LIBOR + 1.30% | )# | 6/15/2032 | $ | 8 | $ | 7,993 | |||||
| JPMorgan Chase Commercial Mortgage Securities Trust 2018-LAQ C† | 1.69% (1 Mo. LIBOR + 1.60% | )# | 6/15/2032 | 146 | 146,400 | |||||||
| JPMorgan Chase Commercial Mortgage Securities Trust 2018-MINN A† | 2.27% (1 Mo. LIBOR + 1.02% | )# | 11/15/2035 | 48 | 48,205 | |||||||
| JPMorgan Chase Commercial Mortgage Securities Trust 2018-MINN B† | 2.60% (1 Mo. LIBOR + 1.35% | )# | 11/15/2035 | 12 | 11,365 | |||||||
| JPMorgan Chase Commercial Mortgage Securities Trust 2018-WPT AFL† | 1.286% (1 Mo. LIBOR + 1.20% | )# | 7/5/2033 | 10 | 9,694 | |||||||
| JPMorgan Chase Commercial Mortgage Securities Trust 2018-WPT AFX† | 4.248% | 7/5/2033 | 19 | 19,820 | ||||||||
| JPMorgan Chase Commercial Mortgage Securities Trust 2018-WPT BFX† | 4.549% | 7/5/2033 | 10 | 10,384 | ||||||||
| JPMorgan Chase Commercial Mortgage Securities Trust 2018-WPT CFL† | 1.986% (1 Mo. LIBOR + 1.90% | )# | 7/5/2033 | 12 | 12,034 | |||||||
| JPMorgan Chase Commercial Mortgage Securities Trust 2018-WPT CFX† | 4.95% | 7/5/2033 | 14 | 14,538 | ||||||||
| JPMorgan Chase Commercial Mortgage Securities Trust 2019-ICON A† | 3.884% | 1/5/2034 | 368 | 380,223 | ||||||||
| JPMorgan Chase Commercial Mortgage Securities Trust 2019-ICON C† | 4.536% | 1/5/2034 | 33 | 32,564 | (j) | |||||||
| JPMorgan Chase Commercial Mortgage Securities Trust 2020-ACE A† | 3.287% | 1/10/2037 | 300 | 307,083 | ||||||||
| JPMorgan Chase Commercial Mortgage Securities Trust 2020-ACE B† | 3.64% | 1/10/2037 | 60 | 60,833 | ||||||||
| JPMorgan Chase Commercial Mortgage Securities Trust 2021-1440 B† | 1.84% (1 Mo. LIBOR + 1.75% | )# | 3/15/2036 | 680 | 679,600 | |||||||
| JPMorgan Chase Commercial Mortgage Securities Trust 2018-MINN C† | 2.95% (1 Mo. LIBOR + 1.70% | )# | 11/15/2035 | 12 | 11,174 | (j) | ||||||
| KIND Trust 2021-KIND A† | 1.04% (1 Mo. LIBOR + .95% | )# | 8/15/2038 | 450 | 450,896 | |||||||
| KKR Industrial Portfolio Trust 2021-KDIP A† | 0.64% (1 Mo. LIBOR + .55% | )# | 12/15/2037 | 91 | 89,774 | |||||||
| 310 | See Notes to Financial Statements. |
Schedule of Investments (continued)
SHORT DURATION CORE BOND FUND November 30, 2021
| Investments | Interest Rate | Maturity Date | Principal Amount (000) | Fair Value | ||||||||
| NON-AGENCY COMMERCIAL MORTGAGE-BACKED SECURITIES (continued) | ||||||||||||
| Life 2021-BMR Mortgage Trust 2021-BMR A† | 0.79% (1 Mo. LIBOR + .70% | )# | 3/15/2038 | $ | 500 | $ | 499,609 | |||||
| Morgan Stanley Bank of America Merrill Lynch Trust 2013-C7 A4 | 2.918% | 2/15/2046 | 29 | 29,441 | ||||||||
| Morgan Stanley Bank of America Merrill Lynch Trust 2016-C29 A4 | 3.325% | 5/15/2049 | 60 | 63,795 | ||||||||
| Morgan Stanley Capital I Trust 2012-C4 AS | 3.773% | 3/15/2045 | 25 | 25,101 | ||||||||
| Morgan Stanley Capital I Trust 2012-STAR A2† | 3.201% | 8/5/2034 | 500 | 501,004 | ||||||||
| MSBAM Commercial Mortgage Securities Trust 2012-CKSV A2† | 3.277% | 10/15/2030 | 100 | 99,498 | ||||||||
| MSCG Trust 2015-ALDR A1† | 2.612% | 6/7/2035 | 29 | 29,147 | ||||||||
| Natixis Commercial Mortgage Securities Trust 2018-285M A† | 3.917% | #(h) | 11/15/2032 | 33 | 33,811 | |||||||
| NYO Commercial Mortgage Trust 2021-1290 A† | 1.175% (1 Mo. LIBOR + 1.10% | )# | 11/15/2038 | 220 | 219,604 | |||||||
| One New York Plaza Trust 2020-1NYP A† | 1.04% (1 Mo. LIBOR + .95% | )# | 1/15/2026 | 225 | 224,861 | |||||||
| One New York Plaza Trust 2020-1NYP AJ† | 1.34% (1 Mo. LIBOR + 1.25% | )# | 1/15/2026 | 290 | 290,521 | |||||||
| Ready Capital Mortgage Financing LLC 2021-FL6 A† | 1.042% (1 Mo. LIBOR + .95% | )# | 7/25/2036 | 460 | 460,768 | |||||||
| ReadyCap Commercial Mortgage Trust 2018-4 A† | 3.39% | 2/27/2051 | 14 | 13,933 | ||||||||
| ReadyCap Commercial Mortgage Trust 2019-6 A† | 2.833% | 10/25/2052 | 12 | 12,103 | ||||||||
| SFO Commercial Mortgage Trust 2021 555 A† | 1.24% (1 Mo. LIBOR + 1.15% | )# | 5/15/2038 | 320 | 320,550 | |||||||
| SLIDE 2018-FUN A† | 1.24% (1 Mo. LIBOR + 1.15% | )# | 6/15/2031 | 237 | 237,004 | |||||||
| SLIDE 2018-FUN B† | 1.59% (1 Mo. LIBOR + 1.50% | )# | 6/15/2031 | 93 | 91,842 | |||||||
| SLIDE 2018-FUN C† | 1.89% (1 Mo. LIBOR + 1.80% | )# | 6/15/2031 | 9 | 9,140 | |||||||
| SLIDE 2018-FUN D† | 2.19% (1 Mo. LIBOR + 2.10% | )# | 6/15/2031 | 565 | 554,790 | |||||||
| SLIDE 2018-FUN XCP IO XCP† | Zero Coupon | #(c)(h) | 12/15/2020 | 5,552 | 56 | |||||||
| SREIT Trust 2021-MFP A† | 0.831% (1 Mo. LIBOR + .73% | )# | 11/15/2038 | 500 | 497,896 | |||||||
| See Notes to Financial Statements. | 311 |
Schedule of Investments (continued)
SHORT DURATION CORE BOND FUND November 30, 2021
| Investments | Interest Rate | Maturity Date | Principal Amount (000) | Fair Value | ||||||||
| NON-AGENCY COMMERCIAL MORTGAGE-BACKED SECURITIES (continued) | ||||||||||||
| Starwood Mortgage Residential Trust 2020-3 A1† | 1.486% | #(h) | 4/25/2065 | $ | 100 | $ | 100,194 | |||||
| UBS-BAMLL Trust 2012-WRM A† | 3.663% | 6/10/2030 | 100 | 100,311 | ||||||||
| UBS-Barclays Commercial Mortgage Trust 2012-C2 A4 | 3.525% | 5/10/2063 | 45 | 45,706 | ||||||||
| UBS-Barclays Commercial Mortgage Trust 2013-C6 A4 | 3.244% | 4/10/2046 | 242 | 247,635 | ||||||||
| Verus Securitization Trust 2020-4 A1† | 1.502% | 5/25/2065 | 89 | 89,586 | ||||||||
| Verus Securitization Trust 2020-5 A1† | 1.218% | 5/25/2065 | 162 | 162,328 | ||||||||
| Verus Securitization Trust 2020-INV1 A1† | 1.977% | #(h) | 3/25/2060 | 60 | 60,315 | |||||||
| Vista Point Securitization Trust 2020-1 A1† | 1.763% | #(h) | 3/25/2065 | 75 | 75,044 | |||||||
| Vista Point Securitization Trust 2020-2 A1† | 1.475% | #(h) | 4/25/2065 | 68 | 68,228 | |||||||
| VMC Finance LLC 2019-FL3 A† | 1.189% (1 Mo. LIBOR + 1.10% | )# | 9/15/2036 | 232 | 232,012 | |||||||
| VNDO Mortgage Trust 2012-6AVE A† | 2.996% | 11/15/2030 | 86 | 87,465 | ||||||||
| VNDO Mortgage Trust 2012-6AVE C† | 3.448% | #(h) | 11/15/2030 | 309 | 313,765 | |||||||
| Waikiki Beach Hotel Trust 2019-WBM D† | 2.119% (1 Mo. LIBOR + 2.03% | )# | 12/15/2033 | 200 | 198,744 | |||||||
| Wells Fargo Commercial Mortgage Trust 2015-C26 AS | 3.58% | 2/15/2048 | 40 | 41,624 | ||||||||
| Wells Fargo Commercial Mortgage Trust 2015-NXS3 A3 | 3.354% | 9/15/2057 | 24 | 25,501 | ||||||||
| Wells Fargo Commercial Mortgage Trust 2016-C32 A4 | 3.56% | 1/15/2059 | 60 | 64,260 | ||||||||
| Wells Fargo Commercial Mortgage Trust 2018-C48 A2 | 4.224% | 1/15/2052 | 13 | 13,123 | ||||||||
| West Town Mall Trust 2017-KNOX C† | 4.491% | #(h) | 7/5/2030 | 15 | 14,921 | |||||||
| West Town Mall Trust 2017-KNOX D† | 4.491% | #(h) | 7/5/2030 | 15 | 14,859 | |||||||
| WFLD Mortgage Trust 2014-MONT A† | 3.88% | #(h) | 8/10/2031 | 275 | 285,021 | |||||||
| WF-RBS Commercial Mortgage Trust 2012-C7 B | 4.881% | #(h) | 6/15/2045 | 25 | 24,052 | |||||||
| WF-RBS Commercial Mortgage Trust 2014-C19 A5 | 4.101% | 3/15/2047 | 87 | 92,009 | ||||||||
| WF-RBS Commercial Mortgage Trust 2014-C20 A5 | 3.995% | 5/15/2047 | 140 | 147,358 | ||||||||
| Total Non-Agency Commercial Mortgage-Backed Securities (cost $33,970,777) | 33,878,226 | |||||||||||
| U.S. TREASURY OBLIGATIONS 17.98% | ||||||||||||
| U.S. Treasury Bill | Zero Coupon | 4/21/2022 | 6,866 | 6,864,184 | ||||||||
| U.S. Treasury Note | 0.125% | 8/31/2023 | 5,068 | 5,037,117 | ||||||||
| U.S. Treasury Note | 0.375% | 10/31/2023 | 16,113 | 16,070,200 | ||||||||
| U.S. Treasury Note | 1.125% | 10/31/2026 | 5,044 | 5,037,695 | ||||||||
| Total U.S. Treasury Obligations (cost $33,024,826) | 33,009,196 | |||||||||||
| Total Long-Term Investments (cost $191,774,389) | 191,417,191 | |||||||||||
| 312 | See Notes to Financial Statements. |
Schedule of Investments (continued)
SHORT DURATION CORE BOND FUND November 30, 2021
| Investments | Interest Rate | Maturity Date | Principal Amount (000) | Fair Value | ||||||||
| SHORT-TERM INVESTMENTS 3.74% | ||||||||||||
| COMMERCIAL PAPER 0.27% | ||||||||||||
| Software | ||||||||||||
| Fidelity Natl Information Svcs (cost $506,977) | Zero Coupon | 12/8/2021 | $ | 507 | $ | 506,977 | ||||||
| REPURCHASE AGREEMENTS 3.47% | ||||||||||||
| Repurchase Agreement dated 11/30/2021, 0.00% due 12/1/2021 with Fixed Income Clearing Corp. collateralized by $6,266,400 of U.S. Treasury Note at 2.75% due 04/30/2023; value: $6,493,394; proceeds: $6,366,007 (cost $6,366,007) | 6,366 | 6,366,007 | ||||||||||
| Total Short-Term Investments (cost $6,872,984) | 6,872,984 | |||||||||||
| Total Investments in Securities 108.00% (cost $198,647,373) | 198,290,175 | |||||||||||
| Other Assets and Liabilities – Net(k) (8.00)% | (14,688,140 | ) | ||||||||||
| Net Assets 100.00% | $ | 183,602,035 | ||||||||||
| CMT | Constant Maturity Rate. | |
| IO | Interest Only. | |
| LIBOR | London Interbank Offered Rate. | |
| SOFR | Secured Over Night Financing Rate. | |
| † | Security was purchased pursuant to Rule 144A under the Securities Act of 1933 and, unless registered under such Act or exempted from registration, may only be resold to qualified institutional buyers. At November 30, 2021, the total value of Rule 144A securities was $104,685,112, which represents 57.02% of net assets. | |
| # | Variable rate security. The interest rate represents the rate in effect at November 30, 2021. | |
| (a) | Amount represents less than $1,000. | |
| (b) | Securities purchased on a when-issued basis (See Note 2(j)). | |
| (c) | Variable Rate is Fixed to Float: Rate remains fixed or at Zero Coupon until designated future date. | |
| (d) | Foreign security traded in U.S. dollars. | |
| (e) | Floating Rate Loans in which the Fund invests generally pay interest at rates which are periodically re-determined at a margin above the London Interbank Offered Rate (“LIBOR”) or the prime rate offered by major U.S. banks. The rate(s) shown is the rate(s) in effect at November 30, 2021. | |
| (f) | Interest rate to be determined. | |
| (g) | Level 3 Investment as described in Note 2(t) in the Notes to Financials. Floating Rate Loans categorized as Level 3 are valued based on a single quotation obtained from a dealer. Accounting principles generally accepted in the United States of America do not require the Fund to create quantitative unobservable inputs that were not developed by the Fund. Therefore, the Fund does not have access to unobservable inputs and cannot disclose such inputs in the valuation. | |
| (h) | Interest rate is based on the weighted average interest rates of the underlying mortgages within the mortgage pool. | |
| (i) | To-be-announced (“TBA”). Security purchased on a forward commitment basis with an approximate principal and maturity date. Actual principal and maturity will be determined upon settlement when the specific mortgage pools are assigned. | |
| (j) | Level 3 Investment as described in Note 2(t) in the Notes to Financials. Security valued utilizing third party pricing information without adjustment. Such valuations are based on unobservable inputs. A significant change in third party information could result in a significantly lower or higher value of such Level 3 investments. | |
| (k) | Other Assets and Liabilities - Net include net unrealized appreciation/depreciation on futures contracts and swaps as follows: | |
| See Notes to Financial Statements. | 313 |
Schedule of Investments (continued)
SHORT DURATION CORE BOND FUND November 30, 2021
Credit Default Swaps on Indexes - Sell Protection at November 30, 2021(1):
| Referenced Index* | Swap Counterparty | Fund Receives (Quarterly) | Termination Date | Notional Amount | Payments Upfront(2) | Unrealized Appreciation/ (Depreciation)(3) | Credit Default Swap Agreements Receivable at Fair Value(4) | |||||||
| Markit CMBX.NA.AA.9 | Morgan Stanley | 1.500% | 9/17/2058 | $500,000 | $2,414 | $4,630 | $7,044 |
| * | The Referenced Index is for the Credit Default Swaps on Indexes, which is comprised of a basket of commercial mortgage-backed securities. | |
| (1) | If the Fund is a seller of protection and a credit event occurs, as defined under the terms of that particular swap agreement, the Fund will either (i) pay to the buyer of protection an amount equal to the notional amount of the swap and take delivery of the referenced obligation or underlying securities comprising the referenced index or (ii) pay a net settlement amount in the form of cash or securities equal to the notional amount of the swap less the recovery value of the referenced obligation or underlying securities. | |
| (2) | Upfront payments received/paid are presented net of amortization. | |
| (3) | Total unrealized appreciation on Credit Default Swaps on Indexes amounted to $4,630. Total unrealized depreciation on Credit Default Swaps on Indexes amounted to $0. | |
| (4) | Includes upfront payments received. |
Open Futures Contracts at November 30, 2021:
| Type | Expiration | Contracts | Position | Notional Amount | Notional Value | Unrealized Appreciation | ||||||||||||
| U.S. 2-Year Treasury Note | March 2022 | 45 | Long | $9,824,965 | $9,843,047 | $18,082 | ||||||||||||
| Type | Expiration | Contracts | Position | Notional Amount | Notional Value | Unrealized Depreciation | ||||||||||||
| U.S. 5-Year Treasury Note | March 2022 | 36 | Short | $(4,336,820 | ) | $(4,370,344 | ) | $(33,524 | ) | |||||||||
| 314 | See Notes to Financial Statements. |
Schedule of Investments (continued)
SHORT DURATION CORE BOND FUND November 30, 2021
The following is a summary of the inputs used as of November 30, 2021 in valuing the Fund’s investments carried at fair value(1):
| Investment Type(2) | Level 1 | Level 2 | Level 3 | Total | ||||||||||||
| Long-Term Investments | ||||||||||||||||
| Asset-Backed Securities | $ | – | $ | 52,505,372 | $ | – | $ | 52,505,372 | ||||||||
| Corporate Bonds | – | 55,271,148 | – | 55,271,148 | ||||||||||||
| Floating Rate Loans | ||||||||||||||||
| Gaming | – | – | 466,475 | 466,475 | ||||||||||||
| Health Care | – | – | 1,100,414 | 1,100,414 | ||||||||||||
| Telecommunications | – | – | 405,217 | 405,217 | ||||||||||||
| Remaining Industries | – | 8,503,187 | – | 8,503,187 | ||||||||||||
| Foreign Government Obligations | – | 1,446,554 | – | 1,446,554 | ||||||||||||
| Government Sponsored Enterprises Collateralized Mortgage Obligations | – | 10,408 | – | 10,408 | ||||||||||||
| Government Sponsored Enterprises Pass-Throughs | – | 4,666,025 | – | 4,666,025 | ||||||||||||
| Municipal Bonds | – | 154,969 | – | 154,969 | ||||||||||||
| Non-Agency Commercial Mortgage-Backed Securities | – | 33,834,488 | 43,738 | 33,878,226 | ||||||||||||
| U.S. Treasury Obligations | – | 33,009,196 | – | 33,009,196 | ||||||||||||
| Short-Term Investments | ||||||||||||||||
| Commercial Paper | – | 506,977 | – | 506,977 | ||||||||||||
| Repurchase Agreements | – | 6,366,007 | – | 6,366,007 | ||||||||||||
| Total | $ | – | $ | 196,274,331 | $ | 2,015,844 | $ | 198,290,175 | ||||||||
| Other Financial Instruments | ||||||||||||||||
| Credit Default Swap Contracts | ||||||||||||||||
| Assets | $ | – | $ | 7,044 | $ | – | $ | 7,044 | ||||||||
| Liabilities | – | – | – | – | ||||||||||||
| Futures Contracts | ||||||||||||||||
| Assets | 18,082 | – | – | 18,082 | ||||||||||||
| Liabilities | (33,524 | ) | – | – | (33,524 | ) | ||||||||||
| Total | $ | (15,442 | ) | $ | 7,044 | $ | – | $ | (8,398 | ) | ||||||
| (1) | Refer to Note 2(t) for a description of fair value measurements and the three-tier hierarchy of inputs. | |
| (2) | See Schedule of Investments for fair values in each industry and identification of foreign issuers and/or geography. The table above is presented by Investment Type. Industries are presented within an Investment Type should such Investment Type include securities classified as two or more levels within the three-tier fair value hierarchy. When applicable each Level 3 security is identified on the Schedule of Investments along with the valuation technique utilized. |
A reconciliation of Level 3 investments is presented when the Fund has a material amount of Level 3 investments at the beginning or end of the year in relation to the Fund’s net assets.
| See Notes to Financial Statements. | 315 |
Schedule of Investments (concluded)
SHORT DURATION CORE BOND FUND November 30, 2021
The following is a reconciliation of investments with unobservable inputs (Level 3) that were used in determining fair value:
| Investment Type | Asset– Backed Securities | Floating Rate Loans | Non-Agency Commercial Mortgage-Backed Securities | |||||||||
| Balance as of December 1, 2020 | $ | 116,159 | $ | – | $ | 86,778 | ||||||
| Accrued Discounts (Premiums) | – | 412 | 137 | |||||||||
| Realized Gain (Loss) | 7,477 | – | – | |||||||||
| Change in Unrealized Appreciation (Depreciation) | (3,803 | ) | (16,864 | ) | (373 | ) | ||||||
| Purchases | – | 1,988,558 | – | |||||||||
| Sales | (119,833 | ) | – | – | ||||||||
| Transfers into Level 3 | – | – | 11,136 | |||||||||
| Transfers out of Level 3 | – | – | (53,940 | ) | ||||||||
| Balance as of November 30, 2021 | $ | – | $ | 1,972,106 | $ | 43,738 | ||||||
| Change in unrealized appreciation/depreciation for the year ended November 30, 2021, related to Level 3 investments held at November 30, 2021 | $ | – | $ | (16,864 | ) | $ | (373 | ) | ||||
| 316 | See Notes to Financial Statements. |
Schedule of Investments
SHORT DURATION INCOME FUND November 30, 2021
| Investments | Interest Rate | Maturity Date | Principal Amount (000) | Fair Value | ||||||||
| LONG-TERM INVESTMENTS 98.36% | ||||||||||||
| ASSET-BACKED SECURITIES 24.19% | ||||||||||||
| Auto Floor Plan 0.49% | ||||||||||||
| Ford Credit Floorplan Master Owner Trust 2019-1 A | 2.84% | 3/15/2024 | $ | 137,580 | $ | 138,595,437 | ||||||
| Ford Credit Floorplan Master Owner Trust 2019-2 A | 3.06% | 4/15/2026 | 87,098 | 91,133,947 | ||||||||
| Nissan Master Owner Trust Receivables 2019-A A | 0.65% (1 Mo. LIBOR + .56% | )# | 2/15/2024 | 84,750 | 84,815,571 | |||||||
| Total | 314,544,955 | |||||||||||
| Automobiles 8.56% | ||||||||||||
| Ally Auto Receivables Trust 2019-3 A3 | 1.93% | 5/15/2024 | 30,288 | 30,492,342 | ||||||||
| AmeriCredit Automobile Receivables Trust 2019-1 B | 3.13% | 2/18/2025 | 28,000 | 28,248,321 | ||||||||
| AmeriCredit Automobile Receivables Trust 2019-1 C | 3.36% | 2/18/2025 | 36,750 | 37,648,596 | ||||||||
| AmeriCredit Automobile Receivables Trust 2020-1 B | 1.48% | 1/21/2025 | 36,007 | 36,309,621 | ||||||||
| ARI Fleet Lease Trust 2020-A A2† | 1.77% | 8/15/2028 | 12,224 | 12,265,666 | ||||||||
| Arivo Acceptance Auto Loan Receivables Trust 2019-1 A† | 2.99% | 7/15/2024 | 7,095 | 7,149,608 | ||||||||
| Avis Budget Rental Car Funding AESOP LLC 2018-2A A† | 4.00% | 3/20/2025 | 22,004 | 23,300,907 | ||||||||
| Avis Budget Rental Car Funding AESOP LLC 2018-2A D† | 3.04% | 3/20/2025 | 59,000 | 59,095,167 | (a) | |||||||
| Avis Budget Rental Car Funding AESOP LLC 2020-2A A† | 2.02% | 2/20/2027 | 22,560 | 22,877,333 | ||||||||
| Bank of The West Auto Trust 2017-1 A4† | 2.33% | 9/15/2023 | 10,593 | 10,625,579 | ||||||||
| Capital One Prime Auto Receivables Trust 2021-1 A2 | 0.32% | 2/18/2025 | 74,315 | 74,232,726 | ||||||||
| CarMax Auto Owner Trust 2020-2 A3 | 1.70% | 11/15/2024 | 12,502 | 12,596,719 | ||||||||
| CarMax Auto Owner Trust 2020-2 A4 | 2.05% | 5/15/2025 | 35,731 | 36,439,103 | ||||||||
| Carvana Auto Receivables Trust 2019-2A C† | 3.00% | 6/17/2024 | 23,649 | 23,866,871 | ||||||||
| Carvana Auto Receivables Trust 2021-N1 A | 0.70% | 1/10/2028 | 25,123 | 25,052,730 | ||||||||
| Chesapeake Funding II LLC 2019-1A A1† | 2.94% | 4/15/2031 | 6,374 | 6,432,532 | ||||||||
| CPS Auto Receivables Trust 2017-B E† | 5.75% | 12/15/2023 | 10,010 | 10,086,478 | ||||||||
| CPS Auto Receivables Trust 2017-D D† | 3.73% | 9/15/2023 | 2,616 | 2,631,211 | ||||||||
| CPS Auto Receivables Trust 2019-B E† | 5.00% | 3/17/2025 | 3,500 | 3,649,751 | ||||||||
| CPS Auto Receivables Trust 2019-C C† | 2.84% | 6/16/2025 | 3,678 | 3,695,587 | ||||||||
| CPS Auto Receivables Trust 2019-C D† | 3.17% | 6/16/2025 | 7,669 | 7,819,250 | ||||||||
| CPS Auto Receivables Trust 2019-D C† | 2.54% | 8/15/2024 | 28,395 | 28,566,693 | ||||||||
| CPS Auto Receivables Trust 2020-A E† | 4.09% | 12/15/2025 | 11,448 | 11,674,606 | ||||||||
| Credit Acceptance Auto Loan Trust 2021-3A A† | 1.00% | 5/15/2030 | 48,200 | 47,935,637 | ||||||||
| Drive Auto Receivables Trust 2018-4 D | 4.09% | 1/15/2026 | 33,780 | 34,404,485 | ||||||||
| See Notes to Financial Statements. | 317 |
Schedule of Investments (continued)
SHORT DURATION INCOME FUND November 30, 2021
| Investments | Interest Rate | Maturity Date | Principal Amount (000) | Fair Value | ||||||||
| Automobiles (continued) | ||||||||||||
| Drive Auto Receivables Trust 2018-5 C | 3.99% | 1/15/2025 | $ | 11,977 | $ | 12,042,270 | ||||||
| Drive Auto Receivables Trust 2019-2 C | 3.42% | 6/16/2025 | 24,024 | 24,228,751 | ||||||||
| Drive Auto Receivables Trust 2019-2 D | 3.69% | 8/17/2026 | 27,026 | 27,720,633 | ||||||||
| Drive Auto Receivables Trust 2019-4 C | 2.51% | 11/17/2025 | 53,418 | 53,771,546 | ||||||||
| Drive Auto Receivables Trust 2019-4 D | 2.70% | 2/16/2027 | 46,783 | 47,703,937 | ||||||||
| Drive Auto Receivables Trust 2020-2 A3 | 0.83% | 5/15/2024 | 3,348 | 3,348,944 | ||||||||
| Drive Auto Receivables Trust 2020-2 B | 1.42% | 3/17/2025 | 9,000 | 9,031,882 | ||||||||
| Drive Auto Receivables Trust 2021-1 C | 1.02% | 6/15/2027 | 39,725 | 39,799,484 | ||||||||
| Drive Auto Receivables Trust 2021-1 D | 1.45% | 1/16/2029 | 37,120 | 37,055,107 | ||||||||
| Drive Auto Receivables Trust 2021-2 A2 | 0.36% | 5/15/2024 | 107,335 | 107,294,878 | ||||||||
| Drive Auto Receivables Trust 2021-2 D | 1.39% | 3/15/2029 | 91,455 | 89,957,315 | ||||||||
| Enterprise Fleet Financing LLC 2020-2 A2† | 0.61% | 7/20/2026 | 74,557 | 74,524,161 | ||||||||
| Exeter Automobile Receivables Trust 2021-2A A2 | 0.27% | 1/16/2024 | 23,611 | 23,607,488 | ||||||||
| Exeter Automobile Receivables Trust 2021-2A C | 0.98% | 6/15/2026 | 29,900 | 29,863,612 | ||||||||
| Exeter Automobile Receivables Trust 2021-2A D | 1.40% | 4/15/2027 | 52,760 | 52,254,253 | ||||||||
| Exeter Automobile Receivables Trust 2021-3A A2 | 0.34% | 1/16/2024 | 76,014 | 75,985,890 | ||||||||
| Exeter Automobile Receivables Trust 2021-3A D | 1.55% | 6/15/2027 | 61,755 | 60,956,094 | ||||||||
| Exeter Automobile Receivables Trust 2021-3A E† | 3.04% | 12/15/2028 | 40,830 | 40,429,854 | ||||||||
| Fifth Third Auto Trust 2019-1 A4 | 2.69% | 11/16/2026 | 28,013 | 28,533,941 | ||||||||
| Ford Credit Auto Lease Trust 2021-A A2 | 0.19% | 7/15/2023 | 86,756 | 86,742,797 | ||||||||
| Ford Credit Auto Lease Trust 2021-A A3 | 0.26% | 2/15/2024 | 107,486 | 107,313,711 | ||||||||
| Ford Credit Auto Owner Trust 2017-2 A† | 2.36% | 3/15/2029 | 38,244 | 38,831,428 | ||||||||
| Ford Credit Auto Owner Trust 2018-REV2 A† | 3.47% | 1/15/2030 | 97,245 | 101,489,258 | ||||||||
| Ford Credit Auto Owner Trust 2019-REV1 A† | 3.52% | 7/15/2030 | 89,401 | 94,153,092 | ||||||||
| Ford Credit Auto Owner Trust 2020-C A3 | 0.41% | 7/15/2025 | 80,663 | 80,443,516 | ||||||||
| Ford Credit Auto Owner Trust 2021-A A2 | 0.17% | 10/15/2023 | 110,757 | 110,739,635 | ||||||||
| Ford Credit Auto Owner Trust REV1 2018-1 A† | 3.19% | 7/15/2031 | 48,939 | 51,737,577 | ||||||||
| Ford Credit Auto Owner Trust REV1 2021-1 A† | 1.37% | 10/17/2033 | 76,875 | 76,511,727 | ||||||||
| Foursight Capital Automobile Receivables Trust 2020-1 A3† | 2.05% | 10/15/2024 | 7,382 | 7,414,817 | ||||||||
| GLS Auto Receivables Issuer Trust 2021-3A A† | 0.42% | 1/15/2025 | 126,401 | 126,377,167 | ||||||||
| GM Financial Automobile Leasing Trust 2020-2 A3 | 0.80% | 7/20/2023 | 38,356 | 38,440,437 | ||||||||
| GM Financial Consumer Automobile Receivables Trust 2019-1 B | 3.37% | 8/16/2024 | 13,545 | 13,825,352 | ||||||||
| GM Financial Consumer Automobile Receivables Trust 2020-4 A3 | 0.38% | 8/18/2025 | 103,164 | 102,974,704 | ||||||||
| GM Financial Consumer Automobile Receivables Trust 2021-1 A2 | 0.23% | 11/16/2023 | 39,578 | 39,575,469 | ||||||||
| 318 | See Notes to Financial Statements. |
Schedule of Investments (continued)
SHORT DURATION INCOME FUND November 30, 2021
| Investments | Interest Rate | Maturity Date | Principal Amount (000) | Fair Value | ||||||||
| Automobiles (continued) | ||||||||||||
| GM Financial Consumer Automobile Receivables Trust 2021-1 A3 | 0.35% | 10/16/2025 | $ | 65,136 | $ | 64,893,759 | ||||||
| GM Financial Leasing Trust 2021-1 A2 | 0.17% | 4/20/2023 | 122,605 | 122,574,463 | ||||||||
| GM Financial Leasing Trust 2021-1 A3 | 0.26% | 2/20/2024 | 139,892 | 139,602,563 | ||||||||
| Hertz Vehicle Financing III LP 2021-2A A† | 1.68% | 12/27/2027 | 89,713 | 89,665,039 | ||||||||
| Hertz Vehicle Financing LLC 2021-1A A† | 1.21% | 12/26/2025 | 91,200 | 90,642,184 | ||||||||
| Hertz Vehicle Financing LLC 2021-1A D† | 3.98% | 12/26/2025 | 25,000 | 24,788,655 | ||||||||
| Honda Auto Receivables Owner Trust 2019-1 A4 | 2.90% | 6/18/2024 | 11,000 | 11,153,273 | ||||||||
| Honda Auto Receivables Owner Trust 2020-2 A3 | 0.82% | 7/15/2024 | 38,483 | 38,585,115 | ||||||||
| Honda Auto Receivables Owner Trust 2020-3 A3 | 0.37% | 10/18/2024 | 81,372 | 81,174,925 | ||||||||
| Honda Auto Receivables Owner Trust 2021-1 A2 | 0.16% | 7/21/2023 | 82,125 | 82,106,956 | ||||||||
| Honda Auto Receivables Owner Trust 2021-2 A2 | 0.17% | 11/15/2023 | 144,530 | 144,438,195 | ||||||||
| Hyundai Auto Lease Securitization Trust 2021-A A2† | 0.25% | 4/17/2023 | 38,330 | 38,321,415 | ||||||||
| Mercedes-Benz Auto Lease Trust 2021-A A2 | 0.18% | 3/15/2023 | 33,103 | 33,098,977 | ||||||||
| Mercedes-Benz Auto Lease Trust 2021-A A3 | 0.25% | 1/16/2024 | 71,069 | 70,940,699 | ||||||||
| Nissan Auto Lease Trust 2020-B A3 | 0.43% | 10/16/2023 | 93,172 | 93,237,798 | ||||||||
| OneMain Direct Auto Receivables Trust 2021-1A A† | 0.87% | 7/14/2028 | 119,845 | 118,570,353 | ||||||||
| Santander Drive Auto Receivables Trust 2019-3 C | 2.49% | 10/15/2025 | 42,412 | 42,622,017 | ||||||||
| Santander Drive Auto Receivables Trust 2021-1 C | 0.75% | 2/17/2026 | 58,188 | 58,227,428 | ||||||||
| Santander Drive Auto Receivables Trust 2021-2 A2 | 0.28% | 4/15/2024 | 67,469 | 67,454,068 | ||||||||
| Santander Drive Auto Receivables Trust 2021-2 D | 1.35% | 7/15/2027 | 71,680 | 71,480,135 | ||||||||
| Santander Drive Auto Receivables Trust 2021-3 A2 | 0.29% | 5/15/2024 | 176,967 | 176,937,392 | ||||||||
| Santander Retail Auto Lease Trust 2019-B D† | 3.31% | 6/20/2024 | 39,672 | 40,411,181 | ||||||||
| Santander Retail Auto Lease Trust 2021-A A3† | 0.51% | 7/22/2024 | 159,370 | 158,519,522 | ||||||||
| Santander Retail Auto Lease Trust 2021-C A2† | 0.29% | 4/22/2024 | 69,985 | 69,906,561 | ||||||||
| Santander Retail Auto Lease Trust 2021-C A3† | 0.50% | 3/20/2025 | 73,120 | 72,770,055 | ||||||||
| Toyota Auto Loan Extended Note Trust 2020-1A A† | 1.35% | 5/25/2033 | 179,000 | 179,221,405 | ||||||||
| Toyota Auto Receivables Owner Trust 2020-D A2 | 0.23% | 5/15/2023 | 28,221 | 28,222,572 | ||||||||
| Toyota Auto Receivables Owner Trust 2020-D A3 | 0.35% | 1/15/2025 | 84,958 | 84,831,183 | ||||||||
| Volkswagen Auto Loan Enhanced Trust 2020-1 A3 | 0.98% | 11/20/2024 | 66,839 | 67,089,737 | ||||||||
| Westlake Automobile Receivables Trust 2019-1A C† | 3.45% | 3/15/2024 | 1,896 | 1,899,605 | ||||||||
| Westlake Automobile Receivables Trust 2019-2A D† | 3.20% | 11/15/2024 | 47,426 | 48,405,608 | ||||||||
| Westlake Automobile Receivables Trust 2019-3A B† | 2.41% | 10/15/2024 | 24,795 | 24,836,461 | ||||||||
| Westlake Automobile Receivables Trust 2019-3A C† | 2.49% | 10/15/2024 | 61,941 | 62,434,757 | ||||||||
| Westlake Automobile Receivables Trust 2020-1A B† | 1.94% | 4/15/2025 | 48,382 | 48,678,553 | ||||||||
| Westlake Automobile Receivables Trust 2021-2A A2A† | 0.32% | 4/15/2025 | 157,075 | 156,989,598 | ||||||||
| Westlake Automobile Receivables Trust 2021-2A C† | 0.89% | 7/15/2026 | 53,150 | 52,785,205 | ||||||||
| See Notes to Financial Statements. | 319 |
Schedule of Investments (continued)
SHORT DURATION INCOME FUND November 30, 2021
| Investments | Interest Rate | Maturity Date | Principal Amount (000) | Fair Value | ||||||||
| Automobiles (continued) | ||||||||||||
| World Omni Automobile Lease Securitization Trust 2020-B A3 | 0.45% | 2/15/2024 | $ | 48,093 | $ | 48,025,665 | ||||||
| World Omni Select Auto Trust 2018-1A D† | 4.13% | 1/15/2025 | 29,174 | 29,411,721 | ||||||||
| World Omni Select Auto Trust 2019-A C | 2.38% | 12/15/2025 | 8,886 | 9,041,058 | ||||||||
| World Omni Select Auto Trust 2019-A D | 2.59% | 12/15/2025 | 25,464 | 25,822,640 | ||||||||
| Total | 5,381,596,742 | |||||||||||
| Credit Card 1.08% | ||||||||||||
| American Express Credit Account Master Trust 2019-1 B | 3.07% | 10/15/2024 | 32,109 | 32,360,632 | ||||||||
| American Express Credit Account Master Trust 2019-3 B | 2.20% | 4/15/2025 | 12,714 | 12,890,085 | ||||||||
| Capital One Multi-Asset Execution Trust 2019-A2 A2 | 1.72% | 8/15/2024 | 21,237 | 21,454,849 | ||||||||
| Discover Card Execution Note Trust 2018-A2 A2 | 0.419% (1 Mo. LIBOR + .33% | )# | 8/15/2025 | 5,100 | 5,115,947 | |||||||
| Golden Credit Card Trust 2018-4A A† | 3.44% | 8/15/2025 | 53,161 | 55,584,153 | ||||||||
| Master Credit Card Trust II 2020-1A A† | 1.99% | 9/21/2024 | 12,223 | 12,443,166 | ||||||||
| Master Credit Card Trust II Series 2018-1A A† | 0.581% (1 Mo. LIBOR + .49% | )# | 7/21/2024 | 149,340 | 149,830,582 | |||||||
| Newday Funding Master Issuer plc 2021-1A A2† | 1.148% (SOFR + 1.10% | )# | 3/15/2029 | 19,600 | 19,765,377 | |||||||
| Perimeter Master Note Business Trust 2019-2A A† | 4.23% | 5/15/2024 | 31,250 | 32,166,031 | (a) | |||||||
| Perimeter Master Note Business Trust 2021-1A A† | 3.19% | 5/15/2024 | 46,000 | 45,767,079 | (a) | |||||||
| Synchrony Credit Card Master Note Trust 2017-2 B | 2.82% | 10/15/2025 | 36,807 | 37,520,128 | ||||||||
| World Financial Network Credit Card Master Trust 2019-A A | 3.14% | 12/15/2025 | 132,435 | 133,232,788 | ||||||||
| World Financial Network Credit Card Master Trust 2019-A M | 3.61% | 12/15/2025 | 29,519 | 29,678,462 | ||||||||
| World Financial Network Credit Card Master Trust 2019-B A | 2.49% | 4/15/2026 | 4,451 | 4,501,378 | ||||||||
| World Financial Network Credit Card Master Trust 2019-C A | 2.21% | 7/15/2026 | 81,668 | 82,837,306 | ||||||||
| Total | 675,147,963 | |||||||||||
| Other 13.82% | ||||||||||||
| A10 Bridge Asset Financing LLC 2019-B A1† | 3.085% | 8/15/2040 | 43,250 | 43,641,068 | ||||||||
| ACAM Ltd. 2019-FL1 A† | 1.562% (1 Mo. SOFR + 1.51% | )# | 11/17/2034 | 94,772 | 95,196,436 | |||||||
| ACAM Ltd. 2019-FL1 AS† | 1.912% (1 Mo. SOFR + 1.86% | )# | 11/17/2034 | 25,000 | 25,092,053 | |||||||
| 320 | See Notes to Financial Statements. |
Schedule of Investments (continued)
SHORT DURATION INCOME FUND November 30, 2021
| Investments | Interest Rate | Maturity Date | Principal Amount (000) | Fair Value | ||||||||
| Other (continued) | ||||||||||||
| ACREC Ltd. 2021-FL1 A† | 1.239% (1 Mo. LIBOR + 1.15% | )# | 10/16/2036 | $ | 102,830 | $ | 102,727,921 | |||||
| Affirm Asset Securitization Trust 2021-B A† | 1.03% | 8/17/2026 | 89,250 | 88,870,821 | ||||||||
| AIMCO CLO Series 2018-BA AR† | 1.224% (3 Mo. LIBOR + 1.10% | )# | 1/15/2032 | 69,000 | 69,196,865 | |||||||
| AMMC CLO 19 Ltd. 2016-19A AR† | 1.264% (3 Mo. LIBOR + 1.14% | )# | 10/16/2028 | 45,010 | 45,034,735 | |||||||
| AMMC CLO Ltd. 2016-19A BR† | 1.924% (3 Mo. LIBOR + 1.80% | )# | 10/16/2028 | 29,854 | 29,880,368 | |||||||
| AMMC CLO Ltd. 2016-19A CR† | 2.674% (3 Mo. LIBOR + 2.55% | )# | 10/16/2028 | 13,000 | 13,017,933 | |||||||
| AMMC CLO Ltd. 2020-23A A1R† | 1.163% (3 Mo. LIBOR + 1.04% | )# | 10/17/2031 | 116,150 | 116,160,194 | |||||||
| Amur Equipment Finance Receivables VI LLC 2018-2A A2† | 3.89% | 7/20/2022 | 5,272 | 5,306,723 | ||||||||
| Amur Equipment Finance Receivables VII LLC 2019-1A A2† | 2.63% | 6/20/2024 | 20,459 | 20,676,222 | ||||||||
| Anchorage Capital CLO 3-R Ltd. 2014-3RA A† | 1.186% (3 Mo. LIBOR + 1.05% | )# | 1/28/2031 | 31,258 | 31,277,595 | |||||||
| Anchorage Capital CLO 4-R Ltd. 2014-4RA A† | 1.186% (3 Mo. LIBOR + 1.05% | )# | 1/28/2031 | 40,886 | 40,896,308 | |||||||
| Apidos CLO XXII 2015-22A A1R† | 1.192% (3 Mo. LIBOR + 1.06% | )# | 4/20/2031 | 79,418 | 79,485,636 | |||||||
| Apidos CLO XXIV 2016-24A A1AL† | 1.082% (3 Mo. LIBOR + .95% | )# | 10/20/2030 | 23,480 | 23,474,130 | |||||||
| Apidos CLO XXXI 2019-31A A1R† | 1.224% (3 Mo. LIBOR + 1.10% | )# | 4/15/2031 | 86,400 | 86,591,068 | |||||||
| Applebee’s Funding LLC/IHOP Funding LLC 2019-1A A2II† | 4.723% | 6/5/2049 | 4,702 | 4,886,117 | ||||||||
| Aqua Finance Trust 2019-A A† | 3.14% | 7/16/2040 | 30,511 | 31,122,357 | ||||||||
| Aqua Finance Trust 2021-A A† | 1.54% | 7/17/2046 | 115,997 | 115,190,845 | ||||||||
| Arbor Realty Commercial Real Estate Notes Ltd. 2018-FL1 A† | 1.24% (1 Mo. LIBOR + 1.15% | )# | 6/15/2028 | 35,293 | 35,305,353 | |||||||
| Arbor Realty Commercial Real Estate Notes Ltd. 2019-FL1 A† | 1.24% (1 Mo. LIBOR + 1.15% | )# | 5/15/2037 | 55,365 | 55,348,391 | |||||||
| Arbor Realty Commercial Real Estate Notes Ltd. 2021-FL2 A† | 1.19% (1 Mo. LIBOR + 1.10% | )# | 5/15/2036 | 60,530 | 60,432,547 | |||||||
| See Notes to Financial Statements. | 321 |
Schedule of Investments (continued)
SHORT DURATION INCOME FUND November 30, 2021
| Investments | Interest Rate | Maturity Date | Principal Amount (000) | Fair Value | ||||||||
| Other (continued) | ||||||||||||
| Arbor Realty Commercial Real Estate Notes Ltd. 2021-FL3 A† | 1.16% (1 Mo. LIBOR + 1.07% | )# | 8/15/2034 | $ | 80,250 | $ | 80,077,759 | |||||
| Arbor Realty Commercial Real Estate Notes Ltd. 2021-FL3 AS† | 1.49% (1 Mo. LIBOR + 1.40% | )# | 8/15/2034 | 18,530 | 18,461,254 | |||||||
| Arbor Realty Commercial Real Estate Notes Ltd. 2021-FL4 A†(b) | 1.44% (1 Mo. LIBOR + 1.35% | )# | 11/15/2036 | 188,500 | 188,660,677 | |||||||
| ARES L CLO Ltd. 2018-50A AR† | 1.174% (3 Mo. LIBOR + 1.05% | )# | 1/15/2032 | 120,140 | 120,076,210 | |||||||
| Bain Capital Credit CLO 2019-2A AR† | 1.222% (3 Mo. LIBOR + 1.10% | )# | 10/17/2032 | 75,950 | 76,006,778 | |||||||
| Bain Capital Credit CLO Ltd. 2017-1A A1R† | 1.102% (3 Mo. LIBOR + .97% | )# | 7/20/2030 | 93,850 | 93,876,835 | |||||||
| Bain Capital Credit CLO Ltd. 2020-5A A1† | 1.352% (3 Mo. LIBOR + 1.22% | )# | 1/20/2032 | 72,770 | 72,803,297 | |||||||
| Ballyrock CLO Ltd. 2019-1A A1R† | Zero Coupon | #(c) | 7/15/2032 | 141,710 | 141,350,215 | |||||||
| Barings CLO Ltd. 2019-3A A1R† | 1.202% (3 Mo. LIBOR + 1.07% | )# | 4/20/2031 | 117,460 | 117,430,379 | |||||||
| BDS Ltd. 2021-FL7 A† | 1.159% (1 Mo. LIBOR + 1.07% | )# | 6/16/2036 | 104,240 | 104,173,286 | |||||||
| Benefit Street Partners CLO IV Ltd. 2014-IVA ARRR† | 1.312% (3 Mo. LIBOR + 1.18% | )# | 1/20/2032 | 77,740 | 77,775,522 | |||||||
| BlueMountain CLO Ltd. 2015-2A A1R† | 1.052% (3 Mo. LIBOR + .93% | )# | 7/18/2027 | 6,505 | 6,506,503 | |||||||
| BlueMountain CLO Ltd. 2016-2A A1R2† | 1.28% (3 Mo. LIBOR + 1.12% | )# | 8/20/2032 | 33,000 | 33,003,804 | |||||||
| BlueMountain Fuji US CLO I Ltd. 2017-1A A1R† | 1.112% (3 Mo. LIBOR + .98% | )# | 7/20/2029 | 69,720 | 69,713,126 | |||||||
| BSPRT Issuer Ltd. 2019 FL5 A† | 1.24% (1 Mo. LIBOR + 1.15% | )# | 5/15/2029 | 38,503 | 38,363,654 | |||||||
| Carlyle Global Market Strategies CLO Ltd. 2015-1A AR3† | 1.112% (3 Mo. LIBOR + .98% | )# | 7/20/2031 | 78,820 | 78,866,230 | |||||||
| Carlyle US CLO Ltd. 2017-2A A1R† | 1.184% (3 Mo. LIBOR + 1.05% | )# | 7/20/2031 | 90,210 | 90,255,074 | |||||||
| Carlyle US CLO Ltd. 2017-3A A1AR† | 1.032% (3 Mo. LIBOR + .90% | )# | 7/20/2029 | 27,740 | 27,748,367 | |||||||
| 322 | See Notes to Financial Statements. |
Schedule of Investments (continued)
SHORT DURATION INCOME FUND November 30, 2021
| Investments | Interest Rate | Maturity Date | Principal Amount (000) | Fair Value | ||||||||
| Other (continued) | ||||||||||||
| Carlyle US CLO Ltd. 2019-1A A1AR† | 1.212% (3 Mo. LIBOR + 1.08% | )# | 4/20/2031 | $ | 137,100 | $ | 137,204,728 | |||||
| Cedar Funding X CLO Ltd. 2019-10A AR† | Zero Coupon | #(c) | 10/20/2032 | 10,610 | 10,610,803 | |||||||
| Cedar Funding XIV CLO Ltd. 2021-14A A† | 1.224% (3 Mo. LIBOR + 1.10% | )# | 7/15/2033 | 96,630 | 96,547,865 | |||||||
| CF Hippolyta LLC 2021-1A A1† | 1.53% | 3/15/2061 | 39,058 | 38,441,473 | ||||||||
| CIFC Funding II Ltd. 2013-2A A1L2† | Zero Coupon | #(c) | 10/18/2030 | 37,100 | 37,096,340 | |||||||
| CIFC Funding Ltd. 2021-4A A† | 1.174% (3 Mo. LIBOR + 1.05% | )# | 7/15/2033 | 83,100 | 83,038,262 | |||||||
| Colombia Cent CLO Ltd. 2018-27A A2A† | 1.724% (3 Mo. LIBOR + 1.60% | )# | 10/25/2028 | 5,608 | 5,617,788 | |||||||
| Dell Equipment Finance Trust 2021-2 A2† | 0.33% | 12/22/2026 | 63,275 | 63,088,858 | ||||||||
| Diamond Resorts Owner Trust 2018-1 A† | 3.70% | 1/21/2031 | 17,885 | 18,390,465 | ||||||||
| Diamond Resorts Owner Trust 2018-1 B† | 4.19% | 1/21/2031 | 10,722 | 11,026,277 | ||||||||
| DLL LLC 2018-1 A4† | 3.27% | 4/17/2026 | 12,869 | 12,912,718 | ||||||||
| Dryden CLO Ltd. 2018-55A A1† | 1.144% (3 Mo. LIBOR + 1.02% | )# | 4/15/2031 | 20,170 | 20,185,591 | |||||||
| Dryden CLO Ltd. 2019 72A AR† | 1.236% (3 Mo. LIBOR + 1.08% | )# | 5/15/2032 | 98,100 | 98,051,137 | |||||||
| Dryden Senior Loan Fund 2017-47A A1R† | 1.104% (3 Mo. LIBOR + .98% | )# | 4/15/2028 | 93,000 | 92,972,293 | |||||||
| Elmwood CLO X Ltd. 2021-3A A† | 1.13% (3 Mo. LIBOR + 1.04% | )# | 10/20/2034 | 126,290 | 126,337,359 | |||||||
| Fairstone Financial Issuance Trust I 2020-1A A†(d) | 2.509% | 10/20/2039 | CAD | 35,080 | 27,676,921 | |||||||
| Galaxy XIX CLO Ltd. 2015-19A A1RR† | 1.074% (3 Mo. LIBOR + .95% | )# | 7/24/2030 | $ | 54,290 | 54,287,286 | ||||||
| GPMT Ltd. 2019-FL2 A† | 1.389% (1 Mo. LIBOR + 1.30% | )# | 2/22/2036 | 21,403 | 21,398,576 | |||||||
| Gracie Point International Funding 2020-B A† | 1.486% (1 Mo. LIBOR + 1.40% | )# | 5/2/2023 | 74,997 | 75,436,009 | |||||||
| Grand Avenue CRE 2019-FL1 AS† | 1.589% (1 Mo. LIBOR + 1.50% | )# | 6/15/2037 | 18,701 | 18,723,604 | |||||||
| GreatAmerica Leasing Receivables Funding LLC Series 2019-1 A4† | 3.21% | 2/18/2025 | 17,040 | 17,338,534 | ||||||||
| Greystone Commercial Real Estate Notes Ltd. 2018-HC1 A† | 1.64% (1 Mo. LIBOR + 1.55% | )# | 9/15/2028 | 42,376 | 42,449,414 | |||||||
| Greystone Commercial Real Estate Notes Ltd. 2018-HC1 AS† | 2.24% (1 Mo. LIBOR + 2.15% | )# | 9/15/2028 | 22,123 | 22,038,777 | |||||||
| See Notes to Financial Statements. | 323 |
Schedule of Investments (continued)
SHORT DURATION INCOME FUND November 30, 2021
| Investments | Interest Rate | Maturity Date | Principal Amount (000) | Fair Value | ||||||||
| Other (continued) | ||||||||||||
| Greystone CRE Notes Ltd. 2021-FL3 A† | 1.11% (1 Mo. LIBOR + 1.02% | )# | 7/15/2039 | $ | 92,430 | $ | 92,131,950 | |||||
| Greywolf CLO VII Ltd. 2018-2A A1† | 1.312% (3 Mo. LIBOR + 1.18% | )# | 10/20/2031 | 37,250 | 37,231,533 | |||||||
| Halcyon Loan Advisors Funding Ltd. 2015-2A AR† | 1.204% (3 Mo. LIBOR + 1.08% | )# | 7/25/2027 | 548 | 548,302 | |||||||
| Halcyon Loan Advisors Funding Ltd. 2015-2A BR† | 1.774% (3 Mo. LIBOR + 1.65% | )# | 7/25/2027 | 15,727 | 15,739,189 | |||||||
| Halcyon Loan Advisors Funding Ltd. 2017-2A A2† | 1.822% (3 Mo. LIBOR + 1.70% | )# | 1/17/2030 | 23,027 | 23,067,173 | |||||||
| HGI CRE CLO Ltd. 2021-FL2 A† | 1.089% (1 Mo. LIBOR + 1.00% | )# | 9/17/2036 | 26,520 | 26,532,990 | |||||||
| HPEFS Equipment Trust 2020-1A A3† | 1.76% | 2/20/2030 | 30,663 | 30,770,153 | ||||||||
| HPEFS Equipment Trust 2020-1A B† | 1.89% | 2/20/2030 | 9,003 | 9,073,994 | ||||||||
| Hyundai Floorplan Master Owner Trust 2019-1 A† | 2.68% | 4/15/2024 | 104,527 | 105,415,709 | ||||||||
| JFIN CLO Ltd. 2013-1A A1NR† | 1.522% (3 Mo. LIBOR + 1.39% | )# | 1/20/2030 | 72,557 | 72,630,174 | |||||||
| JFIN CLO Ltd. 2013-1A A2R† | 2.332% (3 Mo. LIBOR + 2.20% | )# | 1/20/2030 | 37,291 | 37,338,450 | |||||||
| Kayne CLO 5 Ltd. 2019-5A A† | 1.474% (3 Mo. LIBOR + 1.35% | )# | 7/24/2032 | 55,397 | 55,466,439 | |||||||
| Kayne CLO II Ltd. 2018-2A AR† | 1.204% (3 Mo. LIBOR + 1.08% | )# | 10/15/2031 | 100,220 | 100,358,906 | |||||||
| KKR CLO Ltd. 24 A1R† | 1.212% (3 Mo. LIBOR + 1.08% | )# | 4/20/2032 | 130,540 | 130,588,953 | |||||||
| KKR CLO Ltd. 30A A1R† | 2.266% (3 Mo. LIBOR + 1.02% | )# | 10/17/2031 | 18,250 | 18,259,112 | |||||||
| KREF Ltd. 2021-FL2 A† | 1.159% (1 Mo. LIBOR + 1.07% | )# | 2/15/2039 | 69,690 | 69,690,223 | |||||||
| KREF Ltd. 2021-FL2 AS† | 1.389% (1 Mo. LIBOR + 1.30% | )# | 2/15/2039 | 37,030 | 37,076,276 | |||||||
| LCM XXII Ltd. 22A A1R† | 1.292% (3 Mo. LIBOR + 1.16% | )# | 10/20/2028 | 11,750 | 11,767,854 | |||||||
| Lendmark Funding Trust 2021-2A A† | 2.00% | 4/20/2032 | 137,050 | 136,910,853 | ||||||||
| LMREC, Inc. 2019-CRE3 A† | 1.492% (1 Mo. LIBOR + 1.40% | )# | 12/22/2035 | 65,000 | 65,072,469 | |||||||
| LoanCore Issuer Ltd. 2019-CRE2 A† | 1.22% (1 Mo. LIBOR + 1.13% | )# | 5/15/2036 | 31,870 | 31,877,005 | |||||||
| M360 LLC 2019-CRE2 A† | 1.562% (1 Mo. SOFR + 1.51% | )# | 9/15/2034 | 36,832 | 36,893,284 | |||||||
| 324 | See Notes to Financial Statements. |
Schedule of Investments (continued)
SHORT DURATION INCOME FUND November 30, 2021
| Investments | Interest Rate | Maturity Date | Principal Amount (000) | Fair Value | ||||||||
| Other (continued) | ||||||||||||
| M360 LLC 2019-CRE2 B† | 2.412% (1 Mo. SOFR + 2.36% | )# | 9/15/2034 | $ | 10,311 | $ | 10,326,307 | |||||
| Madison Park Funding Ltd. 2015-17A BR2† | 1.63% (3 Mo. LIBOR + 1.50% | )# | 7/21/2030 | 10,000 | 10,008,151 | |||||||
| Madison Park Funding XI Ltd. 2013-11A AR2† | 1.024% (3 Mo. LIBOR + .90% | )# | 7/23/2029 | 16,820 | 16,817,203 | |||||||
| Madison Park Funding XVII Ltd. 2015-17A AR2† | 1.13% (3 Mo. LIBOR + 1.00% | )# | 7/21/2030 | 29,600 | 29,610,583 | |||||||
| Madison Park Funding XXV Ltd. 2017-25A A1R† | 1.094% (3 Mo. LIBOR + .97% | )# | 4/25/2029 | 53,500 | 53,560,754 | |||||||
| Magnetite Ltd. 2021-29A A† | 1.114% (3 Mo. LIBOR + .99% | )# | 1/15/2034 | 79,670 | 79,768,588 | |||||||
| Magnetite XXII Ltd. 2019-22A AR† | 1.184% (3 Mo. LIBOR + 1.06% | )# | 4/15/2031 | 47,750 | 47,756,628 | |||||||
| Mariner Finance Issuance Trust 2021-BA A† | 2.10% | 11/20/2036 | 63,990 | 64,050,893 | ||||||||
| Mercedes-Benz Master Owner Trust 2019-BA A† | 2.61% | 5/15/2024 | 83,702 | 84,558,640 | ||||||||
| Meritage Mortgage Loan Trust 2004-2 M3 | 1.067% (1 Mo. LIBOR + .98% | )# | 1/25/2035 | 36 | 41,445 | |||||||
| MF1 Ltd. 2021-FL6 AS† | 1.539% (1 Mo. LIBOR + 1.45% | )# | 7/16/2036 | 66,840 | 66,894,140 | |||||||
| MF1 Ltd. 2021-FL7 A† | 1.169% (1 Mo. LIBOR + 1.08% | )# | 10/16/2036 | 95,220 | 94,748,661 | |||||||
| MF1 Ltd. 2021-FL7 AS† | 1.539% (1 Mo. LIBOR + 1.45% | )# | 10/16/2036 | 90,320 | 89,900,012 | |||||||
| Mountain View CLO LLC 2017-1A AR† | 1.212% (3 Mo. LIBOR + 1.09% | )# | 10/16/2029 | 40,527 | 40,540,885 | |||||||
| Mountain View CLO LLC 2017-1A BR† | 1.872% (3 Mo. LIBOR + 1.75% | )# | 10/16/2029 | 36,502 | 36,576,255 | |||||||
| MVW Owner Trust 2017-1A A† | 2.42% | 12/20/2034 | 4,226 | 4,283,599 | ||||||||
| Navient Private Education Refi Loan Trust 2020-FA A† | 1.22% | 7/15/2069 | 65,132 | 65,122,995 | ||||||||
| Navient Private Education Refi Loan Trust 2021-CA A† | 1.06% | 10/15/2069 | 146,277 | 144,819,720 | ||||||||
| Nelnet Student Loan Trust 2021-A APT1† | 1.36% | 4/20/2062 | 60,053 | 59,334,460 | ||||||||
| New Economy Assets Phase 1 Sponsor LLC 2021-1 A1† | 1.91% | 10/20/2061 | 70,550 | 69,448,559 | ||||||||
| New Economy Assets Phase 1 Sponsor LLC 2021-1 B1† | 2.41% | 10/20/2061 | 28,890 | 28,963,051 | ||||||||
| Newark BSL CLO 1 Ltd. 2016-1A A1R† | 1.235% (3 Mo. LIBOR + 1.10% | )# | 12/21/2029 | 67,407 | 67,491,578 | |||||||
| See Notes to Financial Statements. | 325 |
Schedule of Investments (continued)
SHORT DURATION INCOME FUND November 30, 2021
| Investments | Interest Rate | Maturity Date | Principal Amount (000) | Fair Value | ||||||||
| Other (continued) | ||||||||||||
| Newark BSL CLO 2 Ltd. 2017-1A A1R† | 1.094% (3 Mo. LIBOR + .97% | )# | 7/25/2030 | $ | 48,300 | $ | 48,295,811 | |||||
| Oaktree CLO Ltd. 2015-1A A1R† | 1.002% (3 Mo. LIBOR + .87% | )# | 10/20/2027 | 9,278 | 9,277,908 | |||||||
| OCP CLO Ltd. 2015-10A A2AR† | 1.425% (3 Mo. LIBOR + 1.30% | )# | 10/26/2027 | 24,351 | 24,370,556 | |||||||
| OCP CLO Ltd. 2015-9A A2R† | 1.474% (3 Mo. LIBOR + 1.35% | )# | 7/15/2027 | 25,719 | 25,728,579 | |||||||
| OCP CLO Ltd. 2016-12A A1R† | 1.242% (3 Mo. LIBOR + 1.12% | )# | 10/18/2028 | 27,515 | 27,537,381 | |||||||
| OCP CLO Ltd. 2016-12A A2R† | 1.722% (3 Mo. LIBOR + 1.60% | )# | 10/18/2028 | 26,201 | 26,222,528 | |||||||
| OCP CLO Ltd. 2019-17A A1R† | 1.172% (3 Mo. LIBOR + 1.04% | )# | 7/20/2032 | 157,030 | 157,226,237 | |||||||
| Octagon Investment Partners 30 Ltd. 2017-1A A1R† | 1.132% (3 Mo. LIBOR + 1.00% | )# | 3/17/2030 | 34,550 | 34,558,638 | |||||||
| Octagon Investment Partners 32 Ltd. 2017-1A A1R† | 1.074% (3 Mo. LIBOR + .95% | )# | 7/15/2029 | 118,070 | 118,081,834 | |||||||
| Octagon Investment Partners 49 Ltd. 2020-5A A1† | 1.344% (3 Mo. LIBOR + 1.22% | )# | 1/15/2033 | 79,600 | 79,666,955 | |||||||
| Octagon Investment Partners XIV Ltd. 2012-1A AARR† | 1.074% (3 Mo. LIBOR + .95% | )# | 7/15/2029 | 43,910 | 43,891,699 | |||||||
| Octagon Investment Partners XXI Ltd. 2014-1A AAR3† | 1.156% (3 Mo. LIBOR + 1.00% | )# | 2/14/2031 | 95,190 | 95,275,726 | |||||||
| Octane Receivables Trust 2021-1A A† | 0.93% | 3/22/2027 | 36,649 | 36,548,825 | ||||||||
| OneMain Financial Issuance Trust 2018-2A A† | 3.57% | 3/14/2033 | 7,689 | 7,978,000 | ||||||||
| OneMain Financial Issuance Trust 2019-1A A† | 3.48% | 2/14/2031 | 22,969 | 22,988,166 | ||||||||
| OneMain Financial Issuance Trust 2019-1A B† | 3.79% | 2/14/2031 | 18,443 | 18,478,230 | ||||||||
| OneMain Financial Issuance Trust 2019-2A A† | 3.14% | 10/14/2036 | 75,865 | 80,327,607 | ||||||||
| OneMain Financial Issuance Trust 2020-2A A† | 1.75% | 9/14/2035 | 20,800 | 20,742,003 | ||||||||
| OneMain Financial Issuance Trust 2020-2A C† | 2.76% | 9/14/2035 | 11,700 | 11,960,141 | ||||||||
| Orange Lake Timeshare Trust 2019-A A† | 3.06% | 4/9/2038 | 8,066 | 8,247,979 | ||||||||
| OZLM VIII Ltd. 2014-8A A1RR† | 1.292% (3 Mo. LIBOR + 1.17% | )# | 10/17/2029 | 32,900 | 32,921,465 | |||||||
| OZLM XVII Ltd. 2017 17A A1† | 1.382% (3 Mo. LIBOR + 1.25% | )# | 7/20/2030 | 14,087 | 14,083,216 | |||||||
| Palmer Square Loan Funding Ltd. 2018-4A A1† | 1.056% (3 Mo. LIBOR + .90% | )# | 11/15/2026 | 3,039 | 3,040,783 | |||||||
| Perimeter Master Note Business | 2.13% | 5/15/2027 | 90,000 | 90,177,840 | (a) | |||||||
| PFS Financing Corp. 2020-E A† | 1.00% | 10/15/2025 | 71,520 | 71,464,493 | ||||||||
| PFS Financing Corp. 2020-G A† | 0.97% | 2/15/2026 | 55,841 | 55,691,061 | ||||||||
| 326 | See Notes to Financial Statements. |
Schedule of Investments (continued)
SHORT DURATION INCOME FUND November 30, 2021
| Investments | Interest Rate | Maturity Date | Principal Amount (000) | Fair Value | ||||||||
| Other (continued) | ||||||||||||
| Planet Fitness Master Issuer LLC 2018-1A A2II† | 4.666% | 9/5/2048 | $ | 25,905 | $ | 26,604,776 | ||||||
| Prima Capital CRE Securitization 2015-5A C† | 4.50% | 12/24/2050 | 24,102 | 24,153,858 | ||||||||
| Prima Capital CRE Securitization Ltd. 2013-3A A† | 2.214% | 10/24/2035 | 2,050 | 2,050,825 | (a) | |||||||
| Prima Capital CRE Securitization Ltd. 2013-3A C† | 5.00% | 10/24/2035 | 35,011 | 34,744,771 | ||||||||
| Prima Capital CRE Securitization Ltd. 2015-4A MR-A† | 2.55% | 8/24/2049 | 5,572 | 5,574,910 | ||||||||
| Progress Residential 2021-SFR8 Trust F† | 3.181% | 10/17/2038 | 43,080 | 42,332,971 | ||||||||
| Progress Residential Trust 2021-SFR8 B† | 1.681% | 10/17/2038 | 28,310 | 27,689,224 | ||||||||
| Rad CLO Ltd. 2021-15A A†(b) | Zero Coupon | #(c) | 1/20/2034 | 105,000 | 105,000,000 | (a) | ||||||
| Romark CLO Ltd. 2017-1A A1R† | 1.154% (3 Mo. LIBOR + 1.03% | )# | 10/23/2030 | 75,250 | 75,269,595 | |||||||
| SCF Equipment Leasing LLC 2019-2A A1† | 2.22% | 6/20/2024 | 8,468 | 8,490,305 | ||||||||
| SCF Equipment Leasing LLC 2019-2A A2† | 2.47% | 4/20/2026 | 101,195 | 102,838,174 | ||||||||
| SCF Equipment Leasing LLC 2021-1A A3† | 0.83% | 8/21/2028 | 136,635 | 135,660,820 | ||||||||
| SCF Equipment Leasing LLC 2021-1A B† | 1.37% | 8/20/2029 | 14,900 | 14,630,121 | ||||||||
| Signal Peak CLO 8 Ltd. 2020-8A A† | 1.402% (3 Mo. LIBOR + 1.27% | )# | 4/20/2033 | 38,000 | 38,097,519 | |||||||
| SMB Private Education Loan Trust 2021-A A1† | 0.59% (1 Mo. LIBOR + .50% | )# | 1/15/2053 | 12,985 | 12,997,557 | |||||||
| Sound Point CLO III-R Ltd. 2013-2RA B† | 1.574% (3 Mo. LIBOR + 1.45% | )# | 4/15/2029 | 10,000 | 9,973,232 | |||||||
| TCI-Flatiron CLO Ltd. 2016-1A AR2† | 1.272% (3 Mo. LIBOR + 1.15% | )# | 1/17/2032 | 16,330 | 16,348,346 | |||||||
| TCI-Flatiron CLO Ltd. 2017-1A AR† | 1.118% (3 Mo. LIBOR + .96% | )# | 11/18/2030 | 58,190 | 58,177,576 | |||||||
| TCI-Flatiron CLO Ltd. 2018-1A ANR† | 1.189% (3 Mo. LIBOR + 1.06% | )# | 1/29/2032 | 35,050 | 35,109,535 | |||||||
| TICP CLO XIV Ltd. 2019-14A A1R†(b) | Zero Coupon | #(c) | 10/20/2032 | 58,170 | 58,170,000 | |||||||
| TPG Real Estate Finance Issuer Ltd. 2018-FL2 A† | 1.219% (1 Mo. LIBOR + 1.13% | )# | 11/15/2037 | 23,067 | 23,058,611 | |||||||
| TRTX Issuer Ltd. 2019-FL3 A† | 1.312% (1 Mo. SOFR + 1.26% | )# | 10/15/2034 | 13,040 | 13,032,642 | |||||||
| Upstart Securitization Trust 2021-2 A† | 0.91% | 6/20/2031 | 61,116 | 61,082,782 | ||||||||
| Upstart Securitization Trust 2021-5 A† | 1.31% | 11/20/2031 | 68,670 | 68,544,526 | ||||||||
| Venture CLO Ltd. 2018-33A A1LR† | 1.184% (3 Mo. LIBOR + 1.06% | )# | 7/15/2031 | 68,200 | 68,219,471 | |||||||
| VERDE CLO Ltd. 2019-1A AR† | 1.224% (3 Mo. LIBOR + 1.10% | )# | 4/15/2032 | 34,355 | 34,359,294 | |||||||
| Verizon Owner Trust 2020-B A | 0.47% | 2/20/2025 | 77,688 | 77,616,154 | ||||||||
| See Notes to Financial Statements. | 327 |
Schedule of Investments (continued)
SHORT DURATION INCOME FUND November 30, 2021
| Investments | Interest Rate | Maturity Date | Principal Amount (000) | Fair Value | ||||||||
| Other (continued) | ||||||||||||
| Verizon Owner Trust 2020-C A | 0.41% | 4/21/2025 | $ | 106,612 | $ | 106,330,203 | ||||||
| Wind River CLO Ltd. 2013-1A A1RR† | 1.112% (3 Mo. LIBOR + .98% | )# | 7/20/2030 | 133,930 | 134,016,757 | |||||||
| Total | 8,678,854,048 | |||||||||||
| Student Loan 0.24% | ||||||||||||
| Navient Private Education Refi Loan Trust 2021-FA A† | 1.11% | 2/18/2070 | 103,175 | 101,845,330 | ||||||||
| SLC Student Loan Trust 2008-1 A4A | 1.716% (3 Mo. LIBOR + 1.60% | )# | 12/15/2032 | 18,459 | 18,804,043 | |||||||
| Towd Point Asset Trust 2018-SL1 A† | 0.689% (1 Mo. LIBOR + .60% | )# | 1/25/2046 | 31,814 | 31,675,752 | |||||||
| Total | 152,325,125 | |||||||||||
| Total Asset-Backed Securities (cost $15,194,296,085) | 15,202,468,833 | |||||||||||
| Shares (000) | ||||||||||||
| COMMON STOCKS 0.06% | ||||||||||||
| Miscellaneous Financials 0.00% | ||||||||||||
| UTEX Industries, Inc. | 84 | 4,039,536 | ||||||||||
| Oil, Gas & Consumable Fuels 0.06% | ||||||||||||
| Dommo Energia SA*(d) | BRL | 1,106 | 120,004 | |||||||||
| Oasis Petroleum, Inc. | 298 | 35,730,200 | ||||||||||
| Total | 35,850,204 | |||||||||||
| Total Common Stocks (cost $30,002,542) | 39,889,740 | |||||||||||
| Principal Amount (000) | ||||||||||||
| CONVERTIBLE BONDS 0.10% | ||||||||||||
| Internet | ||||||||||||
| Weibo Corp. (China)(e) (cost $65,310,122) | 1.25% | 11/15/2022 | $ | 66,436 | 64,609,010 | |||||||
| CORPORATE BONDS 37.89% | ||||||||||||
| Advertising 0.03% | ||||||||||||
| Clear Channel International BV (United Kingdom)†(e) | 6.625% | 8/1/2025 | 15,835 | 16,365,156 | ||||||||
| 328 | See Notes to Financial Statements. |
Schedule of Investments (continued)
SHORT DURATION INCOME FUND November 30, 2021
| Investments | Interest Rate | Maturity Date | Principal Amount (000) | Fair Value | ||||||||
| Aerospace/Defense 0.76% | ||||||||||||
| Boeing Co. (The) | 2.196% | 2/4/2026 | $ | 71,250 | $ | 71,141,621 | ||||||
| Boeing Co. (The) | 4.508% | 5/1/2023 | 29,478 | 30,784,927 | ||||||||
| Boeing Co. (The) | 4.875% | 5/1/2025 | 164,892 | 180,833,119 | ||||||||
| Bombardier, Inc. (Canada)†(e) | 7.125% | 6/15/2026 | 29,715 | 30,743,139 | ||||||||
| Howmet Aerospace, Inc. | 5.125% | 10/1/2024 | 20,799 | 22,277,185 | ||||||||
| Howmet Aerospace, Inc. | 6.875% | 5/1/2025 | 14,000 | 16,045,540 | ||||||||
| Kratos Defense & Security Solutions, Inc.† | 6.50% | 11/30/2025 | 9,093 | 9,380,248 | ||||||||
| TransDigm, Inc.† | 6.25% | 3/15/2026 | 91,164 | 94,713,926 | ||||||||
| TransDigm, Inc.† | 8.00% | 12/15/2025 | 20,477 | 21,605,078 | ||||||||
| Total | 477,524,783 | |||||||||||
| Agriculture 0.84% | ||||||||||||
| BAT Capital Corp. | 1.036% (3 Mo. LIBOR + .88% | )# | 8/15/2022 | 14,546 | 14,601,804 | |||||||
| BAT Capital Corp. | 2.789% | 9/6/2024 | 27,255 | 28,197,541 | ||||||||
| BAT Capital Corp. | 3.222% | 8/15/2024 | 166,397 | 173,381,384 | ||||||||
| BAT International Finance plc (United Kingdom)†(e) | 3.95% | 6/15/2025 | 19,560 | 20,996,032 | ||||||||
| Imperial Brands Finance plc (United Kingdom)†(e) | 3.125% | 7/26/2024 | 166,275 | 172,464,254 | ||||||||
| Imperial Brands Finance plc (United Kingdom)†(e) | 3.50% | 2/11/2023 | 18,268 | 18,681,963 | ||||||||
| Imperial Brands Finance plc (United Kingdom)†(e) | 3.75% | 7/21/2022 | 12,867 | 13,045,994 | ||||||||
| Reynolds American, Inc. | 4.45% | 6/12/2025 | 41,974 | 45,428,804 | ||||||||
| Viterra Finance BV (Netherlands)†(e) | 2.00% | 4/21/2026 | 47,780 | 47,691,354 | ||||||||
| Total | 534,489,130 | |||||||||||
| Airlines 0.15% | ||||||||||||
| Air Canada 2015-1 Class B Pass-Through Trust (Canada)†(e) | 3.875% | 9/15/2024 | 7,101 | 7,156,068 | ||||||||
| Air Canada 2015-2 Class B Pass-Through Trust (Canada)†(e) | 5.00% | 6/15/2025 | 6,051 | 6,165,372 | ||||||||
| American Airlines 2014-1 Class B Pass-Through Trust | 4.375% | 4/1/2024 | 10,355 | 10,382,186 | ||||||||
| American Airlines Group, Inc.† | 3.75% | 3/1/2025 | 51,959 | 46,362,496 | ||||||||
| Spirit Loyalty Cayman Ltd./Spirit IP Cayman Ltd.† | 8.00% | 9/20/2025 | 15,343 | 16,798,693 | ||||||||
| United Airlines 2014-1 Class B Pass-Through Trust | 4.75% | 10/11/2023 | 3,850 | 3,881,936 | ||||||||
| United Airlines, Inc. | 6.636% | 1/2/2024 | 3,535 | 3,632,131 | ||||||||
| Total | 94,378,882 | |||||||||||
| Apparel 0.09% | ||||||||||||
| PVH Corp. | 4.625% | 7/10/2025 | 19,872 | 21,827,764 | ||||||||
| William Carter Co. (The)† | 5.50% | 5/15/2025 | 31,722 | 33,014,513 | ||||||||
| Total | 54,842,277 | |||||||||||
| See Notes to Financial Statements. | 329 |
Schedule of Investments (continued)
SHORT DURATION INCOME FUND November 30, 2021
| Investments | Interest Rate | Maturity Date | Principal Amount (000) | Fair Value | ||||||||
| Auto Manufacturers 2.88% | ||||||||||||
| Daimler Finance North America LLC† | 1.04% (3 Mo. LIBOR + .88% | )# | 2/22/2022 | $ | 12,862 | $ | 12,883,249 | |||||
| Daimler Finance North America LLC† | 1.75% | 3/10/2023 | 42,791 | 43,308,432 | ||||||||
| Daimler Finance North America LLC† | 3.65% | 2/22/2024 | 22,690 | 23,960,432 | ||||||||
| Ford Motor Credit Co. LLC | 1.221% (3 Mo. LIBOR + 1.08% | )# | 8/3/2022 | 43,730 | 43,689,285 | |||||||
| Ford Motor Credit Co. LLC | 2.979% | 8/3/2022 | 20,011 | 20,181,294 | ||||||||
| Ford Motor Credit Co. LLC | 3.087% | 1/9/2023 | 26,383 | 26,748,932 | ||||||||
| Ford Motor Credit Co. LLC | 3.219% | 1/9/2022 | 15,768 | 15,807,814 | ||||||||
| Ford Motor Credit Co. LLC | 3.339% | 3/28/2022 | 44,221 | 44,465,321 | ||||||||
| Ford Motor Credit Co. LLC | 3.37% | 11/17/2023 | 41,316 | 42,353,445 | ||||||||
| Ford Motor Credit Co. LLC | 3.81% | 1/9/2024 | 16,725 | 17,196,311 | ||||||||
| Ford Motor Credit Co. LLC | 4.25% | 9/20/2022 | 8,835 | 9,034,229 | ||||||||
| Ford Motor Credit Co. LLC | 5.125% | 6/16/2025 | 41,304 | 44,704,145 | ||||||||
| Ford Motor Credit Co. LLC | 5.584% | 3/18/2024 | 159,854 | 170,879,930 | ||||||||
| Ford Motor Credit Co. LLC | 5.596% | 1/7/2022 | 17,541 | 17,628,530 | ||||||||
| General Motors Co. | 5.40% | 10/2/2023 | 24,769 | 26,692,887 | ||||||||
| General Motors Co. | 6.125% | 10/1/2025 | 48,531 | 56,022,393 | ||||||||
| General Motors Financial Co., Inc. | 2.75% | 6/20/2025 | 74,459 | 76,998,292 | ||||||||
| General Motors Financial Co., Inc. | 2.90% | 2/26/2025 | 30,070 | 31,164,332 | ||||||||
| General Motors Financial Co., Inc. | 3.15% | 6/30/2022 | 55,795 | 56,516,336 | ||||||||
| General Motors Financial Co., Inc. | 3.70% | 5/9/2023 | 27,654 | 28,616,289 | ||||||||
| General Motors Financial Co., Inc. | 3.95% | 4/13/2024 | 35,702 | 37,647,224 | ||||||||
| General Motors Financial Co., Inc. | 4.25% | 5/15/2023 | 17,554 | 18,375,213 | ||||||||
| General Motors Financial Co., Inc. | 4.30% | 7/13/2025 | 10,803 | 11,691,381 | ||||||||
| General Motors Financial Co., Inc. | 5.10% | 1/17/2024 | 197,137 | 212,212,932 | ||||||||
| General Motors Financial Co., Inc. | 5.25% | 3/1/2026 | 32,940 | 37,053,347 | ||||||||
| Hyundai Capital America† | 0.80% | 1/8/2024 | 99,441 | 98,676,107 | ||||||||
| Hyundai Capital America† | 0.875% | 6/14/2024 | 84,025 | 83,039,266 | ||||||||
| Hyundai Capital America† | 1.00% | 9/17/2024 | 24,927 | 24,606,917 | ||||||||
| Hyundai Capital America† | 1.25% | 9/18/2023 | 98,674 | 98,887,478 | ||||||||
| Hyundai Capital America† | 1.30% | 1/8/2026 | 42,197 | 41,094,073 | ||||||||
| Hyundai Capital America† | 1.50% | 6/15/2026 | 47,772 | 46,534,302 | ||||||||
| Hyundai Capital America† | 1.80% | 10/15/2025 | 10,345 | 10,336,407 | ||||||||
| Hyundai Capital America† | 2.375% | 2/10/2023 | 39,278 | 39,939,694 | ||||||||
| Hyundai Capital America† | 2.85% | 11/1/2022 | 10,000 | 10,189,996 | ||||||||
| Hyundai Capital America† | 3.00% | 6/20/2022 | 8,435 | 8,529,762 | ||||||||
| Hyundai Capital America† | 3.25% | 9/20/2022 | 32,832 | 33,520,728 | ||||||||
| Hyundai Capital America† | 5.875% | 4/7/2025 | 13,781 | 15,626,785 | ||||||||
| 330 | See Notes to Financial Statements. |
Schedule of Investments (continued)
SHORT DURATION INCOME FUND November 30, 2021
| Investments | Interest Rate | Maturity Date | Principal Amount (000) | Fair Value | ||||||||
| Auto Manufacturers (continued) | ||||||||||||
| Hyundai Capital Services, Inc. (South Korea)†(e) | 3.00% | 8/29/2022 | $ | 38,997 | $ | 39,599,044 | ||||||
| Nissan Motor Acceptance Corp.† | 0.772% (3 Mo. LIBOR + .65% | )# | 7/13/2022 | 36,745 | 36,750,529 | |||||||
| Stellantis N.V. (Netherlands)(e) | 5.25% | 4/15/2023 | 12,230 | 12,952,671 | ||||||||
| Volkswagen Group of America Finance LLC† | 2.90% | 5/13/2022 | 64,408 | 65,074,158 | ||||||||
| Volkswagen Group of America Finance LLC† | 3.35% | 5/13/2025 | 17,003 | 17,945,547 | ||||||||
| Total | 1,809,135,439 | |||||||||||
| Auto Parts & Equipment 0.23% | ||||||||||||
| IHO Verwaltungs GmbH PIK 5.50% (Germany)†(e) | 4.75% | 9/15/2026 | 34,149 | 34,905,286 | ||||||||
| ZF North America Capital, Inc.† | 4.75% | 4/29/2025 | 104,914 | 111,911,239 | ||||||||
| Total | 146,816,525 | |||||||||||
| Banks 10.44% | ||||||||||||
| ABN AMRO Bank NV (Netherlands)†(e) | 4.75% | 7/28/2025 | 61,319 | 67,129,785 | ||||||||
| ABN AMRO Bank NV (Netherlands)†(e) | 4.80% | 4/18/2026 | 23,800 | 26,390,325 | ||||||||
| ABN AMRO Bank NV (Netherlands)(e) | 6.25% | 4/27/2022 | 64,981 | 66,460,617 | ||||||||
| AIB Group plc (Ireland)†(e) | 4.263% (3 Mo. LIBOR + 1.87% | )# | 4/10/2025 | 85,702 | 90,736,949 | |||||||
| AIB Group plc (Ireland)†(e) | 4.75% | 10/12/2023 | 70,222 | 74,671,693 | ||||||||
| Akbank T.A.S. (Turkey)†(e) | 5.00% | 10/24/2022 | 20,150 | 20,357,948 | ||||||||
| ASB Bank Ltd. (New Zealand)†(e) | 3.75% | 6/14/2023 | 31,956 | 33,426,848 | ||||||||
| Australia & New Zealand Banking Group Ltd. (Australia)†(e) | 4.40% | 5/19/2026 | 10,873 | 11,928,275 | ||||||||
| Australia & New Zealand Banking Group Ltd. (Australia)†(e) | 4.50% | 3/19/2024 | 12,844 | 13,753,471 | ||||||||
| Banco Santander Mexico SA Institucion de Banca Multiple Grupo Financiero Santand (Mexico)†(e) | 5.375% | 4/17/2025 | 10,000 | 10,859,350 | ||||||||
| Bancolombia SA (Colombia)(e) | 3.00% | 1/29/2025 | 24,254 | 24,147,161 | ||||||||
| Bank of America Corp. | 0.523% (SOFR + .41% | )# | 6/14/2024 | 78,938 | 78,360,533 | |||||||
| Bank of America Corp. | 0.981% (SOFR + .91% | )# | 9/25/2025 | 19,293 | 19,055,392 | |||||||
| Bank of America Corp. | 1.197% (SOFR + 1.01% | )# | 10/24/2026 | 91,258 | 89,398,524 | |||||||
| Bank of America Corp. | 1.319% (SOFR + 1.15% | )# | 6/19/2026 | 81,286 | 80,546,648 | |||||||
| Bank of America Corp. | 3.093% (3 Mo. LIBOR + 1.09% | )# | 10/1/2025 | 45,485 | 47,505,581 | |||||||
| Bank of America Corp. | 3.124% (3 Mo. LIBOR + 1.16% | )# | 1/20/2023 | 30,000 | 30,101,497 | |||||||
| See Notes to Financial Statements. | 331 |
Schedule of Investments (continued)
SHORT DURATION INCOME FUND November 30, 2021
| Investments | Interest Rate | Maturity Date | Principal Amount (000) | Fair Value | ||||||||
| Banks (continued) | ||||||||||||
| Bank of America Corp. | 3.366% (3 Mo. LIBOR + .81% | )# | 1/23/2026 | $ | 60,488 | $ | 63,901,829 | |||||
| Bank of America Corp. | 3.95% | 4/21/2025 | 88,575 | 95,096,559 | ||||||||
| Bank of America Corp. | 4.00% | 1/22/2025 | 35,512 | 38,007,187 | ||||||||
| Bank of America Corp. | 4.20% | 8/26/2024 | 72,321 | 77,751,576 | ||||||||
| Bank of Ireland Group plc (Ireland)†(e) | 2.029% (1 Yr. Treasury CMT + 1.10% | )# | 9/30/2027 | 56,942 | 56,282,452 | |||||||
| Bank of Ireland Group plc (Ireland)†(e) | 4.50% | 11/25/2023 | 35,213 | 37,472,428 | ||||||||
| BankUnited, Inc. | 4.875% | 11/17/2025 | 54,521 | 60,263,139 | ||||||||
| Barclays Bank plc (United Kingdom)(e) | 1.70% | 5/12/2022 | 32,243 | 32,385,239 | ||||||||
| Barclays plc (United Kingdom)(e) | 3.684% | 1/10/2023 | 6,000 | 6,019,012 | ||||||||
| Barclays plc (United Kingdom)(e) | 4.375% | 9/11/2024 | 22,925 | 24,541,933 | ||||||||
| Barclays plc (United Kingdom)(e) | 5.20% | 5/12/2026 | 68,799 | 77,384,083 | ||||||||
| BBVA Bancomer SA† | 4.375% | 4/10/2024 | 48,455 | 51,800,333 | ||||||||
| BBVA Bancomer SA† | 6.75% | 9/30/2022 | 47,751 | 49,723,594 | ||||||||
| BNP Paribas SA (France)†(e) | 1.323% (SOFR + 1.00% | )# | 1/13/2027 | 20,584 | 20,064,544 | |||||||
| BNP Paribas SA (France)†(e) | 3.375% | 1/9/2025 | 28,155 | 29,697,096 | ||||||||
| BNP Paribas SA (France)†(e) | 4.375% | 9/28/2025 | 930 | 1,010,116 | ||||||||
| BNP Paribas SA (France)†(e) | 4.375% | 5/12/2026 | 14,691 | 16,000,590 | ||||||||
| BNP Paribas SA (France)†(e) | 4.705% (3 Mo. LIBOR + 2.24% | )# | 1/10/2025 | 15,316 | 16,388,004 | |||||||
| BPCE SA (France)†(e) | 2.375% | 1/14/2025 | 14,304 | 14,596,464 | ||||||||
| BPCE SA (France)†(e) | 4.50% | 3/15/2025 | 25,965 | 28,065,755 | ||||||||
| BPCE SA (France)†(e) | 5.15% | 7/21/2024 | 5,000 | 5,450,384 | ||||||||
| CIT Group, Inc. | 3.929% (SOFR + 3.83% | )# | 6/19/2024 | 21,437 | 22,120,280 | |||||||
| CIT Group, Inc. | 4.75% | 2/16/2024 | 27,174 | 28,720,744 | ||||||||
| CIT Group, Inc. | 5.00% | 8/15/2022 | 15,745 | 16,180,428 | ||||||||
| CIT Group, Inc. | 5.00% | 8/1/2023 | 32,346 | 34,168,859 | ||||||||
| Citigroup, Inc. | 1.281% (SOFR + .53% | )# | 11/3/2025 | 19,303 | 19,260,342 | |||||||
| Citigroup, Inc. | 1.678% (SOFR + 1.67% | )# | 5/15/2024 | 49,728 | 50,272,848 | |||||||
| Citigroup, Inc. | 2.876% (3 Mo. LIBOR + .95% | )# | 7/24/2023 | 70,699 | 71,665,285 | |||||||
| Citigroup, Inc. | 3.106% (SOFR + 2.84% | )# | 4/8/2026 | 241,086 | 252,879,286 | |||||||
| Citigroup, Inc. | 3.142% (3 Mo. LIBOR + .72% | )# | 1/24/2023 | 51,246 | 51,430,813 | |||||||
| 332 | See Notes to Financial Statements. |
Schedule of Investments (continued)
SHORT DURATION INCOME FUND November 30, 2021
| Investments | Interest Rate | Maturity Date | Principal Amount (000) | Fair Value | ||||||||
| Banks (continued) | ||||||||||||
| Citigroup, Inc. | 3.352% (3 Mo. LIBOR + .90% | )# | 4/24/2025 | $ | 37,866 | $ | 39,662,684 | |||||
| Citigroup, Inc. | 3.70% | 1/12/2026 | 17,120 | 18,538,697 | ||||||||
| Citigroup, Inc. | 3.875% | 3/26/2025 | 33,016 | 35,360,462 | ||||||||
| Citigroup, Inc. | 4.05% | 7/30/2022 | 30,628 | 31,333,105 | ||||||||
| Citigroup, Inc. | 4.40% | 6/10/2025 | 135,546 | 147,296,045 | ||||||||
| Citigroup, Inc. | 5.50% | 9/13/2025 | 30,131 | 34,120,645 | ||||||||
| Citizens Bank NA/Providence RI | 0.876% (3 Mo. LIBOR + .72% | )# | 2/14/2022 | 14,985 | 14,995,989 | |||||||
| Citizens Bank NA/Providence RI | 1.082% (3 Mo. LIBOR + .95% | )# | 3/29/2023 | 22,245 | 22,458,046 | |||||||
| Credit Agricole SA (France)†(e) | 4.375% | 3/17/2025 | 28,116 | 30,374,274 | ||||||||
| Credit Suisse AG/New York NY | 3.625% | 9/9/2024 | 14,875 | 15,828,046 | ||||||||
| Credit Suisse Group AG (Switzerland)†(e) | 1.305% (SOFR + .98% | )# | 2/2/2027 | 32,933 | 31,910,011 | |||||||
| Credit Suisse Group AG (Switzerland)†(e) | 2.193% (SOFR + 2.04% | )# | 6/5/2026 | 42,530 | 42,949,496 | |||||||
| Credit Suisse Group AG (Switzerland)†(e) | 2.593% (SOFR + 1.56% | )# | 9/11/2025 | 27,460 | 28,088,299 | |||||||
| Credit Suisse Group AG (Switzerland)(e) | 3.75% | 3/26/2025 | 10,200 | 10,878,474 | ||||||||
| Credit Suisse Group AG (Switzerland)†(e) | 4.207% (3 Mo. LIBOR + 1.24% | )# | 6/12/2024 | 17,160 | 17,930,373 | |||||||
| Credit Suisse Group Funding Guernsey Ltd. (Guernsey)(e) | 3.80% | 9/15/2022 | 21,574 | 22,108,350 | ||||||||
| Danske Bank A/S (Denmark)†(e) | 0.976% (1 Yr. Treasury CMT + .55% | )# | 9/10/2025 | 46,616 | 45,996,637 | |||||||
| Danske Bank A/S (Denmark)†(e) | 1.171% (1 Yr. Treasury CMT + 1.03% | )# | 12/8/2023 | 145,875 | 145,978,449 | |||||||
| Danske Bank A/S (Denmark)†(e) | 1.226% | 6/22/2024 | 51,642 | 51,773,156 | ||||||||
| Danske Bank A/S (Denmark)†(e) | 1.621% (1 Yr. Treasury CMT + 1.35% | )# | 9/11/2026 | 46,515 | 46,046,937 | |||||||
| Danske Bank A/S (Denmark)†(e) | 3.244% (3 Mo. LIBOR + 1.59% | )# | 12/20/2025 | 132,473 | 137,977,810 | |||||||
| Danske Bank A/S (Denmark)†(e) | 5.00% | 1/12/2022 | 58,835 | 59,127,594 | ||||||||
| Danske Bank A/S (Denmark)†(e) | 5.00% (1 Yr. Treasury CMT + 1.73% | )# | 1/12/2023 | 11,928 | 11,980,936 | |||||||
| Danske Bank A/S (Denmark)†(e) | 5.375% | 1/12/2024 | 66,319 | 71,691,365 | ||||||||
| FNB Corp. | 2.20% | 2/24/2023 | 30,110 | 30,472,232 | ||||||||
| Goldman Sachs Group, Inc. (The) | 0.657% (SOFR + .51% | )# | 9/10/2024 | 78,938 | 78,345,111 | |||||||
| See Notes to Financial Statements. | 333 |
Schedule of Investments (continued)
SHORT DURATION INCOME FUND November 30, 2021
| Investments | Interest Rate | Maturity Date | Principal Amount (000) | Fair Value | ||||||||
| Banks (continued) | ||||||||||||
| Goldman Sachs Group, Inc. (The) | 0.914% (3 Mo. LIBOR + .75% | )# | 2/23/2023 | $ | 47,398 | $ | 47,648,186 | |||||
| Goldman Sachs Group, Inc. (The) | 1.124% (3 Mo. LIBOR + 1.00% | )# | 7/24/2023 | 45,327 | 45,509,454 | |||||||
| Goldman Sachs Group, Inc. (The) | 1.948% (SOFR + .91% | )# | 10/21/2027 | 71,073 | 70,949,958 | |||||||
| Goldman Sachs Group, Inc. (The) | 3.272% (3 Mo. LIBOR + 1.20% | )# | 9/29/2025 | 34,934 | 36,662,108 | |||||||
| Goldman Sachs Group, Inc. (The) | 3.50% | 1/23/2025 | 9,494 | 10,045,916 | ||||||||
| Goldman Sachs Group, Inc. (The) | 3.50% | 4/1/2025 | 79,656 | 84,519,207 | ||||||||
| Goldman Sachs Group, Inc. (The) | 4.25% | 10/21/2025 | 41,174 | 44,803,736 | ||||||||
| HSBC Holdings plc (United Kingdom)(e) | 0.732% (SOFR + .53% | )# | 8/17/2024 | 29,988 | 29,780,860 | |||||||
| HSBC Holdings plc (United Kingdom)(e) | 0.976% (SOFR + .71% | )# | 5/24/2025 | 22,757 | 22,508,265 | |||||||
| HSBC Holdings plc (United Kingdom)(e) | 3.262% (3 Mo. LIBOR + 1.06% | )# | 3/13/2023 | 79,087 | 79,648,015 | |||||||
| HSBC Holdings PLC (United Kingdom)(e) | 4.25% | 3/14/2024 | 32,390 | 34,364,313 | ||||||||
| ING Groep NV (Netherlands)(e) | 1.282% (3 Mo. LIBOR + 1.15% | )# | 3/29/2022 | 4,050 | 4,063,617 | |||||||
| Intesa Sanpaolo SpA (Italy)†(e) | 3.125% | 7/14/2022 | 7,031 | 7,132,315 | ||||||||
| Intesa Sanpaolo SpA (Italy)†(e) | 3.25% | 9/23/2024 | 20,481 | 21,395,513 | ||||||||
| Intesa Sanpaolo SpA (Italy)†(e) | 5.017% | 6/26/2024 | 164,145 | 175,406,273 | ||||||||
| Intesa Sanpaolo SpA (Italy)†(e) | 5.71% | 1/15/2026 | 82,517 | 91,527,777 | ||||||||
| Itau Unibanco Holding SA† | 2.90% | 1/24/2023 | 41,840 | 42,291,244 | ||||||||
| JPMorgan Chase & Co. | 0.768% (SOFR + .49% | )# | 8/9/2025 | 78,538 | 77,490,426 | |||||||
| JPMorgan Chase & Co. | 0.824% (SOFR + .54% | )# | 6/1/2025 | 91,927 | 90,858,204 | |||||||
| JPMorgan Chase & Co. | 3.875% | 9/10/2024 | 45,147 | 48,196,636 | ||||||||
| Lloyds Banking Group plc (United Kingdom)(e) | 1.326% (1 Yr. Treasury CMT + 1.10% | )# | 6/15/2023 | 58,888 | 59,050,057 | |||||||
| Lloyds Banking Group plc (United Kingdom)(e) | 2.858% (3 Mo. LIBOR + 1.25% | )# | 3/17/2023 | 40,000 | 40,246,897 | |||||||
| Lloyds Banking Group plc (United Kingdom)(e) | 4.582% | 12/10/2025 | 18,348 | 20,137,494 | ||||||||
| Lloyds Banking Group plc (United Kingdom)(e) | 4.65% | 3/24/2026 | 29,589 | 32,683,376 | ||||||||
| Macquarie Bank Ltd. (Australia)†(e) | 4.875% | 6/10/2025 | 32,811 | 36,062,511 | ||||||||
| Macquarie Group Ltd. (Australia)†(e) | 1.201% (SOFR + .69% | )# | 10/14/2025 | 40,033 | 39,742,250 | |||||||
| Macquarie Group Ltd. (Australia)†(e) | 1.34% (SOFR + 1.07% | )# | 1/12/2027 | 33,697 | 32,980,255 | |||||||
| 334 | See Notes to Financial Statements. |
Schedule of Investments (continued)
SHORT DURATION INCOME FUND November 30, 2021
| Investments | Interest Rate | Maturity Date | Principal Amount (000) | Fair Value | ||||||||
| Banks (continued) | ||||||||||||
| Macquarie Group Ltd. (Australia)†(e) | 3.189% (3 Mo. LIBOR + 1.02% | )# | 11/28/2023 | $ | 39,372 | $ | 40,309,660 | |||||
| Macquarie Group Ltd. (Australia)†(e) | 4.15% (3 Mo. LIBOR + 1.33% | )# | 3/27/2024 | 45,740 | 47,599,090 | |||||||
| Mitsubishi UFJ Financial Group, Inc. (Japan)(e) | 0.953% (1 Yr. Treasury CMT + .55% | )# | 7/19/2025 | 58,686 | 58,119,562 | |||||||
| Morgan Stanley | 0.79% (SOFR + .53% | )# | 5/30/2025 | 90,799 | 89,439,659 | |||||||
| Morgan Stanley | 0.791% (SOFR + .51% | )# | 1/22/2025 | 98,685 | 97,632,810 | |||||||
| Morgan Stanley | 1.524% (3 Mo. LIBOR + 1.40% | )# | 10/24/2023 | 56,465 | 57,100,069 | |||||||
| Morgan Stanley | 4.10% | 5/22/2023 | 47,121 | 49,271,978 | ||||||||
| Morgan Stanley | 5.00% | 11/24/2025 | 26,920 | 30,114,424 | ||||||||
| Natwest Group plc (United Kingdom)(e) | 5.125% | 5/28/2024 | 18,213 | 19,710,574 | ||||||||
| NatWest Markets plc (United Kingdom)†(e) | 0.80% | 8/12/2024 | 23,409 | 23,100,505 | ||||||||
| Nordea Bank Abp (Finland)†(e) | 3.75% | 8/30/2023 | 42,252 | 44,364,341 | ||||||||
| Nordea Bank Abp (Finland)†(e) | 4.25% | 9/21/2022 | 18,035 | 18,551,694 | ||||||||
| People’s United Bank NA | 4.00% | 7/15/2024 | 5,725 | 6,030,179 | ||||||||
| Popular, Inc. | 6.125% | 9/14/2023 | 13,517 | 14,398,106 | ||||||||
| Santander Holdings USA, Inc. | 3.244% | 10/5/2026 | 31,493 | 32,981,306 | ||||||||
| Santander Holdings USA, Inc. | 3.45% | 6/2/2025 | 13,839 | 14,610,856 | ||||||||
| Santander Holdings USA, Inc. | 3.50% | 6/7/2024 | 38,764 | 40,584,436 | ||||||||
| Santander UK Group Holdings plc (United Kingdom)(e) | 1.089% (SOFR + .79% | )# | 3/15/2025 | 3,888 | 3,854,905 | |||||||
| Santander UK Group Holdings plc (United Kingdom)(e) | 3.373% (3 Mo. LIBOR + 1.08% | )# | 1/5/2024 | 54,665 | 56,087,194 | |||||||
| Santander UK Group Holdings plc (United Kingdom)†(e) | 4.75% | 9/15/2025 | 7,686 | 8,404,348 | ||||||||
| Santander UK Group Holdings plc (United Kingdom)(e) | 4.796% (3 Mo. LIBOR + 1.57% | )# | 11/15/2024 | 10,000 | 10,694,673 | |||||||
| Standard Chartered plc (United Kingdom)†(e) | 0.991% (1 Yr. Treasury CMT + .78% | )# | 1/12/2025 | 100,594 | 99,640,944 | |||||||
| Standard Chartered plc (United Kingdom)†(e) | 1.214% (1 Yr. Treasury CMT + .88% | )# | 3/23/2025 | 10,244 | 10,198,495 | |||||||
| Standard Chartered plc (United Kingdom)†(e) | 1.319% (1 Yr. Treasury CMT + 1.17% | )# | 10/14/2023 | 37,814 | 37,907,958 | |||||||
| Standard Chartered plc (United Kingdom)†(e) | 2.819% (3 Mo. LIBOR + 1.21% | )# | 1/30/2026 | 8,168 | 8,389,205 | |||||||
| Standard Chartered plc (United Kingdom)†(e) | 3.885% (3 Mo. LIBOR + 1.08% | )# | 3/15/2024 | 21,000 | 21,711,056 | |||||||
| See Notes to Financial Statements. | 335 |
Schedule of Investments (continued)
SHORT DURATION INCOME FUND November 30, 2021
| Investments | Interest Rate | Maturity Date | Principal Amount (000) | Fair Value | ||||||||
| Banks (continued) | ||||||||||||
| Standard Chartered plc (United Kingdom)†(e) | 4.247% (3 Mo. LIBOR + 1.15% | )# | 1/20/2023 | $ | 41,630 | $ | 41,823,272 | |||||
| Standard Chartered plc (United Kingdom)†(e) | 5.20% | 1/26/2024 | 15,029 | 16,090,508 | ||||||||
| Swedbank AB (Sweden)†(e) | 1.30% | 6/2/2023 | 63,916 | 64,526,909 | ||||||||
| Swedbank AB (Sweden)†(e) | 2.80% | 3/14/2022 | 30,591 | 30,813,189 | ||||||||
| Synovus Bank/Columbus GA | 2.289% (SOFR + .95% | )# | 2/10/2023 | 24,638 | 24,686,857 | |||||||
| Synovus Financial Corp. | 3.125% | 11/1/2022 | 1,981 | 2,013,371 | ||||||||
| Turkiye Vakiflar Bankasi TAO (Turkey)†(e) | 5.625% | 5/30/2022 | 34,279 | 34,619,219 | ||||||||
| Turkiye Vakiflar Bankasi TAO (Turkey)†(e) | 5.75% | 1/30/2023 | 17,943 | 18,137,233 | ||||||||
| UBS AG (United Kingdom)†(e) | 1.75% | 4/21/2022 | 28,736 | 28,860,736 | ||||||||
| UBS AG (Switzerland)(e) | 5.125% | 5/15/2024 | 97,473 | 104,905,316 | ||||||||
| UBS AG | 7.625% | 8/17/2022 | 153,627 | 160,490,578 | ||||||||
| UBS Group AG (Switzerland)†(e) | 1.008% (1 Yr. Treasury CMT + .83% | )# | 7/30/2024 | 41,646 | 41,630,112 | |||||||
| UBS Group AG (Switzerland)†(e) | 1.384% (3 Mo. LIBOR + 1.22% | )# | 5/23/2023 | 83,148 | 83,588,642 | |||||||
| UBS Group AG (Switzerland)†(e) | 3.491% | 5/23/2023 | 10,000 | 10,132,228 | ||||||||
| UniCredit SpA (Italy)†(e) | 4.027% (3 Mo. LIBOR + 3.90% | )# | 1/14/2022 | 35,494 | 35,640,969 | |||||||
| UniCredit SpA (Italy)†(e) | 6.572% | 1/14/2022 | 82,560 | 83,095,497 | ||||||||
| UniCredit SpA (Italy)†(e) | 7.83% | 12/4/2023 | 38,610 | 43,522,546 | ||||||||
| Wells Fargo & Co. | 1.359% (3 Mo. LIBOR + 1.23% | )# | 10/31/2023 | 38,415 | 38,790,694 | |||||||
| Wells Fargo & Co. | 3.00% | 2/19/2025 | 24,618 | 25,694,800 | ||||||||
| Wells Fargo & Co. | 3.55% | 9/29/2025 | 12,924 | 13,863,965 | ||||||||
| Zions Bancorp N.A. | 3.35% | 3/4/2022 | 36,198 | 36,370,815 | ||||||||
| Total | 6,562,465,368 | |||||||||||
| Chemicals 0.08% | ||||||||||||
| Braskem Finance Ltd. | 6.45% | 2/3/2024 | 10,904 | 11,824,952 | ||||||||
| Celanese US Holdings LLC | 4.625% | 11/15/2022 | 13,876 | 14,373,874 | ||||||||
| Orbia Advance Corp. SAB de CV (Mexico)†(e) | 1.875% | 5/11/2026 | 26,739 | 26,186,840 | ||||||||
| Total | 52,385,666 | |||||||||||
| Commercial Services 0.41% | ||||||||||||
| Adani Ports & Special Economic Zone Ltd. (India)†(e) | 3.375% | 7/24/2024 | 30,600 | 31,662,317 | ||||||||
| Ashtead Capital, Inc.† | 4.00% | 5/1/2028 | 19,696 | 20,578,552 | ||||||||
| Ashtead Capital, Inc.† | 4.375% | 8/15/2027 | 38,574 | 40,159,584 | ||||||||
| 336 | See Notes to Financial Statements. |
Schedule of Investments (continued)
SHORT DURATION INCOME FUND November 30, 2021
| Investments | Interest Rate | Maturity Date | Principal Amount (000) | Fair Value | ||||||||
| Commercial Services (continued) | ||||||||||||
| IHS Markit Ltd. (United Kingdom)(e) | 4.125% | 8/1/2023 | $ | 30,011 | $ | 31,418,216 | ||||||
| IHS Markit Ltd. (United Kingdom)†(e) | 4.75% | 2/15/2025 | 4,359 | 4,765,020 | ||||||||
| IHS Markit Ltd. (United Kingdom)†(e) | 5.00% | 11/1/2022 | 18,588 | 19,157,815 | ||||||||
| Nielsen Co. Luxembourg S.a.r.l. (The) (Luxembourg)†(e) | 5.00% | 2/1/2025 | 8,930 | 9,057,788 | ||||||||
| Sabre GLBL, Inc.† | 7.375% | 9/1/2025 | 34,169 | 35,416,510 | ||||||||
| Triton Container International Ltd.† | 0.80% | 8/1/2023 | 33,070 | 32,826,492 | ||||||||
| Triton Container International Ltd.† | 1.15% | 6/7/2024 | 32,498 | 32,142,198 | ||||||||
| Total | 257,184,492 | |||||||||||
| Computers 0.37% | ||||||||||||
| Dell International LLC/EMC Corp. | 4.00% | 7/15/2024 | 11,901 | 12,673,384 | ||||||||
| Dell International LLC/EMC Corp. | 5.45% | 6/15/2023 | 142,149 | 150,814,392 | ||||||||
| Dell International LLC/EMC Corp. | 5.85% | 7/15/2025 | 37,892 | 43,377,897 | ||||||||
| Dell International LLC/EMC Corp. | 6.02% | 6/15/2026 | 21,362 | 24,883,420 | ||||||||
| Total | 231,749,093 | |||||||||||
| Cosmetics/Personal Care 0.02% | ||||||||||||
| Coty, Inc.† | 5.00% | 4/15/2026 | 10,620 | 10,839,675 | ||||||||
| Diversified Financial Services 3.66% | ||||||||||||
| AerCap Ireland Capital DAC/AerCap Global Aviation Trust (Ireland)(e) | 1.75% | 10/29/2024 | 31,795 | 31,759,110 | ||||||||
| AerCap Ireland Capital DAC/AerCap Global Aviation Trust (Ireland)(e) | 2.875% | 8/14/2024 | 30,354 | 31,340,983 | ||||||||
| AerCap Ireland Capital DAC/AerCap Global Aviation Trust (Ireland)(e) | 3.15% | 2/15/2024 | 19,000 | 19,625,191 | ||||||||
| AerCap Ireland Capital DAC/AerCap Global Aviation Trust (Ireland)(e) | 3.50% | 1/15/2025 | 22,804 | 23,841,961 | ||||||||
| AerCap Ireland Capital DAC/AerCap Global Aviation Trust (Ireland)(e) | 4.875% | 1/16/2024 | 27,911 | 29,837,301 | ||||||||
| AerCap Ireland Capital DAC/AerCap Global Aviation Trust (Ireland)(e) | 6.50% | 7/15/2025 | 23,021 | 26,352,368 | ||||||||
| Air Lease Corp. | 4.25% | 2/1/2024 | 24,197 | 25,623,517 | ||||||||
| Aircastle Ltd. | 4.40% | 9/25/2023 | 52,900 | 55,629,911 | ||||||||
| Aircastle Ltd. | 5.00% | 4/1/2023 | 39,893 | 41,909,744 | ||||||||
| Aircastle Ltd.† | 5.25% | 8/11/2025 | 57,858 | 63,838,700 | ||||||||
| Alliance Data Systems Corp.† | 4.75% | 12/15/2024 | 86,014 | 87,293,888 | ||||||||
| Alliance Data Systems Corp.† | 7.00% | 1/15/2026 | 57,232 | 60,249,557 | ||||||||
| Ally Financial, Inc. | 1.45% | 10/2/2023 | 11,837 | 11,894,852 | ||||||||
| Ally Financial, Inc. | 3.875% | 5/21/2024 | 79,117 | 83,427,070 | ||||||||
| See Notes to Financial Statements. | 337 |
Schedule of Investments (continued)
SHORT DURATION INCOME FUND November 30, 2021
| Investments | Interest Rate | Maturity Date | Principal Amount (000) | Fair Value | ||||||||
| Diversified Financial Services (continued) | ||||||||||||
| Ally Financial, Inc. | 4.125% | 2/13/2022 | $ | 9,982 | $ | 10,051,758 | ||||||
| Ally Financial, Inc. | 4.625% | 3/30/2025 | 31,811 | 34,752,238 | ||||||||
| Ally Financial, Inc. | 5.125% | 9/30/2024 | 91,001 | 99,758,938 | ||||||||
| Ally Financial, Inc. | 5.75% | 11/20/2025 | 133,544 | 151,334,157 | ||||||||
| Aviation Capital Group LLC† | 1.95% | 1/30/2026 | 27,395 | 26,902,093 | ||||||||
| Aviation Capital Group LLC† | 2.875% | 1/20/2022 | 9,356 | 9,366,372 | ||||||||
| Aviation Capital Group LLC† | 3.875% | 5/1/2023 | 59,242 | 61,346,971 | ||||||||
| Aviation Capital Group LLC† | 5.50% | 12/15/2024 | 56,550 | 62,292,992 | ||||||||
| Avolon Holdings Funding Ltd. (Ireland)†(e) | 2.125% | 2/21/2026 | 23,269 | 22,795,318 | ||||||||
| Avolon Holdings Funding Ltd. (Ireland)†(e) | 3.625% | 5/1/2022 | 26,356 | 26,616,091 | ||||||||
| Avolon Holdings Funding Ltd. (Ireland)†(e) | 3.95% | 7/1/2024 | 10,307 | 10,810,955 | ||||||||
| Avolon Holdings Funding Ltd. (Ireland)†(e) | 4.25% | 4/15/2026 | 22,567 | 24,111,511 | ||||||||
| Avolon Holdings Funding Ltd. (Ireland)†(e) | 4.375% | 5/1/2026 | 19,759 | 21,187,311 | ||||||||
| Avolon Holdings Funding Ltd. (Ireland)†(e) | 5.125% | 10/1/2023 | 112,721 | 119,366,858 | ||||||||
| Avolon Holdings Funding Ltd. (Ireland)†(e) | 5.25% | 5/15/2024 | 47,066 | 50,669,205 | ||||||||
| Avolon Holdings Funding Ltd. (Ireland)†(e) | 5.50% | 1/15/2023 | 27,137 | 28,364,419 | ||||||||
| Avolon Holdings Funding Ltd. (Ireland)†(e) | 5.50% | 1/15/2026 | 20,268 | 22,521,742 | ||||||||
| Capital One Financial Corp. | 0.849% (3 Mo. LIBOR + .72% | )# | 1/30/2023 | 23,854 | 23,979,035 | |||||||
| Capital One Financial Corp. | 1.066% (3 Mo. LIBOR + .95% | )# | 3/9/2022 | 21,996 | 22,027,909 | |||||||
| Citigroup Global Markets Holdings, Inc. | 0.75% | 6/7/2024 | 62,101 | 61,454,861 | ||||||||
| Discover Financial Services | 5.20% | 4/27/2022 | 35,582 | 36,243,507 | ||||||||
| Global Aircraft Leasing Co. Ltd. PIK 7.25%† | 6.50% | 9/15/2024 | 42,755 | 40,948,707 | ||||||||
| Muthoot Finance Ltd. (India)†(e) | 4.40% | 9/2/2023 | 24,876 | 25,342,425 | ||||||||
| Muthoot Finance Ltd. (India)†(e) | 6.125% | 10/31/2022 | 25,282 | 25,914,050 | ||||||||
| Navient Corp. | 5.50% | 1/25/2023 | 49,868 | 51,738,050 | ||||||||
| Navient Corp. | 5.875% | 10/25/2024 | 80,407 | 84,211,055 | ||||||||
| Navient Corp. | 6.125% | 3/25/2024 | 59,019 | 61,987,361 | ||||||||
| Navient Corp. | 6.50% | 6/15/2022 | 11,898 | 12,273,084 | ||||||||
| Navient Corp. | 7.25% | 9/25/2023 | 38,190 | 41,128,912 | ||||||||
| OneMain Finance Corp. | 5.625% | 3/15/2023 | 14,711 | 15,275,755 | ||||||||
| OneMain Finance Corp. | 6.125% | 5/15/2022 | 14,919 | 15,286,380 | ||||||||
| OneMain Finance Corp. | 6.125% | 3/15/2024 | 42,165 | 44,325,745 | ||||||||
| OneMain Finance Corp. | 8.25% | 10/1/2023 | 35,967 | 39,572,872 | ||||||||
| OneMain Finance Corp. | 8.875% | 6/1/2025 | 26,157 | 28,079,540 | ||||||||
| Park Aerospace Holdings Ltd. (Ireland)†(e) | 4.50% | 3/15/2023 | 54,041 | 56,072,880 | ||||||||
| Park Aerospace Holdings Ltd. (Ireland)†(e) | 5.25% | 8/15/2022 | 23,209 | 23,813,506 | ||||||||
| 338 | See Notes to Financial Statements. |
Schedule of Investments (continued)
SHORT DURATION INCOME FUND November 30, 2021
| Investments | Interest Rate | Maturity Date | Principal Amount (000) | Fair Value | ||||||||
| Diversified Financial Services (continued) | ||||||||||||
| Park Aerospace Holdings Ltd. (Ireland)†(e) | 5.50% | 2/15/2024 | $ | 122,071 | $ | 131,502,951 | ||||||
| Rocket Mortgage LLC/Rocket Mortgage Co-Issuer, Inc.† | 2.875% | 10/15/2026 | 85,988 | 83,959,543 | ||||||||
| Total | 2,300,011,210 | |||||||||||
| Electric 2.35% | ||||||||||||
| AES Corp. (The)† | 3.30% | 7/15/2025 | 72,993 | 76,499,219 | ||||||||
| Alexander Funding Trust† | 1.841% | 11/15/2023 | 87,343 | 88,254,531 | ||||||||
| American Transmission Systems, Inc.† | 5.25% | 1/15/2022 | 9,843 | 9,894,070 | ||||||||
| Ausgrid Finance Pty Ltd. (Australia)†(e) | 3.85% | 5/1/2023 | 74,470 | 76,801,497 | ||||||||
| Calpine Corp.† | 5.25% | 6/1/2026 | 76,096 | 77,974,620 | ||||||||
| Cemig Geracao e Transmissao SA (Brazil)†(e) | 9.25% | 12/5/2024 | 20,662 | 22,979,863 | ||||||||
| Cleco Corporate Holdings LLC | 3.743% | 5/1/2026 | 1,137 | 1,213,245 | ||||||||
| Cleveland Electric Illuminating Co. (The) | 5.50% | 8/15/2024 | 10,475 | 11,624,882 | ||||||||
| Comision Federal de Electricidad (Mexico)†(e) | 4.875% | 1/15/2024 | 64,830 | 68,941,194 | ||||||||
| FirstEnergy Corp. | 1.60% | 1/15/2026 | 18,065 | 17,762,863 | ||||||||
| FirstEnergy Corp. | 2.05% | 3/1/2025 | 71,006 | 70,890,970 | ||||||||
| FirstEnergy Corp. | 4.75% | 3/15/2023 | 77,854 | 80,133,565 | ||||||||
| FirstEnergy Transmission LLC† | 4.35% | 1/15/2025 | 125,251 | 132,933,974 | ||||||||
| IPALCO Enterprises, Inc. | 3.70% | 9/1/2024 | 18,119 | 19,060,293 | ||||||||
| Israel Electric Corp. Ltd. (Israel)†(e) | 5.00% | 11/12/2024 | 7,926 | 8,646,790 | ||||||||
| Israel Electric Corp. Ltd. (Israel)†(e) | 6.875% | 6/21/2023 | 21,735 | 23,623,815 | ||||||||
| Jersey Central Power & Light Co.† | 4.70% | 4/1/2024 | 50,436 | 53,709,838 | ||||||||
| NextEra Energy Capital Holdings, Inc. | 0.898% (3 Mo. LIBOR + .72% | )# | 2/25/2022 | 8,011 | 8,023,545 | |||||||
| NRG Energy, Inc.† | 3.75% | 6/15/2024 | 90,412 | 94,475,255 | ||||||||
| OGE Energy Corp. | 0.703% | 5/26/2023 | 9,350 | 9,304,529 | ||||||||
| Pacific Gas and Electric Co. | 1.367% | 3/10/2023 | 79,231 | 78,812,453 | ||||||||
| Pacific Gas and Electric Co. | 3.15% | 1/1/2026 | 196,591 | 201,614,619 | ||||||||
| Pacific Gas and Electric Co. | 3.25% | 6/15/2023 | 9,548 | 9,733,231 | ||||||||
| Pacific Gas and Electric Co. | 3.75% | 2/15/2024 | 41,386 | 42,870,015 | ||||||||
| Puget Energy, Inc. | 5.625% | 7/15/2022 | 19,415 | 19,777,222 | ||||||||
| TransAlta Corp. (Canada)(e) | 4.50% | 11/15/2022 | 23,370 | 23,734,572 | ||||||||
| Vistra Operations Co. LLC† | 3.55% | 7/15/2024 | 145,238 | 150,639,076 | ||||||||
| Total | 1,479,929,746 | |||||||||||
| Electronics 0.13% | ||||||||||||
| Flex Ltd. | 3.75% | 2/1/2026 | 74,470 | 79,615,267 | ||||||||
| See Notes to Financial Statements. | 339 |
Schedule of Investments (continued)
SHORT DURATION INCOME FUND November 30, 2021
| Investments | Interest Rate | Maturity Date | Principal Amount (000) | Fair Value | ||||||||
| Energy-Alternate Sources 0.13% | ||||||||||||
| Enviva Partners LP/Enviva Partners Finance Corp.† | 6.50% | 1/15/2026 | $ | 17,776 | $ | 18,369,363 | ||||||
| Greenko Dutch BV (Netherlands)†(e) | 3.85% | 3/29/2026 | 31,863 | 32,227,609 | ||||||||
| Greenko Mauritius Ltd. (India)†(e) | 6.25% | 2/21/2023 | 30,255 | 30,936,046 | ||||||||
| Total | 81,533,018 | |||||||||||
| Engineering & Construction 0.01% | ||||||||||||
| Fluor Corp. | 3.50% | 12/15/2024 | 5,273 | 5,412,339 | ||||||||
| Entertainment 0.30% | ||||||||||||
| Caesars Entertainment, Inc.† | 6.25% | 7/1/2025 | 58,933 | 61,342,770 | ||||||||
| Caesars Entertainment, Inc.† | 8.125% | 7/1/2027 | 60,100 | 66,024,358 | ||||||||
| Caesars Resort Collection LLC/CRC Finco, Inc.† | 5.75% | 7/1/2025 | 10,798 | 11,229,218 | ||||||||
| International Game Technology plc† | 4.125% | 4/15/2026 | 17,293 | 17,627,879 | ||||||||
| International Game Technology plc† | 6.50% | 2/15/2025 | 13,074 | 14,201,959 | ||||||||
| Scientific Games International, Inc.† | 8.625% | 7/1/2025 | 8,113 | 8,646,065 | ||||||||
| Vail Resorts, Inc.† | 6.25% | 5/15/2025 | 5,000 | 5,235,450 | ||||||||
| Total | 184,307,699 | |||||||||||
| Food 0.36% | ||||||||||||
| Chobani LLC/Chobani Finance Corp., Inc.† | 7.50% | 4/15/2025 | 35,850 | 37,123,033 | ||||||||
| FAGE International SA/FAGE USA Dairy Industry, Inc. (Luxembourg)†(e) | 5.625% | 8/15/2026 | 27,478 | 28,045,421 | ||||||||
| Fresh Market, Inc. (The)† | 9.75% | 5/1/2023 | 18,756 | 19,271,321 | ||||||||
| JBS USA LUX SA/JBS USA Finance, Inc.† | 6.75% | 2/15/2028 | 33,773 | 36,465,890 | ||||||||
| NBM US Holdings, Inc.† | 7.00% | 5/14/2026 | 50,000 | 52,494,250 | ||||||||
| Pilgrim’s Pride Corp.† | 5.875% | 9/30/2027 | 40,386 | 42,458,206 | ||||||||
| US Foods, Inc.† | 6.25% | 4/15/2025 | 11,989 | 12,501,290 | ||||||||
| Total | 228,359,411 | |||||||||||
| Forest Products & Paper 0.03% | ||||||||||||
| Suzano Austria GmbH (Brazil)†(e) | 5.75% | 7/14/2026 | 18,736 | 21,136,269 | ||||||||
| Gas 0.42% | ||||||||||||
| Atmos Energy Corp. | 0.625% | 3/9/2023 | 32,511 | 32,455,282 | ||||||||
| National Fuel Gas Co. | 3.75% | 3/1/2023 | 34,700 | 35,631,267 | ||||||||
| National Fuel Gas Co. | 5.50% | 1/15/2026 | 90,555 | 102,674,938 | ||||||||
| National Fuel Gas Co. | 7.395% | 3/30/2023 | 3,993 | 4,236,694 | ||||||||
| ONE Gas, Inc. | 0.85% | 3/11/2023 | 40,594 | 40,542,766 | ||||||||
| ONE Gas, Inc. | 1.10% | 3/11/2024 | 49,259 | 48,582,430 | ||||||||
| Total | 264,123,377 | |||||||||||
| 340 | See Notes to Financial Statements. |
Schedule of Investments (continued)
SHORT DURATION INCOME FUND November 30, 2021
| Investments | Interest Rate | Maturity Date | Principal Amount (000) | Fair Value | ||||||||
| Health Care-Services 0.94% | ||||||||||||
| Centene Corp. | 4.25% | 12/15/2027 | $ | 141,656 | $ | 147,138,795 | ||||||
| Fresenius Medical Care US Finance II, Inc.† | 4.75% | 10/15/2024 | 7,605 | 8,249,072 | ||||||||
| Fresenius Medical Care US Finance II, Inc.† | 5.875% | 1/31/2022 | 35,647 | 35,933,570 | ||||||||
| Fresenius Medical Care US Finance III, Inc.† | 1.875% | 12/1/2026 | 31,515 | 31,198,275 | ||||||||
| HCA, Inc. | 5.00% | 3/15/2024 | 36,593 | 39,500,564 | ||||||||
| HCA, Inc. | 5.25% | 4/15/2025 | 193,688 | 215,463,308 | ||||||||
| HCA, Inc. | 5.25% | 6/15/2026 | 23,129 | 26,040,412 | ||||||||
| HCA, Inc. | 5.375% | 2/1/2025 | 13,173 | 14,384,916 | ||||||||
| HCA, Inc. | 8.36% | 4/15/2024 | 24,106 | 27,669,590 | ||||||||
| Humana, Inc. | 0.65% | 8/3/2023 | 22,594 | 22,481,675 | ||||||||
| Select Medical Corp.† | 6.25% | 8/15/2026 | 20,500 | 21,549,702 | ||||||||
| Total | 589,609,879 | |||||||||||
| Holding Companies-Diversified 0.02% | ||||||||||||
| KOC Holding AS (Turkey)†(e) | 5.25% | 3/15/2023 | 14,301 | 14,450,460 | ||||||||
| Home Builders 0.16% | ||||||||||||
| Lennar Corp. | 4.50% | 4/30/2024 | 33,705 | 35,999,973 | ||||||||
| Lennar Corp. | 4.75% | 5/30/2025 | 17,145 | 18,841,841 | ||||||||
| Lennar Corp. | 4.875% | 12/15/2023 | 15,364 | 16,365,810 | ||||||||
| Toll Brothers Finance Corp. | 4.375% | 4/15/2023 | 16,223 | 16,824,062 | ||||||||
| Toll Brothers Finance Corp. | 4.875% | 11/15/2025 | 12,314 | 13,508,950 | ||||||||
| Total | 101,540,636 | |||||||||||
| Housewares 0.11% | ||||||||||||
| Newell Brands, Inc. | 4.35% | 4/1/2023 | 56,481 | 58,574,186 | ||||||||
| Newell Brands, Inc. | 4.875% | 6/1/2025 | 10,464 | 11,322,048 | ||||||||
| Total | 69,896,234 | |||||||||||
| Insurance 0.74% | ||||||||||||
| Aon Corp. | 8.205% | 1/1/2027 | 50,792 | 64,703,863 | ||||||||
| Assurant, Inc. | 4.20% | 9/27/2023 | 23,012 | 24,290,858 | ||||||||
| CNO Financial Group, Inc. | 5.25% | 5/30/2025 | 90,846 | 101,344,307 | ||||||||
| CNO Global Funding † | 1.75% | 10/7/2026 | 29,008 | 28,768,813 | ||||||||
| F&G Global Funding† | 0.90% | 9/20/2024 | 31,336 | 30,941,766 | ||||||||
| F&G Global Funding† | 1.75% | 6/30/2026 | 29,365 | 29,288,192 | ||||||||
| Fidelity & Guaranty Life Holdings, Inc.† | 5.50% | 5/1/2025 | 49,979 | 56,207,007 | ||||||||
| GA Global Funding Trust† | 0.80% | 9/13/2024 | 24,170 | 23,815,969 | ||||||||
| Kemper Corp. | 4.35% | 2/15/2025 | 25,199 | 27,050,450 | ||||||||
| See Notes to Financial Statements. | 341 |
Schedule of Investments (continued)
SHORT DURATION INCOME FUND November 30, 2021
| Investments | Interest Rate | Maturity Date | Principal Amount (000) | Fair Value | ||||||||
| Insurance (continued) | ||||||||||||
| Peachtree Corners Funding Trust† | 3.976% | 2/15/2025 | $ | 21,890 | $ | 23,558,570 | ||||||
| USI, Inc.† | 6.875% | 5/1/2025 | 56,770 | 57,031,994 | ||||||||
| Total | 467,001,789 | |||||||||||
| Internet 0.74% | ||||||||||||
| Baidu, Inc. (China)(e) | 3.075% | 4/7/2025 | 6,600 | 6,882,420 | ||||||||
| Baidu, Inc. (China)(e) | 3.875% | 9/29/2023 | 104,889 | 110,008,509 | ||||||||
| Baidu, Inc. (China)(e) | 4.375% | 5/14/2024 | 94,629 | 101,429,253 | ||||||||
| E*TRADE Financial Corp. | 2.95% | 8/24/2022 | 24,738 | 25,135,342 | ||||||||
| Netflix, Inc.† | 3.625% | 6/15/2025 | 37,758 | 39,872,826 | ||||||||
| Netflix, Inc. | 4.375% | 11/15/2026 | 41,988 | 46,340,686 | ||||||||
| Uber Technologies, Inc.† | 7.50% | 5/15/2025 | 36,413 | 38,412,802 | ||||||||
| Uber Technologies, Inc.† | 8.00% | 11/1/2026 | 48,853 | 52,078,275 | ||||||||
| VeriSign, Inc. | 5.25% | 4/1/2025 | 10,000 | 11,071,700 | ||||||||
| Weibo Corp. (China)(e) | 3.50% | 7/5/2024 | 30,217 | 31,146,124 | ||||||||
| Total | 462,377,937 | |||||||||||
| Iron-Steel 0.21% | ||||||||||||
| Baffinland Iron Mines Corp./Baffinland Iron Mines LP (Canada)†(e) | 8.75% | 7/15/2026 | 5,833 | 6,093,560 | ||||||||
| CSN Resources SA (Brazil)†(e) | 7.625% | 4/17/2026 | 23,003 | 23,805,345 | ||||||||
| POSCO (South Korea)†(e) | 2.375% | 11/12/2022 | 27,050 | 27,442,746 | ||||||||
| Steel Dynamics, Inc. | 5.00% | 12/15/2026 | 52,105 | 53,246,375 | ||||||||
| Vale Overseas Ltd. (Brazil)(e) | 6.25% | 8/10/2026 | 20,212 | 23,030,159 | ||||||||
| Total | 133,618,185 | |||||||||||
| Leisure Time 0.24% | ||||||||||||
| Carnival Corp.† | 10.50% | 2/1/2026 | 50,000 | 57,070,500 | ||||||||
| NCL Corp. Ltd.† | 5.875% | 3/15/2026 | 34,137 | 33,326,246 | ||||||||
| Royal Caribbean Cruises Ltd.† | 11.50% | 6/1/2025 | 52,115 | 58,255,711 | ||||||||
| Total | 148,652,457 | |||||||||||
| Lodging 0.20% | ||||||||||||
| Hyatt Hotels Corp. | 1.30% | 10/1/2023 | 41,871 | 41,896,674 | ||||||||
| Hyatt Hotels Corp. | 1.80% | 10/1/2024 | 39,327 | 39,368,596 | ||||||||
| MGM Resorts International | 6.75% | 5/1/2025 | 14,690 | 15,329,235 | ||||||||
| Travel + Leisure Co. | 6.60% | 10/1/2025 | 5,006 | 5,467,428 | ||||||||
| Wynn Las Vegas LLC/Wynn Las Vegas Capital Corp.† | 4.25% | 5/30/2023 | 8,311 | 8,328,786 | ||||||||
| Wynn Las Vegas LLC/Wynn Las Vegas Capital Corp.† | 5.50% | 3/1/2025 | 15,581 | 15,630,620 | ||||||||
| Total | 126,021,339 | |||||||||||
| 342 | See Notes to Financial Statements. |
Schedule of Investments (continued)
SHORT DURATION INCOME FUND November 30, 2021
| Investments | Interest Rate | Maturity Date | Principal Amount (000) | Fair Value | ||||||||
| Machinery-Diversified 0.44% | ||||||||||||
| CNH Industrial Capital LLC | 4.375% | 4/5/2022 | $ | 49,589 | $ | 50,190,479 | ||||||
| CNH Industrial NV (United Kingdom)(e) | 4.50% | 8/15/2023 | 48,535 | 51,231,875 | ||||||||
| Granite US Holdings Corp.† | 11.00% | 10/1/2027 | 16,062 | 17,494,891 | ||||||||
| Nvent Finance S.a.r.l. (Luxembourg)(e) | 3.95% | 4/15/2023 | 42,259 | 44,017,171 | ||||||||
| Otis Worldwide Corp. | 0.583% (3 Mo. LIBOR + .45% | )# | 4/5/2023 | 4,836 | 4,836,277 | |||||||
| Wabtec Corp. | 4.375% | 8/15/2023 | 25,687 | 26,832,338 | ||||||||
| Westinghouse Air Brake Technologies Corp. | 3.20% | 6/15/2025 | 9,811 | 10,294,576 | ||||||||
| Westinghouse Air Brake Technologies Corp. | 4.40% | 3/15/2024 | 66,622 | 70,959,971 | ||||||||
| Total | 275,857,578 | |||||||||||
| Media 0.41% | ||||||||||||
| CCO Holdings LLC/CCO Holdings Capital Corp.† | 5.125% | 5/1/2027 | 11,741 | 12,104,971 | ||||||||
| CCO Holdings LLC/CCO Holdings Capital Corp.† | 5.50% | 5/1/2026 | 11,519 | 11,906,384 | ||||||||
| DISH DBS Corp. | 5.875% | 7/15/2022 | 72,648 | 73,639,282 | ||||||||
| iHeartCommunications, Inc. | 6.375% | 5/1/2026 | 25,796 | 26,749,828 | ||||||||
| Nexstar Media, Inc.† | 5.625% | 7/15/2027 | 18,155 | 18,857,417 | ||||||||
| Univision Communications, Inc.† | 5.125% | 2/15/2025 | 74,762 | 75,917,073 | ||||||||
| Ziggo BV (Netherlands)†(e) | 5.50% | 1/15/2027 | 38,700 | 39,893,508 | ||||||||
| Total | 259,068,463 | |||||||||||
| Mining 1.34% | ||||||||||||
| Alcoa Nederland Holding BV (Netherlands)†(e) | 5.50% | 12/15/2027 | 59,041 | 62,777,115 | ||||||||
| Alcoa Nederland Holding BV (Netherlands)†(e) | 6.125% | 5/15/2028 | 12,615 | 13,453,645 | ||||||||
| Anglo American Capital plc (United Kingdom)†(e) | 3.625% | 9/11/2024 | 113,828 | 120,152,623 | ||||||||
| Anglo American Capital plc (United Kingdom)†(e) | 4.875% | 5/14/2025 | 36,785 | 40,525,928 | ||||||||
| First Quantum Minerals Ltd. (Canada)†(e) | 7.25% | 4/1/2023 | 101,159 | 103,183,698 | ||||||||
| First Quantum Minerals Ltd. (Zambia)†(e) | 7.50% | 4/1/2025 | 4,948 | 5,089,364 | ||||||||
| FMG Resources August 2006 Pty Ltd. (Australia)†(e) | 5.125% | 5/15/2024 | 9,885 | 10,433,766 | ||||||||
| Freeport-McMoRan, Inc. | 3.875% | 3/15/2023 | 28,124 | 28,972,782 | ||||||||
| Freeport-McMoRan, Inc. | 4.55% | 11/14/2024 | 55,328 | 59,280,079 | ||||||||
| Glencore Finance Canada Ltd. (Canada)†(e) | 4.25% | 10/25/2022 | 76,066 | 78,443,823 | ||||||||
| Glencore Funding LLC† | 1.625% | 4/27/2026 | 28,258 | 27,771,504 | ||||||||
| Glencore Funding LLC† | 4.00% | 3/27/2027 | 19,386 | 20,891,610 | ||||||||
| Glencore Funding LLC† | 4.125% | 5/30/2023 | 58,063 | 60,720,994 | ||||||||
| Glencore Funding LLC† | 4.125% | 3/12/2024 | 66,000 | 69,697,779 | ||||||||
| Glencore Funding LLC† | 4.625% | 4/29/2024 | 72,854 | 77,968,618 | ||||||||
| Kinross Gold Corp. (Canada)(e) | 5.95% | 3/15/2024 | 42,328 | 46,170,531 | ||||||||
| Novelis Corp.† | 3.25% | 11/15/2026 | 19,654 | 19,666,775 | ||||||||
| Total | 845,200,634 | |||||||||||
| See Notes to Financial Statements. | 343 |
Schedule of Investments (continued)
SHORT DURATION INCOME FUND November 30, 2021
| Investments | Interest Rate | Maturity Date | Principal Amount (000) | Fair Value | ||||||||
| Miscellaneous Manufacturing 0.01% | ||||||||||||
| Gates Global LLC/Gates Corp.† | 6.25% | 1/15/2026 | $ | 4,682 | $ | 4,808,133 | ||||||
| Oil & Gas 3.65% | ||||||||||||
| Callon Petroleum Co. | 6.125% | 10/1/2024 | 18,825 | 18,158,407 | ||||||||
| Cenovus Energy, Inc. (Canada)(e) | 5.375% | 7/15/2025 | 63,981 | 71,130,427 | ||||||||
| Comstock Resources, Inc.† | 7.50% | 5/15/2025 | 21,933 | 22,544,711 | ||||||||
| Continental Resources, Inc.† | 2.268% | 11/15/2026 | 31,891 | 31,546,418 | ||||||||
| Continental Resources, Inc. | 3.80% | 6/1/2024 | 132,282 | 138,056,109 | ||||||||
| Continental Resources, Inc. | 4.50% | 4/15/2023 | 35,948 | 37,166,997 | ||||||||
| Coterra Energy, Inc.† | 4.375% | 6/1/2024 | 93,364 | 99,284,812 | ||||||||
| CrownRock LP/CrownRock Finance, Inc.† | 5.625% | 10/15/2025 | 110,666 | 111,318,929 | ||||||||
| Devon Energy Corp.† | 5.25% | 9/15/2024 | 75,558 | 82,018,469 | ||||||||
| Devon Energy Corp.† | 5.25% | 10/15/2027 | 75,495 | 79,817,216 | ||||||||
| Devon Energy Corp.† | 5.875% | 6/15/2028 | 8,051 | 8,785,478 | ||||||||
| Devon Energy Corp.† | 8.25% | 8/1/2023 | 23,154 | 25,490,465 | ||||||||
| Diamondback Energy, Inc. | 2.875% | 12/1/2024 | 90,889 | 94,346,239 | ||||||||
| Diamondback Energy, Inc. | 4.75% | 5/31/2025 | 33,609 | 36,849,727 | ||||||||
| Endeavor Energy Resources LP/EER Finance, Inc.† | 5.75% | 1/30/2028 | 4,198 | 4,371,902 | ||||||||
| Endeavor Energy Resources LP/EER Finance, Inc.† | 6.625% | 7/15/2025 | 16,266 | 17,117,769 | ||||||||
| Eni SpA (Italy)†(e) | 4.00% | 9/12/2023 | 29,551 | 31,008,962 | ||||||||
| EQT Corp.† | 3.125% | 5/15/2026 | 17,876 | 17,892,625 | ||||||||
| Equinor ASA (Norway)†(e) | 7.875% | 12/9/2022 | 7,000 | 7,521,173 | ||||||||
| Hess Corp. | 3.50% | 7/15/2024 | 9,413 | 9,847,375 | ||||||||
| Laredo Petroleum, Inc. | 9.50% | 1/15/2025 | 48,901 | 48,756,987 | ||||||||
| Lukoil Capital DAC (Ireland)†(e) | 2.80% | 4/26/2027 | 24,165 | 23,917,865 | ||||||||
| Lukoil International Finance BV (Netherlands)†(e) | 4.563% | 4/24/2023 | 17,000 | 17,667,165 | ||||||||
| Lundin Energy Finance BV (Netherlands)†(e) | 2.00% | 7/15/2026 | 96,528 | 95,972,295 | ||||||||
| Matador Resources Co. | 5.875% | 9/15/2026 | 93,876 | 95,335,678 | ||||||||
| MEG Energy Corp. (Canada)†(e) | 6.50% | 1/15/2025 | 95,517 | 96,806,957 | ||||||||
| Murphy Oil Corp. | 6.875% | 8/15/2024 | 26,392 | 26,758,717 | ||||||||
| Occidental Petroleum Corp. | 2.90% | 8/15/2024 | 34,148 | 34,288,007 | ||||||||
| Occidental Petroleum Corp. | 3.50% | 6/15/2025 | 10,000 | 10,051,100 | ||||||||
| Occidental Petroleum Corp. | 5.55% | 3/15/2026 | 26,875 | 28,791,187 | ||||||||
| Occidental Petroleum Corp. | 6.95% | 7/1/2024 | 63,888 | 70,424,381 | ||||||||
| OGX Austria GmbH (Brazil)†(e)(f) | 8.50% | 6/1/2018 | 31,150 | 623 | ||||||||
| Ovintiv Exploration, Inc. | 5.375% | 1/1/2026 | 23,473 | 25,889,535 | ||||||||
| Parsley Energy LLC/Parsley Finance Corp.† | 4.125% | 2/15/2028 | 26,480 | 27,117,506 | ||||||||
| Parsley Energy LLC/Parsley Finance Corp.† | 5.625% | 10/15/2027 | 9,732 | 10,210,863 | ||||||||
| PDC Energy, Inc. | 5.75% | 5/15/2026 | 40,350 | 40,829,358 | ||||||||
| 344 | See Notes to Financial Statements. |
Schedule of Investments (continued)
SHORT DURATION INCOME FUND November 30, 2021
| Investments | Interest Rate | Maturity Date | Principal Amount (000) | Fair Value | ||||||||
| Oil & Gas (continued) | ||||||||||||
| PDC Energy, Inc. | 6.125% | 9/15/2024 | $ | 12,003 | $ | 12,125,311 | ||||||
| Petroleos Mexicanos (Mexico)(e) | 3.764% (3 Mo. LIBOR + 3.65% | )# | 3/11/2022 | 23,850 | 23,836,883 | |||||||
| Petroleos Mexicanos (Mexico)(e) | 4.25% | 1/15/2025 | 43,137 | 42,971,570 | ||||||||
| Petroleos Mexicanos (Mexico)(e) | 4.875% | 1/18/2024 | 12,719 | 12,961,297 | ||||||||
| Petroleos Mexicanos (Mexico)(e) | 5.375% | 3/13/2022 | 33,589 | 33,817,741 | ||||||||
| Petroleos Mexicanos (Mexico)†(e) | 6.875% | 10/16/2025 | 27,374 | 29,256,099 | ||||||||
| Petroleos Mexicanos (Mexico)(e) | 6.875% | 8/4/2026 | 44,121 | 46,871,503 | ||||||||
| Precision Drilling Corp. (Canada)†(e) | 7.125% | 1/15/2026 | 6,856 | 6,917,156 | ||||||||
| Range Resources Corp. | 9.25% | 2/1/2026 | 107,898 | 116,058,865 | ||||||||
| Reliance Industries Ltd. (India)†(e) | 5.40% | 2/14/2022 | 78,805 | 79,490,075 | ||||||||
| Saudi Arabian Oil Co. (South Korea)†(e) | 2.875% | 4/16/2024 | 26,491 | 27,429,973 | ||||||||
| SM Energy Co.† | 10.00% | 1/15/2025 | 47,872 | 52,441,143 | ||||||||
| Suncor Energy Ventures Corp. (Canada)†(e) | 4.50% | 4/1/2022 | 17,525 | 17,582,514 | ||||||||
| Suncor Energy, Inc. (Canada)(e) | 7.875% | 6/15/2026 | 14,077 | 17,314,335 | ||||||||
| Tengizchevroil Finance Co. International Ltd. (Kazakhstan)†(e) | 2.625% | 8/15/2025 | 52,551 | 52,958,270 | ||||||||
| Valero Energy Corp. | 1.20% | 3/15/2024 | 26,028 | 25,916,687 | ||||||||
| Valero Energy Corp. | 2.85% | 4/15/2025 | 55,196 | 57,311,654 | ||||||||
| Valero Energy Corp. | 3.65% | 3/15/2025 | 14,003 | 14,973,847 | ||||||||
| Viper Energy Partners LP† | 5.375% | 11/1/2027 | 25,848 | 26,679,401 | ||||||||
| Total | 2,294,006,758 | |||||||||||
| Oil & Gas Services 0.05% | ||||||||||||
| Oceaneering International, Inc. | 4.65% | 11/15/2024 | 28,225 | 28,704,543 | ||||||||
| Pharmaceuticals 0.75% | ||||||||||||
| Bayer US Finance II LLC† | 1.126% (3 Mo. LIBOR + 1.01% | )# | 12/15/2023 | 125,880 | 127,106,936 | |||||||
| Bayer US Finance II LLC† | 3.875% | 12/15/2023 | 138,894 | 145,938,657 | ||||||||
| Bayer US Finance II LLC† | 4.25% | 12/15/2025 | 92,758 | 101,037,949 | ||||||||
| Becton Dickinson & Co. | 1.148% (3 Mo. LIBOR + 1.03% | )# | 6/6/2022 | 51,169 | 51,411,184 | |||||||
| Cigna Corp. | 1.014% (3 Mo. LIBOR + .89% | )# | 7/15/2023 | 43,170 | 43,554,284 | |||||||
| Total | 469,049,010 | |||||||||||
| Pipelines 1.78% | ||||||||||||
| Cheniere Corpus Christi Holdings LLC | 5.875% | 3/31/2025 | 170,595 | 190,133,088 | ||||||||
| Cheniere Corpus Christi Holdings LLC | 7.00% | 6/30/2024 | 143,980 | 160,059,207 | ||||||||
| Energy Transfer Operating LP | 4.25% | 3/15/2023 | 65,435 | 67,577,883 | ||||||||
| See Notes to Financial Statements. | 345 |
Schedule of Investments (continued)
SHORT DURATION INCOME FUND November 30, 2021
| Investments | Interest Rate | Maturity Date | Principal Amount (000) | Fair Value | ||||||||
| Pipelines (continued) | ||||||||||||
| Energy Transfer Operating LP | 5.875% | 1/15/2024 | $ | 113,261 | $ | 122,115,084 | ||||||
| Florida Gas Transmission Co. LLC† | 3.875% | 7/15/2022 | 3,623 | 3,666,699 | ||||||||
| Kinder Morgan, Inc. | 1.404% (3 Mo. LIBOR + 1.28% | )# | 1/15/2023 | 11,775 | 11,896,927 | |||||||
| MPLX LP | 3.50% | 12/1/2022 | 2,009 | 2,058,455 | ||||||||
| MPLX LP | 4.00% | 2/15/2025 | 14,400 | 15,403,358 | ||||||||
| NOVA Gas Transmission Ltd. (Canada)(e) | 7.875% | 4/1/2023 | 9,276 | 10,092,073 | ||||||||
| ONEOK Partners LP | 4.90% | 3/15/2025 | 26,810 | 29,436,836 | ||||||||
| ONEOK Partners LP | 5.00% | 9/15/2023 | 7,656 | 8,114,937 | ||||||||
| ONEOK, Inc. | 7.50% | 9/1/2023 | 28,775 | 31,487,384 | ||||||||
| Plains All American Pipeline LP/PAA Finance Corp. | 4.50% | 12/15/2026 | 23,000 | 25,164,159 | ||||||||
| Plains All American Pipeline LP/PAA Finance Corp. | 4.65% | 10/15/2025 | 77,966 | 85,140,476 | ||||||||
| Sabine Pass Liquefaction LLC | 5.625% | 4/15/2023 | 126,720 | 133,239,199 | ||||||||
| Sabine Pass Liquefaction LLC | 5.75% | 5/15/2024 | 154,737 | 169,070,234 | ||||||||
| Texas Eastern Transmission LP† | 2.80% | 10/15/2022 | 15,598 | 15,774,458 | ||||||||
| Western Midstream Operating LP | 2.222% (3 Mo. LIBOR + 2.10% | )# | 1/13/2023 | 38,049 | 37,857,396 | |||||||
| Total | 1,118,287,853 | |||||||||||
| REITS 1.09% | ||||||||||||
| Brixmor Operating Partnership LP | 3.65% | 6/15/2024 | 39,260 | 41,412,291 | ||||||||
| CyrusOne LP/CyrusOne Finance Corp. | 2.90% | 11/15/2024 | 30,150 | 31,329,469 | ||||||||
| EPR Properties | 4.50% | 4/1/2025 | 7,208 | 7,711,536 | ||||||||
| EPR Properties | 4.50% | 6/1/2027 | 54,601 | 58,365,937 | ||||||||
| EPR Properties | 4.75% | 12/15/2026 | 27,415 | 29,605,092 | ||||||||
| GLP Capital LP/GLP Financing II, Inc. | 5.25% | 6/1/2025 | 25,105 | 27,656,044 | ||||||||
| GLP Capital LP/GLP Financing II, Inc. | 5.375% | 4/15/2026 | 11,000 | 12,217,645 | ||||||||
| HAT Holdings I LLC/HAT Holdings II LLC† | 3.375% | 6/15/2026 | 32,101 | 31,644,524 | ||||||||
| HAT Holdings I LLC/HAT Holdings II LLC† | 6.00% | 4/15/2025 | 31,191 | 32,342,884 | ||||||||
| Kilroy Realty LP | 4.375% | 10/1/2025 | 10,037 | 10,988,161 | ||||||||
| Ladder Capital Finance Holdings LLLP/Ladder Capital Finance Corp.† | 5.25% | 10/1/2025 | 33,100 | 33,339,975 | ||||||||
| MPT Operating Partnership LP/MPT Finance Corp. | 5.00% | 10/15/2027 | 109,729 | 114,679,424 | ||||||||
| Park Intermediate Holdings LLC/PK Domestic Property LLC/PK Finance Co-Issuer† | 7.50% | 6/1/2025 | 4,147 | 4,362,354 | ||||||||
| Realty Income Corp. | 4.625% | 11/1/2025 | 24,210 | 26,956,219 | ||||||||
| SL Green Operating Partnership LP | 3.25% | 10/15/2022 | 40,027 | 40,602,251 | ||||||||
| SL Green Realty Corp. | 4.50% | 12/1/2022 | 45,876 | 46,978,086 | ||||||||
| Vornado Realty LP | 2.15% | 6/1/2026 | 19,421 | 19,507,090 | ||||||||
| 346 | See Notes to Financial Statements. |
Schedule of Investments (continued)
SHORT DURATION INCOME FUND November 30, 2021
| Investments | Interest Rate | Maturity Date | Principal Amount (000) | Fair Value | ||||||||
| REITS (continued) | ||||||||||||
| Vornado Realty LP | 3.50% | 1/15/2025 | $ | 23,249 | $ | 24,395,631 | ||||||
| WEA Finance LLC/Westfield UK & Europe Finance plc† | 3.75% | 9/17/2024 | 87,757 | 92,485,889 | ||||||||
| Total | 686,580,502 | |||||||||||
| Retail 0.07% | ||||||||||||
| Arcos Dorados Holdings, Inc. (Uruguay)†(e) | 5.875% | 4/4/2027 | 30,784 | 31,797,563 | ||||||||
| Bath & Body Works, Inc.† | 9.375% | 7/1/2025 | 5,015 | 6,099,043 | ||||||||
| IRB Holding Corp.† | 6.75% | 2/15/2026 | 4,887 | 4,970,079 | ||||||||
| Total | 42,866,685 | |||||||||||
| Savings & Loans 0.07% | ||||||||||||
| People’s United Financial, Inc. | 3.65% | 12/6/2022 | 40,480 | 41,375,237 | ||||||||
| Semiconductors 0.69% | ||||||||||||
| Microchip Technology, Inc.† | 0.972% | 2/15/2024 | 153,581 | 152,216,459 | ||||||||
| Microchip Technology, Inc. | 2.67% | 9/1/2023 | 126,267 | 129,602,858 | ||||||||
| Microchip Technology, Inc. | 4.25% | 9/1/2025 | 21,622 | 22,462,576 | ||||||||
| Microchip Technology, Inc. | 4.333% | 6/1/2023 | 64,279 | 67,321,763 | ||||||||
| SK Hynix, Inc. (South Korea)†(e) | 1.00% | 1/19/2024 | 33,256 | 33,018,998 | ||||||||
| SK Hynix, Inc. (South Korea)†(e) | 1.50% | 1/19/2026 | 34,161 | 33,593,986 | ||||||||
| Total | 438,216,640 | |||||||||||
| Shipbuilding 0.05% | ||||||||||||
| Huntington Ingalls Industries, Inc. | 3.844% | 5/1/2025 | 26,743 | 28,458,978 | ||||||||
| Software 0.06% | ||||||||||||
| Ascend Learning LLC† | 6.875% | 8/1/2025 | 19,139 | 19,511,349 | ||||||||
| Ascend Learning LLC† | 6.875% | 8/1/2025 | 1,700 | 1,732,640 | ||||||||
| Boxer Parent Co., Inc.† | 9.125% | 3/1/2026 | 13,476 | 14,099,804 | ||||||||
| Total | 35,343,793 | |||||||||||
| Telecommunications 0.14% | ||||||||||||
| Altice France SA (France)†(e) | 8.125% | 2/1/2027 | 83,287 | 88,926,779 | ||||||||
| Toys/Games/Hobbies 0.10% | ||||||||||||
| Hasbro, Inc. | 3.00% | 11/19/2024 | 25,290 | 26,437,921 | ||||||||
| Mattel, Inc. | 3.15% | 3/15/2023 | 12,637 | 12,723,437 | ||||||||
| Mattel, Inc.† | 3.375% | 4/1/2026 | 20,534 | 20,881,846 | ||||||||
| Total | 60,043,204 | |||||||||||
| See Notes to Financial Statements. | 347 |
Schedule of Investments (continued)
SHORT DURATION INCOME FUND November 30, 2021
| Investments | Interest Rate | Maturity Date | Principal Amount (000) | Fair Value | ||||||||
| Transportation 0.14% | ||||||||||||
| Indian Railway Finance Corp. Ltd. (India)(e) | 3.73% | 3/29/2024 | $ | 14,120 | $ | 14,796,271 | ||||||
| Pelabuhan Indonesia III Persero PT (Indonesia)†(e) | 4.50% | 5/2/2023 | 20,485 | 21,394,944 | ||||||||
| Rumo Luxembourg S.a.r.l. (Luxembourg)†(e) | 5.875% | 1/18/2025 | 40,396 | 41,455,183 | ||||||||
| XPO Logistics, Inc.† | 6.25% | 5/1/2025 | 12,083 | 12,579,853 | ||||||||
| Total | 90,226,251 | |||||||||||
| Trucking & Leasing 0.00% | ||||||||||||
| Fortress Transportation and Infrastructure Investors LLC† | 6.50% | 10/1/2025 | 2,257 | 2,304,961 | ||||||||
| Total Corporate Bonds (cost $23,644,792,730) | 23,815,099,740 | |||||||||||
| FLOATING RATE LOANS(g) 8.18% | ||||||||||||
| Advertising 0.10% | ||||||||||||
| ABG Intermediate Holdings 2 LLC 2021 | ||||||||||||
| Term Loan B | 4.00% (3 Mo. LIBOR + 3.25% | ) | 9/27/2024 | 61,508 | 61,375,976 | |||||||
| Air Transportation 0.21% | ||||||||||||
| AAdvantage Loyalty IP Ltd. 2021 Term Loan | 5.50% (3 Mo. LIBOR + 4.75% | ) | 4/20/2028 | 49,388 | 50,838,385 | |||||||
| American Airlines, Inc. 2017 Incremental Term Loan | 2.089% (1 Mo. LIBOR + 2.00% | ) | 12/15/2023 | 63,842 | 62,455,846 | |||||||
| American Airlines, Inc. 2018 Term Loan B | 1.842% (1 Mo. LIBOR + 1.75% | ) | 6/27/2025 | 22,494 | 21,266,066 | |||||||
| Total | 134,560,297 | |||||||||||
| Auto Parts: Original Equipment 0.11% | ||||||||||||
| Tenneco, Inc. 2018 Term Loan B | 3.09% (1 Mo. LIBOR + 3.00% | ) | 10/1/2025 | 71,315 | 70,127,571 | |||||||
| Automotive 0.14% | ||||||||||||
| Ford Motor Company Unsecured Term Loan | 1.85% (1 Mo. LIBOR + 1.75% | ) | 12/31/2022 | 90,994 | 90,311,289 | |||||||
| Building Materials 0.04% | ||||||||||||
| Forterra Finance, LLC 2017 Term Loan B | 4.00% (1 Mo. LIBOR + 3.00% | ) | 10/25/2023 | 22,281 | 22,298,829 | |||||||
| Business Services 0.40% | ||||||||||||
| APi Group DE, Inc. 2021 Incremental Term Loan B | - | (h) | 10/7/2028 | 18,891 | 18,839,454 | |||||||
| Global Payments Inc. 2019 Term Loan | 1.467% (1 Mo. LIBOR + 1.38% | ) | 7/9/2024 | 109,813 | 109,538,555 | |||||||
| 348 | See Notes to Financial Statements. |
Schedule of Investments (continued)
SHORT DURATION INCOME FUND November 30, 2021
| Investments | Interest Rate | Maturity Date | Principal Amount (000) | Fair Value | ||||||||
| Business Services (continued) | ||||||||||||
| Syniverse Holdings, Inc. 2018 1st Lien Term Loan | 6.00% (3 Mo. LIBOR + 5.00% | ) | 3/9/2023 | $ | 58,032 | $ | 57,934,311 | |||||
| Trans Union, LLC 2019 Term Loan B5 | 1.84% (1 Mo. LIBOR + 1.75% | ) | 11/16/2026 | 64,495 | 63,661,887 | |||||||
| Total | 249,974,207 | |||||||||||
| Chemicals 0.27% | ||||||||||||
| Axalta Coating Systems US Holdings Inc. USD Term Loan B3 | 1.882% (3 Mo. LIBOR + 1.75% | ) | 6/1/2024 | 68,942 | 68,761,699 | |||||||
| Nutrition & Biosciences, Inc. 3 Year Delayed Draw Term Loan | 1.395% (3 Mo. LIBOR + 1.25% | ) | 1/17/2023 | 36,437 | 36,413,886 | |||||||
| Nutrition & Biosciences, Inc. 5 Year Delayed Draw Term Loan | 1.77% (3Mo. LIBOR + 1.63% | ) | 1/17/2025 | 64,282 | 64,241,743 | |||||||
| Total | 169,417,328 | |||||||||||
| Computer Hardware 0.01% | ||||||||||||
| Science Applications International Corporation 2020 Incremental Term Loan B | 1.965% (1 Mo. LIBOR + 1.88% | ) | 3/12/2027 | 5,984 | 5,977,148 | |||||||
| Computer Software 0.48% | ||||||||||||
| Applied Systems, Inc. 2017 1st Lien Term Loan | 3.75% - 5.50% (Prime Rate + 2.25% (3Mo. LIBOR + 3.25% | ) ) | 9/19/2024 | 69,983 | 69,851,924 | |||||||
| Athenahealth, Inc. 2021 Term Loan B1 | - | (h) | 2/11/2026 | 46,300 | 46,318,036 | |||||||
| McAfee, LLC 2018 USD Term Loan B | - | (h) | 9/30/2024 | 26,364 | 26,361,839 | |||||||
| Vmware, Inc. 3 Year Term Loan | 0.85% (3Mo. LIBOR + .75% | ) | 9/2/2024 | 161,032 | 160,881,242 | |||||||
| Total | 303,413,041 | |||||||||||
| Drugs 0.14% | ||||||||||||
| Change Healthcare Holdings LLC 2017 Term Loan B | 3.50% (1 Mo. LIBOR + 2.50% | ) | 3/1/2024 | 89,807 | 89,697,798 | |||||||
| Entertainment 0.22% | ||||||||||||
| Scientific Games International, Inc. 2018 Term Loan B5 | 2.84% (1 Mo. LIBOR + 2.75% | ) | 8/14/2024 | 139,673 | 138,828,826 | |||||||
| See Notes to Financial Statements. | 349 |
Schedule of Investments (continued)
SHORT DURATION INCOME FUND November 30, 2021
| Investments | Interest Rate | Maturity Date | Principal Amount (000) | Fair Value | ||||||||
| Environmental Services 0.06% | ||||||||||||
| Filtration Group Corporation 2018 1st Lien Term Loan | - | (h) | 3/29/2025 | $ | 41,328 | $ | 40,879,117 | |||||
| Financial Services 0.10% | ||||||||||||
| Delos Finance Sarl 2018 Term Loan B (Luxembourg)(e) | 1.882% (3 Mo. LIBOR + 1.75% | ) | 10/6/2023 | 63,473 | 63,421,594 | |||||||
| Food 0.08% | ||||||||||||
| JBS USA Lux S.A. 2019 Term Loan B (Luxembourg)(e) | 2.092% (1 Mo. LIBOR + 2.00% | ) | 5/1/2026 | 47,526 | 47,353,833 | |||||||
| Gaming 0.10% | ||||||||||||
| GLP Capital L.P. 2020 Term Loan A2 | 1.589% (1 Mo. LIBOR + 1.50% | ) | 5/21/2023 | 11,191 | 11,107,095 | (i) | ||||||
| Penn National Gaming, Inc. 2017 Term Loan A | 2.00% (1 Mo. LIBOR + 1.25% | ) | 10/19/2023 | 54,948 | 54,765,298 | |||||||
| Total | 65,872,393 | |||||||||||
| Government 0.20% | ||||||||||||
| Seminole Tribe of Florida 2018 Term Loan B | 1.84% (1 Mo. LIBOR + 1.75% | ) | 7/8/2024 | 129,019 | 128,787,429 | |||||||
| Health Care 0.20% | ||||||||||||
| Humana Inc. Delayed Draw Term Loan | 1.34% (1 Mo. LIBOR + 1.25% | ) | 5/28/2024 | 39,204 | 38,689,578 | (i) | ||||||
| Humana Inc. Term Loan | - | (h) | 10/30/2023 | 85,343 | 84,223,539 | (i) | ||||||
| Total | 122,913,117 | |||||||||||
| Health Care Services 0.55% | ||||||||||||
| DaVita, Inc. 2019 | ||||||||||||
| Delayed Draw Term Loan A | 1.59% (1 Mo. LIBOR + 1.50% | ) | 8/12/2024 | 15,179 | 15,124,944 | |||||||
| DaVita, Inc. 2020 Term Loan B | 1.84% (1 Mo. LIBOR + 1.75% | ) | 8/12/2026 | 156,507 | 154,981,305 | |||||||
| PPD, Inc. Initial Term Loan | 2.50% (1 Mo. LIBOR + 2.00% | ) | 1/13/2028 | 176,078 | 175,898,904 | |||||||
| Total | 346,005,153 | |||||||||||
| 350 | See Notes to Financial Statements. |
Schedule of Investments (continued)
SHORT DURATION INCOME FUND November 30, 2021
| Investments | Interest Rate | Maturity Date | Principal Amount (000) | Fair Value | ||||||||
| Insurance 0.18% | ||||||||||||
| Asurion LLC 2018 Term Loan B6 | 3.215% (1 Mo. LIBOR + 3.13% | ) | 11/3/2023 | $ | 111,845 | $ | 111,565,802 | |||||
| Leasing 0.09% | ||||||||||||
| Avolon TLB Borrower 1 (US) LLC Term Loan B3 | 2.50% (1 Mo. LIBOR + 1.75% | ) | 1/15/2025 | 57,925 | 57,770,086 | |||||||
| Leisure 0.26% | ||||||||||||
| Carnival Corporation USD Term Loan B (Panama)(e) | 3.75% (1 Mo. LIBOR + 3.00% | ) | 6/30/2025 | 130,301 | 128,769,950 | |||||||
| Life Time Fitness, Inc. 2021 Term Loan B | 5.75% (3 Mo. LIBOR + 4.75% | ) | 12/16/2024 | 36,675 | 37,022,171 | |||||||
| Total | 165,792,121 | |||||||||||
| Lodging 0.61% | ||||||||||||
| Boyd Gaming Corporation Term Loan B3 | 2.328% (1 Wk. LIBOR + 2.25% | ) | 9/15/2023 | 96,600 | 96,521,834 | |||||||
| Caesars Resort Collection, LLC 2017 1st Lien Term Loan B | 2.84% (1 Mo. LIBOR + 2.75% | ) | 12/23/2024 | 91,410 | 90,621,577 | |||||||
| Four Seasons Hotels Limited New 1st Lien Term Loan (Canada)(e) | 2.00% (1 Mo. LIBOR + 2.00% | ) | 11/30/2023 | 52,783 | 52,519,839 | |||||||
| Hilton Worldwide Finance, LLC 2019 Term Loan B2 | 1.842% (1 Mo. LIBOR + 1.75% | ) | 6/22/2026 | 97,594 | 96,358,581 | |||||||
| Resorts World Las Vegas LLC Term Loan A | 1.60% (1 Mo. LIBOR + 1.50% | ) | 4/16/2024 | 25,375 | 24,994,375 | |||||||
| Wynn Resorts, Limited 2019 Term Loan A | - | (h) | 9/20/2024 | 19,479 | 19,284,130 | |||||||
| Total | 380,300,336 | |||||||||||
| Machinery: Industrial/Specialty 0.12% | ||||||||||||
| Welbilt, Inc. 2018 Term Loan B | 2.59% (1 Mo. LIBOR + 2.50% | ) | 10/23/2025 | 75,453 | 75,182,536 | |||||||
| Media 0.63% | ||||||||||||
| Gray Television, Inc. 2021 Second Lien Bridge Term Loan(j) | - | (h) | 8/12/2022 | 96,044 | 96,043,686 | (i) | ||||||
| Meredith Corporation 2020 Term Loan B2 | 4.75% | 1/31/2025 | 21,937 | 21,937,172 | ||||||||
| See Notes to Financial Statements. | 351 |
Schedule of Investments (continued)
SHORT DURATION INCOME FUND November 30, 2021
| Investments | Interest Rate | Maturity Date | Principal Amount (000) | Fair Value | ||||||||
| Media (continued) | ||||||||||||
| Nexstar Broadcasting, Inc. 2018 Term Loan A4 | 1.586% (1 Mo. LIBOR + 1.50% | ) | 10/26/2023 | $ | 11,370 | $ | 11,323,840 | |||||
| Nexstar Broadcasting, Inc. 2018 Term Loan B3 | 2.34% (1 Mo. LIBOR + 2.25% | ) | 1/17/2024 | 16,240 | 16,192,734 | |||||||
| Nexstar Broadcasting, Inc. Term Loan A5 | 1.586% (1 Mo. LIBOR + 1.50% | ) | 9/19/2024 | 29,123 | 28,999,711 | |||||||
| Nielsen Finance LLC USD Term Loan B4 | 2.089% (1 Mo. LIBOR + 2.00% | ) | 10/4/2023 | 155,941 | 155,746,355 | |||||||
| Univision Communications Inc. 2021 First Lien Term Loan B | 4.00% (1 Mo. LIBOR + 3.25% | ) | 3/15/2026 | 8,450 | 8,442,234 | |||||||
| Univision Communications Inc. Term Loan C5 | 3.75% (1 Mo. LIBOR + 2.75% | ) | 3/15/2024 | 54,411 | 54,318,650 | |||||||
| Total | 393,004,382 | |||||||||||
| Miscellaneous 0.57% | ||||||||||||
| Charter Communications Operating, LLC 2017 Term Loan A2 | 1.60% (1 Mo. LIBOR + 1.50% | ) | 3/31/2023 | 84,579 | 84,578,713 | |||||||
| Charter Communications Operating, LLC 2019 Term Loan B1 | 1.85% (1 Mo. LIBOR + 1.75% | ) | 4/30/2025 | 248,786 | 247,929,876 | |||||||
| Clean Harbors Inc. 2017 Term Loan B | 1.84% (1 Mo. LIBOR + 1.75% | ) | 6/28/2024 | 17,792 | 17,778,154 | |||||||
| WideOpenWest Finance LLC 2017 Term Loan B | 4.25% (1 Mo. LIBOR + 3.25% | ) | 8/18/2023 | 8,453 | 8,452,059 | |||||||
| Total | 358,738,802 | |||||||||||
| Oil 0.15% | ||||||||||||
| Hess Corporation Term Loan | 2.10% (1 Mo. LIBOR + 2.00% | ) | 3/16/2023 | 92,477 | 92,245,901 | |||||||
| Oil: Crude Producers 0.27% | ||||||||||||
| Buckeye Partners, L.P. 2021 Term Loan B | 2.336% (1 Mo. LIBOR + 2.25% | ) | 11/1/2026 | 89,324 | 88,939,772 | |||||||
| Cheniere Corpus Christi Holdings, LLC Delayed Draw Term Loan Tranche 2 | 1.84% (1 Mo. LIBOR + 1.75% | ) | 6/30/2024 | 83,411 | 83,393,585 | |||||||
| Total | 172,333,357 | |||||||||||
| 352 | See Notes to Financial Statements. |
Schedule of Investments (continued)
SHORT DURATION INCOME FUND November 30, 2021
| Investments | Interest Rate | Maturity Date | Principal Amount (000) | Fair Value | ||||||||
| Real Estate Investment Trusts 0.45% | �� | |||||||||||
| Crown Castle International Corporation 2016 Term Loan A | 1.225% (1 Mo. LIBOR + 1.13% | ) | 6/21/2024 | $ | 16,558 | $ | 16,530,575 | |||||
| Invitation Homes Operating Partnership LP 2020 Term Loan A | 1.09% (1 Mo. LIBOR + 1.00% | ) | 1/31/2025 | 250,806 | 250,806,186 | |||||||
| SL Green Realty Corp. Term Loan A | 1.192% (1 Mo. LIBOR + 1.10% | ) | 3/31/2023 | 12,677 | 12,549,929 | (i) | ||||||
| Total | 279,886,690 | |||||||||||
| Retail 0.33% | ||||||||||||
| 1011778 B.C. Unlimited Liability Company Term Loan A (Canada)(e) | 1.414% (3 Mo. LIBOR + 1.25% | ) | 9/6/2024 | 36,254 | 35,392,620 | |||||||
| BJ’s Wholesale Club, Inc. 2017 1st Lien Term Loan | 2.089% (1 Mo. LIBOR + 0.02% | ) | 2/3/2024 | 28,268 | 28,253,584 | |||||||
| Panera Bread Company Term Loan A | 2.375% (1 Mo. LIBOR + 2.25% | ) | 7/18/2022 | 145,227 | 143,775,229 | |||||||
| Total | 207,421,433 | |||||||||||
| Technology 0.54% | ||||||||||||
| Comcast Hulu Holdings, LLC Term Loan A | 0.965% (1 Mo. LIBOR + 0.88% | ) | 3/15/2024 | 276,174 | 273,757,671 | |||||||
| ProQuest LLC 2019 Term Loan | 5.75% | 10/23/2026 | 65,927 | 65,936,066 | ||||||||
| Total | 339,693,737 | |||||||||||
| Telecommunications 0.33% | ||||||||||||
| AT&T Inc. 2021 Delayed Draw Term Loan | 1.091% (1 Mo. LIBOR + 1.00% | ) | 3/23/2022 | 84,465 | 84,510,189 | (i) | ||||||
| CenturyLink, Inc. 2020 Term Loan A | 2.09% (1 Mo. LIBOR + 2.00% | ) | 1/31/2025 | 103,251 | 102,782,580 | |||||||
| NeuStar, Inc. 2018 Term Loan B4 | - | (h) | 8/8/2024 | 17,693 | 17,715,694 | |||||||
| Total | 205,008,463 | |||||||||||
| Transportation: Miscellaneous 0.24% | ||||||||||||
| XPO Logistics, Inc. 2018 Term Loan B | 1.831% (1 Mo. LIBOR + 1.75% | ) | 2/24/2025 | 152,671 | 151,700,644 | |||||||
| Total Floating Rate Loans (cost $5,159,950,571) | 5,141,859,236 | |||||||||||
| See Notes to Financial Statements. | 353 |
Schedule of Investments (continued)
SHORT DURATION INCOME FUND November 30, 2021
| Investments | Interest Rate | Maturity Date | Principal Amount (000) | Fair Value | ||||||||
| FOREIGN GOVERNMENT OBLIGATIONS 0.90% | ||||||||||||
| Egypt 0.25% | ||||||||||||
| Republic of Egypt(e) | 6.125% | 1/31/2022 | $ | 12,921 | $ | 12,961,895 | ||||||
| Republic of Egypt†(e) | 6.125% | 1/31/2022 | 146,652 | 147,116,153 | ||||||||
| Total | 160,078,048 | |||||||||||
| Indonesia 0.02% | ||||||||||||
| Perusahaan Penerbit SBSN†(e) | 3.75% | 3/1/2023 | 13,995 | 14,530,519 | ||||||||
| Japan 0.32% | ||||||||||||
| Japan Treasury Discount Bill(d) | Zero Coupon | 2/7/2022 | JPY | 22,732,050 | 201,159,773 | |||||||
| Kenya 0.15% | ||||||||||||
| Republic of Kenya†(e) | 6.875% | 6/24/2024 | $ | 88,229 | 93,705,815 | |||||||
| Morocco 0.09% | ||||||||||||
| Morocco Government International Bond†(e) | 4.25% | 12/11/2022 | 56,058 | 57,434,000 | ||||||||
| Romania 0.03% | ||||||||||||
| Republic of Romania†(e) | 4.875% | 1/22/2024 | 14,588 | 15,565,323 | ||||||||
| South Korea 0.04% | ||||||||||||
| Korea National Oil Corp.†(e) | 2.875% | 3/27/2022 | 25,000 | 25,176,113 | ||||||||
| Total Foreign Government Obligations (cost $561,464,576) | 567,649,591 | |||||||||||
| GOVERNMENT SPONSORED ENTERPRISES COLLATERALIZED MORTGAGE OBLIGATIONS 0.04% | ||||||||||||
| Federal Home Loan Mortgage Corp. K061 X1 IO | 0.297% | #(k) | 11/25/2026 | 550,866 | 4,697,071 | |||||||
| Federal Home Loan Mortgage Corp. K722 X1 IO | 1.441% | #(k) | 3/25/2023 | 166,923 | 1,893,204 | |||||||
| Government National Mortgage Assoc. 2013-171 IO | 0.545% | #(k) | 6/16/2054 | 2,219 | 157,373 | |||||||
| Government National Mortgage Assoc. 2013-193 IO | 0.32% | #(k) | 1/16/2055 | 3,628 | 314,222 | |||||||
| Government National Mortgage Assoc. 2014-112 A | 3.00% | #(k) | 1/16/2048 | 9,678 | 9,877,272 | |||||||
| Government National Mortgage Assoc. 2014-15 IO | 0.266% | #(k) | 8/16/2054 | 2,499 | 129,329 | |||||||
| Government National Mortgage Assoc. 2014-186 AP | 2.80% | 4/16/2050 | 6,660 | 6,793,310 | ||||||||
| Government National Mortgage Assoc. 2014-64 IO | 0.794% | #(k) | 12/16/2054 | 2,837 | 163,917 | |||||||
| Government National Mortgage Assoc. 2014-78 IO | Zero Coupon | #(k) | 3/16/2056 | 10,047 | 83,826 | |||||||
| Government National Mortgage Assoc. 2015-19 AD | 2.90% | 10/16/2055 | 2,876 | 2,911,787 | ||||||||
| Total Government Sponsored Enterprises Collateralized Mortgage Obligations (cost $29,746,026) | 27,021,311 | |||||||||||
| 354 | See Notes to Financial Statements. |
Schedule of Investments (continued)
SHORT DURATION INCOME FUND November 30, 2021
| Investments | Interest Rate | Maturity Date | Principal Amount (000) | Fair Value | ||||||||
| GOVERNMENT SPONSORED ENTERPRISES PASS-THROUGHS 0.27% | ||||||||||||
| Federal Home Loan Mortgage Corp. | 1.89% (12 Mo. LIBOR + 1.64% | )# | 11/1/2043 | $ | 855 | $ | 894,289 | |||||
| Federal Home Loan Mortgage Corp. | 2.028% (12 Mo. LIBOR + 1.76% | )# | 5/1/2037 | 2,214 | 2,339,643 | |||||||
| Federal Home Loan Mortgage Corp. | 2.031% (12 Mo. LIBOR + 1.66% | )# | 2/1/2038 | 2,553 | 2,687,544 | |||||||
| Federal Home Loan Mortgage Corp. | 2.033% (12 Mo. LIBOR + 1.72% | )# | 4/1/2037 | 4,244 | 4,478,780 | |||||||
| Federal Home Loan Mortgage Corp. | 2.051% (12 Mo. LIBOR + 1.78% | )# | 12/1/2036 | 6,462 | 6,819,751 | |||||||
| Federal Home Loan Mortgage Corp. | 2.077% (12 Mo. LIBOR + 1.80% | )# | 6/1/2041 | 1,765 | 1,865,288 | |||||||
| Federal Home Loan Mortgage Corp. | 2.107% (12 Mo. LIBOR + 1.80% | )# | 10/1/2038 | 2,653 | 2,807,118 | |||||||
| Federal Home Loan Mortgage Corp. | 2.123% (12 Mo. LIBOR + 1.79% | )# | 5/1/2036 | 2,256 | 2,380,491 | |||||||
| Federal Home Loan Mortgage Corp. | 2.164% (12 Mo. LIBOR + 1.88% | )# | 9/1/2035 | 1,935 | 2,045,086 | |||||||
| Federal Home Loan Mortgage Corp. | 2.169% (12 Mo. LIBOR + 1.85% | )# | 6/1/2042 | 4,383 | 4,625,528 | |||||||
| Federal Home Loan Mortgage Corp. | 2.184% (12 Mo. LIBOR + 1.90% | )# | 12/1/2040 | 569 | 600,955 | |||||||
| Federal Home Loan Mortgage Corp. | 2.20% (12 Mo. LIBOR + 1.88% | )# | 12/1/2040 | 2,776 | 2,932,770 | |||||||
| Federal Home Loan Mortgage Corp. | 2.217% (12 Mo. LIBOR + 1.92% | )# | 9/1/2036 | 6,546 | 6,927,738 | |||||||
| Federal Home Loan Mortgage Corp. | 2.258% (12 Mo. LIBOR + 1.96% | )# | 2/1/2037 | 3,130 | 3,330,473 | (a) | ||||||
| Federal Home Loan Mortgage Corp. | 2.587% (1 Yr. Treasury CMT + 2.50% | )# | 12/1/2035 | 3,030 | 3,241,877 | |||||||
| Federal National Mortgage Assoc. | 1.782% (12 Mo. LIBOR + 1.47% | )# | 12/1/2035 | 6,567 | 6,866,085 | |||||||
| Federal National Mortgage Assoc. | 1.786% (12 Mo. LIBOR + 1.52% | )# | 10/1/2035 | 4,358 | 4,564,626 | |||||||
| Federal National Mortgage Assoc. | 1.787% (12 Mo. LIBOR + 1.54% | )# | 11/1/2036 | 1,068 | 1,120,225 | |||||||
| Federal National Mortgage Assoc. | 1.816% (12 Mo. LIBOR + 1.51% | )# | 2/1/2036 | 2,773 | 2,905,280 | |||||||
| Federal National Mortgage Assoc. | 1.836% (12 Mo. LIBOR + 1.51% | )# | 3/1/2039 | 2,737 | 2,866,561 | |||||||
| Federal National Mortgage Assoc. | 1.851% (12 Mo. LIBOR + 1.59% | )# | 8/1/2034 | 6,159 | 6,451,274 | |||||||
| See Notes to Financial Statements. | 355 |
Schedule of Investments (continued)
SHORT DURATION INCOME FUND November 30, 2021
| Investments | Interest Rate | Maturity Date | Principal Amount (000) | Fair Value | ||||||||
| GOVERNMENT SPONSORED ENTERPRISES PASS-THROUGHS (continued) | ||||||||||||
| Federal National Mortgage Assoc. | 1.861% (12 Mo. LIBOR + 1.56% | )# | 6/1/2038 | $ | 855 | $ | 897,675 | |||||
| Federal National Mortgage Assoc. | 1.895% (12 Mo. LIBOR + 1.58% | )# | 3/1/2038 | 3,202 | 3,366,059 | |||||||
| Federal National Mortgage Assoc. | 1.911% (12 Mo. LIBOR + 1.64% | )# | 9/1/2038 | 2,527 | 2,656,289 | |||||||
| Federal National Mortgage Assoc. | 1.914% (12 Mo. LIBOR + 1.62% | )# | 8/1/2037 | 3,773 | 3,951,419 | |||||||
| Federal National Mortgage Assoc. | 1.921% (12 Mo. LIBOR + 1.60% | )# | 4/1/2038 | 3,052 | 3,208,097 | |||||||
| Federal National Mortgage Assoc. | 1.931% (12 Mo. LIBOR + 1.62% | )# | 1/1/2038 | 1,401 | 1,473,740 | |||||||
| Federal National Mortgage Assoc. | 1.937% (12 Mo. LIBOR + 1.66% | )# | 9/1/2036 | 2,180 | 2,286,313 | |||||||
| Federal National Mortgage Assoc. | 1.981% (12 Mo. LIBOR + 1.66% | )# | 8/1/2038 | 1,297 | 1,364,944 | |||||||
| Federal National Mortgage Assoc. | 1.982% (12 Mo. LIBOR + 1.65% | )# | 12/1/2036 | 2,327 | 2,445,471 | |||||||
| Federal National Mortgage Assoc. | 2.035% (12 Mo. LIBOR + 1.73% | )# | 10/1/2036 | 2,655 | 2,801,210 | |||||||
| Federal National Mortgage Assoc. | 2.054% (12 Mo. LIBOR + 1.80% | )# | 10/1/2040 | 854 | 898,382 | |||||||
| Federal National Mortgage Assoc. | 2.06% (12 Mo. LIBOR + 1.80% | )# | 11/1/2040 | 5,889 | 6,201,874 | |||||||
| Federal National Mortgage Assoc. | 2.066% (12 Mo. LIBOR + 1.82% | )# | 1/1/2042 | 5,546 | 5,845,880 | |||||||
| Federal National Mortgage Assoc. | 2.075% (12 Mo. LIBOR + 1.79% | )# | 3/1/2042 | 2,972 | 3,130,313 | |||||||
| Federal National Mortgage Assoc. | 2.09% (12 Mo. LIBOR + 1.75% | )# | 11/1/2038 | 3,668 | 3,866,069 | |||||||
| Federal National Mortgage Assoc. | 2.10% (12 Mo. LIBOR + 1.80% | )# | 12/1/2040 | 3,486 | 3,670,473 | |||||||
| Federal National Mortgage Assoc. | 2.111% (12 Mo. LIBOR + 1.79% | )# | 1/1/2041 | 5,808 | 6,118,271 | |||||||
| Federal National Mortgage Assoc. | 2.114% (12 Mo. LIBOR + 1.82% | )# | 8/1/2041 | 2,358 | 2,486,664 | |||||||
| Federal National Mortgage Assoc. | 2.137% (12 Mo. LIBOR + 1.81% | )# | 12/1/2040 | 1,460 | 1,537,963 | |||||||
| Federal National Mortgage Assoc. | 2.139% (12 Mo. LIBOR + 1.80% | )# | 1/1/2041 | 1,901 | 2,003,534 | (a) | ||||||
| Federal National Mortgage Assoc. | 2.147% (12 Mo. LIBOR + 1.79% | )# | 10/1/2036 | 2,322 | 2,453,707 | (a) | ||||||
| 356 | See Notes to Financial Statements. |
Schedule of Investments (continued)
SHORT DURATION INCOME FUND November 30, 2021
| Investments | Interest Rate | Maturity Date | Principal Amount (000) | Fair Value | ||||||||
| GOVERNMENT SPONSORED ENTERPRISES PASS-THROUGHS (continued) | ||||||||||||
| Federal National Mortgage Assoc. | 2.17% (12 Mo. LIBOR + 1.81% | )# | 4/1/2040 | $ | 1,223 | $ | 1,289,615 | |||||
| Federal National Mortgage Assoc. | 2.184% (12 Mo. LIBOR + 1.84% | )# | 7/1/2040 | 637 | 668,691 | |||||||
| Federal National Mortgage Assoc. | 2.19% (12 Mo. LIBOR + 1.88% | )# | 12/1/2038 | 1,886 | 2,002,100 | |||||||
| Federal National Mortgage Assoc. | 2.267% (1 Yr. Treasury CMT + 2.17% | )# | 3/1/2038 | 651 | 681,847 | |||||||
| Federal National Mortgage Assoc. | 2.322% (1 Yr. Treasury CMT + 2.21% | )# | 1/1/2038 | 1,280 | 1,365,600 | |||||||
| Federal National Mortgage Assoc. | 2.722% (12 Mo. LIBOR + 1.60% | )# | 12/1/2045 | 5,533 | 5,786,521 | |||||||
| Federal National Mortgage Assoc. | 2.735% (12 Mo. LIBOR + 1.60% | )# | 12/1/2045 | 4,327 | 4,526,118 | |||||||
| Federal National Mortgage Assoc. | 2.776% (12 Mo. LIBOR + 1.60% | )# | 10/1/2045 | 4,643 | 4,853,492 | |||||||
| Federal National Mortgage Assoc. | 2.923% (12 Mo. LIBOR + 1.72% | )# | 6/1/2042 | 2,571 | 2,712,737 | |||||||
| Federal National Mortgage Assoc. | 2.938% (12 Mo. LIBOR + 1.74% | )# | 5/1/2042 | 6,485 | 6,840,913 | |||||||
| Total Government Sponsored Enterprises Pass-Throughs (cost $164,627,973) | 166,143,363 | |||||||||||
| MUNICIPAL BONDS 0.06% | ||||||||||||
| Miscellaneous | ||||||||||||
| State of Illinois (cost $37,915,842) | 4.95% | 6/1/2023 | 37,367 | 39,087,903 | ||||||||
| NON-AGENCY COMMERCIAL MORTGAGE-BACKED SECURITIES 18.20% | ||||||||||||
| 1211 Avenue of the Americas Trust 2015-1211 XA IO† | 0.38% | #(k) | 8/10/2035 | 214,200 | 1,959,951 | |||||||
| AD Mortgage Trust 2017-330M A† | 3.294% | #(k) | 8/15/2034 | 3,060 | 3,110,542 | |||||||
| Angel Oak Mortgage Trust 2020-1 A1† | 2.466% | #(k) | 12/25/2059 | 12,322 | 12,370,508 | |||||||
| Angel Oak Mortgage Trust 2020-6 A1† | 1.261% | #(k) | 5/25/2065 | 18,417 | 18,445,265 | |||||||
| Angel Oak Mortgage Trust 2021-4 A1† | 1.035% | #(k) | 1/20/2065 | 72,993 | 72,352,944 | |||||||
| Angel Oak Mortgage Trust 2021-6 A1† | 1.458% | #(k) | 9/25/2066 | 102,157 | 101,529,798 | |||||||
| Angel Oak Mortgage Trust 2021-7 A1† | 1.978% | #(k) | 10/25/2066 | 74,850 | 75,375,222 | |||||||
| Atrium Hotel Portfolio Trust 2017-ATRM A† | 1.02% (1 Mo. LIBOR + .93% | )# | 12/15/2036 | 19,170 | 19,155,013 | |||||||
| Atrium Hotel Portfolio Trust 2017-ATRM B† | 1.59% (1 Mo. LIBOR + 1.50% | )# | 12/15/2036 | 30,936 | 30,670,529 | |||||||
| Atrium Hotel Portfolio Trust 2018-ATRM B† | 1.52% (1 Mo. LIBOR + 1.43% | )# | 6/15/2035 | 28,355 | 28,116,316 | |||||||
| See Notes to Financial Statements. | 357 |
Schedule of Investments (continued)
SHORT DURATION INCOME FUND November 30, 2021
| Investments | Interest Rate | Maturity Date | Principal Amount (000) | Fair Value | ||||||||
| NON-AGENCY COMMERCIAL MORTGAGE-BACKED SECURITIES (continued) | ||||||||||||
| Atrium Hotel Portfolio Trust 2018-ATRM C† | 1.74% (1 Mo. LIBOR + 1.65% | )# | 6/15/2035 | $ | 9,012 | $ | 8,915,202 | |||||
| BAMLL Commercial Mortgage Securities Trust 2019-AHT B† | 1.69% (1 Mo. LIBOR + 1.60% | )# | 3/15/2034 | 10,221 | 10,222,331 | |||||||
| Banc of America Commercial Mortgage Trust 2016-UB10 XA IO | 1.965% | #(k) | 7/15/2049 | 56,122 | 3,480,475 | |||||||
| Bancorp Commercial Mortgage Trust 2019-CRE6 A† | 1.212% (1 Mo. SOFR + 1.16% | )# | 9/15/2036 | 1,410 | 1,410,284 | |||||||
| BBCMS Mortgage Trust 2018-TALL A† | 0.812% (1 Mo. LIBOR + .72% | )# | 3/15/2037 | 35,484 | 35,148,708 | |||||||
| BBCMS Mortgage Trust 2018-TALL E† | 2.527% (1 Mo. LIBOR + 2.44% | )# | 3/15/2037 | 36,419 | 34,921,826 | |||||||
| BBCMS Mortgage Trust 2019-BWAY A† | 1.046% (1 Mo. LIBOR + .96% | )# | 11/15/2034 | 57,710 | 57,624,405 | |||||||
| BBCMS Mortgage Trust 2019-BWAY B† | 1.40% (1 Mo. LIBOR + 1.31% | )# | 11/15/2034 | 26,023 | 25,898,993 | |||||||
| BBCMS Mortgage Trust 2019-BWAY C† | 1.70% (1 Mo. LIBOR + 1.61% | )# | 11/15/2034 | 10,000 | 9,878,996 | |||||||
| BBCMS Mortgage Trust 2020-C7 A2 | 2.021% | 4/15/2053 | 13,250 | 13,378,480 | ||||||||
| BBCMS Trust 2015-MSQ A† | 3.593% | 9/15/2032 | 19,174 | 19,314,062 | ||||||||
| BBCMS Trust 2015-VFM A1† | 2.466% | 3/10/2036 | 18,697 | 18,857,146 | ||||||||
| BBCMS Trust 2018-BXH A† | 1.089% (1 Mo. LIBOR + 1.00% | )# | 10/15/2037 | 12,519 | 12,536,020 | |||||||
| BB-UBS Trust 2012-SHOW A† | 3.43% | 11/5/2036 | 39,264 | 40,849,009 | ||||||||
| BB-UBS Trust 2012-TFT A† | 2.892% | 6/5/2030 | 29,764 | 29,811,499 | ||||||||
| BB-UBS Trust 2012-TFT B† | 3.678% | #(k) | 6/5/2030 | 7,850 | 7,388,652 | |||||||
| BB-UBS Trust 2012-TFT C† | 3.678% | #(k) | 6/5/2030 | 14,354 | 12,602,346 | |||||||
| BDS Ltd. 2021-FL8 A† | 1.009% (1 Mo. LIBOR + .92% | )# | 1/18/2036 | 62,000 | 61,671,400 | |||||||
| Benchmark Mortgage Trust 2018-B3 A3 | 3.746% | 4/10/2051 | 5,000 | 5,283,086 | ||||||||
| Benchmark Mortgage Trust 2021 B23 A2 | 1.62% | 2/15/2054 | 28,550 | 28,358,769 | ||||||||
| BFLD 2019-DPLO E† | 2.33% (1 Mo. LIBOR + 2.24% | )# | 10/15/2034 | 24,480 | 24,036,951 | |||||||
| BHMS 2018-ATLS D† | 2.34% (1 Mo. LIBOR + 2.25% | )# | 7/15/2035 | 39,450 | 39,142,136 | |||||||
| BHP Trust 2019-BXHP A† | 1.065% (1 Mo. LIBOR + .98% | )# | 8/15/2036 | 75,429 | 75,433,966 | |||||||
| BHP Trust 2019-BXHP B† | 1.413% (1 Mo. LIBOR + 1.32% | )# | 8/15/2036 | 8,168 | 8,149,681 | |||||||
| 358 | See Notes to Financial Statements. |
Schedule of Investments (continued)
SHORT DURATION INCOME FUND November 30, 2021
| Investments | Interest Rate | Maturity Date | Principal Amount (000) | Fair Value | ||||||||
| NON-AGENCY COMMERCIAL MORTGAGE-BACKED SECURITIES (continued) | ||||||||||||
| BWAY Mortgage Trust 2013-1515 A1† | 2.809% | 3/10/2033 | $ | 5,476 | $ | 5,623,010 | ||||||
| BWAY Mortgage Trust 2013-1515 XB IO† | 0.534% | #(k) | 3/10/2033 | 103,040 | 1,305,414 | |||||||
| BX 2021-MFM1 A† | 0.79% (1 Mo. LIBOR + .70% | )# | 1/15/2034 | 11,340 | 11,307,930 | |||||||
| BX Commercial Mortgage Trust 2018-BIOA A† | 0.761% (1 Mo. LIBOR + .67% | )# | 3/15/2037 | 54,186 | 54,156,994 | |||||||
| BX Commercial Mortgage Trust 2019-XL A† | 1.01% (1 Mo. LIBOR + .92% | )# | 10/15/2036 | 148,232 | 148,372,334 | |||||||
| BX Commercial Mortgage Trust 2019-XL B† | 1.17% (1 Mo. LIBOR + 1.08% | )# | 10/15/2036 | 10,880 | 10,867,600 | |||||||
| BX Commercial Mortgage Trust 2019-XL F† | 2.09% (1 Mo. LIBOR + 2.00% | )# | 10/15/2036 | 24,272 | 24,156,578 | |||||||
| BX Commercial Mortgage Trust 2021-ACNT A† | 0.95% (1 Mo. LIBOR + .85% | )# | 11/15/2026 | 81,970 | 81,894,776 | |||||||
| BX Commercial Mortgage Trust 2021-ACNT D† | 1.95% (1 Mo. LIBOR + 1.85% | )# | 11/15/2026 | 51,690 | 51,693,722 | |||||||
| BX Commercial Mortgage Trust 2021-XL2 A† | 0.779% (1 Mo. LIBOR + .69% | )# | 10/15/2038 | 125,340 | 124,908,392 | |||||||
| BX Trust 2017-SLCT D† | 2.14% (1 Mo. LIBOR + 2.05% | )# | 7/15/2034 | 39,669 | 39,743,607 | |||||||
| BX Trust 2018-BILT A† | 0.89% (1 Mo. LIBOR + .80% | )# | 5/15/2030 | 21,628 | 21,613,122 | |||||||
| BX Trust 2019-OC11 XA IO† | 0.873% | #(k) | 12/9/2041 | 561,200 | 29,210,797 | |||||||
| BX Trust 2019-RP B† | 1.585% (1 Mo. LIBOR + 1.50% | )# | 6/15/2034 | 17,480 | 16,782,735 | |||||||
| BX Trust 2021-ARIA E† | 2.335% (1 Mo. LIBOR + 2.24% | )# | 10/15/2036 | 209,735 | 209,111,164 | |||||||
| BX Trust 2021-ARIA F† | 2.684% (1 Mo. LIBOR + 2.59% | )# | 10/15/2036 | 69,150 | 68,967,575 | |||||||
| BX Trust 2021-RISE A†(b) | 0.848% (1 Mo. LIBOR + .75% | )# | 11/15/2036 | 165,000 | 166,549,317 | |||||||
| BX Trust 2021-RISE B†(b) | 1.35% (1 Mo. LIBOR + 1.25% | )# | 11/15/2036 | 59,250 | 59,813,936 | |||||||
| BXHPP Trust 2021-FILM A† | 0.74% (1 Mo. LIBOR + .65% | )# | 8/15/2036 | 149,970 | 149,561,107 | |||||||
| See Notes to Financial Statements. | 359 |
Schedule of Investments (continued)
SHORT DURATION INCOME FUND November 30, 2021
| Investments | Interest Rate | Maturity Date | Principal Amount (000) | Fair Value | ||||||||
| NON-AGENCY COMMERCIAL MORTGAGE-BACKED SECURITIES (continued) | ||||||||||||
| BXHPP Trust 2021-FILM B† | 0.99% (1 Mo. LIBOR + .90% | )# | 8/15/2036 | $ | 38,250 | $ | 38,073,541 | |||||
| BXMT Ltd. 2021-FL4 A† | 1.14% (1 Mo. LIBOR + 1.05% | )# | 5/15/2038 | 57,000 | 56,846,100 | |||||||
| BXP Trust 2017-CQHP A† | 0.94% (1 Mo. LIBOR + .85% | )# | 11/15/2034 | 41,359 | 41,103,108 | |||||||
| Cantor Commercial Real Estate Lending 2019-CF1 65A† | 4.411% | #(k) | 5/15/2052 | 5,498 | 5,635,793 | |||||||
| CF Trust 2019-BOSS A1 | 4.75% (1 Mo. LIBOR + 3.25%) | 12/15/2021 | 63,488 | 58,627,359 | (a) | |||||||
| CFCRE Commercial Mortgage Trust 2016-C4 XA IO | 1.798% | #(k) | 5/10/2058 | 64,359 | 3,777,629 | |||||||
| CFCRE Commercial Mortgage Trust 2016-C6 XA IO | 1.24% | #(k) | 11/10/2049 | 148,545 | 6,695,040 | |||||||
| CFCRE Commercial Mortgage Trust 2016-C7 XA IO | 0.828% | #(k) | 12/10/2054 | 141,865 | 4,369,194 | |||||||
| CFCRE Commercial Mortgage Trust 2018-TAN A† | 4.236% | 2/15/2033 | 9,907 | 10,162,937 | ||||||||
| CHT Mortgage Trust 2017-CSMO A† | 1.019% (1 Mo. LIBOR + .93% | )# | 11/15/2036 | 24,230 | 24,248,604 | |||||||
| Citigroup Commercial Mortgage Trust 2012-GC8 XB IO† | 0.233% | #(k) | 9/10/2045 | 207,654 | 203,667 | |||||||
| Citigroup Commercial Mortgage Trust 2013-GC11 XA IO | 1.499% | #(k) | 4/10/2046 | 335,575 | 4,765,533 | |||||||
| Citigroup Commercial Mortgage Trust 2014-GC19 A3 IO | 3.753% | 3/10/2047 | 4,346 | 4,521,083 | ||||||||
| Citigroup Commercial Mortgage Trust 2014-GC21 XA IO | 1.315% | #(k) | 5/10/2047 | 168,576 | 4,018,686 | |||||||
| Citigroup Commercial Mortgage Trust 2014-GC23 XB IO | 0.304% | #(k) | 7/10/2047 | 120,131 | 677,094 | |||||||
| Citigroup Commercial Mortgage Trust 2015-GC27 AAB | 2.944% | 2/10/2048 | 5,651 | 5,804,425 | ||||||||
| Citigroup Commercial Mortgage Trust 2015-GC27 XA IO | 1.48% | #(k) | 2/10/2048 | 108,736 | 3,778,969 | |||||||
| Citigroup Commercial Mortgage Trust 2015-GC31 XA IO | 0.477% | #(k) | 6/10/2048 | 229,210 | 2,584,939 | |||||||
| Citigroup Commercial Mortgage Trust 2015-GC35 XA IO | 0.872% | #(k) | 11/10/2048 | 153,477 | 3,801,057 | |||||||
| Citigroup Commercial Mortgage Trust 2016-GC36 A5 | 3.616% | 2/10/2049 | 16,900 | 18,127,526 | ||||||||
| Citigroup Commercial Mortgage Trust 2016-GC36 XA IO | 1.376% | #(k) | 2/10/2049 | 93,833 | 3,922,645 | |||||||
| Citigroup Commercial Mortgage Trust 2016-GC37 A4 | 3.314% | 4/10/2049 | 46,275 | 49,111,861 | ||||||||
| Citigroup Commercial Mortgage Trust 2016-GC37 XA IO | 1.853% | #(k) | 4/10/2049 | 57,951 | 3,457,492 | |||||||
| 360 | See Notes to Financial Statements. |
Schedule of Investments (continued)
SHORT DURATION INCOME FUND November 30, 2021
| Investments | Interest Rate | Maturity Date | Principal Amount (000) | Fair Value | ||||||||
| NON-AGENCY COMMERCIAL MORTGAGE-BACKED SECURITIES (continued) | ||||||||||||
| Citigroup Commercial Mortgage Trust 2018-B2 A2 | 3.788% | 3/10/2051 | $ | 5,605 | $ | 5,741,843 | ||||||
| COLT Mortgage Loan Trust 2021-2 A1† | 0.924% | #(k) | 8/25/2066 | 12,433 | 12,337,919 | |||||||
| Commercial Mortgage Pass-Through Certificates 2010-C1 C† | 5.807% | #(k) | 7/10/2046 | 931 | 933,101 | |||||||
| Commercial Mortgage Pass-Through Certificates 2010-C1 D† | 5.942% | #(k) | 7/10/2046 | 12,446 | 12,625,377 | |||||||
| Commercial Mortgage Pass-Through Certificates 2012-CR3 AM† | 3.416% | 10/15/2045 | 7,449 | 7,457,719 | ||||||||
| Commercial Mortgage Pass-Through Certificates 2012-CR4 XA IO | 1.839% | #(k) | 10/15/2045 | 202,308 | 1,957,917 | |||||||
| Commercial Mortgage Pass-Through Certificates 2012-CR5 AM† | 3.223% | 12/10/2045 | 22,028 | 22,443,092 | ||||||||
| Commercial Mortgage Pass-Through Certificates 2012-LC4 XA IO† | 2.078% | #(k) | 12/10/2044 | 17,620 | 849 | |||||||
| Commercial Mortgage Pass-Through Certificates 2012-LTRT A1† | 2.15% | 10/5/2030 | 4,971 | 4,968,608 | ||||||||
| Commercial Mortgage Pass-Through Certificates 2013-CR12 A3 | 3.765% | 10/10/2046 | 16,558 | 17,092,697 | ||||||||
| Commercial Mortgage Pass-Through Certificates 2013-CR6 A4 | 3.101% | 3/10/2046 | 4,850 | 4,910,200 | ||||||||
| Commercial Mortgage Pass-Through Certificates 2013-CR7 XA IO | 1.32% | #(k) | 3/10/2046 | 126,818 | 1,488,332 | |||||||
| Commercial Mortgage Pass-Through Certificates 2013-CR8 XA IO | 0.426% | #(k) | 6/10/2046 | 345,586 | 1,277,356 | |||||||
| Commercial Mortgage Pass-Through Certificates 2013-GAM A2† | 3.367% | 2/10/2028 | 13,201 | 13,128,872 | ||||||||
| Commercial Mortgage Pass-Through Certificates 2013-SFS A1† | 1.873% | 4/12/2035 | 6,408 | 6,425,715 | ||||||||
| Commercial Mortgage Pass-Through Certificates 2013-WWP XB IO† | 0.389% | #(k) | 3/10/2031 | 265,903 | 816,109 | |||||||
| Commercial Mortgage Pass-Through Certificates 2014-CR17 A5 | 3.977% | 5/10/2047 | 7,751 | 8,222,180 | ||||||||
| Commercial Mortgage Pass-Through Certificates 2014-CR19 A4 | 3.532% | 8/10/2047 | 12,771 | 13,422,728 | ||||||||
| Commercial Mortgage Pass-Through Certificates 2014-CR19 A5 | 3.796% | 8/10/2047 | 10,150 | 10,757,896 | ||||||||
| Commercial Mortgage Pass-Through Certificates 2014-CR19 XA IO | 1.111% | #(k) | 8/10/2047 | 73,074 | 1,538,832 | |||||||
| Commercial Mortgage Pass-Through Certificates 2014-CR21 A3 | 3.528% | 12/10/2047 | 4,568 | 4,771,268 | ||||||||
| See Notes to Financial Statements. | 361 |
Schedule of Investments (continued)
SHORT DURATION INCOME FUND November 30, 2021
| Investments | Interest Rate | Maturity Date | Principal Amount (000) | Fair Value | ||||||||
| NON-AGENCY COMMERCIAL MORTGAGE-BACKED SECURITIES (continued) | ||||||||||||
| Commercial Mortgage Pass-Through Certificates 2014-CR21 XA IO | 1.001% | #(k) | 12/10/2047 | $ | 101,913 | $ | 2,187,890 | |||||
| Commercial Mortgage Pass-Through Certificates 2014-LC17 XA IO | 0.857% | #(k) | 10/10/2047 | 93,184 | 1,560,601 | |||||||
| Commercial Mortgage Pass-Through Certificates 2014-UBS3 A3 | 3.546% | 6/10/2047 | 5,798 | 5,995,457 | ||||||||
| Commercial Mortgage Pass-Through Certificates 2014-UBS3 A4 | 3.819% | 6/10/2047 | 13,342 | 14,105,125 | ||||||||
| Commercial Mortgage Pass-Through Certificates 2014-UBS5 A4 | 3.838% | 9/10/2047 | 25,610 | 27,160,747 | ||||||||
| Commercial Mortgage Pass-Through Certificates 2014-UBS5 XA IO | 1.012% | #(k) | 9/10/2047 | 191,542 | 3,726,623 | |||||||
| Commercial Mortgage Pass-Through Certificates 2014-UBS6 A5 | 3.644% | 12/10/2047 | 16,942 | 17,933,033 | ||||||||
| Commercial Mortgage Pass-Through Certificates 2015-DC1 A5 | 3.35% | 2/10/2048 | 33,734 | 35,526,011 | ||||||||
| Commercial Mortgage Pass-Through Certificates 2015-LC21 A4 | 3.708% | 7/10/2048 | 17,723 | 18,985,478 | ||||||||
| Commercial Mortgage Pass-Through Certificates 2015-PC1 A5 | 3.902% | 7/10/2050 | 45,504 | 48,838,806 | ||||||||
| Commercial Mortgage Pass-Through Certificates 2015-PC1 XA IO† | 0.61% | #(k) | 7/10/2050 | 144,319 | 1,657,371 | |||||||
| Commercial Mortgage Pass-Through Certificates 2016-CD1 XA IO | 1.524% | #(k) | 8/10/2049 | 106,010 | 5,492,812 | |||||||
| Commercial Mortgage Pass-Through Certificates 2016-DC2 ASB | 3.55% | 2/10/2049 | 4,351 | 4,550,736 | ||||||||
| Commercial Mortgage Pass-Through Certificates 2020-SBX A† | 1.67% | 1/10/2038 | 11,094 | 11,076,608 | ||||||||
| Credit Suisse Commercial Mortgage Securities Corp. 2019-SKLZ A† | 1.34% (1 Mo. LIBOR + 1.25% | )# | 1/15/2034 | 1,326 | 1,334,446 | |||||||
| Credit Suisse Commercial Mortgage Securities Corp. 2019-SKLZ B† | 1.99% (1 Mo. LIBOR + 1.90% | )# | 1/15/2034 | 26,960 | 26,843,894 | |||||||
| Credit Suisse Commercial Mortgage Securities Corp. 2019-SKLZ C† | 2.84% (1 Mo. LIBOR + 2.75% | )# | 1/15/2034 | 17,520 | 17,439,865 | |||||||
| Credit Suisse Mortgage Capital Certificates 2016-C6 XA IO | 2.031% | #(k) | 1/15/2049 | 133,887 | 9,191,178 | |||||||
| Credit Suisse Mortgage Capital Certificates 2017-MOON A† | 3.197% | 7/10/2034 | 22,524 | 22,686,011 | ||||||||
| Credit Suisse Mortgage Capital Certificates 2017-MOON B† | 3.303% | #(k) | 7/10/2034 | 8,000 | 8,044,666 | |||||||
| 362 | See Notes to Financial Statements. |
Schedule of Investments (continued)
SHORT DURATION INCOME FUND November 30, 2021
| Investments | Interest Rate | Maturity Date | Principal Amount (000) | Fair Value | ||||||||
| NON-AGENCY COMMERCIAL MORTGAGE-BACKED SECURITIES (continued) | ||||||||||||
| Credit Suisse Mortgage Capital Certificates 2019-ICE4 A† | 1.07% (1 Mo. LIBOR + .98% | )# | 5/15/2036 | $ | 47,265 | $ | 47,320,215 | |||||
| Credit Suisse Mortgage Capital Certificates 2020-AFC1 A1† | 2.24% | #(k) | 2/25/2050 | 33,979 | 34,133,226 | |||||||
| Credit Suisse Mortgage Capital Certificates 2020-NQM1 A1† | 1.208% | # | 5/25/2065 | 24,495 | 24,479,074 | |||||||
| Credit Suisse Mortgage Capital Certificates 2020-SPT1 A1† | 1.616% | 4/25/2065 | 24,912 | 24,978,929 | ||||||||
| Credit Suisse Mortgage Capital Certificates Trust 2014-USA A1† | 3.304% | 9/15/2037 | 8,931 | 9,251,621 | ||||||||
| Credit Suisse Mortgage Capital Certificates Trust 2014-USA X1 IO† | 0.686% | #(k) | 9/15/2037 | 113,022 | 1,996,267 | |||||||
| Credit Suisse Mortgage Capital Certificates Trust 2017-PFHP A† | 1.04% (1 Mo. LIBOR + .95% | )# | 12/15/2030 | 18,561 | 18,569,486 | |||||||
| Credit Suisse Mortgage Capital Certificates Trust 2021-ADV A† | 1.49% (1 Mo. LIBOR + 1.40% | )# | 7/15/2038 | 40,940 | 41,013,966 | |||||||
| Credit Suisse Mortgage Capital Certificates Trust 2021-AFC1 A1† | 0.83% | #(k) | 3/25/2056 | 28,431 | 28,176,423 | |||||||
| Credit Suisse Mortgage Capital Certificates Trust 2021-BPNY A† | 3.804% (1 Mo. LIBOR + 3.71% | )# | 8/15/2023 | 64,750 | 64,674,042 | |||||||
| Credit Suisse Mortgage Capital Certificates Trust 2021-INV1 A11† | 0.849% (1 Mo. SOFR + .80% | )# | 7/25/2056 | 14,950 | 14,980,787 | |||||||
| Credit Suisse Mortgage Capital Certificates Trust 2021-INV1 A15† | 2.50% | #(k) | 7/25/2056 | 17,501 | 17,593,420 | |||||||
| Credit Suisse Mortgage Capital Certificates Trust 2021-NQM1 A1† | 0.809% | #(k) | 5/25/2065 | 24,154 | 24,096,690 | |||||||
| Credit Suisse Mortgage Capital Certificates Trust 2021-NQM3 A1† | 1.015% | #(k) | 4/25/2066 | 39,148 | 38,871,500 | |||||||
| Credit Suisse Mortgage Capital Certificates Trust 2021-NQM5 A1† | 0.938% | #(k) | 5/25/2066 | 17,188 | 16,983,910 | |||||||
| CS Master Trust 2021-AHP A† | 4.449% (1 Mo. LIBOR + 3.95% | )# | 4/15/2025 | 83,500 | 83,748,417 | (a) | ||||||
| CS Master Trust 2021-BLUF A† | 4.527% (1 Mo. LIBOR + 4.18% | )# | 4/15/2023 | 47,600 | 48,064,386 | (a) | ||||||
| CS Master Trust 2021-BLUF A | 4.15% | 8/15/2023 | 62,700 | 62,900,853 | ||||||||
| CSAIL Commercial Mortgage Trust 2016-C7 A5 | 3.502% | 11/15/2049 | 26,778 | 28,745,142 | ||||||||
| CSAIL Commercial Mortgage Trust 2016-C7 XA IO | 1.09% | #(k) | 11/15/2049 | 209,573 | 7,681,733 | |||||||
| CSAIL Commercial Mortgage Trust 2018-C14 A2 | 4.261% | 11/15/2051 | 16,081 | 16,849,378 | ||||||||
| See Notes to Financial Statements. | 363 |
Schedule of Investments (continued)
SHORT DURATION INCOME FUND November 30, 2021
| Investments | Interest Rate | Maturity Date | Principal Amount (000) | Fair Value | ||||||||
| NON-AGENCY COMMERCIAL MORTGAGE-BACKED SECURITIES (continued) | ||||||||||||
| CSMC 2021-NQM6 A1† | 1.174% | #(k) | 7/25/2066 | $ | 48,666 | $ | 48,331,312 | |||||
| CSMC 2021-NQM7 A1† | 1.756% | #(k) | 10/25/2066 | 57,227 | 57,029,512 | |||||||
| CSMC 2021-NQM7 A3† | 2.064% | #(k) | 10/25/2066 | 23,089 | 23,009,476 | |||||||
| CSMC 2021-SRDC A† | 4.235% (1 Mo. LIBOR + 4.14% | )# | 11/15/2023 | 25,000 | 25,031,225 | |||||||
| DBGS Mortgage Trust 2018 5BP A† | 0.885% (1 Mo. LIBOR + .80% | )# | 6/15/2033 | 38,755 | 38,737,258 | |||||||
| DBGS Mortgage Trust 2018-BIOD A† | 0.893% (1 Mo. LIBOR + .80% | )# | 5/15/2035 | 24,942 | 24,949,066 | |||||||
| DBGS Mortgage Trust 2021-W52 A† | 1.486% (1 Mo. LIBOR + 1.39% | )# | 10/15/2036 | 86,290 | 87,225,694 | |||||||
| DBJPM Mortgage Trust 2016-C3 XA IO | 1.584% | #(k) | 8/10/2049 | 188,076 | 10,657,869 | |||||||
| DBUBS Mortgage Trust 2011-LC3A PM4† | 5.268% | #(k) | 5/10/2044 | 9,200 | 7,059,390 | (a) | ||||||
| DBWF Mortgage Trust 2015-LCM A1† | 2.998% | 6/10/2034 | 11,221 | 11,319,008 | ||||||||
| DBWF Mortgage Trust 2015-LCM XA† | 0.537% | #(k) | 6/10/2034 | 22,173 | 233,037 | |||||||
| DBWF Mortgage Trust 2018-AMXP A† | 3.873% | #(k) | 5/5/2035 | 268,200 | 268,454,361 | |||||||
| DBWF Mortgage Trust 2018-AMXP B† | 4.122% | #(k) | 5/5/2035 | 53,868 | 53,916,664 | |||||||
| DBWF Mortgage Trust 2018-AMXP C† | 3.956% | #(k) | 5/5/2035 | 49,438 | 49,388,809 | |||||||
| DBWF Mortgage Trust 2018-AMXP D† | 3.917% | #(k) | 5/5/2035 | 6,780 | 6,739,026 | |||||||
| DBWF Mortgage Trust 2018-GLKS A† | 1.119% (1 Mo. LIBOR + 1.03% | )# | 12/19/2030 | 24,067 | 24,104,204 | |||||||
| Deephaven Residential Mortgage Trust 2020-1 A1† | 2.339% | #(k) | 1/25/2060 | 17,419 | 17,459,606 | |||||||
| Deephaven Residential Mortgage Trust 2021-3 A1† | 1.194% | #(k) | 8/25/2066 | 100,747 | 100,267,455 | |||||||
| Eleven Madison Mortgage Trust 2015-11MD A† | 3.673% | #(k) | 9/10/2035 | 22,689 | 24,048,148 | |||||||
| Ellington Financial Mortgage Trust 2020-2 A1† | 1.178% | #(k) | 10/25/2065 | 18,451 | 18,486,337 | |||||||
| Ellington Financial Mortgage Trust 2021-1 A1† | 0.797% | #(k) | 2/25/2066 | 8,897 | 8,844,293 | |||||||
| Ellington Financial Mortgage Trust 2021-3 A1† | 1.241% | #(k) | 9/25/2066 | 29,007 | 28,808,299 | |||||||
| ELP Commercial Mortgage Trust 2021-ELP D† | 1.619% (1 Mo. LIBOR + 1.52% | )# | 11/15/2038 | 46,730 | 46,607,212 | |||||||
| EQUS Mortgage Trust 2021-EQAZ B† | 1.19% (1 Mo. LIBOR + 1.10% | )# | 10/15/2038 | 26,031 | 25,932,184 | |||||||
| EQUS Mortgage Trust 2021-EQAZ C† | 1.44% (1 Mo. LIBOR + 1.35% | )# | 10/15/2038 | 4,450 | 4,433,694 | |||||||
| EQUS Mortgage Trust 2021-EQAZ D† | 1.74% (1 Mo. LIBOR + 1.65% | )# | 10/15/2038 | 36,402 | 36,275,620 | |||||||
| Fannie Mae Connecticut Avenue Securities 2021-R02 2M1†(b) | 0.95% (1 Mo. SOFR + .09% | )# | 11/25/2041 | 40,200 | 40,262,792 | |||||||
| 364 | See Notes to Financial Statements. |
Schedule of Investments (continued)
SHORT DURATION INCOME FUND November 30, 2021
| Investments | Interest Rate | Maturity Date | Principal Amount (000) | Fair Value | ||||||||
| NON-AGENCY COMMERCIAL MORTGAGE-BACKED SECURITIES (continued) | ||||||||||||
| Fannie Mae Connecticut Avenue Securities 2021-R02 2M2†(b) | 2.05% (1 Mo. SOFR + 2.00% | )# | 11/25/2041 | $ | 18,765 | $ | 18,800,184 | |||||
| Fontainebleau Miami Beach Trust 2019-FBLU A† | 3.144% | 12/10/2036 | 53,309 | 54,917,545 | ||||||||
| Fontainebleau Miami Beach Trust 2019-FBLU B† | 3.447% | 12/10/2036 | 16,564 | 17,003,365 | ||||||||
| Fontainebleau Miami Beach Trust 2019-FBLU XA IO† | 0.774% | #(k) | 12/10/2036 | 367,400 | 7,125,723 | |||||||
| Freddie Mac STACR REMIC Trust 2021-DNA6 M2† | 1.55% (1 Mo. SOFR + 1.50% | )# | 10/25/2041 | 24,280 | 24,341,142 | |||||||
| Freddie Mac STACR REMIC Trust 2021-HQA3 M1† | 0.90% (1 Mo. SOFR + .85% | )# | 9/25/2041 | 75,450 | 75,527,978 | |||||||
| Freddie Mac Structured Agency Credit Risk Debt Notes 2021-DNA7 M2† | 1.848% (1 Mo. SOFR + 1.80% | )# | 11/25/2041 | 30,480 | 30,575,110 | |||||||
| GCAT Trust 2020-NQM1 A1† | 2.247% | 1/25/2060 | 9,945 | 9,976,610 | ||||||||
| Great Wolf Trust 2019-WOLF B† | 1.424% (1 Mo. LIBOR + 1.33% | )# | 12/15/2036 | 38,043 | 37,853,778 | |||||||
| Great Wolf Trust 2019-WOLF C† | 1.723% (1 Mo. LIBOR + 1.63% | )# | 12/15/2036 | 66,196 | 65,793,130 | |||||||
| Great Wolf Trust 2019-WOLF D† | 2.023% (1 Mo. LIBOR + 1.93% | )# | 12/15/2036 | 11,248 | 11,140,222 | |||||||
| Great Wolf Trust 2019-WOLF E† | 2.822% (1 Mo. LIBOR + 2.73% | )# | 12/15/2036 | 13,667 | 13,257,690 | |||||||
| GS Mortgage Securities Corp. II 2012-BWTR A† | 2.954% | 11/5/2034 | 9,225 | 9,320,913 | ||||||||
| GS Mortgage Securities Corp. II 2012-TMSQ A† | 3.007% | 12/10/2030 | 43,122 | 43,672,953 | ||||||||
| GS Mortgage Securities Corp. II 2012-TMSQ C† | 3.573% | #(k) | 12/10/2030 | 14,494 | 14,254,174 | |||||||
| GS Mortgage Securities Corp. II 2021-ARDN A† | 1.35% (1 Mo. LIBOR + 1.25% | )# | 11/15/2026 | 119,190 | 118,235,717 | |||||||
| GS Mortgage Securities Corp. Trust 2017-GPTX A† | 2.856% | 5/10/2034 | 42,391 | 42,286,085 | ||||||||
| GS Mortgage Securities Corp. Trust 2017-GPTX B† | 3.104% | 5/10/2034 | 31,044 | 30,693,082 | ||||||||
| GS Mortgage Securities Corp. Trust 2017-SLP A† | 3.419% | 10/10/2032 | 12,601 | 12,810,320 | ||||||||
| GS Mortgage Securities Corp. Trust 2017-STAY A† | 1.44% (1 Mo. LIBOR + 1.35% | )# | 7/15/2032 | 35,859 | 35,927,947 | |||||||
| GS Mortgage Securities Corp. Trust 2017-STAY B† | 1.69% (1 Mo. LIBOR + 1.60% | )# | 7/15/2032 | 16,811 | 16,863,107 | |||||||
| GS Mortgage Securities Corp. Trust 2017-STAY C† | 1.94% (1 Mo. LIBOR + 1.85% | )# | 7/15/2032 | 15,228 | 15,251,731 | |||||||
| GS Mortgage Securities Corp. Trust 2018-RIVR A† | 1.04% (1 Mo. LIBOR + .95% | )# | 7/15/2035 | 47,601 | 47,313,201 | |||||||
| GS Mortgage Securities Corp. Trust 2019-70P A† | 1.09% (1 Mo. LIBOR + 1.00% | )# | 10/15/2036 | 70,000 | 69,768,293 | |||||||
| See Notes to Financial Statements. | 365 |
Schedule of Investments (continued)
SHORT DURATION INCOME FUND November 30, 2021
| Investments | Interest Rate | Maturity Date | Principal Amount (000) | Fair Value | ||||||||
| NON-AGENCY COMMERCIAL MORTGAGE-BACKED SECURITIES (continued) | ||||||||||||
| GS Mortgage Securities Corp. Trust 2019-70P B† | 1.41% (1 Mo. LIBOR + 1.32% | )# | 10/15/2036 | $ | 31,298 | $ | 30,715,150 | |||||
| GS Mortgage Securities Corp. Trust 2019-BOCA B† | 1.59% (1 Mo. LIBOR + 1.50% | )# | 6/15/2038 | 18,625 | 18,610,919 | |||||||
| GS Mortgage Securities Corp. Trust 2019-SMP A† | 1.24% (1 Mo. LIBOR + 1.15% | )# | 8/15/2032 | 22,000 | 21,996,284 | |||||||
| GS Mortgage Securities Corp. Trust 2021-RNT2 A† | 3.35% (1 Mo. LIBOR + 3.10% | )# | 11/21/2023 | 84,750 | 85,111,628 | (a) | ||||||
| GS Mortgage Securities Corp. Trust 2021-ROSS A† | 1.24% (1 Mo. LIBOR + 1.15% | )# | 5/15/2026 | 47,760 | 47,888,981 | |||||||
| GS Mortgage Securities Corp. Trust 2021-ROSS G† | 4.74% (1 Mo. LIBOR + 4.65% | )# | 5/15/2026 | 15,000 | 15,083,640 | |||||||
| GS Mortgage Securities Corp. Trust 2021-ROSS H† | 5.99% (1 Mo. LIBOR + 5.90% | )# | 5/15/2026 | 19,706 | 19,875,129 | |||||||
| GS Mortgage Securities Trust 2011-GC5 B† | 5.302% | #(k) | 8/10/2044 | 39,535 | 39,634,771 | |||||||
| GS Mortgage Securities Trust 2012-GCJ7 B | 4.74% | 5/10/2045 | 11,331 | 11,467,575 | ||||||||
| GS Mortgage Securities Trust 2012-GCJ9 XA IO | 2.076% | #(k) | 11/10/2045 | 82,001 | 764,123 | |||||||
| GS Mortgage Securities Trust 2012-GCJ9 XB IO† | 0.441% | #(k) | 11/10/2045 | 89,303 | 206,432 | |||||||
| GS Mortgage Securities Trust 2013-G1 A1† | 2.059% | 4/10/2031 | 2,986 | 2,998,606 | ||||||||
| GS Mortgage Securities Trust 2013-GC12 B | 3.777% | #(k) | 6/10/2046 | 5,809 | 5,975,589 | |||||||
| GS Mortgage Securities Trust 2013-GC12 XA IO | 1.531% | #(k) | 6/10/2046 | 407,992 | 5,931,553 | |||||||
| GS Mortgage Securities Trust 2013-GC14 A5 | 4.243% | 8/10/2046 | 10,000 | 10,467,930 | ||||||||
| GS Mortgage Securities Trust 2014-GC18 A4 | 4.074% | 1/10/2047 | 13,252 | 13,920,585 | ||||||||
| GS Mortgage Securities Trust 2014-GC26 XA IO | 1.105% | #(k) | 11/10/2047 | 85,130 | 1,971,001 | |||||||
| GS Mortgage Securities Trust 2015-GC34 A4 | 3.506% | 10/10/2048 | 36,577 | 38,963,865 | ||||||||
| GS Mortgage Securities Trust 2015-GS1 XA IO | 0.908% | #(k) | 11/10/2048 | 91,413 | 2,424,687 | |||||||
| GS Mortgage Securities Trust 2016-GS2 A4 IO | 3.05% | 5/10/2049 | 28,917 | 30,398,325 | ||||||||
| GS Mortgage Securities Trust 2016-GS2 XA | 1.895% | #(k) | 5/10/2049 | 164,566 | 10,525,476 | |||||||
| GS Mortgage Securities Trust 2020-GC45 A2 | 2.898% | 2/13/2053 | 15,000 | 15,530,199 | ||||||||
| Hawaii Hotel Trust 2019-MAUI B† | 1.54% (1 Mo. LIBOR + 1.45% | )# | 5/15/2038 | 35,079 | 35,005,334 | |||||||
| Hilton USA Trust 2016-SFP B† | 3.323% | 11/5/2035 | 4,745 | 4,747,240 | ||||||||
| HMH Trust 2017-NSS A† | 3.062% | 7/5/2031 | 33,687 | 33,745,595 | ||||||||
| HMH Trust 2017-NSS B† | 3.343% | 7/5/2031 | 21,685 | 21,270,264 | ||||||||
| HMH Trust 2017-NSS C† | 3.787% | 7/5/2031 | 16,116 | 15,823,586 | ||||||||
| HMH Trust 2017-NSS D† | 4.723% | 7/5/2031 | 21,309 | 20,999,086 | ||||||||
| HONO Mortgage Trust 2021-LULU A† | 1.24% (1 Mo. LIBOR + 1.15% | )# | 10/15/2036 | 54,660 | 54,754,917 | |||||||
| Houston Galleria Mall Trust 2015-HGLR A1A2† | 3.087% | 3/5/2037 | 54,825 | 55,914,088 | ||||||||
| Hudsons Bay Simon JV Trust 2015-HB10 XA10 IO† | 1.474% | #(k) | 8/5/2034 | 150,785 | 6,765,723 | |||||||
| 366 | See Notes to Financial Statements. |
Schedule of Investments (continued)
SHORT DURATION INCOME FUND November 30, 2021
| Investments | Interest Rate | Maturity Date | Principal Amount (000) | Fair Value | ||||||||
| NON-AGENCY COMMERCIAL MORTGAGE-BACKED SECURITIES (continued) | ||||||||||||
| Hudsons Bay Simon JV Trust 2015-HB7 A7† | 3.914% | 8/5/2034 | $ | 65,851 | $ | 63,966,753 | ||||||
| Hudsons Bay Simon JV Trust 2015-HB7 B7† | 4.666% | 8/5/2034 | 5,000 | 4,543,237 | ||||||||
| Hudsons Bay Simon JV Trust 2015-HB7 D7† | 5.331% | #(k) | 8/5/2034 | 5,000 | 3,802,097 | |||||||
| Hudsons Bay Simon JV Trust 2015-HB7 XA7 IO† | 1.417% | #(k) | 8/5/2034 | 171,661 | 1,119,230 | |||||||
| IMT Trust 2017-APTS AFX† | 3.478% | 6/15/2034 | 1,380 | 1,438,720 | ||||||||
| Irvine Core Office Trust 2013-IRV A1† | 2.068% | 5/15/2048 | 11,674 | 11,784,797 | ||||||||
| Irvine Core Office Trust 2013-IRV A2† | 3.279% | #(k) | 5/15/2048 | 40,462 | 41,628,896 | |||||||
| Irvine Core Office Trust 2013-IRV XA IO† | 1.211% | #(k) | 5/15/2048 | 23,789 | 185,675 | |||||||
| JPMBB Commercial Mortgage Securities Trust 2015-C30 XA IO | 0.638% | #(k) | 7/15/2048 | 123,478 | 1,960,296 | |||||||
| JPMDB Commercial Mortgage Securities Trust 2020-COR7 A2 | 2.215% | 5/13/2053 | 14,750 | 15,018,780 | ||||||||
| JPMorgan Chase Commercial Mortgage Securities Corp Series 2019-MARG A† | 1.19% (1 Mo. LIBOR + 1.10% | )# | 5/15/2034 | 23,269 | 23,275,269 | |||||||
| JPMorgan Chase Commercial Mortgage Securities Corp Series 2019-MARG B† | 1.49% (1 Mo. LIBOR + 1.40% | )# | 5/15/2034 | 11,000 | 11,005,830 | |||||||
| JPMorgan Chase Commercial Mortgage Securities Corp Series 2019-MARG C† | 1.80% (1 Mo. LIBOR + 1.71% | )# | 5/15/2034 | 7,900 | 7,867,847 | |||||||
| JPMorgan Chase Commercial Mortgage Securities Trust | 1.839% | 9/15/2029 | 52,487 | 52,269,440 | ||||||||
| JPMorgan Chase Commercial Mortgage Securities Trust | 2.739% | 9/15/2029 | 15,299 | 15,230,949 | ||||||||
| JPMorgan Chase Commercial Mortgage Securities Trust | 3.439% | 9/15/2029 | 11,384 | 11,313,933 | ||||||||
| JPMorgan Chase Commercial Mortgage Securities Trust | 4.44% | 9/15/2029 | 14,048 | 13,936,827 | ||||||||
| JPMorgan Chase Commercial Mortgage Securities Trust | 5.44% | 9/15/2029 | 8,338 | 8,304,404 | (a) | |||||||
| JPMorgan Chase Commercial Mortgage Securities Trust 2012-C6 B | 4.819% | #(k) | 5/15/2045 | 9,466 | 9,566,826 | |||||||
| JPMorgan Chase Commercial Mortgage Securities Trust 2012-WLDN A† | 3.905% | 5/5/2030 | 69,762 | 59,901,981 | ||||||||
| JPMorgan Chase Commercial Mortgage Securities Trust 2013-C10 XA IO | 1.076% | #(k) | 12/15/2047 | 240,710 | 1,891,426 | |||||||
| JPMorgan Chase Commercial Mortgage Securities Trust 2013-C12 XA IO | 0.562% | #(k) | 7/15/2045 | 130,298 | 660,506 | |||||||
| JPMorgan Chase Commercial Mortgage Securities Trust 2013-LC11 XA IO | 1.369% | #(k) | 4/15/2046 | 90,605 | 1,106,662 | |||||||
| See Notes to Financial Statements. | 367 |
Schedule of Investments (continued)
SHORT DURATION INCOME FUND November 30, 2021
| Investments | Interest Rate | Maturity Date | Principal Amount (000) | Fair Value | ||||||||
| NON-AGENCY COMMERCIAL MORTGAGE-BACKED SECURITIES (continued) | ||||||||||||
| JPMorgan Chase Commercial Mortgage Securities Trust 2014-C24 XA IO | 1.011% | #(k) | 11/15/2047 | $ | 91,569 | $ | 1,787,781 | |||||
| JPMorgan Chase Commercial Mortgage Securities Trust 2014-C25 XA IO | 0.979% | #(k) | 11/15/2047 | 160,161 | 3,361,531 | |||||||
| JPMorgan Chase Commercial Mortgage Securities Trust 2014-C26 XA IO | 1.099% | #(k) | 1/15/2048 | 145,933 | 3,477,095 | |||||||
| JPMorgan Chase Commercial Mortgage Securities Trust 2014-DSTY A† | 3.429% | 6/10/2027 | 163,798 | 92,545,926 | ||||||||
| JPMorgan Chase Commercial Mortgage Securities Trust 2014-DSTY B† | 3.771% | 6/10/2027 | 20,772 | 6,106,968 | ||||||||
| JPMorgan Chase Commercial Mortgage Securities Trust 2014-DSTY C† | 3.931% | #(k) | 6/10/2027 | 14,352 | 2,411,136 | |||||||
| JPMorgan Chase Commercial Mortgage Securities Trust 2014-DSTY D† | 3.931% | #(k) | 6/10/2027 | 25,795 | 1,760,535 | |||||||
| JPMorgan Chase Commercial Mortgage Securities Trust 2014-DSTY XA IO† | 0.503% | #(k) | 6/10/2027 | 102,274 | 4,091 | |||||||
| JPMorgan Chase Commercial Mortgage Securities Trust 2014-DSTY XB IO† | 0.16% | #(k) | 6/10/2027 | 45,476 | 455 | |||||||
| JPMorgan Chase Commercial Mortgage Securities Trust 2015-C29 XA IO | 0.759% | #(k) | 5/15/2048 | 57,365 | 1,000,883 | |||||||
| JPMorgan Chase Commercial Mortgage Securities Trust 2016-JP4 XA IO | 0.765% | #(k) | 12/15/2049 | 142,780 | 3,320,050 | |||||||
| JPMorgan Chase Commercial Mortgage Securities Trust 2016-NINE A† | 2.949% | #(k) | 9/6/2038 | 10,000 | 10,415,267 | |||||||
| JPMorgan Chase Commercial Mortgage Securities Trust 2017-JP7 A3 | 3.379% | 9/15/2050 | 10,000 | 10,348,198 | ||||||||
| JPMorgan Chase Commercial Mortgage Securities Trust 2017-JP7 XA IO | 1.184% | #(k) | 9/15/2050 | 287,117 | 12,230,891 | |||||||
| JPMorgan Chase Commercial Mortgage Securities Trust 2017-MARK A† | 3.392% | 6/5/2032 | 25,713 | 25,841,470 | ||||||||
| JPMorgan Chase Commercial Mortgage Securities Trust 2017-MARK B† | 3.795% | 6/5/2032 | 21,137 | 21,130,080 | ||||||||
| JPMorgan Chase Commercial Mortgage Securities Trust 2017-MARK C† | 4.171% | #(k) | 6/5/2032 | 15,721 | 15,630,917 | |||||||
| JPMorgan Chase Commercial Mortgage Securities Trust 2018-BCON A† | 3.735% | 1/5/2031 | 27,681 | 28,383,109 | ||||||||
| JPMorgan Chase Commercial Mortgage Securities Trust 2018-LAQ B† | 1.39% (1 Mo. LIBOR + 1.30% | )# | 6/15/2032 | 29,356 | 29,362,670 | |||||||
| JPMorgan Chase Commercial Mortgage Securities Trust 2018-LAQ C† | 1.69% (1 Mo. LIBOR + 1.60% | )# | 6/15/2032 | 22,978 | 22,977,572 | |||||||
| 368 | See Notes to Financial Statements. |
Schedule of Investments (continued)
SHORT DURATION INCOME FUND November 30, 2021
| Investments | Interest Rate | Maturity Date | Principal Amount (000) | Fair Value | ||||||||
| NON-AGENCY COMMERCIAL MORTGAGE-BACKED SECURITIES (continued) | ||||||||||||
| JPMorgan Chase Commercial Mortgage Securities Trust 2018-MINN A† | 2.27% (1 Mo. LIBOR + 1.02% | )# | 11/15/2035 | $ | 13,730 | $ | 13,788,535 | |||||
| JPMorgan Chase Commercial Mortgage Securities Trust 2018-MINN B† | 2.60% (1 Mo. LIBOR + 1.35% | )# | 11/15/2035 | 10,053 | 9,521,146 | |||||||
| JPMorgan Chase Commercial Mortgage Securities Trust 2018-PTC A† | 1.54% (1 Mo. LIBOR + 1.45% | )# | 4/15/2031 | 25,048 | 24,783,122 | |||||||
| JPMorgan Chase Commercial Mortgage Securities Trust 2018-PTC B† | 2.24% (1 Mo. LIBOR + 2.15% | )# | 4/15/2031 | 14,359 | 14,237,599 | |||||||
| JPMorgan Chase Commercial Mortgage Securities Trust 2018-PTC C† | 2.64% (1 Mo. LIBOR + 2.55% | )# | 4/15/2031 | 10,408 | 10,333,909 | |||||||
| JPMorgan Chase Commercial Mortgage Securities Trust 2018-WPT AFL† | 1.286% (1 Mo. LIBOR + 1.20% | )# | 7/5/2033 | 31,273 | 31,320,842 | |||||||
| JPMorgan Chase Commercial Mortgage Securities Trust 2018-WPT AFX† | 4.248% | 7/5/2033 | 102,017 | 106,420,033 | ||||||||
| JPMorgan Chase Commercial Mortgage Securities Trust 2018-WPT CFL† | 1.986% (1 Mo. LIBOR + 1.90% | )# | 7/5/2033 | 9,118 | 9,143,481 | |||||||
| JPMorgan Chase Commercial Mortgage Securities Trust 2018-WPT CFX† | 4.95% | 7/5/2033 | 31,569 | 32,782,440 | ||||||||
| JPMorgan Chase Commercial Mortgage Securities Trust 2018-WPT XAFX IO† | 1.295% | #(k) | 7/5/2033 | 155,900 | 2,424,245 | |||||||
| JPMorgan Chase Commercial Mortgage Securities Trust 2019-ICON A† | 3.884% | 1/5/2034 | 32,965 | 34,059,952 | ||||||||
| JPMorgan Chase Commercial Mortgage Securities Trust 2019-ICON B† | 4.235% | 1/5/2034 | 13,737 | 13,619,961 | (a) | |||||||
| JPMorgan Chase Commercial Mortgage Securities Trust 2019-ICON C† | 4.536% | 1/5/2034 | 12,800 | 12,631,040 | (a) | |||||||
| JPMorgan Chase Commercial Mortgage Securities Trust 2019-UES A† | 3.81% | 5/5/2032 | 6,460 | 6,496,693 | ||||||||
| JPMorgan Chase Commercial Mortgage Securities Trust 2020-ACE A† | 3.287% | 1/10/2037 | 136,320 | 139,538,733 | ||||||||
| JPMorgan Chase Commercial Mortgage Securities Trust 2020-ACE B† | 3.64% | 1/10/2037 | 29,970 | 30,386,077 | ||||||||
| JPMorgan Chase Commercial Mortgage Securities Trust 2020-ACE C† | 3.817% | #(k) | 1/10/2037 | 10,000 | 9,557,847 | |||||||
| See Notes to Financial Statements. | 369 |
Schedule of Investments (continued)
SHORT DURATION INCOME FUND November 30, 2021
| Investments | Interest Rate | Maturity Date | Principal Amount (000) | Fair Value | ||||||||
| NON-AGENCY COMMERCIAL MORTGAGE-BACKED SECURITIES (continued) | ||||||||||||
| JPMorgan Chase Commercial Mortgage Securities Trust 2021-1440 A† | 1.39% (1 Mo. LIBOR + 1.30% | )# | 3/15/2036 | $ | 35,000 | $ | 34,992,034 | |||||
| JPMorgan Chase Commercial Mortgage Securities Trust 2021-BOLT A† | 1.39% (1 Mo. LIBOR + 1.30% | )# | 8/15/2033 | 50,480 | 50,543,100 | |||||||
| JPMorgan Chase Commercial Mortgage Securities Trust 2021-BOLT B† | 2.54% (1 Mo. LIBOR + 2.45% | )# | 8/15/2033 | 41,740 | 41,792,175 | |||||||
| JPMorgan Chase Commercial Mortgage Securities Trust 2021-BOLT C† | 4.04% (1 Mo. LIBOR + 3.95% | )# | 8/15/2033 | 37,430 | 37,500,181 | |||||||
| JPMorgan Chase Commercial Mortgage Securities Trust 2018-MINN C† | 2.95% (1 Mo. LIBOR + 1.70% | )# | 11/15/2035 | 8,746 | 8,143,794 | (a) | ||||||
| Key Commercial Mortgage Securities Trust 2019-S2 A1† | 2.656% | 6/15/2052 | 14,193 | 14,498,868 | ||||||||
| Key Commercial Mortgage Securities Trust 2019-S2 X IO† | 1.704% | #(k) | 6/15/2052 | 129,065 | 9,932,161 | |||||||
| KIND Trust 2021-KIND A† | 1.04% (1 Mo. LIBOR + .95% | )# | 8/15/2038 | 82,500 | 82,664,315 | |||||||
| KIND Trust 2021-KIND E† | 3.34% (1 Mo. LIBOR + 3.25% | )# | 8/15/2038 | 64,200 | 64,101,594 | |||||||
| KKR Industrial Portfolio Trust 2021-KDIP A† | 0.64% (1 Mo. LIBOR + .55% | )# | 12/15/2037 | 32,807 | 32,528,260 | |||||||
| Ladder Capital Commercial Mortgage Trust 2013-GCP A1† | 3.575% | 2/15/2036 | 6,516 | 6,842,249 | ||||||||
| Life 2021-BMR Mortgage Trust 2021-BMR A† | 0.79% (1 Mo. LIBOR + .70% | )# | 3/15/2038 | 78,200 | 78,138,910 | |||||||
| LoanCore Issuer Ltd. 2019-CRE3 A† | 1.14% (1 Mo. LIBOR + 1.05% | )# | 4/15/2034 | 35,992 | 35,953,114 | |||||||
| LoanCore Issuer Ltd. 2019-CRE3 AS† | 1.46% (1 Mo. LIBOR + 1.37% | )# | 4/15/2034 | 21,868 | 21,878,081 | |||||||
| LSTAR Commercial Mortgage Trust 2016-4 XA IO† | 1.92% | #(k) | 3/10/2049 | 84,066 | 3,125,041 | |||||||
| LSTAR Commercial Mortgage Trust 2017-5 A2† | 2.776% | 3/10/2050 | 9,794 | 9,797,065 | ||||||||
| LSTAR Commercial Mortgage Trust 2017-5 A3† | 4.50% | 3/10/2050 | 72,650 | 74,912,684 | ||||||||
| LUXE Trust 2021-TRIP A† | 1.14% (1 Mo. LIBOR + 1.05% | )# | 10/15/2038 | 25,000 | 25,053,395 | |||||||
| LUXE Trust 2021-TRIP B† | 1.49% (1 Mo. LIBOR + 1.40% | )# | 10/15/2038 | 18,750 | 18,785,578 | |||||||
| LUXE Trust 2021-TRIP D† | 2.34% (1 Mo. LIBOR + 2.25% | )# | 10/15/2038 | 27,000 | 27,068,180 | |||||||
| 370 | See Notes to Financial Statements. |
Schedule of Investments (continued)
SHORT DURATION INCOME FUND November 30, 2021
| Investments | Interest Rate | Maturity Date | Principal Amount (000) | Fair Value | ||||||||
| NON-AGENCY COMMERCIAL MORTGAGE-BACKED SECURITIES (continued) | ||||||||||||
| MHC Commercial Mortgage Trust 2021-MHC A† | 0.89% (1 Mo. LIBOR + .80% | )# | 4/15/2038 | $ | 29,500 | $ | 29,474,783 | |||||
| Morgan Stanley Bank of America Merrill Lynch Trust 2012-CKSV A1† | 2.117% | 10/15/2030 | 2,881 | 2,878,967 | ||||||||
| Morgan Stanley Bank of America Merrill Lynch Trust 2012-CKSV A2† | 3.277% | 10/15/2030 | 15,315 | 15,238,122 | ||||||||
| Morgan Stanley Bank of America Merrill Lynch Trust 2013-C7 A4 | 2.918% | 2/15/2046 | 5,280 | 5,360,268 | ||||||||
| Morgan Stanley Bank of America Merrill Lynch Trust 2013-C8 A4 | 3.134% | 12/15/2048 | 9,470 | 9,642,848 | ||||||||
| Morgan Stanley Bank of America Merrill Lynch Trust 2013-C9 XA IO | 1.149% | #(k) | 5/15/2046 | 187,067 | 1,799,041 | |||||||
| Morgan Stanley Bank of America Merrill Lynch Trust 2013-C9 XB IO† | 0.394% | #(k) | 5/15/2046 | 107,177 | 547,676 | |||||||
| Morgan Stanley Bank of America Merrill Lynch Trust 2014 C19 XA IO | 1.113% | #(k) | 12/15/2047 | 105,288 | 2,473,813 | |||||||
| Morgan Stanley Bank of America Merrill Lynch Trust 2014-C17 A4 | 3.443% | 8/15/2047 | 9,208 | 9,395,294 | ||||||||
| Morgan Stanley Bank of America Merrill Lynch Trust 2016-C29 A4 | 3.325% | 5/15/2049 | 18,050 | 19,191,522 | ||||||||
| Morgan Stanley Bank of America Merrill Lynch Trust 2016-C29 XA IO | 1.695% | #(k) | 5/15/2049 | 117,833 | 6,207,582 | |||||||
| Morgan Stanley Bank of America Merrill Lynch Trust 2016-C31 XA IO | 1.462% | #(k) | 11/15/2049 | 241,372 | 12,018,099 | |||||||
| Morgan Stanley Capital I Trust 2012-C4 AS | 3.773% | 3/15/2045 | 11,383 | 11,429,275 | ||||||||
| Morgan Stanley Capital I Trust 2012-C4 XA IO† | 2.002% | #(k) | 3/15/2045 | 51,689 | 2,528 | |||||||
| Morgan Stanley Capital I Trust 2012-STAR A1† | 2.084% | 8/5/2034 | 4,134 | 4,138,751 | ||||||||
| Morgan Stanley Capital I Trust 2012-STAR A2† | 3.201% | 8/5/2034 | 11,276 | 11,298,638 | ||||||||
| Morgan Stanley Capital I Trust 2012-STAR B† | 3.451% | 8/5/2034 | 1,267 | 1,267,199 | ||||||||
| Morgan Stanley Capital I Trust 2015-420 A† | 3.727% | 10/12/2050 | 23,524 | 24,597,146 | ||||||||
| Morgan Stanley Capital I Trust 2015-UBS8 ASB | 3.626% | 12/15/2048 | 7,552 | 7,872,973 | ||||||||
| Morgan Stanley Capital I Trust 2016-UB11 XA IO | 1.634% | #(k) | 8/15/2049 | 78,038 | 4,141,275 | |||||||
| Morgan Stanley Capital I Trust 2016-UB11 XB IO | 1.054% | #(k) | 8/15/2049 | 121,223 | 4,941,198 | |||||||
| Mortgage Repurchase Agreement Financing Trust Series 2021-S1 A1† | 0.591% (1 Mo. LIBOR + .50% | )# | 9/10/2022 | 135,400 | 135,568,641 | |||||||
| Mortgage Repurchase Agreement Financing Trust Series 2021-S1 A2† | 0.591% (1 Mo. LIBOR + .50% | )# | 9/10/2022 | 6,770 | 6,778,432 | |||||||
| MRA Issuance Trust 2020-13 A† | 1.286% (1 Mo. LIBOR + 1.20% | )# | 2/15/2022 | 100,000 | 100,619,700 | (a) | ||||||
| See Notes to Financial Statements. | 371 |
Schedule of Investments (continued)
SHORT DURATION INCOME FUND November 30, 2021
| Investments | Interest Rate | Maturity Date | Principal Amount (000) | Fair Value | ||||||||
| NON-AGENCY COMMERCIAL MORTGAGE-BACKED SECURITIES (continued) | ||||||||||||
| MRA Issuance Trust 2021-4 A† | 1.286% (1 Mo. LIBOR + 1.20% | )# | 4/7/2022 | $ | 399,126 | $ | 402,313,632 | (a) | ||||
| MRA Issuance Trust 2021-4 A2† | 1.286% (1 Mo. LIBOR + 1.20% | )# | 4/7/2022 | 350,000 | 352,670,500 | (a) | ||||||
| MRA Issuance Trust 2021-8 A2X† | Zero Coupon | #(k) | 5/15/2022 | 53,500 | 53,898,896 | (a) | ||||||
| MSCG Trust 2015-ALDR A1† | 2.612% | 6/7/2035 | 12,941 | 13,141,160 | ||||||||
| Natixis Commercial Mortgage Securities Trust 2018-285M A† | 3.917% | #(k) | 11/15/2032 | 47,581 | 48,457,166 | |||||||
| Natixis Commercial Mortgage Securities Trust 2018-285M B† | 3.917% | #(k) | 11/15/2032 | 17,029 | 17,325,003 | |||||||
| New Orleans Hotel Trust 2019-HNLA A† | 1.078% (1 Mo. LIBOR + .99% | )# | 4/15/2032 | 41,812 | 41,672,486 | |||||||
| New Residential Mortgage Loan Trust 2020-NQM1 A1† | 2.464% | #(k) | 1/26/2060 | 11,532 | 11,595,060 | |||||||
| NYO Commercial Mortgage Trust 2021-1290 A† | 1.175% (1 Mo. LIBOR + 1.10% | )# | 11/15/2038 | 78,460 | 78,318,631 | |||||||
| One New York Plaza Trust 2020-1NYP A† | 1.04% (1 Mo. LIBOR + .95% | )# | 1/15/2026 | 90,000 | 89,944,587 | |||||||
| One New York Plaza Trust 2020-1NYP AJ† | 1.34% (1 Mo. LIBOR + 1.25% | )# | 1/15/2026 | 59,595 | 59,702,033 | |||||||
| Palisades Center Trust 2016-PLSD A† | 2.713% | 4/13/2033 | 6,735 | 6,259,392 | ||||||||
| Palisades Center Trust 2016-PLSD C† | 3.998% | 4/13/2033 | 40,040 | 23,464,541 | ||||||||
| Palisades Center Trust 2016-PLSD D† | 4.737% | 4/13/2033 | 34,072 | 16,337,403 | ||||||||
| PFP Ltd. 2019-5 A† | 1.061% (1 Mo. LIBOR + .97% | )# | 4/14/2036 | 5,318 | 5,302,541 | |||||||
| PFP Ltd. 2019-6 A† | 1.141% (1 Mo. LIBOR + 1.05% | )# | 4/14/2037 | 14,306 | 14,266,441 | |||||||
| PFP Ltd. 2019-6 AS† | 1.541% (1 Mo. LIBOR + 1.45% | )# | 4/14/2037 | 35,400 | 35,359,750 | |||||||
| PFP Ltd. 2019-6 B† | 1.791% (1 Mo. LIBOR + 1.70% | )# | 4/14/2037 | 36,005 | 36,007,376 | |||||||
| Prima Capital CRE Securitization Ltd. 2019-7A A† | 2.25% | 12/25/2050 | 36,233 | 36,000,830 | (a) | |||||||
| RBS Commercial Funding, Inc. Trust 2013-SMV A† | 3.26% | 3/11/2031 | 57,896 | 58,769,106 | ||||||||
| Ready Capital Mortgage Financing LLC 2021-FL6 A† | 1.042% (1 Mo. LIBOR + .95% | )# | 7/25/2036 | 81,320 | 81,455,804 | |||||||
| Ready Capital Mortgage Trust 2019-5 A† | 3.777% | 2/25/2052 | 4,045 | 4,111,482 | ||||||||
| Ready Capital Mortgage Financing LLC 2019-FL3 A† | 1.092% (1 Mo. LIBOR + 1.00% | )# | 3/25/2034 | 17,309 | 17,322,175 | |||||||
| 372 | See Notes to Financial Statements. |
Schedule of Investments (continued)
SHORT DURATION INCOME FUND November 30, 2021
| Investments | Interest Rate | Maturity Date | Principal Amount (000) | Fair Value | ||||||||
| NON-AGENCY COMMERCIAL MORTGAGE-BACKED SECURITIES (continued) | ||||||||||||
| ReadyCap Commercial Mortgage Trust 2018-4 A† | 3.39% | 2/27/2051 | $ | 12,172 | $ | 12,401,999 | ||||||
| ReadyCap Commercial Mortgage Trust 2019-6 A† | 2.833% | 10/25/2052 | 31,528 | 31,889,841 | ||||||||
| Residential Mortgage Loan Trust 2020-1 A1† | 2.376% | #(k) | 1/26/2060 | 8,840 | 8,895,838 | |||||||
| SFO Commercial Mortgage Trust 2021 555 A† | 1.24% (1 Mo. LIBOR + 1.15% | )# | 5/15/2038 | 90,000 | 90,154,665 | |||||||
| Shops at Crystals Trust 2016-CSTL XA IO† | 0.73% | #(k) | 7/5/2036 | 112,000 | 2,817,920 | |||||||
| SLIDE 2018-FUN A† | 1.24% (1 Mo. LIBOR + 1.15% | )# | 6/15/2031 | 43,607 | 43,550,475 | |||||||
| SLIDE 2018-FUN B† | 1.59% (1 Mo. LIBOR + 1.50% | )# | 6/15/2031 | 8,344 | 8,266,712 | |||||||
| SLIDE 2018-FUN C† | 1.89% (1 Mo. LIBOR + 1.80% | )# | 6/15/2031 | 6,590 | 6,497,330 | |||||||
| SREIT Trust 2021-MFP A† | 0.831% (1 Mo. LIBOR + .73% | )# | 11/15/2038 | 63,000 | 62,734,953 | |||||||
| SREIT Trust 2021-MFP D† | 1.678% (1 Mo. LIBOR + 1.58% | )# | 11/15/2038 | 39,500 | 39,357,117 | |||||||
| Starwood Mortgage Residential Trust 2020-1 A1† | 2.275% | #(k) | 2/25/2050 | 14,599 | 14,688,247 | |||||||
| Starwood Mortgage Residential Trust 2021-2 A1† | 0.943% | #(k) | 5/25/2065 | 14,874 | 14,806,984 | |||||||
| Structured Asset Securities Corp. 2006-3H 1A2 | 5.75% | 12/25/2035 | 3,712 | 3,867,411 | ||||||||
| Structured Asset Securities Corp. 2006-3H 1A3 | 5.75% | 12/25/2035 | 2,242 | 2,335,071 | ||||||||
| UBS Commercial Mortgage Trust 2017-C6 XA IO | 1.129% | #(k) | 12/15/2050 | 358,871 | 17,377,777 | |||||||
| UBS-BAMLL Trust 2012-WRM D† | 4.379% | #(k) | 6/10/2030 | 6,900 | 5,281,560 | |||||||
| UBS-Barclays Commercial Mortgage Trust 2012-C2 A4 | 3.525% | 5/10/2063 | 26,327 | 26,521,462 | ||||||||
| UBS-Barclays Commercial Mortgage Trust 2012-C2 BEC† | 4.971% | #(k) | 5/10/2063 | 8,100 | 7,704,354 | |||||||
| UBS-Barclays Commercial Mortgage Trust 2012-C2 XA IO† | 1.427% | #(k) | 5/10/2063 | 77,856 | 282,430 | |||||||
| UBS-Barclays Commercial Mortgage Trust 2012-C4 A4 | 2.792% | 12/10/2045 | 34,991 | 35,146,748 | ||||||||
| UBS-Barclays Commercial Mortgage Trust 2012-C4 A5 | 2.85% | 12/10/2045 | 15,487 | 15,697,857 | ||||||||
| UBS-Barclays Commercial Mortgage Trust 2013-C5 A4 IO | 3.185% | 3/10/2046 | 23,329 | 23,753,198 | ||||||||
| UBS-Barclays Commercial Mortgage Trust 2013-C5 AS† | 3.347% | 3/10/2046 | 23,805 | 24,323,039 | ||||||||
| UBS-Barclays Commercial Mortgage Trust 2013-C5 B† | 3.649% | #(k) | 3/10/2046 | 12,000 | 12,055,286 | |||||||
| UBS-Barclays Commercial Mortgage Trust 2013-C5 XA† | 1.038% | #(k) | 3/10/2046 | 284,778 | 1,762,494 | |||||||
| See Notes to Financial Statements. | 373 |
Schedule of Investments (continued)
SHORT DURATION INCOME FUND November 30, 2021
| Investments | Interest Rate | Maturity Date | Principal Amount (000) | Fair Value | ||||||||
| NON-AGENCY COMMERCIAL MORTGAGE-BACKED SECURITIES (continued) | ||||||||||||
| UBS-Barclays Commercial Mortgage Trust 2013-C6 XA IO† | 1.232% | #(k) | 4/10/2046 | $ | 383,806 | $ | 3,496,971 | |||||
| VASA Trust 2021-VASA B† | 1.34% (1 Mo. LIBOR + 1.25% | )# | 7/15/2039 | 12,542 | 12,565,817 | |||||||
| Verus Securitization Trust 2020-1 A1† | 2.417% | 1/25/2060 | 13,922 | 14,004,340 | ||||||||
| Verus Securitization Trust 2020-4 A1† | 1.502% | 5/25/2065 | 24,633 | 24,664,000 | ||||||||
| Verus Securitization Trust 2020-5 A1† | 1.218% | 5/25/2065 | 22,357 | 22,348,432 | ||||||||
| Verus Securitization Trust 2021-1 A1† | 0.815% | #(k) | 1/25/2066 | 39,200 | 38,872,888 | |||||||
| Verus Securitization Trust 2021-3 A1† | 1.046% | #(k) | 6/25/2066 | 57,915 | 57,490,207 | |||||||
| Verus Securitization Trust 2021-5 A1† | 1.013% | #(k) | 9/25/2066 | 56,949 | 56,215,243 | |||||||
| Verus Securitization Trust 2021-R2 A1† | 0.918% | #(k) | 2/25/2064 | 14,087 | 14,045,972 | |||||||
| Verus Securitization Trust 2021-R3 A1† | 1.02% | #(k) | 4/25/2064 | 52,153 | 51,940,086 | |||||||
| VMC Finance LLC 2019-FL3 A† | 1.189% (1 Mo. LIBOR + 1.10% | )# | 9/15/2036 | 81,349 | 81,344,647 | |||||||
| VNDO Mortgage Trust 2012-6AVE A† | 2.996% | 11/15/2030 | 13,900 | 14,136,725 | ||||||||
| Waikiki Beach Hotel Trust 2019-WBM A† | 1.139% (1 Mo. LIBOR + 1.05% | )# | 12/15/2033 | 49,800 | 49,819,651 | |||||||
| Waikiki Beach Hotel Trust 2019-WBM B† | 1.319% (1 Mo. LIBOR + 1.23% | )# | 12/15/2033 | 31,700 | 31,599,061 | |||||||
| Waikiki Beach Hotel Trust 2019-WBM C† | 1.569% (1 Mo. LIBOR + 1.48% | )# | 12/15/2033 | 22,200 | 22,078,522 | |||||||
| Waikiki Beach Hotel Trust 2019-WBM D† | 2.119% (1 Mo. LIBOR + 2.03% | )# | 12/15/2033 | 14,900 | 14,806,434 | |||||||
| WaMu Mortgage Pass-Through Certificates Trust 2005-AR18 1A1 | 2.829% | #(k) | 1/25/2036 | 1,733 | 1,767,593 | |||||||
| Wells Fargo Commercial Mortgage Trust 2014-LC16 A5 | 3.817% | 8/15/2050 | 13,277 | 13,982,884 | ||||||||
| Wells Fargo Commercial Mortgage Trust 2015-C29 XA IO | 0.745% | #(k) | 6/15/2048 | 131,949 | 2,457,751 | |||||||
| Wells Fargo Commercial Mortgage Trust 2015-SG1 XA IO | 0.812% | #(k) | 9/15/2048 | 149,262 | 3,108,440 | |||||||
| Wells Fargo Commercial Mortgage Trust 2016-BNK1 XA IO | 1.863% | #(k) | 8/15/2049 | 188,200 | 12,422,436 | |||||||
| Wells Fargo Commercial Mortgage Trust 2016-C32 A4 | 3.56% | 1/15/2059 | 18,500 | 19,813,441 | ||||||||
| Wells Fargo Commercial Mortgage Trust 2016-C34 XA IO | 2.263% | #(k) | 6/15/2049 | 135,343 | 8,733,820 | |||||||
| Wells Fargo Commercial Mortgage Trust 2017-SMP B† | 1.214% (1 Mo. LIBOR + 1.13% | )# | 12/15/2034 | 16,322 | 16,281,996 | |||||||
| 374 | See Notes to Financial Statements. |
Schedule of Investments (continued)
SHORT DURATION INCOME FUND November 30, 2021
| Investments | Interest Rate | Maturity Date | Principal Amount (000) | Fair Value | ||||||||
| NON-AGENCY COMMERCIAL MORTGAGE-BACKED SECURITIES (continued) | ||||||||||||
| Wells Fargo Commercial Mortgage Trust 2018-C44 A2 | 4.178% | 5/15/2051 | $ | 20,000 | $ | 20,639,968 | ||||||
| Wells Fargo Commercial Mortgage Trust 2018-C47 A2 | 4.361% | 9/15/2061 | 22,988 | 23,979,757 | ||||||||
| Wells Fargo Commercial Mortgage Trust 2018-C48 A2 | 4.224% | 1/15/2052 | 7,767 | 8,032,386 | ||||||||
| West Town Mall Trust 2017-KNOX A† | 3.823% | 7/5/2030 | 26,107 | 26,211,108 | ||||||||
| West Town Mall Trust 2017-KNOX B† | 4.322% | 7/5/2030 | 23,788 | 23,837,748 | ||||||||
| West Town Mall Trust 2017-KNOX C† | 4.491% | #(k) | 7/5/2030 | 17,640 | 17,547,215 | |||||||
| West Town Mall Trust 2017-KNOX D† | 4.491% | #(k) | 7/5/2030 | 21,720 | 21,515,613 | |||||||
| WFLD Mortgage Trust 2014-MONT A† | 3.88% | #(k) | 8/10/2031 | 7,750 | 8,032,402 | |||||||
| WF-RBS Commercial Mortgage Trust 2012-C10 XA IO† | 1.632% | #(k) | 12/15/2045 | 47,524 | 497,822 | |||||||
| WF-RBS Commercial Mortgage Trust 2012-C2 XA IO† | 1.436% | #(k) | 6/15/2045 | 295,681 | 374,835 | |||||||
| WF-RBS Commercial Mortgage Trust 2012-C6 AS | 3.835% | 4/15/2045 | 2,244 | 2,243,863 | ||||||||
| WF-RBS Commercial Mortgage Trust 2012-C7 A2 | 3.431% | 6/15/2045 | 5,393 | 5,424,763 | ||||||||
| WF-RBS Commercial Mortgage Trust 2012-C7 B | 4.881% | #(k) | 6/15/2045 | 17,378 | 16,719,306 | |||||||
| WF-RBS Commercial Mortgage Trust 2012-C8 XA IO† | 1.931% | #(k) | 8/15/2045 | 41,831 | 151,344 | |||||||
| WF-RBS Commercial Mortgage Trust 2012-C9 A3 | 2.87% | 11/15/2045 | 16,685 | 16,870,122 | ||||||||
| WF-RBS Commercial Mortgage Trust 2012-C9 C | 4.543% | #(k) | 11/15/2045 | 9,180 | 9,161,450 | |||||||
| WF-RBS Commercial Mortgage Trust 2013-C11 AS | 3.311% | 3/15/2045 | 5,000 | 5,102,927 | ||||||||
| WF-RBS Commercial Mortgage Trust 2013-C12 AS | 3.56% | 3/15/2048 | 26,191 | 26,924,309 | ||||||||
| WF-RBS Commercial Mortgage Trust 2013-C13 XA IO† | 1.314% | #(k) | 5/15/2045 | 221,512 | 2,683,380 | |||||||
| WF-RBS Commercial Mortgage Trust 2013-C15 A3 | 3.881% | 8/15/2046 | 2,420 | 2,498,693 | ||||||||
| WF-RBS Commercial Mortgage Trust 2014-C19 A4 | 3.829% | 3/15/2047 | 18,050 | 18,738,795 | ||||||||
| WF-RBS Commercial Mortgage Trust 2014-C19 A5 | 4.101% | 3/15/2047 | 25,388 | 26,849,951 | ||||||||
| WF-RBS Commercial Mortgage Trust 2014-C20 A5 | 3.995% | 5/15/2047 | 9,160 | 9,641,429 | ||||||||
| WFRBS Commercial Mortgage Trust 2014-C21 A4 | 3.41% | 8/15/2047 | 15,978 | 16,562,873 | ||||||||
| WF-RBS Commercial Mortgage Trust 2014-C21 XB IO | 0.791% | #(k) | 8/15/2047 | 77,368 | 1,261,269 | |||||||
| WF-RBS Commercial Mortgage Trust 2014-C22 XA IO | 0.94% | #(k) | 9/15/2057 | 79,678 | 1,413,656 | |||||||
| WF-RBS Commercial Mortgage Trust 2014-C22 XB IO | 0.494% | #(k) | 9/15/2057 | 37,769 | 422,863 | |||||||
| Total Non-Agency Commercial Mortgage-Backed Securities (cost $11,651,302,242) | 11,436,191,346 | |||||||||||
| See Notes to Financial Statements. | 375 |
Schedule of Investments (continued)
SHORT DURATION INCOME FUND November 30, 2021
| Investments | Exercise Price | Expiration Date | Shares (000) | Fair Value | ||||||||
| RIGHTS 0.00% | ||||||||||||
| Oil & Gas | ||||||||||||
| Dommo Energia SA*(d) | $0.70 | 12/23/2021 | BRL | 712 | $ | 5,066 | ||||||
| Total Rights (cost $0) | 5,066 | |||||||||||
| Interest Rate | Maturity Date | Principal Amount (000) | ||||||||||
| U.S. TREASURY OBLIGATIONS 8.47% | ||||||||||||
| U.S. Treasury Bill | Zero Coupon | 1/27/2022 | $ | 1,023,419 | 1,023,350,134 | |||||||
| U.S. Treasury Bill | Zero Coupon | 4/21/2022 | 181,420 | 181,372,036 | ||||||||
| U.S. Treasury Note | 0.125% | 8/31/2023 | 1,214,816 | 1,207,413,215 | ||||||||
| U.S. Treasury Note | 0.375% | 10/31/2023 | 2,023,038 | 2,017,664,306 | ||||||||
| U.S. Treasury Note | 0.75% | 11/15/2024 | 705,248 | 703,622,622 | ||||||||
| U.S. Treasury Note | 1.125% | 10/31/2026 | 187,091 | 186,857,136 | ||||||||
| Total U.S. Treasury Obligations (cost $5,326,961,786) | 5,320,279,449 | |||||||||||
| Exercise Price | Expiration Date | Shares (000) | ||||||||||
| WARRANTS 0.00% | ||||||||||||
| Miscellaneous Financials | ||||||||||||
| Sable Permian Resources†*(f) | $ – | (l) | 2/1/2024 | 18 | 544,492 | |||||||
| UTEX Industries, Inc.* | 114.76 | 12/3/2025 | 10 | 24,612 | ||||||||
| Total Warrants (cost $126,938) | 569,104 | |||||||||||
| Total Long-Term Investments (cost $61,866,497,433) | 61,820,873,692 | |||||||||||
| Interest Rate | Maturity Date | Principal Amount (000) | ||||||||||
| SHORT-TERM INVESTMENTS 3.11% | ||||||||||||
| COMMERCIAL PAPER 0.33% | ||||||||||||
| Chemicals 0.21% | ||||||||||||
| FMC Corp. | 0.456% | 12/30/2021 | 69,680 | 69,654,741 | ||||||||
| FMC Corp. | 0.507% | 12/30/2021 | 64,693 | 64,666,943 | ||||||||
| Total | 134,321,684 | |||||||||||
| Computers 0.04% | ||||||||||||
| Fidelity National Information Services, Inc. | 0.233% | 12/8/2021 | 22,000 | 21,999,016 | ||||||||
| 376 | See Notes to Financial Statements. |
Schedule of Investments (continued)
SHORT DURATION INCOME FUND November 30, 2021
| Investments | Interest Rate | Maturity Date | Principal Amount (000) | Fair Value | ||||||||
| Oil & Gas 0.08% | ||||||||||||
| Energy Transfer Partners LP | 0.355% | 12/1/2021 | $ | 50,000 | $ | 49,999,514 | ||||||
| Total Commercial Paper (cost $206,320,700) | 206,320,214 | |||||||||||
| REPURCHASE AGREEMENTS 2.78% | ||||||||||||
| Repurchase Agreement dated 11/30/2021, 0.00% due 12/1/2021 with Fixed Income Clearing Corp. collateralized by $250,000,000 of U.S. Treasury Note at 0.125% due 07/31/2022; $800,000,000 of U.S. Treasury Inflation Indexed Note at 0.125% due 07/15/2022; $407,883,200 of U.S. Treasury Note at 0.125% due 08/31/2022; $90,505,100 of U.S. Treasury Bill at 0.00% due 05/26/2022; $50,000,000 of U.S. Treasury Note at 1.625% due 08/15/2022; value: $1,785,992,487; proceeds: $1,750,973,008 (cost $1,750,973,008) | 1,750,973 | 1,750,973,008 | ||||||||||
| Total Short-Term Investments (cost $1,957,293,708) | 1,957,293,222 | |||||||||||
| Total Investments in Securities 101.47% (cost $63,823,791,141) | 63,778,166,914 | |||||||||||
| Less Unfunded Loan Commitments (0.15%) (cost $96,043,686)(m) | (96,043,686 | ) | ||||||||||
| Net Investments in Securities 101.32% (cost $63,727,747,455) | 63,682,123,228 | |||||||||||
| Other Assets and Liabilities – Net(n) (1.32)% | (826,978,274 | ) | ||||||||||
| Net Assets 100.00% | $ | 62,855,144,954 | ||||||||||
| BRL | Brazilian Real. | |
| CAD | Canadian Dollar. | |
| JPY | Japanese Yen. | |
| CMT | Constant Maturity Rate. | |
| IO | Interest Only. | |
| LIBOR | London Interbank Offered Rate. | |
| PIK | Payment-in-kind. | |
| SOFR | Secured Over Night Financing Rate. | |
| # | Variable rate security. The interest rate represents the rate in effect at November 30, 2021. | |
| † | Security was purchased pursuant to Rule 144A under the Securities Act of 1933 and, unless registered under such Act or exempted from registration, may only be resold to qualified institutional buyers. At November 30, 2021, the total value of Rule 144A securities was $32,141,186,565, which represents 51.14% of net assets. | |
| * | Non-income producing security. | |
| (a) | Level 3 Investment as described in Note 2(t) in the Notes to Financials. Security valued utilizing third party pricing information without adjustment. Such valuations are based on unobservable inputs. A significant change in third party information could result in a significantly lower or higher value of such Level 3 investments. | |
| (b) | Securities purchased on a when-issued basis (See Note 2(j)). | |
| (c) | Variable Rate is Fixed to Float: Rate remains fixed or at Zero Coupon until designated future date. | |
| (d) | Investment in non-U.S. dollar denominated securities. | |
| (e) | Foreign security traded in U.S. dollars. | |
| (f) | Defaulted (non-income producing security). | |
| (g) | Floating Rate Loans in which the Fund invests generally pay interest at rates which are periodically re-determined at a margin above the London Interbank Offered Rate (“LIBOR”) or the prime rate offered by major U.S. banks. The rate(s) shown is the rate(s) in effect at November 30, 2021. | |
| (h) | Interest rate to be determined. |
| See Notes to Financial Statements. | 377 |
Schedule of Investments (continued)
SHORT DURATION INCOME FUND November 30, 2021
| (i) | Level 3 Investment as described in Note 2(t) in the Notes to Financials. Floating Rate Loans categorized as Level 3 are valued based on a single quotation obtained from a dealer. Accounting principles generally accepted in the United States of America do not require the Fund to create quantitative unobservable inputs that were not developed by the Fund. Therefore, the Fund does not have access to unobservable inputs and cannot disclose such inputs in the valuation. | |
| (j) | Security partially/fully unfunded. See Note (2(o)). | |
| (k) | Interest rate is based on the weighted average interest rates of the underlying mortgages within the mortgage pool. | |
| (l) | Cashless strike price. | |
| (m) | See Note (2(o)). | |
| (n) | Other Assets and Liabilities - Net include net unrealized appreciation/depreciation on forward foreign currency exchange contracts, futures contracts and swaps as follows: |
Credit Default Swaps on Indexes - Sell Protection at November 30, 2021(1):
| Referenced Index* | Swap Counterparty | Fund Receives (Quarterly) | Termination Date | Notional Amount | Payments Upfront(2) | Unrealized Appreciation/ (Depreciation)(3) | Credit Default Swap Agreements Receivable at Fair Value(4) | ||||||||||||||||
| Markit CMBX. NA.AA.8 | Citibank | 1.500% | 10/17/2057 | $ | 35,000,000 | $ | (85,669 | ) | $ | 304,745 | $ | 219,076 | |||||||||||
| Markit CMBX. NA.AA.9 | Morgan Stanley | 1.500% | 9/17/2058 | 49,500,000 | 239,081 | 458,320 | 697,401 | ||||||||||||||||
| Markit CMBX. NA.AA.8 | Morgan Stanley | 1.500% | 10/17/2057 | 25,000,000 | (68,976 | ) | 225,458 | 156,482 | |||||||||||||||
| $ | 84,436 | $ | 988,523 | $ | 1,072,959 | ||||||||||||||||||
| Referenced Index* | Swap Counterparty | Fund Receives (Quarterly) | Termination Date | Notional Amount | Payments Upfront(2) | Unrealized Appreciation/ (Depreciation)(3) | Credit Default Swap Agreements Payable at Fair Value(4) | ||||||||||||||||
| Markit CMBX. NA.AA.7 | Citibank | 1.500% | 1/17/2047 | 35,000,000 | $ | (551,854 | ) | $ | (46,082 | ) | $ | (597,936 | ) | ||||||||||
| Markit CMBX. NA.AA.7 | Citibank | 1.500% | 1/17/2047 | 25,000,000 | (454,584 | ) | 27,487 | (427,097 | ) | ||||||||||||||
| Markit CMBX. NA.AA.7 | Citibank | 1.500% | 1/17/2047 | 20,000,000 | (321,274 | ) | (20,404 | ) | (341,678 | ) | |||||||||||||
| Markit CMBX. NA.AA.6 | Citibank | 1.500% | 5/11/2063 | 40,000,000 | (394,835 | ) | (582,526 | ) | (977,361 | ) | |||||||||||||
| Markit CMBX. NA.AA.6 | Citibank | 1.500% | 5/11/2063 | 10,000,000 | (161,148 | ) | (83,192 | ) | (244,340 | ) | |||||||||||||
| Markit CMBX. NA.AA.6 | Citibank | 1.500% | 5/11/2063 | 10,000,000 | (189,150 | ) | (55,190 | ) | (244,340 | ) | |||||||||||||
| Markit CMBX. NA.AA.6 | Citibank | 1.500% | 5/11/2063 | 5,000,000 | (58,743 | ) | (63,427 | ) | (122,170 | ) | |||||||||||||
| Markit CMBX. NA.AA.6 | Citibank | 1.500% | 5/11/2063 | 5,000,000 | (77,348 | ) | (44,822 | ) | (122,170 | ) | |||||||||||||
| Markit CMBX. NA.AA.6 | Citibank | 1.500% | 5/11/2063 | 10,000,000 | (114,289 | ) | (130,051 | ) | (244,340 | ) | |||||||||||||
| Markit CMBX. NA.AA.6 | Citibank | 1.500% | 5/11/2063 | 10,000,000 | (117,485 | ) | (126,855 | ) | (244,340 | ) | |||||||||||||
| Markit CMBX. NA.BBB-.12 | Goldman Sachs | 3.000% | 8/17/2061 | 20,000,000 | (770,944 | ) | (545,279 | ) | (1,316,223 | ) | |||||||||||||
| 378 | See Notes to Financial Statements. |
Schedule of Investments (continued)
SHORT DURATION INCOME FUND November 30, 2021
| Referenced Index* | Swap Counterparty | Fund Receives (Quarterly) | Termination Date | Notional Amount | Payments Upfront(2) | Unrealized Appreciation/ (Depreciation)(3) | Credit Default Swap Agreements Payable at Fair Value(4) | ||||||||||||||||
| Markit CMBX. NA.AA.6 | Goldman Sachs | 1.500% | 5/11/2063 | $ | 28,000,000 | $ | (870,972 | ) | $ | 186,819 | $ | (684,153 | ) | ||||||||||
| Markit CMBX. NA.A.6 | Morgan Stanley | 2.000% | 5/11/2063 | 66,143,000 | (863,771 | ) | (5,670,463 | ) | (6,534,234 | ) | |||||||||||||
| Markit CMBX. NA.A10 | Morgan Stanley | 2.000% | 11/17/2059 | 25,000,000 | (124,090 | ) | (81,056 | ) | (205,146 | ) | |||||||||||||
| Markit CMBX. NA.A.10 | Morgan Stanley | 2.000% | 11/17/2059 | 25,000,000 | (71,297 | ) | (133,849 | ) | (205,146 | ) | |||||||||||||
| Markit CMBX. NA.A.10 | Morgan Stanley | 2.000% | 11/17/2059 | 25,000,000 | (120,549 | ) | (84,597 | ) | (205,146 | ) | |||||||||||||
| Markit CMBX. NA.AA.6 | Morgan Stanley | 1.500% | 5/11/2063 | 30,000,000 | (259,127 | ) | (473,894 | ) | (733,021 | ) | |||||||||||||
| Markit CMBX. NA.BBB-.10 | Morgan Stanley | 3.000% | 11/17/2059 | 16,000,000 | (1,388,142 | ) | (219,538 | ) | (1,607,680 | ) | |||||||||||||
| $ | (6,909,602 | ) | $ | (8,146,919 | ) | $ | (15,056,521 | ) | |||||||||||||||
| Total Credit Default Swaps on Indexes - Sell Protection | $ | (6,825,166 | ) | $ | (7,158,396 | ) | $ | (13,983,562 | ) | ||||||||||||||
| * | The Referenced Index is for the Credit Default Swaps on Indexes, which is comprised of a basket of commercial mortgage-backed securities. | |
| (1) | If the Fund is a seller of protection and a credit event occurs, as defined under the terms of that particular swap agreement, the Fund will either (i) pay to the buyer of protection an amount equal to the notional amount of the swap and take delivery of the referenced obligation or underlying securities comprising the referenced index or (ii) pay a net settlement amount in the form of cash or securities equal to the notional amount of the swap less the recovery value of the referenced obligation or underlying securities. | |
| (2) | Upfront payments received/paid are presented net of amortization. | |
| (3) | Total unrealized appreciation on Credit Default Swaps on Indexes amounted to $1,202,829. Total unrealized depreciation on Credit Default Swaps on Indexes amounted to $8,361,225. | |
| (4) | Includes upfront payments received. |
Open Forward Foreign Currency Exchange Contracts at November 30, 2021:
| Forward Foreign Currency Exchange Contracts | Transaction Type | Counterparty | Expiration Date | Foreign Currency | U.S. $ Cost on Origination Date | U.S. $ Current Value | Unrealized Appreciation | ||||||||
| Canadian dollar | Sell | Toronto Dominion Bank | 1/20/2022 | 35,600,000 | $28,793,667 | $27,881,389 | $912,278 | ||||||||
| Forward Foreign Currency Exchange Contracts | Transaction Type | Counterparty | Expiration Date | Foreign Currency | U.S. $ Cost on Origination Date | U.S. $ Current Value | Unrealized Depreciation | ||||||||
| Japanese yen | Sell | Bank of America | 2/7/2022 | 22,732,050,000 | $197,213,836 | $201,317,001 | $(4,103,165 | ) |
| See Notes to Financial Statements. | 379 |
Schedule of Investments (continued)
SHORT DURATION INCOME FUND November 30, 2021
Open Futures Contracts at November 30, 2021:
| Type | Expiration | Contracts | Position | Notional Amount | Notional Value | Unrealized Appreciation | |||||||
| U.S. 2-Year Treasury Note | March 2022 | 61,243 | Long | $13,371,340,115 | $13,395,949,390 | $24,609,275 | |||||||
| Type | Expiration | Contracts | Position | Notional Amount | Notional Value | Unrealized Depreciation | |||||||
| U.S. 5-Year Treasury Note | March 2022 | 10,042 | Short | $(1,209,731,713 | ) | $(1,219,083,115 | ) | $(9,351,402 | ) |
The following is a summary of the inputs used as of November 30, 2021 in valuing the Fund’s investments carried at fair value(1):
| Investment Type(2) | Level 1 | Level 2 | Level 3 | Total | ||||||||||||
| Long-Term Investments | ||||||||||||||||
| Asset-Backed Securities | ||||||||||||||||
| Automobiles | $ | – | $ | 5,322,501,575 | $ | 59,095,167 | $ | 5,381,596,742 | ||||||||
| Credit Card | – | 597,214,853 | 77,933,110 | 675,147,963 | ||||||||||||
| Other | – | 8,481,625,383 | 197,228,665 | 8,678,854,048 | ||||||||||||
| Remaining Industries | – | 466,870,080 | – | 466,870,080 | ||||||||||||
| Common Stocks | ||||||||||||||||
| Miscellaneous Financials | – | 4,039,536 | – | 4,039,536 | ||||||||||||
| Remaining Industries | 35,850,204 | – | – | 35,850,204 | ||||||||||||
| Convertible Bonds | – | 64,609,010 | – | 64,609,010 | ||||||||||||
| Corporate Bonds | – | 23,815,099,740 | – | 23,815,099,740 | ||||||||||||
| Floating Rate Loans | ||||||||||||||||
| Gaming | – | 54,765,298 | 11,107,095 | 65,872,393 | ||||||||||||
| Health Care | – | – | 122,913,117 | 122,913,117 | ||||||||||||
| Media | – | 296,960,696 | 96,043,686 | 393,004,382 | ||||||||||||
| Real Estate Investment Trusts | – | 267,336,761 | 12,549,929 | 279,886,690 | ||||||||||||
| Telecommunications | – | 120,498,274 | 84,510,189 | 205,008,463 | ||||||||||||
| Remaining Industries | – | 4,075,174,191 | – | 4,075,174,191 | ||||||||||||
| Less Unfunded Commitments | – | – | (96,043,686 | ) | (96,043,686 | ) | ||||||||||
| Foreign Government Obligations | – | 567,649,591 | – | 567,649,591 | ||||||||||||
| Government Sponsored Enterprises Collateralized Mortgage Obligations | – | 27,021,311 | – | 27,021,311 | ||||||||||||
| Government Sponsored Enterprises Pass-Throughs | – | 158,355,649 | 7,787,714 | 166,143,363 | ||||||||||||
| Municipal Bonds | – | 39,087,903 | – | 39,087,903 | ||||||||||||
| Non-Agency Commercial Mortgage-Backed Securities | – | 10,165,377,409 | 1,270,813,937 | 11,436,191,346 | ||||||||||||
| Rights | – | 5,066 | – | 5,066 | ||||||||||||
| U.S. Treasury Obligations | – | 5,320,279,449 | – | 5,320,279,449 | ||||||||||||
| Warrants | – | 569,104 | – | 569,104 | ||||||||||||
| Short-Term Investments | ||||||||||||||||
| Commercial Paper | – | 206,320,214 | – | 206,320,214 | ||||||||||||
| Repurchase Agreements | – | 1,750,973,008 | – | 1,750,973,008 | ||||||||||||
| Total | $ | 35,850,204 | $ | 61,802,334,101 | $ | 1,843,938,923 | $ | 63,682,123,228 | ||||||||
| 380 | See Notes to Financial Statements. |
Schedule of Investments (concluded)
SHORT DURATION INCOME FUND November 30, 2021
| Other Financial Instruments | Level 1 | Level 2 | Level 3 | Total | ||||||||||||
| Credit Default Swap Contracts | ||||||||||||||||
| Assets | $ | – | $ | 1,072,959 | $ | – | $ | 1,072,959 | ||||||||
| Liabilities | – | (15,056,521 | ) | – | (15,056,521 | ) | ||||||||||
| Forward Foreign Currency Exchange Contracts | ||||||||||||||||
| Assets | – | 912,278 | – | 912,278 | ||||||||||||
| Liabilities | – | (4,103,165 | ) | – | (4,103,165 | ) | ||||||||||
| Futures Contracts | ||||||||||||||||
| Assets | 24,609,275 | – | – | 24,609,275 | ||||||||||||
| Liabilities | (9,351,402 | ) | – | – | (9,351,402 | ) | ||||||||||
| Total | $ | 15,257,873 | $ | (17,174,449 | ) | $ | – | $ | (1,916,576 | ) | ||||||
| (1) | Refer to Note 2(t) for a description of fair value measurements and the three-tier hierarchy of inputs. | |
| (2) | See Schedule of Investments for fair values in each industry and identification of foreign issuer and/or geography. The table above is presented by Investment Type. Industries are presented within an Investment Type should such Investment Type include securities classified as two or more levels within the three- tier fair value hierarchy. When applicable each Level 3 security is identified on the Schedule of Investments along with the valuation technique utilized. |
A reconciliation of Level 3 investments is presented when the Fund has a material amount of Level 3 investments at the beginning or end of the year in relation to the Fund’s net assets.
The following is a reconciliation of investments with unobservable inputs (Level 3) that were used in determining fair value:
| Investment Type | Asset- Backed Securities | Common Stocks | Floating Rate Loans | Government Sponsored Enterprises Pass- Throughs | Non-Agency Commercial Mortgage- Backed Securities | Preferred Stocks | ||||||||||||||||||
| Balance as of December 1, 2020 | $ | 146,599,548 | $ | 14,212 | $ | 718,509,949 | $ | – | $ | 334,585,399 | $ | 1 | ||||||||||||
| Accrued Discounts (Premiums) | (324,732 | ) | – | 331,909 | (16,947 | ) | (44,865 | ) | – | |||||||||||||||
| Realized Gain (Loss) | 1,589,488 | (1,776,469 | ) | 821,106 | (104,314 | ) | 115,691 | (4,795,109 | ) | |||||||||||||||
| Change in Unrealized Appreciation (Depreciation) | (931,397 | ) | 1,762,257 | (1,468,457 | ) | 41,373 | 6,209,408 | 4,795,108 | ||||||||||||||||
| Purchases | 332,570,985 | – | 308,844,760 | – | 1,119,350,000 | – | ||||||||||||||||||
| Sales | (25,474,736 | ) | – | (341,560,328 | ) | (2,051,667 | ) | (44,798,866 | ) | – | ||||||||||||||
| Transfers into Level 3 | – | – | 12,549,929 | 9,919,269 | 8,116,332 | – | ||||||||||||||||||
| Transfers out of Level 3 | (119,772,214 | ) | – | (466,948,538 | ) | – | (152,719,162 | ) | – | |||||||||||||||
| Balance as of November 30, 2021 | $ | 334,256,942 | $ | – | $ | 231,080,330 | $ | 7,787,714 | $ | 1,270,813,937 | $ | – | ||||||||||||
| Change in unrealized appreciation/ depreciation for the year ended November 30, 2021, related to Level 3 investments held at November 30, 2021 | $ | (44,604 | ) | $ | – | $ | (1,567,623 | ) | $ | 41,373 | $ | 6,209,557 | $ | – | ||||||||||
| See Notes to Financial Statements. | 381 |
Schedule of Investments
TOTAL RETURN FUND November 30, 2021
| Investments | Interest Rate | Maturity Date | Principal Amount (000) | Fair Value | ||||||||
| LONG-TERM INVESTMENTS 102.03% | ||||||||||||
| ASSET-BACKED SECURITIES 16.27% | ||||||||||||
| Auto Floor Plan 0.23% | ||||||||||||
| Ford Credit Floorplan Master Owner Trust 2018-4 A | 4.06% | 11/15/2030 | $ | 8,490 | $ | 9,587,174 | ||||||
| Automobiles 5.15% | ||||||||||||
| ACC Trust 2019-1 B† | 4.47% | 10/20/2022 | 1,061 | 1,064,844 | ||||||||
| Avid Automobile Receivables Trust 2019-1 A† | 2.62% | 2/15/2024 | 32 | 31,816 | ||||||||
| Avid Automobile Receivables Trust 2019-1 B† | 2.82% | 7/15/2026 | 1,747 | 1,763,194 | ||||||||
| Avid Automobile Receivables Trust 2019-1 C† | 3.14% | 7/15/2026 | 760 | 774,056 | ||||||||
| Avis Budget Rental Car Funding AESOP LLC 2021-2A D† | 4.08% | 2/20/2028 | 7,500 | 7,531,117 | ||||||||
| Carmax Auto Owner Trust 2021-1 A2A | 0.22% | 2/15/2024 | 18,250 | 18,245,631 | ||||||||
| Carvana Auto Receivables Trust 2019-3A E† | 4.60% | 7/15/2026 | 4,236 | 4,383,822 | ||||||||
| Carvana Auto Receivables Trust 2020-P1† | 2.84% | 9/8/2027 | 81 | 81,517 | ||||||||
| Carvana Auto Receivables Trust 2021-P1† | 2.16% | 12/10/2027 | 1,622 | 1,622,220 | ||||||||
| Carvana Auto Receivables Trust NP1 2020-N1A E† | 5.20% | 7/15/2027 | 9,077 | 9,563,290 | ||||||||
| CPS Auto Receivables Trust 2018-B D† | 4.26% | 3/15/2024 | 1,830 | 1,855,420 | ||||||||
| CPS Auto Receivables Trust 2019-B E† | 5.00% | 3/17/2025 | 1,585 | 1,652,816 | ||||||||
| CPS Auto Receivables Trust 2020-A E† | 4.09% | 12/15/2025 | 812 | 828,073 | ||||||||
| CPS Auto Receivables Trust 2020-C C† | 1.71% | 8/17/2026 | 5,096 | 5,131,323 | ||||||||
| Exeter Automobile Receivables Trust 2020-3A E† | 3.44% | 8/17/2026 | 10,847 | 11,196,263 | ||||||||
| Flagship Credit Auto Trust 2018-4 E† | 5.51% | 3/16/2026 | 9,800 | 10,353,771 | ||||||||
| Flagship Credit Auto Trust 2020-2 A† | 1.49% | 7/15/2024 | 583 | 584,177 | ||||||||
| Flagship Credit Auto Trust 2021-1 A† | 0.31% | 6/16/2025 | 6,912 | 6,896,685 | ||||||||
| Ford Credit Auto Lease Trust 2021-A A2 | 0.19% | 7/15/2023 | 19,596 | 19,593,068 | ||||||||
| Ford Credit Auto Owner Trust 2020-B A2 | 0.50% | 2/15/2023 | 245 | 244,997 | ||||||||
| Foursight Capital Automobile Receivables Trust 2018-1 C† | 3.68% | 8/15/2023 | 901 | 901,853 | ||||||||
| Hertz Vehicle Financing III LP 2021-2A A† | 1.68% | 12/27/2027 | 13,150 | 13,142,970 | ||||||||
| Honda Auto Receivables Owner Trust 2020-2 A2 | 0.74% | 11/15/2022 | 79 | 78,951 | ||||||||
| Mercedes-Benz Auto Lease Trust 2021-A A2 | 0.18% | 3/15/2023 | 16,198 | 16,195,713 | ||||||||
| Santander Drive Auto Receivables Trust 2021-1 A2 | 0.29% | 11/15/2023 | 5,304 | 5,304,105 | ||||||||
| Toyota Auto Receivables Owner Trust 2021-A A2 | 0.16% | 7/17/2023 | 25,138 | 25,130,219 | ||||||||
| Tricolor Auto Securitization Trust 2021-1A E† | 3.23% | 9/15/2026 | 4,270 | 4,236,325 | ||||||||
| Westlake Automobile Receivables Trust 2020-2A A2A† | 0.93% | 2/15/2024 | 6,514 | 6,522,255 | ||||||||
| Westlake Automobile Receivables Trust 2020-3A E† | 3.34% | 6/15/2026 | 8,700 | 8,896,405 | ||||||||
| Westlake Automobile Receivables Trust 2021-1A E† | 2.33% | 8/17/2026 | 11,045 | 11,015,669 | ||||||||
| World Omni Auto Receivables Trust 2021-A A2 | 0.17% | 2/15/2024 | 19,178 | 19,169,186 | ||||||||
| Total | 213,991,751 | |||||||||||
| 382 | See Notes to Financial Statements. |
Schedule of Investments (continued)
TOTAL RETURN FUND November 30, 2021
| Investments | Interest Rate | Maturity Date | Principal Amount (000) | Fair Value | ||||||||
| Credit Card 1.23% | ||||||||||||
| Genesis Sales Finance Master Trust 2020-AA A† | 1.65% | 9/22/2025 | $ | 15,000 | $ | 15,074,235 | ||||||
| Genesis Sales Finance Master Trust 2020-AA D† | 4.71% | 9/22/2025 | 2,300 | 2,314,920 | ||||||||
| Genesis Sales Finance Master Trust 2021-AA B† | 1.45% | 12/21/2026 | 8,410 | 8,322,461 | ||||||||
| Genesis Sales Finance Master Trust 2021-AA D† | 2.09% | 12/21/2026 | 4,000 | 3,958,323 | ||||||||
| Perimeter Master Note Business Trust 2019-2A A† | 4.23% | 5/15/2024 | 15,000 | 15,439,695 | (a) | |||||||
| Perimeter Master Note Business Trust 2021-1A B† | 4.17% | 5/15/2024 | 5,875 | 5,853,090 | (a) | |||||||
| Total | 50,962,724 | |||||||||||
| Home Equity 0.00% | ||||||||||||
| New Century Home Equity Loan Trust 2005-A A6 | 4.713% | 8/25/2035 | 85 | 84,316 | ||||||||
| Other 9.22% | ||||||||||||
| AMMC CLO Ltd. 2020-23A CR† | 2.123% (3 Mo. LIBOR + 2.00% | )# | 10/17/2031 | 6,470 | 6,471,399 | |||||||
| AMMC CLO Ltd. 2021-24A B†(b) | Zero Coupon | #(c) | 1/20/2035 | 8,000 | 8,000,000 | |||||||
| AMMC CLO XIII Ltd. 2013-13A A2LR† | 1.824% (3 Mo. LIBOR + 1.70% | )# | 7/24/2029 | 810 | 810,639 | |||||||
| Apidos CLO XXXV 2021-35A A† | 1.182% (3 Mo. LIBOR + 1.05% | )# | 4/20/2034 | 4,660 | 4,660,574 | |||||||
| Arbor Realty Collateralized Loan Obligation Ltd. 2021-FL2 D† | 2.59% (1 Mo. LIBOR + 2.50% | )# | 5/15/2036 | 7,800 | 7,762,365 | |||||||
| Arbor Realty Collateralized Loan Obligation Ltd. 2021-FL2 E† | 3.04% (1 Mo. LIBOR + 2.95% | )# | 5/15/2036 | 1,930 | 1,919,568 | |||||||
| Barings CLO Ltd. 2018-3A D† | 3.032% (3 Mo. LIBOR + 2.90% | )# | 7/20/2029 | 4,518 | 4,459,003 | |||||||
| Barings CLO Ltd. 2019-3A BR† | 1.732% (3 Mo. LIBOR + 1.60% | )# | 4/20/2031 | 6,590 | 6,595,366 | |||||||
| Carlyle Global Market Strategies CLO Ltd. 2015-5A BRR† | 2.432% (3 Mo. LIBOR + 2.30% | )# | 1/20/2032 | 4,830 | 4,837,275 | |||||||
| CARLYLE US CLO Ltd. 2019-1A BR† | 2.332% (3 Mo. LIBOR + 2.20% | )# | 4/20/2031 | 4,590 | 4,596,939 | |||||||
| CBAM Ltd. 2017-1A D† | 3.882% (3 Mo. LIBOR + 3.75% | )# | 7/20/2030 | 5,910 | 5,920,058 | |||||||
| CIFC Funding I Ltd. 2021-1A A1† | 1.234% (3 Mo. LIBOR + 1.11% | )# | 4/25/2033 | 16,720 | 16,728,346 | |||||||
| Consumer Loan Underlying Bond CLUB Credit Trust 2019-P2 C† | 4.41% | 10/15/2026 | 7,928 | 8,054,940 | ||||||||
| Diamond Resorts Owner Trust 2017-1A B† | 4.11% | 10/22/2029 | 950 | 955,523 | ||||||||
| See Notes to Financial Statements. | 383 |
Schedule of Investments (continued)
TOTAL RETURN FUND November 30, 2021
| Investments | Interest Rate | Maturity Date | Principal Amount (000) | Fair Value | ||||||||
| Other (continued) | ||||||||||||
| Dryden 61 CLO Ltd. 2018-61A A1R† | 1.112% (3 Mo. LIBOR + .99% | )# | 1/17/2032 | $ | 10,720 | $ | 10,717,682 | |||||
| Dryden Senior Loan Fund 2017-47A BR† | 1.594% (3 Mo. LIBOR + 1.47% | )# | 4/15/2028 | 12,670 | 12,692,447 | |||||||
| Elmwood CLO VIII Ltd. 2021 1A B1† | 1.682% (3 Mo. LIBOR + 1.55% | )# | 1/20/2034 | 10,000 | 10,001,896 | |||||||
| Fairstone Financial Issuance Trust I 2020-1A C†(d) | 5.162% | 10/20/2039 | CAD | 20,760 | 16,641,620 | (a) | ||||||
| Fairstone Financial Issuance Trust I 2020-1A D†(d) | 6.873% | 10/20/2039 | CAD | 2,649 | 2,191,920 | (a) | ||||||
| Galaxy XXI CLO Ltd. 2015-21A AR† | 1.152% (3 Mo. LIBOR + 1.02% | )# | 4/20/2031 | $ | 1,970 | 1,971,142 | ||||||
| Gracie Point International Funding 2020 B† | 2.486% (1 Mo. LIBOR + 2.40% | )# | 5/2/2023 | 7,161 | 7,204,822 | |||||||
| Greywolf CLO VII Ltd. 2018-2A A1† | 1.312% (3 Mo. LIBOR + 1.18% | )# | 10/20/2031 | 3,800 | 3,798,116 | |||||||
| Hardee’s Funding LLC 2018-1A A2II† | 4.959% | 6/20/2048 | 3,958 | 4,186,291 | ||||||||
| HGI CRE CLO Ltd. 2021-FL1 C† | 1.789% (1 Mo. LIBOR + 1.70% | )# | 6/16/2036 | 2,350 | 2,348,402 | |||||||
| HGI CRE CLO Ltd. 2021-FL1 D† | 2.439% (1 Mo. LIBOR + 2.35% | )# | 6/16/2036 | 3,590 | 3,615,926 | |||||||
| Invesco CLO Ltd. 2021-3A B† | Zero Coupon | #(c) | 10/22/2034 | 3,810 | 3,810,000 | (a) | ||||||
| Kayne CLO 5 Ltd. 2019-5A A† | 1.474% (3 Mo. LIBOR + 1.35% | )# | 7/24/2032 | 8,700 | 8,710,859 | |||||||
| Kayne CLO Ltd. 2020-7A A1† | 1.322% (3 Mo. LIBOR + 1.20% | )# | 4/17/2033 | 11,511 | 11,528,472 | |||||||
| Kayne CLO Ltd. 2021-10A A† | Zero Coupon | #(c) | 4/23/2034 | 13,740 | 13,790,580 | |||||||
| KKR CLO Ltd. 30A CR† | 3.246% (3 Mo. LIBOR + 2.00% | )# | 10/17/2031 | 3,680 | 3,678,685 | |||||||
| KKR CLO Ltd.18 D† | 3.722% (3 Mo. LIBOR + 3.60% | )# | 7/18/2030 | 918 | 919,782 | |||||||
| KKR CLO Ltd-29A D† | 3.524% (3 Mo. LIBOR + 3.40% | )# | 1/15/2032 | 7,000 | 6,899,778 | |||||||
| Lending Funding Trust 2020-2A A† | 2.32% | 4/21/2031 | 11,751 | 11,828,119 | ||||||||
| Lendmark Funding Trust 2021-1A A† | 1.90% | 11/20/2031 | 8,300 | 8,278,152 | ||||||||
| Lendmark Funding Trust 2021-2A C† | 3.09% | 4/20/2032 | 5,380 | 5,415,280 | ||||||||
| Lendmark Funding Trust 2021-2A D† | 4.46% | 4/20/2032 | 4,025 | 4,069,449 | ||||||||
| Marble Point CLO XVII Ltd. 2020-1A A† | 1.432% (3 Mo. LIBOR + 1.30% | )# | 4/20/2033 | 7,154 | 7,154,498 | |||||||
| Mariner Finance Issuance Trust D† | 3.42% | 11/20/2036 | 6,655 | 6,675,694 | ||||||||
| Mariner Finance Issuance Trust 2021-BA E† | 4.68% | 11/20/2036 | 4,100 | 4,118,070 | ||||||||
| ME Funding LLC 2019-1 A2† | 6.448% | 7/30/2049 | 13,293 | 14,036,227 | ||||||||
| 384 | See Notes to Financial Statements. |
Schedule of Investments (continued)
TOTAL RETURN FUND November 30, 2021
| Investments | Interest Rate | Maturity Date | Principal Amount (000) | Fair Value | ||||||||
| Other (continued) | ||||||||||||
| Mountain View CLO LLC 2017-1A AR† | 1.212% (3 Mo. LIBOR + 1.09% | )# | 10/16/2029 | $ | 6,610 | $ | 6,612,126 | |||||
| Newark BSL CLO 1 Ltd. 2016-1A CR† | 3.135% (3 Mo. LIBOR + 3.00% | )# | 12/21/2029 | 4,440 | 4,445,062 | |||||||
| Oaktree CLO Ltd. 2019-4A CR† | 4.169% (3 Mo. LIBOR + 2.25% | )# | 10/20/2032 | 6,770 | 6,707,378 | |||||||
| OCP CLO Ltd. 2019-17A A1R† | 1.172% (3 Mo. LIBOR + 1.04% | )# | 7/20/2032 | 9,970 | 9,982,459 | |||||||
| Palmer Square CLO Ltd. 2021-2A A† | 1.274% (3 Mo. LIBOR + 1.15% | )# | 7/15/2034 | 11,020 | 11,028,074 | |||||||
| Parallel Ltd. 2017-1A A1R† | 1.162% (3 Mo. LIBOR + 1.03% | )# | 7/20/2029 | 2,515 | 2,513,614 | |||||||
| Planet Fitness Master Issuer LLC 2019-1A A2† | 3.858% | 12/5/2049 | 3,261 | 3,389,240 | ||||||||
| Race Point IX CLO Ltd. 2015-9A CR† | 3.324% (3 Mo. LIBOR + 3.20% | )# | 10/15/2030 | 6,090 | 5,890,975 | |||||||
| SCF Equipment Leasing LLC 2019-2A B† | 2.76% | 8/20/2026 | 9,263 | 9,471,843 | ||||||||
| SCF Equipment Leasing LLC 2021-1A D† | 1.93% | 9/20/2030 | 8,430 | 8,171,071 | ||||||||
| SEB Funding LLC 2021-1A A2† | 4.969% | 1/30/2052 | 8,715 | 8,746,226 | ||||||||
| Signal Peak CLO 2 LLC 2015-1A DR2† | 2.982% (3 Mo. LIBOR + 2.85% | )# | 4/20/2029 | 6,000 | 5,988,947 | |||||||
| Sunrun Demeter Issuer 2021-2A A† | 2.27% | 1/30/2057 | 4,646 | 4,652,844 | (a) | |||||||
| VERDE CLO Ltd. 2019-1A AR† | 1.224% (3 Mo. LIBOR + 1.10% | )# | 4/15/2032 | 10,770 | 10,771,346 | |||||||
| Voya CLO Ltd. 2019-3A CR† | 2.263% (3 Mo. LIBOR + 2.15% | )# | 10/17/2032 | 9,120 | 9,120,000 | |||||||
| Westgate Resorts LLC 2018-1A A† | 3.38% | 12/20/2031 | 774 | 778,687 | ||||||||
| Wind River CLO Ltd. 2021-4A B†(b) | Zero Coupon | #(c) | 1/20/2035 | 6,250 | 6,250,310 | |||||||
| Total | 382,576,106 | |||||||||||
| Student Loan 0.44% | ||||||||||||
| Massachusetts Educational Financing Authority 2008-1 A1 | 1.074% (3 Mo. LIBOR + .95% | )# | 4/25/2038 | 1,912 | 1,917,279 | |||||||
| Nelnet Student Loan Trust 2021-DA B† | 2.90% | 4/20/2062 | 6,900 | 7,008,632 | ||||||||
| Pennsylvania Higher Education Assistance Agency 2006-1 B | 0.394% (3 Mo. LIBOR + .27% | )# | 4/25/2038 | 1,057 | 1,008,939 | |||||||
| SLC Student Loan Trust 2008-1 A4A | 1.716% (3 Mo. LIBOR + 1.60% | )# | 12/15/2032 | 5,859 | 5,968,544 | |||||||
| Towd Point Asset Trust 2018-SL1 A† | 0.689% (1 Mo. LIBOR + .60% | )# | 1/25/2046 | 2,418 | 2,407,364 | |||||||
| Total | 18,310,758 | |||||||||||
| Total Asset-Backed Securities (cost $674,299,626) | 675,512,829 | |||||||||||
| See Notes to Financial Statements. | 385 |
Schedule of Investments (continued)
TOTAL RETURN FUND November 30, 2021
| Investments | Shares (000) | Fair Value | ||||||||||
| COMMON STOCKS 0.00% | ||||||||||||
| Oil, Gas & Consumable Fuels | ||||||||||||
| Dommo Energia SA*(d) (cost $10,494) | BRL | 61 | $ | 6,657 | ||||||||
| Interest Rate | Maturity Date | Principal Amount (000) | ||||||||||
| CORPORATE BONDS 32.52% | ||||||||||||
| Advertising 0.10% | ||||||||||||
| Clear Channel Outdoor Holdings, Inc.† | 7.75% | 4/15/2028 | $ | 4,129 | 4,313,515 | |||||||
| Aerospace/Defense 0.20% | ||||||||||||
| Bombardier, Inc. (Canada)†(e) | 6.00% | 2/15/2028 | 4,152 | 4,128,167 | ||||||||
| TransDigm, Inc. | 6.375% | 6/15/2026 | 3,913 | 4,030,038 | ||||||||
| Total | 8,158,205 | |||||||||||
| Agriculture 0.18% | ||||||||||||
| MHP Lux SA (Luxembourg)†(e) | 6.25% | 9/19/2029 | 7,870 | 7,417,475 | ||||||||
| Airlines 0.90% | ||||||||||||
| Air Canada (Canada)†(e) | 3.875% | 8/15/2026 | 4,177 | 4,149,369 | ||||||||
| American Airlines Group, Inc.† | 3.75% | 3/1/2025 | 4,678 | 4,174,133 | ||||||||
| American Airlines, Inc.† | 11.75% | 7/15/2025 | 3,839 | 4,661,986 | ||||||||
| British Airways 2020-1 Class A Pass Through Trust (United Kingdom)†(e) | 4.25% | 11/15/2032 | 6,284 | 6,799,081 | ||||||||
| Delta Air Lines, Inc.† | 7.00% | 5/1/2025 | 8,298 | 9,539,630 | ||||||||
| Delta Air Lines, Inc./SkyMiles IP Ltd.† | 4.50% | 10/20/2025 | 3,691 | 3,871,228 | ||||||||
| Delta Air Lines, Inc./SkyMiles IP Ltd.† | 4.75% | 10/20/2028 | 3,739 | 4,100,987 | ||||||||
| Total | 37,296,414 | |||||||||||
| Apparel 0.21% | ||||||||||||
| Levi Strauss & Co.† | 3.50% | 3/1/2031 | 6,207 | 6,319,657 | ||||||||
| PVH Corp. | 7.75% | 11/15/2023 | 2,290 | 2,582,365 | ||||||||
| Total | 8,902,022 | |||||||||||
| Auto Manufacturers 0.94% | ||||||||||||
| Ford Motor Co. | 3.25% | 2/12/2032 | 12,396 | 12,416,330 | ||||||||
| General Motors Financial Co., Inc. | 3.60% | 6/21/2030 | 25,126 | 26,667,394 | ||||||||
| Total | 39,083,724 | |||||||||||
| 386 | See Notes to Financial Statements. |
Schedule of Investments (continued)
TOTAL RETURN FUND November 30, 2021
| Investments | Interest Rate | Maturity Date | Principal Amount (000) | Fair Value | ||||||||
| Banks 7.17% | ||||||||||||
| Bank of America Corp. | 2.087% (SOFR + 1.06% | )# | 6/14/2029 | $ | 9,122 | $ | 9,004,716 | |||||
| Bank of America Corp. | 2.687% (SOFR + 1.32% | )# | 4/22/2032 | 13,448 | 13,625,760 | |||||||
| Bank of America Corp. | 3.593% (3 Mo. LIBOR + 1.37% | )# | 7/21/2028 | 10,476 | 11,272,529 | |||||||
| Bank of America Corp. | 3.97% (3 Mo. LIBOR + 1.07% | )# | 3/5/2029 | 5,597 | 6,158,037 | |||||||
| Bank of America Corp. | 4.00% | 1/22/2025 | 4,554 | 4,873,979 | ||||||||
| Bank of America Corp. | 4.45% | 3/3/2026 | 4,792 | 5,276,598 | ||||||||
| BankUnited, Inc. | 5.125% | 6/11/2030 | 6,768 | 7,785,668 | ||||||||
| BNP Paribas SA (France)†(e) | 4.375% (5 Yr. Swap rate + 1.48% | )# | 3/1/2033 | 9,625 | 10,493,070 | |||||||
| Citigroup, Inc. | 2.666% (SOFR + 1.15% | )# | 1/29/2031 | 4,013 | 4,077,597 | |||||||
| Citigroup, Inc. | 3.887% (3 Mo. LIBOR + 1.56% | )# | 1/10/2028 | 13,692 | 14,854,565 | |||||||
| Citigroup, Inc. | 3.98% (3 Mo. LIBOR + 1.34% | )# | 3/20/2030 | 26,656 | 29,549,802 | |||||||
| Danske Bank A/S (Denmark)†(e) | 4.375% | 6/12/2028 | 200 | 223,952 | ||||||||
| Goldman Sachs Group, Inc. (The) | 2.383% (SOFR + 1.25% | )# | 7/21/2032 | 15,695 | 15,411,118 | |||||||
| JPMorgan Chase & Co. | 3.54% (3 Mo. LIBOR + 1.38% | )# | 5/1/2028 | 14,941 | 16,054,091 | |||||||
| JPMorgan Chase & Co. | 3.782% (3 Mo. LIBOR + 1.34% | )# | 2/1/2028 | 5,679 | 6,158,715 | |||||||
| Macquarie Bank Ltd. (Australia)†(e) | 3.624% | 6/3/2030 | 2,821 | 2,926,742 | ||||||||
| Macquarie Group Ltd. (Australia)†(e) | 2.691% (SOFR + 1.44% | )# | 6/23/2032 | 11,002 | 10,959,934 | |||||||
| Macquarie Group Ltd. (Australia)†(e) | 4.654% (3 Mo. LIBOR + 1.73% | )# | 3/27/2029 | 9,640 | 10,927,777 | |||||||
| Morgan Stanley | 2.239% (SOFR + 1.18% | )# | 7/21/2032 | 8,325 | 8,164,537 | |||||||
| Morgan Stanley | 2.484% (SOFR + 1.36% | )# | 9/16/2036 | 6,328 | 6,128,143 | |||||||
| Morgan Stanley | 3.625% | 1/20/2027 | 7,496 | 8,119,251 | ||||||||
| Morgan Stanley | 4.431% (3 Mo. LIBOR + 1.63% | )# | 1/23/2030 | 17,350 | 19,805,895 | |||||||
| National Australia Bank Ltd. (Australia)†(e) | 2.99% | 5/21/2031 | 3,132 | 3,153,268 | ||||||||
| Santander Holdings USA, Inc. | 4.40% | 7/13/2027 | 3,856 | 4,255,893 | ||||||||
| UBS AG (Switzerland)(e) | 5.125% | 5/15/2024 | 9,363 | 10,076,929 | ||||||||
| Wells Fargo & Co. | 2.393% (SOFR + 2.10% | )# | 6/2/2028 | 20,155 | 20,429,966 | |||||||
| Wells Fargo & Co. | 3.584% (3 Mo. LIBOR + 1.31% | )# | 5/22/2028 | 10,914 | 11,758,514 | |||||||
| See Notes to Financial Statements. | 387 |
Schedule of Investments (continued)
TOTAL RETURN FUND November 30, 2021
| Investments | Interest Rate | Maturity Date | Principal Amount (000) | Fair Value | ||||||||
| Banks (continued) | ||||||||||||
| Westpac Banking Corp. (Australia)(e) | 2.894% (5 Yr. Treasury CMT + 1.35% | )# | 2/4/2030 | $ | 6,432 | $ | 6,586,624 | |||||
| Westpac Banking Corp. (Australia)(e) | 4.322% (USISDA05 + 2.24% | )# | 11/23/2031 | 17,998 | 19,537,708 | |||||||
| Total | 297,651,378 | |||||||||||
| Building Materials 0.21% | ||||||||||||
| Cemex SAB de CV (Mexico)†(e) | 5.45% | 11/19/2029 | 5,645 | 5,921,831 | ||||||||
| Griffon Corp. | 5.75% | 3/1/2028 | 2,703 | 2,791,509 | ||||||||
| Total | 8,713,340 | |||||||||||
| Chemicals 0.45% | ||||||||||||
| Braskem Netherlands Finance BV (Netherlands)†(e) | 4.50% | 1/31/2030 | 7,064 | 7,076,044 | ||||||||
| CVR Partners LP/CVR Nitrogen Finance Corp.† | 6.125% | 6/15/2028 | 3,972 | 4,126,749 | ||||||||
| Phosagro OAO Via Phosagro Bond Funding DAC (Ireland)†(e) | 2.60% | 9/16/2028 | 7,540 | 7,400,390 | ||||||||
| Total | 18,603,183 | |||||||||||
| Coal 0.19% | ||||||||||||
| SunCoke Energy, Inc.† | 4.875% | 6/30/2029 | 4,099 | 3,989,434 | ||||||||
| Warrior Met Coal, Inc.† | 8.00% | 11/1/2024 | 3,800 | 3,889,395 | ||||||||
| Total | 7,878,829 | |||||||||||
| Commercial Services 0.20% | ||||||||||||
| Rent-A-Center, Inc.† | 6.375% | 2/15/2029 | 4,068 | 4,178,975 | ||||||||
| United Rentals North America, Inc. | 4.00% | 7/15/2030 | 4,045 | 4,126,547 | ||||||||
| Total | 8,305,522 | |||||||||||
| Computers 0.40% | ||||||||||||
| CA Magnum Holdings (Mauritius)†(e) | 5.375% | 10/31/2026 | 3,765 | 3,854,419 | ||||||||
| Dell International LLC/EMC Corp. | 8.35% | 7/15/2046 | 7,530 | 12,586,309 | ||||||||
| Total | 16,440,728 | |||||||||||
| Cosmetics/Personal Care 0.10% | ||||||||||||
| Coty, Inc.† | 5.00% | 4/15/2026 | 4,045 | 4,128,671 | ||||||||
| Diversified Financial Services 3.02% | ||||||||||||
| AerCap Ireland Capital DAC/AerCap Global Aviation Trust (Ireland)(e) | 3.30% | 1/30/2032 | 3,220 | 3,247,037 | ||||||||
| AerCap Ireland Capital DAC/AerCap Global Aviation Trust (Ireland)(e) | 3.50% | 1/15/2025 | 10,075 | 10,533,580 | ||||||||
| 388 | See Notes to Financial Statements. |
Schedule of Investments (continued)
TOTAL RETURN FUND November 30, 2021
| Investments | Interest Rate | Maturity Date | Principal Amount (000) | Fair Value | ||||||||
| Diversified Financial Services (continued) | ||||||||||||
| AerCap Ireland Capital DAC/AerCap Global Aviation Trust (Ireland)(e) | 3.875% | 1/23/2028 | $ | 6,006 | $ | 6,394,838 | ||||||
| AerCap Ireland Capital DAC/AerCap Global Aviation Trust (Ireland)(e) | 4.875% | 1/16/2024 | 2,348 | 2,510,049 | ||||||||
| Aircastle Ltd.† | 2.85% | 1/26/2028 | 12,605 | 12,680,139 | ||||||||
| Ally Financial, Inc. | 4.70% (5 Yr. Treasury CMT + 3.87% | )# | – | (f) | 4,022 | 4,160,256 | ||||||
| Ally Financial, Inc. | 8.00% | 11/1/2031 | 7,429 | 10,516,207 | ||||||||
| Aviation Capital Group LLC† | 1.95% | 1/30/2026 | 4,918 | 4,829,513 | ||||||||
| Aviation Capital Group LLC† | 5.50% | 12/15/2024 | 11,453 | 12,616,121 | ||||||||
| Avolon Holdings Funding Ltd. (Ireland)†(e) | 2.125% | 2/21/2026 | 11,378 | 11,146,380 | ||||||||
| Avolon Holdings Funding Ltd. (Ireland)†(e) | 4.25% | 4/15/2026 | 8,427 | 9,003,753 | ||||||||
| Brightsphere Investment Group, Inc. | 4.80% | 7/27/2026 | 1,727 | 1,790,927 | ||||||||
| Coinbase Global, Inc.† | 3.375% | 10/1/2028 | 4,300 | 4,048,945 | ||||||||
| Global Aircraft Leasing Co. Ltd. PIK 7.25%† | 6.50% | 9/15/2024 | 6,139 | 5,879,410 | ||||||||
| Nationstar Mortgage Holdings, Inc.† | 5.50% | 8/15/2028 | 4,065 | 4,056,179 | ||||||||
| Navient Corp. | 5.00% | 3/15/2027 | 4,040 | 4,063,089 | ||||||||
| Neuberger Berman Group LLC/Neuberger Berman Finance Corp.† | 4.50% | 3/15/2027 | 3,612 | 4,026,673 | ||||||||
| Neuberger Berman Group LLC/Neuberger Berman Finance Corp.† | 4.875% | 4/15/2045 | 4,780 | 5,761,294 | ||||||||
| OneMain Finance Corp. | 5.375% | 11/15/2029 | 3,612 | 3,808,403 | ||||||||
| Rocket Mortgage LLC/Rocket Mortgage Co-Issuer, Inc.† | 3.625% | 3/1/2029 | 4,198 | 4,111,836 | ||||||||
| Total | 125,184,629 | |||||||||||
| Electric 2.29% | ||||||||||||
| AES Corp. (The)† | 3.95% | 7/15/2030 | 6,812 | 7,361,285 | ||||||||
| Alfa Desarrollo S.p.A. (Chile)†(e) | 4.55% | 9/27/2051 | 5,778 | 5,513,223 | ||||||||
| Ausgrid Finance Pty Ltd. (Australia)†(e) | 4.35% | 8/1/2028 | 7,038 | 7,951,910 | ||||||||
| Calpine Corp.† | 5.00% | 2/1/2031 | 4,293 | 4,138,151 | ||||||||
| Cikarang Listrindo Tbk PT (Indonesia)†(e) | 4.95% | 9/14/2026 | 6,150 | 6,270,724 | ||||||||
| Emera US Finance LP | 3.55% | 6/15/2026 | 26,765 | 28,665,881 | ||||||||
| FirstEnergy Corp. | 4.40% | 7/15/2027 | 8,370 | 8,956,408 | ||||||||
| Minejesa Capital BV (Netherlands)†(e) | 4.625% | 8/10/2030 | 7,792 | 8,084,200 | ||||||||
| NRG Energy, Inc.† | 4.45% | 6/15/2029 | 3,410 | 3,723,235 | ||||||||
| Pennsylvania Electric Co.† | 3.60% | 6/1/2029 | 3,906 | 4,134,780 | ||||||||
| Vistra Operations Co. LLC† | 3.55% | 7/15/2024 | 9,911 | 10,279,568 | ||||||||
| Total | 95,079,365 | |||||||||||
| See Notes to Financial Statements. | 389 |
Schedule of Investments (continued)
TOTAL RETURN FUND November 30, 2021
| Investments | Interest Rate | Maturity Date | Principal Amount (000) | Fair Value | ||||||||
| Entertainment 0.39% | ||||||||||||
| Caesars Entertainment, Inc.† | 4.625% | 10/15/2029 | $ | 3,298 | $ | 3,220,200 | ||||||
| Caesars Entertainment, Inc.† | 8.125% | 7/1/2027 | 4,009 | 4,404,187 | ||||||||
| Live Nation Entertainment, Inc.† | 4.75% | 10/15/2027 | 4,211 | 4,215,759 | ||||||||
| Scientific Games International, Inc.† | 7.25% | 11/15/2029 | 3,853 | 4,255,369 | ||||||||
| Total | 16,095,515 | |||||||||||
| Environmental Control 0.09% | ||||||||||||
| Madison IAQ LLC† | 5.875% | 6/30/2029 | 4,018 | 3,871,986 | ||||||||
| Food 0.19% | ||||||||||||
| Albertsons Cos, Inc./Safeway, Inc./ New Albertsons LP/Albertsons LLC† | 4.875% | 2/15/2030 | 3,763 | 4,006,429 | ||||||||
| JBS USA LUX SA/JBS USA Food Co./JBS USA Finance, Inc.† | 6.50% | 4/15/2029 | 3,667 | 4,023,414 | ||||||||
| Total | 8,029,843 | |||||||||||
| Forest Products & Paper 0.10% | ||||||||||||
| Mercer International, Inc. (Canada)(e) | 5.125% | 2/1/2029 | 4,098 | 4,055,135 | ||||||||
| Gas 0.20% | ||||||||||||
| National Fuel Gas Co. | 5.50% | 1/15/2026 | 7,186 | 8,147,779 | ||||||||
| Health Care-Services 1.46% | ||||||||||||
| Centene Corp. | 2.45% | 7/15/2028 | 3,197 | 3,142,203 | ||||||||
| Centene Corp. | 2.625% | 8/1/2031 | 2,590 | 2,501,642 | ||||||||
| Centene Corp. | 3.375% | 2/15/2030 | 3,950 | 3,983,328 | ||||||||
| Centene Corp. | 4.25% | 12/15/2027 | 2,984 | 3,099,496 | ||||||||
| CHS/Community Health Systems, Inc.† | 4.75% | 2/15/2031 | 4,089 | 4,034,054 | ||||||||
| CHS/Community Health Systems, Inc.† | 6.125% | 4/1/2030 | 4,000 | 3,840,060 | ||||||||
| DaVita, Inc.† | 3.75% | 2/15/2031 | 4,196 | 3,898,084 | ||||||||
| HCA, Inc. | 4.125% | 6/15/2029 | 12,892 | 14,184,723 | ||||||||
| HCA, Inc. | 4.50% | 2/15/2027 | 5,323 | 5,860,567 | ||||||||
| HCA, Inc. | 5.25% | 6/15/2026 | 1,729 | 1,946,642 | ||||||||
| Radiology Partners, Inc.† | 9.25% | 2/1/2028 | 4,152 | 4,239,441 | ||||||||
| Surgery Center Holdings, Inc.† | 10.00% | 4/15/2027 | 3,684 | 3,930,939 | ||||||||
| Tenet Healthcare Corp.† | 4.875% | 1/1/2026 | 4,000 | 4,094,620 | ||||||||
| Tenet Healthcare Corp.† | 6.25% | 2/1/2027 | 1,883 | 1,953,424 | ||||||||
| Total | 60,709,223 | |||||||||||
| Home Builders 0.43% | ||||||||||||
| Century Communities, Inc. | 6.75% | 6/1/2027 | 3,686 | 3,873,756 | ||||||||
| NVR, Inc. | 3.00% | 5/15/2030 | 5,628 | 5,869,848 | ||||||||
| 390 | See Notes to Financial Statements. |
Schedule of Investments (continued)
TOTAL RETURN FUND November 30, 2021
| Investments | Interest Rate | Maturity Date | Principal Amount (000) | Fair Value | ||||||||
| Home Builders (continued) | ||||||||||||
| Toll Brothers Finance Corp. | 3.80% | 11/1/2029 | $ | 3,800 | $ | 4,022,661 | ||||||
| Toll Brothers Finance Corp. | 4.35% | 2/15/2028 | 3,884 | 4,204,857 | ||||||||
| Total | 17,971,122 | |||||||||||
| Housewares 0.06% | ||||||||||||
| Newell Brands, Inc. | 5.875% | 4/1/2036 | 1,886 | 2,306,154 | ||||||||
| Insurance 0.21% | ||||||||||||
| Assurant, Inc. | 2.65% | 1/15/2032 | 3,488 | 3,444,954 | ||||||||
| First American Financial Corp. | 2.40% | 8/15/2031 | 5,418 | 5,279,481 | ||||||||
| Total | 8,724,435 | |||||||||||
| Internet 0.64% | ||||||||||||
| GrubHub Holdings, Inc.† | 5.50% | 7/1/2027 | 3,740 | 3,757,728 | ||||||||
| Match Group Holdings II LLC† | 5.00% | 12/15/2027 | 1,980 | 2,068,199 | ||||||||
| Match Group Holdings II LLC† | 5.625% | 2/15/2029 | 1,858 | 1,991,813 | ||||||||
| Netflix, Inc.† | 4.875% | 6/15/2030 | 3,591 | 4,164,213 | ||||||||
| Netflix, Inc. | 6.375% | 5/15/2029 | 5,169 | 6,420,932 | ||||||||
| Uber Technologies, Inc.† | 4.50% | 8/15/2029 | 4,208 | 4,173,810 | ||||||||
| Uber Technologies, Inc.† | 8.00% | 11/1/2026 | 3,839 | 4,092,451 | ||||||||
| Total | 26,669,146 | |||||||||||
| Investment Companies 0.11% | ||||||||||||
| Owl Rock Capital Corp. | 2.875% | 6/11/2028 | 4,791 | 4,684,391 | ||||||||
| Leisure Time 0.22% | ||||||||||||
| Carnival Corp.† | 7.625% | 3/1/2026 | 2,521 | 2,590,327 | ||||||||
| Life Time, Inc.† | 5.75% | 1/15/2026 | 4,059 | 4,119,581 | ||||||||
| Royal Caribbean Cruises Ltd.† | 11.50% | 6/1/2025 | 2,127 | 2,377,624 | ||||||||
| Total | 9,087,532 | |||||||||||
| Lodging 0.13% | ||||||||||||
| Boyd Gaming Corp. | 4.75% | 12/1/2027 | 2,038 | 2,071,250 | ||||||||
| Boyd Gaming Corp.† | 4.75% | 6/15/2031 | 3,292 | 3,279,655 | ||||||||
| Total | 5,350,905 | |||||||||||
| Machinery-Diversified 0.49% | ||||||||||||
| nVent Finance Sarl (Luxembourg)(e) | 4.55% | 4/15/2028 | 13,974 | 15,625,698 | ||||||||
| TK Elevator US Newco, Inc.† | 5.25% | 7/15/2027 | 4,654 | 4,739,936 | ||||||||
| Total | 20,365,634 | |||||||||||
| Media 0.70% | ||||||||||||
| CCO Holdings LLC / CCO Holdings Capital Corp.† | 4.75% | 3/1/2030 | 1,900 | 1,949,523 | ||||||||
| See Notes to Financial Statements. | 391 |
Schedule of Investments (continued)
TOTAL RETURN FUND November 30, 2021
| Investments | Interest Rate | Maturity Date | Principal Amount (000) | Fair Value | ||||||||
| Media (continued) | ||||||||||||
| CCO Holdings LLC / CCO Holdings Capital Corp.† | 5.00% | 2/1/2028 | $ | 1,951 | $ | 2,012,886 | ||||||
| Charter Communications Operating LLC/Charter Communications Operating Capital | 2.25% | 1/15/2029 | 13,371 | 12,969,178 | ||||||||
| Diamond Sports Group LLC/Diamond Sports Finance Co.† | 5.375% | 8/15/2026 | 5,154 | 2,293,195 | ||||||||
| Time Warner Cable LLC | 7.30% | 7/1/2038 | 2,682 | 3,853,292 | ||||||||
| Time Warner Entertainment Co. LP | 8.375% | 7/15/2033 | 4,078 | 6,018,617 | ||||||||
| Total | 29,096,691 | |||||||||||
| Mining 1.51% | ||||||||||||
| Alcoa Nederland Holding BV (Netherland)†(e) | 4.125% | 3/31/2029 | 4,011 | 4,096,956 | ||||||||
| Anglo American Capital plc (United Kingdom)†(e) | 4.00% | 9/11/2027 | 10,010 | 10,802,529 | ||||||||
| FMG Resources August 2006 Pty Ltd. (Australia)†(e) | 4.375% | 4/1/2031 | 3,984 | 4,044,477 | ||||||||
| FMG Resources August 2006 Pty Ltd. (Australia)†(e) | 4.50% | 9/15/2027 | 2,435 | 2,527,847 | ||||||||
| Freeport-McMoRan, Inc. | 4.125% | 3/1/2028 | 4,026 | 4,140,962 | ||||||||
| Freeport-McMoRan, Inc. | 4.625% | 8/1/2030 | 5,691 | 6,019,257 | ||||||||
| Freeport-McMoRan, Inc. | 5.45% | 3/15/2043 | 3,196 | 3,945,094 | ||||||||
| Glencore Funding LLC† | 2.85% | 4/27/2031 | 6,534 | 6,506,560 | ||||||||
| Glencore Funding LLC† | 4.875% | 3/12/2029 | 18,042 | 20,545,858 | ||||||||
| Total | 62,629,540 | |||||||||||
| Oil & Gas 3.33% | ||||||||||||
| Apache Corp. | 4.375% | 10/15/2028 | 2,230 | 2,354,211 | ||||||||
| Apache Corp. | 4.625% | 11/15/2025 | 2,966 | 3,139,822 | ||||||||
| California Resources Corp.† | 7.125% | 2/1/2026 | 2,119 | 2,187,126 | ||||||||
| Callon Petroleum Co.† | 8.00% | 8/1/2028 | 3,955 | 3,878,926 | ||||||||
| Comstock Resources, Inc.† | 6.75% | 3/1/2029 | 3,889 | 4,052,591 | ||||||||
| Continental Resources, Inc.† | 5.75% | 1/15/2031 | 5,617 | 6,553,719 | ||||||||
| Diamondback Energy, Inc. | 3.50% | 12/1/2029 | 14,958 | 15,710,284 | ||||||||
| Diamondback Energy, Inc. | 4.75% | 5/31/2025 | 1,559 | 1,709,326 | ||||||||
| Helmerich & Payne, Inc.† | 2.90% | 9/29/2031 | 7,656 | 7,491,248 | ||||||||
| Hilcorp Energy I LP/Hilcorp Finance Co.† | 5.75% | 2/1/2029 | 3,576 | 3,525,721 | ||||||||
| Hilcorp Energy I LP/Hilcorp Finance Co.† | 6.25% | 11/1/2028 | 4,412 | 4,488,107 | ||||||||
| Laredo Petroleum, Inc. | 9.50% | 1/15/2025 | 5,672 | 5,655,296 | ||||||||
| MEG Energy Corp. (Canada)†(e) | 5.875% | 2/1/2029 | 2,270 | 2,255,983 | ||||||||
| MEG Energy Corp. (Canada)†(e) | 7.125% | 2/1/2027 | 7,431 | 7,610,087 | ||||||||
| Murphy Oil Corp. | 5.875% | 12/1/2027 | 4,044 | 4,124,900 | ||||||||
| Occidental Petroleum Corp. | 6.125% | 1/1/2031 | 6,743 | 7,868,070 | ||||||||
| OGX Austria GmbH (Brazil)†(e)(g) | 8.50% | 6/1/2018 | 1,730 | 35 | ||||||||
| Ovintiv, Inc. | 6.50% | 2/1/2038 | 3,359 | 4,286,000 | ||||||||
| 392 | See Notes to Financial Statements. |
Schedule of Investments (continued)
TOTAL RETURN FUND November 30, 2021
| Investments | Interest Rate | Maturity Date | Principal Amount (000) | Fair Value | ||||||||
| Oil & Gas (continued) | ||||||||||||
| Petroleos Mexicanos (Mexico)(e) | 4.50% | 1/23/2026 | $ | 6,372 | $ | 6,251,537 | ||||||
| Petroleos Mexicanos (Mexico)(e) | 5.35% | 2/12/2028 | 8,508 | 8,198,054 | ||||||||
| Qatar Petroleum (Saudi Arabia)†(e) | 3.125% | 7/12/2041 | 6,000 | 6,030,330 | ||||||||
| Range Resources Corp.† | 8.25% | 1/15/2029 | 3,803 | 4,196,725 | ||||||||
| SA Global Sukuk Ltd.† | 2.694% | 6/17/2031 | 8,200 | 8,202,509 | ||||||||
| SM Energy Co. | 5.625% | 6/1/2025 | 1,886 | 1,871,600 | ||||||||
| SM Energy Co. | 6.75% | 9/15/2026 | 3,462 | 3,478,444 | ||||||||
| Southwestern Energy Co. | 7.75% | 10/1/2027 | 3,797 | 4,077,029 | ||||||||
| Tengizchevroil Finance Co. International Ltd. (Kazakhstan)†(e) | 3.25% | 8/15/2030 | 2,900 | 2,866,882 | ||||||||
| Transocean Guardian Ltd.† | 5.875% | 1/15/2024 | 4,392 | 4,138,001 | ||||||||
| Viper Energy Partners LP† | 5.375% | 11/1/2027 | 2,028 | 2,093,231 | ||||||||
| Total | 138,295,794 | |||||||||||
| Oil & Gas Services 0.10% | ||||||||||||
| Weatherford International Ltd.† | 8.625% | 4/30/2030 | 4,017 | 3,944,091 | ||||||||
| Pharmaceuticals 0.11% | ||||||||||||
| Bayer Corp.† | 6.65% | 2/15/2028 | 3,872 | 4,726,218 | ||||||||
| Pipelines 1.40% | ||||||||||||
| Buckeye Partners LP | 6.375% (3 Mo. LIBOR + 4.02% | )# | 1/22/2078 | 5,092 | 4,509,653 | |||||||
| Cheniere Corpus Christi Holdings LLC | 3.70% | 11/15/2029 | 5,602 | 5,989,238 | ||||||||
| Eastern Gas Transmission & Storage, Inc.† | 3.00% | 11/15/2029 | 4,956 | 5,166,105 | ||||||||
| Galaxy Pipeline Assets Bidco Ltd. (United Arab Emirates)†(e) | 3.25% | 9/30/2040 | 9,000 | 9,024,381 | ||||||||
| NGPL PipeCo LLC† | 3.25% | 7/15/2031 | 8,174 | 8,290,522 | ||||||||
| Sabine Pass Liquefaction LLC | 5.875% | 6/30/2026 | 13,221 | 15,212,975 | ||||||||
| Western Midstream Operating LP | 5.30% | 2/1/2030 | 9,358 | 10,086,052 | ||||||||
| Total | 58,278,926 | |||||||||||
| REITS 1.26% | ||||||||||||
| American Campus Communities | ||||||||||||
| Operating Partnership LP | 2.25% | 1/15/2029 | 3,469 | 3,441,099 | ||||||||
| American Homes 4 Rent LP | 2.375% | 7/15/2031 | 5,072 | 5,024,420 | ||||||||
| Blackstone Mortgage Trust, Inc.† | 3.75% | 1/15/2027 | 5,857 | 5,777,520 | ||||||||
| EPR Properties | 3.75% | 8/15/2029 | 8,520 | 8,735,128 | ||||||||
| EPR Properties | 4.95% | 4/15/2028 | 6,790 | 7,439,439 | ||||||||
| Invitation Homes Operating Partnership LP | 2.00% | 8/15/2031 | 10,401 | 9,876,464 | ||||||||
| See Notes to Financial Statements. | 393 |
Schedule of Investments (continued)
TOTAL RETURN FUND November 30, 2021
| Investments | Interest Rate | Maturity Date | Principal Amount (000) | Fair Value | ||||||||
| REITS (continued) | ||||||||||||
| Invitation Homes Operating Partnership LP | 2.30% | 11/15/2028 | $ | 4,124 | $ | 4,094,773 | ||||||
| Physicians Realty LP | 2.625% | 11/1/2031 | 7,926 | 7,928,028 | ||||||||
| Total | 52,316,871 | |||||||||||
| Retail 1.03% | ||||||||||||
| Bath & Body Works, Inc. | 6.875% | 11/1/2035 | 3,290 | 3,957,097 | ||||||||
| Carvana Co.† | 5.875% | 10/1/2028 | 3,892 | 3,912,803 | ||||||||
| CEC Entertainment LLC† | 6.75% | 5/1/2026 | 4,131 | 4,032,537 | ||||||||
| Gap, Inc. (The)† | 3.875% | 10/1/2031 | 4,176 | 4,002,988 | ||||||||
| Kohl’s Corp. | 5.55% | 7/17/2045 | 6,406 | 7,740,897 | ||||||||
| Party City Holdings, Inc.† | 8.75% | 2/15/2026 | 6,053 | 6,114,680 | ||||||||
| Penske Automotive Group, Inc. | 3.50% | 9/1/2025 | 4,227 | 4,282,902 | ||||||||
| PetSmart, Inc./PetSmart Finance Corp.† | 4.75% | 2/15/2028 | 4,581 | 4,643,760 | ||||||||
| Staples, Inc.† | 7.50% | 4/15/2026 | 4,129 | 4,105,795 | ||||||||
| Total | 42,793,459 | |||||||||||
| Semiconductors 0.32% | ||||||||||||
| Skyworks Solutions, Inc. | 3.00% | 6/1/2031 | 8,516 | 8,645,915 | ||||||||
| TSMC Arizona Corp. | 3.25% | 10/25/2051 | 4,300 | 4,633,211 | ||||||||
| Total | 13,279,126 | |||||||||||
| Software 0.88% | ||||||||||||
| Oracle Corp. | 2.875% | 3/25/2031 | 22,604 | 23,150,108 | ||||||||
| VMware, Inc. | 4.70% | 5/15/2030 | 11,456 | 13,312,249 | ||||||||
| Total | 36,462,357 | |||||||||||
| Telecommunications 0.40% | ||||||||||||
| Connect Finco SARL/Connect US Finco LLC (Luxembourg)†(e) | 6.75% | 10/1/2026 | 3,783 | 3,949,187 | ||||||||
| Frontier Communications Holdings LLC† | 5.00% | 5/1/2028 | 4,819 | 4,841,408 | ||||||||
| LogMeIn, Inc.† | 5.50% | 9/1/2027 | 4,083 | 4,068,587 | ||||||||
| Sprint Capital Corp. | 6.875% | 11/15/2028 | 3,140 | 3,881,543 | ||||||||
| Total | 16,740,725 | |||||||||||
| Transportation 0.10% | ||||||||||||
| Watco Cos LLC/Watco Finance Corp.† | 6.50% | 6/15/2027 | 3,844 | 4,035,739 | ||||||||
| Water 0.10% | ||||||||||||
| Aegea Finance Sarl (Luxembourg)†(e) | 5.75% | 10/10/2024 | 3,936 | 4,013,519 | ||||||||
| Total Corporate Bonds (cost $1,332,426,897) | 1,349,838,856 | |||||||||||
| 394 | See Notes to Financial Statements. |
Schedule of Investments (continued)
TOTAL RETURN FUND November 30, 2021
| Investments | Interest Rate | Maturity Date | Principal Amount (000) | Fair Value | ||||||||
| FLOATING RATE LOANS(h) 2.48% | ||||||||||||
| Advertising 0.35% | ||||||||||||
| Lamar Media Corporation 2020 Term Loan B | 1.589% (1 Mo. LIBOR + 1.50% | ) | 2/5/2027 | $ | 14,572 | $ | 14,513,328 | |||||
| Aerospace/Defense 0.10% | ||||||||||||
| WP CPP Holdings, LLC 2018 Term Loan | 4.75% (1 Mo. LIBOR + 3.75% (3 Mo. LIBOR + 3.75% | ) ) ) | 4/30/2025 | 4,169 | 4,021,964 | |||||||
| Air Transportation 0.34% | ||||||||||||
| AAdvantage Loyalty IP Ltd. 2021 Term Loan | 5.50% (3 Mo. LIBOR + 4.75% | ) | 4/20/2028 | 7,814 | 8,043,731 | |||||||
| United Airlines, Inc. 2021 Term Loan B | 4.50% (3 Mo. LIBOR + 3.75% | ) | 4/21/2028 | 6,170 | 6,171,697 | |||||||
| Total | 14,215,428 | |||||||||||
| Automotive 0.10% | ||||||||||||
| American Trailer World Corp. Term Loan B | 4.50% (1 Mo. LIBOR + 3.75% | ) | 3/3/2028 | 4,090 | 4,055,682 | |||||||
| Business Services 0.11% | ||||||||||||
| Trans Union, LLC 2021 2nd Lien Term Loan | - | (i) | 11/16/2029 | 1,003 | 1,003,444 | (a) | ||||||
| Trans Union, LLC 2021 Term Loan B6(j) | - | (i) | 11/16/2028 | 3,764 | 3,746,433 | |||||||
| Total | 4,749,877 | |||||||||||
| Computer Software 0.30% | ||||||||||||
| Polaris Newco LLC USD Term Loan B | 4.50% (6 Mo. LIBOR + 4.00% | ) | 6/2/2028 | 6,273 | 6,257,336 | |||||||
| Red Planet Borrower, LLC Term Loan B | 4.25% (3 Mo. LIBOR + 3.75% | ) | 10/2/2028 | 6,100 | 6,060,350 | |||||||
| Total | 12,317,686 | |||||||||||
| Entertainment 0.41% | ||||||||||||
| Playtika Holding Corp 2021 Term Loan (Israel)(e) | 2.84% (1 Mo. LIBOR + 2.75% | ) | 3/13/2028 | 8,743 | 8,698,928 | |||||||
| Scientific Games International, Inc. 2018 Term Loan B5 | 2.84% (1 Mo. LIBOR + 2.75% | ) | 8/14/2024 | 8,300 | 8,249,868 | |||||||
| Total | 16,948,796 | |||||||||||
| See Notes to Financial Statements. | 395 |
Schedule of Investments (continued)
TOTAL RETURN FUND November 30, 2021
| Investments | Interest Rate | Maturity Date | Principal Amount (000) | Fair Value | ||||||||
| Health Care Services 0.10% | ||||||||||||
| MED ParentCo LP 1st Lien Term Loan | 4.34% (1 Mo. LIBOR + 4.25% | ) | 8/31/2026 | $ | 4,349 | $ | 4,338,266 | |||||
| Household Furnishings 0.10% | ||||||||||||
| Springs Windows Fashions, LLC 2021 Term Loan B | 4.75% (1 Mo. LIBOR + 4.00% | ) | 10/6/2028 | 4,200 | 4,151,007 | |||||||
| Oil 0.11% | ||||||||||||
| Brazos Delaware II, LLC Term Loan B | 4.091% (1 Mo. LIBOR + 4.00% | ) | 5/21/2025 | 4,548 | 4,448,031 | |||||||
| Oil: Integrated Domestic 0.16% | ||||||||||||
| BCP Raptor II, LLC 1st Lien Term Loan | 4.84% (1 Mo. LIBOR + 4.75% | ) | 11/3/2025 | 6,796 | 6,777,138 | |||||||
| Services 0.10% | ||||||||||||
| KUEHG Corp. 2018 Incremental Term Loan | 4.75% (3 Mo. LIBOR + 3.75% | ) | 2/21/2025 | 4,372 | 4,293,942 | |||||||
| Telecommunications 0.20% | ||||||||||||
| SSH Group Holdings, Inc. 2018 1st Lien Term Loan | 4.382% (3 Mo. LIBOR + 4.25% | ) | 7/30/2025 | 4,417 | 4,241,685 | |||||||
| Twin River Worldwide Holdings, Inc. 2021 Term Loan B | 3.75% (6 Mo. LIBOR + 3.25% | ) | 8/6/2028 | 4,100 | 4,084,625 | |||||||
| Total | 8,326,310 | |||||||||||
| Total Floating Rate Loans (cost $102,376,292) | 103,157,455 | |||||||||||
| FOREIGN GOVERNMENT OBLIGATIONS(e) 0.94% | ||||||||||||
| Egypt 0.25% | ||||||||||||
| Egypt Government International Bond† | 5.80% | 9/30/2027 | 11,100 | 10,357,410 | ||||||||
| Ghana 0.19% | ||||||||||||
| Republic of Ghana† | 6.375% | 2/11/2027 | 9,500 | 7,854,030 | ||||||||
| Nigeria 0.19% | ||||||||||||
| Republic of Nigeria† | 7.143% | 2/23/2030 | 8,475 | 8,075,912 | ||||||||
| 396 | See Notes to Financial Statements. |
Schedule of Investments (continued)
TOTAL RETURN FUND November 30, 2021
| Investments | Interest Rate | Maturity Date | Principal Amount (000) | Fair Value | ||||||||
| Qatar 0.23% | ||||||||||||
| Qatar Government International Bond† | 3.75% | 4/16/2030 | $ | 8,458 | $ | 9,429,317 | ||||||
| Sri Lanka 0.08% | ||||||||||||
| Republic of Sri Lanka† | 5.875% | 7/25/2022 | 4,250 | 3,224,645 | ||||||||
| Total Foreign Government Obligations (cost $41,294,368) | 38,941,314 | |||||||||||
| GOVERNMENT SPONSORED ENTERPRISES COLLATERALIZED MORTGAGE OBLIGATIONS 0.05% | ||||||||||||
| Federal Home Loan Mortgage Corp. Q001 XA | 2.141% | #(k) | 2/25/2032 | 16,126 | 1,702,284 | |||||||
| Government National Mortgage Assoc. 2015-73 AC | 2.90% | #(k) | 2/16/2053 | 419 | 427,883 | |||||||
| Total Government Sponsored Enterprises Collateralized Mortgage Obligations (cost $2,133,562) | 2,130,167 | |||||||||||
| GOVERNMENT SPONSORED ENTERPRISES PASS-THROUGHS 5.64% | ||||||||||||
| Fannie Mae or Freddie Mac(l) | 3.00% | TBA | 183,990 | 191,062,117 | ||||||||
| Federal National Mortgage Assoc. | 3.50% | 9/1/2047 | 24,859 | 26,515,711 | ||||||||
| Federal National Mortgage Assoc. | 3.50% | 3/1/2050 | 15,291 | 16,335,268 | ||||||||
| Total Government Sponsored Enterprises Pass-Throughs (cost $232,899,847) | 233,913,096 | |||||||||||
| MUNICIPAL BONDS 0.56% | ||||||||||||
| Miscellaneous | ||||||||||||
| County of Miami-Dade FL | 2.786% | 10/1/2037 | 2,615 | 2,641,287 | ||||||||
| Foothill-Eastern Transportation Corridor Agency | 4.094% | 1/15/2049 | 4,178 | 4,536,239 | ||||||||
| New Jersey Transportation Trust Fund Authority | 4.081% | 6/15/2039 | 1,055 | 1,218,648 | ||||||||
| New Jersey Transportation Trust Fund Authority | 4.131% | 6/15/2042 | 7,170 | 8,371,953 | ||||||||
| New York City Transitional Finance Authority Futur | 1.95% | 8/1/2034 | 4,200 | 4,010,585 | ||||||||
| Regents of the University of California Medical Ce | 3.006% | 5/15/2050 | 2,380 | 2,520,891 | ||||||||
| Total Municipal Bonds (cost $22,479,408) | 23,299,603 | |||||||||||
| NON-AGENCY COMMERCIAL MORTGAGE-BACKED SECURITIES 9.40% | ||||||||||||
| Angel Oak Mortgage Trust 2020-1 A1† | 2.466% | #(k) | 12/25/2059 | 901 | 904,664 | |||||||
| Atrium Hotel Portfolio Trust 2018-ATRM A† | 1.04% (1 Mo. LIBOR + .95% | )# | 6/15/2035 | 6,700 | 6,695,901 | |||||||
| BBCMS Mortgage Trust 2019-BWAY A† | 1.046% (1 Mo. LIBOR + .96% | )# | 11/15/2034 | 4,168 | 4,161,818 | |||||||
| BBCMS Mortgage Trust 2019-BWAY B† | 1.40% (1 Mo. LIBOR + 1.31% | )# | 11/15/2034 | 1,832 | 1,823,270 | |||||||
| Benchmark Mortgage Trust 2018-B5 C | 4.762% | #(k) | 7/15/2051 | 5,200 | 5,765,348 | |||||||
| BFLD 2019-DPLO F† | 2.63% (1 Mo. LIBOR + 2.54% | )# | 10/15/2034 | 4,830 | 4,711,545 | |||||||
| BHMS 2018-ATLS A† | 1.34% (1 Mo. LIBOR + 1.25% | )# | 7/15/2035 | 6,580 | 6,591,610 | |||||||
| See Notes to Financial Statements. | 397 |
Schedule of Investments (continued)
TOTAL RETURN FUND November 30, 2021
| Investments | Interest Rate | Maturity Date | Principal Amount (000) | Fair Value | ||||||||
| NON-AGENCY COMMERCIAL MORTGAGE-BACKED SECURITIES (continued) | ||||||||||||
| BHMS 2018-ATLS C† | 1.99% (1 Mo. LIBOR + 1.90% | )# | 7/15/2035 | $ | 3,965 | $ | 3,954,898 | |||||
| BX Trust 2018-GW A† | 0.89% (1 Mo. LIBOR + .80% | )# | 5/15/2035 | 10,503 | 10,498,991 | |||||||
| BX Trust 2021-ARIA E† | 2.335% (1 Mo. LIBOR + 2.24% | )# | 10/15/2036 | 14,530 | 14,486,782 | |||||||
| CF Trust 2019-BOSS A1 | 4.75% (1 Mo. LIBOR + 3.25% | ) | 12/15/2021 | 4,660 | 4,303,230 | (a) | ||||||
| CIM Retail Portfolio Trust 2021-RETL E† | 3.84% (1 Mo. LIBOR + 3.75% | )# | 8/15/2036 | 10,650 | 10,597,392 | |||||||
| Citigroup Commercial Mortgage Trust 2014-GC25 XB | 0.31% | #(k) | 10/10/2047 | 50,626 | 296,511 | |||||||
| Citigroup Commercial Mortgage Trust 2016-GC36 D† | 2.85% | 2/10/2049 | 8,100 | 5,802,607 | ||||||||
| Commercial Mortgage Pass-Through Certificates 2014-CR19 XA IO | 1.111% | #(k) | 8/10/2047 | 3,415 | 71,925 | |||||||
| Commercial Mortgage Pass-Through Certificates 2014-UBS4 D† | 4.869% | #(k) | 8/10/2047 | 12,450 | 11,131,341 | |||||||
| Commercial Mortgage Pass-Through Certificates 2015-DC1 D† | 4.451% | #(k) | 2/10/2048 | 10,552 | 9,070,826 | |||||||
| Commercial Mortgage Pass-Through Certificates 2015-PC1 AM | 4.29% | #(k) | 7/10/2050 | 3,400 | 3,650,927 | |||||||
| Commercial Mortgage Pass-Through Certificates 2015-PC1 B | 4.463% | #(k) | 7/10/2050 | 1,570 | 1,675,133 | |||||||
| Commercial Mortgage Pass-Through Certificates 2015-PC1 C | 4.463% | #(k) | 7/10/2050 | 4,369 | 4,562,324 | |||||||
| Commercial Mortgage Pass-Through Certificates 2015-PC1 D | 4.463% | #(k) | 7/10/2050 | 7,822 | 7,127,114 | |||||||
| Connecticut Avenue Securities Trust 2021-R01 1M2† | 1.60% (1 Mo. SOFR + 1.55% | )# | 10/25/2041 | 5,177 | 5,207,764 | |||||||
| Credit Suisse Commercial Mortgage Securities Corp. | 2.09% | 11/15/2038 | 10,418 | 10,520,152 | ||||||||
| Credit Suisse Mortgage Capital Certificates 2014-USA E† | 4.373% | 9/15/2037 | 3,000 | 2,697,521 | ||||||||
| Credit Suisse Mortgage Capital Certificates 2020-AFC1 A1† | 2.24% | #(k) | 2/25/2050 | 2,465 | 2,475,760 | |||||||
| Credit Suisse Mortgage Capital Certificates 2020-SPT1 A1† | 1.616% | 4/25/2065 | 3,635 | 3,645,151 | ||||||||
| CS Master Trust 2021-AHP A† | 4.449% (1 Mo. LIBOR + 3.95% | )# | 4/15/2025 | 5,700 | 5,716,958 | (a) | ||||||
| 398 | See Notes to Financial Statements. |
Schedule of Investments (continued)
TOTAL RETURN FUND November 30, 2021
| Investments | Interest Rate | Maturity Date | Principal Amount (000) | Fair Value | ||||||||
| NON-AGENCY COMMERCIAL MORTGAGE-BACKED SECURITIES (continued) | ||||||||||||
| CS Master Trust 2021-BLUF A† | 4.527% (1 Mo. LIBOR + 4.18% | )# | 4/15/2023 | $ | 3,300 | $ | 3,332,195 | (a) | ||||
| CSAIL Commercial Mortgage Trust 2016-C7 D† | 4.529% | #(k) | 11/15/2049 | 4,890 | 3,869,810 | |||||||
| DBWF Mortgage Trust 2018-GLKS A† | 1.119% (1 Mo. LIBOR + 1.03% | )# | 12/19/2030 | 6,500 | 6,509,990 | |||||||
| Deephaven Residential Mortgage Trust 2020-1 A1† | 2.339% | #(k) | 1/25/2060 | 1,263 | 1,266,070 | |||||||
| Deephaven Residential Mortgage Trust 2021-3 A1† | 1.194% | #(k) | 8/25/2066 | 10,107 | 10,059,030 | |||||||
| Extended Stay America Trust 2021-ESH C† | 1.79% (1 Mo. LIBOR + 1.70% | )# | 7/15/2038 | 7,212 | 7,224,677 | |||||||
| Fannie Mae Connecticut Avenue Securities 2021-R02 2M2†(b) | 2.05% (1 Mo. SOFR + 2.00% | )# | 11/25/2041 | 4,970 | 4,979,319 | |||||||
| Freddie Mac STACR REMIC Trust 2021-DNA3 M2† | 2.15% (1 Mo. SOFR + 2.10% | )# | 10/25/2033 | 7,725 | 7,792,030 | |||||||
| Freddie Mac STACR REMIC Trust 2021-DNA6 M2† | 1.55% (1 Mo. SOFR + 1.50% | )# | 10/25/2041 | 6,110 | 6,125,386 | |||||||
| Freddie Mac STACR REMIC Trust 2021-HQA3 M2† | 2.15% (1 Mo. SOFR + 2.10% | )# | 9/25/2041 | 12,350 | 12,360,680 | |||||||
| Freddie Mac Structured Agency Credit Risk Debt Notes 2021-DNA7 M2† | 1.848% (1 Mo. SOFR + 1.80% | )# | 11/25/2041 | 6,260 | 6,279,534 | |||||||
| GCAT Trust 2020-NQM1 A1† | 2.247% | 1/25/2060 | 721 | 722,983 | ||||||||
| Great Wolf Trust 2019-WOLF A† | 1.124% (1 Mo. LIBOR + 1.03% | )# | 12/15/2036 | 12,751 | 12,741,170 | |||||||
| GS Mortgage Securities | ||||||||||||
| Corp. II 2021-ARDN B† | 1.75% (1 Mo. LIBOR + 1.65% | )# | 11/15/2026 | 9,400 | 9,411,750 | |||||||
| GS Mortgage Securities Corp. Trust 2018-RIVR A† | 1.04% (1 Mo. LIBOR + .95% | )# | 7/15/2035 | 4,372 | 4,346,031 | |||||||
| GS Mortgage Securities Corp. Trust 2021-ROSS G† | 4.74% (1 Mo. LIBOR + 4.65% | )# | 5/15/2026 | 7,288 | 7,328,638 | |||||||
| GS Mortgage Securities Trust 2014-GC26 C | 4.66% | #(k) | 11/10/2047 | 135 | 132,403 | |||||||
| GS Mortgage Securities Trust 2015-GC32 C | 4.574% | #(k) | 7/10/2048 | 1,230 | 1,284,851 | |||||||
| HONO Mortgage Trust 2021-LULU B† | 1.54% (1 Mo. LIBOR + 1.45% | )# | 10/15/2036 | 3,000 | 3,005,791 | |||||||
| See Notes to Financial Statements. | 399 |
Schedule of Investments (continued)
TOTAL RETURN FUND November 30, 2021
| Investments | Interest Rate | Maturity Date | Principal Amount (000) | Fair Value | ||||||||
| NON-AGENCY COMMERCIAL MORTGAGE-BACKED SECURITIES (continued) | ||||||||||||
| HONO Mortgage Trust 2021-LULU C† | 1.94% (1 Mo. LIBOR + 1.85% | )# | 10/15/2036 | $ | 1,820 | $ | 1,823,972 | |||||
| Hudsons Bay Simon JV Trust 2015-HB10 XB10† | 0.723% | #(k) | 8/5/2034 | 19,156 | 385,802 | |||||||
| Hudsons Bay Simon JV Trust 2015-HB7 B7† | 4.666% | 8/5/2034 | 4,226 | 3,839,944 | ||||||||
| Hudsons Bay Simon JV Trust 2015-HB7 D7† | 5.331% | #(k) | 8/5/2034 | 3,741 | 2,844,348 | |||||||
| Hudsons Bay Simon JV Trust 2015-HB7 XB7† | 0.665% | #(k) | 8/5/2034 | 22,024 | 61,887 | |||||||
| JPMorgan Chase Commercial Mortgage Securities Trust 2015-C30 C | 4.406% | #(k) | 7/15/2048 | 2,500 | 2,555,328 | |||||||
| JPMorgan Chase Commercial Mortgage Securities Trust 2018-LAQ B† | 1.39% (1 Mo. LIBOR + 1.30% | )# | 6/15/2032 | 6,329 | 6,330,539 | |||||||
| JPMorgan Chase Commercial Mortgage Securities Trust 2018-MINN A† | 2.27% (1 Mo. LIBOR + 1.02% | )# | 11/15/2035 | 3,436 | 3,450,649 | |||||||
| JPMorgan Chase Commercial Mortgage Securities Trust 2018-WPT AFL† | 1.286% (1 Mo. LIBOR + 1.20% | )# | 7/5/2033 | 2,393 | 2,396,321 | |||||||
| JPMorgan Chase Commercial Mortgage Securities Trust 2018-WPT BFL† | 1.586% (1 Mo. LIBOR + 1.50% | )# | 7/5/2033 | 7,410 | 7,427,760 | |||||||
| JPMorgan Chase Commercial Mortgage Securities Trust 2018-WPT BFX† | 4.549% | 7/5/2033 | 2,228 | 2,313,644 | ||||||||
| JPMorgan Chase Commercial Mortgage Securities Trust 2018-WPT CFX† | 4.95% | 7/5/2033 | 2,968 | 3,082,083 | ||||||||
| KIND Trust 2021-KIND D† | 2.39% (1 Mo. LIBOR + 2.30% | )# | 8/15/2038 | 6,740 | 6,727,865 | |||||||
| Life Mortgage Trust 2021-BMR E† | 1.84% (1 Mo. LIBOR + 1.75% | )# | 3/15/2038 | 4,000 | 3,975,473 | |||||||
| Merrill Lynch Mortgage Investors Trust 2006-AF2 AF1 | 6.25% | 10/25/2036 | 411 | 256,211 | ||||||||
| New Residential Mortgage Loan Trust 2020-NQM1 A1† | 2.464% | #(k) | 1/26/2060 | 842 | 846,273 | |||||||
| One New York Plaza Trust 2020-1NYP B† | 1.59% (1 Mo. LIBOR + 1.50% | )# | 1/15/2026 | 10,480 | 10,516,900 | |||||||
| PFP Ltd. 2019-6 A† | 1.141% (1 Mo. LIBOR + 1.05% | )# | 4/14/2037 | 1,860 | 1,854,657 | |||||||
| ReadyCap Commercial Mortgage Financing LLC 2021-FL6 C† | 1.992% (1 Mo. LIBOR + 1.90% | )# | 7/25/2036 | 6,320 | 6,333,525 | |||||||
| ReadyCap Commercial Mortgage Trust 2019-6 A† | 2.833% | 10/25/2052 | 2,335 | 2,362,270 | ||||||||
| Residential Mortgage Loan Trust 2020-1 A1† | 2.376% | #(k) | 1/26/2060 | 642 | 645,578 | |||||||
| 400 | See Notes to Financial Statements. |
Schedule of Investments (continued)
TOTAL RETURN FUND November 30, 2021
| Investments | Interest Rate | Maturity Date | Principal Amount (000) | Fair Value | |||||||||
| NON-AGENCY COMMERCIAL MORTGAGE-BACKED SECURITIES (continued) | |||||||||||||
| SFAVE Commercial Mortgage | |||||||||||||
| Securities Trust 2015-5AVE A1† | 3.872% | #(k) | 1/5/2043 | $ | 695 | $ | 739,357 | ||||||
| Starwood Mortgage Residential Trust 2020-1 A1† | 2.275% | #(k) | 2/25/2050 | 1,057 | 1,063,660 | ||||||||
| Starwood Mortgage Residential Trust 2020-3 A1† | 1.486% | #(k) | 4/25/2065 | 5,450 | 5,471,542 | ||||||||
| UBS-BAMLL Trust 2012-WRM E† | 4.379% | #(k) | 6/10/2030 | 3,905 | 2,222,095 | ||||||||
| Verus Securitization Trust 2020-1 A1† | 2.417% | 1/25/2060 | 2,042 | 2,054,480 | |||||||||
| Verus Securitization Trust 2020-5 A1† | 1.218% | 5/25/2065 | 5,992 | 5,989,402 | |||||||||
| Verus Securitization Trust 2021-2 A1† | 1.031% | #(k) | 2/25/2066 | 9,591 | 9,533,587 | ||||||||
| Vista Point Securitization Trust 2020-2 A1† | 1.475% | #(k) | 4/25/2065 | 3,771 | 3,772,203 | ||||||||
| Wells Fargo Commercial Mortgage Trust 2013-LC12 D† | 4.441% | #(k) | 7/15/2046 | 5,195 | 2,931,236 | ||||||||
| Wells Fargo Commercial Mortgage Trust 2015-C28 D | 4.23% | #(k) | 5/15/2048 | 7,460 | 7,191,127 | ||||||||
| Wells Fargo Commercial Mortgage Trust 2015-SG1 B | 4.603% | #(k) | 9/15/2048 | 4,020 | 4,083,602 | ||||||||
| Wells Fargo Commercial Mortgage Trust 2016-C35 C | 4.176% | #(k) | 7/15/2048 | 2,642 | 2,690,206 | ||||||||
| Wells Fargo Commercial Mortgage Trust 2016-NXS5 E† | 5.151% | #(k) | 1/15/2059 | 2,748 | 2,733,713 | ||||||||
| WFRBS Commercial Mortgage Trust 2014-C23 XA | 0.708% | #(k) | 10/15/2057 | 55,533 | 746,148 | ||||||||
| ZH Trust 2021-2 A† | 2.349% | 10/17/2027 | 11,990 | 11,887,665 | (a) | ||||||||
| Total Non-Agency Commercial Mortgage-Backed Securities (cost $391,459,160) | 390,060,853 | ||||||||||||
| Exercise Price | Expiration Date | Shares (000) | |||||||||||
| RIGHTS 0.00% | |||||||||||||
| Oil & Gas | |||||||||||||
| Dommo Energia SA*(d) | $0.70 | 12/23/2021 | BRL | 40 | 281 | ||||||||
| Total Rights (cost $0) | 281 | ||||||||||||
| Interest Rate | Maturity Date | Principal Amount (000) | |||||||||||
| U.S. TREASURY OBLIGATIONS 34.17% | |||||||||||||
| U.S. Treasury Bill | Zero Coupon | 1/27/2022 | $ | 317,940 | 317,918,606 | ||||||||
| U.S. Treasury Bill | Zero Coupon | 4/21/2022 | 72,081 | 72,061,943 | |||||||||
| U.S. Treasury Bond | 1.125% | 5/15/2040 | 25,442 | 22,573,812 | |||||||||
| U.S. Treasury Bond | 1.75% | 8/15/2041 | 82,820 | 81,331,828 | |||||||||
| See Notes to Financial Statements. | 401 |
Schedule of Investments (continued)
TOTAL RETURN FUND November 30, 2021
| Investments | Interest Rate | Maturity Date | Principal Amount (000) | Fair Value | ||||||||
| U.S. TREASURY OBLIGATIONS (continued) | ||||||||||||
| U.S. Treasury Bond | 2.00% | 8/15/2051 | $ | 110,947 | $ | 116,216,982 | ||||||
| U.S. Treasury Bond | 2.25% | 8/15/2049 | 37,311 | 41,028,983 | ||||||||
| U.S. Treasury Note | 0.125% | 8/31/2023 | 252,385 | 250,847,029 | ||||||||
| U.S. Treasury Note | 0.375% | 10/31/2023 | 179,536 | 179,059,107 | ||||||||
| U.S. Treasury Note | 0.75% | 11/15/2024 | 70,000 | 69,838,672 | ||||||||
| U.S. Treasury Note | 1.125% | 10/31/2026 | 132,745 | 132,579,069 | ||||||||
| U.S. Treasury Note | 1.25% | 8/15/2031 | 136,920 | 134,748,534 | ||||||||
| Total U.S. Treasury Obligations (cost $1,410,622,763) | 1,418,204,565 | |||||||||||
| Total Long-Term Investments (cost $4,210,002,417) | 4,235,065,676 | |||||||||||
| SHORT-TERM INVESTMENTS 2.09% | ||||||||||||
| REPURCHASE AGREEMENTS 2.09% | ||||||||||||
| Repurchase Agreement dated 11/30/2021, 0.00% due 12/1/2021 with Fixed Income Clearing Corp. collateralized by $85,258,000 of U.S. Treasury Note at 2.75% due 4/30/2023 value: $88,346,387; proceeds: $86,614,070 (cost $86,614,070) | 86,614 | 86,614,070 | ||||||||||
| Total Investments in Securities 104.12% (cost $4,296,616,487) | 4,321,679,746 | |||||||||||
| Less Unfunded Loan Commitments (0.09%) (cost $3,754,658)(m) | (3,746,433 | ) | ||||||||||
| Net Investments in Securities 104.03% (cost $4,292,861,829) | 4,317,933,313 | |||||||||||
| Other Assets and Liabilities – Net(n) (4.03)% | (167,074,289 | ) | ||||||||||
| Net Assets 100.00% | $ | 4,150,859,024 | ||||||||||
| BRL | Brazilian Real. | |
| CAD | Canadian Dollar. | |
| CMT | Constant Maturity Rate. | |
| IO | Interest Only. | |
| LIBOR | London Interbank Offered Rate. | |
| PIK | Payment-in-kind. | |
| SOFR | Secured Over Night Financing Rate. | |
| † | Security was purchased pursuant to Rule 144A under the Securities Act of 1933 and, unless registered under such Act or exempted from registration, may only be resold to qualified institutional buyers. At November 30, 2021, the total value of Rule 144A securities was $1,503,761,727, which represents 36.23% of net assets. | |
| # | Variable rate security. The interest rate represents the rate in effect at November 30, 2021. | |
| * | Non-income producing security. | |
| (a) | Level 3 Investment as described in Note 2(t) in the Notes to Financials. Security valued utilizing third party pricing information without adjustment. Such valuations are based on unobservable inputs. A significant change in third party information could result in a significantly lower or higher value of such Level 3 investments. | |
| (b) | Securities purchased on a when-issued basis (See Note 2(j)). | |
| (c) | Variable Rate is Fixed to Float: Rate remains fixed or at Zero Coupon until designated future date. | |
| (d) | Investment in non-U.S. dollar denominated securities. | |
| (e) | Foreign security traded in U.S. dollars. | |
| (f) | Security is perpetual in nature and has no stated maturity. | |
| (g) | Defaulted (non-income producing security). |
| 402 | See Notes to Financial Statements. |
Schedule of Investments (continued)
TOTAL RETURN FUND November 30, 2021
| (h) | Floating Rate Loans in which the Fund invests generally pay interest at rates which are periodically re-determined at a margin above the London Interbank Offered Rate (“LIBOR”) or the prime rate offered by major U.S. banks. The rate(s) shown is the rate(s) in effect at November 30, 2021. | |
| (i) | Interest Rate to be determined. | |
| (j) | Security partially/fully unfunded. See Note (2(o)). | |
| (k) | Interest rate is based on the weighted average interest rates of the underlying mortgages within the mortgage pool. | |
| (l) | To-be-announced (“TBA”). Security purchased on a forward commitment basis with an approximate principal and maturity date. Actual principal and maturity will be determined upon settlement when the specific mortgage pools are assigned. | |
| (m) | See Note (2(o)). | |
| (n) | Other Assets and Liabilities - Net include net unrealized appreciation/depreciation on forward foreign currency exchange contracts, futures contracts and swaps as follows: |
Centrally Cleared Credit Default Swaps on Indexes - Buy Protection at November 30, 2021(1):
| Referenced Indexes | Central Clearing Party | Fund Pays (Quarterly) | Termination Date | Notional Amount | Payments Upfront(2) | Value/ Unrealized Appreciation(3) | ||||||||||
| Markit CDX. NA.EM.36(4)(5) | Bank of America | 1.00% | 12/20/2026 | $34,950,000 | $ | 1,163,520 | $ | 704,114 | ||||||||
| Markit CDX. NA.IG.37(4)(6) | Bank of America | 1.00% | 12/20/2026 | 67,465,000 | (1,547,954) | 168,256 | ||||||||||
| $ | (384,434) | $ | 872,370 | |||||||||||||
| (1) | If the Fund is a buyer of protection and a credit event occurs, as defined under the terms of that particular swap agreement, the Fund will either (i) receive from the seller of protection an amount equal to the notional amount of the swap and make delivery of the referenced obligation or underlying securities comprising the referenced index or (ii) pay a net settlement amount in the form of cash or securities equal to the notional amount of the swap less the recovery value of the referenced obligation or underlying securities. | |
| (2) | Upfront payments received/paid by Central Clearing Party are presented net of amortization. | |
| (3) | Total unrealized appreciation on Credit Default Swaps on Indexes amounted to $872,370. Total unrealized depreciation on Credit Default Swaps on Indexes amounted to $0. | |
| (4) | Central Clearinghouse: Intercontinental Exchange (ICE). | |
| (5) | The Referenced Index is for the Centrally Cleared Credit Default Swaps on Indexes, which is comprised of a basket of emerging market securities. | |
| (6) | The Referenced Index is for the Centrally Cleared Credit Default Swaps on Indexes, which is comprised of a basket of investment grade securities. |
Credit Default Swaps on Indexes - Sell Protection at November 30, 2021(1):
| Referenced Index* | Swap Counterparty | Fund Receives (Quarterly) | Termination Date | Notional Amount | Payments Upfront(2) | Unrealized Appreciation/ (Depreciation)(3) | Credit Default Swap Agreements Receivable at Fair Value(4) | |||||||||||||||
| Markit CMBX.NA.AA.8 | Citibank | 1.500% | 10/17/2057 | $ | 5,000,000 | $25,105 | $6,192 | $ | 31,296 | |||||||||||||
| See Notes to Financial Statements. | 403 |
Schedule of Investments (continued)
TOTAL RETURN FUND November 30, 2021
| Referenced Index* | Swap Counterparty | Fund Receives (Quarterly) | Termination Date | Notional Amount | Payments Upfront(2) | Unrealized Appreciation/ (Depreciation)(3) | Credit Default Swap Agreements Payable at Fair Value(4) | ||||||||||||||||
| Markit CMBX. NA.BBB-.12 | Goldman Sachs | 3.000% | 8/17/2061 | $ | 4,250,000 | $ | (163,826 | ) | $ | (115,872 | ) | $ | (279,697 | ) | |||||||||
| Markit CMBX. NA.BBB-.10 | Citibank | 3.000% | 11/17/2059 | 8,600,000 | (754,486 | ) | (109,641 | ) | (864,128 | ) | |||||||||||||
| Markit CMBX. NA.BBB-9 | Citibank | 3.000% | 9/17/2058 | 5,835,000 | (457,569 | ) | (97,168 | ) | (554,737 | ) | |||||||||||||
| Markit CMBX. NA.BBB-9 | Morgan Stanley | 3.000% | 9/17/2058 | 4,165,000 | (329,117 | ) | (66,852 | ) | (395,969 | ) | |||||||||||||
| Markit CMBX. NA.BBB-9 | Morgan Stanley | 3.000% | 9/17/2058 | 4,250,000 | (352,017 | ) | (52,033 | ) | (404,050 | ) | |||||||||||||
| Markit CMBX. NA.BBB-.9 | Citibank | 3.000% | 9/17/2058 | 5,000,000 | (530,665 | ) | 55,312 | (475,353 | ) | ||||||||||||||
| Markit CMBX. NA.BBB-.9 | Citibank | 3.000% | 9/17/2058 | 4,000,000 | (317,794 | ) | (62,489 | ) | (380,282 | ) | |||||||||||||
| Markit CMBX. NA.BBB-.9 | Citibank | 3.000% | 9/17/2058 | 4,250,000 | (353,516 | ) | (50,534 | ) | (404,050 | ) | |||||||||||||
| Markit CMBX. NA.BBB-.10 | Morgan Stanley | 3.000% | 11/17/2059 | 3,400,000 | (294,980 | ) | (46,652 | ) | (341,632 | ) | |||||||||||||
| $ | (3,553,970 | ) | $ | (545,929 | ) | $ | (4,099,898 | ) | |||||||||||||||
| Total | $ | (3,528,865 | ) | $ | (539,737 | ) | $ | (4,068,602 | ) | ||||||||||||||
| * | The Referenced Index is for the Credit Default Swaps on Indexes, which is comprised of a basket of commercial mortgage-backed securities. | |
| (1) | If the Fund is a seller of protection and a credit event occurs, as defined under the terms of that particular swap agreement, the Fund will either (i) pay to the buyer of protection an amount equal to the notional amount of the swap and take delivery of the referenced obligation or underlying securities comprising the referenced index or (ii) pay a net settlement amount in the form of cash or securities equal to the notional amount of the swap less the recovery value of the referenced obligation or underlying securities. | |
| (2) | Upfront payments received/paid are presented net of amortization. | |
| (3) | Total unrealized appreciation on Credit Default Swaps on Indexes amounted to $61,504. Total unrealized depreciation on Credit Default Swaps on Indexes amounted to $601,241. | |
| (4) | Includes upfront payments received. |
Open Forward Foreign Currency Exchange Contracts at November 30, 2021:
| Forward Foreign Currency Exchange Contracts | Transaction Type | Counterparty | Expiration Date | Foreign Currency | U.S. $ Cost on Origination Date | U.S. $ Current Value | Unrealized Appreciation | |||||||||||||||
| Euro | Buy | Goldman Sachs | 12/10/2021 | 3,529,000 | $ | 3,996,264 | $ | 4,002,961 | $ | 6,697 | ||||||||||||
| Canadian dollar | Sell | Toronto Dominion Bank | 1/20/2022 | 24,260,000 | 19,621,752 | 19,000,070 | 621,682 | |||||||||||||||
| Euro | Sell | State Street Bank and Trust | 12/10/2021 | 7,732,000 | 9,157,371 | 8,770,443 | 386,928 | |||||||||||||||
| Unrealized Appreciation on Forward Foreign Currency Exchange Contracts | $ | 1,015,307 | ||||||||||||||||||||
| 404 | See Notes to Financial Statements. |
Schedule of Investments (continued)
TOTAL RETURN FUND November 30, 2021
| Forward Foreign Currency Exchange Contracts | Transaction Type | Counterparty | Expiration Date | Foreign Currency | U.S. $ Cost on Origination Date | U.S. $ Current Value | Unrealized Depreciation | |||||||||||||||
| Euro | Buy | Bank of America | 12/10/2021 | 1,820,000 | $ | 2,112,929 | $ | 2,064,434 | $ | (48,495 | ) | |||||||||||
| Euro | Buy | Morgan Stanley | 12/10/2021 | 2,251,000 | 2,603,801 | 2,553,320 | (50,481 | ) | ||||||||||||||
| Unrealized Depreciation on Forward Foreign Currency Exchange Contracts | $ | (98,976 | ) | |||||||||||||||||||
Open Futures Contracts at November 30, 2021:
| Type | Expiration | Contracts | Position | Notional Amount | Notional Value | Unrealized Appreciation | ||||||||||||
| U.S. 10-Year Treasury Note | March 2022 | 699 | Long | $ | 90,177,803 | $ | 91,437,938 | $ | 1,260,135 | |||||||||
| U.S. Treasury Long Bond | March 2022 | 2,238 | Long | 355,356,748 | 362,835,750 | 7,479,002 | ||||||||||||
| U.S. Ultra Treasury Bond | March 2022 | 807 | Long | 156,609,987 | 161,853,937 | 5,243,950 | ||||||||||||
| Total Unrealized Appreciation on Open Futures Contracts | $ | 13,983,087 | ||||||||||||||||
| Type | Expiration | Contracts | Position | Notional Amount | Notional Value | Unrealized Depreciation | ||||||||||||
| U.S. 10-Year Ultra Treasury Note | March 2022 | 1,384 | Short | $ | (199,790,718 | ) | $ | (203,296,625 | ) | $ | (3,505,907 | ) | ||||||
| U.S. 2-Year Treasury Note | March 2022 | 1,153 | Short | (251,739,121 | ) | (252,200,736 | ) | (461,615 | ) | |||||||||
| Total Unrealized Depreciation on Open Futures Contracts | $ | (3,967,522 | ) | |||||||||||||||
The following is a summary of the inputs used as of November 30, 2021 in valuing the Fund’s investments carried at fair value(1):
| Investment Type(2) | Level 1 | Level 2 | Level 3 | Total | ||||||||||||
| Long-Term Investments | ||||||||||||||||
| Asset-Backed Securities | ||||||||||||||||
| Credit Card | $ | – | $ | 29,669,939 | $ | 21,292,785 | $ | 50,962,724 | ||||||||
| Other | – | 355,279,722 | 27,296,384 | 382,576,106 | ||||||||||||
| Remaining Industries | – | 241,973,999 | – | 241,973,999 | ||||||||||||
| Common Stocks | 6,657 | – | – | 6,657 | ||||||||||||
| Corporate Bonds | – | 1,349,838,856 | – | 1,349,838,856 | ||||||||||||
| Floating Rate Loans | ||||||||||||||||
| Business Services | – | 3,746,433 | 1,003,444 | 4,749,877 | ||||||||||||
| Remaining Industries | – | 98,407,578 | – | 98,407,578 | ||||||||||||
| Less Unfunded Commitments | – | (3,746,433 | ) | – | (3,746,433 | ) | ||||||||||
| Foreign Government Obligations | – | 38,941,314 | – | 38,941,314 | ||||||||||||
| Government Sponsored Enterprises Collateralized Mortgage Obligations | – | 2,130,167 | – | 2,130,167 | ||||||||||||
| Government Sponsored Enterprises Pass-Throughs | – | 233,913,096 | – | 233,913,096 | ||||||||||||
| Municipal Bonds | – | 23,299,603 | – | 23,299,603 | ||||||||||||
| Non-Agency Commercial Mortgage-Backed Securities | – | 364,820,805 | 25,240,048 | 390,060,853 | ||||||||||||
| Rights | – | 281 | – | 281 | ||||||||||||
| U.S. Treasury Obligations | – | 1,418,204,565 | – | 1,418,204,565 | ||||||||||||
| Short-Term Investments | ||||||||||||||||
| Repurchase Agreements | – | 86,614,070 | – | 86,614,070 | ||||||||||||
| Total | $ | 6,657 | $ | 4,243,093,995 | $ | 74,832,661 | $ | 4,317,933,313 | ||||||||
| See Notes to Financial Statements. | 405 |
Schedule of Investments (concluded)
TOTAL RETURN FUND November 30, 2021
| Other Financial Instruments | Level 1 | Level 2 | Level 3 | Total | ||||||||||||
| Centrally Cleared Credit Default Swap Contracts | ||||||||||||||||
| Assets | $ | – | $ | 872,370 | $ | – | $ | 872,370 | ||||||||
| Liabilities | – | – | – | – | ||||||||||||
| Credit Default Swap Contracts | ||||||||||||||||
| Assets | – | 31,296 | – | 31,296 | ||||||||||||
| Liabilities | – | (4,099,898 | ) | – | (4,099,898 | ) | ||||||||||
| Forward Foreign Currency Exchange Contracts | ||||||||||||||||
| Assets | – | 1,015,307 | – | 1,015,307 | ||||||||||||
| Liabilities | – | (98,976 | ) | – | (98,976 | ) | ||||||||||
| Futures Contracts | ||||||||||||||||
| Assets | 13,983,087 | – | – | 13,983,087 | ||||||||||||
| Liabilities | (3,967,522 | ) | – | – | (3,967,522 | ) | ||||||||||
| Total | $ | 10,015,565 | $ | (2,279,901 | ) | $ | – | $ | 7,735,664 | |||||||
| (1) | Refer to Note 2(t) for a description of fair value measurements and the three-tier hierarchy of inputs. | |
| (2) | See Schedule of Investments for fair values in each industry. The table above is presented by Investment Type. Industries are presented within an Investment Type should such Investment Type include securities classified as two or more levels within the three- tier fair value hierarchy. When applicable each Level 3 security is identified on the Schedule of Investments along with the valuation technique utilized. |
A reconciliation of Level 3 investments is presented when the Fund has a material amount of Level 3 investments at the beginning or end of the year in relation to the Fund’s net assets.
The following is a reconciliation of investments with unobservable inputs (Level 3) that were used in determining fair value:
| Investment Type | Asset-Backed Securities | Floating Rate Loans | Non-Agency Commercial Mortgage-Backed Securities | ||||||||||||
| Balance as of December 1, 2020 | $ | 20,060,159 | $ | – | $ | 4,304,153 | |||||||||
| Accrued Discounts (Premiums) | (165,586 | ) | – | 15 | |||||||||||
| Realized Gain (Loss) | 128,951 | – | – | ||||||||||||
| Change in Unrealized Appreciation (Depreciation) | 81,648 | 5,017 | (54,104 | ) | |||||||||||
| Purchases | 37,728,134 | 998,427 | 20,989,984 | ||||||||||||
| Sales | (2,066,706 | ) | – | – | |||||||||||
| Transfers into Level 3 | – | – | – | ||||||||||||
| Transfers out of Level 3 | (7,177,431 | ) | – | – | |||||||||||
| Balance as of November 30, 2021 | $ | 48,589,169 | $ | 1,003,444 | $ | 25,240,048 | |||||||||
| Change in unrealized appreciation/ depreciation for the year ended November 30, 2021, related to Level 3 investments held at November 30, 2021 | $ | 153,583 | $ | 5,017 | $ | (54,104 | ) | ||||||||
| 406 | See Notes to Financial Statements. |
Schedule of Investments
ULTRA SHORT BOND FUND November 30, 2021
| Investments | Interest Rate | Maturity Date | Principal Amount (000) | Fair Value | ||||||||
| LONG-TERM INVESTMENTS 94.52% | ||||||||||||
| ASSET-BACKED SECURITIES 25.49% | ||||||||||||
| Automobiles 11.23% | ||||||||||||
| American Credit Acceptance Receivables Trust 2020-3 A† | 0.62% | 10/13/2023 | $ | 1,214 | $ | 1,214,590 | ||||||
| AmeriCredit Automobile Receivables Trust 2020-2 A2A | 0.60% | 12/18/2023 | 3,032 | 3,032,869 | ||||||||
| ARI Fleet Lease Trust 2020-A A2† | 1.77% | 8/15/2028 | 4,721 | 4,737,417 | ||||||||
| Arivo Acceptance Auto Loan Receivables Trust 2021-1 A† | 1.19% | 1/15/2027 | 12,504 | 12,485,636 | ||||||||
| Avid Automobile Receivables Trust 2021-1 A† | 0.61% | 1/15/2025 | 16,233 | 16,224,133 | ||||||||
| BMW Vehicle Lease Trust 2021-1 A3 | 0.29% | 1/25/2024 | 97,234 | 97,074,750 | ||||||||
| CarMax Auto Owner Trust 2018-3 A3 | 3.13% | 6/15/2023 | 2,093 | 2,104,442 | ||||||||
| Carmax Auto Owner Trust 2019-1 A3 | 3.05% | 3/15/2024 | 5,345 | 5,396,864 | ||||||||
| Carmax Auto Owner Trust 2019-2 A3 | 2.68% | 3/15/2024 | 22,533 | 22,806,801 | ||||||||
| CarMax Auto Owner Trust 2020-2 A3 | 1.70% | 11/15/2024 | 4,723 | 4,758,221 | ||||||||
| Carvana Auto Receivables Trust 2020-P1 A2 | 0.28% | 11/8/2023 | 4,836 | 4,835,779 | ||||||||
| Carvana Auto Receivables Trust 2020-P1 A3 | 0.44% | 6/9/2025 | 16,043 | 16,033,884 | ||||||||
| Carvana Auto Receivables Trust 2021-N1 B | 1.09% | 1/10/2028 | 41,645 | 41,575,295 | ||||||||
| Chesapeake Funding II LLC 2018-3A A2† | 0.57% (1 Mo. LIBOR + .48% | )# | 1/15/2031 | 23,497 | 23,532,355 | |||||||
| CPS Auto Receivables Trust 2020-C A† | 0.63% | 3/15/2024 | 332 | 332,476 | ||||||||
| CPS Auto Receivables Trust 2020-C B† | 1.01% | 1/15/2025 | 3,880 | 3,884,867 | ||||||||
| CPS Auto Receivables Trust 2021-D A† | 0.61% | 10/15/2025 | 48,064 | 48,055,932 | ||||||||
| Donlen Fleet Lease Funding 2 LLC 2021-2 A2† | 0.56% | 12/11/2034 | 88,275 | 87,991,496 | ||||||||
| Drive Auto Receivables Trust 2017-3 D† | 3.53% | 12/15/2023 | 351 | 351,782 | ||||||||
| Drive Auto Receivables Trust 2018-4 D | 4.09% | 1/15/2026 | 1,022 | 1,040,473 | ||||||||
| Drive Auto Receivables Trust 2019-3 C | 2.90% | 8/15/2025 | 4,356 | 4,392,993 | ||||||||
| Drive Auto Receivables Trust 2021-1 A3 | 0.44% | 11/15/2024 | 27,730 | 27,738,680 | ||||||||
| Drive Auto Receivables Trust 2021-2 A2 | 0.36% | 5/15/2024 | 31,840 | 31,828,098 | ||||||||
| Exeter Automobile Receivables Trust 2021-3A A2 | 0.34% | 1/16/2024 | 22,550 | 22,541,315 | ||||||||
| First Investors Auto Owner Trust 2019-2A A† | 2.21% | 9/16/2024 | 4,401 | 4,413,367 | ||||||||
| First Investors Auto Owner Trust 2021-2A A† | 0.48% | 3/15/2027 | 19,905 | 19,842,481 | ||||||||
| Flagship Credit Auto Trust 2020-2 A† | 1.49% | 7/15/2024 | 2,679 | 2,684,845 | ||||||||
| Flagship Credit Auto Trust 2021-2 B† | 0.93% | 6/15/2027 | 10,000 | 9,908,746 | ||||||||
| Ford Credit Auto Lease Trust 2020-B A2A | 0.50% | 12/15/2022 | 418 | 418,029 | ||||||||
| Ford Credit Auto Owner Trust 2017-REV1 A† | 2.62% | 8/15/2028 | 20,898 | 20,995,707 | ||||||||
| Ford Credit Auto Owner Trust 2018-B A3 | 3.24% | 4/15/2023 | 2,028 | 2,033,780 | ||||||||
| Ford Credit Auto Owner Trust 2020-B A2 | 0.50% | 2/15/2023 | 1,159 | 1,158,728 | ||||||||
| See Notes to Financial Statements. | 407 |
Schedule of Investments (continued)
ULTRA SHORT BOND FUND November 30, 2021
| Investments | Interest Rate | Maturity Date | Principal Amount (000) | Fair Value | ||||||||
| Automobiles (continued) | ||||||||||||
| Ford Credit Auto Owner Trust 2020-C A2 | 0.25% | 9/15/2023 | $ | 48,352 | $ | 48,347,656 | ||||||
| Foursight Capital Automobile Receivables Trust 2021-2 A3† | 0.81% | 5/15/2026 | 10,885 | 10,801,183 | ||||||||
| GLS Auto Receivables Issuer Trust 2019-3A B† | 2.72% | 6/17/2024 | 7,903 | 7,958,055 | ||||||||
| GLS Auto Receivables Issuer Trust 2020-3A A† | 0.69% | 10/16/2023 | 1,864 | 1,864,477 | ||||||||
| GLS Auto Receivables Issuer Trust 2021-1A B† | 0.82% | 4/15/2025 | 16,000 | 16,016,240 | ||||||||
| GLS Auto Receivables Issuer Trust 2021-1A C† | 1.20% | 1/15/2027 | 14,600 | 14,603,717 | ||||||||
| GLS Auto Receivables Issuer Trust 2021-3A B† | 0.78% | 11/17/2025 | 31,525 | 31,304,111 | ||||||||
| GLS Auto Receivables Issuer Trust 2021-3A C† | 1.11% | 9/15/2026 | 25,359 | 25,099,813 | ||||||||
| GLS Auto Receivables Trust 2021-2A B† | 0.77% | 9/15/2025 | 26,520 | 26,425,056 | ||||||||
| GLS Auto Receivables Trust 2021-2A C† | 1.08% | 6/15/2026 | 21,660 | 21,525,998 | ||||||||
| GM Financial Automobile Leasing Trust 2020-2 A2A | 0.71% | 10/20/2022 | 3,063 | 3,063,838 | ||||||||
| GM Financial Automobile Leasing Trust 2020-3 A2A | 0.35% | 11/21/2022 | 17,102 | 17,103,374 | ||||||||
| GM Financial Automobile Leasing Trust 2020-3 A3 | 0.45% | 8/21/2023 | 28,464 | 28,487,321 | ||||||||
| GM Financial Consumer Automobile Receivables Trust 2019-2 A3 | 2.65% | 2/16/2024 | 14,460 | 14,582,645 | ||||||||
| GM Financial Consumer Automobile Receivables Trust 2020-4 A2 | 0.26% | 11/16/2023 | 49,186 | 49,186,057 | ||||||||
| GM Financial Consumer Automobile Receivables Trust 2021-1 A2 | 0.23% | 11/16/2023 | 14,958 | 14,956,849 | ||||||||
| Hertz Vehicle Financing LLC 2021-1A A† | 1.21% | 12/26/2025 | 27,730 | 27,560,392 | ||||||||
| Honda Auto Receivables Owner Trust 2020-2 A2 | 0.74% | 11/15/2022 | 363 | 362,812 | ||||||||
| Honda Auto Receivables Owner Trust 2020-3 A2 | 0.27% | 2/21/2023 | 51,728 | 51,729,874 | ||||||||
| Honda Auto Receivables Owner Trust 2020-3 A3 | 0.37% | 10/18/2024 | 46,416 | 46,303,585 | ||||||||
| Hyundai Auto Lease Securitization Trust 2020-B A2† | 0.36% | 1/17/2023 | 21,150 | 21,152,058 | ||||||||
| Hyundai Auto Lease Securitization Trust 2020-B A3† | 0.51% | 9/15/2023 | 27,857 | 27,878,088 | ||||||||
| Hyundai Auto Lease Securitization Trust 2021-A A2† | 0.25% | 4/17/2023 | 13,216 | 13,212,960 | ||||||||
| Hyundai Auto Lease Securitization Trust 2021-A A3† | 0.33% | 1/16/2024 | 61,940 | 61,886,825 | ||||||||
| Hyundai Auto Receivables Trust 2020-B A2 | 0.38% | 3/15/2023 | 2,794 | 2,794,173 | ||||||||
| Mercedes-Benz Auto Lease Trust 2019-B A3 | 2.00% | 10/17/2022 | 2,466 | 2,471,528 | ||||||||
| Mercedes-Benz Auto Lease Trust 2020-B A3 | 0.40% | 11/15/2023 | 20,473 | 20,471,886 | ||||||||
| Mercedes-Benz Auto Receivables Trust 2020-1 A2 | 0.46% | 3/15/2023 | 4,110 | 4,110,526 | ||||||||
| Nissan Auto Lease Trust 2020-B A2 | 0.34% | 12/15/2022 | 53,636 | 53,647,254 | ||||||||
| Nissan Auto Receivables Owner Trust 2019-A A3 | 2.90% | 10/16/2023 | 12,001 | 12,104,760 | ||||||||
| Octane Receivables Trust 2021-1A A† | 0.93% | 3/22/2027 | 17,612 | 17,564,268 | ||||||||
| OneMain Direct Auto Receivables Trust 2021-1A A† | 0.87% | 7/14/2028 | 34,360 | 33,994,554 | ||||||||
| OneMain Direct Auto Receivables Trust 2021-1A B† | 1.26% | 7/14/2028 | 34,347 | 34,081,786 | ||||||||
| Santander Consumer Auto Receivable Trust 2021-AA A2† | 0.23% | 11/15/2023 | 15,758 | 15,755,862 | ||||||||
| 408 | See Notes to Financial Statements. |
Schedule of Investments (continued)
ULTRA SHORT BOND FUND November 30, 2021
| Investments | Interest Rate | Maturity Date | Principal Amount (000) | Fair Value | ||||||||
| Automobiles (continued) | ||||||||||||
| Santander Consumer Auto Receivables Trust 2020-BA A3† | 0.46% | 8/15/2024 | $ | 21,455 | $ | 21,461,571 | ||||||
| Santander Consumer Auto Receivables Trust 2021-AA A3† | 0.33% | 10/15/2025 | 26,527 | 26,451,825 | ||||||||
| Santander Drive Auto Receivables Trust 2021-2 C | 0.90% | 6/15/2026 | 15,410 | 15,401,152 | ||||||||
| Santander Retail Auto Lease Trust 2021-A B† | 0.92% | 3/20/2026 | 24,305 | 24,078,395 | ||||||||
| Santander Retail Auto Lease Trust 2021-C A2† | 0.29% | 4/22/2024 | 20,340 | 20,317,203 | ||||||||
| Santander Retail Auto Lease Trust 2021-C A3† | 0.50% | 3/20/2025 | 21,255 | 21,153,276 | ||||||||
| Tesla Auto Lease Trust 2019-A A3† | 2.16% | 10/20/2022 | 49,529 | 49,808,760 | ||||||||
| Tesla Auto Lease Trust 2020-A A2† | 0.55% | 5/22/2023 | 5,725 | 5,727,638 | ||||||||
| Tesla Auto Lease Trust 2021-A A3† | 0.56% | 3/20/2025 | 40,000 | 39,776,804 | ||||||||
| Tesla Auto Lease Trust 2021-A B† | 1.02% | 3/20/2025 | 21,800 | 21,747,745 | ||||||||
| Toyota Auto Receivables Owner Trust 2018-D A3 | 3.18% | 3/15/2023 | 2,272 | 2,285,294 | ||||||||
| Toyota Auto Receivables Owner Trust 2019-A A3 | 2.91% | 7/17/2023 | 5,817 | 5,868,563 | ||||||||
| Toyota Auto Receivables Owner Trust 2020-C A2 | 0.36% | 2/15/2023 | 6,294 | 6,294,365 | ||||||||
| Toyota Auto Receivables Owner Trust 2020-D A2 | 0.23% | 5/15/2023 | 47,527 | 47,530,321 | ||||||||
| Tricolor Auto Securitization Trust 2021-1A A† | 0.74% | 4/15/2024 | 28,115 | 28,103,018 | ||||||||
| Volkswagen Auto Lease Trust 2020-A A2 | 0.27% | 4/20/2023 | 60,375 | 60,372,045 | ||||||||
| Volkswagen Auto Lease Trust 2020-A A3 | 0.39% | 1/22/2024 | 44,001 | 43,964,484 | ||||||||
| Volkswagen Auto Loan Enhanced Trust 2018-2 A3 | 3.25% | 4/20/2023 | 1,925 | 1,932,601 | ||||||||
| Westlake Automobile Receivables Trust 2020-2A A2A† | 0.93% | 2/15/2024 | 30,195 | 30,234,309 | ||||||||
| Westlake Automobile Receivables Trust 2021-1A C† | 0.95% | 3/16/2026 | 87,800 | 87,406,630 | ||||||||
| Westlake Automobile Receivables Trust 2021-2A D† | 1.23% | 12/15/2026 | 30,025 | 29,633,567 | ||||||||
| World Omni Auto Receivables Trust 2019-B A3 | 2.59% | 7/15/2024 | 3,015 | 3,038,235 | ||||||||
| World Omni Automobile Lease Securitization Trust 2020-B A2 | 0.32% | 9/15/2023 | 26,363 | 26,361,992 | ||||||||
| Total | 1,942,786,205 | |||||||||||
| Credit Card 1.68% | ||||||||||||
| American Express Credit Account Master Trust 2017-2 A | 0.54% (1 Mo. LIBOR + .45% | )# | 9/16/2024 | 4,415 | 4,418,617 | |||||||
| American Express Credit Account Master Trust 2019-1 B | 3.07% | 10/15/2024 | 9,000 | 9,070,531 | ||||||||
| Capital One Multi-Asset Execution Trust 2019-A1 A1 | 2.84% | 12/15/2024 | 10,500 | 10,556,889 | ||||||||
| Discover Card Execution Note Trust 2019-A1 A1 | 3.04% | 7/15/2024 | 13,936 | 13,982,741 | ||||||||
| Synchrony Card Funding LLC 2019-A1 A | 2.95% | 3/15/2025 | 97,011 | 97,770,887 | ||||||||
| See Notes to Financial Statements. | 409 |
Schedule of Investments (continued)
ULTRA SHORT BOND FUND November 30, 2021
| Investments | Interest Rate | Maturity Date | Principal Amount (000) | Fair Value | ||||||||
| Credit Cards (continued) | ||||||||||||
| World Financial Network Credit Card Master Trust 2019-A A | 3.14% | 12/15/2025 | $ | 48,860 | $ | 49,154,333 | ||||||
| World Financial Network Credit Card Master Trust 2019-C A | 2.21% | 7/15/2026 | 104,350 | 105,844,062 | ||||||||
| Total | 290,798,060 | |||||||||||
| Other 12.58% | ||||||||||||
| Affirm Asset Securitization Trust 2021-A A† | 0.88% | 8/15/2025 | 58,000 | 58,044,231 | ||||||||
| Amur Equipment Finance Receivables VI LLC 2018-2A A2† | 3.89% | 7/20/2022 | 1,370 | 1,379,426 | ||||||||
| Amur Equipment Finance Receivables VII LLC 2019-1A A2† | 2.63% | 6/20/2024 | 7,106 | 7,181,676 | ||||||||
| Apidos CLO XXIV 2016-24A A1AL† | 1.082% (3 Mo. LIBOR + .95% | )# | 10/20/2030 | 60,000 | 59,985,000 | |||||||
| Apidos CLO XXXI 2019-31A A1R† | 1.224% (3 Mo. LIBOR + 1.10% | )# | 4/15/2031 | 30,000 | 30,066,343 | |||||||
| Aqua Finance Trust 2021-A A† | 1.54% | 7/17/2046 | 33,317 | 33,084,845 | ||||||||
| Arbor Realty Commercial Real Estate Notes Ltd. 2018-FL1 A† | 1.24% (1 Mo. LIBOR + 1.15% | )# | 6/15/2028 | 26,901 | 26,910,415 | |||||||
| Arbor Realty Commercial Real Estate Notes Ltd. 2019-FL1 A† | 1.24% (1 Mo. LIBOR + 1.15% | )# | 5/15/2037 | 31,330 | 31,320,601 | |||||||
| Atalaya Equipment Leasing Trust 2021-1A A2† | 1.23% | 5/15/2026 | 30,000 | 30,070,800 | ||||||||
| Atrium IX-9A AR2† | 1.166% (3 Mo. LIBOR + .99% | )# | 5/28/2030 | 40,630 | 40,654,375 | |||||||
| Avery Point VI CLO Ltd. 2015-6A AR2† | 1.04% (3 Mo. LIBOR + .90% | )# | 8/5/2027 | 16,370 | 16,370,260 | |||||||
| Bain Capital Credit CLO Ltd. 2016-2A ARR† | 1.094% (3 Mo. LIBOR + .97% | )# | 1/15/2029 | 44,234 | 44,233,834 | |||||||
| Barings CLO Ltd. 2019-3A A1R† | 1.202% (3 Mo. LIBOR + 1.07% | )# | 4/20/2031 | 38,370 | 38,360,324 | |||||||
| BDS Ltd. 2020-FL5 A† | 1.312% (1 Mo. SOFR + 1.26% | )# | 2/16/2037 | 10,830 | 10,802,925 | |||||||
| BlueMountain Fuji US CLO I Ltd. 2017-1A A1R† | 1.112% (3 Mo. LIBOR + .98% | )# | 7/20/2029 | 60,000 | 59,994,085 | |||||||
| Carlyle Global Market Strategies CLO Ltd. 2015-1A AR3† | 1.112% (3 Mo. LIBOR + .98% | )# | 7/20/2031 | 26,090 | 26,105,303 | |||||||
| Cedar Funding XI Clo Ltd. 2019-11A A1R† | 1.226% (3 Mo. LIBOR + 1.05% | )# | 5/29/2032 | 36,290 | 36,244,680 | |||||||
| 410 | See Notes to Financial Statements. |
Schedule of Investments (continued)
ULTRA SHORT BOND FUND November 30, 2021
| Investments | Interest Rate | Maturity Date | Principal Amount (000) | Fair Value | ||||||||
| Other (continued) | ||||||||||||
| CIFC Funding Ltd. 2021-4A A† | 1.174% (3 Mo. LIBOR + 1.05% | )# | 7/15/2033 | $ | 24,750 | $ | 24,731,612 | |||||
| Dell Equipment Finance Trust 2020-2 A2† | 0.47% | 10/24/2022 | 19,125 | 19,137,315 | ||||||||
| Dell Equipment Finance Trust 2020-2 A3† | 0.57% | 10/23/2023 | 49,519 | 49,530,914 | ||||||||
| Dell Equipment Finance Trust 2021-2 A2† | 0.33% | 12/22/2026 | 18,390 | 18,335,900 | ||||||||
| Dell Equipment Finance Trust 2021-2 B† | 0.81% | 12/22/2026 | 10,880 | 10,771,915 | ||||||||
| Dell Equipment Finance Trust 2021-2 C† | 0.94% | 12/22/2026 | 7,370 | 7,302,877 | ||||||||
| Dell Equipment Finance Trust 2021-2 D† | 1.21% | 6/22/2027 | 6,980 | 6,920,227 | ||||||||
| Encina Equipment Finance LLC 2021-1A A1† | 0.50% | 9/15/2025 | 16,837 | 16,843,270 | ||||||||
| Encina Equipment Finance LLC 2021-1A A2† | 0.74% | 12/15/2026 | 23,365 | 23,328,322 | ||||||||
| Flatiron CLO Ltd. 2017-1A AR† | 1.136% (3 Mo. LIBOR + .98% | )# | 5/15/2030 | 17,000 | 17,021,243 | |||||||
| Freed ABS Trust 2020-1CP A† | 0.66% | 3/20/2028 | 6,233 | 6,233,531 | ||||||||
| FS RIALTO 2021-FL2 A† | 1.309% (1 Mo. LIBOR + 1.22% | )# | 4/16/2028 | 18,000 | 17,991,720 | |||||||
| Galaxy XIX CLO Ltd. 2015-19A A1RR† | 1.074% (3 Mo. LIBOR + .95% | )# | 7/24/2030 | 50,000 | 49,997,500 | |||||||
| Galaxy XXIII CLO Ltd. 2017-23 AR† | 0.994% (3 Mo. LIBOR + .87% | )# | 4/24/2029 | 56,827 | 56,980,907 | |||||||
| GreatAmerica Leasing Receivables Funding LLC Series 2021-2 A4† | 1.04% | 9/15/2027 | 14,000 | 13,859,572 | ||||||||
| HGI CRE CLO Ltd. 2021-FL1 A† | 1.139% (1 Mo. LIBOR + 1.05% | )# | 6/16/2036 | 21,570 | 21,553,059 | |||||||
| HGI CRE CLO Ltd. 2021-FL1 AS† | 1.489% (1 Mo. LIBOR + 1.40% | )# | 6/16/2036 | 6,177 | 6,125,190 | |||||||
| HGI CRE CLO Ltd. 2021-FL1 B† | 1.689% (1 Mo. LIBOR + 1.60% | )# | 6/16/2036 | 6,990 | 6,988,211 | |||||||
| HPEFS Equipment Trust 2020-2A A2† | 0.65% | 7/22/2030 | 9,355 | 9,359,414 | ||||||||
| KAYNE CLO I Ltd. 2018-1A AR† | 1.104% (3 Mo. LIBOR + .98% | )# | 7/15/2031 | 28,370 | 28,361,535 | |||||||
| KREF Ltd. 2021-FL2 A† | 1.159% (1 Mo. LIBOR + 1.07% | )# | 2/15/2039 | 36,710 | 36,710,117 | |||||||
| Lending Funding Trust 2020-2A A† | 2.32% | 4/21/2031 | 19,085 | 19,210,251 | ||||||||
| LFT CRE Ltd. 2021-FL1 A† | 1.26% (1 Mo. LIBOR + 1.17% | )# | 6/15/2039 | 53,040 | 53,051,669 | |||||||
| LFT CRE Ltd. 2021-FL1 B† | 1.84% (1 Mo. LIBOR + 1.75% | )# | 6/15/2039 | 41,120 | 41,117,122 | |||||||
| LMREC LLC 2021-CRE4 A† | 1.135% (1 Mo. LIBOR + 1.05% | )# | 4/22/2037 | 38,000 | 38,003,040 | |||||||
| Madison Park Funding X Ltd. 2012-10A AR3† | 1.142% (3 Mo. LIBOR + 1.01% | )# | 1/20/2029 | 66,741 | 66,774,042 | |||||||
| See Notes to Financial Statements. | 411 |
Schedule of Investments (continued)
ULTRA SHORT BOND FUND November 30, 2021
| Investments | Interest Rate | Maturity Date | Principal Amount (000) | Fair Value | ||||||||
| Other (continued) | ||||||||||||
| Madison Park Funding XI Ltd. 2013-11A AR2† | 1.024% (3 Mo. LIBOR + .90% | )# | 7/23/2029 | $ | 59,787 | $ | 59,776,788 | |||||
| Madison Park Funding XVII Ltd. 2015-17A AR2† | 1.13% (3 Mo. LIBOR + 1.00% | )# | 7/21/2030 | 40,000 | 40,014,301 | |||||||
| Madison Park Funding XXXV Ltd. 2019-35A A1R† | 1.122% (3 Mo. LIBOR + .99% | )# | 4/20/2032 | 49,080 | 49,121,440 | |||||||
| Marlette Funding Trust 2021-1A A† | 0.60% | 6/16/2031 | 11,328 | 11,330,832 | ||||||||
| Marlette Funding Trust 2021-1A B† | 1.00% | 6/16/2031 | 9,175 | 9,161,496 | ||||||||
| Marlette Funding Trust 2021-2A B† | 1.06% | 9/15/2031 | 12,340 | 12,280,519 | ||||||||
| Marlette Funding Trust 2021-3A B† | 1.30% | 12/15/2031 | 32,525 | 32,200,966 | ||||||||
| MF1 Ltd. 2021-FL6 A† | 1.189% (1 Mo. LIBOR + 1.10% | )# | 7/16/2036 | 90,860 | 90,774,592 | |||||||
| Navient Private Education Refi Loan Trust 2020-EA A† | 1.69% | 5/15/2069 | 25,338 | 25,421,830 | ||||||||
| Navient Private Education Refi Loan Trust 2021-FA A† | 1.11% | 2/18/2070 | 29,799 | 29,414,760 | ||||||||
| Octagon Investment Partners 30 Ltd. 2017-1A A1R† | 1.132% (3 Mo. LIBOR + 1.00% | )# | 3/17/2030 | 68,340 | 68,357,085 | |||||||
| Octagon Investment Partners 31 LLC 2017-1A AR† | 1.182% (3 Mo. LIBOR + 1.05% | )# | 7/20/2030 | 50,000 | 50,047,084 | |||||||
| Octagon Investment Partners XIV Ltd. 2012-1A AARR† | 1.074% (3 Mo. LIBOR + .95% | )# | 7/15/2029 | 60,000 | 59,974,993 | |||||||
| Octagon Loan Funding Ltd. 2014-1A ARR† | 1.34% (3 Mo. LIBOR + 1.18% | )# | 11/18/2031 | 26,390 | 26,425,552 | |||||||
| Pagaya AI Debt Selection Trust 2021-1 A† | 1.18% | 11/15/2027 | 55,298 | 55,242,128 | ||||||||
| PFS Financing Corp. 2020-F A† | 0.93% | 8/15/2024 | 24,175 | 24,248,734 | ||||||||
| Regatta Funding LP 2013-2A A1R3† | 0.974% (3 Mo. LIBOR + .85% | )# | 1/15/2029 | 60,993 | 60,971,509 | |||||||
| SCF Equipment Leasing LLC 2019-2A A1† | 2.22% | 6/20/2024 | 3,074 | 3,082,491 | ||||||||
| SCF Equipment Leasing LLC 2021-1A A2† | 0.42% | 8/20/2026 | 121,168 | 120,913,859 | ||||||||
| TCI-Flatiron Clo Ltd. 2017-1A AR† | 1.118% (3 Mo. LIBOR + .96% | )# | 11/18/2030 | 50,000 | 49,989,324 | |||||||
| Theorem Funding Trust 2021-1A A† | 1.21% | 12/15/2027 | 7,267 | 7,262,034 | ||||||||
| TICP CLO XIV Ltd. 2019-14A A1R†(a) | Zero Coupon#(b) | 10/20/2032 | 37,840 | 37,840,000 | ||||||||
| 412 | See Notes to Financial Statements. |
Schedule of Investments (continued)
ULTRA SHORT BOND FUND November 30, 2021
| Investments | Interest Rate | Maturity Date | Principal Amount (000) | Fair Value | ||||||||
| Other (continued) | ||||||||||||
| Voya CLO 2019-3 Ltd. AR†(a) | 1.193% (3 Mo. LIBOR + 1.08% | )# | 10/17/2032 | $ | 33,000 | $ | 33,000,000 | |||||
| Westgate Resorts LLC 2018-1A A† | 3.38% | 12/20/2031 | 851 | 855,458 | ||||||||
| Total | 2,174,757,373 | |||||||||||
| Total Asset-Backed Securities (cost $4,419,009,135) | 4,408,341,638 | |||||||||||
| CORPORATE BONDS 52.89% | ||||||||||||
| Aerospace/Defense 0.70% | ||||||||||||
| Boeing Co. (The) | 1.167% | 2/4/2023 | 39,426 | 39,442,430 | ||||||||
| L3Harris Technologies, Inc. | 0.866% (3 Mo. LIBOR + .75% | )# | 3/10/2023 | 81,249 | 81,630,008 | |||||||
| Total | 121,072,438 | |||||||||||
| Agriculture 0.75% | ||||||||||||
| BAT Capital Corp. | 1.036% (3 Mo. LIBOR + .88% | )# | 8/15/2022 | 80,408 | 80,716,473 | |||||||
| Imperial Brands Finance plc (United Kingdom)†(c) | 3.50% | 2/11/2023 | 47,531 | 48,608,078 | ||||||||
| Total | 129,324,551 | |||||||||||
| Apparel 0.19% | ||||||||||||
| Tapestry, Inc. | 3.00% | 7/15/2022 | 32,902 | 33,317,150 | ||||||||
| Auto Manufacturers 5.19% | ||||||||||||
| American Honda Finance Corp. | 0.672% (3 Mo. LIBOR + .54% | )# | 6/27/2022 | 68,107 | 68,284,784 | |||||||
| BMW Finance NV (Netherlands)†(c) | 0.944% (3 Mo. LIBOR + .79% | )# | 8/12/2022 | 45,212 | 45,464,486 | |||||||
| BMW US Capital LLC† | 0.657% (3 Mo. LIBOR + .53% | )# | 4/14/2022 | 48,220 | 48,294,610 | |||||||
| BMW US Capital LLC† | 0.767% (3 Mo. LIBOR + .64% | )# | 4/6/2022 | 9,101 | 9,114,885 | |||||||
| Daimler Finance North America LLC† | 1.04% (3 Mo. LIBOR + .88% | )# | 2/22/2022 | 16,045 | 16,071,508 | |||||||
| Daimler Finance North America LLC† | 1.056% (3 Mo. LIBOR + .90% | )# | 2/15/2022 | 67,089 | 67,195,720 | |||||||
| Daimler Finance North America LLC† | 2.85% | 1/6/2022 | 5,870 | 5,882,188 | ||||||||
| Daimler Finance North America LLC† | 3.40% | 2/22/2022 | 18,181 | 18,303,901 | ||||||||
| General Motors Co. | 4.875% | 10/2/2023 | 49,892 | 53,069,914 | ||||||||
| General Motors Co. | 5.40% | 10/2/2023 | 35,030 | 37,750,891 | ||||||||
| General Motors Financial Co., Inc. | 0.669% (SOFR + .62% | )# | 10/15/2024 | 44,943 | 44,936,500 | |||||||
| See Notes to Financial Statements. | 413 |
Schedule of Investments (continued)
ULTRA SHORT BOND FUND November 30, 2021
| Investments | Interest Rate | Maturity Date | Principal Amount (000) | Fair Value | ||||||||
| Auto Manufacturers (continued) | ||||||||||||
| General Motors Financial Co., Inc. | 1.123% (3 Mo. LIBOR + .99% | )# | 1/5/2023 | $ | 2,989 | $ | 3,005,380 | |||||
| General Motors Financial Co., Inc. | 1.442% (3 Mo. LIBOR + 1.31% | )# | 6/30/2022 | 15,191 | 15,257,046 | |||||||
| General Motors Financial Co., Inc. | 1.677% (3 Mo. LIBOR + 1.55% | )# | 1/14/2022 | 9,237 | 9,249,353 | |||||||
| General Motors Financial Co., Inc. | 3.70% | 5/9/2023 | 13,587 | 14,059,793 | ||||||||
| General Motors Financial Co., Inc. | 5.10% | 1/17/2024 | 36,347 | 39,126,615 | ||||||||
| Hyundai Capital America† | 0.80% | 4/3/2023 | 10,481 | 10,448,536 | ||||||||
| Hyundai Capital America† | 0.80% | 1/8/2024 | 99,652 | 98,885,484 | ||||||||
| Hyundai Capital America† | 1.25% | 9/18/2023 | 15,532 | 15,565,603 | ||||||||
| Hyundai Capital America† | 2.375% | 2/10/2023 | 41,268 | 41,963,218 | ||||||||
| Hyundai Capital America† | 3.25% | 9/20/2022 | 18,805 | 19,199,479 | ||||||||
| Hyundai Capital America† | 3.40% | 6/20/2024 | 13,639 | 14,319,848 | ||||||||
| Hyundai Capital America† | 5.75% | 4/6/2023 | 13,629 | 14,472,864 | ||||||||
| Stellantis N.V. (Netherlands)(c) | 5.25% | 4/15/2023 | 48,582 | 51,452,710 | ||||||||
| Toyota Motor Credit Corp. | 1.15% | 5/26/2022 | 91,057 | 91,400,441 | ||||||||
| Volkswagen Group of America Finance LLC† | 0.75% | 11/23/2022 | 34,858 | 34,893,395 | ||||||||
| Volkswagen Group of America Finance LLC† | 2.90% | 5/13/2022 | 10,339 | 10,445,934 | ||||||||
| Total | 898,115,086 | |||||||||||
| Banks 31.55% | ||||||||||||
| ABN AMRO Bank NV (Netherlands)(c) | 6.25% | 4/27/2022 | 4,534 | 4,637,239 | ||||||||
| AIB Group plc (Ireland)†(c) | 4.75% | 10/12/2023 | 77,826 | 82,757,529 | ||||||||
| Australia & New Zealand Banking Group Ltd. (Australia)†(c) | 0.65% (3 Mo. LIBOR + .49% | )# | 11/21/2022 | 30,679 | 30,808,427 | |||||||
| Banco BBVA Peru SA (Peru)(c) | 5.00% | 8/26/2022 | 1,602 | 1,646,736 | ||||||||
| Banco Santander Mexico SA Institucion de Banca Multiple Grupo Financiero Santand (Mexico)†(c) | 4.125% | 11/9/2022 | 22,291 | 22,886,504 | ||||||||
| Bank of America Corp. | 3.124% (3 Mo. LIBOR + 1.16% | )# | 1/20/2023 | 27,633 | 27,726,489 | |||||||
| Bank of America Corp. | 3.30% | 1/11/2023 | 29,143 | 30,010,530 | ||||||||
| Bank of Ireland Group plc (Ireland)†(c) | 4.50% | 11/25/2023 | 39,191 | 41,705,675 | ||||||||
| Bank of Montreal (Canada)(c) | 0.729% (SOFR + .68% | )# | 3/10/2023 | 107,269 | 107,862,599 | |||||||
| Bank of Nova Scotia (The) (Canada)(c) | 0.599% (SOFR + .55% | )# | 9/15/2023 | 67,842 | 68,151,849 | |||||||
| Barclays Bank plc (United Kingdom)(c) | 1.70% | 5/12/2022 | 25,762 | 25,875,649 | ||||||||
| 414 | See Notes to Financial Statements. |
Schedule of Investments (continued)
ULTRA SHORT BOND FUND November 30, 2021
| Investments | Interest Rate | Maturity Date | Principal Amount (000) | Fair Value | ||||||||
| Banks (continued) | ||||||||||||
| Barclays plc (United Kingdom)(c) | 1.746% (3 Mo. LIBOR + 1.63% | )# | 1/10/2023 | $ | 4,955 | $ | 4,963,292 | |||||
| Barclays plc (United Kingdom)(c) | 3.684% | 1/10/2023 | 26,347 | 26,430,486 | ||||||||
| Barclays plc (United Kingdom)(c) | 4.338% (3 Mo. LIBOR + 1.36% | )# | 5/16/2024 | 36,454 | 38,178,323 | |||||||
| Barclays plc (United Kingdom)(c) | 4.375% | 9/11/2024 | 8,819 | 9,441,017 | ||||||||
| Barclays plc (United Kingdom)(c) | 4.61% (3 Mo. LIBOR + 1.40% | )# | 2/15/2023 | 98,625 | 99,392,204 | |||||||
| BBVA Bancomer SA† | 4.375% | 4/10/2024 | 5,535 | 5,917,136 | ||||||||
| BBVA Bancomer SA† | 6.75% | 9/30/2022 | 64,370 | 67,029,125 | ||||||||
| BPCE SA (France)†(c) | 1.354% (3 Mo. LIBOR + 1.24% | )# | 9/12/2023 | 18,134 | 18,445,296 | |||||||
| Canadian Imperial Bank of Commerce (Canada)(c) | 0.849% (SOFR + .80% | )# | 3/17/2023 | 137,844 | 138,750,346 | |||||||
| Capital One NA | 1.279% (3 Mo. LIBOR + 1.15% | )# | 1/30/2023 | 1,730 | 1,732,503 | |||||||
| Capital One NA | 2.15% | 9/6/2022 | 5,493 | 5,554,424 | ||||||||
| CIT Group, Inc. | 3.929% (SOFR + 3.83% | )# | 6/19/2024 | 9,200 | 9,493,239 | |||||||
| CIT Group, Inc. | 4.75% | 2/16/2024 | 29,916 | 31,618,819 | ||||||||
| CIT Group, Inc. | 5.00% | 8/15/2022 | 5,208 | 5,352,027 | ||||||||
| CIT Group, Inc. | 5.00% | 8/1/2023 | 9,600 | 10,141,008 | ||||||||
| Citigroup, Inc. | 0.825% (3 Mo. LIBOR + .69% | )# | 10/27/2022 | 6,182 | 6,208,111 | |||||||
| Citigroup, Inc. | 1.084% (3 Mo. LIBOR + .96% | )# | 4/25/2022 | 46,057 | 46,168,471 | |||||||
| Citigroup, Inc. | 1.601% (3 Mo. LIBOR + 1.43% | )# | 9/1/2023 | 2,992 | 3,018,704 | |||||||
| Citigroup, Inc. | 2.70% | 10/27/2022 | 6,024 | 6,133,767 | ||||||||
| Citigroup, Inc. | 3.142% (3 Mo. LIBOR + .72% | )# | 1/24/2023 | 76,173 | 76,447,710 | |||||||
| Citizens Bank NA/Providence RI | 0.876% (3 Mo. LIBOR + .72% | )# | 2/14/2022 | 31,773 | 31,796,299 | |||||||
| Citizens Bank NA/Providence RI | 0.99% (3 Mo. LIBOR + .81% | )# | 5/26/2022 | 2,778 | 2,786,740 | |||||||
| Citizens Bank NA/Providence RI | 1.082% (3 Mo. LIBOR + .95% | )# | 3/29/2023 | 14,500 | 14,638,870 | |||||||
| Cooperatieve Rabobank UA (Netherlands)(c) | 4.625% | 12/1/2023 | 4,425 | 4,736,591 | ||||||||
| Credit Suisse AG | 0.50% (SOFR + .45% | )# | 2/4/2022 | 5,092 | 5,093,751 | |||||||
| See Notes to Financial Statements. | 415 |
Schedule of Investments (continued)
ULTRA SHORT BOND FUND November 30, 2021
| Investments | Interest Rate | Maturity Date | Principal Amount (000) | Fair Value | ||||||||
| Banks (continued) | ||||||||||||
| Credit Suisse AG | 2.80% | 4/8/2022 | $ | 35,048 | $ | 35,343,558 | ||||||
| Credit Suisse Group AG (Switzerland)†(c) | 2.997% (3 Mo. LIBOR + 1.20% | )# | 12/14/2023 | 20,157 | 20,547,586 | |||||||
| Credit Suisse Group AG (Switzerland)†(c) | 3.574% | 1/9/2023 | 86,296 | 86,537,256 | ||||||||
| Credit Suisse Group AG (Switzerland)†(c) | 4.207% (3 Mo. LIBOR + 1.24% | )# | 6/12/2024 | 23,000 | 24,032,551 | |||||||
| Danske Bank A/S (Denmark)†(c) | 1.171% (1 Yr. Treasury CMT + 1.03% | )# | 12/8/2023 | 31,766 | 31,788,527 | |||||||
| Danske Bank A/S (Denmark)†(c) | 1.174% (3 Mo. LIBOR + 1.06% | )# | 9/12/2023 | 2,800 | 2,824,555 | |||||||
| Danske Bank A/S (Denmark)†(c) | 1.226% | 6/22/2024 | 11,630 | 11,659,537 | ||||||||
| Danske Bank A/S (Denmark)†(c) | 5.00% | 1/12/2022 | 86,990 | 87,422,613 | ||||||||
| Danske Bank A/S (Denmark)†(c) | 5.00% (1 Yr. Treasury CMT + 1.73% | )# | 1/12/2023 | 10,278 | 10,323,613 | |||||||
| Danske Bank A/S (Denmark)†(c) | 5.375% | 1/12/2024 | 73,404 | 79,350,306 | ||||||||
| DNB Bank ASA (Norway)†(c) | 0.793% (3 Mo. LIBOR + .62% | )# | 12/2/2022 | 45,058 | 45,280,098 | |||||||
| Fifth Third Bank NA | 0.772% (3 Mo. LIBOR + .64% | )# | 2/1/2022 | 1,505 | 1,505,705 | |||||||
| First Abu Dhabi Bank PJSC (United Arab Emirates)(c) | 1.072% (3 Mo. LIBOR + .95% | )# | 4/16/2022 | 18,310 | 18,337,904 | |||||||
| Goldman Sachs Group, Inc. (The) | 0.481% | 1/27/2023 | 72,132 | 71,910,773 | ||||||||
| Goldman Sachs Group, Inc. (The) | 0.539% (SOFR + .49% | )# | 10/21/2024 | 63,161 | 63,063,391 | |||||||
| Goldman Sachs Group, Inc. (The) | 0.59% (SOFR + .54% | )# | 11/17/2023 | 53,778 | 53,748,623 | |||||||
| Goldman Sachs Group, Inc. (The) | 0.673% (SOFR + .57% | )# | 3/8/2024 | 37,783 | 37,649,796 | |||||||
| Goldman Sachs Group, Inc. (The) | 0.914% (3 Mo. LIBOR + .75% | )# | 2/23/2023 | 133,230 | 133,933,243 | |||||||
| Goldman Sachs Group, Inc. (The) | 2.905% (3 Mo. LIBOR + .99% | )# | 7/24/2023 | 46,466 | 47,075,722 | |||||||
| Goldman Sachs Group, Inc. (The) | 5.75% | 1/24/2022 | 25,337 | 25,533,099 | ||||||||
| HSBC Holdings plc (United Kingdom)(c) | 3.262% (3 Mo. LIBOR + 1.06% | )# | 3/13/2023 | 18,074 | 18,202,211 | |||||||
| ING Groep NV (Netherlands)(c) | 1.282% (3 Mo. LIBOR + 1.15% | )# | 3/29/2022 | 55,235 | 55,420,717 | |||||||
| Intesa Sanpaolo SpA (Italy)†(c) | 3.125% | 7/14/2022 | 15,951 | 16,180,850 | ||||||||
| Intesa Sanpaolo SpA (Italy)†(c) | 3.375% | 1/12/2023 | 39,863 | 40,889,475 | ||||||||
| 416 | See Notes to Financial Statements. |
Schedule of Investments (continued)
ULTRA SHORT BOND FUND November 30, 2021
| Investments | Interest Rate | Maturity Date | Principal Amount (000) | Fair Value | ||||||||
| Banks (continued) | ||||||||||||
| Intesa Sanpaolo SpA (Italy)(c) | 5.25% | 1/12/2024 | $ | 33,000 | $ | 35,641,667 | ||||||
| JPMorgan Chase & Co. | 1.024% (3 Mo. LIBOR + .90% | )# | 4/25/2023 | 1,332 | 1,335,510 | |||||||
| JPMorgan Chase & Co. | 1.124% (3 Mo. LIBOR + 1.00% | )# | 1/15/2023 | 28,100 | 28,131,362 | |||||||
| JPMorgan Chase & Co. | 2.776% (3 Mo. LIBOR + .94% | )# | 4/25/2023 | 78,510 | 79,152,809 | |||||||
| JPMorgan Chase & Co. | 3.207% (3 Mo. LIBOR + .70% | )# | 4/1/2023 | 24,833 | 25,049,228 | |||||||
| KeyBank NA | 0.792% (3 Mo. LIBOR + .66% | )# | 2/1/2022 | 61,863 | 61,923,891 | |||||||
| Lloyds Banking Group plc (United Kingdom)(c) | 1.326% (1 Yr. Treasury CMT + 1.10% | )# | 6/15/2023 | 27,963 | 28,039,953 | |||||||
| Macquarie Bank Ltd. (Australia)†(c) | 0.441% | 12/16/2022 | 96,940 | 96,827,333 | ||||||||
| Macquarie Group Ltd. (Australia)†(c) | 1.196% (3 Mo. LIBOR + 1.02% | )# | 11/28/2023 | 26,123 | 26,297,514 | |||||||
| Macquarie Group Ltd. (Australia)†(c) | 4.15% (3 Mo. LIBOR + 1.33% | )# | 3/27/2024 | 16,446 | 17,114,443 | |||||||
| Mitsubishi UFJ Financial Group, Inc. (Japan)(c) | 2.623% | 7/18/2022 | 84,765 | 85,918,655 | ||||||||
| Mitsubishi UFJ Financial Group, Inc. (Japan)(c) | 3.218% | 3/7/2022 | 12,059 | 12,150,800 | ||||||||
| Morgan Stanley | 0.529% (SOFR + .46% | )# | 1/25/2024 | 94,617 | 94,273,336 | |||||||
| Morgan Stanley | 0.75% (SOFR + .70% | )# | 1/20/2023 | 288,988 | 289,249,812 | |||||||
| Morgan Stanley | 1.524% (3 Mo. LIBOR + 1.40% | )# | 10/24/2023 | 22,625 | 22,879,466 | |||||||
| Morgan Stanley | 4.875% | 11/1/2022 | 17,185 | 17,838,230 | ||||||||
| MUFG Union Bank NA | 0.716% (3 Mo. LIBOR + .60% | )# | 3/7/2022 | 46,286 | 46,331,976 | |||||||
| National Australia Bank Ltd. (Australia)†(c) | 0.524% (3 Mo. LIBOR + .41% | )# | 12/13/2022 | 71,318 | 71,546,774 | |||||||
| National Bank of Canada (Canada)†(c) | 2.15% | 10/7/2022 | 8,695 | 8,817,218 | ||||||||
| Natwest Group plc (United Kingdom)(c) | 1.626% (3 Mo. LIBOR + 1.47% | )# | 5/15/2023 | 52,890 | 53,142,956 | |||||||
| Natwest Group plc (United Kingdom)(c) | 3.498% (3 Mo. LIBOR + 1.48% | )# | 5/15/2023 | 112,378 | 113,723,876 | |||||||
| Natwest Group plc (United Kingdom)(c) | 3.875% | 9/12/2023 | 96,394 | 100,803,183 | ||||||||
| See Notes to Financial Statements. | 417 |
Schedule of Investments (continued)
ULTRA SHORT BOND FUND November 30, 2021
| Investments | Interest Rate | Maturity Date | Principal Amount (000) | Fair Value | ||||||||
| Banks (continued) | ||||||||||||
| Natwest Group plc (United Kingdom)(c) | 5.125% | 5/28/2024 | $ | 42,410 | $ | 45,897,186 | ||||||
| NatWest Group plc (United Kingdom)(c) | 4.519% (3 Mo. LIBOR + 1.55% | )# | 6/25/2024 | 28,800 | 30,316,067 | |||||||
| Natwest Markets plc (United Kingdom)†(c) | 0.58% (SOFR + .53% | )# | 8/12/2024 | 22,842 | 22,887,186 | |||||||
| Nordea Bank Abp (Finland)†(c) | 4.25% | 9/21/2022 | 51,819 | 53,303,589 | ||||||||
| PNC Bank NA | 0.495% (3 Mo. LIBOR + .33% | )# | 2/24/2023 | 90,201 | 90,294,021 | |||||||
| PNC Bank NA | 0.546% (3 Mo. LIBOR + .43% | )# | 12/9/2022 | 67,643 | 67,647,439 | |||||||
| Royal Bank of Canada (Canada)(c) | 0.482% (3 Mo. LIBOR + .36% | )# | 1/17/2023 | 95,792 | 96,052,632 | |||||||
| Santander Holdings USA, Inc. | 3.70% | 3/28/2022 | 37,000 | 37,271,620 | ||||||||
| Santander UK Group Holdings plc (United Kingdom)(c) | 3.373% (3 Mo. LIBOR + 1.08% | )# | 1/5/2024 | 80,471 | 82,564,577 | |||||||
| Skandinaviska Enskilda Banken AB (Sweden)†(c) | 0.759% (3 Mo. LIBOR + .65% | )# | 12/12/2022 | 56,713 | 57,050,982 | |||||||
| Standard Chartered plc (United Kingdom)†(c) | 1.282% (3 Mo. LIBOR + 1.15% | )# | 1/20/2023 | 63,599 | 63,667,079 | |||||||
| Standard Chartered plc (United Kingdom)†(c) | 1.299% (SOFR + 1.25% | )# | 10/14/2023 | 32,098 | 32,342,977 | |||||||
| Standard Chartered plc (United Kingdom)†(c) | 1.319% (1 Yr. Treasury CMT + 1.17% | )# | 10/14/2023 | 41,828 | 41,931,932 | |||||||
| Standard Chartered plc (United Kingdom)†(c) | 3.885% (3 Mo. LIBOR + 1.08% | )# | 3/15/2024 | 20,000 | 20,677,196 | |||||||
| Standard Chartered plc (United Kingdom)†(c) | 3.95% | 1/11/2023 | 42,168 | 43,358,805 | ||||||||
| Standard Chartered plc (United Kingdom)†(c) | 4.247% (3 Mo. LIBOR + 1.15% | )# | 1/20/2023 | 62,306 | 62,595,262 | |||||||
| Standard Chartered plc (United Kingdom)†(c) | 5.20% | 1/26/2024 | 30,000 | 32,118,920 | ||||||||
| Standard Chartered plc (United Kingdom)(c) | 5.70% | 1/25/2022 | 30,228 | 30,446,186 | ||||||||
| Sumitomo Mitsui Financial Group, Inc. (Japan)(c) | 0.901% (3 Mo. LIBOR + .78% | )# | 7/12/2022 | 17,448 | 17,524,116 | |||||||
| Sumitomo Mitsui Financial Group, Inc. (Japan)(c) | 2.784% | 7/12/2022 | 45,752 | 46,406,666 | ||||||||
| Sumitomo Mitsui Financial Group, Inc. (Japan)(c) | 2.846% | 1/11/2022 | 21,765 | 21,824,808 | ||||||||
| Swedbank AB (Sweden)†(c) | 2.80% | 3/14/2022 | 46,374 | 46,710,825 | ||||||||
| Synovus Bank/Columbus GA | 2.289% (SOFR + .95% | )# | 2/10/2023 | 24,678 | 24,726,936 | |||||||
| Toronto-Dominion Bank (The) (Canada)(c) | 0.701% (3 Mo. LIBOR + .53% | )# | 12/1/2022 | 59,538 | 59,850,950 | |||||||
| 418 | See Notes to Financial Statements. |
Schedule of Investments (continued)
ULTRA SHORT BOND FUND November 30, 2021
| Investments | Interest Rate | Maturity Date | Principal Amount (000) | Fair Value | ||||||||
| Banks (continued) | ||||||||||||
| Truist Bank | 0.748% (3 Mo. LIBOR + .59% | )# | 5/17/2022 | $ | 56,695 | $ | 56,801,529 | |||||
| Truist Bank | 0.779% (SOFR + .73% | )# | 3/9/2023 | 22,403 | 22,551,732 | |||||||
| UBS AG (United Kingdom)†(c) | 1.75% | 4/21/2022 | 82,793 | 83,152,383 | ||||||||
| UBS AG (Switzerland)(c) | 5.125% | 5/15/2024 | 25,498 | 27,442,222 | ||||||||
| UBS AG | 7.625% | 8/17/2022 | 158,927 | 166,027,366 | ||||||||
| UBS Group AG (Switzerland)†(c) | 1.106% (3 Mo. LIBOR + .95% | )# | 8/15/2023 | 8,123 | 8,167,113 | |||||||
| UBS Group AG (Switzerland)†(c) | 1.662% (3 Mo. LIBOR + 1.53% | )# | 2/1/2022 | 36,422 | 36,515,313 | |||||||
| UBS Group AG (Switzerland)†(c) | 2.65% | 2/1/2022 | 45,651 | 45,824,616 | ||||||||
| UniCredit SpA (Italy)†(c) | 4.027% (3 Mo. LIBOR + 3.90% | )# | 1/14/2022 | 19,192 | 19,271,468 | |||||||
| UniCredit SpA (Italy)†(c) | 6.572% | 1/14/2022 | 81,893 | 82,424,171 | ||||||||
| UniCredit SpA (Italy)†(c) | 7.83% | 12/4/2023 | 69,639 | 78,499,524 | ||||||||
| US Bank NA/Cincinnati OH | 0.516% (3 Mo. LIBOR + .40% | )# | 12/9/2022 | 85,692 | 86,009,623 | |||||||
| Wells Fargo & Co. | 1.234% (3 Mo. LIBOR + 1.11% | )# | 1/24/2023 | 19,862 | 19,892,827 | |||||||
| Wells Fargo & Co. | 2.625% | 7/22/2022 | 64,642 | 65,532,818 | ||||||||
| Wells Fargo & Co. | 3.50% | 3/8/2022 | 40,517 | 40,858,892 | ||||||||
| Westpac Banking Corp. (Australia)(c) | 0.512% (3 Mo. LIBOR + .39% | )# | 1/13/2023 | 41,123 | 41,280,772 | |||||||
| Total | 5,456,009,512 | |||||||||||
| Beverages 0.16% | ||||||||||||
| Diageo Investment Corp. | 8.00% | 9/15/2022 | 26,863 | 28,432,129 | ||||||||
| Chemicals 0.06% | ||||||||||||
| International Flavors & Fragrances, Inc.† | 0.697% | 9/15/2022 | 9,654 | 9,661,322 | ||||||||
| Commercial Services 0.21% | ||||||||||||
| IHS Markit Ltd. (United Kingdom)(c) | 4.125% | 8/1/2023 | 6,885 | 7,207,838 | ||||||||
| IHS Markit Ltd. (United Kingdom)†(c) | 5.00% | 11/1/2022 | 21,303 | 21,956,043 | ||||||||
| Triton Container International Ltd.† | 0.80% | 8/1/2023 | 7,430 | 7,375,290 | ||||||||
| Total | 36,539,171 | |||||||||||
| Computers 0.34% | ||||||||||||
| Dell International LLC/EMC Corp. | 5.45% | 6/15/2023 | 56,230 | 59,657,776 | ||||||||
| See Notes to Financial Statements. | 419 |
Schedule of Investments (continued)
ULTRA SHORT BOND FUND November 30, 2021
| Investments | Interest Rate | Maturity Date | Principal Amount (000) | Fair Value | ||||||||
| Diversified Financial Services 3.10% | ||||||||||||
| AerCap Ireland Capital DAC/AerCap Global Aviation Trust (Ireland)(c) | 4.50% | 9/15/2023 | $ | 24,000 | $ | 25,291,002 | ||||||
| AerCap Ireland Capital DAC/AerCap Global Aviation Trust (Ireland)(c) | 4.875% | 1/16/2024 | 45,000 | 48,105,713 | ||||||||
| Air Lease Corp. | 3.00% | 9/15/2023 | 11,000 | 11,314,833 | ||||||||
| Aircastle Ltd. | 4.40% | 9/25/2023 | 8,000 | 8,412,841 | ||||||||
| Ally Financial, Inc. | 4.125% | 2/13/2022 | 5,764 | 5,804,281 | ||||||||
| Ally Financial, Inc. | 4.625% | 5/19/2022 | 20,584 | 20,978,846 | ||||||||
| American Express Co. | 0.78% | )# | 5/20/2022 | 44,541 | 44,567,210 | |||||||
| American Express Co. | 0.826% (3 Mo. LIBOR + .65% | )# | 2/27/2023 | 5,961 | 5,998,952 | |||||||
| American Express Co. | 2.50% | 8/1/2022 | 76,365 | 77,320,338 | ||||||||
| American Express Co. | 2.75% | 5/20/2022 | 70,377 | 71,022,537 | ||||||||
| Aviation Capital Group LLC† | 2.875% | 1/20/2022 | 3,750 | 3,754,157 | ||||||||
| Aviation Capital Group LLC† | 3.875% | 5/1/2023 | 8,003 | 8,287,360 | ||||||||
| Aviation Capital Group LLC† | 4.375% | 1/30/2024 | 16,212 | 17,116,175 | ||||||||
| Avolon Holdings Funding Ltd. (Ireland)†(c) | 3.95% | 7/1/2024 | 9,147 | 9,594,237 | ||||||||
| Avolon Holdings Funding Ltd. (Ireland)†(c) | 5.125% | 10/1/2023 | 21,534 | 22,803,612 | ||||||||
| Avolon Holdings Funding Ltd. (Ireland)†(c) | 5.25% | 5/15/2024 | 36,108 | 38,872,300 | ||||||||
| Capital One Bank USA NA | 2.014% (SOFR + .62% | )# | 1/27/2023 | 10,801 | 10,821,493 | |||||||
| Capital One Financial Corp. | 1.066% (3 Mo. LIBOR + .95% | )# | 3/9/2022 | 16,296 | 16,319,640 | |||||||
| Citigroup Global Markets Holdings, Inc. | 0.75% | 6/7/2024 | 19,291 | 19,090,284 | ||||||||
| Intercontinental Exchange, Inc. | 2.35% | 9/15/2022 | 19,142 | 19,384,433 | ||||||||
| Nasdaq, Inc. | 0.445% | 12/21/2022 | 21,504 | 21,460,397 | ||||||||
| Park Aerospace Holdings Ltd. (Ireland)†(c) | 4.50% | 3/15/2023 | 4,092 | 4,245,855 | ||||||||
| Park Aerospace Holdings Ltd. (Ireland)†(c) | 5.50% | 2/15/2024 | 22,918 | 24,688,785 | ||||||||
| Total | 535,255,281 | |||||||||||
| Electric 2.49% | ||||||||||||
| Abu Dhabi National Energy Co. PJSC (United Arab Emirates)†(c) | 3.625% | 1/12/2023 | 5,690 | 5,860,598 | ||||||||
| American Electric Power Co., Inc. | 0.612% (3 Mo. LIBOR + .48% | )# | 11/1/2023 | 26,874 | 26,881,749 | |||||||
| American Transmission Systems, Inc.† | 5.25% | 1/15/2022 | 6,747 | 6,782,007 | ||||||||
| CenterPoint Energy, Inc. | 0.70% (SOFR + .65% | )# | 5/13/2024 | 26,348 | 26,356,394 | |||||||
| 420 | See Notes to Financial Statements. |
Schedule of Investments (continued)
ULTRA SHORT BOND FUND November 30, 2021
| Investments | Interest Rate | Maturity Date | Principal Amount (000) | Fair Value | ||||||||
| Electric (continued) | ||||||||||||
| Cleco Power LLC† | 0.616% (3 Mo. LIBOR + .50% | )# | 6/15/2023 | $ | 30,164 | $ | 30,162,174 | |||||
| Comision Federal de Electricidad (Mexico)†(c) | 4.875% | 1/15/2024 | 30,753 | 32,703,202 | ||||||||
| Dominion Energy, Inc. | 0.646% (3 Mo. LIBOR + .53% | )# | 9/15/2023 | 31,659 | 31,680,586 | |||||||
| DTE Energy Co. | 0.55% | 11/1/2022 | 67,590 | 67,494,175 | ||||||||
| Duke Energy Progress LLC | 0.34% (3 Mo. LIBOR + .18% | )# | 2/18/2022 | 36,540 | 36,540,000 | |||||||
| Exelon Corp. | 3.497% | 6/1/2022 | 3,695 | 3,733,401 | ||||||||
| Metropolitan Edison Co.† | 3.50% | 3/15/2023 | 2,000 | 2,049,050 | ||||||||
| Monongahela Power Co.† | 4.10% | 4/15/2024 | 13,665 | 14,465,363 | ||||||||
| NextEra Energy Capital Holdings, Inc. | 0.45% (SOFR + .40% | )# | 11/3/2023 | 35,964 | 35,910,238 | |||||||
| NextEra Energy Capital Holdings, Inc. | 0.59% (SOFR + .54% | )# | 3/1/2023 | 17,877 | 17,931,669 | |||||||
| OGE Energy Corp. | 0.703% | 5/26/2023 | 5,434 | 5,407,573 | ||||||||
| Pacific Gas and Electric Co. | 1.367% | 3/10/2023 | 21,677 | 21,562,489 | ||||||||
| Saudi Electricity Global Sukuk Co. 2 (Saudi Arabia)†(c) | 3.473% | 4/8/2023 | 41,983 | 43,435,696 | ||||||||
| Saudi Electricity Global Sukuk Co. 3 (Saudi Arabia)†(c) | 4.00% | 4/8/2024 | 20,106 | 21,342,559 | ||||||||
| Total | 430,298,923 | |||||||||||
| Electronics 0.13% | ||||||||||||
| Honeywell International, Inc. | 0.514% (3 Mo. LIBOR + .37% | )# | 8/8/2022 | 21,630 | 21,659,602 | |||||||
| Food 0.21% | ||||||||||||
| Mondelez International, Inc. | 0.625% | 7/1/2022 | 36,433 | 36,473,008 | ||||||||
| Gas 0.48% | ||||||||||||
| Atmos Energy Corp. | 0.496% (3 Mo. LIBOR + .38% | )# | 3/9/2023 | 27,228 | 27,230,088 | |||||||
| CenterPoint Energy Resources Corp. | 0.673% (3 Mo. LIBOR + .50% | )# | 3/2/2023 | 27,567 | 27,531,653 | |||||||
| ONE Gas, Inc. | 0.724% (3 Mo. LIBOR + .61% | )# | 3/11/2023 | 28,234 | 28,234,787 | |||||||
| Total | 82,996,528 | |||||||||||
| Health Care-Products 0.52% | ||||||||||||
| Thermo Fisher Scientific, Inc. | 0.399% (SOFR + .35% | )# | 4/18/2023 | 45,122 | 45,149,854 | |||||||
| See Notes to Financial Statements. | 421 |
Schedule of Investments (continued)
ULTRA SHORT BOND FUND November 30, 2021
| Investments | Interest Rate | Maturity Date | Principal Amount (000) | Fair Value | ||||||||
| Health Care-Products (continued) | ||||||||||||
| Thermo Fisher Scientific, Inc. | 0.439% (SOFR + .39% | )# | 10/18/2023 | $ | 31,586 | $ | 31,605,812 | |||||
| Thermo Fisher Scientific, Inc. | 0.579% (SOFR + .53% | )# | 10/18/2024 | 13,647 | 13,668,059 | |||||||
| Total | 90,423,725 | |||||||||||
| Health Care-Services 0.04% | ||||||||||||
| Humana, Inc. | 0.65% | 8/3/2023 | 6,774 | 6,740,323 | ||||||||
| Home Builders 0.24% | ||||||||||||
| Lennar Corp. | 4.75% | 11/15/2022 | 25,208 | 25,927,058 | ||||||||
| NVR, Inc. | 3.95% | 9/15/2022 | 15,097 | 15,365,235 | ||||||||
| Total | 41,292,293 | |||||||||||
| Household Products/Wares 0.30% | ||||||||||||
| Reckitt Benckiser Treasury Services PLC (United Kingdom)†(c) | 0.689% (3 Mo. LIBOR + .56% | )# | 6/24/2022 | 51,458 | 51,593,595 | |||||||
| Insurance 1.37% | ||||||||||||
| Brighthouse Financial Global Funding† | 0.809% (SOFR + .76% | )# | 4/12/2024 | 19,741 | 19,903,969 | |||||||
| Jackson National Life Global Funding† | 0.862% (3 Mo. LIBOR + .73% | )# | 6/27/2022 | 13,794 | 13,849,731 | |||||||
| Met Tower Global Funding† | 0.55% | 7/13/2022 | 95,604 | 95,659,559 | ||||||||
| Metropolitan Life Global Funding I† | 0.619% (SOFR + .57% | )# | 1/13/2023 | 70,611 | 70,944,245 | |||||||
| New York Life Global Funding† | 0.561% (3 Mo. LIBOR + .44% | )# | 7/12/2022 | 36,246 | 36,337,455 | |||||||
| Total | 236,694,959 | |||||||||||
| Investment Companies 0.03% | ||||||||||||
| MDGH - GMTN BV (Netherlands)†(c) | 5.50% | 3/1/2022 | 5,515 | 5,586,651 | ||||||||
| Lodging 0.15% | ||||||||||||
| Hyatt Hotels Corp. | 1.099% (SOFR + 1.05% | )# | 10/1/2023 | 26,113 | 26,168,260 | |||||||
| Machinery: Construction & Mining 0.13% | ||||||||||||
| Caterpillar Financial Services Corp. | 0.347% (3 Mo. LIBOR + .22% | )# | 1/6/2022 | 22,762 | 22,765,153 | |||||||
| 422 | See Notes to Financial Statements. |
Schedule of Investments (continued)
ULTRA SHORT BOND FUND November 30, 2021
| Investments | Interest Rate | Maturity Date | Principal Amount (000) | Fair Value | ||||||||
| Machinery-Diversified 0.38% | ||||||||||||
| John Deere Capital Corp. | 0.604% (3 Mo. LIBOR + .49% | )# | 6/13/2022 | $ | 22,613 | $ | 22,668,171 | |||||
| Otis Worldwide Corp. | 0.583% (3 Mo. LIBOR + .45% | )# | 4/5/2023 | 43,807 | 43,809,513 | |||||||
| Total | 66,477,684 | |||||||||||
| Media 0.16% | ||||||||||||
| Charter Communications Operating LLC/Charter Communications Operating Capital | 1.782% (3 Mo. LIBOR + 1.65% | )# | 2/1/2024 | 27,078 | 27,700,859 | |||||||
| Mining 0.85% | ||||||||||||
| Glencore Finance Canada Ltd. (Canada)†(c) | 4.25% | 10/25/2022 | 19,435 | 20,042,538 | ||||||||
| Glencore Funding LLC† | 4.125% | 5/30/2023 | 18,458 | 19,302,966 | ||||||||
| Glencore Funding LLC† | 4.125% | 3/12/2024 | 42,858 | 45,259,203 | ||||||||
| Glencore Funding LLC† | 4.625% | 4/29/2024 | 55,531 | 59,429,480 | ||||||||
| Indonesia Asahan Aluminium Persero PT (Indonesia)(c) | 5.71% | 11/15/2023 | 2,000 | 2,156,500 | ||||||||
| Total | 146,190,687 | |||||||||||
| Oil & Gas 0.88% | ||||||||||||
| BP Capital Markets plc (United Kingdom)(c) | 2.50% | 11/6/2022 | 21,671 | 22,073,873 | ||||||||
| PT Pertamina Persero (Indonesia)†(c) | 4.875% | 5/3/2022 | 16,000 | 16,256,713 | ||||||||
| SA Global Sukuk Ltd.† | 0.946% | 6/17/2024 | 48,661 | 47,976,437 | ||||||||
| Saudi Arabian Oil Co. (Saudi Arabia)†(c) | 2.875% | 4/16/2024 | 63,023 | 65,256,850 | ||||||||
| Total | 151,563,873 | |||||||||||
| Pharmaceuticals 1.71% | ||||||||||||
| AbbVie, Inc. | 0.81% (3 Mo. LIBOR + .65% | )# | 11/21/2022 | 74,727 | 75,114,590 | |||||||
| AbbVie, Inc. | 3.45% | 3/15/2022 | 84,373 | 84,668,873 | ||||||||
| AstraZeneca plc (United Kingdom)(c) | 0.736% (3 Mo. LIBOR + .62% | )# | 6/10/2022 | 9,023 | 9,047,081 | |||||||
| AstraZeneca plc (United Kingdom)(c) | 0.823% (3 Mo. LIBOR + .67% | )# | 8/17/2023 | 7,157 | 7,214,233 | |||||||
| AstraZeneca plc (United Kingdom)(c) | 2.375% | 6/12/2022 | 8,677 | 8,754,060 | ||||||||
| Bayer US Finance II LLC† | 1.126% (3 Mo. LIBOR + 1.01% | )# | 12/15/2023 | 13,568 | 13,700,246 | |||||||
| Becton Dickinson & Co. | 1.148% (3 Mo. LIBOR + 1.03% | )# | 6/6/2022 | 53,604 | 53,857,709 | |||||||
| Cigna Corp. | 1.014% (3 Mo. LIBOR + .89% | )# | 7/15/2023 | 30,112 | 30,380,046 | |||||||
| See Notes to Financial Statements. | 423 |
Schedule of Investments (continued)
ULTRA SHORT BOND FUND November 30, 2021
| Investments | Interest Rate | Maturity Date | Principal Amount (000) | Fair Value | ||||||||
| Pharmaceuticals (continued) | ||||||||||||
| Viatris, Inc. | 1.125% | 6/22/2022 | $ | 13,655 | $ | 13,677,811 | ||||||
| Total | 296,414,649 | |||||||||||
| Pipelines 0.06% | ||||||||||||
| Florida Gas Transmission Co. LLC† | 3.875% | 7/15/2022 | 10,158 | 10,280,522 | ||||||||
| Savings & Loans 0.12% | ||||||||||||
| Nationwide Building Society (United Kingdom)†(c) | 3.766% (3 Mo. LIBOR + 1.06% | )# | 3/8/2024 | 19,292 | 19,959,539 | |||||||
| Software 0.05% | ||||||||||||
| Roper Technologies, Inc. | 0.45% | 8/15/2022 | 9,136 | 9,129,367 | ||||||||
| Telecommunications 0.25% | ||||||||||||
| AT&T, Inc. | 0.689% (SOFR + .64% | )# | 3/25/2024 | 26,988 | 27,005,882 | |||||||
| Ooredoo International Finance Ltd.† | 3.25% | 2/21/2023 | 15,894 | 16,304,669 | ||||||||
| Total | 43,310,551 | |||||||||||
| Transportation 0.09% | ||||||||||||
| Pelabuhan Indonesia III Persero PT (Indonesia)†(c) | 4.50% | 5/2/2023 | 14,414 | 15,054,270 | ||||||||
| Total Corporate Bonds (cost $9,149,230,848) | 9,146,159,437 | |||||||||||
| FLOATING RATE LOANS(d) 2.75% | ||||||||||||
| Chemicals 0.34% | ||||||||||||
| Nutrition & Biosciences, Inc. 3 Year Delayed Draw Term Loan | 1.395% (3 Mo. LIBOR + 1.25% | ) | 1/17/2023 | 58,398 | 58,361,755 | |||||||
| Computer Software 0.37% | ||||||||||||
| Vmware, Inc. 3 Year Term Loan | – | (e) | 9/2/2024 | 64,350 | 64,290,230 | |||||||
| Financial Services 0.88% | ||||||||||||
| Delos Finance Sarl 2018 Term Loan B (Luxembourg)(c) | 1.882% (3 Mo. LIBOR + 1.75% | ) | 10/6/2023 | 152,221 | 152,098,294 | |||||||
| Government 0.03% | ||||||||||||
| Seminole Tribe of Florida 2018 Term Loan B | – | (e) | 7/8/2024 | 5,814 | 5,804,034 | |||||||
| Health Care Services 0.29% | ||||||||||||
| Humana Inc. Term Loan | – | (e) | 10/30/2023 | 50,000 | 49,344,000 | (f) | ||||||
| 424 | See Notes to Financial Statements. |
Schedule of Investments (continued)
ULTRA SHORT BOND FUND November 30, 2021
| Investments | Interest Rate | Maturity Date | Principal Amount (000) | Fair Value | ||||||||
| Oil 0.12% | ||||||||||||
| Hess Corporation Term Loan | 2.00% (1 Mo. LIBOR + 2.00%) | 3/16/2023 | $ | 21,682 | $ | 21,628,168 | ||||||
| Technology 0.46% | ||||||||||||
| Comcast Hulu Holdings, LLC Term Loan A | 0.965% (1 Mo. LIBOR + 0.88% | ) | 3/15/2024 | 80,000 | 79,300,000 | |||||||
| Telecommunications 0.26% | ||||||||||||
| AT&T Inc. 2021 Delayed Draw Term Loan | 1.091% (1 Mo. LIBOR + 1.00% | ) | 3/23/2022 | 45,000 | 45,024,075 | (f) | ||||||
| Total Floating Rate Loans (cost $477,181,975) | 475,850,556 | |||||||||||
| FOREIGN GOVERNMENT OBLIGATIONS 0.13% | ||||||||||||
| Bermuda 0.01% | ||||||||||||
| Bermuda Government International Bond | 4.854% | 2/6/2024 | 1,382 | 1,478,609 | ||||||||
| Kuwait 0.04% | ||||||||||||
| Kuwait International Government Bond†(c) | 2.75% | 3/20/2022 | 6,750 | 6,798,478 | ||||||||
| Peru 0.08% | ||||||||||||
| Fondo MIVIVIENDA SA†(c) | 3.50% | 1/31/2023 | 14,213 | 14,504,153 | ||||||||
| Total Foreign Government Obligations (cost $22,894,228) | 22,781,240 | |||||||||||
| NON-AGENCY COMMERCIAL MORTGAGE-BACKED SECURITIES 10.77% | ||||||||||||
| Angel Oak Mortgage Trust 2021-3 A1† | 1.068% | #(g) | 5/25/2066 | 21,357 | 21,193,567 | |||||||
| Angel Oak Mortgage Trust 2021-6 A1† | 1.458% | #(g) | 9/25/2066 | 29,533 | 29,352,149 | |||||||
| Angel Oak Mortgage Trust 2021-7 A1† | 1.978% | #(g) | 10/25/2066 | 20,750 | 20,895,603 | |||||||
| BBCMS Mortgage Trust 2017-DELC A A† | 0.94% (1 Mo. LIBOR + .85% | )# | 8/15/2036 | 10,660 | 10,660,757 | |||||||
| BFLD 2019-DPLO A† | 1.18% (1 Mo. LIBOR + 1.09% | )# | 10/15/2034 | 11,780 | 11,778,088 | |||||||
| BRAVO Residential Funding Trust 2021-NQM2 A1† | 0.97% | #(g) | 3/25/2060 | 46,076 | 45,956,413 | |||||||
| BX Commercial Mortgage Trust 2020-VKNG A† | 1.02% (1 Mo. LIBOR + .93% | )# | 10/15/2037 | 9,384 | 9,412,356 | |||||||
| BX Commercial Mortgage Trust 2021-VINO A† | 0.742% (1 Mo. LIBOR + .65% | )# | 5/15/2038 | 43,630 | 43,551,623 | |||||||
| BX Commercial Mortgage Trust 2021-XL2 A† | 0.779% (1 Mo. LIBOR + .69% | )# | 10/15/2038 | 72,640 | 72,389,864 | |||||||
| See Notes to Financial Statements. | 425 |
Schedule of Investments (continued)
ULTRA SHORT BOND FUND November 30, 2021
| Investments | Interest Rate | Maturity Date | Principal Amount (000) | Fair Value | ||||||||
| NON-AGENCY COMMERCIAL MORTGAGE-BACKED SECURITIES (continued) | ||||||||||||
| BX Trust 2021-ARIA A† | 0.989% (1 Mo. LIBOR + .90% | )# | 10/15/2036 | $ | 73,640 | $ | 73,572,870 | |||||
| BXHPP Trust 2021-FILM A† | 0.74% (1 Mo. LIBOR + .65% | )# | 8/15/2036 | 44,480 | 44,358,725 | |||||||
| BXMT Ltd. 2020-FL2 A† | 1.062% (1 Mo. SOFR + 1.01% | )# | 2/15/2038 | 51,270 | 51,157,206 | |||||||
| BXMT Ltd. 2021-FL4 A† | 1.14% (1 Mo. LIBOR + 1.05% | )# | 5/15/2038 | 49,175 | 49,042,228 | |||||||
| COLT Mortgage Loan Trust 2021-2 A1† | 0.924% | #(g) | 8/25/2066 | 51,751 | 51,354,215 | |||||||
| COLT Mortgage Loan Trust 2021-3 A1† | 0.956% | #(g) | 9/27/2066 | 37,540 | 37,138,877 | |||||||
| Connecticut Avenue Securities Trust 2021-R01 1M1† | 0.80% (1 Mo. SOFR + .75% | )# | 10/25/2041 | 28,055 | 28,082,349 | |||||||
| CSMC 2021-NQM4 A1† | 1.101% | #(g) | 5/25/2066 | 23,916 | 23,753,377 | |||||||
| CSMC 2021-NQM7 A1† | 1.756% | #(g) | 10/25/2066 | 36,145 | 36,020,194 | |||||||
| CSMC Trust 2021-NQM5 A1† | 0.938% | #(g) | 5/25/2066 | 52,852 | 52,225,524 | |||||||
| DBCG BBG Mortgage Trust 2017-BBG A† | 0.79% (1 Mo. LIBOR + .70% | )# | 6/15/2034 | 18,900 | 18,872,873 | |||||||
| Deephaven Residential Mortgage Trust 2021-3 A1† | 1.194% | #(g) | 8/25/2066 | 43,615 | 43,407,110 | |||||||
| EQUS Mortgage Trust 2021-EQAZ A† | 0.845% (1 Mo. LIBOR + .75% | )# | 10/15/2038 | 49,476 | 49,276,226 | |||||||
| Fannie Mae Connecticut Avenue Securities 2021-R02 2M1†(a) | 0.95% (1 Mo. SOFR + .90% | )# | 11/25/2041 | 35,100 | 35,154,826 | |||||||
| Freddie Mac STACR REMIC Trust 2021-DNA3 M1† | 0.80% (1 Mo. SOFR + .75% | )# | 10/25/2033 | 16,993 | 17,001,488 | |||||||
| Freddie Mac STACR REMIC Trust 2021-DNA5 M1† | 0.70% (1 Mo. SOFR + .65% | )# | 1/25/2034 | 6,081 | 6,081,466 | |||||||
| Freddie Mac STACR REMIC Trust 2021-DNA6 M1† | 0.85% (1 Mo. SOFR + .80% | )# | 10/25/2041 | 27,300 | 27,321,316 | |||||||
| Freddie Mac STACR REMIC Trust 2021-HQA1 M1† | 0.75% (1 Mo. SOFR + .70% | )# | 8/25/2033 | 17,796 | 17,805,308 | |||||||
| Freddie Mac STACR REMIC Trust 2021-HQA2 M1† | 0.75% (1 Mo. SOFR + .70% | )# | 12/25/2033 | 10,125 | 10,128,322 | |||||||
| Freddie Mac STACR REMIC Trust 2021-HQA3 M1† | 0.90% (1 Mo. SOFR + .85% | )# | 9/25/2041 | 15,920 | 15,936,453 | |||||||
| Freddie Mac Structured Agency Credit Risk Debt Notes 2021-DNA2 M1† | 0.85% (1 Mo. SOFR + .80% | )# | 8/25/2033 | 22,401 | 22,417,200 | |||||||
| 426 | See Notes to Financial Statements. |
Schedule of Investments (continued)
ULTRA SHORT BOND FUND November 30, 2021
| Investments | Interest Rate | Maturity Date | Principal Amount (000) | Fair Value | ||||||||
| NON-AGENCY COMMERCIAL MORTGAGE-BACKED SECURITIES (continued) | ||||||||||||
| Freddie Mac Structured Agency Credit Risk Debt Notes 2021-DNA7 M1† | 0.898% (1 Mo. SOFR + .85% | )# | 11/25/2041 | $ | 50,170 | $ | 50,219,081 | |||||
| Great Wolf Trust 2019-WOLF A† | 1.124% (1 Mo. LIBOR + 1.03% | )# | 12/15/2036 | 14,400 | 14,388,899 | |||||||
| GS Mortgage Securities Corp. Trust 2018-HULA A† | 1.01% (1 Mo. LIBOR + .92% | )# | 7/15/2025 | 15,138 | 15,139,052 | |||||||
| GS Mortgage Securities Corp. Trust 2021-RENT A† | 0.791% (1 Mo. LIBOR + .70% | )# | 11/21/2035 | 24,750 | 24,657,475 | |||||||
| GS Mortgage Securities Corp. Trust 2021-ROSS A† | 1.24% (1 Mo. LIBOR + 1.15% | )# | 5/15/2026 | 40,000 | 40,108,024 | |||||||
| Hilton Orlando Trust 2018-ORL A† | 1.01% (1 Mo. LIBOR + .92% | )# | 12/15/2034 | 36,955 | 36,924,671 | |||||||
| KIND Trust 2021-KIND A† | 1.04% (1 Mo. LIBOR + .95% | )# | 8/15/2038 | 24,750 | 24,799,295 | |||||||
| Life 2021-BMR Mortgage Trust 2021-BMR A† | 0.79% (1 Mo. LIBOR + .70% | )# | 3/15/2038 | 32,000 | 31,975,002 | |||||||
| MFRA Trust 2021-NQM2 A1† | 1.029% | #(g) | 11/25/2064 | 33,813 | 33,639,015 | |||||||
| Mortgage Repurchase Agreement Financing Trust 2021-1 A1† | 0.591% (1 Mo. LIBOR + .50% | )# | 3/10/2022 | 40,000 | 40,051,388 | |||||||
| Mortgage Repurchase Agreement Financing Trust Series 2021-S1 A1† | 0.591% (1 Mo. LIBOR + .50% | )# | 9/10/2022 | 72,900 | 72,990,797 | |||||||
| Motel Trust 2021-MTL6 A† | 0.99% (1 Mo. LIBOR + .90% | )# | 9/15/2038 | 27,300 | 27,299,934 | |||||||
| OBX Trust 2021-NQM3 A1† | 1.054% | #(g) | 7/25/2061 | 56,795 | 56,304,466 | |||||||
| ONE PARK Mortgage Trust 2021-PARK A† | 0.79% (1 Mo. LIBOR + .70% | )# | 3/15/2036 | 49,520 | 49,366,978 | |||||||
| PFP Ltd. 2021-7 A† | 0.94% (1 Mo. LIBOR + .85% | )# | 4/14/2038 | 104,895 | 104,431,131 | |||||||
| Ready Capital Mortgage Financing LLC 2021-FL5 A† | 1.092% (1 Mo. LIBOR + 1.00% | )# | 4/25/2038 | 46,999 | 47,017,951 | |||||||
| VASA Trust 2021-VASA A† | 0.99% (1 Mo. LIBOR + .90% | )# | 7/15/2039 | 55,250 | 55,311,029 | |||||||
| Verus Securitization Trust 2021-4 A1† | 0.938% | #(g) | 7/25/2066 | 57,932 | 57,357,139 | |||||||
| Verus Securitization Trust 2021-5 A1† | 1.013% | #(g) | 9/25/2066 | 26,343 | 26,003,359 | |||||||
| Verus Securitization Trust 2021-5 A2† | 1.218% | #(g) | 9/25/2066 | 8,388 | 8,280,447 | |||||||
| See Notes to Financial Statements. | 427 |
Schedule of Investments (continued)
ULTRA SHORT BOND FUND November 30, 2021
| Investments | Interest Rate | Maturity Date | Principal Amount (000) | Fair Value | ||||||||
| NON-AGENCY COMMERCIAL MORTGAGE-BACKED SECURITIES (continued) | ||||||||||||
| VNDO Mortgage Trust 2012-6AVE A† | 2.996% | 11/15/2030 | $ | 16,870 | $ | 17,157,306 | ||||||
| WF-RBS Commercial Mortgage Trust 2012-C7 A2 | 3.431% | 6/15/2045 | 52,704 | 53,014,405 | ||||||||
| Total Non-Agency Commercial Mortgage-Backed Securities (cost $1,867,097,973) | 1,861,735,417 | |||||||||||
| U.S. TREASURY OBLIGATIONS 2.49% | ||||||||||||
| U.S. Treasury Bill (cost $431,401,626) | Zero Coupon | 1/27/2022 | 431,431 | 431,401,969 | ||||||||
| Total Long-Term Investments (cost $16,366,815,785) | 16,346,270,257 | |||||||||||
| SHORT-TERM INVESTMENTS 5.92% | ||||||||||||
| COMMERCIAL PAPER 5.37% | ||||||||||||
| Automobiles 0.68% | ||||||||||||
| General Motors Financial Co., Inc. | 0.243% | 12/1/2021 | 117,545 | 117,545,000 | ||||||||
| Chemicals 0.15% | ||||||||||||
| FMC Corp. | 0.284% | 12/1/2021 | 26,342 | 26,342,000 | ||||||||
| Electric 0.33% | ||||||||||||
| Enel Finance America LLC | 0.458% | 2/4/2022 | 28,327 | 28,316,769 | ||||||||
| Hawaiian Electric Co. | 0.254% | 12/7/2021 | 28,176 | 28,174,826 | ||||||||
| Total | 56,491,595 | |||||||||||
| Electronics 0.96% | ||||||||||||
| Flex Ltd. | 0.385% | 12/7/2021 | 165,441 | 165,430,523 | ||||||||
| Health Care-Services 0.32% | ||||||||||||
| Catholic Health Initiatives | 0.456% | 12/8/2021 | 54,727 | 54,722,211 | ||||||||
| Oil: Crude Producers 0.83% | ||||||||||||
| Energy Transfer Partners LP | 0.406% | 12/3/2021 | 97,428 | 97,425,835 | ||||||||
| Energy Transfer Partners LP | 0.406% | 12/6/2021 | 45,291 | 45,288,484 | ||||||||
| Total | 142,714,319 | |||||||||||
| REITS 0.08% | ||||||||||||
| Welltower, Inc. | 0.193% | 12/6/2021 | 13,636 | 13,635,640 | ||||||||
| Retail 0.72% | ||||||||||||
| Autonation, Inc | 0.223% | 12/1/2021 | 103,020 | 103,020,000 | ||||||||
| Autonation, Inc | 0.284% | 12/7/2021 | 22,366 | 22,364,956 | ||||||||
| Total | 125,384,956 | |||||||||||
| 428 | See Notes to Financial Statements. |
Schedule of Investments (continued)
ULTRA SHORT BOND FUND November 30, 2021
| Investments | Interest Rate | Maturity Date | Principal Amount (000) | Fair Value | ||||||||
| Telecommunications 1.30% | ||||||||||||
| AT&T, Inc. | 0.407% | 12/14/2021 | $ | 63,766 | $ | 63,756,790 | ||||||
| AT&T, Inc. | 0.407% | 12/14/2021 | 87,972 | 87,959,293 | ||||||||
| AT&T, Inc. | 0.407% | 12/16/2021 | 73,896 | 73,883,684 | ||||||||
| Total | 225,599,767 | |||||||||||
| Total Commercial Paper (cost $927,853,225) | 927,866,011 | |||||||||||
| REPURCHASE AGREEMENTS 0.55% | ||||||||||||
| Repurchase Agreement dated 11/30/2021, 0.00% due 12/1/2021 with Fixed Income Clearing Corp. collateralized by $23,638,500 of U.S. Treasury Note at 0.25% due 11/15/2023;, $70,574,200 of U.S. Treasury Note at 2.875% due 10/31/2023; value: $97,463,886; proceeds: $95,552,803 (cost $95,552,803) | 95,553 | 95,552,803 | ||||||||||
| Total Short-Term Investments (cost $1,023,406,028) | 1,023,418,814 | |||||||||||
| Total Investments in Securities 100.44% (cost $17,390,221,813) | 17,369,689,071 | |||||||||||
| Other Assets and Liabilities – Net(h) (0.44)% | (76,435,043 | ) | ||||||||||
| Net Assets 100.00% | $ | 17,293,254,028 | ||||||||||
| CMT | Constant Maturity Rate. | |
| LIBOR | London Interbank Offered Rate. | |
| SOFR | Secured Over Night Financing Rate. | |
| † | Security was purchased pursuant to Rule 144A under the Securities Act of 1933 and, unless registered under such Act or exempted from registration, may only be resold to qualified institutional buyers. At November 30, 2021, the total value of Rule 144A securities was $8,340,496,472, which represents 48.23% of net assets. | |
| # | Variable rate security. The interest rate represents the rate in effect at November 30, 2021. | |
| (a) | Securities purchased on a when-issued basis (See Note 2(j)). | |
| (b) | Variable Rate is Fixed to Float: Rate remains fixed or at Zero Coupon until designated future date. | |
| (c) | Foreign security traded in U.S. dollars. | |
| (d) | Floating Rate Loans in which the Fund invests generally pay interest at rates which are periodically re-determined at a margin above the London Interbank Offered Rate (“LIBOR”) or the prime rate offered by major U.S. banks. The rate(s) shown is the rate(s) in effect at November 30, 2021. | |
| (e) | Interest rate to be determined. | |
| (f) | Level 3 Investment as described in Note 2(t) in the Notes to Financials. Floating Rate Loans categorized as Level 3 are valued based on a single quotation obtained from a dealer. Accounting principles generally accepted in the United States of America do not require the Fund to create quantitative unobservable inputs that were not developed by the Fund. Therefore, the Fund does not have access to unobservable inputs and cannot disclose such inputs in the valuation. | |
| (g) | Interest rate is based on the weighted average interest rates of the underlying mortgages within the mortgage pool. | |
| (h) | Other Assets and Liabilities – Net include net unrealized depreciation on futures contracts as follows: |
| See Notes to Financial Statements. | 429 |
Schedule of Investments (concluded)
ULTRA SHORT BOND FUND November 30, 2021
Open Futures Contracts at November 30, 2021:
| Type | Expiration | Contracts | Position | Notional Amount | Notional Value | Unrealized Depreciation | ||||||||||||||
| U.S. 2-Year Treasury Note | March 2022 | 8,053 | Short | $ | (1,758,243,831 | ) | $ | (1,761,467,930 | ) | $ | (3,224,099 | ) | ||||||||
The following is a summary of the inputs used as of November 30, 2021 in valuing the Fund’s investments carried at fair value(1):
| Investment Type(2) | Level 1 | Level 2 | Level 3 | Total | ||||||||||||
| Long-Term Investments | ||||||||||||||||
| Asset-Backed Securities | $ | – | $ | 4,408,341,638 | $ | – | $ | 4,408,341,638 | ||||||||
| Corporate Bonds | – | 9,146,159,437 | – | 9,146,159,437 | ||||||||||||
| Floating Rate Loans | ||||||||||||||||
| Health Care Services | – | – | 49,344,000 | 49,344,000 | ||||||||||||
| Telecommunications | – | – | 45,024,075 | 45,024,075 | ||||||||||||
| Remaining Industries | – | 381,482,481 | – | 381,482,481 | ||||||||||||
| Foreign Government Obligations | – | 22,781,240 | – | 22,781,240 | ||||||||||||
| Non-Agency Commercial Mortgage-Backed Securities | – | 1,861,735,417 | – | 1,861,735,417 | ||||||||||||
| U.S. Treasury Obligations | – | 431,401,969 | – | 431,401,969 | ||||||||||||
| Short-Term Investments | ||||||||||||||||
| Commercial Paper | – | 927,866,011 | – | 927,866,011 | ||||||||||||
| Repurchase Agreements | – | 95,552,803 | – | 95,552,803 | ||||||||||||
| Total | $ | – | $ | 17,275,320,996 | $ | 94,368,075 | $ | 17,369,689,071 | ||||||||
| Other Financial Instruments | ||||||||||||||||
| Futures Contracts | ||||||||||||||||
| Assets | $ | – | $ | – | $ | – | $ | – | ||||||||
| Liabilities | (3,224,099 | ) | – | – | (3,224,099 | ) | ||||||||||
| Total | $ | (3,224,099 | ) | $ | – | $ | – | $ | (3,224,099 | ) | ||||||
| (1) | Refer to Note 2(t) for a description of fair value measurements and the three-tier hierarchy of inputs. | |
| (2) | See Schedule of Investments for fair values in each industry and identification of foreign issuers and/or geography. The table above is presented by Investment Type. Industries are presented within an Investment Type should such Investment Type include securities classified as two or more levels within the three-tier fair value hierarchy. When applicable each Level 3 security is identified on the Schedule of Investments along with the valuation technique utilized. |
A reconciliation of Level 3 investments is presented when the Fund has a material amount of Level 3 investments at the beginning or end of the year in relation to the Fund’s net assets. Management has determined not to provide a reconciliation as the balance of Level 3 investments was not considered to be material to the Fund’s net assets at the beginning or end of the year.
| 430 | See Notes to Financial Statements. |
This page is intentionally left blank.
| 431 |
Statements of Assets and Liabilities
November 30, 2021
| Convertible Fund | Core Fixed Income Fund | Core Plus Bond Fund | ||||||||||
| ASSETS: | ||||||||||||
| Investments in securities, at cost | $ | 1,521,779,713 | $ | 2,230,810,523 | $ | 417,501,940 | ||||||
| Investments in securities, at fair value including $8,699,544, $0, $0, $0, $0, $7,208,542, $0 and $0, respectively, of securities loaned | $ | 1,615,248,901 | $ | 2,242,831,524 | $ | 418,610,986 | ||||||
| Cash | – | – | – | |||||||||
| Cash at broker | – | – | – | |||||||||
| Deposits with brokers for futures collateral | – | 4,296,645 | 377,000 | |||||||||
| Deposit with brokers for forwards and swaps collateral | – | 2,233,660 | 3 | |||||||||
| Receivables: | ||||||||||||
| Investment securities sold | 16,282,262 | 20,885,442 | 4,530,248 | |||||||||
| Interest and dividends | 4,571,814 | 6,325,427 | 2,570,816 | |||||||||
| Capital shares sold | 3,159,354 | 4,782,459 | 2,244,869 | |||||||||
| Securities lending income receivable | 54,643 | – | – | |||||||||
| From broker | – | – | – | |||||||||
| From advisor (See Note 3) | – | 17,611 | – | |||||||||
| Variation margin for futures contracts | – | 2,201,460 | 199,411 | |||||||||
| Variation margin for centrally cleared swap agreements | – | – | – | |||||||||
| Unrealized appreciation on forward foreign currency exchange contracts | 2,369,831 | – | 34,832 | |||||||||
| Unrealized appreciation on CPI swaps | – | – | – | |||||||||
| Prepaid expenses and other assets | 90,314 | 70,913 | 78,990 | |||||||||
| Total assets | 1,641,777,119 | 2,283,645,141 | 428,647,155 | |||||||||
| LIABILITIES: | ||||||||||||
| Payables: | ||||||||||||
| Investment securities purchased | 17,618,753 | 228,024,741 | 19,715,795 | |||||||||
| Payable for collateral due to broker for securities lending | 9,297,335 | – | – | |||||||||
| Payable due to broker for swap collateral | – | – | – | |||||||||
| Capital shares reacquired | 5,048,573 | 2,140,510 | 882,389 | |||||||||
| Management fee | 909,968 | 377,751 | 93,219 | |||||||||
| 12b-1 distribution plan | 170,106 | 179,373 | 40,873 | |||||||||
| Trustees’ fees | 133,086 | 208,272 | 15,994 | |||||||||
| Fund administration | 55,185 | 67,331 | 13,317 | |||||||||
| Variation margin for futures contracts | – | – | – | |||||||||
| To bank | – | 347,287 | 254,680 | |||||||||
| Variation margin for centrally cleared swap agreements | – | – | – | |||||||||
| Credit default swap agreements payable, at fair value (including upfront payments of $0, $1,883,165, $368,676, $0, $0, $32,503,522, $2,721,797 and $0, respectively) | – | 1,709,565 | 451,437 | |||||||||
| Interfund lending payable | – | – | – | |||||||||
| Interfund lending interest payable | – | – | – | |||||||||
| Unrealized depreciation on forward foreign currency exchange contracts | 17,961 | – | 6,561 | |||||||||
| Unrealized depreciation on CPI swaps | – | – | – | |||||||||
| Foreign currency overdraft (cost $26, $0, $135,732, $0, $3,567,880, $0, $3,382,872, $0, respectively) | 26 | – | 132,638 | |||||||||
| Unrealized depreciation on unfunded commitments | – | – | 803 | |||||||||
| Total return swaps, at fair value | – | – | – | |||||||||
| Distributions payable | – | 2,448,344 | 808,753 | |||||||||
| Accrued expenses and other liabilities | 317,269 | 392,673 | 118,723 | |||||||||
| Total liabilities | 33,568,262 | 235,895,847 | 22,535,182 | |||||||||
| Commitments and contingent liabilities | ||||||||||||
| NET ASSETS | $ | 1,608,208,857 | $ | 2,047,749,294 | $ | 406,111,973 | ||||||
| 432 | See Notes to Financial Statements. |
| Corporate Bond Fund | Floating Rate Fund | High Yield Fund | Income Fund | Inflation Focused Fund | ||||||||||||||
| $ | 11,428,532 | $ | 7,269,468,248 | $ | 7,084,450,125 | $ | 3,150,361,088 | $ | 3,726,756,039 | |||||||||
| $ | 11,586,469 | $ | 7,286,718,730 | $ | 7,225,095,291 | $ | 3,209,339,037 | $ | 3,712,573,397 | |||||||||
| – | – | – | 11,222,276 | 11,059,021 | ||||||||||||||
| – | – | 8,440,000 | – | 7,930,000 | ||||||||||||||
| 28,919 | 2,796,275 | 7,406,876 | 4,252,175 | 1,532,375 | ||||||||||||||
| – | 14,612,354 | 37,060,160 | 2,150,694 | 128,076,970 | ||||||||||||||
| 135,643 | 338,784,470 | 261,824,786 | 12,446,102 | 19,781,903 | ||||||||||||||
| 104,253 | 41,575,138 | 98,202,038 | 24,374,538 | 19,566,136 | ||||||||||||||
| 15,108 | 46,665,560 | 42,251,155 | 15,376,895 | 42,290,665 | ||||||||||||||
| – | – | 57,513 | – | – | ||||||||||||||
| – | 43,620 | – | – | – | ||||||||||||||
| 17,003 | – | – | – | – | ||||||||||||||
| – | – | – | 1,277,866 | – | ||||||||||||||
| – | 241,170 | 1,871,125 | – | – | ||||||||||||||
| – | 5,746,691 | 14,841,497 | 1,964,049 | – | ||||||||||||||
| – | – | – | – | 37,073,339 | ||||||||||||||
| 33,957 | 244,196 | 123,309 | 77,363 | 273,149 | ||||||||||||||
| 11,921,352 | 7,737,428,204 | 7,697,173,750 | 3,282,480,995 | 3,980,156,955 | ||||||||||||||
| 156,496 | 704,928,433 | 232,420,523 | 82,036,856 | 156,172,847 | ||||||||||||||
| – | – | 7,416,688 | – | – | ||||||||||||||
| – | – | 8,440,000 | – | 7,930,000 | ||||||||||||||
| 5,969 | 56,557,622 | 20,946,752 | 7,046,247 | 16,376,110 | ||||||||||||||
| 3,821 | 2,588,864 | 3,204,363 | 981,980 | 849,654 | ||||||||||||||
| 1,297 | 1,623,872 | 725,585 | 425,646 | 388,585 | ||||||||||||||
| 806 | 1,101,316 | 836,654 | 499,557 | 140,224 | ||||||||||||||
| 382 | 226,468 | 246,486 | 103,772 | 116,682 | ||||||||||||||
| 4 | 700,471 | 615,485 | – | 409,738 | ||||||||||||||
| 41,072 | 31,762,956 | 4,438,376 | – | – | ||||||||||||||
| – | – | 1,473,911 | – | 7,959,866 | ||||||||||||||
| – | – | 24,316,698 | 2,478,617 | – | ||||||||||||||
| – | – | 86,282,213 | – | – | ||||||||||||||
| – | – | 1,288 | – | – | ||||||||||||||
| – | 609,765 | 2,591,267 | 21,460 | – | ||||||||||||||
| – | – | – | – | 49,497,495 | ||||||||||||||
| – | 3,559,448 | – | 3,413,969 | – | ||||||||||||||
| – | 96,303 | 18,243 | – | – | ||||||||||||||
| – | 4,939,416 | – | – | – | ||||||||||||||
| 28,380 | 21,125,014 | 33,141,210 | 7,648,328 | 5,930,331 | ||||||||||||||
| 52,688 | 1,489,404 | 1,731,781 | 502,880 | 366,486 | ||||||||||||||
| 290,915 | 831,309,352 | 428,847,523 | 105,159,312 | 246,138,018 | ||||||||||||||
| $ | 11,630,437 | $ | 6,906,118,852 | $ | 7,268,326,227 | $ | 3,177,321,683 | $ | 3,734,018,937 | |||||||||
| See Notes to Financial Statements. | 433 |
Statements of Assets and Liabilities (continued)
November 30, 2021
| Convertible Fund | Core Fixed Income Fund | Core Plus Bond Fund | ||||||||||
| COMPOSITION OF NET ASSETS: | ||||||||||||
| Paid-in capital | $ | 1,283,056,387 | $ | 2,041,732,260 | $ | 408,205,336 | ||||||
| Total distributable earnings (loss) | 325,152,470 | 6,017,034 | (2,093,363 | ) | ||||||||
| Net Assets | $ | 1,608,208,857 | $ | 2,047,749,294 | $ | 406,111,973 | ||||||
| Net Assets by class: | ||||||||||||
| Class A Shares | $ | 365,551,188 | $ | 646,894,008 | $ | 76,162,236 | ||||||
| Class C Shares | $ | 79,104,096 | $ | 29,522,567 | $ | 5,549,778 | ||||||
| Class F Shares | $ | 804,858,541 | $ | 342,050,053 | $ | 274,812,082 | ||||||
| Class F3 Shares | $ | 37,889,463 | $ | 442,420,822 | $ | 34,554,393 | ||||||
| Class I Shares | $ | 259,179,990 | $ | 534,312,818 | $ | 13,423,363 | ||||||
| Class P Shares | $ | 43,494 | – | – | ||||||||
| Class R2 Shares | $ | 93,719 | $ | 849,985 | – | |||||||
| Class R3 Shares | $ | 36,482,607 | $ | 9,263,995 | $ | 159,110 | ||||||
| Class R4 Shares | $ | 918,539 | $ | 10,587,344 | $ | 378,871 | ||||||
| Class R5 Shares | $ | 1,905,306 | $ | 1,442,975 | $ | 11,320 | ||||||
| Class R6 Shares | $ | 22,181,914 | $ | 30,404,727 | $ | 1,060,820 | ||||||
| Outstanding shares by class (unlimited number of authorized shares of beneficial interest): | ||||||||||||
| Class A Shares | 19,001,175 | 58,093,666 | 4,953,564 | |||||||||
| Class C Shares | 4,154,273 | 2,663,387 | 360,862 | |||||||||
| Class F Shares | 41,815,815 | 30,723,140 | 17,888,697 | |||||||||
| Class F3 Shares | 1,949,135 | 39,733,172 | 2,247,677 | |||||||||
| Class I Shares | 13,364,082 | 48,010,478 | 873,292 | |||||||||
| Class P Shares | 2,213 | – | – | |||||||||
| Class R2 Shares | 4,775 | 76,308 | – | |||||||||
| Class R3 Shares | 1,908,198 | 831,756 | 10,352 | |||||||||
| Class R4 Shares | 47,750 | 951,003 | 24,649 | |||||||||
| Class R5 Shares | 98,280 | 129,568 | 736 | |||||||||
| Class R6 Shares | 1,140,817 | 2,731,664 | 68,996 | |||||||||
| Net Asset Value, offering and redemption price per share (Net assets divided by outstanding shares): | ||||||||||||
| Class A Shares-Net asset value | $19.24 | $11.14 | $15.38 | |||||||||
| Class A Shares-Maximum offering price (Net asset value plus sales charge of 2.25%) | $19.68 | $11.40 | $15.73 | |||||||||
| Class C Shares-Net asset value | $19.04 | $11.08 | $15.38 | |||||||||
| Class F Shares-Net asset value | $19.25 | $11.13 | $15.36 | |||||||||
| Class F3 Shares-Net asset value | $19.44 | $11.13 | $15.37 | |||||||||
| Class I Shares-Net asset value | $19.39 | $11.13 | $15.37 | |||||||||
| Class P Shares-Net asset value | $19.65 | – | – | |||||||||
| Class R2 Shares-Net asset value* | $19.63 | $11.14 | – | |||||||||
| Class R3 Shares-Net asset value* | $19.12 | $11.14 | $15.37 | |||||||||
| Class R4 Shares-Net asset value | $19.24 | $11.13 | $15.37 | |||||||||
| Class R5 Shares-Net asset value | $19.39 | $11.14 | $15.38 | |||||||||
| Class R6 Shares-Net asset value* | $19.44 | $11.13 | $15.38 | |||||||||
| * | Net asset value may not recalculate due to rounding of fractional shares. |
| 434 | See Notes to Financial Statements. |
| Corporate Bond Fund | Floating Rate Fund | High Yield Fund | Income Fund | Inflation Focused Fund | ||||||||||||||
| $ | 11,406,006 | $ | 8,432,092,100 | $ | 7,136,702,542 | $ | 3,095,916,410 | $ | 3,938,549,123 | |||||||||
| 224,431 | (1,525,973,248 | ) | 131,623,685 | 81,405,273 | (204,530,186 | ) | ||||||||||||
| $ | 11,630,437 | $ | 6,906,118,852 | $ | 7,268,326,227 | $ | 3,177,321,683 | $ | 3,734,018,937 | |||||||||
| $ | 2,546,582 | $ | 1,981,600,053 | $ | 1,089,068,631 | $ | 1,275,011,692 | $ | 560,624,277 | |||||||||
| $ | 547,218 | $ | 499,849,757 | $ | 258,440,769 | $ | 81,240,278 | $ | 92,580,319 | |||||||||
| $ | 4,660,273 | $ | 2,999,065,418 | $ | 2,239,174,304 | $ | 570,552,501 | $ | 1,818,237,822 | |||||||||
| $ | 1,770,375 | $ | 137,807,997 | $ | 737,767,790 | $ | 985,588,659 | $ | 236,950,770 | |||||||||
| $ | 145,769 | $ | 1,133,927,182 | $ | 1,759,013,401 | $ | 135,924,897 | $ | 1,006,157,199 | |||||||||
| – | – | $ | 43,769 | – | – | |||||||||||||
| $ | 28,958 | $ | 964,779 | $ | 6,381,354 | $ | 1,349,750 | $ | 299 | |||||||||
| $ | 68,937 | $ | 51,914,799 | $ | 113,622,571 | $ | 56,410,246 | $ | 401,721 | |||||||||
| $ | 29,211 | $ | 2,679,897 | $ | 96,476,693 | $ | 4,501,432 | $ | 2,020,382 | |||||||||
| $ | 29,436 | $ | 2,974,863 | $ | 267,722,192 | $ | 6,308,643 | $ | 304,093 | |||||||||
| $ | 1,803,678 | $ | 95,334,107 | $ | 700,614,753 | $ | 60,433,585 | $ | 16,742,055 | |||||||||
| 245,191 | 236,800,611 | 146,632,931 | 426,872,018 | 45,051,888 | ||||||||||||||
| 52,699 | 59,684,440 | 34,982,537 | 27,087,252 | 7,431,105 | ||||||||||||||
| 447,938 | 358,745,278 | 301,844,856 | 191,003,178 | 145,868,263 | ||||||||||||||
| 170,450 | 16,442,279 | 98,868,391 | 330,007,999 | 19,024,964 | ||||||||||||||
| 14,041 | 135,412,558 | 235,798,756 | 45,474,676 | 80,875,860 | ||||||||||||||
| – | – | 5,810 | – | – | ||||||||||||||
| 2,788 | 115,179 | 854,258 | 448,749 | 24 | ||||||||||||||
| 6,638 | 6,200,728 | 15,212,594 | 18,826,136 | 32,305 | ||||||||||||||
| 2,812 | 320,289 | 12,992,383 | 1,506,597 | 162,458 | ||||||||||||||
| 2,834 | 355,022 | 35,907,122 | 2,110,671 | 24,474 | ||||||||||||||
| 173,657 | 11,380,272 | 93,884,134 | 20,238,152 | 1,346,479 | ||||||||||||||
| $10.39 | $8.37 | $7.43 | $2.99 | $12.44 | ||||||||||||||
| $10.63 | $8.56 | $7.60 | $3.06 | $12.73 | ||||||||||||||
| $10.38 | $8.37 | $7.39 | $3.00 | $12.46 | ||||||||||||||
| $10.40 | $8.36 | $7.42 | $2.99 | $12.46 | ||||||||||||||
| $10.39 | $8.38 | $7.46 | $2.99 | $12.45 | ||||||||||||||
| $10.38 | $8.37 | $7.46 | $2.99 | $12.44 | ||||||||||||||
| – | – | $7.53 | – | – | ||||||||||||||
| $10.39 | $8.38 | $7.47 | $3.01 | $12.38 | ||||||||||||||
| $10.38 | $8.37 | $7.47 | $3.00 | $12.44 | ||||||||||||||
| $10.39 | $8.37 | $7.43 | $2.99 | $12.44 | ||||||||||||||
| $10.39 | $8.38 | $7.46 | $2.99 | $12.43 | ||||||||||||||
| $10.39 | $8.38 | $7.46 | $2.99 | $12.43 | ||||||||||||||
| See Notes to Financial Statements. | 435 |
Statements of Assets and Liabilities (continued)
November 30, 2021
| Short Duration Core Bond Fund | Short Duration Income Fund | |||||||
| ASSETS: | �� | |||||||
| Investments in securities, at cost | $ | 198,647,373 | $ | 63,727,747,455 | ||||
| Investments in securities, at fair value | $ | 198,290,175 | $ | 63,682,123,228 | ||||
| Cash | 159,250 | 101,580,921 | ||||||
| Deposits with brokers for futures collateral | 12,164 | 34,386,259 | ||||||
| Deposit with brokers for forwards and swaps collateral | – | 13,590,708 | ||||||
| Foreign cash, at value (cost $0, $57,751, $82,261 and $0, respectively) | – | 57,416 | ||||||
| Receivables: | ||||||||
| Investment securities sold | 889,073 | 421,536,354 | ||||||
| Interest and dividends | 740,558 | 308,322,814 | ||||||
| Capital shares sold | 715,742 | 273,869,443 | ||||||
| From advisor (See Note 3) | 32,166 | – | ||||||
| Variation margin for futures contracts | – | – | ||||||
| Variation margin for centrally cleared swap agreements | – | – | ||||||
| Unrealized appreciation on forward foreign currency exchange contracts | – | 912,278 | ||||||
| Credit default swap agreements receivable, at fair value (including upfront payments of $2,414, $84,436, $25,105 and $0, respectively) | 7,044 | 1,072,959 | ||||||
| Prepaid expenses and other assets | 39,776 | 1,020,424 | ||||||
| Total assets | 200,885,948 | 64,838,472,804 | ||||||
| LIABILITIES: | ||||||||
| Payables: | ||||||||
| Investment securities purchased | 16,173,023 | 1,640,807,328 | ||||||
| Capital shares reacquired | 659,428 | 153,625,066 | ||||||
| Management fee | 45,391 | 13,035,180 | ||||||
| 12b-1 distribution plan | 19,876 | 10,413,502 | ||||||
| Trustees’ fees | 6,634 | 6,039,785 | ||||||
| Fund administration | 6,052 | 2,065,903 | ||||||
| Variation margin for futures contracts | 47 | 11,084,848 | ||||||
| To bank | – | – | ||||||
| Credit default swap agreements payable, at fair value (including upfront payments of $0, $6,909,602, $3,553,970 and $0, respectively) | – | 15,056,521 | ||||||
| Unrealized depreciation on forward foreign currency exchange contracts | – | 4,103,165 | ||||||
| Unrealized depreciation on unfunded commitments | – | – | ||||||
| Distributions payable | 300,150 | 119,690,237 | ||||||
| Accrued expenses | 73,312 | 7,406,315 | ||||||
| Total liabilities | 17,283,913 | 1,983,327,850 | ||||||
| Commitments and contingent liabilities | ||||||||
| NET ASSETS | $ | 183,602,035 | $ | 62,855,144,954 | ||||
| COMPOSITION OF NET ASSETS: | ||||||||
| Paid-in capital | $ | 185,779,120 | $ | 67,008,696,591 | ||||
| Total distributable earnings (loss) | (2,177,085 | ) | (4,153,551,637 | ) | ||||
| Net Assets | $ | 183,602,035 | $ | 62,855,144,954 | ||||
| 436 | See Notes to Financial Statements. |
| Total Return Fund | Ultra Short Bond Fund | ||||||
| $ | 4,292,861,829 | $ | 17,390,221,813 | ||||
| $ | 4,317,933,313 | $ | 17,369,689,071 | ||||
| – | 25,330,331 | ||||||
| 11,865,303 | 4,630,475 | ||||||
| 6,850,983 | – | ||||||
| 81,785 | – | ||||||
| 56,683,835 | 131,145,229 | ||||||
| 21,197,538 | 57,853,536 | ||||||
| 12,767,817 | 77,812,126 | ||||||
| 14,223 | – | ||||||
| 5,529,604 | 25,144 | ||||||
| 172,081 | – | ||||||
| 1,015,307 | – | ||||||
| 31,296 | – | ||||||
| 69,581 | 636,145 | ||||||
| 4,434,212,666 | 17,667,122,057 | ||||||
| 263,187,834 | 295,298,681 | ||||||
| 4,668,570 | 64,050,116 | ||||||
| 950,877 | 2,459,680 | ||||||
| 367,905 | 1,636,070 | ||||||
| 467,305 | 1,391,419 | ||||||
| 136,173 | 578,748 | ||||||
| – | – | ||||||
| 1,262,547 | – | ||||||
| 4,099,898 | – | ||||||
| 98,976 | – | ||||||
| 8,225 | – | ||||||
| 7,272,032 | 6,577,413 | ||||||
| 833,300 | 1,875,902 | ||||||
| 283,353,642 | 373,868,029 | ||||||
| $ | 4,150,859,024 | $ | 17,293,254,028 | ||||
| $ | 4,136,164,249 | $ | 17,364,863,847 | ||||
| 14,694,775 | (71,609,819 | ) | |||||
| $ | 4,150,859,024 | $ | 17,293,254,028 | ||||
| See Notes to Financial Statements. | 437 |
Statements of Assets and Liabilities (concluded)
November 30, 2021
| Short Duration Core Bond Fund | Short Duration Income Fund | |||||||
| Net Assets by class: | ||||||||
| Class A Shares | $ | 47,227,130 | $ | 13,355,735,810 | ||||
| Class A1 Shares | – | – | ||||||
| Class C Shares | $ | 4,025,750 | $ | 3,379,489,563 | ||||
| Class F Shares | $ | 104,324,356 | $ | 26,865,299,341 | ||||
| Class F3 Shares | $ | 513,911 | $ | 5,139,001,006 | ||||
| Class I Shares | $ | 26,462,702 | $ | 12,428,298,422 | ||||
| Class P Shares | – | – | ||||||
| Class R2 Shares | – | $ | 9,900,640 | |||||
| Class R3 Shares | $ | 60,741 | $ | 410,131,094 | ||||
| Class R4 Shares | $ | 12,108 | $ | 168,337,528 | ||||
| Class R5 Shares | $ | 12,108 | $ | 63,716,636 | ||||
| Class R6 Shares | $ | 963,229 | $ | 1,035,234,914 | ||||
| Outstanding shares by class (unlimited number of authorized shares of beneficial interest): | ||||||||
| Class A Shares | 4,834,047 | 3,209,807,466 | ||||||
| Class A1 Shares | – | – | ||||||
| Class C Shares | 412,271 | 807,253,730 | ||||||
| Class F Shares | 10,685,024 | 6,460,827,315 | ||||||
| Class F3 Shares | 52,648 | 1,233,580,987 | ||||||
| Class I Shares | 2,709,421 | 2,989,542,346 | ||||||
| Class P Shares | – | – | ||||||
| Class R2 Shares | – | 2,378,327 | ||||||
| Class R3 Shares | 6,220 | 98,470,567 | ||||||
| Class R4 Shares | 1,240 | 40,407,686 | ||||||
| Class R5 Shares | 1,240 | 15,351,918 | ||||||
| Class R6 Shares | 98,653 | 248,940,227 | ||||||
| Net Asset Value, offering and redemption price per share (Net assets divided by outstanding shares): | ||||||||
| Class A Shares-Net asset value | $9.77 | $4.16 | ||||||
| Class A Shares-Maximum offering price (Net asset value plus sales charge of 2.25%)** | $9.99 | $4.26 | ||||||
| Class A1 Shares-Net asset value | – | – | ||||||
| Class A1 Shares-Maximum offering price (Net asset value plus sales charge of 1.50%) | – | – | ||||||
| Class C Shares-Net asset value | $9.76 | $4.19 | ||||||
| Class F Shares-Net asset value | $9.76 | $4.16 | ||||||
| Class F3 Shares-Net asset value | $9.76 | $4.17 | ||||||
| Class I Shares-Net asset value | $9.77 | $4.16 | ||||||
| Class P Shares-Net asset value | – | – | ||||||
| Class R2 Shares-Net asset value | – | $4.16 | ||||||
| Class R3 Shares-Net asset value* | $9.76 | $4.17 | ||||||
| Class R4 Shares-Net asset value* | $9.77 | $4.17 | ||||||
| Class R5 Shares-Net asset value* | $9.77 | $4.15 | ||||||
| Class R6 Shares-Net asset value | $9.76 | $4.16 | ||||||
| ** | Sales charge not applicable to Ultra Short Bond Fund. |
| * | Net asset value may not recalculate due to rounding of fractional shares. |
| 438 | See Notes to Financial Statements. |
| Total Return Fund | Ultra Short Bond Fund | ||||||
| $ | 1,300,030,552 | $ | 10,038,159,113 | ||||
| – | $ | 13,239,843 | |||||
| $ | 59,759,013 | – | |||||
| $ | 1,059,760,011 | $ | 5,349,685,601 | ||||
| $ | 881,986,017 | $ | 519,234,690 | ||||
| $ | 433,257,729 | $ | 1,285,378,390 | ||||
| $ | 710,338 | – | |||||
| $ | 1,768,204 | – | |||||
| $ | 37,845,539 | – | |||||
| $ | 44,057,617 | – | |||||
| $ | 78,821,888 | $ | 592,242 | ||||
| $ | 252,862,116 | $ | 86,964,149 | ||||
| 123,354,210 | 1,003,905,637 | ||||||
| – | 1,323,580 | ||||||
| 5,674,768 | – | ||||||
| 100,561,099 | 534,902,770 | ||||||
| 83,649,812 | 51,925,908 | ||||||
| 41,030,345 | 128,572,846 | ||||||
| 67,082 | – | ||||||
| 167,828 | – | ||||||
| 3,591,783 | – | ||||||
| 4,180,482 | – | ||||||
| 7,476,320 | 59,224 | ||||||
| 23,970,921 | 8,694,740 | ||||||
| $10.54 | $10.00 | ||||||
| $10.78 | $10.23 | ||||||
| – | $10.00 | ||||||
| – | $10.15 | ||||||
| $10.53 | – | ||||||
| $10.54 | $10.00 | ||||||
| $10.54 | $10.00 | ||||||
| $10.56 | $10.00 | ||||||
| $10.59 | – | ||||||
| $10.54 | – | ||||||
| $10.54 | – | ||||||
| $10.54 | – | ||||||
| $10.54 | $10.00 | ||||||
| $10.55 | $10.00 | ||||||
| See Notes to Financial Statements. | 439 |
For the Year Ended November 30, 2021
| Convertible Fund | Core Fixed Income Fund | Core Plus Bond Fund | ||||||||||
| Investment income: | ||||||||||||
| Dividends (net of foreign withholding taxes of $29,407, $0, $0, $0, $0, $2,657, $0 and $0, respectively) | $ | 7,310,968 | $ | – | $ | – | ||||||
| Securities lending net income | 65,628 | – | – | |||||||||
| Interest and other (net of foreign withholding taxes of $0, $1,038, $0, $0, $0, $102,336, $1,436 and $0, respectively) | 17,810,525 | 32,331,569 | 8,586,861 | |||||||||
| Interest earned from Interfund Lending (See Note 12) | – | 247 | – | |||||||||
| Total investment income | 25,187,121 | 32,331,816 | 8,586,861 | |||||||||
| Expenses: | ||||||||||||
| Management fee | 11,024,766 | 4,586,688 | 864,633 | |||||||||
| 12b-1 distribution plan-Class A | 728,963 | 1,324,948 | 136,541 | |||||||||
| 12b-1 distribution plan-Class C | 697,925 | 328,328 | 48,105 | |||||||||
| 12b-1 distribution plan-Class F | 849,457 | 356,329 | 191,290 | |||||||||
| 12b-1 distribution plan-Class P | 310 | – | – | |||||||||
| 12b-1 distribution plan-Class R2 | 526 | 4,136 | – | |||||||||
| 12b-1 distribution plan-Class R3 | 170,338 | 53,279 | 741 | |||||||||
| 12b-1 distribution plan-Class R4 | 1,357 | 26,589 | 794 | |||||||||
| Shareholder servicing | 1,409,021 | 1,370,441 | 277,510 | |||||||||
| Fund administration | 668,318 | 817,346 | 123,519 | |||||||||
| Registration | 318,181 | 247,391 | 188,475 | |||||||||
| Reports to shareholders | 90,301 | 34,318 | 6,616 | |||||||||
| Professional | 67,992 | 79,824 | 58,440 | |||||||||
| Trustees’ fees | 63,355 | 80,592 | 11,485 | |||||||||
| Custody | 30,651 | 58,791 | 31,589 | |||||||||
| Interest paid from Interfund Lending (See Note 12) | 1,406 | – | – | |||||||||
| Other | 113,150 | 107,247 | 43,034 | |||||||||
| Gross expenses | 16,236,017 | 9,476,247 | 1,982,772 | |||||||||
| Expense reductions (See Note 10) | (1,408 | ) | (1,243 | ) | (258 | ) | ||||||
| Fees waived and expenses reimbursed (See Note 3) | (30,651 | ) | (58,791 | ) | (141,868 | ) | ||||||
| Shareholder servicing reimbursed-Class I (See Note 3) | – | (203,107 | ) | – | ||||||||
| Net expenses | 16,203,958 | 9,213,106 | 1,840,646 | |||||||||
| Net investment income | 8,983,163 | 23,118,710 | 6,746,215 | |||||||||
| 440 | See Notes to Financial Statements. |
| Corporate Bond Fund | Floating Rate Fund | High Yield Fund | Income Fund | Inflation Focused Fund | ||||||||||||||
| $ | – | $ | 3,319,916 | $ | 4,433,817 | $ | 313,627 | $ | 148,810 | |||||||||
| – | – | 452,123 | – | – | ||||||||||||||
| 318,054 | 286,222,641 | 431,069,723 | 97,732,552 | 31,989,797 | ||||||||||||||
| – | – | – | – | – | ||||||||||||||
| 318,054 | 289,542,557 | 435,955,663 | 98,046,179 | 32,138,607 | ||||||||||||||
| 46,185 | 28,489,454 | 41,436,957 | 11,447,978 | 5,590,754 | ||||||||||||||
| 5,434 | 3,727,092 | 2,341,938 | 2,513,322 | 584,740 | ||||||||||||||
| 6,302 | 4,540,993 | 2,291,901 | 775,136 | 381,903 | ||||||||||||||
| 4,215 | 2,552,028 | 2,217,119 | 569,906 | 855,928 | ||||||||||||||
| – | – | 210 | – | – | ||||||||||||||
| 174 | 5,865 | 37,293 | 8,473 | 217 | ||||||||||||||
| 314 | 234,998 | 568,984 | 274,758 | 1,601 | ||||||||||||||
| 73 | 6,827 | 260,951 | 15,233 | 4,786 | ||||||||||||||
| 3,821 | 4,316,790 | 6,133,039 | 1,959,161 | 1,208,144 | ||||||||||||||
| 4,618 | 2,487,951 | 3,194,957 | 1,206,557 | 755,157 | ||||||||||||||
| 155,208 | 375,879 | 318,149 | 242,443 | 511,339 | ||||||||||||||
| 1,870 | 2 | 134,359 | 22,667 | 7,361 | ||||||||||||||
| 57,734 | 129,348 | 151,835 | 101,813 | 103,373 | ||||||||||||||
| 465 | 241,558 | 317,647 | 117,738 | 62,293 | ||||||||||||||
| 7,405 | 126,468 | 137,851 | 50,241 | 57,593 | ||||||||||||||
| – | – | 2,249 | – | – | ||||||||||||||
| 7,889 | 357,473 | 284,162 | 115,744 | 87,368 | ||||||||||||||
| 301,707 | 47,592,726 | 59,829,601 | 19,421,170 | 10,212,557 | ||||||||||||||
| – | (5,356 | ) | (4,857 | ) | (1,938 | ) | (1,377 | ) | ||||||||||
| (231,086 | ) | (126,468 | ) | (137,851 | ) | (50,241 | ) | (57,593 | ) | |||||||||
| – | – | – | – | – | ||||||||||||||
| 70,621 | 47,460,902 | 59,686,893 | 19,368,991 | 10,153,587 | ||||||||||||||
| 247,433 | 242,081,655 | 376,268,770 | 78,677,188 | 21,985,020 | ||||||||||||||
| See Notes to Financial Statements. | 441 |
Statements of Operations (continued)
For the Year Ended November 30, 2021
| Convertible Fund | Core Fixed Income Fund | Core Plus Bond Fund | ||||||||||
| Net realized and unrealized gain (loss): | ||||||||||||
| Net realized gain (loss) on Investments | $ | 317,845,852 | $ | 12,229,671 | $ | 1,380,996 | ||||||
| Net realized gain (loss) on futures contracts | – | (3,965,876 | ) | (568,970 | ) | |||||||
| Net realized gain (loss) on forward foreign currency exchange contracts | (3,399,530 | ) | 184,157 | (14,765 | ) | |||||||
| Net realized gain (loss) on swap contracts | – | (2,663,431 | ) | (519,013 | ) | |||||||
| Net realized gain (loss) on foreign currency related transactions | 730,506 | – | 6,931 | |||||||||
| Net change in unrealized appreciation/depreciation on Investments | (218,671,662 | ) | (37,590,950 | ) | (4,565,230 | ) | ||||||
| Net change in unrealized appreciation/depreciation on futures contracts | – | 3,283,768 | 305,192 | |||||||||
| Net change in unrealized appreciation/depreciation on forward foreign currency exchange contracts | 2,736,224 | 123,919 | 54,832 | |||||||||
| Net change in unrealized appreciation/depreciation on swap contracts | – | 277,396 | (68,046 | ) | ||||||||
| Net change in unrealized appreciation/depreciation on translation of assets and liabilities denominated in foreign currencies | (30,148 | ) | 156 | (212 | ) | |||||||
| Net change in unrealized appreciation/depreciation on unfunded commitments | – | – | (803 | ) | ||||||||
| Net realized and unrealized gain (loss) | 99,211,242 | (28,121,190 | ) | (3,989,088 | ) | |||||||
| Net Increase (Decrease) in Net Assets Resulting From Operations | $ | 108,194,405 | $ | (5,002,480 | ) | $ | 2,757,127 | |||||
| 442 | See Notes to Financial Statements. |
| Corporate Bond Fund | Floating Rate Fund | High Yield Fund | Income Fund | Inflation Focused Fund | ||||||||||||||
| $ | 196,633 | $ | 14,385,691 | $ | 420,834,167 | $ | 88,980,292 | $ | 1,688,843 | |||||||||
| 51,937 | 4,908,240 | 21,817,545 | (6,110,868 | ) | (7,083,076 | ) | ||||||||||||
| – | 507,633 | 1,181,414 | 274,192 | (26,551 | ) | |||||||||||||
| – | 4,742,156 | 3,388,532 | 1,898,553 | (67,700,926 | ) | |||||||||||||
| – | (367,468 | ) | (1,387,876 | ) | (81,939 | ) | (2,022 | ) | ||||||||||
| (395,211 | ) | 85,566,625 | (306,006,546 | ) | (93,887,136 | ) | (11,155,980 | ) | ||||||||||
| 7,328 | (2,662,905 | ) | (2,969,875 | ) | 3,494,871 | 794,025 | ||||||||||||
| – | 5,735,899 | 14,069,000 | 2,085,073 | 3,275 | ||||||||||||||
| – | (3,194,992 | ) | 12,510,610 | (4,539,958 | ) | 216,268,849 | ||||||||||||
| 1 | 530,519 | (186,495 | ) | (22,577 | ) | (70 | ) | |||||||||||
| – | 40,614 | (40,197 | ) | – | – | |||||||||||||
| (139,312 | ) | 110,192,012 | 163,210,279 | (7,909,497 | ) | 132,786,367 | ||||||||||||
| $ | 108,121 | $ | 352,273,667 | $ | 539,479,049 | $ | 70,767,691 | $ | 154,771,387 | |||||||||
| See Notes to Financial Statements. | 443 |
Statements of Operations (concluded)
For the Year Ended November 30, 2021
| Short Duration Core Bond Fund | Short Duration Income Fund | |||||||
| Investment income: | ||||||||
| Dividends | $ | – | $ | 5,663,038 | ||||
| Interest and other (net of foreign withholding taxes of $0, $0, $0 and $0, respectively) | 2,204,520 | 1,263,164,794 | ||||||
| Interest earned from Interfund Lending (See Note 12) | – | 745 | ||||||
| Total investment income | 2,204,520 | 1,268,828,577 | ||||||
| Expenses: | ||||||||
| Management fee | 505,303 | 150,704,642 | ||||||
| 12b-1 distribution plan-Class A | 92,059 | 26,379,777 | ||||||
| 12b-1 distribution plan-Class A1 | – | – | ||||||
| 12b-1 distribution plan-Class C | 38,457 | 31,356,806 | ||||||
| 12b-1 distribution plan-Class F | 100,544 | 25,317,438 | ||||||
| 12b-1 distribution plan-Class P | – | – | ||||||
| 12b-1 distribution plan-Class R2 | – | 69,639 | ||||||
| 12b-1 distribution plan-Class R3 | 267 | 2,016,403 | ||||||
| 12b-1 distribution plan-Class R4 | 29 | 406,084 | ||||||
| Registration | 178,502 | 2,353,059 | ||||||
| Shareholder servicing | 133,985 | 39,708,092 | ||||||
| Fund administration | 67,374 | 23,872,743 | ||||||
| Professional | 58,305 | 458,039 | ||||||
| Custody | 15,839 | 551,741 | ||||||
| Trustees’ fees | 6,333 | 2,324,337 | ||||||
| Reports to shareholders | 4,368 | 190,309 | ||||||
| Other | 23,860 | 780,642 | ||||||
| Gross expenses | 1,225,225 | 306,489,751 | ||||||
| Expense reductions (See Note 10) | (153 | ) | (48,892 | ) | ||||
| Fees waived and expenses reimbursed (See Note 3) | (320,795 | ) | (551,741 | ) | ||||
| Shareholder servicing reimbursed-Class I (See Note 3) | – | – | ||||||
| Net expenses | 904,277 | 305,889,118 | ||||||
| Net investment income | 1,300,243 | 962,939,459 | ||||||
| Net realized and unrealized gain (loss): | ||||||||
| Net realized gain (loss) on Investments | 445,616 | 260,943,539 | ||||||
| Net realized gain (loss) on futures contracts | 158,143 | 10,860,392 | ||||||
| Net realized gain (loss) on forward foreign currency exchange contracts | (5,545 | ) | 10,523,212 | |||||
| Net realized gain (loss) on swap contracts | (69,131 | ) | 29,033,257 | |||||
| Net realized gain (loss) on foreign currency related transactions | (204 | ) | 226,968 | |||||
| Net change in unrealized appreciation/depreciation on Investments | (1,276,572 | ) | (389,349,952 | ) | ||||
| Net change in unrealized appreciation/depreciation on futures contracts | (11,463 | ) | 12,524,163 | |||||
| Net change in unrealized appreciation/depreciation on forward foreign currency exchange contracts | 1,638 | (1,954,612 | ) | |||||
| Net change in unrealized appreciation/depreciation on swap contracts | 117,054 | (16,266,793 | ) | |||||
| Net change in unrealized appreciation/depreciation on translation of assets and liabilities denominated in foreign currencies | (43 | ) | (4,515 | ) | ||||
| Net change in unrealized appreciation/depreciation on unfunded commitments | – | – | ||||||
| Net realized and unrealized gain (loss) | (640,507 | ) | (83,464,341 | ) | ||||
| Net Increase in Net Assets Resulting From Operations | $ | 659,736 | $ | 879,475,118 | ||||
| 444 | See Notes to Financial Statements. |
| Total Return Fund | Ultra Short Bond Fund | ||||||
| $ | – | $ | – | ||||
| 101,362,229 | 147,550,141 | ||||||
| 212 | 200 | ||||||
| 101,362,441 | 147,550,341 | ||||||
| 11,667,743 | 32,791,962 | ||||||
| 2,744,981 | 16,785,749 | ||||||
| – | 39,753 | ||||||
| 600,912 | – | ||||||
| 1,027,938 | 6,109,662 | ||||||
| 3,030 | – | ||||||
| 13,098 | – | ||||||
| 284,745 | – | ||||||
| 124,348 | – | ||||||
| 271,452 | 1,724,274 | ||||||
| 3,315,633 | 10,177,793 | ||||||
| 1,671,960 | 7,715,756 | ||||||
| 89,348 | 159,137 | ||||||
| 112,144 | 271,051 | ||||||
| 165,186 | 778,712 | ||||||
| 78,048 | – | ||||||
| 126,284 | 390,030 | ||||||
| 22,296,850 | 76,943,879 | ||||||
| (2,808 | ) | (16,953 | ) | ||||
| (112,144 | ) | (272,017 | ) | ||||
| (163,569 | ) | – | |||||
| 22,018,329 | 76,654,909 | ||||||
| 79,344,112 | 70,895,432 | ||||||
| 45,248,913 | 2,455,409 | ||||||
| (21,063,812 | ) | 3,507,439 | |||||
| (567,889 | ) | – | |||||
| (8,671,154 | ) | – | |||||
| 71,683 | – | ||||||
| (72,117,918 | ) | (68,639,208 | ) | ||||
| 8,319,211 | (3,224,099 | ) | |||||
| 1,353,994 | – | ||||||
| 924,513 | – | ||||||
| (2,298 | ) | – | |||||
| (8,225 | ) | – | |||||
| (46,512,982 | ) | (65,900,459 | ) | ||||
| $ | 32,831,130 | $ | 4,994,973 | ||||
| See Notes to Financial Statements. | 445 |
Statements of Changes in Net Assets
| Convertible Fund | ||||||||
| INCREASE (DECREASE) IN NET ASSETS | For the Year Ended November 30, 2021 | For the Year Ended November 30, 2020 | ||||||
| Operations: | ||||||||
| Net investment income | $ | 8,983,163 | $ | 8,280,966 | ||||
| Net realized gain (loss) on investments, futures contracts, forward foreign currency exchange contracts, swaps and foreign currency related transactions | 315,176,828 | 197,625,004 | ||||||
| Net change in unrealized appreciation/depreciation on investments, futures contracts, forward foreign currency exchange contracts, swaps, unfunded commitments and translation of assets and liabilities denominated in foreign currencies | (215,965,586 | ) | 248,550,714 | |||||
| Net increase (decrease) in net assets resulting from operations | 108,194,405 | 454,456,684 | ||||||
| Distributions to shareholders: | ||||||||
| Class A | (44,474,798 | ) | (12,026,469 | ) | ||||
| Class C | (9,636,964 | ) | (3,152,590 | ) | ||||
| Class F | (98,696,767 | ) | (15,483,914 | ) | ||||
| Class F3 | (3,794,157 | ) | (703,791 | ) | ||||
| Class I | (44,532,989 | ) | (23,687,385 | ) | ||||
| Class P | (10,698 | ) | (5,567 | ) | ||||
| Class R2 | (6,653 | ) | (4,234 | ) | ||||
| Class R3 | (3,781,842 | ) | (848,067 | ) | ||||
| Class R4 | (62,354 | ) | (6,762 | ) | ||||
| Class R5 | (208,290 | ) | (72,154 | ) | ||||
| Class R6 | (938,396 | ) | (407,738 | ) | ||||
| Total distributions to shareholders | (206,143,908 | ) | (56,398,671 | ) | ||||
| Capital share transactions (Net of share conversions) (See Note 17): | ||||||||
| Net proceeds from sales of shares | 1,148,419,471 | 753,471,200 | ||||||
| Reinvestment of distributions | 184,921,377 | 51,918,546 | ||||||
| Cost of shares reacquired | (1,004,464,628 | ) | (516,629,223 | ) | ||||
| Net increase in net assets resulting from capital share transactions | 328,876,220 | 288,760,523 | ||||||
| Net increase (decrease) in net assets | 230,926,717 | 686,818,536 | ||||||
| NET ASSETS: | ||||||||
| Beginning of year | $ | 1,377,282,140 | $ | 690,463,604 | ||||
| End of year | $ | 1,608,208,857 | $ | 1,377,282,140 | ||||
| 446 | See Notes to Financial Statements. |
| Core Fixed Income Fund | Core Plus Bond Fund | |||||||||||||
| For the Year Ended November 30, 2021 | For the Year Ended November 30, 2020 | For the Year Ended November 30, 2021 | For the Year Ended November 30, 2020 | |||||||||||
| $ | 23,118,710 | $ | 31,744,335 | $ | 6,746,215 | $ | 6,619,390 | |||||||
| 5,784,521 | 79,393,615 | 285,179 | 4,457,156 | |||||||||||
| (33,905,711 | ) | 17,515,377 | (4,274,267 | ) | 3,490,588 | |||||||||
| (5,002,480 | ) | 128,653,327 | 2,757,127 | 14,567,134 | ||||||||||
| (30,146,588 | ) | (11,268,416 | ) | (2,476,213 | ) | (1,564,863 | ) | |||||||
| (1,823,741 | ) | (660,646 | ) | (181,477 | ) | (155,580 | ) | |||||||
| (16,536,554 | ) | (6,168,214 | ) | (7,213,736 | ) | (6,963,737 | ) | |||||||
| (19,418,211 | ) | (7,652,850 | ) | (637,706 | ) | (202,841 | ) | |||||||
| (23,340,610 | ) | (10,497,468 | ) | (1,096,104 | ) | (992,480 | ) | |||||||
| – | – | – | – | |||||||||||
| (19,609 | ) | (8,902 | ) | – | – | |||||||||
| (466,113 | ) | (187,241 | ) | (4,961 | ) | (6,167 | ) | |||||||
| (465,934 | ) | (180,145 | ) | (11,229 | ) | (4,551 | ) | |||||||
| (52,146 | ) | (27,049 | ) | (456 | ) | (919 | ) | |||||||
| (1,574,971 | ) | (835,176 | ) | (40,649 | ) | (27,450 | ) | |||||||
| (93,844,477 | ) | (37,486,107 | ) | (11,662,531 | ) | (9,918,588 | ) | |||||||
| 566,871,625 | 1,175,119,050 | 289,650,946 | 228,820,166 | |||||||||||
| 93,164,727 | 37,271,368 | 11,626,541 | 9,922,011 | |||||||||||
| (562,456,825 | ) | (740,809,797 | ) | (176,565,796 | ) | (153,506,555 | ) | |||||||
| 97,579,527 | 471,580,621 | 124,711,691 | 85,235,622 | |||||||||||
| (1,267,430 | ) | 562,747,841 | 115,806,287 | 89,884,168 | ||||||||||
| $ | 2,049,016,724 | $ | 1,486,268,883 | $ | 290,305,686 | $ | 200,421,518 | |||||||
| $ | 2,047,749,294 | $ | 2,049,016,724 | $ | 406,111,973 | $ | 290,305,686 | |||||||
| See Notes to Financial Statements. | 447 |
Statements of Changes in Net Assets (continued)
| Corporate Bond Fund | ||||||||
| INCREASE (DECREASE) IN NET ASSETS | For the Year Ended November 30, 2021 | For the Year Ended November 30, 2020 | ||||||
| Operations: | ||||||||
| Net investment income | $ | 247,433 | $ | 263,442 | ||||
| Net realized gain (loss) on investments, futures contracts, forward foreign currency exchange contracts, swaps and foreign currency related transactions | 248,570 | 402,389 | ||||||
| Net change in unrealized appreciation/depreciation on investments, futures contracts, forward foreign currency exchange contracts, swaps, unfunded commitments and translation of assets and liabilities denominated in foreign currencies | (387,882 | ) | 172,350 | |||||
| Net increase (decrease) in net assets resulting from operations | 108,121 | 838,181 | ||||||
| Distributions to shareholders: | ||||||||
| Class A | (118,710 | ) | (40,744 | ) | ||||
| Class C | (30,828 | ) | (16,679 | ) | ||||
| Class F | (195,506 | ) | (141,022 | ) | ||||
| Class F3 | (87,404 | ) | (63,015 | ) | ||||
| Class I | (6,770 | ) | (5,550 | ) | ||||
| Class P | – | – | ||||||
| Class R2 | (1,243 | ) | (847 | ) | ||||
| Class R3 | (2,650 | ) | (1,701 | ) | ||||
| Class R4 | (1,357 | ) | (957 | ) | ||||
| Class R5 | (1,443 | ) | (1,037 | ) | ||||
| Class R6 | (88,815 | ) | (63,702 | ) | ||||
| Return of capital | ||||||||
| Class A | – | – | ||||||
| Class C | – | – | ||||||
| Class F | – | – | ||||||
| Class F3 | – | – | ||||||
| Class I | – | – | ||||||
| Class R2 | – | – | ||||||
| Class R3 | – | – | ||||||
| Class R4 | – | – | ||||||
| Class R5 | – | – | ||||||
| Class R6 | – | – | ||||||
| Total distributions to shareholders | (534,726 | ) | (335,254 | ) | ||||
| Capital share transactions (Net of share conversions) (See Note 17): | ||||||||
| Net proceeds from sales of shares | 3,286,355 | 7,415,917 | ||||||
| Reinvestment of distributions | 279,857 | 229,109 | ||||||
| Cost of shares reacquired | (2,432,483 | ) | (5,100,194 | ) | ||||
| Net increase (decrease) in net assets resulting from capital share transactions | 1,133,729 | 2,544,832 | ||||||
| Net increase (decrease) in net assets | 707,124 | 3,047,759 | ||||||
| NET ASSETS: | ||||||||
| Beginning of year | $ | 10,923,313 | $ | 7,875,554 | ||||
| End of year | $ | 11,630,437 | $ | 10,923,313 | ||||
| 448 | See Notes to Financial Statements. |
| Floating Rate Fund | High Yield Fund | ||||||||||||||
| For the Year Ended November 30, 2021 | For the Year Ended November 30, 2020 | For the Year Ended November 30, 2021 | For the Year Ended November 30, 2020 | ||||||||||||
| $ | 242,081,655 | $ | 333,650,171 | $ | 376,268,770 | $ | 383,295,703 | ||||||||
| 24,176,252 | (918,115,780 | ) | 445,833,782 | (171,817,109 | ) | ||||||||||
| 86,015,760 | 161,355,097 | (282,623,503 | ) | 332,891,348 | |||||||||||
| 352,273,667 | (423,110,512 | ) | 539,479,049 | 544,369,942 | |||||||||||
| (71,663,534 | ) | (77,880,628 | ) | (55,737,636 | ) | (59,430,642 | ) | ||||||||
| (17,977,968 | ) | (29,550,397 | ) | (11,440,283 | ) | (15,701,003 | ) | ||||||||
| (100,311,162 | ) | (118,552,436 | ) | (107,702,794 | ) | (114,217,234 | ) | ||||||||
| (4,533,210 | ) | (4,748,546 | ) | (67,467,481 | ) | (71,956,776 | ) | ||||||||
| (39,381,013 | ) | (46,185,206 | ) | (90,563,940 | ) | (83,792,385 | ) | ||||||||
| – | – | (2,110 | ) | (2,942 | ) | ||||||||||
| (33,778 | ) | (45,528 | ) | (271,454 | ) | (460,759 | ) | ||||||||
| (1,669,244 | ) | (1,700,200 | ) | (5,084,508 | ) | (5,800,041 | ) | ||||||||
| (103,869 | ) | (157,132 | ) | (4,921,338 | ) | (6,144,453 | ) | ||||||||
| (140,747 | ) | (291,452 | ) | (12,626,828 | ) | (14,865,606 | ) | ||||||||
| (4,430,656 | ) | (4,971,555 | ) | (34,216,604 | ) | (34,047,152 | ) | ||||||||
| – | (13,936,988 | ) | – | – | |||||||||||
| – | (5,288,138 | ) | – | – | |||||||||||
| – | (21,215,339 | ) | – | – | |||||||||||
| – | (849,768 | ) | – | – | |||||||||||
| – | (8,264,991 | ) | – | – | |||||||||||
| – | (8,147 | ) | – | – | |||||||||||
| – | (304,257 | ) | – | – | |||||||||||
| – | (28,119 | ) | – | – | |||||||||||
| – | (52,156 | ) | – | – | |||||||||||
| – | (889,676 | ) | – | – | |||||||||||
| (240,245,181 | ) | (334,920,659 | ) | (390,034,976 | ) | (406,418,993 | ) | ||||||||
| 3,152,226,991 | 2,769,549,859 | 2,223,607,627 | 4,557,701,200 | ||||||||||||
| 202,485,760 | 277,197,863 | 363,727,584 | 378,696,214 | ||||||||||||
| (2,322,466,657 | ) | (5,936,645,921 | ) | (3,770,958,816 | ) | (3,827,045,203 | ) | ||||||||
| 1,032,246,094 | $ | (2,889,898,199 | ) | (1,183,623,605 | ) | 1,109,352,211 | |||||||||
| 1,144,274,580 | (3,647,929,370 | ) | (1,034,179,532 | ) | 1,247,303,160 | ||||||||||
| $ | 5,761,844,272 | $ | 9,409,773,642 | $ | 8,302,505,759 | $ | 7,055,202,599 | ||||||||
| $ | 6,906,118,852 | $ | 5,761,844,272 | $ | 7,268,326,227 | $ | 8,302,505,759 | ||||||||
| See Notes to Financial Statements. | 449 |
Statements of Changes in Net Assets (continued)
| Income Fund | ||||||||
| INCREASE (DECREASE) IN NET ASSETS | For the Year Ended November 30, 2021 | For the Year Ended November 30, 2020 | ||||||
| Operations: | ||||||||
| Net investment income | $ | 78,677,188 | $ | 87,432,612 | ||||
| Net realized gain (loss) on investments, futures contracts, forward foreign currency exchange contracts, swaps and foreign currency related transactions | 84,960,230 | 21,948,574 | ||||||
| Net change in unrealized appreciation/depreciation on investments, futures contracts, forward foreign currency exchange contracts, swaps, unfunded commitments and translation of assets and liabilities denominated in foreign currencies | (92,869,727 | ) | 79,976,299 | |||||
| Net increase in net assets resulting from operations | 70,767,691 | 189,357,485 | ||||||
| Distributions to shareholders: | ||||||||
| Class A | (37,966,179 | ) | (40,039,344 | ) | ||||
| Class C | (2,229,886 | ) | (4,336,200 | ) | ||||
| Class F | (17,756,247 | ) | (22,016,457 | ) | ||||
| Class F3 | (27,165,271 | ) | (25,058,866 | ) | ||||
| Class I | (4,553,494 | ) | (5,984,763 | ) | ||||
| Class R2 | (37,083 | ) | (50,895 | ) | ||||
| Class R3 | (1,496,610 | ) | (1,800,809 | ) | ||||
| Class R4 | (182,213 | ) | (325,479 | ) | ||||
| Class R5 | (205,062 | ) | (236,503 | ) | ||||
| Class R6 | (1,942,082 | ) | (2,235,220 | ) | ||||
| Total distributions to shareholders | (93,534,127 | ) | (102,084,536 | ) | ||||
| Capital share transactions (Net of share conversions) (See Note 17): | ||||||||
| Net proceeds from sales of shares | 903,627,448 | 974,203,120 | ||||||
| Reinvestment of distributions | 87,005,996 | 92,724,686 | ||||||
| Cost of shares reacquired | (704,310,353 | ) | (944,205,546 | ) | ||||
| Net increase (decrease) in net assets resulting from capital share transactions | 286,323,091 | 122,722,260 | ||||||
| Net increase (decrease) in net assets | 263,556,655 | 209,995,209 | ||||||
| NET ASSETS: | ||||||||
| Beginning of year | $ | 2,913,765,028 | $ | 2,703,769,819 | ||||
| End of year | $ | 3,177,321,683 | $ | 2,913,765,028 | ||||
| 450 | See Notes to Financial Statements. |
| Inflation Focused Fund | Short Duration Core Bond Fund | ||||||||||||||
| For the Year Ended November 30, 2021 | For the Year Ended November 30, 2020 | For the Year Ended November 30, 2021 | For the Year Ended November 30, 2020 | ||||||||||||
| $ | 21,985,020 | $ | 19,519,379 | $ | 1,300,243 | $ | 1,144,019 | ||||||||
| (73,123,732 | ) | (6,988,431 | ) | 528,879 | 173,966 | ||||||||||
| 205,910,099 | (4,179,790 | ) | (1,169,386 | ) | 524,598 | ||||||||||
| 154,771,387 | 8,351,158 | 659,736 | 1,842,583 | ||||||||||||
| (6,605,755 | ) | (3,367,740 | ) | (783,111 | ) | (407,452 | ) | ||||||||
| (695,768 | ) | (699,044 | ) | (44,830 | ) | (47,544 | ) | ||||||||
| (19,635,542 | ) | (7,922,723 | ) | (1,804,755 | ) | (1,175,567 | ) | ||||||||
| (1,880,994 | ) | (342,816 | ) | (9,140 | ) | (5,050 | ) | ||||||||
| (15,218,619 | ) | (16,633,850 | ) | (303,164 | ) | (60,914 | ) | ||||||||
| (822 | ) | (1,217 | ) | – | (298 | ) | |||||||||
| (6,861 | ) | (6,093 | ) | (753 | ) | (1,680 | ) | ||||||||
| (47,470 | ) | (95,602 | ) | (203 | ) | (476 | ) | ||||||||
| (5,436 | ) | (10,385 | ) | (232 | ) | (525 | ) | ||||||||
| (446,150 | ) | (1,270,570 | ) | (17,880 | ) | (23,329 | ) | ||||||||
| (44,543,417 | ) | (30,350,040 | ) | (2,964,068 | ) | (1,722,835 | ) | ||||||||
| 3,375,804,253 | 283,087,556 | 168,095,317 | 170,629,856 | ||||||||||||
| 42,764,809 | 27,038,763 | 2,830,620 | 1,670,767 | ||||||||||||
| (435,077,649 | ) | (751,918,774 | ) | (109,774,576 | ) | (92,491,819 | ) | ||||||||
| 2,983,491,413 | (441,792,455 | ) | 61,151,361 | 79,808,804 | |||||||||||
| 3,093,719,383 | (463,791,337 | ) | 58,847,029 | 79,928,552 | |||||||||||
| $ | 640,299,554 | $ | 1,104,090,891 | $ | 124,755,006 | $ | 44,826,454 | ||||||||
| $ | 3,734,018,937 | $ | 640,299,554 | $ | 183,602,035 | $ | 124,755,006 | ||||||||
| See Notes to Financial Statements. | 451 |
Statements of Changes in Net Assets (concluded)
| Short Duration Income Fund | ||||||||
| INCREASE (DECREASE) IN NET ASSETS | For the Year Ended November 30, 2021 | For the Year Ended November 30, 2020 | ||||||
| Operations: | ||||||||
| Net investment income | $ | 962,939,459 | $ | 1,237,223,645 | ||||
| Net realized gain (loss) on investments, futures contracts, forward foreign currency exchange contracts, swaps and foreign currency related transactions | 311,587,368 | (56,963,808 | ) | |||||
| Net change in unrealized appreciation/depreciation on investments, futures contracts, forward foreign currency exchange contracts, swaps, unfunded commitments and translation of assets and liabilities denominated in foreign currencies | (395,051,709 | ) | 36,380,905 | |||||
| Net increase in net assets resulting from operations | 879,475,118 | 1,216,640,742 | ||||||
| Distributions to shareholders: | ||||||||
| Class A | (309,607,372 | ) | (350,586,053 | ) | ||||
| Class A1 | – | – | ||||||
| Class C | (62,982,386 | ) | (106,276,101 | ) | ||||
| Class F | (617,730,413 | ) | (688,006,004 | ) | ||||
| Class F3 | (125,501,106 | ) | (138,292,416 | ) | ||||
| Class I | (279,943,499 | ) | (305,139,040 | ) | ||||
| Class P | – | – | ||||||
| Class R2 | (227,822 | ) | (365,608 | ) | ||||
| Class R3 | (8,276,628 | ) | (9,763,395 | ) | ||||
| Class R4 | (3,848,330 | ) | (4,531,989 | ) | ||||
| Class R5 | (1,715,632 | ) | (2,374,136 | ) | ||||
| Class R6 | (25,537,393 | ) | (27,870,793 | ) | ||||
| Total distributions to shareholders | (1,435,370,581 | ) | (1,633,205,535 | ) | ||||
| Capital share transactions (Net of share conversions) (See Note 17): | ||||||||
| Net proceeds from sales of shares | 26,643,406,283 | 26,023,360,331 | ||||||
| Reinvestment of distributions | 1,242,281,987 | 1,411,722,115 | ||||||
| Cost of shares reacquired | (20,390,255,915 | ) | (26,669,111,863 | ) | ||||
| Net increase (decrease) in net assets resulting from capital share transactions | 7,495,432,355 | 765,970,583 | ||||||
| Net increase (decrease) in net assets | 6,939,536,892 | 349,405,790 | ||||||
| NET ASSETS: | ||||||||
| Beginning of year | $ | 55,915,608,062 | $ | 55,566,202,272 | ||||
| End of year | $ | 62,855,144,954 | $ | 55,915,608,062 | ||||
| 452 | See Notes to Financial Statements. |
| Total Return Fund | Ultra Short Bond Fund | ||||||||||||||
| For the Year Ended November 30, 2021 | For the Year Ended November 30, 2020 | For the Year Ended November 30, 2021 | For the Year Ended November 30, 2020 | ||||||||||||
| $ | 79,344,112 | $ | 95,432,675 | $ | 70,895,432 | $ | 237,124,012 | ||||||||
| 15,017,741 | 164,923,469 | 5,962,848 | (49,993,084 | ) | |||||||||||
| (61,530,723 | ) | 5,727,695 | (71,863,307 | ) | 12,662,427 | ||||||||||
| 32,831,130 | 266,083,839 | 4,994,973 | 199,793,355 | ||||||||||||
| (57,216,980 | ) | (33,261,179 | ) | (40,628,679 | ) | (139,495,939 | ) | ||||||||
| – | – | (42,663 | ) | (80,421 | ) | ||||||||||
| (2,760,963 | ) | (2,032,803 | ) | – | – | ||||||||||
| (43,026,580 | ) | (25,171,768 | ) | (25,148,239 | ) | (76,898,925 | ) | ||||||||
| (35,456,865 | ) | (19,710,469 | ) | (3,563,432 | ) | (4,398,887 | ) | ||||||||
| (17,833,713 | ) | (11,283,291 | ) | (6,438,730 | ) | (18,442,515 | ) | ||||||||
| (25,673 | ) | (13,487 | ) | – | – | ||||||||||
| (87,984 | ) | (61,337 | ) | – | – | ||||||||||
| (2,707,274 | ) | (1,974,852 | ) | – | – | ||||||||||
| (2,208,768 | ) | (1,631,622 | ) | – | – | ||||||||||
| (4,197,222 | ) | (3,077,974 | ) | (3,612 | ) | (27,977 | ) | ||||||||
| (12,413,150 | ) | (9,775,103 | ) | (429,817 | ) | (573,211 | ) | ||||||||
| (177,935,172 | ) | (107,993,885 | ) | (76,255,172 | ) | (239,917,875 | ) | ||||||||
| 989,612,784 | 1,231,781,820 | 11,462,190,489 | 21,872,176,858 | ||||||||||||
| 164,741,222 | 99,416,854 | 71,411,372 | 228,044,541 | ||||||||||||
| (1,114,907,634 | ) | (1,314,339,885 | ) | (15,726,627,092 | ) | (21,082,406,048 | ) | ||||||||
| 39,446,372 | 16,858,789 | (4,193,025,231 | ) | 1,017,815,351 | |||||||||||
| (105,657,670 | ) | 174,948,743 | (4,264,285,430 | ) | 977,690,831 | ||||||||||
| $ | 4,256,516,694 | $ | 4,081,567,951 | $ | 21,557,539,458 | $ | 20,579,848,627 | ||||||||
| $ | 4,150,859,024 | $ | 4,256,516,694 | $ | 17,293,254,028 | $ | 21,557,539,458 | ||||||||
| See Notes to Financial Statements. | 453 |
CONVERTIBLE FUND
| Per Share Operating Performance: | ||||||||||||||||||||||||||||
| Investment Operations: | Distributions to shareholders from: | |||||||||||||||||||||||||||
| Net asset value, beginning of period | Net invest- ment income (loss)(a) | Net realized and unrealized gain (loss) | Total from invest- ment opera- tions | Net investment income | Net realized gain | Total distri- butions | ||||||||||||||||||||||
| Class A | ||||||||||||||||||||||||||||
| 11/30/2021 | $ | 20.52 | $ | 0.09 | $ | 1.68 | $ | 1.77 | $ | (0.19 | ) | $ | (2.86 | ) | $ | (3.05 | ) | |||||||||||
| 11/30/2020 | 14.15 | 0.14 | 7.40 | 7.54 | (0.21 | ) | (0.96 | ) | (1.17 | ) | ||||||||||||||||||
| 11/30/2019 | 13.16 | 0.21 | 1.70 | 1.91 | (0.53 | ) | (0.39 | ) | (0.92 | ) | ||||||||||||||||||
| 11/30/2018 | 13.31 | 0.16 | (0.03 | ) | 0.13 | (0.28 | ) | – | (0.28 | ) | ||||||||||||||||||
| 11/30/2017 | 11.65 | 0.20 | 1.83 | 2.03 | (0.37 | ) | – | (0.37 | ) | |||||||||||||||||||
| Class C | ||||||||||||||||||||||||||||
| 11/30/2021 | 20.37 | (0.04 | ) | 1.66 | 1.62 | (0.09 | ) | (2.86 | ) | (2.95 | ) | |||||||||||||||||
| 11/30/2020 | 14.05 | 0.03 | 7.36 | 7.39 | (0.11 | ) | (0.96 | ) | (1.07 | ) | ||||||||||||||||||
| 11/30/2019 | 13.08 | 0.12 | 1.69 | 1.81 | (0.45 | ) | (0.39 | ) | (0.84 | ) | ||||||||||||||||||
| 11/30/2018 | 13.23 | 0.07 | (0.03 | ) | 0.04 | (0.19 | ) | – | (0.19 | ) | ||||||||||||||||||
| 11/30/2017 | 11.57 | 0.13 | 1.83 | 1.96 | (0.30 | ) | – | (0.30 | ) | |||||||||||||||||||
| Class F | ||||||||||||||||||||||||||||
| 11/30/2021 | 20.52 | 0.11 | 1.68 | 1.79 | (0.20 | ) | (2.86 | ) | (3.06 | ) | ||||||||||||||||||
| 11/30/2020 | 14.15 | 0.16 | 7.39 | 7.55 | (0.22 | ) | (0.96 | ) | (1.18 | ) | ||||||||||||||||||
| 11/30/2019 | 13.17 | 0.22 | 1.69 | 1.91 | (0.54 | ) | (0.39 | ) | (0.93 | ) | ||||||||||||||||||
| 11/30/2018 | 13.32 | 0.18 | (0.04 | ) | 0.14 | (0.29 | ) | – | (0.29 | ) | ||||||||||||||||||
| 11/30/2017 | 11.65 | 0.22 | 1.84 | 2.06 | (0.39 | ) | – | (0.39 | ) | |||||||||||||||||||
| Class F3 | ||||||||||||||||||||||||||||
| 11/30/2021 | 20.68 | 0.15 | 1.69 | 1.84 | (0.22 | ) | (2.86 | ) | (3.08 | ) | ||||||||||||||||||
| 11/30/2020 | 14.24 | 0.18 | 7.46 | 7.64 | (0.24 | ) | (0.96 | ) | (1.20 | ) | ||||||||||||||||||
| 11/30/2019 | 13.25 | 0.24 | 1.70 | 1.94 | (0.56 | ) | (0.39 | ) | (0.95 | ) | ||||||||||||||||||
| 11/30/2018 | 13.39 | 0.20 | (0.04 | ) | 0.16 | (0.30 | ) | – | (0.30 | ) | ||||||||||||||||||
| 4/4/2017 to 11/30/2017(c) | 17.35 | 0.16 | (4.01 | ) | (3.85 | ) | (0.11 | ) | – | (0.11 | ) | |||||||||||||||||
| Class I | ||||||||||||||||||||||||||||
| 11/30/2021 | 20.66 | 0.13 | 1.68 | 1.81 | (0.22 | ) | (2.86 | ) | (3.08 | ) | ||||||||||||||||||
| 11/30/2020 | 14.23 | 0.17 | 7.46 | 7.63 | (0.24 | ) | (0.96 | ) | (1.20 | ) | ||||||||||||||||||
| 11/30/2019 | 13.24 | 0.24 | 1.70 | 1.94 | (0.56 | ) | (0.39 | ) | (0.95 | ) | ||||||||||||||||||
| 11/30/2018 | 13.39 | 0.19 | (0.04 | ) | 0.15 | (0.30 | ) | – | (0.30 | ) | ||||||||||||||||||
| 11/30/2017 | 11.71 | 0.23 | 1.85 | 2.08 | (0.40 | ) | – | (0.40 | ) | |||||||||||||||||||
| Class P | ||||||||||||||||||||||||||||
| 11/30/2021 | 20.88 | 0.05 | 1.70 | 1.75 | (0.12 | ) | (2.86 | ) | (2.98 | ) | ||||||||||||||||||
| 11/30/2020 | 14.37 | 0.09 | 7.55 | 7.64 | (0.17 | ) | (0.96 | ) | (1.13 | ) | ||||||||||||||||||
| 11/30/2019 | 13.36 | 0.18 | 1.72 | 1.90 | (0.50 | ) | (0.39 | ) | (0.89 | ) | ||||||||||||||||||
| 11/30/2018 | 13.51 | 0.13 | (0.04 | ) | 0.09 | (0.24 | ) | – | (0.24 | ) | ||||||||||||||||||
| 11/30/2017 | 11.81 | 0.18 | 1.86 | 2.04 | (0.34 | ) | – | (0.34 | ) | |||||||||||||||||||
| 454 | See Notes to Financial Statements. |
| Ratios to Average Net Assets: | Supplemental Data: | |||||||||||||||||||||||||
| Net asset value, end of period | Total return (%)(b) | Total expenses after waivers and/or reimburse- ments (%) | Total expenses (%) | Net invest- ment income (loss) (%) | Net assets, end of period (000) | Portfolio turnover rate (%) | ||||||||||||||||||||
| $ | 19.24 | 8.83 | 1.03 | 1.03 | 0.47 | $ | 365,551 | 154 | ||||||||||||||||||
| 20.52 | 57.67 | 1.06 | 1.06 | 0.86 | 290,469 | 138 | ||||||||||||||||||||
| 14.15 | 15.80 | 1.06 | 1.06 | 1.59 | 143,294 | 161 | ||||||||||||||||||||
| 13.16 | 0.94 | 1.04 | 1.04 | 1.21 | 133,181 | 213 | ||||||||||||||||||||
| 13.31 | 17.86 | 1.03 | 1.04 | 1.63 | 116,819 | 224 | ||||||||||||||||||||
| 19.04 | 8.08 | 1.70 | 1.70 | (0.19 | ) | 79,104 | 154 | |||||||||||||||||||
| 20.37 | 56.72 | 1.70 | 1.70 | 0.21 | 64,570 | 138 | ||||||||||||||||||||
| 14.05 | 15.00 | 1.70 | 1.70 | 0.94 | 41,278 | 161 | ||||||||||||||||||||
| 13.08 | 0.27 | 1.69 | 1.69 | 0.56 | 38,615 | 213 | ||||||||||||||||||||
| 13.23 | 17.25 | 1.65 | 1.66 | 1.06 | 42,574 | 224 | ||||||||||||||||||||
| 19.25 | 8.98 | 0.93 | 0.93 | 0.59 | 804,859 | 154 | ||||||||||||||||||||
| 20.52 | 57.83 | 0.96 | 0.96 | 0.96 | 625,813 | 138 | ||||||||||||||||||||
| 14.15 | 15.92 | 0.96 | 0.96 | 1.69 | 173,878 | 161 | ||||||||||||||||||||
| 13.17 | 0.95 | 0.94 | 0.94 | 1.32 | 201,325 | 213 | ||||||||||||||||||||
| 13.32 | 18.06 | 0.93 | 0.93 | 1.71 | 148,917 | 224 | ||||||||||||||||||||
| 19.44 | 9.18 | 0.75 | 0.75 | 0.77 | 37,889 | 154 | ||||||||||||||||||||
| 20.68 | 58.11 | 0.80 | 0.80 | 1.12 | 23,424 | 138 | ||||||||||||||||||||
| 14.24 | 16.02 | 0.83 | 0.83 | 1.81 | 8,030 | 161 | ||||||||||||||||||||
| 13.25 | 1.12 | 0.81 | 0.81 | 1.47 | 6,635 | 213 | ||||||||||||||||||||
| 13.39 | 10.06 | (d) | 0.81 | (e) | 0.82 | (e) | 1.84 | (e) | 3,884 | 224 | ||||||||||||||||
| 19.39 | 9.02 | 0.82 | 0.82 | 0.68 | 259,180 | 154 | ||||||||||||||||||||
| 20.66 | 58.08 | 0.86 | 0.86 | 1.05 | 340,178 | 138 | ||||||||||||||||||||
| 14.23 | 15.94 | 0.86 | 0.86 | 1.82 | 307,308 | 161 | ||||||||||||||||||||
| 13.24 | 1.12 | 0.84 | 0.84 | 1.40 | 469,350 | 213 | ||||||||||||||||||||
| 13.39 | 18.16 | 0.83 | 0.84 | 1.84 | 553,681 | 224 | ||||||||||||||||||||
| 19.65 | 8.57 | 1.27 | 1.27 | 0.23 | 43 | 154 | ||||||||||||||||||||
| 20.88 | 57.33 | 1.31 | 1.31 | 0.60 | 74 | 138 | ||||||||||||||||||||
| 14.37 | 15.43 | 1.31 | 1.31 | 1.33 | 70 | 161 | ||||||||||||||||||||
| 13.36 | 0.68 | 1.29 | 1.29 | 0.96 | 59 | 213 | ||||||||||||||||||||
| 13.51 | 17.66 | 1.27 | 1.28 | 1.43 | 56 | 224 | ||||||||||||||||||||
| See Notes to Financial Statements. | 455 |
Financial Highlights (continued)
CONVERTIBLE FUND
| Per Share Operating Performance: | ||||||||||||||||||||||||||||
| Investment Operations: | Distributions to shareholders from: | |||||||||||||||||||||||||||
| Net asset value, beginning of period | Net invest- ment income (loss)(a) | Net realized and unrealized gain (loss) | Total from invest- ment opera- tions | Net investment income | Net realized gain | Total distri- butions | ||||||||||||||||||||||
| Class R2 | ||||||||||||||||||||||||||||
| 11/30/2021 | $ | 20.88 | $ | 0.02 | $ | 1.71 | $ | 1.73 | $ | (0.12 | ) | $ | (2.86 | ) | $ | (2.98 | ) | |||||||||||
| 11/30/2020 | 14.37 | 0.07 | 7.54 | 7.61 | (0.14 | ) | (0.96 | ) | (1.10 | ) | ||||||||||||||||||
| 11/30/2019 | 13.35 | 0.17 | 1.71 | 1.88 | (0.47 | ) | (0.39 | ) | (0.86 | ) | ||||||||||||||||||
| 11/30/2018 | 13.49 | 0.11 | (0.03 | ) | 0.08 | (0.22 | ) | – | (0.22 | ) | ||||||||||||||||||
| 11/30/2017 | 11.79 | 0.17 | 1.85 | 2.02 | (0.32 | ) | – | (0.32 | ) | |||||||||||||||||||
| Class R3 | ||||||||||||||||||||||||||||
| 11/30/2021 | 20.41 | 0.04 | 1.66 | 1.70 | (0.13 | ) | (2.86 | ) | (2.99 | ) | ||||||||||||||||||
| 11/30/2020 | 14.08 | 0.09 | 7.37 | 7.46 | (0.17 | ) | (0.96 | ) | (1.13 | ) | ||||||||||||||||||
| 11/30/2019 | 13.11 | 0.17 | 1.68 | 1.85 | (0.49 | ) | (0.39 | ) | (0.88 | ) | ||||||||||||||||||
| 11/30/2018 | 13.26 | 0.13 | (0.04 | ) | 0.09 | (0.24 | ) | – | (0.24 | ) | ||||||||||||||||||
| 11/30/2017 | 11.60 | 0.17 | 1.83 | 2.00 | (0.34 | ) | – | (0.34 | ) | |||||||||||||||||||
| Class R4 | ||||||||||||||||||||||||||||
| 11/30/2021 | 20.52 | 0.09 | 1.67 | 1.76 | (0.18 | ) | (2.86 | ) | (3.04 | ) | ||||||||||||||||||
| 11/30/2020 | 14.14 | 0.14 | 7.40 | 7.54 | (0.20 | ) | (0.96 | ) | (1.16 | ) | ||||||||||||||||||
| 11/30/2019 | 13.16 | 0.20 | 1.70 | 1.90 | (0.53 | ) | (0.39 | ) | (0.92 | ) | ||||||||||||||||||
| 11/30/2018 | 13.31 | 0.16 | (0.04 | ) | 0.12 | (0.27 | ) | – | (0.27 | ) | ||||||||||||||||||
| 11/30/2017 | 11.64 | 0.20 | 1.84 | 2.04 | (0.37 | ) | – | (0.37 | ) | |||||||||||||||||||
| Class R5 | ||||||||||||||||||||||||||||
| 11/30/2021 | 20.65 | 0.14 | 1.68 | 1.82 | (0.22 | ) | (2.86 | ) | (3.08 | ) | ||||||||||||||||||
| 11/30/2020 | 14.23 | 0.17 | 7.45 | 7.62 | (0.24 | ) | (0.96 | ) | (1.20 | ) | ||||||||||||||||||
| 11/30/2019 | 13.24 | 0.23 | 1.71 | 1.94 | (0.56 | ) | (0.39 | ) | (0.95 | ) | ||||||||||||||||||
| 11/30/2018 | 13.38 | 0.19 | (0.03 | ) | 0.16 | (0.30 | ) | – | (0.30 | ) | ||||||||||||||||||
| 11/30/2017 | 11.70 | 0.21 | 1.87 | 2.08 | (0.40 | ) | – | (0.40 | ) | |||||||||||||||||||
| Class R6 | ||||||||||||||||||||||||||||
| 11/30/2021 | 20.69 | 0.15 | 1.68 | 1.83 | (0.22 | ) | (2.86 | ) | (3.08 | ) | ||||||||||||||||||
| 11/30/2020 | 14.25 | 0.17 | 7.47 | 7.64 | (0.24 | ) | (0.96 | ) | (1.20 | ) | ||||||||||||||||||
| 11/30/2019 | 13.25 | 0.24 | 1.71 | 1.95 | (0.56 | ) | (0.39 | ) | (0.95 | ) | ||||||||||||||||||
| 11/30/2018 | 13.39 | 0.19 | (0.03 | ) | 0.16 | (0.30 | ) | – | (0.30 | ) | ||||||||||||||||||
| 11/30/2017 | 11.71 | 0.23 | 1.85 | 2.08 | (0.40 | ) | – | (0.40 | ) | |||||||||||||||||||
| (a) | Calculated using average shares outstanding during the period. |
| (b) | Total return for Classes A and C does not consider the effects of sales loads and assumes the reinvestment of all distributions. Total return for all other classes assumes the reinvestment of all distributions. |
| (c) | Commenced on April 4, 2017. |
| (d) | Not annualized. |
| (e) | Annualized. |
| 456 | See Notes to Financial Statements. |
| Ratios to Average Net Assets: | Supplemental Data: | |||||||||||||||||||||||||
| Net asset value, end of period | Total return (%)(b) | Total expenses after waivers and/or reimburse- ments (%) | Total expenses (%) | Net invest- ment income (loss) (%) | Net assets, end of period (000) | Portfolio turnover rate (%) | ||||||||||||||||||||
| $ | 19.63 | 8.43 | 1.42 | 1.42 | 0.10 | $ | 94 | 154 | ||||||||||||||||||
| 20.88 | 57.05 | 1.46 | 1.46 | 0.45 | 46 | 138 | ||||||||||||||||||||
| 14.37 | 15.27 | 1.45 | 1.45 | 1.23 | 56 | 161 | ||||||||||||||||||||
| 13.35 | 0.57 | 1.44 | 1.44 | 0.79 | 70 | 213 | ||||||||||||||||||||
| 13.49 | 17.49 | 1.43 | 1.44 | 1.32 | 119 | 224 | ||||||||||||||||||||
| 19.12 | 8.52 | 1.33 | 1.33 | 0.19 | 36,483 | 154 | ||||||||||||||||||||
| 20.41 | 57.25 | 1.36 | 1.36 | 0.56 | 25,311 | 138 | ||||||||||||||||||||
| 14.08 | 15.37 | 1.36 | 1.36 | 1.28 | 10,420 | 161 | ||||||||||||||||||||
| 13.11 | 0.65 | 1.34 | 1.34 | 0.94 | 8,548 | 213 | ||||||||||||||||||||
| 13.26 | 17.61 | 1.32 | 1.32 | 1.34 | 5,577 | 224 | ||||||||||||||||||||
| 19.24 | 8.80 | 1.08 | 1.08 | 0.44 | 919 | 154 | ||||||||||||||||||||
| 20.52 | 57.67 | 1.13 | 1.13 | 0.86 | 418 | 138 | ||||||||||||||||||||
| 14.14 | 15.68 | 1.11 | 1.11 | 1.53 | 88 | 161 | ||||||||||||||||||||
| 13.16 | 0.88 | 1.09 | 1.09 | 1.17 | 64 | 213 | ||||||||||||||||||||
| 13.31 | 17.90 | 1.08 | 1.08 | 1.61 | 59 | 224 | ||||||||||||||||||||
| 19.39 | 9.08 | 0.83 | 0.83 | 0.69 | 1,905 | 154 | ||||||||||||||||||||
| 20.65 | 58.01 | 0.86 | 0.86 | 1.05 | 1,314 | 138 | ||||||||||||||||||||
| 14.23 | 16.03 | 0.86 | 0.87 | 1.70 | 843 | 161 | ||||||||||||||||||||
| 13.24 | 1.10 | 0.83 | 0.83 | 1.43 | 150 | 213 | ||||||||||||||||||||
| 13.38 | 18.18 | 0.83 | 0.83 | 1.63 | 139 | 224 | ||||||||||||||||||||
| 19.44 | 9.12 | 0.75 | 0.75 | 0.79 | 22,182 | 154 | ||||||||||||||||||||
| 20.69 | 58.08 | 0.80 | 0.80 | 1.11 | 5,665 | 138 | ||||||||||||||||||||
| 14.25 | 16.01 | 0.83 | 0.83 | 1.77 | 5,198 | 161 | ||||||||||||||||||||
| 13.25 | 1.20 | 0.81 | 0.81 | 1.39 | 4,558 | 213 | ||||||||||||||||||||
| 13.39 | 18.16 | 0.81 | 0.81 | 1.77 | 2,573 | 224 | ||||||||||||||||||||
| See Notes to Financial Statements. | 457 |
Financial Highlights (continued)
CORE FIXED INCOME FUND
| Per Share Operating Performance: | ||||||||||||||||||||||||||||
| Investment Operations: | Distributions to shareholders from: | |||||||||||||||||||||||||||
| Net asset value, beginning of period | Net invest- ment income(a) | Net realized and unrealized gain (loss) | Total from invest- ment opera- tions | Net investment income | Net realized gain | Total distri- butions | ||||||||||||||||||||||
| Class A | ||||||||||||||||||||||||||||
| 11/30/2021 | $ | 11.69 | $ | 0.11 | $ | (0.15 | ) | $ | (0.04 | ) | $ | (0.14 | ) | $ | (0.37 | ) | $ | (0.51 | ) | |||||||||
| 11/30/2020 | 11.10 | 0.19 | 0.62 | 0.81 | (0.22 | ) | – | (0.22 | ) | |||||||||||||||||||
| 11/30/2019 | 10.38 | 0.25 | 0.76 | 1.01 | (0.29 | ) | – | (0.29 | ) | |||||||||||||||||||
| 11/30/2018 | 10.87 | 0.25 | (0.43 | ) | (0.18 | ) | (0.31 | ) | – | (0.31 | ) | |||||||||||||||||
| 11/30/2017 | 10.80 | 0.18 | 0.14 | 0.32 | (0.25 | ) | – | (0.25 | ) | |||||||||||||||||||
| Class C | ||||||||||||||||||||||||||||
| 11/30/2021 | 11.63 | 0.04 | (0.15 | ) | (0.11 | ) | (0.07 | ) | (0.37 | ) | (0.44 | ) | ||||||||||||||||
| 11/30/2020 | 11.05 | 0.12 | 0.61 | 0.73 | (0.15 | ) | – | (0.15 | ) | |||||||||||||||||||
| 11/30/2019 | 10.34 | 0.18 | 0.75 | 0.93 | (0.22 | ) | – | (0.22 | ) | |||||||||||||||||||
| 11/30/2018 | 10.82 | 0.18 | (0.41 | ) | (0.23 | ) | (0.25 | ) | – | (0.25 | ) | |||||||||||||||||
| 11/30/2017 | 10.75 | 0.12 | 0.13 | 0.25 | (0.18 | ) | – | (0.18 | ) | |||||||||||||||||||
| Class F | ||||||||||||||||||||||||||||
| 11/30/2021 | 11.68 | 0.12 | (0.15 | ) | (0.03 | ) | (0.15 | ) | (0.37 | ) | (0.52 | ) | ||||||||||||||||
| 11/30/2020 | 11.10 | 0.19 | 0.62 | 0.81 | (0.23 | ) | – | (0.23 | ) | |||||||||||||||||||
| 11/30/2019 | 10.38 | 0.26 | 0.76 | 1.02 | (0.30 | ) | – | (0.30 | ) | |||||||||||||||||||
| 11/30/2018 | 10.87 | 0.26 | (0.43 | ) | (0.17 | ) | (0.32 | ) | – | (0.32 | ) | |||||||||||||||||
| 11/30/2017 | 10.80 | 0.19 | 0.14 | 0.33 | (0.26 | ) | – | (0.26 | ) | |||||||||||||||||||
| Class F3 | ||||||||||||||||||||||||||||
| 11/30/2021 | 11.69 | 0.14 | (0.16 | ) | (0.02 | ) | (0.17 | ) | (0.37 | ) | (0.54 | ) | ||||||||||||||||
| 11/30/2020 | 11.10 | 0.22 | 0.62 | 0.84 | (0.25 | ) | – | (0.25 | ) | |||||||||||||||||||
| 11/30/2019 | 10.38 | 0.28 | 0.76 | 1.04 | (0.32 | ) | – | (0.32 | ) | |||||||||||||||||||
| 11/30/2018 | 10.87 | 0.28 | (0.43 | ) | (0.15 | ) | (0.34 | ) | – | (0.34 | ) | |||||||||||||||||
| 4/4/2017 to 11/30/2017(c) | 10.84 | 0.15 | 0.06 | 0.21 | (0.18 | ) | – | (0.18 | ) | |||||||||||||||||||
| Class I | ||||||||||||||||||||||||||||
| 11/30/2021 | 11.68 | 0.14 | (0.15 | ) | (0.01 | ) | (0.17 | ) | (0.37 | ) | (0.54 | ) | ||||||||||||||||
| 11/30/2020 | 11.10 | 0.21 | 0.62 | 0.83 | (0.25 | ) | – | (0.25 | ) | |||||||||||||||||||
| 11/30/2019 | 10.38 | 0.27 | 0.76 | 1.03 | (0.31 | ) | – | (0.31 | ) | |||||||||||||||||||
| 11/30/2018 | 10.86 | 0.28 | (0.42 | ) | (0.14 | ) | (0.34 | ) | – | (0.34 | ) | |||||||||||||||||
| 11/30/2017 | 10.80 | 0.21 | 0.12 | 0.33 | (0.27 | ) | – | (0.27 | ) | |||||||||||||||||||
| Class R2 | ||||||||||||||||||||||||||||
| 11/30/2021 | 11.69 | 0.07 | (0.15 | ) | (0.08 | ) | (0.10 | ) | (0.37 | ) | (0.47 | ) | ||||||||||||||||
| 11/30/2020 | 11.10 | 0.14 | 0.63 | 0.77 | (0.18 | ) | – | (0.18 | ) | |||||||||||||||||||
| 11/30/2019 | 10.38 | 0.21 | 0.75 | 0.96 | (0.24 | ) | – | (0.24 | ) | |||||||||||||||||||
| 11/30/2018 | 10.87 | 0.21 | (0.43 | ) | (0.22 | ) | (0.27 | ) | – | (0.27 | ) | |||||||||||||||||
| 11/30/2017 | 10.80 | 0.14 | 0.13 | 0.27 | (0.20 | ) | – | (0.20 | ) | |||||||||||||||||||
| 458 | See Notes to Financial Statements. |
| Ratios to Average Net Assets: | Supplemental Data: | |||||||||||||||||||||||||
| Net asset value, end of period | Total return (%)(b) | Total expenses after waivers and/or reimburse- ments (%) | Total expenses (%) | Net invest- ment income (%) | Net assets, end of period (000) | Portfolio turnover rate (%) | ||||||||||||||||||||
| $ | 11.14 | (0.30 | ) | 0.58 | 0.58 | 1.01 | $ | 646,894 | 492 | |||||||||||||||||
| 11.69 | 7.40 | 0.60 | 0.60 | 1.63 | 677,401 | 589 | ||||||||||||||||||||
| 11.10 | 9.79 | 0.64 | 0.64 | 2.30 | 492,702 | 836 | ||||||||||||||||||||
| 10.38 | (1.64 | ) | 0.62 | 0.69 | 2.36 | 405,998 | 615 | |||||||||||||||||||
| 10.87 | 2.96 | 0.66 | 0.86 | 1.70 | 460,291 | 466 | ||||||||||||||||||||
| 11.08 | (0.96 | ) | 1.22 | 1.22 | 0.38 | 29,523 | 492 | |||||||||||||||||||
| 11.63 | 6.66 | 1.22 | 1.22 | 1.01 | 49,939 | 589 | ||||||||||||||||||||
| 11.05 | 9.05 | 1.25 | 1.25 | 1.70 | 42,376 | 836 | ||||||||||||||||||||
| 10.34 | (2.18 | ) | 1.25 | 1.32 | 1.72 | 41,820 | 615 | |||||||||||||||||||
| 10.82 | 2.33 | 1.28 | 1.48 | 1.07 | 66,387 | 466 | ||||||||||||||||||||
| 11.13 | (0.21 | ) | 0.48 | 0.48 | 1.11 | 342,050 | 492 | |||||||||||||||||||
| 11.68 | 7.41 | 0.49 | 0.49 | 1.70 | 371,706 | 589 | ||||||||||||||||||||
| 11.10 | 9.89 | 0.54 | 0.54 | 2.37 | 214,720 | 836 | ||||||||||||||||||||
| 10.38 | (1.54 | ) | 0.52 | 0.60 | 2.43 | 128,716 | 615 | |||||||||||||||||||
| 10.87 | 3.07 | 0.55 | 0.75 | 1.78 | 196,037 | 466 | ||||||||||||||||||||
| 11.13 | (0.12 | ) | 0.30 | 0.30 | 1.28 | 442,421 | 492 | |||||||||||||||||||
| 11.69 | 7.69 | 0.32 | 0.32 | 1.90 | 399,915 | 589 | ||||||||||||||||||||
| 11.10 | 10.09 | 0.35 | 0.35 | 2.58 | 307,972 | 836 | ||||||||||||||||||||
| 10.38 | (1.38 | ) | 0.34 | 0.41 | 2.63 | 237,638 | 615 | |||||||||||||||||||
| 10.87 | 1.99 | (d) | 0.35 | (e) | 0.55 | (e) | 2.14 | (e) | 300,983 | 466 | ||||||||||||||||
| 11.13 | (0.07 | ) | 0.34 | 0.38 | 1.25 | 534,313 | 492 | |||||||||||||||||||
| 11.68 | 7.56 | 0.35 | 0.39 | 1.87 | 493,395 | 589 | ||||||||||||||||||||
| 11.10 | 10.04 | 0.40 | 0.44 | 2.50 | 364,812 | 836 | ||||||||||||||||||||
| 10.38 | (1.33 | ) | 0.39 | 0.48 | 2.60 | 194,836 | 615 | |||||||||||||||||||
| 10.86 | 3.07 | 0.46 | 0.66 | 1.90 | 190,063 | 466 | ||||||||||||||||||||
| 11.14 | (0.70 | ) | 0.98 | 0.98 | 0.60 | 850 | 492 | |||||||||||||||||||
| 11.69 | 6.97 | 1.00 | 1.00 | 1.26 | 445 | 589 | ||||||||||||||||||||
| 11.10 | 9.35 | 1.04 | 1.04 | 1.93 | 532 | 836 | ||||||||||||||||||||
| 10.38 | (2.03 | ) | 1.02 | 1.10 | 1.95 | 632 | 615 | |||||||||||||||||||
| 10.87 | 2.56 | 1.06 | 1.26 | 1.28 | 951 | 466 | ||||||||||||||||||||
| See Notes to Financial Statements. | 459 |
Financial Highlights (continued)
CORE FIXED INCOME FUND
| Per Share Operating Performance: | ||||||||||||||||||||||||||||
| Investment Operations: | Distributions to shareholders from: | |||||||||||||||||||||||||||
| Net asset value, beginning of period | Net invest- ment income(a) | Net realized and unrealized gain (loss) | Total from invest- ment opera- tions | Net investment income | Net realized gain | Total distri- butions | ||||||||||||||||||||||
| Class R3 | ||||||||||||||||||||||||||||
| 11/30/2021 | $ | 11.69 | $ | 0.08 | $ | (0.15 | ) | $ | (0.07 | ) | $ | (0.11 | ) | $ | (0.37 | ) | $ | (0.48 | ) | |||||||||
| 11/30/2020 | 11.10 | 0.15 | 0.63 | 0.78 | (0.19 | ) | – | (0.19 | ) | |||||||||||||||||||
| 11/30/2019 | 10.38 | 0.22 | 0.75 | 0.97 | (0.25 | ) | – | (0.25 | ) | |||||||||||||||||||
| 11/30/2018 | 10.87 | 0.22 | (0.43 | ) | (0.21 | ) | (0.28 | ) | – | (0.28 | ) | |||||||||||||||||
| 11/30/2017 | 10.80 | 0.15 | 0.14 | 0.29 | (0.22 | ) | – | (0.22 | ) | |||||||||||||||||||
| Class R4 | ||||||||||||||||||||||||||||
| 11/30/2021 | 11.68 | 0.11 | (0.15 | ) | (0.04 | ) | (0.14 | ) | (0.37 | ) | (0.51 | ) | ||||||||||||||||
| 11/30/2020 | 11.10 | 0.18 | 0.62 | 0.80 | (0.22 | ) | – | (0.22 | ) | |||||||||||||||||||
| 11/30/2019 | 10.38 | 0.24 | 0.76 | 1.00 | (0.28 | ) | – | (0.28 | ) | |||||||||||||||||||
| 11/30/2018 | 10.87 | 0.25 | (0.43 | ) | (0.18 | ) | (0.31 | ) | – | (0.31 | ) | |||||||||||||||||
| 11/30/2017 | 10.80 | 0.18 | 0.13 | 0.31 | (0.24 | ) | – | (0.24 | ) | |||||||||||||||||||
| Class R5 | ||||||||||||||||||||||||||||
| 11/30/2021 | 11.69 | 0.13 | (0.14 | ) | (0.01 | ) | (0.17 | ) | (0.37 | ) | (0.54 | ) | ||||||||||||||||
| 11/30/2020 | 11.10 | 0.21 | 0.63 | 0.84 | (0.25 | ) | – | (0.25 | ) | |||||||||||||||||||
| 11/30/2019 | 10.38 | 0.27 | 0.76 | 1.03 | (0.31 | ) | – | (0.31 | ) | |||||||||||||||||||
| 11/30/2018 | 10.87 | 0.27 | (0.43 | ) | (0.16 | ) | (0.33 | ) | – | (0.33 | ) | |||||||||||||||||
| 11/30/2017 | 10.80 | 0.21 | 0.13 | 0.34 | (0.27 | ) | – | (0.27 | ) | |||||||||||||||||||
| Class R6 | ||||||||||||||||||||||||||||
| 11/30/2021 | 11.68 | 0.14 | (0.15 | ) | (0.01 | ) | (0.17 | ) | (0.37 | ) | (0.54 | ) | ||||||||||||||||
| 11/30/2020 | 11.10 | 0.22 | 0.62 | 0.84 | (0.26 | ) | – | (0.26 | ) | |||||||||||||||||||
| 11/30/2019 | 10.38 | 0.28 | 0.76 | 1.04 | (0.32 | ) | – | (0.32 | ) | |||||||||||||||||||
| 11/30/2018 | 10.86 | 0.28 | (0.42 | ) | (0.14 | ) | (0.34 | ) | – | (0.34 | ) | |||||||||||||||||
| 11/30/2017 | 10.80 | 0.22 | 0.12 | 0.34 | (0.28 | ) | – | (0.28 | ) | |||||||||||||||||||
| (a) | Calculated using average shares outstanding during the period. |
| (b) | Total return for Classes A and C does not consider the effects of sales loads and assumes the reinvestment of all distributions. Total return for all other classes assumes the reinvestment of all distributions. |
| (c) | Commenced on April 4, 2017. |
| (d) | Not annualized. |
| (e) | Annualized. |
| 460 | See Notes to Financial Statements. |
| Ratios to Average Net Assets: | Supplemental Data: | |||||||||||||||||||||||||
| Net asset value, end of period | Total return (%)(b) | Total expenses after waivers and/or reimburse- ments (%) | Total expenses (%) | Net invest- ment income (%) | Net assets, end of period (000) | Portfolio turnover rate (%) | ||||||||||||||||||||
| $ | 11.14 | (0.60 | ) | 0.88 | 0.88 | 0.71 | $ | 9,264 | 492 | |||||||||||||||||
| 11.69 | 7.08 | 0.90 | 0.90 | 1.35 | 11,473 | 589 | ||||||||||||||||||||
| 11.10 | 9.46 | 0.94 | 0.94 | 2.02 | 11,736 | 836 | ||||||||||||||||||||
| 10.38 | (1.94 | ) | 0.92 | 0.99 | 2.05 | 11,965 | 615 | |||||||||||||||||||
| 10.87 | 2.67 | 0.94 | 1.15 | 1.38 | 15,555 | 466 | ||||||||||||||||||||
| 11.13 | (0.36 | ) | 0.63 | 0.63 | 0.96 | 10,587 | 492 | |||||||||||||||||||
| 11.68 | 7.26 | 0.65 | 0.65 | 1.58 | 10,750 | 589 | ||||||||||||||||||||
| 11.10 | 9.73 | 0.69 | 0.69 | 2.25 | 7,553 | 836 | ||||||||||||||||||||
| 10.38 | (1.69 | ) | 0.67 | 0.73 | 2.34 | 8,196 | 615 | |||||||||||||||||||
| 10.87 | 2.92 | 0.72 | 0.92 | 1.65 | 6,544 | 466 | ||||||||||||||||||||
| 11.14 | (0.10 | ) | 0.38 | 0.38 | 1.20 | 1,443 | 492 | |||||||||||||||||||
| 11.69 | 7.61 | 0.40 | 0.40 | 1.86 | 1,053 | 589 | ||||||||||||||||||||
| 11.10 | 10.01 | 0.44 | 0.44 | 2.50 | 1,370 | 836 | ||||||||||||||||||||
| 10.38 | (1.44 | ) | 0.42 | 0.48 | 2.58 | 811 | 615 | |||||||||||||||||||
| 10.87 | 3.17 | 0.46 | 0.66 | 1.88 | 802 | 466 | ||||||||||||||||||||
| 11.13 | (0.03 | ) | 0.30 | 0.30 | 1.29 | 30,405 | 492 | |||||||||||||||||||
| 11.68 | 7.60 | 0.32 | 0.32 | 1.95 | 32,940 | 589 | ||||||||||||||||||||
| 11.10 | 10.10 | 0.35 | 0.35 | 2.60 | 42,495 | 836 | ||||||||||||||||||||
| 10.38 | (1.28 | ) | 0.34 | 0.41 | 2.65 | 42,302 | 615 | |||||||||||||||||||
| 10.86 | 3.19 | 0.34 | 0.54 | 1.99 | 41,952 | 466 | ||||||||||||||||||||
| See Notes to Financial Statements. | 461 |
Financial Highlights (continued)
CORE PLUS BOND FUND
| Per Share Operating Performance: | ||||||||||||||||||||||||||||
| Investment Operations: | Distributions to shareholders from: | |||||||||||||||||||||||||||
| Net asset value, beginning of period | Net invest- ment income(a) | Net realized and unrealized gain (loss) | Total from invest- ment opera- tions | Net investment income | Net realized gain | Total distri- butions | ||||||||||||||||||||||
| Class A | ||||||||||||||||||||||||||||
| 11/30/2021 | $ | 15.78 | $ | 0.33 | $ | (0.14 | ) | $ | 0.19 | $ | (0.42 | ) | $ | (0.17 | ) | $ | (0.59 | ) | ||||||||||
| 11/30/2020 | 15.39 | 0.38 | 0.61 | 0.99 | (0.50 | ) | (0.10 | ) | (0.60 | ) | ||||||||||||||||||
| 11/30/2019 | 14.41 | 0.42 | 1.06 | 1.48 | (0.50 | ) | – | (0.50 | ) | |||||||||||||||||||
| 11/30/2018 | 15.14 | 0.47 | (0.64 | ) | (0.17 | ) | (0.56 | ) | – | (0.56 | ) | |||||||||||||||||
| 11/30/2017 | 15.03 | 0.40 | 0.30 | 0.70 | (0.49 | ) | (0.10 | ) | (0.59 | ) | ||||||||||||||||||
| Class C | ||||||||||||||||||||||||||||
| 11/30/2021 | 15.78 | 0.23 | (0.14 | ) | 0.09 | (0.32 | ) | (0.17 | ) | (0.49 | ) | |||||||||||||||||
| 11/30/2020 | 15.39 | 0.27 | 0.61 | 0.88 | (0.39 | ) | (0.10 | ) | (0.49 | ) | ||||||||||||||||||
| 11/30/2019 | 14.42 | 0.31 | 1.06 | 1.37 | (0.40 | ) | – | (0.40 | ) | |||||||||||||||||||
| 11/30/2018 | 15.15 | 0.37 | (0.64 | ) | (0.27 | ) | (0.46 | ) | – | (0.46 | ) | |||||||||||||||||
| 11/30/2017 | 15.04 | 0.30 | 0.29 | 0.59 | (0.38 | ) | (0.10 | ) | (0.48 | ) | ||||||||||||||||||
| Class F | ||||||||||||||||||||||||||||
| 11/30/2021 | 15.76 | 0.34 | (0.14 | ) | 0.20 | (0.43 | ) | (0.17 | ) | (0.60 | ) | |||||||||||||||||
| 11/30/2020 | 15.38 | 0.39 | 0.60 | 0.99 | (0.51 | ) | (0.10 | ) | (0.61 | ) | ||||||||||||||||||
| 11/30/2019 | 14.41 | 0.41 | 1.07 | 1.48 | (0.51 | ) | – | (0.51 | ) | |||||||||||||||||||
| 11/30/2018 | 15.14 | 0.48 | (0.64 | ) | (0.16 | ) | (0.57 | ) | – | (0.57 | ) | |||||||||||||||||
| 11/30/2017 | 15.03 | 0.42 | 0.30 | 0.72 | (0.51 | ) | (0.10 | ) | (0.61 | ) | ||||||||||||||||||
| Class F3 | ||||||||||||||||||||||||||||
| 11/30/2021 | 15.77 | 0.36 | (0.13 | ) | 0.23 | (0.46 | ) | (0.17 | ) | (0.63 | ) | |||||||||||||||||
| 11/30/2020 | 15.40 | 0.42 | 0.59 | 1.01 | (0.54 | ) | (0.10 | ) | (0.64 | ) | ||||||||||||||||||
| 11/30/2019 | 14.42 | 0.47 | 1.04 | 1.51 | (0.53 | ) | – | (0.53 | ) | |||||||||||||||||||
| 11/30/2018 | 15.15 | 0.52 | (0.65 | ) | (0.13 | ) | (0.60 | ) | – | (0.60 | ) | |||||||||||||||||
| 4/4/2017 to 11/30/2017(c) | 15.08 | 0.30 | 0.12 | 0.42 | (0.35 | ) | – | (0.35 | ) | |||||||||||||||||||
| Class I | ||||||||||||||||||||||||||||
| 11/30/2021 | 15.77 | 0.37 | (0.15 | ) | 0.22 | (0.45 | ) | (0.17 | ) | (0.62 | ) | |||||||||||||||||
| 11/30/2020 | 15.39 | 0.41 | 0.60 | 1.01 | (0.53 | ) | (0.10 | ) | (0.63 | ) | ||||||||||||||||||
| 11/30/2019 | 14.41 | 0.40 | 1.11 | 1.51 | (0.53 | ) | – | (0.53 | ) | |||||||||||||||||||
| 11/30/2018 | 15.14 | 0.50 | (0.64 | ) | (0.14 | ) | (0.59 | ) | – | (0.59 | ) | |||||||||||||||||
| 11/30/2017 | 15.03 | 0.43 | 0.30 | 0.73 | (0.52 | ) | (0.10 | ) | (0.62 | ) | ||||||||||||||||||
| Class R3 | ||||||||||||||||||||||||||||
| 11/30/2021 | 15.77 | 0.28 | (0.14 | ) | 0.14 | (0.37 | ) | (0.17 | ) | (0.54 | ) | |||||||||||||||||
| 11/30/2020 | 15.39 | 0.34 | 0.59 | 0.93 | (0.45 | ) | (0.10 | ) | (0.55 | ) | ||||||||||||||||||
| 11/30/2019 | 14.41 | 0.37 | 1.07 | 1.44 | (0.46 | ) | – | (0.46 | ) | |||||||||||||||||||
| 11/30/2018 | 15.13 | 0.43 | (0.64 | ) | (0.21 | ) | (0.51 | ) | – | (0.51 | ) | |||||||||||||||||
| 11/30/2017 | 15.03 | 0.36 | 0.29 | 0.65 | (0.45 | ) | (0.10 | ) | (0.55 | ) | ||||||||||||||||||
| 462 | See Notes to Financial Statements. |
| Ratios to Average Net Assets: | Supplemental Data: | |||||||||||||||||||||||||
| Net asset value, end of period | Total return (%)(b) | Total expenses after waivers and/or reimburse- ments (%) | Total expenses (%) | Net invest- ment income (%) | Net assets, end of period (000) | Portfolio turnover rate (%) | ||||||||||||||||||||
| $ | 15.38 | 1.23 | 0.68 | 0.73 | 2.12 | $ | 76,162 | 258 | ||||||||||||||||||
| 15.78 | 6.57 | 0.68 | 0.80 | 2.46 | 57,837 | 443 | ||||||||||||||||||||
| 15.39 | 10.39 | 0.68 | 1.12 | 2.74 | 24,429 | 598 | ||||||||||||||||||||
| 14.41 | (1.16 | ) | 0.68 | 2.45 | 3.18 | 6,283 | 468 | |||||||||||||||||||
| 15.14 | 4.73 | 0.68 | 2.68 | 2.66 | 6,390 | 396 | ||||||||||||||||||||
| 15.38 | 0.57 | 1.33 | 1.38 | 1.50 | 5,550 | 258 | ||||||||||||||||||||
| 15.78 | 5.83 | 1.38 | 1.50 | 1.77 | 5,846 | 443 | ||||||||||||||||||||
| 15.39 | 9.63 | 1.32 | 1.70 | 2.03 | 3,992 | 598 | ||||||||||||||||||||
| 14.42 | (1.83 | ) | 1.36 | 3.12 | 2.51 | 603 | 468 | |||||||||||||||||||
| 15.15 | 3.98 | 1.40 | 3.41 | 1.95 | 613 | 396 | ||||||||||||||||||||
| 15.36 | 1.32 | 0.58 | 0.62 | 2.18 | 274,812 | 258 | ||||||||||||||||||||
| 15.76 | 6.61 | 0.58 | 0.70 | 2.56 | 181,474 | 443 | ||||||||||||||||||||
| 15.38 | 10.41 | 0.58 | 0.89 | 2.71 | 157,901 | 598 | ||||||||||||||||||||
| 14.41 | (1.07 | ) | 0.58 | 2.35 | 3.28 | 5,774 | 468 | |||||||||||||||||||
| 15.14 | 4.83 | 0.58 | 2.58 | 2.76 | 6,010 | 396 | ||||||||||||||||||||
| 15.37 | 1.51 | 0.38 | 0.43 | 2.32 | 34,554 | 258 | ||||||||||||||||||||
| 15.77 | 6.69 | 0.39 | 0.50 | 2.74 | 8,558 | 443 | ||||||||||||||||||||
| 15.40 | 10.63 | 0.46 | 0.98 | 3.11 | 11 | 598 | ||||||||||||||||||||
| 14.42 | (0.83 | ) | 0.43 | 2.12 | 3.46 | 10 | 468 | |||||||||||||||||||
| 15.15 | 2.71 | (d) | 0.39 | (e) | 2.66 | (e) | 3.01 | (e) | 10 | 396 | ||||||||||||||||
| 15.37 | 1.42 | 0.48 | 0.54 | 2.40 | 13,423 | 258 | ||||||||||||||||||||
| 15.77 | 6.71 | 0.48 | 0.61 | 2.66 | 35,271 | 443 | ||||||||||||||||||||
| 15.39 | 10.61 | 0.47 | 0.70 | 2.62 | 13,782 | 598 | ||||||||||||||||||||
| 14.41 | (0.95 | ) | 0.47 | 2.25 | 3.40 | 108 | 468 | |||||||||||||||||||
| 15.14 | 4.94 | 0.48 | 2.48 | 2.86 | 109 | 396 | ||||||||||||||||||||
| 15.37 | 0.93 | 0.98 | 1.03 | 1.84 | 159 | 258 | ||||||||||||||||||||
| 15.77 | 6.19 | 0.98 | 1.09 | 2.19 | 124 | 443 | ||||||||||||||||||||
| 15.39 | 10.09 | 0.95 | 1.47 | 2.43 | 188 | 598 | ||||||||||||||||||||
| 14.41 | (1.45 | ) | 0.97 | 2.75 | 2.88 | 27 | 468 | |||||||||||||||||||
| 15.13 | 4.42 | 0.98 | 2.97 | 2.35 | 27 | 396 | ||||||||||||||||||||
| See Notes to Financial Statements. | 463 |
Financial Highlights (continued)
CORE PLUS BOND FUND
| Per Share Operating Performance: | ||||||||||||||||||||||||||||
| Investment Operations: | Distributions to shareholders from: | |||||||||||||||||||||||||||
| Net asset value, beginning of period | Net invest- ment income(a) | Net realized and unrealized gain (loss) | Total from invest- ment opera- tions | Net investment income | Net realized gain | Total distri- butions | ||||||||||||||||||||||
| Class R4 | ||||||||||||||||||||||||||||
| 11/30/2021 | $ | 15.77 | $ | 0.32 | $ | (0.14 | ) | $ | 0.18 | $ | (0.41 | ) | $ | (0.17 | ) | $ | (0.58 | ) | ||||||||||
| 11/30/2020 | 15.39 | 0.37 | 0.60 | 0.97 | (0.49 | ) | (0.10 | ) | (0.59 | ) | ||||||||||||||||||
| 11/30/2019 | 14.41 | 0.43 | 1.04 | 1.47 | (0.49 | ) | – | (0.49 | ) | |||||||||||||||||||
| 11/30/2018 | 15.14 | 0.46 | (0.64 | ) | (0.18 | ) | (0.55 | ) | – | (0.55 | ) | |||||||||||||||||
| 11/30/2017 | 15.03 | 0.40 | 0.29 | 0.69 | (0.48 | ) | (0.10 | ) | (0.58 | ) | ||||||||||||||||||
| Class R5 | ||||||||||||||||||||||||||||
| 11/30/2021 | 15.77 | 0.36 | (0.13 | ) | 0.23 | (0.45 | ) | (0.17 | ) | (0.62 | ) | |||||||||||||||||
| 11/30/2020 | 15.39 | 0.41 | 0.60 | 1.01 | (0.53 | ) | (0.10 | ) | (0.63 | ) | ||||||||||||||||||
| 11/30/2019 | 14.41 | 0.47 | 1.04 | 1.51 | (0.53 | ) | – | (0.53 | ) | |||||||||||||||||||
| 11/30/2018 | 15.14 | 0.50 | (0.64 | ) | (0.14 | ) | (0.59 | ) | – | (0.59 | ) | |||||||||||||||||
| 11/30/2017 | 15.03 | 0.43 | 0.30 | 0.73 | (0.52 | ) | (0.10 | ) | (0.62 | ) | ||||||||||||||||||
| Class R6 | ||||||||||||||||||||||||||||
| 11/30/2021 | 15.78 | 0.38 | (0.14 | ) | 0.24 | (0.47 | ) | (0.17 | ) | (0.64 | ) | |||||||||||||||||
| 11/30/2020 | 15.39 | 0.43 | 0.60 | 1.03 | (0.54 | ) | (0.10 | ) | (0.64 | ) | ||||||||||||||||||
| 11/30/2019 | 14.41 | 0.47 | 1.04 | 1.51 | (0.53 | ) | – | (0.53 | ) | |||||||||||||||||||
| 11/30/2018 | 15.14 | 0.50 | (0.64 | ) | (0.14 | ) | (0.59 | ) | – | (0.59 | ) | |||||||||||||||||
| 11/30/2017 | 15.03 | 0.45 | 0.30 | 0.75 | (0.54 | ) | (0.10 | ) | (0.64 | ) | ||||||||||||||||||
| (a) | Calculated using average shares outstanding during the period. |
| (b) | Total return for Classes A and C does not consider the effects of sales loads and assumes the reinvestment of all distributions. Total return for all other classes assumes the reinvestment of all distributions. |
| (c) | Commenced on April 4, 2017. |
| (d) | Not annualized. |
| (e) | Annualized. |
| 464 | See Notes to Financial Statements. |
| Ratios to Average Net Assets: | Supplemental Data: | |||||||||||||||||||||||||
| Net asset value, end of period | Total return (%)(b) | Total expenses after waivers and/or reimburse- ments (%) | Total expenses (%) | Net invest- ment income (%) | Net assets, end of period (000) | Portfolio turnover rate (%) | ||||||||||||||||||||
| $ | 15.37 | 1.18 | 0.73 | 0.77 | 2.06 | $ | 379 | 258 | ||||||||||||||||||
| 15.77 | 6.45 | 0.73 | 0.86 | 2.39 | 266 | 443 | ||||||||||||||||||||
| 15.39 | 10.35 | 0.73 | 1.31 | �� | 2.84 | 30 | 598 | |||||||||||||||||||
| 14.41 | (1.21 | ) | 0.72 | 2.50 | 3.13 | 27 | 468 | |||||||||||||||||||
| 15.14 | 4.68 | 0.74 | 2.73 | 2.58 | 27 | 396 | ||||||||||||||||||||
| 15.38 | 1.49 | 0.48 | 0.50 | 2.35 | 11 | 258 | ||||||||||||||||||||
| 15.77 | 6.72 | 0.48 | 0.57 | 2.69 | 12 | 443 | ||||||||||||||||||||
| 15.39 | 10.63 | 0.48 | 1.06 | 3.10 | 30 | 598 | ||||||||||||||||||||
| 14.41 | (0.97 | ) | 0.47 | 2.25 | 3.38 | 27 | 468 | |||||||||||||||||||
| 15.14 | 4.94 | 0.48 | 2.48 | 2.84 | 27 | 396 | ||||||||||||||||||||
| 15.38 | 1.53 | 0.38 | 0.44 | 2.44 | 1,061 | 258 | ||||||||||||||||||||
| 15.78 | 6.86 | 0.39 | 0.51 | 2.78 | 918 | 443 | ||||||||||||||||||||
| 15.39 | 10.65 | 0.46 | 1.00 | 3.11 | 30 | 598 | ||||||||||||||||||||
| 14.41 | (0.93 | ) | 0.44 | 2.24 | 3.42 | 27 | 468 | |||||||||||||||||||
| 15.14 | 5.05 | 0.37 | 2.47 | 2.95 | 27 | 396 | ||||||||||||||||||||
| See Notes to Financial Statements. | 465 |
Financial Highlights (continued)
CORPORATE BOND FUND
| Per Share Operating Performance: | ||||||||||||||||||||||||||||
| Investment Operations: | Distributions to shareholders from: | |||||||||||||||||||||||||||
| Net asset value, beginning of period | Net invest- ment income(a) | Net realized and unrealized gain (loss) | Total from invest- ment opera- tions | Net investment income | Net realized gain | Total distri- butions | ||||||||||||||||||||||
| Class A | ||||||||||||||||||||||||||||
| 11/30/2021 | $ | 10.78 | $ | 0.21 | $ | (0.11 | ) | $ | 0.10 | $ | (0.31 | ) | $ | (0.18 | ) | $ | (0.49 | ) | ||||||||||
| 11/30/2020 | 10.23 | 0.26 | 0.64 | 0.90 | (0.35 | ) | – | (0.35 | ) | |||||||||||||||||||
| 11/30/2019 | 9.32 | 0.31 | 0.99 | 1.30 | (0.39 | ) | – | (0.39 | ) | |||||||||||||||||||
| 11/30/2018 | 10.06 | 0.31 | (0.64 | ) | (0.33 | ) | (0.40 | ) | (0.01 | ) | (0.41 | ) | ||||||||||||||||
| 4/19/2017 to 11/30/2017(c) | 10.00 | 0.17 | 0.13 | 0.30 | (0.24 | ) | – | (0.24 | ) | |||||||||||||||||||
| Class C | ||||||||||||||||||||||||||||
| 11/30/2021 | 10.77 | 0.15 | (0.12 | ) | 0.03 | (0.24 | ) | (0.18 | ) | (0.42 | ) | |||||||||||||||||
| 11/30/2020 | 10.23 | 0.20 | 0.62 | 0.82 | (0.28 | ) | – | (0.28 | ) | |||||||||||||||||||
| 11/30/2019 | 9.32 | 0.24 | 0.99 | 1.23 | (0.32 | ) | – | (0.32 | ) | |||||||||||||||||||
| 11/30/2018 | 10.06 | 0.23 | (0.63 | ) | (0.40 | ) | (0.33 | ) | (0.01 | ) | (0.34 | ) | ||||||||||||||||
| 4/19/2017 to 11/30/2017(c) | 10.00 | 0.13 | 0.12 | 0.25 | (0.19 | ) | – | (0.19 | ) | |||||||||||||||||||
| Class F | ||||||||||||||||||||||||||||
| 11/30/2021 | 10.79 | 0.23 | (0.12 | ) | 0.11 | (0.32 | ) | (0.18 | ) | (0.50 | ) | |||||||||||||||||
| 11/30/2020 | 10.25 | 0.27 | 0.63 | 0.90 | (0.36 | ) | – | (0.36 | ) | |||||||||||||||||||
| 11/30/2019 | 9.34 | 0.32 | 0.99 | 1.31 | (0.40 | ) | – | (0.40 | ) | |||||||||||||||||||
| 11/30/2018 | 10.08 | 0.31 | (0.63 | ) | (0.32 | ) | (0.41 | ) | (0.01 | ) | (0.42 | ) | ||||||||||||||||
| 4/19/2017 to 11/30/2017(c) | 10.00 | 0.18 | 0.14 | 0.32 | (0.24 | ) | – | (0.24 | ) | |||||||||||||||||||
| Class F3 | ||||||||||||||||||||||||||||
| 11/30/2021 | 10.78 | 0.24 | (0.11 | ) | 0.13 | (0.34 | ) | (0.18 | ) | (0.52 | ) | |||||||||||||||||
| 11/30/2020 | 10.23 | 0.30 | 0.62 | 0.92 | (0.37 | ) | – | (0.37 | ) | |||||||||||||||||||
| 11/30/2019 | 9.32 | 0.34 | 0.98 | 1.32 | (0.41 | ) | – | (0.41 | ) | |||||||||||||||||||
| 11/30/2018 | 10.06 | 0.34 | (0.64 | ) | (0.30 | ) | (0.43 | ) | (0.01 | ) | (0.44 | ) | ||||||||||||||||
| 4/19/2017 to 11/30/2017(c) | 10.00 | 0.19 | 0.13 | 0.32 | (0.26 | ) | – | (0.26 | ) | |||||||||||||||||||
| Class I | ||||||||||||||||||||||||||||
| 11/30/2021 | 10.77 | 0.24 | (0.12 | ) | 0.12 | (0.33 | ) | (0.18 | ) | (0.51 | ) | |||||||||||||||||
| 11/30/2020 | 10.23 | 0.30 | 0.61 | 0.91 | (0.37 | ) | – | (0.37 | ) | |||||||||||||||||||
| 11/30/2019 | 9.32 | 0.33 | 0.98 | 1.31 | (0.40 | ) | – | (0.40 | ) | |||||||||||||||||||
| 11/30/2018 | 10.06 | 0.32 | (0.63 | ) | (0.31 | ) | (0.42 | ) | (0.01 | ) | (0.43 | ) | ||||||||||||||||
| 4/19/2017 to 11/30/2017(c) | 10.00 | 0.19 | 0.12 | 0.31 | (0.25 | ) | – | (0.25 | ) | |||||||||||||||||||
| Class R2 | ||||||||||||||||||||||||||||
| 11/30/2021 | 10.77 | 0.18 | (0.11 | ) | 0.07 | (0.27 | ) | (0.18 | ) | (0.45 | ) | |||||||||||||||||
| 11/30/2020 | 10.23 | 0.23 | 0.62 | 0.85 | (0.31 | ) | – | (0.31 | ) | |||||||||||||||||||
| 11/30/2019 | 9.32 | 0.27 | 0.99 | 1.26 | (0.35 | ) | – | (0.35 | ) | |||||||||||||||||||
| 11/30/2018 | 10.06 | 0.27 | (0.64 | ) | (0.37 | ) | (0.36 | ) | (0.01 | ) | (0.37 | ) | ||||||||||||||||
| 4/19/2017 to 11/30/2017(c) | 10.00 | 0.15 | 0.12 | 0.27 | (0.21 | ) | – | (0.21 | ) | |||||||||||||||||||
| 466 | See Notes to Financial Statements. |
| Ratios to Average Net Assets: | Supplemental Data: | |||||||||||||||||||||||||
| Net asset value, end of period | Total return (%)(b) | Total expenses after waivers and/or reimburse- ments (%) | Total expenses (%) | Net invest- ment income (%) | Net assets, end of period (000) | Portfolio turnover rate (%) | ||||||||||||||||||||
| $ | 10.39 | 0.95 | 0.68 | 2.67 | 2.06 | $ | 2,547 | 111 | ||||||||||||||||||
| 10.78 | 8.95 | 0.68 | 3.24 | 2.53 | 2,157 | 119 | ||||||||||||||||||||
| 10.23 | 14.12 | 0.68 | 4.25 | 3.12 | 769 | 54 | ||||||||||||||||||||
| 9.32 | (3.36 | ) | 0.68 | 4.54 | 3.17 | 368 | 109 | |||||||||||||||||||
| 10.06 | 3.01 | (d) | 0.68 | (e) | 3.99 | (e) | 2.80 | (e) | 311 | 88 | ||||||||||||||||
| 10.38 | 0.29 | 1.35 | 3.35 | 1.43 | 547 | 111 | ||||||||||||||||||||
| 10.77 | 8.12 | 1.36 | 4.13 | 1.96 | 791 | 119 | ||||||||||||||||||||
| 10.23 | 13.38 | 1.33 | 4.78 | 2.43 | 597 | 54 | ||||||||||||||||||||
| 9.32 | (4.07 | ) | 1.43 | 5.17 | 2.39 | 71 | 109 | |||||||||||||||||||
| 10.06 | 2.52 | (d) | 1.48 | (e) | 4.75 | (e) | 2.02 | (e) | 102 | 88 | ||||||||||||||||
| 10.40 | 1.06 | 0.58 | 2.58 | 2.17 | 4,660 | 111 | ||||||||||||||||||||
| 10.79 | 8.95 | 0.58 | 3.17 | 2.64 | 3,991 | 119 | ||||||||||||||||||||
| 10.25 | 14.20 | 0.58 | 4.20 | 3.22 | 2,764 | 54 | ||||||||||||||||||||
| 9.34 | (3.26 | ) | 0.58 | 4.20 | 3.21 | 1,501 | 109 | |||||||||||||||||||
| 10.08 | 3.27 | (d) | 0.58 | (e) | 3.82 | (e) | 2.89 | (e) | 2,614 | 88 | ||||||||||||||||
| 10.39 | 1.20 | 0.44 | 2.45 | 2.32 | 1,770 | 111 | ||||||||||||||||||||
| 10.78 | 9.22 | 0.45 | 3.21 | 2.88 | 1,837 | 119 | ||||||||||||||||||||
| 10.23 | 14.42 | 0.41 | 4.15 | 3.42 | 1,718 | 54 | ||||||||||||||||||||
| 9.32 | (3.07 | ) | 0.37 | 4.28 | 3.46 | 1,501 | 109 | |||||||||||||||||||
| 10.06 | 3.20 | (d) | 0.38 | (e) | 3.67 | (e) | 3.10 | (e) | 1,548 | 88 | ||||||||||||||||
| 10.38 | 1.16 | 0.48 | 2.48 | 2.28 | 146 | 111 | ||||||||||||||||||||
| 10.77 | 9.08 | 0.48 | 3.33 | 2.88 | 134 | 119 | ||||||||||||||||||||
| 10.23 | 14.34 | 0.48 | 4.17 | 3.35 | 171 | 54 | ||||||||||||||||||||
| 9.32 | (3.19 | ) | 0.48 | 4.16 | 3.30 | 144 | 109 | |||||||||||||||||||
| 10.06 | 3.13 | (d) | 0.48 | (e) | 3.78 | (e) | 3.00 | (e) | 52 | 88 | ||||||||||||||||
| 10.39 | 0.65 | 1.08 | 3.08 | 1.68 | 29 | 111 | ||||||||||||||||||||
| 10.77 | 8.43 | 1.08 | 3.84 | 2.24 | 30 | 119 | ||||||||||||||||||||
| 10.23 | 13.66 | 1.08 | 4.78 | 2.74 | 28 | 54 | ||||||||||||||||||||
| 9.32 | (3.75 | ) | 1.08 | 4.92 | 2.76 | 25 | 109 | |||||||||||||||||||
| 10.06 | 2.76 | (d) | 1.08 | (e) | 4.38 | (e) | 2.40 | (e) | 26 | 88 | ||||||||||||||||
| See Notes to Financial Statements. | 467 |
Financial Highlights (continued)
CORPORATE BOND FUND
| Per Share Operating Performance: | ||||||||||||||||||||||||||||
| Investment Operations: | Distributions to shareholders from: | |||||||||||||||||||||||||||
| Net asset value, beginning of period | Net invest- ment income(a) | Net realized and unrealized gain (loss) | Total from invest- ment opera- tions | Net investment income | Net realized gain | Total distri- butions | ||||||||||||||||||||||
| Class R3 | ||||||||||||||||||||||||||||
| 11/30/2021 | $ | 10.77 | $ | 0.19 | $ | (0.12 | ) | $ | 0.07 | $ | (0.28 | ) | $ | (0.18 | ) | $ | (0.46 | ) | ||||||||||
| 11/30/2020 | 10.23 | 0.24 | 0.62 | 0.86 | (0.32 | ) | – | (0.32 | ) | |||||||||||||||||||
| 11/30/2019 | 9.32 | 0.28 | 0.99 | 1.27 | (0.36 | ) | – | (0.36 | ) | |||||||||||||||||||
| 11/30/2018 | 10.06 | 0.28 | (0.64 | ) | (0.36 | ) | (0.37 | ) | (0.01 | ) | (0.38 | ) | ||||||||||||||||
| 4/19/2017 to 11/30/2017(c) | 10.00 | 0.15 | 0.13 | 0.28 | (0.22 | ) | – | (0.22 | ) | |||||||||||||||||||
| Class R4 | ||||||||||||||||||||||||||||
| 11/30/2021 | 10.78 | 0.21 | (0.11 | ) | 0.10 | (0.31 | ) | (0.18 | ) | (0.49 | ) | |||||||||||||||||
| 11/30/2020 | 10.23 | 0.27 | 0.62 | 0.89 | (0.34 | ) | – | (0.34 | ) | |||||||||||||||||||
| 11/30/2019 | 9.32 | 0.30 | 0.99 | 1.29 | (0.38 | ) | – | (0.38 | ) | |||||||||||||||||||
| 11/30/2018 | 10.06 | 0.30 | (0.63 | ) | (0.33 | ) | (0.40 | ) | (0.01 | ) | (0.41 | ) | ||||||||||||||||
| 4/19/2017 to 11/30/2017(c) | 10.00 | 0.17 | 0.13 | 0.30 | (0.24 | ) | – | (0.24 | ) | |||||||||||||||||||
| Class R5 | ||||||||||||||||||||||||||||
| 11/30/2021 | 10.78 | 0.24 | (0.12 | ) | 0.12 | (0.33 | ) | (0.18 | ) | (0.51 | ) | |||||||||||||||||
| 11/30/2020 | 10.24 | 0.29 | 0.62 | 0.91 | (0.37 | ) | – | (0.37 | ) | |||||||||||||||||||
| 11/30/2019 | 9.32 | 0.33 | 0.99 | 1.32 | (0.40 | ) | – | (0.40 | ) | |||||||||||||||||||
| 11/30/2018 | 10.06 | 0.33 | (0.64 | ) | (0.31 | ) | (0.42 | ) | (0.01 | ) | (0.43 | ) | ||||||||||||||||
| 4/19/2017 to 11/30/2017(c) | 10.00 | 0.19 | 0.12 | 0.31 | (0.25 | ) | – | (0.25 | ) | |||||||||||||||||||
| Class R6 | ||||||||||||||||||||||||||||
| 11/30/2021 | 10.78 | 0.24 | (0.11 | ) | 0.13 | (0.34 | ) | (0.18 | ) | (0.52 | ) | |||||||||||||||||
| 11/30/2020 | 10.23 | 0.30 | 0.62 | 0.92 | (0.37 | ) | – | (0.37 | ) | |||||||||||||||||||
| 11/30/2019 | 9.32 | 0.34 | 0.98 | 1.32 | (0.41 | ) | – | (0.41 | ) | |||||||||||||||||||
| 11/30/2018 | 10.06 | 0.34 | (0.64 | ) | (0.30 | ) | (0.43 | ) | (0.01 | ) | (0.44 | ) | ||||||||||||||||
| 4/19/2017 to 11/30/2017(c) | 10.00 | 0.19 | 0.13 | 0.32 | (0.26 | ) | – | (0.26 | ) | |||||||||||||||||||
| (a) | Calculated using average shares outstanding during the period. |
| (b) | Total return for Classes A and C does not consider the effects of sales loads and assumes the reinvestment of all distributions. Total return for all other classes assumes the reinvestment of all distributions. |
| (c) | Commenced on April 19, 2017. |
| (d) | Not annualized. |
| (e) | Annualized. |
| 468 | See Notes to Financial Statements. |
| Ratios to Average Net Assets: | Supplemental Data: | |||||||||||||||||||||||||
| Net asset value, end of period | Total return (%)(b) | Total expenses after waivers and/or reimburse- ments (%) | Total expenses (%) | Net invest- ment income (%) | Net assets, end of period (000) | Portfolio turnover rate (%) | ||||||||||||||||||||
| $ | 10.38 | 0.65 | 0.98 | 2.98 | 1.78 | $ | 69 | 111 | ||||||||||||||||||
| 10.77 | 8.54 | 0.98 | 3.75 | 2.34 | 59 | 119 | ||||||||||||||||||||
| 10.23 | 13.77 | 0.98 | 4.68 | 2.85 | 54 | 54 | ||||||||||||||||||||
| 9.32 | (3.65 | ) | 0.98 | 4.87 | 2.87 | 47 | 109 | |||||||||||||||||||
| 10.06 | 2.82 | (d) | 0.97 | (e) | 4.20 | (e) | 2.49 | (e) | 39 | 88 | ||||||||||||||||
| 10.39 | 0.91 | 0.73 | 2.73 | 2.04 | 29 | 111 | ||||||||||||||||||||
| 10.78 | 8.91 | 0.73 | 3.49 | 2.59 | 30 | 119 | ||||||||||||||||||||
| 10.23 | 14.06 | 0.73 | 4.42 | 3.09 | 28 | 54 | ||||||||||||||||||||
| 9.32 | (3.41 | ) | 0.73 | 4.56 | 3.11 | 25 | 109 | |||||||||||||||||||
| 10.06 | 2.98 | (d) | 0.73 | (e) | 4.00 | (e) | 2.74 | (e) | 26 | 88 | ||||||||||||||||
| 10.39 | 1.16 | 0.48 | 2.48 | 2.28 | 29 | 111 | ||||||||||||||||||||
| 10.78 | 9.07 | 0.48 | 3.25 | 2.84 | 31 | 119 | ||||||||||||||||||||
| 10.24 | 14.45 | 0.48 | 4.17 | 3.34 | 29 | 54 | ||||||||||||||||||||
| 9.32 | (3.17 | ) | 0.48 | 4.32 | 3.36 | 25 | 109 | |||||||||||||||||||
| 10.06 | 3.14 | (d) | 0.48 | (e) | 3.79 | (e) | 2.99 | (e) | 26 | 88 | ||||||||||||||||
| 10.39 | 1.20 | 0.44 | 2.45 | 2.32 | 1,804 | 111 | ||||||||||||||||||||
| 10.78 | 9.22 | 0.45 | 3.21 | 2.88 | 1,864 | 119 | ||||||||||||||||||||
| 10.23 | 14.42 | 0.41 | 4.15 | 3.42 | 1,718 | 54 | ||||||||||||||||||||
| 9.32 | (3.07 | ) | 0.37 | 4.28 | 3.46 | 1,501 | 109 | |||||||||||||||||||
| 10.06 | 3.20 | (d) | 0.38 | (e) | 3.67 | (e) | 3.10 | (e) | 1,548 | 88 | ||||||||||||||||
| See Notes to Financial Statements. | 469 |
Financial Highlights (continued)
FLOATING RATE FUND
| Per Share Operating Performance: | ||||||||||||||||||||||||||||
| Investment Operations: | Distributions to shareholders from: | |||||||||||||||||||||||||||
| Net asset value, beginning of period | Net investment income(a) | Net realized and unrealized gain (loss) | Total from invest- ment opera- tions | Net invest- ment income | Return of capital | Total distri- butions | ||||||||||||||||||||||
| Class A | ||||||||||||||||||||||||||||
| 11/30/2021 | $ | 8.20 | $ | 0.33 | $ | 0.16 | $ | 0.49 | $ | (0.32 | ) | $ | – | $ | (0.32 | ) | ||||||||||||
| 11/30/2020 | 8.73 | 0.38 | (0.53 | ) | (0.15 | ) | (0.32 | ) | (0.06 | ) | (0.38 | ) | ||||||||||||||||
| 11/30/2019 | 8.97 | 0.49 | (0.24 | ) | 0.25 | (0.49 | ) | – | (0.49 | ) | ||||||||||||||||||
| 11/30/2018 | 9.18 | 0.46 | (0.21 | ) | 0.25 | (0.46 | ) | – | (0.46 | ) | ||||||||||||||||||
| 11/30/2017 | 9.17 | 0.41 | 0.01 | 0.42 | (0.41 | ) | – | (0.41 | ) | |||||||||||||||||||
| Class C | ||||||||||||||||||||||||||||
| 11/30/2021 | 8.20 | 0.27 | 0.17 | 0.44 | (0.27 | ) | – | (0.27 | ) | |||||||||||||||||||
| 11/30/2020 | 8.74 | 0.33 | (0.54 | ) | (0.21 | ) | (0.27 | ) | (0.06 | ) | (0.33 | ) | ||||||||||||||||
| 11/30/2019 | 8.98 | 0.44 | (0.24 | ) | 0.20 | (0.44 | ) | – | (0.44 | ) | ||||||||||||||||||
| 11/30/2018 | 9.18 | 0.40 | (0.20 | ) | 0.20 | (0.40 | ) | – | (0.40 | ) | ||||||||||||||||||
| 11/30/2017 | 9.17 | 0.35 | 0.01 | 0.36 | (0.35 | ) | – | (0.35 | ) | |||||||||||||||||||
| Class F | ||||||||||||||||||||||||||||
| 11/30/2021 | 8.19 | 0.33 | 0.17 | 0.50 | (0.33 | ) | – | (0.33 | ) | |||||||||||||||||||
| 11/30/2020 | 8.72 | 0.39 | (0.54 | ) | (0.15 | ) | (0.32 | ) | (0.06 | ) | (0.38 | ) | ||||||||||||||||
| 11/30/2019 | 8.96 | 0.50 | (0.24 | ) | 0.26 | (0.50 | ) | – | (0.50 | ) | ||||||||||||||||||
| 11/30/2018 | 9.17 | 0.47 | (0.21 | ) | 0.26 | (0.47 | ) | – | (0.47 | ) | ||||||||||||||||||
| 11/30/2017 | 9.16 | 0.42 | 0.01 | 0.43 | (0.42 | ) | – | (0.42 | ) | |||||||||||||||||||
| Class F3 | ||||||||||||||||||||||||||||
| 11/30/2021 | 8.21 | 0.35 | 0.17 | 0.52 | (0.35 | ) | – | (0.35 | ) | |||||||||||||||||||
| 11/30/2020 | �� | 8.75 | 0.40 | (0.54 | ) | (0.14 | ) | (0.34 | ) | (0.06 | ) | (0.40 | ) | |||||||||||||||
| 11/30/2019 | 8.98 | 0.52 | (0.23 | ) | 0.29 | (0.52 | ) | – | (0.52 | ) | ||||||||||||||||||
| 11/30/2018 | 9.19 | 0.49 | (0.22 | ) | 0.27 | (0.48 | ) | – | (0.48 | ) | ||||||||||||||||||
| 4/4/2017 to 11/30/2017(c) | 9.23 | 0.28 | (0.04 | ) | 0.24 | (0.28 | ) | – | (0.28 | ) | ||||||||||||||||||
| Class I | ||||||||||||||||||||||||||||
| 11/30/2021 | 8.20 | 0.34 | 0.17 | 0.51 | (0.34 | ) | – | (0.34 | ) | |||||||||||||||||||
| 11/30/2020 | 8.74 | 0.40 | (0.55 | ) | (0.15 | ) | (0.33 | ) | (0.06 | ) | (0.39 | ) | ||||||||||||||||
| 11/30/2019 | 8.97 | 0.51 | (0.23 | ) | 0.28 | (0.51 | ) | – | (0.51 | ) | ||||||||||||||||||
| 11/30/2018 | 9.18 | 0.48 | (0.21 | ) | 0.27 | (0.48 | ) | – | (0.48 | ) | ||||||||||||||||||
| 11/30/2017 | 9.17 | 0.42 | 0.02 | 0.44 | (0.43 | ) | – | (0.43 | ) | |||||||||||||||||||
| Class R2 | ||||||||||||||||||||||||||||
| 11/30/2021 | 8.20 | 0.29 | 0.18 | 0.47 | (0.29 | ) | – | (0.29 | ) | |||||||||||||||||||
| 11/30/2020 | 8.74 | 0.35 | (0.54 | ) | (0.19 | ) | (0.29 | ) | (0.06 | ) | (0.35 | ) | ||||||||||||||||
| 11/30/2019 | 8.98 | 0.46 | (0.24 | ) | 0.22 | (0.46 | ) | – | (0.46 | ) | ||||||||||||||||||
| 11/30/2018 | 9.19 | 0.43 | (0.22 | ) | 0.21 | (0.42 | ) | – | (0.42 | ) | ||||||||||||||||||
| 11/30/2017 | 9.18 | 0.37 | 0.01 | 0.38 | (0.37 | ) | – | (0.37 | ) | |||||||||||||||||||
| 470 | See Notes to Financial Statements. |
| Ratios to Average Net Assets: | Supplemental Data: | |||||||||||||||||||||||||
| Net asset value, end of period | Total return (%)(b) | Total expenses after waivers and/or reim- bursements (%) | Total expenses (%) | Net investment income (%) | Net assets, end of period (000) | Portfolio turnover rate (%) | ||||||||||||||||||||
| $ | 8.37 | 6.07 | 0.79 | 0.79 | 3.87 | $ | 1,981,600 | 87 | ||||||||||||||||||
| 8.20 | (1.58 | ) | 0.80 | 0.80 | 4.65 | 1,790,285 | 92 | |||||||||||||||||||
| 8.73 | 2.90 | 0.81 | 0.81 | 5.56 | 2,462,684 | 58 | ||||||||||||||||||||
| 8.97 | 2.74 | 0.79 | 0.79 | 5.05 | 3,653,385 | 68 | ||||||||||||||||||||
| 9.18 | 4.65 | 0.79 | 0.79 | 4.43 | 3,530,233 | 81 | ||||||||||||||||||||
| 8.37 | 5.42 | 1.41 | 1.41 | 3.26 | 499,850 | 87 | ||||||||||||||||||||
| 8.20 | (2.31 | ) | 1.42 | 1.42 | 4.08 | 616,741 | 92 | |||||||||||||||||||
| 8.74 | 2.37 | 1.45 | 1.45 | 4.93 | 1,141,085 | 58 | ||||||||||||||||||||
| 8.98 | 2.10 | 1.43 | 1.43 | 4.42 | 1,627,126 | 68 | ||||||||||||||||||||
| 9.18 | 3.98 | 1.44 | 1.44 | 3.80 | 1,587,964 | 81 | ||||||||||||||||||||
| 8.36 | 6.17 | 0.69 | 0.69 | 3.96 | 2,999,065 | 87 | ||||||||||||||||||||
| 8.19 | (1.50 | ) | 0.70 | 0.70 | 4.79 | 2,231,780 | 92 | |||||||||||||||||||
| 8.72 | 3.00 | 0.71 | 0.71 | 5.65 | 4,007,181 | 58 | ||||||||||||||||||||
| 8.96 | 2.84 | 0.69 | 0.69 | 5.17 | 6,725,819 | 68 | ||||||||||||||||||||
| 9.17 | 4.75 | 0.69 | 0.69 | 4.52 | 4,877,793 | 81 | ||||||||||||||||||||
| �� | ||||||||||||||||||||||||||
| 8.38 | 6.34 | 0.53 | 0.53 | 4.12 | 137,808 | 87 | ||||||||||||||||||||
| 8.21 | (1.32 | ) | 0.54 | 0.54 | 4.92 | 91,251 | 92 | |||||||||||||||||||
| 8.75 | 3.17 | 0.54 | 0.54 | 5.83 | 147,359 | 58 | ||||||||||||||||||||
| 8.98 | 3.00 | 0.53 | 0.53 | 5.29 | 277,822 | 68 | ||||||||||||||||||||
| 9.19 | 2.67 | (d) | 0.54 | (e) | 0.54 | (e) | 4.68 | (e) | 203,910 | 81 | ||||||||||||||||
| 8.37 | 6.28 | 0.59 | 0.59 | 4.06 | 1,133,927 | 87 | ||||||||||||||||||||
| 8.20 | (1.50 | ) | 0.60 | 0.60 | 4.92 | 855,140 | 92 | |||||||||||||||||||
| 8.74 | 3.22 | 0.61 | 0.61 | 5.75 | 1,475,395 | 58 | ||||||||||||||||||||
| 8.97 | 2.94 | 0.59 | 0.59 | 5.27 | 2,462,923 | 68 | ||||||||||||||||||||
| 9.18 | 4.85 | 0.60 | 0.60 | 4.61 | 1,744,687 | 81 | ||||||||||||||||||||
| 8.38 | 5.78 | 1.19 | 1.19 | 3.48 | 965 | 87 | ||||||||||||||||||||
| 8.20 | (2.09 | ) | 1.20 | 1.20 | 4.26 | 1,026 | 92 | |||||||||||||||||||
| 8.74 | 2.50 | 1.21 | 1.21 | 5.16 | 1,471 | 58 | ||||||||||||||||||||
| 8.98 | 2.35 | 1.19 | 1.19 | 4.68 | 1,579 | 68 | ||||||||||||||||||||
| 9.19 | 4.24 | 1.20 | 1.20 | 4.04 | 1,254 | 81 | ||||||||||||||||||||
| See Notes to Financial Statements. | 471 |
Financial Highlights (continued)
FLOATING RATE FUND
| Per Share Operating Performance: | ||||||||||||||||||||||||||||
| Investment Operations: | Distributions to shareholders from: | |||||||||||||||||||||||||||
| Net asset value, beginning of period | Net investment income(a) | Net realized and unrealized gain (loss) | Total from invest- ment opera tions | Net invest- ment income | Return of capital | Total distri- butions | ||||||||||||||||||||||
| Class R3 | ||||||||||||||||||||||||||||
| 11/30/2021 | $ | 8.20 | $ | 0.30 | $ | 0.17 | $ | 0.47 | $ | (0.30 | ) | $ | – | $ | (0.30 | ) | ||||||||||||
| 11/30/2020 | 8.74 | 0.35 | (0.54 | ) | (0.19 | ) | (0.29 | ) | (0.06 | ) | (0.35 | ) | ||||||||||||||||
| 11/30/2019 | 8.97 | 0.47 | (0.23 | ) | 0.24 | (0.47 | ) | – | (0.47 | ) | ||||||||||||||||||
| 11/30/2018 | 9.18 | 0.44 | (0.22 | ) | 0.22 | (0.43 | ) | – | (0.43 | ) | ||||||||||||||||||
| 11/30/2017 | 9.17 | 0.38 | 0.01 | 0.39 | (0.38 | ) | – | (0.38 | ) | |||||||||||||||||||
| Class R4 | ||||||||||||||||||||||||||||
| 11/30/2021 | 8.20 | 0.32 | 0.17 | 0.49 | (0.32 | ) | – | (0.32 | ) | |||||||||||||||||||
| 11/30/2020 | 8.73 | 0.38 | (0.54 | ) | (0.16 | ) | (0.31 | ) | (0.06 | ) | (0.37 | ) | ||||||||||||||||
| 11/30/2019 | 8.97 | 0.49 | (0.24 | ) | 0.25 | (0.49 | ) | – | (0.49 | ) | ||||||||||||||||||
| 11/30/2018 | 9.18 | 0.47 | (0.22 | ) | 0.25 | (0.46 | ) | – | (0.46 | ) | ||||||||||||||||||
| 11/30/2017 | 9.17 | 0.40 | 0.01 | 0.41 | (0.40 | ) | – | (0.40 | ) | |||||||||||||||||||
| Class R5 | ||||||||||||||||||||||||||||
| 11/30/2021 | 8.21 | 0.34 | 0.17 | 0.51 | (0.34 | ) | – | (0.34 | ) | |||||||||||||||||||
| 11/30/2020 | 8.75 | 0.40 | (0.55 | ) | (0.15 | ) | (0.33 | ) | (0.06 | ) | (0.39 | ) | ||||||||||||||||
| 11/30/2019 | 8.98 | 0.51 | (0.23 | ) | 0.28 | (0.51 | ) | – | (0.51 | ) | ||||||||||||||||||
| 11/30/2018 | 9.19 | 0.51 | (0.24 | ) | 0.27 | (0.48 | ) | – | (0.48 | ) | ||||||||||||||||||
| 11/30/2017 | 9.18 | 0.43 | 0.01 | 0.44 | (0.43 | ) | – | (0.43 | ) | |||||||||||||||||||
| Class R6 | ||||||||||||||||||||||||||||
| 11/30/2021 | 8.20 | 0.35 | 0.18 | 0.53 | (0.35 | ) | – | (0.35 | ) | |||||||||||||||||||
| 11/30/2020 | 8.74 | 0.40 | (0.54 | ) | (0.14 | ) | (0.34 | ) | (0.06 | ) | (0.40 | ) | ||||||||||||||||
| 11/30/2019 | 8.98 | 0.51 | (0.23 | ) | 0.28 | (0.52 | ) | – | (0.52 | ) | ||||||||||||||||||
| 11/30/2018 | 9.19 | 0.49 | (0.22 | ) | 0.27 | (0.48 | ) | – | (0.48 | ) | ||||||||||||||||||
| 11/30/2017 | 9.18 | 0.43 | 0.01 | 0.44 | (0.43 | ) | – | (0.43 | ) | |||||||||||||||||||
| (a) | Calculated using average shares outstanding during the period. |
| (b) | Total return for Classes A and C does not consider the effects of sales loads and assumes the reinvestment of all distributions. Total return for all other classes assumes the reinvestment of all distributions. |
| (c) | Commenced on April 4, 2017. |
| (d) | Not annualized. |
| (e) | Annualized. |
| 472 | See Notes to Financial Statements. |
| Ratios to Average Net Assets: | Supplemental Data: | |||||||||||||||||||||||||
| Net asset value, end of period | Total return (%)(b) | Total expenses after waivers and/or reim- bursements (%) | Total expenses (%) | Net investment income (%) | Net assets, end of period (000) | Portfolio turnover rate (%) | ||||||||||||||||||||
| $ | 8.37 | 5.76 | 1.09 | 1.09 | 3.58 | $ | 51,915 | 87 | ||||||||||||||||||
| 8.20 | (1.99 | ) | 1.10 | 1.10 | 4.35 | 43,458 | 92 | |||||||||||||||||||
| 8.74 | 2.71 | 1.12 | 1.12 | 5.26 | 52,957 | 58 | ||||||||||||||||||||
| 8.97 | 2.45 | 1.09 | 1.09 | 4.78 | 52,978 | 68 | ||||||||||||||||||||
| 9.18 | 4.35 | 1.10 | 1.10 | 4.15 | 43,115 | 81 | ||||||||||||||||||||
| 8.37 | 6.02 | 0.84 | 0.84 | 3.83 | 2,680 | 87 | ||||||||||||||||||||
| 8.20 | (1.63 | ) | 0.85 | 0.85 | 4.64 | 2,953 | 92 | |||||||||||||||||||
| 8.73 | 2.85 | 0.86 | 0.86 | 5.54 | 5,240 | 58 | ||||||||||||||||||||
| 8.97 | 2.70 | 0.85 | 0.85 | 5.16 | 21,747 | 68 | ||||||||||||||||||||
| 9.18 | 4.60 | 0.84 | 0.84 | 4.37 | 5,134 | 81 | ||||||||||||||||||||
| 8.38 | 6.28 | 0.59 | 0.59 | 4.08 | 2,975 | 87 | ||||||||||||||||||||
| 8.21 | (1.49 | ) | 0.60 | 0.60 | 4.93 | 5,019 | 92 | |||||||||||||||||||
| 8.75 | 3.23 | 0.62 | 0.62 | 5.79 | 6,661 | 58 | ||||||||||||||||||||
| 8.98 | 2.96 | 0.60 | 0.60 | 5.62 | 44,385 | 68 | ||||||||||||||||||||
| 9.19 | 4.87 | 0.60 | 0.60 | 4.65 | 2,542 | 81 | ||||||||||||||||||||
| 8.38 | 6.48 | 0.53 | 0.53 | 4.15 | 95,334 | 87 | ||||||||||||||||||||
| 8.20 | (1.44 | ) | 0.54 | 0.54 | 4.89 | 124,190 | 92 | |||||||||||||||||||
| 8.74 | 3.16 | 0.55 | 0.55 | 5.77 | 109,741 | 58 | ||||||||||||||||||||
| 8.98 | 3.01 | 0.53 | 0.53 | 5.35 | 63,275 | 68 | ||||||||||||||||||||
| 9.19 | 4.93 | 0.54 | 0.54 | 4.70 | 36,295 | 81 | ||||||||||||||||||||
| See Notes to Financial Statements. | 473 |
Financial Highlights (continued)
HIGH YIELD FUND
| Per Share Operating Performance: | ||||||||||||||||||||||||
| Investment Operations: | Distributions to shareholders from: | |||||||||||||||||||||||
| Net asset value, beginning of period | Net investment income(a) | Net realized and unrealized gain (loss) | Total from investment operations | Net investment income | Net asset value, end of period | |||||||||||||||||||
| Class A | ||||||||||||||||||||||||
| 11/30/2021 | $7.30 | $0.35 | $0.14 | $0.49 | $(0.36 | ) | $7.43 | |||||||||||||||||
| 11/30/2020 | 7.37 | 0.36 | (0.05 | )(c) | 0.31 | (0.38 | ) | 7.30 | ||||||||||||||||
| 11/30/2019 | 7.13 | 0.40 | 0.25 | 0.65 | (0.41 | ) | 7.37 | |||||||||||||||||
| 11/30/2018 | 7.71 | 0.41 | (0.56 | ) | (0.15 | ) | (0.43 | ) | 7.13 | |||||||||||||||
| 11/30/2017 | 7.41 | 0.42 | 0.32 | 0.74 | (0.44 | ) | 7.71 | |||||||||||||||||
| Class C | ||||||||||||||||||||||||
| 11/30/2021 | 7.27 | 0.30 | 0.13 | 0.43 | (0.31 | ) | 7.39 | |||||||||||||||||
| 11/30/2020 | 7.33 | 0.32 | (0.04 | )(c) | 0.28 | (0.34 | ) | 7.27 | ||||||||||||||||
| 11/30/2019 | 7.09 | 0.35 | 0.26 | 0.61 | (0.37 | ) | 7.33 | |||||||||||||||||
| 11/30/2018 | 7.67 | 0.36 | (0.56 | ) | (0.20 | ) | (0.38 | ) | 7.09 | |||||||||||||||
| 11/30/2017 | 7.38 | 0.37 | 0.30 | 0.67 | (0.38 | ) | 7.67 | |||||||||||||||||
| Class F | ||||||||||||||||||||||||
| 11/30/2021 | 7.30 | 0.35 | 0.14 | 0.49 | (0.37 | ) | 7.42 | |||||||||||||||||
| 11/30/2020 | 7.36 | 0.37 | (0.04 | )(c) | 0.33 | (0.39 | ) | 7.30 | ||||||||||||||||
| 11/30/2019 | 7.12 | 0.40 | 0.26 | 0.66 | (0.42 | ) | 7.36 | |||||||||||||||||
| 11/30/2018 | 7.70 | 0.42 | (0.56 | ) | (0.14 | ) | (0.44 | ) | 7.12 | |||||||||||||||
| 11/30/2017 | 7.41 | 0.42 | 0.31 | 0.73 | (0.44 | ) | 7.70 | |||||||||||||||||
| Class F3 | ||||||||||||||||||||||||
| 11/30/2021 | 7.34 | 0.37 | 0.13 | 0.50 | (0.38 | ) | 7.46 | |||||||||||||||||
| 11/30/2020 | 7.41 | 0.37 | (0.03 | )(c) | 0.34 | (0.41 | ) | 7.34 | ||||||||||||||||
| 11/30/2019 | 7.16 | 0.42 | 0.27 | 0.69 | (0.44 | ) | 7.41 | |||||||||||||||||
| 11/30/2018 | 7.75 | 0.43 | (0.56 | ) | (0.13 | ) | (0.46 | ) | 7.16 | |||||||||||||||
| 4/4/2017 to 11/30/2017(d) | 7.65 | 0.28 | 0.12 | 0.40 | (0.30 | ) | 7.75 | |||||||||||||||||
| Class I | ||||||||||||||||||||||||
| 11/30/2021 | 7.34 | 0.36 | 0.14 | 0.50 | (0.38 | ) | 7.46 | |||||||||||||||||
| 11/30/2020 | 7.40 | 0.37 | (0.03 | )(c) | 0.34 | (0.40 | ) | 7.34 | ||||||||||||||||
| 11/30/2019 | 7.16 | 0.41 | 0.26 | 0.67 | (0.43 | ) | 7.40 | |||||||||||||||||
| 11/30/2018 | 7.74 | 0.43 | (0.56 | ) | (0.13 | ) | (0.45 | ) | 7.16 | |||||||||||||||
| 11/30/2017 | 7.45 | 0.44 | 0.30 | 0.74 | (0.45 | ) | 7.74 | |||||||||||||||||
| Class P | ||||||||||||||||||||||||
| 11/30/2021 | 7.41 | 0.33 | 0.14 | 0.47 | (0.35 | ) | 7.53 | |||||||||||||||||
| 11/30/2020 | 7.48 | 0.35 | (0.05 | )(c) | 0.30 | (0.37 | ) | 7.41 | ||||||||||||||||
| 11/30/2019 | 7.23 | 0.39 | 0.26 | 0.65 | (0.40 | ) | 7.48 | |||||||||||||||||
| 11/30/2018 | 7.82 | 0.40 | (0.57 | ) | (0.17 | ) | (0.42 | ) | 7.23 | |||||||||||||||
| 11/30/2017 | 7.52 | 0.40 | 0.32 | 0.72 | (0.42 | ) | 7.82 | |||||||||||||||||
| 474 | See Notes to Financial Statements. |
| Ratios to Average Net Assets: | Supplemental Data: | |||||||||||||||||||||
| Total return (%)(b) | Total expenses after waivers and/or reim- bursements (%) | Total expenses (%) | Net investment income (%) | Net assets, end of period (000) | Portfolio turnover rate (%) | |||||||||||||||||
| 6.74 | 0.88 | 0.88 | 4.59 | $ | 1,089,069 | 113 | ||||||||||||||||
| 4.65 | 0.90 | 0.90 | 5.15 | 1,134,235 | 126 | |||||||||||||||||
| 9.37 | 0.91 | 0.91 | 5.42 | 1,218,731 | 86 | |||||||||||||||||
| (2.03 | ) | 0.90 | 0.90 | 5.48 | 1,126,386 | 107 | ||||||||||||||||
| 10.13 | 0.89 | 0.89 | 5.48 | 1,576,504 | 93 | |||||||||||||||||
| 5.94 | 1.50 | 1.50 | 3.96 | 258,441 | 113 | |||||||||||||||||
| 4.14 | 1.53 | 1.53 | 4.55 | 287,145 | 126 | |||||||||||||||||
| 8.72 | 1.53 | 1.53 | 4.81 | 376,682 | 86 | |||||||||||||||||
| (2.70 | ) | 1.55 | 1.55 | 4.84 | 410,469 | 107 | ||||||||||||||||
| 9.28 | 1.57 | 1.57 | 4.81 | 515,964 | 93 | |||||||||||||||||
| 6.70 | 0.77 | 0.77 | 4.68 | 2,239,174 | 113 | |||||||||||||||||
| 4.89 | 0.80 | 0.80 | 5.24 | 2,097,727 | 126 | |||||||||||||||||
| 9.48 | 0.81 | 0.81 | 5.52 | 2,144,680 | 86 | |||||||||||||||||
| (1.95 | ) | 0.80 | 0.80 | 5.58 | 2,082,549 | 107 | ||||||||||||||||
| 10.09 | 0.79 | 0.79 | 5.54 | 2,011,192 | 93 | |||||||||||||||||
| 6.90 | 0.59 | 0.59 | 4.88 | 737,768 | 113 | |||||||||||||||||
| 4.97 | 0.60 | 0.60 | 5.31 | 1,984,689 | 126 | |||||||||||||||||
| 9.82 | 0.62 | 0.62 | 5.72 | 555,795 | 86 | |||||||||||||||||
| (1.85 | ) | 0.60 | 0.60 | 5.77 | 507,646 | 107 | ||||||||||||||||
| 5.28 | (e) | 0.62 | (f) | 0.62 | (f) | 5.45 | (f) | 449,538 | 93 | |||||||||||||
| 6.80 | 0.67 | 0.67 | 4.78 | 1,759,013 | 113 | |||||||||||||||||
| 5.00 | 0.70 | 0.70 | 5.30 | 1,664,193 | 126 | |||||||||||||||||
| 9.57 | 0.71 | 0.71 | 5.61 | 1,610,253 | 86 | |||||||||||||||||
| (1.82 | ) | 0.70 | 0.70 | 5.66 | 1,412,203 | 107 | ||||||||||||||||
| 10.19 | 0.69 | 0.69 | 5.70 | 1,725,003 | 93 | |||||||||||||||||
| 6.46 | 1.12 | 1.12 | 4.35 | 44 | 113 | |||||||||||||||||
| 4.42 | 1.15 | 1.15 | 4.97 | 54 | 126 | |||||||||||||||||
| 9.20 | 1.15 | 1.15 | 5.36 | 51 | 86 | |||||||||||||||||
| (2.29 | ) | 1.15 | 1.15 | 5.24 | 333 | 107 | ||||||||||||||||
| 9.81 | 1.15 | 1.15 | 5.16 | 478 | 93 | |||||||||||||||||
| See Notes to Financial Statements. | 475 |
Financial Highlights (continued)
HIGH YIELD FUND
| Per Share Operating Performance: | ||||||||||||||||||||||||
| Investment Operations: | Distributions to shareholders from: | |||||||||||||||||||||||
| Net asset value, beginning of period | Net investment income(a) | Net realized and unrealized gain (loss) | Total from investment operations | Net investment income | Net asset value, end of period | |||||||||||||||||||
| Class R2 | ||||||||||||||||||||||||
| 11/30/2021 | $7.35 | $0.32 | $0.13 | $0.45 | $(0.33 | ) | $7.47 | |||||||||||||||||
| 11/30/2020 | 7.41 | 0.34 | (0.04 | )(c) | 0.30 | (0.36 | ) | 7.35 | ||||||||||||||||
| 11/30/2019 | 7.17 | 0.37 | 0.26 | 0.63 | (0.39 | ) | 7.41 | |||||||||||||||||
| 11/30/2018 | 7.76 | 0.38 | (0.57 | ) | (0.19 | ) | (0.40 | ) | 7.17 | |||||||||||||||
| 11/30/2017 | 7.46 | 0.39 | 0.32 | 0.71 | (0.41 | ) | 7.76 | |||||||||||||||||
| Class R3 | ||||||||||||||||||||||||
| 11/30/2021 | 7.35 | 0.32 | 0.14 | 0.46 | (0.34 | ) | 7.47 | |||||||||||||||||
| 11/30/2020 | 7.41 | 0.34 | (0.04 | )(c) | 0.30 | (0.36 | ) | 7.35 | ||||||||||||||||
| 11/30/2019 | 7.17 | 0.38 | 0.25 | 0.63 | (0.39 | ) | 7.41 | |||||||||||||||||
| 11/30/2018 | 7.75 | 0.39 | (0.56 | ) | (0.17 | ) | (0.41 | ) | 7.17 | |||||||||||||||
| 11/30/2017 | 7.46 | 0.40 | 0.31 | 0.71 | (0.42 | ) | 7.75 | |||||||||||||||||
| Class R4 | ||||||||||||||||||||||||
| 11/30/2021 | 7.30 | 0.34 | 0.14 | 0.48 | (0.35 | ) | 7.43 | |||||||||||||||||
| 11/30/2020 | 7.37 | 0.36 | (0.05 | )(c) | 0.31 | (0.38 | ) | 7.30 | ||||||||||||||||
| 11/30/2019 | 7.12 | 0.39 | 0.27 | 0.66 | (0.41 | ) | 7.37 | |||||||||||||||||
| 11/30/2018 | 7.71 | 0.41 | (0.57 | ) | (0.16 | ) | (0.43 | ) | 7.12 | |||||||||||||||
| 11/30/2017 | 7.41 | 0.41 | 0.32 | 0.73 | (0.43 | ) | 7.71 | |||||||||||||||||
| Class R5 | ||||||||||||||||||||||||
| 11/30/2021 | 7.33 | 0.36 | 0.15 | 0.51 | (0.38 | ) | 7.46 | |||||||||||||||||
| 11/30/2020 | 7.40 | 0.38 | (0.05 | )(c) | 0.33 | (0.40 | ) | 7.33 | ||||||||||||||||
| 11/30/2019 | 7.15 | 0.41 | 0.27 | 0.68 | (0.43 | ) | 7.40 | |||||||||||||||||
| 11/30/2018 | 7.74 | 0.43 | (0.57 | ) | (0.14 | ) | (0.45 | ) | 7.15 | |||||||||||||||
| 11/30/2017 | 7.44 | 0.43 | 0.32 | 0.75 | (0.45 | ) | 7.74 | |||||||||||||||||
| Class R6 | ||||||||||||||||||||||||
| 11/30/2021 | 7.34 | 0.37 | 0.13 | 0.50 | (0.38 | ) | 7.46 | |||||||||||||||||
| 11/30/2020 | 7.41 | 0.38 | (0.04 | )(c) | 0.34 | (0.41 | ) | 7.34 | ||||||||||||||||
| 11/30/2019 | 7.16 | 0.42 | 0.27 | 0.69 | (0.44 | ) | 7.41 | |||||||||||||||||
| 11/30/2018 | 7.75 | 0.43 | (0.56 | ) | (0.13 | ) | (0.46 | ) | 7.16 | |||||||||||||||
| 11/30/2017 | 7.45 | 0.44 | 0.32 | 0.76 | (0.46 | ) | 7.75 | |||||||||||||||||
| (a) | Calculated using average shares outstanding during the period. |
| (b) | Total return for Classes A and C does not consider the effects of sales loads and assumes the reinvestment of all distributions. Total return for all other classes assumes the reinvestment of all distributions. |
| (c) | Realized and unrealized gain (loss) per share does not correlate to the aggregate of the net realized and unrealized gain (loss) in the Statement of Operations for the year ended November 30, 2020, primarily due to the timing of the sales and repurchases of the Fund’s shares in relation to fluctuating market values of the Fund’s portfolio. |
| (d) | Commenced on April 4, 2017. |
| (e) | Not annualized. |
| (f) | Annualized. |
| 476 | See Notes to Financial Statements. |
| Ratios to Average Net Assets: | Supplemental Data: | |||||||||||||||||||||
| Total return (%)(b) | Total expenses after waivers and/or reim- bursements (%) | Total expenses (%) | Net investment income (%) | Net assets, end of period (000) | Portfolio turnover rate (%) | |||||||||||||||||
| 6.17 | 1.27 | 1.28 | 4.19 | $ | 6,381 | 113 | ||||||||||||||||
| 4.39 | 1.31 | 1.31 | 4.81 | 6,662 | 126 | |||||||||||||||||
| 8.93 | 1.30 | 1.30 | 5.05 | 11,284 | 86 | |||||||||||||||||
| (2.50 | ) | 1.29 | 1.29 | 5.10 | 14,435 | 107 | ||||||||||||||||
| 9.68 | 1.29 | 1.29 | 5.09 | 14,837 | 93 | |||||||||||||||||
| 6.27 | 1.17 | 1.18 | 4.29 | 113,623 | 113 | |||||||||||||||||
| 4.49 | 1.20 | 1.20 | 4.87 | 114,737 | 126 | |||||||||||||||||
| 9.03 | 1.21 | 1.21 | 5.14 | 117,517 | 86 | |||||||||||||||||
| (2.28 | ) | 1.20 | 1.20 | 5.20 | 107,532 | 107 | ||||||||||||||||
| 9.64 | 1.19 | 1.19 | 5.18 | 91,021 | 93 | |||||||||||||||||
| 6.69 | 0.92 | 0.93 | 4.54 | 96,477 | 113 | |||||||||||||||||
| 4.61 | 0.95 | 0.95 | 5.11 | 113,046 | 126 | |||||||||||||||||
| 9.48 | 0.96 | 0.96 | 5.38 | 109,351 | 86 | |||||||||||||||||
| (2.21 | ) | 0.95 | 0.95 | 5.45 | 91,526 | 107 | ||||||||||||||||
| 10.09 | 0.95 | 0.95 | 5.38 | 67,741 | 93 | |||||||||||||||||
| 6.95 | 0.67 | 0.68 | 4.80 | 267,722 | 113 | |||||||||||||||||
| 4.87 | 0.70 | 0.70 | 5.37 | 256,527 | 126 | |||||||||||||||||
| 9.73 | 0.71 | 0.71 | 5.64 | 289,988 | 86 | |||||||||||||||||
| (1.94 | ) | 0.70 | 0.70 | 5.70 | 266,231 | 107 | ||||||||||||||||
| 10.34 | 0.71 | 0.71 | 5.56 | 264,638 | 93 | |||||||||||||||||
| 6.90 | 0.58 | 0.59 | 4.88 | 700,615 | 113 | |||||||||||||||||
| 4.97 | 0.61 | 0.61 | 5.45 | 643,491 | 126 | |||||||||||||||||
| 9.82 | 0.62 | 0.62 | 5.71 | 620,871 | 86 | |||||||||||||||||
| (1.84 | ) | 0.60 | 0.61 | 5.78 | 451,009 | 107 | ||||||||||||||||
| 10.42 | 0.61 | 0.61 | 5.67 | 381,440 | 93 | |||||||||||||||||
| See Notes to Financial Statements. | 477 |
Financial Highlights (continued)
INCOME FUND
| Per Share Operating Performance: | ||||||||||||||||||||||||
| Investment Operations: | Distributions to shareholders from: | |||||||||||||||||||||||
| Net asset value, beginning of period | Net investment income(a) | Net realized and unrealized gain (loss) | Total from investment operations | Net investment income | Net asset value, end of period | |||||||||||||||||||
| Class A | ||||||||||||||||||||||||
| 11/30/2021 | $ | 3.01 | $ | 0.08 | $ | (0.01 | ) | $ | 0.07 | $ | (0.09 | ) | $ | 2.99 | ||||||||||
| 11/30/2020 | 2.90 | 0.09 | 0.13 | 0.22 | (0.11 | ) | 3.01 | |||||||||||||||||
| 11/30/2019 | 2.67 | 0.10 | 0.24 | 0.34 | (0.11 | ) | 2.90 | |||||||||||||||||
| 11/30/2018 | 2.86 | 0.10 | (0.18 | ) | (0.08 | ) | (0.11 | ) | 2.67 | |||||||||||||||
| 11/30/2017 | 2.76 | 0.09 | 0.11 | 0.20 | (0.10 | ) | 2.86 | |||||||||||||||||
| Class C | ||||||||||||||||||||||||
| 11/30/2021 | 3.02 | 0.06 | (0.01 | ) | 0.05 | (0.07 | ) | 3.00 | ||||||||||||||||
| 11/30/2020 | 2.92 | 0.07 | 0.12 | 0.19 | (0.09 | ) | 3.02 | |||||||||||||||||
| 11/30/2019 | 2.69 | 0.08 | 0.25 | 0.33 | (0.10 | ) | 2.92 | |||||||||||||||||
| 11/30/2018 | 2.87 | 0.08 | (0.16 | ) | (0.08 | ) | (0.10 | ) | 2.69 | |||||||||||||||
| 11/30/2017 | 2.78 | 0.07 | 0.10 | 0.17 | (0.08 | ) | 2.87 | |||||||||||||||||
| Class F | ||||||||||||||||||||||||
| 11/30/2021 | 3.01 | 0.08 | (0.01 | ) | 0.07 | (0.09 | ) | 2.99 | ||||||||||||||||
| 11/30/2020 | 2.91 | 0.09 | 0.12 | 0.21 | (0.11 | ) | 3.01 | |||||||||||||||||
| 11/30/2019 | 2.67 | 0.10 | 0.26 | 0.36 | (0.12 | ) | 2.91 | |||||||||||||||||
| 11/30/2018 | 2.86 | 0.10 | (0.17 | ) | (0.07 | ) | (0.12 | ) | 2.67 | |||||||||||||||
| 11/30/2017 | 2.76 | 0.09 | 0.11 | 0.20 | (0.10 | ) | 2.86 | |||||||||||||||||
| Class F3 | ||||||||||||||||||||||||
| 11/30/2021 | 3.01 | 0.08 | – | 0.08 | (0.10 | ) | 2.99 | |||||||||||||||||
| 11/30/2020 | 2.90 | 0.10 | 0.12 | 0.22 | (0.11 | ) | 3.01 | |||||||||||||||||
| 11/30/2019 | 2.67 | 0.11 | 0.24 | 0.35 | (0.12 | ) | 2.90 | |||||||||||||||||
| 11/30/2018 | 2.86 | 0.10 | (0.17 | ) | (0.07 | ) | (0.12 | ) | 2.67 | |||||||||||||||
| 4/4/2017 to 11/30/2017(c) | 2.82 | 0.06 | 0.05 | 0.11 | (0.07 | ) | 2.86 | |||||||||||||||||
| Class I | ||||||||||||||||||||||||
| 11/30/2021 | 3.01 | 0.08 | – | 0.08 | (0.10 | ) | 2.99 | |||||||||||||||||
| 11/30/2020 | 2.91 | 0.10 | 0.11 | 0.21 | (0.11 | ) | 3.01 | |||||||||||||||||
| 11/30/2019 | 2.67 | 0.10 | 0.26 | 0.36 | (0.12 | ) | 2.91 | |||||||||||||||||
| 11/30/2018 | 2.86 | 0.10 | (0.17 | ) | (0.07 | ) | (0.12 | ) | 2.67 | |||||||||||||||
| 11/30/2017 | 2.76 | 0.09 | 0.12 | 0.21 | (0.11 | ) | 2.86 | |||||||||||||||||
| Class R2 | ||||||||||||||||||||||||
| 11/30/2021 | 3.03 | 0.06 | – | 0.06 | (0.08 | ) | 3.01 | |||||||||||||||||
| 11/30/2020 | 2.93 | 0.08 | 0.11 | 0.19 | (0.09 | ) | 3.03 | |||||||||||||||||
| 11/30/2019 | 2.70 | 0.09 | 0.24 | 0.33 | (0.10 | ) | 2.93 | |||||||||||||||||
| 11/30/2018 | 2.88 | 0.09 | (0.17 | ) | (0.08 | ) | (0.10 | ) | 2.70 | |||||||||||||||
| 11/30/2017 | 2.79 | 0.08 | 0.10 | 0.18 | (0.09 | ) | 2.88 | |||||||||||||||||
| 478 | See Notes to Financial Statements. |
| Ratios to Average Net Assets: | Supplemental Data: | |||||||||||||||||||||
| Total return (%)(b) | Total expenses after waivers and/or reim- bursements (%) | Total expenses (%) | Net investment income (%) | Net assets, end of period (000) | Portfolio turnover rate (%) | |||||||||||||||||
| 2.38 | 0.73 | 0.73 | 2.53 | $ | 1,275,012 | 112 | ||||||||||||||||
| 7.65 | 0.76 | 0.76 | 3.11 | 1,229,762 | 112 | |||||||||||||||||
| 13.02 | 0.77 | 0.77 | 3.53 | 1,054,889 | 108 | |||||||||||||||||
| (2.78 | ) | 0.77 | 0.81 | 3.46 | 836,525 | 117 | ||||||||||||||||
| 7.33 | 0.78 | 0.89 | 3.03 | 918,917 | 205 | |||||||||||||||||
| 1.74 | 1.36 | 1.36 | 1.90 | 81,240 | 112 | |||||||||||||||||
| 6.60 | 1.38 | 1.38 | 2.53 | 107,888 | 112 | |||||||||||||||||
| 12.26 | 1.38 | 1.38 | 2.93 | 162,000 | 108 | |||||||||||||||||
| (3.00 | ) | 1.39 | 1.43 | 2.82 | 166,762 | 117 | ||||||||||||||||
| 6.28 | 1.40 | 1.51 | 2.42 | 230,293 | 205 | |||||||||||||||||
| 2.48 | 0.63 | 0.63 | 2.62 | 570,553 | 112 | |||||||||||||||||
| 7.38 | 0.66 | 0.66 | 3.20 | 570,685 | 112 | |||||||||||||||||
| 13.09 | 0.67 | 0.67 | 3.61 | 591,492 | 108 | |||||||||||||||||
| (2.33 | ) | 0.67 | 0.71 | 3.55 | 434,593 | 117 | ||||||||||||||||
| 7.43 | 0.68 | 0.79 | 3.10 | 454,740 | 205 | |||||||||||||||||
| 2.66 | 0.45 | 0.45 | 2.79 | 985,589 | 112 | |||||||||||||||||
| 7.95 | 0.47 | 0.47 | 3.38 | 722,882 | 112 | |||||||||||||||||
| 13.33 | 0.49 | 0.49 | 3.79 | 586,822 | 108 | |||||||||||||||||
| (2.51 | ) | 0.47 | 0.51 | 3.75 | 394,646 | 117 | ||||||||||||||||
| 3.99 | (d) | 0.46 | (e) | 0.60 | (e) | 3.25 | (e) | 274,355 | 205 | |||||||||||||
| 2.58 | 0.53 | 0.53 | 2.73 | 135,925 | 112 | |||||||||||||||||
| 7.49 | 0.56 | 0.56 | 3.33 | 155,970 | 112 | |||||||||||||||||
| 13.63 | 0.57 | 0.57 | 3.73 | 184,515 | 108 | |||||||||||||||||
| (2.59 | ) | 0.57 | 0.60 | 3.66 | 165,736 | 117 | ||||||||||||||||
| 7.54 | 0.58 | 0.69 | 3.22 | 166,989 | 205 | |||||||||||||||||
| 1.98 | 1.13 | 1.13 | 2.14 | 1,350 | 112 | |||||||||||||||||
| 6.83 | 1.16 | 1.16 | 2.73 | 1,730 | 112 | |||||||||||||||||
| 12.47 | 1.17 | 1.17 | 3.17 | 1,285 | 108 | |||||||||||||||||
| (2.76 | ) | 1.17 | 1.21 | 3.05 | 1,667 | 117 | ||||||||||||||||
| 6.49 | 1.18 | 1.29 | 2.64 | 2,008 | 205 | |||||||||||||||||
| See Notes to Financial Statements. | 479 |
Financial Highlights (continued)
INCOME FUND
| Per Share Operating Performance: | ||||||||||||||||||||||||
| Investment Operations: | Distributions to shareholders from: | |||||||||||||||||||||||
| Net asset value, beginning of period | Net investment income(a) | Net realized and unrealized gain (loss) | Total from investment operations | Net investment income | Net asset value, end of period | |||||||||||||||||||
| Class R3 | ||||||||||||||||||||||||
| 11/30/2021 | $ | 3.02 | $ | 0.07 | $ | (0.01 | ) | $ | 0.06 | $ | (0.08 | ) | $3.00 | |||||||||||
| 11/30/2020 | 2.91 | 0.08 | 0.13 | 0.21 | (0.10 | ) | 3.02 | |||||||||||||||||
| 11/30/2019 | 2.68 | 0.09 | 0.24 | 0.33 | (0.10 | ) | 2.91 | |||||||||||||||||
| 11/30/2018 | 2.87 | 0.09 | (0.18 | ) | (0.09 | ) | (0.10 | ) | 2.68 | |||||||||||||||
| 11/30/2017 | 2.77 | 0.08 | 0.11 | 0.19 | (0.09 | ) | 2.87 | |||||||||||||||||
| Class R4 | ||||||||||||||||||||||||
| 11/30/2021 | 3.01 | 0.08 | (0.01 | ) | 0.07 | (0.09 | ) | 2.99 | ||||||||||||||||
| 11/30/2020 | 2.90 | 0.09 | 0.12 | 0.21 | (0.10 | ) | 3.01 | |||||||||||||||||
| 11/30/2019 | 2.67 | 0.10 | 0.24 | 0.34 | (0.11 | ) | 2.90 | |||||||||||||||||
| 11/30/2018 | 2.86 | 0.10 | (0.18 | ) | (0.08 | ) | (0.11 | ) | 2.67 | |||||||||||||||
| 11/30/2017 | 2.77 | 0.08 | 0.11 | 0.19 | (0.10 | ) | 2.86 | |||||||||||||||||
| Class R5 | ||||||||||||||||||||||||
| 11/30/2021 | 3.01 | 0.08 | – | 0.08 | (0.10 | ) | 2.99 | |||||||||||||||||
| 11/30/2020 | 2.91 | 0.10 | 0.11 | 0.21 | (0.11 | ) | 3.01 | |||||||||||||||||
| 11/30/2019 | 2.68 | 0.11 | 0.24 | 0.35 | (0.12 | ) | 2.91 | |||||||||||||||||
| 11/30/2018 | 2.86 | 0.10 | (0.16 | ) | (0.06 | ) | (0.12 | ) | 2.68 | |||||||||||||||
| 11/30/2017 | 2.76 | 0.09 | 0.12 | 0.21 | (0.11 | ) | 2.86 | |||||||||||||||||
| Class R6 | ||||||||||||||||||||||||
| 11/30/2021 | 3.01 | 0.08 | – | 0.08 | (0.10 | ) | 2.99 | |||||||||||||||||
| 11/30/2020 | 2.90 | 0.10 | 0.12 | 0.22 | (0.11 | ) | 3.01 | |||||||||||||||||
| 11/30/2019 | 2.67 | 0.11 | 0.24 | 0.35 | (0.12 | ) | 2.90 | |||||||||||||||||
| 11/30/2018 | 2.86 | 0.10 | (0.17 | ) | (0.07 | ) | (0.12 | ) | 2.67 | |||||||||||||||
| 11/30/2017 | 2.76 | 0.09 | 0.12 | 0.21 | (0.11 | ) | 2.86 | |||||||||||||||||
| (a) | Calculated using average shares outstanding during the period. |
| (b) | Total return for Classes A and C does not consider the effects of sales loads and assumes the reinvestment of all distributions. Total return for all other classes assumes the reinvestment of all distributions. |
| (c) | Commenced on April 4, 2017. |
| (d) | Not annualized. |
| (e) | Annualized. |
| 480 | See Notes to Financial Statements. |
| Ratios to Average Net Assets: | Supplemental Data: | |||||||||||||||||||||
| Total return (%)(b) | Total expenses after waivers and/or reim- bursements (%) | Total expenses (%) | Net investment income (%) | Net assets, end of period (000) | Portfolio turnover rate (%) | |||||||||||||||||
| 2.08 | 1.03 | 1.03 | 2.23 | $ | 56,410 | 112 | ||||||||||||||||
| 7.32 | 1.06 | 1.06 | 2.83 | 53,114 | 112 | |||||||||||||||||
| 12.65 | 1.07 | 1.07 | 3.24 | 55,317 | 108 | |||||||||||||||||
| (3.05 | ) | 1.07 | 1.11 | 3.16 | 50,016 | 117 | ||||||||||||||||
| 7.00 | 1.08 | 1.19 | 2.74 | 53,025 | 205 | |||||||||||||||||
| 2.33 | 0.78 | 0.78 | 2.50 | 4,501 | 112 | |||||||||||||||||
| 7.60 | 0.81 | 0.81 | 3.07 | 9,205 | 112 | |||||||||||||||||
| 12.97 | 0.82 | 0.82 | 3.46 | 9,218 | 108 | |||||||||||||||||
| (2.83 | ) | 0.82 | 0.85 | 3.44 | 5,363 | 117 | ||||||||||||||||
| 6.89 | 0.83 | 0.94 | 2.98 | 3,117 | 205 | |||||||||||||||||
| 2.59 | 0.53 | 0.53 | 2.73 | 6,309 | 112 | |||||||||||||||||
| 7.50 | 0.56 | 0.56 | 3.32 | 6,548 | 112 | |||||||||||||||||
| 13.21 | 0.57 | 0.57 | 3.73 | 6,099 | 108 | |||||||||||||||||
| (2.23 | ) | 0.58 | 0.62 | 3.54 | 4,048 | 117 | ||||||||||||||||
| 7.55 | 0.57 | 0.70 | 3.21 | 15,926 | 205 | |||||||||||||||||
| 2.67 | 0.45 | 0.45 | 2.81 | 60,434 | 112 | |||||||||||||||||
| 7.95 | 0.48 | 0.48 | 3.40 | 55,981 | 112 | |||||||||||||||||
| 13.34 | 0.49 | 0.49 | 3.81 | 52,133 | 108 | |||||||||||||||||
| (2.50 | ) | 0.47 | 0.51 | 3.77 | 33,975 | 117 | ||||||||||||||||
| 7.66 | 0.47 | 0.59 | 3.31 | 19,714 | 205 | |||||||||||||||||
| See Notes to Financial Statements. | 481 |
Financial Highlights (continued)
INFLATION FOCUSED FUND
| Per Share Operating Performance: | ||||||||||||||||||||||||
| Investment Operations: | Distributions to shareholders from: | |||||||||||||||||||||||
| Net asset value, beginning of period | Net investment income(a) | Net realized and unrealized gain (loss) | Total from investment operations | Net investment income | Net asset value, end of period | |||||||||||||||||||
| Class A | ||||||||||||||||||||||||
| 11/30/2021 | $ | 11.33 | $ | 0.13 | $ | 1.28 | $ | 1.41 | $ | (0.30 | ) | $ | 12.44 | |||||||||||
| 11/30/2020 | 11.23 | 0.26 | 0.26 | (c) | 0.52 | (0.42 | ) | 11.33 | ||||||||||||||||
| 11/30/2019 | 11.55 | 0.34 | (0.21 | ) | 0.13 | (0.45 | ) | 11.23 | ||||||||||||||||
| 11/30/2018 | 11.88 | 0.29 | (0.17 | ) | 0.12 | (0.45 | ) | 11.55 | ||||||||||||||||
| 11/30/2017 | 12.18 | 0.24 | (0.09 | ) | 0.15 | (0.45 | ) | 11.88 | ||||||||||||||||
| Class C | ||||||||||||||||||||||||
| 11/30/2021 | 11.35 | 0.05 | 1.29 | 1.34 | (0.23 | ) | 12.46 | |||||||||||||||||
| 11/30/2020 | 11.25 | 0.20 | 0.25 | (c) | 0.45 | (0.35 | ) | 11.35 | ||||||||||||||||
| 11/30/2019 | 11.57 | 0.27 | (0.21 | ) | 0.06 | (0.38 | ) | 11.25 | ||||||||||||||||
| 11/30/2018 | 11.90 | 0.22 | (0.18 | ) | 0.04 | (0.37 | ) | 11.57 | ||||||||||||||||
| 11/30/2017 | 12.20 | 0.16 | (0.08 | ) | 0.08 | (0.38 | ) | 11.90 | ||||||||||||||||
| Class F | ||||||||||||||||||||||||
| 11/30/2021 | 11.35 | 0.14 | 1.29 | 1.43 | (0.32 | ) | 12.46 | |||||||||||||||||
| 11/30/2020 | 11.24 | 0.27 | 0.27 | (c) | 0.54 | (0.43 | ) | 11.35 | ||||||||||||||||
| 11/30/2019 | 11.57 | 0.35 | (0.21 | ) | 0.14 | (0.47 | ) | 11.24 | ||||||||||||||||
| 11/30/2018 | 11.89 | 0.31 | (0.17 | ) | 0.14 | (0.46 | ) | 11.57 | ||||||||||||||||
| 11/30/2017 | 12.19 | 0.25 | (0.09 | ) | 0.16 | (0.46 | ) | 11.89 | ||||||||||||||||
| Class F3 | ||||||||||||||||||||||||
| 11/30/2021 | 11.34 | 0.14 | 1.30 | 1.44 | (0.33 | ) | 12.45 | |||||||||||||||||
| 11/30/2020 | 11.23 | 0.29 | 0.27 | (c) | 0.56 | (0.45 | ) | 11.34 | ||||||||||||||||
| 11/30/2019 | 11.55 | 0.37 | (0.21 | ) | 0.16 | (0.48 | ) | 11.23 | ||||||||||||||||
| 11/30/2018 | 11.88 | 0.33 | (0.18 | ) | 0.15 | (0.48 | ) | 11.55 | ||||||||||||||||
| 4/4/2017 to 11/30/2017(d) | 12.17 | 0.19 | (0.15 | ) | 0.04 | (0.33 | ) | 11.88 | ||||||||||||||||
| Class I | ||||||||||||||||||||||||
| 11/30/2021 | 11.34 | 0.16 | 1.27 | 1.43 | (0.33 | ) | 12.44 | |||||||||||||||||
| 11/30/2020 | 11.24 | 0.28 | 0.26 | (c) | 0.54 | (0.44 | ) | 11.34 | ||||||||||||||||
| 11/30/2019 | 11.56 | 0.36 | (0.20 | ) | 0.16 | (0.48 | ) | 11.24 | ||||||||||||||||
| 11/30/2018 | 11.89 | 0.32 | (0.18 | ) | 0.14 | (0.47 | ) | 11.56 | ||||||||||||||||
| 11/30/2017 | 12.18 | 0.26 | (0.07 | ) | 0.19 | (0.48 | ) | 11.89 | ||||||||||||||||
| Class R2 | ||||||||||||||||||||||||
| 11/30/2021 | 11.30 | 0.11 | 1.23 | 1.34 | (0.26 | ) | 12.38 | |||||||||||||||||
| 11/30/2020 | 11.22 | 0.20 | 0.26 | (c) | 0.46 | (0.38 | ) | 11.30 | ||||||||||||||||
| 11/30/2019 | 11.55 | 0.30 | (0.22 | ) | 0.08 | (0.41 | ) | 11.22 | ||||||||||||||||
| 11/30/2018 | 11.87 | 0.24 | (0.16 | ) | 0.08 | (0.40 | ) | 11.55 | ||||||||||||||||
| 11/30/2017 | 12.17 | 0.19 | (0.09 | ) | 0.10 | (0.40 | ) | 11.87 | ||||||||||||||||
| 482 | See Notes to Financial Statements. |
| Ratios to Average Net Assets: | Supplemental Data: | |||||||||||||||||||||
| Total return (%)(b) | Total expenses after waivers and/or reim- bursements (%) | Total expenses (%) | Net investment income (%) | Net assets, end of period (000) | Portfolio turnover rate (%) | |||||||||||||||||
| 12.59 | 0.64 | 0.64 | 1.06 | $ | 560,624 | 97 | ||||||||||||||||
| 4.87 | 0.69 | 0.70 | 2.40 | 89,956 | 97 | |||||||||||||||||
| 1.19 | 0.69 | 0.69 | 2.97 | 109,626 | 43 | |||||||||||||||||
| 0.95 | 0.69 | 0.69 | 2.48 | 171,109 | 108 | |||||||||||||||||
| 1.27 | 0.75 | 0.81 | 1.98 | 179,371 | 64 | |||||||||||||||||
| 11.85 | 1.31 | 1.31 | 0.39 | 92,580 | 97 | |||||||||||||||||
| 4.23 | 1.30 | 1.31 | 1.81 | 17,716 | 97 | |||||||||||||||||
| 0.55 | 1.33 | 1.33 | 2.33 | 28,655 | 43 | |||||||||||||||||
| 0.30 | 1.34 | 1.35 | 1.84 | 49,435 | 108 | |||||||||||||||||
| 0.63 | 1.39 | 1.45 | 1.32 | 47,475 | 64 | |||||||||||||||||
| 12.68 | 0.54 | 0.54 | 1.11 | 1,818,238 | 97 | |||||||||||||||||
| 5.06 | 0.59 | 0.60 | 2.52 | 187,180 | 97 | |||||||||||||||||
| 1.20 | 0.59 | 0.59 | 3.06 | 285,297 | 43 | |||||||||||||||||
| 1.14 | 0.58 | 0.59 | 2.60 | 489,043 | 108 | |||||||||||||||||
| 1.36 | 0.65 | 0.70 | 2.04 | 328,360 | 64 | |||||||||||||||||
| 12.86 | 0.38 | 0.38 | 1.17 | 236,951 | 97 | |||||||||||||||||
| 5.24 | 0.42 | 0.43 | 2.68 | 8,595 | 97 | |||||||||||||||||
| 1.46 | 0.42 | 0.42 | 3.24 | 10,645 | 43 | |||||||||||||||||
| 1.25 | 0.39 | 0.43 | 2.80 | 22,597 | 108 | |||||||||||||||||
| 0.33 | (e) | 0.38 | (f) | 0.53 | (f) | 2.47 | (f) | 13,427 | 64 | |||||||||||||
| 12.73 | 0.44 | 0.45 | 1.32 | 1,006,157 | 97 | |||||||||||||||||
| 5.08 | 0.49 | 0.50 | 2.63 | 320,045 | 97 | |||||||||||||||||
| 1.39 | 0.49 | 0.49 | 3.16 | 631,037 | 43 | |||||||||||||||||
| 1.16 | 0.48 | 0.49 | 2.71 | 661,340 | 108 | |||||||||||||||||
| 1.47 | 0.55 | 0.60 | 2.17 | 511,535 | 64 | |||||||||||||||||
| 11.96 | 1.07 | 1.07 | 0.96 | 0 | 97 | |||||||||||||||||
| 4.28 | 1.07 | 1.08 | 1.83 | 166 | 97 | |||||||||||||||||
| 0.70 | 1.08 | 1.08 | 2.59 | 51 | 43 | |||||||||||||||||
| 0.64 | 1.10 | 1.11 | 2.07 | 201 | 108 | |||||||||||||||||
| 0.87 | 1.15 | 1.20 | 1.55 | 286 | 64 | |||||||||||||||||
| See Notes to Financial Statements. | 483 |
Financial Highlights (continued)
INFLATION FOCUSED FUND
| Per Share Operating Performance: | ||||||||||||||||||||||||
| Investment Operations: | Distributions to shareholders from: | |||||||||||||||||||||||
| Net asset value, beginning of period | Net investment income(a) | Net realized and unrealized gain (loss) | Total from investment operations | Net investment income | Net asset value, end of period | |||||||||||||||||||
| Class R3 | ||||||||||||||||||||||||
| 11/30/2021 | $ | 11.34 | $ | 0.11 | $ | 1.26 | $ | 1.37 | $ | (0.27 | ) | $ | 12.44 | |||||||||||
| 11/30/2020 | 11.23 | 0.22 | 0.28 | (c) | 0.50 | (0.39 | ) | 11.34 | ||||||||||||||||
| 11/30/2019 | 11.56 | 0.30 | (0.21 | ) | 0.09 | (0.42 | ) | 11.23 | ||||||||||||||||
| 11/30/2018 | 11.88 | 0.26 | (0.17 | ) | 0.09 | (0.41 | ) | 11.56 | ||||||||||||||||
| 11/30/2017 | 12.18 | 0.20 | (0.08 | ) | 0.12 | (0.42 | ) | 11.88 | ||||||||||||||||
| Class R4 | ||||||||||||||||||||||||
| 11/30/2021 | 11.34 | 0.15 | 1.25 | 1.40 | (0.30 | ) | 12.44 | |||||||||||||||||
| 11/30/2020 | 11.23 | 0.26 | 0.26 | (c) | 0.52 | (0.41 | ) | 11.34 | ||||||||||||||||
| 11/30/2019 | 11.56 | 0.33 | (0.21 | ) | 0.12 | (0.45 | ) | 11.23 | ||||||||||||||||
| 11/30/2018 | 11.88 | 0.30 | (0.18 | ) | 0.12 | (0.44 | ) | 11.56 | ||||||||||||||||
| 11/30/2017 | 12.18 | 0.24 | (0.09 | ) | 0.15 | (0.45 | ) | 11.88 | ||||||||||||||||
| Class R5 | ||||||||||||||||||||||||
| 11/30/2021 | 11.33 | 0.17 | 1.26 | 1.43 | (0.33 | ) | 12.43 | |||||||||||||||||
| 11/30/2020 | 11.23 | 0.28 | 0.26 | (c) | 0.54 | (0.44 | ) | 11.33 | ||||||||||||||||
| 11/30/2019 | 11.55 | 0.36 | (0.20 | ) | 0.16 | (0.48 | ) | 11.23 | ||||||||||||||||
| 11/30/2018 | 11.88 | 0.33 | (0.19 | ) | 0.14 | (0.47 | ) | 11.55 | ||||||||||||||||
| 11/30/2017 | 12.18 | 0.26 | (0.08 | ) | 0.18 | (0.48 | ) | 11.88 | ||||||||||||||||
| Class R6 | ||||||||||||||||||||||||
| 11/30/2021 | 11.34 | 0.18 | 1.25 | 1.43 | (0.34 | ) | 12.43 | |||||||||||||||||
| 11/30/2020 | 11.23 | 0.29 | 0.27 | (c) | 0.56 | (0.45 | ) | 11.34 | ||||||||||||||||
| 11/30/2019 | 11.56 | 0.37 | (0.21 | ) | 0.16 | (0.49 | ) | 11.23 | ||||||||||||||||
| 11/30/2018 | 11.88 | 0.33 | (0.17 | ) | 0.16 | (0.48 | ) | 11.56 | ||||||||||||||||
| 11/30/2017 | 12.18 | 0.28 | (0.08 | ) | 0.20 | (0.50 | ) | 11.88 | ||||||||||||||||
| (a) | Calculated using average shares outstanding during the period. |
| (b) | Total return for Classes A and C does not consider the effects of sales loads and assumes the reinvestment of all distributions. Total return for all other classes assumes the reinvestment of all distributions. |
| (c) | Realized and unrealized gain (loss) per share does not correlate to the aggregate of the net realized and unrealized gain (loss) in the Statement of Operations for the year ended November 30, 2020, primarily due to the timing of the sales and repurchases of the Fund’s shares in relation to fluctuating market values of the Fund’s portfolio. |
| (d) | Commenced on April 4, 2017. |
| (e) | Not annualized. |
| (f) | Annualized. |
| 484 | See Notes to Financial Statements. |
| Ratios to Average Net Assets: | Supplemental Data: | |||||||||||||||||||||
| Total return (%)(b) | Total expenses after waivers and/or reim- bursements (%) | Total expenses (%) | Net investment income (%) | Net assets, end of period (000) | Portfolio turnover rate (%) | |||||||||||||||||
| 12.17 | 0.94 | 0.95 | 0.90 | $ | 402 | 97 | ||||||||||||||||
| 4.65 | 0.98 | 0.99 | 2.03 | 226 | 97 | |||||||||||||||||
| 0.80 | 0.99 | 0.99 | 2.66 | 104 | 43 | |||||||||||||||||
| 0.74 | 0.99 | 1.00 | 2.17 | 111 | 108 | |||||||||||||||||
| 0.97 | 1.05 | 1.11 | 1.65 | 175 | 64 | |||||||||||||||||
| 12.46 | 0.70 | 0.70 | 1.21 | 2,020 | 97 | |||||||||||||||||
| 4.91 | 0.74 | 0.75 | 2.35 | 1,706 | 97 | |||||||||||||||||
| 1.05 | 0.74 | 0.74 | 2.91 | 3,174 | 43 | |||||||||||||||||
| 1.00 | 0.73 | 0.73 | 2.52 | 2,006 | 108 | |||||||||||||||||
| 1.22 | 0.80 | 0.84 | 2.05 | 735 | 64 | |||||||||||||||||
| 12.75 | 0.45 | 0.45 | 1.40 | 304 | 97 | |||||||||||||||||
| 5.08 | 0.49 | 0.50 | 2.64 | 170 | 97 | |||||||||||||||||
| 1.39 | 0.49 | 0.49 | 3.17 | 334 | 43 | |||||||||||||||||
| 1.17 | 0.47 | 0.48 | 2.83 | 144 | 108 | |||||||||||||||||
| 1.48 | 0.55 | 0.59 | 2.19 | 33 | 64 | |||||||||||||||||
| 12.71 | 0.39 | 0.40 | 1.52 | 16,742 | 97 | |||||||||||||||||
| 5.24 | 0.42 | 0.43 | 2.70 | 14,541 | 97 | |||||||||||||||||
| 1.37 | 0.42 | 0.42 | 3.25 | 35,167 | 43 | |||||||||||||||||
| 1.34 | 0.39 | 0.43 | 2.81 | 54,549 | 108 | |||||||||||||||||
| 1.67 | 0.37 | 0.52 | 2.37 | 33,747 | 64 | |||||||||||||||||
| See Notes to Financial Statements. | 485 |
Financial Highlights (continued)
SHORT DURATION CORE BOND FUND
| Per Share Operating Performance: | ||||||||||||||||||||
| Investment Operations: | Distributions to shareholders from: | |||||||||||||||||||
| Net asset value, beginning of period | Net investment income(a) | Net realized and unrealized gain (loss) | Total from investment operations | Net invest- ment income | ||||||||||||||||
| Class A | ||||||||||||||||||||
| 11/30/2021 | $ | 9.89 | $ | 0.07 | $ | (0.02 | ) | $ | 0.05 | $ | (0.17 | ) | ||||||||
| 11/30/2020 | 9.89 | 0.14 | 0.10 | 0.24 | (0.24 | ) | ||||||||||||||
| 11/30/2019 | 9.72 | 0.24 | 0.23 | 0.47 | (0.30 | ) | ||||||||||||||
| 11/30/2018 | 9.92 | 0.22 | (0.12 | ) | 0.10 | (0.30 | ) | |||||||||||||
| 4/19/2017 to 11/30/2017(c) | 10.00 | 0.09 | (0.02 | ) | 0.07 | (0.15 | ) | |||||||||||||
| Class C | ||||||||||||||||||||
| 11/30/2021 | 9.89 | – | (f) | (0.03 | ) | (0.03 | ) | (0.10 | ) | |||||||||||
| 11/30/2020 | 9.89 | 0.09 | 0.08 | 0.17 | (0.17 | ) | ||||||||||||||
| 11/30/2019 | 9.72 | 0.17 | 0.23 | 0.40 | (0.23 | ) | ||||||||||||||
| 11/30/2018 | 9.92 | 0.14 | (0.11 | ) | 0.03 | (0.23 | ) | |||||||||||||
| 4/19/2017 to 11/30/2017(c) | 10.00 | 0.04 | (0.02 | ) | 0.02 | (0.10 | ) | |||||||||||||
| Class F | ||||||||||||||||||||
| 11/30/2021 | 9.89 | 0.08 | (0.03 | ) | 0.05 | (0.18 | ) | |||||||||||||
| 11/30/2020 | 9.89 | 0.16 | 0.09 | 0.25 | (0.25 | ) | ||||||||||||||
| 11/30/2019 | 9.72 | 0.24 | 0.24 | 0.48 | (0.31 | ) | ||||||||||||||
| 11/30/2018 | 9.92 | 0.23 | (0.12 | ) | 0.11 | (0.31 | ) | |||||||||||||
| 4/19/2017 to 11/30/2017(c) | 10.00 | 0.09 | (0.01 | ) | 0.08 | (0.16 | ) | |||||||||||||
| Class F3 | ||||||||||||||||||||
| 11/30/2021 | 9.88 | 0.10 | (0.02 | ) | 0.08 | (0.20 | ) | |||||||||||||
| 11/30/2020 | 9.89 | 0.37 | (0.11 | ) | 0.26 | (0.27 | ) | |||||||||||||
| 11/30/2019 | 9.72 | 0.27 | 0.22 | 0.49 | (0.32 | ) | ||||||||||||||
| 11/30/2018 | 9.92 | 0.24 | (0.11 | ) | 0.13 | (0.33 | ) | |||||||||||||
| 4/19/2017 to 11/30/2017(c) | 10.00 | 0.11 | (0.02 | ) | 0.09 | (0.17 | ) | |||||||||||||
| Class I | ||||||||||||||||||||
| 11/30/2021 | 9.89 | 0.09 | (0.02 | ) | 0.07 | (0.19 | ) | |||||||||||||
| 11/30/2020 | 9.89 | 0.16 | 0.10 | 0.26 | (0.26 | ) | ||||||||||||||
| 11/30/2019 | 9.71 | 0.24 | 0.26 | 0.50 | (0.32 | ) | ||||||||||||||
| 11/30/2018 | 9.92 | 0.24 | (0.13 | ) | 0.11 | (0.32 | ) | |||||||||||||
| 4/19/2017 to 11/30/2017(c) | 10.00 | 0.10 | (0.02 | ) | 0.08 | (0.16 | ) | |||||||||||||
| Class R3 | ||||||||||||||||||||
| 11/30/2021 | 9.89 | 0.04 | (0.03 | ) | 0.01 | (0.14 | ) | |||||||||||||
| 11/30/2020 | 9.89 | 0.13 | 0.08 | 0.21 | (0.21 | ) | ||||||||||||||
| 11/30/2019 | 9.72 | 0.21 | 0.23 | 0.44 | (0.27 | ) | ||||||||||||||
| 11/30/2018 | 9.92 | 0.19 | (0.12 | ) | 0.07 | (0.27 | ) | |||||||||||||
| 4/19/2017 to 11/30/2017(c) | 10.00 | 0.07 | (0.02 | ) | 0.05 | (0.13 | ) | |||||||||||||
| 486 | See Notes to Financial Statements. |
| Ratios to Average Net Assets: | Supplemental Data: | |||||||||||||||||||||||||
| Net asset value, end of period | Total return (%)(b) | Total expenses after waivers and/or reimburse- ments (%) | Total expenses (%) | Net investment income (%) | Net assets, end of period (000) | Portfolio turnover rate (%) | ||||||||||||||||||||
| $ | 9.77 | 0.48 | 0.60 | 0.79 | 0.71 | $ | 47,227 | 220 | ||||||||||||||||||
| 9.89 | 2.46 | 0.60 | 1.00 | 1.47 | 32,022 | 351 | ||||||||||||||||||||
| 9.89 | 4.87 | 0.60 | 1.81 | 2.47 | 8,032 | 136 | ||||||||||||||||||||
| 9.72 | 1.04 | 0.60 | 3.11 | 2.21 | 3,844 | 177 | ||||||||||||||||||||
| 9.92 | 0.70 | (d) | 0.60 | (e) | 3.42 | (e) | 1.43 | (e) | 1,775 | 216 | ||||||||||||||||
| 9.76 | (0.29 | ) | 1.28 | 1.47 | 0.04 | 4,026 | 220 | |||||||||||||||||||
| 9.89 | 1.76 | 1.28 | 1.71 | 0.90 | 4,334 | 351 | ||||||||||||||||||||
| 9.89 | 4.15 | 1.29 | 2.54 | 1.77 | 2,238 | 136 | ||||||||||||||||||||
| 9.72 | 0.27 | 1.39 | 3.88 | 1.42 | 1,083 | 177 | ||||||||||||||||||||
| 9.92 | 0.22 | (d) | 1.37 | (e) | 4.11 | (e) | 0.70 | (e) | 806 | 216 | ||||||||||||||||
| 9.76 | 0.48 | 0.50 | 0.69 | 0.81 | 104,324 | 220 | ||||||||||||||||||||
| 9.89 | 2.54 | 0.50 | 0.91 | 1.58 | 82,951 | 351 | ||||||||||||||||||||
| 9.89 | 4.97 | 0.50 | 1.46 | 2.40 | 29,007 | 136 | ||||||||||||||||||||
| 9.72 | 1.14 | 0.50 | 3.00 | 2.32 | 4,212 | 177 | ||||||||||||||||||||
| 9.92 | 0.77 | (d) | 0.50 | (e) | 3.37 | (e) | 1.52 | (e) | 1,894 | 216 | ||||||||||||||||
| 9.76 | 0.80 | 0.34 | 0.52 | 1.02 | 514 | 220 | ||||||||||||||||||||
| 9.88 | 2.65 | 0.36 | 1.06 | 3.78 | 12 | 351 | ||||||||||||||||||||
| 9.89 | 5.13 | 0.36 | 1.64 | 2.72 | 1,612 | 136 | ||||||||||||||||||||
| 9.72 | 1.34 | 0.32 | 2.87 | 2.47 | 1,533 | 177 | ||||||||||||||||||||
| 9.92 | 0.89 | (d) | 0.30 | (e) | 3.25 | (e) | 1.71 | (e) | 1,513 | 216 | ||||||||||||||||
| 9.77 | 0.68 | 0.40 | 0.59 | 0.89 | 26,463 | 220 | ||||||||||||||||||||
| 9.89 | 2.65 | 0.40 | 0.80 | 1.63 | 4,402 | 351 | ||||||||||||||||||||
| 9.89 | 5.18 | 0.40 | 1.35 | 2.49 | 1,821 | 136 | ||||||||||||||||||||
| 9.71 | 1.14 | 0.40 | 2.88 | 2.42 | 127 | 177 | ||||||||||||||||||||
| 9.92 | 0.83 | (d) | 0.40 | (e) | 3.35 | (e) | 1.61 | (e) | 50 | 216 | ||||||||||||||||
| 9.76 | 0.09 | 0.90 | 1.09 | 0.42 | 61 | 220 | ||||||||||||||||||||
| 9.89 | 2.16 | 0.90 | 1.34 | 1.32 | 98 | 351 | ||||||||||||||||||||
| 9.89 | 4.56 | 0.90 | 2.14 | 2.17 | 76 | 136 | ||||||||||||||||||||
| 9.72 | 0.75 | 0.90 | 3.42 | 1.92 | 49 | 177 | ||||||||||||||||||||
| 9.92 | 0.53 | (d) | 0.90 | (e) | 3.84 | (e) | 1.09 | (e) | 25 | 216 | ||||||||||||||||
| See Notes to Financial Statements. | 487 |
Financial Highlights (continued)
SHORT DURATION CORE BOND FUND
| Per Share Operating Performance: | ||||||||||||||||||||
| Investment Operations: | Distributions to shareholders from: | |||||||||||||||||||
| Net asset value, beginning of period | Net investment income(a) | Net realized and unrealized gain (loss) | Total from investment operations | Net invest- ment income | ||||||||||||||||
| Class R4 | ||||||||||||||||||||
| 11/30/2021 | $ | 9.89 | $ | 0.07 | $ | (0.03 | ) | $ | 0.04 | $ | (0.16 | ) | ||||||||
| 11/30/2020 | 9.89 | 0.18 | 0.05 | 0.23 | (0.23 | ) | ||||||||||||||
| 11/30/2019 | 9.72 | 0.24 | 0.22 | 0.46 | (0.29 | ) | ||||||||||||||
| 11/30/2018 | 9.92 | 0.21 | (0.11 | ) | 0.10 | (0.30 | ) | |||||||||||||
| 4/19/2017 to 11/30/2017(c) | 10.00 | 0.08 | (0.01 | ) | 0.07 | (0.15 | ) | |||||||||||||
| Class R5 | ||||||||||||||||||||
| 11/30/2021 | 9.89 | 0.09 | (0.02 | ) | 0.07 | (0.19 | ) | |||||||||||||
| 11/30/2020 | 9.89 | 0.20 | 0.06 | 0.26 | (0.26 | ) | ||||||||||||||
| 11/30/2019 | 9.72 | 0.26 | 0.23 | 0.49 | (0.32 | ) | ||||||||||||||
| 11/30/2018 | 9.92 | 0.23 | (0.11 | ) | 0.12 | (0.32 | ) | |||||||||||||
| 4/19/2017 to 11/30/2017(c) | 10.00 | 0.10 | (0.02 | ) | 0.08 | (0.16 | ) | |||||||||||||
| Class R6 | ||||||||||||||||||||
| 11/30/2021 | 9.89 | 0.10 | (0.04 | ) | 0.06 | (0.19 | ) | |||||||||||||
| 11/30/2020 | 9.89 | 0.21 | 0.06 | 0.27 | (0.27 | ) | ||||||||||||||
| 11/30/2019 | 9.72 | 0.27 | 0.22 | 0.49 | (0.32 | ) | ||||||||||||||
| 11/30/2018 | 9.92 | 0.24 | (0.11 | ) | 0.13 | (0.33 | ) | |||||||||||||
| 4/19/2017 to 11/30/2017(c) | 10.00 | 0.11 | (0.02 | ) | 0.09 | (0.17 | ) | |||||||||||||
| (a) | Calculated using average shares outstanding during the period. |
| (b) | Total return for Classes A and C does not consider the effects of sales loads and assumes the reinvestment of all distributions. Total return for all other classes assumes the reinvestment of all distributions. |
| (c) | Commenced on April 19, 2017. |
| (d) | Not annualized. |
| (e) | Annualized. |
| (f) | Amount less than $0.01. |
| 488 | See Notes to Financial Statements. |
| Ratios to Average Net Assets: | Supplemental Data: | |||||||||||||||||||||||||
| Net asset value, end of period | Total return (%)(b) | Total expenses after waivers and/or reimburse- ments (%) | Total expenses (%) | Net investment income (%) | Net assets, end of period (000) | Portfolio turnover rate (%) | ||||||||||||||||||||
| 9.77 | 0.44 | 0.65 | 0.81 | 0.67 | $ | 12 | 220 | |||||||||||||||||||
| 9.89 | 2.41 | 0.65 | 1.11 | 1.81 | 12 | 351 | ||||||||||||||||||||
| 9.89 | 4.82 | 0.65 | 1.95 | 2.42 | 27 | 136 | ||||||||||||||||||||
| 9.72 | 1.00 | 0.65 | 3.13 | 2.14 | 25 | 177 | ||||||||||||||||||||
| 9.92 | 0.68 | (d) | 0.65 | (e) | 3.56 | (e) | 1.35 | (e) | 25 | 216 | ||||||||||||||||
| 9.77 | 0.68 | 0.40 | 0.57 | 0.90 | 12 | 220 | ||||||||||||||||||||
| 9.89 | 2.66 | 0.40 | 0.87 | 2.06 | 12 | 351 | ||||||||||||||||||||
| 9.89 | 5.08 | 0.40 | 1.69 | 2.67 | 27 | 136 | ||||||||||||||||||||
| 9.72 | 1.25 | 0.40 | 2.88 | 2.39 | 26 | 177 | ||||||||||||||||||||
| 9.92 | 0.83 | (d) | 0.40 | (e) | 3.34 | (e) | 1.60 | (e) | 25 | 216 | ||||||||||||||||
| 9.76 | 0.65 | 0.34 | 0.52 | 0.98 | 963 | 220 | ||||||||||||||||||||
| 9.89 | 2.75 | 0.36 | 0.81 | 2.17 | 911 | 351 | ||||||||||||||||||||
| 9.89 | 5.13 | 0.36 | 1.63 | 2.72 | 1,961 | 136 | ||||||||||||||||||||
| 9.72 | 1.34 | 0.32 | 2.87 | 2.48 | 1,653 | 177 | ||||||||||||||||||||
| 9.92 | 0.89 | (d) | 0.30 | (e) | 3.25 | (e) | 1.71 | (e) | 1,513 | 216 | ||||||||||||||||
| See Notes to Financial Statements. | 489 |
Financial Highlights (continued)
SHORT DURATION INCOME FUND
| Per Share Operating Performance: | ||||||||||||||||||||
| Investment Operations: | Distributions to shareholders from: | |||||||||||||||||||
| Net asset value, beginning of period | Net investment income(a) | Net realized and unrealized gain (loss) | Total from investment operations | Net invest- ment income | ||||||||||||||||
| Class A | ||||||||||||||||||||
| 11/30/2021 | $ | 4.20 | $ | 0.07 | $ | (0.01 | ) | $ | 0.06 | $ | (0.10 | ) | ||||||||
| 11/30/2020 | 4.21 | 0.09 | 0.02 | (c) | 0.11 | (0.12 | ) | |||||||||||||
| 11/30/2019 | 4.14 | 0.12 | 0.10 | 0.22 | (0.15 | ) | ||||||||||||||
| 11/30/2018 | 4.26 | 0.11 | (0.07 | ) | 0.04 | (0.16 | ) | |||||||||||||
| 11/30/2017 | 4.31 | 0.09 | 0.02 | 0.11 | (0.16 | ) | ||||||||||||||
| Class C | ||||||||||||||||||||
| 11/30/2021 | 4.22 | 0.04 | – | 0.04 | (0.07 | ) | ||||||||||||||
| 11/30/2020 | 4.23 | 0.07 | 0.02 | (c) | 0.09 | (0.10 | ) | |||||||||||||
| 11/30/2019 | 4.17 | 0.10 | 0.09 | 0.19 | (0.13 | ) | ||||||||||||||
| 11/30/2018 | 4.29 | 0.09 | (0.08 | ) | 0.01 | (0.13 | ) | |||||||||||||
| 11/30/2017 | 4.34 | 0.07 | 0.01 | 0.08 | (0.13 | ) | ||||||||||||||
| Class F | ||||||||||||||||||||
| 11/30/2021 | 4.19 | 0.07 | – | 0.07 | (0.10 | ) | ||||||||||||||
| 11/30/2020 | 4.21 | 0.10 | 0.01 | (c) | 0.11 | (0.13 | ) | |||||||||||||
| 11/30/2019 | 4.14 | 0.13 | 0.10 | 0.23 | (0.16 | ) | ||||||||||||||
| 11/30/2018 | 4.26 | 0.12 | (0.08 | ) | 0.04 | (0.16 | ) | |||||||||||||
| 11/30/2017 | 4.31 | 0.10 | 0.01 | 0.11 | (0.16 | ) | ||||||||||||||
| Class F3 | ||||||||||||||||||||
| 11/30/2021 | 4.20 | 0.08 | – | 0.08 | (0.11 | ) | ||||||||||||||
| 11/30/2020 | 4.21 | 0.10 | 0.02 | (c) | 0.12 | (0.13 | ) | |||||||||||||
| 11/30/2019 | 4.14 | 0.13 | 0.10 | 0.23 | (0.16 | ) | ||||||||||||||
| 11/30/2018 | 4.26 | 0.12 | (0.07 | ) | 0.05 | (0.17 | ) | |||||||||||||
| 4/4/2017 to 11/30/2017(d) | 4.30 | 0.07 | – | 0.07 | (0.11 | ) | ||||||||||||||
| Class I | ||||||||||||||||||||
| 11/30/2021 | 4.19 | 0.07 | 0.01 | (c) | 0.08 | (0.11 | ) | |||||||||||||
| 11/30/2020 | 4.21 | 0.10 | 0.01 | (c) | 0.11 | (0.13 | ) | |||||||||||||
| 11/30/2019 | 4.14 | 0.13 | 0.10 | 0.23 | (0.16 | ) | ||||||||||||||
| 11/30/2018 | 4.25 | 0.12 | (0.06 | ) | 0.06 | (0.17 | ) | |||||||||||||
| 11/30/2017 | 4.31 | 0.10 | 0.01 | 0.11 | (0.17 | ) | ||||||||||||||
| Class R2 | ||||||||||||||||||||
| 11/30/2021 | 4.20 | 0.05 | (0.01 | ) | 0.04 | (0.08 | ) | |||||||||||||
| 11/30/2020 | 4.21 | 0.08 | 0.02 | (c) | 0.10 | (0.11 | ) | |||||||||||||
| 11/30/2019 | 4.14 | 0.11 | 0.10 | 0.21 | (0.14 | ) | ||||||||||||||
| 11/30/2018 | 4.26 | 0.10 | (0.08 | ) | 0.02 | (0.14 | ) | |||||||||||||
| 11/30/2017 | 4.31 | 0.08 | 0.01 | 0.09 | (0.14 | ) | ||||||||||||||
| 490 | See Notes to Financial Statements. |
| Ratios to Average Net Assets: | Supplemental Data: | |||||||||||||||||||||||||
| Net asset value, end of period | Total return (%)(b) | Total expenses after waivers and/or reimburse- ments (%) | Total expenses (%) | Net investment income (%) | Net assets, end of period (000) | Portfolio turnover rate (%) | ||||||||||||||||||||
| $ | 4.16 | 1.40 | 0.58 | 0.58 | 1.55 | $ | 13,355,736 | 84 | ||||||||||||||||||
| 4.20 | 2.76 | 0.59 | 0.59 | 2.22 | 12,733,693 | 102 | ||||||||||||||||||||
| 4.21 | 5.48 | 0.60 | 0.60 | 2.92 | 11,693,022 | 57 | ||||||||||||||||||||
| 4.14 | 0.96 | 0.59 | 0.59 | 2.70 | 8,735,221 | 71 | ||||||||||||||||||||
| 4.26 | 2.55 | 0.59 | 0.59 | 2.19 | 10,697,423 | 67 | ||||||||||||||||||||
| 4.19 | 0.99 | 1.23 | 1.23 | 0.91 | 3,379,490 | 84 | ||||||||||||||||||||
| 4.22 | 2.10 | 1.24 | 1.24 | 1.62 | 3,914,470 | 102 | ||||||||||||||||||||
| 4.23 | 4.57 | 1.22 | 1.22 | 2.31 | 4,914,970 | 57 | ||||||||||||||||||||
| 4.17 | 0.35 | 1.23 | 1.23 | 2.07 | 4,912,225 | 71 | ||||||||||||||||||||
| 4.29 | 1.91 | 1.23 | 1.23 | 1.55 | 6,129,077 | 67 | ||||||||||||||||||||
| 4.16 | 1.74 | 0.48 | 0.48 | 1.65 | 26,865,299 | 84 | ||||||||||||||||||||
| 4.19 | 2.62 | 0.49 | 0.49 | 2.33 | 23,546,579 | 102 | ||||||||||||||||||||
| 4.21 | 5.58 | 0.50 | 0.50 | 3.02 | 23,128,477 | 57 | ||||||||||||||||||||
| 4.14 | 1.06 | 0.49 | 0.49 | 2.80 | 15,833,169 | 71 | ||||||||||||||||||||
| 4.26 | 2.65 | 0.49 | 0.49 | 2.28 | 14,906,190 | 67 | ||||||||||||||||||||
| 4.17 | 1.91 | 0.31 | 0.31 | 1.81 | 5,139,001 | 84 | ||||||||||||||||||||
| 4.20 | 3.03 | 0.33 | 0.33 | 2.48 | 4,425,861 | 102 | ||||||||||||||||||||
| 4.21 | 5.75 | 0.34 | 0.34 | 3.19 | 4,087,351 | 57 | ||||||||||||||||||||
| 4.14 | 1.22 | 0.32 | 0.32 | 2.95 | 3,709,795 | 71 | ||||||||||||||||||||
| 4.26 | 1.62 | (e) | 0.33 | (f) | 0.33 | (f) | 2.55 | (f) | 2,914,992 | 67 | ||||||||||||||||
| 4.16 | 1.85 | 0.38 | 0.38 | 1.74 | 12,428,298 | 84 | ||||||||||||||||||||
| 4.19 | 2.97 | 0.39 | 0.39 | 2.44 | 9,762,949 | 102 | ||||||||||||||||||||
| 4.21 | 5.44 | 0.40 | 0.40 | 3.12 | 10,281,839 | 57 | ||||||||||||||||||||
| 4.14 | 1.40 | 0.39 | 0.39 | 2.90 | 7,315,707 | 71 | ||||||||||||||||||||
| 4.25 | 2.51 | 0.39 | 0.39 | 2.37 | 7,091,069 | 67 | ||||||||||||||||||||
| 4.16 | 1.00 | 0.98 | 0.98 | 1.17 | 9,901 | 84 | ||||||||||||||||||||
| 4.20 | 2.36 | 0.99 | 0.99 | 1.85 | 13,909 | 102 | ||||||||||||||||||||
| 4.21 | 5.07 | 1.00 | 1.00 | 2.55 | 18,031 | 57 | ||||||||||||||||||||
| 4.14 | 0.56 | 0.99 | 0.99 | 2.30 | 20,433 | 71 | ||||||||||||||||||||
| 4.26 | 2.14 | 0.99 | 0.99 | 1.79 | 27,492 | 67 | ||||||||||||||||||||
| See Notes to Financial Statements. | 491 |
Financial Highlights (continued)
SHORT DURATION INCOME FUND
| Per Share Operating Performance: | ||||||||||||||||||||
| Investment Operations: | Distributions to shareholders from: | |||||||||||||||||||
| Net asset value, beginning of period | Net investment income(a) | Net realized and unrealized gain (loss) | Total from investment operations | Net invest- ment income | ||||||||||||||||
| Class R3 | ||||||||||||||||||||
| 11/30/2021 | $ | 4.20 | 0.05 | 0.01 | (c) | 0.06 | (0.09 | ) | ||||||||||||
| 11/30/2020 | 4.21 | 0.08 | 0.02 | (c) | 0.10 | (0.11 | ) | |||||||||||||
| 11/30/2019 | 4.14 | 0.11 | 0.10 | 0.21 | (0.14 | ) | ||||||||||||||
| 11/30/2018 | 4.26 | 0.10 | (0.07 | ) | 0.03 | (0.15 | ) | |||||||||||||
| 11/30/2017 | 4.31 | 0.08 | 0.02 | 0.10 | (0.15 | ) | ||||||||||||||
| Class R4 | ||||||||||||||||||||
| 11/30/2021 | 4.20 | 0.07 | – | 0.07 | (0.10 | ) | ||||||||||||||
| 11/30/2020 | 4.22 | 0.09 | 0.01 | (c) | 0.10 | (0.12 | ) | |||||||||||||
| 11/30/2019 | 4.15 | 0.12 | 0.10 | 0.22 | (0.15 | ) | ||||||||||||||
| 11/30/2018 | 4.27 | 0.11 | (0.07 | ) | 0.04 | (0.16 | ) | |||||||||||||
| 11/30/2017 | 4.32 | 0.09 | 0.02 | 0.11 | (0.16 | ) | ||||||||||||||
| Class R5 | ||||||||||||||||||||
| 11/30/2021 | 4.19 | 0.08 | (0.01 | ) | 0.07 | (0.11 | ) | |||||||||||||
| 11/30/2020 | 4.20 | 0.10 | 0.02 | (c) | 0.12 | (0.13 | ) | |||||||||||||
| 11/30/2019 | 4.13 | 0.13 | 0.10 | 0.23 | (0.16 | ) | ||||||||||||||
| 11/30/2018 | 4.25 | 0.12 | (0.07 | ) | 0.05 | (0.17 | ) | |||||||||||||
| 11/30/2017 | 4.30 | 0.10 | 0.02 | 0.12 | (0.17 | ) | ||||||||||||||
| Class R6 | ||||||||||||||||||||
| 11/30/2021 | 4.19 | 0.08 | – | 0.08 | (0.11 | ) | ||||||||||||||
| 11/30/2020 | 4.21 | 0.10 | 0.01 | (c) | 0.11 | (0.13 | ) | |||||||||||||
| 11/30/2019 | 4.14 | 0.13 | 0.10 | 0.23 | (0.16 | ) | ||||||||||||||
| 11/30/2018 | 4.26 | 0.13 | (0.08 | ) | 0.05 | (0.17 | ) | |||||||||||||
| 11/30/2017 | 4.31 | 0.11 | 0.01 | 0.12 | (0.17 | ) | ||||||||||||||
| (a) | Calculated using average shares outstanding during the period. |
| (b) | Total return for Classes A and C does not consider the effects of sales loads and assumes the reinvestment of all distributions. Total return for all other classes assumes the reinvestment of all distributions. |
| (c) | Realized and unrealized gain (loss) per share does not correlate to the aggregate of the net realized and unrealized gain (loss) in the Statement of Operations for the years ended November 30, 2020 and 2021, primarily due to the timing of the sales and repurchases of the Fund’s shares in relation to fluctuating market values of the Fund’s portfolio. |
| (d) | Commenced on April 4, 2017. |
| (e) | Not annualized. |
| (f) | Annualized. |
| 492 | See Notes to Financial Statements. |
| Ratios to Average Net Assets: | Supplemental Data: | |||||||||||||||||||||||||
| Net asset value, end of period | Total return (%)(b) | Total expenses after waivers and/or reimburse- ments (%) | Total expenses (%) | Net investment income (%) | Net assets, end of period (000) | Portfolio turnover rate (%) | ||||||||||||||||||||
| 4.17 | 1.10 | 0.88 | 0.88 | 1.26 | 410,131 | 84 | ||||||||||||||||||||
| 4.20 | 2.46 | 0.89 | 0.89 | 1.94 | 384,845 | 102 | ||||||||||||||||||||
| 4.21 | 5.17 | 0.90 | 0.90 | 2.64 | 367,328 | 57 | ||||||||||||||||||||
| 4.14 | 0.67 | 0.89 | 0.89 | 2.41 | 318,477 | 71 | ||||||||||||||||||||
| 4.26 | 2.25 | 0.89 | 0.89 | 1.90 | 311,784 | 67 | ||||||||||||||||||||
| 4.17 | 1.67 | 0.63 | 0.63 | 1.58 | 168,338 | 84 | ||||||||||||||||||||
| 4.20 | 2.47 | 0.64 | 0.64 | 2.18 | 166,524 | 102 | ||||||||||||||||||||
| 4.22 | 5.43 | 0.65 | 0.65 | 2.88 | 147,772 | 57 | ||||||||||||||||||||
| 4.15 | 0.93 | 0.64 | 0.64 | 2.68 | 105,445 | 71 | ||||||||||||||||||||
| 4.27 | 2.50 | 0.64 | 0.64 | 2.15 | 76,006 | 67 | ||||||||||||||||||||
| 4.15 | 1.67 | 0.38 | 0.38 | 1.83 | 63,717 | 84 | ||||||||||||||||||||
| 4.19 | 2.97 | 0.39 | 0.39 | 2.45 | 69,901 | 102 | ||||||||||||||||||||
| 4.20 | 5.70 | 0.40 | 0.40 | 3.14 | 70,274 | 57 | ||||||||||||||||||||
| 4.13 | 1.16 | 0.39 | 0.39 | 2.94 | 45,264 | 71 | ||||||||||||||||||||
| 4.25 | 2.76 | 0.30 | 0.39 | 2.39 | 24,140 | 67 | ||||||||||||||||||||
| 4.16 | 1.91 | 0.31 | 0.31 | 1.82 | 1,035,235 | 84 | ||||||||||||||||||||
| 4.19 | 2.79 | 0.33 | 0.33 | 2.50 | 896,878 | 102 | ||||||||||||||||||||
| 4.21 | 5.76 | 0.34 | 0.34 | 3.19 | 857,139 | 57 | ||||||||||||||||||||
| 4.14 | 1.23 | 0.33 | 0.33 | 3.00 | 551,235 | 71 | ||||||||||||||||||||
| 4.26 | 2.82 | 0.33 | 0.33 | 2.46 | 289,557 | 67 | ||||||||||||||||||||
| See Notes to Financial Statements. | 493 |
Financial Highlights (continued)
TOTAL RETURN FUND
| Per Share Operating Performance: | ||||||||||||||||||||||||||||
| Investment Operations: | Distributions to shareholders from: | |||||||||||||||||||||||||||
| Net asset value, beginning of period | Net invest- ment income(a) | Net realized and unrealized gain (loss) | Total from invest- ment opera- tions | Net investment income | Net realized gain | Total distri- butions | ||||||||||||||||||||||
| Class A | ||||||||||||||||||||||||||||
| 11/30/2021 | $ | 10.91 | $ | 0.19 | $ | (0.12 | ) | $ | 0.07 | $ | (0.21 | ) | $ | (0.23 | ) | $ | (0.44 | ) | ||||||||||
| 11/30/2020 | 10.49 | 0.23 | 0.46 | 0.69 | (0.27 | ) | – | (0.27 | ) | |||||||||||||||||||
| 11/30/2019 | 9.86 | 0.28 | 0.66 | 0.94 | (0.31 | ) | – | (0.31 | ) | |||||||||||||||||||
| 11/30/2018 | 10.36 | 0.28 | (0.46 | ) | (0.18 | ) | (0.32 | ) | – | (0.32 | ) | |||||||||||||||||
| 11/30/2017 | 10.29 | 0.22 | 0.15 | 0.37 | (0.27 | ) | (0.03 | ) | (0.30 | ) | ||||||||||||||||||
| Class C | ||||||||||||||||||||||||||||
| 11/30/2021 | 10.90 | 0.12 | (0.11 | ) | 0.01 | (0.15 | ) | (0.23 | ) | (0.38 | ) | |||||||||||||||||
| 11/30/2020 | 10.48 | 0.17 | 0.45 | 0.62 | (0.20 | ) | – | (0.20 | ) | |||||||||||||||||||
| 11/30/2019 | 9.85 | 0.21 | 0.66 | 0.87 | (0.24 | ) | – | (0.24 | ) | |||||||||||||||||||
| 11/30/2018 | 10.35 | 0.21 | (0.45 | ) | (0.24 | ) | (0.26 | ) | – | (0.26 | ) | |||||||||||||||||
| 11/30/2017 | 10.28 | 0.15 | 0.15 | 0.30 | (0.20 | ) | (0.03 | ) | (0.23 | ) | ||||||||||||||||||
| Class F | ||||||||||||||||||||||||||||
| 11/30/2021 | 10.91 | 0.20 | (0.12 | ) | 0.08 | (0.22 | ) | (0.23 | ) | (0.45 | ) | |||||||||||||||||
| 11/30/2020 | 10.48 | 0.24 | 0.47 | 0.71 | (0.28 | ) | – | (0.28 | ) | |||||||||||||||||||
| 11/30/2019 | 9.86 | 0.29 | 0.65 | 0.94 | (0.32 | ) | – | (0.32 | ) | |||||||||||||||||||
| 11/30/2018 | 10.36 | 0.29 | (0.46 | ) | (0.17 | ) | (0.33 | ) | – | (0.33 | ) | |||||||||||||||||
| 11/30/2017 | 10.29 | 0.23 | 0.15 | 0.38 | (0.28 | ) | (0.03 | ) | (0.31 | ) | ||||||||||||||||||
| Class F3 | ||||||||||||||||||||||||||||
| 11/30/2021 | 10.91 | 0.22 | (0.11 | ) | 0.11 | (0.25 | ) | (0.23 | ) | (0.48 | ) | |||||||||||||||||
| 11/30/2020 | 10.49 | 0.27 | 0.45 | 0.72 | (0.30 | ) | – | (0.30 | ) | |||||||||||||||||||
| 11/30/2019 | 9.87 | 0.31 | 0.65 | 0.96 | (0.34 | ) | – | (0.34 | ) | |||||||||||||||||||
| 11/30/2018 | 10.36 | 0.31 | (0.44 | ) | (0.13 | ) | (0.36 | ) | – | (0.36 | ) | |||||||||||||||||
| 4/4/2017 to 11/30/2017(c) | 10.33 | 0.18 | 0.05 | 0.23 | (0.20 | ) | – | (0.20 | ) | |||||||||||||||||||
| Class I | ||||||||||||||||||||||||||||
| 11/30/2021 | 10.93 | 0.22 | (0.12 | ) | 0.10 | (0.24 | ) | (0.23 | ) | (0.47 | ) | |||||||||||||||||
| 11/30/2020 | 10.50 | 0.26 | 0.46 | 0.72 | (0.29 | ) | – | (0.29 | ) | |||||||||||||||||||
| 11/30/2019 | 9.88 | 0.30 | 0.65 | 0.95 | (0.33 | ) | – | (0.33 | ) | |||||||||||||||||||
| 11/30/2018 | 10.38 | 0.30 | (0.45 | ) | (0.15 | ) | (0.35 | ) | – | (0.35 | ) | |||||||||||||||||
| 11/30/2017 | 10.31 | 0.24 | 0.15 | 0.39 | (0.29 | ) | (0.03 | ) | (0.32 | ) | ||||||||||||||||||
| Class P | ||||||||||||||||||||||||||||
| 11/30/2021 | 10.96 | 0.16 | (0.11 | ) | 0.05 | (0.19 | ) | (0.23 | ) | (0.42 | ) | |||||||||||||||||
| 11/30/2020 | 10.53 | 0.21 | 0.46 | 0.67 | (0.24 | ) | – | (0.24 | ) | |||||||||||||||||||
| 11/30/2019 | 9.91 | 0.25 | 0.65 | 0.90 | (0.28 | ) | – | (0.28 | ) | |||||||||||||||||||
| 11/30/2018 | 10.41 | 0.25 | (0.45 | ) | (0.20 | ) | (0.30 | ) | – | (0.30 | ) | |||||||||||||||||
| 11/30/2017 | 10.34 | 0.19 | 0.15 | 0.34 | (0.24 | ) | (0.03 | ) | (0.27 | ) | ||||||||||||||||||
| 494 | See Notes to Financial Statements. |
| Ratios to Average Net Assets: | Supplemental Data: | |||||||||||||||||||||||||
| Net asset value, end of period | Total return (%)(b) | Total expenses after waivers and/or reimburse- ments (%) | Total expenses (%) | Net invest- ment income (%) | Net assets, end of period (000) | Portfolio turnover rate (%) | ||||||||||||||||||||
| $ | 10.54 | 0.68 | 0.64 | 0.64 | 1.79 | $ | 1,300,031 | 393 | ||||||||||||||||||
| 10.91 | 6.63 | 0.66 | 0.66 | 2.19 | 1,416,776 | 538 | ||||||||||||||||||||
| 10.49 | 9.62 | 0.68 | 0.68 | 2.68 | 1,275,715 | 736 | ||||||||||||||||||||
| 9.86 | (1.71 | ) | 0.68 | 0.72 | 2.74 | 1,150,292 | 643 | |||||||||||||||||||
| 10.36 | 3.65 | 0.68 | 0.80 | 2.11 | 1,269,964 | 472 | ||||||||||||||||||||
| 10.53 | 0.04 | 1.28 | 1.28 | 1.16 | 59,759 | 393 | ||||||||||||||||||||
| 10.90 | 5.98 | 1.29 | 1.29 | 1.59 | 85,200 | 538 | ||||||||||||||||||||
| 10.48 | 8.95 | 1.30 | 1.30 | 2.08 | 118,447 | 736 | ||||||||||||||||||||
| 9.85 | (2.32 | ) | 1.30 | 1.35 | 2.10 | 123,735 | 643 | |||||||||||||||||||
| 10.35 | 2.99 | 1.32 | 1.43 | 1.47 | 170,287 | 472 | ||||||||||||||||||||
| 10.54 | 0.78 | 0.54 | 0.54 | 1.88 | 1,059,760 | 393 | ||||||||||||||||||||
| 10.91 | 6.84 | 0.56 | 0.56 | 2.29 | 1,013,091 | 538 | ||||||||||||||||||||
| 10.48 | 9.62 | 0.58 | 0.58 | 2.78 | 960,498 | 736 | ||||||||||||||||||||
| 9.86 | (1.61 | ) | 0.58 | 0.62 | 2.83 | 822,274 | 643 | |||||||||||||||||||
| 10.36 | 3.74 | 0.58 | 0.69 | 2.18 | 901,918 | 472 | ||||||||||||||||||||
| 10.54 | 0.97 | 0.35 | 0.35 | 2.07 | 881,986 | 393 | ||||||||||||||||||||
| 10.91 | 6.95 | 0.36 | 0.36 | 2.49 | 774,625 | 538 | ||||||||||||||||||||
| 10.49 | 9.83 | 0.38 | 0.38 | 2.98 | 664,783 | 736 | ||||||||||||||||||||
| 9.87 | (1.31 | ) | 0.37 | 0.40 | 3.05 | 632,109 | 643 | |||||||||||||||||||
| 10.36 | 2.22 | (d) | 0.35 | (e) | 0.48 | (e) | 2.58 | (e) | 581,363 | 472 | ||||||||||||||||
| 10.56 | 0.92 | 0.40 | 0.44 | 2.02 | 433,258 | 393 | ||||||||||||||||||||
| 10.93 | 6.98 | 0.43 | 0.47 | 2.44 | 414,220 | 538 | ||||||||||||||||||||
| 10.50 | 9.76 | 0.44 | 0.48 | 2.93 | 405,218 | 736 | ||||||||||||||||||||
| 9.88 | (1.48 | ) | 0.45 | 0.52 | 2.97 | 376,595 | 643 | |||||||||||||||||||
| 10.38 | 3.85 | 0.48 | 0.60 | 2.31 | 380,442 | 472 | ||||||||||||||||||||
| 10.59 | 0.43 | 0.89 | 0.89 | 1.53 | 710 | 393 | ||||||||||||||||||||
| 10.96 | 6.45 | 0.91 | 0.91 | 1.94 | 659 | 538 | ||||||||||||||||||||
| 10.53 | 9.21 | 0.93 | 0.93 | 2.45 | 528 | 736 | ||||||||||||||||||||
| 9.91 | (1.93 | ) | 0.93 | 0.97 | 2.49 | 555 | 643 | |||||||||||||||||||
| 10.41 | 3.38 | 0.93 | 1.05 | 1.85 | 650 | 472 | ||||||||||||||||||||
| See Notes to Financial Statements. | 495 |
Financial Highlights (continued)
TOTAL RETURN FUND
| Per Share Operating Performance: | ||||||||||||||||||||||||||||
| Investment Operations: | Distributions to shareholders from: | |||||||||||||||||||||||||||
| Net asset value, beginning of period | Net invest- ment income(a) | Net realized and unrealized gain (loss) | Total from invest- ment opera- tions | Net investment income | Net realized gain | Total distri- butions | ||||||||||||||||||||||
| Class R2 | ||||||||||||||||||||||||||||
| 11/30/2021 | $ | 10.90 | $ | 0.15 | $ | (0.11 | ) | $ | 0.04 | $ | (0.17 | ) | $ | (0.23 | ) | $ | (0.40 | ) | ||||||||||
| 11/30/2020 | 10.48 | 0.19 | 0.45 | 0.64 | (0.22 | ) | – | (0.22 | ) | |||||||||||||||||||
| 11/30/2019 | 9.86 | 0.24 | 0.65 | 0.89 | (0.27 | ) | – | (0.27 | ) | |||||||||||||||||||
| 11/30/2018 | 10.36 | 0.23 | (0.45 | ) | (0.22 | ) | (0.28 | ) | – | (0.28 | ) | |||||||||||||||||
| 11/30/2017 | 10.29 | 0.18 | 0.15 | 0.33 | (0.23 | ) | (0.03 | ) | (0.26 | ) | ||||||||||||||||||
| Class R3 | ||||||||||||||||||||||||||||
| 11/30/2021 | 10.90 | 0.16 | (0.11 | ) | 0.05 | (0.18 | ) | (0.23 | ) | (0.41 | ) | |||||||||||||||||
| 11/30/2020 | 10.48 | 0.20 | 0.45 | 0.65 | (0.23 | ) | – | (0.23 | ) | |||||||||||||||||||
| 11/30/2019 | 9.86 | 0.25 | 0.65 | 0.90 | (0.28 | ) | – | (0.28 | ) | |||||||||||||||||||
| 11/30/2018 | 10.36 | 0.24 | (0.45 | ) | (0.21 | ) | (0.29 | ) | – | (0.29 | ) | |||||||||||||||||
| 11/30/2017 | 10.29 | 0.19 | 0.15 | 0.34 | (0.24 | ) | (0.03 | ) | (0.27 | ) | ||||||||||||||||||
| Class R4 | ||||||||||||||||||||||||||||
| 11/30/2021 | 10.91 | 0.18 | (0.11 | ) | 0.07 | (0.21 | ) | (0.23 | ) | (0.44 | ) | |||||||||||||||||
| 11/30/2020 | 10.49 | 0.23 | 0.45 | 0.68 | (0.26 | ) | – | (0.26 | ) | |||||||||||||||||||
| 11/30/2019 | 9.86 | 0.27 | 0.66 | 0.93 | (0.30 | ) | – | (0.30 | ) | |||||||||||||||||||
| 11/30/2018 | 10.36 | 0.27 | (0.45 | ) | (0.18 | ) | (0.32 | ) | – | (0.32 | ) | |||||||||||||||||
| 11/30/2017 | 10.29 | 0.22 | 0.14 | 0.36 | (0.26 | ) | (0.03 | ) | (0.29 | ) | ||||||||||||||||||
| Class R5 | ||||||||||||||||||||||||||||
| 11/30/2021 | 10.91 | 0.21 | (0.11 | ) | 0.10 | (0.24 | ) | (0.23 | ) | (0.47 | ) | |||||||||||||||||
| 11/30/2020 | 10.49 | 0.26 | 0.45 | 0.71 | (0.29 | ) | – | (0.29 | ) | |||||||||||||||||||
| 11/30/2019 | 9.86 | 0.30 | 0.66 | 0.96 | (0.33 | ) | – | (0.33 | ) | |||||||||||||||||||
| 11/30/2018 | 10.36 | 0.30 | (0.46 | ) | (0.16 | ) | (0.34 | ) | – | (0.34 | ) | |||||||||||||||||
| 11/30/2017 | 10.29 | 0.24 | 0.15 | 0.39 | (0.29 | ) | (0.03 | ) | (0.32 | ) | ||||||||||||||||||
| Class R6 | ||||||||||||||||||||||||||||
| 11/30/2021 | 10.92 | 0.22 | (0.11 | ) | 0.11 | (0.25 | ) | (0.23 | ) | (0.48 | ) | |||||||||||||||||
| 11/30/2020 | 10.49 | 0.27 | 0.46 | 0.73 | (0.30 | ) | – | (0.30 | ) | |||||||||||||||||||
| 11/30/2019 | 9.87 | 0.31 | 0.65 | 0.96 | (0.34 | ) | – | (0.34 | ) | |||||||||||||||||||
| 11/30/2018 | 10.37 | 0.31 | (0.45 | ) | (0.14 | ) | (0.36 | ) | – | (0.36 | ) | |||||||||||||||||
| 11/30/2017 | 10.30 | 0.25 | 0.15 | 0.40 | (0.30 | ) | (0.03 | ) | (0.33 | ) | ||||||||||||||||||
| (a) | Calculated using average shares outstanding during the period. |
| (b) | Total return for Classes A and C does not consider the effects of sales loads and assumes the reinvestment of all distributions. Total return for all other classes assumes the reinvestment of all distributions. |
| (c) | Commenced on April 4, 2017. |
| (d) | Not annualized. |
| (e) | Annualized. |
| 496 | See Notes to Financial Statements. |
| Ratios to Average Net Assets: | Supplemental Data: | |||||||||||||||||||||||||
| Net asset value, end of period | Total return (%)(b) | Total expenses after waivers and/or reimburse- ments (%) | Total expenses (%) | Net invest- ment income (%) | Net assets, end of period (000) | Portfolio turnover rate (%) | ||||||||||||||||||||
| $ | 10.54 | 0.37 | 1.04 | 1.04 | 1.39 | $ | 1,768 | 393 | ||||||||||||||||||
| 10.90 | 6.21 | 1.06 | 1.06 | 1.81 | 2,579 | 538 | ||||||||||||||||||||
| 10.48 | 9.08 | 1.08 | 1.08 | 2.31 | 3,501 | 736 | ||||||||||||||||||||
| 9.86 | (2.10 | ) | 1.08 | 1.13 | 2.31 | 4,898 | 643 | |||||||||||||||||||
| 10.36 | 3.24 | 1.08 | 1.20 | 1.69 | 8,150 | 472 | ||||||||||||||||||||
| 10.54 | 0.47 | 0.95 | 0.95 | 1.50 | 37,846 | 393 | ||||||||||||||||||||
| 10.90 | 6.32 | 0.96 | 0.96 | 1.90 | 85,403 | 538 | ||||||||||||||||||||
| 10.48 | 9.19 | 0.98 | 0.98 | 2.40 | 93,652 | 736 | ||||||||||||||||||||
| 9.86 | (2.00 | ) | 0.98 | 1.02 | 2.43 | 107,380 | 643 | |||||||||||||||||||
| 10.36 | 3.34 | 0.98 | 1.09 | 1.79 | 133,227 | 472 | ||||||||||||||||||||
| 10.54 | 0.63 | 0.69 | 0.69 | 1.74 | 44,058 | 393 | ||||||||||||||||||||
| 10.91 | 6.58 | 0.71 | 0.71 | 2.16 | 58,811 | 538 | ||||||||||||||||||||
| 10.49 | 9.56 | 0.73 | 0.73 | 2.64 | 66,840 | 736 | ||||||||||||||||||||
| 9.86 | (1.76 | ) | 0.73 | 0.77 | 2.70 | 63,160 | 643 | |||||||||||||||||||
| 10.36 | 3.60 | 0.73 | 0.84 | 2.05 | 68,972 | 472 | ||||||||||||||||||||
| 10.54 | 0.88 | 0.44 | 0.44 | 1.99 | 78,822 | 393 | ||||||||||||||||||||
| 10.91 | 6.85 | 0.46 | 0.46 | 2.40 | 110,056 | 538 | ||||||||||||||||||||
| 10.49 | 9.84 | 0.49 | 0.49 | 2.88 | 127,807 | 736 | ||||||||||||||||||||
| 9.86 | (1.51 | ) | 0.48 | 0.52 | 2.94 | 85,701 | 643 | |||||||||||||||||||
| 10.36 | 3.87 | 0.48 | 0.60 | 2.32 | 91,931 | 472 | ||||||||||||||||||||
| 10.55 | 0.97 | 0.35 | 0.35 | 2.08 | 252,862 | 393 | ||||||||||||||||||||
| 10.92 | 7.05 | 0.36 | 0.36 | 2.51 | 295,096 | 538 | ||||||||||||||||||||
| 10.49 | 9.84 | 0.38 | 0.38 | 2.97 | 364,578 | 736 | ||||||||||||||||||||
| 9.87 | (1.40 | ) | 0.37 | 0.40 | 3.07 | 220,216 | 643 | |||||||||||||||||||
| 10.37 | 3.98 | 0.36 | 0.48 | 2.45 | 161,412 | 472 | ||||||||||||||||||||
| See Notes to Financial Statements. | 497 |
Financial Highlights (continued)
ULTRA SHORT BOND FUND
| Per Share Operating Performance: | ||||||||||||||||||||||||
| Investment Operations: | Distributions to shareholders from: | |||||||||||||||||||||||
| Net asset value, beginning of period | Net investment income(a) | Net realized and unrealized gain (loss) | Total from investment operations | Net investment income | Net asset value, end of period | |||||||||||||||||||
| Class A | ||||||||||||||||||||||||
| 11/30/2021 | $ | 10.04 | $ | 0.03 | $ | (0.03 | ) | $ | – | (c) | $ | (0.04 | ) | $ | 10.00 | |||||||||
| 11/30/2020 | 10.03 | 0.11 | 0.01 | (d) | 0.12 | (0.11 | ) | 10.04 | ||||||||||||||||
| 11/30/2019 | 10.00 | 0.24 | 0.03 | 0.27 | (0.24 | ) | 10.03 | |||||||||||||||||
| 11/30/2018 | 10.01 | 0.21 | (0.02 | ) | 0.19 | (0.20 | ) | 10.00 | ||||||||||||||||
| 11/30/2017 | 10.00 | 0.13 | – | 0.13 | (0.12 | ) | 10.01 | |||||||||||||||||
| Class A1 | ||||||||||||||||||||||||
| 11/30/2021 | 10.04 | 0.02 | (0.03 | ) | (0.01 | ) | (0.03 | ) | 10.00 | |||||||||||||||
| 11/30/2020 | 10.03 | 0.07 | 0.04 | (d) | 0.11 | (0.10 | ) | 10.04 | ||||||||||||||||
| 7/31/2019 to 11/30/2019(e) | 10.02 | 0.05 | 0.03 | 0.08 | (0.07 | ) | 10.03 | |||||||||||||||||
| Class F | ||||||||||||||||||||||||
| 11/30/2021 | 10.04 | 0.04 | (0.04 | ) | – | (c) | (0.04 | ) | 10.00 | |||||||||||||||
| 11/30/2020 | 10.03 | 0.11 | 0.02 | (d) | 0.13 | (0.12 | ) | 10.04 | ||||||||||||||||
| 11/30/2019 | 10.00 | 0.25 | 0.03 | 0.28 | (0.25 | ) | 10.03 | |||||||||||||||||
| 11/30/2018 | 10.01 | 0.22 | (0.02 | ) | 0.20 | (0.21 | ) | 10.00 | ||||||||||||||||
| 11/30/2017 | 10.00 | 0.13 | – | 0.13 | (0.12 | ) | 10.01 | |||||||||||||||||
| Class F3 | ||||||||||||||||||||||||
| 11/30/2021 | 10.04 | 0.05 | (0.03 | ) | 0.02 | (0.06 | ) | 10.00 | ||||||||||||||||
| 11/30/2020 | 10.03 | 0.11 | 0.03 | (d) | 0.14 | (0.13 | ) | 10.04 | ||||||||||||||||
| 11/30/2019 | 10.00 | 0.26 | 0.03 | 0.29 | (0.26 | ) | 10.03 | |||||||||||||||||
| 11/30/2018 | 10.01 | 0.23 | (0.02 | ) | 0.21 | (0.22 | ) | 10.00 | ||||||||||||||||
| 4/4/2017 to 11/30/2017(h) | 10.01 | 0.10 | – | 0.10 | (0.10 | ) | 10.01 | |||||||||||||||||
| Class I | ||||||||||||||||||||||||
| 11/30/2021 | 10.04 | 0.05 | (0.04 | ) | 0.01 | (0.05 | ) | 10.00 | ||||||||||||||||
| 11/30/2020 | 10.03 | 0.13 | 0.01 | (d) | 0.14 | (0.13 | ) | 10.04 | ||||||||||||||||
| 11/30/2019 | 9.99 | 0.26 | 0.04 | 0.30 | (0.26 | ) | 10.03 | |||||||||||||||||
| 11/30/2018 | 10.01 | 0.23 | (0.03 | ) | 0.20 | (0.22 | ) | 9.99 | ||||||||||||||||
| 11/30/2017 | 10.00 | 0.15 | – | 0.15 | (0.14 | ) | 10.01 | |||||||||||||||||
| Class R5 | ||||||||||||||||||||||||
| 11/30/2021 | 10.04 | 0.05 | (0.04 | ) | 0.01 | (0.05 | ) | 10.00 | ||||||||||||||||
| 11/30/2020 | 10.03 | 0.13 | 0.01 | (d) | 0.14 | (0.13 | ) | 10.04 | ||||||||||||||||
| 11/30/2019 | 10.00 | 0.26 | 0.03 | 0.29 | (0.26 | ) | 10.03 | |||||||||||||||||
| 11/30/2018 | 10.01 | 0.23 | (0.02 | ) | 0.21 | (0.22 | ) | 10.00 | ||||||||||||||||
| 11/30/2017 | 10.00 | 0.14 | 0.01 | 0.15 | (0.14 | ) | 10.01 | |||||||||||||||||
| 498 | See Notes to Financial Statements. |
| Ratios to Average Net Assets: | Supplemental Data: | |||||||||||||||||||||
| Total return (%)(b) | Total expenses after waivers and/or reimburse- ments (%) | Total expenses (%) | Net investment income (%) | Net assets, end of period (000) | Portfolio turnover rate (%) | |||||||||||||||||
| (0.03 | ) | 0.43 | 0.43 | 0.34 | $ | 10,038,159 | 72 | |||||||||||||||
| 1.25 | 0.42 | 0.45 | 1.14 | 12,300,460 | 93 | |||||||||||||||||
| 2.87 | 0.41 | 0.48 | 2.39 | 11,938,003 | 46 | |||||||||||||||||
| 1.84 | 0.40 | 0.49 | 2.11 | 6,688,131 | 23 | |||||||||||||||||
| 1.30 | 0.40 | 0.51 | 1.28 | 1,550,462 | 23 | |||||||||||||||||
| (0.13 | ) | 0.53 | 0.53 | 0.24 | 13,240 | 72 | ||||||||||||||||
| 1.15 | 0.52 | 0.54 | 0.74 | 19,403 | 93 | |||||||||||||||||
| 0.79 | (f) | 0.48 | (g) | 0.55 | (g) | 1.56 | (g) | 2,860 | 46 | |||||||||||||
| 0.02 | 0.38 | 0.38 | 0.38 | 5,349,686 | 72 | |||||||||||||||||
| 1.30 | 0.37 | 0.40 | 1.15 | 7,109,132 | 93 | |||||||||||||||||
| 2.82 | 0.36 | 0.43 | 2.47 | 6,539,665 | 46 | |||||||||||||||||
| 1.98 | 0.35 | 0.44 | 2.18 | 4,603,442 | 23 | |||||||||||||||||
| 1.34 | 0.35 | 0.44 | 1.32 | 552,335 | 23 | |||||||||||||||||
| 0.16 | 0.24 | 0.24 | 0.53 | 519,235 | 72 | |||||||||||||||||
| 1.45 | 0.25 | 0.26 | 1.13 | 804,537 | 93 | |||||||||||||||||
| 2.97 | 0.22 | 0.29 | 2.62 | 282,582 | 46 | |||||||||||||||||
| 2.13 | 0.22 | 0.30 | 2.27 | 271,727 | 23 | |||||||||||||||||
| 0.96 | (f) | 0.21 | (g) | 0.34 | (g) | 1.50 | (g) | 50,096 | 23 | |||||||||||||
| 0.12 | 0.28 | 0.28 | 0.49 | 1,285,378 | 72 | |||||||||||||||||
| 1.40 | 0.27 | 0.30 | 1.35 | 1,258,215 | 93 | |||||||||||||||||
| 3.03 | 0.26 | 0.33 | 2.56 | 1,803,798 | 46 | |||||||||||||||||
| 1.99 | 0.25 | 0.35 | 2.32 | 1,291,802 | 23 | |||||||||||||||||
| 1.46 | 0.25 | 0.39 | 1.45 | 115,193 | 23 | |||||||||||||||||
| 0.12 | 0.28 | 0.28 | 0.49 | 592 | 72 | |||||||||||||||||
| 1.41 | 0.27 | 0.30 | 1.31 | 784 | 93 | |||||||||||||||||
| 2.94 | 0.26 | 0.33 | 2.63 | 1,369 | 46 | |||||||||||||||||
| 2.11 | 0.25 | 0.35 | 2.29 | 1,716 | 23 | |||||||||||||||||
| 1.48 | 0.25 | 0.53 | 1.35 | 292 | 23 | |||||||||||||||||
| See Notes to Financial Statements. | 499 |
Financial Highlights (concluded)
ULTRA SHORT BOND FUND
| Per Share Operating Performance: | ||||||||||||||||||||||||
| Investment Operations: | Distributions to shareholders from: | |||||||||||||||||||||||
| Net asset value, beginning of period | Net investment income(a) | Net realized and unrealized gain (loss) | Total from investment operations | Net investment income | Net asset value, end of period | |||||||||||||||||||
| Class R6 | ||||||||||||||||||||||||
| 11/30/2021 | $ | 10.04 | $ | 0.05 | $ | (0.03 | ) | $ | 0.02 | $ | (0.06 | ) | $ | 10.00 | ||||||||||
| 11/30/2020 | 10.03 | 0.12 | 0.02 | (d) | 0.14 | (0.13 | ) | 10.04 | ||||||||||||||||
| 11/30/2019 | 10.00 | 0.26 | 0.03 | 0.29 | (0.26 | ) | 10.03 | |||||||||||||||||
| 11/30/2018 | 10.01 | 0.24 | (0.03 | ) | 0.21 | (0.22 | ) | 10.00 | ||||||||||||||||
| 11/30/2017 | 10.00 | 0.14 | 0.01 | 0.15 | (0.14 | ) | 10.01 | |||||||||||||||||
| (a) | Calculated using average shares outstanding during the period. |
| (b) | Total return for Classes A and A1 does not consider the effects of sales loads and assumes the reinvestment of all distributions. Total return for all other classes assumes the reinvestment of all distributions. |
| (c) | Amount less than $0.01. |
| (d) | Realized and unrealized gain (loss) per share does not correlate to the aggregate of the net realized and unrealized gain (loss) in the Statement of Operations for the year ended November 30, 2020, primarily due to the timing of the sales and repurchases of the Fund’s shares in relation to fluctuating market values of the Fund’s portfolio. |
| (e) | Commenced on July 31, 2019. |
| (f) | Not annualized. |
| (g) | Annualized. |
| (h) | Commenced on April 4, 2017. |
| 500 | See Notes to Financial Statements. |
| Ratios to Average Net Assets: | Supplemental Data: | |||||||||||||||||||||
| Total return (%)(b) | Total expenses after waivers and/or reimburse- ments (%) | Total expenses (%) | Net investment income (%) | Net assets, end of period (000) | Portfolio turnover rate (%) | |||||||||||||||||
| 0.16 | 0.24 | 0.24 | 0.54 | $ | 86,964 | 72 | ||||||||||||||||
| 1.45 | 0.25 | 0.26 | 1.17 | 65,008 | 93 | |||||||||||||||||
| 2.96 | 0.22 | 0.29 | 2.55 | 11,572 | 46 | |||||||||||||||||
| 2.13 | 0.23 | 0.30 | 2.35 | 7,075 | 23 | |||||||||||||||||
| 1.53 | 0.20 | 0.50 | 1.41 | 314 | 23 | |||||||||||||||||
| See Notes to Financial Statements. | 501 |
| 1. | ORGANIZATION |
Lord Abbett Investment Trust (the “Trust”) is registered under the Investment Company Act of 1940, as amended (the “Act”), as a diversified, open-end management investment company and was organized as a Delaware statutory trust on August 16, 1993.
The Trust currently consists of fourteen funds as of November 30, 2021. This report covers the following twelve funds (separately, a “Fund” and collectively, the “Funds”) and their respective active share classes at November 30, 2021:
| Funds | Classes |
| Lord Abbett Convertible Fund (“Convertible Fund”) | A, C, F, F3, I, P, R2, R3, R4, R5, and R6 |
| Lord Abbett Core Fixed Income Fund (“Core Fixed Income Fund”) | A, C, F, F3 I, R2, R3, R4, R5, and R6 |
| Lord Abbett Core Plus Bond Fund (“Core Plus Bond Fund”) | A, C, F, F3, I, R3, R4, R5, and R6 |
| Lord Abbett Corporate Bond Fund (“Corporate Bond Fund”) | A, C, F, F3, I, R2, R3, R4, R5, and R6 |
| Lord Abbett Floating Rate Fund (“Floating Rate Fund”) | A, C, F, F3, I, R2, R3, R4, R5, and R6 |
| Lord Abbett High Yield Fund (“High Yield Fund”) | A, C, F, F3, I, P, R2, R3, R4, R5, and R6 |
| Lord Abbett Income Fund (“Income Fund”) | A, C, F, F3, I, R2, R3, R4, R5, and R6 |
| Lord Abbett Inflation Focused Fund (“Inflation Focused Fund”) | A, C, F, F3, I, R2, R3, R4, R5, and R6 |
| Lord Abbett Short Duration Core Bond Fund (“Short Duration Core Bond Fund”) | A, C, F, F3, I, R3, R4, R5, and R6 |
| Lord Abbett Short Duration Income Fund (“Short Duration Income Fund”) | A, C, F, F3, I, R2, R3, R4, R5, and R6 |
| Lord Abbett Total Return Fund (“Total Return Fund”) | A, C, F, F3, I, P, R2, R3, R4, R5, and R6 |
| Lord Abbett Ultra Short Bond Fund (“Ultra Short Bond Fund”) | A, A1, F, F3, I, R5, and R6 |
The Funds’ Class P shares are closed to substantially all new investors, with certain exceptions as set forth in the Funds’ prospectus.
Convertible Fund’s investment objective is to seek current income and the opportunity for capital appreciation to produce a high total return. Corporate Bond Fund’s investment objective is to seek current income. Each of Core Fixed Income Fund’s, Core Plus Bond Fund’s and Total Return Fund’s investment objective is to seek income and capital appreciation to produce a high total return. Floating Rate Fund’s investment objective is to seek a high level of current income. High Yield Fund’s investment objective is to seek a high current income and the opportunity for capital appreciation to produce a high total return. Each of Income Fund’s and Short Duration Income Fund’s investment objective is to seek a high level of income consistent with preservation of capital. Inflation Focused Fund’s primary investment objective is to provide investment returns that exceed the rate of inflation in the U.S. economy over a full economic cycle. As a secondary objective, the Fund seeks current income. Each of Short Duration Core Bond Fund’s and Ultra Short Bond Fund’s investment objective is to seek current income consistent with the preservation of capital.
Each class of shares has different expenses and dividends. A front-end sales charge is normally added to the net asset value (“NAV”) for Class A and A1 shares. There is no front-end sales charge in the case of Class C, F, F3, I, P, R2, R3, R4, R5 and R6 shares, although there may be a contingent deferred sales charge (“CDSC”) in certain cases as follows: Class A shares purchased without a sales charge and redeemed before the first day of the month in which the one-year anniversary of the purchase falls (subject to certain exceptions as set forth in each Fund’s prospectus); Class A1 shares purchased without a sales charge and redeemed before the first day of the month in which the eighteenth month anniversary of the purchase falls (subject to certain exceptions as set forth in each Fund’s prospectus); and Class C shares redeemed before the first anniversary of purchase. Class C shares
502
Notes to Financial Statements (continued)
automatically convert to Class A shares on the 25th day of the month (or, if the 25th day is not a business day, the next business day thereafter) following the eighth anniversary of the month on which the purchase order was accepted, provided that the Fund or financial intermediary through which a shareholder purchased Class C shares has records verifying that the C shares have been held at least eight years.
The preparation of the financial statements in conformity with accounting principles generally accepted in the United States of America (“U.S. GAAP”) requires management to make certain estimates and assumptions that affect the reported amounts of assets and liabilities and disclosure of contingent assets and liabilities at the date of the financial statements and the reported amounts of increases and decreases in net assets from operations during the reporting period. Actual results could differ from those estimates. Each Fund is considered an investment company under U.S. GAAP and follows the accounting and reporting guidance applicable to investment companies.
| 2. | SIGNIFICANT ACCOUNTING POLICIES |
| (a) | Investment Valuation–Under procedures approved by the Funds’ Board of Directors (the “Board”), Lord, Abbett & Co. LLC (“Lord Abbett”), the Funds’ investment manager, has formed a Pricing Committee to administer the pricing and valuation of portfolio investments and to ensure that prices utilized reasonably reflect fair value. Among other things, these procedures allow the Funds to utilize independent pricing services, quotations from securities and financial instrument dealers and other market sources to determine fair value. |
| Securities actively traded on any recognized U.S. or non-U.S. exchange or on The NASDAQ Stock Market LLC are valued at the last sale price or official closing price on the exchange or system on which they are principally traded. Events occurring after the close of trading on non-U.S. exchanges may result in adjustments to the valuation of foreign securities to reflect their fair value as of the close of regular trading on the New York Stock Exchange. When valuing foreign equity securities that meet certain criteria, the Board has approved the use of an independent fair valuation service that values such securities to reflect market trading that occurs after the close of the applicable foreign markets of comparable securities or other instruments that correlate to the fair-valued securities. Unlisted equity securities are valued at the last quoted sale price or, if no sale price is available, at the mean between the most recently quoted bid and asked prices. Fixed income securities are valued based on evaluated prices supplied by independent pricing services, which reflect broker/dealer supplied valuations and the independent pricing services’ own electronic data processing techniques. Floating rate loans are valued at the average of bid and ask quotations obtained from dealers in loans on the basis of prices supplied by independent pricing services. Forward foreign currency exchange contracts are valued using daily forward exchange rates. Exchange traded options and futures contracts are valued at the last quoted sale price in the market where they are principally traded. If no sale has occurred, the mean between the most recently quoted bid and asked prices is used. Swaps are valued daily using independent pricing services or quotations from broker/dealers to the extent available. | |
| Securities for which prices are not readily available are valued at fair value as determined by the Pricing Committee. The Pricing Committee considers a number of factors, including observable and unobservable inputs, when arriving at fair value. The Pricing Committee may use related or comparable assets or liabilities, recent transactions, market multiples, book values, yield curves, broker quotes, observable trading activity, option adjusted spread models and other relevant information to determine the fair value of portfolio investments. The Board |
503
Notes to Financial Statements (continued)
| or a designated committee thereof regularly reviews fair value determinations made by the Pricing Committee and may employ techniques such as reviewing related market activity, reviewing inputs and assumptions, and retrospectively comparing prices of subsequent purchases and sales transactions to fair value determinations made by the Pricing Committee. | |
| Investments in open-end money market mutual funds are valued at their NAV as of the close of each business day. Short-term securities with 60 days or less remaining to maturity are valued using the amortized cost method, which approximates fair value. | |
| (b) | Security Transactions–Security transactions are recorded as of the date that the securities are purchased or sold (trade date). Realized gains and losses on sales of portfolio securities are calculated using the identified-cost method. Realized and unrealized gains (losses) are allocated to each class of shares based upon the relative proportion of net assets at the beginning of the day. |
| (c) | Investment Income–Dividend income is recorded on the ex-dividend date. Interest income is recorded on the accrual basis as earned. Discounts are accreted and premiums are amortized using the effective interest method and are included in Interest and other on the Statements of Operations. Withholding taxes on foreign dividends have been provided for in accordance with the applicable country’s tax rules and rates. Investment income is allocated to each class of shares based upon the relative proportion of net assets at the beginning of the day. |
| (d) | Income Taxes–It is the policy of each Fund to meet the requirements of Subchapter M of the Internal Revenue Code applicable to regulated investment companies and to distribute substantially all taxable income and capital gains to its shareholders. Therefore, no income tax provision is required. |
| Each Fund files U.S. federal and various state and local tax returns. No income tax returns are currently under examination. The statute of limitations on each Fund’s filed U.S. federal tax returns remains open for the fiscal years ended November 30, 2018 through November 30, 2021. The statutes of limitations on the Trust’s state and local tax returns may remain open for an additional year depending upon the jurisdiction. | |
| (e) | Expenses–Expenses incurred by the Trust that do not specifically relate to an individual fund are generally allocated to the Funds within the Trust on a pro rata basis by relative net assets. Expenses, excluding class-specific expenses, are allocated to each class of shares based upon the relative proportion of net assets at the beginning of the day. In addition, Class F3 and R6 bear only their class-specific shareholder servicing expenses. Class A, A1, C, F, P, R2, R3 and R4 shares bear their class-specific share of all expenses and fees relating to the Funds’ 12b-1 Distribution Plan. |
| (f) | Foreign Transactions–The books and records of each Fund are maintained in U.S. dollars and transactions denominated in foreign currencies are recorded in each Fund’s records at the rate prevailing when earned or recorded. Asset and liability accounts that are denominated in foreign currencies are adjusted daily to reflect current exchange rates and any unrealized gain (loss), if applicable, is included in Net change in unrealized appreciation/depreciation on translation of assets and liabilities denominated in foreign currencies in each Fund’s Statement of Operations. The resultant exchange gains and losses upon settlement of such transactions, if applicable, are included in Net realized gain (loss) on foreign currency related transactions in each Fund’s Statement of Operations. The Funds do not isolate that portion of the results of operations arising as a result of changes in the foreign exchange rates from the changes in market prices of the securities. |
504
Notes to Financial Statements (continued)
| The Funds use foreign currency exchange contracts to facilitate transactions in foreign-denominated securities. Losses from these transactions may arise from changes in the value of the foreign currency or if the counterparties do not perform under the contracts’ terms. | |
| (g) | Forward Foreign Currency Exchange Contracts–Each Fund may enter into forward foreign currency exchange contracts in order to reduce their exposure to changes in foreign currency exchange rates on their foreign portfolio holdings, or gain or reduce exposure to foreign currency solely for investment purposes. A forward foreign currency exchange contract is a commitment to purchase or sell a foreign currency at a future date at a negotiated rate. The contracts are valued daily at forward exchange rates and any unrealized gain (loss) is included in Net change in unrealized appreciation/depreciation on forward foreign currency exchange contracts in each Fund’s Statement of Operations. The gain (loss) arising from the difference between the U.S. dollar cost of the original contract and the value of the forward foreign currency in U.S. dollars upon closing of such contracts is included in Net realized gain (loss) on forward foreign currency exchange contracts in each Fund’s Statement of Operations. |
| (h) | Futures Contracts–Each Fund may purchase and sell futures contracts to manage cash, to adjust exposure to the direction of interest rates or as a substitute position in lieu of holding the underlying asset on which the instrument is based. At the time of entering into a futures transaction, an investor is required to deposit and maintain a specified amount of cash or eligible securities called “initial margin.” Subsequent payments made or received by a Fund called “variation margin” are made on a daily basis as the market price of the futures contract fluctuates. Each Fund will record an unrealized gain (loss) based on the amount of variation margin. When a contract is closed, a realized gain (loss) is recorded equal to the difference between the opening and closing value of the contract. |
| (i) | Repurchase Agreements–Each Fund may enter into repurchase agreements with respect to securities. A repurchase agreement is a transaction in which a fund acquires a security and simultaneously commits to resell that security to the seller (a bank or securities dealer) at an agreed-upon price on an agreed-upon date. Each Fund requires at all times that the repurchase agreement be collateralized by cash, or by securities of the U.S. Government, its agencies, its instrumentalities, or U.S. Government sponsored enterprises having a value equal to, or in excess of, the value of the repurchase agreement (including accrued interest). If the seller of the agreement defaults on its obligation to repurchase the underlying securities at a time when the fair value of these securities has declined, a Fund may incur a loss upon disposition of the securities. |
| (j) | When-Issued, Forward Transactions or To-Be-Announced (“TBA”) Transactions–Each Fund may purchase portfolio securities on a when-issued or forward basis. When-issued, forward transactions or TBA transactions involve a commitment by a Fund to purchase securities, with payment and delivery (“settlement”) to take place in the future, in order to secure what is considered to be an advantageous price or yield at the time of entering into the transaction. During the period between purchase and settlement, the fair value of the securities will fluctuate and assets consisting of cash and/or marketable securities (normally short-term U.S. Government or U.S. Government sponsored enterprise securities) marked to market daily in an amount sufficient to make payment at settlement will be segregated at each Fund’s custodian in order to pay for the commitment. At the time each Fund makes the commitment to purchase a security on a when-issued basis, it will record the transaction and reflect the liability for the purchase and fair value of the security in determining its NAV. Each |
505
Notes to Financial Statements (continued)
| Fund, generally, has the ability to close out a purchase obligation on or before the settlement date rather than take delivery of the security. Under no circumstances will settlement for such securities take place more than 120 days after the purchase date. | |
| (k) | TBA Sale Commitments–Each Fund may enter into TBA sale commitments to hedge its positions or to sell mortgage-backed securities it owns under delayed delivery arrangements. Proceeds of TBA sale commitments are not received until the contractual settlement date. During the time a TBA sale commitment is outstanding, equivalent deliverable securities, or an offsetting TBA purchase commitment deliverable on or before the sale commitment date, are held as “cover” for the transaction. Unsettled TBA sale commitments are valued at the current market value of the underlying securities, according to the procedures described under “Investment Valuation” above. The contract is adjusted to market value daily and the change in market value is recorded by each Fund as unrealized appreciation (depreciation). If the TBA sale (purchase) commitment is closed through the acquisition of an offsetting purchase (sale) commitment, each Fund realizes a gain or loss from the sale of the securities based upon the unit price established at the date the commitment was entered into. |
| (l) | Mortgage Dollar Rolls–Each Fund may enter into mortgage dollar rolls in which the Fund sells mortgage-backed securities for delivery in the current month and simultaneously contracts with the same counterparty to repurchase similar (same type, coupon and maturity) but not identical securities on a specified future date. During the roll period, the Fund loses the right to receive principal (including prepayments of principal) and interest paid on the securities sold. |
| (m) | Commercial Paper–Each Fund may purchase commercial paper. Commercial paper consists of unsecured promissory notes issued by corporations to finance short-term credit needs. Commercial paper is issued in bearer form with maturities generally not exceeding nine months. Commercial paper obligations may include variable amount master demand notes. |
| (n) | Reverse Repurchase Agreements–Each Fund may enter into reverse repurchase agreements. In a reverse repurchase agreement, a Fund sells a security to a securities dealer or bank for cash and also agrees to repurchase the same security later at a set price. Reverse repurchase agreements expose the Fund to credit risk (that is, the risk that the counterparty will fail to resell the security to the Fund). Engaging in reverse repurchase agreements also may involve the use of leverage, in that a Fund may reinvest the cash it receives in additional securities. Reverse repurchase agreements involve the risk that the market value of the securities to be repurchased by the Fund may decline below the repurchase price. |
| (o) | Floating Rate Loans–Each Fund may invest in floating rate loans, which usually take the form of loan participations and assignments. Loan participations and assignments are agreements to make money available to U.S. or foreign corporations, partnerships or other business entities (the “Borrower”) in a specified amount, at a specified rate and within a specified time. A loan is typically originated, negotiated and structured by a U.S. or foreign bank, insurance company or other financial institution (the “Agent”) for a group of loan investors (“Loan Investors”). The Agent typically administers and enforces the loan on behalf of the other Loan Investors in the syndicate and may hold any collateral on behalf of the Loan Investors. Such loan participations and assignments are typically senior, secured and collateralized in nature. A Fund records an investment when the Borrower withdraws money and records interest as earned. These loans pay interest at rates which are periodically reset by |
506
Notes to Financial Statements (continued)
reference to a base lending rate plus a spread. These base lending rates are generally the prime rate offered by a designated U.S. bank or London InterBank Offered Rate (“LIBOR”).
The loans in which each Fund invests may be subject to some restrictions on resale. For example, each Fund may be contractually obligated to receive approval from the Agent and/or Borrower prior to the sale of these investments. Each Fund generally has no right to enforce compliance with the terms of the loan agreement with the Borrower. As a result, each Fund assumes the credit risk of the Borrower, the selling participant and any other persons interpositioned between each Fund and the Borrower (“Intermediate Participants”). In the event that the Borrower, selling participant or Intermediate Participants become insolvent or enter into bankruptcy, each Fund may incur certain costs and delays in realizing payment or may suffer a loss of principal and/or interest.
Unfunded commitments represent the remaining obligation of each Fund to the Borrower. At any point in time, up to the maturity date of the issue, the Borrower may demand the unfunded portion. Until demanded by the Borrower, unfunded commitments are not recognized as an asset on the Statements of Assets and Liabilities. Unrealized appreciation/depreciation on unfunded commitments presented on the Statements of Assets and Liabilities represents mark to market of the unfunded portion of each Fund’s floating rate notes. As of November 30, 2021, the following Funds had unfunded loan commitments:
| Core Plus Bond Fund | ||||||||||||||||
| Unrealized | ||||||||||||||||
| Principal | Market | Appreciation/ | ||||||||||||||
| Borrower | Amount | Value | Cost | Depreciation | ||||||||||||
| Trans Union LLC 2016 Term Loan B6 | $ | 367,590 | $ | 365,868 | $ | 366,671 | $ | (803 | ) | |||||||
| Floating Rate Loan Fund | ||||||||||||||||
| Unrealized | ||||||||||||||||
| Principal | Market | Appreciation/ | ||||||||||||||
| Borrower | Amount | Value | Cost | Depreciation | ||||||||||||
| CMBF LLC Delayed Draw Term Loan | $ | 3,296,244 | $ | 3,263,282 | $ | 3,296,244 | $ | (32,962 | ) | |||||||
| DexKo Global, Inc. 2021 USD Delayed Draw Term Loan | 805,573 | 800,288 | 805,573 | (5,285 | ) | |||||||||||
| EyeCare Partners LLC 2021 Delayed Draw Term Loan | 2,314,933 | 2,308,660 | 2,314,933 | (6,273 | ) | |||||||||||
| Gray Television Inc. 2021 Second Lien Bridge Term Loan, Inc. | 9,930,292 | 9,930,292 | 9,930,292 | – | ||||||||||||
| LBM Acquisition LLC 2021 Incremental Delayed Draw Term Loan B2 | 4,801,170 | 4,734,722 | 4,755,219 | (20,497 | ) | |||||||||||
| Medical Solutions LLC 2021 Delayed Draw Term Loan | 1,656,474 | 1,649,227 | 1,648,253 | 974 | ||||||||||||
| Refficiency Holdings LLC 2021 Delayed Draw Term Loan | 3,212,677 | 3,215,344 | 3,212,677 | 2,667 | ||||||||||||
| SCP Eye Care Services LLC 2021 Delayed Draw Term Loan | 1,492,684 | 1,492,684 | 1,492,684 | – | ||||||||||||
| Service Logic Acquisition, Inc. Delayed draw Term Loan | 743,837 | 743,837 | 737,442 | 6,395 | ||||||||||||
| Thermostat Purchaser III, Inc. Delayed Draw Term Loan | 1,714,822 | 1,712,679 | 1,714,822 | (2,143 | ) | |||||||||||
| Trans Union, LLC 2021 Term Loan B6 | 17,304,615 | 17,223,543 | 17,261,354 | (37,811 | ) | |||||||||||
| Western Dental Service, Inc. 2021 Delayed Draw Term Loan | 956,189 | 954,821 | 956,189 | (1,368 | ) | |||||||||||
| Total | $ | 48,229,510 | $ | 48,029,379 | $ | 48,125,682 | $ | (96,303 | ) | |||||||
507
Notes to Financial Statements (continued)
| High Yield Fund | ||||||||||||||||
| Unrealized | ||||||||||||||||
| Principal | Market | Appreciation/ | ||||||||||||||
| Borrower | Amount | Value | Cost | Depreciation | ||||||||||||
| CMBF LLC Delayed Draw Term Loan | $ | 1,959,418 | $ | 1,939,824 | $ | 1,959,418 | $ | (19,594 | ) | |||||||
| Medical Solutions LLC 2021 Delayed Draw Term Loan | 1,411,477 | 1,405,302 | 1,404,472 | 830 | ||||||||||||
| Refficiency Holdings LLC 2021 Delayed Draw Term Loan | 808,721 | 809,392 | 808,721 | 671 | ||||||||||||
| Washington Prime Group LP 2018 Revolver | 23,920 | 24,338 | 24,488 | (150 | ) | |||||||||||
| Gray Television, Inc. 2021 2nd Lien Bridge Term Loan | 21,523,310 | 21,523,310 | 21,523,310 | – | ||||||||||||
| Total | $ | 25,726,846 | $ | 25,702,166 | $ | 25,720,409 | $ | (18,243 | ) | |||||||
| Inflation Focused Fund | ||||||||||||||||
| Unrealized | ||||||||||||||||
| Principal | Market | Appreciation/ | ||||||||||||||
| Borrower | Amount | Value | Cost | Depreciation | ||||||||||||
| Gray Television, Inc. 2nd Lien Bridge Term Loan | $ | 3,956,314 | $ | 3,956,314 | $ | 3,956,314 | $ | – | ||||||||
| Short Duration Income Fund | ||||||||||||||||
| Unrealized | ||||||||||||||||
| Principal | Market | Appreciation/ | ||||||||||||||
| Borrower | Amount | Value | Cost | Depreciation | ||||||||||||
| Gray Television, Inc. 2021 Second Lien Bridge Term Loan | $ | 96,043,686 | $ | 96,043,686 | $ | 96,043,686 | $ | – | ||||||||
| Total Return Fund | ||||||||||||||||
| Unrealized | ||||||||||||||||
| Principal | Market | Appreciation/ | ||||||||||||||
| Borrower | Amount | Value | Cost | Depreciation | ||||||||||||
| Trans Union, LLC 2021 Term Loan B6 | $ | 3,764,068 | $ | 3,746,433 | $ | 3,754,658 | $ | (8,225 | ) | |||||||
| (p) | Inflation-Linked Derivatives–Inflation Focused Fund may invest in inflation-linked derivatives, such as Consumer Price Index Swap Agreements (“CPI swaps”). A CPI swap is a contract in which one party agrees to pay a fixed rate in exchange for a variable rate, which is the rate of change in the CPI during the life of the contract. Payments are based on a notional amount of principal. The Fund will normally enter into CPI swap contracts on a zero coupon basis, meaning that the floating rate will be based on the cumulative CPI during the life of the contract, and the fixed rate will compound until the swap’s maturity date, at which point the payments are netted. The swaps are valued daily and any unrealized gain (loss) is included in the Net change in unrealized appreciation/depreciation on swaps in the Fund’s Statement of Operations. A liquidation payment received or made at the termination or maturity of the swap is recorded in realized gain (loss) and is included in Net realized gain (loss) on swaps in the Fund’s Statement of Operations. Daily changes in valuation of centrally cleared CPI swaps, if any, are recorded as a receivable or payable for the change in value as appropriate (“variation margin”) on the Statements of Assets and Liabilities. For the centrally cleared CPI swaps, there was minimal counterparty risk to the Fund, since such CPI swaps entered into were traded through a central clearinghouse, which guarantees against default. |
| (q) | Credit Default Swaps–Each Fund may enter into credit default swap contracts in order to hedge credit risk or for speculation purposes. As a seller of a credit default swap contract (“seller of protection”), a Fund is required to pay the notional amount or other agreed-upon value of a referenced debt obligation to the counterparty in the event of a default by or other credit event involving the referenced issuer, obligation or index. In return, a Fund receives from the counterparty a periodic stream of payments over the term of the contract. |
508
Notes to Financial Statements (continued)
| As a purchaser of a credit default swap contract (“buyer of protection”), a Fund would receive the notional amount or other agreed upon value of a referenced debt obligation from the counterparty in the event of default by or other credit event involving the referenced issuer, obligation or index. In return, a Fund makes periodic payments to the counterparty over the term of the contracts, provided no event of default has occurred. | |
| These credit default swaps may have as a reference obligation corporate or sovereign issuers or credit indices. These credit indices are comprised of a basket of securities representing a particular sector of the market. | |
| Credit default swaps are fair valued based upon quotations from counterparties, brokers or market-makers and the change in value, if any, is recorded as an unrealized appreciation or depreciation. For a credit default swap sold by a Fund, payment of the agreed-upon amount made by a Fund in the event of default of the referenced debt obligation is recorded as the cost of the referenced debt obligation purchased/received. For a credit default swap purchased by a Fund, the agreed-upon amount received by a Fund in the event of default of the referenced debt obligation is recorded as proceeds from sale/delivery of the referenced debt obligation and the resulting gain or loss realized on the referenced debt obligation is recorded as such by a Fund. | |
| Any upfront payments made or received upon entering a credit default swap contract would be amortized or accreted over the life of the swap and recorded as realized gains or losses. Collateral, in the form of cash or securities, may be required to be held in segregated accounts with the custodian bank or broker in accordance with the swap agreement. The value and credit rating of each credit default swap where a Fund is the seller of protection, are both measures of the current payment/performance risk of the swap. As the value of the swap changes as a positive or negative percentage of the total notional amount, the payment/performance risk may decrease or increase, respectively. The maximum potential amount of future payments (undiscounted) that a Fund as a seller of protection could be required to make under a credit default swap agreement would be an amount equal to the notional amount of the agreement. These potential amounts would be partially offset by any recovery values of the respective referenced obligations, upfront payments received upon entering into the agreement, or net amounts received from the settlement of buy protection credit default swap agreements entered into by a Fund for the same referenced entity or entities. | |
| Entering into credit default swaps involves credit and market risk. Such risks involve the possibility that there will be no liquid market for these agreements, that the counterparty to the agreements may default on its obligation to perform or disagree as to the meaning of the contractual terms in the agreements, and that there may be unfavorable changes in interest rates, and that Lord Abbett does not correctly predict the creditworthiness of the issuers of the reference obligation on which the credit default swap is based. For the centrally cleared credit default swaps, there was minimal counterparty risk to the Fund, since such credit default swaps entered into were traded through a central clearinghouse, which guarantees against default. | |
| (r) | Interest Rate Swaps–Each Fund may enter into interest rate swap agreements. Pursuant to interest rate swap agreements, a Fund either makes floating-rate payments to the counterparty (or Central counterparty clearing house (“CCP”) in the case of centrally cleared swaps) based on a benchmark interest rate in exchange for fixed-rate payments or a Fund makes fixed-rate payments to the counterparty or CCP in exchange for payments on a floating benchmark interest rate. Payments received or made, including amortization of upfront payments/receipts, are recorded as realized gains or losses. During the term of the outstanding swap agreement, |
509
Notes to Financial Statements (continued)
| changes in the underlying value of the swap are recorded as unrealized gains or losses. For centrally cleared swaps, the daily change in valuation is recorded as a receivable or payable for variation margin and settled in cash with the CCP daily. The value of the swap is determined by changes in the relationship between two rates of interest. A Fund is exposed to credit loss in the event of non-performance by the swap counterparty. In the case of centrally cleared swaps, counterparty risk is minimal due to protections provided by the CCP. Risk may also arise from movements in interest rates. | |
| (s) | Total Return Swaps–Each Fund may enter into total return swap agreements to obtain exposure to a security or market without owning such security or investing directly in that market. Each Fund may agree to make payments that are the equivalent of interest in exchange for the right to receive payments equivalent to any appreciation in the value of an underlying security, index or other asset, as well as receive payments equivalent to any distributions made on that asset, over the term of the swap. If the value of the asset underlying a total return swap declines over the term of the swap, each Fund also may be required to pay an amount equal to that decline in value to their counterparty. |
| (t) | Fair Value Measurements–Fair value is defined as the price that each Fund would receive upon selling an investment or transferring a liability in an orderly transaction to an independent buyer in the principal or most advantageous market of the investment. A three-tier hierarchy is used to maximize the use of observable market data and minimize the use of unobservable inputs and to establish classification of fair value measurements for disclosure purposes. Inputs refer broadly to the assumptions that market participants would use in pricing the asset or liability, including assumptions about risk – for example, the risk inherent in a particular valuation technique used to measure fair value (such as a pricing model) and/or the risk inherent in the inputs to the valuation technique. Inputs may be observable or unobservable. Observable inputs reflect the assumptions market participants would use in pricing the asset or liability. Observable inputs are based on market data obtained from sources independent of the reporting entity. Unobservable inputs reflect the reporting entity’s own assumptions about the assumptions market participants would use in pricing the asset or liability. Unobservable inputs are based on the best information available in the circumstances. The three-tier hierarchy classification is determined based on the lowest level of inputs that is significant to the fair value measurement, and is summarized in the three broad Levels listed below: |
| • | Level 1 – | unadjusted quoted prices in active markets for identical investments; |
| • | Level 2 – | other significant observable inputs (including quoted prices for similar investments, interest rates, prepayment speeds, credit risk, etc.); and |
| • | Level 3 – | significant unobservable inputs (including each Fund’s own assumptions in determining the fair value of investments). |
| A summary of inputs used in valuing each Fund’s investments and other financial instruments as of November 30, 2021 and, if applicable, Level 3 rollforwards for the fiscal year then ended is included in each Fund’s Schedule of Investments. | |
| Changes in valuation techniques may result in transfers into or out of an assigned level within the three-tier hierarchy. The inputs or methodology used for valuing securities are not necessarily an indication of the risk associated with investing in those securities. |
510
Notes to Financial Statements (continued)
| 3. | MANAGEMENT FEE AND OTHER TRANSACTIONS WITH AFFILIATES |
Management Fee
The Trust has a management agreement with Lord Abbett, pursuant to which Lord Abbett provides each Fund with investment management services and executive and other personnel, provides office space and pays for ordinary and necessary office and clerical expenses relating to research and statistical work and supervision of each Fund’s investment portfolio.
The management fee is based on each Fund’s average daily net assets at the following annual rates:
| Convertible Fund | Income Fund | |||
| First $1 billion | .70% | Next $3 billion | .38% | |
| Next $1 billion | .60% | Next $7 billion | .35% | |
| Over $2 billion | .57% | Over $10 billion | .34% | |
| Core Fixed Income Fund | Inflation Focused Fund | |||
| First $1 billion | .24% | First $2 billion | .30% | |
| Next $1 billion | .21% | Next $3 billion | .28% | |
| Over $2 billion | .20% | Over $5 billion | .26% | |
| Core Plus Bond Fund | Short Duration Core Bond Fund | |||
| First $4 billion | .28% | First $1 billion | .30% | |
| Next $11 billion | .26% | Next $1 billion | .25% | |
| Over $15 billion | .25% | Over $2 billion | .20% | |
| Corporate Bond Fund | Short Duration Income Fund | |||
| First $2 billion | .40% | First $1 billion | .35% | |
| Over $2 billion | .35% | Next $1 billion | .30% | |
| Over $2 billion | .25% | |||
| Floating Rate Fund | ||||
| First $1 billion | .50% | Total Return Fund | ||
| Over $1 billion | .45% | First $4 billion | .28% | |
| Next $11 billion | .26% | |||
| High Yield Fund | Over $15 billion | .25% | ||
| First $1 billion | .60% | |||
| Next $1 billion | .55% | Ultra Short Bond Fund | .17% | |
| Over $2 billion | .50% |
For the fiscal year ended November 30, 2021, the effective management fee, net of waivers, was based on each Fund’s average daily net assets at the following annualized rates:
| Net Effective | |||
| Management Fee | |||
| Convertible Fund | .66% | ||
| Core Fixed Income Fund | .22% | ||
| Core Plus Bond Fund | .24% | ||
| Corporate Bond Fund | .00% | ||
| Floating Rate Fund | .46% | ||
| High Yield Fund | .52% | ||
| Income Fund | .38 | ||
| Inflation Focused Fund | .29% | ||
| Short Duration Core Bond Fund | .12% | ||
| Short Duration Income Fund | .25% | ||
| Total Return Fund | .28% | ||
| Ultra Short Bond Fund | .17% |
511
Notes to Financial Statements (continued)
In addition, Lord Abbett provides certain administrative services to each Fund pursuant to an Administrative Services Agreement in return for a fee at an annual rate of ..04% of each Fund’s average daily net assets. Lord Abbett voluntarily waived the following fund administration fees during the fiscal year ended November 30, 2021:
| Fund | Fund Administration Fee | ||
| Convertible Fund | $ 30,651 | ||
| Core Fixed Income Fund | 58,791 | ||
| Core Plus Bond Fund | 31,589 | ||
| Corporate Bond Fund | 7,405 | ||
| Floating Rate Fund | 126,468 | ||
| High Yield Fund | 137,851 | ||
| Income Fund | 50,241 | ||
| Inflation Focused Fund | 57,593 | ||
| Short Duration Core Bond Fund | 15,839 | ||
| Short Duration Income Fund | 551,741 | ||
| Total Return Fund | 112,144 | ||
| Ultra Short Bond Fund | 271,051 |
For the fiscal year ended November 30, 2021 and continuing through March 31, 2022, Lord Abbett has contractually agreed to waive its fees and reimburse expenses to the extent necessary to limit total net annual operating expenses for each class, excluding 12b-1 fees, to the following annual rates:
| Effective April 1, 2021 | Prior to April 1, 2021 | |||||||||||||||||||||||
| Classes | Classes | |||||||||||||||||||||||
| A,C,F,I,R2,R3, | A,C,F,I,R2,R3, | |||||||||||||||||||||||
| Fund | R4 and R5 | A1 | F3 and R6 | R4 and R5 | A1 | F3 and R6 | ||||||||||||||||||
| Core Plus Bond Fund | .48% | – | .38% | .48% | – | .39% | ||||||||||||||||||
| Corporate Bond Fund | .48% | – | .44% | .48% | – | .45% | ||||||||||||||||||
| Short Duration Core Bond Fund | .40% | – | .34% | .40% | – | .34% | ||||||||||||||||||
| Ultra Short Bond Fund | – | – | – | – | .27% | – | ||||||||||||||||||
For the fiscal year ended November 30, 2021 and continuing through March 31, 2022, Lord Abbett has contractually agreed to waive Core Fixed Income Fund’s and Total Return Fund’s Class I shareholder servicing expenses at an annual rate of 0.04% of each Fund’s average daily net assets.
All contractual management fee waiver and expense reimbursement agreements between the Funds and Lord Abbett may be terminated only upon the approval of the Board.
12b-1 Distribution Plan
Each Fund has adopted a distribution plan with respect to Class A, A1, C, F, P, R2, R3 and R4 shares pursuant to Rule 12b-1 under the Act, which provides for the payment of ongoing distribution and service fees to Lord Abbett Distributor LLC (the “Distributor”), an affiliate of Lord Abbett. The following annual rates have been authorized by the Board pursuant to the plan:
| Fees* | Class A | Class A1 | Class C(1) | Class F(2) | Class P | Class R2 | Class R3 | Class R4 | |||||||||||||||||||||||
| Service | .15% | .25% | (4) | .25% | – | .25% | .25% | .25% | .25% | ||||||||||||||||||||||
| Distribution | .05% | (3) | – | .75% | .10% | .20% | .35% | .25% | – | ||||||||||||||||||||||
| * | The Funds may designate a portion of the aggregate fee as attributable to service activities for purposes of calculating Financial Industry Regulatory Authority, Inc. (“FINRA”) sales charge limitations. |
512
Notes to Financial Statements (continued)
| (1) | The 12b-1 fees each Fund pays on Class C shares is a blended rate based on 1.00% of each Fund’s average daily net assets attributable to Class C shares held for less than one year and .80% (.25% service, .55% distribution) of each Fund’s average daily net assets attributable to Class C shares held for one year or more. All Class C shareholders of a Fund will bear 12b-1 fees at the same rate. |
| (2) | The Class F Share Rule 12b-1 fee may be designated as a service fee in limited circumstances as described in the Funds’ prospectus. |
| (3) | Distribution fees not applicable to Ultra Short Bond Fund. |
| (4) | Class A1 is only for Ultra Short Bond Fund. |
Class F3, Class I, Class R5 and Class R6 shares do not have a distribution plan.
Commissions
Distributor received the following commissions on sales of shares of the Funds, after concessions were paid to authorized dealers, for the fiscal year ended November 30, 2021:
| Distributor | Dealers’ | |||||||
| Commissions | Concessions | |||||||
| Convertible Fund | $ | 61,290 | $ | 396,311 | ||||
| Core Fixed Income Fund | 75,363 | 445,608 | ||||||
| Core Plus Bond Fund | 25,010 | 143,310 | ||||||
| Corporate Bond Fund | 1,514 | 8,548 | ||||||
| Floating Rate Fund | 115,683 | 660,401 | ||||||
| High Yield Fund | 73,684 | 478,938 | ||||||
| Income Fund | 180,725 | 1,152,072 | ||||||
| Inflation Focused Fund | 144,060 | 847,569 | ||||||
| Short Duration Core Bond Fund | 7,683 | 41,769 | ||||||
| Short Duration Income Fund | 911,169 | 6,295,153 | ||||||
| Total Return Fund | 136,009 | 819,165 | ||||||
| Ultra Short Bond Fund | – | 3,975 | ||||||
Distributor received the following amount of CDSCs for the fiscal year ended November 30, 2021:
| Class A | Class C | |||||||
| Convertible Fund | $ | 39,437 | $ | 11,872 | ||||
| Core Fixed Income Fund | 17,863 | 6,716 | ||||||
| Core Plus Bond Fund | – | – | ||||||
| Corporate Bond Fund | – | – | ||||||
| Floating Rate Fund | 113,865 | 33,416 | ||||||
| High Yield Fund | 19,469 | 13,718 | ||||||
| Income Fund | 21,282 | 5,329 | ||||||
| Inflation Focused Fund | 6,443 | 7,572 | ||||||
| Short Duration Core Bond Fund | – | – | ||||||
| Short Duration Income Fund | 1,361,867 | 539,359 | ||||||
| Total Return Fund | 16,650 | 7,982 | ||||||
| Ultra Short Bond Fund | 4,859 | – | ||||||
513
Notes to Financial Statements (continued)
Other Related Parties
As of November 30, 2021, the percentages of Convertible Fund’s, Core Fixed Income Fund’s, Floating Rate Fund’s, High Yield Fund’s, Inflation Focused Fund’s and Short Duration Income Fund’s outstanding shares owned by each Fund that invests principally in affiliated mutual funds managed by Lord Abbett (“Fund of Funds”) were as follows:
| Underlying Funds | |||||||||||||||||||||||
| Core | Short | ||||||||||||||||||||||
| Fixed | Floating | High | Inflation | Duration | |||||||||||||||||||
| Convertible | Income | Rate | Yield | Focused | Income | ||||||||||||||||||
| Fund of Funds | Fund | Fund | Fund | Fund | Fund | Fund | |||||||||||||||||
| Lord Abbett Multi-Asset Balanced Opportunity Fund | 2.36% | 4.28% | 0.17% | 6.19% | 3.68% | 0.02% | |||||||||||||||||
| Lord Abbett Multi-Asset Income Fund | 0.80% | 8.01% | 0.55% | 3.19% | 2.87% | 0.02% | |||||||||||||||||
One Trustee and certain of the Trust’s officers have an interest in Lord Abbett.
| 4. | DISTRIBUTIONS AND CAPITAL LOSS CARRYFORWARDS |
Dividends from net investment income, if any, are declared daily and paid monthly for Core Fixed Income Fund, Core Plus Bond Fund, Corporate Bond Fund, Floating Rate Fund, High Yield Fund, Income Fund, Inflation Focused Fund, Short Duration Core Bond Fund, Short Duration Income Fund, Total Return Fund and Ultra Short Bond Fund and declared and paid quarterly for Convertible Fund. Taxable net realized gains from investment transactions, reduced by allowable capital loss carryforwards, if any, are declared and distributed to shareholders at least annually. The capital loss carryforward amount, if any, is available to offset future net capital gains. Dividends and distributions to shareholders are recorded on the ex-dividend date. The amounts of dividends and distributions from net investment income and net realized capital gains are determined in accordance with federal income tax regulations, which may differ from accounting principles generally accepted in the United States of America. These book/tax differences are either considered temporary or permanent in nature. To the extent these differences are permanent in nature, such amounts are reclassified within the components of net assets based on their federal tax basis treatment; temporary differences do not require reclassification. Dividends and distributions, which exceed earnings and profits for tax purposes, are reported as a tax return of capital.
The tax character of distributions paid during the fiscal years ended November 30, 2021 and 2020 was as follows:
| Convertible Fund | Core Fixed Income Fund | ||||||||||||||
| Year Ended | Year Ended | Year Ended | Year Ended | ||||||||||||
| 11/30/2021 | 11/30/2020 | 11/30/2021 | 11/30/2020 | ||||||||||||
| Distributions paid from: | |||||||||||||||
| Ordinary income | $ | 157,702,879 | $ | 31,447,133 | $ | 77,783,549 | $ | 37,486,107 | |||||||
| Net long-term capital gains | 48,441,029 | 24,951,538 | 16,060,928 | – | |||||||||||
| Total distributions paid | $ | 206,143,908 | $ | 56,398,671 | $ | 93,844,477 | $ | 37,486,107 | |||||||
514
Notes to Financial Statements (continued)
| Core Plus Bond Fund | Corporate Bond Fund | ||||||||||||||
| Year Ended | Year Ended | Year Ended | Year Ended | ||||||||||||
| 11/30/2021 | 11/30/2020 | 11/30/2021 | 11/30/2020 | ||||||||||||
| Distributions paid from: | |||||||||||||||
| Ordinary income | $ | 10,225,689 | $ | 9,591,221 | $ | 473,612 | $ | 335,254 | |||||||
| Net long-term capital gains | 1,436,842 | 327,367 | 61,114 | – | |||||||||||
| Total distributions paid | $ | 11,662,531 | $ | 9,918,588 | $ | 534,726 | $ | 335,254 | |||||||
| Floating Rate Fund | High Yield Fund | ||||||||||||||
| Year Ended | Year Ended | Year Ended | Year Ended | ||||||||||||
| 11/30/2021 | 11/30/2020 | 11/30/2021 | 11/30/2020 | ||||||||||||
| Distributions paid from: | |||||||||||||||
| Ordinary income | $ | 240,245,181 | $ | 284,083,080 | $ | 390,034,976 | $ | 406,418,993 | |||||||
| Tax return of capital | – | 50,837,579 | |||||||||||||
| Total distributions paid | $ | 240,245,181 | $ | 334,920,659 | $ | 390,034,976 | $ | 406,418,993 | |||||||
| Income Fund | Inflation Focused Fund | ||||||||||||||
| Year Ended | Year Ended | Year Ended | Year Ended | ||||||||||||
| 11/30/2021 | 11/30/2020 | 11/30/2021 | 11/30/2020 | ||||||||||||
| Distributions paid from: | |||||||||||||||
| Ordinary income | $ | 93,534,127 | $ | 102,084,536 | $ | 44,543,417 | $ | 30,350,040 | |||||||
| Total distributions paid | $ | 93,534,127 | $ | 102,084,536 | $ | 44,543,417 | $ | 30,350,040 | |||||||
| Short Duration Core Bond Fund | Short Duration Income Fund | ||||||||||||||
| Year Ended | Year Ended | Year Ended | Year Ended | ||||||||||||
| 11/30/2021 | 11/30/2020 | 11/30/2021 | 11/30/2020 | ||||||||||||
| Distributions paid from: | |||||||||||||||
| Ordinary income | $ | 2,964,068 | $ | 1,722,835 | $ | 1,435,370,581 | $ | 1,633,205,535 | |||||||
| Total distributions paid | $ | 2,964,068 | $ | 1,722,835 | $ | 1,435,370,581 | $ | 1,633,205,535 | |||||||
| Total Return Fund | Ultra Short Bond Fund | ||||||||||||||
| Year Ended | Year Ended | Year Ended | Year Ended | ||||||||||||
| 11/30/2021 | 11/30/2020 | 11/30/2021 | 11/30/2020 | ||||||||||||
| Distributions paid from: | |||||||||||||||
| Ordinary income | $ | 128,733,647 | $ | 107,993,885 | $ | 76,255,172 | $ | 239,917,875 | |||||||
| Net long-term capital gains | 49,201,525 | – | – | – | |||||||||||
| Total distributions paid | $ | 177,935,172 | $ | 107,993,885 | $ | 76,255,172 | $ | 239,917,875 | |||||||
As of November 30, 2021, the components of accumulated gains (losses) on a tax-basis were as follows:
| Convertible | Core Fixed | |||||||
| Fund | Income Fund | |||||||
| Undistributed ordinary income – net | $ | 101,065,076 | $ | 1,103,873 | ||||
| Undistributed long-term capital gains | 131,835,772 | 7,484,048 | ||||||
| Total undistributed earnings | 232,900,848 | 8,587,921 | ||||||
| Capital loss carryforwards* | – | – | ||||||
| Temporary differences | (133,085 | ) | (208,272 | ) | ||||
| Unrealized gains (losses) – net | 92,384,707 | (2,362,615 | ) | |||||
| Total accumulated gains (losses) | $ | 325,152,470 | $ | 6,017,034 | ||||
515
Notes to Financial Statements (continued)
| Core Plus | Corporate | |||||||
| Bond Fund | Bond Fund | |||||||
| Undistributed ordinary income – net | $ | – | $ | 6,507 | ||||
| Undistributed long-term capital gains | 84,595 | 175,812 | ||||||
| Total undistributed earnings | 84,595 | 182,319 | ||||||
| Capital loss carryforwards* | – | – | ||||||
| Temporary differences | (60,040 | ) | (806 | ) | ||||
| Unrealized gains (losses) – net | (2,117,918 | ) | 42,918 | |||||
| Total accumulated gains (losses) | $ | (2,093,363 | ) | $ | 224,431 | |||
| Floating | High | |||||||
| Rate Fund | Yield Fund | |||||||
| Undistributed ordinary income – net | $ | – | $ | – | ||||
| Undistributed long-term capital gains | – | – | ||||||
| Total undistributed earnings | – | – | ||||||
| Capital loss carryforwards* | (1,519,776,229 | ) | – | |||||
| Temporary differences | (21,957,161 | ) | (8,133,639 | ) | ||||
| Unrealized gains (losses) – net | 15,760,142 | 139,757,324 | ||||||
| Total accumulated gains (losses) | $ | (1,525,973,248 | ) | $ | 131,623,685 | |||
| Inflation | ||||||||
| Income Fund | Focused Fund | |||||||
| Undistributed ordinary income – net | $ | – | $ | – | ||||
| Undistributed long-term capital gains | 50,225,909 | – | ||||||
| Total undistributed earnings | 50,225,909 | – | ||||||
| Capital loss carryforwards* | – | (196,403,408 | ) | |||||
| Temporary differences | (4,059,212 | ) | (397,653 | ) | ||||
| Unrealized gains (losses) – net | 35,238,576 | (7,729,125 | ) | |||||
| Total accumulated gains (losses) | $ | 81,405,273 | $ | (204,530,186 | ) | |||
| Short Duration | Short Duration | |||||||
| Core Bond Fund | Income Fund | |||||||
| Undistributed ordinary income – net | $ | 20,633 | $ | – | ||||
| Total undistributed earnings | 20,633 | – | ||||||
| Capital loss carryforwards* | (387,449 | ) | (2,661,708,441 | ) | ||||
| Temporary differences | (6,635 | ) | (29,900,256 | ) | ||||
| Unrealized gains (losses)-net | (1,803,634 | ) | (1,461,942,940 | ) | ||||
| Total accumulated gains (losses) | $ | (2,177,085 | ) | $ | (4,153,551,637 | ) | ||
| Total | Ultra Short | |||||||
| Return Fund | Bond Fund | |||||||
| Undistributed ordinary income – net | $ | – | $ | 6,073,965 | ||||
| Undistributed long-term capital gains | 24,256,431 | – | ||||||
| Total undistributed earnings | 24,256,431 | 6,073,965 | ||||||
| Capital loss carryforwards* | – | (55,759,281 | ) | |||||
| Temporary differences | (7,535,858 | ) | (1,391,419 | ) | ||||
| Unrealized gains (losses) – net | (2,025,798 | ) | (20,533,084 | ) | ||||
| Total accumulated gains (losses) | $ | 14,694,775 | $ | (71,609,819 | ) | |||
| * | The capital losses will carry forward indefinitely. |
As of November 30, 2021, the aggregate unrealized gains and losses on investments and other financial instruments based on cost for U.S. federal income tax purposes were as follows:
516
Notes to Financial Statements (continued)
| Convertible | Core Fixed | |||||||
| Fund | Income Fund | |||||||
| Tax cost | $ | 1,525,199,911 | $ | 2,249,153,607 | ||||
| Gross unrealized gain | 140,487,876 | 6,807,233 | ||||||
| Gross unrealized loss | (48,087,016 | ) | (9,169,848 | ) | ||||
| Net unrealized security gain/(loss) | $ | 92,400,860 | $ | (2,362,615 | ) | |||
| Core Plus | Corporate | |||||||
| Bond Fund | Bond Fund | |||||||
| Tax cost | $ | 421,050,471 | $ | 11,551,672 | ||||
| Gross unrealized gain | 1,061,769 | 148,827 | ||||||
| Gross unrealized loss | (3,179,658 | ) | (105,910 | ) | ||||
| Net unrealized security gain/(loss) | $ | (2,117,889 | ) | $ | 42,917 | |||
| Floating | High | |||||||
| Rate Fund | Yield Fund | |||||||
| Tax cost | $ | 7,271,386,029 | $ | 7,108,668,037 | ||||
| Gross unrealized gain | 76,363,847 | 273,347,409 | ||||||
| Gross unrealized loss | (60,907,955 | ) | (133,523,594 | ) | ||||
| Net unrealized security gain/(loss) | $ | 15,455,892 | $ | 139,823,815 | ||||
| Inflation | ||||||||
| Income Fund | Focused Fund | |||||||
| Tax cost | $ | 3,180,183,825 | $ | 3,783,861,472 | ||||
| Gross unrealized gain | 55,129,350 | 73,974,390 | ||||||
| Gross unrealized loss | (19,878,011 | ) | (81,703,516 | ) | ||||
| Net unrealized security gain/(loss) | $ | 35,251,339 | $ | (7,729,126 | ) | |||
| Short Duration | Short Duration | |||||||
| Core Bond Fund | Income Fund | |||||||
| Tax cost | $ | 200,082,998 | $ | 65,148,974,254 | ||||
| Gross unrealized gain | 418,509 | 432,902,665 | ||||||
| Gross unrealized loss | (2,222,144 | ) | (1,894,845,101 | ) | ||||
| Net unrealized security gain/(loss) | $ | (1,803,635 | ) | $ | (1,461,942,436 | ) | ||
| Total | Ultra Short | |||||||
| Return Fund | Bond Fund | |||||||
| Tax cost | $ | 4,331,214,697 | $ | 17,386,998,056 | ||||
| Gross unrealized gain | 31,437,633 | 15,660,000 | ||||||
| Gross unrealized loss | (33,456,521 | ) | (36,193,084 | ) | ||||
| Net unrealized security gain/(loss) | $ | (2,018,888 | ) | $ | (20,533,084 | ) | ||
The difference between book-basis and tax-basis unrealized gains (losses) is primarily attributable to the tax treatment of certain securities, certain distributions, amortization of premium, other financial instruments and wash sales.
Permanent items identified during the fiscal year ended November 30, 2021 have been reclassified among the components of net assets based on their tax basis treatment as follows:
| Total distributable | ||||||||
| earnings (loss | ) | Paid-in Capital | ||||||
| Convertible Fund | $ (85,690,173 | ) | $ 85,690,173 | |||||
| Short Duration Income Fund | 593,269 | (593,269 | ) | |||||
| Ultra Short Bond Fund | (1,518,201 | ) | 1,518,201 | |||||
The permanent differences are primarily attributable to the tax treatment of certain distributions and certain redemptions.
517
Notes to Financial Statements (continued)
| 5. | PORTFOLIO SECURITIES TRANSACTIONS |
Purchases and sales of investment securities (excluding short-term investments) for the fiscal year ended November 30, 2021 were as follows:
| U.S. Government Purchases | Non-U.S. Government Purchases | U.S. Government Sales | Non-U.S. Government Sales | |||||||||||||
| Convertible Fund | $ | – | $ | 2,503,767,350 | $ | – | $ | 2,404,728,296 | ||||||||
| Core Fixed Income Fund | 8,841,724,191 | 986,962,021 | 9,168,133,202 | 1,085,062,890 | ||||||||||||
| Core Plus Bond Fund | 627,893,261 | 248,947,786 | 573,107,084 | 212,760,569 | ||||||||||||
| Corporate Bond Fund | 3,672,829 | 9,873,372 | 3,517,069 | 9,144,974 | ||||||||||||
| Floating Rate Fund | – | 6,000,510,878 | – | 5,182,431,951 | ||||||||||||
| High Yield Fund | – | 8,858,375,882 | – | 10,010,586,216 | ||||||||||||
| Income Fund | 1,329,306,898 | 2,308,398,070 | 1,164,284,044 | 2,155,640,246 | ||||||||||||
| Inflation Focused Fund | 1,246,601,665 | 3,217,733,028 | 896,719,514 | 744,322,643 | ||||||||||||
| Short Duration Core Bond Fund | 246,517,799 | 152,582,015 | 254,218,913 | 86,222,242 | ||||||||||||
| Short Duration Income Fund | 17,999,258,326 | 35,835,985,313 | 17,874,054,680 | 29,748,403,588 | ||||||||||||
| Total Return Fund | 13,639,060,470 | 2,088,083,014 | 14,062,184,179 | 2,339,822,912 | ||||||||||||
| Ultra Short Bond Fund | 263,857,800 | 12,049,465,817 | 499,983,827 | 10,970,922,080 | ||||||||||||
Each Fund is permitted to purchase and sell securities (“cross-trade”) from and to other Lord Abbett funds or client accounts pursuant to procedures approved by the Board in compliance with Rule 17a-7 under the Act (the “Rule”). Each cross-trade is executed at a fair market price in compliance with provisions of the Rule. For the fiscal year ended November 30, 2021, the following Funds engaged in cross-trades:
| Fund | Purchases | Sales | Gain (Loss) | |||||||||
| Core Fixed Income Fund | $ | 5,204,585 | $ | – | $ | – | ||||||
| Core Plus Bond Fund | 1,519,569 | 814,456 | 15,415 | |||||||||
| Floating Rate Fund | 4,050,761 | 56,962,083 | 2,115,758 | |||||||||
| High Yield Fund | 9,682,063 | 321,639,768 | 30,572,948 | |||||||||
| Income Fund | 13,770,404 | 30,097,163 | 2,173,556 | |||||||||
| Inflation Focused Fund | 40,677,751 | – | – | |||||||||
| Short Duration Core Bond Fund | 533,200 | – | – | |||||||||
| Short Duration Income Fund | 530,239,358 | – | – | |||||||||
| Total Return Fund | 4,328,527 | 11,617,693 | 434,448 | |||||||||
| Ultra Short Bond Fund | 96,711 | – | – | |||||||||
| 6. | REDEMPTION IN KIND |
During the fiscal year ended November 30, 2021, a shareholder of Short Duration Income Fund and Ultra Short Bond Fund redeemed its Fund shares in exchange for portfolio securities “redemption in kind.” As a result of the redemption in-kind, the Funds realized a net gain of $593,269 and $268,871, respectively.
| 7. | DISCLOSURES ABOUT DERIVATIVE INSTRUMENTS AND HEDGING ACTIVITIES |
Each Fund except for Corporate Bond Fund and Ultra Short Bond Fund entered into forward foreign currency exchange contracts for the fiscal year ended November 30, 2021 (as described in note 2(g)). A forward foreign currency exchange contract reduces each Fund’s exposure to changes in the value of the currency it will deliver (or settle in cash) and increases its exposure to changes in the value of the currency it will receive (or settle in cash) for the duration of the contract. Each Fund’s use of
518
Notes to Financial Statements (continued)
forward foreign currency exchange contracts involves the risk that Lord Abbett will not accurately predict currency movements, and each Fund’s returns could be reduced as a result. Forward foreign currency exchange contracts are subject to the risk that those currencies will decline in value relative to the U.S. dollar, or, in the case of hedged positions, that the U.S. dollar will decline relative to the currency being hedged. Currency rates in foreign countries may fluctuate significantly over short periods of time. Each Fund’s risk of loss from counterparty credit risk is the unrealized appreciation on forward foreign currency exchange contracts and deposits with brokers for collateral.
Each Fund except for Convertible Fund entered into U.S. Treasury futures contracts for the fiscal year ended November 30, 2021 (as described in Note 2(h)) to economically hedge against changes in interest rates. The Funds bear the risk of interest rates moving unexpectedly, in which case the Funds may not achieve the anticipated benefits of the futures contracts and realize a loss. There is minimal counterparty credit risk to the Funds since futures are exchange traded and the exchange’s clearinghouse, as counterparty to all exchange traded futures, guarantees futures against default.
Inflation Focused Fund entered into CPI swaps for the fiscal year ended November 30, 2021 (as described in note 2(p)) to speculate the rate of inflation in the U.S. economy. The Fund’s use of CPI swaps involves the risk that Lord Abbett will not accurately predict expectations of inflation or interest rates, and the Fund’s returns could be reduced as a result. The Fund’s risk of loss from counterparty credit risk is the unrealized appreciation on CPI swaps. For the centrally cleared CPI swaps, there is minimal counterparty credit risk to the Fund since these CPI swaps are traded through a central clearinghouse. As a counterparty to all centrally cleared CPI swaps, the clearinghouse guarantees CPI swaps against default.
Core Fixed Income Fund, Core Plus Bond Fund, High Yield Fund, Income Fund, Inflation Focused Fund, Short Duration Core Bond Fund, Short Duration Income Fund and Total Return Fund entered into credit default swaps for the fiscal year ended November 30, 2021 (as described in Note 2(q)) for investment purposes, to economically hedge credit risk or for speculative purposes. Credit default swaps involve the exchange of a fixed rate premium for protection against the loss in value of an underlying security in the event of a defined credit event, such as payment default or bankruptcy. Under a credit default swap one party acts as a guarantor by receiving the fixed periodic payment in exchange for the commitment to purchase the underlying security at par if the defined credit event occurs. Upon the occurrence of a defined credit event, the difference between the value of the reference obligation and the swap’s notional amount is recorded as realized gain or loss on swap transactions in the Statements of Operations. Each Fund’s maximum risk of loss from counterparty risk, either as the protection seller or as the protection buyer, is the fair value of the contract. For the centrally cleared credit default swaps, there is minimal counterparty credit risk to the Funds since these credit default swaps are traded through a central clearinghouse. As a counterparty to all centrally cleared credit default swaps, the clearinghouse guarantees credit default swaps against default.
Floating Rate Fund entered into total return swaps on indexes for the fiscal year ended November 30, 2021 (as described in Note 2(s)) to hedge credit risk. The Fund may enter into total return swap agreements to obtain exposure to a security or market without owning such security or investing directly in that market. The Fund may agree to make payments that are the equivalent of interest in exchange for the right to receive payments equivalent to any appreciation in the value of an underlying security, index or other asset, as well as receive payments equivalent to any distributions made on that asset, over the term of the swap. If the value of the asset underlying a total return
519
Notes to Financial Statements (continued)
swap declines over the term of the swap, the Fund also may be required to pay an amount equal to that decline in value to its counterparty.
Floating Rate Fund and Inflation Focused Fund entered into interest rate swaps for the fiscal year ended November 30, 2021 (as described in Note 2(r)) in order to enhance returns or hedge against interest rate risk. Interest rate swaps are agreements in which one party pays a stream of interest payments, either fixed or floating, for another party’s stream of interest payments, either fixed or floating, on the same notional amount for a specified period of time. The interest rate swap agreement will normally be entered into on a zero coupon basis, meaning that the floating rate will be based on the cumulative of the variable rate, and the fixed rate will compound until the swap’s maturity date, at which point the payments would be netted.
As of November 30, 2021, each Fund had the following derivatives at fair value, grouped into appropriate risk categories that illustrate each Fund’s use of derivative instruments:
| Convertible Fund | ||||||||||||
| Asset Derivatives | Foreign Currency Contracts | |||||||||||
| Forward Foreign Currency Exchange Contracts(1) | $ | 2,369,831 | ||||||||||
| Liability Derivatives | ||||||||||||
| Forward Foreign Currency Exchange Contracts(2) | $ | 17,961 | ||||||||||
| Core Fixed Income Fund | ||||||||||||
| Asset Derivatives | Interest Rate Contracts | Credit Contracts | ||||||||||
| Futures Contracts(3) | $ | 5,229,292 | – | |||||||||
| Liability Derivatives | ||||||||||||
| Credit Default Swap Contracts(4) | – | $ | 1,709,565 | |||||||||
| Futures Contracts(3) | $ | 1,443,424 | – | |||||||||
| Core Plus Bond Fund | ||||||||||||
| Asset Derivatives | Interest Rate Contracts | Foreign Currency Contracts | Credit Contracts | |||||||||
| Forward Foreign Currency Exchange Contracts(1) | – | $ | 34,832 | – | ||||||||
| Futures Contracts(3) | $ | 376,889 | – | – | ||||||||
| Liability Derivatives | ||||||||||||
| Credit Default Swap Contracts(4) | – | – | $ | 451,437 | ||||||||
| Forward Foreign Currency Exchange Contracts(2) | – | $ | 6,561 | – | ||||||||
520
Notes to Financial Statements (continued)
| Corporate Bond Fund | ||||||||||||||||
| Asset Derivatives | Interest Rate Contracts | |||||||||||||||
| Futures Contracts(3) | $ | 38,463 | ||||||||||||||
| Liability Derivatives | ||||||||||||||||
| Futures Contracts(3) | $ | 30,343 | ||||||||||||||
| Floating Rate Fund | ||||||||||||||||
| Asset Derivatives | Equity Contracts | Interest Rate Contracts | Foreign Currency Contracts | Credit Contracts | ||||||||||||
| Centrally Cleared Credit Default Swap Contracts(5) | – | – | – | $ | 1,825,272 | |||||||||||
| Centrally Cleared Interest Rate Swap Contracts(5) | – | $ | 1,185,596 | – | – | |||||||||||
| Forward Foreign Currency Exchange Contracts(1) | – | – | $ | 5,746,691 | – | |||||||||||
| Liability Derivatives | ||||||||||||||||
| Centrally Cleared Interest Rate Contracts(5) | – | $ | 173,779 | – | $ | – | ||||||||||
| Forward Foreign Currency Exchange Contracts(2) | – | – | $ | 609,765 | – | |||||||||||
| Futures Contracts(3) | – | $ | 2,815,105 | – | – | |||||||||||
| Total Return Swap Contracts(6) | $ | 4,939,416 | – | – | – | |||||||||||
| High Yield Fund | ||||||||||||||||
| Asset Derivatives | Interest Rate Contracts | Foreign Currency Contracts | Credit Contracts | |||||||||||||
| Centrally Cleared Credit Default Swap Contracts(5) | – | – | $ | 5,784,463 | ||||||||||||
| Forward Foreign Currency Exchange Contracts(1) | – | $ | 14,841,497 | – | ||||||||||||
| Futures Contracts(3) | $ | 11,008,449 | – | – | ||||||||||||
| Liability Derivatives | ||||||||||||||||
| Centrally Cleared Credit Default Swap Contracts(5) | – | – | $ | 64,820 | ||||||||||||
| Credit Default Swap Contracts(4) | – | – | $ | 24,316,698 | ||||||||||||
| Forward Foreign Currency Exchange Contracts(2) | – | $ | 2,591,267 | – | ||||||||||||
| Futures Contracts(3) | $ | 13,750,342 | – | – | ||||||||||||
521
Notes to Financial Statements (continued)
| Income Fund | ||||||||||||
| Asset Derivatives | Interest Rate Contracts | Foreign Currency Contracts | Credit Contracts | |||||||||
| Forward Foreign Currency Exchange Contracts(1) | – | $ | 1,964,049 | – | ||||||||
| Futures Contracts(3) | $ | 3,917,871 | – | – | ||||||||
| Liability Derivatives | ||||||||||||
| Credit Default Swap Contracts(4) | – | – | $ | 2,478,617 | ||||||||
| Forward Foreign Currency Exchange Contracts(2) | – | $ | 21,460 | – | ||||||||
| Futures Contracts(3) | $ | 7,513 | – | – | ||||||||
| Inflation Focused Fund | ||||||||||||
| Asset Derivatives | Interest Rate Contracts | Inflation Linked Contracts | ||||||||||
| Centrally Cleared CPI Swap Contracts(5) | – | $ | 86,997,090 | |||||||||
| Centrally Cleared Interest Rate Swap Contracts(5) | $ | 5,649 | – | |||||||||
| CPI Swap Contracts(7) | – | $ | 37,073,339 | |||||||||
| Futures Contracts(3) | $ | 1,070,877 | – | |||||||||
| Liability Derivatives | ||||||||||||
| Centrally Cleared CPI Swap Contracts(5) | – | $ | 12,084,542 | |||||||||
| Centrally Cleared Interest Rate Contracts(5) | $ | 5,969 | – | |||||||||
| CPI Swap Contracts(8) | – | $ | 49,497,495 | |||||||||
| Short Duration Core Bond Fund | ||||||||||||
| Asset Derivatives | Interest Rate Contracts | Credit Contracts | ||||||||||
| Credit Default Swap Contracts(4) | – | $ | 7,044 | |||||||||
| Futures Contracts(3) | $ | 18,082 | – | |||||||||
| Liability Derivatives | ||||||||||||
| Futures Contracts(3) | $ | 33,524 | – | |||||||||
522
Notes to Financial Statements (continued)
| Short Duration Income Fund | ||||||||||||
| Asset Derivatives | Interest Rate Contracts | Foreign Currency Contracts | Credit Contracts | |||||||||
| Credit Default Swap Contracts(4) | – | – | $ | 1,072,959 | ||||||||
| Forward Foreign Currency Exchange Contracts(1) | – | $ | 912,278 | – | ||||||||
| Futures Contracts(3) | $ | 24,609,275 | – | – | ||||||||
| Liability Derivatives | ||||||||||||
| Credit Default Swap Contracts(4) | – | – | $ | 15,056,521 | ||||||||
| Forward Foreign Currency Exchange Contracts(2) | – | $ | 4,103,165 | – | ||||||||
| Futures Contracts(3) | $ | 9,351,402 | – | – | ||||||||
| Total Return Fund | ||||||||||||
| Asset Derivatives | Interest Rate Contracts | Foreign Currency Contracts | Credit Contracts | |||||||||
| Centrally Cleared Credit Default Swap Contracts(5) | – | – | $ | 872,370 | ||||||||
| Credit Default Swap Contracts(4) | – | – | $ | 31,296 | ||||||||
| Forward Foreign Currency Exchange Contracts(1) | – | $ | 1,015,307 | – | ||||||||
| Futures Contracts(3) | $ | 13,983,087 | – | – | ||||||||
| Liability Derivatives | ||||||||||||
| Credit Default Swap Contracts(4) | – | – | $ | 4,099,898 | ||||||||
| Forward Foreign Currency Exchange Contracts(2) | – | $ | 98,976 | – | ||||||||
| Futures Contracts(3) | $ | 3,967,522 | – | – | ||||||||
| Ultra Short Bond Fund | ||||||||||||
| Liability Derivatives | Interest Rate Contracts | |||||||||||
| Futures Contracts(3) | $ | 3,224,099 | ||||||||||
| (1) | Statements of Assets and Liabilities location: Unrealized appreciation on forward foreign currency exchange contracts. |
| (2) | Statements of Assets and Liabilities location: Unrealized depreciation on forward foreign currency exchange contracts. |
| (3) | Statements of Assets and Liabilities location: Includes cumulative unrealized appreciation/depreciation of futures contracts as reported in the Schedules of Investments. Only current day’s variation margin is reported within the Statements of Assets and Liabilities. |
| (4) | Statements of Assets and Liabilities location: Credit default swap agreements receivable/payable, at fair value. |
| (5) | Statements of Assets and Liabilities location: Includes cumulative unrealized appreciation/depreciation of centrally cleared swap contracts as reported in the Schedules of Investments. Only current day’s variation margin is reported within the Statements of Assets and Liabilities. |
| (6) | Statements of Assets and Liabilities location: Total Return Swaps, at fair value. |
| (7) | Statements of Assets and Liabilities location: Unrealized appreciation on CPI swaps. |
| (8) | Statements of Assets and Liabilities location: Unrealized depreciation on CPI swaps. |
523
Notes to Financial Statements (continued)
Transactions in derivative investments for the fiscal year ended November 30, 2021 were as follows:
| Convertible Fund | ||||||||||||
| Foreign Currency Contracts | ||||||||||||
| Net Realized Gain (Loss) | ||||||||||||
| Forward Foreign Currency Exchange Contracts(1) | $ | (3,399,530 | ) | |||||||||
| Net Change in Unrealized Appreciation/ Depreciation | ||||||||||||
| Forward Foreign Currency Exchange Contracts(2) | $ | 2,736,224 | ||||||||||
| Average Number of Contracts/Notional Amounts* | ||||||||||||
| Forward Foreign Currency Exchange Contracts(3) | $ | 69,014,631 | ||||||||||
| Core Fixed Income Fund | ||||||||||||
| Inflation Linked/ Interest Rate Contracts | Foreign Currency Contracts | Credit Contracts | ||||||||||
| Net Realized Gain (Loss) | ||||||||||||
| CPI/Interest Rate Swap Contracts(4) | $ | (2,974,225 | ) | – | – | |||||||
| Credit Default Swaps Contracts(4) | – | – | $ | 310,794 | ||||||||
| Forward Foreign Currency Exchange Contracts(1) | – | $ | 184,157 | – | ||||||||
| Futures Contracts(5) | $ | (3,965,876 | ) | – | – | |||||||
| Net Change in Unrealized Appreciation/Depreciation | ||||||||||||
| Credit Default Swaps(6) | – | – | $ | 277,396 | ||||||||
| Forward Foreign Currency Exchange Contracts(2) | – | $ | 123,919 | – | ||||||||
| Futures Contracts(7) | $ | 3,283,768 | – | – | ||||||||
| Average Number of Contracts/Notional Amounts* | ||||||||||||
| CPI/Interest Rate Swap Contracts(8) | 26,750,000 | – | – | |||||||||
| Credit Default Swap Contracts(8) | – | – | 63,166,667 | |||||||||
| Forward Foreign Currency Exchange Contracts(3) | – | $ | 6,693,869 | – | ||||||||
| Futures Contracts(8) | 2,509 | – | – | |||||||||
524
Notes to Financial Statements (continued)
| Core Plus Bond Fund | ||||||||||||
| Inflation Linked/ Interest Rate Contracts | Foreign Currency Contracts | Credit Contracts | ||||||||||
| Net Realized Gain (Loss) | ||||||||||||
| CPI/Interest Rate Swap Contracts(4) | $ | (413,624 | ) | – | – | |||||||
| Credit Default Swaps Contracts(4) | – | – | $ | (105,389 | ) | |||||||
| Forward Foreign Currency Exchange Contracts(1) | – | $ | (14,765 | ) | – | |||||||
| Futures Contracts(5) | $ | (568,970 | ) | – | – | |||||||
| Net Change in Unrealized Appreciation/Depreciation | ||||||||||||
| Credit Default Swaps(6) | – | – | $ | (68,046 | ) | |||||||
| Forward Foreign Currency Exchange Contracts(2) | – | $ | 54,832 | – | ||||||||
| Futures Contracts(7) | $ | 305,192 | – | – | ||||||||
| Average Number of Contracts/Notional Amounts* | ||||||||||||
| CPI/Interest Rate Swap Contracts(8) | 3,716,667 | – | – | |||||||||
| Credit Default Swap Contracts(8) | – | – | 7,591,333 | |||||||||
| Forward Foreign Currency Exchange Contracts(3) | – | $ | 1,967,656 | – | ||||||||
| Futures(8) | 403 | |||||||||||
| Corporate Bond Fund | ||||||||||||
Inflation Linked/ Interest Rate Contracts | ||||||||||||
| Net Realized Gain (Loss) | ||||||||||||
| Futures Contracts(5) | $ | 51,937 | ||||||||||
| Net Change in Unrealized Appreciation/Depreciation | ||||||||||||
| Futures Contracts(7) | $ | 7,328 | ||||||||||
| Average Number of Contracts/Notional Amounts* | ||||||||||||
| Futures Contracts(8) | 31 | |||||||||||
525
Notes to Financial Statements (continued)
| Floating Rate Fund | ||||||||||||||||
| Equity Contracts | Inflation Linked/ Interest Rate Contracts | Foreign Currency Contracts | Credit Contracts | |||||||||||||
| Net Realized Gain (Loss) | ||||||||||||||||
| CPI/Interest Rate Swaps(4) | – | $ | 1,480,948 | – | – | |||||||||||
| Credit Default Swaps Contracts(4) | – | – | $ | (1,593,469 | ) | |||||||||||
| Forward Foreign Currency Exchange Contracts(1) | – | – | $ | 507,633 | – | |||||||||||
| Futures Contracts(5) | – | $ | 4,908,240 | – | – | |||||||||||
| Total Return Swap Contracts(4) | $ | 4,854,677 | – | – | – | |||||||||||
| Net Change in Unrealized Appreciation/Depreciation | ||||||||||||||||
| CPI/Interest Rate Swaps(6) | – | $ | 1,212,242 | – | – | |||||||||||
| Credit Default Swaps(6) | – | – | – | $ | 1,825,272 | |||||||||||
| Forward Foreign Currency Exchange Contracts(2) | – | – | $ | 5,735,899 | – | |||||||||||
| Futures Contracts(7) | – | $ | (2,662,905 | ) | – | – | ||||||||||
| Total Return Swap Contracts(6) | $ | (6,232,506 | ) | – | – | – | ||||||||||
| Average Number of Contracts/Notional Amounts* | ||||||||||||||||
| CPI/Interest Rate Swap Contracts(8) | – | 99,238,477 | – | – | ||||||||||||
| Credit Default Swap Contracts(8) | – | – | – | 45,746,583 | ||||||||||||
| Forward Foreign Currency Exchange Contracts(3) | – | – | $ | 146,593,300 | – | |||||||||||
| Futures Contracts(8) | – | 3,834 | – | – | ||||||||||||
| Total Return Swap Contracts(8) | 1,262,797 | – | – | – | ||||||||||||
526
Notes to Financial Statements (continued)
| High Yield Fund | ||||||||||||
| Inflation Linked/ Interest Rate Contracts | Foreign Currency Contracts | Credit Contracts | ||||||||||
| Net Realized Gain (Loss) | ||||||||||||
| Credit Default Swaps Contracts(4) | – | – | $ | 3,388,532 | ||||||||
| Forward Foreign Currency Exchange Contracts(1) | – | $ | 1,181,414 | – | ||||||||
| Futures Contracts(5) | $ | 21,817,545 | – | – | ||||||||
| Net Change in Unrealized Appreciation/Depreciation | ||||||||||||
| Credit Default Swaps(6) | – | – | $ | 12,510,610 | ||||||||
| Forward Foreign Currency Exchange Contracts(2) | – | $ | 14,069,000 | – | ||||||||
| Futures Contracts(7) | $ | (2,969,875 | ) | – | – | |||||||
| Average Number of Contracts/Notional Amounts* | ||||||||||||
| Credit Default Swap Contracts(8) | – | – | 654,181,680 | |||||||||
| Forward Foreign Currency Exchange Contracts(3) | – | $ | 442,270,539 | – | ||||||||
| Futures Contracts(8) | 20,065 | – | – | |||||||||
| Income Fund | ||||||||||||
| Inflation Linked/ Interest Rate Contracts | Foreign Currency Contracts | Credit Contracts | ||||||||||
| Net Realized Gain (Loss) | ||||||||||||
| CPI/Interest Rate Swap Contracts(4) | $ | (4,443,703 | ) | – | – | |||||||
| Credit Default Swaps Contracts(4) | – | – | $ | 6,342,256 | ||||||||
| Forward Foreign Currency Exchange Contracts(1) | – | $ | 274,192 | – | ||||||||
| Futures Contracts(5) | $ | (6,110,868 | ) | – | – | |||||||
| Net Change in Unrealized Appreciation/Depreciation | ||||||||||||
| Credit Default Swaps(6) | – | – | $ | (4,539,958 | ) | |||||||
| Forward Foreign Currency Exchange Contracts(2) | – | $ | 2,085,073 | – | ||||||||
| Futures Contracts(7) | $ | 3,494,871 | – | – | ||||||||
| Average Number of Contracts/Notional Amounts* | ||||||||||||
| CPI/Interest Rate Swap Contracts(8) | 39,843,333 | – | – | |||||||||
| Credit Default Swap Contracts(8) | – | – | 46,257,021 | |||||||||
| Forward Foreign Currency Exchange Contracts(3) | – | $ | 40,186,684 | – | ||||||||
| Futures Contracts(8) | 3,201 | |||||||||||
527
Notes to Financial Statements (continued)
| Inflation Focused Fund | ||||||||||||
| Inflation Linked/ Interest Rate Contracts | Foreign Currency Contracts | Credit Contracts | ||||||||||
| Net Realized Gain (Loss) | ||||||||||||
| CPI/Interest Rate Swaps(4) | $ | (67,701,936 | ) | – | – | |||||||
| Credit Default Swaps Contracts(4) | – | – | $ | 1,010 | ||||||||
| Forward Foreign Currency Exchange Contracts(1) | – | $ | (26,551 | ) | – | |||||||
| Futures Contracts(5) | $ | (7,083,076 | ) | – | – | |||||||
| Net Change in Unrealized Appreciation/Depreciation | ||||||||||||
| CPI/Interest Rate Swaps(6) | $ | 216,464,700 | – | – | ||||||||
| Credit Default Swaps(6) | – | – | $ | (195,851 | ) | |||||||
| Forward Foreign Currency Exchange Contracts(2) | – | $ | 3,275 | – | ||||||||
| Futures Contracts(7) | $ | 794,025 | – | – | ||||||||
| Average Number of Contracts/Notional Amounts* | ||||||||||||
| CPI/Interest Rate Swap Contracts(8) | $ | 3,303,851,133 | – | – | ||||||||
| Credit Default Swap Contracts(8) | – | – | 995,514 | |||||||||
| Forward Foreign Currency Exchange Contracts(3) | – | $ | 630,682 | – | ||||||||
| Futures Contracts(8) | 3,166 | |||||||||||
528
Notes to Financial Statements (continued)
| Short Duration Core Bond Fund | ||||||||||||
| Inflation Linked/ Interest Rate Contracts | Foreign Currency Contracts | Credit Contracts | ||||||||||
| Net Realized Gain (Loss) | ||||||||||||
| Credit Default Swaps Contracts(4) | – | – | $ | (69,131 | ) | |||||||
| Forward Foreign Currency Exchange Contracts(1) | – | $ | (5,545 | ) | – | |||||||
| Futures Contracts(5) | $ | 158,143 | – | – | ||||||||
| Net Change in Unrealized Appreciation/Depreciation | ||||||||||||
| Credit Default Swaps(6) | – | – | $ | 117,054 | ||||||||
| Forward Foreign Currency Exchange Contracts(2) | – | $ | 1,638 | – | ||||||||
| Futures Contracts(7) | $ | (11,463 | ) | – | – | |||||||
| Average Number of Contracts/Notional Amounts* | ||||||||||||
| Credit Default Swap Contracts(8) | – | – | 607,167 | |||||||||
| Forward Foreign Currency Exchange Contracts(3) | – | $ | 106,471 | – | ||||||||
| Futures Contracts(8) | 111 | – | – | |||||||||
| Short Duration Income Fund | ||||||||||||
| Inflation Linked/ Interest Rate Contracts | Foreign Currency Contracts | Credit Contracts | ||||||||||
| Net Realized Gain (Loss) | ||||||||||||
| Credit Default Swaps Contracts(4) | – | – | $ | 29,033,257 | ||||||||
| Forward Foreign Currency Exchange Contracts(1) | – | $ | 10,523,212 | – | ||||||||
| Futures Contracts(5) | $ | 10,860,392 | – | – | ||||||||
| Net Change in Unrealized Appreciation/Depreciation | ||||||||||||
| Credit Default Swaps(6) | – | – | $ | (16,266,793 | ) | |||||||
| Forward Foreign Currency Exchange Contracts(2) | – | $ | (1,954,612 | ) | – | |||||||
| Futures Contracts(7) | $ | 12,524,163 | – | – | ||||||||
| Average Number of Contracts/Notional Amounts* | ||||||||||||
| Credit Default Swap Contracts(8) | – | – | 473,652,107 | |||||||||
| Forward Foreign Currency Exchange Contracts(3) | – | $ | 208,709,433 | – | ||||||||
| Futures(8) | 127,943 | – | – | |||||||||
529
Notes to Financial Statements (continued)
| Total Return Fund | ||||||||||||
| Inflation Linked/ Interest Rate Contracts | Foreign Currency Contracts | Credit Contracts | ||||||||||
| Net Realized Gain (Loss) | ||||||||||||
| CPI/Interest Rate Swaps(4) | $ | (6,077,223 | ) | – | – | |||||||
| Credit Default Swaps Contracts(4) | – | – | $ | (2,593,931 | ) | |||||||
| Forward Foreign Currency Exchange Contracts(1) | – | $ | (567,889 | ) | – | |||||||
| Futures Contracts(5) | $ | (21,063,812 | ) | – | – | |||||||
| Net Change in Unrealized Appreciation/Depreciation | ||||||||||||
| Credit Default Swaps(6) | – | – | $ | 924,513 | ||||||||
| Forward Foreign Currency Exchange Contracts(2) | – | $ | 1,353,994 | – | ||||||||
| Futures Contracts(7) | $ | 8,319,211 | – | – | ||||||||
| Average Number of Contracts/Notional Amounts* | ||||||||||||
| CPI/Interest Rate Swap Contracts(8) | 54,690,000 | – | – | |||||||||
| Credit Default Swap Contracts(8) | – | – | 234,870,833 | |||||||||
| Forward Foreign Currency Exchange Contracts(3) | – | $ | 37,957,818 | – | ||||||||
| Futures Contracts(8) | 9,676 | |||||||||||
| Ultra Short Bond Fund | ||||||||||||
| Inflation Linked/ Interest Rate Contracts | ||||||||||||
| Net Realized Gain (Loss) | ||||||||||||
| Futures Contracts(5) | $ | 3,507,439 | ||||||||||
| Net Change in Unrealized Appreciation/Depreciation | ||||||||||||
| Futures Contracts(7) | $ | (3,224,099 | ) | |||||||||
| Average Number of Contracts/Notional Amounts* | ||||||||||||
| Futures Contracts(8) | 671 | |||||||||||
| * | Calculated based on the number of contracts or notional amounts for the fiscal year ended November 30, 2021. |
| (1) | Statements of Operations location: Net realized gain (loss) on forward foreign currency exchange contracts. |
| (2) | Statements of Operations location: Net change in unrealized appreciation/depreciation on forward foreign currency exchange contracts. |
| (3) | Amount represents notional amounts in U.S. dollars. |
| (4) | Statements of Operations location: Net realized gain (loss) on swap contracts. |
| (5) | Statements of Operations location: Net realized gain (loss) on futures contracts. |
| (6) | Statements of Operations location: Net change in unrealized appreciation/depreciation on swap contracts. |
| (7) | Statements of Operations location: Net change in unrealized appreciation/depreciation on futures contracts. |
| (8) | Amount represents number of contracts. |
530
Notes to Financial Statements (continued)
| 8. | DISCLOSURES ABOUT OFFSETTING ASSETS AND LIABILITIES |
The Financial Accounting Standards Board requires disclosures intended to help better assess the effect or potential effect of offsetting arrangements on a fund’s financial position. The following tables illustrate gross and net information about recognized assets and liabilities eligible for offset in the Statements of Assets and Liabilities; and disclose such amounts subject to an enforceable master netting agreement or similar agreement, by a counterparty. A master netting agreement is an agreement between a fund and a counterparty which provides for the net settlement of amounts owed under all contracts traded under that agreement, as well as cash collateral, through a single payment by one party to the other in the event of default on or termination of any one contract. The Funds’ accounting policy with respect to balance sheet offsetting is that, absent an event of default by the counterparty or a termination of the agreement, the master netting agreement does not result in an offset of reported amounts of financial assets and liabilities in the Statements of Assets and Liabilities across transactions between the Funds and the applicable counterparty:
| Convertible Fund | ||||||||||||
| Description | Gross Amounts of Recognized Assets | Gross Amounts Offset in the Statement of Assets and Liabilities | Net Amounts of Assets Presented in the Statement of Assets and Liabilities | |||||||||
| Forward Foreign Currency Exchange Contracts | $ | 2,369,831 | $ | – | $ | 2,369,831 | ||||||
| Repurchase Agreements | 74,564,305 | – | 74,564,305 | |||||||||
| Total | $ | 76,934,136 | $ | – | $ | 76,934,136 | ||||||
| Net Amount of Assets Presented in | Amounts Not Offset in the Statement of Assets and Liabilities | |||||||||||||||||||
| Counterparty | the Statement of Assets and Liabilities | Financial Instruments | Cash Collateral Received(a) | Securities Collateral Received(a) | Net Amount(b) | |||||||||||||||
| Morgan Stanley | $ | 34,618 | $ | – | $ | – | $ | – | $ | 34,618 | ||||||||||
| State Street Bank and Trust | 662,156 | (17,961 | ) | (630,000 | ) | – | 14,195 | |||||||||||||
| Toronto Dominion Bank | 1,673,057 | – | (1,673,057 | ) | – | – | ||||||||||||||
| Fixed Income Clearing Corp. | 74,564,305 | – | – | (74,564,305 | ) | – | ||||||||||||||
| Total | $ | 76,934,136 | $ | (17,961 | ) | $ | (2,303,057 | ) | $ | (74,564,305 | ) | $ | 48,813 | |||||||
| Description | Gross Amounts of Recognized Liabilities | Gross Amounts Offset in the Statement of Assets and Liabilities | Net Amounts of Liabilities Presented in the Statement of Assets and Liabilities | |||||||||
| Forward Foreign Currency Exchange Contracts | $ | 17,961 | $ | – | $ | 17,961 | ||||||
| Total | $ | 17,961 | $ | – | $ | 17,961 | ||||||
| Net Amounts of Liabilities Presented in | Amounts Not Offset in the Statement of Assets and Liabilities | |||||||||||||||||||
| Counterparty | the Statement of Assets and Liabilities | Financial Instruments | Cash Collateral Pledged(a) | Securities Collateral Pledged(a) | Net Amount(c) | |||||||||||||||
| State Street Bank and Trust | $ | 17,961 | $ | (17,961 | ) | $ | – | $ | – | $ | – | |||||||||
| Total | $ | 17,961 | $ | (17,961 | ) | $ | – | $ | – | $ | – | |||||||||
531
Notes to Financial Statements (continued)
| Core Fixed Income Fund | ||||||||||||
| Description | Gross Amounts of Recognized Assets | Gross Amounts Offset in the Statement of Assets and Liabilities | Net Amounts of Assets Presented in the Statement of Assets and Liabilities | |||||||||
| Repurchase Agreements | $ | 67,487,439 | $ | – | $ | 67,487,439 | ||||||
| Total | $ | 67,487,439 | $ | – | $ | 67,487,439 | ||||||
| Net Amount of Assets Presented in | Amounts Not Offset in the Statement of Assets and Liabilities | |||||||||||||||||||
| Counterparty | the Statement of Assets and Liabilities | Financial Instruments | Cash Collateral Received(a) | Securities Collateral Received(a) | Net Amount(b) | |||||||||||||||
| Fixed Income Clearing Corp. | $ | 67,487,439 | $ | – | $ | – | $(67,487,439 | ) | $ | – | ||||||||||
| Total | $ | 67,487,439 | $ | – | $ | – | $(67,487,439 | ) | $ | – | ||||||||||
| Description | Gross Amounts of Recognized Liabilities | Gross Amounts Offset in the Statement of Assets and Liabilities | Net Amounts of Liabilities Presented in the Statement of Assets and Liabilities | |||||||||
| Credit Default Swap Contracts | $ | 1,709,565 | $ | – | $ | 1,709,565 | ||||||
| Total | $ | 1,709,565 | $ | – | $ | 1,709,565 | ||||||
| Net Amounts of Liabilities Presented in | Amounts Not Offset in the Statement of Assets and Liabilities | |||||||||||||||||||
| Counterparty | the Statement of Assets and Liabilities | Financial Instruments | Cash Collateral Pledged(a) | Securities Collateral Pledged(a) | Net Amount(c) | |||||||||||||||
| Citibank | $ | 663,168 | $ | – | $ | (593,123 | ) | $ | – | $ | 70,045 | |||||||||
| Goldman Sachs | 269,826 | – | (269,826 | ) | – | – | ||||||||||||||
| Morgan Stanley | 776,571 | – | (730,000 | ) | – | 46,571 | ||||||||||||||
| Total | $ | 1,709,565 | $ | – | $ | (1,592,949 | ) | $ | – | $ | 116,616 | |||||||||
| Core Plus Bond Fund | ||||||||||||
| Description | Gross Amounts of Recognized Assets | Gross Amounts Offset in the Statement of Assets and Liabilities | Net Amounts of Assets Presented in the Statement of Assets and Liabilities | |||||||||
| Forward Foreign Currency Exchange Contracts | $ | 34,832 | $ | – | $ | 34,832 | ||||||
| Repurchase Agreements | 9,417,831 | – | 9,417,831 | |||||||||
| Total | $ | 9,452,663 | $ | – | $ | 9,452,663 | ||||||
| Net Amount of Assets Presented in | Amounts Not Offset in the Statement of Assets and Liabilities | |||||||||||||||||||
| Counterparty | the Statement of Assets and Liabilities | Financial Instruments | Cash Collateral Received(a) | Securities Collateral Received(a) | Net Amount(b) | |||||||||||||||
| State Street Bank and Trust | $ | 13,511 | $ | – | $ | – | $ | – | $ | 13,511 | ||||||||||
| Toronto Dominion Bank | 21,321 | – | – | – | 21,321 | |||||||||||||||
| Fixed Income Clearing Corp. | 9,417,831 | – | – | (9,417,831 | ) | – | ||||||||||||||
| Total | $ | 9,452,663 | $ | – | $ | – | $ | (9,417,831 | ) | $ | 34,832 | |||||||||
532
Notes to Financial Statements (continued)
| Core Plus Bond Fund | ||||||||||||
| Description | Gross Amounts of Recognized Liabilities | Gross Amounts Offset in the Statement of Assets and Liabilities | Net Amounts of Liabilities Presented in the Statement of Assets and Liabilities | |||||||||
| Credit Default Swap Contracts | $ | 451,437 | $ | – | $ | 451,437 | ||||||
| Forward Foreign Currency Exchange Contracts | 6,561 | – | 6,561 | |||||||||
| Total | $ | 457,998 | $ | – | $ | 457,998 | ||||||
| Net Amounts of Liabilities Presented in | Amounts Not Offset in the Statement of Assets and Liabilities | |||||||||||||||||||
| Counterparty | the Statement of Assets and Liabilities | Financial Instruments | Cash Collateral Pledged(a) | Securities Collateral Pledged(a) | Net Amount(c) | |||||||||||||||
| Bank of America | $ | 3,197 | $ | – | $ | – | $ | – | $ | 3,197 | ||||||||||
| Citibank | 183,012 | – | – | – | 183,012 | |||||||||||||||
| Goldman Sachs | 49,358 | – | – | – | 49,358 | |||||||||||||||
| Morgan Stanley | 222,431 | – | – | – | 222,431 | |||||||||||||||
| Total | $ | 457,998 | $ | – | $ | – | $ | – | $ | 457,998 | ||||||||||
| Corporate Bond Fund | ||||||||||||
| Description | Gross Amounts of Recognized Assets | Gross Amounts Offset in the Statement of Assets and Liabilities | Net Amounts of Assets Presented in the Statement of Assets and Liabilities | |||||||||
| Repurchase Agreements | $ | 314,281 | $ | – | $ | 314,281 | ||||||
| Total | $ | 314,281 | $ | – | $ | 314,281 | ||||||
| Net Amount of Assets Presented in | Amounts Not Offset in the Statement of Assets and Liabilities | |||||||||||||||||||
| Counterparty | the Statement of Assets and Liabilities | Financial Instruments | Cash Collateral Received(a) | Securities Collateral Received(a) | Net Amount(b) | |||||||||||||||
| Fixed Income Clearing Corp. | $ | 314,281 | $ | – | $ | – | $(341,281 | ) | $ | – | ||||||||||
| Total | $ | 314,281 | $ | – | $ | – | $(341,281 | ) | $ | – | ||||||||||
| Floating Rate Fund | ||||||||||||
| Description | Gross Amounts of Recognized Assets | Gross Amounts Offset in the Statement of Assets and Liabilities | Net Amounts of Assets Presented in the Statement of Assets and Liabilities | |||||||||
| Forward Foreign Currency Exchange Contracts | $ | 5,746,691 | $ | – | $ | 5,746,691 | ||||||
| Repurchase Agreements | 858,796,061 | – | 858,796,061 | |||||||||
| Total | $ | 864,542,752 | $ | – | $ | 864,542,752 | ||||||
533
Notes to Financial Statements (continued)
| Floating Rate Fund | ||||||||||||||||||||
| Net Amount of Assets Presented in | Amounts Not Offset in the Statement of Assets and Liabilities | |||||||||||||||||||
| Counterparty | the Statement of Assets and Liabilities | Financial Instruments | Cash Collateral Received(a) | Securities Collateral Received(a) | Net Amount(b) | |||||||||||||||
| Bank of America | $ | 257,885 | $ | (16,912 | ) | $ | – | $ | – | $ | 240,973 | |||||||||
| Barclays Bank plc | 1,596,008 | (1,596,008 | ) | – | – | – | ||||||||||||||
| Morgan Stanley | 60,251 | (60,251 | ) | – | – | – | ||||||||||||||
| State Street Bank and Trust | 3,601,761 | (6,071 | ) | (1,300,000 | ) | (2,295,690 | ) | – | ||||||||||||
| Toronto Dominion Bank | 230,786 | – | (230,786 | ) | – | – | ||||||||||||||
| Fixed Income Clearing Corp. | 858,796,061 | – | – | (858,796,061 | ) | – | ||||||||||||||
| Total | $ | 864,542,752 | $ | (1,679,242 | ) | $ | (1,530,786 | ) | $ | (861,091,751 | ) | $ | 240,973 | |||||||
| Description | Gross Amounts of Recognized Liabilities | Gross Amounts Offset in the Statement of Assets and Liabilities | Net Amounts of Liabilities Presented in the Statement of Assets and Liabilities | |||||||||
| Forward Foreign Currency Exchange Contracts | $ | 609,765 | $ | – | $ | 609,765 | ||||||
| Total Return Swap Contracts | 4,939,416 | – | 4,939,416 | |||||||||
| Total | $ | 5,549,181 | $ | – | $ | 5,549,181 | ||||||
| Net Amounts of Liabilities Presented in | Amounts Not Offset in the Statement of Assets and Liabilities | |||||||||||||||||||
| Counterparty | the Statement of Assets and Liabilities | Financial Instruments | Cash Collateral Pledged(a) | Securities Collateral Pledged(a) | Net Amount(c) | |||||||||||||||
| Bank of America | $ | 16,912 | $ | (16,912 | ) | $ | – | $ | – | $ | – | |||||||||
| Barclays Bank plc | 2,212,490 | (1,596,008 | ) | (480,000 | ) | – | 136,482 | |||||||||||||
| Morgan Stanley | 2,948,018 | (60,251 | ) | (2,350,000 | ) | – | 537,767 | |||||||||||||
| Standard Chartered Bank | 307,161 | – | (280,000 | ) | – | 27,161 | ||||||||||||||
| State Street Bank and Trust | 6,071 | (6,071 | ) | – | – | – | ||||||||||||||
| UBS AG | 58,529 | – | – | – | 58,529 | |||||||||||||||
| Total | $ | 5,549,181 | $ | (1,679,242 | ) | $ | (3,110,000 | ) | $ | – | $ | 759,939 | ||||||||
| High Yield Fund | ||||||||||||
| Description | Gross Amounts of Recognized Assets | Gross Amounts Offset in the Statement of Assets and Liabilities | Net Amounts of Assets Presented in the Statement of Assets and Liabilities | |||||||||
| Forward Foreign Currency Exchange Contracts | $ | 14,841,497 | $ | – | $ | 14,841,497 | ||||||
| Repurchase Agreements | 11,327,717 | – | 11,327,717 | |||||||||
| Total | $ | 26,169,214 | $ | – | $ | 26,169,214 | ||||||
534
Notes to Financial Statements (continued)
| High Yield Fund | ||||||||||||||||||||
| Net Amount of Assets Presented in | Amounts Not Offset in the Statement of Assets and Liabilities | |||||||||||||||||||
| Counterparty | the Statement of Assets and Liabilities | Financial Instruments | Cash Collateral Received(a) | Securities Collateral Received(a) | Net Amount(b) | |||||||||||||||
| Bank of America | $ | 92,849 | $ | (92,849 | ) | $ | – | $ | – | $ | – | |||||||||
| Barclays Bank plc | 2,961,934 | – | (2,850,000 | ) | – | 111,934 | ||||||||||||||
| BNP Paribas S.A. | 14,527 | – | – | – | 14,527 | |||||||||||||||
| Goldman Sachs | 142,881 | (142,881 | ) | – | – | – | ||||||||||||||
| Morgan Stanley | 5,469 | (5,469 | ) | – | – | – | ||||||||||||||
| Standard Chartered Bank | 13,990 | (1,627 | ) | – | – | 12,363 | ||||||||||||||
| State Street Bank and Trust | 11,609,847 | (96,340 | ) | (5,590,000 | ) | (5,923,507 | ) | – | ||||||||||||
| Fixed Income Clearing Corp. | 11,327,717 | – | – | (11,327,717 | ) | – | ||||||||||||||
| Total | $ | 26,169,214 | $ | (339,166 | ) | $ | (8,440,000 | ) | $ | (17,251,224 | ) | $ | 138,824 | |||||||
| Description | Gross Amounts of Recognized Liabilities | Gross Amounts Offset in the Statement of Assets and Liabilities | Net Amounts of Liabilities Presented in the Statement of Assets and Liabilities | |||||||||
| Credit Default Swap Contracts | $ | 24,316,698 | $ | – | $ | 24,316,698 | ||||||
| Forward Foreign Currency Exchange Contracts | 2,591,267 | – | 2,591,267 | |||||||||
| Total | $ | 26,907,965 | $ | – | $ | 26,907,965 | ||||||
| Net Amounts of Liabilities Presented in | Amounts Not Offset in the Statement of Assets and Liabilities | |||||||||||||||||||
| Counterparty | the Statement of Assets and Liabilities | Financial Instruments | Cash Collateral Pledged(a) | Securities Collateral Pledged(a) | Net Amount(c) | |||||||||||||||
| Bank of America | $ | 1,492,005 | $ | (92,849 | ) | $ | (1,399,156 | ) | $ | – | $ | – | ||||||||
| Citibank | 5,741,521 | – | (5,691,683 | ) | – | 49,838 | ||||||||||||||
| Goldman Sachs | 1,994,949 | (142,881 | ) | (1,770,000 | ) | – | 82,068 | |||||||||||||
| J.P. Morgan | 3,401,849 | – | (3,180,000 | ) | – | 221,849 | ||||||||||||||
| Merrill Lynch | 1,004,800 | – | (880,000 | ) | – | 124,800 | ||||||||||||||
| Morgan Stanley | 13,174,874 | (5,469 | ) | (12,700,000 | ) | – | 469,405 | |||||||||||||
| Standard Chartered Bank | 1,627 | (1,627 | ) | – | – | – | ||||||||||||||
| State Street Bank and Trust | 96,340 | (96,340 | ) | – | – | – | ||||||||||||||
| Total | $ | 26,907,965 | $ | (339,166 | ) | $ | (25,620,839 | ) | $ | – | $ | 947,960 | ||||||||
| Income Fund | ||||||||||||
| Description | Gross Amounts of Recognized Assets | Gross Amounts Offset in the Statement of Assets and Liabilities | Net Amounts of Assets Presented in the Statement of Assets and Liabilities | |||||||||
| Forward Foreign Currency Exchange Contracts | $ | 1,964,049 | $ | – | $ | 1,964,049 | ||||||
| Repurchase Agreements | 119,401,923 | – | 119,401,923 | |||||||||
| Total | $ | 121,365,972 | $ | – | $ | 121,365,972 | ||||||
535
Notes to Financial Statements (continued)
| Income Fund | ||||||||||||||||||||
| Net Amount of Assets Presented in | Amounts Not Offset in the Statement of Assets and Liabilities | |||||||||||||||||||
| Counterparty | the Statement of Assets and Liabilities | Financial Instruments | Cash Collateral Received(a) | Securities Collateral Received(a) | Net Amount(b) | |||||||||||||||
| Bank of America | $ | 560 | $ | – | $ | – | $ | – | $ | 560 | ||||||||||
| Standard Chartered Bank | 85,394 | – | – | – | 85,394 | |||||||||||||||
| State Street Bank and Trust | 1,467,006 | – | (680,000 | ) | (787,006 | ) | – | |||||||||||||
| Toronto Dominion Bank | 411,089 | – | (260,000 | ) | – | 151,089 | ||||||||||||||
| Fixed Income Clearing Corp. | 119,401,923 | – | – | (119,401,923 | ) | – | ||||||||||||||
| Total | $ | 121,365,972 | $ | – | $ | (940,000 | ) | $ | (120,188,929 | ) | $ | 237,043 | ||||||||
| Description | Gross Amounts of Recognized Liabilities | Gross Amounts Offset in the Statement of Assets and Liabilities | Net Amounts of Liabilities Presented in the Statement of Assets and Liabilities | |||||||||
| Credit Default Swap Contracts | $ | 2,478,617 | $ | – | $ | 2,478,617 | ||||||
| Forward Foreign Currency Exchange Contracts | 21,460 | – | 21,460 | |||||||||
| Total | $ | 2,500,077 | $ | – | $ | 2,500,077 | ||||||
| Net Amounts of Liabilities Presented in | Amounts Not Offset in the Statement of Assets and Liabilities | |||||||||||||||||||
| Counterparty | the Statement of Assets and Liabilities | Financial Instruments | Cash Collateral Pledged(a) | Securities Collateral Pledged(a) | Net Amount(c) | |||||||||||||||
| Citibank | $ | 984,704 | $ | – | $ | (880,698 | ) | $ | – | $ | 104,006 | |||||||||
| Goldman Sachs | 409,746 | – | (230,000 | ) | – | 179,746 | ||||||||||||||
| Morgan Stanley | 1,105,627 | – | (1,040,000 | ) | – | 65,627 | ||||||||||||||
| Total | $ | 2,500,077 | $ | – | $ | (2,150,698 | ) | $ | – | $ | 349,379 | |||||||||
| Inflation Focused Fund | ||||||||||||
| Description | Gross Amounts of Recognized Assets | Gross Amounts Offset in the Statement of Assets and Liabilities | Net Amounts of Assets Presented in the Statement of Assets and Liabilities | |||||||||
| Consumer Price Index (“CPI”) Swaps | $ | 37,073,339 | $ | – | $ | 37,073,339 | ||||||
| Repurchase Agreements | 106,805,451 | – | 106,805,451 | |||||||||
| Total | $ | 143,878,790 | $ | – | $ | 143,878,790 | ||||||
536
Notes to Financial Statements (continued)
| Inflation Focused Fund | ||||||||||||||||||||
| Net Amount of Assets Presented in | Amounts Not Offset in the Statement of Assets and Liabilities | |||||||||||||||||||
| Counterparty | the Statement of Assets and Liabilities | Financial Instruments | Cash Collateral Received(a) | Securities Collateral Received(a) | Net Amount(b) | |||||||||||||||
| Bank of America | $ | 15,823,675 | $ | (9,266,840 | ) | $ | (6,556,835 | ) | $ | – | $ | – | ||||||||
| Barclays Bank plc | 10,554,864 | (7,706,046 | ) | – | (2,848,818 | ) | – | |||||||||||||
| Deutsche Bank AG | 2,041,607 | (2,041,607 | ) | – | – | – | ||||||||||||||
| Goldman Sachs | 6,560,227 | (6,560,227 | ) | – | – | – | ||||||||||||||
| J.P. Morgan | 2,092,966 | (2,092,966 | ) | – | – | – | ||||||||||||||
| Fixed Income Clearing Corp. | 106,805,451 | – | – | (106,805,451 | ) | – | ||||||||||||||
| Total | $ | 143,878,790 | $ | (27,667,686 | ) | $ | (6,556,835 | ) | $ | (109,654,269 | ) | $ | – | |||||||
| Description | Gross Amounts of Recognized Liabilities | Gross Amounts Offset in the Statement of Assets and Liabilities | Net Amounts of Liabilities Presented in the Statement of Assets and Liabilities | |||||||||
| Consumer Price Index (“CPI”) Swaps | $ | 49,497,495 | $ | – | $ | 49,497,495 | ||||||
| Total | $ | 49,497,495 | $ | – | $ | 49,497,495 | ||||||
| Net Amounts of Liabilities Presented in | Amounts Not Offset in the Statement of Assets and Liabilities | |||||||||||||||||||
| Counterparty | the Statement of Assets and Liabilities | Financial Instruments | Cash Collateral Pledged(a) | Securities Collateral Pledged(a) | Net Amount(c) | |||||||||||||||
| Credit Suisse | $ | 2,729,049 | $ | – | $ | (2,630,000 | ) | $ | – | $ | 99,049 | |||||||||
| Bank of America | 9,266,840 | (9,266,840 | ) | – | – | – | ||||||||||||||
| Barclays Bank plc | 7,706,046 | (7,706,046 | ) | – | – | – | ||||||||||||||
| Deutsche Bank AG | 16,227,788 | (2,041,607 | ) | (13,830,000 | ) | – | 356,181 | |||||||||||||
| Goldman Sachs | 8,379,529 | (6,560,227 | ) | (1,300,000 | ) | – | 519,302 | |||||||||||||
| J.P. Morgan | 3,607,620 | (2,092,966 | ) | (1,290,000 | ) | – | 224,654 | |||||||||||||
| Wells Fargo | 1,580,623 | – | (1,580,623 | ) | – | – | ||||||||||||||
| Total | $ | 49,497,495 | $ | (27,667,686 | ) | $ | (20,630,623 | ) | $ | – | $ | 1,199,186 | ||||||||
| Short Duration Core Bond Fund | ||||||||||||
| Description | Gross Amounts of Recognized Assets | Gross Amounts Offset in the Statement of Assets and Liabilities | Net Amounts of Assets Presented in the Statement of Assets and Liabilities | |||||||||
| Credit Default Swap Contracts | $ | 7,044 | $ | – | $ | 7,044 | ||||||
| Repurchase Agreements | 6,366,007 | – | 6,366,007 | |||||||||
| Total | $ | 6,373,051 | $ | – | $ | 6,373,051 | ||||||
537
Notes to Financial Statements (continued)
| Short Duration Core Bond Fund | ||||||||||||||||||||
| Net Amount of Assets Presented in | Amounts Not Offset in the Statement of Assets and Liabilities | |||||||||||||||||||
| Counterparty | the Statement of Assets and Liabilities | Financial Instruments | Cash Collateral Received(a) | Securities Collateral Received(a) | Net Amount(b) | |||||||||||||||
| Morgan Stanley | $ | 7,044 | $ | – | $ | – | $ | – | $ | 7,044 | ||||||||||
| Fixed Income Clearing Corp. | 6,366,007 | – | – | (6,366,007 | ) | – | ||||||||||||||
| Total | $ | 6,373,051 | $ | – | $ | – | $ | (6,366,007 | ) | $ | 7,044 | |||||||||
| Short Duration Income Fund | ||||||||||||
| Description | Gross Amounts of Recognized Assets | Gross Amounts Offset in the Statement of Assets and Liabilities | Net Amounts of Assets Presented in the Statement of Assets and Liabilities | |||||||||
| Credit Default Swap Contracts | $ | 1,072,959 | $ | – | $ | 1,072,959 | ||||||
| Forward Foreign Currency Exchange Contracts | 912,278 | – | 912,278 | |||||||||
| Repurchase Agreements | 1,750,973,008 | – | 1,750,973,008 | |||||||||
| Total | $ | 1,752,958,245 | $ | – | $ | 1,752,958,245 | ||||||
| Net Amount of Assets Presented in | Amounts Not Offset in the Statement of Assets and Liabilities | |||||||||||||||||||
| Counterparty | the Statement of Assets and Liabilities | Financial Instruments | Cash Collateral Received(a) | Securities Collateral Received(a) | Net Amount(b) | |||||||||||||||
| Citibank | $ | 219,076 | $ | (219,076 | ) | $ | – | $ | – | $ | – | |||||||||
| Morgan Stanley | 853,883 | (853,883 | ) | – | – | – | ||||||||||||||
| Toronto Dominion Bank | 912,278 | – | (760,000 | ) | – | 152,278 | ||||||||||||||
| Fixed Income Clearing Corp. | 1,750,973,008 | – | – | (1,750,973,008 | ) | – | ||||||||||||||
| Total | $ | 1,752,958,245 | $ | (1,072,959 | ) | $ | (760,000 | ) | $ | (1,750,973,008 | ) | $ | 152,278 | |||||||
| Description | Gross Amounts of Recognized Liabilities | Gross Amounts Offset in the Statement of Assets and Liabilities | Net Amounts of Liabilities Presented in the Statement of Assets and Liabilities | |||||||||
| Credit Default Swap Contracts | $ | 15,056,521 | $ | – | $ | 15,056,521 | ||||||
| Forward Foreign Currency Exchange Contracts | 4,103,165 | – | 4,103,165 | |||||||||
| Total | $ | 19,159,686 | $ | – | $ | 19,159,686 | ||||||
| Net Amounts of Liabilities Presented in | Amounts Not Offset in the Statement of Assets and Liabilities | |||||||||||||||||||
| Counterparty | the Statement of Assets and Liabilities | Financial Instruments | Cash Collateral Pledged(a) | Securities Collateral Pledged(a) | Net Amount(c) | |||||||||||||||
| Bank of America | $ | 4,103,165 | $ | – | $ | (2,860,000 | ) | $ | – | $ | 1,243,165 | |||||||||
| Citibank | 3,565,772 | (219,076 | ) | (3,334,583 | ) | – | 12,113 | |||||||||||||
| Goldman Sachs | 2,000,376 | – | (1,800,000 | ) | – | 200,376 | ||||||||||||||
| Morgan Stanley | 9,490,373 | (853,883 | ) | (8,200,000 | ) | – | 436,490 | |||||||||||||
| Total | $ | 19,159,686 | $ | (1,072,959 | ) | $ | (16,194,583 | ) | $ | – | $ | 1,892,144 | ||||||||
538
Notes to Financial Statements (continued)
| Total Return Fund | ||||||||||||
| Description | Gross Amounts of Recognized Assets | Gross Amounts Offset in the Statement of Assets and Liabilities | Net Amounts of Assets Presented in the Statement of Assets and Liabilities | |||||||||
| Credit Default Swap Contracts | $ | 31,296 | $ | – | $ | 31,296 | ||||||
| Forward Foreign Currency Exchange Contracts | 1,015,307 | – | 1,015,307 | |||||||||
| Repurchase Agreements | 86,614,070 | – | 86,614,070 | |||||||||
| Total | $ | 87,660,673 | $ | – | $ | 87,660,673 | ||||||
| Net Amount of Assets Presented in | Amounts Not Offset in the Statement of Assets and Liabilities | |||||||||||||||||||
| Counterparty | the Statement of Assets and Liabilities | Financial Instruments | Cash Collateral Received(a) | Securities Collateral Received(a) | Net Amount(b) | |||||||||||||||
| Citibank | $ | 31,296 | $(31,296 | ) | $ | – | $ | – | $ | – | ||||||||||
| Goldman Sachs | 6,697 | (6,697 | ) | – | – | – | ||||||||||||||
| State Street Bank and Trust | 386,928 | – | – | (309,871 | ) | 77,057 | ||||||||||||||
| Toronto Dominion Bank | 621,682 | – | (621,682 | ) | – | – | ||||||||||||||
| Fixed Income Clearing Corp. | 86,614,070 | – | – | (86,614,070 | ) | – | ||||||||||||||
| Total | $ | 87,660,673 | $(37,993 | ) | $ | (621,682 | ) | $ | (86,923,941 | ) | $ | 77,057 | ||||||||
| Description | Gross Amounts of Recognized Liabilities | Gross Amounts Offset in the Statement of Assets and Liabilities | Net Amounts of Liabilities Presented in the Statement of Assets and Liabilities | |||||||||
| Credit Default Swap Contracts | $ | 4,099,898 | $ | – | $ | 4,099,898 | ||||||
| Forward Foreign Currency Exchange Contracts | 98,976 | – | 98,976 | |||||||||
| Total | $ | 4,198,874 | $ | – | $ | 4,198,874 | ||||||
| Net Amounts of Liabilities Presented in | Amounts Not Offset in the Statement of Assets and Liabilities | |||||||||||||||||||
| Counterparty | the Statement of Assets and Liabilities | Financial Instruments | Cash Collateral Pledged(a) | Securities Collateral Pledged(a) | Net Amount(c) | |||||||||||||||
| Bank of America | $ | 48,495 | $ | – | $ | – | $ | – | $ | 48,495 | ||||||||||
| Citibank | 2,678,550 | (31,296 | ) | (2,607,312 | ) | – | 39,942 | |||||||||||||
| Goldman Sachs | 279,697 | (6,697 | ) | (270,000 | ) | – | 3,000 | |||||||||||||
| Morgan Stanley | 1,192,132 | – | (990,000 | ) | – | 202,132 | ||||||||||||||
| Total | $ | 4,198,874 | $ | (37,993 | ) | $ | (3,867,312 | ) | $ | – | $ | 293,569 | ||||||||
| Ultra Short Bond Fund | ||||||||||||
| Description | Gross Amounts of Recognized Assets | Gross Amounts Offset in the Statement of Assets and Liabilities | Net Amounts of Assets Presented in the Statement of Assets and Liabilities | |||||||||
| Repurchase Agreements | $ | 95,552,803 | $ | – | $ | 95,552,803 | ||||||
| Total | $ | 95,552,803 | $ | – | $ | 95,552,803 | ||||||
539
Notes to Financial Statements (continued)
| Ultra Short Bond Fund | ||||||||||||||||||||
| Net Amount of Assets Presented in | Amounts Not Offset in the Statement of Assets and Liabilities | |||||||||||||||||||
| Counterparty | the Statement of Assets and Liabilities | Financial Instruments | Cash Collateral Received(a) | Securities Collateral Received(a) | Net Amount(b) | |||||||||||||||
| Fixed Income Clearing Corp. | $ | 95,552,803 | $ | – | $ | – | $(95,552,803 | ) | $ | – | ||||||||||
| Total | $ | 95,552,803 | $ | – | $ | – | $(95,552,803 | ) | $ | – | ||||||||||
| (a) | Collateral disclosed is limited to an amount not to exceed 100% of the net amount of assets (liabilities) presented in the Statements of Assets and Liabilities, for each respective counterparty. |
| (b) | Net amount represents the amount owed to the Fund by the counterparty as of November 30, 2021. |
| (c) | Net amount represents the amount owed by the Fund to the counterparty as of November 30, 2021. |
| 9. | TRUSTEES’ REMUNERATION |
The Trust’s officers and one Trustee, who are associated with Lord Abbett, do not receive any compensation from the Trust for serving in such capacities. Independent Trustees’ fees are allocated among all Lord Abbett-sponsored funds based on the net assets of each fund. There is an equity-based plan available to all Independent Trustees under which Independent Trustees must defer receipt of a portion of, and may elect to defer receipt of an additional portion of Trustees’ fees. The deferred amounts are treated as though equivalent dollar amounts had been invested in the funds. Such amounts and earnings accrued thereon are included in Trustees’ fees on the Statements of Operations and in Trustees’ fees payable on the Statements of Assets and Liabilities and are not deductible for U.S. federal income tax purposes until such amounts are paid.
| 10. | EXPENSE REDUCTIONS |
The Trust has entered into an arrangement with its transfer agent and custodian, whereby credits realized as a result of uninvested cash balances are used to reduce a portion of each Fund’s expenses.
| 11. | LINE OF CREDIT |
For the period ended August 4, 2021, the Funds and certain other funds managed by Lord Abbett (collectively, the “Participating Funds”) entered into a syndicated line of credit facility with various lenders for $1.17 billion (the “Syndicated Facility”) whereas State Street Bank and Trust Company (“SSB”) participated as a lender and as agent for the lenders. The Participating Funds were subject to graduated borrowing limits of one-third of Funds net assets (if Fund net assets are less than $750 million), $250 million, $300 million, $600 million, or $900 million, based on past borrowings and likelihood of future borrowings, among other factors.
Effective August 5, 2021, the Participating Funds entered into a Syndicated Facility with various lenders for $1.275 billion whereas SSB participates as a lender and as agent for the lenders. The Participating Funds are subject to graduated borrowing limits of one-third of Fund net assets (if Fund net assets are less than $750 million), $250 million, $300 million, $700 million, or $1 billion, based on past borrowings and likelihood of future borrowings, among other factors.
For the fiscal year ended November 30, 2021, the Participating Funds were party to an additional line of credit facility with SSB for $330 million (the “Bilateral Facility”), $250 million committed and $80 million uncommitted. Under the Bilateral Facility, the Participating Funds are subject to graduated borrowing limits of one-third of Funds net assets (if net assets are less than $750
540
Notes to Financial Statements (continued)
million), $250 million, $300 million, or $330 million, based on past borrowings and likelihood of future borrowings, among other factors.
The Syndicated Facility and the Bilateral Facility are to be used for temporary or emergency purposes as an additional source of liquidity to satisfy redemptions.
The High Yield Fund utilized the Facility on multiple dates for the period January 6, 2021 through January 18, 2021 with an average borrowing amount of $24,495,286. The average interest rate during the period was 1.38% and total interest paid amounted to $6,575. The other funds did not utilize the Syndicated Facility or the Bilateral Facility.
| 12. | INTERFUND LENDING PROGRAM |
Pursuant to an exemptive order issued by the U.S. Securities and Exchange Commission (“SEC exemptive order”) certain registered open-end management investment companies managed by Lord Abbett, including each Fund, participate in a joint lending and borrowing program (the “Interfund Lending Program”). The SEC exemptive order allows the Funds to borrow money from and lend money to each other for temporary or emergency purposes subject to the limitations and conditions.
During the year ended November 30, 2021, the following Funds participated as lenders in the Interfund Lending Program. For the period in which the loan was outstanding, the average amount loaned, interest rate and interest income were as follows:
| Fund | Average Amount Loaned | Average Interest Rate | Interest Income* | |||||
| Core Fixed Income Fund | $16,851,678 | 0.54% | $247 | |||||
| Short Duration Income Fund | 49,600,000 | 0.55% | 745 | |||||
| Total Return Fund | 14,069,000 | 0.55% | 212 | |||||
| Ultra Short Bond Fund | 13,398,000 | 0.55% | 200 |
| * | Statements of Operations location: Interest earned from Interfund Lending. |
During the year ended November 30, 2021, the following Funds participated as borrowers in the Interfund Lending Program. For the period in which the loan was outstanding, the average amount borrowed, interest rate and interest expense were as follows:
| Fund | Average Amount Borrowed | Average Interest Rate | Interest Expense* | |||||
| Convertible Fund | $31,552,226 | 0.54% | $1,406 | |||||
| High Yield Fund | 37,592,053 | 0.55% | 2,249 |
| * | Statements of Operations location: Interest paid from Interfund Lending. |
| 13. | TRANSACTIONS WITH AFFILIATED ISSUERS |
An affiliated issuer is one in which a Fund has ownership of at least 5% of the outstanding voting securities of the underlying issuer at any point during the fiscal year or any company which is under common ownership or control. Short Duration Income Fund had the following transactions with affiliated issuers during the year ended November 30, 2021:
| Affiliated Issuer | Value at 11/30/2020 | Purchases at Cost | Proceeds from Sales | Net Realized Gain (Loss) | Net change in Appreciation (Depreciation) | Value at 11/30/2021 | Shares as of 11/30/2021 | Dividend Income | ||||||||||||||||||||||||
| Oasis Petroleum(a)(b) | $ | 36,035,382 | $ | – | $ | (89,818,835 | ) | $ | 21,476,750 | $ | 68,036,903 | $ | 35,730,200 | 298,000 | $ | 395,125 | ||||||||||||||||
| (a) | Not an affiliated issuer as of November 30, 2020. |
| (b) | Not an affiliated issuer as of November 30, 2021. |
541
Notes to Financial Statements (continued)
| 14. | CUSTODIAN AND ACCOUNTING AGENT |
State Street Bank and Trust Company (“SSB”) is the Trust’s custodian and accounting agent. SSB performs custodial, accounting and recordkeeping functions relating to portfolio transactions and calculating each Fund’s NAV.
| 15. | SECURITIES LENDING AGREEMENT |
The Funds, except for Inflation Focused Fund, have established a securities lending agreement with Citibank, N.A. for the lending of securities to qualified brokers in exchange for securities or cash collateral equal to at least the market value of securities loaned, plus interest, if applicable. Cash collateral is invested in an approved money market fund. In accordance with the Funds’ securities lending agreement, the market value of securities on loan is determined each day at the close of business and any additional collateral required to cover the value of securities on loan is delivered to the Funds on the next business day. As with other extensions of credit, the Funds may experience a delay in the recovery of its securities or incur a loss should the borrower of the securities breach its agreement with the Funds or the borrower becomes insolvent at a time when the collateral is insufficient to cover the cost of repurchasing securities on loan. Any income earned from securities lending is included in Securities lending net income on each Fund’s Statement of Operations.
The initial collateral received by the Funds is required to have a value equal to at least 100% of the market value of the securities loaned. The collateral must be marked-to-market daily to cover increases in the market value of the securities loaned (or potentially a decline in the value of the collateral). In general, the risk of borrower default will be borne by the Funds’ agent; the Funds will bear the risk of loss with respect to the investment of the cash collateral. The advantage of such loans is that the Funds continue to receive income on loaned securities while receiving a portion of any securities lending fees and earning returns on the cash amounts which may be reinvested for the purchase of investments in securities.
As of November 30, 2021, the market value of securities loaned and collateral received for the Funds were as follows:
| Funds | Market Value of Securities Loaned | Collateral Received(1) | |||||
| Convertible Fund | $ | 8,699,544 | $9,297,335 | ||||
| High Yield Fund | 7,208,542 | 7,416,688 | |||||
| (1) | Statements of Assets and Liabilities location: Payable for collateral due to broker for securities lending. |
| 16. | INVESTMENT RISKS |
Each Fund is subject to the general risks and considerations associated with investing in fixed income securities and to the changing prospects of individual companies and/or sectors in which the Funds invest. The value of an investment will change as interest rates fluctuate and in response to market movements. When interest rates rise, the prices of fixed income securities are likely to decline; when interest rates fall, such prices tend to rise. Longer-term securities are usually more sensitive to interest rate changes. There is also the risk that an issuer of a fixed income security will fail to make timely payments of principal and/or interest to a Fund, a risk that is greater with high-yield bonds (sometimes called “junk bonds”) in which one or more of the Funds may invest. Some issuers, particularly of high-yield bonds, may default as to principal and/or interest payments after a Fund purchases their securities. A default, or concerns in the market about an increase in risk of default, may result in losses to each Fund. High-yield bonds are subject to greater price fluctuations and increased liquidity risk, as well as additional risks.
542
Notes to Financial Statements (continued)
Certain instruments in which the Funds may invest may rely in some fashion upon LIBOR. On March 5, 2021 the United Kingdom Financial Conduct Authority (FCA) and LIBOR’s administrator, ICE Benchmark Administration (IBA), announced that most LIBOR settings will no longer be published after the end of 2021 and a majority of U.S. dollar LIBOR settings will no longer be published after June 30, 2023. Abandonment of or modification to LIBOR could have adverse impacts on newly issued financial instruments and existing financial instruments which reference LIBOR and lead to significant short-term and long-term uncertainty and market instability.
Because the Ultra Short Bond Fund invests a significant portion of its assets in securities issued by companies in the financial services industry, developments affecting this industry may have a disproportionate impact on the Fund. Interest rate risk, credit risk, and the risk of regulatory changes in the financial services industry, among other risks, may have a negative effect on companies in the financial services industry.
The values of equity holdings of Convertible Fund will fluctuate in response to movements in the equity securities market in general and to the changing prospects of the individual companies and/or sectors in which the Fund invests.
Convertible Fund, High Yield Fund, Income Fund, Inflation Focused Fund, and Short Duration Income Fund are subject to the general risks and considerations associated with investing in convertible securities, which have both equity and fixed income risk characteristics including market, credit, liquidity, and interest rate risks. Generally, convertible securities offer lower interest or dividend yields than non-convertible securities of similar quality and less potential for gains or capital appreciation in a rising equity securities market than equity securities. They tend to be more volatile than other fixed income securities, and the markets for convertible securities may be less liquid than markets for stocks or bonds. A significant portion of convertible securities have below investment grade credit ratings and are subject to increased credit and liquidity risks.
Each Fund’s investment exposure to foreign (which may include emerging market) companies presents increased market, liquidity, currency, political, information and other risks. The cost of a Fund’s potential use of forward foreign currency exchange contracts varies with factors such as the currencies involved, the length of the contract period and the market conditions prevailing.
Each Fund is subject to the risks associated with derivatives, which may be different from and greater than the risks associated with directly investing in securities. Derivatives may be subject to risks such as liquidity risk, leveraging risk, interest rate risk, market risk, and credit risk. Illiquid securities may lower the Funds’ returns since the Funds may be unable to sell these securities at their desired time or price. Derivatives also may involve the risk of mispricing or improper valuation and the risk that changes in the value of the derivative may not correlate perfectly with the value of the underlying asset, rate or index. Whether a Fund’s use of derivatives is successful will depend on, among other things, the Fund’s ability to correctly forecast market movements, changes in foreign exchange and interest rates, and other factors. If a Fund incorrectly forecasts these and other factors, its performance could suffer. A Fund’s use of derivatives could result in a loss exceeding the amount of the Fund’s investment in these instruments.
Each Fund may invest in swap contracts. Swap contracts are bi-lateral agreements between a fund and its counterparty. Each party is exposed to the risk of default by the other in addition to the risks associated with investing in derivatives discussed above. In addition, they may involve a small investment of cash compared to the risk assumed with the result that small changes may produce disproportionate and substantial gains or losses to the Funds.
543
Notes to Financial Statements (continued)
The Funds are subject to the risks of investing in credit default swap contracts. The risks associated with the Funds’ investment in credit default swaps are greater than if the Funds invested directly in the reference obligation because they are subject to liquidity risk, counterparty risk, and credit risk at both the counterparty and underlying issuer levels in addition to the risks associated with investing in derivatives discussed above.
Each Fund’s exposure to inflation-linked investments, such as Treasury Inflation Protected Securities, may be vulnerable to changes in expectations of inflation or interest rates and there is no guarantee that the Fund’s use of these instruments will be successful.
The Funds are subject to the risks of investing in floating rate or adjustable rate senior loans, which are subject to increased credit and liquidity risks. Senior loans are business loans made to borrowers that may be U.S. or foreign corporations, partnerships or other business entities. The senior loans in which Core Fixed Income Fund, Core Plus Bond Fund, Floating Rate Fund, High Yield Fund, Income Fund, Inflation Focused Fund, Short Duration Income Fund and Total Return Fund may invest may consist primarily of senior loans that are rated below investment grade or, if unrated, deemed by Lord Abbett to be equivalent to below investment grade securities. Below investment grade senior loans, as in the case of high- yield debt securities, or junk bonds, are usually more credit sensitive than interest rate sensitive, although the value of these instruments may be impacted by broader interest rate swings in the overall fixed income market. In addition, Floating Rate Fund may invest up to 20% of its total assets in senior loans that are not secured by any specific collateral.
Each Fund is subject to the risk of investing in securities issued or guaranteed by the U.S. Government or its agencies and instrumentalities (such as the Government National Mortgage Association (“Ginnie Mae”), the Federal National Mortgage Association (“Fannie Mae”), or the Federal Home Loan Mortgage Corporation (“Freddie Mac”)). Unlike Ginnie Mae securities, securities issued or guaranteed by U.S. Government-related organizations such as Fannie Mae and Freddie Mac are not backed by the full faith and credit of the U.S. Government and no assurance can be given that the U.S. Government would provide financial support to its agencies and instrumentalities if not required to do so by law. Consequently, the Fund may be required to look principally to the agency issuing or guaranteeing the obligation.
Convertible Fund, Core Fixed Income Fund, Core Plus Bond Fund, Floating Rate Fund, High Yield Fund, Income Fund, Inflation Focused Fund, Short Duration Core Bond Fund, Short Duration Income Fund and Total Return Fund are subject to the risks of investing in asset backed securities and mortgage-related securities, including those of such Government sponsored enterprises as Fannie Mae and Freddie Mac. In addition, these Funds may invest in non-agency backed and mortgage related securities, which are issued by the private institutions, not by the government-sponsored enterprises. Such securities may be particularly sensitive to changes in economic conditions, including delinquencies and/or defaults, and changes in prevailing interest rates. These changes can affect the value, income and/or liquidity of such positions. When interest rates are declining, the value of these securities with prepayment features may not increase as much as other fixed income securities. Early principal repayment may deprive a Fund of income payments above current markets rates. The prepayment rate also will affect the price and volatility of a mortgage-related security. In addition, securities of government sponsored enterprises are guaranteed with respect to the timely payment of interest and principal by the particular enterprise involved, not by the U.S. Government.
Geopolitical and other events (e.g., wars, terrorism, natural disasters, epidemics or pandemics such as the COVID-19 outbreak which began in late 2019) may disrupt securities markets and adversely affect global economies and markets, thereby decreasing the value of each Fund’s investments.
544
Notes to Financial Statements (continued)
Market disruptions can also prevent the Funds from implementing their investment strategies and achieving their investment objectives.
The transmission of COVID-19 and efforts to contain its spread have resulted in, among other things, border closings and other significant travel restrictions and disruptions, significant disruptions to business operations, supply chains and customer activity, lower consumer demand for goods and services, event cancellations and restrictions, service cancellations, reductions and other changes, significant challenges in healthcare service preparation and delivery, and prolonged quarantines, as well as general concern and uncertainty. The impact of the COVID-19 outbreak could negatively affect the global economy, the economies of individual countries, and the financial performance of individual issuers, sectors, industries, asset classes, and markets in significant and unforeseen ways.
The COVID-19 pandemic and its effects may last for an extended period of time, and in either case could result in significant market volatility, exchange trading suspensions and closures, declines in global financial markets, higher default rates, and a substantial economic downturn or recession. The foregoing could disrupt the operations of each Fund and its service providers, adversely affect the value and liquidity of each Fund’s investments, and negatively impact each Fund’s performance and your investment in each Fund.
These factors, and others, can affect each Fund’s performance.
| 17. | SUMMARY OF CAPITAL TRANSACTIONS |
Transactions in shares of beneficial interest were as follows:
| Year Ended | Year Ended | |||||||||||||||
| Convertible Fund | November 30, 2021 | November 30, 2020 | ||||||||||||||
| Class A Shares | Shares | Amount | Shares | Amount | ||||||||||||
| Shares sold | 8,838,225 | $ | 174,295,397 | 6,637,363 | $ | 109,295,101 | ||||||||||
| Converted from Class C* | 179,706 | 3,508,875 | 493,755 | 8,073,778 | ||||||||||||
| Reinvestment of distributions | 2,199,871 | 41,969,365 | 836,900 | 11,306,788 | ||||||||||||
| Shares reacquired | (6,372,913 | ) | (123,833,622 | ) | (3,941,324 | ) | (61,200,100 | ) | ||||||||
| Increase | 4,844,889 | $ | 95,940,015 | 4,026,694 | $ | 67,475,567 | ||||||||||
| Class C Shares | ||||||||||||||||
| Shares sold | 1,536,045 | $ | 30,072,046 | 1,360,311 | $ | 22,258,038 | ||||||||||
| Reinvestment of distributions | 428,793 | 8,107,902 | 185,024 | 2,454,644 | ||||||||||||
| Shares reacquired | (799,750 | ) | (15,376,218 | ) | (815,551 | ) | (12,307,247 | ) | ||||||||
| Converted to Class A* | (181,419 | ) | (3,508,875 | ) | (497,349 | ) | (8,073,778 | ) | ||||||||
| Increase | 983,669 | $ | 19,294,855 | 232,435 | $ | 4,331,657 | ||||||||||
| Class F Shares | ||||||||||||||||
| Shares sold | 33,266,945 | $ | 654,630,937 | 27,490,097 | $ | 440,997,259 | ||||||||||
| Reinvestment of distributions | 4,299,466 | 82,067,054 | 935,772 | 12,768,009 | ||||||||||||
| Shares reacquired | (26,245,504 | ) | (506,913,516 | ) | (10,220,319 | ) | (162,869,227 | ) | ||||||||
| Increase | 11,320,907 | $ | 229,784,475 | 18,205,550 | $ | 290,896,041 | ||||||||||
| Class F3 Shares | ||||||||||||||||
| Shares sold | 1,388,249 | $ | 27,728,724 | 701,872 | $ | 12,008,995 | ||||||||||
| Reinvestment of distributions | 197,011 | 3,794,157 | 51,388 | 703,791 | ||||||||||||
| Shares reacquired | (768,561 | ) | (15,114,984 | ) | (184,551 | ) | (2,873,723 | ) | ||||||||
| Increase | 816,699 | $ | 16,407,897 | 568,709 | $ | 9,839,063 | ||||||||||
545
Notes to Financial Statements (continued)
| Year Ended | Year Ended | |||||||||||||||
| Convertible Fund | November 30, 2021 | November 30, 2020 | ||||||||||||||
| Class I Shares | Shares | Amount | Shares | Amount | ||||||||||||
| Shares sold | 11,382,641 | $ | 225,843,658 | 9,787,817 | $ | 152,687,276 | ||||||||||
| Reinvestment of distributions | 2,309,299 | 44,400,039 | 1,737,942 | 23,626,798 | ||||||||||||
| Shares reacquired | (16,796,426 | ) | (333,882,554 | ) | (16,648,304 | ) | (267,498,985 | ) | ||||||||
| Decrease | (3,104,486 | ) | $ | (63,638,857 | ) | (5,122,545 | ) | $ | (91,184,911 | ) | ||||||
| Class P Shares | ||||||||||||||||
| Shares sold | 377 | $ | 7,658 | 1,842 | $ | 25,888 | ||||||||||
| Reinvestment of distributions | 550 | 10,698 | 409 | 5,568 | ||||||||||||
| Shares reacquired | (2,255 | ) | (44,572 | ) | (3,611 | ) | (52,312 | ) | ||||||||
| Decrease | (1,328 | ) | $ | (26,216 | ) | (1,360 | ) | $ | (20,856 | ) | ||||||
| Class R2 Shares | ||||||||||||||||
| Shares sold | 6,032 | $ | 123,949 | 93 | $ | 1,345 | ||||||||||
| Reinvestment of distributions | 342 | 6,653 | 282 | 3,834 | ||||||||||||
| Shares reacquired | (3,808 | ) | (76,082 | ) | (2,048 | ) | (29,527 | ) | ||||||||
| Increase (decrease) | 2,566 | $ | 54,520 | (1,673 | ) | $ | (24,348 | ) | ||||||||
| Class R3 Shares | ||||||||||||||||
| Shares sold | 779,583 | $ | 15,197,322 | 618,720 | $ | 9,860,017 | ||||||||||
| Reinvestment of distributions | 199,477 | 3,781,842 | 63,228 | 848,066 | ||||||||||||
| Shares reacquired | (311,040 | ) | (5,997,654 | ) | (181,841 | ) | (2,822,070 | ) | ||||||||
| Increase | 668,020 | $ | 12,981,510 | 500,107 | $ | 7,886,013 | ||||||||||
| Class R4 Shares | ||||||||||||||||
| Shares sold | 28,885 | $ | 572,114 | 16,981 | $ | 324,428 | ||||||||||
| Reinvestment of distributions | 3,268 | 62,354 | 504 | 6,761 | ||||||||||||
| Shares reacquired | (4,771 | ) | (92,330 | ) | (3,312 | ) | (42,900 | ) | ||||||||
| Increase | 27,382 | $ | 542,138 | 14,173 | $ | 288,289 | ||||||||||
| Class R5 Shares | ||||||||||||||||
| Shares sold | 51,606 | $ | 1,045,670 | 25,239 | $ | 421,598 | ||||||||||
| Reinvestment of distributions | 10,838 | 208,290 | 5,305 | 72,154 | ||||||||||||
| Shares reacquired | (27,808 | ) | (547,421 | ) | (26,181 | ) | (428,250 | ) | ||||||||
| Increase | 34,636 | $ | 706,539 | 4,363 | $ | 65,502 | ||||||||||
| Class R6 Shares | ||||||||||||||||
| Shares sold | 972,726 | $ | 18,901,996 | 371,377 | $ | 5,591,255 | ||||||||||
| Reinvestment of distributions | 26,608 | 513,023 | 8,928 | 122,133 | ||||||||||||
| Shares reacquired | (132,324 | ) | (2,585,675 | ) | (471,318 | ) | (6,504,882 | ) | ||||||||
| Increase (decrease) | 867,010 | $ | 16,829,344 | (91,013 | ) | $ | (791,494 | ) | ||||||||
| Year Ended | Year Ended | |||||||||||||||
| Core Fixed Income Fund | November 30, 2021 | November 30, 2020 | ||||||||||||||
| Class A Shares | Shares | Amount | Shares | Amount | ||||||||||||
| Shares sold | 10,665,974 | $ | 119,543,565 | 20,546,341 | $ | 234,629,013 | ||||||||||
| Converted from Class C* | 287,008 | 3,193,063 | 1,354,236 | 15,754,138 | ||||||||||||
| Reinvestment of distributions | 2,630,926 | 29,652,806 | 969,122 | 11,099,192 | ||||||||||||
| Shares reacquired | (13,453,573 | ) | (150,363,645 | ) | (9,291,661 | ) | (105,669,767 | ) | ||||||||
| Increase | 130,335 | $ | 2,025,789 | 13,578,038 | $ | 155,812,576 | ||||||||||
546
Notes to Financial Statements (continued)
| Year Ended | Year Ended | |||||||||||||||
| Core Fixed Income Fund | November 30, 2021 | November 30, 2020 | ||||||||||||||
| Class C Shares | Shares | Amount | Shares | Amount | ||||||||||||
| Shares sold | 284,612 | $ | 3,186,373 | 2,901,692 | $ | 32,881,776 | ||||||||||
| Reinvestment of distributions | 159,704 | 1,795,351 | 55,779 | 635,233 | ||||||||||||
| Shares reacquired | (1,784,781 | ) | (19,868,439 | ) | (1,139,736 | ) | (12,948,016 | ) | ||||||||
| Converted to Class A* | (288,309 | ) | (3,193,063 | ) | (1,360,147 | ) | (15,754,138 | ) | ||||||||
| Increase (decrease) | (1,628,774 | ) | $ | (18,079,778 | ) | 457,588 | $ | 4,814,855 | ||||||||
| Class F Shares | ||||||||||||||||
| Shares sold | 14,669,082 | $ | 164,190,485 | 29,817,069 | $ | 339,579,009 | ||||||||||
| Reinvestment of distributions | 1,464,189 | 16,497,583 | 538,321 | 6,172,565 | ||||||||||||
| Shares reacquired | (17,222,136 | ) | (192,470,581 | ) | (17,890,591 | ) | (204,020,556 | ) | ||||||||
| Increase (decrease) | (1,088,865 | ) | $ | (11,782,513 | ) | 12,464,799 | $ | 141,731,018 | ||||||||
| Class F3 Shares | ||||||||||||||||
| Shares sold | 12,251,293 | $ | 137,126,446 | 12,684,590 | $ | 145,067,068 | ||||||||||
| Reinvestment of distributions | 1,724,729 | 19,423,083 | 669,309 | 7,663,163 | ||||||||||||
| Shares reacquired | (8,464,176 | ) | (94,571,925 | ) | (6,878,681 | ) | (77,902,398 | ) | ||||||||
| Increase | 5,511,846 | $ | 61,977,604 | 6,475,218 | $ | 74,827,833 | ||||||||||
| Class I Shares | ||||||||||||||||
| Shares sold | 11,746,634 | $ | 131,695,079 | 36,180,845 | $ | 409,655,279 | ||||||||||
| Reinvestment of distributions | 2,072,253 | 23,322,632 | 918,152 | 10,506,684 | ||||||||||||
| Shares reacquired | (8,046,444 | ) | (90,183,328 | ) | (27,738,028 | ) | (315,696,001 | ) | ||||||||
| Increase | 5,772,443 | $ | 64,834,383 | 9,360,969 | $ | 104,465,962 | ||||||||||
| Class P Shares | ||||||||||||||||
| Shares sold | – | $ | – | – | $ | 1 | ||||||||||
| Reinvestment of distributions | – | – | – | 3 | ||||||||||||
| Shares reacquired | – | – | (10 | ) | (118 | ) | ||||||||||
| Decrease | – | $ | – | (10 | ) | $ | (114 | ) | ||||||||
| Class R2 Shares | ||||||||||||||||
| Shares sold | 55,527 | $ | 615,962 | 31,496 | $ | 351,390 | ||||||||||
| Reinvestment of distributions | 1,687 | 18,999 | 753 | 8,596 | ||||||||||||
| Shares reacquired | (19,011 | ) | (214,646 | ) | (42,056 | ) | (483,493 | ) | ||||||||
| Increase (decrease) | 38,203 | $ | 420,315 | (9,807 | ) | $ | (123,507 | ) | ||||||||
| Class R3 Shares | ||||||||||||||||
| Shares sold | 163,907 | $ | 1,835,402 | 327,342 | $ | 3,739,594 | ||||||||||
| Reinvestment of distributions | 41,266 | 465,460 | 16,320 | 186,587 | ||||||||||||
| Shares reacquired | (354,883 | ) | (3,986,728 | ) | (419,251 | ) | (4,750,686 | ) | ||||||||
| Decrease | (149,710 | ) | $ | (1,685,866 | ) | (75,589 | ) | $ | (824,505 | ) | ||||||
| Class R4 Shares | ||||||||||||||||
| Shares sold | 357,824 | $ | 4,005,894 | 412,019 | $ | 4,682,583 | ||||||||||
| Reinvestment of distributions | 35,045 | 394,933 | 13,390 | 153,374 | ||||||||||||
| Shares reacquired | (361,883 | ) | (4,055,408 | ) | (185,977 | ) | (2,125,935 | ) | ||||||||
| Increase | 30,986 | $ | 345,419 | 239,432 | $ | 2,710,022 | ||||||||||
547
Notes to Financial Statements (continued)
| Year Ended | Year Ended | |||||||||||||||
| Core Fixed Income Fund | November 30, 2021 | November 30, 2020 | ||||||||||||||
| Class R5 Shares | Shares | Amount | Shares | Amount | ||||||||||||
| Shares sold | 50,934 | $ | 570,141 | 43,020 | $ | 491,104 | ||||||||||
| Reinvestment of distributions | 4,451 | 50,110 | 2,267 | 25,915 | ||||||||||||
| Shares reacquired | (15,899 | ) | (176,795 | ) | (78,588 | ) | (900,555 | ) | ||||||||
| Increase (decrease) | 39,486 | $ | 443,456 | (33,301 | ) | $ | (383,536 | ) | ||||||||
| Class R6 Shares | ||||||||||||||||
| Shares sold | 363,171 | $ | 4,102,278 | 355,149 | $ | 4,042,233 | ||||||||||
| Reinvestment of distributions | 137,142 | 1,543,770 | 71,883 | 820,056 | ||||||||||||
| Shares reacquired | (588,254 | ) | (6,565,330 | ) | (1,437,189 | ) | (16,312,272 | ) | ||||||||
| Decrease | (87,941 | ) | $ | (919,282 | ) | (1,010,157 | ) | $ | (11,449,983 | ) | ||||||
| Year Ended | Year Ended | |||||||||||||||
| Core Plus Bond Fund | November 30, 2021 | November 30, 2020 | ||||||||||||||
| Class A Shares | Shares | Amount | Shares | Amount | ||||||||||||
| Shares sold | 2,435,277 | $ | 37,776,792 | 2,829,761 | $ | 43,514,916 | ||||||||||
| Converted from Class C* | 7,545 | 117,283 | 16,476 | 257,643 | ||||||||||||
| Reinvestment of distributions | 158,997 | 2,467,236 | 100,794 | 1,550,976 | ||||||||||||
| Shares reacquired | (1,314,450 | ) | (20,325,939 | ) | (868,204 | ) | (13,153,532 | ) | ||||||||
| Increase | 1,287,369 | $ | 20,035,372 | 2,078,827 | $ | 32,170,003 | ||||||||||
| Class C Shares | ||||||||||||||||
| Shares sold | 104,867 | $ | 1,627,599 | 219,608 | $ | 3,366,582 | ||||||||||
| Reinvestment of distributions | 11,655 | 181,111 | 10,110 | 155,302 | ||||||||||||
| Shares reacquired | (118,627 | ) | (1,836,400 | ) | (102,037 | ) | (1,540,326 | ) | ||||||||
| Converted to Class A* | (7,542 | ) | (117,283 | ) | (16,473 | ) | (257,643 | ) | ||||||||
| Increase (decrease) | (9,647 | ) | $ | (144,973 | ) | 111,208 | $ | 1,723,915 | ||||||||
| Class F Shares | ||||||||||||||||
| Shares sold | 13,276,593 | $ | 205,351,399 | 9,431,125 | $ | 145,005,768 | ||||||||||
| Reinvestment of distributions | 466,841 | 7,238,315 | 454,786 | 6,978,005 | ||||||||||||
| Shares reacquired | (7,367,686 | ) | (113,798,937 | ) | (8,641,173 | ) | (130,297,839 | ) | ||||||||
| Increase | 6,375,748 | $ | 98,790,777 | 1,244,738 | $ | 21,685,934 | ||||||||||
| Class F3 Shares | ||||||||||||||||
| Shares sold | 1,958,120 | $ | 30,308,730 | 667,865 | $ | 10,303,076 | ||||||||||
| Reinvestment of distributions | 38,049 | 589,463 | 13,260 | 204,026 | ||||||||||||
| Shares reacquired | (291,018 | ) | (4,500,910 | ) | (139,331 | ) | (2,107,549 | ) | ||||||||
| Increase | 1,705,151 | $ | 26,397,283 | 541,794 | $ | 8,399,553 | ||||||||||
| Class I Shares | ||||||||||||||||
| Shares sold | 913,824 | $ | 14,211,992 | 1,661,328 | $ | 25,140,249 | ||||||||||
| Reinvestment of distributions | 70,406 | 1,093,569 | 64,625 | 994,635 | ||||||||||||
| Shares reacquired | (2,347,116 | ) | (36,000,612 | ) | (385,394 | ) | (5,860,091 | ) | ||||||||
| Increase (decrease) | (1,362,886 | ) | $ | (20,695,051 | ) | 1,340,559 | $ | 20,274,793 | ||||||||
| Class R2 Shares | ||||||||||||||||
| Reinvestment of distributions | – | – | 35 | $ | 528 | |||||||||||
| Shares reacquired | – | – | (1,934 | ) | (29,414 | ) | ||||||||||
| Increase (decrease) | – | – | (1,899 | ) | $ | (28,886 | ) | |||||||||
548
Notes to Financial Statements (continued)
| Year Ended | Year Ended | |||||||||||||||
| Core Plus Bond Fund | November 30, 2021 | November 30, 2020 | ||||||||||||||
| Class R3 Shares | Shares | Amount | Shares | Amount | ||||||||||||
| Shares sold | 2,450 | $ | 38,177 | 1,199 | $ | 18,396 | ||||||||||
| Reinvestment of distributions | 320 | 4,960 | 397 | 6,082 | ||||||||||||
| Shares reacquired | (275 | ) | (4,287 | ) | (5,945 | ) | (92,189 | ) | ||||||||
| Increase (decrease) | 2,495 | $ | 38,850 | (4,349 | ) | $ | (67,711 | ) | ||||||||
| Class R4 Shares | ||||||||||||||||
| Shares sold | 7,137 | $ | 111,188 | 19,734 | $ | 305,222 | ||||||||||
| Reinvestment of distributions | 724 | 11,234 | 291 | 4,482 | ||||||||||||
| Shares reacquired | (83 | ) | (1,267 | ) | (5,080 | ) | (77,126 | ) | ||||||||
| Increase | 7,778 | $ | 121,155 | 14,945 | $ | 232,578 | ||||||||||
| Class R5 Shares | ||||||||||||||||
| Shares sold | – | $ | – | 36 | $ | 547 | ||||||||||
| Reinvestment of distributions | – | 1 | 41 | 627 | ||||||||||||
| Shares reacquired | – | (3 | ) | (1,297 | ) | (19,738 | ) | |||||||||
| Decrease | – | $ | (2 | ) | (1,220 | ) | $ | (18,564 | ) | |||||||
| Class R6 Shares | ||||||||||||||||
| Shares sold | 14,501 | $ | 225,069 | 75,761 | $ | 1,165,410 | ||||||||||
| Reinvestment of distributions | 2,620 | 40,652 | 1,778 | 27,348 | ||||||||||||
| Shares reacquired | (6,318 | ) | (97,441 | ) | (21,304 | ) | (328,751 | ) | ||||||||
| Increase | 10,803 | $ | 168,280 | 56,235 | $ | 864,007 | ||||||||||
| Year Ended | Year Ended | |||||||||||||||
| Corporate Bond Fund | November 30, 2021 | November 30, 2020 | ||||||||||||||
| Class A Shares | Shares | Amount | Shares | Amount | ||||||||||||
| Shares sold | 185,094 | $ | 1,941,844 | 277,124 | $ | 2,887,701 | ||||||||||
| Converted from Class C | 2,068 | 21,027 | – | – | ||||||||||||
| Reinvestment of distributions | 10,917 | 114,257 | 3,767 | 39,161 | ||||||||||||
| Shares reacquired | (153,091 | ) | (1,578,569 | ) | (155,801 | ) | (1,586,634 | ) | ||||||||
| Increase | 44,988 | $ | 498,559 | 125,090 | $ | 1,340,228 | ||||||||||
| Class C Shares | ||||||||||||||||
| Shares sold | 16,108 | $ | 170,018 | 38,465 | $ | 406,664 | ||||||||||
| Reinvestment of distributions | 2,930 | 30,722 | 1,602 | 16,544 | ||||||||||||
| Shares reacquired | (37,707 | ) | (393,432 | ) | (24,973 | ) | (254,382 | ) | ||||||||
| Converted to Class A | (2,068 | ) | (21,027 | ) | – | – | ||||||||||
| Increase (decrease) | (20,737 | ) | $ | (213,719 | ) | 15,094 | $ | 168,826 | ||||||||
| Class F Shares | ||||||||||||||||
| Shares sold | 109,682 | $ | 1,142,316 | 392,172 | $ | 4,081,283 | ||||||||||
| Reinvestment of distributions | 11,948 | 125,320 | 10,735 | 111,561 | ||||||||||||
| Shares reacquired | (43,427 | ) | (455,067 | ) | (302,788 | ) | (3,196,227 | ) | ||||||||
| Increase | 78,203 | $ | 812,569 | 100,119 | $ | 996,617 | ||||||||||
| Class F3 Shares | ||||||||||||||||
| Reinvestment of distributions | – | – | 2,633 | 26,701 | ||||||||||||
| Increase | – | $ | – | 2,633 | $ | 26,701 | ||||||||||
549
Notes to Financial Statements (continued)
| Year Ended | Year Ended | |||||||||||||||
| Corporate Bond Fund | November 30, 2021 | November 30, 2020 | ||||||||||||||
| Class I Shares | Shares | Amount | Shares | Amount | ||||||||||||
| Shares sold | 1,403 | $ | 14,840 | 1,256 | $ | 13,119 | ||||||||||
| Reinvestment of distributions | 647 | 6,771 | 519 | 5,351 | ||||||||||||
| Shares reacquired | (494 | ) | (5,173 | ) | (6,025 | ) | (61,392 | ) | ||||||||
| Increase (decrease) | 1,556 | $ | 16,438 | (4,250 | ) | $ | (42,922 | ) | ||||||||
| Class R2 Shares | ||||||||||||||||
| Shares sold | 5 | $ | 56 | – | $ | – | ||||||||||
| Reinvestment of distributions | – | – | 36 | 361 | ||||||||||||
| Shares reacquired | – | (1 | ) | – | – | |||||||||||
| Increase | 5 | $ | 55 | 36 | $ | 361 | ||||||||||
| Class R3 Shares | ||||||||||||||||
| Shares sold | 1,070 | $ | 11,108 | 164 | $ | 1,693 | ||||||||||
| Reinvestment of distributions | 131 | 1,375 | 116 | 1,197 | ||||||||||||
| Shares reacquired | (7 | ) | (74 | ) | (143 | ) | (1,475 | ) | ||||||||
| Increase | 1,194 | $ | 12,409 | 137 | $ | 1,415 | ||||||||||
| Class R4 Shares | ||||||||||||||||
| Reinvestment of distributions | – | – | 39 | 406 | ||||||||||||
| Increase | – | $ | – | 39 | $ | 406 | ||||||||||
| Class R5 Shares | ||||||||||||||||
| Reinvestment of distributions | – | – | 44 | 438 | ||||||||||||
| Increase | – | $ | – | 44 | $ | 438 | ||||||||||
| Class R6 Shares | ||||||||||||||||
| Shares sold | 595 | $ | 6,173 | 2,434 | $ | 25,457 | ||||||||||
| Reinvestment of distributions | 135 | 1,412 | 2,700 | 27,389 | ||||||||||||
| Shares reacquired | (16 | ) | (167 | ) | (8 | ) | (84 | ) | ||||||||
| Increase | 714 | $ | 7,418 | 5,126 | $ | 52,762 | ||||||||||
| Year Ended | Year Ended | |||||||||||||||
| Floating Rate Fund | November 30, 2021 | November 30, 2020 | ||||||||||||||
| Class A Shares | Shares | Amount | Shares | Amount | ||||||||||||
| Shares sold | 70,847,868 | $ | 594,915,418 | 53,831,205 | $ | 452,762,182 | ||||||||||
| Converted from Class C* | 9,767,096 | 82,006,518 | 22,537,440 | 179,070,970 | ||||||||||||
| Reinvestment of distributions | 7,345,121 | 61,637,264 | 9,901,261 | 80,121,236 | ||||||||||||
| Shares reacquired | (69,588,714 | ) | (582,705,688 | ) | (149,805,123 | ) | (1,214,623,631 | ) | ||||||||
| Increase (decrease) | 18,371,371 | $ | 155,853,512 | (63,535,217 | ) | $ | (502,669,243 | ) | ||||||||
| Class C Shares | ||||||||||||||||
| Shares sold | 10,967,468 | $ | 92,170,716 | 8,867,958 | $ | 75,105,350 | ||||||||||
| Reinvestment of distributions | 1,925,648 | 16,160,520 | 3,650,995 | 29,534,503 | ||||||||||||
| Shares reacquired | (18,638,211 | ) | (156,235,798 | ) | (45,374,513 | ) | (365,881,174 | ) | ||||||||
| Converted to Class A* | (9,758,678 | ) | (82,006,518 | ) | (22,511,427 | ) | (179,070,970 | ) | ||||||||
| Decrease | (15,503,773 | ) | $ | (129,911,080 | ) | (55,366,987 | ) | $ | (440,312,291 | ) | ||||||
550
Notes to Financial Statements (continued)
| Year Ended | Year Ended | |||||||||||||||
| Floating Rate Fund | November 30, 2021 | November 30, 2020 | ||||||||||||||
| Class F Shares | Shares | Amount | Shares | Amount | ||||||||||||
| Shares sold | 210,990,966 | $ | 1,769,590,962 | 166,926,226 | $ | 1,396,671,053 | ||||||||||
| Reinvestment of distributions | 9,078,458 | 76,117,529 | 12,916,068 | 104,660,547 | ||||||||||||
| Shares reacquired | (133,896,233 | ) | (1,120,582,117 | ) | (366,557,368 | ) | (2,953,733,180 | ) | ||||||||
| Increase (decrease) | 86,173,191 | $ | 725,126,374 | (186,715,074 | ) | $ | (1,452,401,580 | ) | ||||||||
| Class F3 Shares | ||||||||||||||||
| Shares sold | 8,474,462 | $ | 71,297,602 | 6,871,886 | $ | 56,249,498 | ||||||||||
| Reinvestment of distributions | 540,485 | 4,542,901 | 690,599 | 5,601,185 | ||||||||||||
| Shares reacquired | (3,688,320 | ) | (30,961,663 | ) | (13,297,322 | ) | (108,344,898 | ) | ||||||||
| Increase (decrease) | 5,326,627 | $ | 44,878,840 | (5,734,837 | ) | $ | (46,494,215 | ) | ||||||||
| Class I Shares | ||||||||||||||||
| Shares sold | 69,936,987 | $ | 587,730,859 | 85,714,702 | $ | 723,541,451 | ||||||||||
| Reinvestment of distributions | 4,496,344 | 37,751,554 | 6,039,384 | 49,012,324 | ||||||||||||
| Shares reacquired | (43,284,598 | ) | (362,661,196 | ) | (156,323,718 | ) | (1,234,486,155 | ) | ||||||||
| Increase (decrease) | 31,148,733 | $ | 262,821,217 | (64,569,632 | ) | $ | (461,932,380 | ) | ||||||||
| Class R2 Shares | ||||||||||||||||
| Shares sold | 40,586 | $ | 340,594 | 31,492 | $ | 264,429 | ||||||||||
| Reinvestment of distributions | 3,957 | 33,225 | 6,591 | 53,288 | ||||||||||||
| Shares reacquired | (54,436 | ) | (456,761 | ) | (81,318 | ) | (667,277 | ) | ||||||||
| Decrease | (9,893 | ) | $ | (82,942 | ) | (43,235 | ) | $ | (349,560 | ) | ||||||
| Class R3 Shares | ||||||||||||||||
| Shares sold | 1,667,118 | $ | 14,008,818 | 925,706 | $ | 7,569,960 | ||||||||||
| Reinvestment of distributions | 198,695 | 1,667,940 | 248,085 | 2,003,318 | ||||||||||||
| Shares reacquired | (964,814 | ) | (8,087,543 | ) | (1,934,924 | ) | (15,597,118 | ) | ||||||||
| Increase (decrease) | 900,999 | $ | 7,589,215 | (761,133 | ) | $ | (6,023,840 | ) | ||||||||
| Class R4 Shares | ||||||||||||||||
| Shares sold | 82,782 | $ | 695,249 | 151,743 | $ | 1,270,633 | ||||||||||
| Reinvestment of distributions | 8,967 | 75,220 | 16,796 | 136,247 | ||||||||||||
| Shares reacquired | (131,823 | ) | (1,107,228 | ) | (408,195 | ) | (3,264,735 | ) | ||||||||
| Decrease | (40,074 | ) | $ | (336,759 | ) | (239,656 | ) | $ | (1,857,855 | ) | ||||||
| Class R5 Shares | ||||||||||||||||
| Shares sold | 398,189 | $ | 3,349,757 | 762,766 | $ | 6,459,182 | ||||||||||
| Reinvestment of distributions | 16,238 | 136,348 | 42,919 | 343,260 | ||||||||||||
| Shares reacquired | (671,012 | ) | (5,639,854 | ) | (955,644 | ) | (7,477,955 | ) | ||||||||
| Decrease | (256,585 | ) | $ | (2,153,749 | ) | (149,959 | ) | $ | (675,513 | ) | ||||||
| Class R6 Shares | ||||||||||||||||
| Shares sold | 2,160,379 | $ | 18,127,016 | 5,938,862 | $ | 49,656,121 | ||||||||||
| Reinvestment of distributions | 519,585 | 4,363,259 | 711,490 | 5,731,955 | ||||||||||||
| Shares reacquired | (6,436,240 | ) | (54,028,809 | ) | (4,066,341 | ) | (32,569,798 | ) | ||||||||
| Increase (decrease) | (3,756,276 | ) | $ | (31,538,534 | ) | 2,584,011 | $ | 22,818,278 | ||||||||
551
Notes to Financial Statements (continued)
| Year Ended | Year Ended | |||||||||||||||
| High Yield Fund | November 30, 2021 | November 30, 2020 | ||||||||||||||
| Class A Shares | Shares | Amount | Shares | Amount | ||||||||||||
| Shares sold | 35,201,499 | $ | 264,367,952 | 62,049,030 | $ | 429,250,059 | ||||||||||
| Converted from Class C* | 1,910,817 | 14,337,393 | 6,470,599 | 45,018,334 | ||||||||||||
| Reinvestment of distributions | 6,688,340 | 50,255,598 | 7,733,237 | 53,823,441 | ||||||||||||
| Shares reacquired | (52,446,667 | ) | (393,724,754 | ) | (86,298,639 | ) | (594,557,897 | ) | ||||||||
| Decrease | (8,646,011 | ) | $ | (64,763,811 | ) | (10,045,773 | ) | $ | (66,466,063 | ) | ||||||
| Class C Shares | ||||||||||||||||
| Shares sold | 4,371,896 | $ | 32,702,170 | 6,947,239 | $ | 47,589,029 | ||||||||||
| Reinvestment of distributions | 1,440,898 | 10,767,697 | 2,101,155 | 14,501,832 | ||||||||||||
| Shares reacquired | (8,428,793 | ) | (62,988,463 | ) | (14,394,667 | ) | (98,474,437 | ) | ||||||||
| Converted to Class A* | (1,921,059 | ) | (14,337,393 | ) | (6,500,390 | ) | (45,018,334 | ) | ||||||||
| Decrease | (4,537,058 | ) | $ | (33,855,989 | ) | (11,846,663 | ) | $ | (81,401,910 | ) | ||||||
| Class F Shares | ||||||||||||||||
| Shares sold | 102,461,925 | $ | 768,750,074 | 174,926,941 | $ | 1,178,345,632 | ||||||||||
| Reinvestment of distributions | 13,344,832 | 100,148,223 | 15,302,700 | 106,192,473 | ||||||||||||
| Shares reacquired | (101,478,230 | ) | (761,015,489 | ) | (194,022,847 | ) | (1,334,548,452 | ) | ||||||||
| Increase (decrease) | 14,328,527 | $ | 107,882,808 | (3,793,206 | ) | $ | (50,010,347 | ) | ||||||||
| Class F3 Shares | ||||||||||||||||
| Shares sold | 32,270,266 | $ | 243,319,676 | 220,124,645 | $ | 1,438,379,222 | ||||||||||
| Reinvestment of distributions | 8,848,265 | 66,625,138 | 10,245,541 | 71,758,712 | ||||||||||||
| Shares reacquired | (212,661,038 | ) | (1,602,908,012 | ) | (34,989,634 | ) | (243,036,010 | ) | ||||||||
| Increase (decrease) | (171,542,507 | ) | $ | (1,292,963,198 | ) | 195,380,552 | $ | 1,267,101,924 | ||||||||
| Class I Shares | ||||||||||||||||
| Shares sold | 76,491,846 | $ | 576,745,229 | 157,436,477 | $ | 1,084,994,455 | ||||||||||
| Reinvestment of distributions | 10,963,627 | 82,753,464 | 10,770,107 | 75,364,640 | ||||||||||||
| Shares reacquired | (78,476,325 | ) | (591,873,491 | ) | (158,897,614 | ) | (1,108,508,456 | ) | ||||||||
| Increase | 8,979,148 | $ | 67,625,202 | 9,308,970 | $ | 51,850,639 | ||||||||||
| Class P Shares | ||||||||||||||||
| Shares sold | 419 | $ | 3,205 | 2,285 | $ | 17,112 | ||||||||||
| Reinvestment of distributions | 277 | 2,108 | 411 | 2,878 | ||||||||||||
| Shares reacquired | (2,165 | ) | (16,322 | ) | (2,192 | ) | (15,016 | ) | ||||||||
| Increase (decrease) | (1,469 | ) | $ | (11,009 | ) | 504 | $ | 4,974 | ||||||||
| Class R2 Shares | ||||||||||||||||
| Shares sold | 369,227 | $ | 2,787,025 | 358,789 | $ | 2,534,757 | ||||||||||
| Reinvestment of distributions | 33,329 | 251,851 | 55,034 | 383,282 | ||||||||||||
| Shares reacquired | (455,104 | ) | (3,428,803 | ) | (1,028,810 | ) | (7,203,411 | ) | ||||||||
| Decrease | (52,548 | ) | $ | (389,927 | ) | (614,987 | ) | $ | (4,285,372 | ) | ||||||
| Class R3 Shares | ||||||||||||||||
| Shares sold | 3,060,729 | $ | 23,151,999 | 4,311,006 | $ | 30,022,516 | ||||||||||
| Reinvestment of distributions | 672,087 | 5,076,622 | 829,252 | 5,789,251 | ||||||||||||
| Shares reacquired | (4,139,075 | ) | (31,227,579 | ) | (5,372,182 | ) | (37,154,910 | ) | ||||||||
| Decrease | (406,259 | ) | $ | (2,998,958 | ) | (231,924 | ) | $ | (1,343,143 | ) | ||||||
552
Notes to Financial Statements (continued)
| Year Ended | Year Ended | |||||||||||||||
| High Yield Fund | November 30, 2021 | November 30, 2020 | ||||||||||||||
| Class R4 Shares | Shares | Amount | Shares | Amount | ||||||||||||
| Shares sold | 4,403,524 | $ | 33,058,825 | 8,174,919 | $ | 56,282,195 | ||||||||||
| Reinvestment of distributions | 499,146 | 3,748,665 | 684,442 | 4,748,489 | ||||||||||||
| Shares reacquired | (7,389,802 | ) | (55,482,815 | ) | (8,217,195 | ) | (57,188,882 | ) | ||||||||
| Increase (decrease) | (2,487,132 | ) | $ | (18,675,325 | ) | 642,166 | $ | 3,841,802 | ||||||||
| Class R5 Shares | ||||||||||||||||
| Shares sold | 7,540,132 | $ | 57,015,450 | 6,928,944 | $ | 46,782,369 | ||||||||||
| Reinvestment of distributions | 1,627,911 | 12,281,825 | 2,078,497 | 14,509,468 | ||||||||||||
| Shares reacquired | (8,243,811 | ) | (61,884,881 | ) | (13,208,442 | ) | (92,713,565 | ) | ||||||||
| Increase (decrease) | 924,232 | $ | 7,412,394 | (4,201,001 | ) | $ | (31,421,728 | ) | ||||||||
| Class R6 Shares | ||||||||||||||||
| Shares sold | 29,333,655 | $ | 221,706,022 | 35,139,885 | $ | 243,503,854 | ||||||||||
| Reinvestment of distributions | 4,214,333 | 31,816,393 | 4,531,498 | 31,621,748 | ||||||||||||
| Shares reacquired | (27,338,088 | ) | (206,408,207 | ) | (35,825,195 | ) | (253,644,167 | ) | ||||||||
| Increase | 6,209,900 | $ | 47,114,208 | 3,846,188 | $ | 21,481,435 | ||||||||||
| Year Ended | Year Ended | |||||||||||||||
| Income Fund | November 30, 2021 | November 30, 2020 | ||||||||||||||
| Class A Shares | Shares | Amount | Shares | Amount | ||||||||||||
| Shares sold | 74,924,736 | $ | 224,544,836 | 94,665,949 | $ | 274,630,661 | ||||||||||
| Converted from Class C* | 4,685,702 | 14,024,020 | 17,404,978 | 51,097,060 | ||||||||||||
| Reinvestment of distributions | 11,700,147 | 35,049,259 | 12,784,373 | 36,873,308 | ||||||||||||
| Shares reacquired | (73,278,649 | ) | (219,290,688 | ) | (79,232,188 | ) | (225,683,327 | ) | ||||||||
| Increase | 18,031,936 | $ | 54,327,427 | 45,623,112 | $ | 136,917,702 | ||||||||||
| �� | ||||||||||||||||
| Class C Shares | ||||||||||||||||
| Shares sold | 3,308,724 | $ | 9,972,263 | 9,692,001 | $ | 28,135,423 | ||||||||||
| Reinvestment of distributions | 715,722 | 2,152,260 | 1,377,497 | 3,978,104 | ||||||||||||
| Shares reacquired | (7,986,625 | ) | (24,006,282 | ) | (13,569,091 | ) | (38,740,295 | ) | ||||||||
| Converted to Class A* | (4,670,096 | ) | (14,024,020 | ) | (17,298,443 | ) | (51,097,060 | ) | ||||||||
| Decrease | (8,632,275 | ) | $ | (25,905,779 | ) | (19,798,036 | ) | $ | (57,723,828 | ) | ||||||
| Class F Shares | ||||||||||||||||
| Shares sold | 66,348,099 | $ | 198,816,209 | 104,873,324 | $ | 300,332,169 | ||||||||||
| Reinvestment of distributions | 5,184,030 | 15,532,153 | 6,239,824 | 17,981,009 | ||||||||||||
| Shares reacquired | (70,222,604 | ) | (210,223,140 | ) | (125,024,088 | ) | (357,555,687 | ) | ||||||||
| Increase (decrease) | 1,309,525 | $ | 4,125,222 | (13,910,940 | ) | $ | (39,242,509 | ) | ||||||||
| Class F3 Shares | ||||||||||||||||
| Shares sold | 129,476,964 | $ | 387,986,205 | 83,849,617 | $ | 243,023,663 | ||||||||||
| Reinvestment of distributions | 9,079,711 | 27,200,930 | 8,698,355 | 25,086,698 | ||||||||||||
| Shares reacquired | (48,906,705 | ) | (146,409,637 | ) | (54,268,142 | ) | (154,189,022 | ) | ||||||||
| Increase | 89,649,970 | $ | 268,777,498 | 38,279,830 | $ | 113,921,339 | ||||||||||
| Class I Shares | ||||||||||||||||
| Shares sold | 15,827,037 | $ | 47,567,746 | 28,201,911 | $ | 81,560,116 | ||||||||||
| Reinvestment of distributions | 1,489,424 | 4,463,106 | 1,974,151 | 5,686,608 | ||||||||||||
| Shares reacquired | (23,676,325 | ) | (70,381,845 | ) | (41,854,035 | ) | (117,243,499 | ) | ||||||||
| Decrease | (6,359,864 | ) | $ | (18,350,993 | ) | (11,677,973 | ) | $ | (29,996,775 | ) | ||||||
553
Notes to Financial Statements (continued)
| Year Ended | Year Ended | |||||||||||||||
| Income Fund | November 30, 2021 | November 30, 2020 | ||||||||||||||
| Class R2 Shares | Shares | Amount | Shares | Amount | ||||||||||||
| Shares sold | 112,921 | $ | 342,693 | 515,209 | $ | 1,512,832 | ||||||||||
| Reinvestment of distributions | 12,166 | 36,716 | 16,159 | 46,734 | ||||||||||||
| Shares reacquired | (247,326 | ) | (749,642 | ) | (399,415 | ) | (1,164,039 | ) | ||||||||
| Increase (decrease) | (122,239 | ) | $ | (370,233 | ) | 131,953 | $ | 395,527 | ||||||||
| Class R3 Shares | ||||||||||||||||
| Shares sold | 3,855,986 | $ | 11,589,654 | 3,917,042 | $ | 11,291,709 | ||||||||||
| Reinvestment of distributions | 497,374 | 1,495,008 | 621,746 | 1,797,240 | ||||||||||||
| Shares reacquired | (3,129,824 | ) | (9,416,813 | ) | (5,923,830 | ) | (16,878,142 | ) | ||||||||
| Increase (decrease) | 1,223,536 | $ | 3,667,849 | (1,385,042 | ) | $ | (3,789,193 | ) | ||||||||
| Class R4 Shares | ||||||||||||||||
| Shares sold | 547,096 | $ | 1,640,557 | 1,378,203 | $ | 3,996,869 | ||||||||||
| Reinvestment of distributions | 21,073 | 63,173 | 42,255 | 121,694 | ||||||||||||
| Shares reacquired | (2,121,048 | ) | (6,317,159 | ) | (1,535,123 | ) | (4,424,900 | ) | ||||||||
| Decrease | (1,552,879 | ) | $ | (4,613,429 | ) | (114,665 | ) | $ | (306,337 | ) | ||||||
| Class R5 Shares | ||||||||||||||||
| Shares sold | 528,663 | $ | 1,580,637 | 1,090,790 | $ | 3,153,798 | ||||||||||
| Reinvestment of distributions | 19,465 | 58,361 | 24,336 | 70,078 | ||||||||||||
| Shares reacquired | (612,910 | ) | (1,829,498 | ) | (1,038,776 | ) | (2,920,424 | ) | ||||||||
| Increase (decrease) | (64,782 | ) | $ | (190,500 | ) | 76,350 | $ | 303,452 | ||||||||
| Class R6 Shares | ||||||||||||||||
| Shares sold | 6,544,355 | $ | 19,586,648 | 9,171,658 | $ | 26,565,880 | ||||||||||
| Reinvestment of distributions | 318,842 | 955,030 | 375,892 | 1,083,213 | ||||||||||||
| Shares reacquired | (5,241,405 | ) | (15,685,649 | ) | (8,886,672 | ) | (25,406,211 | ) | ||||||||
| Increase | 1,621,792 | $ | 4,856,029 | 660,878 | $ | 2,242,882 | ||||||||||
| Year Ended | Year Ended | |||||||||||||||
| Inflation Focused Fund | November 30, 2021 | November 30, 2020 | ||||||||||||||
| Class A Shares | Shares | Amount | Shares | Amount | ||||||||||||
| Shares sold | 41,935,852 | $ | 511,771,404 | 2,228,292 | $ | 24,006,488 | ||||||||||
| Converted from Class C* | 295,272 | 3,536,718 | 491,415 | 5,326,517 | ||||||||||||
| Reinvestment of distributions | 525,102 | 6,415,395 | 288,878 | 3,128,420 | ||||||||||||
| Shares reacquired | (5,642,443 | ) | (68,578,309 | ) | (4,831,005 | ) | (51,794,060 | ) | ||||||||
| Increase (decrease) | 37,113,783 | $ | 453,145,208 | (1,822,420 | ) | $ | (19,332,635 | ) | ||||||||
| Class C Shares | ||||||||||||||||
| Shares sold | 6,494,253 | $ | 79,716,782 | 380,822 | $ | 4,120,498 | ||||||||||
| Reinvestment of distributions | 52,333 | 639,134 | 52,379 | 566,345 | ||||||||||||
| Shares reacquired | (381,482 | ) | (4,625,581 | ) | (929,430 | ) | (9,995,212 | ) | ||||||||
| Converted to Class A* | (294,900 | ) | (3,536,718 | ) | (490,888 | ) | (5,326,517 | ) | ||||||||
| Increase (decrease) | 5,870,204 | $ | 72,193,617 | (987,117 | ) | $ | (10,634,886 | ) | ||||||||
554
Notes to Financial Statements (continued)
| Year Ended | Year Ended | |||||||||||||||
| Inflation Focused Fund | November 30, 2021 | November 30, 2020 | ||||||||||||||
| Class F Shares | Shares | Amount | Shares | Amount | ||||||||||||
| Shares sold | 146,237,476 | $ | 1,792,663,718 | 11,254,145 | $ | 123,470,413 | ||||||||||
| Reinvestment of distributions | 1,492,080 | 18,318,334 | 497,392 | 5,395,961 | ||||||||||||
| Shares reacquired | (18,353,878 | ) | (225,317,052 | ) | (20,635,565 | ) | (217,457,111 | ) | ||||||||
| Increase (decrease) | 129,375,678 | $ | 1,585,665,000 | (8,884,028 | ) | $ | (88,590,737 | ) | ||||||||
| Class F3 Shares | ||||||||||||||||
| Shares sold | 18,929,537 | $ | 233,059,102 | 224,394 | $ | 2,470,489 | ||||||||||
| Reinvestment of distributions | 154,434 | 1,901,674 | 31,700 | 343,124 | ||||||||||||
| Shares reacquired | (817,208 | ) | (10,001,550 | ) | (445,942 | ) | (4,760,598 | ) | ||||||||
| Increase (decrease) | 18,266,763 | $ | 224,959,226 | (189,848 | ) | $ | (1,946,985 | ) | ||||||||
| Class I Shares | ||||||||||||||||
| Shares sold | 61,295,381 | $ | 751,761,704 | 10,756,754 | $ | 118,435,989 | ||||||||||
| Reinvestment of distributions | 1,242,207 | 15,123,194 | 1,521,500 | 16,454,079 | ||||||||||||
| Shares reacquired | (9,885,382 | ) | (120,346,454 | ) | (40,212,471 | ) | (434,303,762 | ) | ||||||||
| Increase (decrease) | 52,652,206 | $ | 646,538,444 | (27,934,217 | ) | $ | (299,413,694 | ) | ||||||||
| Class R2 Shares | ||||||||||||||||
| Shares sold | 110 | $ | 1,334 | 17,751 | $ | 194,417 | ||||||||||
| Reinvestment of distributions | 48 | 577 | 77 | 848 | ||||||||||||
| Shares reacquired | (14,820 | ) | (173,969 | ) | (7,702 | ) | (85,672 | ) | ||||||||
| Increase (decrease) | (14,662 | ) | $ | (172,058 | ) | 10,126 | $ | 109,593 | ||||||||
| Class R3 Shares | ||||||||||||||||
| Shares sold | 25,308 | $ | 307,456 | 12,733 | $ | 128,636 | ||||||||||
| Reinvestment of distributions | 568 | 6,876 | 560 | 6,078 | ||||||||||||
| Shares reacquired | (13,465 | ) | (164,364 | ) | (2,676 | ) | (29,554 | ) | ||||||||
| Increase | 12,411 | $ | 149,968 | 10,617 | $ | 105,160 | ||||||||||
| Class R4 Shares | ||||||||||||||||
| Shares sold | 65,653 | $ | 794,102 | 67,463 | $ | 724,428 | ||||||||||
| Reinvestment of distributions | 2,180 | 26,431 | 2,688 | 29,084 | ||||||||||||
| Shares reacquired | (55,837 | ) | (676,881 | ) | (202,234 | ) | (2,241,111 | ) | ||||||||
| Increase (decrease) | 11,996 | $ | 143,652 | (132,083 | ) | $ | (1,487,599 | ) | ||||||||
| Class R5 Shares | ||||||||||||||||
| Shares sold | 13,642 | $ | 167,922 | 10,530 | $ | 112,984 | ||||||||||
| Reinvestment of distributions | 257 | 3,124 | 518 | 5,573 | ||||||||||||
| Shares reacquired | (4,405 | ) | (52,872 | ) | (25,852 | ) | (272,479 | ) | ||||||||
| Increase (decrease) | 9,494 | $ | 118,174 | (14,804 | ) | $ | (153,922 | ) | ||||||||
| Class R6 Shares | ||||||||||||||||
| Shares sold | 461,544 | $ | 5,560,729 | 880,650 | $ | 9,423,214 | ||||||||||
| Reinvestment of distributions | 27,273 | 330,070 | 103,221 | 1,109,251 | ||||||||||||
| Shares reacquired | (425,112 | ) | (5,140,617 | ) | (2,832,353 | ) | (30,979,215 | ) | ||||||||
| Increase (decrease) | 63,705 | $ | 750,182 | (1,848,482 | ) | $ | (20,446,750 | ) | ||||||||
555
Notes to Financial Statements (continued)
| Year Ended | Year Ended | |||||||||||||||
| Short Duration Core Bond Fund | November 30, 2021 | November 30, 2020 | ||||||||||||||
| Class A Shares | Shares | Amount | Shares | Amount | ||||||||||||
| Shares sold | 3,777,149 | $ | 37,332,636 | 4,278,172 | $ | 41,638,608 | ||||||||||
| Converted from Class C* | 12,660 | 124,444 | 14,889 | 146,807 | ||||||||||||
| Reinvestment of distributions | 73,908 | 728,472 | 40,453 | 397,362 | ||||||||||||
| Shares reacquired | (2,266,963 | ) | (22,386,471 | ) | (1,908,246 | ) | (18,691,277 | ) | ||||||||
| Increase | 1,596,754 | $ | 15,799,081 | 2,425,268 | $ | 23,491,500 | ||||||||||
| Class C Shares | ||||||||||||||||
| Shares sold | 161,545 | $ | 1,595,182 | 307,268 | $ | 3,017,646 | ||||||||||
| Reinvestment of distributions | 4,399 | 43,353 | 4,731 | 46,425 | ||||||||||||
| Shares reacquired | (179,232 | ) | (1,768,687 | ) | (85,254 | ) | (832,058 | ) | ||||||||
| Converted to Class A* | (12,662 | ) | (124,444 | ) | (14,890 | ) | (146,807 | ) | ||||||||
| Increase (decrease) | (25,950 | ) | $ | (254,596 | ) | 211,855 | $ | 2,085,206 | ||||||||
| Class F Shares | ||||||||||||||||
| Shares sold | 10,196,561 | $ | 100,685,925 | 12,153,051 | $ | 119,720,849 | ||||||||||
| Reinvestment of distributions | 181,120 | 1,784,299 | 118,766 | 1,166,295 | ||||||||||||
| Shares reacquired | (8,082,328 | ) | (79,731,097 | ) | (6,815,936 | ) | (66,583,974 | ) | ||||||||
| Increase | 2,295,353 | $ | 22,739,127 | 5,455,881 | $ | 54,303,170 | ||||||||||
| Class F3 Shares | ||||||||||||||||
| Shares sold | 50,505 | $ | 500,000 | – | $ | – | ||||||||||
| Reinvestment of distributions | 903 | 8,893 | 469 | 4,634 | ||||||||||||
| Shares reacquired | – | – | (162,248 | ) | (1,602,664 | ) | ||||||||||
| Increase (decrease) | 51,408 | $ | 508,893 | (161,779 | ) | $ | (1,598,030 | ) | ||||||||
| Class I Shares | ||||||||||||||||
| Shares sold | 2,826,490 | $ | 27,863,515 | 563,251 | $ | 5,526,071 | ||||||||||
| Reinvestment of distributions | 25,102 | 246,972 | 3,521 | 34,741 | ||||||||||||
| Shares reacquired | (587,218 | ) | (5,778,782 | ) | (305,748 | ) | (2,949,394 | ) | ||||||||
| Increase | 2,264,374 | $ | 22,331,705 | 261,024 | $ | 2,611,418 | ||||||||||
| Class R2 Shares | ||||||||||||||||
| Reinvestment of distributions | – | – | 28 | 272 | ||||||||||||
| Shares reacquired | – | – | (2,698 | ) | (26,115 | ) | ||||||||||
| Decrease | – | $ | – | (2,670 | ) | $ | (25,843 | ) | ||||||||
| Class R3 Shares | ||||||||||||||||
| Shares sold | 1,907 | $ | 18,827 | 5,997 | $ | 58,323 | ||||||||||
| Reinvestment of distributions | 76 | 751 | 165 | 1,615 | ||||||||||||
| Shares reacquired | (5,686 | ) | (56,234 | ) | (3,891 | ) | (38,421 | ) | ||||||||
| Increase (decrease) | (3,703 | ) | $ | (36,656 | ) | 2,271 | $ | 21,517 | ||||||||
| Class R4 Shares | ||||||||||||||||
| Reinvestment of distributions | – | – | 32 | 314 | ||||||||||||
| Shares reacquired | – | – | (1,486 | ) | (14,395 | ) | ||||||||||
| Decrease | – | $ | – | (1,454 | ) | $ | (14,081 | ) | ||||||||
556
Notes to Financial Statements (continued)
| Year Ended | Year Ended | |||||||||||||||
| Short Duration Core Bond Fund | November 30, 2021 | November 30, 2020 | ||||||||||||||
| Class R5 Shares | Shares | Amount | Shares | Amount | ||||||||||||
| Reinvestment of distributions | – | – | 35 | 343 | ||||||||||||
| Shares reacquired | – | – | (1,507 | ) | (14,593 | ) | ||||||||||
| Decrease | – | $ | – | (1,472 | ) | $ | (14,250 | ) | ||||||||
| Class R6 Shares | ||||||||||||||||
| Shares sold | 10,092 | $ | 99,232 | 68,192 | $ | 668,359 | ||||||||||
| Reinvestment of distributions | 1,815 | 17,880 | 1,912 | 18,766 | ||||||||||||
| Shares reacquired | (5,389 | ) | (53,305 | ) | (176,244 | ) | (1,738,928 | ) | ||||||||
| Increase (decrease) | 6,518 | $ | 63,807 | (106,140 | ) | $ | (1,051,803 | ) | ||||||||
| Year Ended | Year Ended | |||||||||||||||
| Short Duration Income Fund | November 30, 2021 | November 30, 2020 | ||||||||||||||
| Class A Shares | Shares | Amount | Shares | Amount | ||||||||||||
| Shares sold | 957,059,326 | $ | 4,022,410,417 | 1,158,120,409 | $ | 4,821,271,180 | ||||||||||
| Converted from Class C* | 72,771,884 | 305,709,471 | 253,662,372 | 1,053,164,491 | ||||||||||||
| Reinvestment of distributions | 64,591,613 | 271,205,753 | 74,377,463 | 308,555,392 | ||||||||||||
| Shares reacquired | (918,802,573 | ) | (3,859,945,250 | ) | (1,230,098,845 | ) | (5,070,939,033 | ) | ||||||||
| Increase | 175,620,250 | $ | 739,380,391 | 256,061,399 | $ | 1,112,052,030 | ||||||||||
| Class C Shares | ||||||||||||||||
| Shares sold | 170,862,416 | $ | 722,605,248 | 278,296,629 | $ | 1,167,949,796 | ||||||||||
| Reinvestment of distributions | 13,581,225 | 57,401,321 | 22,484,326 | 93,778,077 | ||||||||||||
| Shares reacquired | (231,916,852 | ) | (980,221,549 | ) | (282,425,885 | ) | (1,173,740,029 | ) | ||||||||
| Converted to Class A* | (72,333,411 | ) | (305,709,471 | ) | (251,881,670 | ) | (1,053,164,491 | ) | ||||||||
| Decrease | (119,806,622 | ) | $ | (505,924,451 | ) | (233,526,600 | ) | $ | (965,176,647 | ) | ||||||
| Class F Shares | ||||||||||||||||
| Shares sold | 2,967,600,484 | $ | 12,461,510,216 | 3,035,552,766 | $ | 12,596,108,550 | ||||||||||
| Reinvestment of distributions | 121,499,361 | 509,896,090 | 136,436,045 | 565,509,706 | ||||||||||||
| Shares reacquired | (2,242,556,542 | ) | (9,414,956,448 | ) | (3,056,339,418 | ) | (12,567,323,766 | ) | ||||||||
| Increase | 846,543,303 | $ | 3,556,449,858 | 115,649,393 | $ | 594,294,490 | ||||||||||
| Class F3 Shares | ||||||||||||||||
| Shares sold | 549,283,667 | $ | 2,310,488,236 | 518,450,718 | $ | 2,153,489,850 | ||||||||||
| Reinvestment of distributions | 26,834,710 | 112,837,928 | 30,927,038 | 128,407,325 | ||||||||||||
| Shares reacquired | (395,770,753 | ) | (1,663,906,113 | ) | (466,045,093 | ) | (1,930,278,874 | ) | ||||||||
| Increase | 180,347,624 | $ | 759,420,051 | 83,332,663 | $ | 351,618,301 | ||||||||||
| Class I Shares | ||||||||||||||||
| Shares sold | 1,553,797,745 | $ | 6,520,845,375 | 1,112,781,041 | $ | 4,625,046,258 | ||||||||||
| Reinvestment of distributions | 60,833,603 | 255,234,900 | 66,276,022 | 274,745,146 | ||||||||||||
| Shares reacquired | (953,347,806 | ) | (4,000,174,954 | ) | (1,295,844,473 | ) | (5,305,745,470 | ) | ||||||||
| Increase (decrease) | 661,283,542 | $ | 2,775,905,321 | (116,787,410 | ) | $ | (405,954,066 | ) | ||||||||
| Class R2 Shares | ||||||||||||||||
| Shares sold | 574,518 | $ | 2,416,685 | 1,787,709 | $ | 7,404,215 | ||||||||||
| Reinvestment of distributions | 41,829 | 175,846 | 54,345 | 225,561 | ||||||||||||
| Shares reacquired | (1,550,672 | ) | (6,522,544 | ) | (2,811,655 | ) | (11,673,275 | ) | ||||||||
| Decrease | (934,325 | ) | $ | (3,930,013 | ) | (969,601 | ) | $ | (4,043,499 | ) | ||||||
557
Notes to Financial Statements (continued)
| Year Ended | Year Ended | |||||||||||||||
| Short Duration Income Fund | November 30, 2021 | November 30, 2020 | ||||||||||||||
| Class R3 Shares | Shares | Amount | Shares | Amount | ||||||||||||
| Shares sold | 25,752,786 | $ | 108,302,140 | 25,726,613 | $ | 107,096,433 | ||||||||||
| Reinvestment of distributions | 1,967,013 | 8,269,040 | 2,350,858 | 9,754,764 | ||||||||||||
| Shares reacquired | (20,857,093 | ) | (87,663,993 | ) | (23,657,432 | ) | (97,577,432 | ) | ||||||||
| Increase | 6,862,706 | $ | 28,907,187 | 4,420,039 | $ | 19,273,765 | ||||||||||
| Class R4 Shares | ||||||||||||||||
| Shares sold | 17,197,108 | $ | 72,362,105 | 20,681,949 | $ | 85,934,046 | ||||||||||
| Reinvestment of distributions | 668,051 | 2,810,370 | 820,825 | 3,409,155 | ||||||||||||
| Shares reacquired | (17,062,650 | ) | (71,845,588 | ) | (16,943,506 | ) | (70,145,375 | ) | ||||||||
| Increase | 802,509 | $ | 3,326,887 | 4,559,268 | $ | 19,197,826 | ||||||||||
| Class R5 Shares | ||||||||||||||||
| Shares sold | 7,257,964 | $ | 30,437,170 | 12,178,982 | $ | 50,679,769 | ||||||||||
| Reinvestment of distributions | 378,499 | 1,587,056 | 536,223 | 2,217,971 | ||||||||||||
| Shares reacquired | (8,969,330 | ) | (37,622,421 | ) | (12,757,332 | ) | (52,507,315 | ) | ||||||||
| Increase (decrease) | (1,332,867 | ) | $ | (5,598,195 | ) | (42,127 | ) | $ | 390,425 | |||||||
| Class R6 Shares | ||||||||||||||||
| Shares sold | 93,338,490 | $ | 392,028,691 | 98,338,489 | $ | 408,380,234 | ||||||||||
| Reinvestment of distributions | 5,447,940 | 22,863,683 | 6,061,400 | 25,119,018 | ||||||||||||
| Shares reacquired | (63,662,505 | ) | (267,397,055 | ) | (94,331,056 | ) | (389,181,294 | ) | ||||||||
| Increase | 35,123,925 | $ | 147,495,319 | 10,068,833 | $ | 44,317,958 | ||||||||||
| Year Ended | Year Ended | |||||||||||||||
| Total Return Fund | November 30, 2021 | November 30, 2020 | ||||||||||||||
| Class A Shares | Shares | Amount | Shares | Amount | ||||||||||||
| Shares sold | 17,942,529 | $ | 190,511,422 | 28,211,327 | $ | 300,688,840 | ||||||||||
| Converted from Class C* | 398,592 | 4,220,753 | 3,274,694 | 35,373,753 | ||||||||||||
| Reinvestment of distributions | 4,903,044 | 52,187,203 | 2,819,877 | 30,060,626 | ||||||||||||
| Shares reacquired | (29,791,268 | ) | (316,106,763 | ) | (26,071,310 | ) | (276,263,441 | ) | ||||||||
| Increase (decrease) | (6,547,103 | ) | $ | (69,187,385 | ) | 8,234,588 | $ | 89,859,778 | ||||||||
| Class C Shares | ||||||||||||||||
| Shares sold | 484,118 | $ | 5,154,965 | 2,252,352 | $ | 23,850,525 | ||||||||||
| Reinvestment of distributions | 235,826 | 2,512,605 | 160,883 | 1,710,386 | ||||||||||||
| Shares reacquired | (2,464,392 | ) | (26,094,816 | ) | (2,624,010 | ) | (27,745,914 | ) | ||||||||
| Converted to Class A* | (398,969 | ) | (4,220,753 | ) | (3,277,729 | ) | (35,373,753 | ) | ||||||||
| Decrease | (2,143,417 | ) | $ | (22,647,999 | ) | (3,488,504 | ) | $ | (37,558,756 | ) | ||||||
| Class F Shares | ||||||||||||||||
| Shares sold | 25,453,059 | $ | 270,208,824 | 28,696,766 | $ | 305,441,219 | ||||||||||
| Reinvestment of distributions | 3,616,161 | 38,478,269 | 2,119,074 | 22,584,710 | ||||||||||||
| Shares reacquired | (21,402,212 | ) | (226,872,160 | ) | (29,533,218 | ) | (312,506,883 | ) | ||||||||
| Increase | 7,667,008 | $ | 81,814,933 | 1,282,622 | $ | 15,519,046 | ||||||||||
558
Notes to Financial Statements (continued)
| Year Ended | Year Ended | |||||||||||||||
| Total Return Fund | November 30, 2021 | November 30, 2020 | ||||||||||||||
| Class F3 Shares | Shares | Amount | Shares | Amount | ||||||||||||
| Shares sold | 23,684,679 | $ | 251,205,279 | 20,120,531 | $ | 214,622,773 | ||||||||||
| Reinvestment of distributions | 3,332,896 | 35,474,033 | 1,849,422 | 19,725,545 | ||||||||||||
| Shares reacquired | (14,362,053 | ) | (152,180,367 | ) | (14,350,744 | ) | (151,748,323 | ) | ||||||||
| Increase | 12,655,522 | $ | 134,498,945 | 7,619,209 | $ | 82,599,995 | ||||||||||
| Class I Shares | ||||||||||||||||
| Shares sold | 13,995,434 | $ | 149,170,987 | 12,298,971 | $ | 130,473,419 | ||||||||||
| Reinvestment of distributions | 1,572,829 | 16,766,843 | 985,523 | 10,523,779 | ||||||||||||
| Shares reacquired | (12,446,700 | ) | (132,132,161 | ) | (13,951,056 | ) | (147,609,560 | ) | ||||||||
| Increase (decrease) | 3,121,563 | $ | 33,805,669 | (666,562 | ) | $ | (6,612,362 | ) | ||||||||
| Class P Shares | ||||||||||||||||
| Shares sold | 16,884 | $ | 180,379 | 20,212 | $ | 212,341 | ||||||||||
| Reinvestment of distributions | 2,398 | 25,666 | 1,258 | 13,484 | ||||||||||||
| Shares reacquired | (12,385 | ) | (132,003 | ) | (11,409 | ) | (122,055 | ) | ||||||||
| Increase | 6,897 | $ | 74,042 | 10,061 | $ | 103,770 | ||||||||||
| Class R2 Shares | ||||||||||||||||
| Shares sold | 43,685 | $ | 464,047 | 86,611 | $ | 913,334 | ||||||||||
| Reinvestment of distributions | 5,821 | 61,996 | 3,626 | 38,620 | ||||||||||||
| Shares reacquired | (118,205 | ) | (1,256,359 | ) | (187,685 | ) | (1,980,901 | ) | ||||||||
| Decrease | (68,699 | ) | $ | (730,316 | ) | (97,448 | ) | $ | (1,028,947 | ) | ||||||
| Class R3 Shares | ||||||||||||||||
| Shares sold | 1,126,048 | $ | 11,974,725 | 3,441,825 | $ | 36,808,856 | ||||||||||
| Reinvestment of distributions | 253,652 | 2,704,114 | 184,847 | 1,968,436 | ||||||||||||
| Shares reacquired | (5,620,810 | ) | (59,892,552 | ) | (4,728,184 | ) | (50,222,928 | ) | ||||||||
| Decrease | (4,241,110 | ) | $ | (45,213,713 | ) | (1,101,512 | ) | $ | (11,445,636 | ) | ||||||
| Class R4 Shares | ||||||||||||||||
| Shares sold | 1,973,453 | $ | 20,956,107 | 3,415,933 | $ | 36,251,462 | ||||||||||
| Reinvestment of distributions | 103,214 | 1,099,091 | 68,472 | 729,102 | ||||||||||||
| Shares reacquired | (3,288,428 | ) | (34,746,885 | ) | (4,466,657 | ) | (47,272,837 | ) | ||||||||
| Decrease | (1,211,761 | ) | $ | (12,691,687 | ) | (982,252 | ) | $ | (10,292,273 | ) | ||||||
| Class R5 Shares | ||||||||||||||||
| Shares sold | 1,478,286 | $ | 15,732,346 | 2,854,410 | $ | 30,264,005 | ||||||||||
| Reinvestment of distributions | 364,187 | 3,880,733 | 272,420 | 2,902,389 | ||||||||||||
| Shares reacquired | (4,454,550 | ) | (47,430,148 | ) | (5,225,045 | ) | (55,213,141 | ) | ||||||||
| Decrease | (2,612,077 | ) | $ | (27,817,069 | ) | (2,098,215 | ) | $ | (22,046,747 | ) | ||||||
| Class R6 Shares | ||||||||||||||||
| Shares sold | 6,968,509 | $ | 74,053,703 | 14,406,152 | $ | 152,255,046 | ||||||||||
| Reinvestment of distributions | 1,084,454 | 11,550,669 | 859,492 | 9,159,777 | ||||||||||||
| Shares reacquired | (11,114,907 | ) | (118,063,420 | ) | (22,972,530 | ) | (243,653,902 | ) | ||||||||
| Decrease | (3,061,944 | ) | $ | (32,459,048 | ) | (7,706,886 | ) | $ | (82,239,079 | ) | ||||||
559
Notes to Financial Statements (concluded)
| Year Ended | Year Ended | |||||||||||||||
| Ultra Short Bond Fund | November 30, 2021 | November 30, 2020 | ||||||||||||||
| Class A Shares | Shares | Amount | Shares | Amount | ||||||||||||
| Shares sold | 607,828,859 | $ | 6,097,215,028 | 1,170,775,799 | $ | 11,728,084,997 | ||||||||||
| Reinvestment of distributions | 4,032,930 | 40,438,554 | 13,857,706 | 138,526,354 | ||||||||||||
| Shares reacquired | (833,349,467 | ) | (8,358,572,837 | ) | (1,149,768,490 | ) | (11,471,918,155 | ) | ||||||||
| Increase (decrease) | (221,487,678 | ) | $ | (2,220,919,255 | ) | 34,865,015 | $ | 394,693,196 | ||||||||
| Class A1 Shares | ||||||||||||||||
| Shares sold | 334,126 | $ | 3,352,608 | 2,357,324 | $ | 23,644,104 | ||||||||||
| Reinvestment of distributions | 4,258 | 42,703 | 8,115 | 81,206 | ||||||||||||
| Shares reacquired | (947,144 | ) | (9,501,049 | ) | (718,248 | ) | (7,195,066 | ) | ||||||||
| Increase (decrease) | (608,760 | ) | $ | (6,105,738 | ) | 1,647,191 | $ | 16,530,244 | ||||||||
| Class F Shares | ||||||||||||||||
| Shares sold | 384,732,142 | $ | 3,859,631,760 | 803,904,504 | $ | 8,044,780,233 | ||||||||||
| Reinvestment of distributions | 2,276,659 | 22,832,751 | 7,059,688 | 70,584,503 | ||||||||||||
| Shares reacquired | (560,204,231 | ) | (5,619,560,382 | ) | (754,923,557 | ) | (7,541,778,990 | ) | ||||||||
| Increase (decrease) | (173,195,430 | ) | $ | (1,737,095,871 | ) | 56,040,635 | $ | 573,585,746 | ||||||||
| Class F3 Shares | ||||||||||||||||
| Shares sold | 55,335,031 | $ | 555,091,222 | 83,992,528 | $ | 841,881,724 | ||||||||||
| Reinvestment of distributions | 187,823 | 1,883,599 | 319,051 | 3,190,700 | ||||||||||||
| Shares reacquired | (83,732,448 | ) | (840,043,714 | ) | (32,349,945 | ) | (323,530,736 | ) | ||||||||
| Increase (decrease) | (28,209,594 | ) | $ | (283,068,893 | ) | 51,961,634 | $ | 521,541,688 | ||||||||
| Class I Shares | ||||||||||||||||
| Shares sold | 89,869,984 | $ | 901,322,863 | 114,257,562 | $ | 1,142,913,440 | ||||||||||
| Reinvestment of distributions | 576,492 | 5,780,417 | 1,506,844 | 15,067,553 | ||||||||||||
| Shares reacquired | (87,241,085 | ) | (875,020,183 | ) | (170,310,302 | ) | (1,699,293,306 | ) | ||||||||
| Increase (decrease) | 3,205,391 | $ | 32,083,097 | (54,545,896 | ) | $ | (541,312,313 | ) | ||||||||
| Class R5 Shares | ||||||||||||||||
| Shares sold | 1,247 | $ | 12,497 | 644,235 | $ | 6,410,557 | ||||||||||
| Reinvestment of distributions | 356 | 3,572 | 2,412 | 24,133 | ||||||||||||
| Shares reacquired | (20,468 | ) | (205,335 | ) | (705,042 | ) | (7,065,566 | ) | ||||||||
| Decrease | (18,865 | ) | $ | (189,266 | ) | (58,395 | ) | $ | (630,876 | ) | ||||||
| Class R6 Shares | ||||||||||||||||
| Shares sold | 4,542,848 | $ | 45,564,511 | 8,420,502 | $ | 84,461,803 | ||||||||||
| Reinvestment of distributions | 42,859 | 429,776 | 57,022 | 570,092 | ||||||||||||
| Shares reacquired | (2,364,440 | ) | (23,723,592 | ) | (3,157,554 | ) | (31,624,229 | ) | ||||||||
| Increase | 2,221,267 | $ | 22,270,695 | 5,319,970 | $ | 53,407,666 | ||||||||||
| * | Automatic conversion of Class C shares occurs on the 25th day of the month (or, if the 25th day was not a business day, the next business day thereafter) following the eighth anniversary of the day on which the purchase order was accepted. Prior to June 30, 2020, conversion occurred following the tenth anniversary of the day on which the purchase was accepted. |
560
Report of Independent Registered Public Accounting Firm
To the shareholders and the Board of Trustees of Lord Abbett Investment Trust
Opinion on the Financial Statements and Financial Highlights
We have audited the accompanying statements of assets and liabilities, including the schedules of investments, of Lord Abbett Convertible Fund, Lord Abbett Core Fixed Income Fund, Lord Abbett Core Plus Bond Fund, Lord Abbett Corporate Bond Fund, Lord Abbett Floating Rate Fund, Lord Abbett High Yield Fund, Lord Abbett Income Fund, Lord Abbett Inflation Focused Fund, Lord Abbett Short Duration Core Bond Fund, Lord Abbett Short Duration Income Fund, Lord Abbett Total Return Fund, and Lord Abbett Ultra Short Bond Fund, twelve of the funds constituting the Lord Abbett Investment Trust (the “Trust”), as of November 30, 2021, the related statements of operations for the year then ended, the statements of changes in net assets for each of the two years in the period then ended, the financial highlights for each of the five years in the period then ended for the Trust, except for the Funds listed in the table below; and the financial highlights for the periods indicated in the table below; and the related notes. In our opinion, the financial statements and financial highlights present fairly, in all material respects, the financial position of each of the funds listed above constituting the Trust as of November 30, 2021, and the results of their operations for the year then ended, the changes in their net assets for each of the two years in the period then ended, and the financial highlights for each of the five years in the period then ended (or for the period listed in the table below), in conformity with accounting principles generally accepted in the United States of America.
| Individual Funds constituting Lord Abbett Investment Trust | Financial Highlights |
| Lord Abbett Corporate Bond Fund | For the years ended November 30, 2021, 2020, 2019, 2018, and the period from April 19, 2017 (commencement of operations) through November 30, 2017 |
| Lord Abbett Short Duration Core Bond Fund | For the years ended November 30, 2021, 2020, 2019, 2018, and the period from April 19, 2017 (commencement of operations) through November 30, 2017 |
Basis for Opinion
These financial statements and financial highlights are the responsibility of the Trust’s management. Our responsibility is to express an opinion on the Trust’s financial statements and financial highlights based on our audits. We are a public accounting firm registered with the Public Company Accounting Oversight Board (United States) (PCAOB) and are required to be independent with respect to the Trust in accordance with the U.S. federal securities laws and the applicable rules and regulations of the Securities and Exchange Commission and the PCAOB.
We conducted our audits in accordance with the standards of the PCAOB. Those standards require that we plan and perform the audit to obtain reasonable assurance about whether the financial statements and financial highlights are free of material misstatement, whether due to error or fraud. The Trust is not required to have, nor were we engaged to perform, an audit of its internal control over financial reporting. As part of our audits we are required to obtain an understanding of internal control over financial reporting but not for the purpose of expressing an opinion on the effectiveness of the Trust’s internal control over financial reporting. Accordingly, we express no such opinion.
561
Report of Independent Registered Public Accounting Firm (continued)
Our audits included performing procedures to assess the risks of material misstatement of the financial statements and financial highlights, whether due to error or fraud, and performing procedures that respond to those risks. Such procedures included examining, on a test basis, evidence regarding the amounts and disclosures in the financial statements and financial highlights. Our audits also included evaluating the accounting principles used and significant estimates made by management, as well as evaluating the overall presentation of the financial statements and financial highlights. Our procedures included confirmation of securities owned as of November 30, 2021, by correspondence with the custodian, brokers and selling or agent banks; when replies were not received from brokers and selling or agent banks, we performed other auditing procedures. We believe that our audits provide a reasonable basis for our opinion.
DELOITTE & TOUCHE LLP
New York, New York
January 28, 2022
We have served as the auditor of one or more Lord Abbett Family of Funds’ investment companies since 1932.
562
Basic Information About Management
The Board is responsible for the management of the business and affairs of the Fund in accordance with the laws of the state of organization. The Board elects officers who are responsible for the day-to-day operations of the Fund and who execute policies authorized by the Board. The Board also approves an investment adviser to the Fund and continues to monitor the cost and quality of the services the investment adviser provides, and annually considers whether to renew the contract with the investment adviser. Generally, each Board member holds office until his/her successor is elected and qualified or until his/her earlier resignation or removal, as provided in the Fund’s organizational documents.
Lord, Abbett & Co. LLC (“Lord Abbett”), a Delaware limited liability company, is the Fund’s investment adviser. Designated Lord Abbett personnel are responsible for the day-to-day management of the Fund.
Independent Board Members
The following Independent Board Members also are board members of each of the 14 investment companies in the Lord Abbett Family of Funds, which consist of 63 investment portfolios.
| Name, Address and Year of Birth | Current Position and Length of Service with the Fund | Principal Occupation and Other Directorships During the Past Five Years |
| Evelyn E. Guernsey Lord, Abbett & Co. LLC c/o Legal Dept. 90 Hudson Street Jersey City, NJ 07302 (1955) | Board member since 2011 | Principal Occupation: None.
Other Directorships: None. |
| Julie A. Hill Lord, Abbett & Co. LLC c/o Legal Dept. 90 Hudson Street Jersey City, NJ 07302 (1946) | Board member since 2004 | Principal Occupation: Owner and CEO of The Hill Company, a business consulting firm (since 1998).
Other Directorships: Currently serves as director of Anthem, Inc., a health benefits company (since 1994). |
| Kathleen M. Lutito Lord, Abbett & Co. LLC c/o Legal Dept. 90 Hudson Street Jersey City, NJ 07302 (1963) | Board member since 2017 | Principal Occupation: President and Chief Investment Officer of CenturyLink Investment Management Company (since 2006).
Other Directorships: None. |
| James M. McTaggart Lord, Abbett & Co. LLC c/o Legal Dept. 90 Hudson Street Jersey City, NJ 07302 (1947) | Board member since 2012 | Principal Occupation: Independent management advisor and consultant (since 2012).
Other Directorships: Blyth, Inc., a home products company (2004–2015). |
Charles O. Prince Lord, Abbett & Co. LLC | Board member since 2019 | Principal Occupation: None. Formerly Chairman and Chief Executive Officer, Citigroup, Inc. (Retired 2007).
Other Directorships: Currently serves as director of Johnson & Johnson (2006–Present). Previously served as director of Xerox Corporation (2008–2018). |
563
Basic Information About Management (continued)
| Name, Address and Year of Birth | Current Position and Length of Service with the Fund | Principal Occupation and Other Directorships During the Past Five Years |
| Karla M. Rabusch Lord, Abbett & Co. LLC c/o Legal Dept. 90 Hudson Street. Jersey City, NJ 07302 (1959) | Board member since 2017 | Principal Occupation: President and Director of Wells Fargo Funds Management, LLC (2003–2017); President of Wells Fargo Funds (2003–2016).
Other Directorships: None |
| Lorin Patrick Taylor Radtke Lord, Abbett & Co. LLC c/o Legal Dept. 90 Hudson Street Jersey City, NJ 07302 (1968) | Board member since 2021 | Principal Occupation: Partner and Co-Founder of M Seven 8 Partners LLC, a venture capital firm (since 2016). Formerly partner, Goldman Sachs.
Other Directorships: Currently serves as director of Assured Guaranty (2021–Present). |
| Leah Song Richardson Lord, Abbett & Co. LLC c/o Legal Dept. 90 Hudson Street Jersey City, NJ 07302 (1966) | Board member since 2021 | Principal Occupation: President of Colorado College (since 2021) and was formerly Dean at University of California, Irvine–School of Law (2017–2021) and formerly Professor of Law at University of California, Irvine (2014–2017).
Other Directorships: None. |
| Mark A. Schmid Lord, Abbett & Co. LLC c/o Legal Dept. 90 Hudson Street Jersey City, NJ 07302 (1959) | Board member since 2016 | Principal Occupation: None.
Other Directorships: None. |
| James L.L. Tullis Lord, Abbett & Co. LLC c/o Legal Dept. 90 Hudson Street Jersey City, NJ 07302 (1947) | Board member since 2006; Chairman since 2017 | Principal Occupation: Chairman of Tullis Health Investors – FL LLC (since 2018); CEO of Tullis-Dickerson and Co. Inc., a venture capital management firm (1990–2016). Other Directorships: Currently serves as director of Crane Co. (since 1998), Alphatec Spine (since 2018), electroCore, Inc. (since 2018), and Exagen Inc. (since 2019). |
Interested Board Members
Mr. Sieg is affiliated with Lord Abbett and is an “interested person” of the Fund as defined in the Act. Mr. Sieg is a board member of each of the 14 investment companies in the Lord Abbett Family of Funds, which consist of 63 investment portfolios. Mr. Sieg is an officer of the Lord Abbett Family of Funds.
| Name, Address and Year of Birth | Current Position and Length of Service with the Fund | Principal Occupation and Other Directorships During the Past Five Years |
| Douglas B. Sieg Lord, Abbett & Co. LLC 90 Hudson Street Jersey City, NJ 07302 (1969) | Board member since 2016; President and Chief Executive Officer since 2018 | Principal Occupation: Managing Partner (since 2018) and was formerly Head of Client Services, joined Lord Abbett in 1994.
Other Directorships: None. |
564
Basic Information About Management (continued)
Officers
None of the officers listed below have received compensation from the Fund. All of the officers of the Fund also may be officers of the other Lord Abbett Funds and maintain offices at 90 Hudson Street, Jersey City, NJ 07302. Unless otherwise indicated, the position(s) and title(s) listed under the “Principal Occupation During the Past Five Years” column indicate each officer’s position(s) and title(s) with Lord Abbett. Each officer serves for an indefinite term (i.e., until his or her death, resignation, retirement, or removal).
| Name and Year of Birth | Current Position with the Fund | Length of Service of Current Position | Principal Occupation During the Past Five Years |
| Douglas B. Sieg (1969) | President and Chief Executive Officer | Elected as President and Chief Executive Officer in 2018 | Managing Partner of Lord Abbett (since 2018) and was formerly Head of Client Services, joined Lord Abbett in 1994. |
| Jackson C. Chan (1964) | AML Compliance Officer | Elected in 2018 | Deputy Chief Compliance Officer and Director of Regulatory Affairs, joined Lord Abbett in 2014. |
| Pamela P. Chen (1978) | Vice President, Assistant Secretary and Privacy Officer | Elected as Vice President and Assistant Secretary in 2018 and Privacy Officer in 2019 | Associate General Counsel, joined Lord Abbett in 2017 and was formerly Special Counsel at Schulte, Roth & Zabel LLP (2005–2017). |
| John T. Fitzgerald (1975) | Vice President and Assistant Secretary | Elected in 2018 | Deputy General Counsel, joined Lord Abbett in 2018 and was formerly Deputy Head of U.S. Funds Legal, Executive Director and Assistant General Counsel at JPMorgan Chase (2005–2018). |
| Vito A. Fronda (1969) | Vice President and Assistant Treasurer | Elected as Vice President and Assistant Treasurer in 2021 | Partner and Director of U.S. Fund Treasury & Global Taxation, joined Lord Abbett in 2003. |
| Michael J. Hebert (1976) | Chief Financial Officer and Treasurer | Elected as Chief Financial Officer and Treasurer in 2021 | Head of Global Fund Finance, joined Lord Abbett in 2021 and was formerly Vice President at Eaton Vance Management (EVM) (2014–2021) and Calvert Research & Management (CRM) (2016–2021), and Assistant Treasurer of registered investment companies managed, advised or administered by EVM and CRM during such years. |
| Linda Y. Kim (1980) | Vice President and Assistant Secretary | Elected in 2016 | Counsel, joined Lord Abbett in 2015. |
565
Basic Information About Management (concluded)
| Name and Year of Birth | Current Position with the Fund | Length of Service of Current Position | Principal Occupation During the Past Five Years |
| Joseph M. McGill (1962) | Chief Compliance Officer | Elected in 2014 | Partner and Chief Compliance Officer, joined Lord Abbett in 2014. |
| Amanda S. Ryan (1978) | Vice President and Assistant Secretary | Elected in 2018 | Counsel, joined Lord Abbett in 2016. |
| Lawrence B. Stoller (1963) | Vice President, Secretary and Chief Legal Officer | Elected as Vice President and Secretary in 2007 and Chief Legal Officer in 2019 | Partner and General Counsel, joined Lord Abbett in 2007. |
Please call 888–522–2388 for a copy of the statement of additional information, which contains further information about the Fund’s Board members. It is available free upon request.
566
Approval of Advisory Contract
The Board, including all of the Trustees who are not “interested persons” of the Company or of Lord Abbett, as defined in the Investment Company Act of 1940, as amended (the “Independent Trustees”), annually considers whether to approve the continuation of the existing management agreement between each Fund and Lord Abbett (the “Agreement”). In connection with its most recent approval, the Board reviewed materials relating specifically to the Agreement, as well as numerous materials received throughout the course of the year, including information about each Fund’s investment performance compared to the performance of an appropriate benchmark. Before making its decision as to each Fund, the Board had the opportunity to ask questions and request further information, taking into account its knowledge of Lord Abbett gained through its meetings and discussions. These meetings and discussions included reviews of Fund performance conducted by members of the Contract Committee, the deliberations of the Contract Committee, and discussions between the Contract Committee and Lord Abbett’s management. The Independent Trustees also met with their independent legal counsel in various private sessions at which no representatives of management were present.
The materials received by the Board as to each Fund included, but were not limited to: (1) information provided by Broadridge Financial Solutions (“Broadridge”) regarding the investment performance of the Fund compared to the investment performance of certain funds with similar investment styles as determined by Broadridge, based, in part, on the Fund’s Morningstar category (the “performance peer group”), and the investment performance of one or more appropriate benchmarks; (2) information provided by Broadridge regarding the expense ratios, contractual and actual management fee rates, and other expense components for the Fund and certain funds in the same Morningstar category, with generally the same or similar share classes and operational characteristics, including asset size (the “expense peer group”); (3) certain supplemental investment performance information provided by Lord Abbett; (4) information provided by Lord Abbett on the expense ratios, management fee rates, and other expense components for the Fund; (5) sales and redemption information for the Fund; (6) information regarding Lord Abbett’s financial condition; (7) an analysis of the relative profitability of the Agreement to Lord Abbett; (8) information provided by Lord Abbett regarding the investment management fee schedules for Lord Abbett’s other advisory clients maintaining accounts with a similar investment strategy as the Fund (for each Fund other than Corporate Bond Fund, Income Fund, and Inflation Focused Fund); and (9) information regarding the personnel and other resources devoted by Lord Abbett to managing the Fund.
Investment Management and Related Services Generally. The Board considered the services provided by Lord Abbett to each Fund, including investment research, portfolio management, and trading, and Lord Abbett’s commitment to compliance with all applicable legal requirements. The Board also observed that Lord Abbett was solely engaged in the investment management business and accordingly did not experience the conflicts of interest that may result from being engaged in other lines of business. The Board considered the investment advisory services provided by Lord Abbett to other clients, the fees charged for the services, and the differences in the nature of the services provided to each Fund and other Lord Abbett Funds, on the one hand, and the services provided to other clients, on the other. After reviewing these and related factors, the Board concluded that each Fund was likely to continue to benefit from the nature, extent and quality of the investment services provided by Lord Abbett under the Agreement.
Investment Performance. The Board reviewed each Fund’s investment performance in relation to that of its performance peer group and one or more appropriate benchmarks as of various periods ended June 30, 2021. As to Convertible Fund, the Board observed that the Fund’s investment performance was above the median of the performance peer group for the one-, three- five-, and ten-year periods. As to Core Fixed Income Fund, Income Fund and Total Return Fund, the Board
567
Approval of Advisory Contract (continued)
observed that the Fund’s investment performance was above the median of the performance peer group for the one-year period and below the median for the three-, five-, and ten-year periods. As to Floating Rate Fund the Board observed that the Fund’s investment performance was above the median of the performance peer group for the one-year period, below the median for the three- and five-year periods and equal to the median for the ten-year period. As to Core Plus Bond Fund the Board observed that the Fund’s investment performance was above the median of the performance peer group for the one-, three-, and five-year periods. As to Corporate Bond Fund the Board observed that the Fund’s investment performance was above the median of the performance peer group for the one-year period and below the median for the three-year period. As to Short Duration Core Bond Fund and Ultra Short Bond Fund, the Board observed that the Fund’s investment performance was below the median of the performance peer group for the one- and three-year periods. As to High Yield Fund, the Board observed that the Fund’s investment performance was above the median of the performance peer group for the one-, five-, and ten-year periods, but below the median of the performance peer group for the three-year period. As to Short Duration Income Fund, the Board observed that the Fund’s investment performance was above the median of the performance peer group for the one-, three-, five-, and ten-year periods. As to Inflation Focused Fund, the Board observed that the Fund’s investment performance was above the median of the performance peer group for the one- and five-year periods and below the median of the performance peer group for the three- and ten-year periods. The Board observed that the Fund outperformed its benchmarks for the one-, three-, five-, and ten-year periods. The Board further considered Lord Abbett’s performance and reputation generally, the performance of other Lord Abbett-managed funds overseen by the Board, and the willingness of Lord Abbett to take steps intended to improve performance when appropriate. After reviewing these and other factors, including those described below, the Board concluded that each Fund’s Agreement should be continued.
Lord Abbett’s Personnel and Methods. The Board considered the qualifications of the personnel providing investment management services to each Fund, in light of its investment objective and discipline, and other services provided to each Fund by Lord Abbett. Among other things, the Board considered the size, experience, and turnover of Lord Abbett’s staff, Lord Abbett’s investment methodology and philosophy, and Lord Abbett’s approach to recruiting, training, and retaining personnel.
Nature and Quality of Other Services. The Board considered the nature, quality, and extent of compliance, administrative, and other services performed by Lord Abbett and the nature and extent of Lord Abbett’s supervision of third party service providers, including each Fund’s transfer agent and custodian.
Expenses. The Board considered the expense level of each Fund, including the contractual and actual management fee rates, and the expense levels of the Fund’s expense peer group. It also considered how the expense level of each Fund related to those of the expense peer group and the amount and nature of the fees paid by shareholders. As to Convertible Fund, the Board observed that the net total expense ratio of the Fund was above the median of the expense peer group. As to each other Fund, the Board observed that the net total expense ratio of the Fund was below the median of the expense peer group. After reviewing these and related factors, the Board concluded, within the context of its overall approval of the Agreement, that the management fees paid by, and expense level of, each Fund were reasonable in light of all of the factors it considered and supported the continuation of the Agreement on behalf of each Fund.
Profitability. As to each Fund, the Board considered the level of Lord Abbett’s operating margin in managing the Fund, including a review of Lord Abbett’s methodology for allocating its costs to its
568
Approval of Advisory Contract (concluded)
management of the Fund. It considered whether each Fund was profitable to Lord Abbett in connection with the Fund’s operation, including the fee that Lord Abbett receives from the Fund for providing administrative services to the Fund. The Board considered Lord Abbett’s profit margins excluding Lord Abbett’s marketing and distribution expenses. The Board also considered Lord Abbett’s profit margins, without those exclusions, in comparison with available industry data and how those profit margins could affect Lord Abbett’s ability to recruit and retain personnel. The Board recognized that Lord Abbett’s overall profitability was a factor in enabling it to attract and retain qualified personnel to provide services to each Fund. After reviewing these and related factors, the Board concluded, within the context of its overall approval of the Agreement, that Lord Abbett’s profitability with respect to each Fund was not excessive.
Economies of Scale. As to each Fund, the Board considered the extent to which there had been economies of scale in managing the Fund, whether the Fund’s shareholders had appropriately benefited from such economies of scale, and whether there was potential for realization of any further economies of scale. The Board also considered information provided by Lord Abbett regarding how it shares any potential economies of scale through its investments in its businesses supporting the Funds. The Board also considered each Fund’s existing management fee schedule, noting one or more contractual breakpoints in the level of management fee for each Fund other than Ultra Short Bond Fund, and, with respect to Core Plus Bond Fund, Corporate Bond Fund, and Short Duration Core Bond Fund, the Fund’s expense limitation agreement. Based on these considerations, the Board concluded that economies of scale were adequately addressed in respect of each Fund.
Other Benefits to Lord Abbett. As to each Fund, the Board considered the amount and nature of the fees paid by the Fund and the Fund’s shareholders to Lord Abbett and the Distributor for services other than investment advisory services, such as the fee that Lord Abbett receives from each Fund for providing administrative services to the Fund. The Board also considered the revenues and profitability of Lord Abbett’s investment advisory business apart from its mutual fund business, and the intangible benefits enjoyed by Lord Abbett by virtue of its relationship with each Fund. The Board observed that the Distributor receives 12b-1 fees from certain of the Lord Abbett Funds as to shares held in accounts for which there is no other broker of record, may retain a portion of the 12b-1 fees it receives, and receives a portion of the sales charges on sales and redemptions of some classes of shares of the Lord Abbett Funds. In addition, the Board observed that Lord Abbett accrues certain benefits for its business of providing investment advice to clients other than the Lord Abbett Funds, but that business also benefits the Funds. The Board also noted that Lord Abbett, as disclosed in the prospectus of each Fund, has entered into revenue sharing arrangements with certain entities that distribute shares of the Lord Abbett Funds. The Board also took into consideration the investment research that Lord Abbett receives as a result of client brokerage transactions.
Alternative Arrangements. As to each Fund, the Board considered whether, instead of approving continuation of the Agreement, it might be in the best interests of the Fund to implement one or more alternative arrangements, such as continuing to employ Lord Abbett, but on different terms. After considering all of the relevant factors, the Board unanimously found that continuation of the Agreement was in the best interests of each Fund and its shareholders and voted unanimously to approve the continuation of the Agreement on behalf of each Fund. As to each Fund, in considering whether to approve the continuation of the Agreement, the Board did not identify any single factor as paramount or controlling. Individual Trustees may have evaluated the information presented differently from one another, giving different weights to various factors. This summary does not discuss in detail all matters considered.
569
Liquidity Risk Management Program
Pursuant to Rule 22e-4 under the 1940 Act, each Fund has adopted a Liquidity Risk Management Program and Policy (“Program”). The Program is designed to assess, manage and periodically review each Fund’s liquidity risk. Liquidity risk is defined under Rule 22e-4 as the risk that each Fund could not meet redemption requests without significant dilution of remaining investors’ interests in the Fund. The Board has appointed Lord Abbett as the administrator for each Fund’s Program. At the June 2-3, 2021 meeting, Lord Abbett provided the Board with a report addressing the operation of the Program and assessing its adequacy and effectiveness of implementation for the period March 1, 2020 through March 1, 2021. Lord Abbett reported that the Program operated effectively during the period. In particular, Lord Abbett reported that: each Fund did not breach its 15% limit on illiquid investments at any point during the period and all regulatory reporting related to Rule 22e-4 was completed on time and without issue during the period. There can be no assurance that the Program will achieve its objectives in the future. Please refer to the Funds’ prospectus for more information regarding each Fund’s exposure to liquidity risk and other principal risks to which an investment in each Fund may be subject.
Householding
The Trust has adopted a policy that allows it to send only one copy of each Fund’s prospectus, proxy material, annual report and semiannual report (or related notice of internet availability of annual report and semiannual report) to certain shareholders residing at the same “household.” This reduces Fund expenses, which benefits you and other shareholders. If you need additional copies or do not want your mailings to be “householded,” please call Lord Abbett at 888-522-2388 or send a written request with your name, the name of your fund or funds and your account number or numbers to Lord Abbett Family of Funds, P.O. Box 219336, Kansas City, MO 64121.
Proxy Voting Policies, Procedures and Records
A description of the policies and procedures that Lord Abbett uses to vote proxies related to each Fund’s portfolio securities, and information on how Lord Abbett voted each Fund’s proxies during the 12-month period ended June 30 are available without charge, upon request, (i) by calling 888-522-2388; (ii) on Lord Abbett’s Website at www.lordabbett.com; and (iii) on the Securities and Exchange Commission’s (“SEC”) Website at www.sec.gov.
Shareholder Reports and Quarterly Portfolio Disclosure
The Funds are required to file their complete schedule of portfolio holdings with the SEC for their first and third fiscal quarters as an attachment to Form N-PORT. Copies of the filings are available without charge, upon request on the SEC’s Website at www.sec.gov and may be available by calling Lord Abbett at 888-522-2388.
570
Tax Information (unaudited)
The percentages below reflect the portion of ordinary income distributions that are eligible for the corporate received deduction (DRD) and qualified dividend income (QDI) for individual shareholders.
| Fund Name | DRD | QDI | ||
| Convertible Fund | 3% | 3% | ||
| High Yield Fund | 1% | 1% | ||
For foreign shareholders, the percentages below reflect the portion of net investment income distributions that represent interest-related dividends: | ||||
| Fund Name | ||||
| Convertible Fund | 76% | |||
| Core Fixed Income Fund | 100% | |||
| Core Plus Bond Fund | 100% | |||
| Corporate Bond Fund | 100% | |||
| Floating Rate Fund | 98% | |||
| High Yield Fund | 98% | |||
| Income Fund | 99% | |||
| Inflation Focused Fund | 100% | |||
| Short Duration Core Bond Fund | 100% | |||
| Short Duration Income Fund | 99% | |||
| Total Return Fund | 100% | |||
| Ultra Short Bond Fund | 100% | |||
Additionally, of the distributions paid to shareholders during the fiscal year ended November 30, 2021, the following amounts represent capital gains:
| Fund Name | Short-Term Capital Gains | Long-Term Capital Gains | ||||||
| Convertible Fund | $ | 142,587,059 | $ | 48,441,029 | ||||
| Core Fixed Income | $ | 49,024,406 | $ | 16,060,928 | ||||
| Core Plus Bond Fund | $ | 1,765,532 | $ | 1,436,842 | ||||
| Corporate Bond | $ | 120,676 | $ | 61,114 | ||||
| Total Return Fund | $ | 39,556,464 | $ | 49,201,525 | ||||
571

This report, when not used for the general information of shareholders of the Fund, is to be distributed only if preceded or accompanied by a current fund prospectus.
Lord Abbett mutual fund shares are distributed by | Lord Abbett Investment Trust
Lord Abbett Convertible Fund
Lord Abbett Core Fixed Income Fund
Lord Abbett Core Plus Bond Fund
Lord Abbett Corporate Bond Fund
Lord Abbett Floating Rate Fund
Lord Abbett High Yield Fund
Lord Abbett Income Fund
Lord Abbett Inflation Focused Fund
Lord Abbett Short Duration Core Bond Fund
Lord Abbett Short Duration Income Fund
Lord Abbett Total Return Fund
Lord Abbett Ultra Short Bond Fund | LAIT-2 (01/22) |

| Item 2: | Code of Ethics. |
| (a) | In accordance with applicable requirements, the Registrant adopted a Sarbanes-Oxley Code of Ethics on June 19, 2003 that applies to the principal executive officer and senior financial officers of the Registrant (“Code of Ethics”). The Code of Ethics was in effect during the fiscal year ended November 30, 2021 (the “Period”). |
| (b) | Not applicable. |
| (c) | The Registrant has not amended the Code of Ethics as described in Form N-CSR during the Period. |
| (d) | The Registrant has not granted any waiver, including an implicit waiver, from a provision of the Code of Ethics as described in Form N-CSR during the Period. |
| (e) | Not applicable. |
| (f) | See Item 12(a)(1) concerning the filing of the Code of Ethics. |
| Item 3: | Audit Committee Financial Expert. |
The Registrant’s board of trustees has determined that each of the following independent trustees who are members of the audit committee is an audit committee financial expert: Evelyn E. Guernsey, Karla M. Rabusch and Mark A. Schmid. Each of these persons is independent within the meaning of the Form N-CSR.
| Item 4: | Principal Accountant Fees and Services. |
In response to sections (a), (b), (c) and (d) of Item 4, the aggregate fees billed to the Registrant for the fiscal years ended November 30, 2021 and 2020 by the Registrant’s principal accounting firm, Deloitte & Touche LLP, the member firms of Deloitte Touche Tohmatsu and their respective affiliates (collectively, “Deloitte”) were as follows:
| Fiscal year ended: | ||
| 2021 | 2020 | |
| Audit Fees {a} | $787,500 | $802,900 |
| Audit-Related Fees | - 0 - | - 0 - |
| Total audit and audit-related fees | 787,500 | 802,900 |
| Tax Fees {b} | 98,417 | 97,390 |
| All Other Fees | - 0 - | - 0 - |
| Total Fees | $885,917 | $900,290 |
{a} Consists of fees for audits of the Registrant’s annual financial statements.
{b} Fees for the fiscal year ended November 30, 2021 and 2020 consist of fees for preparing the U.S. Income Tax Return for Regulated Investment Companies, New Jersey Corporation Business Tax Return, New Jersey Annual Report Form, U.S. Return of Excise Tax on Undistributed Income of Investment Companies, IRS Forms 1099-MISC and 1096 Annual Summary and Transmittal of U.S. Information Returns.
(e) (1) Pursuant to Rule 2-01(c) (7) of Regulation S-X, the Registrant’s Audit Committee has adopted pre-approval policies and procedures. Such policies and procedures generally provide that the Audit Committee must pre-approve:
| · | any audit, audit-related, tax, and other services to be provided to the Lord Abbett Funds, including the Registrant, and |
| · | any audit-related, tax, and other services to be provided to the Registrant’s investment adviser and any entity controlling, controlled by or under common control with the investment adviser that provides ongoing services to one or more Funds comprising the Registrant if the engagement relates directly to operations and financial reporting of a Fund, by the independent auditor to assure that the provision of such services does not impair the auditor’s independence. |
The Audit Committee has delegated pre-approval authority to its Chairman, subject to a fee limit of $10,000 per event, and not to exceed $25,000 annually. The Chairman will report any pre-approval decisions to the Audit Committee at its next scheduled meeting. Unless a type of service to be provided by the independent auditor has received general pre-approval, it must be pre-approved by the Audit Committee. Any proposed services exceeding pre-approved cost levels will require specific pre-approval by the Audit Committee.
(e) (2) The Registrant’s Audit Committee has approved 100% of the services described in this Item 4 (b) through (d).
(f) Not applicable.
(g) The aggregate non-audit fees billed by Deloitte for services rendered to the Registrant are shown above in the response to Item 4 (a), (b), (c) and (d) as “All Other Fees”.
The aggregate non-audit fees billed by Deloitte for services rendered to the Registrant’s investment adviser, Lord, Abbett & Co. LLC (“Lord Abbett”), for the fiscal years ended November 30, 2021 and 2020 were:
| Fiscal year ended: | ||
| 2021 | 2020 | |
| All Other Fees {a} | $220,000 | $214,142 |
{a} Consist of fees for Independent Services Auditors’ Report on Controls Placed in Operation and Tests of Operating Effectiveness related to Lord Abbett’s Asset Management Services (“SOC-1 Report”).
The aggregate non-audit fees billed by Deloitte for services rendered to entities under the common control of Lord Abbett for the fiscal years ended November 30, 2021 and 2020 were:
| Fiscal year ended: | ||
| 2021 | 2020 | |
| All Other Fees | $ - 0 - | $ - 0- |
(h) The Registrant’s Audit Committee has considered the provision of non-audit services that were rendered to the Registrant’s investment adviser, and any entity controlling, controlled by or under common control with the investment adviser that provides ongoing services to the Registrant, that were not pre-approved pursuant to Rule 2-01 (c)(7)(ii) of Regulation S-X and has determined that the provision of such services is compatible with maintaining Deloitte’s independence.
| Item 5: | Audit Committee of Listed Registrants. |
| Not applicable. | |
| Item 6: | Investments. |
| Not applicable. | |
| Item 7: | Disclosure of Proxy Voting Policies and Procedures for Closed-End Management Investment Companies. |
| Not applicable. | |
| Item 8: | Portfolio Managers of Closed-End Management Investment Companies. |
| Not applicable. | |
| Item 9: | Purchases of Equity Securities by Closed-End Management Investment Company and Affiliated Purchasers. |
| Not applicable. | |
| Item 10: | Submission of Matters to a Vote of Security Holders. |
| Not applicable. | |
| Item 11: | Controls and Procedures. |
| (a) | The principal executive officer and principal financial & accounting officer have concluded as of a date within 90 days of the filing date of this report, based on |
| their evaluation of the Registrant’s disclosure controls and procedures (as defined in Rule 30a-3(c) under the Investment Company Act of 1940), that the design of such procedures is effective to provide reasonable assurance that material information required to be disclosed by the Registrant on Form N-CSR is recorded, processed, summarized and reported within the time periods specified in the Commission’s rules and forms. |
| (b) | There were no changes in the Registrant’s internal control over financial reporting (as defined in Rule 30a-3(d) under the Investment Company Act of 1940) that occurred during the period covered by this report that have materially affected, or are reasonably likely to materially affect, the Registrant’s internal control over financial reporting. |
| Item 12: | Disclosure of Securities Lending Activities for Closed-End Management Investment Companies. |
| Not applicable. | |
| Item 13: | Exhibits. |
| (a)(1) | The Lord Abbett Family of Funds Sarbanes-Oxley Code of Ethics for the Principal Executive Officer and Senior Financial Officers is attached hereto as part of EX-99.CODEETH. |
SIGNATURES
Pursuant to the requirements of the Securities Exchange Act of 1934 and the Investment Company Act of 1940, the Registrant has duly caused this report to be signed on its behalf by the undersigned, thereunto duly authorized.
| LORD ABBETT INVESTMENT TRUST | ||
| By: | /s/Douglas B. Sieg | |
| Douglas B. Sieg | ||
| President and Chief Executive Officer |
Date: January 28, 2022
Pursuant to the requirements of the Securities Exchange Act of 1934 and the Investment Company Act of 1940, this report has been signed below by the following persons on behalf of the Registrant and in the capacities and on the dates indicated.
| By: | /s/Douglas B. Sieg | |
| Douglas B. Sieg | ||
| President and Chief Executive Officer |
Date: January 28, 2022
| By: | /s/Michael J. Hebert | |
| Michael J. Hebert | ||
| Chief Financial Officer and Treasurer |
Date: January 28, 2022