Exhibit 99.2
| Associated Estates Realty Corporation First Quarter 2007 Earnings Release and Supplemental Financial Data |
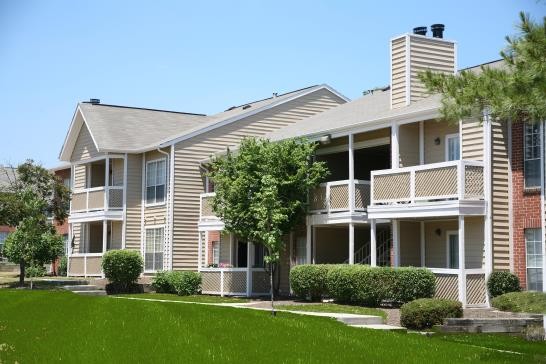
Hampton Point
3340 Hampton Point Drive
Silver Spring, MD 20904
Tel: (301) 890-9700
WebSite: www.hamptonpointapts.com
Hampton Point offers numerous amenities to give residents the ultimate in comfort and convenience. Such features include large, open floor plans with vaulted ceilings, walk-in closets, extra storage space, wood-burning fireplaces and more. This community is ideally located between Washington D.C. and Baltimore, placing it within minutes of endless events and activities, as well as the area's best shopping, dining and entertainment.
Associated Estates Realty CorporationPhone: (216) 261-5000
1 AEC ParkwayFax: (216) 289-9600
Richmond Heights, Ohio 44143-1467Web Site:www.aecrealty.com
Investor contacts: Michael Lawson Kimberly Kanary
Vice President of Investor Relations Manager of Corporate Communications
(216) 797-8798 (216) 797-8752
mlawson@aecrealty.com kkanary@aecrealty.com
| "Safe Harbor" Statement under the Private Securities Litigation Reform Act of 1995: This news release contains forward-looking statements based on current judgments and knowledge of management, which are subject to certain risks, trends and uncertainties that could cause actual results to vary from those projected, including but not limited to, expectations regarding the Company's 2007 performance, which are based on certain assumptions. Accordingly, readers are cautioned not to place undue reliance on forward-looking statements, which speak only as of the date of this news release. These forward-looking statements are intended to be covered by the safe harbor provisions of the Private Securities Litigation Reform Act of 1995. The words "expects," "projects," "believes," "plans," "anticipates," and similar expressions are intended to identify forward-looking statements. Investors are cautioned that the Company's forward-looking statements involve risks and uncertainty, that could cause actual results to differ from estimates or projections contained in these forward-looking statements, including without limitation the following: changes in the economic climate in the markets in which the Company owns and manages properties, including interest rates, the ability of the Company to consummate the sale of properties pursuant to its current plan, the overall level of economic activity, the availability of consumer credit and mortgage financing, unemployment rates and other factors; the ability of the Company to refinance debt on favorable terms at maturity; the ability of the Company to defease or prepay debt pursuant to its current plan; risks of a lessening of demand for the multifamily units owned or managed by the Company; competition from other available multifamily units and changes in market rental rates; increases in property and liability insurance costs; unanticipated increases in real estate taxes and other operating expenses (e.g., cleaning, utilities, repair and maintenance costs, insurance and administrative costs, security, landscaping, staffing and other general costs); weather conditions that adversely affect operating expenses; expenditures that cannot be anticipated such as utility rate and usage increases, unanticipated repairs, and real estate tax valuation reassessments or millage rate increases; inability of the Company to control operating expenses or achieve increases in revenue; the results of litigation filed or to be filed against the Company; changes in tax legislation; risks of personal injury claims and property damage related to mold claims because of diminished insurance coverage; catastrophic property damage losses that are not covered by the Company's insurance; risks associated with property acquisitions such as environmental liabilities, among others; changes in government regulations affecting properties, the rents of which are subsidized and certain aspects of which are regulated by the United States Department of Housing and Urban Development ("HUD") and other properties owned by the Company; inability to renew current contracts with HUD for rent subsidized properties at existing rents; changes in or termination of contracts relating to third party management and advisory business; risks related to the Company's joint ventures; risks related to the perception of residents and prospective residents as to the attractiveness, convenience and safety of the Company's properties or the neighborhoods in which they are located; and the Company's ability to acquire properties at prices consistent with our investment criteria. |

| Associated Estates Realty Corporation First Quarter 2007 Supplemental Financial Data |
| Table of Contents | |
| Earnings Release | 2 |
| Financial and Operating Highlights | |
| Condensed Consolidated Balance Sheets | |
| Consolidated Statements of Operations | 8 |
| Reconciliation of Funds from Operations (FFO) and Funds Available for Distribution (FAD) | 9 |
| Discontinued Operations | 10 |
| Overview of Operating Expenses Related to Repairs and Maintenance and Capitalized | |
| Expenditures | 11 |
| "Same Community" Market-Rate Data | 12 |
| First Quarter Property Revenue | 14 |
| First Quarter Property Operating Expenses | 15 |
| First Quarter Property Net Operating Income (Property NOI) | 16 |
| Debt Structure | 17 |
| Joint Venture Summary Data | 18 |
| 2007 Financial Outlook | 19 |
| Definitions of Non-GAAP Financial Measures | 20 |
| Associated Estates Realty Corporation First Quarter Earnings |
Cleveland, Ohio - April 26, 2007 - Associated Estates Realty Corporation (NYSE: AEC) today reported a net loss applicable to common shares of $812,000 or $0.05 per common share (basic and diluted), for the first quarter ended March 31, 2007, compared with a net loss applicable to common shares of $8.9 million or $0.51 per common share (basic and diluted), for the first quarter ended March 31, 2006.
Funds from operations (FFO) for the quarter were $0.14 per common share (basic and diluted), compared with a negative $0.02 per common share (basic and diluted) for the first quarter ended March 31, 2006. The results for the first quarter of 2007 include $2.7 million in defeasance/prepayment costs associated with the prepayment of $30.9 million in debt. Excluding defeasance/prepayment costs, FFO for the first quarter of 2007 would have been $0.29 per common share (basic and diluted), compared to $0.19 per common share over the same period in 2006, an increase of 52.6 percent.
The increase in FFO for the quarter ended March 31, 2007 was positively impacted by improved property operating results and insurance premium refunds attributable to a favorable loss experience under the Company's self-insured retention property plan, which amounted to $629,000 or approximately $0.04 per share.
Commenting on the Company's results, John Shannon, senior vice president of operations, said, "Our favorable performance in the quarter is reflective of the fact that we have the right people in place to take advantage of the improving market fundamentals in the Midwest and the continued strength in our Atlanta, Metro DC and Florida sub-markets."
A reconciliation of net (loss) income applicable to common shares to FFO is included on page 9.
Total revenue for the quarter was $37.2 million compared with $35.7 million for the first quarter of 2006, an increase of 4.2 percent.
Same Community (Market-Rate) Portfolio Results
Revenues for the quarter from the Company's same community portfolio were up 4.9 percent, and total property operating expenses for the same community portfolio decreased 0.9 percent, resulting in a 10.3 percent increase in net operating income (NOI), compared with the first quarter of 2006. Physical occupancy was 95.5 percent at the end of the first quarter of 2007 compared with 94.9 percent at the end of the first quarter of 2006.
For the first quarter, the average net collected rent per unit for the same community properties increased 5.0 percent to $776 per month, compared with the first quarter of 2006. Net collected rent per unit for the Company's same community Midwest portfolio grew 5.3 percent, while net collected rent per unit for the Company's same community properties in the Mid-Atlantic/Southeast markets grew 4.4 percent.
Additional quarterly financial information, including performance by region for the Company's portfolio, is included on pages 12 through 16.
| Associated Estates Realty Corporation First Quarter Earnings |
Dispositions
During the quarter, the Company sold a 120-unit property, located in Mayfield Heights, Ohio, which completed its exit from the congregate care business. The Company said it still expects to sell between $50 million and $75 million of assets during 2007.
Outlook
The Company has reaffirmed its current FFO guidance for the year 2007 of $1.08 to $1.12 per share, excluding defeasance and other prepayment costs. Assumptions relating to the Company's earnings guidance can be found on page 19.
Conference Call
A conference call to discuss the results will be held today, Thursday, April 26, at 2:00 p.m. Eastern. To participate in the call:
Via Telephone: The dial in number is 800-909-5202, and the passcode is "Estates."
Via the Internet (listen only): Access the Investor Relations page on the Company's website at www.aecrealty.com. Please log on at least 15 minutes prior to the scheduled start time in order to register, download, and install any necessary audio software. Select the "Live Webcast" link at the top of the page and follow the brief instructions to register for the event. The webcast will be archived through May 10, 2007.
.
| Associated Estates Realty Corporation Financial and Operating Highlights For the Three Months Ended March 31, 2007 and 2006 (Unaudited; in thousands, except per share and ratio data) |
| OPERATING INFORMATION | ||
| Total revenue | $ 37,165 | $ 35,692 |
| Property revenue | $ 33,855 | $ 32,301 |
| Net (loss) income applicable to common shares | $ (812) | $ (8,885) |
| Per share - Basic and diluted | $ (0.05) | $ (0.51) |
| Funds from Operations (FFO) (1) | $ 2,336 | $ (310) |
| FFO excluding defeasance costs and/or other prepayment costs(2) | $ 4,999 | $ 3,249 |
| FFO per share - basic and diluted | $ 0.14 | $ (0.02) |
| FFO per share excluding defeasance costs | ||
| and/or other prepayment costs - basic and diluted | $ 0.29 | $ 0.19 |
| Funds Available for Distribution (FAD)(1) | $ 4,599 | $ 2,655 |
| Dividends per share | $ 0.17 | $ 0.17 |
| Payout ratio - FFO | 121.4% | (850.0)% |
| Payout ratio - FFO excluding defeasance costs and/or other prepayment costs | 58.6% | 89.5% |
| Payout ratio - FAD | 63.0% | 113.3% |
| General and administrative expense | $ 2,712 | $ 2,346 |
| Interest expense (3) | $ 8,664 | $ 9,897 |
| Interest coverage ratio(4) | 1.69:1 | 1.42:1 |
| Fixed charge coverage ratio(5) | 1.49:1 | 1.27:1 |
| General and administrative expense to property revenue | 8.0% | 7.3% |
| Interest expense to property revenue | 25.6% | 30.6% |
| Property NOI(6) | $ 18,290 | $ 16,435 |
| ROA(7) | 8.2% | 7.3% |
| Same community market-rate revenue increase | 4.9% | 5.8% |
| Same community market-rate expense (decrease) increase | (0.9)% | 9.4% |
| Same community market-rate NOI increase | 10.3% | 2.7% |
| Same community market-rate operating margins | 54.6% | 52.0% |
(1) See page 9 for a reconciliation of net income to these non-GAAP measurements and page 20 for the Company's definition of these non-GAAP measurements.
(2) See page 20 for the Company's definition of this non-GAAP measurement.
(3) Excludes amortization of financing fees of $235 and $250 for 2007 and 2006, respectively. Additionally, it excludes $2,663 and $2,364 of defeasance costs for 2007 and 2006, respectively.
(4) Is calculated as EBITDA divided by interest expense, including capitalized interest and amortization of deferred financing costs, and excluding defeasance costs and preferred redemption cost write-off. See page 21 for a reconciliation of net income to EBITDA and for the Company's definition of EBITDA.
(5) Represents interest expense and preferred stock dividend payment coverage, excluding defeasance costs.
(6) See page 22 for a reconciliation of net income to this non-GAAP measurement and for the Company's definition of this non-GAAP measurement.
(7) ROA is calculated as trailing twelve month Property NOI divided by average gross real estate assets.
| Associated Estates Realty Corporation Financial and Operating Highlights First Quarter 2007 (Unaudited; in thousands, except per share and ratio data) |
| MARKET CAPITALIZATION DATA | ||
| Net real estate investments | $ 584,644 | $ 591,520 |
| Total assets | $ 617,700 | $ 648,829 |
| Debt | $ 471,065 | $ 498,634 |
| Minority interest | $ 1,837 | $ 1,851 |
| Preferred stock - 8.70% Class B Cumulative Redeemable Preferred | ||
| Shares | $ 58,000 | $ 58,000 |
| Total shareholders' equity | $ 108,577 | $ 112,051 |
| Common shares outstanding | 17,495 | 17,261 |
| Share price, end of period | $ 14.09 | $ 13.74 |
| Total market capitalization(1) | $ 798,223 | $ 816,455 |
| Undepreciated book value of real estate(2) | $ 873,884 | $ 877,797 |
| Debt to undepreciated book value of real estate | 53.9% | 56.8% |
| Debt and preferred stock to undepreciated book value of real estate | 60.5% | 63.4% |
| Debt to total market capitalization(1) | 61.9% | 63.8% |
| Annual dividend | $ 0.68 | $ 0.68 |
| Annual dividend yield based on share price, end of period | 4.8% | 4.9% |
(1) Includes the Company's share of unconsolidated debt of $22,653 and $22,655 as of March 31, 2007 and December 31, 2006, respectively.
(2) Includes $4,614 of undepreciated real estate associated with one property classified as held for sale at December 31, 2006.
| Associated Estates Realty Corporation Financial and Operating Highlights First Quarter 2007 |
| PORTFOLIO INFORMATION | |||
| Company Portfolio: | Owned Properties | ||
| Directly owned: | |||
| Affordable Housing | 11 | 1,146 | 29 |
| "Same Community" Market-Rate | |||
| Midwest | 41 | 10,221 | 18 |
| Mid-Atlantic/Southeast | 11 | 2,917 | 15 |
| Total directly owned | 63 | 14,284 | 18 |
| Joint ventures: | |||
| Affordable Housing | 1 | 108 | 25 |
| Market-Rate | 1 | 843 | 7 |
| Total joint ventures | 2 | 951 | 9 |
| Third party managed: | |||
| Affordable Housing | 30 | 4,816 | |
| Market-Rate | 4 | 599 | |
| Total third party managed | 34 | 5,415 | |
| Total Company Portfolio | 99 | 20,650 |
| Associated Estates Realty Corporation Condensed Consolidated Balance Sheets First Quarter 2007 (Unaudited; dollar amounts in thousands) |
March 31, | ||
| Real estate assets | ||
| Investment in real estate | $ 872,485 | $ 871,860 |
| Construction in progress | 1,399 | 1,323 |
| Less: accumulated depreciation | (289,240) | (281,994) |
| 584,644 | 591,189 | |
| Real estate associated with property held for sale, net | - | 331 |
| Real estate, net | 584,644 | 591,520 |
| Cash and cash equivalents | 5,867 | 30,010 |
| Restricted cash | 6,402 | 7,279 |
| Other assets | 20,787 | 20,020 |
| Total assets | $ 617,700 | $ 648,829 |
LIABILITIES AND SHAREHOLDERS' EQUITY | ||
| Mortgage notes payable | $ 445,285 | $ 472,854 |
| Unsecured borrowings | 25,780 | 25,780 |
| Total debt | 471,065 | 498,634 |
| Accounts payable, accrued expenses and other liabilities | 36,221 | 36,293 |
| Total liabilities | 507,286 | 534,927 |
| Operating partnership minority interest | 1,837 | 1,851 |
| Shareholders' equity | ||
| Preferred shares, without par value; 9,000,000 shares authorized; | ||
| 8.70% Class B Series II cumulative redeemable, $250 per share | ||
| liquidation preference, 232,000 issued and outstanding | 58,000 | 58,000 |
| Common shares, without par value, $.10 stated value; 41,000,000 | ||
| authorized; 22,995,763 issued and 17,495,416 and 17,261,224 | ||
| outstanding at March 31, 2007 and December 31, 2006, respectively | 2,300 | 2,300 |
| Paid-in capital | 280,085 | 280,369 |
| Accumulated distributions in excess of accumulated net income | (177,746) | (173,962) |
| Accumulated other comprehensive loss | - | (71) |
| Less: Treasury shares, at cost, 5,500,347 and 5,734,539 shares | ||
| at March 31, 2007 and December 31, 2006, respectively | (54,062) | (54,585) |
| Total shareholders' equity | 108,577 | 112,051 |
| Total liabilities and shareholders' equity | $ 617,700 | $ 648,829 |
| Associated Estates Realty Corporation Consolidated Statements of Operations Three Months Ended March 31, 2007 and 2006 (Unaudited; dollar and share amounts in thousands) |
| REVENUE | ||
| Property revenue | $ 33,855 | $ 32,301 |
| Management and service company revenue: | ||
| Fees, reimbursements and other | 2,694 | 3,079 |
| Painting services | 616 | 312 |
| Total revenue | 37,165 | 35,692 |
| EXPENSES | ||
| Property operating and maintenance | 15,565 | 15,866 |
| Depreciation and amortization | 7,762 | 8,048 |
| Direct property management and service companies expenses | 3,241 | 3,223 |
| Painting services and charges | 591 | 407 |
| General and administrative | 2,712 | 2,346 |
| Total expenses | 29,871 | 29,890 |
| Operating income | 7,294 | 5,802 |
| Interest income | 271 | 378 |
| Interest expense | (11,562) | (12,511) |
| (Loss) income before equity in net loss of joint ventures, | ||
| minority interest and income (loss) from discontinued operations | (3,997) | (6,331) |
| Equity in net loss of joint ventures | (72) | ( 106) |
| Minority interest in operating partnership | (13) | (16) |
| (Loss) income from continuing operations | (4,082) | (6,453) |
| Income (loss) from discontinued operations: | ||
| Operating (loss) income | (29) | (1,170) |
| Gain on disposition of properties | 4,561 | - |
| Income (loss) from discontinued operations | 4,532 | (1,170) |
| Net income (loss) | 450 | (7,623) |
| Preferred share dividends | (1,262) | (1,262) |
| Net (loss) income applicable to common shares | $ (812) | $ (8,885) |
| Earnings per common share - basic and diluted: | ||
| (Loss) income from continuing operations applicable to common shares | $ (0.31) | $ (0.44) |
| Income (loss) from discontinued operations | 0.26 | (0.07) |
| Net (loss) income applicable to common shares | $ (0.05) | $ (0.51) |
| Weighted average shares outstanding - basic and diluted | 17,109 | 17,283 |
| Associated Estates Realty Corporation Reconciliation of Funds from Operations (FFO) and Funds Available for Distribution (FAD) (In thousands, except per share data) |
| CALCULATION OF FFO AND FAD | ||
| Net (loss) income applicable to common shares | $ (812) | $ (8,885) |
| Add: Depreciation - real estate assets | 7,449 | 7,886 |
| Depreciation - real estate assets - joint ventures | 242 | 240 |
| Amortization of joint venture deferred costs | 9 | 9 |
| Amortization of intangible assets | 9 | 440 |
| Less: Gain on disposition of properties | (4,561) | - |
| Funds From Operations (FFO) (1) | 2,336 | (310) |
| Add: Defeasance costs and other prepayment costs | 2,663 | 3,559 |
| Funds From Operations (FFO) Excluding Defeasance Costs | ||
| and/or Other Prepayment Costs(1) | 4,999 | 3,249 |
| Add: Depreciation - other assets | 304 | 363 |
| Depreciation - other assets - joint ventures | 47 | 44 |
| Amortization of deferred financing fees | 235 | 281 |
| Amortization of deferred financing fees - joint ventures | 12 | 12 |
| Less: Fixed asset additions (2) | (979) | (1,272) |
| Fixed asset additions - joint ventures(2) | (19) | (22) |
| Funds Available for Distribution (FAD)(1) | $ 4,599 | $ 2,655 |
| Weighted average shares outstanding - basic and diluted (3) | 17,109 | 17,283 |
| PER SHARE INFORMATION: | ||
| FFO - basic and diluted | $ 0.14 | $ (0.02) |
| FFO excluding defeasance costs and/or other | ||
| prepayment costs - basic and diluted | $ 0.29 | $ 0.19 |
| Dividends | $ 0.17 | $ 0.17 |
| Payout ratio - FFO | 121.4% | (850.0)% |
| Payout ratio - FFO excluding defeasance costs and/or other prepayment costs | 58.6% | 89.5% |
| Payout ratio - FAD | 63.0% | 113.3% |
(1) See page 20 for the Company's definition of these non-GAAP measurements.
(2) Fixed asset additions exclude development, investment and non-recurring capital additions and only reflect the Company's prorata share of recurring joint
venture capital additions.
(3) The Company computes the weighted average shares outstanding in accordance with SFAS 128 and accordingly has excluded 671,000 common share equivalents from the 2007 calculation and 248,000 common share equivalents from the 2006 calculation used in the computation of earnings per share and FFO per share as they would be anti-dilutive to the loss from continuing operations.
| Associated Estates Realty Corporation Discontinued Operations(1) Three Months Ended March 31, 2007 and 2006 (Unaudited; dollar and share amounts in thousands) |
| REVENUE | ||
| Property revenue | $ 172 | $ 3,836 |
| EXPENSES | ||
| Property operating and maintenance | 201 | 2,684 |
| Depreciation and amortization | - | 641 |
| Total expenses | 201 | 3,325 |
| Operating (loss) income | (29) | 511 |
| Interest income | - | 3 |
| Interest expense(2) | - | (1,684) |
| Gain on disposition of properties | 4,561 | - |
| Income (loss) from discontinued operations | $ 4,532 | $ (1,170) |
| Earnings per common share - basic and diluted: | ||
| Income (loss) from discontinued operations | $ 0.26 | $ (0.07) |
| Weighted average shares outstanding - basic and diluted | 17,109 | 17,283 |
(1) In accordance with SFAS 144, the Company reports the results of operations and gain/loss related to the sale of real estate assets as discontinued operations. Real estate assets that are classified as held for sale are also reported as discontinued operations. The Company generally classifies properties held for sale when all significant contingencies surrounding the closing have been resolved. In many transactions, these contingencies are not satisfied until the actual closing of the transaction. Interest expense included in discontinued operations is limited to interest on mortgage debt specifically associated with properties sold or classified as held for sale.
Included in the table above are one property disposed of in 2007 and eight properties disposed of in 2006.
(2) Included in the 2006 expense is $1,195 of defeasance costs.
| Associated Estates Realty Corporation Overview of Operating Expenses Related to Repairs and Maintenance and Capitalized Expenditures (In thousands, except estimated GAAP useful life and cost per unit) |
| OPERATING EXPENSES RELATED TO REPAIRS AND MAINTENANCE | |||
| Repairs and maintenance(2) | $ 2,626 | $ 184 | |
| Maintenance personnel labor cost(2) | 1,634 | 114 | |
| Total Operating Expenses Related to Repairs and Maintenance | 4,260 | 298 | |
| CAPITAL EXPENDITURES | |||
| Recurring Capital Expenditures(3) | |||
| Amenities | 5 | 130 | 9 |
| Appliances | 5 | 136 | 10 |
| Building improvements | 14 | 103 | 7 |
| Carpet and flooring | 5 | 548 | 38 |
| Furnishings | 5 | 77 | 5 |
| Office/Model | 5 | 7 | 1 |
| HVAC and mechanicals | 15 | 79 | 6 |
| Landscaping and grounds | 14 | 82 | 6 |
| Suite improvements | 5 | 37 | 3 |
| Miscellaneous | 5 | 6 | - |
| Total Recurring Capital Expenditures - Properties | 1,205 | 85 | |
| Corporate capital expenditures(4) | 17 | 1 | |
| Less: Capital to be funded from sale of properties(5) | (243) | (17) | |
| Total Recurring Capital Expenditures | 979 | 69 | |
| Total Recurring Capital Expenditures and Repairs and Maintenance | $ 5,239 | $ 367 | |
| Total Recurring Capital Expenditures | $ 979 | ||
| Investment/Revenue Enhancing Expenditures:(6) | |||
| Building improvements - Elevator upgrade | 20 | 6 | |
| Total Investment/Revenue Enhancing Expenditures | 6 | ||
| Capital to be funded from the sale of properties(5) | 243 | ||
| Grand Total Capital Expenditures | $ 1,228 | ||
(1) Calculated using 14,284 units, including 1,146 affordable housing units, and 13,138 same community market-rate units.
(2) Included in property operating and maintenance expense in the Consolidated Statements of Operations.
(3) See page 22 for the Company's definition of recurring fixed asset additions.
(4) Includes upgrades to computer hardware and software as well as corporate office furniture and fixtures.
(5) The Company's practice has been to fund recurring capital expenditures via funds provided by operations and to fund investment/revenue enhancing expenditures either through proceeds from property sales, borrowings on the lines of credit or property refinancings. For 2007, the Company has budgeted to fund a portion of the recurring capital expenditures through the proceeds from property sales. The amount shown represents the prorata amount for the first quarter.
(6) See page 22 for the Company's definition of investment/revenue enhancing additions.
| Associated Estates Realty Corporation "Same Community" Market-Rate Data Operating Results for the Last Five Quarters (Unaudited, in thousands, except unit totals and per unit amounts) |
| March 31, | December 31, | September 30, | |||
| Property Revenue | $ 31,463 | $ 31,285 | $ 31,424 | $ 30,942 | $ 29,987 |
| Property Operating and Maintenance Expenses | |||||
| Personnel | 3,834 | 3,588 | 3,641 | 3,712 | 3,769 |
| Advertising | 420 | 455 | 420 | 447 | 476 |
| Utilities | 2,072 | 1,820 | 1,849 | 1,733 | 2,103 |
| Repairs and maintenance | 2,493 | 2,333 | 3,018 | 3,331 | 2,546 |
| Real estate taxes and insurance | 4,212 | 4,642 | 4,657 | 4,319 | 4,553 |
| Other operating | 1,248 | 1,421 | 1,154 | 1,153 | 959 |
| Total Expenses | 14,279 | 14,259 | 14,739 | 14,695 | 14,406 |
| Net Operating Income | $ 17,184 | $ 17,026 | $ 16,685 | $ 16,247 | $ 15,581 |
| Operating Margin | 54.6% | 54.4% | 53.1% | 52.5% | 52.0% |
| Total Number of Units | 13,138 | 13,138 | 13,138 | 13,138 | 13,138 |
| NOI Per Unit | $ 1,308 | $ 1,296 | $ 1,270 | $ 1,237 | $ 1,186 |
| Average Net Collected Per Unit(1) | $ 776 | $ 771 | $ 775 | $ 761 | $ 739 |
| Physical Occupancy - End of Period(2) | 95.5% | 94.4% | 95.4% | 95.5% | 94.9% |
(1) Represents gross potential rents less vacancies and concessions.
(2) Is defined as number of units occupied divided by total number of units.
| Associated Estates Realty Corporation "Same Community" Market-Rate Data As of March 31, 2007 and March 31, 2006 (Unaudited, in thousands, except unit totals and per unit amounts) |
| Net Rent Collected per Unit(1) | ||||||||||||
| Average | Q1 | Q1 | % | Q1 | % | Q1 | Q1 | Q1 | ||||
| Midwest Properties | ||||||||||||
| Indiana | 836 | 11 | $ 737 | $ 725 | 1.7% | $ 893 | $ 877 | 1.8% | 95.2% | 95.2% | 50.7% | 39.2% |
| Michigan | 2,888 | 16 | 695 | 654 | 6.3% | 836 | 826 | 1.2% | 97.5% | 94.1% | 46.8% | 47.4% |
| Ohio - Central Ohio | 2,621 | 16 | 695 | 665 | 4.5% | 806 | 782 | 3.1% | 95.5% | 94.7% | 51.3% | 51.0% |
| Ohio - Northeastern Ohio | 2,348 | 22 | 732 | 703 | 4.1% | 865 | 847 | 2.1% | 92.7% | 94.5% | 43.8% | 39.7% |
| Ohio - Toledo, Ohio | 1,060 | 21 | 639 | 584 | 9.4% | 756 | 730 | 3.6% | 96.0% | 95.2% | 57.4% | 38.9% |
| Pennsylvania | 468 | 21 | 681 | 625 | 9.0% | 808 | 788 | 2.5% | 97.0% | 90.8% | 48.7% | 53.0% |
| Total Midwest Properties | 10,221 | 18 | 700 | 665 | 5.3% | 830 | 812 | 2.2% | 95.5% | 94.4% | 48.8% | 45.3% |
| Mid-Atlantic/Southeast Properties | ||||||||||||
| Florida | 1,272 | 8 | 1,183 | 1,142 | 3.6% | 1,301 | 1,207 | 7.8% | 95.8% | 97.6% | 62.6% | 82.4% |
| Georgia | 874 | 19 | 767 | 720 | 6.5% | 932 | 923 | 1.0% | 95.8% | 95.0% | 68.6% | 58.6% |
| Metro D.C. | 667 | 21 | 1,154 | 1,103 | 4.6% | 1,257 | 1,182 | 6.3% | 93.9% | 96.9% | 45.0% | 33.6% |
| Texas | 104 | 14 | 898 | 905 | (0.8)% | 1,117 | 1,104 | 1.2% | 92.3% | 95.2% | 38.5% | 30.8% |
| Total Mid-Atlantic/Southeast Properties | 2,917 | 15 | 1,042 | 998 | 4.4% | 1,174 | 1,113 | 5.5% | 95.2% | 96.6% | 59.5% | 62.3% |
| Total/Average "Same Community" | ||||||||||||
| Market-Rate | 13,138 | 17 | $ 776 | $ 739 | 5.0% | $ 906 | $ 879 | 3.1% | 95.5% | 94.9% | 51.2% | 49.0% |
(1) Represents gross potential rents less vacancies and allowances for all units divided by the number of units in a market.
(2) Represents gross potential rents for all units divided by the number of units in a market.
(3) Represents physical occupancy at the end of the quarter.
(4) Represents the number of units turned over for the quarter, divided by the number of units in a market, annualized.
(5) Age shown in years.
| Associated Estates Realty Corporation Property Revenue For the Three Months Ended March 31, 2007 and 2006 |
| Property Revenue | |||||||
| "Same Community" Market-Rate | |||||||
| Midwest Properties | |||||||
| Indiana | 836 | 95.2% | 95.2% | $ 1,924 | $ 1,863 | $ 61 | 3.3% |
| Michigan | 2,888 | 97.5% | 94.1% | 6,258 | 5,889 | 369 | 6.3% |
| Ohio - Central Ohio | 2,621 | 95.5% | 94.7% | 5,627 | 5,385 | 242 | 4.5% |
| Ohio - Northeastern Ohio | 2,348 | 92.7% | 94.5% | 5,307 | 5,076 | 231 | 4.6% |
| Ohio - Toledo, Ohio | 1,060 | 96.0% | 95.2% | 2,118 | 1,941 | 177 | 9.1% |
| Pennsylvania | 468 | 97.0% | 90.8% | 971 | 903 | 68 | 7.5% |
| Total Midwest Properties | 10,221 | 95.5% | 94.4% | 22,205 | 21,057 | 1,148 | 5.5% |
| Mid-Atlantic/Southeast Properties | |||||||
| Florida | 1,272 | 95.8% | 97.6% | 4,591 | 4,502 | 89 | 2.0% |
| Georgia | 874 | 95.8% | 95.0% | 2,059 | 1,921 | 138 | 7.2% |
| Metro D.C. | 667 | 93.9% | 96.9% | 2,327 | 2,226 | 101 | 4.5% |
| Texas | 104 | 92.3% | 95.2% | 281 | 281 | - | 0.0% |
| Total Mid-Atlantic/Southeast Properties | 2,917 | 95.2% | 96.6% | 9,258 | 8,930 | 328 | 3.7% |
| Total "Same Community" Market-Rate | 13,138 | 95.5% | 94.9% | 31,463 | 29,987 | 1,476 | 4.9% |
| Affordable Housing | |||||||
| Ohio | 1,146 | 99.0% | 99.9% | 2,392 | 2,314 | 78 | 3.4% |
| Total Property Revenue | 14,284 | 95.8% | 95.3% | $ 33,855 | $ 32,301 | $ 1,554 | 4.8% |
(1) Represents physical occupancy at the end of the quarter.
| Associated Estates Realty Corporation Property Operating Expenses For the Three Months Ended March 31, 2007 and 2006 |
| Property Operating Expenses | |||||||
| "Same Community" Market-Rate | |||||||
| Midwest Properties | |||||||
| Indiana | 836 | 95.2% | 95.2% | $ 802 | $ 813 | $ (11) | (1.4)% |
| Michigan | 2,888 | 97.5% | 94.1% | 2,928 | 2,873 | 55 | 1.9% |
| Ohio - Central Ohio | 2,621 | 95.5% | 94.7% | 2,611 | 2,654 | (43) | (1.6)% |
| Ohio - Northeastern Ohio | 2,348 | 92.7% | 94.5% | 2,882 | 3,110 | (228) | (7.3)% |
| Ohio - Toledo, Ohio | 1,060 | 96.0% | 95.2% | 1,050 | 949 | 101 | 10.6% |
| Pennsylvania | 468 | 97.0% | 90.8% | 426 | 435 | (9) | (2.1)% |
| Total Midwest Properties | 10,221 | 95.5% | 94.4% | 10,699 | 10,834 | (135) | (1.2)% |
| Mid-Atlantic/Southeast Properties | |||||||
| Florida | 1,272 | 95.8% | 97.6% | 1,685 | 1,777 | (92) | (5.2)% |
| Georgia | 874 | 95.8% | 95.0% | 980 | 930 | 50 | 5.4% |
| Metro D.C. | 667 | 93.9% | 96.9% | 764 | 710 | 54 | 7.6% |
| Texas | 104 | 92.3% | 95.2% | 151 | 155 | (4) | (2.6)% |
| Total Mid-Atlantic/Southeast Properties | 2,917 | 95.2% | 96.6% | 3,580 | 3,572 | 8 | 0.2% |
| Total "Same Community" Market-Rate | 13,138 | 95.5% | 94.9% | 14,279 | 14,406 | (127) | (0.9)% |
| Affordable Housing | |||||||
| Ohio | 1,146 | 99.0% | 99.9% | 1,286 | 1,460 | (174) | (11.9)% |
| Total Property Operating Expenses | 14,284 | 95.8% | 95.3% | $ 15,565 | $ 15,866 | $ (301) | (1.9)% |
(1) Represents physical occupancy at the end of the quarter.
| Associated Estates Realty Corporation Property Net Operating Income (Property NOI) For the Three Months Ended March 31, 2007 and 2006 |
| Property NOI(1) | |||||||
| "Same Community" Market-Rate | |||||||
| Midwest Properties | |||||||
| Indiana | 836 | 95.2% | 95.2% | $ 1,122 | $ 1,050 | $ 72 | 6.9% |
| Michigan | 2,888 | 97.5% | 94.1% | 3,330 | 3,016 | 314 | 10.4% |
| Ohio - Central Ohio | 2,621 | 95.5% | 94.7% | 3,016 | 2,731 | 285 | 10.4% |
| Ohio - Northeastern Ohio | 2,348 | 92.7% | 94.5% | 2,425 | 1,966 | 459 | 23.3% |
| Ohio - Toledo, Ohio | 1,060 | 96.0% | 95.2% | 1,068 | 992 | 76 | 7.7% |
| Pennsylvania | 468 | 97.0% | 90.8% | 545 | 468 | 77 | 16.5% |
| Total Midwest Properties | 10,221 | 95.5% | 94.4% | 11,506 | 10,223 | 1,283 | 12.6% |
| Mid-Atlantic/Southeast Properties | |||||||
| Florida | 1,272 | 95.8% | 97.6% | 2,906 | 2,725 | 181 | 6.6% |
| Georgia | 874 | 95.8% | 95.0% | 1,079 | 991 | 88 | 8.9% |
| Metro D.C. | 667 | 93.9% | 96.9% | 1,563 | 1,516 | 47 | 3.1% |
| Texas | 104 | 92.3% | 95.2% | 130 | 126 | 4 | 3.2% |
| Total Mid-Atlantic/Southeast Properties | 2,917 | 95.2% | 96.6% | 5,678 | 5,358 | 320 | 6.0% |
| Total "Same Community" Market-Rate | 13,138 | 95.5% | 94.9% | 17,184 | 15,581 | 1,603 | 10.3% |
| Affordable Housing | |||||||
| Ohio | 1,146 | 99.0% | 99.9% | 1,106 | 854 | 252 | 29.5% |
| Total Property NOI | 14,284 | 95.8% | 95.3% | $ 18,290 | $ 16,435 | $ 1,855 | 11.3% |
(1) See page 22 for a reconciliation of net income (loss) to this non-GAAP measurement and for the Company's definition of this non-GAAP measurement.
(2) Represents physical occupancy at the end of the quarter.
| Associated Estates Realty Corporation Debt Structure As of March 31, 2007 (Dollar and share amounts in thousands) |
| Current | |||
Balance | Weighted | ||
Outstanding | Average | ||
| FIXED RATE DEBT | |||
| Mortgages payable - CMBS | $ 257,376 | 54.6% | 7.5% |
| Mortgages payable - other | 132,209 | 28.1% | 6.1% |
| Unsecured borrowing | 25,780 | 5.5% | 7.9% |
| Total fixed rate debt | 415,365 | 88.2% | 7.2% |
| VARIABLE RATE DEBT | |||
| Mortgages payable | 55,700 | 11.8% | 6.7% |
| Line of credit borrowings | - | 0.0% | 0.0% |
| Total variable rate debt | 55,700 | 11.8% | 6.7% |
| TOTAL DEBT | $ 471,065 | 100.0% | 7.1% |
| Interest coverage ratio(1) | 1.69:1 | ||
| Fixed charge coverage ratio(2) | 1.49:1 | ||
| Weighted average maturity | 5.0 years |
| SCHEDULED PRINCIPAL MATURITIES | ||||
| Fixed Rate - CMBS | Fixed Rate - Other | Variable Rate | ||
| 2007 | $ 38,670 | $ - | $ - | $ 38,670 |
| 2008 | 36,054 | - | - | 36,054 |
| 2009 | 38,246 | - | 19,000 | 57,246 |
| 2010 | 28,519 | - | 32,800 | 61,319 |
| 2011 | 68,342 | - | 3,900 | 72,242 |
| Thereafter | 47,545 | 157,989 | - | 205,534 |
| Total | $ 257,376 | $157,989 | $ 55,700 | $ 471,065 |
| Three Months Ended | ||
| March 31, | ||
| INTEREST RATE SWAP | ||
| Amortization of termination fee (3) | $ (66) | $ (153) |
(1) Is calculated as EBITDA divided by interest expense, including capitalized interest and amortization of deferred financing costs, and excluding defeasance
costs and preferred redemption cost write-off. See page 21 for a reconciliation of net (loss) income to EBITDA and for the Company's definition of EBITDA.
(2) Represents interest expense and preferred stock dividend payment coverage, excluding defeasance costs.
(3) On December 11, 2000, the Company executed termination agreements for two swaps. The Company received termination payments totaling $3.2 million, which are being amortized over the remaining terms of the swaps through 2007, at the rate of $22,036 month or $264,437 per year. In connection with the defeasance of one mortgage loan during the quarter ended March 31, 2006, the Company wrote off $57,000 which was the remaining unamortized portion of the fee related to that loan.
| Associated Estates Realty Corporation Joint Venture Summary Data For the Three Months Ended March 31, 2007 and 2006 (Unaudited, dollar amounts in thousands) |
| Balance Sheet Data | March 31, | December 31, |
| Real estate, net | $ 51,346 | $ 51,865 |
| Other assets | 4,188 | 3,446 |
| $ 55,534 | $ 55,311 | |
| Amount payable to the Company | $ 11 | $ 11 |
| Mortgage payable | 46,146 | 46,149 |
| Other liabilities | 1,323 | 1,059 |
| Equity | 8,054 | 8,092 |
| $ 55,534 | $ 55,311 |
| Beneficial Interest in Operations | ||
| Property revenue | $ 1,068 | $ 1,005 |
| Cost of operations | 487 | 498 |
| Revenue less cost of operations | 581 | 507 |
| Interest income | - | - |
| Interest expense | (343) | (308) |
| Depreciation - real estate assets | (242) | (240) |
| Depreciation - other | (47) | (44) |
| Amortization of deferred costs | (9) | (9) |
| Amortization of deferred financing fees | (12) | (12) |
| Net (loss) income | (72) | (106) |
| Add: | ||
| Depreciation - real estate assets | 242 | 240 |
| Amortization of deferred costs | 9 | 9 |
| Funds From Operations (FFO)(1) | $ 179 | $ 143 |
| Summary of Debt | ||||
| Lakeshore Village (50.0% Affordable) | 108 | $ 4,146 | $ 2,073 | 8/1/2031 |
| Idlewylde Apartments (49.0% Market-Rate) | 843 | 42,000 | 20,580 | 6/1/2010 |
| Total of all joint ventures | 951 | $ 46,146 | $ 22,653 |
(1) See page 20 for the Company's definition of this non-GAAP measurement.
| Associated Estates Realty Corporation 2007 Financial Outlook With Assumptions Supporting 2007 FFO Per Share As of April 26, 2007 |
This page includes forward-looking statements based on current judgments and knowledge of management, which are subject to certain risks, trends and uncertainties that could cause results to vary from those projected. Please see the paragraph on forward-looking statements on the cover of this document for a list of risk factors.
| Earnings Guidance Per Common Share | |
| Expected net income | $0.53 to $0.57 |
| Expected real estate depreciation and amortization | 1.82 |
| Expected adjustments to unconsolidated joint ventures | 0.06 |
| Expected defeasance costs and other prepayment costs on secured debt | 0.29 |
| Expected gains on disposition of properties | (1.62) |
| Expected Funds from Operations (FFO) Excluding Defeasance Costs | |
| and Other Prepayment Costs(1) | $1.08 to $1.12 |
| Same Community Portfolio | |
| Revenue growth | 3.2% to 3.7% |
| Expense growth | 2.6% to 3.1% |
| Property NOI(2) growth | 3.7% to 4.2% |
| Physical occupancy | 94.0% to 94.5% |
| Transactions | |
| Acquisitions | $50 million |
| Dispositions | $50 to $75 million |
| Development | $0 million |
| Corporate Expenses | |
| General and administrative expense growth | 5.0% to 10.0% |
| Debt | |
| Capitalized interest | $0 million |
| Expensed interest (excluding defeasance/prepayment costs) | $35.0 million |
| LIBOR | 5.10% to 5.35% |
| Expected defeasance/prepayment costs | $5.0 million |
| Capital Structure | |
| Common share repurchases | $0 million |
(1) See page 20 for the Company's definition of this non-GAAP measurement.
(2) See page 22 for the Company's definition of this non-GAAP measurement.
| Associated Estates Realty Corporation Definitions of Non-GAAP Financial Measures |
This supplemental includes certain non-GAAP financial measures that the Company believes are helpful in understanding our business, as further described below. The Company's definition and calculation of these non-GAAP financial measures may differ from those of other REITs, and may, therefore, not be comparable.
Funds from Operations ("FFO")
The Company defines FFO as the inclusion of all operating results, both recurring and non-recurring, except those results defined as "extraordinary items" under GAAP, adjusted for depreciation on real estate assets and amortization of intangible assets and gains and losses from the disposition of properties and land. Adjustments for joint ventures are calculated to reflect FFO on the same basis. FFO does not represent cash generated from operating activities in accordance with GAAP and is not necessarily indicative of cash available to fund cash needs and should not be considered an alternative to net income as an indicator of the Company's operating performance or as an alternative to cash flow as a measure of liquidity. The Company generally considers FFO to be a useful measure for reviewing the comparative operating and financial performance of the Company because FFO can help one compare the operating performance of a company's real estate between periods or as compared to different REITs.
Funds from Operations ("FFO") Excluding Defeasance Costs and/or Other Prepayment Costs
The Company defines FFO excluding defeasance costs and/or other prepayment costs as FFO, as defined above, plus the add back of defeasance costs and other prepayment costs of $2,663,000 and $3,559,000 (of this amount $1,195,000 is included in income (loss) from discontinued operations) for the quarter ended March 31, 2007 and 2006, respectively. In accordance with GAAP, these prepayment costs are included as interest expense in the Company's Consolidated Statement of Operations. These costs are the costs associated with the defeasance (prepayment) of two loans in 2007 and four loans in 2006. The Company is providing this calculation as an alternative FFO calculation as it considers it a more appropriate measure of comparing the operating performance of a company's real estate between periods or as compared to different REITs.
Funds Available for Distribution ("FAD")
The Company defines FAD as FFO plus depreciation-other and amortization of deferred financing fees less recurring fixed asset additions. Fixed asset additions exclude development, investment, revenue enhancing and non-recurring capital additions. Adjustments for joint ventures are calculated to reflect FAD on the same basis. The Company considers FAD to be an appropriate supplemental measure of the performance of an equity REIT because, like FFO, it captures real estate performance by excluding gains or losses from the disposition of properties and land and depreciation on real estate assets and amortization of intangible assets. Unlike FFO, FAD also reflects the recurring capital expenditures that are necessary to maintain the associated real estate.
| Associated Estates Realty Corporation Definitions of Non-GAAP Financial Measures |
Earnings Before Interest, Taxes, Depreciation and Amortization ("EBITDA")
EBITDA is defined as earnings before interest, taxes, depreciation and amortization. The Company considers EBITDA to be appropriate supplemental measures of our performance because they eliminate depreciation and interest which permits investors to view income from operations unclouded by non-cash depreciation or the cost of debt. Below is a reconciliation of net (loss) income available to common shareholders to EBITDA.
| Net (loss) income available to common shareholders | $ (812) | $ (8,885) |
| Equity in net loss of joint venture | 72 | 106 |
| Preferred share dividends | 1,262 | 1,262 |
| Interest income | (271) | (381) |
| Interest expense(1) | 11,562 | 14,195 |
| Depreciation and amortization | 7,762 | 8,689 |
| Gain on disposition of properties | (4,561) | - |
| Taxes | 69 | 70 |
| EBITDA | 15,083 | 15,056 |
| EBITDA - Joint Ventures: | ||
| Equity in net loss of joint venture | (72) | (106) |
| Interest expense | 364 | 329 |
| Depreciation and amortization | 289 | 284 |
| EBITDA - Joint Ventures | 581 | 507 |
| Total EBITDA | $ 15,664 | $ 15,563 |
(1) 2007 includes $2,663 of defeasance costs and 2006 includes $3,559 of defeasance costs.
| Associated Estates Realty Corporation Definitions of Non-GAAP Financial Measures |
Net Operating Income ("NOI")
NOI is determined by deducting property operating and maintenance expenses, direct property management and service companies expenses and painting service expense from total revenues. The Company evaluates the performance of its reportable segments based on NOI. The Company considers NOI to be an appropriate supplemental measure of our performance because it reflects the operating performance of our real estate portfolio and management and service companies at the property and management service company level and is used to assess regional property and management and service company level performance. NOI should not be considered an alternative to net income as a measure of performance or cash generated from operating activities in accordance with GAAP and, therefore, it should not be considered indicative of cash available to fund cash needs.
Property Net Operating Income ("Property NOI")
Property NOI is determined by deducting property operating and maintenance expenses from total property revenue. The Company considers Property NOI to be an appropriate supplemental measure of our performance because it reflects the operating performance of our real estate portfolio at the property level and is used to assess regional property level performance. Property NOI should not be considered an alternative to net income as a measure of performance or cash generated from operating activities in accordance with GAAP and, therefore, it should not be considered indicative of cash available to fund cash needs. The following is a reconciliation of Property NOI to total consolidated net income (loss).
| Property NOI | $ 18,290 | $ 16,435 |
| Management and service operations NOI | (522) | (239) |
| Depreciation and amortization | (7,762) | (8,048) |
| General and administrative expense | (2,712) | (2,346) |
| Interest income | 271 | 378 |
| Interest expense | (11,562) | (12,511) |
| Equity in net loss of joint ventures | (72) | (106) |
| Minority interest in operating partnership | (13) | (16) |
| Income (loss) from discontinued operations | 4,532 | (1,170) |
| Consolidated net income (loss) | $ 450 | $ (7,623) |
Recurring Fixed Asset Additions
The Company considers recurring fixed asset additions to a property to be capital expenditures made to replace worn out assets so as to maintain the property's value.
Investment/Revenue Enhancing and/or Non-Recurring Fixed Asset Additions
The Company considers investment/revenue enhancing and/or non-recurring fixed assets to be capital expenditures if such improvements increase the value of the property and/or enable the Company to increase rents.
"Same Community" Market-Rate Properties
"Same Community" Market-Rate Properties are conventional multifamily residential apartments, which have reached stabilization and were owned and operational for the entire periods presented. The Company considers a property stabilized when its occupancy rate reaches 93.0% and the Company has owned the property for one year.