Exhibit 99.2
| Associated Estates Realty Corporation Fourth Quarter 2003 Earnings Release and Supplemental Financial Data |
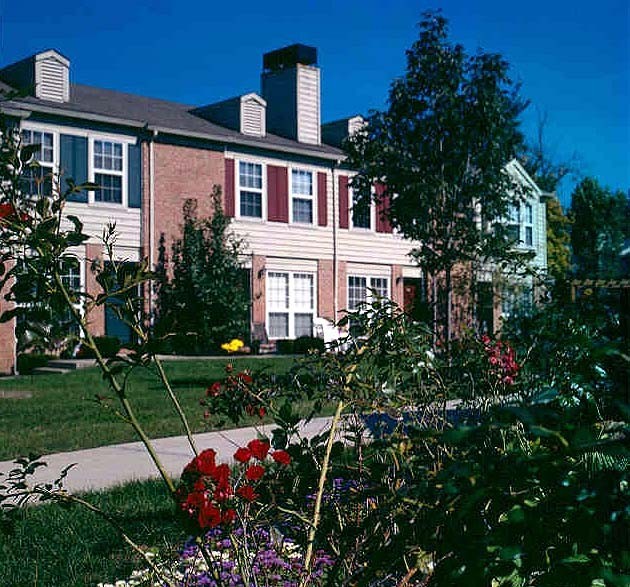
Williamsburg Townhomes
6636 Deerfield Drive
Sagamore Hills, Ohio 44067
Tel: (330) 468-3499
WebSite:www.williamsburgtownhomeapts.com
Williamsburg Townhomes, located in the unique and beautiful Greenwood Village of Sagamore Hills in Northeast Ohio, is a great place to live, play, and relax. Amenities include attached garages, in-suite washers and dryers, woodburning fireplaces, central air, attic storage, loft floor plans, three swimming pools, and a 24-hour fitness center. The leasing center offers residents a complimentary video and DVD library, as well as sporting equipment and mountain bikes. Facilities are available for tennis, sand volleyball, fishing and much more.
Associated Estates Realty CorporationPhone: (216) 261-5000
5025 Swetland CourtFax: (216) 289-9600
Richmond Heights, Ohio 44143-1467Web Site:www.aecrealty.com
Investor contact: Barbara E. Hasenstab
Vice President of Investor Relations
and Corporate Communications
(216) 797-8798
IR@aecrealty.com
| "Safe Harbor" Statement under the Private Securities Litigation Reform Act of 1995: This news release contains forward-looking statements.Historical results and percentage relationships set forth in the Consolidated Statements of Operations contained in the financial statements of the Company's supplemental information, including trends which might appear, should not be taken as indicative of future operations. This news release may also contain forward-looking statements based on current judgments and current knowledge of management, which are subject to certain risks, trends and uncertainties that could cause actual results to vary from those projected. Accordingly, readers are cautioned not to place undue reliance on forward-looking statements. These forward-looking statements are intended to be covered by the safe harbor provisions of the Private Securities Litigation Reform Act of 1995. Investors are cautioned that the Company's forward-looking statements involve risks and uncertainty, including without limitation the following: changes in economic conditions in the markets in which the Company owns properties, including interest rates, the overall level of economic activity, the availability of consumer credit and mortgage financing, unemployment rates and other factors; risks of a lessening of demand for the multifamily units owned or managed by the Company; competition from other available apartments and change in market rental rates; increases in property and liability insurance costs; changes in government regulations affecting the Affordable Housing properties; changes in or termination of contracts relating to third party management and advisory business; inability to renew current Housing Assistance Payment ("HAP") contracts at existing rents; weather and other conditions that might adversely affect operating expenses; expenditures that cannot be anticipated such as utility rate and usage increases, unanticipated repairs, additional staffing, and real estate tax valuation reassessments; changes in market conditions that may limit or prevent the Company from acquiring or selling properties; and risks of construction including cost overruns, contractor defaults and contractor delays. |

| Associated Estates Realty Corporation Fourth Quarter 2003 Supplemental Financial Data |
| Table of Contents | |
| Earnings Release | 1 |
| Financial and Operating Highlights | |
| Condensed Consolidated Balance Sheets | |
| Consolidated Statements of Operations | 8 |
| Reconciliation of Funds From Operations ("FFO") and Funds Available for Distribution ("FAD") | 9 |
| Overview of Operating Expenses Related to Repairs and Maintenance and Capitalized | |
| Expenditures | 10 |
| Segment Information | 11 |
| "Same-Store" Market Rate Data | 13 |
| Debt Structure | 17 |
| Joint Venture Summary Data | 18 |
Cleveland, Ohio - February 12, 2004 - Associated Estates Realty Corporation (NYSE: AEC) today reported a net loss of $0.04 per common share (basic and diluted) for the fourth quarter ended December 31, 2003 compared with a net loss of $0.17 per common share (basic and diluted) for the fourth quarter ended December 31, 2002.
Funds from operations (FFO) for the quarter were $0.32 per common share (basic and diluted) compared with $0.23 per common share (basic and diluted) for the fourth quarter ended December 31, 2002. A reconciliation of net income to FFO is included on page 9.
Total revenues for the quarter were $40,598,000 compared with $38,320,000 in the fourth quarter of 2002, an increase of 5.9 percent.
The $0.09 per share increase in FFO compared with the fourth quarter of 2002 consists of:
. An increase of approximately $0.02 per share in the contribution from acquisitions and dispositions, primarily as a result of an increase in the contribution from joint venture properties. The actual contribution from acquisitions and dispositions was $0.01 per share in the fourth quarter of 2003 compared with a loss of $0.01 per share in the fourth quarter of 2002.
. An increase of $0.03 per share in the contribution from the Company's same store market-rate and affordable housing portfolio. The actual contribution from the same store market-rate and affordable housing portfolio was $0.29 per share in the fourth quarter of 2003 compared with $0.26 per share in the fourth quarter of 2002.
. An increase of $0.04 per share in the contribution from the Company's management and service operations, primarily as a result of the disposition fees received from an advisory client relating to the sale of two properties, and a net contribution of $0.01 per share from the Company's painting subsidiary. The actual contribution from management and service operations was $0.02 per share in the fourth quarter of 2003 compared with a loss of $0.02 per share in the fourth quarter of 2002.
Segment detail as well as performance by region for the Company's same-store portfolio is included on pages 11 - 16.
Same Store (Market-Rate) Portfolio
Revenues for the quarter from the Company's same store (market-rate) portfolio were up 1.3 percent, and total property operating expenses for the same store (market-rate) portfolio increased 3.1 percent, resulting in a 0.3 percent decrease in net operating income (NOI) compared with the fourth quarter of 2002. Excluding real estate taxes and insurance, same store property operating expenses were flat in the fourth quarter of 2003 compared with the fourth quarter of 2002.
For the fourth quarter, the average rent per unit for the same store (market-rate) properties declined 3.1 percent to $772 per month, while the average net collected rent increased 1.7 percent to $670 per month compared with the fourth quarter of 2002. Physical occupancy was 92.7 percent at the end of the quarter compared with 87.4 percent in the fourth quarter of 2002.
Joint Ventures
On October 17, 2003, the Company sold its partnership interest in Berkley Manor, a 252-unit joint venture property located in Cranberry Township, Pennsylvania. The gain of $1,314,000 on the sale of this joint venture interest is included in the Company's fourth quarter results.
Physical occupancy at a newly constructed 288-unit joint venture development in Orlando, Florida, is currently at 86.5 percent. Stabilized occupancy (93 percent) is targeted for the first quarter of 2004.
Advisory Business
In late December, two client-owned apartment communities were sold as part of the client's strategy to divest certain real estate holdings: a 396-unit community in Alpharetta, Georgia; and a 390-unit community in Sunrise, Florida. Disposition fees as a result of the sale of these properties are included in the Company's fourth quarter results.
In addition, a 256-unit advisory-owned property in Silver Spring, Maryland was sold in the first quarter of 2004. Disposition fees from the sale of this property will be reflected in the Company's first quarter 2004 results.
Year 2003 Results
For the year 2003, the Company reported a loss of $0.85 per share (basic and diluted) compared with a loss of $0.21 per share (basic and diluted) for the year 2002. The results for 2003 include gains on sales of $1,764,000, or approximately $0.09 per share. The results for 2002 include a net gain on property sales of $9,887,000, or approximately $0.52 per share.
FFO for the year 2003 was $0.81 per common share (basic and diluted) compared with $1.03 per common share (basic and diluted) in 2002.
For the year 2003, total revenue was $157,325,000 compared with $162,354,000 in 2002, a decline of 3.1 percent. Total revenue for 2003 reflects a decline of $6,089,000 in fee income and reimbursements compared with 2002.
For the year, same store (market-rate) revenues declined 1.7 percent, total property operating expenses increased 6.3 percent, and net operating income declined 8.9 percent.
Recurring capital expenditures totaled $562 per unit in 2003 compared with $490 per unit in 2002. Details regarding the Company's 2003 capital expenditures are included on page 10.
Outlook
"We are pleased with the trends in occupancy and net collected rent per unit for our same-store portfolio," said Jeffrey I. Friedman, President and CEO. "These improvements reflect the positive impact of many initiatives we implemented during the year, as well as our close watch on controllable expenses."
"We expect these efforts, along with continued property level expense controls, to result in sequential quarterly improvement in our results throughout 2004," said Friedman. "Based on our recent property operating performance, we expect to generate FFO per share in the range of $1.05 to $1.10 for the year 2004," said Friedman. "At these levels, we would expect our funds available for distribution to be approximately $0.71 to $0.76 per share for the year."
Tax Characterization of 2003 Dividend
As reported to shareholders in January 2004, 100 percent of the $0.68 per share dividend paid on the Company's common shares in 2003 is classified as non-taxable return of capital.
Preferred Share Dividend
The Company also announced today that a quarterly dividend of $0.60938 per one-tenth depositary share has been declared on its Class A Cumulative Preferred Shares (NYSE: AECPRA), payable on March 15, 2004 to preferred shareholders of record on March 1, 2004.
Each depositary share represents one-tenth of a share of the Company's 9-3/4% Class A Cumulative Redeemable Preferred Shares.
| Associated Estates Realty Corporation Financial and Operating Highlights For the Three and Twelve Months Ended December 31, 2003 (Unaudited; in thousands, except per share and ratio data) |
| OPERATING INFORMATION | ||||
| Total revenues | $ 40,598 | $ 38,320 | $ 157,325 | $ 162,354 |
| Property revenues | $ 35,345 | $ 34,861 | $ 140,055 | $ 139,923 |
| Net (loss) income applicable to common shareholders | $ (842) | $ (3,237) | $ (16,397) | $ (4,006) |
| Per share: | ||||
| Basic | $ (0.04) | $ (0.17) | $ (0.85) | $ (0.21) |
| Diluted | $ (0.04) | $ (0.17) | $ (0.85) | $ (0.21) |
| Funds From Operations (FFO) (1) | $ 6,254 | $ 4,390 | $ 15,675 | $ 20,000 |
| FFO per share: | ||||
| Basic | $ 0.32 | $ 0.23 | $ 0.81 | $ 1.03 |
| Diluted | $ 0.32 | $ 0.23 | $ 0.81 | $ 1.03 |
| Funds Available for Distribution (FAD)(2) | $ 4,131 | $ 3,451 | $ 9,877 | $ 14,985 |
| Dividends per share | $ 0.17 | $ 0.25 | $ 0.68 | $ 1.00 |
| Payout ratio - FFO | 53.1% | 108.7% | 84.0% | 97.1% |
| Payout ratio - FAD | 79.9% | 140.3% | 133.6% | 129.1% |
| Common dividends - paid | $ 3,310 | $ 4,869 | $ 13,240 | $ 19,462 |
| Preferred dividends - paid | $ 1,371 | $ 1,371 | $ 5,484 | $ 5,485 |
| Service companies expense | $ 897 | $ 1,177 | $ 3,657 | $ 5,641 |
| General and administrative expense | $ 1,239 | $ 1,629 | $ 6,084 | $ 7,016 |
| Interest expense (3) | $ 9,870 | $ 10,131 | $ 39,608 | $ 40,100 |
| Interest coverage ratio(4) | 1.77:1 | 1.57:1 | 1.57:1 | 1.61:1 |
| Fixed charge coverage ratio(5) | 1.56:1 | 1.40:1 | 1.39:1 | 1.43:1 |
| General and administrative expense to property revenue | 3.5% | 4.7% | 4.3% | 5.0% |
| Interest expense to property revenue | 27.9% | 29.1% | 28.3% | 28.7% |
| Total NOI(6) | 19,543 | 18,637 | 70,636 | 75,998 |
| Property NOI(7) | 18,644 | 18,568 | 68,673 | 74,171 |
| ROA(8) | 7.5% | 8.1% | 7.5% | 8.1% |
| Same-store market rate revenue increase (decrease) | 1.3% | (2.7)% | (1.7)% | (2.1)% |
| Same-store market rate expense increase | 3.1% | 1.3% | 6.3% | 2.0% |
| Same-store market rate NOI decrease | (0.3)% | (7.5)% | (8.9)% | (5.5)% |
| Same-store market rate operating margins | 52.4% | 53.2% | 49.9% | 53.6% |
(1) The Company defines FFO as the inclusion of all operating results, both recurring and non-recurring, except those results defined as "extraordinary items" under GAAP, adjusted for depreciation on real estate assets and amortization of intangible assets and gains and losses from the disposition of properties and land. Adjustments for joint ventures are calculated to reflect FFO on the same basis. FFO does not represent cash generated from operating activities in accordance with GAAP and is not necessarily indicative of cash available to fund cash needs and should not be considered an alternative to net income as an indicator of the Company's operating performance or as an alternative to cash flow as a measure of liquidity. The Company generally considers FFO to be a useful measure for reviewing the comparative operating and financial performance of the Company because FFO can help one compare the operating performance of a company's real estate between periods or as compared to different REITs. It should be noted, however, that certain other real estate companies may define FFO in a different manner.
(2) The Company defines FAD as FFO plus depreciation other and amortization of deferred financing fees less recurring fixed asset additions. Fixed asset additions exclude development, investment, revenue enhancing and non-recurring capital additions. Adjustments for joint ventures are calculated to reflect FAD on the same basis. The Company considers FAD to be an appropriate supplemental measure of the performance of an equity REIT because, like FFO, it captures real estate performance by excluding gains or losses from the disposition of properties and land and depreciation on real estate assets and amortization of intangible assets. Unlike FFO, FAD also reflects that recurring capital expenditures are necessary to maintain the associated real estate.
(3) Excludes amortization of financing fees of $276 and $1,151 for the three and twelve months 2003, respectively, and $293 and $1,221 for the three and twelve months 2002, respectively.
(4) Is calculated as EBITDA divided by interest expense, including capitalized interest and amortization of deferred financing costs.
(5) Represents interest expense and preferred stock dividend payment coverage.
(6) NOI is determined by deducting property operating and maintenance expenses, direct property management and service companies expenses and painting service expense from total revenues. The Company evaluates the performance of its reportable segments based on NOI. The Company considers NOI to be an appropriate supplemental measure of our performance because it reflects the operating performance of our real estate portfolio and management and service companies at the property and management service company level and is used to assess regional property and management and service company level performance. NOI should not be considered an alternative to net income as a measure of performance or cash generated from operating activities in accordance with GAAP and, therefore, it should not be considered indicative of cash available to fund cash needs.
(7) Property NOI is determined by deducting property operating and maintenance expenses from total property revenue. The Company considers property NOI to be an appropriate supplemental measure of our performance because it reflects the operating performance of our real estate portfolio at the property level and is used to assess regional property level performance. NOI should not be considered an alternative to net income as a measure of performance or cash generated from operating activities in accordance with GAAP and, therefore, it should not be considered indicative of cash available to fund cash needs.
(8) ROA is calculated as trailing twelve month property NOI divided by average gross real estate assets.
| Associated Estates Realty Corporation Financial and Operating Highlights Fourth Quarter 2003 (Unaudited; in thousands, except per share and ratio data) |
| MARKET CAPITALIZATION DATA | ||
| Net real estate investments | $ 661,585 | $ 683,058 |
| Total assets | $ 704,793 | $ 735,303 |
| Total debt | $ 543,496 | $ 540,498 |
| Minority interest | $ 2,172 | $ 2,972 |
| Preferred stock | $ 56,250 | $ 56,250 |
| Total shareholders' equity | $ 121,428 | $ 150,865 |
| Common shares outstanding | 19,479 | 19,474 |
| Share price, end of period | $ 7.31 | $ 6.75 |
| Total market capitalization(1) | $ 768,543 | $ 760,860 |
| Debt to total assets | 77.1% | 73.5% |
(1) Includes our share of unconsolidated debt of $26,406 and $32,659 as of December 31, 2003 and December 31, 2002, respectively.
| Associated Estates Realty Corporation Financial and Operating Highlights Fourth Quarter 2003 |
| PORTFOLIO INFORMATION | ||
| Company Portfolio: | ||
| Directly owned: | ||
| Affordable Housing | 12 | 1,246 |
| "Same Store" Market Rate | 62 | 15,828 |
| Joint ventures | 4 | 1,239 |
| Third party managed(1) | 30 | 6,038 |
| Total Company Portfolio | 107 | 24,351 |
(1) Effective January 31, 2004, the Company assumed management of a 127 unit community located in Sharon, Pennsylvania. Additionally, on January 30, 2004, a client advised property containing 256 units was sold.
| Associated Estates Realty Corporation Condensed Consolidated Balance Sheets Fourth Quarter 2003 (Unaudited; dollar amounts in thousands) |
| Real estate assets | ||
| Investment in real estate | $ 920,444 | $ 910,540 |
| Construction in progress | 5,527 | 5,868 |
| Less: accumulated depreciation | (264,386) | (233,350) |
| Real estate, net | 661,585 | 683,058 |
| Cash and cash equivalents | 2,212 | 900 |
| Restricted cash | 10,889 | 13,326 |
| Other assets | 30,107 | 38,019 |
| $ 704,793 | $ 735,303 | |
LIABILITIES AND SHAREHOLDERS' EQUITY | ||
| Secured debt | $ 543,391 | $ 540,393 |
| Unsecured debt | 105 | 105 |
| Total indebtedness | 543,496 | 540,498 |
| Accounts payable and accrued expenses | 37,697 | 40,968 |
| Total liabilities | 581,193 | 581,466 |
| Operating partnership minority interest | 2,172 | 2,972 |
| Shareholders' equity | ||
| Preferred shares, Class A cumulative, without par value; | ||
| 3,000,000 authorized; 225,000 issued and outstanding | 56,250 | 56,250 |
| Common shares, without par value, $.10 stated value; 50,000,000 | ||
| authorized; 22,995,763 issued and 19,478,681 and 19,473,576 | ||
| outstanding at December 31, 2003 and 2002, respectively | 2,300 | 2,300 |
| Paid-in capital | 279,087 | 279,039 |
| Accumulated distributions in excess of accumulated net income | (184,436) | (154,798) |
| Less: Treasury shares, at cost, 3,517,082 and 3,522,187 shares | ||
| at December 31, 2003 and 2002, respectively | (31,773) | (31,926) |
| Total shareholders' equity | 121,428 | 150,865 |
| $ 704,793 | $ 735,303 |
| Associated Estates Realty Corporation Consolidated Statements of Operations Three and Twelve Months Ended December 31, 2003 and 2002 (Unaudited; dollar and share amounts in thousands) |
| REVENUE | ||||
| Rental income | $ 34,398 | $ 34,111 | $ 136,743 | $ 137,028 |
| Fee income and reimbursements | 3,758 | 2,920 | 14,053 | 20,142 |
| Other income | 2,442 | 1,289 | 6,529 | 5,184 |
| Total revenue | 40,598 | 38,320 | 157,325 | 162,354 |
| EXPENSES | ||||
| Property operating and maintenance | 16,701 | 16,292 | 71,382 | 65,752 |
| Depreciation and amortization | 8,643 | 8,602 | 34,828 | 34,431 |
| Direct property management and service companies expenses | 3,079 | 2,891 | 12,458 | 18,812 |
| Painting services and charges | 1,275 | 500 | 2,809 | 1,792 |
| General and administrative | 1,239 | 1,629 | 6,084 | 7,016 |
| Interest expense | 10,145 | 10,359 | 40,759 | 40,841 |
| Total expenses | 41,082 | 40,273 | 168,320 | 168,644 |
| (Loss) income before gain on disposition of properties, equity in net loss | ||||
| of joint ventures, gain on sale of partnership interest, minority interest | ||||
| and income from discontinued operations | (484) | (1,953) | (10,995) | (6,290) |
| Gain on disposition of properties | - | 11 | - | 227 |
| Equity in net loss of joint ventures | (286) | (574) | (1,157) | (1,627) |
| Gain on sale of partnership interest | 1,314 | - | 1,314 | - |
| Minority interest in operating partnership | (15) | (25) | (75) | (324) |
| Income (loss) before income from discontinued operations | 529 | (2,541) | (10,913) | (8,014) |
| Income from discontinued operations: | ||||
| Operating loss | - | (149) | - | (167) |
| Gain on disposition of properties | - | 824 | - | 9,660 |
| Income from discontinued operations | - | 675 | - | 9,493 |
| Net income (loss) | 529 | (1,866) | (10,913) | 1,479 |
| Preferred share dividends | (1,371) | (1,371) | (5,484) | (5,485) |
| Net (loss) income applicable to common shares | $ (842) | $ (3,237) | $ (16,397) | $ (4,006) |
| Earnings per common share - basic: | ||||
| (Loss) income before income from discontinued operations | $ (0.04) | $ (0.20) | $ (0.85) | $ (0.70) |
| Income from discontinued operations | - | 0.03 | - | 0.49 |
| Net (loss) income applicable to common shares | $ (0.04) | $ (0.17) | $ (0.85) | $ (0.21) |
| Earnings per common share - diluted: | ||||
| (Loss) income before income from discontinued operations | $ (0.04) | $ (0.20) | $ (0.85) | $ (0.70) |
| Income from discontinued operations | - | 0.03 | - | 0.49 |
| Net (loss) income applicable to common shares | $ (0.04) | $ (0.17) | $ (0.85) | $ (0.21) |
| Funds From Operations (FFO)(1) | $ 6,254 | $ 4,390 | $ 15,675 | $ 20,000 |
| Funds Available For Distribution (FAD)(2) | $ 4,131 | $ 3,451 | $ 9,877 | $ 14,985 |
| Weighted average shares outstanding - basic | 19,413 | 19,366 | 19,401 | 19,343 |
| Weighted average shares outstanding - diluted | 19,413 | 19,366 | 19,401 | 19,343 |
(1) The Company defines FFO as the inclusion of all operating results, both recurring and non-recurring, except those results defined as "extraordinary items" under GAAP, adjusted for depreciation on real estate assets and amortization of intangible assets and gains and losses from the disposition of properties and land. Adjustments for joint ventures are calculated to reflect FFO on the same basis. FFO does not represent cash generated from operating activities in accordance with GAAP and is not necessarily indicative of cash available to fund cash needs and should not be considered an alternative to net income as an indicator of the Company's operating performance or as an alternative to cash flow as a measure of liquidity. The Company generally considers FFO to be a useful measure for reviewing the comparative operating and financial performance of the Company because FFO can help one compare the operating performance of a company's real estate between periods or as compared to different REITs. It should be noted, however, that certain other real estate companies may define FFO in a different manner.
(2) The Company defines FAD as FFO plus depreciation other and amortization of deferred financing fees less recurring fixed asset additions. Fixed asset additions exclude development, investment, revenue enhancing and non-recurring capital additions. Adjustments for joint ventures are calculated to reflect FAD on the same basis. The Company considers FAD to be an appropriate supplemental measure of the performance of an equity REIT because, like FFO, it captures real estate performance by excluding gains or losses from the disposition of properties and land and depreciation on real estate assets and amortization of intangible assets. Unlike FFO, FAD also reflects that recurring capital expenditures are necessary to maintain the associated real estate.
| Associated Estates Realty Corporation Reconciliation of Funds from Operations (FFO) and Funds Available for Distribution (FAD) (In thousands, except per share data) |
| CALCULATION OF FFO AND FAD | ||||
| Net (loss) income applicable to common shares | $ (842) | $ (3,237) | $ (16,397) | $ (4,006) |
| Add: Depreciation - real estate assets | 7,996 | 8,007 | 32,082 | 31,884 |
| Depreciation - real estate assets - joint ventures | 315 | 377 | 1,371 | 1,314 |
| Amortization of joint venture deferred costs | 21 | - | 71 | - |
| Amortization of intangible assets | 78 | 78 | 312 | 695 |
| Less: Gain on disposition of properties and partnership interest | (1,314) | (835) | (1,764) | (9,887) |
| Funds From Operations (FFO) (1) | 6,254 | 4,390 | 15,675 | 20,000 |
| Add: Depreciation - other assets | 569 | 563 | 2,434 | 2,195 |
| Depreciation - other assets - joint ventures | 50 | 32 | 243 | 117 |
| Amortization of deferred financing fees | 276 | 293 | 1,151 | 1,221 |
| Amortization of deferred financing fees - joint ventures | 19 | 18 | 90 | 47 |
| Less: Fixed asset additions (2) | (3,037) | (1,845) | (9,571) | (8,462) |
| Fixed asset additions - joint ventures(2) | - | - | (145) | (133) |
| Funds Available for Distribution (FAD)(3) | $ 4,131 | $ 3,451 | $ 9,877 | $ 14,985 |
| Weighted average shares outstanding - basic | 19,413 | 19,366 | 19,401 | 19,343 |
| Weighted average shares outstanding - diluted | 19,413 | 19,366 | 19,401 | 19,343 |
| PER SHARE INFORMATION: | ||||
| FFO - basic | $ 0.32 | $ 0.23 | $ 0.81 | $ 1.03 |
| FFO - diluted | $ 0.32 | $ 0.23 | $ 0.81 | $ 1.03 |
| Dividends | $ 0.17 | $ 0.25 | $ 0.68 | $ 1.00 |
| Payout ratio - FFO | 53.1% | 108.7% | 84.0% | 97.1% |
| Payout ratio - FAD | 79.9% | 140.3% | 133.6% | 129.1% |
(1) The Company defines FFO as the inclusion of all operating results, both recurring and non-recurring, except those results defined as "extraordinary items" under GAAP, adjusted for depreciation on real estate assets and amortization of intangible assets and gains and losses from the disposition of properties and land. Adjustments for joint ventures are calculated to reflect FFO on the same basis. FFO does not represent cash generated from operating activities in accordance with GAAP and is not necessarily indicative of cash available to fund cash needs and should not be considered an alternative to net income as an indicator of the Company's operating performance or as an alternative to cash flow as a measure of liquidity. The Company generally considers FFO to be a useful measure for reviewing the comparative operating and financial performance of the Company because FFO can help one compare the operating performance of a company's real estate between periods or as compared to different REITs. It should be noted, however, that certain other real estate companies may define FFO in a different manner.
(2) Fixed asset additions exclude development, investment, revenue enhancing and non-recurring capital additions and only reflects the Company's prorata share of recurring joint venture capital additions.
(3) The Company defines FAD as FFO plus depreciation other and amortization of deferred financing fees less recurring fixed asset additions. Fixed asset additions exclude development, investment, revenue enhancing and non-recurring capital additions. Adjustments for joint ventures are calculated to reflect FAD on the same basis. The Company considers FAD to be an appropriate supplemental measure of the performance of an equity REIT because, like FFO, it captures real estate performance by excluding gains or losses from the disposition of properties and land and depreciation on real estate assets and amortization of intangible assets. Unlike FFO, FAD also reflects that recurring capital expenditures are necessary to maintain the associated real estate.
| Associated Estates Realty Corporation Overview of Operating Expenses Related to Repairs and Maintenance and Capitalized Expenditures (In thousands, except estimated GAAP useful life and cost per unit) |
| OPERATING EXPENSES RELATED TO REPAIRS AND MAINTENANCE | |||
| Repairs and maintenance(2) | $ 14,785 | $ 866 | |
| Maintenance personnel labor cost(2) | 7,423 | 435 | |
| Total Operating Expenses Related to Repairs and Maintenance | 22,208 | 1,301 | |
| CAPITAL EXPENDITURES | |||
| Recurring Capital Expenditures | |||
| Amenities | 5 | 235 | 14 |
| Appliances | 5 | 827 | 48 |
| Building improvements(3) | 14 | 2,898 | 170 |
| Carpet and flooring | 5 | 3,322 | 195 |
| HVAC and mechanicals | 15 | 659 | 39 |
| Landscaping and grounds | 14 | 867 | 51 |
| Office/model | 5 | 13 | 1 |
| Suite improvements | 5 | 122 | 7 |
| Miscellaneous | 5 | 81 | 5 |
| Total Recurring Capital Expenditures - Properties | 9,024 | 530 | |
| Corporate capital expenditures(4) (5) | 547 | 32 | |
| Total Recurring Capital Expenditures | 9,571 | 562 | |
| Total Recurring Capital Expenditures andRepairs and Maintenance | $ 31,779 | $ 1,863 | |
| Total Recurring Capital Expenditures | $ 9,571 | ||
| Investment/Revenue Enhancing Expenditures: | |||
| Build out Retail Space | 30 | 66 | |
| Underground parking garage(6) | 30 | 3,852 | |
| Total Investment/Revenue Enhancing Expenditures | 3,918 | ||
| Non-recurring Expenditures - Siding replacement(6) | 30 | 384 | |
| Grand Total Capital Expenditures | $ 13,873 | ||
(1) Calculated using 17,074, including 1,246 affordable housing and 15,828 same store (market-rate).
(2) Included in property operating and maintenance expense in the Consolidated Statements of Operations.
(3) Includes primarily building exterior work, exterior painting and new roofs.
(4) Includes upgrades to computer hardware and software as well as corporate office furniture and fixtures.
(5) Includes $23 of capital lease payments.
(6) Related to a single market-rate asset.
| Associated Estates Realty Corporation Segment Information (Unaudited, in thousands, except per share data) |
| Revenue | $ - | $ 32,948 | $ 2,397 | $ 5,253 | $ 40,598 |
| Expenses | (14) | 15,673 | 1,042 | 4,354 | 21,055 |
| NOI(1) | 14 | 17,275 | 1,355 | 899 | 19,543 |
| Depreciation and amortization | - | 7,926 | 322 | 395 | 8,643 |
| General and administrative | - | 1,149 | 90 | - | 1,239 |
| Interest expense | - | 10,086 | 1 | 58 | 10,145 |
| - | 19,161 | 413 | 453 | 20,027 | |
| Income (loss) before equity in net loss of joint ventures, | |||||
| gain on sale of partnership interest and minority interest | 14 | (1,886) | 942 | 446 | (484) |
| Equity in net loss of joint ventures | (128) | (136) | (22) | - | (286) |
| Gain on sale of partnership interest | 1,314 | - | - | - | 1,314 |
| Minority interest in operating partnership | - | - | - | (15) | (15) |
| Net income (loss) | 1,200 | (2,020) | 920 | 431 | 529 |
| Preferred share dividends | - | (1,177) | (86) | (108) | (1,371) |
| Net income (loss) applicable to common shares | $ 1,200 | $ (3,199) | $ 834 | $ 323 | $ (842) |
| Weighted average shares outstanding - basic | 19,413 | ||||
| Weighted average shares outstanding - diluted | 19,413 | ||||
| FFO per share - basic | $ 0.01 | $ 0.23 | $ 0.06 | $ 0.02 | $ 0.32 |
| FFO per share - diluted | $ 0.01 | $ 0.23 | $ 0.06 | $ 0.02 | $ 0.32 |
| Revenue | $ - | $ 32,535 | $ 2,326 | $ 3,459 | $ 38,320 |
| Expenses | (7) | 15,211 | 1,089 | 3,390 | 19,683 |
| NOI(1) | 7 | 17,324 | 1,237 | 69 | 18,637 |
| Depreciation and amortization | - | 7,850 | 311 | 441 | 8,602 |
| General and administrative | 134 | 1,376 | 119 | - | 1,629 |
| Interest expense | (134) | 10,424 | 1 | 68 | 10,359 |
| - | 19,650 | 431 | 509 | 20,590 | |
| Income (loss) before gain on disposition of properties, equity | |||||
| in net loss of joint ventures, minority interest and income | |||||
| from discontinued operations | 7 | (2,326) | 806 | (440) | (1,953) |
| Gain on disposition of properties | 11 | - | - | - | 11 |
| Equity in net loss of joint ventures | (427) | (137) | (10) | - | (574) |
| Minority interest in operating partnership | - | - | - | (25) | (25) |
| (Loss) income before income from discontinued operations | (409) | (2,463) | 796 | (465) | (2,541) |
| Income from discontinued operations | 675 | - | - | - | 675 |
| Net income (loss) | 266 | (2,463) | 796 | (465) | (1,866) |
| Preferred share dividends | (7) | (1,211) | (87) | (66) | (1,371) |
| Net income (loss) applicable to common shares | $ 259 | $ (3,674) | $ 709 | $ (531) | $ (3,237) |
| Weighted average shares outstanding - basic | 19,366 | ||||
| Weighted average shares outstanding - diluted | 19,366 | ||||
| FFO per share - basic | $ (0.01) | $ 0.21 | $ 0.05 | $ (0.02) | $ 0.23 |
| FFO per share - diluted | $ (0.01) | $ 0.21 | $ 0.05 | $ (0.02) | $ 0.23 |
(1) The Company evaluates the performance of its reportable segments based on NOI. NOI is determined by deducting property operating and maintenance expenses, direct property management and service companies expenses and painting service expense from total revenues. The Company considers NOI to be an appropriate supplemental measure of our performance because it reflects the operating performance of our real estate portfolio and management and service company at the property and management and service company level and is used to assess regional property and management and service company level performance. NOI should not be considered an alternative to net income as a measure of performance or cash generated from operating activities in accordance with GAAP and, therefore, it should not be considered indicative of cash available to fund cash needs.
| Associated Estates Realty Corporation Segment Information (Unaudited, in thousands, except per share data) |
| Revenue | $ 7,790 | $ 122,839 | $ 9,426 | $ 17,270 | $ 157,325 |
| Expenses | 5,606 | 61,505 | 4,271 | 15,267 | 86,649 |
| NOI(1) | 2,184 | 61,334 | 5,155 | 2,003 | 70,676 |
| Depreciation and amortization | 500 | 31,263 | 1,247 | 1,818 | 34,828 |
| General and administrative | 498 | 5,139 | 447 | - | 6,084 |
| Interest expense | 789 | 39,728 | 5 | 237 | 40,759 |
| 1,787 | 76,130 | 1,699 | 2,055 | 81,671 | |
| Income (loss) before equity in net loss of joint ventures, | |||||
| gain on sale of partnership interest and minority interest | 397 | (14,796) | 3,456 | (52) | (10,995) |
| Equity in net loss of joint ventures | (527) | (558) | (72) | - | (1,157) |
| Gain on sale of partnership interest | 1,314 | 1,314 | |||
| Minority interest in operating partnership | - | - | - | (75) | (75) |
| Net income (loss) | 1,184 | (15,354) | 3,384 | (127) | (10,913) |
| Preferred share dividends | (289) | (4,535) | (347) | (313) | (5,484) |
| Net income (loss) applicable to common shares | $ 895 | $ (19,889 | $ 3,037 | $ (440) | $ (16,397) |
| Weighted average shares outstanding - basic | 19,401 | ||||
| Weighted average shares outstanding - diluted | 19,401 | ||||
| FFO per share - basic | $ 0.03 | $ 0.56 | $ 0.22 | $ - | $ 0.81 |
| FFO per share - diluted | $ 0.03 | $ 0.56 | $ 0.22 | $ - | $ 0.81 |
| Revenue | $ 5,537 | $ 125,062 | $ 9,324 | $ 22,431 | $ 162,354 |
| Expenses | 3,510 | 58,010 | 4,232 | 20,604 | 86,356 |
| NOI(1) | 2,027 | 67,052 | 5,092 | 1,827 | 75,998 |
| Depreciation and amortization | 212 | 30,904 | 1,238 | 2,077 | 34,431 |
| General and administrative | 578 | 5,926 | 512 | - | 7,016 |
| Interest expense | (199) | 40,409 | 194 | 437 | 40,841 |
| 591 | 77,239 | 1,944 | 2,514 | 82,288 | |
| Income (loss) before gain on disposition of properties, equity | |||||
| in net loss of joint ventures, minority interest and | |||||
| income from discontinued operations | 1,436 | (10,187) | 3,148 | (687) | (6,290) |
| Gain on disposition of properties | 227 | - | - | - | 227 |
| Equity in net loss of joint ventures | (1,181) | (422) | (24) | - | (1,627) |
| Minority interest in operating partnership | - | - | - | (324) | (324) |
| Income (loss) before income from discontinued operations | 482 | (10,609) | 3,124 | (1,011) | (8,014) |
| Income from discontinued operations | 9,493 | - | - | - | 9,493 |
| Net income (loss) | 9,975 | (10,609) | 3,124 | (1,011) | 1,479 |
| Preferred share dividends | (272) | (4,540) | (338) | (335) | (5,485) |
| Net income (loss) applicable to common shares | $ 9,703 | $ (15,149) | $ 2,786 | $ (1,346) | $ (4,006) |
| Weighted average shares outstanding - basic | 19,343 | ||||
| Weighted average shares outstanding - diluted | 19,343 | ||||
| FFO per share - basic | $ 0.06 | $ 0.79 | $ 0.21 | $ (0.03) | $ 1.03 |
| FFO per share - diluted | $ 0.06 | $ 0.79 | $ 0.21 | $ (0.03) | $ 1.03 |
(1) The Company evaluates the performance of its reportable segments based on NOI. NOI is determined by deducting property operating and maintenance expenses, direct property management and service companies expenses and painting service expense from total revenues. The Company considers NOI to be an appropriate supplemental measure of our performance because it reflects the operating performance of our real estate portfolio and management and service operations at the property and management and service company level and is used to assess regional property and management and service company level performance. NOI should not be considered an alternative to net income as a measure of performance or cash generated from operating activities in accordance with GAAP and, therefore, it should not be considered indicative of cash available to fund cash needs.
| Associated Estates Realty Corporation "Same Store" Market Rate Data Operating Results for the Last Five Quarters (Unaudited, in thousands, except unit totals and per unit amounts) |
| Revenues | |||||
| Rental | $ 32,063 | $ 32,460 | $ 31,821 | $ 31,047 | $ 31,788 |
| Other income | 885 | 780 | 784 | 790 | 747 |
| Total Revenue | 32,948 | 33,240 | 32,605 | 31,837 | 32,535 |
| Property Operating and Maintenance | |||||
| Expenses | |||||
| Personnel | 4,373 | 4,923 | 4,548 | 4,309 | 4,372 |
| Advertising | 511 | 667 | 689 | 652 | 739 |
| Utilities | 2,193 | 2,104 | 1,883 | 2,702 | 2,044 |
| Repairs and maintenance | 3,401 | 3,987 | 3,833 | 3,015 | 2,916 |
| Real estate taxes and insurance | 3,922 | 4,478 | 4,838 | 4,530 | 3,661 |
| Other operating | 1,273 | 1,466 | 1,440 | 1,413 | 1,477 |
| Total Expenses | 15,673 | 17,625 | 17,231 | 16,621 | 15,209 |
| Net Operating Income | $ 17,275 | $ 15,615 | $ 15,374 | $ 15,216 | $ 17,326 |
| Operating Margin | 52.4% | 47.0% | 47.2% | 47.8% | 53.2% |
| Total Number of Units | 15,828 | 15,828 | 15,828 | 15,828 | 15,828 |
| NOI Per Unit | $ 1,091 | $ 987 | $ 971 | $ 961 | $ 1,095 |
| Average Net Collected Per Unit(1) | $ 670 | $ 669 | $ 657 | $ 643 | $ 659 |
| Physical Occupancy - End of Period(2) | 92.7% | 93.7% | 91.5% | 89.5% | 87.4% |
| Average Economic Occupancy(3) | 86.7% | 85.7% | 82.9% | 80.6% | 82.7% |
(1) Represents gross potential rents less vacancies and allowances.
(2) Is defined as number of units occupied divided by total number of units.
(3) Is defined as potential rent less vacancies and concessions divided by potential rent.
| Associated Estates Realty Corporation "Same-Store" Market Rate Data Three and Twelve Months Ended December 31, 2003 and 2002 |
| REVENUE GROWTH | |||||
| Region | |||||
| Arizona | 204 | 1.3% | 1.2% | (5.1)% | 1.2% |
| Florida | 1,128 | 4.6% | 9.3% | (6.2)% | 9.0% |
| Georgia | 706 | 1.6% | 3.9% | (2.9)% | 3.9% |
| Indiana | 836 | (1.4)% | 5.3% | (5.6)% | 5.4% |
| Metro D.C. | 667 | 0.8% | 6.2% | 3.8% | 6.2% |
| Michigan | 2,888 | 0.6% | 18.8% | (4.8)% | 19.0% |
| North Carolina | 276 | 8.0% | 1.5% | (14.0)% | 1.4% |
| Ohio - Central Ohio | 3,135 | 5.1% | 18.9% | (4.7)% | 18.3% |
| Ohio - Northeastern Ohio | 4,186 | 0.0% | 24.8% | (0.5)% | 25.1% |
| Ohio - Northeastern - Congregate Care | 170 | (1.9)% | 1.0% | (8.7)% | 1.0% |
| Ohio - Toledo, Ohio | 1,060 | (5.9)% | 5.7% | (6.1)% | 6.1% |
| Pennsylvania | 468 | 3.8% | 2.5% | (6.9)% | 2.5% |
| Texas | 104 | (4.1)% | 0.9% | 3.4% | 0.9% |
| Total "Same Store" Market Rate | 15,828 | 1.3% | 100.0% | (2.7)% | 100.0% |
| EXPENSE GROWTH | |||||
| Region | |||||
| Arizona | 204 | (20.6)% | 1.2% | 17.0% | 1.5% |
| Florida | 1,128 | 2.7% | 9.7% | 4.5% | 9.7% |
| Georgia | 706 | (18.4)% | 4.5% | 5.5% | 5.7% |
| Indiana | 836 | 0.8% | 5.5% | 12.2% | 5.6% |
| Metro D.C. | 667 | (3.4)% | 4.2% | 12.6% | 4.5% |
| Michigan | 2,888 | (4.4)% | 16.5% | 3.5% | 17.7% |
| North Carolina | 276 | 2.5% | 1.5% | 3.1% | 1.5% |
| Ohio - Central Ohio | 3,135 | 17.8% | 17.3% | (11.8)% | 15.1% |
| Ohio - Northeastern Ohio | 4,186 | 8.3% | 29.5% | 1.6% | 28.1% |
| Ohio - Northeastern - Congregate Care | 170 | (6.6)% | 1.9% | 14.2% | 2.2% |
| Ohio - Toledo, Ohio | 1,060 | (13.7)% | 4.5% | 0.8% | 5.4% |
| Pennsylvania | 468 | 36.2% | 2.8% | 2.0% | 2.1% |
| Texas | 104 | 15.2% | 0.9% | (13.9)% | 0.9% |
| Total "Same Store" Market Rate | 15,828 | 3.1% | 100.0% | 1.3% | 100.0% |
| NOI GROWTH | |||||
| Region | % | ||||
| Arizona | 204 | 33.4% | 1.2% | (25.7)% | 0.9% |
| Florida | 1,128 | 6.6% | 8.9% | (15.2)% | 8.3% |
| Georgia | 706 | 43.6% | 3.4% | (16.7)% | 2.4% |
| Indiana | 836 | (3.5)% | 5.1% | (17.7)% | 5.3% |
| Metro D.C. | 667 | 3.0% | 8.0% | (0.1)% | 7.7% |
| Michigan | 2,888 | 4.5% | 21.0% | (10.4)% | 20.0% |
| North Carolina | 276 | 13.0% | 1.6% | (25.5)% | 1.4% |
| Ohio - Central Ohio | 3,135 | (3.0)% | 20.4% | 0.5% | 21.0% |
| Ohio - Northeastern Ohio | 4,186 | (9.0)% | 20.5% | (2.6)% | 22.5% |
| Ohio - Northeastern - Congregate Care | 170 | 185.1% | 0.1% | (89.8)% | 0.0% |
| Ohio - Toledo, Ohio | 1,060 | (0.4)% | 6.7% | (10.5)% | 6.8% |
| Pennsylvania | 468 | (17.8)% | 2.3% | (12.0)% | 2.8% |
| Texas | 104 | (17.7)% | 0.8% | 20.4% | 0.9% |
| Total "Same Store" Market Rate | 15,828 | (0.3)% | 100.0% | (7.5)% | 100.0% |
| Associated Estates Realty Corporation "Same-Store" Market Rate Data Three and Twelve Months Ended December 31, 2003 and 2002 |
| REVENUE GROWTH | |||||
| Region | |||||
| Arizona | 204 | (2.4)% | 1.2% | (11.1)% | 1.2% |
| Florida | 1,128 | (0.5)% | 9.2% | (1.8)% | 9.1% |
| Georgia | 706 | (2.7)% | 3.9% | (6.1)% | 3.9% |
| Indiana | 836 | (4.2)% | 5.4% | 0.3% | 5.6% |
| Metro D.C. | 667 | 0.2% | 6.2% | 5.0% | 6.1% |
| Michigan | 2,888 | (2.2)% | 18.7% | (5.0)% | 18.8% |
| North Carolina | 276 | (2.6)% | 1.5% | (11.6)% | 1.5% |
| Ohio - Central Ohio | 3,135 | 1.1% | 18.8% | (3.3)% | 18.3% |
| Ohio - Northeastern Ohio | 4,186 | (2.6)% | 24.7% | 1.9% | 25.0% |
| Ohio - Northeastern - Congregate Care | 170 | (2.6)% | 1.0% | (10.7)% | 1.0% |
| Ohio - Toledo, Ohio | 1,060 | (5.1)% | 6.0% | (3.8)% | 6.2% |
| Pennsylvania | 468 | (0.3)% | 2.5% | (6.8)% | 2.5% |
| Texas | 104 | (1.2)% | 0.9% | 8.6% | 0.8% |
| Total "Same Store" Market Rate | 15,828 | (1.7)% | 100.0% | (2.1)% | 100.0% |
| EXPENSE GROWTH | |||||
| Region | |||||
| Arizona | 204 | (10.2)% | 1.2% | 18.0% | 1.4% |
| Florida | 1,128 | 9.4% | 9.5% | (4.9)% | 9.3% |
| Georgia | 706 | (4.1)% | 4.7% | 1.9% | 5.2% |
| Indiana | 836 | 15.7% | 5.7% | 9.6% | 5.3% |
| Metro D.C. | 667 | 8.7% | 4.4% | 2.0% | 4.3% |
| Michigan | 2,888 | 0.8% | 16.6% | 4.5% | 17.5% |
| North Carolina | 276 | 8.7% | 1.5% | (0.1)% | 1.5% |
| Ohio - Central Ohio | 3,135 | 6.9% | 17.2% | (1.1)% | 17.1% |
| Ohio - Northeastern Ohio | 4,186 | 7.5% | 28.5% | 2.0% | 28.2% |
| Ohio - Northeastern - Congregate Care | 170 | (2.5)% | 1.8% | 9.0% | 2.0% |
| Ohio - Toledo, Ohio | 1,060 | 7.5% | 5.2% | 5.2% | 5.2% |
| Pennsylvania | 468 | 26.4% | 2.8% | 5.0% | 2.4% |
| Texas | 104 | 10.9% | 0.9% | (3.4)% | 0.6% |
| Total "Same Store" Market Rate | 15,828 | 6.3% | 100.0% | 2.0% | 100.0% |
| NOI GROWTH | |||||
| Region | % | ||||
| Arizona | 204 | 8.3% | 1.1% | (33.4)% | 1.0% |
| Florida | 1,128 | (9.7)% | 8.9% | 1.3% | 8.9% |
| Georgia | 706 | (0.5)% | 3.0% | (17.2)% | 2.7% |
| Indiana | 836 | (20.3)% | 5.1% | (6.1)% | 5.9% |
| Metro D.C. | 667 | (4.0)% | 8.1% | 6.6% | 7.7% |
| Michigan | 2,888 | (4.6)% | 21.0% | (11.3)% | 20.1% |
| North Carolina | 276 | (12.4)% | 1.5% | (19.6)% | 1.5% |
| Ohio - Central Ohio | 3,135 | (3.6)% | 20.4% | (4.9)% | 19.3% |
| Ohio - Northeastern Ohio | 4,186 | (14.2)% | 20.7% | 1.7% | 22.0% |
| Ohio - Northeastern - Congregate Care | 170 | (3.7)% | 0.2% | (64.8)% | 0.2% |
| Ohio - Toledo, Ohio | 1,060 | (13.4)% | 6.7% | (9.0)% | 7.1% |
| Pennsylvania | 468 | (22.0)% | 2.3% | (14.6)% | 2.6% |
| Texas | 104 | (10.2)% | 1.0% | 19.8% | 1.0% |
| Total "Same Store" Market Rate | 15,828 | (8.9)% | 100.0% | (5.5)% | 100.0% |
| Associated Estates Realty Corporation "Same-Store" Market Rate Data As of December 31, 2003 and December 31, 2002 |
RENTAL
| Average | Q4 | Q4 | % | Q4 | Q4 | Q4 | Q4 | ||
| Arizona | 204 | 14 | $ 632 | $ 623 | 1.4% | 95.1% | 94.1% | 54.9% | 39.2% |
| Florida | 1,128 | 7 | 887 | 885 | 5.0% | 90.7% | 89.3% | 56.0% | 55.3% |
| Georgia | 706 | 16 | 605 | 587 | 3.1% | 96.5% | 84.6% | 37.4% | 56.1% |
| Indiana | 836 | 8 | 685 | 691 | (0.9)% | 93.7% | 90.4% | 49.3% | 54.5% |
| Metro D.C. | 667 | 17 | 1,002 | 997 | 0.5% | 94.2% | 92.7% | 56.4% | 55.8% |
| Michigan | 2,888 | 13 | 692 | 684 | 1.2% | 95.5% | 89.2% | 47.2% | 52.9% |
| North Carolina | 276 | 9 | 594 | 543 | 9.4% | 93.5% | 78.3% | 43.5% | 60.9% |
| Ohio - Central Ohio | 3,135 | 11 | 646 | 616 | 4.9% | 94.4% | 88.5% | 50.7% | 51.0% |
| Ohio - Northeastern Ohio | 4,186 | 16 | 604 | 605 | (0.2)% | 91.5% | 86.6% | 41.5% | 43.9% |
| Ohio - Northeastern - Congregate | 170 | 21 | 651 | 665 | (2.1)% | 69.4% | 65.9% | 21.2% | 11.8% |
| Ohio - Toledo, Ohio | 1,060 | 22 | 579 | 601 | (3.7)% | 87.0% | 85.3% | 32.1% | 50.2% |
| Pennsylvania | 468 | 17 | 575 | 566 | 1.6% | 88.0% | 77.4% | 47.9% | 48.7% |
| Texas | 104 | 10 | 878 | 928 | (5.4)% | 95.2% | 94.2% | 38.5% | 50.0% |
| Total/Average "Same Store" | |||||||||
| Market Rate | 15,828 | 14 | $ 670 | $ 659 | 1.7% | 92.7% | 87.4% | 45.8% | 49.9% |
(1) Represents gross potential rents less vacancies and allowances.
(2) Represents physical occupancy at the end of the quarter.
(3) Represents the number of units turned over for the period, divided by the number of units in the region, annualized.
(4) Age shown in years.
| Associated Estates Realty Corporation Debt Structure and Share Analysis as of December 31, 2003 (Dollar and share amounts in thousands) |
| FIXED RATE DEBT | |||
| Unsecured | $ 105 | 0.0% | 6.9% |
| Secured | 480,646 | 88.6% | 7.7% |
| Total fixed rate debt | 480,751 | 88.6% | 7.7% |
| VARIABLE RATE DEBT | |||
| Secured lines of credit | 5,000 | 0.9% | 2.8% |
| Secured | 57,745 | 10.5% | 4.4% |
| Total variable rate debt | 62,745 | 11.4% | 4.3% |
| TOTAL DEBT | $ 543,496 | 100.0% | 7.3% |
| Interest coverage ratio(1) | 1.57:1 | ||
| Fixed charge coverage ratio(2) | 1.39:1 | ||
| Weighted average maturity | 5.5 years |
| SCHEDULED PRINCIPAL MATURITIES | |||
| 2004(3) | $ 105 | $ 22,462 | $ 22,567 |
| 2005 | - | 28,362 | 28,362 |
| 2006 | - | 11,625 | 11,625 |
| 2007 | - | 83,333 | 83,333 |
| 2008 | - | 41,740 | 41,740 |
| Thereafter | - | 355,869 | 355,869 |
| Total | $ 105 | $ 543,391 | $ 543,496 |
| CAPITALIZED INTEREST | ||||
| Interest capitalized | $ - | $ (42) | $ (29) | $ (869) |
| INTEREST RATE SWAP | ||||
| Amortization of termination fee (4) | $ (119) | $ (119) | $ (476) | $ (476) |
| Interest rate swap expense | (233) | (195) | (896) | (442) |
| Total | $ (352) | $ (314) | $ (1,372) | $ (918) |
(1) Is calculated as EBITDA divided by interest expense, including capitalized interest and amortization of deferred financing costs.
(2) Represents interest expense and preferred stock and restricted stock dividend payment coverage.
(3) Includes the scheduled maturity on one of the Company's line of credit, the outstanding balance of which was $5.0 million at December 31, 2003.
(4) On December 11, 2000, the Company executed termination agreements for two swaps. The Company received termination payments totaling $3.2 million,
which are being amortized over the remaining terms of the swaps through 2007, at the rate of $39,693 per month or $476,317 per year.
| Associated Estates Realty Corporation Joint Venture Summary Data For the Three and Twelve Months Ended December 31, 2003 and 2002 (Unaudited, dollar amounts in thousands) |
| Balance Sheet Data | December 31, | December 31, |
| Real estate, net | $ 77,898 | $ 91,046 |
| Other assets | 3,266 | 2,077 |
| $ 81,164 | $ 93,123 | |
| Amount payable to the Company | $ 152 | $ 112 |
| Mortgage payable | 61,769 | 68,852 |
| Other liabilities | 949 | 3,238 |
| Equity | 18,294 | 20,921 |
| $ 81,164 | $ 93,123 |
| Beneficial Interest in Operations | ||||
| Revenue | $ 1,063 | $ 699 | $ 3,521 | $ 4,217 |
| Cost of operations | 594 | 481 | 2,220 | 2,927 |
| Revenue less cost of operation | 469 | 218 | 1,301 | 1,290 |
| Interest income | 1 | - | 3 | 6 |
| Interest expense | (321) | (303) | (1,267) | (1,296) |
| Depreciation - real estate assets | (295) | (247) | (975) | (895) |
| Depreciation - other | (50) | (27) | (224) | (106) |
| Amortization of deferred costs | (21) | - | (71) | - |
| Amortization of deferred financing fees | (18) | (18) | (77) | (47) |
| Discontinued Operations: | ||||
| Results of operations | (50) | (197) | (297) | (579) |
| Gain on sale of property | - | - | 450 | - |
| Net (loss) income | (285) | (574) | (1,157) | (1,627) |
| Add: | ||||
| Depreciation - real estate assets | 315 | 378 | 1,371 | 1,314 |
| Amortization of deferred costs | 21 | - | 71 | - |
| Less: | ||||
| Gain on sale of property | - | - | (450) | - |
| Funds From Operations (FFO)(1) | $ (51) | $ (196) | $ (165) | $ (313) |
| Summary of Debt | ||||
| Lakeshore Village (50.0% Affordable Housing) | 108 | $ 3,786 | $ 1,893 | 11/1/2023 |
| Idlewylde Phase I (49.0% Market Rate) | 308 | 16,836 | 8,250 | 5/31/2005 |
| Idlewylde Phase II (49.0% Market Rate)(2) | 535 | 25,527 | 12,508 | 12/10/2005 |
| Courtney Chase (24.0% Market Rate) (3) | 288 | 15,620 | 3,755 | 6/1/2005 |
| Total joint venture debt | 1,239 | $ 61,769 | $ 26,406 |
(1) The Company defines FFO as the inclusion of all operating results, both recurring and non-recurring, except those results defined as "extraordinary items" under GAAP, adjusted for depreciation on real estate assets and amortization of intangible assets and gains and losses from the disposition of properties and land. FFO does not represent cash generated from operating activities in accordance with GAAP and is not necessarily indicative of cash available to fund cash needs and should not be considered an alternative to net income as an indicator of the Company's operating performance or as an alternative to cash flow as a measure of liquidity. The Company generally considers FFO to be a useful measure for reviewing the comparative operating and financial performance of the Company because FFO can help one compare the operating performance of a company's real estate between periods or as compared to different REITs. It should be noted, however, that certain other real estate companies may define FFO in a different manner.
(2) The Company has guaranteed the payment of the total loan which is for a maximum of $26.0 million.
(3) The Company has guaranteed the payment of the total loan which is for a maximum of $15.8 million.