UNITED STATES
SECURITIES AND EXCHANGE COMMISSION
Washington, D.C. 20549
FORM N-CSR
CERTIFIED SHAREHOLDER REPORT OF
REGISTERED MANAGEMENT INVESTMENT COMPANIES
Investment Company Act file number 811-7992
MFS SERIES TRUST XI
(Exact name of registrant as specified in charter)
500 Boylston Street, Boston, Massachusetts 02116
(Address of principal executive offices) (Zip code)
Susan S. Newton
Massachusetts Financial Services Company
500 Boylston Street
Boston, Massachusetts 02116
(Name and address of agents for service)
Registrant’s telephone number, including area code: (617) 954-5000
Date of fiscal year end: September 30
Date of reporting period: September 30, 2011
| ITEM 1. | REPORTS TO STOCKHOLDERS. |

MFS® Mid Cap Value Fund

ANNUAL REPORT
September 30, 2011
MDV-ANN
MFS® MID CAP VALUE FUND
SIPC Contact Information: You may obtain information about the Securities Investor Protection Corporation (“SIPC”), including the SIPC Brochure, by contacting SIPC either by telephone (1-202-371-8300) or by accessing SIPC’s web site address (www.sipc.org).
The report is prepared for the general information of shareholders. It is authorized for distribution to prospective investors only when preceded or accompanied by a current prospectus.
NOT FDIC INSURED Ÿ MAY LOSE VALUE Ÿ NO BANK GUARANTEE

LETTER FROM THE CEO
Dear Shareholders:
We are indeed living through some volatile times. Economic uncertainty is everywhere, as it seems no place in the world has been unmoved by crisis this year. We have seen a devastating earthquake and tsunami that have led to disruptions in the Japanese markets and supply chains. Protests have changed the face of the Middle East and left in their wake lingering tensions and resultant higher oil prices. We have seen debt limits tested in Europe and the United States and policymakers grappling to craft often unpopular monetary and fiscal responses at a time when consumers and businesses struggle with what appears to be a slowing global economy. On top of all of that, we have seen long-term U.S. debt lose its Standard & Poor’s AAA rating.
When markets become volatile, managing risk becomes a top priority for investors and their advisors. At MFS® risk management is foremost in our minds in all market climates. Our analysts and portfolio managers keep risks firmly in mind when evaluating securities. Additionally, we have a team of quantitative analysts that measures and assesses the risk profiles of our portfolios and securities on an ongoing basis. The chief investment risk officer, who oversees the team, reports directly to the firm’s president and chief investment officer so the risk associated with each portfolio can be assessed objectively and independently of the portfolio management team.
As always, we continue to be mindful of the many economic challenges faced at the local, national, and international levels. It is in times such as these that we want to remind investors of the merits of maintaining a long-term view, adhering to basic investing principles such as asset allocation and diversification, and working closely with their advisors to research and identify appropriate investment opportunities.
Respectfully,

Robert J. Manning
Chairman and Chief Executive Officer
MFS Investment Management®
November 15, 2011
The opinions expressed in this letter are subject to change, may not be relied upon for investment advice, and no forecasts can be guaranteed.
1
PORTFOLIO COMPOSITION
Portfolio structure

| | | | |
| Top ten holdings | | | | |
| NVR, Inc. | | | 1.6% | |
| Allied World Assurance Co. | | | 1.5% | |
| Aon Corp. | | | 1.4% | |
| AGL Resources, Inc. | | | 1.4% | |
| CMS Energy Corp. | | | 1.2% | |
| Entertainment Properties Trust, REIT | | | 1.2% | |
| Celanese Corp. | | | 1.2% | |
| Check Point Software Technologies Ltd. | | | 1.1% | |
| J.M. Smucker Co. | | | 1.1% | |
| QEP Resources, Inc. | | | 1.1% | |
| | | | |
| Equity sectors | | | | |
| Financial Services | | | 21.4% | |
| Utilities & Communications | | | 12.0% | |
| Energy | | | 8.4% | |
| Consumer Staples | | | 8.0% | |
| Basic Materials | | | 7.9% | |
| Leisure | | | 7.1% | |
| Autos & Housing | | | 6.6% | |
| Health Care | | | 6.4% | |
| Technology | | | 5.6% | |
| Industrial Goods & Services | | | 5.6% | |
| Retailing | | | 5.5% | |
| Special Products & Services | | | 1.8% | |
| Transportation | | | 1.3% | |
Percentages are based on net assets as of 9/30/11.
The portfolio is actively managed and current holdings may be different.
2
MANAGEMENT REVIEW
Summary of Results
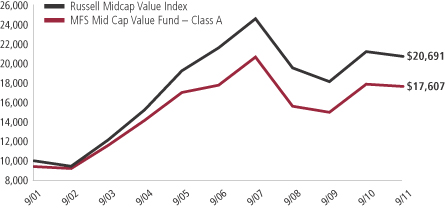
For the twelve months ended September 30, 2011, Class A shares of the MFS Mid Cap Value Fund (the “fund”) provided a total return of –1.31%, at net asset value. This compares with a return of –2.36% for the fund’s benchmark, the Russell Midcap Value Index.
Market Environment
Early in the period, the U.S. Federal Reserve (the Fed) indicated that further monetary loosening would be forthcoming if macroeconomic activity did not show signs of improvement. The prospects for, and subsequent implementation of, more easing by the Fed improved market sentiment and drove risk-asset prices markedly higher. The December agreement on a surprisingly large (relative to expectations) expansionary U.S. fiscal package also boosted sentiment. During the subsequent several months, the renewed positive market sentiment, coupled with better indications of global macroeconomic activity, pushed many asset valuations to post-crisis highs. At the same time, global sovereign bond yields rose amidst the more “risk-seeking” environment.
However, towards the middle of the period, a weakening macroeconomic backdrop and renewed concerns over Greek debt sustainability began to challenge equity valuations and pushed sovereign bond yields lower. Towards the end of the reporting period, uncertainty in financial markets continued to increase. European policy makers debated and disagreed over elements of a new Greek bailout package, while Spanish and Italian bond yields increased markedly signaling a widening European crisis. In the U.S., concerns about sovereign debt default and the long term sustainability of the trend in U.S. fiscal policy resulted in one agency downgrading U.S. credit quality. Amidst this turmoil, global equity markets declined sharply. As a result of these developments, global consumer and producer sentiment indicators fell precipitously, highly-rated sovereign bond yields hit multi-decade lows and, despite a more mixed picture emanating from the “hard” data, markets grew increasingly worried about a return to global recession.
Contributors to Performance
Stock selection in the industrial goods & services sector was a positive factor contributing to the fund’s performance relative to the Russell Midcap Value Index. Within this sector, an overweight allocation to Goodrich (h) aided relative performance as the aerospace components and systems supplier outperformed the broad market. Shares of the company surged at the end of the period when
it was announced that United Technologies had placed a bid to acquire Goodrich at a premium.
3
Management Review – continued
In the financial services sector, a combination of stock selection and an underweight allocation benefited relative results. Here, the fund’s avoidance of banking services provider Regions Financial (h), and an overweight position in strong-performing credit card company Discover Financial Services, strengthened relative performance.
Stock selection in the retailing and energy sectors contributed to relative performance. Within these sectors, the fund’s holdings of beauty supplies retailer Sally Beauty Holdings, discount retailer Dollar General (b), integrated energy company EQT, and fuel refiner CVR Energy (b) were among the fund’s top relative contributors for the reporting period. Shares of EQT appreciated, in part, due to the company’s announcement of a better-than-expected sale price of its Big Sandy pipeline and the use of part of the proceeds from the sale to increase production output.
Elsewhere, the fund’s ownership of containers manufacturer Graham Packaging (b)(h) and Israeli-headquartered security software provider Check Point Software Technologies (b), as well as an overweight allocation to strong-performing natural gas supplier AGL Resources, also benefited relative performance.
Detractors from Performance
An underweight allocation to the utilities & communications sector hindered relative performance as this sector outperformed the broad market over the reporting period.
Stock selection in the consumer staples, leisure, and health care sectors held back relative results. Within the consumer staples sector, the fund’s overweight position in housewares and specialty products provider Newell Rubbermaid weakened relative performance. Holdings of cosmetics and beauty supply company Avon Products (b), and not holding shares of strong-performing tobacco company Lorillard (h), also dampened relative returns.
Within the leisure and health care sectors, holdings of toy maker Hasbro (b), and not owning shares of health care provider Humana (h), detracted from relative performance.
Within other sectors, the fund’s overweight allocation to banking firm TCF Financial, property and casualty insurance firm Aspen Insurance (h), and communications equipment provider Tellabs (h) were among the top relative detractors for the reporting period. Shares of TCF Financial depreciated as the company announced 2011 second quarter earnings that were lower than expectations. The company reported lower fee income, primarily driven by leasing fees, as well as lower-than-expected outstanding loan balances. Not
4
Management Review – continued
holding shares of mobile phone maker Motorola Mobility (h) and apparel retailer VF (h) also hindered relative results.
Respectfully,
| | |
| Kevin Schmitz | | Brooks Taylor |
| Portfolio Manager | | Portfolio Manager |
| (b) | Security is not a benchmark constituent. |
| (h) | Security was not held in the portfolio at period end. |
The views expressed in this report are those of the portfolio managers only through the end of the period of the report as stated on the cover and do not necessarily reflect the views of MFS or any other person in the MFS organization. These views are subject to change at any time based on market or other conditions, and MFS disclaims any responsibility to update such views. These views may not be relied upon as investment advice or an indication of trading intent on behalf of any MFS portfolio. References to specific securities are not recommendations of such securities, and may not be representative of any MFS portfolio’s current or future investments.
5
PERFORMANCE SUMMARY THROUGH 9/30/11
The following chart illustrates a representative class of the fund’s historical performance in comparison to its benchmark(s). Performance results include the deduction of the maximum applicable sales charge and reflect the percentage change in net asset value, including reinvestment of dividends and capital gains distributions. The performance of other share classes will be greater than or less than that of the class depicted below. Benchmarks are unmanaged and may not be invested in directly. Benchmark returns do not reflect sales charges, commissions or expenses. (See Notes to Performance Summary.)
Performance data shown represents past performance and is no guarantee of future results. Investment return and principal value fluctuate so your shares, when sold, may be worth more or less than the original cost; current performance may be lower or higher than quoted. The performance shown does not reflect the deduction of taxes, if any, that a shareholder would pay on fund distributions or the redemption of fund shares.
Growth of a Hypothetical $10,000 Investment
6
Performance Summary – continued
Total Returns through 9/30/11
Average annual without sales charge
| | | | | | | | | | | | | | |
| | | Share class | | Class inception date | | 1-yr | | 5-yr | | 10-yr | | Life (t) | | |
| | | A | | 8/31/01 | | (1.31)% | | (0.18)% | | 6.45% | | N/A | | |
| | | B | | 11/01/01 | | (2.05)% | | (0.89)% | | N/A | | 5.21% | | |
| | | C | | 11/01/01 | | (2.05)% | | (0.87)% | | N/A | | 5.22% | | |
| | | I | | 11/01/01 | | (1.07)% | | 0.11% | | N/A | | 6.26% | | |
| | | R1 | | 4/01/05 | | (2.07)% | | (0.91)% | | N/A | | 1.05% | | |
| | | R2 | | 10/31/03 | | (1.64)% | | (0.41)% | | N/A | | 4.35% | | |
| | | R3 | | 4/01/05 | | (1.29)% | | (0.16)% | | N/A | | 1.80% | | |
| | | R4 | | 4/01/05 | | (1.08)% | | 0.09% | | N/A | | 2.07% | | |
| | | 529A | | 7/31/02 | | (1.47)% | | (0.34)% | | N/A | | 6.17% | | |
| | | 529B | | 7/31/02 | | (2.19)% | | (1.02)% | | N/A | | 5.46% | | |
| | | 529C | | 7/31/02 | | (2.09)% | | (1.00)% | | N/A | | 5.49% | | |
| Comparative benchmark | | | | | | | | | | |
| | | Russell Midcap Value Index (f) | | (2.36)% | | (0.84)% | | 7.54% | | N/A | | |
| Average annual with sales charge | | | | | | | | | | |
| | | A
With Initial Sales Charge (5.75%) | | (6.98)% | | (1.35)% | | 5.82% | | N/A | | |
| | | B
With CDSC (Declining over six years from 4% to 0%) (x) | | (5.97)% | | (1.24)% | | N/A | | 5.21% | | |
| | | C
With CDSC (1% for 12 months) (x) | | (3.03)% | | (0.87)% | | N/A | | 5.22% | | |
| | | 529A
With Initial Sales Charge (5.75%) | | (7.13)% | | (1.52)% | | N/A | | 5.49% | | |
| | | 529B
With CDSC (Declining over six years from 4% to 0%) (x) | | (6.10)% | | (1.37)% | | N/A | | 5.46% | | |
| | | 529C
With CDSC (1% for 12 months) (x) | | (3.07)% | | (1.00)% | | N/A | | 5.49% | | |
Class I, R1, R2, R3, and R4 shares do not have a sales charge.
CDSC – Contingent Deferred Sales Charge.
| (f) | Source: FactSet Research Systems Inc. |
| (t) | For the period from the class inception date through the stated period end (for those share classes with less than 10 years of performance history). No comparative benchmark performance information is provided for “life” periods. (See Notes to Performance Summary.) |
| (x) | Assuming redemption at the end of the applicable period. |
7
Performance Summary – continued
Benchmark Definition
Russell Midcap Value Index – constructed to provide a comprehensive barometer for value securities in the mid-cap segment of the U.S. equity universe. Companies in this index generally have lower price-to-book ratios and lower forecasted growth values.
It is not possible to invest directly in an index.
Notes to Performance Summary
Class 529 shares are only available in conjunction with qualified tuition programs, such as the MFS 529 Savings Plan. There also is an additional fee, which is detailed in the program description, on qualified tuition programs. If this fee was reflected, the performance for Class 529 shares would have been lower. This annual fee is waived for Oregon residents and for those accounts with assets of $25,000 or more.
Average annual total return represents the average annual change in value for each share class for the periods presented. Life returns are presented where the share class has less than 10 years of performance history and represent the average annual total return from the class inception date to the stated period end date. As the fund’s share classes may have different inception dates, the life returns may represent different time periods and may not be comparable. As a result, no comparative benchmark performance information is provided for life periods.
Performance results reflect any applicable expense subsidies and waivers in effect during the periods shown. Without such subsidies and waivers the fund’s performance results would be less favorable. Please see the prospectus and financial statements for complete details.
Performance results do not include adjustments made for financial reporting purposes in accordance with U.S. generally accepted accounting principles and may differ from amounts reported in the financial highlights.
From time to time the fund may receive proceeds from litigation settlements, without which performance would be lower.
8
EXPENSE TABLE
Fund expenses borne by the shareholders during the period,
April 1, 2011 through September 30, 2011
As a shareholder of the fund, you incur two types of costs: (1) transaction costs, including sales charges (loads) on certain purchase or redemption payments, and (2) ongoing costs, including management fees; distribution and service (12b-1) fees; and other fund expenses. This example is intended to help you understand your ongoing costs (in dollars) of investing in the fund and to compare these costs with the ongoing costs of investing in other mutual funds.
The example is based on an investment of $1,000 invested at the beginning of the period and held for the entire period April 1, 2011 through September 30, 2011.
The expenses include the payment of a portion of the transfer-agent-related expenses of MFS funds that invest in the fund. For further information, please see the Notes to the Financial Statements.
Actual Expenses
The first line for each share class in the following table provides information about actual account values and actual expenses. You may use the information in this line, together with the amount you invested, to estimate the expenses that you paid over the period. Simply divide your account value by $1,000 (for example, an $8,600 account value divided by $1,000 = 8.6), then multiply the result by the number in the first line under the heading entitled “Expenses Paid During Period” to estimate the expenses you paid on your account during this period.
Hypothetical Example for Comparison Purposes
The second line for each share class in the following table provides information about hypothetical account values and hypothetical expenses based on the fund’s actual expense ratio and an assumed rate of return of 5% per year before expenses, which is not the fund’s actual return. The hypothetical account values and expenses may not be used to estimate the actual ending account balance or expenses you paid for the period. You may use this information to compare the ongoing costs of investing in the fund and other funds. To do so, compare this 5% hypothetical example with the 5% hypothetical examples that appear in the shareholder reports of the other funds.
Please note that the expenses shown in the table are meant to highlight your ongoing costs only and do not reflect any transactional costs, such as sales charges (loads). Therefore, the second line for each share class in the table is useful in comparing ongoing costs only, and will not help you determine the relative total costs of owning different funds. In addition, if these transactional costs were included, your costs would have been higher.
9
Expense Table – continued
| | | | | | | | | | | | | | | | | | |
Share
Class | | | | Annualized
Expense
Ratio | | | Beginning
Account Value
4/01/11 | | | Ending
Account Value
9/30/11 | | | Expenses
Paid During
Period (p)
4/01/11-9/30/11 | |
| A | | Actual | | | 1.23% | | | | $1,000.00 | | | | $811.66 | | | | $5.59 | |
| | Hypothetical (h) | | | 1.23% | | | | $1,000.00 | | | | $1,018.90 | | | | $6.23 | |
| B | | Actual | | | 1.98% | | | | $1,000.00 | | | | $808.23 | | | | $8.98 | |
| | Hypothetical (h) | | | 1.98% | | | | $1,000.00 | | | | $1,015.14 | | | | $10.00 | |
| C | | Actual | | | 1.98% | | | | $1,000.00 | | | | $808.68 | | | | $8.98 | |
| | Hypothetical (h) | | | 1.98% | | | | $1,000.00 | | | | $1,015.14 | | | | $10.00 | |
| I | | Actual | | | 0.98% | | | | $1,000.00 | | | | $812.28 | | | | $4.45 | |
| | Hypothetical (h) | | | 0.98% | | | | $1,000.00 | | | | $1,020.16 | | | | $4.96 | |
| R1 | | Actual | | | 1.98% | | | | $1,000.00 | | | | $808.04 | | | | $8.97 | |
| | Hypothetical (h) | | | 1.98% | | | | $1,000.00 | | | | $1,015.14 | | | | $10.00 | |
| R2 | | Actual | | | 1.48% | | | | $1,000.00 | | | | $810.42 | | | | $6.72 | |
| | Hypothetical (h) | | | 1.48% | | | | $1,000.00 | | | | $1,017.65 | | | | $7.49 | |
| R3 | | Actual | | | 1.24% | | | | $1,000.00 | | | | $811.66 | | | | $5.63 | |
| | Hypothetical (h) | | | 1.24% | | | | $1,000.00 | | | | $1,018.85 | | | | $6.28 | |
| R4 | | Actual | | | 0.98% | | | | $1,000.00 | | | | $812.77 | | | | $4.45 | |
| | Hypothetical (h) | | | 0.98% | | | | $1,000.00 | | | | $1,020.16 | | | | $4.96 | |
| 529A | | Actual | | | 1.31% | | | | $1,000.00 | | | | $810.66 | | | | $5.95 | |
| | Hypothetical (h) | | | 1.31% | | | | $1,000.00 | | | | $1,018.50 | | | | $6.63 | |
| 529B | | Actual | | | 2.06% | | | | $1,000.00 | | | | $808.13 | | | | $9.34 | |
| | Hypothetical (h) | | | 2.06% | | | | $1,000.00 | | | | $1,014.74 | | | | $10.40 | |
| 529C | | Actual | | | 2.06% | | | | $1,000.00 | | | | $808.24 | | | | $9.34 | |
| | Hypothetical (h) | | | 2.06% | | | | $1,000.00 | | | | $1,014.74 | | | | $10.40 | |
| (h) | 5% class return per year before expenses. |
| (p) | Expenses paid is equal to each class’ annualized expense ratio, as shown above, multiplied by the average account value over the period, multiplied by the number of days in the period, divided by the number of days in the year. Expenses paid do not include any applicable sales charges (loads). If these transaction costs had been included, your costs would have been higher. |
Expense Changes Impacting the Table
Changes to the fund’s fee arrangements occurred during the six month period. Had these fee changes been in effect throughout the entire six month period, the annualized expense ratios would have been 1.28%, 2.03%, and 2.03% for Classes 529A, 529B, and 529C, respectively; the actual expenses paid during the period would have been approximately $5.81, $9.20, and $9.20 for Classes 529A, 529B, and 529C respectively; and the hypothetical expenses paid during the period would have been approximately $6.48, $10.25, and $10.25 for Classes 529A, 529B, and 529C, respectively. For further information about the fund’s fee arrangements and changes to those fee arrangements, please see Note 3 in the Notes to Financial Statements.
10
PORTFOLIO OF INVESTMENTS
9/30/11
The Portfolio of Investments is a complete list of all securities owned by your fund. It is categorized by broad-based asset classes.
| | | | | | | | |
| Common Stocks - 96.6% | | | | | | | | |
| Issuer | | Shares/Par | | | Value ($) | |
| | | | | | | | |
| Aerospace - 0.9% | | | | | | | | |
| Precision Castparts Corp. | | | 45,795 | | | $ | 7,119,291 | |
| | |
| Airlines - 0.4% | | | | | | | | |
| United Continental Holdings, Inc. (a) | | | 144,870 | | | $ | 2,807,581 | |
| | |
| Apparel Manufacturers - 1.5% | | | | | | | | |
| Hanesbrands, Inc. (a) | | | 288,458 | | | $ | 7,214,335 | |
| PVH Corp. | | | 42,802 | | | | 2,492,788 | |
| Jones Group, Inc. | | | 172,708 | | | | 1,590,641 | |
| | | | | | | | |
| | | | | | | $ | 11,297,764 | |
| Automotive - 1.2% | | | | | | | | |
| Johnson Controls, Inc. | | | 104,187 | | | $ | 2,747,411 | |
| Lear Corp. | | | 147,810 | | | | 6,341,049 | |
| | | | | | | | |
| | | | | | | $ | 9,088,460 | |
| Broadcasting - 1.8% | | | | | | | | |
| CBS Corp., “B” | | | 247,802 | | | $ | 5,050,205 | |
| Interpublic Group of Cos., Inc. | | | 687,707 | | | | 4,951,490 | |
| Nielsen Holdings B.V. (a) | | | 129,239 | | | | 3,370,553 | |
| | | | | | | | |
| | | | | | | $ | 13,372,248 | |
| Brokerage & Asset Managers - 2.6% | | | | | | | | |
| Affiliated Managers Group, Inc. (a) | | | 87,676 | | | $ | 6,843,112 | |
| Evercore Partners, Inc. | | | 110,000 | | | | 2,508,000 | |
| GFI Group, Inc. | | | 1,046,442 | | | | 4,206,697 | |
| TD AMERITRADE Holding Corp. | | | 346,913 | | | | 5,101,356 | |
| Walter Investment Management Corp. | | | 65,700 | | | | 1,506,501 | |
| | | | | | | | |
| | | | | | | $ | 20,165,666 | |
| Business Services - 1.2% | | | | | | | | |
| Dun & Bradstreet Corp. | | | 98,987 | | | $ | 6,063,944 | |
| Towers Watson & Co. | | | 46,590 | �� | | | 2,785,150 | |
| | | | | | | | |
| | | | | | | $ | 8,849,094 | |
| Cable TV - 1.3% | | | | | | | | |
| Charter Communications, Inc., “A” (a) | | | 115,331 | | | $ | 5,402,104 | |
| Dish Network Corp., “A” (a) | | | 176,089 | | | | 4,412,790 | |
| | | | | | | | |
| | | | | | | $ | 9,814,894 | |
11
Portfolio of Investments – continued
| | | | | | | | |
| Issuer | | Shares/Par | | | Value ($) | |
| | | | | | | | |
| Common Stocks - continued | | | | | | | | |
| Chemicals - 1.2% | | | | | | | | |
| Celanese Corp. | | | 273,720 | | | $ | 8,904,112 | |
| | |
| Computer Software - 2.7% | | | | | | | | |
| Check Point Software Technologies Ltd. (a) | | | 165,331 | | | $ | 8,722,864 | |
| Compuware Corp. (a) | | | 283,637 | | | | 2,172,659 | |
| Fair Isaac Corp. | | | 190,109 | | | | 4,150,079 | |
| Symantec Corp. (a) | | | 351,715 | | | | 5,732,954 | |
| | | | | | | | |
| | | | | | | $ | 20,778,556 | |
| Computer Software - Systems - 0.8% | | | | | | | | |
| Xerox Corp. | | | 841,950 | | | $ | 5,868,392 | |
| | |
| Construction - 5.0% | | | | | | | | |
| Beacon Roofing Supply, Inc. (a) | | | 186,529 | | | $ | 2,982,599 | |
| Lennox International, Inc. | | | 112,066 | | | | 2,889,061 | |
| NVR, Inc. (a) | | | 20,690 | | | | 12,496,346 | |
| Owens Corning (a) | | | 214,051 | | | | 4,640,626 | |
| Sherwin-Williams Co. | | | 101,258 | | | | 7,525,495 | |
| Stanley Black & Decker, Inc. | | | 162,109 | | | | 7,959,552 | |
| | | | | | | | |
| | | | | | | $ | 38,493,679 | |
| Consumer Products - 3.1% | | | | | | | | |
| Avon Products, Inc. | | | 284,992 | | | $ | 5,585,843 | |
| Energizer Holdings, Inc. (a) | | | 88,864 | | | | 5,904,124 | |
| International Flavors & Fragrances, Inc. | | | 56,735 | | | | 3,189,642 | |
| Newell Rubbermaid, Inc. | | | 558,492 | | | | 6,629,300 | |
| Prestige Brands Holdings, Inc. (a) | | | 288,406 | | | | 2,610,074 | |
| | | | | | | | |
| | | | | | | $ | 23,918,983 | |
| Consumer Services - 0.6% | | | | | | | | |
| H&R Block, Inc. | | | 345,402 | | | $ | 4,597,301 | |
| | |
| Containers - 2.1% | | | | | | | | |
| Ball Corp. | | | 165,043 | | | $ | 5,119,634 | |
| Greif, Inc. | | | 98,700 | | | | 4,233,243 | |
| Owens-Illinois, Inc. (a) | | | 171,015 | | | | 2,585,747 | |
| Silgan Holdings, Inc. | | | 115,090 | | | | 4,228,407 | |
| | | | | | | | |
| | | | | | | $ | 16,167,031 | |
| Electrical Equipment - 1.7% | | | | | | | | |
| Amphenol Corp., “A” | | | 91,380 | | | $ | 3,725,563 | |
| Sensata Technologies Holding B.V. (a) | | | 108,730 | | | | 2,876,996 | |
| Tyco International Ltd. | | | 146,600 | | | | 5,973,950 | |
| | | | | | | | |
| | | | | | | $ | 12,576,509 | |
12
Portfolio of Investments – continued
| | | | | | | | |
| Issuer | | Shares/Par | | | Value ($) | |
| | | | | | | | |
| Common Stocks - continued | | | | | | | | |
| Electronics - 1.8% | | | | | | | | |
| Advanced Micro Devices, Inc. (a) | | | 336,524 | | | $ | 1,709,542 | |
| ASM International N.V. | | | 64,034 | | | | 1,591,901 | |
| Microchip Technology, Inc. | | | 205,686 | | | | 6,398,891 | |
| Semtech Corp. (a) | | | 67,119 | | | | 1,416,211 | |
| Teradyne, Inc. (a) | | | 262,514 | | | | 2,890,279 | |
| | | | | | | | |
| | | | | | | $ | 14,006,824 | |
| Energy - Independent - 4.5% | | | | | | | | |
| Berry Petroleum Corp. | | | 71,822 | | | $ | 2,541,062 | |
| Cabot Oil & Gas Corp. | | | 60,053 | | | | 3,717,881 | |
| Celtic Exploration Ltd. (a) | | | 136,660 | | | | 2,943,426 | |
| CONSOL Energy, Inc. | | | 110,116 | | | | 3,736,236 | |
| CVR Energy, Inc. (a) | | | 209,330 | | | | 4,425,236 | |
| Energy XXI (Bermuda) Ltd. (a) | | | 126,722 | | | | 2,718,187 | |
| EXCO Resources, Inc. | | | 165,760 | | | | 1,776,947 | |
| LyondellBasell Industries N.V., “A” | | | 87,650 | | | | 2,141,289 | |
| Newfield Exploration Co. (a) | | | 114,943 | | | | 4,562,088 | |
| Noble Energy, Inc. | | | 82,089 | | | | 5,811,901 | |
| | | | | | | | |
| | | | | | | $ | 34,374,253 | |
| Energy - Integrated - 2.1% | | | | | | | | |
| EQT Corp. | | | 140,240 | | | $ | 7,483,206 | |
| QEP Resources, Inc. | | | 307,144 | | | | 8,314,388 | |
| | | | | | | | |
| | | | | | | $ | 15,797,594 | |
| Engineering - Construction - 0.8% | | | | | | | | |
| Fluor Corp. | | | 127,906 | | | $ | 5,954,024 | |
| | |
| Food & Beverages - 4.0% | | | | | | | | |
| Bunge Ltd. | | | 112,930 | | | $ | 6,582,690 | |
| Coca-Cola Enterprises, Inc. | | | 187,240 | | | | 4,658,531 | |
| Corn Products International, Inc. | | | 67,310 | | | | 2,641,244 | |
| J.M. Smucker Co. | | | 114,629 | | | | 8,355,308 | |
| McCormick & Co., Inc. | | | 69,234 | | | | 3,195,841 | |
| Mead Johnson Nutrition Co., “A” | | | 77,549 | | | | 5,337,698 | |
| | | | | | | | |
| | | | | | | $ | 30,771,312 | |
| Food & Drug Stores - 0.3% | | | | | | | | |
| METRO, Inc., “A” | | | 46,050 | | | $ | 2,013,561 | |
| | |
| Gaming & Lodging - 1.2% | | | | | | | | |
| Ameristar Casinos, Inc. | | | 158,807 | | | $ | 2,548,852 | |
| Pinnacle Entertainment, Inc. (a) | | | 140,273 | | | | 1,273,679 | |
13
Portfolio of Investments – continued
| | | | | | | | |
| Issuer | | Shares/Par | | | Value ($) | |
| | | | | | | | |
| Common Stocks - continued | | | | | | | | |
| Gaming & Lodging - continued | | | | | | | | |
| Royal Caribbean Cruises Ltd. | | | 89,477 | | | $ | 1,936,282 | |
| Whistler Blackcomb Holdings, Inc. | | | 23,440 | | | | 234,199 | |
| Whistler Blackcomb Holdings, Inc. (z) | | | 28,400 | | | | 283,756 | |
| WMS Industries, Inc. (a) | | | 149,131 | | | | 2,623,214 | |
| | | | | | | | |
| | | | | | | $ | 8,899,982 | |
| General Merchandise - 0.9% | | | | | | | | |
| Dollar General Corp. (a) | | | 177,266 | | | $ | 6,693,564 | |
| | |
| Insurance - 7.7% | | | | | | | | |
| Allied World Assurance Co. | | | 215,582 | | | $ | 11,578,909 | |
| Aon Corp. | | | 258,769 | | | | 10,863,123 | |
| Everest Re Group Ltd. | | | 77,216 | | | | 6,129,406 | |
| Genworth Financial, Inc. (a) | | | 381,653 | | | | 2,190,688 | |
| Hanover Insurance Group, Inc. | | | 112,876 | | | | 4,007,098 | |
| Hartford Financial Services Group, Inc. | | | 376,304 | | | | 6,073,547 | |
| Prudential Financial, Inc. | | | 76,329 | | | | 3,576,777 | |
| Symetra Financial Corp. | | | 303,193 | | | | 2,471,023 | |
| Unum Group | | | 261,854 | | | | 5,488,460 | |
| Willis Group Holdings PLC | | | 180,296 | | | | 6,196,774 | |
| | | | | | | | |
| | | | | | | $ | 58,575,805 | |
| Leisure & Toys - 2.1% | | | | | | | | |
| Activision Blizzard, Inc. | | | 214,560 | | | $ | 2,553,264 | |
| Hasbro, Inc. | | | 251,862 | | | | 8,213,220 | |
| Mattel, Inc. | | | 206,210 | | | | 5,338,777 | |
| | | | | | | | |
| | | | | | | $ | 16,105,261 | |
| Machinery & Tools - 1.6% | | | | | | | | |
| Charter International PLC | | | 352,230 | | | $ | 4,729,726 | |
| Cummins, Inc. | | | 47,073 | | | | 3,843,981 | |
| United Rentals, Inc. (a) | | | 80,403 | | | | 1,353,987 | |
| WABCO Holdings, Inc. (a) | | | 63,050 | | | | 2,387,073 | |
| | | | | | | | |
| | | | | | | $ | 12,314,767 | |
| Major Banks - 1.1% | | | | | | | | |
| Comerica, Inc. | | | 186,937 | | | $ | 4,293,943 | |
| KeyCorp | | | 642,603 | | | | 3,810,636 | |
| | | | | | | | |
| | | | | | | $ | 8,104,579 | |
| Medical & Health Technology & Services - 3.5% | | | | | | | | |
| AmerisourceBergen Corp. | | | 122,098 | | | $ | 4,550,592 | |
| Cross Country Healthcare, Inc. (a) | | | 247,261 | | | | 1,033,551 | |
14
Portfolio of Investments – continued
| | | | | | | | |
| Issuer | | Shares/Par | | | Value ($) | |
| | | | | | | | |
| Common Stocks - continued | | | | | | | | |
| Medical & Health Technology & Services - continued | | | | | | | | |
| LifePoint Hospitals, Inc. (a) | | | 128,249 | | | $ | 4,699,043 | |
| Lincare Holdings, Inc. | | | 96,106 | | | | 2,162,385 | |
| Patterson Cos., Inc. | | | 109,084 | | | | 3,123,075 | |
| Quest Diagnostics, Inc. | | | 45,873 | | | | 2,264,291 | |
| Teleflex, Inc. | | | 88,753 | | | | 4,772,249 | |
| Vanguard Health Systems, Inc. (a) | | | 207,429 | | | | 2,107,479 | |
| VCA Antech, Inc. (a) | | | 141,799 | | | | 2,265,948 | |
| | | | | | | | |
| | | | | | | $ | 26,978,613 | |
| Medical Equipment - 2.4% | | | | | | | | |
| CareFusion Corp. (a) | | | 130,960 | | | $ | 3,136,492 | |
| Covidien PLC | | | 100,490 | | | | 4,431,609 | |
| DENTSPLY International, Inc. | | | 159,274 | | | | 4,888,119 | |
| Pall Corp. | | | 34,413 | | | | 1,459,111 | |
| PerkinElmer, Inc. | | | 246,855 | | | | 4,742,085 | |
| | | | | | | | |
| | | | | | | $ | 18,657,416 | |
| Metals & Mining - 0.5% | | | | | | | | |
| Cliffs Natural Resources, Inc. | | | 75,894 | | | $ | 3,883,496 | |
| | |
| Natural Gas - Distribution - 3.0% | | | | | | | | |
| AGL Resources, Inc. | | | 265,374 | | | $ | 10,811,337 | |
| NorthWestern Corp. | | | 128,078 | | | | 4,090,811 | |
| Spectra Energy Corp. | | | 169,209 | | | | 4,150,697 | |
| Vectren Corp. | | | 131,530 | | | | 3,561,832 | |
| | | | | | | | |
| | | | | | | $ | 22,614,677 | |
| Network & Telecom - 0.3% | | | | | | | | |
| Finisar Corp. (a) | | | 61,046 | | | $ | 1,070,747 | |
| Fortinet, Inc. (a) | | | 87,300 | | | | 1,466,640 | |
| | | | | | | | |
| | | | | | | $ | 2,537,387 | |
| Oil Services - 1.8% | | | | | | | | |
| Cameron International Corp. (a) | | | 63,964 | | | $ | 2,657,065 | |
| Dresser-Rand Group, Inc. (a) | | | 144,768 | | | | 5,867,447 | |
| Ensco International PLC, ADR | | | 134,730 | | | | 5,447,134 | |
| | | | | | | | |
| | | | | | | $ | 13,971,646 | |
| Other Banks & Diversified Financials - 6.1% | | | | | | | | |
| Brookline Bancorp, Inc. | | | 753,612 | | | $ | 5,810,349 | |
| CapitalSource, Inc. | | | 460,120 | | | | 2,825,137 | |
| CIT Group, Inc. (a) | | | 121,445 | | | | 3,688,285 | |
| Discover Financial Services | | | 307,010 | | | | 7,042,809 | |
| Fifth Third Bancorp | | | 483,980 | | | | 4,888,198 | |
15
Portfolio of Investments – continued
| | | | | | | | |
| Issuer | | Shares/Par | | | Value ($) | |
| | | | | | | | |
| Common Stocks - continued | | | | | | | | |
| Other Banks & Diversified Financials - continued | | | | | | | | |
| First Republic Bank (a) | | | 165,570 | | | $ | 3,834,601 | |
| People’s United Financial, Inc. | | | 441,783 | | | | 5,036,326 | |
| TCF Financial Corp. | | | 600,883 | | | | 5,504,088 | |
| Wintrust Financial Corp. | | | 216,144 | | | | 5,578,677 | |
| Zions Bancorporation | | | 189,710 | | | | 2,669,220 | |
| | | | | | | | |
| | | | | | | $ | 46,877,690 | |
| Pharmaceuticals - 0.5% | | | | | | | | |
| Hospira, Inc. (a) | | | 112,646 | | | $ | 4,167,902 | |
| | |
| Pollution Control - 0.6% | | | | | | | | |
| Republic Services, Inc. | | | 175,589 | | | $ | 4,927,027 | |
| | |
| Printing & Publishing - 0.3% | | | | | | | | |
| Lamar Advertising Co., “A” (a) | | | 116,770 | | | $ | 1,988,593 | |
| | |
| Railroad & Shipping - 0.6% | | | | | | | | |
| Kansas City Southern Co. (a) | | | 95,108 | | | $ | 4,751,596 | |
| | |
| Real Estate - 3.9% | | | | | | | | |
| Annaly Mortgage Management, Inc., REIT | | | 365,510 | | | $ | 6,078,431 | |
| Entertainment Properties Trust, REIT | | | 242,080 | | | | 9,436,278 | |
| Host Hotels & Resorts, Inc., REIT | | | 357,594 | | | | 3,912,078 | |
| Kilroy Realty Corp., REIT | | | 178,040 | | | | 5,572,652 | |
| Mack-Cali Realty Corp., REIT | | | 186,110 | | | | 4,978,443 | |
| | | | | | | | |
| | | | | | | $ | 29,977,882 | |
| Restaurants - 0.4% | | | | | | | | |
| P.F. Chang’s China Bistro, Inc. | | | 107,739 | | | $ | 2,934,810 | |
| | |
| Specialty Chemicals - 4.1% | | | | | | | | |
| Air Products & Chemicals, Inc. | | | 45,532 | | | $ | 3,477,279 | |
| Airgas, Inc. | | | 99,309 | | | | 6,337,900 | |
| Akzo Nobel N.V. | | | 76,661 | | | | 3,389,020 | |
| FMC Corp. | | | 104,015 | | | | 7,193,677 | |
| Rockwood Holdings, Inc. (a) | | | 110,764 | | | | 3,731,639 | |
| Symrise AG | | | 149,231 | | | | 3,467,392 | |
| Valspar Corp. | | | 115,232 | | | | 3,596,391 | |
| | | | | | | | |
| | | | | | | $ | 31,193,298 | |
| Specialty Stores - 2.8% | | | | | | | | |
| Advance Auto Parts, Inc. | | | 66,650 | | | $ | 3,872,365 | |
| American Eagle Outfitters, Inc. | | | 246,171 | | | | 2,885,124 | |
16
Portfolio of Investments – continued
| | | | | | | | |
| Issuer | | Shares/Par | | | Value ($) | |
| | | | | | | | |
| Common Stocks - continued | | | | | | | | |
| Specialty Stores - continued | | | | | | | | |
| O’Reilly Automotive, Inc. (a) | | | 67,140 | | | $ | 4,473,538 | |
| Sally Beauty Holdings, Inc. (a) | | | 392,710 | | | | 6,518,986 | |
| Urban Outfitters, Inc. (a) | | | 150,598 | | | | 3,361,347 | |
| | | | | | | | |
| | | | | | | $ | 21,111,360 | |
| Telecommunications - Wireless - 0.6% | | | | | | | | |
| SBA Communications Corp. (a) | | | 139,367 | | | $ | 4,805,374 | |
| | |
| Telephone Services - 0.9% | | | | | | | | |
| Frontier Communications Corp. | | | 679,041 | | | $ | 4,148,941 | |
| TDC A.S. | | | 286,521 | | | | 2,337,712 | |
| | | | | | | | |
| | | | | | | $ | 6,486,653 | |
| Tobacco - 0.9% | | | | | | | | |
| Reynolds American, Inc. | | | 189,260 | | | $ | 7,093,465 | |
| | |
| Trucking - 0.3% | | | | | | | | |
| Swift Transportation Co. (a) | | | 166,772 | | | $ | 1,074,012 | |
| TNT N.V. | | | 220,820 | | | | 1,544,008 | |
| | | | | | | | |
| | | | | | | $ | 2,618,020 | |
| Utilities - Electric Power - 6.9% | | | | | | | | |
| AES Corp. (a) | | | 495,471 | | | $ | 4,835,797 | |
| American Water Works Co., Inc. | | | 79,752 | | | | 2,406,915 | |
| CenterPoint Energy, Inc. | | | 248,924 | | | | 4,883,889 | |
| CMS Energy Corp. | | | 480,899 | | | | 9,516,991 | |
| Constellation Energy Group, Inc. | | | 85,205 | | | | 3,242,902 | |
| DTE Energy Co. | | | 81,890 | | | | 4,014,248 | |
| GenOn Energy, Inc. (a) | | | 495,764 | | | | 1,378,224 | |
| Great Plains Energy, Inc. | | | 211,730 | | | | 4,086,389 | |
| Northeast Utilities | | | 155,806 | | | | 5,242,872 | |
| NRG Energy, Inc. (a) | | | 186,204 | | | | 3,949,387 | |
| OGE Energy Corp. | | | 73,390 | | | | 3,507,308 | |
| Wisconsin Energy Corp. | | | 173,314 | | | | 5,422,995 | |
| | | | | | | | |
| | | | | | | $ | 52,487,917 | |
| Total Common Stocks (Identified Cost, $728,062,090) | | | | | | $ | 737,495,909 | |
| | |
| Convertible Preferred Stocks - 1.0% | | | | | | | | |
| Automotive - 0.4% | | | | | | | | |
| General Motors Co., 4.75% | | | 91,840 | | | $ | 3,221,747 | |
| | |
| Utilities - Electric Power - 0.6% | | | | | | | | |
| PPL Corp., 9.5% | | | 77,110 | | | $ | 4,271,894 | |
| Total Convertible Preferred Stocks (Identified Cost, $8,679,948) | | | | | | $ | 7,493,641 | |
17
Portfolio of Investments – continued
| | | | | | | | |
| Money Market Funds (v) - 4.2% | | | | | | | | |
| Issuer | | Shares/Par | | | Value ($) | |
| | | | | | | | |
MFS Institutional Money Market Portfolio, 0.07%,
at Cost and Net Asset Value | | | 32,380,959 | | | $ | 32,380,959 | |
| Total Investments (Identified Cost, $769,122,997) | | | | | | $ | 777,370,509 | |
| | |
| Other Assets, Less Liabilities - (1.8)% | | | | | | | (13,551,860 | ) |
| Net Assets - 100.0% | | | | | | $ | 763,818,649 | |
| (a) | Non-income producing security. |
| (v) | Underlying affiliated fund that is available only to investment companies managed by MFS. The rate quoted is the annualized seven-day yield of the fund at period end. |
| (z) | Restricted securities are not registered under the Securities Act of 1933 and are subject to legal restrictions on resale. These securities generally may be resold in transactions exempt from registration or to the public if the securities are subsequently registered. Disposal of these securities may involve time-consuming negotiations and prompt sale at an acceptable price may be difficult. The fund holds the following restricted securities: |
| | | | | | | | | | |
| Restricted Securities | | Acquisition
Date | | Cost | | | Value | |
| Whistler Blackcomb Holdings, Inc. | | 11/02/10 | | | $337,576 | | | | $283,756 | |
| % of Net assets | | | | | | | | | 0.04% | |
The following abbreviations are used in this report and are defined:
| ADR | | American Depository Receipt |
| PLC | | Public Limited Company |
| REIT | | Real Estate Investment Trust |
See Notes to Financial Statements
18
Financial Statements
STATEMENT OF ASSETS AND LIABILITIES
At 9/30/11
This statement represents your fund’s balance sheet, which details the assets and liabilities comprising the total value of the fund.
| | | | |
| Assets | | | | |
Investments- | | | | |
Non-affiliated issuers, at value (identified cost, $736,742,038) | | | $744,989,550 | |
Underlying affiliated funds, at cost and value | | | 32,380,959 | |
Total investments, at value (identified cost, $769,122,997) | | | $777,370,509 | |
Receivables for | | | | |
Investments sold | | | 6,358,114 | |
Fund shares sold | | | 2,897,313 | |
Interest and dividends | | | 1,366,350 | |
Other assets | | | 877 | |
Total assets | | | $787,993,163 | |
| Liabilities | | | | |
Payables for | | | | |
Investments purchased | | | $23,536,973 | |
Fund shares reacquired | | | 304,306 | |
Payable to affiliates | | | | |
Investment adviser | | | 32,749 | |
Shareholder servicing costs | | | 214,951 | |
Distribution and service fees | | | 4,212 | |
Program manager fees | | | 5 | |
Payable for independent Trustees’ compensation | | | 77 | |
Accrued expenses and other liabilities | | | 81,241 | |
Total liabilities | | | $24,174,514 | |
Net assets | | | $763,818,649 | |
| Net assets consist of | | | | |
Paid-in capital | | | $851,217,781 | |
Unrealized appreciation (depreciation) on investments and translation of assets and liabilities in foreign currencies | | | 8,248,866 | |
Accumulated net realized gain (loss) on investments and foreign currency transactions | | | (99,023,816 | ) |
Undistributed net investment income | | | 3,375,818 | |
Net assets | | | $763,818,649 | |
Shares of beneficial interest outstanding | | | 66,071,431 | |
19
Statement of Assets and Liabilities – continued
| | | | | | | | | | | | |
| | | Net assets | | | Shares
outstanding | | | Net asset value
per share (a) | |
| Class A | | | $131,913,813 | | | | 11,554,453 | | | | $11.42 | |
| Class B | | | 13,812,783 | | | | 1,255,756 | | | | 11.00 | |
| Class C | | | 18,429,883 | | | | 1,676,902 | | | | 10.99 | |
| Class I | | | 580,412,458 | | | | 49,863,303 | | | | 11.64 | |
| Class R1 | | | 1,760,058 | | | | 162,019 | | | | 10.86 | |
| Class R2 | | | 13,217,366 | | | | 1,179,651 | | | | 11.20 | |
| Class R3 | | | 2,140,764 | | | | 187,466 | | | | 11.42 | |
| Class R4 | | | 173,414 | | | | 15,132 | | | | 11.46 | |
| Class 529A | | | 1,234,350 | | | | 109,576 | | | | 11.26 | |
| Class 529B | | | 177,457 | | | | 16,520 | | | | 10.74 | |
| Class 529C | | | 546,303 | | | | 50,653 | | | | 10.79 | |
| (a) | Maximum offering price per share was equal to the net asset value per share for all share classes, except for Classes A and 529A, for which the maximum offering prices per share were $12.12 [100 / 94.25 x $11.42] and $11.95 [100 / 94.25 x $11.26], respectively. On sales of $50,000 or more, the maximum offering prices of Class A and Class 529A shares are reduced. A contingent deferred sales charge may be imposed on redemptions of Class A, Class B, Class C, Class 529B, and Class 529C shares. Redemption price per share was equal to the net asset value per share for Classes I, R1, R2, R3, R4, and 529A. |
See Notes to Financial Statements
20
Financial Statements
STATEMENT OF OPERATIONS
Year ended 9/30/11
This statement describes how much your fund earned in investment income and accrued in expenses. It also describes any gains and/or losses generated by fund operations.
| | | | |
| Net investment income | | | | |
Income | | | | |
Dividends | | | $14,409,342 | |
Interest | | | 112,901 | |
Dividends from underlying affiliated funds | | | 23,943 | |
Foreign taxes withheld | | | (184,246 | ) |
Total investment income | | | $14,361,940 | |
Expenses | | | | |
Management fee | | | $6,229,571 | |
Distribution and service fees | | | 911,414 | |
Program manager fees | | | 2,207 | |
Shareholder servicing costs | | | 1,356,443 | |
Administrative services fee | | | 125,060 | |
Independent Trustees’ compensation | | | 20,108 | |
Custodian fee | | | 95,335 | |
Shareholder communications | | | 28,858 | |
Auditing fees | | | 31,878 | |
Legal fees | | | 12,861 | |
Miscellaneous | | | 191,387 | |
Total expenses | | | $9,005,122 | |
Fees paid indirectly | | | (94 | ) |
Reduction of expenses by investment adviser and distributor | | | (3,884 | ) |
Net expenses | | | $9,001,144 | |
Net investment income | | | $5,360,796 | |
Realized and unrealized gain (loss) on investments
and foreign currency transactions | | | | |
Realized gain (loss) (identified cost basis) | | | | |
Investment transactions | | | $108,968,742 | |
Foreign currency transactions | | | (11,136 | ) |
Net realized gain (loss) on investments
and foreign currency transactions | | | $108,957,606 | |
Change in unrealized appreciation (depreciation) | | | | |
Investments | | | $(127,017,442 | ) |
Translation of assets and liabilities in foreign currencies | | | 1,048 | |
Net unrealized gain (loss) on investments
and foreign currency translation | | | $(127,016,394 | ) |
Net realized and unrealized gain (loss) on investments
and foreign currency | | | $(18,058,788 | ) |
Change in net assets from operations | | | $(12,697,992 | ) |
See Notes to Financial Statements
21
Financial Statements
STATEMENTS OF CHANGES IN NET ASSETS
These statements describe the increases and/or decreases in net assets resulting from operations, any distributions, and any shareholder transactions.
| | | | | | | | |
| | | Years ended 9/30 | |
| | | 2011 | | | 2010 | |
| Change in net assets | | | | | | |
| From operations | | | | | | | | |
Net investment income | | | $5,360,796 | | | | $5,345,674 | |
Net realized gain (loss) on investments and
foreign currency transactions | | | 108,957,606 | | | | 88,175,296 | |
Net unrealized gain (loss) on investments and
foreign currency translation | | | (127,016,394 | ) | | | 26,372,191 | |
Change in net assets from operations | | | $(12,697,992 | ) | | | $119,893,161 | |
| Distributions declared to shareholders | | | | | | | | |
From net investment income | | | $(5,710,170 | ) | | | $(4,340,173 | ) |
Change in net assets from fund share transactions | | | $52,734,010 | | | | $(26,213,911 | ) |
Total change in net assets | | | $34,325,848 | | | | $89,339,077 | |
| Net assets | | | | | | | | |
At beginning of period | | | 729,492,801 | | | | 640,153,724 | |
At end of period (including undistributed net investment income of $3,375,818 and $3,717,387, respectively) | | | $763,818,649 | | | | $729,492,801 | |
See Notes to Financial Statements
22
Financial Statements
FINANCIAL HIGHLIGHTS
The financial highlights table is intended to help you understand the fund’s financial performance for the past 5 years. Certain information reflects financial results for a single fund share. The total returns in the table represent the rate by which an investor would have earned (or lost) on an investment in the fund share class (assuming reinvestment of all distributions) held for the entire period.
| | | | | | | | | | | | | | | | | | | | |
| Class A | | Years ended 9/30 | |
| | | 2011 | | | 2010 | | | 2009 | | | 2008 | | | 2007 | |
Net asset value, beginning of period | | | $11.64 | | | | $9.83 | | | | $10.37 | | | | $15.15 | | | | $13.47 | |
| Income (loss) from investment operations | | | | | | | | | | | | | | | | | |
Net investment income (d) | | | $0.07 | | | | $0.07 | | | | $0.07 | | | | $0.08 | | | | $0.13 | |
Net realized and unrealized gain (loss)
on investments and foreign currency | | | (0.21 | ) | | | 1.79 | | | | (0.51 | ) | | | (3.50 | ) | | | 2.00 | |
Total from investment operations | | | $(0.14 | ) | | | $1.86 | | | | $(0.44 | ) | | | $(3.42 | ) | | | $2.13 | |
| Less distributions declared to shareholders | | | | | | | | | | | | | | | | | |
From net investment income | | | $(0.08 | ) | | | $(0.05 | ) | | | $(0.10 | ) | | | $(0.13 | ) | | | $(0.05 | ) |
From net realized gain on investments | | | — | | | | — | | | | — | | | | (1.23 | ) | | | (0.40 | ) |
Total distributions declared to shareholders | | | $(0.08 | ) | | | $(0.05 | ) | | | $(0.10 | ) | | | $(1.36 | ) | | | $(0.45 | ) |
Net asset value, end of period | | | $11.42 | | | | $11.64 | | | | $9.83 | | | | $10.37 | | | | $15.15 | |
Total return (%) (r)(s)(t)(x) | | | (1.31 | ) | | | 19.05 | | | | (3.95 | ) | | | (24.36 | ) | | | 16.12 | |
Ratios (%) (to average net assets)
and Supplemental data: | | | | | | | | | | | | | | | | | |
Expenses before expense reductions (f) | | | 1.22 | | | | 1.26 | | | | 1.40 | | | | 1.34 | | | | 1.29 | |
Expenses after expense reductions (f) | | | 1.22 | | | | 1.25 | | | | 1.29 | | | | 1.34 | | | | 1.29 | |
Net investment income | | | 0.50 | | | | 0.65 | | | | 0.93 | | | | 0.64 | | | | 0.85 | |
Portfolio turnover | | | 56 | | | | 60 | | | | 145 | | | | 69 | | | | 56 | |
Net assets at end of period (000 omitted) | | | $131,914 | | | | $136,470 | | | | $118,140 | | | | $144,892 | | | | $148,571 | |
See Notes to Financial Statements
23
Financial Highlights – continued
| | | | | | | | | | | | | | | | | | | | |
| Class B | | Years ended 9/30 | |
| | | 2011 | | | 2010 | | | 2009 | | | 2008 | | | 2007 | |
Net asset value, beginning of period | | | $11.23 | | | | $9.51 | | | | $9.97 | | | | $14.57 | | | | $13.01 | |
| Income (loss) from investment operations | | | | | | | | | | | | | | | | | |
Net investment income (loss) (d) | | | $(0.03 | ) | | | $(0.01 | ) | | | $0.02 | | | | $(0.00 | )(w) | | | $0.03 | |
Net realized and unrealized gain (loss)
on investments and foreign currency | | | (0.20 | ) | | | 1.73 | | | | (0.48 | ) | | | (3.37 | ) | | | 1.93 | |
Total from investment operations | | | $(0.23 | ) | | | $1.72 | | | | $(0.46 | ) | | | $(3.37 | ) | | | $1.96 | |
| Less distributions declared to shareholders | | | | | | | | | | | | | | | | | |
From net investment income | | | $— | | | | $— | | | | $(0.00 | )(w) | | | $— | | | | $— | |
From net realized gain on investments | | | — | | | | — | | | | — | | | | (1.23 | ) | | | (0.40 | ) |
Total distributions declared to shareholders | | | $— | | | | $— | | | | $(0.00 | )(w) | | | $(1.23 | ) | | | $(0.40 | ) |
Net asset value, end of period | | | $11.00 | | | | $11.23 | | | | $9.51 | | | | $9.97 | | | | $14.57 | |
Total return (%) (r)(s)(t)(x) | | | (2.05 | ) | | | 18.09 | | | | (4.59 | ) | | | (24.84 | ) | | | 15.31 | |
Ratios (%) (to average net assets)
and Supplemental data: | | | | | | | | | | | | | | | | | |
Expenses before expense reductions (f) | | | 1.97 | | | | 2.01 | | | | 2.11 | | | | 1.99 | | | | 1.94 | |
Expenses after expense reductions (f) | | | 1.97 | | | | 2.00 | | | | 2.00 | | | | 1.99 | | | | 1.94 | |
Net investment income (loss) | | | (0.25 | ) | | | (0.11 | ) | | | 0.24 | | | | (0.03 | ) | | | 0.20 | |
Portfolio turnover | | | 56 | | | | 60 | | | | 145 | | | | 69 | | | | 56 | |
Net assets at end of period (000 omitted) | | | $13,813 | | | | $18,348 | | | | $22,224 | | | | $34,037 | | | | $72,726 | |
| |
| Class C | | Years ended 9/30 | |
| | | 2011 | | | 2010 | | | 2009 | | | 2008 | | | 2007 | |
Net asset value, beginning of period | | | $11.22 | | | | $9.50 | | | | $9.98 | | | | $14.58 | | | | $13.01 | |
| Income (loss) from investment operations | | | | | | | | | | | | | | | | | |
Net investment income (loss) (d) | | | $(0.03 | ) | | | $(0.01 | ) | | | $0.02 | | | | $(0.00 | )(w) | | | $0.03 | |
Net realized and unrealized gain (loss)
on investments and foreign currency | | | (0.20 | ) | | | 1.73 | | | | (0.49 | ) | | | (3.37 | ) | | | 1.94 | |
Total from investment operations | | | $(0.23 | ) | | | $1.72 | | | | $(0.47 | ) | | | $(3.37 | ) | | | $1.97 | |
| Less distributions declared to shareholders | | | | | | | | | | | | | | | | | |
From net investment income | | | $— | | | | $— | | | | $(0.01 | ) | | | $(0.00 | )(w) | | | $— | |
From net realized gain on investments | | | — | | | | — | | | | — | | | | (1.23 | ) | | | (0.40 | ) |
Total distributions declared to shareholders | | | $— | | | | $— | | | | $(0.01 | ) | | | $(1.23 | ) | | | $(0.40 | ) |
Net asset value, end of period | | | $10.99 | | | | $11.22 | | | | $9.50 | | | | $9.98 | | | | $14.58 | |
Total return (%) (r)(s)(t)(x) | | | (2.05 | ) | | | 18.11 | | | | (4.65 | ) | | | (24.80 | ) | | | 15.38 | |
Ratios (%) (to average net assets)
and Supplemental data: | | | | | | | | | | | | | | | | | |
Expenses before expense reductions (f) | | | 1.97 | | | | 2.01 | | | | 2.11 | | | | 1.99 | | | | 1.94 | |
Expenses after expense reductions (f) | | | 1.97 | | | | 2.00 | | | | 2.00 | | | | 1.99 | | | | 1.94 | |
Net investment income (loss) | | | (0.25 | ) | | | (0.10 | ) | | | 0.23 | | | | (0.02 | ) | | | 0.20 | |
Portfolio turnover | | | 56 | | | | 60 | | | | 145 | | | | 69 | | | | 56 | |
Net assets at end of period (000 omitted) | | | $18,430 | | | | $18,717 | | | | $17,003 | | | | $21,381 | | | | $41,066 | |
See Notes to Financial Statements
24
Financial Highlights – continued
| | | | | | | | | | | | | | | | | | | | |
| Class I | | Years ended 9/30 | |
| | | 2011 | | | 2010 | | | 2009 | | | 2008 | | | 2007 | |
Net asset value, beginning of period | | | $11.86 | | | | $10.02 | | | | $10.59 | | | | $15.43 | | | | $13.72 | |
| Income (loss) from investment operations | | | | | | | | | | | | | | | | | |
Net investment income (d) | | | $0.10 | | | | $0.10 | | | | $0.10 | | | | $0.13 | | | | $0.18 | |
Net realized and unrealized gain (loss)
on investments and foreign currency | | | (0.22 | ) | | | 1.82 | | | | (0.53 | ) | | | (3.57 | ) | | | 2.04 | |
Total from investment operations | | | $(0.12 | ) | | | $1.92 | | | | $(0.43 | ) | | | $(3.44 | ) | | | $2.22 | |
| Less distributions declared to shareholders | | | | | | | | | | | | | | | | | |
From net investment income | | | $(0.10 | ) | | | $(0.08 | ) | | | $(0.14 | ) | | | $(0.17 | ) | | | $(0.11 | ) |
From net realized gain on investments | | | — | | | | — | | | | — | | | | (1.23 | ) | | | (0.40 | ) |
Total distributions declared to shareholders | | | $(0.10 | ) | | | $(0.08 | ) | | | $(0.14 | ) | | | $(1.40 | ) | | | $(0.51 | ) |
Net asset value, end of period | | | $11.64 | | | | $11.86 | | | | $10.02 | | | | $10.59 | | | | $15.43 | |
Total return (%) (r)(s)(x) | | | (1.07 | ) | | | 19.26 | | | | (3.62 | ) | | | (24.07 | ) | | | 16.47 | |
Ratios (%) (to average net assets)
and Supplemental data: | | | | | | | | | | | | | | | | | |
Expenses before expense reductions (f) | | | 0.97 | | | | 1.01 | | | | 1.10 | | | | 0.99 | | | | 0.94 | |
Expenses after expense reductions (f) | | | 0.97 | | | | 1.00 | | | | 1.00 | | | | 0.99 | | | | 0.94 | |
Net investment income | | | 0.76 | | | | 0.90 | | | | 1.20 | | | | 1.01 | | | | 1.21 | |
Portfolio turnover | | | 56 | | | | 60 | | | | 145 | | | | 69 | | | | 56 | |
Net assets at end of period (000 omitted) | | | $580,412 | | | | $537,692 | | | | $467,782 | | | | $493,192 | | | | $610,121 | |
See Notes to Financial Statements
25
Financial Highlights – continued
| | | | | | | | | | | | | | | | | | | | |
| Class R1 | | Years ended 9/30 | |
| | | 2011 | | | 2010 | | | 2009 | | | 2008 | | | 2007 | |
Net asset value, beginning of period | | | $11.09 | | | | $9.39 | | | | $9.89 | | | | $14.54 | | | | $12.99 | |
| Income (loss) from investment operations | | | | | | | | | | | | | | | | | | | | |
Net investment income (loss) (d) | | | $(0.03 | ) | | | $(0.01 | ) | | | $0.02 | | | | $(0.00 | )(w) | | | $0.01 | |
Net realized and unrealized gain (loss)
on investments and foreign currency | | | (0.20 | ) | | | 1.71 | | | | (0.49 | ) | | | (3.36 | ) | | | 1.94 | |
Total from investment operations | | | $(0.23 | ) | | | $1.70 | | | | $(0.47 | ) | | | $(3.36 | ) | | | $1.95 | |
| Less distributions declared to shareholders | | | | | | | | | | | | | | | | | | | | |
From net investment income | | | $— | | | | $(0.00 | )(w) | | | $(0.03 | ) | | | $(0.06 | ) | | | $— | |
From net realized gain on investments | | | — | | | | — | | | | — | | | | (1.23 | ) | | | (0.40 | ) |
Total distributions declared to shareholders | | | $— | | | | $(0.00 | )(w) | | | $(0.03 | ) | | | $(1.29 | ) | | | $(0.40 | ) |
Net asset value, end of period | | | $10.86 | | | | $11.09 | | | | $9.39 | | | | $9.89 | | | | $14.54 | |
Total return (%) (r)(s)(x) | | | (2.07 | ) | | | 18.11 | | | | (4.60 | ) | | | (24.89 | ) | | | 15.25 | |
Ratios (%) (to average net assets)
and Supplemental data: | | | | | | | | | | | | | | | | | | | | |
Expenses before expense reductions (f) | | | 1.97 | | | | 2.01 | | | | 2.10 | | | | 2.03 | | | | 2.09 | |
Expenses after expense reductions (f) | | | 1.97 | | | | 2.00 | | | | 2.00 | | | | 2.03 | | | | 2.04 | |
Net investment income (loss) | | | (0.25 | ) | | | (0.10 | ) | | | 0.20 | | | | (0.00 | ) | | | 0.07 | |
Portfolio turnover | | | 56 | | | | 60 | | | | 145 | | | | 69 | | | | 56 | |
Net assets at end of period (000 omitted) | | | $1,760 | | | | $1,712 | | | | $1,424 | | | | $1,516 | | | | $1,215 | |
| |
| Class R2 | | Years ended 9/30 | |
| | | 2011 | | | 2010 | | | 2009 | | | 2008 | | | 2007 | |
Net asset value, beginning of period | | | $11.43 | | | | $9.66 | | | | $10.21 | | | | $14.93 | | | | $13.29 | |
| Income (loss) from investment operations | | | | | | | | | | | | | | | | | |
Net investment income (d) | | | $0.03 | | | | $0.04 | | | | $0.05 | | | | $0.07 | | | | $0.08 | |
Net realized and unrealized gain (loss)
on investments and foreign currency | | | (0.21 | ) | | | 1.77 | | | | (0.51 | ) | | | (3.46 | ) | | | 1.99 | |
Total from investment operations | | | $(0.18 | ) | | | $1.81 | | | | $(0.46 | ) | | | $(3.39 | ) | | | $2.07 | |
| Less distributions declared to shareholders | | | | | | | | | | | | | | | | | |
From net investment income | | | $(0.05 | ) | | | $(0.04 | ) | | | $(0.09 | ) | | | $(0.10 | ) | | | $(0.03 | ) |
From net realized gain on investments | | | — | | | | — | | | | — | | | | (1.23 | ) | | | (0.40 | ) |
Total distributions declared to shareholders | | | $(0.05 | ) | | | $(0.04 | ) | | | $(0.09 | ) | | | $(1.33 | ) | | | $(0.43 | ) |
Net asset value, end of period | | | $11.20 | | | | $11.43 | | | | $9.66 | | | | $10.21 | | | | $14.93 | |
Total return (%) (r)(s)(x) | | | (1.64 | ) | | | 18.76 | | | | (4.11 | ) | | | (24.49 | ) | | | 15.80 | |
Ratios (%) (to average net assets)
and Supplemental data: | | | | | | | | | | | | | | | | | |
Expenses before expense reductions (f) | | | 1.47 | | | | 1.51 | | | | 1.60 | | | | 1.51 | | | | 1.63 | |
Expenses after expense reductions (f) | | | 1.47 | | | | 1.50 | | | | 1.50 | | | | 1.51 | | | | 1.59 | |
Net investment income | | | 0.25 | | | | 0.40 | | | | 0.70 | | | | 0.59 | | | | 0.52 | |
Portfolio turnover | | | 56 | | | | 60 | | | | 145 | | | | 69 | | | | 56 | |
Net assets at end of period (000 omitted) | | | $13,217 | | | | $13,697 | | | | $11,193 | | | | $11,366 | | | | $4,275 | |
See Notes to Financial Statements
26
Financial Highlights – continued
| | | | | | | | | | | | | | | | | | | | |
| Class R3 | | Years ended 9/30 | |
| | | 2011 | | | 2010 | | | 2009 | | | 2008 | | | 2007 | |
Net asset value, beginning of period | | | $11.64 | | | | $9.84 | | | | $10.37 | | | | $15.11 | | | | $13.46 | |
| Income (loss) from investment operations | | | | | | | | | | | | | | | | | |
Net investment income (d) | | | $0.07 | | | | $0.07 | | | | $0.08 | | | | $0.09 | | | | $0.12 | |
Net realized and unrealized gain (loss)
on investments and foreign currency | | | (0.21 | ) | | | 1.79 | | | | (0.52 | ) | | | (3.49 | ) | | | 2.00 | |
Total from investment operations | | | $(0.14 | ) | | | $1.86 | | | | $(0.44 | ) | | | $(3.40 | ) | | | $2.12 | |
| Less distributions declared to shareholders | | | | | | | | | | | | | | | | | |
From net investment income | | | $(0.08 | ) | | | $(0.06 | ) | | | $(0.09 | ) | | | $(0.11 | ) | | | $(0.07 | ) |
From net realized gain on investments | | | — | | | | — | | | | — | | | | (1.23 | ) | | | (0.40 | ) |
Total distributions declared to shareholders | | | $(0.08 | ) | | | $(0.06 | ) | | | $(0.09 | ) | | | $(1.34 | ) | | | $(0.47 | ) |
Net asset value, end of period | | | $11.42 | | | | $11.64 | | | | $9.84 | | | | $10.37 | | | | $15.11 | |
Total return (%) (r)(s)(x) | | | (1.29 | ) | | | 18.96 | | | | (3.91 | ) | | | (24.23 | ) | | | 16.06 | |
Ratios (%) (to average net assets)
and Supplemental data: | | | | | | | | | | | | | | | | | |
Expenses before expense reductions (f) | | | 1.23 | | | | 1.26 | | | | 1.35 | | | | 1.27 | | | | 1.34 | |
Expenses after expense reductions (f) | | | 1.23 | | | | 1.25 | | | | 1.25 | | | | 1.27 | | | | 1.34 | |
Net investment income | | | 0.50 | | | | 0.65 | | | | 0.96 | | | | 0.73 | | | | 0.80 | |
Portfolio turnover | | | 56 | | | | 60 | | | | 145 | | | | 69 | | | | 56 | |
Net assets at end of period (000 omitted) | | | $2,141 | | | | $898 | | | | $883 | | | | $1,333 | | | | $1,187 | |
| |
| Class R4 | | Years ended 9/30 | |
| | | 2011 | | | 2010 | | | 2009 | | | 2008 | | | 2007 | |
Net asset value, beginning of period | | | $11.68 | | | | $9.86 | | | | $10.43 | | | | $15.21 | | | | $13.53 | |
| Income (loss) from investment operations | | | | | | | | | | | | | | | | | |
Net investment income (d) | | | $0.10 | | | | $0.10 | | | | $0.08 | | | | $0.12 | | | | $0.17 | |
Net realized and unrealized gain (loss)
on investments and foreign currency | | | (0.22 | ) | | | 1.80 | | | | (0.51 | ) | | | (3.52 | ) | | | 2.00 | |
Total from investment operations | | | $(0.12 | ) | | | $1.90 | | | | $(0.43 | ) | | | $(3.40 | ) | | | $2.17 | |
| Less distributions declared to shareholders | | | | | | | | | | | | | | | | | |
From net investment income | | | $(0.10 | ) | | | $(0.08 | ) | | | $(0.14 | ) | | | $(0.15 | ) | | | $(0.09 | ) |
From net realized gain on investments | | | — | | | | — | | | | — | | | | (1.23 | ) | | | (0.40 | ) |
Total distributions declared to shareholders | | | $(0.10 | ) | | | $(0.08 | ) | | | $(0.14 | ) | | | $(1.38 | ) | | | $(0.49 | ) |
Net asset value, end of period | | | $11.46 | | | | $11.68 | | | | $9.86 | | | | $10.43 | | | | $15.21 | |
Total return (%) (r)(s)(x) | | | (1.08 | ) | | | 19.37 | | | | (3.68 | ) | | | (24.11 | ) | | | 16.37 | |
Ratios (%) (to average net assets)
and Supplemental data: | | | | | | | | | | | | | | | | | |
Expenses before expense reductions (f) | | | 0.97 | | | | 1.01 | | | | 1.06 | | | | 1.02 | | | | 1.04 | |
Expenses after expense reductions (f) | | | 0.97 | | | | 1.00 | | | | 1.00 | | | | 1.02 | | | | 1.04 | |
Net investment income | | | 0.75 | | | | 0.90 | | | | 1.04 | | | | 0.98 | | | | 1.11 | |
Portfolio turnover | | | 56 | | | | 60 | | | | 145 | | | | 69 | | | | 56 | |
Net assets at end of period (000 omitted) | | | $173 | | | | $175 | | | | $147 | | | | $50 | | | | $66 | |
See Notes to Financial Statements
27
Financial Highlights – continued
| | | | | | | | | | | | | | | | | | | | |
| Class 529A | | Years ended 9/30 | |
| | | 2011 | | | 2010 | | | 2009 | | | 2008 | | | 2007 | |
Net asset value, beginning of period | | | $11.49 | | | | $9.71 | | | | $10.24 | | | | $14.96 | | | | $13.29 | |
| Income (loss) from investment operations | | | | | | | | | | | | | | | | | |
Net investment income (d) | | | $0.05 | | | | $0.06 | | | | $0.06 | | | | $0.06 | | | | $0.08 | |
Net realized and unrealized gain (loss)
on investments and foreign currency | | | (0.21 | ) | | | 1.77 | | | | (0.50 | ) | | | (3.47 | ) | | | 1.99 | |
Total from investment operations | | | $(0.16 | ) | | | $1.83 | | | | $(0.44 | ) | | | $(3.41 | ) | | | $2.07 | |
| Less distributions declared to shareholders | | | | | | | | | | | | | | | | | |
From net investment income | | | $(0.07 | ) | | | $(0.05 | ) | | | $(0.09 | ) | | | $(0.08 | ) | | | $(0.00 | )(w) |
From net realized gain on investments | | | — | | | | — | | | | — | | | | (1.23 | ) | | | (0.40 | ) |
Total distributions declared to shareholders | | | $(0.07 | ) | | | $(0.05 | ) | | | $(0.09 | ) | | | $(1.31 | ) | | | $(0.40 | ) |
Net asset value, end of period | | | $11.26 | | | | $11.49 | | | | $9.71 | | | | $10.24 | | | | $14.96 | |
Total return (%) (r)(s)(t)(x) | | | (1.47 | ) | | | 18.91 | | | | (4.03 | ) | | | (24.53 | ) | | | 15.83 | |
Ratios (%) (to average net assets)
and Supplemental data: | | | | | | | | | | | | | | | | | |
Expenses before expense reductions (f) | | | 1.32 | | | | 1.36 | | | | 1.49 | | | | 1.52 | | | | 1.54 | |
Expenses after expense reductions (f) | | | 1.31 | | | | 1.35 | | | | 1.39 | | | | 1.52 | | | | 1.54 | |
Net investment income | | | 0.41 | | | | 0.56 | | | | 0.81 | | | | 0.48 | | | | 0.60 | |
Portfolio turnover | | | 56 | | | | 60 | | | | 145 | | | | 69 | | | | 56 | |
Net assets at end of period (000 omitted) | | | $1,234 | | | | $1,076 | | | | $769 | | | | $813 | | | | $1,048 | |
| |
| Class 529B | | Years ended 9/30 | |
| | | 2011 | | | 2010 | | | 2009 | | | 2008 | | | 2007 | |
Net asset value, beginning of period | | | $10.98 | | | | $9.30 | | | | $9.79 | | | | $14.35 | | | | $12.84 | |
| Income (loss) from investment operations | | | | | | | | | | | | | | | | | |
Net investment income (loss) (d) | | | $(0.04 | ) | | | $(0.02 | ) | | | $0.01 | | | | $(0.02 | ) | | | $(0.01 | ) |
Net realized and unrealized gain (loss)
on investments and foreign currency | | | (0.20 | ) | | | 1.70 | | | | (0.48 | ) | | | (3.31 | ) | | | 1.92 | |
Total from investment operations | | | $(0.24 | ) | | | $1.68 | | | | $(0.47 | ) | | | $(3.33 | ) | | | $1.91 | |
| Less distributions declared to shareholders | | | | | | | | | | | | | | | | | |
From net investment income | | | $— | | | | $— | | | | $(0.02 | ) | | | $— | | | | $— | |
From net realized gain on investments | | | — | | | | — | | | | — | | | | (1.23 | ) | | | (0.40 | ) |
Total distributions declared to shareholders | | | $— | | | | $— | | | | $(0.02 | ) | | | $(1.23 | ) | | | $(0.40 | ) |
Net asset value, end of period | | | $10.74 | | | | $10.98 | | | | $9.30 | | | | $9.79 | | | | $14.35 | |
Total return (%) (r)(s)(t)(x) | | | (2.19 | ) | | | 18.06 | | | | (4.77 | ) | | | (24.94 | ) | | | 15.11 | |
Ratios (%) (to average net assets)
and Supplemental data: | | | | | | | | | | | | | | | | | |
Expenses before expense reductions (f) | | | 2.07 | | | | 2.11 | | | | 2.20 | | | | 2.17 | | | | 2.19 | |
Expenses after expense reductions (f) | | | 2.06 | | | | 2.10 | | | | 2.10 | | | | 2.17 | | | | 2.19 | |
Net investment income (loss) | | | (0.35 | ) | | | (0.19 | ) | | | 0.11 | | | | (0.18 | ) | | | (0.04 | ) |
Portfolio turnover | | | 56 | | | | 60 | | | | 145 | | | | 69 | | | | 56 | |
Net assets at end of period (000 omitted) | | | $177 | | | | $245 | | | | $196 | | | | $206 | | | | $293 | |
See Notes to Financial Statements
28
Financial Highlights – continued
| | | | | | | | | | | | | | | | | | | | |
| Class 529C | | Years ended 9/30 | |
| | | 2011 | | | 2010 | | | 2009 | | | 2008 | | | 2007 | |
Net asset value, beginning of period | | | $11.02 | | | | $9.34 | | | | $9.81 | | | | $14.38 | | | | $12.87 | |
| Income (loss) from investment operations | | | | | | | | | | | | | | | | | |
Net investment income (loss) (d) | | | $(0.04 | ) | | | $(0.02 | ) | | | $0.00 | (w) | | | $(0.02 | ) | | | $(0.01 | ) |
Net realized and unrealized gain (loss)
on investments and foreign currency | | | (0.19 | ) | | | 1.70 | | | | (0.46 | ) | | | (3.32 | ) | | | 1.92 | |
Total from investment operations | | | $(0.23 | ) | | | $1.68 | | | | $(0.46 | ) | | | $(3.34 | ) | | | $1.91 | |
| Less distributions declared to shareholders | | | | | | | | | | | | | | | | | |
From net investment income | | | $— | | | | $— | | | | $(0.01 | ) | | | $— | | | | $— | |
From net realized gain on investments | | | — | | | | — | | | | — | | | | (1.23 | ) | | | (0.40 | ) |
Total distributions declared to shareholders | | | $— | | | | $— | | | | $(0.01 | ) | | | $(1.23 | ) | | | $(0.40 | ) |
Net asset value, end of period | | | $10.79 | | | | $11.02 | | | | $9.34 | | | | $9.81 | | | | $14.38 | |
Total return (%) (r)(s)(t)(x) | | | (2.09 | ) | | | 17.99 | | | | (4.67 | ) | | | (24.97 | ) | | | 15.08 | |
Ratios (%) (to average net assets)
and Supplemental data: | | | | | | | | | | | | | | | | | |
Expenses before expense reductions (f) | | | 2.07 | | | | 2.11 | | | | 2.19 | | | | 2.17 | | | | 2.19 | |
Expenses after expense reductions (f) | | | 2.06 | | | | 2.10 | | | | 2.10 | | | | 2.17 | | | | 2.19 | |
Net investment income (loss) | | | (0.34 | ) | | | (0.19 | ) | | | 0.05 | | | | (0.19 | ) | | | (0.04 | ) |
Portfolio turnover | | | 56 | | | | 60 | | | | 145 | | | | 69 | | | | 56 | |
Net assets at end of period (000 omitted) | | | $546 | | | | $462 | | | | $392 | | | | $273 | | | | $439 | |
| (d) | Per share data is based on average shares outstanding. |
| (f) | Ratios do not reflect reductions from fees paid indirectly, if applicable. |
| (r) | Certain expenses have been reduced without which performance would have been lower. |
| (s) | From time to time the fund may receive proceeds from litigation settlements, without which performance would be lower. |
| (t) | Total returns do not include any applicable sales charges. |
| (w) | Per share amount was less than $0.01. |
| (x) | Total returns have been calculated on net asset values which include adjustments made in accordance with U.S. generally accepted accounting principles required at period end for financial reporting purposes. |
See Notes to Financial Statements
29
NOTES TO FINANCIAL STATEMENTS
| (1) | | Business and Organization |
MFS Mid Cap Value Fund (the fund) is a series of MFS Series Trust XI (the trust). The trust is organized as a Massachusetts business trust and is registered under the Investment Company Act of 1940, as amended, as an open-end management investment company.
| (2) | | Significant Accounting Policies |
General – The preparation of financial statements in conformity with U.S. generally accepted accounting principles requires management to make estimates and assumptions that affect the reported amounts of assets and liabilities, and disclosure of contingent assets and liabilities at the date of the financial statements and the reported amounts of revenues and expenses during the reporting period. Actual results could differ from those estimates. In the preparation of these financial statements, management has evaluated subsequent events occurring after the date of the fund’s Statement of Assets and Liabilities through the date that the financial statements were issued.
Investment Valuations – Equity securities, including restricted equity securities, are generally valued at the last sale or official closing price as provided by a third-party pricing service on the market or exchange on which they are primarily traded. Equity securities, for which there were no sales reported that day, are generally valued at the last quoted daily bid quotation as provided by a third-party pricing service on the market or exchange on which such securities are primarily traded. Equity securities held short, for which there were no sales reported for that day, are generally valued at the last quoted daily ask quotation as provided by a third-party pricing service on the market or exchange on which such securities are primarily traded. Debt instruments and floating rate loans (other than short-term instruments), including restricted debt instruments, are generally valued at an evaluated or composite bid as provided by a third-party pricing service. Short-term instruments with a maturity at issuance of 60 days or less generally are valued at amortized cost, which approximates market value. Open-end investment companies are generally valued at net asset value per share. Securities and other assets generally valued on the basis of information from a third-party pricing service may also be valued at a broker/dealer bid quotation. Values obtained from third-party pricing services can utilize both transaction data and market information such as yield, quality, coupon rate, maturity, type of issue, trading characteristics, and other market data. The values of foreign securities and other assets and liabilities expressed in foreign currencies are converted to U.S. dollars using the mean of bid and asked prices for rates provided by a third-party pricing service.
30
Notes to Financial Statements – continued
The Board of Trustees has delegated primary responsibility for determining or causing to be determined the value of the fund’s investments (including any fair valuation) to the adviser pursuant to valuation policies and procedures approved by the Board. If the adviser determines that reliable market quotations are not readily available, investments are valued at fair value as determined in good faith by the adviser in accordance with such procedures under the oversight of the Board of Trustees. Under the fund’s valuation policies and procedures, market quotations are not considered to be readily available for most types of debt instruments and floating rate loans and many types of derivatives. These investments are generally valued at fair value based on information from third-party pricing services. In addition, investments may be valued at fair value if the adviser determines that an investment’s value has been materially affected by events occurring after the close of the exchange or market on which the investment is principally traded (such as foreign exchange or market) and prior to the determination of the fund’s net asset value, or after the halting of trading of a specific security where trading does not resume prior to the close of the exchange or market on which the security is principally traded. Events that occur on a frequent basis after foreign markets close (such as developments in foreign markets and significant movements in the U.S. markets) and prior to the determination of the fund’s net asset value may be deemed to have a material effect on the value of securities traded in foreign markets. Accordingly, the fund’s foreign equity securities may often be valued at fair value. The adviser generally relies on third-party pricing services or other information (such as the correlation with price movements of similar securities in the same or other markets; the type, cost and investment characteristics of the security; the business and financial condition of the issuer; and trading and other market data) to assist in determining whether to fair value and at what value to fair value an investment. The value of an investment for purposes of calculating the fund’s net asset value can differ depending on the source and method used to determine value. When fair valuation is used, the value of an investment used to determine the fund’s net asset value may differ from quoted or published prices for the same investment. There can be no assurance that the fund could obtain the fair value assigned to an investment if it were to sell the investment at the same time at which the fund determines its net asset value per share.
Various inputs are used in determining the value of the fund’s assets or liabilities. These inputs are categorized into three broad levels. In certain cases, the inputs used to measure fair value may fall into different levels of the fair value hierarchy. In such cases, an investment’s level within the fair value hierarchy is based on the lowest level of input that is significant to the fair value measurement. The fund’s assessment of the significance of a particular input to the fair value measurement in its entirety requires judgment, and
31
Notes to Financial Statements – continued
considers factors specific to the investment. Level 1 includes unadjusted quoted prices in active markets for identical assets or liabilities. Level 2 includes other significant observable market-based inputs (including quoted prices for similar securities, interest rates, prepayment speed, and credit risk). Level 3 includes unobservable inputs, which may include the adviser’s own assumptions in determining the fair value of investments. The following is a summary of the levels used as of September 30, 2011 in valuing the fund’s assets or liabilities:
| | | | | | | | | | | | | | | | |
| Investments at Value | | Level 1 | | | Level 2 | | | Level 3 | | | Total | |
| Equity Securities: | | | | | | | | | | | | | | | | |
United States | | | $708,284,851 | | | | $— | | | | $— | | | | $708,284,851 | |
United Kingdom | | | 5,447,134 | | | | 4,729,726 | | | | — | | | | 10,176,860 | |
Israel | | | 8,722,864 | | | | — | | | | — | | | | 8,722,864 | |
Netherlands | | | 1,544,008 | | | | 4,980,921 | | | | — | | | | 6,524,929 | |
Canada | | | 5,191,186 | | | | 283,756 | | | | — | | | | 5,474,942 | |
Germany | | | — | | | | 3,467,392 | | | | — | | | | 3,467,392 | |
Denmark | | | — | | | | 2,337,712 | | | | — | | | | 2,337,712 | |
| Mutual Funds | | | 32,380,959 | | | | — | | | | — | | | | 32,380,959 | |
| Total Investments | | | $761,571,002 | | | | $15,799,507 | | | | $— | | | | $777,370,509 | |
For further information regarding security characteristics, see the Portfolio of Investments.
Foreign Currency Translation – Purchases and sales of foreign investments, income, and expenses are converted into U.S. dollars based upon currency exchange rates prevailing on the respective dates of such transactions or on the reporting date for foreign denominated receivables and payables. Gains and losses attributable to foreign currency exchange rates on sales of securities are recorded for financial statement purposes as net realized gains and losses on investments. Gains and losses attributable to foreign exchange rate movements on receivables, payables, income and expenses are recorded for financial statement purposes as foreign currency transaction gains and losses. That portion of both realized and unrealized gains and losses on investments that results from fluctuations in foreign currency exchange rates is not separately disclosed.
Security Loans – State Street Bank and Trust Company (“State Street”), as lending agent, loans the securities of the fund to certain qualified institutions (the “Borrowers”) approved by the fund. The loans are collateralized by cash and/or U.S. Treasury and federal agency obligations in an amount typically at least equal to the market value of the securities loaned. The market value of the loaned securities is determined at the close of business of the fund and any additional required collateral is delivered to the fund on the next business day. State Street provides the fund with indemnification against Borrower default.
32
Notes to Financial Statements – continued
The fund bears the risk of loss with respect to the investment of cash collateral. On loans collateralized by cash, the cash collateral is invested in a money market fund or short-term securities. A portion of the income generated upon investment of the collateral is remitted to the Borrowers, and the remainder is allocated between the fund and the lending agent. On loans collateralized by U.S. Treasury and/or federal agency obligations, a fee is received from the Borrower, and is allocated between the fund and the lending agent. Income from securities lending is included in interest income on the Statement of Operations. The dividend and interest income earned on the securities loaned is accounted for in the same manner as other dividend and interest income.
Indemnifications – Under the fund’s organizational documents, its officers and Trustees may be indemnified against certain liabilities and expenses arising out of the performance of their duties to the fund. Additionally, in the normal course of business, the fund enters into agreements with service providers that may contain indemnification clauses. The fund’s maximum exposure under these agreements is unknown as this would involve future claims that may be made against the fund that have not yet occurred.
Investment Transactions and Income – Investment transactions are recorded on the trade date. Interest income is recorded on the accrual basis. All premium and discount is amortized or accreted for financial statement purposes in accordance with U.S. generally accepted accounting principles. Dividends received in cash are recorded on the ex-dividend date. Certain dividends from foreign securities will be recorded when the fund is informed of the dividend if such information is obtained subsequent to the ex-dividend date. Dividend and interest payments received in additional securities are recorded on the ex-dividend or ex-interest date in an amount equal to the value of the security on such date.
The fund may receive proceeds from litigation settlements. Any proceeds received from litigation involving portfolio holdings are reflected in the Statement of Operations in realized gain/loss if the security has been disposed of by the fund or in unrealized gain/loss if the security is still held by the fund. Any other proceeds from litigation not related to portfolio holdings are reflected as other income in the Statement of Operations.
Fees Paid Indirectly – The fund’s custody fee may be reduced according to an arrangement that measures the value of cash deposited with the custodian by the fund. This amount, for the year ended September 30, 2011, is shown as a reduction of total expenses on the Statement of Operations.
Tax Matters and Distributions – The fund intends to qualify as a regulated investment company, as defined under Subchapter M of the Internal Revenue Code, and to distribute all of its taxable income, including realized capital gains. As a result, no provision for federal income tax is required. The fund’s
33
Notes to Financial Statements – continued
federal tax returns for the prior three fiscal years remain subject to examination by the Internal Revenue Service. Foreign taxes have been accrued by the fund in the accompanying financial statements.
Distributions to shareholders are recorded on the ex-dividend date. Income and capital gain distributions are determined in accordance with income tax regulations, which may differ from U.S. generally accepted accounting principles. Certain capital accounts in the financial statements are periodically adjusted for permanent differences in order to reflect their tax character. These adjustments have no impact on net assets or net asset value per share. Temporary differences which arise from recognizing certain items of income, expense, gain or loss in different periods for financial statement and tax purposes will reverse at some time in the future. Distributions in excess of net investment income or net realized gains are temporary overdistributions for financial statement purposes resulting from differences in the recognition or classification of income or distributions for financial statement and tax purposes.
Book/tax differences primarily relate to wash sale loss deferrals.
The tax character of distributions declared to shareholders for the last two fiscal years is as follows:
| | | | | | | | |
| | | 9/30/11 | | | 9/30/10 | |
| Ordinary income (including any short-term capital gains) | | | $5,710,170 | | | | $4,340,173 | |
The federal tax cost and the tax basis components of distributable earnings were as follows:
| | | | |
| As of 9/30/11 | | | |
| Cost of investments | | | $772,739,474 | |
| Gross appreciation | | | 88,826,989 | |
| Gross depreciation | | | (84,195,954 | ) |
| Net unrealized appreciation (depreciation) | | | $4,631,035 | |
| Undistributed ordinary income | | | 3,375,818 | |
| Capital loss carryforwards | | | (95,376,523 | ) |
| Other temporary differences | | | (29,462 | ) |
As of September 30, 2011, the fund had capital loss carryforwards available to offset future realized gains. Such losses expire as follows:
Multiple Classes of Shares of Beneficial Interest – The fund offers multiple classes of shares, which differ in their respective distribution, service, and program manager fees. The fund’s income, realized and unrealized gain (loss), and common expenses are allocated to shareholders based on the daily net
34
Notes to Financial Statements – continued
assets of each class. Dividends are declared separately for each class. Differences in per share dividend rates are generally due to differences in separate class expenses. Class B and Class 529B shares will convert to Class A and Class 529A shares, respectively, approximately eight years after purchase. The fund’s distributions declared to shareholders as reported on the Statements of Changes in Net Assets are presented by class as follows:
| | | | | | | | |
| | | From net investment
income | |
| | | Year ended
9/30/11 | | | Year ended
9/30/10 | |
| Class A | | | $890,995 | | | | $643,640 | |
| Class I | | | 4,747,760 | | | | 3,642,550 | |
| Class R1 | | | — | | | | 118 | |
| Class R2 | | | 56,055 | | | | 43,427 | |
| Class R3 | | | 7,018 | | | | 5,278 | |
| Class R4 | | | 1,574 | | | | 1,167 | |
| Class 529A | | | 6,768 | | | | 3,993 | |
| Total | | | $5,710,170 | | | | $4,340,173 | |
| (3) | | Transactions with Affiliates |
Investment Adviser – The fund has an investment advisory agreement with MFS to provide overall investment management and related administrative services and facilities to the fund. The management fee is computed daily and paid monthly at the following annual rates:
| | | | |
| First $1 billion of average daily net assets | | | 0.75 | % |
| Average daily net assets in excess of $1 billion | | | 0.70 | % |
The management fee incurred for the year ended September 30, 2011 was equivalent to an annual effective rate of 0.75% of the fund’s average daily net assets.
Effective July 1, 2011, the investment adviser has agreed in writing to pay a portion of the fund’s total annual operating expenses, exclusive of interest, taxes, extraordinary expenses, brokerage and transaction costs, and investment-related expenses, such that total annual fund operating expenses do not exceed the following rates annually of each class’ average daily net assets.
| | | | | | | | | | | | | | | | | | | | | | | | | | | | | | | | | | | | | | | | |
| Classes | |
| A | | B | | | C | | | I | | | R1 | | | R2 | | | R3 | | | R4 | | | 529A | | | 529B | | | 529C | |
| 1.25% | | | 2.00% | | | | 2.00% | | | | 1.00% | | | | 2.00% | | | | 1.50% | | | | 1.25% | | | | 1.00% | | | | 1.30% | | | | 2.05% | | | | 2.05% | |
This written agreement will continue until modified by the fund’s Board of Trustees, but such agreement will continue at least until January 31, 2013.
Prior to July 1, 2011, the investment adviser had agreed in writing to pay a portion of the fund’s total annual operating expenses, exclusive of interest, taxes, extraordinary expenses, brokerage and transaction costs, and
35
Notes to Financial Statements – continued
investment-related expenses, such that total annual fund operating expenses did not exceed the following rates annually of each class’ average daily net assets.
| | | | | | | | | | | | | | | | | | | | | | | | | | | | | | | | | | | | | | | | |
| Classes | |
| A | | B | | | C | | | I | | | R1 | | | R2 | | | R3 | | | R4 | | | 529A | | | 529B | | | 529C | |
| 1.25% | | | 2.00% | | | | 2.00% | | | | 1.00% | | | | 2.00% | | | | 1.50% | | | | 1.25% | | | | 1.00% | | | | 1.35% | | | | 2.10% | | | | 2.10% | |
This agreement terminated on June 30, 2011.
For the year ended September 30, 2011, the fund’s actual operating expenses did not exceed these limits and therefore, the investment adviser did not pay any portion of the fund’s expenses related to these agreements.
Distributor – MFS Fund Distributors, Inc. (MFD), a wholly-owned subsidiary of MFS, as distributor, received $42,420 and $1,749 for the year ended September 30, 2011, as its portion of the initial sales charge on sales of Class A and Class 529A shares of the fund, respectively.
The Board of Trustees has adopted a distribution plan for certain class shares pursuant to Rule 12b-1 of the Investment Company Act of 1940.
The fund’s distribution plan provides that the fund will pay MFD for services provided by MFD and financial intermediaries in connection with the distribution and servicing of certain share classes. One component of the plan is a distribution fee paid to MFD and another component of the plan is a service fee paid to MFD. MFD may subsequently pay all, or a portion, of the distribution and/or service fees to financial intermediaries.
Distribution Plan Fee Table:
| | | | | | | | | | | | | | | | | | | | |
| | | Distribution
Fee Rate (d) | | | Service Fee
Rate (d) | | | Total
Distribution
Plan (d) | | | Annual
Effective
Rate (e) | | | Distribution
and Service
Fee | |
| Class A | | | — | | | | 0.25% | | | | 0.25% | | | | 0.25% | | | | $391,428 | |
| Class B | | | 0.75% | | | | 0.25% | | | | 1.00% | | | | 1.00% | | | | 184,382 | |
| Class C | | | 0.75% | | | | 0.25% | | | | 1.00% | | | | 1.00% | | | | 222,208 | |
| Class R1 | | | 0.75% | | | | 0.25% | | | | 1.00% | | | | 1.00% | | | | 20,369 | |
| Class R2 | | | 0.25% | | | | 0.25% | | | | 0.50% | | | | 0.50% | | | | 77,541 | |
| Class R3 | | | — | | | | 0.25% | | | | 0.25% | | | | 0.25% | | | | 3,588 | |
| Class 529A | | | — | | | | 0.25% | | | | 0.25% | | | | 0.25% | | | | 3,390 | |
| Class 529B | | | 0.75% | | | | 0.25% | | | | 1.00% | | | | 1.00% | | | | 2,553 | |
| Class 529C | | | 0.75% | | | | 0.25% | | | | 1.00% | | | | 1.00% | | | | 5,955 | |
| Total Distribution and Service Fees | | | | | | | | | | | | | | | | $911,414 | |
| (d) | In accordance with the distribution plan for certain classes, the fund pays distribution and/or service fees equal to these annual percentage rates of each class’ average daily net assets. The distribution and service fee rates disclosed by class represent the current rates in effect at the end of the reporting period. |
| (e) | The annual effective rates represent actual fees incurred under the distribution plan for the year ended September 30, 2011 based on each class’ average daily net assets. |
36
Notes to Financial Statements – continued
Certain Class A shares are subject to a contingent deferred sales charge (CDSC) in the event of a shareholder redemption within 24 months of purchase. Class C and Class 529C shares are subject to a CDSC in the event of a shareholder redemption within 12 months of purchase. Class B and Class 529B shares are subject to a CDSC in the event of a shareholder redemption within six years of purchase. All contingent deferred sales charges are paid to MFD and during the year ended September 30, 2011, were as follows:
| | | | |
| | | Amount | |
| Class A | | | $47 | |
| Class B | | | 13,568 | |
| Class C | | | 2,108 | |
| Class 529B | | | 44 | |
| Class 529C | | | — | |
The fund has entered into and may from time to time enter into contracts with program managers and other parties which administer the tuition programs through which an investment in the fund’s 529 share classes is made. The fund has entered into an agreement with MFD pursuant to which MFD receives an annual fee of up to 0.10% of the average daily net assets attributable to each 529 share class. Effective July 1, 2011, MFD has agreed to waive 0.05% of this annual fee. This waiver agreement will continue until modified by the fund’s Board of Trustees but such agreement will continue at least until January 31, 2013, after which MFD may eliminate this waiver without a vote of the fund’s Board of Trustees. For the period July 1, 2011 through September 30, 2011, this waiver amounted to $278 and is reflected as a reduction of total expenses in the Statement of Operations. The services provided by MFD, or a third party with which MFD contracts, include recordkeeping and tax reporting and account services, as well as services designed to maintain the program’s compliance with the Internal Revenue Code and other regulatory requirements. Program manager fees for the year ended September 30, 2011, were as follows:
| | | | |
| | | Amount | |
| Class 529A | | | $1,356 | |
| Class 529B | | | 255 | |
| Class 529C | | | 596 | |
| Total Program Manager Fees | | | $2,207 | |
Shareholder Servicing Agent – MFS Service Center, Inc. (MFSC), a wholly-owned subsidiary of MFS, receives a fee from the fund for its services as shareholder servicing agent calculated as a percentage of the average daily net assets of the fund as determined periodically under the supervision of the fund’s Board of Trustees. For the year ended September 30, 2011, the fee was $218,129, which equated to 0.0263% annually of the fund’s average daily net assets. MFSC also receives payment from the fund for out-of-pocket expenses, sub-accounting and other shareholder servicing costs which may be paid to
37
Notes to Financial Statements – continued
affiliated and unaffiliated service providers. For the year ended September 30, 2011, these out-of-pocket expenses, sub-accounting and other shareholder servicing costs amounted to $325,812.
Under a Special Servicing Agreement among MFS, each MFS fund which invests in other MFS funds (“MFS fund-of-funds”) and certain underlying funds in which a MFS fund-of-funds invests (“underlying funds”), each underlying fund may pay a portion of each MFS fund-of-fund’s transfer agent-related expenses, including sub-accounting fees payable to financial intermediaries, to the extent such payments do not exceed the benefits realized or expected to be realized by the underlying fund from the investment in the underlying fund by the MFS fund-of-fund. For the year ended September 30, 2011, these costs for the fund amounted to $812,502 and are reflected in the shareholder servicing costs on the Statement of Operations.
Administrator – MFS provides certain financial, legal, shareholder communications, compliance, and other administrative services to the fund. Under an administrative services agreement, the fund partially reimburses MFS the costs incurred to provide these services. The fund is charged an annual fixed amount of $17,500 plus a fee based on average daily net assets. The administrative services fee incurred for the year ended September 30, 2011 was equivalent to an annual effective rate of 0.0151% of the fund’s average daily net assets.
Trustees’ and Officers’ Compensation – The fund pays compensation to independent Trustees in the form of a retainer, attendance fees, and additional compensation to Board and Committee chairpersons. The fund does not pay compensation directly to Trustees or officers of the fund who are also officers of the investment adviser, all of whom receive remuneration for their services to the fund from MFS. Certain officers and Trustees of the fund are officers or directors of MFS, MFD, and MFSC.
Other – This fund and certain other funds managed by MFS (the funds) have entered into services agreements (the Agreements) which provide for payment of fees by the funds to Tarantino LLC and Griffin Compliance LLC in return for the provision of services of an Independent Chief Compliance Officer (ICCO) and Assistant ICCO, respectively, for the funds. The ICCO and Assistant ICCO are officers of the funds and the sole members of Tarantino LLC and Griffin Compliance LLC, respectively. The funds can terminate the Agreements with Tarantino LLC and Griffin Compliance LLC at any time under the terms of the Agreements. For the year ended September 30, 2011, the aggregate fees paid by the fund to Tarantino LLC and Griffin Compliance LLC were $7,417 and are included in miscellaneous expense on the Statement of Operations. MFS has agreed to reimburse the fund for a portion of the payments made by the fund in the amount of $3,606, which is shown as a reduction of total expenses in the
38
Notes to Financial Statements – continued
Statement of Operations. Additionally, MFS has agreed to bear all expenses associated with office space, other administrative support, and supplies provided to the ICCO and Assistant ICCO.
The fund invests in the MFS Institutional Money Market Portfolio which is managed by MFS and seeks a high level of current income consistent with preservation of capital and liquidity. Income earned on this investment is included in dividends from underlying affiliated funds on the Statement of Operations. This money market fund does not pay a management fee to MFS.
Purchases and sales of investments, other than U.S. Government securities, purchased option transactions, and short-term obligations, aggregated $503,657,036 and $459,431,705, respectively.
| (5) | | Shares of Beneficial Interest |
The fund’s Declaration of Trust permits the Trustees to issue an unlimited number of full and fractional shares of beneficial interest. Transactions in fund shares were as follows:
| | | | | | | | | | | | | | | | |
| | | Year ended
9/30/11 | | | Year ended
9/30/10 | |
| | | Shares | | | Amount | | | Shares | | | Amount | |
| Shares sold | | | | | | | | | | | | | | | | |
Class A | | | 2,524,759 | | | | $33,546,619 | | | | 2,410,891 | | | | $26,270,201 | |
Class B | | | 229,760 | | | | 2,986,540 | | | | 272,246 | | | | 2,872,048 | |
Class C | | | 501,828 | | | | 6,287,048 | | | | 339,644 | | | | 3,600,688 | |
Class I | | | 6,939,618 | | | | 90,605,307 | | | | 3,160,578 | | | | 34,424,105 | |
Class R1 | | | 40,855 | | | | 515,729 | | | | 61,722 | | | | 615,381 | |
Class R2 | | | 433,659 | | | | 5,678,659 | | | | 480,498 | | | | 5,093,969 | |
Class R3 | | | 181,470 | | | | 2,470,302 | | | | 35,151 | | | | 393,910 | |
Class R4 | | | 15 | | | | 210 | | | | — | | | | — | |
Class 529A | | | 23,799 | | | | 311,624 | | | | 21,973 | | | | 239,061 | |
Class 529B | | | 2,032 | | | | 26,275 | | | | 2,531 | | | | 26,603 | |
Class 529C | | | 11,428 | | | | 141,953 | | | | 8,452 | | | | 88,735 | |
| | | 10,889,223 | | | | $142,570,266 | | | | 6,793,686 | | | | $73,624,701 | |
| Shares issued to shareholders in reinvestment of distributions | | | | | | | | | | | | | | | | |
Class A | | | 38,353 | | | | $492,835 | | | | 33,018 | | | | $335,465 | |
Class I | | | 362,892 | | | | 4,742,999 | | | | 352,070 | | | | 3,640,399 | |
Class R1 | | | — | | | | — | | | | 12 | | | | 118 | |
Class R2 | | | 4,420 | | | | 55,824 | | | | 4,325 | | | | 43,251 | |
Class R3 | | | 546 | | | | 7,018 | | | | 519 | | | | 5,278 | |
Class R4 | | | 122 | | | | 1,574 | | | | 115 | | | | 1,167 | |
Class 529A | | | 533 | | | | 6,768 | | | | 398 | | | | 3,993 | |
| | | 406,866 | | | | $5,307,018 | | | | 390,457 | | | | $4,029,671 | |
39
Notes to Financial Statements – continued
| | | | | | | | | | | | | | | | |
| | | Year ended
9/30/11 | | | Year ended
9/30/10 | |
| | | Shares | | | Amount | | | Shares | | | Amount | |
| Shares reacquired | | | | | | | | | | | | | | | | |
Class A | | | (2,734,009 | ) | | | $(36,291,456 | ) | | | (2,735,096 | ) | | | $(29,175,424 | ) |
Class B | | | (607,592 | ) | | | (7,770,446 | ) | | | (976,028 | ) | | | (10,221,638 | ) |
Class C | | | (492,855 | ) | | | (6,258,110 | ) | | | (461,568 | ) | | | (4,785,444 | ) |
Class I | | | (2,770,454 | ) | | | (37,279,062 | ) | | | (4,881,276 | ) | | | (53,661,339 | ) |
Class R1 | | | (33,204 | ) | | | (420,869 | ) | | | (58,992 | ) | | | (616,073 | ) |
Class R2 | | | (457,047 | ) | | | (5,920,345 | ) | | | (444,801 | ) | | | (4,692,697 | ) |
Class R3 | | | (71,664 | ) | | | (959,857 | ) | | | (48,286 | ) | | | (526,919 | ) |
Class R4 | | | (15 | ) | | | (209 | ) | | | — | | | | — | |
Class 529A | | | (8,371 | ) | | | (107,317 | ) | | | (7,961 | ) | | | (86,981 | ) |
Class 529B | | | (7,873 | ) | | | (101,903 | ) | | | (1,268 | ) | | | (12,633 | ) |
Class 529C | | | (2,709 | ) | | | (33,700 | ) | | | (8,484 | ) | | | (89,135 | ) |
| | | (7,185,793 | ) | | | $(95,143,274 | ) | | | (9,623,760 | ) | | | $(103,868,283 | ) |
| Net change | | | | | | | | | | | | | | | | |
Class A | | | (170,897 | ) | | | $(2,252,002 | ) | | | (291,187 | ) | | | $(2,569,758 | ) |
Class B | | | (377,832 | ) | | | (4,783,906 | ) | | | (703,782 | ) | | | (7,349,590 | ) |
Class C | | | 8,973 | | | | 28,938 | | | | (121,924 | ) | | | (1,184,756 | ) |
Class I | | | 4,532,056 | | | | 58,069,244 | | | | (1,368,628 | ) | | | (15,596,835 | ) |
Class R1 | | | 7,651 | | | | 94,860 | | | | 2,742 | | | | (574 | ) |
Class R2 | | | (18,968 | ) | | | (185,862 | ) | | | 40,022 | | | | 444,523 | |
Class R3 | | | 110,352 | | | | 1,517,463 | | | | (12,616 | ) | | | (127,731 | ) |
Class R4 | | | 122 | | | | 1,575 | | | | 115 | | | | 1,167 | |
Class 529A | | | 15,961 | | | | 211,075 | | | | 14,410 | | | | 156,073 | |
Class 529B | | | (5,841 | ) | | | (75,628 | ) | | | 1,263 | | | | 13,970 | |
Class 529C | | | 8,719 | | | | 108,253 | | | | (32 | ) | | | (400 | ) |
| | | 4,110,296 | | | | $52,734,010 | | | | (2,439,617 | ) | | | $(26,213,911 | ) |
The fund is one of several mutual funds in which the MFS funds-of-funds may invest. The MFS funds-of-funds do not invest in the underlying MFS funds for the purpose of exercising management or control. At the end of the period, the MFS Growth Allocation Fund, MFS Moderate Allocation Fund, MFS Aggressive Growth Allocation Fund, MFS Conservative Allocation Fund, MFS Lifetime 2030 Fund, and MFS Lifetime 2020 Fund were the owners of record of approximately 28%, 23%, 13%, 7%, 1%, and 1%, respectively, of the value of outstanding voting shares of the fund. In addition, the MFS Lifetime 2050 Fund, MFS Lifetime 2040 Fund, MFS Lifetime 2010 Fund, and the MFS Lifetime Retirement Income Fund were each the owners of record of less than 1% of the value of outstanding voting shares of the fund.
The fund and certain other funds managed by MFS participate in a $1.1 billion unsecured committed line of credit, subject to a $1 billion sublimit, provided
40
Notes to Financial Statements – continued
by a syndication of banks under a credit agreement. Borrowings may be made for temporary financing needs. Interest is charged to each fund, based on its borrowings, generally at a rate equal to the higher of the Federal Reserve funds rate or one month LIBOR plus an agreed upon spread. A commitment fee, based on the average daily, unused portion of the committed line of credit, is allocated among the participating funds at the end of each calendar quarter. In addition, the fund and other funds managed by MFS have established unsecured uncommitted borrowing arrangements with certain banks for temporary financing needs. Interest is charged to each fund, based on its borrowings, at a rate equal to the Federal Reserve funds rate plus an agreed upon spread. For the year ended September 30, 2011, the fund’s commitment fee and interest expense were $6,894 and $0, respectively, and are included in miscellaneous expense on the Statement of Operations.
| (7) | | Transactions in Underlying Affiliated Funds-Affiliated Issuers |
An affiliated issuer may be considered one in which the fund owns 5% or more of the outstanding voting securities, or a company which is under common control. For the purposes of this report, the fund assumes the following to be affiliated issuers:
| | | | | | | | | | | | | | | | |
| Underlying Affiliated Funds | | Beginning
Shares/Par
Amount | | | Acquisitions
Shares/Par
Amount | | | Dispositions
Shares/Par
Amount | | | Ending
Shares/Par
Amount | |
MFS Institutional Money
Market Portfolio | | | 9,620,339 | | | | 212,032,603 | | | | (189,271,983 | ) | | | 32,380,959 | |
| | | | |
| Underlying Affiliated Funds | | Realized
Gain (Loss) | | | Capital Gain
Distributions | | | Dividend
Income | | | Ending
Value | |
MFS Institutional Money
Market Portfolio | | | $— | | | | $— | | | | $23,943 | | | | $32,380,959 | |
41
REPORT OF INDEPENDENT REGISTERED PUBLIC ACCOUNTING FIRM
To the Board of Trustees of MFS Series Trust XI and Shareholders of MFS Mid Cap Value Fund:
We have audited the accompanying statement of assets and liabilities of MFS Mid Cap Value Fund (the Fund) (one of the portfolios comprising MFS Series Trust XI), including the portfolio of investments, as of September 30, 2011, and the related statement of operations for the year then ended, the statements of changes in net assets for each of the two years in the period then ended, and the financial highlights for each of the five years in the period then ended. These financial statements and financial highlights are the responsibility of the Fund’s management. Our responsibility is to express an opinion on these financial statements and financial highlights based on our audits.
We conducted our audits in accordance with the standards of the Public Company Accounting Oversight Board (United States). Those standards require that we plan and perform the audit to obtain reasonable assurance about whether the financial statements and financial highlights are free of material misstatement. We were not engaged to perform an audit of the Fund’s internal control over financial reporting. Our audits included consideration of internal control over financial reporting as a basis for designing audit procedures that are appropriate in the circumstances, but not for the purpose of expressing an opinion on the effectiveness of the Fund’s internal control over financial reporting. Accordingly, we express no such opinion. An audit also includes examining, on a test basis, evidence supporting the amounts and disclosures in the financial statements and financial highlights, assessing the accounting principles used and significant estimates made by management, and evaluating the overall financial statement presentation. Our procedures included confirmation of securities owned as of September 30, 2011, by correspondence with the custodian and brokers or by other appropriate auditing procedures where replies from brokers were not received. We believe that our audits provide a reasonable basis for our opinion.
In our opinion, the financial statements and financial highlights referred to above present fairly, in all material respects, the financial position of the MFS Mid Cap Value Fund at September 30, 2011, the results of its operations for the year then ended, the changes in its net assets for each of the two years in the period then ended, and its financial highlights for each of the five years in the period then ended, in conformity with U.S. generally accepted accounting principles.

Boston, Massachusetts
November 15, 2011
42
TRUSTEES AND OFFICERS — IDENTIFICATION AND BACKGROUND
The Trustees and officers of the Trust, as of November 1, 2011, are listed below, together with their principal occupations during the past five years. (Their titles may have varied during that period.) The address of each Trustee and officer is 500 Boylston Street, Boston, Massachusetts 02116.
| | | | | | | | |
Name, Age | | Position(s) Held with Fund | | Trustee/Officer
Since (h) | | Principal Occupations
During the Past Five Years | | Other
Directorships (j) |
| INTERESTED TRUSTEES |
Robert J. Manning (k) (age 48) | | Trustee | | February 2004 | | Massachusetts Financial Services Company, Chairman, Chief Executive Officer and Director; President (until December 2009); Chief Investment Officer (until July 2010) | | N/A |
Robert C. Pozen (k) (age 65) | | Trustee | | February 2004 | | Massachusetts Financial Services Company, Chairman Emeritus; Chairman (until July 2010) | | Medtronic, Inc, (medical devices), Director (since 2004); The NielsenCompany (market research), Director (since 2010); Telesat (satellite communications), Director (until November 2007); Bell Canada Enterprises (telecommunications), Director (until February 2009) |
| INDEPENDENT TRUSTEES | | | | | | |
David H. Gunning (age 69) | | Trustee and Chair of Trustees | | January 2004 | | Retired; Cleveland-Cliffs Inc. (mining products and service provider), Vice Chairman/Director (until May 2007) | | Lincoln Electric Holdings, Inc. (welding equipment manufacturer), Director; Development Alternatives, Inc. (consulting), Director/Non-Executive Chairman; Portman Limited (mining), Director (until 2008) |
43
Trustees and Officers – continued
| | | | | | | | |
Name, Age | | Position(s) Held with Fund | | Trustee/Officer
Since (h) | | Principal Occupations
During the Past Five Years | | Other
Directorships (j) |
Robert E. Butler (age 69) | | Trustee | | January 2006 | | Consultant – investment company industry regulatory and compliance matters | | N/A |
Maureen R. Goldfarb (age 56) | | Trustee | | January 2009 | | Private investor | | N/A |
William R. Gutow (age 70) | | Trustee | | December 1993 | | Private investor and real estate consultant; Capitol Entertainment Management Company (video franchise), Vice Chairman | | Atlantic Coast Tan (tanning salons), Vice Chairman (until 2007); Texas Donuts (donut franchise), Vice Chairman (until 2010) |
Michael Hegarty (age 66) | | Trustee | | December 2004 | | Private investor | | N/A |
John P. Kavanaugh (age 56) | | Trustee | | January 2009 | | Private investor; The Hanover Insurance Group, Inc., Vice President and Chief Investment Officer (until 2006); Allmerica Investment Trust, Allmerica Securities Trust and Opus Investment Trust (investment companies), Chairman, President and Trustee (until 2006) | | N/A |
J. Dale Sherratt (age 73) | | Trustee | | June 1989 | | Insight Resources, Inc. (acquisition planning specialists), President; Wellfleet Investments (investor in health care companies), Managing General Partner | | N/A |
Laurie J. Thomsen (age 54) | | Trustee | | March 2005 | | Private investor; New Profit, Inc. (venture philanthropy), Executive Partner (until 2010) | | The Travelers Companies (property and casualty insurance), Director |
Robert W. Uek (age 70) | | Trustee | | January 2006 | | Consultant to investment company industry | | N/A |
44
Trustees and Officers – continued
| | | | | | | | |
Name, Age | | Position(s) Held with Fund | | Trustee/Officer
Since (h) | | Principal Occupations
During the Past Five Years | | Other
Directorships (j) |
| OFFICERS | | | | | | | | |
Maria F. DiOrioDwyer (k) (age 52) | | President | | March 2004 | | Massachusetts Financial Services Company, Executive Vice President and Chief Regulatory Officer Chief Compliance Officer (since December 2006) | | N/A |
Christopher R. Bohane (k) (age 37) | | Assistant
Secretary and Assistant Clerk | | July 2005 | | Massachusetts Financial Services Company, Vice President and Senior Counsel | | N/A |
John M. Corcoran (k) (age 46) | | Treasurer | | October 2008 | | Massachusetts Financial Services Company, Senior Vice President (since October 2008); State Street Bank and Trust (financial services provider), Senior Vice President, (until September 2008) | | N/A |
Ethan D. Corey (k) (age 47) | | Assistant
Secretary and Assistant Clerk | | July 2005 | | Massachusetts Financial Services Company, Senior Vice President and Associate General Counsel | | N/A |
David L. DiLorenzo (k) (age 43) | | Assistant
Treasurer | | July 2005 | | Massachusetts Financial Services Company, Vice President | | N/A |
Timothy M. Fagan (k) (age 43) | | Assistant
Secretary and Assistant Clerk | | September 2005 | | Massachusetts Financial Services Company, Vice President and Senior Counsel | | N/A |
45
Trustees and Officers – continued
| | | | | | | | |
Name, Age | | Position(s) Held with Fund | | Trustee/Officer
Since (h) | | Principal Occupations
During the Past Five Years | | Other
Directorships (j) |
Robyn L. Griffin (age 36) | | Assistant Independent Chief Compliance Officer | | August 2008 | | Griffin Compliance LLC (provider of compliance services), Principal (since August 2008); State Street Corporation (financial services provider), Mutual Fund Administration Assistant Vice President (October 2006 – July 2008); Liberty Mutual Group (insurance), Personal Market Assistant Controller (April 2006 – October 2006); Deloitte & Touche LLP (professional services firm). | | N/A |
Brian E. Langenfeld (k) (age 38) | | Assistant Secretary and Assistant Clerk | | June 2006 | | Massachusetts Financial Services Company, Vice President and Senior Counsel | | N/A |
Ellen Moynihan (k) (age 53) | | Assistant Treasurer | | April 1997 | | Massachusetts Financial Services Company, Senior Vice President | | N/A |
Susan S. Newton (k) (age 61) | | Assistant
Secretary and Assistant Clerk | | May 2005 | | Massachusetts Financial Services Company, Senior Vice President and Associate General Counsel | | N/A |
Susan A. Pereira (k) (age 40) | | Assistant Secretary and Assistant Clerk | | July 2005 | | Massachusetts Financial Services Company, Vice President and Senior Counsel | | N/A |
Mark N. Polebaum (k) (age 59) | | Secretary and Clerk | | January 2006 | | Massachusetts Financial Services Company, Executive Vice President, General Counsel and Secretary | | N/A |
46
Trustees and Officers – continued
| | | | | | | | |
Name, Age | | Position(s) Held with Fund | | Trustee/Officer
Since (h) | | Principal Occupations
During the Past Five Years | | Other
Directorships (j) |
Frank L. Tarantino (age 67) | | Independent
Chief Compliance Officer | | June 2004 | | Tarantino LLC (provider of compliance services), Principal | | N/A |
Richard S. Weitzel (k) (age 41) | | Assistant Secretary and Assistant Clerk | | October 2007 | | Massachusetts Financial Services Company, Vice President and Assistant General Counsel | | N/A |
James O. Yost (k) (age 51) | | Assistant Treasurer | | September 1990 | | Massachusetts Financial Services Company, Senior Vice President | | N/A |
| (h) | Date first appointed to serve as Trustee/officer of an MFS fund. Each Trustee has served continuously since appointment unless indicated otherwise. For the period from December 15, 2004 until February 22, 2005, Messrs. Pozen and Manning served as Advisory Trustees. For the period March 2008 until October 2008, Ms. DiOrioDwyer served as Treasurer of the Funds. |
| (j) | Directorships or trusteeships of companies required to report to the Securities and Exchange Commission (i.e., “public companies”). |
| (k) | “Interested person” of the Trust within the meaning of the Investment Company Act of 1940 (referred to as the 1940 Act), which is the principal federal law governing investment companies like the fund, as a result of position with MFS. The address of MFS is 500 Boylston Street, Boston, Massachusetts 02116. |
Each Trustee has been elected by shareholders and each Trustee and officer holds office until his or her successor is chosen and qualified or until his or her earlier death, resignation, retirement or removal. The Trust does not hold annual meetings for the purpose of electing Trustees, and Trustees are not elected for fixed terms. Messrs. Butler, Kavanaugh, Uek and Ms. Thomsen are members of the Trust’s Audit Committee.
Each of the Fund’s Trustees and officers holds comparable positions with certain other funds of which MFS or a subsidiary is the investment adviser or distributor, and, in the case of the officers, with certain affiliates of MFS. As of January 1, 2011, the Trustees served as board members of 105 funds within the MFS Family of Funds.
47
Trustees and Officers – continued
The Statement of Additional Information for the Fund includes further information about the Trustees and is available without charge upon request by calling 1-800-225-2606.
| | |
| Investment Adviser | | Custodian |
Massachusetts Financial Services Company
500 Boylston Street, Boston, MA 02116-3741 | | State Street Bank and Trust 1 Lincoln Street, Boston, MA 02111-2900 |
| Distributor | | Independent Registered Public Accounting Firm |
MFS Fund Distributors, Inc.
500 Boylston Street, Boston, MA 02116-3741 | | Ernst & Young LLP 200 Clarendon Street, Boston, MA 02116 |
| Portfolio Managers | | |
Kevin Schmitz Brooks Taylor | | |
48
BOARD REVIEW OF INVESTMENT ADVISORY AGREEMENT
The Investment Company Act of 1940 requires that both the full Board of Trustees and a majority of the non-interested (“independent”) Trustees, voting separately, annually approve the continuation of the Fund’s investment advisory agreement with MFS. The Trustees consider matters bearing on the Fund and its advisory arrangements at their meetings throughout the year, including a review of performance data at each regular meeting. In addition, the independent Trustees met several times over the course of three months beginning in May and ending in July, 2011 (“contract review meetings”) for the specific purpose of considering whether to approve the continuation of the investment advisory agreement for the Fund and the other investment companies that the Board oversees (the “MFS Funds”). The independent Trustees were assisted in their evaluation of the Fund’s investment advisory agreement by independent legal counsel, from whom they received separate legal advice and with whom they met separately from MFS during various contract review meetings. The independent Trustees were also assisted in this process by the MFS Funds’ Independent Chief Compliance Officer, a full-time senior officer appointed by and reporting to the independent Trustees.
In connection with their deliberations regarding the continuation of the investment advisory agreement, the Trustees, including the independent Trustees, considered such information and factors as they believed, in light of the legal advice furnished to them and their own business judgment, to be relevant. The investment advisory agreement for the Fund was considered separately, although the Trustees also took into account the common interests of all MFS Funds in their review. As described below, the Trustees considered the nature, quality, and extent of the various investment advisory, administrative, and shareholder services performed by MFS under the existing investment advisory agreement and other arrangements with the Fund.
In connection with their contract review meetings, the Trustees received and relied upon materials that included, among other items: (i) information provided by Lipper Inc., an independent third party, on the investment performance of the Fund for various time periods ended December 31, 2010 and the investment performance of a group of funds with substantially similar investment classifications/objectives (the “Lipper performance universe”), (ii) information provided by Lipper Inc. on the Fund’s advisory fees and other expenses and the advisory fees and other expenses of comparable funds identified by Lipper Inc. (the “Lipper expense group”), (iii) information provided by MFS on the advisory fees of comparable portfolios of other clients of MFS, including institutional separate accounts and other clients, (iv) information as to whether and to what extent applicable expense waivers,
49
Board Review of Investment Advisory Agreement – continued
reimbursements or fee “breakpoints” are observed for the Fund, (v) information regarding MFS’ financial results and financial condition, including MFS’ and certain of its affiliates’ estimated profitability from services performed for the Fund and the MFS Funds as a whole, and compared to MFS’ institutional business, (vi) MFS’ views regarding the outlook for the mutual fund industry and the strategic business plans of MFS, (vii) descriptions of various functions performed by MFS for the Funds, such as compliance monitoring and portfolio trading practices, and (viii) information regarding the overall organization of MFS, including information about MFS’ senior management and other personnel providing investment advisory, administrative and other services to the Fund and the other MFS Funds. The comparative performance, fee and expense information prepared and provided by Lipper Inc. was not independently verified and the independent Trustees did not independently verify any information provided to them by MFS.
The Trustees’ conclusion as to the continuation of the investment advisory agreement was based on a comprehensive consideration of all information provided to the Trustees and not the result of any single factor. Some of the factors that figured particularly in the Trustees’ deliberations are described below, although individual Trustees may have evaluated the information presented differently from one another, giving different weights to various factors. It is also important to recognize that the fee arrangements for the Fund and other MFS Funds are the result of years of review and discussion between the independent Trustees and MFS, that certain aspects of such arrangements may receive greater scrutiny in some years than in others, and that the Trustees’ conclusions may be based, in part, on their consideration of these same arrangements during the course of the year and in prior years.
Based on information provided by Lipper Inc., the Trustees reviewed the Fund’s total return investment performance as well as the performance of peer groups of funds over various time periods. The Trustees placed particular emphasis on the total return performance of the Fund’s Class A shares in comparison to the performance of funds in its Lipper performance universe over the three-year period ended December 31, 2010, which the Trustees believed was a long enough period to reflect differing market conditions. The total return performance of the Fund’s Class A shares was in the 3rd quintile relative to the other funds in the universe for this three-year period (the 1st quintile being the best performers and the 5th quintile being the worst performers). The total return performance of the Fund’s Class A shares was in the 1st quintile for the one-year period and the 4th quintile for the five-year period ended December 31, 2010 relative to the Lipper performance universe. Because of the passage of time, these performance results are likely to differ from the performance results for more recent periods, including those shown elsewhere in this report.
50
Board Review of Investment Advisory Agreement – continued
In the course of their deliberations, the Trustees took into account information provided by MFS in connection with the contract review meetings, as well as during investment review meetings conducted with portfolio management personnel during the course of the year regarding the Fund’s performance. After reviewing these and related factors, the Trustees concluded, within the context of their overall conclusions regarding the investment advisory agreement, that they were satisfied with MFS’ responses and efforts relating to investment performance.
In assessing the reasonableness of the Fund’s advisory fee, the Trustees considered, among other information, the Fund’s advisory fee and the total expense ratio of the Fund’s Class A shares as a percentage of average daily net assets and the advisory fee and total expense ratios of peer groups of funds based on information provided by Lipper Inc. The Trustees considered that MFS currently observes an expense limitation for the Fund, which may not be changed without the Trustees’ approval. The Trustees also considered that, according to the Lipper data (which takes into account any fee reductions or expense limitations that were in effect during the Fund's last fiscal year), the Fund’s effective advisory fee rate and total expense ratio were each approximately at the Lipper expense group median.
The Trustees also considered the advisory fees charged by MFS to institutional accounts. In comparing these fees, the Trustees considered information provided by MFS as to the generally broader scope of services provided by MFS to the Fund in comparison to institutional accounts, the higher demands placed on MFS’ investment personnel and trading infrastructure as a result of the daily cash in-flows and out-flows of the Fund, and the impact on MFS and expenses associated with the more extensive regulatory regime to which the Fund is subject in comparison to institutional accounts.
The Trustees also considered whether the Fund is likely to benefit from any economies of scale in the management of the Fund in the event of growth in assets of the Fund. They noted that the Fund’s advisory fee rate schedule is subject to a contractual breakpoint that reduces the Fund’s advisory fee rate on average daily net assets over $1 billion. The Trustees concluded that the existing breakpoint was sufficient to allow the Fund to benefit from economies of scale as its assets grow.
The Trustees also considered information prepared by MFS relating to MFS’ costs and profits with respect to the Fund, the MFS Funds considered as a group, and other investment companies and accounts advised by MFS, as well as MFS’ methodologies used to determine and allocate its costs to the MFS Funds, the Fund and other accounts and products for purposes of estimating profitability.
51
Board Review of Investment Advisory Agreement – continued
After reviewing these and other factors described herein, the Trustees concluded, within the context of their overall conclusions regarding the investment advisory agreement, that the advisory fees charged to the Fund represent reasonable compensation in light of the services being provided by MFS to the Fund.
In addition, the Trustees considered MFS’ resources and related efforts to continue to retain, attract and motivate capable personnel to serve the Fund. The Trustees also considered current and developing conditions in the financial services industry, including the presence of large and well-capitalized companies which are spending, and appear to be prepared to continue to spend, substantial sums to engage personnel and to provide services to competing investment companies. In this regard, the Trustees also considered the financial resources of MFS and its ultimate parent, Sun Life Financial Inc. The Trustees also considered the advantages and possible disadvantages to the Fund of having an adviser that also serves other investment companies as well as other accounts.
The Trustees also considered the nature, quality, cost, and extent of administrative, transfer agency, and distribution services provided to the Fund by MFS and its affiliates under agreements and plans other than the investment advisory agreement, including any 12b-1 fees the Fund pays to MFS Fund Distributors, Inc., an affiliate of MFS. The Trustees also considered the nature, extent and quality of certain other services MFS performs or arranges for on the Fund’s behalf, which may include securities lending programs, directed expense payment programs, class action recovery programs, and MFS’ interaction with third-party service providers, principally custodians and sub-custodians. The Trustees concluded that the various non-advisory services provided by MFS and its affiliates on behalf of the Fund were satisfactory.
The Trustees also considered benefits to MFS from the use of the Fund’s portfolio brokerage commissions, if applicable, to pay for investment research, and various other factors. Additionally, the Trustees considered so-called “fall-out benefits” to MFS such as reputational value derived from serving as investment manager to the Fund.
Based on their evaluation of factors that they deemed to be material, including those factors described above, the Board of Trustees, including a majority of the independent Trustees, concluded that the Fund’s investment advisory agreement with MFS should be continued for an additional one-year period, commencing August 1, 2011.
A discussion regarding the Board’s most recent review and renewal of the fund’s Investment Advisory Agreement with MFS is available by clicking on the fund’s name under “Mutual Funds” in the “Products and Performance” section of the MFS Web site (mfs.com).
52
PROXY VOTING POLICIES AND INFORMATION
A general description of the MFS funds’ proxy voting policies and procedures is available without charge, upon request, by calling
1-800-225-2606, by visiting the Proxy Voting section of mfs.com or by visiting the SEC’s Web site at http://www.sec.gov.
Information regarding how the fund voted proxies relating to portfolio securities during the most recent twelve-month period ended June 30 is available without charge by visiting the Proxy Voting section of mfs.com or by visiting the SEC’s Web site at http://www.sec.gov.
QUARTERLY PORTFOLIO DISCLOSURE
The fund will file a complete schedule of portfolio holdings with the Securities and Exchange Commission (the Commission) for the first and third quarters of each fiscal year on Form N-Q. The fund’s Form N-Q may be reviewed and copied at the:
Public Reference Room
Securities and Exchange Commission
100 F Street, NE, Room 1580
Washington, D.C. 20549
Information on the operation of the Public Reference Room may be obtained by calling the Commission at 1-800-SEC-0330. The fund’s Form N-Q is available on the EDGAR database on the Commission’s Internet Web site at http://www.sec.gov, and copies of this information may be obtained, upon payment of a duplicating fee, by electronic request at the following e-mail address: publicinfo@sec.gov or by writing the Public Reference Section at the above address.
A shareholder can also obtain the quarterly portfolio holdings report at mfs.com.
FURTHER INFORMATION
From time to time, MFS may post important information about the fund or the MFS funds on the MFS web site (mfs.com). This information is available by visiting the “News & Commentary” section of mfs.com or by clicking on the fund’s name under “Mutual Funds” in the “Products and Performance” section of mfs.com.
FEDERAL TAX INFORMATION (unaudited)
The fund will notify shareholders of amounts for use in preparing 2011 income tax forms in January 2012. The following is provided pursuant to provisions of the Internal Revenue Code.
The fund designates the maximum amount allowable as qualified dividend income eligible for the 15% tax rate.
For corporate shareholders, 100% of the ordinary income dividends paid during the fiscal year qualify for the corporate dividends received deduction.
53
rev. 3/11
| | | | |
| FACTS | | WHAT DOES MFS DO WITH YOUR PERSONAL INFORMATION? | |  |
| | |
| Why? | | Financial companies choose how they share your personal information. Federal law gives consumers the right to limit some but not all sharing. Federal law also requires us to tell you how we collect, share, and protect your personal information. Please read this notice carefully to understand what we do. |
| | |
| What? | | The types of personal information we collect and share depend on the product or service you have with us. This information can include: •Social Security number and account balances •Account transactions and transaction history •Checking account information and wire transfer instructions When you are no longer our customer, we continue to share your information as described in this notice. |
| | |
| How? | | All financial companies need to share customers’ personal information to run their everyday business. In the section below, we list the reasons financial companies can share their customers’ personal information; the reasons MFS chooses to share; and whether you can limit this sharing. |
| | | | |
| Reasons we can share your personal information | | Does MFS share? | | Can you limit
this sharing? |
For our everyday business purposes – such as to process your transactions, maintain your account(s), respond to court orders and legal investigations, or report to credit bureaus | | Yes | | No |
For our marketing purposes – to offer our products and services to you | | No | | We don’t share |
| For joint marketing with other financial companies | | No | | We don’t share |
For our affiliates’ everyday business purposes – information about your transactions and experiences | | No | | We don’t share |
For our affiliates’ everyday business purposes – information about your creditworthiness | | No | | We don’t share |
| For nonaffiliates to market to you | | No | | We don’t share |
| | |
| Questions? | | Call 800-225-2606 or go to mfs.com. |
54
| | |
| Who we are |
| Who is providing this notice? | | MFS Funds, MFS Investment Management, MFS Institutional Advisors, Inc., MFS Fund Distributors, Inc., MFS Heritage Trust Company, and MFS Service Center, Inc. |
| | |
| What we do |
| How does MFS protect my personal information? | | To protect your personal information from unauthorized access and use, we use security measures that comply with federal law. These measures include procedural, electronic, and physical safeguards for the protection of the personal information we collect about you. |
How does MFS
collect my personal information? | | We collect your personal information, for example, when you •open an account or provide account information •direct us to buy securities or direct us to sell your securities •make a wire transfer We also collect your personal information from others, such as credit bureaus, affiliates and other companies. |
| Why can’t I limit all sharing? | | Federal law gives you the right to limit only •sharing for affiliates’ everyday business purposes – information about your creditworthiness •affiliates from using your information to market to you •sharing for nonaffiliates to market to you State laws and individual companies may give you additional rights to limit sharing. |
| | |
| Definitions |
| Affiliates | | Companies related by common ownership or control. They can be financial and nonfinancial companies. •MFS does not share personal information with affiliates, except for everyday business purposes as described on page one of this notice. |
| Nonaffiliates | | Companies not related by common ownership or control. They can be financial and nonfinancial companies. •MFS does not share with nonaffiliates so they can market to you. |
| Joint Marketing | | A formal agreement between nonaffiliated financial companies that together market financial products or services to you. •MFS doesn’t jointly market. |
| | |
| Other important information |
| If you own an MFS product or receive an MFS service in the name of a third party such as a bank or broker-dealer, their privacy policy may apply to you instead of ours. |
55
Save paper with eDelivery.
MFS® will send you prospectuses, reports, and proxies directly via e-mail so you will get information faster with less mailbox clutter.
To sign up:
1. Go to mfs.com.
2. Log in via MFS® Access.
3. Select eDelivery.
If you own your MFS fund shares through a financial institution or a retirement plan, MFS® TALK, MFS® Access, or eDelivery may not be available to you.

Web site
mfs.com
MFS TALK
1-800-637-8255
24 hours a day
Account service and literature
Shareholders
1-800-225-2606
Financial advisors
1-800-343-2829
Retirement plan services
1-800-637-1255
Mailing address
MFS Service Center, Inc.
P.O. Box 55824
Boston, MA 02205-5824
Overnight mail
MFS Service Center, Inc.
c/o Boston Financial Data Services
30 Dan Road
Canton, MA 02021-2809

MFS® Blended Research®
Core Equity Fund

ANNUAL REPORT
September 30, 2011
UNE-ANN
MFS® BLENDED RESEARCH®
CORE EQUITY FUND
SIPC Contact Information: You may obtain information about the Securities Investor Protection Corporation (“SIPC”), including the SIPC Brochure, by contacting SIPC either by telephone (1-202-371-8300) or by accessing SIPC’s web site address (www.sipc.org).
The report is prepared for the general information of shareholders. It is authorized for distribution to prospective investors only when preceded or accompanied by a current prospectus.
NOT FDIC INSURED Ÿ MAY LOSE VALUE Ÿ NO BANK GUARANTEE

LETTER FROM THE CEO
Dear Shareholders:
We are indeed living through some volatile times. Economic uncertainty is everywhere, as it seems no place in the world has been unmoved by crisis this year. We have seen a devastating earthquake and tsunami that have led to disruptions in the Japanese markets and supply chains. Protests have changed the face of the Middle East and left in their wake lingering tensions and resultant higher oil prices. We have seen debt limits tested in Europe and the United States and policymakers grappling to craft often unpopular monetary and fiscal responses at a time when consumers and businesses struggle with what appears to be a slowing global economy. On top of all of that, we have seen long-term U.S. debt lose its Standard & Poor’s AAA rating.
When markets become volatile, managing risk becomes a top priority for investors and their advisors. At MFS® risk management is foremost in our minds in all market climates. Our analysts and portfolio managers keep risks firmly in mind when evaluating securities. Additionally, we have a team of quantitative analysts that measures and assesses the risk profiles of our portfolios and securities on an ongoing basis. The chief investment risk officer, who oversees the team, reports directly to the firm’s president and chief investment officer so the risk associated with each portfolio can be assessed objectively and independently of the portfolio management team.
As always, we continue to be mindful of the many economic challenges faced at the local, national, and international levels. It is in times such as these that we want to remind investors of the merits of maintaining a long-term view, adhering to basic investing principles such as asset allocation and diversification, and working closely with their advisors to research and identify appropriate investment opportunities.
Respectfully,

Robert J. Manning
Chairman and Chief Executive Officer
MFS Investment Management®
November 15, 2011
The opinions expressed in this letter are subject to change, may not be relied upon for investment advice, and no forecasts can be guaranteed.
1
PORTFOLIO COMPOSITION
Portfolio structure

| | | | |
| Top ten holdings | | | | |
| Exxon Mobil Corp. | | | 4.7% | |
| Apple, Inc. | | | 4.5% | |
| Chevron Corp. | | | 2.9% | |
| Google, Inc., “A” | | | 2.4% | |
| McDonald’s Corp. | | | 2.2% | |
| Intel Corp. | | | 2.2% | |
| Procter & Gamble Co. | | | 2.1% | |
| Oracle Corp. | | | 2.1% | |
| JPMorgan Chase & Co. | | | 2.0% | |
| Pfizer, Inc. | | | 1.9% | |
| | | | |
| Equity sectors | | | | |
| Technology | | | 16.0% | |
| Financial Services | | | 14.3% | |
| Health Care | | | 12.1% | |
| Consumer Staples | | | 10.2% | |
| Energy | | | 9.7% | |
| Utilities & Communications | | | 8.2% | |
| Industrial Goods & Services | | | 6.5% | |
| Retailing | | | 6.4% | |
| Leisure | | | 5.5% | |
| Basic Materials | | | 4.6% | |
| Autos & Housing | | | 1.8% | |
| Special Products & Services | | | 1.7% | |
| Transportation | | | 1.6% | |
Percentages are based on net assets as of 9/30/11.
The portfolio is actively managed and current holdings may be different.
2
MANAGEMENT REVIEW
Summary of Results
For the twelve months ended September 30, 2011, Class A shares of the MFS Blended Research Core Equity Fund (the “fund”) provided a total return of 1.45%, at net asset value. This compares with a return of 1.14% for the fund’s benchmark, the Standard & Poor’s 500 Stock Index (S&P 500 Index).
Market Environment
Early in the period, the U.S. Federal Reserve (the Fed) indicated that further monetary loosening would be forthcoming if macroeconomic activity did not show signs of improvement. The prospects for, and subsequent implementation of, more easing by the Fed improved market sentiment and drove risk-asset prices markedly higher. The December agreement on a surprisingly large (relative to expectations) expansionary U.S. fiscal package also boosted sentiment. During the subsequent several months, the renewed positive market sentiment, coupled with better indications of global macroeconomic activity, pushed many asset valuations to post-crisis highs. At the same time, global sovereign bond yields rose amidst the more “risk-seeking” environment.
However, towards the middle of the period, a weakening macroeconomic backdrop and renewed concerns over Greek debt sustainability began to challenge equity valuations and pushed sovereign bond yields lower. Towards the end of the reporting period, uncertainty in financial markets continued to increase. European policy makers debated and disagreed over elements of a new Greek bailout package, while Spanish and Italian bond yields increased markedly signaling a widening European crisis. In the U.S., concerns about sovereign debt default and the long term sustainability of the trend in U.S. fiscal policy resulted in one agency downgrading U.S. credit quality. Amidst this turmoil, global equity markets declined sharply. As a result of these developments, global consumer and producer sentiment indicators fell precipitously, highly-rated sovereign bond yields hit multi-decade lows and, despite a more mixed picture emanating from the “hard” data, markets grew increasingly worried about a return to global recession.
Contributors to Performance
Stock selection in the energy sector was a key driver of outperformance relative to the S&P 500 index. The fund’s holdings of strong-performing oil and gas drilling equipment manufacturer National Oilwell Varco boosted relative results. Shares appreciated during the reporting period as commodity prices increased throughout much of the period and the outlook for new orders for the company’s rig equipment improved.
3
Management Review – continued
Stock selection in the technology sector aided relative performance, led by the timing of the fund’s ownership in shares of computer products and services provider Hewlett Packard (h). Holdings of communications equipment provider Polycom (b)(h), and an overweight position in strong-performing computer and personal electronics maker Apple, also supported relative returns. Hewlett-Packard’s stock came under pressure as the company announced sales and profit forecasts that were below expectations. Management also announced a series of strategic shifts, including the spinning-off of its personal computer unit and a multi-billion dollar acquisition of a European software company, which appeared to have shaken investor confidence in the company. Shares of Apple appreciated as the company announced record sales of iPhones and iPads, which helped the company deliver revenue and earnings above expectations.
Stock selection in the leisure sector was another positive factor for relative performance. Holdings of fast food giant McDonald’s bolstered relative results. The company reported strong sales growth across all regions as consumers accepted price increases taken during the period and as the company continued to gain market share on the back of new product offerings. Additionally, its franchised model (2/3rds of its stores are owned and operated by franchisees) somewhat insulated its margins from rising raw materials costs, enabling the company to hold up better than non-franchised peers during the period. The fund’s holdings of media company CBS also helped boost relative returns.
In other sectors, the fund’s timing of ownership in shares of financial services firm Bank of America (h), investment banking firm Goldman Sachs (h), and drug store operator Walgreen (h) benefited relative performance. Holdings of clothing retailer Abercrombie & Fitch also helped.
Detractors from Performance
Stock selection in the utilities & communications sector detracted from relative results. The fund’s holdings of wireless telecommunications carrier MetroPCS held back relative returns. After appreciating throughout most of the period, the stock fell significantly after the company released earnings which were below consensus expectations. The decline in the stock’s value was largely attributable to a higher churn rate as signs that the economy was slowing appeared to have discouraged new business. Additionally, the heightened competition in the wireless communications industry, and the need for the company to increase its capital expenditures to remain competitive, weighed on the stock.
Elsewhere, the fund’s holdings of financial services firm Citigroup, supplemental health and life insurer Aflac, printer manufacturer Lexmark International (h), software company Autodesk, insurance and financial services provider Hartford Financial Services, and oilfield services provider
4
Management Review – continued
Halliburton, weakened relative performance. The timing of the fund’s ownership in shares of diversified technology products and services company International Business Machines (IBM) and debit and credit transaction processing company MasterCard (h) also held back relative returns. Not holding shares of strong-performing internet retailer Amazon.com was another negative factor for relative results.
Respectfully,
| | |
| Matthew Krummell | | Jonathan Sage |
| Portfolio Manager | | Portfolio Manager |
| (b) | Security is not a benchmark constituent. |
| (h) | Security was not held in the portfolio at period end. |
The views expressed in this report are those of the portfolio managers only through the end of the period of the report as stated on the cover and do not necessarily reflect the views of MFS or any other person in the MFS organization. These views are subject to change at any time based on market or other conditions, and MFS disclaims any responsibility to update such views. These views may not be relied upon as investment advice or an indication of trading intent on behalf of any MFS portfolio. References to specific securities are not recommendations of such securities, and may not be representative of any MFS portfolio’s current or future investments.
5
PERFORMANCE SUMMARY THROUGH 9/30/11
The following chart illustrates a representative class of the fund’s historical performance in comparison to its benchmark(s). Performance results include the deduction of the maximum applicable sales charge and reflect the percentage change in net asset value, including reinvestment of dividends and capital gains distributions. The performance of other share classes will be greater than or less than that of the class depicted below. Benchmarks are unmanaged and may not be invested in directly. Benchmark returns do not reflect sales charges, commissions or expenses. (See Notes to Performance Summary.)
Performance data shown represents past performance and is no guarantee of future results. Investment return and principal value fluctuate so your shares, when sold, may be worth more or less than the original cost; current performance may be lower or higher than quoted. The performance shown does not reflect the deduction of taxes, if any, that a shareholder would pay on fund distributions or the redemption of fund shares.
Growth of a Hypothetical $10,000 Investment
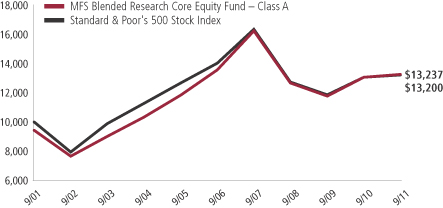
6
Performance Summary – continued
Total Returns through 9/30/11
Average annual without sales charge
| | | | | | | | | | | | | | |
| | | Share class | | Class inception date | | 1-yr | | 5-yr | | 10-Yr | | Life (t) | | |
| | | A | | 8/07/97 | | 1.45% | | (0.47)% | | 3.45% | | N/A | | |
| | | B | | 8/11/97 | | 0.74% | | (1.17)% | | 2.75% | | N/A | | |
| | | C | | 8/11/97 | | 0.77% | | (1.16)% | | 2.77% | | N/A | | |
| | | I | | 1/14/94 | | 1.73% | | (0.20)% | | 3.77% | | N/A | | |
| | | R1 | | 9/02/08 | | 0.73% | | N/A | | N/A | | (2.53)% | | |
| | | R2 | | 9/02/08 | | 1.25% | | N/A | | N/A | | (2.04)% | | |
| | | R3 | | 9/02/08 | | 1.53% | | N/A | | N/A | | (1.79)% | | |
| | | R4 | | 9/02/08 | | 1.75% | | N/A | | N/A | | (1.55)% | | |
| Comparative benchmark | | | | | | | | | | |
| | | Standard & Poor’s 500 Stock Index (f) | | 1.14% | | (1.18)% | | 2.82% | | N/A | | |
| Average annual with sales charge | | | | | | | | | | |
| | | A
With Initial Sales Charge (5.75%) | | (4.38)% | | (1.64)% | | 2.84% | | N/A | | |
| | | B
With CDSC (Declining over six years from 4% to 0%) (x) | | (3.26)% | | (1.55)% | | 2.75% | | N/A | | |
| | | C
With CDSC (1% for 12 months) (x) | | (0.23)% | | (1.16)% | | 2.77% | | N/A | | |
Class I, R1, R2, R3, and R4 shares do not have a sales charge.
CDSC – Contingent Deferred Sales Charge.
| (f) | Source: FactSet Research Systems Inc. |
| (t) | For the period from the class inception date through the stated period end (for those share classes with less than 10 years of performance history). No comparative benchmark performance information is provided for “life” periods. (See Notes to Performance Summary.) |
| (x) | Assuming redemption at the end of the applicable period. |
Benchmark Definition
Standard & Poor’s 500 Stock Index – a market capitalization-weighted index of 500 widely held equity securities, designed to measure broad U.S. equity performance.
It is not possible to invest directly in an index.
Notes to Performance Summary
Performance information prior to June 1, 2008 reflects time periods when the fund had a policy of investing at least 80% of its net assets in union-sensitive and labor-sensitive companies. This policy was eliminated effective June 1, 2008.
7
Performance Summary – continued
Average annual total return represents the average annual change in value for each share class for the periods presented. Life returns are presented where the share class has less than 10 years of performance history and represent the average annual total return from the class inception date to the stated period end date. As the fund’s share classes may have different inception dates, the life returns may represent different time periods and may not be comparable. As a result, no comparative benchmark performance information is provided for life periods.
Performance results reflect any applicable expense subsidies and waivers in effect during the periods shown. Without such subsidies and waivers the fund’s performance results would be less favorable. Please see the prospectus and financial statements for complete details.
Performance results do not include adjustments made for financial reporting purposes in accordance with U.S. generally accepted accounting principles and may differ from amounts reported in the financial highlights.
From time to time the fund may receive proceeds from litigation settlements, without which performance would be lower.
8
EXPENSE TABLE
Fund expenses borne by the shareholders during the period, April 1, 2011 through September 30, 2011
As a shareholder of the fund, you incur two types of costs: (1) transaction costs, including sales charges (loads) on certain purchase or redemption payments, and (2) ongoing costs, including management fees; distribution and service (12b-1) fees; and other fund expenses. This example is intended to help you understand your ongoing costs (in dollars) of investing in the fund and to compare these costs with the ongoing costs of investing in other mutual funds.
The example is based on an investment of $1,000 invested at the beginning of the period and held for the entire period April 1, 2011 through September 30, 2011.
Actual Expenses
The first line for each share class in the following table provides information about actual account values and actual expenses. You may use the information in this line, together with the amount you invested, to estimate the expenses that you paid over the period. Simply divide your account value by $1,000 (for example, an $8,600 account value divided by $1,000 = 8.6), then multiply the result by the number in the first line under the heading entitled “Expenses Paid During Period” to estimate the expenses you paid on your account during this period.
Hypothetical Example for Comparison Purposes
The second line for each share class in the following table provides information about hypothetical account values and hypothetical expenses based on the fund’s actual expense ratio and an assumed rate of return of 5% per year before expenses, which is not the fund’s actual return. The hypothetical account values and expenses may not be used to estimate the actual ending account balance or expenses you paid for the period. You may use this information to compare the ongoing costs of investing in the fund and other funds. To do so, compare this 5% hypothetical example with the 5% hypothetical examples that appear in the shareholder reports of the other funds.
Please note that the expenses shown in the table are meant to highlight your ongoing costs only and do not reflect any transactional costs, such as sales charges (loads). Therefore, the second line for each share class in the table is useful in comparing ongoing costs only, and will not help you determine the relative total costs of owning different funds. In addition, if these transactional costs were included, your costs would have been higher.
9
Expense Table – continued
| | | | | | | | | | | | | | | | | | |
Share
Class | | | | Annualized
Expense
Ratio | | | Beginning
Account Value
4/01/11 | | | Ending
Account Value
9/30/11 | | | Expenses
Paid During
Period (p)
4/01/11-9/30/11 | |
| A | | Actual | | | 0.90% | | | | $1,000.00 | | | | $858.81 | | | | $4.19 | |
| | Hypothetical (h) | | | 0.90% | | | | $1,000.00 | | | | $1,020.56 | | | | $4.56 | |
| B | | Actual | | | 1.65% | | | | $1,000.00 | | | | $855.94 | | | | $7.68 | |
| | Hypothetical (h) | | | 1.65% | | | | $1,000.00 | | | | $1,016.80 | | | | $8.34 | |
| C | | Actual | | | 1.65% | | | | $1,000.00 | | | | $856.03 | | | | $7.68 | |
| | Hypothetical (h) | | | 1.65% | | | | $1,000.00 | | | | $1,016.80 | | | | $8.34 | |
| I | | Actual | | | 0.65% | | | | $1,000.00 | | | | $859.86 | | | | $3.03 | |
| | Hypothetical (h) | | | 0.65% | | | | $1,000.00 | | | | $1,021.81 | | | | $3.29 | |
| R1 | | Actual | | | 1.65% | | | | $1,000.00 | | | | $855.63 | | | | $7.68 | |
| | Hypothetical (h) | | | 1.65% | | | | $1,000.00 | | | | $1,016.80 | | | | $8.34 | |
| R2 | | Actual | | | 1.15% | | | | $1,000.00 | | | | $857.85 | | | | $5.36 | |
| | Hypothetical (h) | | | 1.15% | | | | $1,000.00 | | | | $1,019.30 | | | | $5.82 | |
| R3 | | Actual | | | 0.90% | | | | $1,000.00 | | | | $859.11 | | | | $4.19 | |
| | Hypothetical (h) | | | 0.90% | | | | $1,000.00 | | | | $1,020.56 | | | | $4.56 | |
| R4 | | Actual | | | 0.65% | | | | $1,000.00 | | | | $860.08 | | | | $3.03 | |
| | Hypothetical (h) | | | 0.65% | | | | $1,000.00 | | | | $1,021.81 | | | | $3.29 | |
| (h) | 5% class return per year before expenses. |
| (p) | Expenses paid is equal to each class’ annualized expense ratio, as shown above, multiplied by the average account value over the period, multiplied by the number of days in the period, divided by the number of days in the year. Expenses paid do not include any applicable sales charges (loads). If these transaction costs had been included, your costs would have been higher. |
10
PORTFOLIO OF INVESTMENTS
9/30/11
The Portfolio of Investments is a complete list of all securities owned by your fund. It is categorized by broad-based asset classes.
| | | | | | | | |
| Common Stocks - 98.6% | | | | | | | | |
| Issuer | | Shares/Par | | | Value ($) | |
| | | | | | | | |
| Aerospace - 3.7% | | | | | | | | |
| Lockheed Martin Corp. | | | 8,292 | | | $ | 602,332 | |
| Northrop Grumman Corp. | | | 12,739 | | | | 664,466 | |
| United Technologies Corp. | | | 13,380 | | | | 941,417 | |
| | | | | | | | |
| | | | | | | $ | 2,208,215 | |
| Apparel Manufacturers - 0.7% | | | | | | | | |
| Crocs, Inc. (a) | | | 17,340 | | | $ | 410,438 | |
| | |
| Automotive - 1.1% | | | | | | | | |
| Johnson Controls, Inc. | | | 25,610 | | | $ | 675,336 | |
| | |
| Biotechnology - 2.0% | | | | | | | | |
| Amgen, Inc. | | | 16,850 | | | $ | 925,908 | |
| Gilead Sciences, Inc. (a) | | | 6,380 | | | | 247,544 | |
| | | | | | | | |
| | | | | | | $ | 1,173,452 | |
| Broadcasting - 1.3% | | | | | | | | |
| CBS Corp., “B” | | | 24,310 | | | $ | 495,438 | |
| Viacom, Inc., “B” | | | 6,850 | | | | 265,369 | |
| | | | | | | | |
| | | | | | | $ | 760,807 | |
| Brokerage & Asset Managers - 0.8% | | | | | | | | |
| CME Group, Inc. | | | 2,020 | | | $ | 497,728 | |
| | |
| Business Services - 1.2% | | | | | | | | |
| Accenture PLC, “A” | | | 13,280 | | | $ | 699,590 | |
| | |
| Cable TV - 1.3% | | | | | | | | |
| DIRECTV, “A” (a) | | | 17,600 | | | $ | 743,600 | |
| | |
| Chemicals - 1.1% | | | | | | | | |
| 3M Co. | | | 9,160 | | | $ | 657,596 | |
| | |
| Computer Software - 4.9% | | | | | | | | |
| Autodesk, Inc. (a) | | | 16,040 | | | $ | 445,591 | |
| Microsoft Corp. | | | 23,532 | | | | 585,711 | |
| Oracle Corp. | | | 42,624 | | | | 1,225,014 | |
| Symantec Corp. (a) | | | 39,000 | | | | 635,700 | |
| | | | | | | | |
| | | | | | | $ | 2,892,016 | |
11
Portfolio of Investments – continued
| | | | | | | | |
| Issuer | | Shares/Par | | | Value ($) | |
| | | | | | | | |
| Common Stocks - continued | | | | | | | | |
| Computer Software - Systems - 5.6% | | | | | | | | |
| Apple, Inc. (a) | | | 7,068 | | | $ | 2,694,180 | |
| International Business Machines Corp. | | | 3,411 | | | | 597,027 | |
| | | | | | | | |
| | | | | | | $ | 3,291,207 | |
| Construction - 0.7% | | | | | | | | |
| Owens Corning (a) | | | 18,580 | | | $ | 402,814 | |
| | |
| Consumer Products - 2.1% | | | | | | | | |
| Procter & Gamble Co. | | | 19,571 | | | $ | 1,236,496 | |
| | |
| Consumer Services - 0.5% | | | | | | | | |
| ITT Educational Services, Inc. (a) | | | 5,520 | | | $ | 317,842 | |
| | |
| Electrical Equipment - 1.6% | | | | | | | | |
| General Electric Co. | | | 39,934 | | | $ | 608,594 | |
| Tyco International Ltd. | | | 8,450 | | | | 344,338 | |
| | | | | | | | |
| | | | | | | $ | 952,932 | |
| Electronics - 2.5% | | | | | | | | |
| Intel Corp. | | | 59,817 | | | $ | 1,275,897 | |
| Teradyne, Inc. (a) | | | 16,620 | | | | 182,986 | |
| | | | | | | | |
| | | | | | | $ | 1,458,883 | |
| Energy - Integrated - 8.5% | | | | | | | | |
| Chevron Corp. | | | 18,749 | | | $ | 1,734,657 | |
| ConocoPhillips | | | 7,880 | | | | 498,962 | |
| Exxon Mobil Corp. | | | 38,259 | | | | 2,778,751 | |
| | | | | | | | |
| | | | | | | $ | 5,012,370 | |
| Food & Beverages - 5.6% | | | | | | | | |
| Coca-Cola Co. | | | 3,070 | | | $ | 207,409 | |
| Coca-Cola Enterprises, Inc. | | | 25,180 | | | | 626,478 | |
| Dr Pepper Snapple Group, Inc. | | | 19,760 | | | | 766,293 | |
| General Mills, Inc. | | | 21,370 | | | | 822,104 | |
| PepsiCo, Inc. | | | 14,475 | | | | 896,003 | |
| | | | | | | | |
| | | | | | | $ | 3,318,287 | |
| Food & Drug Stores - 2.5% | | | | | | | | |
| CVS Caremark Corp. | | | 25,700 | | | $ | 863,006 | |
| Kroger Co. | | | 29,560 | | | | 649,138 | |
| | | | | | | | |
| | | | | | | $ | 1,512,144 | |
| Gaming & Lodging - 0.7% | | | | | | | | |
| Wynn Resorts Ltd. | | | 3,700 | | | $ | 425,796 | |
12
Portfolio of Investments – continued
| | | | | | | | |
| Issuer | | Shares/Par | | | Value ($) | |
| | | | | | | | |
| Common Stocks - continued | | | | | | | | |
| General Merchandise - 1.3% | | | | | | | | |
| Macy’s, Inc. | | | 30,440 | | | $ | 801,181 | |
| | |
| Health Maintenance Organizations - 1.9% | | | | | | | | |
| Aetna, Inc. | | | 18,520 | | | $ | 673,202 | |
| WellPoint, Inc. | | | 6,780 | | | | 442,598 | |
| | | | | | | | |
| | | | | | | $ | 1,115,800 | |
| Insurance - 4.5% | | | | | | | | |
| ACE Ltd. | | | 3,950 | | | $ | 239,370 | |
| Aflac, Inc. | | | 9,120 | | | | 318,744 | |
| Berkshire Hathaway, Inc., “B” (a) | | | 1,090 | | | | 77,434 | |
| Chubb Corp. | | | 5,160 | | | | 309,548 | |
| Hartford Financial Services Group, Inc. | | | 37,620 | | | | 607,187 | |
| Prudential Financial, Inc. | | | 14,450 | | | | 677,127 | |
| Travelers Cos., Inc. | | | 8,545 | | | | 416,398 | |
| | | | | | | | |
| | | | | | | $ | 2,645,808 | |
| Internet - 2.4% | | | | | | | | |
| Google, Inc., “A” (a) | | | 2,718 | | | $ | 1,398,085 | |
| | |
| Machinery & Tools - 0.2% | | | | | | | | |
| Cummins, Inc. | | | 1,810 | | | $ | 147,805 | |
| | |
| Major Banks - 3.9% | | | | | | | | |
| JPMorgan Chase & Co. | | | 39,783 | | | $ | 1,198,264 | |
| KeyCorp | | | 64,090 | | | | 380,054 | |
| PNC Financial Services Group, Inc. | | | 12,280 | | | | 591,773 | |
| Wells Fargo & Co. | | | 5,210 | | | | 125,665 | |
| | | | | | | | |
| | | | | | | $ | 2,295,756 | |
| Medical & Health Technology & Services - 1.3% | | | | | | | | |
| McKesson Corp. | | | 10,370 | | | $ | 753,899 | |
| | |
| Medical Equipment - 1.4% | | | | | | | | |
| Medtronic, Inc. | | | 10,760 | | | $ | 357,662 | |
| Thermo Fisher Scientific, Inc. (a) | | | 9,300 | | | | 470,952 | |
| | | | | | | | |
| | | | | | | $ | 828,614 | |
| Metals & Mining - 1.6% | | | | | | | | |
| Cliffs Natural Resources, Inc. | | | 9,170 | | | $ | 469,229 | |
| Freeport-McMoRan Copper & Gold, Inc. | | | 15,800 | | | | 481,110 | |
| | | | | | | | |
| | | | | | | $ | 950,339 | |
| Natural Gas - Pipeline - 2.1% | | | | | | | | |
| El Paso Corp. | | | 34,180 | | | $ | 597,466 | |
13
Portfolio of Investments – continued
| | | | | | | | |
| Issuer | | Shares/Par | | | Value ($) | |
| | | | | | | | |
| Common Stocks - continued | | | | | | | | |
| Natural Gas - Pipeline - continued | | | | | | | | |
| Williams Cos., Inc. | | | 25,780 | | | $ | 627,485 | |
| | | | | | | | |
| | | | | | | $ | 1,224,951 | |
| Network & Telecom - 0.6% | | | | | | | | |
| F5 Networks, Inc. (a) | | | 5,030 | | | $ | 357,382 | |
| | |
| Oil Services - 1.2% | | | | | | | | |
| Halliburton Co. | | | 19,370 | | | $ | 591,172 | |
| National Oilwell Varco, Inc. | | | 2,730 | | | | 139,831 | |
| | | | | | | | |
| | | | | | | $ | 731,003 | |
| Other Banks & Diversified Financials - 4.1% | | | | | | | | |
| Capital One Financial Corp. | | | 17,570 | | | $ | 696,299 | |
| Citigroup, Inc. | | | 39,444 | | | | 1,010,555 | |
| Discover Financial Services | | | 32,230 | | | | 739,356 | |
| | | | | | | | |
| | | | | | | $ | 2,446,210 | |
| Pharmaceuticals - 5.5% | | | | | | | | |
| Abbott Laboratories | | | 22,160 | | | $ | 1,133,262 | |
| Johnson & Johnson | | | 15,195 | | | | 968,073 | |
| Pfizer, Inc. | | | 64,970 | | | | 1,148,670 | |
| | | | | | | | |
| | | | | | | $ | 3,250,005 | |
| Pollution Control - 1.0% | | | | | | | | |
| Republic Services, Inc. | | | 20,570 | | | $ | 577,194 | |
| | |
| Precious Metals & Minerals - 0.5% | | | | | | | | |
| Coeur d’Alene Mines Corp. (a) | | | 14,900 | | | $ | 319,456 | |
| | |
| Railroad & Shipping - 0.9% | | | | | | | | |
| CSX Corp. | | | 27,670 | | | $ | 516,599 | |
| | |
| Real Estate - 1.0% | | | | | | | | |
| Annaly Mortgage Management, Inc., REIT | | | 36,940 | | | $ | 614,312 | |
| | |
| Restaurants - 2.2% | | | | | | | | |
| McDonald’s Corp. | | | 15,120 | | | $ | 1,327,838 | |
| | |
| Specialty Chemicals - 1.4% | | | | | | | | |
| Airgas, Inc. | | | 10,130 | | | $ | 646,497 | |
| Rockwood Holdings, Inc. (a) | | | 5,310 | | | | 178,894 | |
| | | | | | | | |
| | | | | | | $ | 825,391 | |
14
Portfolio of Investments – continued
| | | | | | | | |
| Issuer | | Shares/Par | | | Value ($) | |
| | | | | | | | |
| Common Stocks - continued | | | | | | | | |
| Specialty Stores - 1.9% | | | | | | | | |
| Abercrombie & Fitch Co., “A” | | | 3,460 | | | $ | 212,998 | |
| IAC/InterActiveCorp (a) | | | 10,700 | | | | 423,185 | |
| PetSmart, Inc. | | | 11,270 | | | | 480,666 | |
| | | | | | | | |
| | | | | | | $ | 1,116,849 | |
| Telecommunications - Wireless - 0.9% | | | | | | | | |
| MetroPCS Communications, Inc. (a) | | | 37,420 | | | $ | 325,928 | |
| NII Holdings, Inc. (a) | | | 6,810 | | | | 183,530 | |
| | | | | | | | |
| | | | | | | $ | 509,458 | |
| Telephone Services - 1.8% | | | | | | | | |
| AT&T, Inc. | | | 16,034 | | | $ | 457,290 | |
| CenturyLink, Inc. | | | 19,004 | | | | 629,412 | |
| | | | | | | | |
| | | | | | | $ | 1,086,702 | |
| Tobacco - 2.5% | | | | | | | | |
| Altria Group, Inc. | | | 29,542 | | | $ | 792,021 | |
| Philip Morris International, Inc. | | | 10,910 | | | | 680,566 | |
| | | | | | | | |
| | | | | | | $ | 1,472,587 | |
| Trucking - 0.7% | | | | | | | | |
| United Parcel Service, Inc., “B” | | | 6,940 | | | $ | 438,261 | |
| | |
| Utilities - Electric Power - 3.4% | | | | | | | | |
| AES Corp. (a) | | | 60,640 | | | $ | 591,846 | |
| American Electric Power Co., Inc. | | | 15,820 | | | | 601,476 | |
| CenterPoint Energy, Inc. | | | 11,650 | | | | 228,573 | |
| NRG Energy, Inc. (a) | | | 28,930 | | | | 613,605 | |
| | | | | | | | |
| | | | | | | $ | 2,035,500 | |
| Total Common Stocks (Identified Cost, $64,877,443) | | | | | | $ | 58,434,534 | |
| | |
| Money Market Funds (v) - 0.5% | | | | | | | | |
MFS Institutional Money Market Portfolio, 0.07%,
at Cost and Net Asset Value | | | 290,402 | | | $ | 290,402 | |
| Total Investments (Identified Cost, $65,167,845) | | | | | | $ | 58,724,936 | |
| | |
| Other Assets, Less Liabilities - 0.9% | | | | | | | 538,772 | |
| Net Assets - 100.0% | | | | | | $ | 59,263,708 | |
| (a) | Non-income producing security. |
| (v) | Underlying affiliated fund that is available only to investment companies managed by MFS. The rate quoted is the annualized seven-day yield of the fund at period end. |
15
Portfolio of Investments – continued
The following abbreviations are used in this report and are defined:
| PLC | | Public Limited Company |
| REIT | | Real Estate Investment Trust |
See Notes to Financial Statements
16
Financial Statements
STATEMENT OF ASSETS AND LIABILITIES
At 9/30/11
This statement represents your fund’s balance sheet, which details the assets and liabilities comprising the total value of the fund.
| | | | |
| Assets | | | | |
Investments- | | | | |
Non-affiliated issuers, at value (identified cost, $64,877,443) | | | $58,434,534 | |
Underlying affiliated funds, at cost and value | | | 290,402 | |
Total investments, at value (identified cost, $65,167,845) | | | $58,724,936 | |
Receivables for | | | | |
Investments sold | | | 2,201,657 | |
Fund shares sold | | | 355,334 | |
Dividends | | | 82,397 | |
Receivable from investment adviser | | | 39,941 | |
Other assets | | | 55 | |
Total assets | | | $61,404,320 | |
| Liabilities | | | | |
Payables for | | | | |
Investments purchased | | | $2,109,149 | |
Fund shares reacquired | | | 5,690 | |
Payable to affiliates | | | | |
Shareholder servicing costs | | | 13,568 | |
Distribution and service fees | | | 588 | |
Payable for independent Trustees’ compensation | | | 4 | |
Accrued expenses and other liabilities | | | 11,613 | |
Total liabilities | | | $2,140,612 | |
Net assets | | | $59,263,708 | |
| Net assets consist of | | | | |
Paid-in capital | | | $79,722,327 | |
Unrealized appreciation (depreciation) on investments | | | (6,442,909 | ) |
Accumulated net realized gain (loss) on investments | | | (14,509,467 | ) |
Undistributed net investment income | | | 493,757 | |
Net assets | | | $59,263,708 | |
Shares of beneficial interest outstanding | | | 4,727,144 | |
| | | | | | | | | | | | |
| | | Net assets | | | Shares
outstanding | | | Net asset value
per share (a) | |
Class A | | | $19,237,989 | | | | 1,535,190 | | | | $12.53 | |
Class B | | | 1,444,394 | | | | 118,006 | | | | 12.24 | |
Class C | | | 1,585,915 | | | | 130,793 | | | | 12.13 | |
Class I | | | 20,259,581 | | | | 1,602,757 | | | | 12.64 | |
Class R1 | | | 118,869 | | | | 9,782 | | | | 12.15 | |
Class R2 | | | 1,586,940 | | | | 130,142 | | | | 12.19 | |
Class R3 | | | 7,015,624 | | | | 561,288 | | | | 12.50 | |
Class R4 | | | 8,014,396 | | | | 639,186 | | | | 12.54 | |
| (a) | Maximum offering price per share was equal to the net asset value per share for all share classes, except for Class A, for which the maximum offering price per share was $13.29 [100 / 94.25 x $12.53]. On sales of $50,000 or more, the maximum offering price of Class A shares is reduced. A contingent deferred sales charge may be imposed on redemptions of Class A, Class B, and Class C shares. Redemption price per share was equal to the net asset value per share for Classes I, R1, R2, R3, and R4. |
See Notes to Financial Statements
17
Financial Statements
STATEMENT OF OPERATIONS
Year ended 9/30/11
This statement describes how much your fund earned in investment income and accrued in expenses. It also describes any gains and/or losses generated by fund operations.
| | | | |
| Net investment income | | | | |
Income | | | | |
Dividends | | | $826,111 | |
Dividends from underlying affiliated funds | | | 776 | |
Total investment income | | | $826,887 | |
Expenses | | | | |
Management fee | | | $217,232 | |
Distribution and service fees | | | 91,072 | |
Shareholder servicing costs | | | 53,295 | |
Administrative services fee | | | 17,833 | |
Independent Trustees’ compensation | | | 1,471 | |
Custodian fee | | | 18,298 | |
Shareholder communications | | | 16,754 | |
Auditing fees | | | 48,158 | |
Legal fees | | | 396 | |
Registration fees | | | 115,463 | |
Miscellaneous | | | 13,386 | |
Total expenses | | | $593,358 | |
Fees paid indirectly | | | (3 | ) |
Reduction of expenses by investment adviser | | | (267,057 | ) |
Net expenses | | | $326,298 | |
Net investment income | | | $500,589 | |
| Realized and unrealized gain (loss) on investments | | | | |
Realized gain (loss) on investment transactions (identified cost basis) | | | $1,751,494 | |
Change in unrealized appreciation (depreciation) on investments | | | $(8,434,151 | ) |
Net realized and unrealized gain (loss) on investments | | | $(6,682,657 | ) |
Change in net assets from operations | | | $(6,182,068 | ) |
See Notes to Financial Statements
18
Financial Statements
STATEMENTS OF CHANGES IN NET ASSETS
These statements describe the increases and/or decreases in net assets resulting from operations, any distributions, and any shareholder transactions.
| | | | | | | | |
| | | Years ended 9/30 | |
| | | 2011 | | | 2010 | |
| Change in net assets | | | | | | |
| From operations | | | | | | | | |
Net investment income | | | $500,589 | | | | $203,171 | |
Net realized gain (loss) on investments | | | 1,751,494 | | | | 1,532,876 | |
Net unrealized gain (loss) on investments | | | (8,434,151 | ) | | | (120,197 | ) |
Change in net assets from operations | | | $(6,182,068 | ) | | | $1,615,850 | |
| Distributions declared to shareholders | | | | | | | | |
From net investment income | | | $(210,003 | ) | | | $(480,011 | ) |
Change in net assets from fund share transactions | | | $44,683,710 | | | | $3,948,955 | |
Total change in net assets | | | $38,291,639 | | | | $5,084,794 | |
| Net assets | | | | | | | | |
At beginning of period | | | 20,972,069 | | | | 15,887,275 | |
At end of period (including undistributed net investment
income of $493,757 and $203,171, respectively) | | | $59,263,708 | | | | $20,972,069 | |
See Notes to Financial Statements
19
Financial Statements
FINANCIAL HIGHLIGHTS
The financial highlights table is intended to help you understand the fund’s financial performance for the past 5 years (or life of a particular share class, if shorter). Certain information reflects financial results for a single fund share. The total returns in the table represent the rate by which an investor would have earned (or lost) on an investment in the fund share class (assuming reinvestment of all distributions) held for the entire period.
| | | | | | | | | | | | | | | | | | | | |
| Class A | | Years ended 9/30 | |
| | | 2011 | | | 2010 | | | 2009 | | | 2008 | | | 2007 | |
Net asset value, beginning of period | | | $12.47 | | | | $11.59 | | | | $12.61 | | | | $16.67 | | | | $14.01 | |
| Income (loss) from investment operations | | | | | | | | | | | | | | | | | |
Net investment income (d) | | | $0.20 | | | | $0.16 | | | | $0.17 | | | | $0.14 | | | | $0.09 | |
Net realized and unrealized gain (loss)
on investments | | | (0.01 | )(g) | | | 1.09 | | | | (1.09 | ) | | | (3.71 | ) | | | 2.65 | |
Total from investment operations | | | $0.19 | | | | $1.25 | | | | $(0.92 | ) | | | $(3.57 | ) | | | $2.74 | |
| Less distributions declared to shareholders | | | | | | | | | | | | | | | | | |
From net investment income | | | $(0.13 | ) | | | $(0.37 | ) | | | $(0.06 | ) | | | $(0.17 | ) | | | $(0.08 | ) |
From net realized gain on investments | | | — | | | | — | | | | (0.04 | ) | | | (0.32 | ) | | | — | |
Total distributions declared to shareholders | | | $(0.13 | ) | | | $(0.37 | ) | | | $(0.10 | ) | | | $(0.49 | ) | | | $(0.08 | ) |
Net asset value, end of period | | | $12.53 | | | | $12.47 | | | | $11.59 | | | | $12.61 | | | | $16.67 | |
Total return (%) (r)(s)(t)(x) | | | 1.45 | | | | 10.96 | | | | (7.13 | ) | | | (21.90 | ) | | | 19.64 | |
Ratios (%) (to average net assets)
and Supplemental data: | | | | | | | | | | | | | | | | | |
Expenses before expense reductions (f) | | | 1.67 | | | | 2.17 | | | | 1.85 | | | | 1.38 | | | | 1.35 | |
Expenses after expense reductions (f) | | | 0.90 | | | | 0.88 | | | | 0.88 | | | | 1.18 | | | | 1.30 | |
Net investment income | | | 1.40 | | | | 1.30 | | | | 1.78 | | | | 0.91 | | | | 0.60 | |
Portfolio turnover | | | 92 | | | | 77 | | | | 71 | | | | 91 | | | | 41 | |
Net assets at end of period (000 omitted) | | | $19,238 | | | | $13,018 | | | | $11,473 | | | | $25,907 | | | | $43,612 | |
See Notes to Financial Statements
20
Financial Highlights – continued
| | | | | | | | | | | | | | | | | | | | |
| Class B | | Years ended 9/30 | |
| | | 2011 | | | 2010 | | | 2009 | | | 2008 | | | 2007 | |
Net asset value, beginning of period | | | $12.18 | | | | $11.33 | | | | $12.38 | | | | $16.32 | | | | $13.74 | |
| Income (loss) from investment operations | | | | | | | | | | | | | | | | | |
Net investment income (loss) (d) | | | $0.09 | | | | $0.07 | | | | $0.10 | | | | $0.03 | | | | $(0.01 | ) |
Net realized and unrealized gain (loss)
on investments | | | (0.00 | )(g)(w) | | �� | 1.06 | | | | (1.08 | ) | | | (3.64 | ) | | | 2.61 | |
Total from investment operations | | | $0.09 | | | | $1.13 | | | | $(0.98 | ) | | | $(3.61 | ) | | | $2.60 | |
| Less distributions declared to shareholders | | | | | | | | | | | | | | | | | |
From net investment income | | | $(0.03 | ) | | | $(0.28 | ) | | | $(0.03 | ) | | | $(0.01 | ) | | | $(0.02 | ) |
From net realized gain on investments | | | — | | | | — | | | | (0.04 | ) | | | (0.32 | ) | | | — | |
Total distributions declared to shareholders | | | $(0.03 | ) | | | $(0.28 | ) | | | $(0.07 | ) | | | $(0.33 | ) | | | $(0.02 | ) |
Net asset value, end of period | | | $12.24 | | | | $12.18 | | | | $11.33 | | | | $12.38 | | | | $16.32 | |
Total return (%) (r)(s)(t)(x) | | | 0.74 | | | | 10.14 | | | | (7.84 | ) | | | (22.46 | ) | | | 18.90 | |
Ratios (%) (to average net assets)
and Supplemental data: | | | | | | | | | | | | | | | | | |
Expenses before expense reductions (f) | | | 2.44 | | | | 2.92 | | | | 2.59 | | | | 2.03 | | | | 2.00 | |
Expenses after expense reductions (f) | | | 1.65 | | | | 1.63 | | | | 1.60 | | | | 1.85 | | | | 1.95 | |
Net investment income (loss) | | | 0.68 | | | | 0.55 | | | | 1.06 | | | | 0.23 | | | | (0.05 | ) |
Portfolio turnover | | | 92 | | | | 77 | | | | 71 | | | | 91 | | | | 41 | |
Net assets at end of period (000 omitted) | | | $1,444 | | | | $1,554 | | | | $1,440 | | | | $2,034 | | | | $4,183 | |
See Notes to Financial Statements
21
Financial Highlights – continued
| | | | | | | | | | | | | | | | | | | | |
| Class C | | Years ended 9/30 | |
| | | 2011 | | | 2010 | | | 2009 | | | 2008 | | | 2007 | |
Net asset value, beginning of period | | | $12.07 | | | | $11.25 | | | | $12.29 | | | | $16.23 | | | | $13.67 | |
| Income (loss) from investment operations | | | | | | | | | | | | | | | | | |
Net investment income (loss) (d) | | | $0.09 | | | | $0.06 | | | | $0.10 | | | | $0.03 | | | | $(0.01 | ) |
Net realized and unrealized gain (loss)
on investments | | | 0.01 | (g) | | | 1.06 | | | | (1.07 | ) | | | (3.61 | ) | | | 2.60 | |
Total from investment operations | | | $0.10 | | | | $1.12 | | | | $(0.97 | ) | | | $(3.58 | ) | | | $2.59 | |
| Less distributions declared to shareholders | | | | | | | | | | | | | | | | | |
From net investment income | | | $(0.04 | ) | | | $(0.30 | ) | | | $(0.03 | ) | | | $(0.04 | ) | | | $(0.03 | ) |
From net realized gain on investments | | | — | | | | — | | | | (0.04 | ) | | | (0.32 | ) | | | — | |
Total distributions declared to shareholders | | | $(0.04 | ) | | | $(0.30 | ) | | | $(0.07 | ) | | | $(0.36 | ) | | | $(0.03 | ) |
Net asset value, end of period | | | $12.13 | | | | $12.07 | | | | $11.25 | | | | $12.29 | | | | $16.23 | |
Total return (%) (r)(s)(t)(x) | | | 0.77 | | | | 10.12 | | | | (7.81 | ) | | | (22.46 | ) | | | 18.94 | |
Ratios (%) (to average net assets)
and Supplemental data: | | | | | | | | | | | | | | | | | |
Expenses before expense reductions (f) | | | 2.44 | | | | 2.92 | | | | 2.59 | | | | 2.03 | | | | 2.00 | |
Expenses after expense reductions (f) | | | 1.65 | | | | 1.63 | | | | 1.60 | | | | 1.86 | | | | 1.95 | |
Net investment income (loss) | | | 0.67 | | | | 0.55 | | | | 1.03 | | | | 0.23 | | | | (0.05 | ) |
Portfolio turnover | | | 92 | | | | 77 | | | | 71 | | | | 91 | | | | 41 | |
Net assets at end of period (000 omitted) | | | $1,586 | | | | $1,525 | | | | $1,476 | | | | $1,810 | | | | $3,340 | |
| |
| Class I | | Years ended 9/30 | |
| | | 2011 | | | 2010 | | | 2009 | | | 2008 | | | 2007 | |
Net asset value, beginning of period | | | $12.57 | | | | $11.69 | | | | $12.73 | | | | $16.84 | | | | $14.12 | |
| Income (loss) from investment operations | | | | | | | | | | | | | | | | | |
Net investment income (d) | | | $0.23 | | | | $0.19 | | | | $0.22 | | | | $0.18 | | | | $0.15 | |
Net realized and unrealized gain (loss)
on investments | | | (0.00 | )(g)(w) | | | 1.09 | | | | (1.14 | ) | | | (3.72 | ) | | | 2.68 | |
Total from investment operations | | | $0.23 | | | | $1.28 | | | | $(0.92 | ) | | | $(3.54 | ) | | | $2.83 | |
| Less distributions declared to shareholders | | | | | | | | | | | | | | | | | |
From net investment income | | | $(0.16 | ) | | | $(0.40 | ) | | | $(0.08 | ) | | | $(0.25 | ) | | | $(0.11 | ) |
From net realized gain on investments | | | — | | | | — | | | | (0.04 | ) | | | (0.32 | ) | | | — | |
Total distributions declared to shareholders | | | $(0.16 | ) | | | $(0.40 | ) | | | $(0.12 | ) | | | $(0.57 | ) | | | $(0.11 | ) |
Net asset value, end of period | | | $12.64 | | | | $12.57 | | | | $11.69 | | | | $12.73 | | | | $16.84 | |
Total return (%) (r)(s)(x) | | | 1.73 | | | | 11.21 | | | | (7.07 | ) | | | (21.62 | ) | | | 20.11 | |
Ratios (%) (to average net assets)
and Supplemental data: | | | | | | | | | | | | | | | | | |
Expenses before expense reductions (f) | | | 1.38 | | | | 1.87 | | | | 1.51 | | | | 1.01 | | | | 1.00 | |
Expenses after expense reductions (f) | | | 0.65 | | | | 0.64 | | | | 0.60 | | | | 0.88 | | | | 0.95 | |
Net investment income | | | 1.67 | | | | 1.55 | | | | 2.34 | | | | 1.20 | | | | 0.96 | |
Portfolio turnover | | | 92 | | | | 77 | | | | 71 | | | | 91 | | | | 41 | |
Net assets at end of period (000 omitted) | | | $20,260 | | | | $4,503 | | | | $1,163 | | | | $21,551 | | | | $52,956 | |
See Notes to Financial Statements
22
Financial Highlights – continued
| | | | | | | | | | | | | | | | |
| Class R1 | | Years ended 9/30 | |
| | | 2011 | | | 2010 | | | 2009 | | | 2008 (i) | |
Net asset value, beginning of period | | | $12.10 | | | | $11.29 | | | | $12.38 | | | | $13.70 | |
| Income (loss) from investment operations | | | | | | | | | | | | | |
Net investment income (d) | | | $0.09 | | | | $0.07 | | | | $0.10 | | | | $0.01 | |
Net realized and unrealized gain (loss)
on investments | | | (0.00 | )(g)(w) | | | 1.05 | | | | (1.08 | ) | | | (1.33 | )(g) |
Total from investment operations | | | $0.09 | | | | $1.12 | | | | $(0.98 | ) | | | $(1.32 | ) |
| Less distributions declared to shareholders | | | | | | | | | | | | | |
From net investment income | | | $(0.04 | ) | | | $(0.31 | ) | | | $(0.07 | ) | | | $— | |
From net realized gain on investments | | | — | | | | — | | | | (0.04 | ) | | | — | |
Total distributions declared to shareholders | | | $(0.04 | ) | | | $(0.31 | ) | | | $(0.11 | ) | | | $— | |
Net asset value, end of period | | | $12.15 | | | | $12.10 | | | | $11.29 | | | | $12.38 | |
Total return (%) (r)(s)(x) | | | 0.73 | | | | 10.05 | | | | (7.78 | ) | | | (9.64 | )(n) |
Ratios (%) (to average net assets)
and Supplemental data: | | | | | | | | | | | | | |
Expenses before expense reductions (f) | | | 2.42 | | | | 2.92 | | | | 2.60 | | | | 2.93 | (a) |
Expenses after expense reductions (f) | | | 1.65 | | | | 1.63 | | | | 1.60 | | | | 1.60 | (a) |
Net investment income | | | 0.69 | | | | 0.55 | | | | 1.02 | | | | 0.88 | (a) |
Portfolio turnover | | | 92 | | | | 77 | | | | 71 | | | | 91 | |
Net assets at end of period (000 omitted) | | | $119 | | | | $92 | | | | $83 | | | | $90 | |
| |
| Class R2 | | Years ended 9/30 | |
| | | 2011 | | | 2010 | | | 2009 | | | 2008 (i) | |
Net asset value, beginning of period | | | $12.17 | | | | $11.34 | | | | $12.38 | | | | $13.70 | |
| Income (loss) from investment operations | | | | | | | | | | | | | |
Net investment income (d) | | | $0.14 | | | | $0.12 | | | | $0.15 | | | | $0.01 | |
Net realized and unrealized gain (loss)
on investments | | | 0.02 | (g) | | | 1.07 | | | | (1.08 | ) | | | (1.33 | )(g) |
Total from investment operations | | | $0.16 | | | | $1.19 | | | | $(0.93 | ) | | | $(1.32 | ) |
| Less distributions declared to shareholders | | | | | | | | | | | | | |
From net investment income | | | $(0.14 | ) | | | $(0.36 | ) | | | $(0.07 | ) | | | $— | |
From net realized gain on investments | | | — | | | | — | | | | (0.04 | ) | | | — | |
Total distributions declared to shareholders | | | $(0.14 | ) | | | $(0.36 | ) | | | $(0.11 | ) | | | $— | |
Net asset value, end of period | | | $12.19 | | | | $12.17 | | | | $11.34 | | | | $12.38 | |
Total return (%) (r)(s)(x) | | | 1.25 | | | | 10.65 | | | | (7.32 | ) | | | (9.64 | )(n) |
Ratios (%) (to average net assets)
and Supplemental data: | | | | | | | | | | | | | |
Expenses before expense reductions (f) | | | 1.87 | | | | 2.42 | | | | 2.10 | | | | 2.43 | (a) |
Expenses after expense reductions (f) | | | 1.15 | | | | 1.13 | | | | 1.10 | | | | 1.10 | (a) |
Net investment income | | | 1.07 | | | | 1.05 | | | | 1.52 | | | | 1.38 | (a) |
Portfolio turnover | | | 92 | | | | 77 | | | | 71 | | | | 91 | |
Net assets at end of period (000 omitted) | | | $1,587 | | | | $93 | | | | $84 | | | | $90 | |
See Notes to Financial Statements
23
Financial Highlights – continued
| | | | | | | | | | | | | | | | |
| Class R3 | | Years ended 9/30 | |
| | | 2011 | | | 2010 | | | 2009 | | | 2008 (i) | |
Net asset value, beginning of period | | | $12.43 | | | | $11.57 | | | | $12.60 | | | | $13.94 | |
| Income (loss) from investment operations | | | | | | | | | | | | | |
Net investment income (d) | | | $0.18 | | | | $0.16 | | | | $0.17 | | | | $0.02 | |
Net realized and unrealized gain (loss)
on investments | | | 0.02 | (g) | | | 1.08 | | | | (1.08 | ) | | | (1.36 | )(g) |
Total from investment operations | | | $0.20 | | | | $1.24 | | | | $(0.91 | ) | | | $(1.34 | ) |
| Less distributions declared to shareholders | | | | | | | | | | | | | |
From net investment income | | | $(0.13 | ) | | | $(0.38 | ) | | | $(0.08 | ) | | | $— | |
From net realized gain on investments | | | — | | | | — | | | | (0.04 | ) | | | — | |
Total distributions declared to shareholders | | | $(0.13 | ) | | | $(0.38 | ) | | | $(0.12 | ) | | | $— | |
Net asset value, end of period | | | $12.50 | | | | $12.43 | | | | $11.57 | | | | $12.60 | |
Total return (%) (r)(s)(x) | | | 1.53 | | | | 10.92 | | | | (7.09 | ) | | | (9.61 | )(n) |
Ratios (%) (to average net assets)
and Supplemental data: | | | | | | | | | | | | | |
Expenses before expense reductions (f) | | | 1.51 | | | | 2.17 | | | | 1.85 | | | | 2.18 | (a) |
Expenses after expense reductions (f) | | | 0.90 | | | | 0.89 | | | | 0.85 | | | | 0.85 | (a) |
Net investment income | | | 1.32 | | | | 1.30 | | | | 1.77 | | | | 1.64 | (a) |
Portfolio turnover | | | 92 | | | | 77 | | | | 71 | | | | 91 | |
Net assets at end of period (000 omitted) | | | $7,016 | | | | $93 | | | | $84 | | | | $90 | |
See Notes to Financial Statements
24
Financial Highlights – continued
| | | | | | | | | | | | | | | | |
| Class R4 | | Years ended 9/30 | |
| | | 2011 | | | 2010 | | | 2009 | | | 2008 (i) | |
Net asset value, beginning of period | | | $12.47 | | | | $11.60 | | | | $12.61 | | | | $13.94 | |
| Income (loss) from investment operations | | | | | | | | | | | | | |
Net investment income (d) | | | $0.20 | | | | $0.19 | | | | $0.20 | | | | $0.02 | |
Net realized and unrealized gain (loss)
on investments | | | 0.03 | (g) | | | 1.08 | | | | (1.09 | ) | | | (1.35 | )(g) |
Total from investment operations | | | $0.23 | | | | $1.27 | | | | $(0.89 | ) | | | $(1.33 | ) |
| Less distributions declared to shareholders | | | | | | | | | | | | | |
From net investment income | | | $(0.16 | ) | | | $(0.40 | ) | | | $(0.08 | ) | | | $— | |
From net realized gain on investments | | | — | | | | — | | | | (0.04 | ) | | | — | |
Total distributions declared to shareholders | | | $(0.16 | ) | | | $(0.40 | ) | | | $(0.12 | ) | | | $— | |
Net asset value, end of period | | | $12.54 | | | | $12.47 | | | | $11.60 | | | | $12.61 | |
Total return (%) (r)(s)(x) | | | 1.75 | | | | 11.21 | | | | (6.89 | ) | | | (9.54 | )(n) |
Ratios (%) (to average net assets)
and Supplemental data: | | | | | | | | | | | | | |
Expenses before expense reductions (f) | | | 1.30 | | | | 1.92 | | | | 1.60 | | | | 1.93 | (a) |
Expenses after expense reductions (f) | | | 0.65 | | | | 0.63 | | | | 0.60 | | | | 0.60 | (a) |
Net investment income | | | 1.46 | | | | 1.55 | | | | 2.01 | | | | 1.88 | (a) |
Portfolio turnover | | | 92 | | | | 77 | | | | 71 | | | | 91 | |
Net assets at end of period (000 omitted) | | | $8,014 | | | | $94 | | | | $84 | | | | $90 | |
| (d) | Per share data is based on average shares outstanding. |
| (f) | Ratios do not reflect reductions from fees paid indirectly, if applicable. |
| (g) | The per share amount varies from the net realized and unrealized gain/loss for the period because of the timing of sales of fund shares and the per share amount of realized and unrealized gains and losses at such time. |
| (i) | For the period from the class’ inception September 2, 2008, through the stated period end. |
| (r) | Certain expenses have been reduced without which performance would have been lower. |
| (s) | From time to time the fund may receive proceeds from litigation settlements, without which performance would be lower. |
| (t) | Total returns do not include any applicable sales charges. |
| (w) | Per share amount was less than $0.01. |
| (x) | Total returns have been calculated on net asset values which include adjustments made in accordance with U.S. generally accepted accounting principles required at period end for financial reporting purposes. |
See Notes to Financial Statements
25
NOTES TO FINANCIAL STATEMENTS
| (1) | | Business and Organization |
MFS Blended Research Core Equity Fund (the fund) is a series of MFS Series Trust XI (the trust). The trust is organized as a Massachusetts business trust and is registered under the Investment Company Act of 1940, as amended, as an open-end management investment company.
| (2) | | Significant Accounting Policies |
General – The preparation of financial statements in conformity with U.S. generally accepted accounting principles requires management to make estimates and assumptions that affect the reported amounts of assets and liabilities, and disclosure of contingent assets and liabilities at the date of the financial statements and the reported amounts of revenues and expenses during the reporting period. Actual results could differ from those estimates. In the preparation of these financial statements, management has evaluated subsequent events occurring after the date of the fund’s Statement of Assets and Liabilities through the date that the financial statements were issued.
Investment Valuations – Equity securities, including restricted equity securities, are generally valued at the last sale or official closing price as provided by a third-party pricing service on the market or exchange on which they are primarily traded. Equity securities, for which there were no sales reported that day, are generally valued at the last quoted daily bid quotation as provided by a third-party pricing service on the market or exchange on which such securities are primarily traded. Equity securities held short, for which there were no sales reported for that day, are generally valued at the last quoted daily ask quotation as provided by a third-party pricing service on the market or exchange on which such securities are primarily traded. Short-term instruments with a maturity at issuance of 60 days or less generally are valued at amortized cost, which approximates market value. Open-end investment companies are generally valued at net asset value per share. Securities and other assets generally valued on the basis of information from a third-party pricing service may also be valued at a broker/dealer bid quotation. Values obtained from third-party pricing services can utilize both transaction data and market information such as yield, quality, coupon rate, maturity, type of issue, trading characteristics, and other market data.
The Board of Trustees has delegated primary responsibility for determining or causing to be determined the value of the fund’s investments (including any fair valuation) to the adviser pursuant to valuation policies and procedures approved by the Board. If the adviser determines that reliable market quotations are not readily available, investments are valued at fair value as determined in good faith by the adviser in accordance with such procedures
26
Notes to Financial Statements – continued
under the oversight of the Board of Trustees. Under the fund’s valuation policies and procedures, market quotations are not considered to be readily available for most types of debt instruments and floating rate loans and many types of derivatives. These investments are generally valued at fair value based on information from third-party pricing services. In addition, investments may be valued at fair value if the adviser determines that an investment’s value has been materially affected by events occurring after the close of the exchange or market on which the investment is principally traded (such as foreign exchange or market) and prior to the determination of the fund’s net asset value, or after the halting of trading of a specific security where trading does not resume prior to the close of the exchange or market on which the security is principally traded. Events that occur on a frequent basis after foreign markets close (such as developments in foreign markets and significant movements in the U.S. markets) and prior to the determination of the fund’s net asset value may be deemed to have a material effect on the value of securities traded in foreign markets. Accordingly, the fund’s foreign equity securities may often be valued at fair value. The adviser generally relies on third-party pricing services or other information (such as the correlation with price movements of similar securities in the same or other markets; the type, cost and investment characteristics of the security; the business and financial condition of the issuer; and trading and other market data) to assist in determining whether to fair value and at what value to fair value an investment. The value of an investment for purposes of calculating the fund’s net asset value can differ depending on the source and method used to determine value. When fair valuation is used, the value of an investment used to determine the fund’s net asset value may differ from quoted or published prices for the same investment. There can be no assurance that the fund could obtain the fair value assigned to an investment if it were to sell the investment at the same time at which the fund determines its net asset value per share.
Various inputs are used in determining the value of the fund’s assets or liabilities. These inputs are categorized into three broad levels. In certain cases, the inputs used to measure fair value may fall into different levels of the fair value hierarchy. In such cases, an investment’s level within the fair value hierarchy is based on the lowest level of input that is significant to the fair value measurement. The fund’s assessment of the significance of a particular input to the fair value measurement in its entirety requires judgment, and considers factors specific to the investment. Level 1 includes unadjusted quoted prices in active markets for identical assets or liabilities. Level 2 includes other significant observable market-based inputs (including quoted prices for similar securities, interest rates, prepayment speed, and credit risk). Level 3 includes unobservable inputs, which may include the adviser’s own assumptions in determining the fair value of investments. The following is a
27
Notes to Financial Statements – continued
summary of the levels used as of September 30, 2011 in valuing the fund’s assets or liabilities:
| | | | | | | | | | | | | | | | |
| Investments at Value | | Level 1 | | | Level 2 | | | Level 3 | | | Total | |
| Equity Securities | | | $58,434,534 | | | | $— | | | | $— | | | | $58,434,534 | |
| Mutual Funds | | | 290,402 | | | | — | | | | — | | | | 290,402 | |
| Total Investments | | | $58,724,936 | | | | $— | | | | $— | | | | $58,724,936 | |
For further information regarding security characteristics, see the Portfolio of Investments.
Indemnifications – Under the fund’s organizational documents, its officers and Trustees may be indemnified against certain liabilities and expenses arising out of the performance of their duties to the fund. Additionally, in the normal course of business, the fund enters into agreements with service providers that may contain indemnification clauses. The fund’s maximum exposure under these agreements is unknown as this would involve future claims that may be made against the fund that have not yet occurred.
Investment Transactions and Income – Investment transactions are recorded on the trade date. Dividends received in cash are recorded on the ex-dividend date. Certain dividends from foreign securities will be recorded when the fund is informed of the dividend if such information is obtained subsequent to the ex-dividend date. Dividend and interest payments received in additional securities are recorded on the ex-dividend or ex-interest date in an amount equal to the value of the security on such date.
The fund may receive proceeds from litigation settlements. Any proceeds received from litigation involving portfolio holdings are reflected in the Statement of Operations in realized gain/loss if the security has been disposed of by the fund or in unrealized gain/loss if the security is still held by the fund. Any other proceeds from litigation not related to portfolio holdings are reflected as other income in the Statement of Operations.
Fees Paid Indirectly – The fund’s custody fee may be reduced according to an arrangement that measures the value of cash deposited with the custodian by the fund. This amount, for the year ended September 30, 2011, is shown as a reduction of total expenses on the Statement of Operations.
Tax Matters and Distributions – The fund intends to qualify as a regulated investment company, as defined under Subchapter M of the Internal Revenue Code, and to distribute all of its taxable income, including realized capital gains. As a result, no provision for federal income tax is required. The fund’s federal tax returns for the prior three fiscal years remain subject to examination by the Internal Revenue Service.
28
Notes to Financial Statements – continued
Distributions to shareholders are recorded on the ex-dividend date. Income and capital gain distributions are determined in accordance with income tax regulations, which may differ from U.S. generally accepted accounting principles. Certain capital accounts in the financial statements are periodically adjusted for permanent differences in order to reflect their tax character. These adjustments have no impact on net assets or net asset value per share. Temporary differences which arise from recognizing certain items of income, expense, gain or loss in different periods for financial statement and tax purposes will reverse at some time in the future. Distributions in excess of net investment income or net realized gains are temporary overdistributions for financial statement purposes resulting from differences in the recognition or classification of income or distributions for financial statement and tax purposes.
Book/tax differences primarily relate to wash sale loss deferrals.
The tax character of distributions declared to shareholders for the last two fiscal years is as follows:
| | | | | | | | |
| | | 9/30/11 | | | 9/30/10 | |
| Ordinary income (including any short-term capital gains) | | | $210,003 | | | | $480,011 | |
The federal tax cost and the tax basis components of distributable earnings were as follows:
| | | | |
| As of 9/30/11 | | | |
| Cost of investments | | | $65,549,876 | |
| Gross appreciation | | | 1,008,683 | |
| Gross depreciation | | | (7,833,623 | ) |
| Net unrealized appreciation (depreciation) | | | $(6,824,940 | ) |
| Undistributed ordinary income | | | 493,757 | |
| Capital loss carryforwards | | | (14,127,436 | ) |
As of September 30, 2011, the fund had capital loss carryforwards available to offset future realized gains. Such losses expire as follows:
29
Notes to Financial Statements – continued
Multiple Classes of Shares of Beneficial Interest – The fund offers multiple classes of shares, which differ in their respective distribution, and service fees. The fund’s income, realized and unrealized gain (loss), and common expenses are allocated to shareholders based on the daily net assets of each class. Dividends are declared separately for each class. Differences in per share dividend rates are generally due to differences in separate class expenses. Class B shares will convert to Class A shares approximately eight years after purchase. The fund’s distributions declared to shareholders as reported on the Statements of Changes in Net Assets are presented by class as follows:
| | | | | | | | |
| | | From net investment
income | |
| | | Year ended
9/30/11 | | | Year ended
9/30/10 | |
| Class A | | | $137,085 | | | | $348,642 | |
| Class B | | | 3,826 | | | | 33,603 | |
| Class C | | | 4,477 | | | | 38,643 | |
| Class I | | | 58,264 | | | | 48,546 | |
| Class R1 | | | 317 | | | | 2,269 | |
| Class R2 | | | 3,867 | | | | 2,625 | |
| Class R3 | | | 966 | | | | 2,752 | |
| Class R4 | | | 1,201 | | | | 2,931 | |
| Total | | | $210,003 | | | | $480,011 | |
| (3) | | Transactions with Affiliates |
Investment Adviser – The fund has an investment advisory agreement with MFS to provide overall investment management and related administrative services and facilities to the fund. The management fee is computed daily and paid monthly at an annual rate of 0.60% of the fund’s average daily net assets.
The investment adviser has agreed in writing to pay a portion of the fund’s total annual operating expenses, exclusive of management fee, interest, taxes, extraordinary expenses, brokerage and transaction costs and investment-related expenses, such that total annual fund operating expenses do not exceed the following rates annually of each class’ average daily net assets:
| | | | | | | | | | | | | | | | | | | | | | | | | | | | |
| Class A | | Class B | | | Class C | | | Class I | | | Class R1 | | | Class R2 | | | Class R3 | | | Class R4 | |
| 0.90% | | | 1.65% | | | | 1.65% | | | | 0.65% | | | | 1.65% | | | | 1.15% | | | | 0.90% | | | | 0.65% | |
This written agreement will continue until modified by the fund’s Board of Trustees, but such agreement will continue at least until January 31, 2013. For the year ended September 30, 2011, this reduction amounted to $266,896 and is reflected as a reduction of total expenses in the Statement of Operations.
Distributor – MFS Fund Distributors, Inc. (MFD), a wholly-owned subsidiary of MFS, as distributor, received $9,023 for the year ended September 30, 2011, as its portion of the initial sales charge on sales of Class A shares of the fund.
30
Notes to Financial Statements – continued
The Board of Trustees has adopted a distribution plan for certain class shares pursuant to Rule 12b-1 of the Investment Company Act of 1940.
The fund’s distribution plan provides that the fund will pay MFD for services provided by MFD and financial intermediaries in connection with the distribution and servicing of certain share classes. One component of the plan is a distribution fee paid to MFD and another component of the plan is a service fee paid to MFD. MFD may subsequently pay all, or a portion, of the distribution and/or service fees to financial intermediaries.
Distribution Plan Fee Table:
| | | | | | | | | | | | | | | | | | | | |
| | | Distribution
Fee Rate (d) | | | Service Fee Rate (d) | | | Total
Distribution
Plan (d) | | | Annual
Effective
Rate (e) | | | Distribution
and Service
Fee | |
| Class A | | | — | | | | 0.25% | | | | 0.25% | | | | 0.25% | | | | $44,370 | |
| Class B | | | 0.75% | | | | 0.25% | | | | 1.00% | | | | 1.00% | | | | 16,557 | |
| Class C | | | 0.75% | | | | 0.25% | | | | 1.00% | | | | 1.00% | | | | 18,080 | |
| Class R1 | | | 0.75% | | | | 0.25% | | | | 1.00% | | | | 1.00% | | | | 1,153 | |
| Class R2 | | | 0.25% | | | | 0.25% | | | | 0.50% | | | | 0.50% | | | | 3,188 | |
| Class R3 | | | — | | | | 0.25% | | | | 0.25% | | | | 0.25% | | | | 7,724 | |
| Total Distribution and Service Fees | | | | | | | | | | | | | | | | $91,072 | |
| (d) | In accordance with the distribution plan for certain classes, the fund pays distribution and/or service fees equal to these annual percentage rates of each class’ average daily net assets. The distribution and service fee rates disclosed by class represent the current rates in effect at the end of the reporting period. |
| (e) | The annual effective rates represent actual fees incurred under the distribution plan for the year ended September 30, 2011 based on each class’ average daily net assets. |
Certain Class A shares are subject to a contingent deferred sales charge (CDSC) in the event of a shareholder redemption within 24 months of purchase. Class C shares are subject to a CDSC in the event of a shareholder redemption within 12 months of purchase. Class B shares are subject to a CDSC in the event of a shareholder redemption within six years of purchase. All contingent deferred sales charges are paid to MFD and during the year ended September 30, 2011, were as follows:
| | | | |
| | | Amount | |
| Class A | | | $10 | |
| Class B | | | 4,873 | |
| Class C | | | 97 | |
Shareholder Servicing Agent – MFS Service Center, Inc. (MFSC), a wholly-owned subsidiary of MFS, receives a fee from the fund for its services as shareholder servicing agent calculated as a percentage of the average daily net assets of the fund as determined periodically under the supervision of the fund’s Board of Trustees. For the year ended September 30, 2011, the fee was $17,900, which equated to 0.0495% annually of the fund’s average daily net assets. MFSC also receives payment from the fund for out-of-pocket expenses,
31
Notes to Financial Statements – continued
sub-accounting and other shareholder servicing costs which may be paid to affiliated and unaffiliated service providers. For the year ended September 30, 2011, these out-of-pocket expenses, sub-accounting and other shareholder servicing costs amounted to $35,395.
Administrator – MFS provides certain financial, legal, shareholder communications, compliance, and other administrative services to the fund. Under an administrative services agreement, the fund partially reimburses MFS the costs incurred to provide these services. The fund is charged an annual fixed amount of $17,500 plus a fee based on average daily net assets. The administrative services fee incurred for the year ended September 30, 2011 was equivalent to an annual effective rate of 0.0493% of the fund’s average daily net assets.
Trustees’ and Officers’ Compensation – The fund pays compensation to independent Trustees in the form of a retainer, attendance fees, and additional compensation to Board and Committee chairpersons. The fund does not pay compensation directly to Trustees or officers of the fund who are also officers of the investment adviser, all of whom receive remuneration for their services to the fund from MFS. Certain officers and Trustees of the fund are officers or directors of MFS, MFD, and MFSC.
Other – This fund and certain other funds managed by MFS (the funds) have entered into services agreements (the Agreements) which provide for payment of fees by the funds to Tarantino LLC and Griffin Compliance LLC in return for the provision of services of an Independent Chief Compliance Officer (ICCO) and Assistant ICCO, respectively, for the funds. The ICCO and Assistant ICCO are officers of the funds and the sole members of Tarantino LLC and Griffin Compliance LLC, respectively. The funds can terminate the Agreements with Tarantino LLC and Griffin Compliance LLC at any time under the terms of the Agreements. For the year ended September 30, 2011, the aggregate fees paid by the fund to Tarantino LLC and Griffin Compliance LLC were $287 and are included in miscellaneous expense on the Statement of Operations. MFS has agreed to reimburse the fund for a portion of the payments made by the fund in the amount of $161, which is shown as a reduction of total expenses in the Statement of Operations. Additionally, MFS has agreed to bear all expenses associated with office space, other administrative support, and supplies provided to the ICCO and Assistant ICCO.
The fund invests in the MFS Institutional Money Market Portfolio which is managed by MFS and seeks a high level of current income consistent with preservation of capital and liquidity. Income earned on this investment is included in dividends from underlying affiliated funds on the Statement of Operations. This money market fund does not pay a management fee to MFS.
32
Notes to Financial Statements – continued
Purchases and sales of investments, other than U.S. Government securities, purchased option transactions, and short-term obligations, aggregated $77,623,508 and $33,329,554, respectively.
| (5) | Shares of Beneficial Interest |
The fund’s Declaration of Trust permits the Trustees to issue an unlimited number of full and fractional shares of beneficial interest. Transactions in fund shares were as follows:
| | | | | | | | | | | | | | | | |
| | | Year ended
9/30/11 | | | Year ended
9/30/10 | |
| | | Shares | | | Amount | | | Shares | | | Amount | |
| Shares sold | | | | | | | | | | | | | | | | |
Class A | | | 1,084,589 | | | $ | 15,427,205 | | | | 367,628 | | | $ | 4,521,340 | |
Class B | | | 41,300 | | | | 577,146 | | | | 43,421 | | | | 521,324 | |
Class C | | | 50,826 | | | | 700,294 | | | | 15,774 | | | | 185,238 | |
Class I | | | 1,362,673 | | | | 20,179,872 | | | | 312,973 | | | | 3,928,729 | |
Class R1 | | | 2,313 | | | | 33,327 | | | | — | | | | — | |
Class R2 | | | 139,685 | | | | 1,974,934 | | | | — | | | | — | |
Class R3 | | | 612,753 | | | | 9,138,317 | | | | — | | | �� | — | |
Class R4 | | | 654,415 | | | | 9,233,376 | | | | 51 | | | | 618 | |
| | | 3,948,554 | | | $ | 57,264,471 | | | | 739,847 | | | $ | 9,157,249 | |
| Shares issued to shareholders in reinvestment of distributions | | | | | | | | | | | | | | | | |
Class A | | | 8,833 | | | $ | 119,242 | | | | 28,461 | | | $ | 333,560 | |
Class B | | | 256 | | | | 3,393 | | | | 2,488 | | | | 28,658 | |
Class C | | | 232 | | | | 3,042 | | | | 2,380 | | | | 27,182 | |
Class I | | | 4,157 | | | | 56,495 | | | | 3,626 | | | | 42,748 | |
Class R1 | | | 24 | | | | 317 | | | | 199 | | | | 2,269 | |
Class R2 | | | 294 | | | | 3,867 | | | | 229 | | | | 2,625 | |
Class R3 | | | 72 | | | | 966 | | | | 235 | | | | 2,752 | |
Class R4 | | | 89 | | | | 1,201 | | | | 250 | | | | 2,931 | |
| | | 13,957 | | | $ | 188,523 | | | | 37,868 | | | $ | 442,725 | |
| Shares reacquired | | | | | | | | | | | | | | | | |
Class A | | | (602,524 | ) | | $ | (8,345,605 | ) | | | (341,754 | ) | | $ | (4,131,535 | ) |
Class B | | | (51,134 | ) | | | (698,995 | ) | | | (45,377 | ) | | | (538,921 | ) |
Class C | | | (46,635 | ) | | | (641,475 | ) | | | (22,998 | ) | | | (264,804 | ) |
Class I | | | (122,331 | ) | | | (1,668,068 | ) | | | (57,853 | ) | | | (715,759 | ) |
Class R1 | | | (135 | ) | | | (1,826 | ) | | | — | | | | — | |
Class R2 | | | (17,451 | ) | | | (250,776 | ) | | | — | | | | — | |
Class R3 | | | (59,031 | ) | | | (840,158 | ) | | | — | | | | — | |
Class R4 | | | (22,880 | ) | | | (322,381 | ) | | | — | | | | — | |
| | | (922,121 | ) | | $ | (12,769,284 | ) | | | (467,982 | ) | | $ | (5,651,019 | ) |
33
Notes to Financial Statements – continued
| | | | | | | | | | | | | | | | |
| | | Year ended
9/30/11 | | | Year ended
9/30/10 | |
| | | Shares | | | Amount | | | Shares | | | Amount | |
| Net change | | | | | | | | | | | | | | | | |
Class A | | | 490,898 | | | $ | 7,200,842 | | | | 54,335 | | | $ | 723,365 | |
Class B | | | (9,578 | ) | | | (118,456 | ) | | | 532 | | | | 11,061 | |
Class C | | | 4,423 | | | | 61,861 | | | | (4,844 | ) | | | (52,384 | ) |
Class I | | | 1,244,499 | | | | 18,568,299 | | | | 258,746 | | | | 3,255,718 | |
Class R1 | | | 2,202 | | | | 31,818 | | | | 199 | | | | 2,269 | |
Class R2 | | | 122,528 | | | | 1,728,025 | | | | 229 | | | | 2,625 | |
Class R3 | | | 553,794 | | | | 8,299,125 | | | | 235 | | | | 2,752 | |
Class R4 | | | 631,624 | | | | 8,912,196 | | | | 301 | | | | 3,549 | |
| | | 3,040,390 | | | $ | 44,683,710 | | | | 309,733 | | | $ | 3,948,955 | |
Class W shares were not available for sale during the period. Please see the fund’s prospectus for details.
The fund and certain other funds managed by MFS participate in a $1.1 billion unsecured committed line of credit, subject to a $1 billion sublimit, provided by a syndication of banks under a credit agreement. Borrowings may be made for temporary financing needs. Interest is charged to each fund, based on its borrowings, generally at a rate equal to the higher of the Federal Reserve funds rate or one month LIBOR plus an agreed upon spread. A commitment fee, based on the average daily, unused portion of the committed line of credit, is allocated among the participating funds at the end of each calendar quarter. In addition, the fund and other funds managed by MFS have established unsecured uncommitted borrowing arrangements with certain banks for temporary financing needs. Interest is charged to each fund, based on its borrowings, at a rate equal to the Federal Reserve funds rate plus an agreed upon spread. For the year ended September 30, 2011, the fund’s commitment fee and interest expense were $240 and $0, respectively, and are included in miscellaneous expense on the Statement of Operations.
34
Notes to Financial Statements – continued
| (7) | Transactions in Underlying Affiliated Funds-Affiliated Issuers |
An affiliated issuer may be considered one in which the fund owns 5% or more of the outstanding voting securities, or a company which is under common control. For the purposes of this report, the fund assumes the following to be affiliated issuers:
| | | | | | | | | | | | | | | | |
| Underlying Affiliated Funds | | Beginning
Shares/Par
Amount | | | Acquisitions
Shares/Par
Amount | | | Dispositions
Shares/Par
Amount | | | Ending
Shares/Par
Amount | |
MFS Institutional Money
Market Portfolio | | | 148,723 | | | | 33,782,112 | | | | (33,640,433 | ) | | | 290,402 | |
| | | | |
| Underlying Affiliated Funds | | Realized
Gain (Loss) | | | Capital Gain
Distributions | | | Dividend
Income | | | Ending
Value | |
MFS Institutional Money
Market Portfolio | | | $— | | | | $— | | | | $776 | | | | $290,402 | |
35
REPORT OF INDEPENDENT REGISTERED PUBLIC ACCOUNTING FIRM
To the Board of Trustees of MFS Series Trust XI and the Shareholders of MFS Blended Research Core Equity Fund:
We have audited the accompanying statement of assets and liabilities, including the portfolio of investments, of MFS Blended Research Core Equity Fund (one of the portfolios comprising MFS Series Trust XI) (the “Fund”) as of September 30, 2011, and the related statement of operations for the year then ended, the statements of changes in net assets for each of the two years in the period then ended, and the financial highlights for each of the five years in the period then ended. These financial statements and financial highlights are the responsibility of the Fund’s management. Our responsibility is to express an opinion on these financial statements and financial highlights based on our audits.
We conducted our audits in accordance with the standards of the Public Company Accounting Oversight Board (United States). Those standards require that we plan and perform the audit to obtain reasonable assurance about whether the financial statements and financial highlights are free of material misstatement. The Fund is not required to have, nor were we engaged to perform, an audit of its internal control over financial reporting. Our audits included consideration of internal control over financial reporting as a basis for designing audit procedures that are appropriate in the circumstances, but not for the purpose of expressing an opinion on the effectiveness of the Fund’s internal control over financial reporting. Accordingly, we express no such opinion. An audit also includes examining, on a test basis, evidence supporting the amounts and disclosures in the financial statements, assessing the accounting principles used and significant estimates made by management, as well as evaluating the overall financial statement presentation. Our procedures included confirmation of securities owned as of September 30, 2011, by correspondence with the custodian and brokers; where replies were not received from brokers, we performed other auditing procedures. We believe that our audits provide a reasonable basis for our opinion.
In our opinion, the financial statements and financial highlights referred to above present fairly, in all material respects, the financial position of MFS Blended Research Core Equity Fund as of September 30, 2011, the results of its operations for the year then ended, the changes in its net assets for each of the two years in the period then ended, and the financial highlights for each of the five years in the period then ended, in conformity with accounting principles generally accepted in the United States of America.
DELOITTE & TOUCHE LLP
Boston, Massachusetts
November 15, 2011
36
TRUSTEES AND OFFICERS — IDENTIFICATION AND BACKGROUND
The Trustees and officers of the Trust, as of November 1, 2011, are listed below, together with their principal occupations during the past five years. (Their titles may have varied during that period.) The address of each Trustee and officer is 500 Boylston Street, Boston, Massachusetts 02116.
| | | | | | | | |
Name, Age | | Position(s) Held with Fund | | Trustee/Officer
Since (h) | | Principal Occupations
During the Past Five Years | | Other
Directorships (j) |
| INTERESTED TRUSTEES |
Robert J. Manning (k) (age 48) | | Trustee | | February 2004 | | Massachusetts Financial Services Company, Chairman, Chief Executive Officer and Director; President (until December 2009); Chief Investment Officer (until July 2010) | | N/A |
| Robert C. Pozen (k) (age 65) | | Trustee | | February 2004 | | Massachusetts Financial Services Company, Chairman Emeritus; Chairman (until July 2010) | | Medtronic, Inc, (medical devices), Director (since 2004); The NielsenCompany (market research), Director (since 2010); Telesat (satellite communications), Director (until November 2007); Bell Canada Enterprises (telecommunications), Director (until February 2009) |
| INDEPENDENT TRUSTEES | | | | | | |
| David H. Gunning (age 69) | | Trustee and Chair of Trustees | | January 2004 | | Retired; Cleveland-Cliffs Inc. (mining products and service provider), Vice Chairman/Director (until May 2007) | | Lincoln Electric Holdings, Inc. (welding equipment manufacturer), Director; Development Alternatives, Inc. (consulting), Director/Non-Executive Chairman; Portman Limited (mining), Director (until 2008) |
37
Trustees and Officers – continued
| | | | | | | | |
Name, Age | | Position(s) Held with Fund | | Trustee/Officer
Since (h) | | Principal Occupations
During the Past Five Years | | Other
Directorships (j) |
Robert E. Butler (age 69) | | Trustee | | January 2006 | | Consultant – investment company industry regulatory and compliance matters | | N/A |
Maureen R. Goldfarb (age 56) | | Trustee | | January 2009 | | Private investor | | N/A |
William R. Gutow (age 70) | | Trustee | | December 1993 | | Private investor and real estate consultant; Capitol Entertainment Management Company (video franchise), Vice Chairman | | Atlantic Coast Tan (tanning salons), Vice Chairman (until 2007); Texas Donuts (donut franchise), Vice Chairman (until 2010) |
Michael Hegarty (age 66) | | Trustee | | December 2004 | | Private investor | | N/A |
John P. Kavanaugh (age 56) | | Trustee | | January 2009 | | Private investor; The Hanover Insurance Group, Inc., Vice President and Chief Investment Officer (until 2006); Allmerica Investment Trust, Allmerica Securities Trust and Opus Investment Trust (investment companies), Chairman, President and Trustee (until 2006) | | N/A |
J. Dale Sherratt (age 73) | | Trustee | | June 1989 | | Insight Resources, Inc. (acquisition planning specialists), President; Wellfleet Investments (investor in health care companies), Managing General Partner | | N/A |
Laurie J. Thomsen (age 54) | | Trustee | | March 2005 | | Private investor; New Profit, Inc. (venture philanthropy), Executive Partner (until 2010) | | The Travelers Companies (property and casualty insurance), Director |
Robert W. Uek (age 70) | | Trustee | | January 2006 | | Consultant to investment company industry | | N/A |
38
Trustees and Officers – continued
| | | | | | | | |
Name, Age | | Position(s) Held with Fund | | Trustee/Officer
Since (h) | | Principal Occupations
During the Past Five Years | | Other
Directorships (j) |
| OFFICERS | | | | | | | | |
Maria F. DiOrioDwyer (k) (age 52) | | President | | March 2004 | | Massachusetts Financial Services Company, Executive Vice President and Chief Regulatory Officer Chief Compliance Officer (since December 2006) | | N/A |
Christopher R. Bohane (k) (age 37) | | Assistant
Secretary and Assistant Clerk | | July 2005 | | Massachusetts Financial Services Company, Vice President and Senior Counsel | | N/A |
John M. Corcoran (k) (age 46) | | Treasurer | | October 2008 | | Massachusetts Financial Services Company, Senior Vice President (since October 2008); State Street Bank and Trust (financial services provider), Senior Vice President, (until September 2008) | | N/A |
Ethan D. Corey (k) (age 47) | | Assistant
Secretary and Assistant Clerk | | July 2005 | | Massachusetts Financial Services Company, Senior Vice President and Associate General Counsel | | N/A |
David L. DiLorenzo (k) (age 43) | | Assistant
Treasurer | | July 2005 | | Massachusetts Financial Services Company, Vice President | | N/A |
Timothy M. Fagan (k) (age 43) | | Assistant
Secretary and Assistant Clerk | | September 2005 | | Massachusetts Financial Services Company, Vice President and Senior Counsel | | N/A |
39
Trustees and Officers – continued
| | | | | | | | |
Name, Age | | Position(s) Held with Fund | | Trustee/Officer
Since (h) | | Principal Occupations
During the Past Five Years | | Other
Directorships (j) |
Robyn L. Griffin (age 36) | | Assistant Independent Chief Compliance Officer | | August 2008 | | Griffin Compliance LLC (provider of compliance services), Principal (since August 2008); State Street Corporation (financial services provider), Mutual Fund Administration Assistant Vice President (October 2006 – July 2008); Liberty Mutual Group (insurance), Personal Market Assistant Controller (April 2006 – October 2006); Deloitte & Touche LLP (professional services firm). | | N/A |
Brian E. Langenfeld (k) (age 38) | | Assistant Secretary and Assistant Clerk | | June 2006 | | Massachusetts Financial Services Company, Vice President and Senior Counsel | | N/A |
Ellen Moynihan (k) (age 53) | | Assistant Treasurer | | April 1997 | | Massachusetts Financial Services Company, Senior Vice President | | N/A |
Susan S. Newton (k) (age 61) | | Assistant
Secretary and Assistant Clerk | | May 2005 | | Massachusetts Financial Services Company, Senior Vice President and Associate General Counsel | | N/A |
Susan A. Pereira (k) (age 40) | | Assistant Secretary and Assistant Clerk | | July 2005 | | Massachusetts Financial Services Company, Vice President and Senior Counsel | | N/A |
Mark N. Polebaum (k) (age 59) | | Secretary and Clerk | | January 2006 | | Massachusetts Financial Services Company, Executive Vice President, General Counsel and Secretary | | N/A |
40
Trustees and Officers – continued
| | | | | | | | |
Name, Age | | Position(s) Held with Fund | | Trustee/Officer
Since (h) | | Principal Occupations
During the Past Five Years | | Other
Directorships (j) |
Frank L. Tarantino (age 67) | | Independent
Chief Compliance Officer | | June 2004 | | Tarantino LLC (provider of compliance services), Principal | | N/A |
Richard S. Weitzel (k) (age 41) | | Assistant Secretary and Assistant Clerk | | October 2007 | | Massachusetts Financial Services Company, Vice President and Assistant General Counsel | | N/A |
James O. Yost (k) (age 51) | | Assistant Treasurer | | September 1990 | | Massachusetts Financial Services Company, Senior Vice President | | N/A |
| (h) | Date first appointed to serve as Trustee/officer of an MFS fund. Each Trustee has served continuously since appointment unless indicated otherwise. For the period from December 15, 2004 until February 22, 2005, Messrs. Pozen and Manning served as Advisory Trustees. For the period March 2008 until October 2008, Ms. DiOrioDwyer served as Treasurer of the Funds. |
| (j) | Directorships or trusteeships of companies required to report to the Securities and Exchange Commission (i.e., “public companies”). |
| (k) | “Interested person” of the Trust within the meaning of the Investment Company Act of 1940 (referred to as the 1940 Act), which is the principal federal law governing investment companies like the fund, as a result of position with MFS. The address of MFS is 500 Boylston Street, Boston, Massachusetts 02116. |
Each Trustee has been elected by shareholders and each Trustee and officer holds office until his or her successor is chosen and qualified or until his or her earlier death, resignation, retirement or removal. The Trust does not hold annual meetings for the purpose of electing Trustees, and Trustees are not elected for fixed terms. Messrs. Butler, Kavanaugh, Uek and Ms. Thomsen are members of the Trust’s Audit Committee.
Each of the Fund’s Trustees and officers holds comparable positions with certain other funds of which MFS or a subsidiary is the investment adviser or distributor, and, in the case of the officers, with certain affiliates of MFS. As of January 1, 2011, the Trustees served as board members of 105 funds within the MFS Family of Funds.
41
Trustees and Officers – continued
The Statement of Additional Information for the Fund includes further information about the Trustees and is available without charge upon request by calling 1-800-225-2606.
| | |
| Investment Adviser | | Custodian |
Massachusetts Financial Services Company
500 Boylston Street, Boston, MA 02116-3741 | | State Street Bank and Trust 1 Lincoln Street, Boston, MA 02111-2900 |
| Distributor | | Independent Registered Public Accounting Firm |
MFS Fund Distributors, Inc.
500 Boylston Street, Boston, MA 02116-3741 | | Deloitte & Touche LLP 200 Berkeley Street, Boston, MA 02116 |
| Portfolio Managers | | |
Matthew Krummell Jonathan Sage | | |
42
BOARD REVIEW OF INVESTMENT ADVISORY AGREEMENT
The Investment Company Act of 1940 requires that both the full Board of Trustees and a majority of the non-interested (“independent”) Trustees, voting separately, annually approve the continuation of the Fund’s investment advisory agreement with MFS. The Trustees consider matters bearing on the Fund and its advisory arrangements at their meetings throughout the year, including a review of performance data at each regular meeting. In addition, the independent Trustees met several times over the course of three months beginning in May and ending in July, 2011 (“contract review meetings”) for the specific purpose of considering whether to approve the continuation of the investment advisory agreement for the Fund and the other investment companies that the Board oversees (the “MFS Funds”). The independent Trustees were assisted in their evaluation of the Fund’s investment advisory agreement by independent legal counsel, from whom they received separate legal advice and with whom they met separately from MFS during various contract review meetings. The independent Trustees were also assisted in this process by the MFS Funds’ Independent Chief Compliance Officer, a full-time senior officer appointed by and reporting to the independent Trustees.
In connection with their deliberations regarding the continuation of the investment advisory agreement, the Trustees, including the independent Trustees, considered such information and factors as they believed, in light of the legal advice furnished to them and their own business judgment, to be relevant. The investment advisory agreement for the Fund was considered separately, although the Trustees also took into account the common interests of all MFS Funds in their review. As described below, the Trustees considered the nature, quality, and extent of the various investment advisory, administrative, and shareholder services performed by MFS under the existing investment advisory agreement and other arrangements with the Fund.
In connection with their contract review meetings, the Trustees received and relied upon materials that included, among other items: (i) information provided by Lipper Inc., an independent third party, on the investment performance of the Fund for various time periods ended December 31, 2010 and the investment performance of a group of funds with substantially similar investment classifications/objectives (the “Lipper performance universe”), (ii) information provided by Lipper Inc. on the Fund’s advisory fees and other expenses and the advisory fees and other expenses of comparable funds identified by Lipper Inc. (the “Lipper expense group”), (iii) information provided by MFS on the advisory fees of comparable portfolios of other clients of MFS, including institutional separate accounts and other clients, (iv) information as to whether and to what extent applicable expense waivers, reimbursements or fee “breakpoints” are observed for the Fund, (v) information
43
Board Review of Investment Advisory Agreement – continued
regarding MFS’ financial results and financial condition, including MFS’ and certain of its affiliates’ estimated profitability from services performed for the Fund and the MFS Funds as a whole, and compared to MFS’ institutional business, (vi) MFS’ views regarding the outlook for the mutual fund industry and the strategic business plans of MFS, (vii) descriptions of various functions performed by MFS for the Funds, such as compliance monitoring and portfolio trading practices, and (viii) information regarding the overall organization of MFS, including information about MFS’ senior management and other personnel providing investment advisory, administrative and other services to the Fund and the other MFS Funds. The comparative performance, fee and expense information prepared and provided by Lipper Inc. was not independently verified and the independent Trustees did not independently verify any information provided to them by MFS.
The Trustees’ conclusion as to the continuation of the investment advisory agreement was based on a comprehensive consideration of all information provided to the Trustees and not the result of any single factor. Some of the factors that figured particularly in the Trustees’ deliberations are described below, although individual Trustees may have evaluated the information presented differently from one another, giving different weights to various factors. It is also important to recognize that the fee arrangements for the Fund and other MFS Funds are the result of years of review and discussion between the independent Trustees and MFS, that certain aspects of such arrangements may receive greater scrutiny in some years than in others, and that the Trustees’ conclusions may be based, in part, on their consideration of these same arrangements during the course of the year and in prior years.
In considering the Fund’s investment performance, the Trustees took into account that, effective June 1, 2008, the Fund changed its name (formerly, the Fund was named MFS Union Standard Equity Fund) and made related changes to its investment policies and strategies. Notwithstanding these changes, the Trustees considered the Fund’s prior investment performance prior to June 1, 2008 to be relevant. Based on information provided by Lipper Inc., the Trustees reviewed the Fund’s total return investment performance as well as the performance of peer groups of funds over various time periods. The Trustees placed particular emphasis on the total return performance of the Fund’s Class A shares in comparison to the performance of funds in its Lipper performance universe over the three-year period ended December 31, 2010, which the Trustees believed was a long enough period to reflect differing market conditions. The total return performance of the Fund’s Class A shares was in the 3rd quintile relative to the other funds in the universe for this three-year period (the 1st quintile being the best performers and the 5th quintile being the worst performers). The total return performance of the Fund’s
44
Board Review of Investment Advisory Agreement – continued
Class A shares was in the 1st quintile for each of the one- and five-year periods ended December 31, 2010 relative to the Lipper performance universe. Because of the passage of time, these performance results are likely to differ from the performance results for more recent periods, including those shown elsewhere in this report.
In the course of their deliberations, the Trustees took into account information provided by MFS in connection with the contract review meetings, as well as during investment review meetings conducted with portfolio management personnel during the course of the year regarding the Fund’s performance. After reviewing these and related factors, the Trustees concluded, within the context of their overall conclusions regarding the investment advisory agreement, that they were satisfied with MFS’ responses and efforts relating to investment performance.
In assessing the reasonableness of the Fund’s advisory fee, the Trustees considered, among other information, the Fund’s advisory fee and the total expense ratio of the Fund’s Class A shares as a percentage of average daily net assets and the advisory fee and total expense ratios of peer groups of funds based on information provided by Lipper Inc. The Trustees considered that MFS currently observes an expense limitation for the Fund, which may not be changed without the Trustees’ approval. The Trustees also considered that, according to the Lipper data (which takes into account any fee reductions or expense limitations that were in effect during the Fund’s last fiscal year), the Fund’s effective advisory fee rate and total expense ratio were each lower than the Lipper expense group median.
The Trustees also considered the advisory fees charged by MFS to institutional separate accounts. In comparing these fees, the Trustees considered information provided by MFS as to the generally broader scope of services provided by MFS to the Fund in comparison to institutional separate accounts, the higher demands placed on MFS’ investment personnel and trading infrastructure as a result of the daily cash in-flows and out-flows of the Fund, and the impact on MFS and expenses associated with the more extensive regulatory regime to which the Fund is subject in comparison to institutional separate accounts.
The Trustees also considered whether the Fund is likely to benefit from any economies of scale in the management of the Fund in the event of growth in assets of the Fund. They noted that the Fund’s advisory fee rate schedule is not subject to any breakpoints. Taking into account the expense limitation noted above, the Trustees determined not to recommend any advisory fee breakpoints for the Fund at this time.
The Trustees also considered information prepared by MFS relating to MFS’ costs and profits with respect to the Fund, the MFS Funds considered as a
45
Board Review of Investment Advisory Agreement – continued
group, and other investment companies and accounts advised by MFS, as well as MFS’ methodologies used to determine and allocate its costs to the MFS Funds, the Fund and other accounts and products for purposes of estimating profitability.
After reviewing these and other factors described herein, the Trustees concluded, within the context of their overall conclusions regarding the investment advisory agreement, that the advisory fees charged to the Fund represent reasonable compensation in light of the services being provided by MFS to the Fund.
In addition, the Trustees considered MFS’ resources and related efforts to continue to retain, attract and motivate capable personnel to serve the Fund. The Trustees also considered current and developing conditions in the financial services industry, including the presence of large and well-capitalized companies which are spending, and appear to be prepared to continue to spend, substantial sums to engage personnel and to provide services to competing investment companies. In this regard, the Trustees also considered the financial resources of MFS and its ultimate parent, Sun Life Financial Inc. The Trustees also considered the advantages and possible disadvantages to the Fund of having an adviser that also serves other investment companies as well as other accounts.
The Trustees also considered the nature, quality, cost, and extent of administrative, transfer agency, and distribution services provided to the Fund by MFS and its affiliates under agreements and plans other than the investment advisory agreement, including any 12b-1 fees the Fund pays to MFS Fund Distributors, Inc., an affiliate of MFS. The Trustees also considered the nature, extent and quality of certain other services MFS performs or arranges for on the Fund’s behalf, which may include securities lending programs, directed expense payment programs, class action recovery programs, and MFS’ interaction with third-party service providers, principally custodians and sub-custodians. The Trustees concluded that the various non-advisory services provided by MFS and its affiliates on behalf of the Fund were satisfactory.
The Trustees also considered benefits to MFS from the use of the Fund’s portfolio brokerage commissions, if applicable, to pay for investment research and various other factors. Additionally, the Trustees considered so-called “fall-out benefits” to MFS such as reputational value derived from serving as investment manager to the Fund.
Based on their evaluation of factors that they deemed to be material, including those factors described above, the Board of Trustees, including a majority of the independent Trustees, concluded that the Fund’s investment advisory
46
Board Review of Investment Advisory Agreement – continued
agreement with MFS should be continued for an additional one-year period, commencing August 1, 2011.
A discussion regarding the Board’s most recent review and renewal of the fund’s Investment Advisory Agreement with MFS is available by clicking on the fund’s name under “Mutual Funds” in the “Products and Performance” section of the MFS Web site (mfs.com).
47
PROXY VOTING POLICIES AND INFORMATION
A general description of the MFS funds’ proxy voting policies and procedures is available without charge, upon request, by calling
1-800-225-2606, by visiting the Proxy Voting section of mfs.com or by visiting the SEC’s Web site at http://www.sec.gov.
Information regarding how the fund voted proxies relating to portfolio securities during the most recent twelve-month period ended June 30 is available without charge by visiting the Proxy Voting section of mfs.com or by visiting the SEC’s Web site at http://www.sec.gov.
QUARTERLY PORTFOLIO DISCLOSURE
The fund will file a complete schedule of portfolio holdings with the Securities and Exchange Commission (the Commission) for the first and third quarters of each fiscal year on Form N-Q. The fund’s Form N-Q may be reviewed and copied at the:
Public Reference Room
Securities and Exchange Commission
100 F Street, NE, Room 1580
Washington, D.C. 20549
Information on the operation of the Public Reference Room may be obtained by calling the Commission at 1-800-SEC-0330. The fund’s Form N-Q is available on the EDGAR database on the Commission’s Internet Web site at http://www.sec.gov, and copies of this information may be obtained, upon payment of a duplicating fee, by electronic request at the following e-mail address: publicinfo@sec.gov or by writing the Public Reference Section at the above address.
A shareholder can also obtain the quarterly portfolio holdings report at mfs.com.
FURTHER INFORMATION
From time to time, MFS may post important information about the fund or the MFS funds on the MFS web site (mfs.com). This information is available by visiting the “News & Commentary” section of mfs.com or by clicking on the fund’s name under “Mutual Funds” in the “Products and Performance” section of mfs.com.
FEDERAL TAX INFORMATION (unaudited)
The fund will notify shareholders of amounts for use in preparing 2011 income tax forms in January 2012. The following information is provided pursuant to provisions of the Internal Revenue Code.
The fund designates the maximum amount allowable as qualified dividend income eligible for the 15% tax rate.
For corporate shareholders, 100% of the ordinary income dividends paid during the fiscal year qualify for the corporate dividends received deduction.
48
rev. 3/11
| | | | |
| FACTS | | WHAT DOES MFS DO WITH YOUR PERSONAL INFORMATION? | |  |
| | |
| Why? | | Financial companies choose how they share your personal information. Federal law gives consumers the right to limit some but not all sharing. Federal law also requires us to tell you how we collect, share, and protect your personal information. Please read this notice carefully to understand what we do. |
| | |
| What? | | The types of personal information we collect and share depend on the product or service you have with us. This information can include: •Social Security number and account balances •Account transactions and transaction history •Checking account information and wire transfer instructions When you are no longer our customer, we continue to share your information as described in this notice. |
| | |
| How? | | All financial companies need to share customers’ personal information to run their everyday business. In the section below, we list the reasons financial companies can share their customers’ personal information; the reasons MFS chooses to share; and whether you can limit this sharing. |
| | | | |
| Reasons we can share your personal information | | Does MFS share? | | Can you limit
this sharing? |
For our everyday business purposes – such as to process your transactions, maintain your account(s), respond to court orders and legal investigations, or report to credit bureaus | | Yes | | No |
For our marketing purposes – to offer our products and services to you | | No | | We don’t share |
| For joint marketing with other financial companies | | No | | We don’t share |
For our affiliates’ everyday business purposes – information about your transactions and experiences | | No | | We don’t share |
For our affiliates’ everyday business purposes – information about your creditworthiness | | No | | We don’t share |
| For nonaffiliates to market to you | | No | | We don’t share |
| | |
| Questions? | | Call 800-225-2606 or go to mfs.com. |
49
| | |
| Who we are |
| Who is providing this notice? | | MFS Funds, MFS Investment Management, MFS Institutional Advisors, Inc., MFS Fund Distributors, Inc., MFS Heritage Trust Company, and MFS Service Center, Inc. |
| | |
| What we do |
| How does MFS protect my personal information? | | To protect your personal information from unauthorized access and use, we use security measures that comply with federal law. These measures include procedural, electronic, and physical safeguards for the protection of the personal information we collect about you. |
How does MFS
collect my personal information? | | We collect your personal information, for example, when you •open an account or provide account information •direct us to buy securities or direct us to sell your securities •make a wire transfer We also collect your personal information from others, such as credit bureaus, affiliates and other companies. |
| Why can’t I limit all sharing? | | Federal law gives you the right to limit only •sharing for affiliates’ everyday business purposes – information about your creditworthiness •affiliates from using your information to market to you •sharing for nonaffiliates to market to you State laws and individual companies may give you additional rights to limit sharing. |
| | |
| Definitions |
| Affiliates | | Companies related by common ownership or control. They can be financial and nonfinancial companies. •MFS does not share personal information with affiliates, except for everyday business purposes as described on page one of this notice. |
| Nonaffiliates | | Companies not related by common ownership or control. They can be financial and nonfinancial companies. •MFS does not share with nonaffiliates so they can market to you. |
| Joint Marketing | | A formal agreement between nonaffiliated financial companies that together market financial products or services to you. •MFS doesn’t jointly market. |
| | |
| Other important information |
| If you own an MFS product or receive an MFS service in the name of a third party such as a bank or broker-dealer, their privacy policy may apply to you instead of ours. |
50
Save paper with eDelivery.
MFS® will send you prospectuses, reports, and proxies directly via e-mail so you will get information faster with less mailbox clutter.
To sign up:
1. Go to mfs.com.
2. Log in via MFS® Access.
3. Select eDelivery.
If you own your MFS fund shares through a financial institution or a retirement plan, MFS® TALK, MFS® Access, or eDelivery may not be available to you.

Web site
mfs.com
MFS TALK
1-800-637-8255
24 hours a day
Account service and literature
Shareholders
1-800-225-2606
Financial advisors
1-800-343-2829
Retirement plan services
1-800-637-1255
Mailing address
MFS Service Center, Inc.
P.O. Box 55824
Boston, MA 02205-5824
Overnight mail
MFS Service Center, Inc.
c/o Boston Financial Data Services
30 Dan Road
Canton, MA 02021-2809
The Registrant has adopted a Code of Ethics pursuant to Section 406 of the Sarbanes-Oxley Act and as defined in Form N-CSR that applies to the Registrant’s principal executive officer and principal financial and accounting officer. The Registrant has not amended any provision in its Code of Ethics (the “Code”) that relates to an element of the Code’s definitions enumerated in paragraph (b) of Item 2 of this Form N-CSR. The Registrant has not granted a waiver, including an implicit waiver, from any provision of the Code.
A copy of the Code of Ethics is filed as an exhibit to this Form N-CSR.
| ITEM 3. | AUDIT COMMITTEE FINANCIAL EXPERT. |
Messrs. Robert E. Butler, John P. Kavanaugh and Robert W. Uek and Ms. Laurie J. Thomsen, members of the Audit Committee, have been determined by the Board of Trustees in their reasonable business judgment to meet the definition of “audit committee financial expert” as such term is defined in Form N-CSR. In addition, Messrs. Butler, Kavanaugh and Uek and Ms. Thomsen are “independent” members of the Audit Committee (as such term has been defined by the Securities and Exchange Commission in regulations implementing Section 407 of the Sarbanes-Oxley Act of 2002). The Securities and Exchange Commission has stated that the designation of a person as an audit committee financial expert pursuant to this Item 3 on the Form N-CSR does not impose on such a person any duties, obligations or liability that are greater than the duties, obligations or liability imposed on such person as a member of the Audit Committee and the Board of Trustees in the absence of such designation or identification.
| ITEM 4. | PRINCIPAL ACCOUNTANT FEES AND SERVICES. |
Items 4(a) through 4(d) and 4(g):
The Board of Trustees has appointed Deloitte & Touche LLP (“Deloitte”) to serve as independent accountants to certain series of the Registrant and Ernst & Young LLP (“E&Y”) to serve in the same capacity to certain other series of the Registrant (the series referred to collectively as the “Funds” and singularly as a “Fund”). The tables below set forth the audit fees billed to the Funds as well as fees for non-audit services provided to the Funds and/or to the Funds’ investment adviser, Massachusetts Financial Services Company (“MFS”), and to various entities either controlling, controlled by, or under common control with MFS that provide ongoing services to the Funds (“MFS Related Entities”).
For the fiscal years ended September 30, 2011 and 2010, audit fees billed to the Funds by Deloitte and E&Y were as follows:
| | | | | | | | |
| | | Audit Fees | |
| | | 2011 | | | 2010 | |
Fees billed by Deloitte: | | | | | | | | |
MFS Blended Research Core Equity Fund | | | 39,399 | | | | 38,979 | |
| | | | | | | | |
| | | Audit Fees | |
| | | 2011 | | | 2010 | |
Fees billed by E&Y: | | | | | | | | |
MFS Mid Cap Value Fund | | | 25,308 | | | | 25,041 | |
For the fiscal years ended September 30, 2011 and 2010, fees billed by Deloitte and E&Y for audit-related, tax and other services provided to the Funds and for audit-related, tax and other services provided to MFS and MFS Related Entities were as follows:
| | | | | | | | | | | | | | | | | | | | | | | | |
| | | Audit-Related Fees1 | | | Tax Fees2 | | | All Other Fees3 | |
| | | 2011 | | | 2010 | | | 2011 | | | 2010 | | | 2011 | | | 2010 | |
Fees billed by Deloitte: | | | | | | | | | | | | | | | | | | | | | | | | |
To MFS Blended Research Core Equity Fund | | | 0 | | | | 0 | | | | 7,157 | | | | 7,079 | | | | 601 | | | | 2,035 | |
To MFS and MFS Related Entities of MFS Blended Research Core Equity Fund* | | | 577,704 | | | | 1,333,877 | | | | 0 | | | | 0 | | | | 113,100 | | | | 0 | |
| | | | | | | | |
| | | 2011 | | | 2010 | |
Aggregate fees for non-audit services: | | | | | | | | |
To MFS Blended Research Core Equity Fund, MFS and MFS Related Entities# | | | 1,122,778 | | | | 1,667,816 | |
| | | | | | | | | | | | | | | | | | | | | | | | |
| | | Audit-Related Fees1 | | | Tax Fees2 | | | All Other Fees | |
| | | 2011 | | | 2010 | | | 2011 | | | 2010 | | | 2011 | | | 2010 | |
Fees billed by E&Y: | | | | | | | | | | | | | | | | | | | | | | | | |
To MFS Mid Cap Value Fund | | | 0 | | | | 0 | | | | 5,031 | | | | 4,919 | | | | 0 | | | | 0 | |
To MFS and MFS Related Entities of MFS Mid Cap Value Fund* | | | 0 | | | | 0 | | | | 0 | | | | 0 | | | | 0 | | | | 0 | |
| | | | | | | | |
| | | 2011 | | | 2010 | |
Aggregate fees for non-audit services: | | | | | | | | |
To MFS Mid Cap Value Fund, MFS and MFS Related Entities# | | | 106,395 | | | | 243,407 | |
| * | This amount reflects the fees billed to MFS and MFS Related Entities for non-audit services relating directly to the operations and financial reporting of the Funds (portions of which services also related to the operations and financial reporting of other funds within the MFS Funds complex). |
| # | This amount reflects the aggregate fees billed by Deloitte or E&Y for non-audit services rendered to the Funds and for non-audit services rendered to MFS and the MFS Related Entities. |
| 1 | The fees included under “Audit-Related Fees” are fees related to assurance and related services that are reasonably related to the performance of the audit or review of financial statements, but not reported under ‘‘Audit Fees,’’ including accounting consultations, agreed-upon procedure reports, attestation reports, comfort letters and internal control reviews. |
| 2 | The fees included under “Tax Fees” are fees associated with tax compliance, tax advice and tax planning, including services relating to the filing or amendment of federal, state or local income tax returns, regulated investment company qualification reviews and tax distribution and analysis. |
| 3 | The fees included under “All Other Fees” are fees for products and services provided by Deloitte other than those reported under “Audit Fees,” “Audit-Related Fees” and “Tax Fees,” including fees for services related to review of internal controls and review of Rule 38a-1 compliance program. |
Item 4(e)(1):
Set forth below are the policies and procedures established by the Audit Committee of the Board of Trustees relating to the pre-approval of audit and non-audit related services: To the extent required by applicable law, pre-approval by the Audit Committee of the Board is needed for all audit and permissible non-audit services rendered to the Funds and all permissible non-audit services rendered to MFS or MFS Related Entities if the services relate directly to the operations and financial reporting of the Registrant. Pre-approval is currently on an engagement-by-engagement basis. In the event pre-approval of such services is necessary between regular meetings of the Audit Committee and it is not practical to wait to seek pre-approval at the next regular meeting of the Audit Committee, pre-approval of such services may be referred to the Chair of the Audit Committee for approval; provided that the Chair may not pre-approve any individual engagement for such services exceeding $50,000 or multiple engagements for such services in the aggregate exceeding $100,000 in each period between regular meetings of the Audit Committee. Any engagement pre-approved by the Chair between regular meetings of the Audit Committee shall be presented for ratification by the entire Audit Committee at its next regularly scheduled meeting.
Item 4(e)(2):
None, or 0%, of the services relating to the Audit-Related Fees, Tax Fees and All Other Fees paid by the Fund and MFS and MFS Related Entities relating directly to the operations and financial reporting of the Registrant disclosed above were approved by the
audit committee pursuant to paragraphs (c)(7)(i)(C) of Rule 2-01 of Regulation S-X (which permits audit committee approval after the start of the engagement with respect to services other than audit, review or attest services, if certain conditions are satisfied).
Item 4(f): Not applicable.
Item 4(h): The Registrant’s Audit Committee has considered whether the provision by a Registrant’s independent registered public accounting firm of non-audit services to MFS and MFS Related Entities that were not pre-approved by the Committee (because such services did not relate directly to the operations and financial reporting of the Registrant) was compatible with maintaining the independence of the independent registered public accounting firm as the Registrant’s principal auditors.
| ITEM 5. | AUDIT COMMITTEE OF LISTED REGISTRANTS. |
Not applicable to the Registrant.
A schedule of investments of each series of the Registrant is included as part of the report to shareholders of such series under Item 1 of this Form N-CSR.
| ITEM 7. | DISCLOSURE OF PROXY VOTING POLICIES AND PROCEDURES FOR CLOSED-END MANAGEMENT INVESTMENT COMPANIES. |
Not applicable to the Registrant.
| ITEM 8. | PORTFOLIO MANAGERS OF CLOSED-END MANAGEMENT INVESTMENT COMPANIES. |
Not applicable to the Registrant.
| ITEM 9. | PURCHASES OF EQUITY SECURITIES BY CLOSED-END MANAGEMENT INVESTMENT COMPANY AND AFFILIATED PURCHASERS. |
Not applicable to the Registrant.
| ITEM 10. | SUBMISSION OF MATTERS TO A VOTE OF SECURITY HOLDERS. |
There were no material changes to the procedures by which shareholders may send recommendations to the Board for nominees to the Registrant’s Board since the Registrant last provided disclosure as to such procedures in response to the requirements of Item 407 (c)(2)(iv) of Regulation S-K or this Item.
| ITEM 11. | CONTROLS AND PROCEDURES. |
| (a) | Based upon their evaluation of the effectiveness of the registrant’s disclosure controls and procedures (as defined in Rule 30a-3(c) under the Investment Company Act of 1940 (the “Act”)) as conducted within 90 days of the filing date of this report on Form N-CSR, the registrant’s principal financial officer and principal executive officer have concluded that those disclosure controls and procedures provide reasonable assurance that the material information required to be disclosed by the registrant on this report is recorded, processed, summarized and reported within the time periods specified in the Securities and Exchange Commission’s rules and forms. |
| (b) | There were no changes in the registrant’s internal controls over financial reporting (as defined in Rule 30a-3(d) under the Act) that occurred during the second fiscal quarter of the period covered by the report that have materially affected, or are reasonably likely to materially affect, the registrant’s internal control over financial reporting. |
| (a) | File the exhibits listed below as part of this form. Letter or number the exhibits in the sequence indicated. |
| | (1) | Any code of ethics, or amendment thereto, that is the subject of the disclosure required by Item 2, to the extent that the registrant intends to satisfy the Item 2 requirements through filing of an exhibit: Code of Ethics attached hereto. |
| | (2) | A separate certification for each principal executive officer and principal financial officer of the registrant as required by Rule 30a-2(a) under the Act (17 CFR 270.30a-2): Attached hereto. |
| (b) | If the report is filed under Section 13(a) or 15(d) of the Exchange Act, provide the certifications required by Rule 30a-2(b) under the Act (17 CFR 270.30a-2(b)), Rule 13a-14(b) or Rule 15d-14(b) under the Exchange Act (17 CFR 240.13a-14(b) or 240.15d-14(b)) and Section 1350 of Chapter 63 of Title 18 of the United States Code (18 U.S.C. 1350) as an exhibit. A certification furnished pursuant to this paragraph will not be deemed “filed” for the purposes of Section 18 of the Exchange Act (15 U.S.C. 78r), or otherwise subject to the liability of that section. Such certification will not be deemed to be incorporated by reference into any filing under the Securities Act of 1933 or the Exchange Act, except to the extent that the registrant specifically incorporates it by reference: Attached hereto. |
Notice
A copy of the Amended and Restated Declaration of Trust, as amended, of the Registrant is on file with the Secretary of State of The Commonwealth of Massachusetts and notice is hereby given that this instrument is executed on behalf of the Registrant by an officer of the Registrant as an officer and not individually and the obligations of or arising out of this instrument are not binding upon any of the Trustees or shareholders individually, but are binding only upon the assets and property of the respective constituent series of the Registrant.
SIGNATURES
Pursuant to the requirements of the Securities Exchange Act of 1934 and the Investment Company Act of 1940, the registrant has duly caused this report to be signed on its behalf by the undersigned, thereunto duly authorized.
(Registrant) MFS SERIES TRUST XI
| | |
| By (Signature and Title)* | | MARIA F. DIORIODWYER |
| | Maria F. DiOrioDwyer, President |
Date: November 15, 2011
Pursuant to the requirements of the Securities Exchange Act of 1934 and the Investment Company Act of 1940, this report has been signed below by the following persons on behalf of the registrant and in the capacities and on the dates indicated.
| | |
| By (Signature and Title)* | | MARIA F. DIORIODWYER |
| | Maria F. DiOrioDwyer, President (Principal Executive Officer) |
Date: November 15, 2011
| | |
| By (Signature and Title)* | | JOHN M. CORCORAN |
| | John M. Corcoran, Treasurer (Principal Financial Officer and Accounting Officer) |
Date: November 15, 2011
| * | Print name and title of each signing officer under his or her signature. |