Table of Contents
UNITED STATES
SECURITIES AND EXCHANGE COMMISSION
Washington, D.C. 20549
FORM N-CSR
CERTIFIED SHAREHOLDER REPORT OF
REGISTERED MANAGEMENT INVESTMENT COMPANIES
Investment Company Act file number 811-07992
MFS SERIES TRUST XI
(Exact name of registrant as specified in charter)
111 Huntington Avenue, Boston, Massachusetts 02199
(Address of principal executive offices) (Zip code)
Susan S. Newton
Massachusetts Financial Services Company
111 Huntington Avenue,
Boston, Massachusetts 02199
(Name and address of agents for service)
Registrant’s telephone number, including area code: (617) 954-5000
Date of fiscal year end: September 30
Date of reporting period: March 31, 2014
Table of Contents
| ITEM 1. | REPORTS TO STOCKHOLDERS. |
Table of Contents
SEMIANNUAL REPORT
March 31, 2014

MFS® MID CAP VALUE FUND

MDV-SEM
Table of Contents
MFS® MID CAP VALUE FUND
The report is prepared for the general information of shareholders. It is authorized for distribution to prospective investors only when preceded or accompanied by a current prospectus.
NOT FDIC INSURED Ÿ MAY LOSE VALUE Ÿ NO BANK GUARANTEE
Table of Contents

LETTER FROM THE CHAIRMAN AND CEO
Dear Shareholders:
The pace of U.S. economic growth slowed early in 2014, largely because of harsh winter weather. However, the U.S. labor market, consumer confidence and other
economic data have all pointed to recovery. The U.S. Federal Reserve’s steady, gradual removal of its bond-buying stimulus, after initially causing concern, is providing some consistency, which can inspire consumer and investor confidence.
Global economic uncertainty and geopolitical tensions have added to market volatility. The eurozone, however, is making progress in its economic recovery. Japan’s progress in its battle to end deflation is expected to experience a temporary setback on the heels of the country’s sales tax increase, introduced in April.
The world’s largest economic concern remains the slowdown in China’s pace of growth as it shifts toward a more consumer-oriented economy. Any reduction in China’s economic growth rate is likely to have a ripple effect on its many trading partners.
In uncertain times such as these, it is particularly important to remember that managing risk should always be a top priority. At MFS®, active risk management is an integral part of our collaborative process. Our global team of investment professionals shares ideas and evaluates opportunities that span continents, investment disciplines and asset classes. Our goal is to build better insights, and ultimately better results, for our clients.
We understand and appreciate the economic challenges investors face, and we believe in the value of maintaining a long-term view and applying proven principles, such as asset allocation and diversification. We are confident that our unique approach can serve investors well as they work with their financial advisors to identify and pursue the most suitable opportunities.
Respectfully,

Robert J. Manning
Chairman and Chief Executive Officer
MFS Investment Management
May 13, 2014
The opinions expressed in this letter are subject to change, may not be relied upon for investment advice, and no forecasts can be guaranteed.
1
Table of Contents
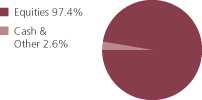
Portfolio structure
| Top ten holdings | ||||
| PerkinElmer, Inc. | 1.1% | |||
| Newell Rubbermaid, Inc. | 1.1% | |||
| BB&T Corp. | 1.1% | |||
| Crown Holdings, Inc. | 1.1% | |||
| Stanley Black & Decker, Inc. | 1.0% | |||
| Xerox Corp. | 1.0% | |||
| NASDAQ OMX Group, Inc. | 1.0% | |||
| TCF Financial Corp. | 1.0% | |||
| Northeast Utilities | 0.9% | |||
| Huntington Bancshares, Inc. | 0.9% |
| Equity sectors | ||||
| Financial Services | 23.7% | |||
| Utilities & Communications | 10.8% | |||
| Health Care | 8.9% | |||
| Industrial Goods & Services | 7.9% | |||
| Energy | 7.7% | |||
| Basic Materials | 7.7% | |||
| Consumer Staples | 7.3% | |||
| Technology | 7.0% | |||
| Retailing | 6.5% | |||
| Autos & Housing | 2.8% | |||
| Special Products & Services | 2.6% | |||
| Leisure | 2.6% | |||
| Transportation | 1.9% |
Percentages are based on net assets as of 3/31/14.
The portfolio is actively managed and current holdings may be different.
2
Table of Contents
Fund expenses borne by the shareholders during the period, October 1, 2013 through March 31, 2014
As a shareholder of the fund, you incur two types of costs: (1) transaction costs, including sales charges (loads) on certain purchase or redemption payments, and (2) ongoing costs, including management fees; distribution and service (12b-1) fees; and other fund expenses. This example is intended to help you understand your ongoing costs (in dollars) of investing in the fund and to compare these costs with the ongoing costs of investing in other mutual funds.
The example is based on an investment of $1,000 invested at the beginning of the period and held for the entire period October 1, 2013 through March 31, 2014.
The expenses include the payment of a portion of the transfer-agent-related expenses of MFS funds that invest in the fund. For further information, please see the Notes to the Financial Statements.
Actual Expenses
The first line for each share class in the following table provides information about actual account values and actual expenses. You may use the information in this line, together with the amount you invested, to estimate the expenses that you paid over the period. Simply divide your account value by $1,000 (for example, an $8,600 account value divided by $1,000 = 8.6), then multiply the result by the number in the first line under the heading entitled “Expenses Paid During Period” to estimate the expenses you paid on your account during this period.
Hypothetical Example for Comparison Purposes
The second line for each share class in the following table provides information about hypothetical account values and hypothetical expenses based on the fund’s actual expense ratio and an assumed rate of return of 5% per year before expenses, which is not the fund’s actual return. The hypothetical account values and expenses may not be used to estimate the actual ending account balance or expenses you paid for the period. You may use this information to compare the ongoing costs of investing in the fund and other funds. To do so, compare this 5% hypothetical example with the 5% hypothetical examples that appear in the shareholder reports of the other funds.
Please note that the expenses shown in the table are meant to highlight your ongoing costs only and do not reflect any transactional costs, such as sales charges (loads). Therefore, the second line for each share class in the table is useful in comparing ongoing costs only, and will not help you determine the relative total costs of owning different funds. In addition, if these transactional costs were included, your costs would have been higher.
3
Table of Contents
Expense Table – continued
| Share Class | Annualized Expense Ratio | Beginning Account Value 10/01/13 | Ending Account Value 3/31/14 | Expenses Paid During Period (p) 10/01/13-3/31/14 | ||||||||||||||
| A | Actual | 1.18% | $1,000.00 | $1,127.10 | $6.26 | |||||||||||||
| Hypothetical (h) | 1.18% | $1,000.00 | $1,019.05 | $5.94 | ||||||||||||||
| B | Actual | 1.93% | $1,000.00 | $1,123.20 | $10.22 | |||||||||||||
| Hypothetical (h) | 1.93% | $1,000.00 | $1,015.31 | $9.70 | ||||||||||||||
| C | Actual | 1.93% | $1,000.00 | $1,122.86 | $10.21 | |||||||||||||
| Hypothetical (h) | 1.93% | $1,000.00 | $1,015.31 | $9.70 | ||||||||||||||
| I | Actual | 0.93% | $1,000.00 | $1,128.64 | $4.94 | |||||||||||||
| Hypothetical (h) | 0.93% | $1,000.00 | $1,020.29 | $4.68 | ||||||||||||||
| R1 | Actual | 1.93% | $1,000.00 | $1,122.49 | $10.21 | |||||||||||||
| Hypothetical (h) | 1.93% | $1,000.00 | $1,015.31 | $9.70 | ||||||||||||||
| R2 | Actual | 1.43% | $1,000.00 | $1,125.55 | $7.58 | |||||||||||||
| Hypothetical (h) | 1.43% | $1,000.00 | $1,017.80 | $7.19 | ||||||||||||||
| R3 | Actual | 1.18% | $1,000.00 | $1,127.55 | $6.26 | |||||||||||||
| Hypothetical (h) | 1.18% | $1,000.00 | $1,019.05 | $5.94 | ||||||||||||||
| R4 | Actual | 0.93% | $1,000.00 | $1,128.23 | $4.93 | |||||||||||||
| Hypothetical (h) | 0.93% | $1,000.00 | $1,020.29 | $4.68 | ||||||||||||||
| R5 | Actual | 0.84% | $1,000.00 | $1,129.54 | $4.46 | |||||||||||||
| Hypothetical (h) | 0.84% | $1,000.00 | $1,020.74 | $4.23 | ||||||||||||||
| 529A | Actual | 1.21% | $1,000.00 | $1,127.22 | $6.42 | |||||||||||||
| Hypothetical (h) | 1.21% | $1,000.00 | $1,018.90 | $6.09 | ||||||||||||||
| 529B | Actual | 1.97% | $1,000.00 | $1,122.88 | $10.43 | |||||||||||||
| Hypothetical (h) | 1.97% | $1,000.00 | $1,015.11 | $9.90 | ||||||||||||||
| 529C | Actual | 1.98% | $1,000.00 | $1,123.01 | $10.48 | |||||||||||||
| Hypothetical (h) | 1.98% | $1,000.00 | $1,015.06 | $9.95 | ||||||||||||||
| (h) | 5% class return per year before expenses. |
| (p) | “Expenses Paid During Period” are equal to each class’s annualized expense ratio, as shown above, multiplied by the average account value over the period, multiplied by 182/365 (to reflect the one-half year period). Expenses paid do not include any applicable sales charges (loads). If these transaction costs had been included, your costs would have been higher. |
Notes to Expense Table
Each class with a Rule 12b-1 service fee is subject to a rebate of a portion of such fee. Such rebates are included in the expense ratios above and are outside of the expense limitation arrangement. For Class 529A and Class 529B shares, this rebate reduced the expense ratio above by 0.02% and 0.01%, respectively. See Note 3 in the Notes to Financial Statements for additional information.
4
Table of Contents
3/31/14 (unaudited)
The Portfolio of Investments is a complete list of all securities owned by your fund. It is categorized by broad-based asset classes.
| Common Stocks - 97.4% | ||||||||
| Issuer | Shares/Par | Value ($) | ||||||
| Aerospace - 1.0% | ||||||||
| MTU Aero Engines Holding AG | 116,750 | $ | 10,850,306 | |||||
| Triumph Group, Inc. | 154,480 | 9,976,318 | ||||||
|
| |||||||
| $ | 20,826,624 | |||||||
| Airlines - 1.5% | ||||||||
| Alaska Air Group, Inc. | 114,510 | $ | 10,684,928 | |||||
| Delta Air Lines, Inc. | 379,070 | 13,134,776 | ||||||
| United Continental Holdings, Inc. (a) | 144,870 | 6,465,548 | ||||||
|
| |||||||
| $ | 30,285,252 | |||||||
| Apparel Manufacturers - 1.6% | ||||||||
| Hanesbrands, Inc. | 136,368 | $ | 10,429,425 | |||||
| PVH Corp. | 99,521 | 12,417,235 | ||||||
| VF Corp. | 148,840 | 9,210,219 | ||||||
|
| |||||||
| $ | 32,056,879 | |||||||
| Automotive - 1.8% | ||||||||
| Delphi Automotive PLC | 269,970 | $ | 18,320,164 | |||||
| TRW Automotive Holdings Corp. (a) | 215,260 | 17,569,521 | ||||||
|
| |||||||
| $ | 35,889,685 | |||||||
| Broadcasting - 0.7% | ||||||||
| Interpublic Group of Companies, Inc. | 797,537 | $ | 13,669,784 | |||||
| Brokerage & Asset Managers - 2.5% | ||||||||
| Affiliated Managers Group, Inc. (a) | 67,123 | $ | 13,427,956 | |||||
| Evercore Partners, Inc. | 110,000 | 6,077,500 | ||||||
| NASDAQ OMX Group, Inc. | 522,636 | 19,306,174 | ||||||
| TD Ameritrade Holding Corp. | 346,913 | 11,777,696 | ||||||
|
| |||||||
| $ | 50,589,326 | |||||||
| Business Services - 1.7% | ||||||||
| Brenntag AG | 61,144 | $ | 11,342,243 | |||||
| Fidelity National Information Services, Inc. | 286,320 | 15,303,804 | ||||||
| Serco Group PLC | 1,167,303 | 8,192,952 | ||||||
|
| |||||||
| $ | 34,838,999 | |||||||
| Cable TV - 0.2% | ||||||||
| Dish Network Corp., “A” (a) | 63,309 | $ | 3,938,453 | |||||
5
Table of Contents
Portfolio of Investments (unaudited) – continued
| Issuer | Shares/Par | Value ($) | ||||||
| Common Stocks - continued | ||||||||
| Chemicals - 0.7% | ||||||||
| Celanese Corp. | 259,900 | $ | 14,427,049 | |||||
| Computer Software - 0.5% | ||||||||
| Symantec Corp. | 522,745 | $ | 10,439,218 | |||||
| Computer Software - Systems - 3.1% | ||||||||
| Ingram Micro, Inc., “A” (a) | 416,050 | $ | 12,298,438 | |||||
| NCR Corp. (a) | 396,980 | 14,509,619 | ||||||
| NICE Systems Ltd., ADR | 335,190 | 14,969,585 | ||||||
| Xerox Corp. | 1,760,790 | 19,896,927 | ||||||
|
| |||||||
| $ | 61,674,569 | |||||||
| Construction - 1.0% | ||||||||
| Stanley Black & Decker, Inc. | 246,359 | $ | 20,014,205 | |||||
| Consumer Products - 2.2% | ||||||||
| International Flavors & Fragrances, Inc. | 113,825 | $ | 10,889,638 | |||||
| Newell Rubbermaid, Inc. | 758,590 | 22,681,841 | ||||||
| Sensient Technologies Corp. | 174,680 | 9,853,699 | ||||||
|
| |||||||
| $ | 43,425,178 | |||||||
| Consumer Services - 0.9% | ||||||||
| DeVry, Inc. | 282,410 | $ | 11,971,360 | |||||
| ITT Educational Services, Inc. (a) | 198,070 | 5,680,648 | ||||||
|
| |||||||
| $ | 17,652,008 | |||||||
| Containers - 2.4% | ||||||||
| Crown Holdings, Inc. (a) | 479,770 | $ | 21,464,910 | |||||
| Greif, Inc., “A” | 170,220 | 8,934,848 | ||||||
| Owens-Illinois, Inc. (a) | 275,915 | 9,334,204 | ||||||
| Silgan Holdings, Inc. | 181,490 | 8,987,385 | ||||||
|
| |||||||
| $ | 48,721,347 | |||||||
| Electrical Equipment - 2.6% | ||||||||
| Pentair Ltd. | 167,785 | $ | 13,312,062 | |||||
| Sensata Technologies Holding B.V. (a) | 233,340 | 9,949,618 | ||||||
| Tyco International Ltd. | 386,360 | 16,381,664 | ||||||
| WESCO International, Inc. (a) | 146,070 | 12,155,945 | ||||||
|
| |||||||
| $ | 51,799,289 | |||||||
| Electronics - 3.4% | ||||||||
| Altera Corp. | 402,480 | $ | 14,585,875 | |||||
| Analog Devices, Inc. | 189,270 | 10,057,808 | ||||||
| Avago Technologies Ltd. | 123,220 | 7,936,600 | ||||||
6
Table of Contents
Portfolio of Investments (unaudited) – continued
| Issuer | Shares/Par | Value ($) | ||||||
| Common Stocks - continued | ||||||||
| Electronics - continued | ||||||||
| Microchip Technology, Inc. | 332,226 | $ | 15,867,114 | |||||
| NXP Semiconductors N.V. (a) | 251,434 | 14,786,834 | ||||||
| Ultratech, Inc. (a) | 195,040 | 5,693,218 | ||||||
|
| |||||||
| $ | 68,927,449 | |||||||
| Energy - Independent - 5.0% | ||||||||
| Cabot Oil & Gas Corp. | 304,812 | $ | 10,327,031 | |||||
| Cimarex Energy Co. | 78,190 | 9,313,211 | ||||||
| CONSOL Energy, Inc. | 334,286 | 13,354,726 | ||||||
| Energen Corp. | 123,730 | 9,998,621 | ||||||
| EQT Corp. | 140,240 | 13,599,073 | ||||||
| Noble Energy, Inc. | 209,678 | 14,895,525 | ||||||
| PDC Energy, Inc. (a) | 201,340 | 12,535,428 | ||||||
| Peabody Energy Corp. | 333,640 | 5,451,678 | ||||||
| SM Energy Co. | 150,170 | 10,705,619 | ||||||
|
| |||||||
| $ | 100,180,912 | |||||||
| Entertainment - 0.2% | ||||||||
| CBS Outdoor Americas, Inc. (a) | 154,090 | $ | 4,507,133 | |||||
| Food & Beverages - 4.5% | ||||||||
| Bunge Ltd. | 194,410 | $ | 15,457,539 | |||||
| Coca-Cola Enterprises, Inc. | 289,230 | 13,813,625 | ||||||
| Dr Pepper Snapple Group, Inc. | 205,070 | 11,168,112 | ||||||
| Ingredion, Inc. | 213,470 | 14,533,038 | ||||||
| J.M. Smucker Co. | 161,669 | 15,720,694 | ||||||
| Pinnacle Foods, Inc. | 385,350 | 11,506,551 | ||||||
| Tate & Lyle PLC | 817,390 | 9,096,102 | ||||||
|
| |||||||
| $ | 91,295,661 | |||||||
| Food & Drug Stores - 0.4% | ||||||||
| Empire Co. Ltd. | 149,810 | $ | 9,170,188 | |||||
| Gaming & Lodging - 0.6% | ||||||||
| Wynn Resorts Ltd. | 51,750 | $ | 11,496,263 | |||||
| General Merchandise - 0.7% | ||||||||
| Kohl’s Corp. | 236,300 | $ | 13,421,840 | |||||
| Insurance - 7.6% | ||||||||
| Allied World Assurance Co. | 124,552 | $ | 12,852,521 | |||||
| Aon PLC | 172,139 | 14,507,875 | ||||||
| Everest Re Group Ltd. | 91,346 | 13,980,505 | ||||||
| Genworth Financial, Inc. (a) | 381,653 | 6,766,708 | ||||||
7
Table of Contents
Portfolio of Investments (unaudited) – continued
| Issuer | Shares/Par | Value ($) | ||||||
| Common Stocks - continued | ||||||||
| Insurance - continued | ||||||||
| Hanover Insurance Group, Inc. | 150,057 | $ | 9,219,502 | |||||
| Hartford Financial Services Group, Inc. | 197,064 | 6,950,447 | ||||||
| HCC Insurance Holdings, Inc. | 305,410 | 13,893,101 | ||||||
| Lincoln National Corp. | 362,260 | 18,355,714 | ||||||
| Protective Life Corp. | 210,120 | 11,050,211 | ||||||
| Symetra Financial Corp. | 440,453 | 8,729,778 | ||||||
| Third Point Reinsurance Ltd. (a) | 502,370 | 7,962,565 | ||||||
| Unum Group | 395,004 | 13,947,591 | ||||||
| Validus Holdings Ltd. | 381,970 | 14,404,089 | ||||||
|
| |||||||
| $ | 152,620,607 | |||||||
| Leisure & Toys - 0.9% | ||||||||
| Hasbro, Inc. | 106,372 | $ | 5,916,411 | |||||
| Mattel, Inc. | 312,190 | 12,521,941 | ||||||
|
| |||||||
| $ | 18,438,352 | |||||||
| Machinery & Tools - 4.3% | ||||||||
| Allison Transmission Holdings, Inc. | 463,040 | $ | 13,863,418 | |||||
| Cummins, Inc. | 89,933 | 13,399,118 | ||||||
| Eaton Corp. PLC | 209,050 | 15,703,836 | ||||||
| Joy Global, Inc. | 162,330 | 9,415,140 | ||||||
| Kennametal, Inc. | 208,220 | 9,224,146 | ||||||
| Regal Beloit Corp. | 168,910 | 12,281,446 | ||||||
| SPX Corp. | 137,140 | 13,482,233 | ||||||
|
| |||||||
| $ | 87,369,337 | |||||||
| Major Banks - 3.6% | ||||||||
| Comerica, Inc. | 287,057 | $ | 14,869,553 | |||||
| Huntington Bancshares, Inc. | 1,882,760 | 18,771,117 | ||||||
| KeyCorp | 1,258,723 | 17,924,216 | ||||||
| Regions Financial Corp. | 1,002,170 | 11,134,109 | ||||||
| State Street Corp. | 139,140 | 9,677,187 | ||||||
|
| |||||||
| $ | 72,376,182 | |||||||
| Medical & Health Technology & Services - 2.0% | ||||||||
| AmerisourceBergen Corp. | 254,178 | $ | 16,671,535 | |||||
| Quest Diagnostics, Inc. | 250,120 | 14,486,950 | ||||||
| Universal Health Services, Inc. | 105,220 | 8,635,405 | ||||||
|
| |||||||
| $ | 39,793,890 | |||||||
| Medical Equipment - 4.5% | ||||||||
| CareFusion Corp. (a) | 341,290 | $ | 13,726,684 | |||||
| Cooper Cos., Inc. | 102,073 | 14,020,747 | ||||||
| DENTSPLY International, Inc. | 273,474 | 12,590,743 | ||||||
8
Table of Contents
Portfolio of Investments (unaudited) – continued
| Issuer | Shares/Par | Value ($) | ||||||
| Common Stocks - continued | ||||||||
| Medical Equipment - continued | ||||||||
| PerkinElmer, Inc. | 509,425 | $ | 22,954,691 | |||||
| St. Jude Medical, Inc. | 193,010 | 12,620,924 | ||||||
| Teleflex, Inc. | 136,593 | 14,648,233 | ||||||
|
| |||||||
| $ | 90,562,022 | |||||||
| Metals & Mining - 0.7% | ||||||||
| GrafTech International Ltd. (a) | 631,383 | $ | 6,894,702 | |||||
| Iluka Resources Ltd. | 809,178 | 7,436,780 | ||||||
|
| |||||||
| $ | 14,331,482 | |||||||
| Natural Gas - Distribution - 2.1% | ||||||||
| AGL Resources, Inc. | 225,494 | $ | 11,040,186 | |||||
| NiSource, Inc. | 286,750 | 10,188,228 | ||||||
| NorthWestern Corp. | 174,348 | 8,269,326 | ||||||
| Spectra Energy Corp. | 336,339 | 12,424,363 | ||||||
|
| |||||||
| $ | 41,922,103 | |||||||
| Natural Gas - Pipeline - 0.4% | ||||||||
| QEP Midstream Partners LP | 363,330 | $ | 8,494,655 | |||||
| Oil Services - 2.7% | ||||||||
| C&J Energy Services, Inc. (a) | 286,750 | $ | 8,361,630 | |||||
| Cameron International Corp. (a) | 250,984 | 15,503,282 | ||||||
| Dresser-Rand Group, Inc. (a) | 183,328 | 10,708,188 | ||||||
| Ensco PLC, “A” | 242,530 | 12,800,733 | ||||||
| Noble Corp. PLC | 236,320 | 7,737,117 | ||||||
|
| |||||||
| $ | 55,110,950 | |||||||
| Other Banks & Diversified Financials - 5.5% | ||||||||
| BB&T Corp. | 560,030 | $ | 22,496,405 | |||||
| Discover Financial Services | 320,240 | 18,634,766 | ||||||
| Fifth Third Bancorp | 752,370 | 17,266,892 | ||||||
| M&T Bank Corp. | 100,398 | 12,178,277 | ||||||
| PrivateBancorp, Inc. | 275,680 | 8,410,997 | ||||||
| SunTrust Banks, Inc. | 317,770 | 12,644,068 | ||||||
| TCF Financial Corp. | 1,157,820 | 19,289,281 | ||||||
|
| |||||||
| $ | 110,920,686 | |||||||
| Pharmaceuticals - 2.4% | ||||||||
| Endo International PLC (a) | 206,920 | $ | 14,205,058 | |||||
| Hospira, Inc. (a) | 312,380 | 13,510,435 | ||||||
| Impax Laboratories, Inc. (a) | 254,930 | 6,735,251 | ||||||
| Valeant Pharmaceuticals International, Inc. (a) | 106,550 | 14,046,487 | ||||||
|
| |||||||
| $ | 48,497,231 | |||||||
9
Table of Contents
Portfolio of Investments (unaudited) – continued
| Issuer | Shares/Par | Value ($) | ||||||
| Common Stocks - continued | ||||||||
| Real Estate - 4.5% | ||||||||
| Annaly Mortgage Management, Inc., REIT | 697,610 | $ | 7,652,782 | |||||
| Big Yellow Group PLC, REIT | 722,021 | 6,578,316 | ||||||
| Corporate Office Properties Trust, REIT | 578,920 | 15,422,429 | ||||||
| DDR Corp., REIT | 687,120 | 11,323,738 | ||||||
| EPR Properties, REIT | 238,800 | 12,749,532 | ||||||
| Equity Lifestyle Properties, Inc., REIT | 210,800 | 8,569,020 | ||||||
| Mid-America Apartment Communities, Inc., REIT | 204,750 | 13,978,283 | ||||||
| Plum Creek Timber Co. Inc., REIT | 349,760 | 14,703,910 | ||||||
|
| |||||||
| $ | 90,978,010 | |||||||
| Specialty Chemicals - 3.8% | ||||||||
| Akzo Nobel N.V. | 213,957 | $ | 17,458,503 | |||||
| Albemarle Corp. | 166,380 | 11,050,960 | ||||||
| FMC Corp. | 207,140 | 15,858,638 | ||||||
| Rockwood Holdings, Inc. | 150,660 | 11,209,104 | ||||||
| Symrise AG | 149,231 | 7,454,622 | ||||||
| Valspar Corp. | 187,180 | 13,499,422 | ||||||
|
| |||||||
| $ | 76,531,249 | |||||||
| Specialty Stores - 3.8% | ||||||||
| ANN, Inc. (a) | 178,710 | $ | 7,412,891 | |||||
| AutoZone, Inc. (a) | 22,424 | 12,043,930 | ||||||
| Bed Bath & Beyond, Inc. (a) | 172,320 | 11,855,606 | ||||||
| Best Buy Co., Inc. | 491,850 | 12,989,759 | ||||||
| Children’s Place Retail Stores, Inc. | 151,481 | 7,545,269 | ||||||
| Sally Beauty Holdings, Inc. (a) | 380,190 | 10,417,206 | ||||||
| Staples, Inc. | 1,183,680 | 13,422,931 | ||||||
|
| |||||||
| $ | 75,687,592 | |||||||
| Telephone Services - 2.2% | ||||||||
| COLT Telecom Group S.A. (a) | 2,653,321 | $ | 6,537,910 | |||||
| Frontier Communications Corp. (l) | 2,962,161 | 16,884,318 | ||||||
| Quebecor, Inc., “B” (l) | 377,360 | 9,216,391 | ||||||
| Windstream Holdings, Inc. (l) | 1,325,830 | 10,924,839 | ||||||
|
| |||||||
| $ | 43,563,458 | |||||||
| Tobacco - 0.6% | ||||||||
| Lorillard, Inc. | 242,460 | $ | 13,112,237 | |||||
| Trucking - 0.4% | ||||||||
| Swift Transportation Co. (a) | 354,850 | $ | 8,782,538 | |||||
10
Table of Contents
Portfolio of Investments (unaudited) – continued
| Issuer | Shares/Par | Value ($) | ||||||
| Common Stocks - continued | ||||||||
| Utilities - Electric Power - 6.2% | ||||||||
| AES Corp. | 940,161 | $ | 13,425,499 | |||||
| Calpine Corp. (a) | 408,860 | 8,549,263 | ||||||
| CenterPoint Energy, Inc. | 248,924 | 5,897,010 | ||||||
| CMS Energy Corp. | 602,529 | 17,642,049 | ||||||
| DTE Energy Co. | 179,780 | 13,355,856 | ||||||
| Great Plains Energy, Inc. | 462,580 | 12,508,163 | ||||||
| Northeast Utilities | 417,646 | 19,002,893 | ||||||
| NRG Energy, Inc. | 191,177 | 6,079,429 | ||||||
| Portland General Electric Co. | 277,420 | 8,971,763 | ||||||
| Public Service Enterprise Group, Inc. | 487,870 | 18,607,362 | ||||||
|
| |||||||
| $ | 124,039,287 | |||||||
| Total Common Stocks (Identified Cost, $1,462,625,917) | $ | 1,962,379,179 | ||||||
| Money Market Funds - 2.5% | ||||||||
| MFS Institutional Money Market Portfolio, 0.09%, at Cost and Net Asset Value (v) | 49,296,450 | $ | 49,296,450 | |||||
| Collateral for Securities Loaned - 1.0% | ||||||||
| Navigator Securities Lending Prime Portfolio, 0.2%, at Cost and Net Asset Value (j) | 21,019,185 | $ | 21,019,185 | |||||
| Total Investments (Identified Cost, $1,532,941,552) | $ | 2,032,694,814 | ||||||
| Other Assets, Less Liabilities - (0.9)% | (18,790,762 | ) | ||||||
| Net Assets - 100.0% | $ | 2,013,904,052 | ||||||
| (a) | Non-income producing security. |
| (j) | The rate quoted is the annualized seven-day yield of the fund at period end. |
| (l) | A portion of this security is on loan. |
| (v) | Underlying affiliated fund that is available only to investment companies managed by MFS. The rate quoted for the MFS Institutional Money Market Portfolio is the annualized seven-day yield of the fund at period end. |
The following abbreviations are used in this report and are defined:
| ADR | American Depositary Receipt |
| PLC | Public Limited Company |
| REIT | Real Estate Investment Trust |
See Notes to Financial Statements
11
Table of Contents
Financial Statements
STATEMENT OF ASSETS AND LIABILITIES
At 3/31/14 (unaudited)
This statement represents your fund’s balance sheet, which details the assets and liabilities comprising the total value of the fund.
| Assets | ||||
Investments- | ||||
Non-affiliated issuers, at value (identified cost, $1,483,645,102) | $1,983,398,364 | |||
Underlying affiliated funds, at cost and value | 49,296,450 | |||
Total investments, at value, including $20,404,267 of securities on loan (identified cost, $1,532,941,552) | $2,032,694,814 | |||
Receivables for | ||||
Investments sold | 7,746,559 | |||
Fund shares sold | 15,814,699 | |||
Interest and dividends | 2,797,609 | |||
Other assets | 8,311 | |||
Total assets | $2,059,061,992 | |||
| Liabilities | ||||
Payables for | ||||
Investments purchased | $17,546,074 | |||
Fund shares reacquired | 5,704,058 | |||
Collateral for securities loaned, at value | 21,019,185 | |||
Payable to affiliates | ||||
Investment adviser | 154,600 | |||
Shareholder servicing costs | 670,935 | |||
Distribution and service fees | 22,358 | |||
Program manager fees | 29 | |||
Payable for independent Trustees’ compensation | 1,271 | |||
Accrued expenses and other liabilities | 39,430 | |||
Total liabilities | $45,157,940 | |||
Net assets | $2,013,904,052 | |||
| Net assets consist of | ||||
Paid-in capital | $1,451,869,215 | |||
Unrealized appreciation (depreciation) on investments and translation of assets and liabilities in foreign currencies | 499,758,235 | |||
Accumulated net realized gain (loss) on investments and foreign currency | 58,282,330 | |||
Undistributed net investment income | 3,994,272 | |||
Net assets | $2,013,904,052 | |||
Shares of beneficial interest outstanding | 99,435,542 |
12
Table of Contents
Statement of Assets and Liabilities (unaudited) – continued
| Net assets | Shares outstanding | Net asset value per share (a) | ||||||||||
Class A | $429,928,715 | 21,472,704 | $20.02 | |||||||||
Class B | 18,430,295 | 957,395 | 19.25 | |||||||||
Class C | 61,146,859 | 3,183,634 | 19.21 | |||||||||
Class I | 111,291,317 | 5,446,953 | 20.43 | |||||||||
Class R1 | 5,810,539 | 306,776 | 18.94 | |||||||||
Class R2 | 25,967,455 | 1,320,812 | 19.66 | |||||||||
Class R3 | 50,923,529 | 2,548,004 | 19.99 | |||||||||
Class R4 | 44,186,179 | 2,199,102 | 20.09 | |||||||||
Class R5 | 1,260,777,895 | 61,720,356 | 20.43 | |||||||||
Class 529A | 3,791,778 | 192,082 | 19.74 | |||||||||
Class 529B | 297,745 | 15,883 | 18.75 | |||||||||
Class 529C | 1,351,746 | 71,841 | 18.82 | |||||||||
| (a) | Maximum offering price per share was equal to the net asset value per share for all share classes, except for Classes A and 529A, for which the maximum offering prices per share were $21.24 [100 / 94.25 x $20.02] and $20.94 [100 / 94.25 x $19.74], respectively. On sales of $50,000 or more, the maximum offering prices of Class A and Class 529A shares are reduced. A contingent deferred sales charge may be imposed on redemptions of Class A, Class B, Class C, Class 529B, and Class 529C shares. Redemption price per share was equal to the net asset value per share for Classes I, R1, R2, R3, R4, R5, and 529A. |
See Notes to Financial Statements
13
Table of Contents
Financial Statements
Six months ended 3/31/14 (unaudited)
This statement describes how much your fund earned in investment income and accrued in expenses. It also describes any gains and/or losses generated by fund operations.
| Net investment income | ||||
Income | ||||
Dividends | $16,339,929 | |||
Interest | 7,482 | |||
Dividends from underlying affiliated funds | 18,626 | |||
Foreign taxes withheld | (43,585 | ) | ||
Total investment income | $16,322,452 | |||
Expenses | ||||
Management fee | $6,397,154 | |||
Distribution and service fees | 922,576 | |||
Program manager fees | 2,479 | |||
Shareholder servicing costs | 916,846 | |||
Administrative services fee | 107,149 | |||
Independent Trustees’ compensation | 12,861 | |||
Custodian fee | 70,624 | |||
Shareholder communications | 19,623 | |||
Audit and tax fees | 16,798 | |||
Legal fees | 6,424 | |||
Miscellaneous | 113,736 | |||
Total expenses | $8,586,270 | |||
Fees paid indirectly | (11 | ) | ||
Reduction of expenses by investment adviser and distributor | (28,204 | ) | ||
Net expenses | $8,558,055 | |||
Net investment income | $7,764,397 | |||
| Realized and unrealized gain (loss) on investments and foreign currency | ||||
Realized gain (loss) (identified cost basis) | ||||
Investments | $66,904,661 | |||
Foreign currency | (3,787 | ) | ||
Net realized gain (loss) on investments and foreign currency | $66,900,874 | |||
Change in unrealized appreciation (depreciation) | ||||
Investments | $137,373,639 | |||
Translation of assets and liabilities in foreign currencies | 1,001 | |||
Net unrealized gain (loss) on investments and foreign currency translation | $137,374,640 | |||
Net realized and unrealized gain (loss) on investments and foreign currency | $204,275,514 | |||
Change in net assets from operations | $212,039,911 | |||
See Notes to Financial Statements
14
Table of Contents
Financial Statements
STATEMENTS OF CHANGES IN NET ASSETS
These statements describe the increases and/or decreases in net assets resulting from operations, any distributions, and any shareholder transactions.
| Change in net assets | Six months ended 3/31/14 (unaudited) | Year ended 9/30/13 | ||||||
| From operations | ||||||||
Net investment income | $7,764,397 | $13,496,664 | ||||||
Net realized gain (loss) on investments and foreign currency | 66,900,874 | 99,104,760 | ||||||
Net unrealized gain (loss) on investments and foreign currency translation | 137,374,640 | 215,934,566 | ||||||
Change in net assets from operations | $212,039,911 | $328,535,990 | ||||||
| Distributions declared to shareholders | ||||||||
From net investment income | $(11,200,178 | ) | $(11,000,078 | ) | ||||
From net realized gain on investments | (78,731,055 | ) | — | |||||
Total distributions declared to shareholders | $(89,931,233 | ) | $(11,000,078 | ) | ||||
Change in net assets from fund share transactions | $338,292,279 | $203,651,986 | ||||||
Total change in net assets | $460,400,957 | $521,187,898 | ||||||
| Net assets | ||||||||
At beginning of period | 1,553,503,095 | 1,032,315,197 | ||||||
At end of period (including undistributed net investment income of $3,994,272 and $7,430,053, respectively) | $2,013,904,052 | $1,553,503,095 | ||||||
See Notes to Financial Statements
15
Table of Contents
Financial Statements
The financial highlights table is intended to help you understand the fund’s financial performance for the semiannual period and the past 5 fiscal years (or life of a particular share class, if shorter). Certain information reflects financial results for a single fund share. The total returns in the table represent the rate by which an investor would have earned (or lost) on an investment in the fund share class (assuming reinvestment of all distributions) held for the entire period.
Six months (unaudited) | Years ended 9/30 | |||||||||||||||||||||||
| Class A | 2013 | 2012 | 2011 | 2010 | 2009 | |||||||||||||||||||
Net asset value, beginning of period | $18.74 | $14.52 | $11.42 | $11.64 | $9.83 | $10.37 | ||||||||||||||||||
| Income (loss) from investment operations | ||||||||||||||||||||||||
Net investment income (d) | $0.07 | $0.14 | $0.09 | $0.07 | $0.07 | $0.07 | ||||||||||||||||||
Net realized and unrealized gain | 2.24 | 4.21 | 3.08 | (0.21 | ) | 1.79 | (0.51 | ) | ||||||||||||||||
Total from investment operations | $2.31 | $4.35 | $3.17 | $(0.14 | ) | $1.86 | $(0.44 | ) | ||||||||||||||||
| Less distributions declared to shareholders | ||||||||||||||||||||||||
From net investment income | $(0.10 | ) | $(0.13 | ) | $(0.07 | ) | $(0.08 | ) | $(0.05 | ) | $(0.10 | ) | ||||||||||||
From net realized gain on investments | (0.93 | ) | — | — | — | — | — | |||||||||||||||||
Total distributions declared to | $(1.03 | ) | $(0.13 | ) | $(0.07 | ) | $(0.08 | ) | $(0.05 | ) | $(0.10 | ) | ||||||||||||
Net asset value, end of period (x) | $20.02 | $18.74 | $14.52 | $11.42 | $11.64 | $9.83 | ||||||||||||||||||
Total return (%) (r)(s)(t)(x) | 12.71 | (n) | 30.21 | 27.87 | (1.31 | ) | 19.05 | (3.95 | ) | |||||||||||||||
| Ratios (%) (to average net assets) and Supplemental data: | ||||||||||||||||||||||||
Expenses before expense reductions (f) | 1.18 | (a) | 1.22 | 1.21 | 1.22 | 1.26 | 1.40 | |||||||||||||||||
Expenses after expense reductions (f) | 1.18 | (a) | 1.21 | 1.21 | 1.22 | 1.25 | 1.29 | |||||||||||||||||
Net investment income | 0.69 | (a) | 0.86 | 0.67 | 0.50 | 0.65 | 0.93 | |||||||||||||||||
Portfolio turnover | 13 | (n) | 35 | 52 | 56 | 60 | 145 | |||||||||||||||||
Net assets at end of period (000 omitted) | $429,929 | $300,046 | $167,512 | $131,914 | $136,470 | $118,140 | ||||||||||||||||||
See Notes to Financial Statements
16
Table of Contents
Financial Highlights – continued
Six months 3/31/14 (unaudited) | Years ended 9/30 | |||||||||||||||||||||||
| Class B | 2013 | 2012 | 2011 | 2010 | 2009 | |||||||||||||||||||
Net asset value, beginning of period | $18.02 | $13.97 | $11.00 | $11.23 | $9.51 | $9.97 | ||||||||||||||||||
| Income (loss) from investment operations | ||||||||||||||||||||||||
Net investment income (loss) (d) | $(0.01 | ) | $0.02 | $(0.01 | ) | $(0.03 | ) | $(0.01 | ) | $0.02 | ||||||||||||||
Net realized and unrealized gain | 2.17 | 4.05 | 2.98 | (0.20 | ) | 1.73 | (0.48 | ) | ||||||||||||||||
Total from investment operations | $2.16 | $4.07 | $2.97 | $(0.23 | ) | $1.72 | $(0.46 | ) | ||||||||||||||||
| Less distributions declared to shareholders | ||||||||||||||||||||||||
From net investment income | $— | $(0.02 | ) | $— | $— | $— | $(0.00 | )(w) | ||||||||||||||||
From net realized gain on investments | (0.93 | ) | — | — | — | — | — | |||||||||||||||||
Total distributions declared to | $(0.93 | ) | $(0.02 | ) | $— | $— | $— | $(0.00 | )(w) | |||||||||||||||
Net asset value, end of period (x) | $19.25 | $18.02 | $13.97 | $11.00 | $11.23 | $9.51 | ||||||||||||||||||
Total return (%) (r)(s)(t)(x) | 12.32 | (n) | 29.16 | 27.00 | (2.05 | ) | 18.09 | (4.59 | ) | |||||||||||||||
| Ratios (%) (to average net assets) and Supplemental data: | ||||||||||||||||||||||||
Expenses before expense reductions (f) | 1.93 | (a) | 1.96 | 1.96 | 1.97 | 2.01 | 2.11 | |||||||||||||||||
Expenses after expense reductions (f) | 1.93 | (a) | 1.96 | 1.96 | 1.97 | 2.00 | 2.00 | |||||||||||||||||
Net investment income (loss) | (0.09 | )(a) | 0.13 | (0.10 | ) | (0.25 | ) | (0.11 | ) | 0.24 | ||||||||||||||
Portfolio turnover | 13 | (n) | 35 | 52 | 56 | 60 | 145 | |||||||||||||||||
Net assets at end of period (000 omitted) | $18,430 | $16,351 | $13,306 | $13,813 | $18,348 | $22,224 | ||||||||||||||||||
See Notes to Financial Statements
17
Table of Contents
Financial Highlights – continued
Six months 3/31/14 (unaudited) | Years ended 9/30 | |||||||||||||||||||||||
| Class C | 2013 | 2012 | 2011 | 2010 | 2009 | |||||||||||||||||||
Net asset value, beginning of period | $17.99 | $13.96 | $10.99 | $11.22 | $9.50 | $9.98 | ||||||||||||||||||
| Income (loss) from investment operations | ||||||||||||||||||||||||
Net investment income (loss) (d) | $(0.01 | ) | $0.02 | $(0.01 | ) | $(0.03 | ) | $(0.01 | ) | $0.02 | ||||||||||||||
Net realized and unrealized gain | 2.16 | 4.05 | 2.98 | (0.20 | ) | 1.73 | (0.49 | ) | ||||||||||||||||
Total from investment operations | $2.15 | $4.07 | $2.97 | $(0.23 | ) | $1.72 | $(0.47 | ) | ||||||||||||||||
| Less distributions declared to shareholders | ||||||||||||||||||||||||
From net investment income | $— | $(0.04 | ) | $— | $— | $— | $(0.01 | ) | ||||||||||||||||
From net realized gain on investments | (0.93 | ) | — | — | — | — | — | |||||||||||||||||
Total distributions declared to | $(0.93 | ) | $(0.04 | ) | $— | $— | $— | $(0.01 | ) | |||||||||||||||
Net asset value, end of period (x) | $19.21 | $17.99 | $13.96 | $10.99 | $11.22 | $9.50 | ||||||||||||||||||
Total return (%) (r)(s)(t)(x) | 12.29 | (n) | 29.21 | 27.02 | (2.05 | ) | 18.11 | (4.65 | ) | |||||||||||||||
| Ratios (%) (to average net assets) and Supplemental data: | ||||||||||||||||||||||||
Expenses before expense reductions (f) | 1.93 | (a) | 1.96 | 1.96 | 1.97 | 2.01 | 2.11 | |||||||||||||||||
Expenses after expense reductions (f) | 1.93 | (a) | 1.96 | 1.96 | 1.97 | 2.00 | 2.00 | |||||||||||||||||
Net investment income (loss) | (0.06 | )(a) | 0.11 | (0.08 | ) | (0.25 | ) | (0.10 | ) | 0.23 | ||||||||||||||
Portfolio turnover | 13 | (n) | 35 | 52 | 56 | 60 | 145 | |||||||||||||||||
Net assets at end of period (000 omitted) | $61,147 | $41,250 | $24,742 | $18,430 | $18,717 | $17,003 | ||||||||||||||||||
See Notes to Financial Statements
18
Table of Contents
Financial Highlights – continued
Six months 3/31/14 (unaudited) | Years ended 9/30 | |||||||||||||||||||||||
| Class I | 2013 | 2012 | 2011 | 2010 | 2009 | |||||||||||||||||||
Net asset value, beginning of period | $19.11 | $14.80 | $11.64 | $11.86 | $10.02 | $10.59 | ||||||||||||||||||
| Income (loss) from investment operations | ||||||||||||||||||||||||
Net investment income (d) | $0.10 | $0.17 | $0.13 | $0.10 | $0.10 | $0.10 | ||||||||||||||||||
Net realized and unrealized gain | 2.29 | 4.31 | 3.13 | (0.22 | ) | 1.82 | (0.53 | ) | ||||||||||||||||
Total from investment operations | $2.39 | $4.48 | $3.26 | $(0.12 | ) | $1.92 | $(0.43 | ) | ||||||||||||||||
| Less distributions declared to shareholders | ||||||||||||||||||||||||
From net investment income | $(0.14 | ) | $(0.17 | ) | $(0.10 | ) | $(0.10 | ) | $(0.08 | ) | $(0.14 | ) | ||||||||||||
From net realized gain on investments | (0.93 | ) | — | — | — | — | — | |||||||||||||||||
Total distributions declared to | $(1.07 | ) | $(0.17 | ) | $(0.10 | ) | $(0.10 | ) | $(0.08 | ) | $(0.14 | ) | ||||||||||||
Net asset value, end of period (x) | $20.43 | $19.11 | $14.80 | $11.64 | $11.86 | $10.02 | ||||||||||||||||||
Total return (%) (r)(s)(x) | 12.86 | (n) | 30.54 | 28.21 | (1.07 | ) | 19.26 | (3.62 | ) | |||||||||||||||
| Ratios (%) (to average net assets) and Supplemental data: | ||||||||||||||||||||||||
Expenses before expense reductions (f) | 0.94 | (a) | 0.93 | 0.96 | 0.97 | 1.01 | 1.10 | |||||||||||||||||
Expenses after expense reductions (f) | 0.93 | (a) | 0.93 | 0.96 | 0.97 | 1.00 | 1.00 | |||||||||||||||||
Net investment income | 1.05 | (a) | 1.13 | 0.92 | 0.76 | 0.90 | 1.20 | |||||||||||||||||
Portfolio turnover | 13 | (n) | 35 | 52 | 56 | 60 | 145 | |||||||||||||||||
Net assets at end of period (000 omitted) | $111,291 | $38,232 | $802,524 | $580,412 | $537,692 | $467,782 | ||||||||||||||||||
See Notes to Financial Statements
19
Table of Contents
Financial Highlights – continued
Six months (unaudited) | Years ended 9/30 | |||||||||||||||||||||||
| Class R1 | 2013 | 2012 | 2011 | 2010 | 2009 | |||||||||||||||||||
Net asset value, beginning of period | $17.80 | $13.79 | $10.86 | $11.09 | $9.39 | $9.89 | ||||||||||||||||||
| Income (loss) from investment operations | ||||||||||||||||||||||||
Net investment income (loss) (d) | $0.00 | (w) | $0.02 | $(0.01 | ) | $(0.03 | ) | $(0.01 | ) | $0.02 | ||||||||||||||
Net realized and unrealized gain | 2.12 | 4.01 | 2.94 | (0.20 | ) | 1.71 | (0.49 | ) | ||||||||||||||||
Total from investment operations | $2.12 | $4.03 | $2.93 | $(0.23 | ) | $1.70 | $(0.47 | ) | ||||||||||||||||
| Less distributions declared to shareholders | ||||||||||||||||||||||||
From net investment income | $(0.05 | ) | $(0.02 | ) | $— | $— | $(0.00 | )(w) | $(0.03 | ) | ||||||||||||||
From net realized gain on investments | (0.93 | ) | — | — | — | — | — | |||||||||||||||||
Total distributions declared to | $(0.98 | ) | $(0.02 | ) | $— | $— | $(0.00 | )(w) | $(0.03 | ) | ||||||||||||||
Net asset value, end of period (x) | $18.94 | $17.80 | $13.79 | $10.86 | $11.09 | $9.39 | ||||||||||||||||||
Total return (%) (r)(s)(x) | 12.25 | (n) | 29.28 | 26.98 | (2.07 | ) | 18.11 | (4.60 | ) | |||||||||||||||
| Ratios (%) (to average net assets) and Supplemental data: | ||||||||||||||||||||||||
Expenses before expense reductions (f) | 1.93 | (a) | 1.96 | 1.96 | 1.97 | 2.01 | 2.10 | |||||||||||||||||
Expenses after expense reductions (f) | 1.93 | (a) | 1.96 | 1.96 | 1.97 | 2.00 | 2.00 | |||||||||||||||||
Net investment income (loss) | 0.01 | (a) | 0.13 | (0.08 | ) | (0.25 | ) | (0.10 | ) | 0.20 | ||||||||||||||
Portfolio turnover | 13 | (n) | 35 | 52 | 56 | 60 | 145 | |||||||||||||||||
Net assets at end of period (000 omitted) | $5,811 | $1,749 | $2,101 | $1,760 | $1,712 | $1,424 | ||||||||||||||||||
See Notes to Financial Statements
20
Table of Contents
Financial Highlights – continued
Six months 3/31/14 (unaudited) | Years ended 9/30 | |||||||||||||||||||||||
| Class R2 | 2013 | 2012 | 2011 | 2010 | 2009 | |||||||||||||||||||
Net asset value, beginning of period | $18.40 | $14.25 | $11.20 | $11.43 | $9.66 | $10.21 | ||||||||||||||||||
| Income (loss) from investment operations | ||||||||||||||||||||||||
Net investment income (d) | $0.04 | $0.10 | $0.05 | $0.03 | $0.04 | $0.05 | ||||||||||||||||||
Net realized and unrealized gain | 2.21 | 4.14 | 3.04 | (0.21 | ) | 1.77 | (0.51 | ) | ||||||||||||||||
Total from investment operations | $2.25 | $4.24 | $3.09 | $(0.18 | ) | $1.81 | $(0.46 | ) | ||||||||||||||||
| Less distributions declared to shareholders | ||||||||||||||||||||||||
From net investment income | $(0.06 | ) | $(0.09 | ) | $(0.04 | ) | $(0.05 | ) | $(0.04 | ) | $(0.09 | ) | ||||||||||||
From net realized gain on investments | (0.93 | ) | — | — | — | — | — | |||||||||||||||||
Total distributions declared to | $(0.99 | ) | $(0.09 | ) | $(0.04 | ) | $(0.05 | ) | $(0.04 | ) | $(0.09 | ) | ||||||||||||
Net asset value, end of period (x) | $19.66 | $18.40 | $14.25 | $11.20 | $11.43 | $9.66 | ||||||||||||||||||
Total return (%) (r)(s)(x) | 12.56 | (n) | 29.93 | 27.63 | (1.64 | ) | 18.76 | (4.11 | ) | |||||||||||||||
| Ratios (%) (to average net assets) and Supplemental data: | ||||||||||||||||||||||||
Expenses before expense reductions (f) | 1.43 | (a) | 1.46 | 1.46 | 1.47 | 1.51 | 1.60 | |||||||||||||||||
Expenses after expense reductions (f) | 1.43 | (a) | 1.46 | 1.46 | 1.47 | 1.50 | 1.50 | |||||||||||||||||
Net investment income | 0.43 | (a) | 0.62 | 0.41 | 0.25 | 0.40 | 0.70 | |||||||||||||||||
Portfolio turnover | 13 | (n) | 35 | 52 | 56 | 60 | 145 | |||||||||||||||||
Net assets at end of period (000 omitted) | $25,967 | $20,018 | $15,355 | $13,217 | $13,697 | $11,193 | ||||||||||||||||||
See Notes to Financial Statements
21
Table of Contents
Financial Highlights – continued
Six months 3/31/14 (unaudited) | Years ended 9/30 | |||||||||||||||||||||||
| Class R3 | 2013 | 2012 | 2011 | 2010 | 2009 | |||||||||||||||||||
Net asset value, beginning of period | $18.72 | $14.51 | $11.42 | $11.64 | $9.84 | $10.37 | ||||||||||||||||||
| Income (loss) from investment operations | ||||||||||||||||||||||||
Net investment income (d) | $0.07 | $0.14 | $0.09 | $0.07 | $0.07 | $0.08 | ||||||||||||||||||
Net realized and unrealized gain | 2.25 | 4.21 | 3.08 | (0.21 | ) | 1.79 | (0.52 | ) | ||||||||||||||||
Total from investment operations | $2.32 | $4.35 | $3.17 | $(0.14 | ) | $1.86 | $(0.44 | ) | ||||||||||||||||
| Less distributions declared to shareholders | ||||||||||||||||||||||||
From net investment income | $(0.12 | ) | $(0.14 | ) | $(0.08 | ) | $(0.08 | ) | $(0.06 | ) | $(0.09 | ) | ||||||||||||
From net realized gain on investments | (0.93 | ) | — | — | — | — | — | |||||||||||||||||
Total distributions declared to | $(1.05 | ) | $(0.14 | ) | $(0.08 | ) | $(0.08 | ) | $(0.06 | ) | $(0.09 | ) | ||||||||||||
Net asset value, end of period (x) | $19.99 | $18.72 | $14.51 | $11.42 | $11.64 | $9.84 | ||||||||||||||||||
Total return (%) (r)(s)(x) | 12.75 | (n) | 30.18 | 27.93 | (1.29 | ) | 18.96 | (3.91 | ) | |||||||||||||||
| Ratios (%) (to average net assets) and Supplemental data: | ||||||||||||||||||||||||
Expenses before expense reductions (f) | 1.19 | (a) | 1.24 | 1.21 | 1.23 | 1.26 | 1.35 | |||||||||||||||||
Expenses after expense reductions (f) | 1.18 | (a) | 1.23 | 1.21 | 1.23 | 1.25 | 1.25 | |||||||||||||||||
Net investment income | 0.75 | (a) | 0.79 | 0.68 | 0.50 | 0.65 | 0.96 | |||||||||||||||||
Portfolio turnover | 13 | (n) | 35 | 52 | 56 | 60 | 145 | |||||||||||||||||
Net assets at end of period (000 omitted) | $50,924 | $24,496 | $3,826 | $2,141 | $898 | $883 | ||||||||||||||||||
See Notes to Financial Statements
22
Table of Contents
Financial Highlights – continued
Six months 3/31/14 (unaudited) | Years ended 9/30 | |||||||||||||||||||||||
| Class R4 | 2013 | 2012 | 2011 | 2010 | 2009 | |||||||||||||||||||
Net asset value, beginning of period | $18.82 | $14.57 | $11.46 | $11.68 | $9.86 | $10.43 | ||||||||||||||||||
| Income (loss) from investment operations | ||||||||||||||||||||||||
Net investment income (d) | $0.09 | $0.18 | $0.13 | $0.10 | $0.10 | $0.08 | ||||||||||||||||||
Net realized and unrealized gain | 2.25 | 4.24 | 3.08 | (0.22 | ) | 1.80 | (0.51 | ) | ||||||||||||||||
Total from investment operations | $2.34 | $4.42 | $3.21 | $(0.12 | ) | $1.90 | $(0.43 | ) | ||||||||||||||||
| Less distributions declared to shareholders | ||||||||||||||||||||||||
From net investment income | $(0.14 | ) | $(0.17 | ) | $(0.10 | ) | $(0.10 | ) | $(0.08 | ) | $(0.14 | ) | ||||||||||||
From net realized gain on investments | (0.93 | ) | — | — | — | — | — | |||||||||||||||||
Total distributions declared to | $(1.07 | ) | $(0.17 | ) | $(0.10 | ) | $(0.10 | ) | $(0.08 | ) | $(0.14 | ) | ||||||||||||
Net asset value, end of period (x) | $20.09 | $18.82 | $14.57 | $11.46 | $11.68 | $9.86 | ||||||||||||||||||
Total return (%) (r)(s)(x) | 12.82 | (n) | 30.61 | 28.22 | (1.08 | ) | 19.37 | (3.68 | ) | |||||||||||||||
| Ratios (%) (to average net assets) and Supplemental data: | ||||||||||||||||||||||||
Expenses before expense reductions (f) | 0.94 | (a) | 0.99 | 0.96 | 0.97 | 1.01 | 1.06 | |||||||||||||||||
Expenses after expense reductions (f) | 0.93 | (a) | 0.98 | 0.96 | 0.97 | 1.00 | 1.00 | |||||||||||||||||
Net investment income | 0.98 | (a) | 0.99 | 0.93 | 0.75 | 0.90 | 1.04 | |||||||||||||||||
Portfolio turnover | 13 | (n) | 35 | 52 | 56 | 60 | 145 | |||||||||||||||||
Net assets at end of period (000 omitted) | $44,186 | $21,747 | $258 | $173 | $175 | $147 | ||||||||||||||||||
See Notes to Financial Statements
23
Table of Contents
Financial Highlights – continued
Six months ended 3/31/14 | Year ended 9/30/13 (i) | |||||||
| Class R5 | ||||||||
| (unaudited) | ||||||||
Net asset value, beginning of period | $19.12 | $16.22 | ||||||
| Income (loss) from investment operations | ||||||||
Net investment income (d) | $0.10 | $0.14 | ||||||
Net realized and unrealized gain (loss) on investments and foreign | 2.29 | 2.76 | (g) | |||||
Total from investment operations | $2.39 | $2.90 | ||||||
| Less distributions declared to shareholders | ||||||||
From net investment income | $(0.15 | ) | $— | |||||
From net realized gain on investments | (0.93 | ) | — | |||||
Total distributions declared to shareholders | $(1.08 | ) | $— | |||||
Net asset value, end of period (x) | $20.43 | $19.12 | ||||||
Total return (%) (r)(s)(x) | 12.89 | (n) | 17.88 | (n) | ||||
| Ratios (%) (to average net assets) and Supplemental data: | ||||||||
Expenses before expense reductions (f) | 0.84 | (a) | 0.88 | (a) | ||||
Expenses after expense reductions (f) | 0.84 | (a) | 0.88 | (a) | ||||
Net investment income | 1.01 | (a) | 1.22 | (a) | ||||
Portfolio turnover | 13 | (n) | 35 | |||||
Net assets at end of period (000 omitted) | $1,260,778 | $1,085,101 | ||||||
See Notes to Financial Statements
24
Table of Contents
Financial Highlights – continued
Six months 3/31/14 (unaudited) | Years ended 9/30 | |||||||||||||||||||||||
| Class 529A | 2013 | 2012 | 2011 | 2010 | 2009 | |||||||||||||||||||
Net asset value, beginning of period | $18.48 | $14.33 | $11.26 | $11.49 | $9.71 | $10.24 | ||||||||||||||||||
| Income (loss) from investment operations | ||||||||||||||||||||||||
Net investment income (d) | $0.06 | $0.14 | $0.08 | $0.05 | $0.06 | $0.06 | ||||||||||||||||||
Net realized and unrealized gain | 2.22 | 4.14 | 3.05 | (0.21 | ) | 1.77 | (0.50 | ) | ||||||||||||||||
Total from investment operations | $2.28 | $4.28 | $3.13 | $(0.16 | ) | $1.83 | $(0.44 | ) | ||||||||||||||||
| Less distributions declared to shareholders | ||||||||||||||||||||||||
From net investment income | $(0.09 | ) | $(0.13 | ) | $(0.06 | ) | $(0.07 | ) | $(0.05 | ) | $(0.09 | ) | ||||||||||||
From net realized gain on investments | (0.93 | ) | — | — | — | — | — | |||||||||||||||||
Total distributions declared to | $(1.02 | ) | $(0.13 | ) | $(0.06 | ) | $(0.07 | ) | $(0.05 | ) | $(0.09 | ) | ||||||||||||
Net asset value, end of period (x) | $19.74 | $18.48 | $14.33 | $11.26 | $11.49 | $9.71 | ||||||||||||||||||
Total return (%) (r)(s)(t)(x) | 12.72 | (n) | 30.09 | 27.94 | (1.47 | ) | 18.91 | (4.03 | ) | |||||||||||||||
| Ratios (%) (to average net assets) and Supplemental data: | ||||||||||||||||||||||||
Expenses before expense reductions (f) | 1.28 | (a) | 1.31 | 1.31 | 1.32 | 1.36 | 1.49 | |||||||||||||||||
Expenses after expense reductions (f) | 1.21 | (a) | 1.24 | 1.26 | 1.31 | 1.35 | 1.39 | |||||||||||||||||
Net investment income | 0.65 | (a) | 0.84 | 0.62 | 0.41 | 0.56 | 0.81 | |||||||||||||||||
Portfolio turnover | 13 | (n) | 35 | 52 | 56 | 60 | 145 | |||||||||||||||||
Net assets at end of period (000 omitted) | $3,792 | $3,047 | $1,930 | $1,234 | $1,076 | $769 | ||||||||||||||||||
See Notes to Financial Statements
25
Table of Contents
Financial Highlights – continued
Six months (unaudited) | Years ended 9/30 | |||||||||||||||||||||||
| Class 529B | 2013 | 2012 | 2011 | 2010 | 2009 | |||||||||||||||||||
Net asset value, beginning of period | $17.58 | $13.63 | $10.74 | $10.98 | $9.30 | $9.79 | ||||||||||||||||||
| Income (loss) from investment operations | ||||||||||||||||||||||||
Net investment income (loss) (d) | $(0.01 | ) | $0.01 | $(0.02 | ) | $(0.04 | ) | $(0.02 | ) | $0.01 | ||||||||||||||
Net realized and unrealized gain | 2.11 | 3.96 | 2.91 | (0.20 | ) | 1.70 | (0.48 | ) | ||||||||||||||||
Total from investment operations | $2.10 | $3.97 | $2.89 | $(0.24 | ) | $1.68 | $(0.47 | ) | ||||||||||||||||
| Less distributions declared to shareholders | ||||||||||||||||||||||||
From net investment income | $— | $(0.02 | ) | $— | $— | $— | $(0.02 | ) | ||||||||||||||||
From net realized gain on investments | (0.93 | ) | — | — | — | — | — | |||||||||||||||||
Total distributions declared to | $(0.93 | ) | $(0.02 | ) | $— | $— | $— | $(0.02 | ) | |||||||||||||||
Net asset value, end of period (x) | $18.75 | $17.58 | $13.63 | $10.74 | $10.98 | $9.30 | ||||||||||||||||||
Total return (%) (r)(s)(t)(x) | 12.29 | (n) | 29.18 | 26.91 | (2.19 | ) | 18.06 | (4.77 | ) | |||||||||||||||
| Ratios (%) (to average net assets) and Supplemental data: | ||||||||||||||||||||||||
Expenses before expense reductions (f) | 2.03 | (a) | 2.06 | 2.06 | 2.07 | 2.11 | 2.20 | |||||||||||||||||
Expenses after expense reductions (f) | 1.97 | (a) | 2.00 | 2.01 | 2.06 | 2.10 | 2.10 | |||||||||||||||||
Net investment income (loss) | (0.13 | )(a) | 0.09 | (0.15 | ) | (0.35 | ) | (0.19 | ) | 0.11 | ||||||||||||||
Portfolio turnover | 13 | (n) | 35 | 52 | 56 | 60 | 145 | |||||||||||||||||
Net assets at end of period (000 omitted) | $298 | $251 | $184 | $177 | $245 | $196 | ||||||||||||||||||
See Notes to Financial Statements
26
Table of Contents
Financial Highlights – continued
Six months (unaudited) | Years ended 9/30 | |||||||||||||||||||||||
| Class 529C | 2013 | 2012 | 2011 | 2010 | 2009 | |||||||||||||||||||
Net asset value, beginning of period | $17.64 | $13.69 | $10.79 | $11.02 | $9.34 | $9.81 | ||||||||||||||||||
| Income (loss) from investment operations | ||||||||||||||||||||||||
Net investment income (loss) (d) | $(0.01 | ) | $0.01 | $(0.02 | ) | $(0.04 | ) | $(0.02 | ) | $0.00 | (w) | |||||||||||||
Net realized and unrealized gain | 2.12 | 3.97 | 2.92 | (0.19 | ) | 1.70 | (0.46 | ) | ||||||||||||||||
Total from investment operations | $2.11 | $3.98 | $2.90 | $(0.23 | ) | $1.68 | $(0.46 | ) | ||||||||||||||||
| Less distributions declared to shareholders | ||||||||||||||||||||||||
From net investment income | $— | $(0.03 | ) | $— | $— | $— | $(0.01 | ) | ||||||||||||||||
From net realized gain on investments | (0.93 | ) | — | — | — | — | — | |||||||||||||||||
Total distributions declared to | $(0.93 | ) | $(0.03 | ) | $— | $— | $— | $(0.01 | ) | |||||||||||||||
Net asset value, end of period (x) | $18.82 | $17.64 | $13.69 | $10.79 | $11.02 | $9.34 | ||||||||||||||||||
Total return (%) (r)(s)(t)(x) | 12.30 | (n) | 29.12 | 26.88 | (2.09 | ) | 17.99 | (4.67 | ) | |||||||||||||||
| Ratios (%) (to average net assets) and Supplemental data: | ||||||||||||||||||||||||
Expenses before expense reductions (f) | 2.03 | (a) | 2.07 | 2.06 | 2.07 | 2.11 | 2.19 | |||||||||||||||||
Expenses after expense reductions (f) | 1.98 | (a) | 2.01 | 2.01 | 2.06 | 2.10 | 2.10 | |||||||||||||||||
Net investment income (loss) | (0.14 | )(a) | 0.08 | (0.15 | ) | (0.34 | ) | (0.19 | ) | 0.05 | ||||||||||||||
Portfolio turnover | 13 | (n) | 35 | 52 | 56 | 60 | 145 | |||||||||||||||||
Net assets at end of period (000 omitted) | $1,352 | $1,215 | $579 | $546 | $462 | $392 | ||||||||||||||||||
| (a) | Annualized. |
| (d) | Per share data is based on average shares outstanding. |
| (f) | Ratios do not reflect reductions from fees paid indirectly, if applicable. |
| (g) | The per share amount varies from the net realized and unrealized gain/loss for the period because of the timing of sales of fund shares and the per share amount of realized and unrealized gains and losses at such time. |
| (i) | For the period from the class inception, February 1, 2013, through the stated period end. |
| (n) | Not annualized. |
| (r) | Certain expenses have been reduced without which performance would have been lower. |
| (s) | From time to time the fund may receive proceeds from litigation settlements, without which performance would be lower. |
| (t) | Total returns do not include any applicable sales charges. |
| (w) | Per share amount was less than $0.01. |
| (x) | The net asset values per share and total returns have been calculated on net assets which include adjustments made in accordance with U.S. generally accepted accounting principles required at period end for financial reporting purposes. |
See Notes to Financial Statements
27
Table of Contents
(unaudited)
(1) Business and Organization
MFS Mid Cap Value Fund (the fund) is a diversified series of MFS Series Trust XI (the trust). The trust is organized as a Massachusetts business trust and is registered under the Investment Company Act of 1940, as amended, as an open-end management investment company.
The fund is an investment company and accordingly follows the investment company accounting and reporting guidance of the Financial Accounting Standards Board (FASB) Accounting Standard Codification Topic 946 Financial Services – Investment Companies.
(2) Significant Accounting Policies
General – The preparation of financial statements in conformity with U.S. generally accepted accounting principles requires management to make estimates and assumptions that affect the reported amounts of assets and liabilities, and disclosure of contingent assets and liabilities at the date of the financial statements and the reported amounts of increases and decreases in net assets from operations during the reporting period. Actual results could differ from those estimates. In the preparation of these financial statements, management has evaluated subsequent events occurring after the date of the fund’s Statement of Assets and Liabilities through the date that the financial statements were issued.
In this reporting period, the fund adopted the disclosure provisions of FASB Accounting Standards Update 2011-11 (“ASU 2011-11”), Balance Sheet (Topic 210) – Disclosures about Offsetting Assets and Liabilities along with the related scope clarification provisions of FASB Accounting Standards Update 2013-01 (“ASU 2013-01”) entitled Balance Sheet (Topic 210) – Clarifying the Scope of Disclosures about Offsetting Assets and Liabilities. ASU 2011-11 is intended to enhance disclosures on the offsetting of financial assets and liabilities by requiring entities to disclose both gross and net information about financial instruments and transactions that are either offset in the statement of financial position or subject to an enforceable Master Netting Agreement or similar arrangement. ASU 2013-01 limits the scope of ASU 2011-11’s disclosure requirements on offsetting to financial assets and financial liabilities related to derivatives, repurchase and reverse repurchase agreements, and securities lending and securities borrowing transactions. The disclosures required by ASU 2011-11, to the extent applicable to the fund, have been included in the fund’s Significant Accounting Policies note under the captions for each of the fund’s in-scope financial instruments and transactions.
Investment Valuations – Equity securities, including restricted equity securities, are generally valued at the last sale or official closing price as provided by a third-party pricing service on the market or exchange on which they are primarily traded. Equity securities, for which there were no sales reported that day, are generally valued at the last quoted daily bid quotation as provided by a third-party pricing service on the market or exchange on which such securities are primarily traded. Short-term instruments with a maturity at issuance of 60 days or less generally are valued at amortized cost, which approximates market value. Open-end investment companies
28
Table of Contents
Notes to Financial Statements (unaudited) – continued
are generally valued at net asset value per share. Securities and other assets generally valued on the basis of information from a third-party pricing service may also be valued at a broker/dealer bid quotation. Values obtained from third-party pricing services can utilize both transaction data and market information such as yield, quality, coupon rate, maturity, type of issue, trading characteristics, and other market data. The values of foreign securities and other assets and liabilities expressed in foreign currencies are converted to U.S. dollars using the mean of bid and asked prices for rates provided by a third-party pricing service.
The Board of Trustees has delegated primary responsibility for determining or causing to be determined the value of the fund’s investments (including any fair valuation) to the adviser pursuant to valuation policies and procedures approved by the Board. If the adviser determines that reliable market quotations are not readily available, investments are valued at fair value as determined in good faith by the adviser in accordance with such procedures under the oversight of the Board of Trustees. Under the fund’s valuation policies and procedures, market quotations are not considered to be readily available for most types of debt instruments and floating rate loans and many types of derivatives. These investments are generally valued at fair value based on information from third-party pricing services. In addition, investments may be valued at fair value if the adviser determines that an investment’s value has been materially affected by events occurring after the close of the exchange or market on which the investment is principally traded (such as foreign exchange or market) and prior to the determination of the fund’s net asset value, or after the halting of trading of a specific security where trading does not resume prior to the close of the exchange or market on which the security is principally traded. Events that occur on a frequent basis after foreign markets close (such as developments in foreign markets and significant movements in the U.S. markets) and prior to the determination of the fund’s net asset value may be deemed to have a material effect on the value of securities traded in foreign markets. Accordingly, the fund’s foreign equity securities may often be valued at fair value. The adviser generally relies on third-party pricing services or other information (such as the correlation with price movements of similar securities in the same or other markets; the type, cost and investment characteristics of the security; the business and financial condition of the issuer; and trading and other market data) to assist in determining whether to fair value and at what value to fair value an investment. The value of an investment for purposes of calculating the fund’s net asset value can differ depending on the source and method used to determine value. When fair valuation is used, the value of an investment used to determine the fund’s net asset value may differ from quoted or published prices for the same investment. There can be no assurance that the fund could obtain the fair value assigned to an investment if it were to sell the investment at the same time at which the fund determines its net asset value per share.
Various inputs are used in determining the value of the fund’s assets or liabilities. These inputs are categorized into three broad levels. In certain cases, the inputs used to measure fair value may fall into different levels of the fair value hierarchy. In such cases, an investment’s level within the fair value hierarchy is based on the lowest level of input that is significant to the fair value measurement. The fund’s assessment of the significance of a particular input to the fair value measurement in its entirety requires judgment, and considers factors specific to the investment. Level 1 includes unadjusted
29
Table of Contents
Notes to Financial Statements (unaudited) – continued
quoted prices in active markets for identical assets or liabilities. Level 2 includes other significant observable market-based inputs (including quoted prices for similar securities, interest rates, prepayment speed, and credit risk). Level 3 includes unobservable inputs, which may include the adviser’s own assumptions in determining the fair value of investments. The following is a summary of the levels used as of March 31, 2014 in valuing the fund’s assets or liabilities:
| Investments at Value | Level 1 | Level 2 | Level 3 | Total | ||||||||||||
| Equity Securities: | $1,962,379,179 | $— | $— | $1,962,379,179 | ||||||||||||
| Mutual Funds | 70,315,635 | — | — | 70,315,635 | ||||||||||||
| Total Investments | $2,032,694,814 | $— | $— | $2,032,694,814 | ||||||||||||
For further information regarding security characteristics, see the Portfolio of Investments.
Foreign Currency Translation – Purchases and sales of foreign investments, income, and expenses are converted into U.S. dollars based upon currency exchange rates prevailing on the respective dates of such transactions or on the reporting date for foreign denominated receivables and payables. Gains and losses attributable to foreign currency exchange rates on sales of securities are recorded for financial statement purposes as net realized gains and losses on investments. Gains and losses attributable to foreign exchange rate movements on receivables, payables, income and expenses are recorded for financial statement purposes as foreign currency transaction gains and losses. That portion of both realized and unrealized gains and losses on investments that results from fluctuations in foreign currency exchange rates is not separately disclosed.
Security Loans – Under its Securities Lending Agency Agreement with the fund, State Street Bank and Trust Company (“State Street”), as lending agent, loans the securities of the fund to certain qualified institutions (the “Borrowers”) approved by the fund. The loans are collateralized by cash and/or U.S. Treasury and federal agency obligations in an amount typically at least equal to the market value of the securities loaned. The market value of the loaned securities is determined at the close of business of the fund and any additional required collateral is delivered to the fund on the next business day. State Street provides the fund with indemnification against Borrower default. In the event of Borrower default, State Street will for the benefit of the fund either purchase securities identical to those loaned or, when such purchase is commercially impracticable, pay the fund the market value of the loaned securities. In return, State Street assumes the fund’s rights to the related collateral. If the collateral value is less than the cost to purchase identical securities, State Street is responsible for the shortfall, but only to the extent that such shortfall is not due to a decline in collateral value resulting from collateral reinvestment for which the fund bears the risk of loss. On loans collateralized by cash, the cash collateral is invested in a money market fund or short-term securities. At period end, the fund had investment securities on loan with a fair value of $20,404,267 and a related liability of $21,019,185 for collateral received on securities loaned, both of which are presented gross on the Statement of Assets and Liabilities. The liability for collateral for securities loaned is carried at fair value, which is categorized as level 2 within the fair value hierarchy. The collateral received on securities loaned exceeded the value of securities on loan at period end. A portion of
30
Table of Contents
Notes to Financial Statements (unaudited) – continued
the income generated upon investment of the collateral is remitted to the Borrowers, and the remainder is allocated between the fund and the lending agent. On loans collateralized by U.S. Treasury and/or federal agency obligations, a fee is received from the Borrower, and is allocated between the fund and the lending agent. Income from securities lending is included in “Interest” income in the Statement of Operations. The dividend and interest income earned on the securities loaned is accounted for in the same manner as other dividend and interest income.
Indemnifications – Under the fund’s organizational documents, its officers and Trustees may be indemnified against certain liabilities and expenses arising out of the performance of their duties to the fund. Additionally, in the normal course of business, the fund enters into agreements with service providers that may contain indemnification clauses. The fund’s maximum exposure under these agreements is unknown as this would involve future claims that may be made against the fund that have not yet occurred.
Investment Transactions and Income – Investment transactions are recorded on the trade date. Interest income is recorded on the accrual basis. Dividends received in cash are recorded on the ex-dividend date. Certain dividends from foreign securities will be recorded when the fund is informed of the dividend if such information is obtained subsequent to the ex-dividend date. Dividend and interest payments received in additional securities are recorded on the ex-dividend or ex-interest date in an amount equal to the value of the security on such date.
The fund may receive proceeds from litigation settlements. Any proceeds received from litigation involving portfolio holdings are reflected in the Statement of Operations in realized gain/loss if the security has been disposed of by the fund or in unrealized gain/loss if the security is still held by the fund. Any other proceeds from litigation not related to portfolio holdings are reflected as other income in the Statement of Operations.
Fees Paid Indirectly – The fund’s custody fee may be reduced according to an arrangement that measures the value of cash deposited with the custodian by the fund. This amount, for the six months ended March 31, 2014, is shown as a reduction of total expenses in the Statement of Operations.
Tax Matters and Distributions – The fund intends to qualify as a regulated investment company, as defined under Subchapter M of the Internal Revenue Code, and to distribute all of its taxable income, including realized capital gains. As a result, no provision for federal income tax is required. The fund’s federal tax returns, when filed, will remain subject to examination by the Internal Revenue Service for a three year period. Management has analyzed the fund’s tax positions taken on federal and state tax returns for all open tax years and does not believe that there are any uncertain tax positions that require recognition of a tax liability. Foreign taxes, if any, have been accrued by the fund in the accompanying financial statements in accordance with the applicable foreign tax law. Foreign income taxes may be withheld by certain countries in which the fund invests. Additionally, capital gains realized by the fund on securities issued in or by certain foreign countries may be subject to capital gains tax imposed by those countries.
31
Table of Contents
Notes to Financial Statements (unaudited) – continued
Distributions to shareholders are recorded on the ex-dividend date. Income and capital gain distributions are determined in accordance with income tax regulations, which may differ from U.S. generally accepted accounting principles. Certain capital accounts in the financial statements are periodically adjusted for permanent differences in order to reflect their tax character. These adjustments have no impact on net assets or net asset value per share. Temporary differences which arise from recognizing certain items of income, expense, gain or loss in different periods for financial statement and tax purposes will reverse at some time in the future. Distributions in excess of net investment income or net realized gains are temporary overdistributions for financial statement purposes resulting from differences in the recognition or classification of income or distributions for financial statement and tax purposes.
Book/tax differences primarily relate to wash sale loss deferrals and treating a portion of the proceeds from redemptions as a distribution for tax purposes.
The tax character of distributions made during the current period will be determined at fiscal year end. The tax character of distributions declared to shareholders for the last fiscal year is as follows:
| 9/30/13 | ||||
| Ordinary income (including any short-term capital gains) | $11,000,078 | |||
The federal tax cost and the tax basis components of distributable earnings were as follows:
| As of 3/31/14 | ||||
| Cost of investments | $1,533,440,879 | |||
| Gross appreciation | 516,779,100 | |||
| Gross depreciation | (17,525,165 | ) | ||
| Net unrealized appreciation (depreciation) | $499,253,935 | |||
| As of 9/30/13 | ||||
| Undistributed ordinary income | 18,579,114 | |||
| Undistributed long-term capital gain | 59,462,777 | |||
| Other temporary differences | 3,972 | |||
| Net unrealized appreciation (depreciation) | 361,880,296 | |||
The aggregate cost above includes prior fiscal year end tax adjustments, if applicable.
Multiple Classes of Shares of Beneficial Interest – The fund offers multiple classes of shares, which differ in their respective distribution, service, and program manager fees. The fund’s income, realized and unrealized gain (loss), and common expenses are allocated to shareholders based on the daily net assets of each class. Dividends are declared separately for each class. Differences in per share dividend rates are generally due to differences in separate class expenses. Class B and Class 529B shares will convert to Class A and Class 529A shares, respectively, approximately eight years after
32
Table of Contents
Notes to Financial Statements (unaudited) – continued
purchase. The fund’s distributions declared to shareholders as reported in the Statements of Changes in Net Assets are presented by class as follows:
| From net investment income | From net realized gain on investments | |||||||||||||||
| Six months ended 3/31/14 | Year ended 9/30/13 | Six months ended 3/31/14 | Year ended 9/30/13 | |||||||||||||
| Class A | $1,800,887 | $1,519,721 | $16,311,588 | $— | ||||||||||||
| Class B | — | 17,312 | 855,823 | — | ||||||||||||
| Class C | — | 71,150 | 2,326,396 | — | ||||||||||||
| Class I | 317,506 | 9,218,445 | 2,167,927 | — | ||||||||||||
| Class R1 | 11,697 | 2,922 | 230,583 | — | ||||||||||||
| Class R2 | 62,247 | 91,394 | 1,048,544 | — | ||||||||||||
| Class R3 | 189,413 | 36,114 | 1,499,446 | — | ||||||||||||
| Class R4 | 178,728 | 22,871 | 1,176,687 | — | ||||||||||||
| Class R5 | 8,624,036 | — | 52,877,245 | — | ||||||||||||
| Class 529A | 15,664 | 18,411 | 157,189 | — | ||||||||||||
| Class 529B | — | 296 | 13,448 | — | ||||||||||||
| Class 529C | — | 1,442 | 66,179 | — | ||||||||||||
| Total | $11,200,178 | $11,000,078 | $78,731,055 | $— | ||||||||||||
(3) Transactions with Affiliates
Investment Adviser – The fund has an investment advisory agreement with MFS to provide overall investment management and related administrative services and facilities to the fund. The management fee is computed daily and paid monthly at the following annual rates:
| First $1 billion of average daily net assets | 0.75 | % | ||
| Average daily net assets in excess of $1 billion | 0.70 | % |
MFS has agreed in writing to reduce its management fee by a specified amount if certain MFS mutual fund assets exceed thresholds agreed to by MFS and the fund’s Board of Trustees. For the six months ended March 31, 2014, this management fee reduction amounted to $22,747, which is included in the reduction of total expenses in the Statement of Operations. The management fee incurred for the six months ended March 31, 2014 was equivalent to an annual effective rate of 0.73% of the fund’s average daily net assets.
For the period October 1, 2013 through January 31, 2014, the investment adviser had agreed in writing to pay a portion of the fund’s total annual operating expenses, exclusive of interest, taxes, extraordinary expenses, brokerage and transaction costs, and investment-related expenses, such that total fund operating expenses did not exceed the following rates annually of each class’s average daily net assets:
| Classes | ||||||||||||||||||||||||||||||||||||||||||||||
| A | B | C | I | R1 | R2 | R3 | R4 | R5 | 529A | 529B | 529C | |||||||||||||||||||||||||||||||||||
| 1.25% | 2.00% | 2.00% | 1.00% | 2.00% | 1.50% | 1.25% | 1.00% | 0.91% | 1.30% | 2.05% | 2.05% | |||||||||||||||||||||||||||||||||||
33
Table of Contents
Notes to Financial Statements (unaudited) – continued
This written agreement was terminated on January 31, 2014. For the period October 1, 2013 through January 31, 2014, the fund’s actual operating expenses did not exceed the limit and therefore, the investment adviser did not pay any portion of the fund’s expenses related to this agreement.
Distributor – MFS Fund Distributors, Inc. (MFD), a wholly-owned subsidiary of MFS, as distributor, received $383,114 and $1,758 for the six months ended March 31, 2014, as its portion of the initial sales charge on sales of Class A and Class 529A shares of the fund, respectively.
The Board of Trustees has adopted a distribution plan for certain share classes pursuant to Rule 12b-1 of the Investment Company Act of 1940.
The fund’s distribution plan provides that the fund will pay MFD for services provided by MFD and financial intermediaries in connection with the distribution and servicing of certain share classes. One component of the plan is a distribution fee paid to MFD and another component of the plan is a service fee paid to MFD. MFD may subsequently pay all, or a portion, of the distribution and/or service fees to financial intermediaries.
Distribution Plan Fee Table:
| Distribution Fee Rate (d) | Service Fee Rate (d) | Total Distribution Plan (d) | Annual Effective Rate (e) | Distribution and Service Fee | ||||||||||||||||
| Class A | — | 0.25% | 0.25% | 0.25% | $448,713 | |||||||||||||||
| Class B | 0.75% | 0.25% | 1.00% | 1.00% | 87,549 | |||||||||||||||
| Class C | 0.75% | 0.25% | 1.00% | 1.00% | 249,243 | |||||||||||||||
| Class R1 | 0.75% | 0.25% | 1.00% | 1.00% | 23,072 | |||||||||||||||
| Class R2 | 0.25% | 0.25% | 0.50% | 0.50% | 56,646 | |||||||||||||||
| Class R3 | — | 0.25% | 0.25% | 0.25% | 45,119 | |||||||||||||||
| Class 529A | �� | — | 0.25% | 0.25% | 0.23% | 4,187 | ||||||||||||||
| Class 529B | 0.75% | 0.25% | 1.00% | 0.99% | 1,332 | |||||||||||||||
| Class 529C | 0.75% | 0.25% | 1.00% | 1.00% | 6,715 | |||||||||||||||
| Total Distribution and Service Fees | $922,576 | |||||||||||||||||||
| (d) | In accordance with the distribution plan for certain classes, the fund pays distribution and/or service fees equal to these annual percentage rates of each class’s average daily net assets. The distribution and service fee rates disclosed by class represent the current rates in effect at the end of the reporting period. Any rate changes, if applicable, are detailed below. |
| (e) | The annual effective rates represent actual fees incurred under the distribution plan for the six months ended March 31, 2014 based on each class’s average daily net assets. MFD has voluntarily agreed to rebate a portion of each class’s 0.25% service fee attributable to accounts for which MFD retains the 0.25% service fee except for accounts attributable to MFS or its affiliates’ seed money. For the six months ended March 31, 2014, this rebate amounted to $2,253, $24, $43, $355, $150, $388, $7, and $7 for Class A, Class B, Class C, Class R2, Class R3, Class 529A, Class 529B, and Class 529C, respectively, and is included in the reduction of total expenses in the Statement of Operations. |
Certain Class A shares are subject to a contingent deferred sales charge (CDSC) in the event of a shareholder redemption within 18 months of purchase for shares purchased on or after August 1, 2012, and within 24 months of purchase for shares purchased prior to August 1, 2012. Class C and Class 529C shares are subject to a CDSC in the event of a shareholder redemption within 12 months of purchase. Class B and
34
Table of Contents
Notes to Financial Statements (unaudited) – continued
Class 529B shares are subject to a CDSC in the event of a shareholder redemption within six years of purchase. All contingent deferred sales charges are paid to MFD and during the six months ended March 31, 2014, were as follows:
| Amount | ||||
| Class A | $2,037 | |||
| Class B | 7,181 | |||
| Class C | 2,765 | |||
| Class 529B | — | |||
| Class 529C | — | |||
The fund has entered into and may from time to time enter into contracts with program managers and other parties which administer the tuition programs through which an investment in the fund’s 529 share classes is made. The fund has entered into an agreement with MFD pursuant to which MFD receives an annual fee of up to 0.10% of the average daily net assets attributable to each 529 share class. MFD has agreed to waive a portion of this fee in an amount equal to 0.05% of the average daily net assets for each 529 share class. This waiver agreement will expire on January 31, 2015, unless MFD elects to extend the waiver. For the six months ended March 31, 2014, this waiver amounted to $1,240 and is included in the reduction of total expenses in the Statement of Operations. The program manager fee incurred for the six months ended March 31, 2014 was equivalent to an annual effective rate of 0.05% of the average daily net assets attributable to each 529 share class. The services provided by MFD, or a third party with which MFD contracts, include recordkeeping and tax reporting and account services, as well as services designed to maintain the program’s compliance with the Internal Revenue Code and other regulatory requirements. Program manager fees and waivers for the six months ended March 31, 2014, were as follows:
| Fee | Waiver | |||||||
| Class 529A | $1,675 | $837 | ||||||
| Class 529B | 133 | 67 | ||||||
| Class 529C | 671 | 336 | ||||||
| Total Program Manager Fees and Waivers | $2,479 | $1,240 | ||||||
Shareholder Servicing Agent – MFS Service Center, Inc. (MFSC), a wholly-owned subsidiary of MFS, receives a fee from the fund for its services as shareholder servicing agent calculated as a percentage of the average daily net assets of the fund as determined periodically under the supervision of the fund’s Board of Trustees. For the six months ended March 31, 2014, the fee was $86,480, which equated to 0.0098% annually of the fund’s average daily net assets. MFSC also receives payment from the fund for out-of-pocket expenses, sub-accounting and other shareholder servicing costs which may be paid to affiliated and unaffiliated service providers. Class R5 shares do not incur sub-accounting fees. For the six months ended March 31, 2014, these out-of-pocket expenses, sub-accounting and other shareholder servicing costs amounted to $339,268.
Under a Special Servicing Agreement among MFS, each MFS fund which invests in other MFS funds (“MFS fund-of-funds”) and certain underlying funds in which a MFS fund-of-funds invests (“underlying funds”), each underlying fund may pay a portion of
35
Table of Contents
Notes to Financial Statements (unaudited) – continued
each MFS fund-of-fund’s transfer agent-related expenses, including sub-accounting fees payable to financial intermediaries, to the extent such payments do not exceed the benefits realized or expected to be realized by the underlying fund from the investment in the underlying fund by the MFS fund-of-fund. For the six months ended March 31, 2014, these costs for the fund amounted to $491,098 and are included in “Shareholder servicing costs” in the Statement of Operations.
Administrator – MFS provides certain financial, legal, shareholder communications, compliance, and other administrative services to the fund. Under an administrative services agreement, the fund partially reimburses MFS the costs incurred to provide these services. The fund is charged an annual fixed amount of $17,500 plus a fee based on average daily net assets. The administrative services fee incurred for the six months ended March 31, 2014 was equivalent to an annual effective rate of 0.0122% of the fund’s average daily net assets.
Trustees’ and Officers’ Compensation – The fund pays compensation to independent Trustees in the form of a retainer, attendance fees, and additional compensation to Board and Committee chairpersons. The fund does not pay compensation directly to Trustees or officers of the fund who are also officers of the investment adviser, all of whom receive remuneration for their services to the fund from MFS. Certain officers and Trustees of the fund are officers or directors of MFS, MFD, and MFSC.
Other – This fund and certain other funds managed by MFS (the funds) have entered into services agreements (the Agreements) which provide for payment of fees by the funds to Tarantino LLC and Griffin Compliance LLC in return for the provision of services of an Independent Chief Compliance Officer (ICCO) and Assistant ICCO, respectively, for the funds. The ICCO and Assistant ICCO are officers of the funds and the sole members of Tarantino LLC and Griffin Compliance LLC, respectively. The funds can terminate the Agreements with Tarantino LLC and Griffin Compliance LLC at any time under the terms of the Agreements. For the six months ended March 31, 2014, the aggregate fees paid by the fund to Tarantino LLC and Griffin Compliance LLC were $5,486 and are included in “Miscellaneous” expense in the Statement of Operations. MFS has agreed to reimburse the fund for a portion of the payments made by the fund in the amount of $990, which is included in the reduction of total expenses in the Statement of Operations. Additionally, MFS has agreed to bear all expenses associated with office space, other administrative support, and supplies provided to the ICCO and Assistant ICCO.
The fund invests in the MFS Institutional Money Market Portfolio which is managed by MFS and seeks current income consistent with preservation of capital and liquidity. Income earned on this investment is included in “Dividends from underlying affiliated funds” in the Statement of Operations. This money market fund does not pay a management fee to MFS.
On January 31, 2013, MFS purchased 6,165 shares of Class R5 for an aggregate amount of $100,000.
On September 11, 2013, MFS redeemed 6,163 shares of Class R5 for an aggregate amount of $99,964.
36
Table of Contents
Notes to Financial Statements (unaudited) – continued
(4) Portfolio Securities
Purchases and sales of investments, other than short-term obligations, aggregated $468,393,974 and $231,169,468, respectively.
(5) Shares of Beneficial Interest
The fund’s Declaration of Trust permits the Trustees to issue an unlimited number of full and fractional shares of beneficial interest. Transactions in fund shares were as follows:
| Six months ended 3/31/14 | Year ended 9/30/13 (i) | |||||||||||||||
| Shares | Amount | Shares | Amount | |||||||||||||
| Shares sold | ||||||||||||||||
Class A | 6,172,983 | $119,707,172 | 6,959,143 | $120,374,242 | ||||||||||||
Class B | 137,858 | 2,572,477 | 275,829 | 4,565,253 | ||||||||||||
Class C | 970,150 | 18,092,897 | 938,292 | 15,451,261 | ||||||||||||
Class I | 3,839,479 | 75,972,632 | 2,571,107 | 41,461,860 | ||||||||||||
Class R1 | 244,325 | 4,493,793 | 39,518 | 638,958 | ||||||||||||
Class R2 | 347,835 | 6,616,017 | 499,233 | 8,291,481 | ||||||||||||
Class R3 | 1,355,227 | 26,003,864 | 1,212,909 | 21,150,716 | ||||||||||||
Class R4 | 1,333,415 | 25,928,932 | 1,270,152 | 22,027,766 | ||||||||||||
Class R5 | 2,993,043 | 58,206,694 | 58,446,118 | 971,253,864 | ||||||||||||
Class 529A | 31,694 | 612,334 | 47,483 | 793,123 | ||||||||||||
Class 529B | 2,556 | 46,774 | 3,757 | 62,175 | ||||||||||||
Class 529C | 12,158 | 222,730 | 28,795 | 466,479 | ||||||||||||
| 17,440,723 | $338,476,316 | 72,292,336 | $1,206,537,178 | |||||||||||||
| Shares issued to shareholders in reinvestment of distributions | ||||||||||||||||
Class A | 722,224 | $13,512,813 | 62,976 | $945,897 | ||||||||||||
Class B | 44,982 | 811,018 | 1,128 | 16,383 | ||||||||||||
Class C | 119,372 | 2,147,500 | 4,401 | 63,818 | ||||||||||||
Class I | 122,000 | 2,327,760 | 601,827 | 9,201,939 | ||||||||||||
Class R1 | 13,657 | 242,280 | 203 | 2,922 | ||||||||||||
Class R2 | 57,654 | 1,060,239 | 6,134 | 90,653 | ||||||||||||
Class R3 | 90,410 | 1,688,859 | 2,406 | 36,114 | ||||||||||||
Class R4 | 72,212 | 1,355,415 | 1,520 | 22,871 | ||||||||||||
Class R5 | 3,225,028 | 61,501,281 | — | — | ||||||||||||
Class 529A | 9,369 | 172,853 | 1,237 | 18,336 | ||||||||||||
Class 529B | 766 | 13,448 | 21 | 296 | ||||||||||||
Class 529C | 3,754 | 66,179 | 100 | 1,442 | ||||||||||||
| 4,481,428 | $84,899,645 | 681,953 | $10,400,671 | |||||||||||||
37
Table of Contents
Notes to Financial Statements (unaudited) – continued
| Six months ended 3/31/14 | Year ended 9/30/13 (i) | |||||||||||||||
| Shares | Amount | Shares | Amount | |||||||||||||
| Shares reacquired | ||||||||||||||||
Class A | (1,432,957 | ) | $(27,720,869 | ) | (2,546,263 | ) | $(42,328,766 | ) | ||||||||
Class B | (132,627 | ) | (2,480,053 | ) | (322,455 | ) | (5,154,043 | ) | ||||||||
Class C | (199,411 | ) | (3,687,606 | ) | (422,025 | ) | (6,729,514 | ) | ||||||||
Class I | (514,856 | ) | (10,230,697 | ) | (55,380,409 | ) | (913,927,206 | ) | ||||||||
Class R1 | (49,484 | ) | (907,427 | ) | (93,738 | ) | (1,469,831 | ) | ||||||||
Class R2 | (172,835 | ) | (3,293,386 | ) | (494,443 | ) | (8,011,866 | ) | ||||||||
Class R3 | (206,027 | ) | (3,982,155 | ) | (170,566 | ) | (2,900,041 | ) | ||||||||
Class R4 | (362,211 | ) | (7,128,201 | ) | (133,676 | ) | (2,387,798 | ) | ||||||||
Class R5 | (1,264,492 | ) | (25,115,096 | ) | (1,679,341 | ) | (29,981,409 | ) | ||||||||
Class 529A | (13,811 | ) | (265,801 | ) | (18,574 | ) | (312,182 | ) | ||||||||
Class 529B | (1,697 | ) | (30,789 | ) | (3,030 | ) | (47,457 | ) | ||||||||
Class 529C | (12,948 | ) | (241,602 | ) | (2,282 | ) | (35,750 | ) | ||||||||
| (4,363,356 | ) | $(85,083,682 | ) | (61,266,802 | ) | $(1,013,285,863 | ) | |||||||||
| Net change | ||||||||||||||||
Class A | 5,462,250 | $105,499,116 | 4,475,856 | $78,991,373 | ||||||||||||
Class B | 50,213 | 903,442 | (45,498 | ) | (572,407 | ) | ||||||||||
Class C | 890,111 | 16,552,791 | 520,668 | 8,785,565 | ||||||||||||
Class I | 3,446,623 | 68,069,695 | (52,207,475 | ) | (863,263,407 | ) | ||||||||||
Class R1 | 208,498 | 3,828,646 | (54,017 | ) | (827,951 | ) | ||||||||||
Class R2 | 232,654 | 4,382,870 | 10,924 | 370,268 | ||||||||||||
Class R3 | 1,239,610 | 23,710,568 | 1,044,749 | 18,286,789 | ||||||||||||
Class R4 | 1,043,416 | 20,156,146 | 1,137,996 | 19,662,839 | ||||||||||||
Class R5 | 4,953,579 | 94,592,879 | 56,766,777 | 941,272,455 | ||||||||||||
Class 529A | 27,252 | 519,386 | 30,146 | 499,277 | ||||||||||||
Class 529B | 1,625 | 29,433 | 748 | 15,014 | ||||||||||||
Class 529C | 2,964 | 47,307 | 26,613 | 432,171 | ||||||||||||
| 17,558,795 | $338,292,279 | 11,707,487 | $203,651,986 | |||||||||||||
| (i) | For Class R5, the period is from inception, February 1, 2013, through the stated period end. |
The fund is one of several mutual funds in which the MFS funds-of-funds may invest. The MFS funds-of-funds do not invest in the underlying funds for the purpose of exercising management or control. At the end of the period, the MFS Growth Allocation Fund, MFS Moderate Allocation Fund, MFS Aggressive Growth Allocation Fund, MFS Conservative Allocation Fund, MFS Lifetime 2030 Fund, and MFS Lifetime 2040 Fund were the owners of record of approximately 22%, 21%, 8%, 6%, 2%, and 1%, respectively, of the value of outstanding voting shares of the fund. In addition, the MFS Lifetime 2010 Fund, MFS Lifetime 2015 Fund, MFS Lifetime 2020 Fund, MFS Lifetime 2025 Fund, MFS Lifetime 2035 Fund, MFS Lifetime 2045 Fund, MFS Lifetime 2050 Fund, MFS Lifetime 2055 Fund, and MFS Lifetime Retirement Income Fund were each the owners of record of less than 1% of the value of outstanding voting shares of the fund.
38
Table of Contents
Notes to Financial Statements (unaudited) – continued
(6) Line of Credit
The fund and certain other funds managed by MFS participate in a $1.1 billion unsecured committed line of credit, subject to a $1 billion sublimit, provided by a syndication of banks under a credit agreement. Borrowings may be made for temporary financing needs. Interest is charged to each fund, based on its borrowings, generally at a rate equal to the higher of the Federal Reserve funds rate or one month LIBOR plus an agreed upon spread. A commitment fee, based on the average daily, unused portion of the committed line of credit, is allocated among the participating funds at the end of each calendar quarter. In addition, the fund and other funds managed by MFS have established unsecured uncommitted borrowing arrangements with certain banks for temporary financing needs. Interest is charged to each fund, based on its borrowings, at a rate equal to the Federal Reserve funds rate plus an agreed upon spread. For the six months ended March 31, 2014, the fund’s commitment fee and interest expense were $3,288 and $0, respectively, and are included in “Miscellaneous” expense in the Statement of Operations.
(7) Transactions in Underlying Affiliated Funds-Affiliated Issuers
An affiliated issuer may be considered one in which the fund owns 5% or more of the outstanding voting securities, or a company which is under common control. For the purposes of this report, the fund assumes the following to be an affiliated issuer:
| Underlying Affiliated Fund | Beginning Shares/Par Amount | Acquisitions Shares/Par Amount | Dispositions Shares/Par Amount | Ending Shares/Par Amount | ||||||||||||
| MFS Institutional Money Market Portfolio | 29,213,749 | 211,068,261 | (190,985,560 | ) | 49,296,450 | |||||||||||
| Underlying Affiliated Fund | Realized Gain (Loss) | Capital Gain Distributions | Dividend Income | Ending Value | ||||||||||||
| MFS Institutional Money Market Portfolio | $— | $— | $18,626 | $49,296,450 | ||||||||||||
39
Table of Contents
BOARD REVIEW OF INVESTMENT ADVISORY AGREEMENT
A discussion regarding the Board’s most recent review and renewal of the fund’s Investment Advisory Agreement with MFS is available by clicking on the fund’s name under “Mutual Funds” in the “Products” section of the MFS Web site (mfs.com).
PROXY VOTING POLICIES AND INFORMATION
MFS votes proxies on behalf of the fund pursuant to proxy voting policies and procedures that are available without charge, upon request, by calling 1-800-225-2606, by visiting the Proxy Voting section of mfs.com or by visiting the SEC’s Web site at http://www.sec.gov.
Information regarding how the fund voted proxies relating to portfolio securities during the most recent twelve-month period ended June 30 is available without charge by visiting the Proxy Voting section of mfs.com or by visiting the SEC’s Web site at http://www.sec.gov.
QUARTERLY PORTFOLIO DISCLOSURE
The fund will file a complete schedule of portfolio holdings with the Securities and Exchange Commission (the Commission) for the first and third quarters of each fiscal year on Form N-Q. A shareholder can obtain the quarterly portfolio holdings report at mfs.com. The fund’s Form N-Q is also available on the EDGAR database on the Commission’s Internet Web site at http://www.sec.gov, and may be reviewed and copied at the:
Public Reference Room
Securities and Exchange Commission
100 F Street, NE, Room 1580
Washington, D.C. 20549
Information on the operation of the Public Reference Room may be obtained by calling the Commission at 1-800-SEC-0330. Copies of the fund’s Form N-Q also may be obtained, upon payment of a duplicating fee, by electronic request at the following e-mail address: publicinfo@sec.gov, or by writing the Public Reference Section at the above address.
From time to time, MFS may post important information about the fund or the MFS funds on the MFS web site (mfs.com). This information is available by visiting the “Commentary & Announcements” and “Market Outlooks” sections of mfs.com or by clicking on the fund’s name under “Mutual Funds” in the “Products” section of mfs.com.
PROVISION OF FINANCIAL REPORTS AND SUMMARY PROSPECTUSES
The fund produces financial reports every six months and updates its summary prospectus and prospectus annually. To avoid sending duplicate copies of materials to households, only one copy of the fund’s annual and semiannual report and summary prospectus may be mailed to shareholders having the same last name and residential address on the fund’s records. However, any shareholder may contact MFSC (please see back cover for address and telephone number) to request that copies of these reports and summary prospectuses be sent personally to that shareholder.
40
Table of Contents
Save paper with eDelivery.
| MFS® will send you prospectuses, |

reports, and proxies directly via e-mail so you will get information faster with less mailbox clutter.
To sign up:
1. Go to mfs.com.
2. Log in via MFS® Access.
3. Select eDelivery.
If you own your MFS fund shares through a financial institution or a retirement plan, MFS® TALK, MFS® Access, or eDelivery may not be available to you.
WEB SITE
mfs.com
MFS TALK
1-800-637-8255
24 hours a day
ACCOUNT SERVICE AND LITERATURE
Shareholders
1-800-225-2606
Financial advisors
1-800-343-2829
Retirement plan services
1-800-637-1255
MAILING ADDRESS
MFS Service Center, Inc.
P.O. Box 55824
Boston, MA 02205-5824
OVERNIGHT MAIL
MFS Service Center, Inc.
c/o Boston Financial Data Services
30 Dan Road
Canton, MA 02021-2809
Table of Contents
SEMIANNUAL REPORT
March 31, 2014

MFS® BLENDED RESEARCH® CORE EQUITY FUND

UNE-SEM
Table of Contents
MFS® BLENDED RESEARCH® CORE EQUITY FUND
The report is prepared for the general information of shareholders. It is authorized for distribution to prospective investors only when preceded or accompanied by a current prospectus.
NOT FDIC INSURED Ÿ MAY LOSE VALUE Ÿ NO BANK GUARANTEE
Table of Contents

LETTER FROM THE CHAIRMAN AND CEO
Dear Shareholders:
The pace of U.S. economic growth slowed early in 2014, largely because of harsh winter weather. However, the U.S. labor market, consumer confidence and other
economic data have all pointed to recovery. The U.S. Federal Reserve’s steady, gradual removal of its bond-buying stimulus, after initially causing concern, is providing some consistency, which can inspire consumer and investor confidence.
Global economic uncertainty and geopolitical tensions have added to market volatility. The eurozone, however, is making progress in its economic recovery. Japan’s progress in its battle to end deflation is expected to experience a temporary setback on the heels of the country’s sales tax increase, introduced in April.
The world’s largest economic concern remains the slowdown in China’s pace of growth as it shifts toward a more consumer-oriented economy. Any reduction in China’s economic growth rate is likely to have a ripple effect on its many trading partners.
In uncertain times such as these, it is particularly important to remember that managing risk should always be a top priority. At MFS®, active risk management is an integral part of our collaborative process. Our global team of investment professionals shares ideas and evaluates opportunities that span continents, investment disciplines and asset classes. Our goal is to build better insights, and ultimately better results, for our clients.
We understand and appreciate the economic challenges investors face, and we believe in the value of maintaining a long-term view and applying proven principles, such as asset allocation and diversification. We are confident that our unique approach can serve investors well as they work with their financial advisors to identify and pursue the most suitable opportunities.
Respectfully,

Robert J. Manning
Chairman and Chief Executive Officer
MFS Investment Management
May 13, 2014
The opinions expressed in this letter are subject to change, may not be relied upon for investment advice, and no forecasts can be guaranteed.
1
Table of Contents
Portfolio structure
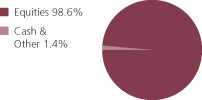
| Top ten holdings | ||||
| Exxon Mobil Corp. | 3.7% | |||
| JPMorgan Chase & Co. | 2.5% | |||
| Apple, Inc. | 2.3% | |||
| Google, Inc., “A” | 2.3% | |||
| Pfizer, Inc. | 2.2% | |||
| Chevron Corp. | 2.1% | |||
| Oracle Corp. | 2.0% | |||
| Wells Fargo & Co. | 1.9% | |||
| CVS Caremark Corp. | 1.9% | |||
| Gilead Sciences, Inc. | 1.8% |
| Equity sectors | ||||
| Technology | 17.4% | |||
| Financial Services | 15.5% | |||
| Health Care | 13.5% | |||
| Energy | 9.7% | |||
| Consumer Staples | 7.4% | |||
| Retailing | 7.4% | |||
| Utilities & Communications | 6.5% | |||
| Industrial Goods & Services | 5.9% | |||
| Leisure | 4.8% | |||
| Basic Materials | 3.4% | |||
| Special Products & Services | 2.7% | |||
| Autos & Housing | 2.3% | |||
| Transportation | 2.1% |
Percentages are based on net assets as of 3/31/14.
The portfolio is actively managed and current holdings may be different.
2
Table of Contents
Fund expenses borne by the shareholders during the period, October 1, 2013 through March 31, 2014
As a shareholder of the fund, you incur two types of costs: (1) transaction costs, including sales charges (loads) on certain purchase or redemption payments, and (2) ongoing costs, including management fees; distribution and service (12b-1) fees; and other fund expenses. This example is intended to help you understand your ongoing costs (in dollars) of investing in the fund and to compare these costs with the ongoing costs of investing in other mutual funds.
The example is based on an investment of $1,000 invested at the beginning of the period and held for the entire period October 1, 2013 through March 31, 2014.
Actual Expenses
The first line for each share class in the following table provides information about actual account values and actual expenses. You may use the information in this line, together with the amount you invested, to estimate the expenses that you paid over the period. Simply divide your account value by $1,000 (for example, an $8,600 account value divided by $1,000 = 8.6), then multiply the result by the number in the first line under the heading entitled “Expenses Paid During Period” to estimate the expenses you paid on your account during this period.
Hypothetical Example for Comparison Purposes
The second line for each share class in the following table provides information about hypothetical account values and hypothetical expenses based on the fund’s actual expense ratio and an assumed rate of return of 5% per year before expenses, which is not the fund’s actual return. The hypothetical account values and expenses may not be used to estimate the actual ending account balance or expenses you paid for the period. You may use this information to compare the ongoing costs of investing in the fund and other funds. To do so, compare this 5% hypothetical example with the 5% hypothetical examples that appear in the shareholder reports of the other funds.
Please note that the expenses shown in the table are meant to highlight your ongoing costs only and do not reflect any transactional costs, such as sales charges (loads). Therefore, the second line for each share class in the table is useful in comparing ongoing costs only, and will not help you determine the relative total costs of owning different funds. In addition, if these transactional costs were included, your costs would have been higher.
3
Table of Contents
Expense Table – continued
| Share Class | Annualized Ratio | Beginning Account Value 10/01/13 | Ending Account Value | Expenses Paid During Period (p) 10/01/13-3/31/14 | ||||||||||||||
| A | Actual | 0.85% | $1,000.00 | $1,144.65 | $4.54 | |||||||||||||
| Hypothetical (h) | 0.85% | $1,000.00 | $1,020.69 | $4.28 | ||||||||||||||
| B | Actual | 1.60% | $1,000.00 | $1,140.35 | $8.54 | |||||||||||||
| Hypothetical (h) | 1.60% | $1,000.00 | $1,016.95 | $8.05 | ||||||||||||||
| C | Actual | 1.60% | $1,000.00 | $1,140.78 | $8.54 | |||||||||||||
| Hypothetical (h) | 1.60% | $1,000.00 | $1,016.95 | $8.05 | ||||||||||||||
| I | Actual | 0.60% | $1,000.00 | $1,146.09 | $3.21 | |||||||||||||
| Hypothetical (h) | 0.60% | $1,000.00 | $1,021.94 | $3.02 | ||||||||||||||
| R1 | Actual | 1.60% | $1,000.00 | $1,140.31 | $8.54 | |||||||||||||
| Hypothetical (h) | 1.60% | $1,000.00 | $1,016.95 | $8.05 | ||||||||||||||
| R2 | Actual | 1.10% | $1,000.00 | $1,143.37 | $5.88 | |||||||||||||
| Hypothetical (h) | 1.10% | $1,000.00 | $1,019.45 | $5.54 | ||||||||||||||
| R3 | Actual | 0.85% | $1,000.00 | $1,144.10 | $4.54 | |||||||||||||
| Hypothetical (h) | 0.85% | $1,000.00 | $1,020.69 | $4.28 | ||||||||||||||
| R4 | Actual | 0.60% | $1,000.00 | $1,145.96 | $3.21 | |||||||||||||
| Hypothetical (h) | 0.60% | $1,000.00 | $1,021.94 | $3.02 | ||||||||||||||
| R5 | Actual | 0.50% | $1,000.00 | $1,146.44 | $2.68 | |||||||||||||
| Hypothetical (h) | 0.50% | $1,000.00 | $1,022.44 | $2.52 | ||||||||||||||
| (h) | 5% class return per year before expenses. |
| (p) | “Expenses Paid During Period” are equal to each class’s annualized expense ratio, as shown above, multiplied by the average account value over the period, multiplied by 182/365 (to reflect the one-half year period). Expenses paid do not include any applicable sales charges (loads). If these transaction costs had been included, your costs would have been higher. |
4
Table of Contents
3/31/14 (unaudited)
The Portfolio of Investments is a complete list of all securities owned by your fund. It is categorized by broad-based asset classes.
| Common Stocks - 98.6% | ||||||||
| Issuer | Shares/Par | Value ($) | ||||||
| Aerospace - 3.6% | ||||||||
| Alliant Techsystems, Inc. | 9,150 | $ | 1,300,672 | |||||
| Exelis, Inc. | 37,120 | 705,651 | ||||||
| Lockheed Martin Corp. | 34,222 | 5,586,399 | ||||||
| United Technologies Corp. | 37,490 | 4,380,332 | ||||||
|
| |||||||
| $ | 11,973,054 | |||||||
| Apparel Manufacturers - 1.1% | ||||||||
| Michael Kors Holdings Ltd. (a) | 39,890 | $ | 3,720,540 | |||||
| Automotive - 2.3% | ||||||||
| General Motors Co. | 104,030 | $ | 3,580,713 | |||||
| Goodyear Tire & Rubber Co. | 12,400 | 324,012 | ||||||
| Johnson Controls, Inc. | 77,420 | 3,663,514 | ||||||
|
| |||||||
| $ | 7,568,239 | |||||||
| Biotechnology - 2.5% | ||||||||
| Celgene Corp. (a) | 17,907 | $ | 2,499,817 | |||||
| Gilead Sciences, Inc. (a) | 82,930 | 5,876,420 | ||||||
|
| |||||||
| $ | 8,376,237 | |||||||
| Broadcasting - 1.0% | ||||||||
| Time Warner, Inc. | 23,530 | $ | 1,537,215 | |||||
| Viacom, Inc., “B” | 20,280 | 1,723,597 | ||||||
|
| |||||||
| $ | 3,260,812 | |||||||
| Business Services - 2.7% | ||||||||
| Accenture PLC, “A” | 47,560 | $ | 3,791,483 | |||||
| Cognizant Technology Solutions Corp., “A” (a) | 35,590 | 1,801,210 | ||||||
| FleetCor Technologies, Inc. (a) | 28,480 | 3,278,048 | ||||||
|
| |||||||
| $ | 8,870,741 | |||||||
| Cable TV - 2.6% | ||||||||
| Comcast Corp., “A” | 79,760 | $ | 3,989,595 | |||||
| Time Warner Cable, Inc. | 34,780 | 4,771,120 | ||||||
|
| |||||||
| $ | 8,760,715 | |||||||
| Chemicals - 2.6% | ||||||||
| CF Industries Holdings, Inc. | 16,258 | $ | 4,237,485 | |||||
| LyondellBasell Industries N.V., “A” | 49,030 | 4,360,728 | ||||||
|
| |||||||
| $ | 8,598,213 | |||||||
5
Table of Contents
Portfolio of Investments (unaudited) – continued
| Issuer | Shares/Par | Value ($) | ||||||
| Common Stocks - continued | ||||||||
| Computer Software - 4.4% | ||||||||
| CA, Inc. | 60,140 | $ | 1,862,536 | |||||
| Microsoft Corp. | 64,472 | 2,642,707 | ||||||
| Oracle Corp. | 159,404 | 6,521,218 | ||||||
| PTC, Inc. (a) | 21,020 | 744,739 | ||||||
| Symantec Corp. | 138,960 | 2,775,031 | ||||||
|
| |||||||
| $ | 14,546,231 | |||||||
| Computer Software - Systems - 5.6% | ||||||||
| Apple, Inc. | 14,302 | $ | 7,676,455 | |||||
| Hewlett-Packard Co. | 169,970 | 5,500,229 | ||||||
| International Business Machines Corp. | 7,906 | 1,521,826 | ||||||
| Western Digital Corp. | 44,270 | 4,064,871 | ||||||
|
| |||||||
| $ | 18,763,381 | |||||||
| Consumer Products - 1.6% | ||||||||
| Procter & Gamble Co. | 67,161 | $ | 5,413,177 | |||||
| Containers - 0.8% | ||||||||
| Packaging Corp. of America | 36,070 | $ | 2,538,246 | |||||
| Electrical Equipment - 0.6% | ||||||||
| General Electric Co. | 81,204 | $ | 2,102,372 | |||||
| Electronics - 1.5% | ||||||||
| Avago Technologies Ltd. | 6,690 | $ | 430,903 | |||||
| Intel Corp. | 176,357 | 4,551,774 | ||||||
|
| |||||||
| $ | 4,982,677 | |||||||
| Energy - Independent - 2.7% | ||||||||
| EOG Resources, Inc. | 24,966 | $ | 4,897,580 | |||||
| Marathon Petroleum Corp. | 45,750 | 3,982,080 | ||||||
|
| |||||||
| $ | 8,879,660 | |||||||
| Energy - Integrated - 5.8% | ||||||||
| Chevron Corp. | 59,144 | $ | 7,032,813 | |||||
| Exxon Mobil Corp. | 124,349 | 12,146,410 | ||||||
|
| |||||||
| $ | 19,179,223 | |||||||
| Food & Beverages - 3.8% | ||||||||
| Archer Daniels Midland Co. | 50,850 | $ | 2,206,382 | |||||
| Coca-Cola Enterprises, Inc. | 32,210 | 1,538,350 | ||||||
| General Mills, Inc. | 61,590 | 3,191,594 | ||||||
| Tyson Foods, Inc., “A” | 127,340 | 5,604,233 | ||||||
|
| |||||||
| $ | 12,540,559 | |||||||
6
Table of Contents
Portfolio of Investments (unaudited) – continued
| Issuer | Shares/Par | Value ($) | ||||||
| Common Stocks - continued | ||||||||
| Food & Drug Stores - 3.1% | ||||||||
| CVS Caremark Corp. | 83,620 | $ | 6,259,793 | |||||
| Kroger Co. | 91,220 | 3,981,753 | ||||||
|
| |||||||
| $ | 10,241,546 | |||||||
| General Merchandise - 1.2% | ||||||||
| Macy’s, Inc. | 69,470 | $ | 4,118,876 | |||||
| Health Maintenance Organizations - 1.3% | ||||||||
| WellPoint, Inc. | 43,160 | $ | 4,296,578 | |||||
| Insurance - 4.7% | ||||||||
| Berkshire Hathaway, Inc., “B” (a) | 8,289 | $ | 1,035,876 | |||||
| Everest Re Group Ltd. | 21,761 | 3,330,521 | ||||||
| MetLife, Inc. | 88,460 | 4,670,688 | ||||||
| Prudential Financial, Inc. | 41,300 | 3,496,045 | ||||||
| Validus Holdings Ltd. | 77,580 | 2,925,542 | ||||||
|
| |||||||
| $ | 15,458,672 | |||||||
| Internet - 4.8% | ||||||||
| Facebook, Inc., “A” (a) | 91,640 | $ | 5,520,394 | |||||
| Google, Inc., “A” (a) | 6,833 | 7,615,447 | ||||||
| Yahoo!, Inc. (a) | 75,170 | 2,698,603 | ||||||
|
| |||||||
| $ | 15,834,444 | |||||||
| Machinery & Tools - 1.7% | ||||||||
| Cummins, Inc. | 28,324 | $ | 4,219,993 | |||||
| Kennametal, Inc. | 29,560 | 1,309,508 | ||||||
|
| |||||||
| $ | 5,529,501 | |||||||
| Major Banks - 6.8% | ||||||||
| Bank of America Corp. | 200,720 | $ | 3,452,384 | |||||
| Goldman Sachs Group, Inc. | 28,256 | 4,629,746 | ||||||
| JPMorgan Chase & Co. | 135,553 | 8,229,423 | ||||||
| Wells Fargo & Co. | 127,190 | 6,326,431 | ||||||
|
| |||||||
| $ | 22,637,984 | |||||||
| Medical & Health Technology & Services - 1.2% | ||||||||
| Cardinal Health, Inc. | 55,060 | $ | 3,853,099 | |||||
| Medical Equipment - 2.9% | ||||||||
| Abbott Laboratories | 71,350 | $ | 2,747,689 | |||||
| Medtronic, Inc. | 22,100 | 1,360,034 | ||||||
| Thermo Fisher Scientific, Inc. | 44,900 | 5,398,776 | ||||||
|
| |||||||
| $ | 9,506,499 | |||||||
7
Table of Contents
Portfolio of Investments (unaudited) – continued
| Issuer | Shares/Par | Value ($) | ||||||
| Common Stocks - continued | ||||||||
| Network & Telecom - 1.1% | ||||||||
| Qualcomm, Inc. | 44,630 | $ | 3,519,522 | |||||
| Oil Services - 1.2% | ||||||||
| Ensco PLC, “A” | 48,980 | $ | 2,585,164 | |||||
| Halliburton Co. | 24,110 | 1,419,838 | ||||||
|
| |||||||
| $ | 4,005,002 | |||||||
| Other Banks & Diversified Financials - 3.7% | ||||||||
| Citigroup, Inc. | 121,124 | $ | 5,765,502 | |||||
| Discover Financial Services | 85,110 | 4,952,551 | ||||||
| SLM Corp. | 61,180 | 1,497,686 | ||||||
|
| |||||||
| $ | 12,215,739 | |||||||
| Pharmaceuticals - 5.6% | ||||||||
| Bristol-Myers Squibb Co. | 67,370 | $ | 3,499,872 | |||||
| Endo International PLC (a) | 53,070 | 3,643,256 | ||||||
| Johnson & Johnson | 44,605 | 4,381,549 | ||||||
| Pfizer, Inc. | 225,070 | 7,229,248 | ||||||
|
| |||||||
| $ | 18,753,925 | |||||||
| Railroad & Shipping - 1.0% | ||||||||
| Union Pacific Corp. | 18,135 | $ | 3,403,214 | |||||
| Real Estate - 0.4% | ||||||||
| Public Storage, Inc., REIT | 7,150 | $ | 1,204,704 | |||||
| Restaurants - 1.2% | ||||||||
| McDonald’s Corp. | 41,161 | $ | 4,035,013 | |||||
| Specialty Stores - 1.9% | ||||||||
| Advance Auto Parts, Inc. | 25,480 | $ | 3,223,220 | |||||
| AutoZone, Inc. (a) | 4,252 | 2,283,749 | ||||||
| Bed Bath & Beyond, Inc. (a) | 12,670 | 871,696 | ||||||
|
| |||||||
| $ | 6,378,665 | |||||||
| Telecommunications - Wireless - 0.9% | ||||||||
| American Tower Corp., REIT | 37,360 | $ | 3,058,663 | |||||
| Telephone Services - 2.4% | ||||||||
| AT&T, Inc. | 52,274 | $ | 1,833,249 | |||||
| Frontier Communications Corp. | 247,940 | 1,413,258 | ||||||
| Verizon Communications, Inc. | 100,400 | 4,776,028 | ||||||
|
| |||||||
| $ | 8,022,535 | |||||||
8
Table of Contents
Portfolio of Investments (unaudited) – continued
| Issuer | Shares/Par | Value ($) | ||||||
| Common Stocks - continued | ||||||||
| Tobacco - 2.0% | ||||||||
| Lorillard, Inc. | 73,510 | $ | 3,975,421 | |||||
| Philip Morris International, Inc. | 32,520 | 2,662,412 | ||||||
|
| |||||||
| $ | 6,637,833 | |||||||
| Trucking - 1.1% | ||||||||
| United Parcel Service, Inc., “B” | 36,650 | $ | 3,568,977 | |||||
| Utilities - Electric Power - 3.2% | ||||||||
| AES Corp. | 242,080 | $ | 3,456,902 | |||||
| American Electric Power Co., Inc. | 72,660 | 3,680,956 | ||||||
| Edison International | 46,680 | 2,642,555 | ||||||
| Great Plains Energy, Inc. | 27,980 | 756,579 | ||||||
|
| |||||||
| $ | 10,536,992 | |||||||
| Total Common Stocks (Identified Cost, $266,799,752) | $ | 326,892,060 | ||||||
| Money Market Funds - 1.0% | ||||||||
| MFS Institutional Money Market Portfolio, 0.09%, at Cost and Net Asset Value (v) | 3,418,477 | $ | 3,418,477 | |||||
| Total Investments (Identified Cost, $270,218,229) | $ | 330,310,537 | ||||||
| Other Assets, Less Liabilities - 0.4% | 1,166,700 | |||||||
| Net Assets - 100.0% | $ | 331,477,237 | ||||||
| (a) | Non-income producing security. |
| (v) | Underlying affiliated fund that is available only to investment companies managed by MFS. The rate quoted for the MFS Institutional Money Market Portfolio is the annualized seven-day yield of the fund at period end. |
The following abbreviations are used in this report and are defined:
| PLC | Public Limited Company |
| REIT | Real Estate Investment Trust |
See Notes to Financial Statements
9
Table of Contents
Financial Statements
STATEMENT OF ASSETS AND LIABILITIES
At 3/31/14 (unaudited)
This statement represents your fund’s balance sheet, which details the assets and liabilities comprising the total value of the fund.
| Assets | ||||
Investments- | ||||
Non-affiliated issuers, at value (identified cost, $266,799,752) | $326,892,060 | |||
Underlying affiliated funds, at cost and value | 3,418,477 | |||
Total investments, at value (identified cost, $270,218,229) | $330,310,537 | |||
Receivables for | ||||
Fund shares sold | 1,342,823 | |||
Dividends | 223,616 | |||
Other assets | 1,719 | |||
Total assets | $331,878,695 | |||
| Liabilities | ||||
Payable for fund shares reacquired | $172,519 | |||
Payable to affiliates | ||||
Investment adviser | 8,332 | |||
Shareholder servicing costs | 180,509 | |||
Distribution and service fees | 6,331 | |||
Payable for independent Trustees’ compensation | 10 | |||
Accrued expenses and other liabilities | 33,757 | |||
Total liabilities | $401,458 | |||
Net assets | $331,477,237 | |||
| Net assets consist of | ||||
Paid-in capital | $266,229,373 | |||
Unrealized appreciation (depreciation) on investments | 60,092,308 | |||
Accumulated net realized gain (loss) on investments | 4,315,076 | |||
Undistributed net investment income | 840,480 | |||
Net assets | $331,477,237 | |||
Shares of beneficial interest outstanding | 15,508,366 |
10
Table of Contents
Statement of Assets and Liabilities (unaudited) – continued
| Net assets | Shares outstanding | Net asset value per share (a) | ||||||||||
| Class A | $89,623,356 | 4,194,704 | $21.37 | |||||||||
| Class B | 5,757,885 | 276,095 | 20.85 | |||||||||
| Class C | 12,883,541 | 624,918 | 20.62 | |||||||||
| Class I | 99,302,137 | 4,603,039 | 21.57 | |||||||||
| Class R1 | 784,678 | 37,865 | 20.72 | |||||||||
| Class R2 | 9,698,823 | 468,409 | 20.71 | |||||||||
| Class R3 | 56,244,318 | 2,642,443 | 21.28 | |||||||||
| Class R4 | 27,813,724 | 1,300,061 | 21.39 | |||||||||
| Class R5 | 29,368,775 | 1,360,832 | 21.58 | |||||||||
| (a) | Maximum offering price per share was equal to the net asset value per share for all share classes, except for Class A, for which the maximum offering price per share was $22.67 [100 / 94.25 x $21.37]. On sales of $50,000 or more, the maximum offering price of Class A shares is reduced. A contingent deferred sales charge may be imposed on redemptions of Class A, Class B, and Class C shares. Redemption price per share was equal to the net asset value per share for Classes I, R1, R2, R3, R4, and R5. |
See Notes to Financial Statements
11
Table of Contents
Financial Statements
Six months ended 3/31/14 (unaudited)
This statement describes how much your fund earned in investment income and accrued in expenses. It also describes any gains and/or losses generated by fund operations.
| Net investment income | ||||
Income | ||||
Dividends | $2,963,698 | |||
Dividends from underlying affiliated funds | 1,697 | |||
Total investment income | $2,965,395 | |||
Expenses | ||||
Management fee | $879,338 | |||
Distribution and service fees | 266,692 | |||
Shareholder servicing costs | 187,047 | |||
Administrative services fee | 22,754 | |||
Independent Trustees’ compensation | 2,489 | |||
Custodian fee | 17,949 | |||
Shareholder communications | 11,694 | |||
Audit and tax fees | 25,478 | |||
Legal fees | 971 | |||
Miscellaneous | 72,778 | |||
Total expenses | $1,487,190 | |||
Fees paid indirectly | (3 | ) | ||
Reduction of expenses by investment adviser and distributor | (345,733 | ) | ||
Net expenses | $1,141,454 | |||
Net investment income | $1,823,941 | |||
| Realized and unrealized gain (loss) on investments | ||||
Realized gain (loss) on investments (identified cost basis) | $4,433,164 | |||
Change in unrealized appreciation (depreciation) on investments | $31,796,151 | |||
Net realized and unrealized gain (loss) on investments | $36,229,315 | |||
Change in net assets from operations | $38,053,256 | |||
See Notes to Financial Statements
12
Table of Contents
Financial Statements
STATEMENTS OF CHANGES IN NET ASSETS
These statements describe the increases and/or decreases in net assets resulting from operations, any distributions, and any shareholder transactions.
| Change in net assets | Six months ended 3/31/14 (unaudited) | Year ended 9/30/13 | ||||||
| From operations | ||||||||
Net investment income | $1,823,941 | $3,158,324 | ||||||
Net realized gain (loss) on investments | 4,433,164 | 13,324,387 | ||||||
Net unrealized gain (loss) on investments | 31,796,151 | 16,256,383 | ||||||
Change in net assets from operations | $38,053,256 | $32,739,094 | ||||||
| Distributions declared to shareholders | ||||||||
From net investment income | $(3,800,012 | ) | $(1,750,002 | ) | ||||
From net realized gain on investments | (649,081 | ) | — | |||||
Total distributions declared to shareholders | $(4,449,093 | ) | $(1,750,002 | ) | ||||
Change in net assets from fund share transactions | $49,052,519 | $77,933,558 | ||||||
Total change in net assets | $82,656,682 | $108,922,650 | ||||||
| Net assets | ||||||||
At beginning of period | 248,820,555 | 139,897,905 | ||||||
At end of period (including undistributed net investment income of $840,480 and $2,816,551, respectively) | $331,477,237 | $248,820,555 | ||||||
See Notes to Financial Statements
13
Table of Contents
Financial Statements
The financial highlights table is intended to help you understand the fund’s financial performance for the semiannual period and the past 5 fiscal years (or life of a particular share class, if shorter). Certain information reflects financial results for a single fund share. The total returns in the table represent the rate by which an investor would have earned (or lost) on an investment in the fund share class (assuming reinvestment of all distributions) held for the entire period.
Six months 3/31/14 | Years ended 9/30 | |||||||||||||||||||||||
| Class A | 2013 | 2012 | 2011 | 2010 | 2009 | |||||||||||||||||||
| (unaudited) | ||||||||||||||||||||||||
Net asset value, beginning of period | $18.95 | $16.11 | $12.53 | $12.47 | $11.59 | $12.61 | ||||||||||||||||||
| Income (loss) from investment operations | ||||||||||||||||||||||||
Net investment income (d) | $0.12 | $0.28 | $0.22 | $0.20 | $0.16 | $0.17 | ||||||||||||||||||
Net realized and unrealized gain | 2.61 | 2.74 | 3.45 | (0.01 | )(g) | 1.09 | (1.09 | ) | ||||||||||||||||
Total from investment operations | $2.73 | $3.02 | $3.67 | $0.19 | $1.25 | $(0.92 | ) | |||||||||||||||||
| Less distributions declared to shareholders | ||||||||||||||||||||||||
From net investment income | $(0.26 | ) | $(0.18 | ) | $(0.09 | ) | $(0.13 | ) | $(0.37 | ) | $(0.06 | ) | ||||||||||||
From net realized gain on | (0.05 | ) | — | — | — | — | (0.04 | ) | ||||||||||||||||
Total distributions declared to | $(0.31 | ) | $(0.18 | ) | $(0.09 | ) | $(0.13 | ) | $(0.37 | ) | $(0.10 | ) | ||||||||||||
Net asset value, end of period (x) | $21.37 | $18.95 | $16.11 | $12.53 | $12.47 | $11.59 | ||||||||||||||||||
Total return (%) (r)(s)(t)(x) | 14.46 | (n) | 18.93 | 29.45 | 1.45 | 10.96 | (7.13 | ) | ||||||||||||||||
| Ratios (%) (to average net assets) and Supplemental data: | ||||||||||||||||||||||||
Expenses before expense reductions (f) | 1.09 | (a) | 1.16 | 1.31 | 1.67 | 2.17 | 1.85 | |||||||||||||||||
Expenses after expense reductions (f) | 0.85 | (a) | 0.86 | 0.90 | 0.90 | 0.88 | 0.88 | |||||||||||||||||
Net investment income | 1.17 | (a) | 1.62 | 1.46 | 1.40 | 1.30 | 1.78 | |||||||||||||||||
Portfolio turnover | 16 | (n) | 54 | 59 | 92 | 77 | 71 | |||||||||||||||||
Net assets at end of period | $89,623 | $64,739 | $42,149 | $19,238 | $13,018 | $11,473 | ||||||||||||||||||
See Notes to Financial Statements
14
Table of Contents
Financial Highlights – continued
Six months 3/31/14 | Years ended 9/30 | |||||||||||||||||||||||
| Class B | 2013 | 2012 | 2011 | 2010 | 2009 | |||||||||||||||||||
| (unaudited) | ||||||||||||||||||||||||
Net asset value, beginning of period | $18.46 | $15.72 | $12.24 | $12.18 | $11.33 | $12.38 | ||||||||||||||||||
| Income (loss) from investment operations | ||||||||||||||||||||||||
Net investment income (d) | $0.04 | $0.15 | $0.10 | $0.09 | $0.07 | $0.10 | ||||||||||||||||||
Net realized and unrealized gain | 2.55 | 2.67 | 3.38 | (0.00 | )(g)(w) | 1.06 | (1.08 | ) | ||||||||||||||||
Total from investment operations | $2.59 | $2.82 | $3.48 | $0.09 | $1.13 | $(0.98 | ) | |||||||||||||||||
| Less distributions declared to shareholders | ||||||||||||||||||||||||
From net investment income | $(0.15 | ) | $(0.08 | ) | $— | $(0.03 | ) | $(0.28 | ) | $(0.03 | ) | |||||||||||||
From net realized gain on | (0.05 | ) | — | — | — | — | (0.04 | ) | ||||||||||||||||
Total distributions declared to | $(0.20 | ) | $(0.08 | ) | $— | $(0.03 | ) | $(0.28 | ) | $(0.07 | ) | |||||||||||||
Net asset value, end of period (x) | $20.85 | $18.46 | $15.72 | $12.24 | $12.18 | $11.33 | ||||||||||||||||||
Total return (%) (r)(s)(t)(x) | 14.04 | (n) | 18.03 | 28.43 | 0.74 | 10.14 | (7.84 | ) | ||||||||||||||||
| Ratios (%) (to average net assets) and Supplemental data: | ||||||||||||||||||||||||
Expenses before expense reductions (f) | 1.84 | (a) | 1.91 | 2.06 | 2.44 | 2.92 | 2.59 | |||||||||||||||||
Expenses after expense reductions (f) | 1.60 | (a) | 1.61 | 1.65 | 1.65 | 1.63 | 1.60 | |||||||||||||||||
Net investment income | 0.43 | (a) | 0.86 | 0.68 | 0.68 | 0.55 | 1.06 | |||||||||||||||||
Portfolio turnover | 16 | (n) | 54 | 59 | 92 | 77 | 71 | |||||||||||||||||
Net assets at end of period | $5,758 | $4,149 | $2,631 | $1,444 | $1,554 | $1,440 | ||||||||||||||||||
See Notes to Financial Statements
15
Table of Contents
Financial Highlights – continued
Six months 3/31/14 | Years ended 9/30 | |||||||||||||||||||||||
| Class C | 2013 | 2012 | 2011 | 2010 | 2009 | |||||||||||||||||||
| (unaudited) | ||||||||||||||||||||||||
Net asset value, beginning of period | $18.27 | $15.58 | $12.13 | $12.07 | $11.25 | $12.29 | ||||||||||||||||||
| Income (loss) from investment operations | ||||||||||||||||||||||||
Net investment income (d) | $0.04 | $0.14 | $0.10 | $0.09 | $0.06 | $0.10 | ||||||||||||||||||
Net realized and unrealized gain | 2.53 | 2.64 | 3.35 | 0.01 | (g) | 1.06 | (1.07 | ) | ||||||||||||||||
Total from investment operations | $2.57 | $2.78 | $3.45 | $0.10 | $1.12 | $(0.97 | ) | |||||||||||||||||
| Less distributions declared to shareholders | ||||||||||||||||||||||||
From net investment income | $(0.17 | ) | $(0.09 | ) | $— | $(0.04 | ) | $(0.30 | ) | $(0.03 | ) | |||||||||||||
From net realized gain on | (0.05 | ) | — | — | — | — | (0.04 | ) | ||||||||||||||||
Total distributions declared to | $(0.22 | ) | $(0.09 | ) | $— | $(0.04 | ) | $(0.30 | ) | $(0.07 | ) | |||||||||||||
Net asset value, end of period (x) | $20.62 | $18.27 | $15.58 | $12.13 | $12.07 | $11.25 | ||||||||||||||||||
Total return (%) (r)(s)(t)(x) | 14.08 | (n) | 17.98 | 28.44 | 0.77 | 10.12 | (7.81 | ) | ||||||||||||||||
| Ratios (%) (to average net assets) and Supplemental data: | ||||||||||||||||||||||||
Expenses before expense reductions (f) | 1.84 | (a) | 1.91 | 2.06 | 2.44 | 2.92 | 2.59 | |||||||||||||||||
Expenses after expense reductions (f) | 1.60 | (a) | 1.61 | 1.65 | 1.65 | 1.63 | 1.60 | |||||||||||||||||
Net investment income | 0.42 | (a) | 0.81 | 0.70 | 0.67 | 0.55 | 1.03 | |||||||||||||||||
Portfolio turnover | 16 | (n) | 54 | 59 | 92 | 77 | 71 | |||||||||||||||||
Net assets at end of period | $12,884 | $8,443 | $3,986 | $1,586 | $1,525 | $1,476 | ||||||||||||||||||
See Notes to Financial Statements
16
Table of Contents
Financial Highlights – continued
Six months 3/31/14 | Years ended 9/30 | |||||||||||||||||||||||
| Class I | 2013 | 2012 | 2011 | 2010 | 2009 | |||||||||||||||||||
| (unaudited) | ||||||||||||||||||||||||
Net asset value, beginning of period | $19.14 | $16.27 | $12.64 | $12.57 | $11.69 | $12.73 | ||||||||||||||||||
| Income (loss) from investment operations | ||||||||||||||||||||||||
Net investment income (d) | $0.15 | $0.32 | $0.26 | $0.23 | $0.19 | $0.22 | ||||||||||||||||||
Net realized and unrealized gain | 2.63 | 2.76 | 3.49 | (0.00 | )(g)(w) | 1.09 | (1.14 | ) | ||||||||||||||||
Total from investment operations | $2.78 | $3.08 | $3.75 | $0.23 | $1.28 | $(0.92 | ) | |||||||||||||||||
| Less distributions declared to shareholders | ||||||||||||||||||||||||
From net investment income | $(0.30 | ) | $(0.21 | ) | $(0.12 | ) | $(0.16 | ) | $(0.40 | ) | $(0.08 | ) | ||||||||||||
From net realized gain on | (0.05 | ) | — | — | — | — | (0.04 | ) | ||||||||||||||||
Total distributions declared to | $(0.35 | ) | $(0.21 | ) | $(0.12 | ) | $(0.16 | ) | $(0.40 | ) | $(0.12 | ) | ||||||||||||
Net asset value, end of period (x) | $21.57 | $19.14 | $16.27 | $12.64 | $12.57 | $11.69 | ||||||||||||||||||
Total return (%) (r)(s)(x) | 14.61 | (n) | 19.17 | 29.80 | 1.73 | 11.21 | (7.07 | ) | ||||||||||||||||
| Ratios (%) (to average net assets) and Supplemental data: | ||||||||||||||||||||||||
Expenses before expense reductions (f) | 0.84 | (a) | 0.91 | 1.06 | 1.38 | 1.87 | 1.51 | |||||||||||||||||
Expenses after expense reductions (f) | 0.60 | (a) | 0.61 | 0.65 | 0.65 | 0.64 | 0.60 | |||||||||||||||||
Net investment income | 1.43 | (a) | 1.79 | 1.71 | 1.67 | 1.55 | 2.34 | |||||||||||||||||
Portfolio turnover | 16 | (n) | 54 | 59 | 92 | 77 | 71 | |||||||||||||||||
Net assets at end of period | $99,302 | $83,157 | $39,555 | $20,260 | $4,503 | $1,163 | ||||||||||||||||||
See Notes to Financial Statements
17
Table of Contents
Financial Highlights – continued
Six months 3/31/14 | Years ended 9/30 | |||||||||||||||||||||||
| Class R1 | 2013 | 2012 | 2011 | 2010 | 2009 | |||||||||||||||||||
| (unaudited) | ||||||||||||||||||||||||
Net asset value, beginning of period | $18.34 | $15.61 | $12.15 | $12.10 | $11.29 | $12.38 | ||||||||||||||||||
| Income (loss) from investment operations | ||||||||||||||||||||||||
Net investment income (d) | $0.04 | $0.12 | $0.10 | $0.09 | $0.07 | $0.10 | ||||||||||||||||||
Net realized and unrealized gain | 2.53 | 2.68 | 3.36 | (0.00 | )(g)(w) | 1.05 | (1.08 | ) | ||||||||||||||||
Total from investment operations | $2.57 | $2.80 | $3.46 | $0.09 | $1.12 | $(0.98 | ) | |||||||||||||||||
| Less distributions declared to shareholders | ||||||||||||||||||||||||
From net investment income | $(0.14 | ) | $(0.07 | ) | $— | $(0.04 | ) | $(0.31 | ) | $(0.07 | ) | |||||||||||||
From net realized gain on | (0.05 | ) | — | — | — | — | (0.04 | ) | ||||||||||||||||
Total distributions declared to | $(0.19 | ) | $(0.07 | ) | $— | $(0.04 | ) | $(0.31 | ) | $(0.11 | ) | |||||||||||||
Net asset value, end of period (x) | $20.72 | $18.34 | $15.61 | $12.15 | $12.10 | $11.29 | ||||||||||||||||||
Total return (%) (r)(s)(x) | 14.03 | (n) | 18.03 | 28.48 | 0.73 | 10.05 | (7.78 | ) | ||||||||||||||||
| Ratios (%) (to average net assets) and Supplemental data: | ||||||||||||||||||||||||
Expenses before expense reductions (f) | 1.84 | (a) | 1.91 | 2.06 | 2.42 | 2.92 | 2.60 | |||||||||||||||||
Expenses after expense reductions (f) | 1.60 | (a) | 1.61 | 1.65 | 1.65 | 1.63 | 1.60 | |||||||||||||||||
Net investment income | 0.43 | (a) | 0.67 | 0.69 | 0.69 | 0.55 | 1.02 | |||||||||||||||||
Portfolio turnover | 16 | (n) | 54 | 59 | 92 | 77 | 71 | |||||||||||||||||
Net assets at end of period | $785 | $662 | $160 | $119 | $92 | $83 | ||||||||||||||||||
See Notes to Financial Statements
18
Table of Contents
Financial Highlights – continued
Six months 3/31/14 | Years ended 9/30 | |||||||||||||||||||||||
| Class R2 | 2013 | 2012 | 2011 | 2010 | 2009 | |||||||||||||||||||
| (unaudited) | ||||||||||||||||||||||||
Net asset value, beginning of period | $18.36 | $15.64 | $12.19 | $12.17 | $11.34 | $12.38 | ||||||||||||||||||
| Income (loss) from investment operations | ||||||||||||||||||||||||
Net investment income (d) | $0.09 | $0.22 | $0.17 | $0.14 | $0.12 | $0.15 | ||||||||||||||||||
Net realized and unrealized gain | 2.53 | 2.66 | 3.37 | 0.02 | (g) | 1.07 | (1.08 | ) | ||||||||||||||||
Total from investment operations | $2.62 | $2.88 | $3.54 | $0.16 | $1.19 | $(0.93 | ) | |||||||||||||||||
| Less distributions declared to shareholders | ||||||||||||||||||||||||
From net investment income | $(0.22 | ) | $(0.16 | ) | $(0.09 | ) | $(0.14 | ) | $(0.36 | ) | $(0.07 | ) | ||||||||||||
From net realized gain on | (0.05 | ) | — | — | — | — | (0.04 | ) | ||||||||||||||||
Total distributions declared to | $(0.27 | ) | $(0.16 | ) | $(0.09 | ) | $(0.14 | ) | $(0.36 | ) | $(0.11 | ) | ||||||||||||
Net asset value, end of period (x) | $20.71 | $18.36 | $15.64 | $12.19 | $12.17 | $11.34 | ||||||||||||||||||
Total return (%) (r)(s)(x) | 14.34 | (n) | 18.62 | 29.15 | 1.25 | 10.65 | (7.32 | ) | ||||||||||||||||
| Ratios (%) (to average net assets) and Supplemental data: | ||||||||||||||||||||||||
Expenses before expense reductions (f) | 1.34 | (a) | 1.41 | 1.56 | 1.87 | 2.42 | 2.10 | |||||||||||||||||
Expenses after expense reductions (f) | 1.10 | (a) | 1.11 | 1.15 | 1.15 | 1.13 | 1.10 | |||||||||||||||||
Net investment income | 0.93 | (a) | 1.27 | 1.20 | 1.07 | 1.05 | 1.52 | |||||||||||||||||
Portfolio turnover | 16 | (n) | 54 | 59 | 92 | 77 | 71 | |||||||||||||||||
Net assets at end of period | $9,699 | $7,030 | $2,968 | $1,587 | $93 | $84 | ||||||||||||||||||
See Notes to Financial Statements
19
Table of Contents
Financial Highlights – continued
Six months 3/31/14 | Years ended 9/30 | |||||||||||||||||||||||
| Class R3 | 2013 | 2012 | 2011 | 2010 | 2009 | |||||||||||||||||||
| (unaudited) | ||||||||||||||||||||||||
Net asset value, beginning of period | $18.88 | $16.06 | $12.50 | $12.43 | $11.57 | $12.60 | ||||||||||||||||||
| Income (loss) from investment operations | ||||||||||||||||||||||||
Net investment income (d) | $0.12 | $0.27 | $0.22 | $0.18 | $0.16 | $0.17 | ||||||||||||||||||
Net realized and unrealized gain | 2.59 | 2.73 | 3.44 | 0.02 | (g) | 1.08 | (1.08 | ) | ||||||||||||||||
Total from investment operations | $2.71 | $3.00 | $3.66 | $0.20 | $1.24 | $(0.91 | ) | |||||||||||||||||
| Less distributions declared to shareholders | ||||||||||||||||||||||||
From net investment income | $(0.26 | ) | $(0.18 | ) | $(0.10 | ) | $(0.13 | ) | $(0.38 | ) | $(0.08 | ) | ||||||||||||
From net realized gain on | (0.05 | ) | — | — | — | — | (0.04 | ) | ||||||||||||||||
Total distributions declared to | $(0.31 | ) | $(0.18 | ) | $(0.10 | ) | $(0.13 | ) | $(0.38 | ) | $(0.12 | ) | ||||||||||||
Net asset value, end of period (x) | $21.28 | $18.88 | $16.06 | $12.50 | $12.43 | $11.57 | ||||||||||||||||||
Total return (%) (r)(s)(x) | 14.41 | (n) | 18.92 | 29.45 | 1.53 | 10.92 | (7.09 | ) | ||||||||||||||||
| Ratios (%) (to average net assets) and Supplemental data: | ||||||||||||||||||||||||
Expenses before expense reductions (f) | 1.09 | (a) | 1.16 | 1.31 | 1.51 | 2.17 | 1.85 | |||||||||||||||||
Expenses after expense reductions (f) | 0.85 | (a) | 0.86 | 0.90 | 0.90 | 0.89 | 0.85 | |||||||||||||||||
Net investment income | 1.18 | (a) | 1.57 | 1.47 | 1.32 | 1.30 | 1.77 | |||||||||||||||||
Portfolio turnover | 16 | (n) | 54 | 59 | 92 | 77 | 71 | |||||||||||||||||
Net assets at end of period | $56,244 | $49,967 | $28,576 | $7,016 | $93 | $84 | ||||||||||||||||||
See Notes to Financial Statements
20
Table of Contents
Financial Highlights – continued
Six months 3/31/14 | Years ended 9/30 | |||||||||||||||||||||||
| Class R4 | 2013 | 2012 | 2011 | 2010 | 2009 | |||||||||||||||||||
| (unaudited) | ||||||||||||||||||||||||
Net asset value, beginning of period | $18.98 | $16.13 | $12.54 | $12.47 | $11.60 | $12.61 | ||||||||||||||||||
| Income (loss) from investment operations | ||||||||||||||||||||||||
Net investment income (d) | $0.15 | $0.33 | $0.25 | $0.20 | $0.19 | $0.20 | ||||||||||||||||||
Net realized and unrealized gain | 2.61 | 2.73 | 3.46 | 0.03 | (g) | 1.08 | (1.09 | ) | ||||||||||||||||
Total from investment operations | $2.76 | $3.06 | $3.71 | $0.23 | $1.27 | $(0.89 | ) | |||||||||||||||||
| Less distributions declared to shareholders | ||||||||||||||||||||||||
From net investment income | $(0.30 | ) | $(0.21 | ) | $(0.12 | ) | $(0.16 | ) | $(0.40 | ) | $(0.08 | ) | ||||||||||||
From net realized gain on | (0.05 | ) | — | — | — | — | (0.04 | ) | ||||||||||||||||
Total distributions declared to | $(0.35 | ) | $(0.21 | ) | $(0.12 | ) | $(0.16 | ) | $(0.40 | ) | $(0.12 | ) | ||||||||||||
Net asset value, end of period (x) | $21.39 | $18.98 | $16.13 | $12.54 | $12.47 | $11.60 | ||||||||||||||||||
Total return (%) (r)(s)(x) | 14.60 | (n) | 19.21 | 29.72 | 1.75 | 11.21 | (6.89 | ) | ||||||||||||||||
| Ratios (%) (to average net assets) and Supplemental data: | ||||||||||||||||||||||||
Expenses before expense reductions (f) | 0.84 | (a) | 0.90 | 1.06 | 1.30 | 1.92 | 1.60 | |||||||||||||||||
Expenses after expense reductions (f) | 0.60 | (a) | 0.62 | 0.65 | 0.65 | 0.63 | 0.60 | |||||||||||||||||
Net investment income | 1.43 | (a) | 1.89 | 1.68 | 1.46 | 1.55 | 2.01 | |||||||||||||||||
Portfolio turnover | 16 | (n) | 54 | 59 | 92 | 77 | 71 | |||||||||||||||||
Net assets at end of period | $27,814 | $21,751 | $19,762 | $8,014 | $94 | $84 | ||||||||||||||||||
See Notes to Financial Statements
21
Table of Contents
Financial Highlights – continued
Six months 3/31/14 | Years ended 9/30 | |||||||||||
| Class R5 | 2013 | 2012 (i) | ||||||||||
| (unaudited) | ||||||||||||
Net asset value, beginning of period | $19.16 | $16.27 | $14.64 | |||||||||
| Income (loss) from investment operations | ||||||||||||
Net investment income (d) | $0.14 | $0.30 | $0.09 | |||||||||
Net realized and unrealized gain (loss) on investments and | 2.65 | 2.80 | 1.54 | (g) | ||||||||
Total from investment operations | $2.79 | $3.10 | $1.63 | |||||||||
| Less distributions declared to shareholders | ||||||||||||
From net investment income | $(0.32 | ) | $(0.21 | ) | $— | |||||||
From net realized gain on investments | (0.05 | ) | — | — | ||||||||
Total distributions declared to shareholders | $(0.37 | ) | $(0.21 | ) | $— | |||||||
Net asset value, end of period (x) | $21.58 | $19.16 | $16.27 | |||||||||
Total return (%) (r)(s)(x) | 14.64 | (n) | 19.34 | 11.13 | (n) | |||||||
| Ratios (%) (to average net assets) and Supplemental data: | ||||||||||||
Expenses before expense reductions (f) | 0.74 | (a) | 0.78 | 0.98 | (a) | |||||||
Expenses after expense reductions (f) | 0.50 | (a) | 0.48 | 0.58 | (a) | |||||||
Net investment income | 1.37 | (a) | 1.61 | 1.65 | (a) | |||||||
Portfolio turnover | 16 | (n) | 54 | 59 | ||||||||
Net assets at end of period (000 omitted) | $29,369 | $8,922 | $111 | |||||||||
| (a) | Annualized. |
| (d) | Per share data is based on average shares outstanding. |
| (f) | Ratios do not reflect reductions from fees paid indirectly, if applicable. |
| (g) | The per share amount varies from the net realized and unrealized gain/loss for the period because of the timing of sales of fund shares and the per share amount of realized and unrealized gains and losses at such time. |
| (i) | For the period from the class inception, June 1, 2012, through the stated period end. |
| (n) | Not annualized. |
| (r) | Certain expenses have been reduced without which performance would have been lower. |
| (s) | From time to time the fund may receive proceeds from litigation settlements, without which performance would be lower. |
| (t) | Total returns do not include any applicable sales charges. |
| (w) | Per share amount was less than $0.01. |
| (x) | The net asset values per share and total returns have been calculated on net assets which include adjustments made in accordance with U.S. generally accepted accounting principles required at period end for financial reporting purposes. |
See Notes to Financial Statements
22
Table of Contents
(unaudited)
(1) Business and Organization
MFS Blended Research Core Equity Fund (the fund) is a diversified series of MFS Series Trust XI (the trust). The trust is organized as a Massachusetts business trust and is registered under the Investment Company Act of 1940, as amended, as an open-end management investment company.
The fund is an investment company and accordingly follows the investment company accounting and reporting guidance of the Financial Accounting Standards Board (FASB) Accounting Standard Codification Topic 946 Financial Services – Investment Companies.
(2) Significant Accounting Policies
General – The preparation of financial statements in conformity with U.S. generally accepted accounting principles requires management to make estimates and assumptions that affect the reported amounts of assets and liabilities, and disclosure of contingent assets and liabilities at the date of the financial statements and the reported amounts of increases and decreases in net assets from operations during the reporting period. Actual results could differ from those estimates. In the preparation of these financial statements, management has evaluated subsequent events occurring after the date of the fund’s Statement of Assets and Liabilities through the date that the financial statements were issued.
In this reporting period, the fund adopted the disclosure provisions of FASB Accounting Standards Update 2011-11 (“ASU 2011-11”), Balance Sheet (Topic 210) – Disclosures about Offsetting Assets and Liabilities along with the related scope clarification provisions of FASB Accounting Standards Update 2013-01 (“ASU 2013-01”) entitled Balance Sheet (Topic 210) – Clarifying the Scope of Disclosures about Offsetting Assets and Liabilities. ASU 2011-11 is intended to enhance disclosures on the offsetting of financial assets and liabilities by requiring entities to disclose both gross and net information about financial instruments and transactions that are either offset in the statement of financial position or subject to an enforceable Master Netting Agreement or similar arrangement. ASU 2013-01 limits the scope of ASU 2011-11’s disclosure requirements on offsetting to financial assets and financial liabilities related to derivatives, repurchase and reverse repurchase agreements, and securities lending and securities borrowing transactions. The disclosures required by ASU 2011-11, to the extent applicable to the fund, have been included in the fund’s Significant Accounting Policies note under the captions for each of the fund’s in-scope financial instruments and transactions.
Investment Valuations – Equity securities, including restricted equity securities, are generally valued at the last sale or official closing price as provided by a third-party pricing service on the market or exchange on which they are primarily traded. Equity securities, for which there were no sales reported that day, are generally valued at the last quoted daily bid quotation as provided by a third-party pricing service on the market or exchange on which such securities are primarily traded. Short-term instruments with a maturity at issuance of 60 days or less generally are valued at amortized cost, which approximates market value. Open-end investment companies are generally valued at net asset value per share. Securities and other assets generally
23
Table of Contents
Notes to Financial Statements (unaudited) – continued
valued on the basis of information from a third-party pricing service may also be valued at a broker/dealer bid quotation. Values obtained from third-party pricing services can utilize both transaction data and market information such as yield, quality, coupon rate, maturity, type of issue, trading characteristics, and other market data.
The Board of Trustees has delegated primary responsibility for determining or causing to be determined the value of the fund’s investments (including any fair valuation) to the adviser pursuant to valuation policies and procedures approved by the Board. If the adviser determines that reliable market quotations are not readily available, investments are valued at fair value as determined in good faith by the adviser in accordance with such procedures under the oversight of the Board of Trustees. Under the fund’s valuation policies and procedures, market quotations are not considered to be readily available for most types of debt instruments and floating rate loans and many types of derivatives. These investments are generally valued at fair value based on information from third-party pricing services. In addition, investments may be valued at fair value if the adviser determines that an investment’s value has been materially affected by events occurring after the close of the exchange or market on which the investment is principally traded (such as foreign exchange or market) and prior to the determination of the fund’s net asset value, or after the halting of trading of a specific security where trading does not resume prior to the close of the exchange or market on which the security is principally traded. Events that occur on a frequent basis after foreign markets close (such as developments in foreign markets and significant movements in the U.S. markets) and prior to the determination of the fund’s net asset value may be deemed to have a material effect on the value of securities traded in foreign markets. Accordingly, the fund’s foreign equity securities may often be valued at fair value. The adviser generally relies on third-party pricing services or other information (such as the correlation with price movements of similar securities in the same or other markets; the type, cost and investment characteristics of the security; the business and financial condition of the issuer; and trading and other market data) to assist in determining whether to fair value and at what value to fair value an investment. The value of an investment for purposes of calculating the fund’s net asset value can differ depending on the source and method used to determine value. When fair valuation is used, the value of an investment used to determine the fund’s net asset value may differ from quoted or published prices for the same investment. There can be no assurance that the fund could obtain the fair value assigned to an investment if it were to sell the investment at the same time at which the fund determines its net asset value per share.
Various inputs are used in determining the value of the fund’s assets or liabilities. These inputs are categorized into three broad levels. In certain cases, the inputs used to measure fair value may fall into different levels of the fair value hierarchy. In such cases, an investment’s level within the fair value hierarchy is based on the lowest level of input that is significant to the fair value measurement. The fund’s assessment of the significance of a particular input to the fair value measurement in its entirety requires judgment, and considers factors specific to the investment. Level 1 includes unadjusted quoted prices in active markets for identical assets or liabilities. Level 2 includes other significant observable market-based inputs (including quoted prices for similar securities, interest rates, prepayment speed, and credit risk). Level 3 includes unobservable inputs, which may include the adviser’s own assumptions in determining
24
Table of Contents
Notes to Financial Statements (unaudited) – continued
the fair value of investments. The following is a summary of the levels used as of March 31, 2014 in valuing the fund’s assets or liabilities:
| Investments at Value | Level 1 | Level 2 | Level 3 | Total | ||||||||||||
| Equity Securities | $326,892,060 | $— | $— | $326,892,060 | ||||||||||||
| Mutual Funds | 3,418,477 | — | — | 3,418,477 | ||||||||||||
| Total Investments | $330,310,537 | $— | $— | $330,310,537 | ||||||||||||
For further information regarding security characteristics, see the Portfolio of Investments.
Indemnifications – Under the fund’s organizational documents, its officers and Trustees may be indemnified against certain liabilities and expenses arising out of the performance of their duties to the fund. Additionally, in the normal course of business, the fund enters into agreements with service providers that may contain indemnification clauses. The fund’s maximum exposure under these agreements is unknown as this would involve future claims that may be made against the fund that have not yet occurred.
Investment Transactions and Income – Investment transactions are recorded on the trade date. Dividends received in cash are recorded on the ex-dividend date. Certain dividends from foreign securities will be recorded when the fund is informed of the dividend if such information is obtained subsequent to the ex-dividend date. Dividend payments received in additional securities are recorded on the ex-dividend date in an amount equal to the value of the security on such date.
The fund may receive proceeds from litigation settlements. Any proceeds received from litigation involving portfolio holdings are reflected in the Statement of Operations in realized gain/loss if the security has been disposed of by the fund or in unrealized gain/loss if the security is still held by the fund. Any other proceeds from litigation not related to portfolio holdings are reflected as other income in the Statement of Operations.
Fees Paid Indirectly – The fund’s custody fee may be reduced according to an arrangement that measures the value of cash deposited with the custodian by the fund. This amount, for the six months ended March 31, 2014, is shown as a reduction of total expenses in the Statement of Operations.
Tax Matters and Distributions – The fund intends to qualify as a regulated investment company, as defined under Subchapter M of the Internal Revenue Code, and to distribute all of its taxable income, including realized capital gains. As a result, no provision for federal income tax is required. The fund’s federal tax returns, when filed, will remain subject to examination by the Internal Revenue Service for a three year period. Management has analyzed the fund’s tax positions taken on federal and state tax returns for all open tax years and does not believe that there are any uncertain tax positions that require recognition of a tax liability. Foreign taxes, if any, have been accrued by the fund in the accompanying financial statements in accordance with the applicable foreign tax law. Foreign income taxes may be withheld by certain countries in which the fund invests. Additionally, capital gains realized by the fund on securities issued in or by certain foreign countries may be subject to capital gains tax imposed by those countries.
25
Table of Contents
Notes to Financial Statements (unaudited) – continued
Distributions to shareholders are recorded on the ex-dividend date. Income and capital gain distributions are determined in accordance with income tax regulations, which may differ from U.S. generally accepted accounting principles. Certain capital accounts in the financial statements are periodically adjusted for permanent differences in order to reflect their tax character. These adjustments have no impact on net assets or net asset value per share. Temporary differences which arise from recognizing certain items of income, expense, gain or loss in different periods for financial statement and tax purposes will reverse at some time in the future. Distributions in excess of net investment income or net realized gains are temporary overdistributions for financial statement purposes resulting from differences in the recognition or classification of income or distributions for financial statement and tax purposes.
Book/tax differences primarily relate to wash sale loss deferrals.
The tax character of distributions made during the current period will be determined at fiscal year end. The tax character of distributions declared to shareholders for the last fiscal year is as follows:
| 9/30/13 | ||||
| Ordinary income (including any short-term capital gains) | $1,750,002 | |||
The federal tax cost and the tax basis components of distributable earnings were as follows:
| As of 3/31/14 | ||||
| Cost of investments | $270,335,751 | |||
| Gross appreciation | 61,921,288 | |||
| Gross depreciation | (1,946,502 | ) | ||
| Net unrealized appreciation (depreciation) | $59,974,786 | |||
| As of 9/30/13 | ||||
| Undistributed ordinary income | 2,816,551 | |||
| Undistributed long-term capital gain | 648,515 | |||
| Net unrealized appreciation (depreciation) | 28,178,635 | |||
The aggregate cost above includes prior fiscal year end tax adjustments, if applicable.
Multiple Classes of Shares of Beneficial Interest – The fund offers multiple classes of shares, which differ in their respective distribution and service fees. The fund’s income, realized and unrealized gain (loss), and common expenses are allocated to shareholders based on the daily net assets of each class. Dividends are declared separately for each class. Differences in per share dividend rates are generally due to differences in separate class expenses. Class B shares will convert to Class A shares
26
Table of Contents
Notes to Financial Statements (unaudited) – continued
approximately eight years after purchase. The fund’s distributions declared to shareholders as reported in the Statements of Changes in Net Assets are presented by class as follows:
| From net investment income | From net realized gain on investments | |||||||||||||||
| Six months ended 3/31/14 | Year ended 9/30/13 | Six months ended 3/31/14 | Year ended 9/30/13 | |||||||||||||
| Class A | $944,549 | $516,538 | $169,324 | $— | ||||||||||||
| Class B | 35,412 | 14,794 | 11,324 | — | ||||||||||||
| Class C | 86,075 | 25,836 | 24,174 | — | ||||||||||||
| Class I | 1,443,660 | 548,053 | 222,193 | — | ||||||||||||
| Class R1 | 5,066 | 795 | 1,707 | — | ||||||||||||
| Class R2 | 96,330 | 39,453 | 20,127 | — | ||||||||||||
| Class R3 | 688,130 | 332,907 | 123,551 | — | ||||||||||||
| Class R4 | 344,831 | 270,159 | 54,064 | — | ||||||||||||
| Class R5 | 155,959 | 1,467 | 22,617 | — | ||||||||||||
| Total | $3,800,012 | $1,750,002 | $649,081 | $— | ||||||||||||
(3) Transactions with Affiliates
Investment Adviser – The fund has an investment advisory agreement with MFS to provide overall investment management and related administrative services and facilities to the fund. The management fee is computed daily and paid monthly at an annual rate of 0.60% of the fund’s average daily net assets. The investment adviser has agreed in writing to reduce its management fee to 0.40% of the fund’s average daily net assets annually. This written agreement will continue until modified by the fund’s Board of Trustees, but such agreement will continue at least until January 31, 2015. For the six months ended March 31, 2014, this management fee reduction amounted to $293,113, which is included in the reduction of total expenses in the Statement of Operations. The management fee incurred for the six months ended March 31, 2014 was equivalent to an annual effective rate of 0.40% of the fund’s average daily net assets.
The investment adviser has agreed in writing to pay a portion of the fund’s total annual operating expenses, exclusive of interest, taxes, extraordinary expenses, brokerage and transaction costs, and investment-related expenses, such that total fund operating expenses do not exceed the following rates annually of each class’s average daily net assets:
| Classes | ||||||||||||||||||||||||||||||||
| A | B | C | I | R1 | R2 | R3 | R4 | R5 | ||||||||||||||||||||||||
| 0.85% | 1.60% | 1.60% | 0.60% | 1.60% | 1.10% | 0.85% | 0.60% | 0.53% | ||||||||||||||||||||||||
This written agreement will continue until modified by the fund’s Board of Trustees, but such agreement will continue at least until January 31, 2015. For the six months ended March 31, 2014, this reduction amounted to $52,005 and is included in the reduction of total expenses in the Statement of Operations.
27
Table of Contents
Notes to Financial Statements (unaudited) – continued
Distributor – MFS Fund Distributors, Inc. (MFD), a wholly-owned subsidiary of MFS, as distributor, received $36,965 for the six months ended March 31, 2014, as its portion of the initial sales charge on sales of Class A shares of the fund.
The Board of Trustees has adopted a distribution plan for certain share classes pursuant to Rule 12b-1 of the Investment Company Act of 1940.
The fund’s distribution plan provides that the fund will pay MFD for services provided by MFD and financial intermediaries in connection with the distribution and servicing of certain share classes. One component of the plan is a distribution fee paid to MFD and another component of the plan is a service fee paid to MFD. MFD may subsequently pay all, or a portion, of the distribution and/or service fees to financial intermediaries.
Distribution Plan Fee Table:
| Distribution Fee Rate (d) | Service Fee Rate (d) | Total Distribution Plan (d) | Annual Effective Rate (e) | Distribution and Service Fee | ||||||||||||||||
| Class A | — | 0.25% | 0.25% | 0.25% | $95,602 | |||||||||||||||
| Class B | 0.75% | 0.25% | 1.00% | 1.00% | 24,707 | |||||||||||||||
| Class C | 0.75% | 0.25% | 1.00% | 1.00% | 53,335 | |||||||||||||||
| Class R1 | 0.75% | 0.25% | 1.00% | 1.00% | 3,680 | |||||||||||||||
| Class R2 | 0.25% | 0.25% | 0.50% | 0.50% | 21,918 | |||||||||||||||
| Class R3 | — | 0.25% | 0.25% | 0.25% | 67,450 | |||||||||||||||
| Total Distribution and Service Fees | $266,692 | |||||||||||||||||||
| (d) | In accordance with the distribution plan for certain classes, the fund pays distribution and/or service fees equal to these annual percentage rates of each class’s average daily net assets. The distribution and service fee rates disclosed by class represent the current rates in effect at the end of the reporting period. Any rate changes, if applicable, are detailed below. |
| (e) | The annual effective rates represent actual fees incurred under the distribution plan for the six months ended March 31, 2014 based on each class’s average daily net assets. MFD has voluntarily agreed to rebate a portion of each class’s 0.25% service fee attributable to accounts for which MFD retains the 0.25% service fee except for accounts attributable to MFS or its affiliates’ seed money. For the six months ended March 31, 2014, this rebate amounted to $439 and $9, for Class A, and Class B, respectively, and is included in the reduction of total expenses in the Statement of Operations. |
Certain Class A shares are subject to a contingent deferred sales charge (CDSC) in the event of a shareholder redemption within 18 months of purchase for shares purchased on or after August 1, 2012, and within 24 months of purchase for shares purchased prior to August 1, 2012. Class C shares are subject to a CDSC in the event of a shareholder redemption within 12 months of purchase. Class B shares are subject to a CDSC in the event of a shareholder redemption within six years of purchase. All contingent deferred sales charges are paid to MFD and during the six months ended March 31, 2014, were as follows:
| Amount | ||||
| Class A | $131 | |||
| Class B | 2,157 | |||
| Class C | 1,665 | |||
Shareholder Servicing Agent – MFS Service Center, Inc. (MFSC), a wholly-owned subsidiary of MFS, receives a fee from the fund for its services as shareholder servicing
28
Table of Contents
Notes to Financial Statements (unaudited) – continued
agent calculated as a percentage of the average daily net assets of the fund as determined periodically under the supervision of the fund’s Board of Trustees. For the six months ended March 31, 2014, the fee was $29,534, which equated to 0.0201% annually of the fund’s average daily net assets. MFSC also receives payment from the fund for out-of-pocket expenses, sub-accounting and other shareholder servicing costs which may be paid to affiliated and unaffiliated service providers. Class R5 shares do not incur sub-accounting fees. For the six months ended March 31, 2014, these out-of-pocket expenses, sub-accounting and other shareholder servicing costs amounted to $157,513.
Administrator – MFS provides certain financial, legal, shareholder communications, compliance, and other administrative services to the fund. Under an administrative services agreement, the fund partially reimburses MFS the costs incurred to provide these services. The fund is charged an annual fixed amount of $17,500 plus a fee based on average daily net assets. The administrative services fee incurred for the six months ended March 31, 2014 was equivalent to an annual effective rate of 0.0155% of the fund’s average daily net assets.
Trustees’ and Officers’ Compensation – The fund pays compensation to independent Trustees in the form of a retainer, attendance fees, and additional compensation to Board and Committee chairpersons. The fund does not pay compensation directly to Trustees or officers of the fund who are also officers of the investment adviser, all of whom receive remuneration for their services to the fund from MFS. Certain officers and Trustees of the fund are officers or directors of MFS, MFD, and MFSC.
Other – This fund and certain other funds managed by MFS (the funds) have entered into services agreements (the Agreements) which provide for payment of fees by the funds to Tarantino LLC and Griffin Compliance LLC in return for the provision of services of an Independent Chief Compliance Officer (ICCO) and Assistant ICCO, respectively, for the funds. The ICCO and Assistant ICCO are officers of the funds and the sole members of Tarantino LLC and Griffin Compliance LLC, respectively. The funds can terminate the Agreements with Tarantino LLC and Griffin Compliance LLC at any time under the terms of the Agreements. For the six months ended March 31, 2014, the aggregate fees paid by the fund to Tarantino LLC and Griffin Compliance LLC were $915 and are included in “Miscellaneous” expense in the Statement of Operations. MFS has agreed to reimburse the fund for a portion of the payments made by the fund in the amount of $167, which is included in the reduction of total expenses in the Statement of Operations. Additionally, MFS has agreed to bear all expenses associated with office space, other administrative support, and supplies provided to the ICCO and Assistant ICCO.
The fund invests in the MFS Institutional Money Market Portfolio which is managed by MFS and seeks current income consistent with preservation of capital and liquidity. Income earned on this investment is included in “Dividends from underlying affiliated funds” in the Statement of Operations. This money market fund does not pay a management fee to MFS.
On September 11, 2013, MFS redeemed 7,827 shares of Class R2 and 7,762 shares of Class R4 for an aggregate amount of $292,585.
29
Table of Contents
Notes to Financial Statements (unaudited) – continued
(4) Portfolio Securities
Purchases and sales of investments, other than short-term obligations, aggregated $91,729,027 and $46,419,623, respectively.
(5) Shares of Beneficial Interest
The fund’s Declaration of Trust permits the Trustees to issue an unlimited number of full and fractional shares of beneficial interest. Transactions in fund shares were as follows:
| Six months ended 3/31/14 | Year ended 9/30/13 | |||||||||||||||
| Shares | Amount | Shares | Amount | |||||||||||||
| Shares sold | ||||||||||||||||
Class A | 1,090,090 | $22,630,218 | 1,518,721 | $26,238,619 | ||||||||||||
Class B | 62,374 | 1,255,065 | 91,037 | 1,540,348 | ||||||||||||
Class C | 236,610 | 4,657,769 | 282,552 | 4,861,469 | ||||||||||||
Class I | 1,438,334 | 29,595,507 | 2,997,013 | 54,543,965 | ||||||||||||
Class R1 | 2,058 | 40,874 | 48,976 | 807,487 | ||||||||||||
Class R2 | 153,861 | 3,018,318 | 305,490 | 4,987,044 | ||||||||||||
Class R3 | 311,266 | 6,349,898 | 1,605,112 | 27,727,591 | ||||||||||||
Class R4 | 212,882 | 4,389,012 | 335,194 | 5,616,510 | ||||||||||||
Class R5 | 928,398 | 19,837,613 | 501,503 | 9,180,784 | ||||||||||||
| 4,435,873 | $91,774,274 | 7,685,598 | $135,503,817 | |||||||||||||
| Shares issued to shareholders in reinvestment of distributions | ||||||||||||||||
Class A | 46,821 | $961,707 | 27,774 | $440,496 | ||||||||||||
Class B | 2,183 | 43,853 | 857 | 13,330 | ||||||||||||
Class C | 4,980 | 98,912 | 1,354 | 20,832 | ||||||||||||
Class I | 63,117 | 1,307,791 | 19,775 | 316,204 | ||||||||||||
Class R1 | 339 | 6,773 | 51 | 795 | ||||||||||||
Class R2 | 5,846 | 116,457 | 2,562 | 39,453 | ||||||||||||
Class R3 | 39,672 | 811,681 | 21,070 | 332,907 | ||||||||||||
Class R4 | 19,411 | 398,895 | 17,034 | 270,159 | ||||||||||||
Class R5 | 8,619 | 178,576 | 92 | 1,467 | ||||||||||||
| 190,988 | $3,924,645 | 90,569 | $1,435,643 | |||||||||||||
| Shares reacquired | ||||||||||||||||
Class A | (359,052 | ) | $(7,359,950 | ) | (746,205 | ) | $(12,900,443 | ) | ||||||||
Class B | (13,184 | ) | (264,114 | ) | (34,473 | ) | (580,480 | ) | ||||||||
Class C | (78,681 | ) | (1,525,285 | ) | (77,777 | ) | (1,306,974 | ) | ||||||||
Class I | (1,242,326 | ) | (26,228,295 | ) | (1,104,801 | ) | (20,187,966 | ) | ||||||||
Class R1 | (629 | ) | (12,561 | ) | (23,174 | ) | (383,967 | ) | ||||||||
Class R2 | (74,184 | ) | (1,480,391 | ) | (114,930 | ) | (2,014,294 | ) | ||||||||
Class R3 | (355,559 | ) | (7,294,100 | ) | (758,820 | ) | (13,165,775 | ) | ||||||||
Class R4 | (78,072 | ) | (1,600,224 | ) | (431,441 | ) | (7,673,402 | ) | ||||||||
Class R5 | (41,920 | ) | (881,480 | ) | (42,691 | ) | (792,601 | ) | ||||||||
| (2,243,607 | ) | $(46,646,400 | ) | (3,334,312 | ) | $(59,005,902 | ) | |||||||||
30
Table of Contents
Notes to Financial Statements (unaudited) – continued
| Six months ended 3/31/14 | Year ended 9/30/13 | |||||||||||||||
| Shares | Amount | Shares | Amount | |||||||||||||
| Net change | ||||||||||||||||
Class A | 777,859 | $16,231,975 | 800,290 | $13,778,672 | ||||||||||||
Class B | 51,373 | 1,034,804 | 57,421 | 973,198 | ||||||||||||
Class C | 162,909 | 3,231,396 | 206,129 | 3,575,327 | ||||||||||||
Class I | 259,125 | 4,675,003 | 1,911,987 | 34,672,203 | ||||||||||||
Class R1 | 1,768 | 35,086 | 25,853 | 424,315 | ||||||||||||
Class R2 | 85,523 | 1,654,384 | 193,122 | 3,012,203 | ||||||||||||
Class R3 | (4,621 | ) | (132,521 | ) | 867,362 | 14,894,723 | ||||||||||
Class R4 | 154,221 | 3,187,683 | (79,213 | ) | (1,786,733 | ) | ||||||||||
Class R5 | 895,097 | 19,134,709 | 458,904 | 8,389,650 | ||||||||||||
| 2,383,254 | $49,052,519 | 4,441,855 | $77,933,558 | |||||||||||||
(6) Line of Credit
The fund and certain other funds managed by MFS participate in a $1.1 billion unsecured committed line of credit, subject to a $1 billion sublimit, provided by a syndication of banks under a credit agreement. Borrowings may be made for temporary financing needs. Interest is charged to each fund, based on its borrowings, generally at a rate equal to the higher of the Federal Reserve funds rate or one month LIBOR plus an agreed upon spread. A commitment fee, based on the average daily, unused portion of the committed line of credit, is allocated among the participating funds at the end of each calendar quarter. In addition, the fund and other funds managed by MFS have established unsecured uncommitted borrowing arrangements with certain banks for temporary financing needs. Interest is charged to each fund, based on its borrowings, at a rate equal to the Federal Reserve funds rate plus an agreed upon spread. For the six months ended March 31, 2014, the fund’s commitment fee and interest expense were $536 and $0, respectively, and are included in “Miscellaneous” expense in the Statement of Operations.
(7) Transactions in Underlying Affiliated Funds-Affiliated Issuers
An affiliated issuer may be considered one in which the fund owns 5% or more of the outstanding voting securities, or a company which is under common control. For the purposes of this report, the fund assumes the following to be an affiliated issuer:
| Underlying Affiliated Fund | Beginning Shares/Par Amount | Acquisitions Shares/Par Amount | Dispositions Shares/Par Amount | Ending Shares/Par Amount | ||||||||||||
| MFS Institutional Money Market Portfolio | 2,973,217 | 65,490,359 | (65,045,099 | ) | 3,418,477 | |||||||||||
| Underlying Affiliated Fund | Realized Gain (Loss) | Capital Gain Distributions | Dividend Income | Ending Value | ||||||||||||
| MFS Institutional Money Market Portfolio | $— | $— | $1,697 | $3,418,477 | ||||||||||||
31
Table of Contents
BOARD REVIEW OF INVESTMENT ADVISORY AGREEMENT
A discussion regarding the Board’s most recent review and renewal of the fund’s Investment Advisory Agreement with MFS is available by clicking on the fund’s name under “Mutual Funds” in the “Products” section of the MFS Web site (mfs.com).
PROXY VOTING POLICIES AND INFORMATION
MFS votes proxies on behalf of the fund pursuant to proxy voting policies and procedures that are available without charge, upon request, by calling 1-800-225-2606, by visiting the Proxy Voting section of mfs.com or by visiting the SEC’s Web site at http://www.sec.gov.
Information regarding how the fund voted proxies relating to portfolio securities during the most recent twelve-month period ended June 30 is available without charge by visiting the Proxy Voting section of mfs.com or by visiting the SEC’s Web site at http://www.sec.gov.
QUARTERLY PORTFOLIO DISCLOSURE
The fund will file a complete schedule of portfolio holdings with the Securities and Exchange Commission (the Commission) for the first and third quarters of each fiscal year on Form N-Q. A shareholder can obtain the quarterly portfolio holdings report at mfs.com. The fund’s Form N-Q is also available on the EDGAR database on the Commission’s Internet Web site at http://www.sec.gov, and may be reviewed and copied at the:
Public Reference Room
Securities and Exchange Commission
100 F Street, NE, Room 1580
Washington, D.C. 20549
Information on the operation of the Public Reference Room may be obtained by calling the Commission at 1-800-SEC-0330. Copies of the fund’s Form N-Q also may be obtained, upon payment of a duplicating fee, by electronic request at the following e-mail address: publicinfo@sec.gov, or by writing the Public Reference Section at the above address.
From time to time, MFS may post important information about the fund or the MFS funds on the MFS web site (mfs.com). This information is available by visiting the “Commentary & Announcements” and “Market Outlooks” sections of mfs.com or by clicking on the fund’s name under “Mutual Funds” in the “Products” section of mfs.com.
PROVISION OF FINANCIAL REPORTS AND SUMMARY PROSPECTUSES
The fund produces financial reports every six months and updates its summary prospectus and prospectus annually. To avoid sending duplicate copies of materials to households, only one copy of the fund’s annual and semiannual report and summary prospectus may be mailed to shareholders having the same last name and residential address on the fund’s records. However, any shareholder may contact MFSC (please see back cover for address and telephone number) to request that copies of these reports and summary prospectuses be sent personally to that shareholder.
32
Table of Contents
Save paper with eDelivery.
| MFS® will send you prospectuses, |

reports, and proxies directly via e-mail so you will get information faster with less mailbox clutter.
To sign up:
1. Go to mfs.com.
2. Log in via MFS® Access.
3. Select eDelivery.
If you own your MFS fund shares through a financial institution or a retirement plan, MFS® TALK, MFS® Access, or eDelivery may not be available to you.
WEB SITE
mfs.com
MFS TALK
1-800-637-8255
24 hours a day
ACCOUNT SERVICE AND LITERATURE
Shareholders
1-800-225-2606
Financial advisors
1-800-343-2829
Retirement plan services
1-800-637-1255
MAILING ADDRESS
MFS Service Center, Inc.
P.O. Box 55824
Boston, MA 02205-5824
OVERNIGHT MAIL
MFS Service Center, Inc.
c/o Boston Financial Data Services
30 Dan Road
Canton, MA 02021-2809
Table of Contents
| ITEM 2. | CODE OF ETHICS. |
During the period covered by this report, the Registrant has not amended any provision in its Code of Ethics (the “Code”) that relates to an element of the Code’s definitions enumerated in paragraph (b) of Item 2 of this Form N-CSR. During the period covered by this report, the Registrant did not grant a waiver, including an implicit waiver, from any provision of the Code.
| ITEM 3. | AUDIT COMMITTEE FINANCIAL EXPERT. |
Not applicable for semi-annual reports.
| ITEM 4. | PRINCIPAL ACCOUNTANT FEES AND SERVICES. |
Not applicable for semi-annual reports.
| ITEM 5. | AUDIT COMMITTEE OF LISTED REGISTRANTS. |
Not applicable to the Registrant.
| ITEM 6. | INVESTMENTS |
A schedule of investments for each series of the Registrant is included as part of the report to shareholders of such series under Item 1 of this Form N-CSR.
| ITEM 7. | DISCLOSURE OF PROXY VOTING POLICIES AND PROCEDURES FOR CLOSED-END MANAGEMENT INVESTMENT COMPANIES. |
Not applicable to the Registrant.
| ITEM 8. | PORTFOLIO MANAGERS OF CLOSED-END MANAGEMENT INVESTMENT COMPANIES. |
Not applicable to the Registrant.
| ITEM 9. | PURCHASES OF EQUITY SECURITIES BY CLOSED-END MANAGEMENT INVESTMENT COMPANY AND AFFILIATED PURCHASERS. |
Not applicable to the Registrant.
Table of Contents
| ITEM 10. | SUBMISSION OF MATTERS TO A VOTE OF SECURITY HOLDERS. |
There were no material changes to the procedures by which shareholders may send recommendations to the Board for nominees to the Registrant’s Board since the Registrant last provided disclosure as to such procedures in response to the requirements of Item 407 (c)(2)(iv) of Regulation S-K or this Item.
| ITEM 11. | CONTROLS AND PROCEDURES. |
| (a) | Based upon their evaluation of the effectiveness of the registrant’s disclosure controls and procedures (as defined in Rule 30a-3(c) under the Investment Company Act of 1940 (the “Act”)) as conducted within 90 days of the filing date of this report on Form N-CSR, the registrant’s principal financial officer and principal executive officer have concluded that those disclosure controls and procedures provide reasonable assurance that the material information required to be disclosed by the registrant on this report is recorded, processed, summarized and reported within the time periods specified in the Securities and Exchange Commission’s rules and forms. |
| (b) | There were no changes in the registrant’s internal controls over financial reporting (as defined in Rule 30a-3(d) under the Act) that occurred during the second fiscal quarter of the period covered by the report that have materially affected, or are reasonably likely to materially affect, the registrant’s internal control over financial reporting. |
| ITEM 12. | EXHIBITS. |
| (a) | File the exhibits listed below as part of this form. Letter or number the exhibits in the sequence indicated. |
| (1) | Any code of ethics, or amendment thereto, that is the subject of the disclosure required by Item 2, to the extent that the registrant intends to satisfy the Item 2 requirements through filing of an exhibit. |
| (2) | A separate certification for each principal executive officer and principal financial officer of the registrant as required by Rule 30a-2(a) under the Act (17 CFR 270.30a-2): Attached hereto. |
| (b) | If the report is filed under Section 13(a) or 15(d) of the Exchange Act, provide the certifications required by Rule 30a-2(b) under the Act (17 CFR 270.30a-2(b)), Rule 13a-14(b) or Rule 15d-14(b) under the Exchange Act (17 CFR 240.13a-14(b) or 240.15d-14(b)) and Section 1350 of Chapter 63 of Title 18 of the United States Code (18 U.S.C. 1350) as an exhibit. A certification furnished pursuant to this paragraph will not be deemed “filed” for the purposes of Section 18 of the Exchange Act (15 U.S.C. 78r), or otherwise subject to the liability of that section. Such certification will not be deemed to be incorporated by reference into any filing under the Securities Act of 1933 or the Exchange Act, except to the extent that the registrant specifically incorporates it by reference: Attached hereto. |
Table of Contents
Notice
A copy of the Amended and Restated Declaration of Trust, as amended, of the Registrant is on file with the Secretary of State of The Commonwealth of Massachusetts and notice is hereby given that this instrument is executed on behalf of the Registrant by an officer of the Registrant as an officer and not individually and the obligations of or arising out of this instrument are not binding upon any of the Trustees or shareholders individually, but are binding only upon the assets and property of the respective constituent series of the Registrant.
Table of Contents
SIGNATURES
Pursuant to the requirements of the Securities Exchange Act of 1934 and the Investment Company Act of 1940, the registrant has duly caused this report to be signed on its behalf by the undersigned, thereunto duly authorized.
(Registrant) MFS SERIES TRUST XI
| By (Signature and Title)* | JOHN M. CORCORAN | |
| John M. Corcoran, President |
Date: May 13, 2014
Pursuant to the requirements of the Securities Exchange Act of 1934 and the Investment Company Act of 1940, this report has been signed below by the following persons on behalf of the registrant and in the capacities and on the dates indicated.
| By (Signature and Title)* | JOHN M. CORCORAN | |
| John M. Corcoran, President (Principal Executive Officer) |
Date: May 13, 2014
| By (Signature and Title)* | DAVID L. DILORENZO | |
David L. DiLorenzo, Treasurer (Principal Financial Officer and Accounting Officer) |
Date: May 13, 2014
| * | Print name and title of each signing officer under his or her signature. |