UNITED STATES
SECURITIES AND EXCHANGE COMMISSION
Washington, D.C. 20549
FORM N-CSR
CERTIFIED SHAREHOLDER REPORT OF
REGISTERED MANAGEMENT INVESTMENT COMPANIES
Investment Company Act file number 811-07992
MFS SERIES TRUST XI
(Exact name of registrant as specified in charter)
111 Huntington Avenue, Boston, Massachusetts 02199
(Address of principal executive offices) (Zip code)
Christopher R. Bohane
Massachusetts Financial Services Company
111 Huntington Avenue, Boston, Massachusetts 02199
(Name and address of agents for service)
Registrant’s telephone number, including area code: (617) 954-5000
Date of fiscal year end: September 30
Date of reporting period: March 31, 2022
| ITEM 1. | REPORTS TO STOCKHOLDERS. |
1(a):

Core Equity Fund

Core Equity Fund
| 1 | |
| 2 | |
| 3 | |
| 5 | |
| 11 | |
| 13 | |
| 14 | |
| 15 | |
| 24 | |
| 34 | |
| 35 | |
| 35 | |
| 35 | |
| 35 | |
| 35 |
| back cover |


| Microsoft Corp. | 7.6% |
| Apple, Inc. | 6.1% |
| Amazon.com, Inc. | 3.8% |
| Alphabet, Inc., “C” | 3.1% |
| Alphabet, Inc., “A” | 2.8% |
| Johnson & Johnson | 2.5% |
| JPMorgan Chase & Co. | 2.1% |
| McKesson Corp. | 1.9% |
| Accenture PLC, “A” | 1.9% |
| Archer Daniels Midland Co. | 1.8% |
| Information Technology | 28.1% |
| Health Care | 14.2% |
| Consumer Discretionary | 11.7% |
| Financials | 11.4% |
| Communication Services | 9.7% |
| Industrials | 7.1% |
| Consumer Staples | 6.1% |
| Energy | 3.6% |
| Real Estate | 3.4% |
| Utilities | 1.9% |
| Materials | 1.8% |
| (g) | The Global Industry Classification Standard (GICS®) was developed by and/or is the exclusive property of MSCI, Inc. and S&P Global Market Intelligence Inc. (“S&P Global Market Intelligence”). GICS is a service mark of MSCI and S&P Global Market Intelligence and has been licensed for use by MFS. MFS has applied its own internal sector/industry classification methodology for equity securities and non-equity securities that are unclassified by GICS. |
October 1, 2021 through March 31, 2022
| Share Class | Annualized Expense Ratio | Beginning Account Value 10/01/21 | Ending Account Value 3/31/22 | Expenses Paid During Period (p) 10/01/21-3/31/22 | |
| A | Actual | 0.74% | $1,000.00 | $1,053.53 | $3.79 |
| Hypothetical (h) | 0.74% | $1,000.00 | $1,021.24 | $3.73 | |
| B | Actual | 1.49% | $1,000.00 | $1,049.42 | $7.61 |
| Hypothetical (h) | 1.49% | $1,000.00 | $1,017.50 | $7.49 | |
| C | Actual | 1.49% | $1,000.00 | $1,049.40 | $7.61 |
| Hypothetical (h) | 1.49% | $1,000.00 | $1,017.50 | $7.49 | |
| I | Actual | 0.49% | $1,000.00 | $1,054.84 | $2.51 |
| Hypothetical (h) | 0.49% | $1,000.00 | $1,022.49 | $2.47 | |
| R1 | Actual | 1.49% | $1,000.00 | $1,049.28 | $7.61 |
| Hypothetical (h) | 1.49% | $1,000.00 | $1,017.50 | $7.49 | |
| R2 | Actual | 0.99% | $1,000.00 | $1,052.42 | $5.07 |
| Hypothetical (h) | 0.99% | $1,000.00 | $1,020.00 | $4.99 | |
| R3 | Actual | 0.74% | $1,000.00 | $1,053.58 | $3.79 |
| Hypothetical (h) | 0.74% | $1,000.00 | $1,021.24 | $3.73 | |
| R4 | Actual | 0.49% | $1,000.00 | $1,054.70 | $2.51 |
| Hypothetical (h) | 0.49% | $1,000.00 | $1,022.49 | $2.47 | |
| R6 | Actual | 0.39% | $1,000.00 | $1,055.48 | $2.00 |
| Hypothetical (h) | 0.39% | $1,000.00 | $1,022.99 | $1.97 |
| (h) | 5% class return per year before expenses. |
| (p) | “Expenses Paid During Period” are equal to each class’s annualized expense ratio, as shown above, multiplied by the average account value over the period, multiplied by 182/365 (to reflect the one-half year period). Expenses paid do not include any applicable sales charges (loads). If these transaction costs had been included, your costs would have been higher. |
| Issuer | Shares/Par | Value ($) | ||
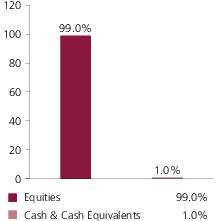
| Common Stocks – 99.0% | ||||
| Aerospace & Defense – 1.6% | ||||
| Honeywell International, Inc. | 19,298 | $ 3,755,005 | ||
| Huntington Ingalls Industries, Inc. | 13,301 | 2,652,751 | ||
| Northrop Grumman Corp. | 27,876 | 12,466,705 | ||
| $ 18,874,461 | ||||
| Alcoholic Beverages – 0.2% | ||||
| Constellation Brands, Inc., “A” | 11,734 | $ 2,702,575 | ||
| Apparel Manufacturers – 0.4% | ||||
| NIKE, Inc., “B” | 37,520 | $ 5,048,691 | ||
| Automotive – 2.0% | ||||
| Ford Motor Co. | 120,148 | $ 2,031,703 | ||
| LKQ Corp. | 59,111 | 2,684,230 | ||
| Tesla, Inc. (a) | 17,207 | 18,542,263 | ||
| $ 23,258,196 | ||||
| Biotechnology – 0.9% | ||||
| Biogen, Inc. (a) | 30,456 | $ 6,414,034 | ||
| Gilead Sciences, Inc. | 35,042 | 2,083,247 | ||
| Moderna, Inc. (a) | 7,824 | 1,347,762 | ||
| $ 9,845,043 | ||||
| Brokerage & Asset Managers – 0.6% | ||||
| Invesco Ltd. | 48,917 | $ 1,128,026 | ||
| KKR & Co., Inc. | 31,173 | 1,822,685 | ||
| Raymond James Financial, Inc. | 38,891 | 4,274,510 | ||
| $ 7,225,221 | ||||
| Business Services – 2.0% | ||||
| Accenture PLC, “A” | 64,413 | $ 21,721,996 | ||
| Amdocs Ltd. | 17,781 | 1,461,776 | ||
| $ 23,183,772 | ||||
| Cable TV – 1.6% | ||||
| Charter Communications, Inc., “A” (a) | 27,801 | $ 15,166,002 | ||
| Comcast Corp., “A” | 65,621 | 3,072,375 | ||
| $ 18,238,377 | ||||
| Chemicals – 0.2% | ||||
| Eastman Chemical Co. | 15,393 | $ 1,724,940 | ||
| Issuer | Shares/Par | Value ($) | ||
| Common Stocks – continued | ||||
| Computer Software – 9.3% | ||||
| Adobe Systems, Inc. (a) | 36,954 | $ 16,836,981 | ||
| Atlassian Corp. PLC, “A” (a) | 11,936 | 3,507,155 | ||
| Microsoft Corp. | 283,752 | 87,483,579 | ||
| $ 107,827,715 | ||||
| Computer Software - Systems – 7.9% | ||||
| Apple, Inc. | 404,296 | $ 70,594,124 | ||
| EPAM Systems, Inc. (a) | 4,142 | 1,228,559 | ||
| HP, Inc. | 248,556 | 9,022,583 | ||
| Juniper Networks, Inc. | 33,034 | 1,227,543 | ||
| ServiceNow, Inc. (a) | 6,812 | 3,793,535 | ||
| SS&C Technologies Holdings, Inc. | 42,448 | 3,184,449 | ||
| Zebra Technologies Corp., “A” (a) | 4,334 | 1,792,976 | ||
| $ 90,843,769 | ||||
| Construction – 0.7% | ||||
| Otis Worldwide Corp. | 45,586 | $ 3,507,843 | ||
| Sherwin-Williams Co. | 17,562 | 4,383,826 | ||
| $ 7,891,669 | ||||
| Consumer Products – 1.2% | ||||
| Colgate-Palmolive Co. | 165,461 | $ 12,546,908 | ||
| Procter & Gamble Co. | 7,115 | 1,087,172 | ||
| $ 13,634,080 | ||||
| Consumer Services – 1.2% | ||||
| Booking Holdings, Inc. (a) | 5,770 | $ 13,550,556 | ||
| Electrical Equipment – 1.6% | ||||
| Johnson Controls International PLC | 165,915 | $ 10,879,047 | ||
| TE Connectivity Ltd. | 55,932 | 7,325,973 | ||
| $ 18,205,020 | ||||
| Electronics – 6.3% | ||||
| Advanced Micro Devices (a) | 77,334 | $ 8,455,700 | ||
| Applied Materials, Inc. | 141,527 | 18,653,259 | ||
| Intel Corp. | 223,367 | 11,070,069 | ||
| NVIDIA Corp. | 28,884 | 7,881,288 | ||
| NXP Semiconductors N.V. | 45,505 | 8,422,065 | ||
| Texas Instruments, Inc. | 99,480 | 18,252,590 | ||
| $ 72,734,971 | ||||
| Issuer | Shares/Par | Value ($) | ||
| Common Stocks – continued | ||||
| Energy - Independent – 2.3% | ||||
| EOG Resources, Inc. | 67,195 | $ 8,011,660 | ||
| Marathon Petroleum Corp. | 14,092 | 1,204,866 | ||
| Valero Energy Corp. | 167,745 | 17,032,827 | ||
| $ 26,249,353 | ||||
| Food & Beverages – 2.9% | ||||
| Archer Daniels Midland Co. | 227,616 | $ 20,544,620 | ||
| J.M. Smucker Co. | 35,425 | 4,796,899 | ||
| Mondelez International, Inc. | 62,385 | 3,916,531 | ||
| PepsiCo, Inc. | 19,006 | 3,181,224 | ||
| Tyson Foods, Inc., “A” | 12,674 | 1,135,971 | ||
| $ 33,575,245 | ||||
| Food & Drug Stores – 1.6% | ||||
| Wal-Mart Stores, Inc. | 125,913 | $ 18,750,964 | ||
| Forest & Paper Products – 0.6% | ||||
| Rayonier, Inc., REIT | 64,212 | $ 2,640,397 | ||
| Weyerhaeuser Co., REIT | 121,793 | 4,615,955 | ||
| $ 7,256,352 | ||||
| Gaming & Lodging – 0.4% | ||||
| International Game Technology PLC | 74,058 | $ 1,827,751 | ||
| Marriott International, Inc., “A” (a) | 18,326 | 3,220,795 | ||
| $ 5,048,546 | ||||
| Health Maintenance Organizations – 2.1% | ||||
| Cigna Corp. | 59,491 | $ 14,254,639 | ||
| Humana, Inc. | 20,043 | 8,722,112 | ||
| UnitedHealth Group, Inc. | 2,518 | 1,284,104 | ||
| $ 24,260,855 | ||||
| Insurance – 4.7% | ||||
| Ameriprise Financial, Inc. | 22,968 | $ 6,898,668 | ||
| Berkshire Hathaway, Inc., “B” (a) | 13,956 | 4,925,212 | ||
| Equitable Holdings, Inc. | 246,660 | 7,624,261 | ||
| Everest Re Group Ltd. | 53,218 | 16,038,841 | ||
| MetLife, Inc. | 248,194 | 17,443,074 | ||
| Reinsurance Group of America, Inc. | 8,784 | 961,497 | ||
| $ 53,891,553 | ||||
| Internet – 7.7% | ||||
| Alphabet, Inc., “A” (a) | 11,738 | $ 32,647,486 | ||
| Alphabet, Inc., “C” (a) | 12,775 | 35,680,447 | ||
| Gartner, Inc. (a) | 18,738 | 5,573,806 | ||
| Issuer | Shares/Par | Value ($) | ||
| Common Stocks – continued | ||||
| Internet – continued | ||||
| Meta Platforms, Inc., “A” (a) | 69,749 | $ 15,509,388 | ||
| $ 89,411,127 | ||||
| Leisure & Toys – 1.6% | ||||
| Brunswick Corp. | 120,594 | $ 9,754,849 | ||
| Electronic Arts, Inc. | 29,076 | 3,678,405 | ||
| Polaris, Inc. | 46,976 | 4,947,512 | ||
| $ 18,380,766 | ||||
| Machinery & Tools – 1.5% | ||||
| Eaton Corp. PLC | 80,160 | $ 12,165,081 | ||
| Regal Rexnord Corp. | 37,678 | 5,605,733 | ||
| $ 17,770,814 | ||||
| Major Banks – 5.1% | ||||
| Bank of America Corp. | 161,408 | $ 6,653,238 | ||
| Goldman Sachs Group, Inc. | 49,107 | 16,210,220 | ||
| JPMorgan Chase & Co. | 179,443 | 24,461,670 | ||
| Wells Fargo & Co. | 235,532 | 11,413,881 | ||
| $ 58,739,009 | ||||
| Medical & Health Technology & Services – 1.9% | ||||
| McKesson Corp. | 73,324 | $ 22,446,676 | ||
| Medical Equipment – 2.8% | ||||
| Abbott Laboratories | 28,927 | $ 3,423,799 | ||
| Boston Scientific Corp. (a) | 36,811 | 1,630,359 | ||
| Danaher Corp. | 13,252 | 3,887,209 | ||
| Hologic, Inc. (a) | 16,425 | 1,261,769 | ||
| Medtronic PLC | 118,072 | 13,100,088 | ||
| Thermo Fisher Scientific, Inc. | 15,257 | 9,011,547 | ||
| $ 32,314,771 | ||||
| Natural Gas - Pipeline – 1.2% | ||||
| Cheniere Energy, Inc. | 95,484 | $ 13,238,857 | ||
| Oil Services – 0.2% | ||||
| NOV, Inc. | 96,327 | $ 1,888,972 | ||
| Other Banks & Diversified Financials – 2.6% | ||||
| SLM Corp. | 645,346 | $ 11,848,552 | ||
| Visa, Inc., “A” | 80,454 | 17,842,284 | ||
| $ 29,690,836 | ||||
| Issuer | Shares/Par | Value ($) | ||
| Common Stocks – continued | ||||
| Pharmaceuticals – 6.5% | ||||
| Eli Lilly & Co. | 51,748 | $ 14,819,075 | ||
| Incyte Corp. (a) | 13,777 | 1,094,169 | ||
| Johnson & Johnson | 160,972 | 28,529,068 | ||
| Merck & Co., Inc. | 233,310 | 19,143,085 | ||
| Pfizer, Inc. | 22,522 | 1,165,964 | ||
| Vertex Pharmaceuticals, Inc. (a) | 39,110 | 10,206,537 | ||
| $ 74,957,898 | ||||
| Railroad & Shipping – 1.4% | ||||
| CSX Corp. | 428,721 | $ 16,055,601 | ||
| Real Estate – 2.7% | ||||
| Extra Space Storage, Inc., REIT | 74,868 | $ 15,392,861 | ||
| Life Storage, Inc., REIT | 92,904 | 13,046,509 | ||
| Spirit Realty Capital, Inc., REIT | 71,265 | 3,279,615 | ||
| $ 31,718,985 | ||||
| Restaurants – 1.1% | ||||
| Starbucks Corp. | 94,375 | $ 8,585,294 | ||
| Texas Roadhouse, Inc. | 52,845 | 4,424,712 | ||
| $ 13,010,006 | ||||
| Specialty Chemicals – 1.2% | ||||
| Corteva, Inc. | 21,938 | $ 1,260,996 | ||
| DuPont de Nemours, Inc. | 45,972 | 3,382,620 | ||
| Linde PLC | 29,881 | 9,544,888 | ||
| $ 14,188,504 | ||||
| Specialty Stores – 5.3% | ||||
| Amazon.com, Inc. (a) | 13,481 | $ 43,947,386 | ||
| AutoZone, Inc. (a) | 3,011 | 6,156,230 | ||
| Home Depot, Inc. | 31,875 | 9,541,144 | ||
| Ross Stores, Inc. | 12,737 | 1,152,189 | ||
| $ 60,796,949 | ||||
| Telephone Services – 0.5% | ||||
| Lumen Technologies, Inc. | 522,739 | $ 5,891,269 | ||
| Tobacco – 0.2% | ||||
| Philip Morris International, Inc. | 26,476 | $ 2,487,155 | ||
| Trucking – 1.3% | ||||
| Knight-Swift Transportation Holdings, Inc. | 47,812 | $ 2,412,594 | ||
| United Parcel Service, Inc., “B” | 60,096 | 12,888,188 | ||
| $ 15,300,782 | ||||
| Issuer | Shares/Par | Value ($) | ||
| Common Stocks – continued | ||||
| Utilities - Electric Power – 1.9% | ||||
| American Electric Power Co., Inc. | 13,880 | $ 1,384,808 | ||
| Constellation Energy | 103,717 | 5,834,081 | ||
| Exelon Corp. | 247,772 | 11,801,380 | ||
| Vistra Corp. | 139,592 | 3,245,514 | ||
| $ 22,265,783 | ||||
| Total Common Stocks (Identified Cost, $739,383,455) | $ 1,144,376,684 | |||
| Investment Companies (h) – 1.1% | ||||
| Money Market Funds – 1.1% | ||||
| MFS Institutional Money Market Portfolio, 0.21% (v) (Identified Cost, $12,322,362) | 12,322,362 | $ 12,322,362 | ||
| Other Assets, Less Liabilities – (0.1)% | (586,965) | |||
| Net Assets – 100.0% | $ 1,156,112,081 | |||
| (a) | Non-income producing security. | |||
| (h) | An affiliated issuer, which may be considered one in which the fund owns 5% or more of the outstanding voting securities, or a company which is under common control. At period end, the aggregate values of the fund's investments in affiliated issuers and in unaffiliated issuers were $12,322,362 and $1,144,376,684, respectively. | |||
| (v) | Affiliated issuer that is available only to investment companies managed by MFS. The rate quoted for the MFS Institutional Money Market Portfolio is the annualized seven-day yield of the fund at period end. |
| The following abbreviations are used in this report and are defined: | |
| REIT | Real Estate Investment Trust |
| Assets | |
| Investments in unaffiliated issuers, at value (identified cost, $739,383,455) | $1,144,376,684 |
| Investments in affiliated issuers, at value (identified cost, $12,322,362) | 12,322,362 |
| Receivables for | |
| Fund shares sold | 1,134,519 |
| Dividends | 724,836 |
| Receivable from investment adviser | 33,520 |
| Other assets | 2,817 |
| Total assets | $1,158,594,738 |
| Liabilities | |
| Payables for | |
| Fund shares reacquired | $2,091,018 |
| Payable to affiliates | |
| Administrative services fee | 929 |
| Shareholder servicing costs | 267,156 |
| Distribution and service fees | 8,035 |
| Payable for independent Trustees' compensation | 3,414 |
| Accrued expenses and other liabilities | 112,105 |
| Total liabilities | $2,482,657 |
| Net assets | $1,156,112,081 |
| Net assets consist of | |
| Paid-in capital | $690,714,674 |
| Total distributable earnings (loss) | 465,397,407 |
| Net assets | $1,156,112,081 |
| Shares of beneficial interest outstanding | 36,556,079 |
| Net assets | Shares outstanding | Net asset value per share (a) | |
| Class A | $222,597,639 | 7,087,558 | $31.41 |
| Class B | 13,691,784 | 458,195 | 29.88 |
| Class C | 39,675,817 | 1,355,097 | 29.28 |
| Class I | 552,279,299 | 17,265,278 | 31.99 |
| Class R1 | 1,383,998 | 46,815 | 29.56 |
| Class R2 | 45,185,350 | 1,526,230 | 29.61 |
| Class R3 | 45,642,309 | 1,458,905 | 31.29 |
| Class R4 | 10,277,548 | 325,367 | 31.59 |
| Class R6 | 225,378,337 | 7,032,634 | 32.05 |
| (a) | Maximum offering price per share was equal to the net asset value per share for all share classes, except for Class A, for which the maximum offering price per share was $33.33 [100 / 94.25 x $31.41]. On sales of $50,000 or more, the maximum offering price of Class A shares is reduced. A contingent deferred sales charge may be imposed on redemptions of Class A, Class B, and Class C shares. Redemption price per share was equal to the net asset value per share for Classes I, R1, R2, R3, R4, and R6. |
| Net investment income (loss) | |
| Income | |
| Dividends | $8,753,083 |
| Other | 24,571 |
| Dividends from affiliated issuers | 3,287 |
| Foreign taxes withheld | (9,678) |
| Total investment income | $8,771,263 |
| Expenses | |
| Management fee | $2,318,453 |
| Distribution and service fees | 766,505 |
| Shareholder servicing costs | 528,203 |
| Administrative services fee | 83,054 |
| Independent Trustees' compensation | 8,900 |
| Custodian fee | 28,334 |
| Shareholder communications | 33,960 |
| Audit and tax fees | 28,978 |
| Legal fees | 3,041 |
| Miscellaneous | 95,423 |
| Total expenses | $3,894,851 |
| Reduction of expenses by investment adviser and distributor | (375,873) |
| Net expenses | $3,518,978 |
| Net investment income (loss) | $5,252,285 |
| Realized and unrealized gain (loss) | |
| Realized gain (loss) (identified cost basis) | |
| Unaffiliated issuers | $62,179,022 |
| Change in unrealized appreciation or depreciation | |
| Unaffiliated issuers | $(3,795,255) |
| Net realized and unrealized gain (loss) | $58,383,767 |
| Change in net assets from operations | $63,636,052 |
| Six months ended | Year ended | |
| 3/31/22 (unaudited) | 9/30/21 | |
| Change in net assets | ||
| From operations | ||
| Net investment income (loss) | $5,252,285 | $10,092,349 |
| Net realized gain (loss) | 62,179,022 | 187,886,545 |
| Net unrealized gain (loss) | (3,795,255) | 117,133,226 |
| Change in net assets from operations | $63,636,052 | $315,112,120 |
| Total distributions to shareholders | $(171,984,596) | $(78,659,212) |
| Change in net assets from fund share transactions | $115,930,918 | $(160,482,968) |
| Total change in net assets | $7,582,374 | $75,969,940 |
| Net assets | ||
| At beginning of period | 1,148,529,707 | 1,072,559,767 |
| At end of period | $1,156,112,081 | $1,148,529,707 |
| Class A | Six months ended | Year ended | ||||
| 3/31/22 (unaudited) | 9/30/21 | 9/30/20 | 9/30/19 | 9/30/18 | 9/30/17 | |
| Net asset value, beginning of period | $34.76 | $28.49 | $26.52 | $29.79 | $26.59 | $23.16 |
| Income (loss) from investment operations | ||||||
| Net investment income (loss) (d) | $0.13 | $0.24 | $0.28 | $0.33 | $0.31 | $0.27 |
| Net realized and unrealized gain (loss) | 1.82 | 8.10 | 3.08 | (0.93) | 3.79 | 3.39 |
| Total from investment operations | $1.95 | $8.34 | $3.36 | $(0.60) | $4.10 | $3.66 |
| Less distributions declared to shareholders | ||||||
| From net investment income | $(0.22) | $(0.26) | $(0.38) | $(0.39) | $(0.33) | $(0.23) |
| From net realized gain | (5.08) | (1.81) | (1.01) | (2.28) | (0.57) | — |
| Total distributions declared to shareholders | $(5.30) | $(2.07) | $(1.39) | $(2.67) | $(0.90) | $(0.23) |
| Net asset value, end of period (x) | $31.41 | $34.76 | $28.49 | $26.52 | $29.79 | $26.59 |
| Total return (%) (r)(s)(t)(x) | 5.35(n) | 30.69 | 12.88 | (0.62) | 15.72 | 15.92 |
| Ratios (%) (to average net assets) and Supplemental data: | ||||||
| Expenses before expense reductions | 0.80(a) | 0.81 | 0.82 | 0.82 | 0.81 | 0.84 |
| Expenses after expense reductions | 0.74(a) | 0.74 | 0.74 | 0.74 | 0.74 | 0.74 |
| Net investment income (loss) | 0.76(a) | 0.74 | 1.04 | 1.29 | 1.10 | 1.11 |
| Portfolio turnover | 20(n) | 57 | 63 | 53 | 64 | 62 |
| Net assets at end of period (000 omitted) | $222,598 | $221,508 | $243,181 | $251,505 | $303,929 | $271,188 |
| Class B | Six months ended | Year ended | ||||
| 3/31/22 (unaudited) | 9/30/21 | 9/30/20 | 9/30/19 | 9/30/18 | 9/30/17 | |
| Net asset value, beginning of period | $33.22 | $27.30 | $25.47 | $28.68 | $25.62 | $22.34 |
| Income (loss) from investment operations | ||||||
| Net investment income (loss) (d) | $0.00(w) | $(0.00)(w) | $0.08 | $0.13 | $0.09 | $0.09 |
| Net realized and unrealized gain (loss) | 1.74 | 7.76 | 2.94 | (0.87) | 3.66 | 3.26 |
| Total from investment operations | $1.74 | $7.76 | $3.02 | $(0.74) | $3.75 | $3.35 |
| Less distributions declared to shareholders | ||||||
| From net investment income | $— | $(0.03) | $(0.18) | $(0.19) | $(0.12) | $(0.07) |
| From net realized gain | (5.08) | (1.81) | (1.01) | (2.28) | (0.57) | — |
| Total distributions declared to shareholders | $(5.08) | $(1.84) | $(1.19) | $(2.47) | $(0.69) | $(0.07) |
| Net asset value, end of period (x) | $29.88 | $33.22 | $27.30 | $25.47 | $28.68 | $25.62 |
| Total return (%) (r)(s)(t)(x) | 4.94(n) | 29.70 | 12.03 | (1.33) | 14.84 | 15.05 |
| Ratios (%) (to average net assets) and Supplemental data: | ||||||
| Expenses before expense reductions | 1.56(a) | 1.55 | 1.57 | 1.57 | 1.56 | 1.59 |
| Expenses after expense reductions | 1.49(a) | 1.49 | 1.49 | 1.49 | 1.49 | 1.49 |
| Net investment income (loss) | 0.01(a) | (0.01) | 0.29 | 0.54 | 0.33 | 0.36 |
| Portfolio turnover | 20(n) | 57 | 63 | 53 | 64 | 62 |
| Net assets at end of period (000 omitted) | $13,692 | $15,538 | $15,562 | $18,064 | $21,577 | $21,193 |
| Class C | Six months ended | Year ended | ||||
| 3/31/22 (unaudited) | 9/30/21 | 9/30/20 | 9/30/19 | 9/30/18 | 9/30/17 | |
| Net asset value, beginning of period | $32.65 | $26.85 | $25.06 | $28.27 | $25.26 | $22.03 |
| Income (loss) from investment operations | ||||||
| Net investment income (loss) (d) | $0.00(w) | $(0.00)(w) | $0.07 | $0.13 | $0.09 | $0.09 |
| Net realized and unrealized gain (loss) | 1.71 | 7.65 | 2.90 | (0.88) | 3.61 | 3.21 |
| Total from investment operations | $1.71 | $7.65 | $2.97 | $(0.75) | $3.70 | $3.30 |
| Less distributions declared to shareholders | ||||||
| From net investment income | $— | $(0.04) | $(0.17) | $(0.18) | $(0.12) | $(0.07) |
| From net realized gain | (5.08) | (1.81) | (1.01) | (2.28) | (0.57) | — |
| Total distributions declared to shareholders | $(5.08) | $(1.85) | $(1.18) | $(2.46) | $(0.69) | $(0.07) |
| Net asset value, end of period (x) | $29.28 | $32.65 | $26.85 | $25.06 | $28.27 | $25.26 |
| Total return (%) (r)(s)(t)(x) | 4.94(n) | 29.76 | 12.02 | (1.37) | 14.86 | 15.03 |
| Ratios (%) (to average net assets) and Supplemental data: | ||||||
| Expenses before expense reductions | 1.56(a) | 1.55 | 1.57 | 1.57 | 1.56 | 1.59 |
| Expenses after expense reductions | 1.49(a) | 1.49 | 1.49 | 1.49 | 1.49 | 1.49 |
| Net investment income (loss) | 0.01(a) | (0.02) | 0.29 | 0.54 | 0.33 | 0.36 |
| Portfolio turnover | 20(n) | 57 | 63 | 53 | 64 | 62 |
| Net assets at end of period (000 omitted) | $39,676 | $45,369 | $44,725 | $53,788 | $70,299 | $74,489 |
| Class I | Six months ended | Year ended | ||||
| 3/31/22 (unaudited) | 9/30/21 | 9/30/20 | 9/30/19 | 9/30/18 | 9/30/17 | |
| Net asset value, beginning of period | $35.38 | $28.96 | $26.94 | $30.23 | $26.96 | $23.48 |
| Income (loss) from investment operations | ||||||
| Net investment income (loss) (d) | $0.17 | $0.33 | $0.35 | $0.40 | $0.38 | $0.34 |
| Net realized and unrealized gain (loss) | 1.86 | 8.24 | 3.13 | (0.94) | 3.85 | 3.43 |
| Total from investment operations | $2.03 | $8.57 | $3.48 | $(0.54) | $4.23 | $3.77 |
| Less distributions declared to shareholders | ||||||
| From net investment income | $(0.34) | $(0.34) | $(0.45) | $(0.47) | $(0.39) | $(0.29) |
| From net realized gain | (5.08) | (1.81) | (1.01) | (2.28) | (0.57) | — |
| Total distributions declared to shareholders | $(5.42) | $(2.15) | $(1.46) | $(2.75) | $(0.96) | $(0.29) |
| Net asset value, end of period (x) | $31.99 | $35.38 | $28.96 | $26.94 | $30.23 | $26.96 |
| Total return (%) (r)(s)(t)(x) | 5.48(n) | 31.03 | 13.15 | (0.39) | 16.00 | 16.17 |
| Ratios (%) (to average net assets) and Supplemental data: | ||||||
| Expenses before expense reductions | 0.55(a) | 0.56 | 0.57 | 0.57 | 0.56 | 0.59 |
| Expenses after expense reductions | 0.49(a) | 0.49 | 0.49 | 0.49 | 0.49 | 0.49 |
| Net investment income (loss) | 1.01(a) | 0.99 | 1.29 | 1.52 | 1.34 | 1.34 |
| Portfolio turnover | 20(n) | 57 | 63 | 53 | 64 | 62 |
| Net assets at end of period (000 omitted) | $552,279 | $533,711 | $465,900 | $392,729 | $498,169 | $640,745 |
| Class R1 | Six months ended | Year ended | ||||
| 3/31/22 (unaudited) | 9/30/21 | 9/30/20 | 9/30/19 | 9/30/18 | 9/30/17 | |
| Net asset value, beginning of period | $32.92 | $27.10 | $25.18 | $28.39 | $25.38 | $22.13 |
| Income (loss) from investment operations | ||||||
| Net investment income (loss) (d) | $0.00(w) | $(0.00)(w) | $0.13 | $0.13 | $0.09 | $0.09 |
| Net realized and unrealized gain (loss) | 1.72 | 7.71 | 2.80 | (0.87) | 3.62 | 3.23 |
| Total from investment operations | $1.72 | $7.71 | $2.93 | $(0.74) | $3.71 | $3.32 |
| Less distributions declared to shareholders | ||||||
| From net investment income | $— | $(0.08) | $— | $(0.19) | $(0.13) | $(0.07) |
| From net realized gain | (5.08) | (1.81) | (1.01) | (2.28) | (0.57) | — |
| Total distributions declared to shareholders | $(5.08) | $(1.89) | $(1.01) | $(2.47) | $(0.70) | $(0.07) |
| Net asset value, end of period (x) | $29.56 | $32.92 | $27.10 | $25.18 | $28.39 | $25.38 |
| Total return (%) (r)(s)(t)(x) | 4.93(n) | 29.76 | 11.79 | (1.33) | 14.84 | 15.04 |
| Ratios (%) (to average net assets) and Supplemental data: | ||||||
| Expenses before expense reductions | 1.56(a) | 1.55 | 1.58 | 1.57 | 1.56 | 1.59 |
| Expenses after expense reductions | 1.49(a) | 1.49 | 1.49 | 1.49 | 1.49 | 1.49 |
| Net investment income (loss) | 0.01(a) | (0.01) | 0.49 | 0.54 | 0.33 | 0.36 |
| Portfolio turnover | 20(n) | 57 | 63 | 53 | 64 | 62 |
| Net assets at end of period (000 omitted) | $1,384 | $1,333 | $1,084 | $10,895 | $13,185 | $14,665 |
| Class R2 | Six months ended | Year ended | ||||
| 3/31/22 (unaudited) | 9/30/21 | 9/30/20 | 9/30/19 | 9/30/18 | 9/30/17 | |
| Net asset value, beginning of period | $33.02 | $27.16 | $25.32 | $28.58 | $25.58 | $22.31 |
| Income (loss) from investment operations | ||||||
| Net investment income (loss) (d) | $0.08 | $0.15 | $0.20 | $0.26 | $0.23 | $0.20 |
| Net realized and unrealized gain (loss) | 1.74 | 7.70 | 2.94 | (0.90) | 3.65 | 3.25 |
| Total from investment operations | $1.82 | $7.85 | $3.14 | $(0.64) | $3.88 | $3.45 |
| Less distributions declared to shareholders | ||||||
| From net investment income | $(0.15) | $(0.18) | $(0.29) | $(0.34) | $(0.31) | $(0.18) |
| From net realized gain | (5.08) | (1.81) | (1.01) | (2.28) | (0.57) | — |
| Total distributions declared to shareholders | $(5.23) | $(1.99) | $(1.30) | $(2.62) | $(0.88) | $(0.18) |
| Net asset value, end of period (x) | $29.61 | $33.02 | $27.16 | $25.32 | $28.58 | $25.58 |
| Total return (%) (r)(s)(t)(x) | 5.24(n) | 30.33 | 12.60 | (0.87) | 15.47 | 15.56 |
| Ratios (%) (to average net assets) and Supplemental data: | ||||||
| Expenses before expense reductions | 1.06(a) | 1.05 | 1.07 | 1.07 | 1.06 | 1.09 |
| Expenses after expense reductions | 0.99(a) | 0.99 | 0.99 | 0.99 | 0.99 | 0.99 |
| Net investment income (loss) | 0.51(a) | 0.49 | 0.79 | 1.04 | 0.85 | 0.86 |
| Portfolio turnover | 20(n) | 57 | 63 | 53 | 64 | 62 |
| Net assets at end of period (000 omitted) | $45,185 | $48,557 | $45,533 | $52,605 | $73,655 | $41,539 |
| Class R3 | Six months ended | Year ended | ||||
| 3/31/22 (unaudited) | 9/30/21 | 9/30/20 | 9/30/19 | 9/30/18 | 9/30/17 | |
| Net asset value, beginning of period | $34.66 | $28.40 | $26.44 | $29.69 | $26.49 | $23.08 |
| Income (loss) from investment operations | ||||||
| Net investment income (loss) (d) | $0.13 | $0.24 | $0.28 | $0.33 | $0.31 | $0.27 |
| Net realized and unrealized gain (loss) | 1.82 | 8.08 | 3.06 | (0.92) | 3.78 | 3.37 |
| Total from investment operations | $1.95 | $8.32 | $3.34 | $(0.59) | $4.09 | $3.64 |
| Less distributions declared to shareholders | ||||||
| From net investment income | $(0.24) | $(0.25) | $(0.37) | $(0.38) | $(0.32) | $(0.23) |
| From net realized gain | (5.08) | (1.81) | (1.01) | (2.28) | (0.57) | — |
| Total distributions declared to shareholders | $(5.32) | $(2.06) | $(1.38) | $(2.66) | $(0.89) | $(0.23) |
| Net asset value, end of period (x) | $31.29 | $34.66 | $28.40 | $26.44 | $29.69 | $26.49 |
| Total return (%) (r)(s)(t)(x) | 5.36(n) | 30.71 | 12.84 | (0.60) | 15.73 | 15.89 |
| Ratios (%) (to average net assets) and Supplemental data: | ||||||
| Expenses before expense reductions | 0.80(a) | 0.81 | 0.82 | 0.82 | 0.81 | 0.84 |
| Expenses after expense reductions | 0.74(a) | 0.74 | 0.74 | 0.74 | 0.74 | 0.74 |
| Net investment income (loss) | 0.76(a) | 0.73 | 1.05 | 1.28 | 1.11 | 1.11 |
| Portfolio turnover | 20(n) | 57 | 63 | 53 | 64 | 62 |
| Net assets at end of period (000 omitted) | $45,642 | $50,589 | $59,630 | $77,311 | $113,415 | $110,105 |
| Class R4 | Six months ended | Year ended | ||||
| 3/31/22 (unaudited) | 9/30/21 | 9/30/20 | 9/30/19 | 9/30/18 | 9/30/17 | |
| Net asset value, beginning of period | $34.99 | $28.65 | $26.66 | $29.96 | $26.72 | $23.27 |
| Income (loss) from investment operations | ||||||
| Net investment income (loss) (d) | $0.17 | $0.32 | $0.35 | $0.40 | $0.38 | $0.34 |
| Net realized and unrealized gain (loss) | 1.83 | 8.16 | 3.09 | (0.95) | 3.82 | 3.40 |
| Total from investment operations | $2.00 | $8.48 | $3.44 | $(0.55) | $4.20 | $3.74 |
| Less distributions declared to shareholders | ||||||
| From net investment income | $(0.32) | $(0.33) | $(0.44) | $(0.47) | $(0.39) | $(0.29) |
| From net realized gain | (5.08) | (1.81) | (1.01) | (2.28) | (0.57) | — |
| Total distributions declared to shareholders | $(5.40) | $(2.14) | $(1.45) | $(2.75) | $(0.96) | $(0.29) |
| Net asset value, end of period (x) | $31.59 | $34.99 | $28.65 | $26.66 | $29.96 | $26.72 |
| Total return (%) (r)(s)(t)(x) | 5.47(n) | 31.06 | 13.15 | (0.39) | 16.02 | 16.20 |
| Ratios (%) (to average net assets) and Supplemental data: | ||||||
| Expenses before expense reductions | 0.55(a) | 0.56 | 0.57 | 0.57 | 0.56 | 0.59 |
| Expenses after expense reductions | 0.49(a) | 0.49 | 0.49 | 0.49 | 0.49 | 0.49 |
| Net investment income (loss) | 1.01(a) | 0.99 | 1.28 | 1.54 | 1.34 | 1.36 |
| Portfolio turnover | 20(n) | 57 | 63 | 53 | 64 | 62 |
| Net assets at end of period (000 omitted) | $10,278 | $12,391 | $16,640 | $23,253 | $44,630 | $43,741 |
| Class R6 | Six months ended | Year ended | ||||
| 3/31/22 (unaudited) | 9/30/21 | 9/30/20 | 9/30/19 | 9/30/18 | 9/30/17 | |
| Net asset value, beginning of period | $35.45 | $29.02 | $26.99 | $30.29 | $27.01 | $23.52 |
| Income (loss) from investment operations | ||||||
| Net investment income (loss) (d) | $0.19 | $0.36 | $0.38 | $0.43 | $0.41 | $0.37 |
| Net realized and unrealized gain (loss) | 1.86 | 8.24 | 3.14 | (0.94) | 3.86 | 3.43 |
| Total from investment operations | $2.05 | $8.60 | $3.52 | $(0.51) | $4.27 | $3.80 |
| Less distributions declared to shareholders | ||||||
| From net investment income | $(0.37) | $(0.36) | $(0.48) | $(0.51) | $(0.42) | $(0.31) |
| From net realized gain | (5.08) | (1.81) | (1.01) | (2.28) | (0.57) | — |
| Total distributions declared to shareholders | $(5.45) | $(2.17) | $(1.49) | $(2.79) | $(0.99) | $(0.31) |
| Net asset value, end of period (x) | $32.05 | $35.45 | $29.02 | $26.99 | $30.29 | $27.01 |
| Total return (%) (r)(s)(t)(x) | 5.55(n) | 31.13 | 13.28 | (0.25) | 16.13 | 16.31 |
| Ratios (%) (to average net assets) and Supplemental data: | ||||||
| Expenses before expense reductions | 0.45(a) | 0.45 | 0.46 | 0.46 | 0.45 | 0.47 |
| Expenses after expense reductions | 0.39(a) | 0.39 | 0.38 | 0.38 | 0.38 | 0.37 |
| Net investment income (loss) | 1.11(a) | 1.09 | 1.40 | 1.64 | 1.45 | 1.48 |
| Portfolio turnover | 20(n) | 57 | 63 | 53 | 64 | 62 |
| Net assets at end of period (000 omitted) | $225,378 | $219,533 | $180,306 | $171,658 | $220,856 | $217,799 |
| (a) | Annualized. |
| (d) | Per share data is based on average shares outstanding. |
| (n) | Not annualized. |
| (r) | Certain expenses have been reduced without which performance would have been lower. |
| (s) | From time to time the fund may receive proceeds from litigation settlements, without which performance would be lower. |
| (t) | Total returns do not include any applicable sales charges. |
| (w) | Per share amount was less than $0.01. |
| (x) | The net asset values and total returns have been calculated on net assets which include adjustments made in accordance with U.S. generally accepted accounting principles required at period end for financial reporting purposes. |
| Financial Instruments | Level 1 | Level 2 | Level 3 | Total |
| Equity Securities | $1,144,376,684 | $— | $— | $1,144,376,684 |
| Mutual Funds | 12,322,362 | — | — | 12,322,362 |
| Total | $1,156,699,046 | $— | $— | $1,156,699,046 |
| Year ended 9/30/21 | |
| Ordinary income (including any short-term capital gains) | $15,993,738 |
| Long-term capital gains | 62,665,474 |
| Total distributions | $78,659,212 |
| As of 3/31/22 | |
| Cost of investments | $755,601,186 |
| Gross appreciation | 419,069,518 |
| Gross depreciation | (17,971,658) |
| Net unrealized appreciation (depreciation) | $401,097,860 |
| As of 9/30/21 | |
| Undistributed ordinary income | 52,795,416 |
| Undistributed long-term capital gain | 116,057,419 |
| Net unrealized appreciation (depreciation) | 404,893,116 |
| Six months ended 3/31/22 | Year ended 9/30/21 | ||
| Class A | $33,423,401 | $17,553,690 | |
| Class B | 2,234,558 | 996,778 | |
| Class C | 6,661,137 | 2,922,697 | |
| Class I | 80,514,448 | 35,171,904 | |
| Class R1 | 199,693 | 76,997 | |
| Class R2 | 7,300,378 | 3,238,481 | |
| Class R3 | 7,378,223 | 4,051,354 | |
| Class R4 | 1,603,043 | 1,141,622 | |
| Class R6 | 32,669,715 | 13,505,689 | |
| Total | $171,984,596 | $78,659,212 |
| Up to $1 billion | 0.40% |
| In excess of $1 billion and up to $2.5 billion | 0.375% |
| In excess of $2.5 billion | 0.35% |
| Classes | ||||||||
| A | B | C | I | R1 | R2 | R3 | R4 | R6 |
| 0.74% | 1.49% | 1.49% | 0.49% | 1.49% | 0.99% | 0.74% | 0.49% | 0.42% |
| Distribution Fee Rate (d) | Service Fee Rate (d) | Total Distribution Plan (d) | Annual Effective Rate (e) | Distribution and Service Fee | |
| Class A | — | 0.25% | 0.25% | 0.25% | $ 283,632 |
| Class B | 0.75% | 0.25% | 1.00% | 1.00% | 74,883 |
| Class C | 0.75% | 0.25% | 1.00% | 1.00% | 220,194 |
| Class R1 | 0.75% | 0.25% | 1.00% | 1.00% | 6,794 |
| Class R2 | 0.25% | 0.25% | 0.50% | 0.50% | 118,950 |
| Class R3 | — | 0.25% | 0.25% | 0.25% | 62,052 |
| Total Distribution and Service Fees | $766,505 |
| (d) | In accordance with the distribution plan for certain classes, the fund pays distribution and/or service fees equal to these annual percentage rates of each class’s average daily net assets. The distribution and service fee rates disclosed by class represent the current rates in effect at the end of the reporting period. Any rate changes, if applicable, are detailed below. |
| (e) | The annual effective rates represent actual fees incurred under the distribution plan for the six months ended March 31, 2022 based on each class's average daily net assets. MFD has voluntarily agreed to rebate a portion of each class’s 0.25% service fee attributable to accounts for which there is no financial intermediary specified on the account except for accounts attributable to MFS or its affiliates’ seed money. For the six months ended March 31, 2022, this rebate amounted to $4, $5, and $128 for Class A, Class C, and Class R3, respectively, and is included in the reduction of total expenses in the Statement of Operations. |
| Amount | |
| Class A | $80 |
| Class B | 2,202 |
| Class C | 444 |
| Six months ended 3/31/22 | Year ended 9/30/21 | ||||
| Shares | Amount | Shares | Amount | ||
| Shares sold | |||||
| Class A | 481,271 | $15,579,561 | 1,334,413 | $41,998,464 | |
| Class B | 4,314 | 132,994 | 1,267 | 36,804 | |
| Class C | 26,528 | 796,430 | 47,122 | 1,426,388 | |
| Class I | 1,729,606 | 57,651,161 | 5,839,587 | 197,867,677 | |
| Class R1 | 2,825 | 87,673 | 6,333 | 194,416 | |
| Class R2 | 120,394 | 3,816,311 | 268,137 | 8,346,913 | |
| Class R3 | 158,062 | 5,126,441 | 178,172 | 5,750,403 | |
| Class R4 | 27,510 | 895,173 | 144,170 | 4,761,994 | |
| Class R6 | 441,058 | 13,970,885 | 1,313,685 | 43,683,747 | |
| 2,991,568 | $98,056,629 | 9,132,886 | $304,066,806 | ||
| Six months ended 3/31/22 | Year ended 9/30/21 | ||||
| Shares | Amount | Shares | Amount | ||
| Shares issued to shareholders in reinvestment of distributions | |||||
| Class A | 936,278 | $29,904,719 | 387,971 | $11,309,359 | |
| Class B | 71,839 | 2,188,229 | 34,830 | 976,286 | |
| Class C | 221,632 | 6,613,497 | 104,347 | 2,873,716 | |
| Class I | 2,442,390 | 79,402,101 | 1,168,902 | 34,611,176 | |
| Class R1 | 6,628 | 199,693 | 2,773 | 76,997 | |
| Class R2 | 242,296 | 7,300,378 | 116,688 | 3,238,090 | |
| Class R3 | 231,874 | 7,378,223 | 139,365 | 4,051,354 | |
| Class R4 | 49,939 | 1,603,043 | 38,990 | 1,141,622 | |
| Class R6 | 971,665 | 31,637,404 | 436,470 | 12,941,348 | |
| 5,174,541 | $166,227,287 | 2,430,336 | $71,219,948 | ||
| Shares reacquired | |||||
| Class A | (702,660) | $(22,814,162) | (3,885,679) | $(133,712,317) | |
| Class B | (85,708) | (2,711,704) | (138,475) | (4,229,837) | |
| Class C | (282,823) | (8,646,617) | (427,144) | (12,690,948) | |
| Class I | (1,991,653) | (68,128,500) | (8,010,040) | (263,017,758) | |
| Class R1 | (3,141) | (101,037) | (8,605) | (280,351) | |
| Class R2 | (306,810) | (9,752,386) | (591,227) | (18,452,028) | |
| Class R3 | (390,654) | (12,810,388) | (957,444) | (30,186,746) | |
| Class R4 | (106,248) | (3,691,725) | (409,706) | (13,639,703) | |
| Class R6 | (572,201) | (19,696,479) | (1,772,030) | (59,560,034) | |
| (4,441,898) | $(148,352,998) | (16,200,350) | $(535,769,722) | ||
| Net change | |||||
| Class A | 714,889 | $22,670,118 | (2,163,295) | $(80,404,494) | |
| Class B | (9,555) | (390,481) | (102,378) | (3,216,747) | |
| Class C | (34,663) | (1,236,690) | (275,675) | (8,390,844) | |
| Class I | 2,180,343 | 68,924,762 | (1,001,551) | (30,538,905) | |
| Class R1 | 6,312 | 186,329 | 501 | (8,938) | |
| Class R2 | 55,880 | 1,364,303 | (206,402) | (6,867,025) | |
| Class R3 | (718) | (305,724) | (639,907) | (20,384,989) | |
| Class R4 | (28,799) | (1,193,509) | (226,546) | (7,736,087) | |
| Class R6 | 840,522 | 25,911,810 | (21,875) | (2,934,939) | |
| 3,724,211 | $115,930,918 | (4,637,128) | $(160,482,968) | ||
| Affiliated Issuers | Beginning Value | Purchases | Sales Proceeds | Realized Gain (Loss) | Change in Unrealized Appreciation or Depreciation | Ending Value |
| MFS Institutional Money Market Portfolio | $7,530,565 | $74,554,366 | $69,762,569 | $— | $— | $12,322,362 |
| Affiliated Issuers | Dividend Income | Capital Gain Distributions |
| MFS Institutional Money Market Portfolio | $3,287 | $— |


| 1 | |
| 2 | |
| 3 | |
| 5 | |
| 12 | |
| 14 | |
| 15 | |
| 16 | |
| 26 | |
| 39 | |
| 40 | |
| 40 | |
| 40 | |
| 40 | |
| 40 |
| back cover |


| KBR, Inc. | 1.2% |
| Hartford Financial Services Group, Inc. | 1.2% |
| Life Storage, Inc., REIT | 1.2% |
| Pioneer Natural Resources Co. | 1.1% |
| Devon Energy Corp. | 1.1% |
| Johnson Controls International PLC | 1.1% |
| Arthur J. Gallagher & Co. | 1.1% |
| Mid-America Apartment Communities, Inc., REIT | 1.1% |
| Dollar Tree, Inc. | 1.0% |
| Eaton Corp. PLC | 1.0% |
| Financials | 20.2% |
| Industrials | 16.3% |
| Consumer Discretionary | 9.8% |
| Materials | 8.9% |
| Utilities | 8.1% |
| Information Technology | 7.4% |
| Health Care | 7.1% |
| Real Estate | 6.8% |
| Energy | 6.7% |
| Consumer Staples | 4.0% |
| Communication Services | 1.7% |
| (g) | The Global Industry Classification Standard (GICS®) was developed by and/or is the exclusive property of MSCI, Inc. and S&P Global Market Intelligence Inc. (“S&P Global Market Intelligence”). GICS is a service mark of MSCI and S&P Global Market Intelligence and has been licensed for use by MFS. MFS has applied its own internal sector/industry classification methodology for equity securities and non-equity securities that are unclassified by GICS. |
October 1, 2021 through March 31, 2022
| Share Class | Annualized Expense Ratio | Beginning Account Value 10/01/21 | Ending Account Value 3/31/22 | Expenses Paid During Period (p) 10/01/21-3/31/22 | |
| A | Actual | 0.98% | $1,000.00 | $1,072.50 | $5.06 |
| Hypothetical (h) | 0.98% | $1,000.00 | $1,020.04 | $4.94 | |
| B | Actual | 1.73% | $1,000.00 | $1,068.42 | $8.92 |
| Hypothetical (h) | 1.73% | $1,000.00 | $1,016.31 | $8.70 | |
| C | Actual | 1.73% | $1,000.00 | $1,068.07 | $8.92 |
| Hypothetical (h) | 1.73% | $1,000.00 | $1,016.31 | $8.70 | |
| I | Actual | 0.73% | $1,000.00 | $1,074.00 | $3.77 |
| Hypothetical (h) | 0.73% | $1,000.00 | $1,021.29 | $3.68 | |
| R1 | Actual | 1.73% | $1,000.00 | $1,068.34 | $8.92 |
| Hypothetical (h) | 1.73% | $1,000.00 | $1,016.31 | $8.70 | |
| R2 | Actual | 1.23% | $1,000.00 | $1,070.88 | $6.35 |
| Hypothetical (h) | 1.23% | $1,000.00 | $1,018.80 | $6.19 | |
| R3 | Actual | 0.98% | $1,000.00 | $1,072.37 | $5.06 |
| Hypothetical (h) | 0.98% | $1,000.00 | $1,020.04 | $4.94 | |
| R4 | Actual | 0.73% | $1,000.00 | $1,073.53 | $3.77 |
| Hypothetical (h) | 0.73% | $1,000.00 | $1,021.29 | $3.68 | |
| R6 | Actual | 0.61% | $1,000.00 | $1,074.33 | $3.15 |
| Hypothetical (h) | 0.61% | $1,000.00 | $1,021.89 | $3.07 | |
| 529A | Actual | 1.02% | $1,000.00 | $1,072.25 | $5.27 |
| Hypothetical (h) | 1.02% | $1,000.00 | $1,019.85 | $5.14 |
| (h) | 5% class return per year before expenses. |
| (p) | “Expenses Paid During Period” are equal to each class’s annualized expense ratio, as shown above, multiplied by the average account value over the period, multiplied by 182/365 (to reflect the one-half year period). Expenses paid do not include any applicable sales charges (loads). If these transaction costs had been included, your costs would have been higher. |
| Issuer | Shares/Par | Value ($) | ||
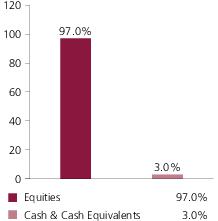
| Common Stocks – 96.7% | ||||
| Aerospace & Defense – 3.5% | ||||
| Howmet Aerospace, Inc. | 3,332,267 | $ 119,761,676 | ||
| KBR, Inc. | 3,667,977 | 200,748,381 | ||
| L3Harris Technologies, Inc. | 590,635 | 146,755,079 | ||
| Leidos Holdings, Inc. | 1,090,260 | 117,769,885 | ||
| $ 585,035,021 | ||||
| Airlines – 1.0% | ||||
| Alaska Air Group, Inc. (a) | 1,229,654 | $ 71,332,229 | ||
| Delta Air Lines, Inc. (a) | 2,160,978 | 85,509,899 | ||
| $ 156,842,128 | ||||
| Apparel Manufacturers – 0.9% | ||||
| PVH Corp. | 683,925 | $ 52,395,494 | ||
| Skechers USA, Inc., “A” (a) | 2,555,543 | 104,163,933 | ||
| $ 156,559,427 | ||||
| Automotive – 2.0% | ||||
| Aptiv PLC (a) | 705,543 | $ 84,460,553 | ||
| Lear Corp. | 603,402 | 86,039,091 | ||
| LKQ Corp. | 3,519,062 | 159,800,605 | ||
| $ 330,300,249 | ||||
| Broadcasting – 0.4% | ||||
| Discovery Communications, Inc., “C” (a) | 2,720,301 | $ 67,925,916 | ||
| Brokerage & Asset Managers – 3.4% | ||||
| Apollo Global Management, Inc. | 2,675,116 | $ 165,830,441 | ||
| Cboe Global Markets, Inc. | 764,824 | 87,511,162 | ||
| Invesco Ltd. | 3,179,411 | 73,317,218 | ||
| Raymond James Financial, Inc. | 1,513,143 | 166,309,547 | ||
| TPG, Inc. (a) | 2,002,039 | 60,341,455 | ||
| $ 553,309,823 | ||||
| Business Services – 1.6% | ||||
| Amdocs Ltd. | 1,682,710 | $ 138,335,589 | ||
| Global Payments, Inc. | 874,716 | 119,696,138 | ||
| $ 258,031,727 | ||||
| Issuer | Shares/Par | Value ($) | ||
| Common Stocks – continued | ||||
| Chemicals – 2.1% | ||||
| Celanese Corp. | 781,267 | $ 111,619,616 | ||
| Eastman Chemical Co. | 1,449,035 | 162,378,862 | ||
| FMC Corp. | 612,733 | 80,617,281 | ||
| $ 354,615,759 | ||||
| Computer Software – 0.8% | ||||
| Black Knight, Inc. (a) | 1,422,741 | $ 82,504,751 | ||
| Dun & Bradstreet Holdings, Inc. (a) | 3,113,468 | 54,547,959 | ||
| $ 137,052,710 | ||||
| Computer Software - Systems – 1.5% | ||||
| NCR Corp. (a) | 1,239,313 | $ 49,807,990 | ||
| Verint Systems, Inc. (a) | 1,091,960 | 56,454,332 | ||
| Zebra Technologies Corp., “A” (a) | 323,349 | 133,769,481 | ||
| $ 240,031,803 | ||||
| Construction – 5.0% | ||||
| Armstrong World Industries, Inc. | 612,483 | $ 55,129,595 | ||
| Builders FirstSource, Inc. (a) | 749,630 | 48,381,120 | ||
| Fortune Brands Home & Security, Inc. | 1,072,978 | 79,700,806 | ||
| Masco Corp. | 1,995,462 | 101,768,562 | ||
| Mid-America Apartment Communities, Inc., REIT | 829,286 | 173,693,953 | ||
| Stanley Black & Decker, Inc. | 947,836 | 132,497,994 | ||
| Toll Brothers, Inc. | 2,979,832 | 140,111,701 | ||
| Vulcan Materials Co. | 531,189 | 97,579,419 | ||
| $ 828,863,150 | ||||
| Consumer Products – 1.3% | ||||
| Energizer Holdings, Inc. | 1,561,761 | $ 48,039,768 | ||
| International Flavors & Fragrances, Inc. | 450,462 | 59,159,175 | ||
| Newell Brands, Inc. | 4,688,069 | 100,371,557 | ||
| $ 207,570,500 | ||||
| Consumer Services – 0.5% | ||||
| Grand Canyon Education, Inc. (a) | 920,360 | $ 89,376,160 | ||
| Containers – 2.7% | ||||
| Berry Global, Inc. (a) | 1,823,605 | $ 105,696,145 | ||
| Crown Holdings, Inc. | 996,889 | 124,700,845 | ||
| Graphic Packaging Holding Co. | 5,722,796 | 114,684,832 | ||
| WestRock Co. | 2,178,962 | 102,476,583 | ||
| $ 447,558,405 | ||||
| Issuer | Shares/Par | Value ($) | ||
| Common Stocks – continued | ||||
| Electrical Equipment – 2.4% | ||||
| Johnson Controls International PLC | 2,697,238 | $ 176,857,896 | ||
| Sensata Technologies Holding PLC (a) | 2,097,011 | 106,633,009 | ||
| TE Connectivity Ltd. | 805,311 | 105,479,635 | ||
| $ 388,970,540 | ||||
| Electronics – 2.3% | ||||
| Corning, Inc. | 2,892,302 | $ 106,754,867 | ||
| NXP Semiconductors N.V. | 738,186 | 136,623,465 | ||
| ON Semiconductor Corp. (a) | 2,203,586 | 137,966,519 | ||
| $ 381,344,851 | ||||
| Energy - Independent – 5.0% | ||||
| Coterra Energy, Inc. | 3,114,588 | $ 84,000,439 | ||
| Devon Energy Corp. | 3,055,309 | 180,660,421 | ||
| Diamondback Energy, Inc. | 1,054,094 | 144,495,206 | ||
| Hess Corp. | 1,279,183 | 136,923,748 | ||
| Pioneer Natural Resources Co. | 738,509 | 184,649,405 | ||
| Valero Energy Corp. | 967,365 | 98,226,242 | ||
| $ 828,955,461 | ||||
| Energy - Renewables – 0.9% | ||||
| AES Corp. | 5,721,393 | $ 147,211,442 | ||
| Engineering - Construction – 0.5% | ||||
| Quanta Services, Inc. | 614,004 | $ 80,809,066 | ||
| Food & Beverages – 2.3% | ||||
| Coca-Cola Europacific Partners PLC | 1,686,971 | $ 82,003,660 | ||
| Ingredion, Inc. | 1,122,120 | 97,792,758 | ||
| J.M. Smucker Co. | 680,583 | 92,157,744 | ||
| Kellogg Co. | 1,582,032 | 102,025,244 | ||
| $ 373,979,406 | ||||
| Food & Drug Stores – 0.7% | ||||
| Albertsons Cos., Inc., “A” | 3,528,974 | $ 117,338,385 | ||
| Gaming & Lodging – 0.8% | ||||
| Hyatt Hotels Corp. (a) | 753,180 | $ 71,891,031 | ||
| International Game Technology PLC | 2,281,266 | 56,301,645 | ||
| $ 128,192,676 | ||||
| General Merchandise – 1.0% | ||||
| Dollar Tree, Inc. (a) | 1,079,376 | $ 172,862,066 | ||
| Issuer | Shares/Par | Value ($) | ||
| Common Stocks – continued | ||||
| Insurance – 8.1% | ||||
| American International Group, Inc. | 1,498,673 | $ 94,071,704 | ||
| Arthur J. Gallagher & Co. | 1,007,711 | 175,946,341 | ||
| Assurant, Inc. | 833,847 | 151,618,400 | ||
| Cincinnati Financial Corp. | 486,309 | 66,118,572 | ||
| Equitable Holdings, Inc. | 4,466,606 | 138,062,791 | ||
| Everest Re Group Ltd. | 472,143 | 142,294,457 | ||
| Hanover Insurance Group, Inc. | 536,638 | 80,238,114 | ||
| Hartford Financial Services Group, Inc. | 2,762,918 | 198,405,142 | ||
| Reinsurance Group of America, Inc. | 728,611 | 79,753,760 | ||
| Voya Financial, Inc. | 1,083,673 | 71,901,703 | ||
| Willis Towers Watson PLC | 600,726 | 141,903,496 | ||
| $ 1,340,314,480 | ||||
| Leisure & Toys – 1.9% | ||||
| Brunswick Corp. | 1,100,041 | $ 88,982,317 | ||
| Electronic Arts, Inc. | 638,566 | 80,784,985 | ||
| Mattel, Inc. (a) | 3,636,924 | 80,776,082 | ||
| Polaris, Inc. | 527,289 | 55,534,077 | ||
| $ 306,077,461 | ||||
| Machinery & Tools – 4.5% | ||||
| Eaton Corp. PLC | 1,122,508 | $ 170,351,814 | ||
| Ingersoll Rand, Inc. | 2,210,382 | 111,292,734 | ||
| ITT, Inc. | 955,238 | 71,843,450 | ||
| PACCAR, Inc. | 1,629,614 | 143,520,105 | ||
| Regal Rexnord Corp. | 895,347 | 133,209,726 | ||
| Wabtec Corp. | 1,129,398 | 108,614,206 | ||
| $ 738,832,035 | ||||
| Major Banks – 2.0% | ||||
| Comerica, Inc. | 1,243,395 | $ 112,440,210 | ||
| KeyCorp | 5,579,907 | 124,878,319 | ||
| State Street Corp. | 1,038,538 | 90,477,430 | ||
| $ 327,795,959 | ||||
| Medical & Health Technology & Services – 3.9% | ||||
| AmerisourceBergen Corp. | 923,454 | $ 142,867,568 | ||
| ICON PLC (a) | 444,124 | 108,019,839 | ||
| Laboratory Corp. of America Holdings (a) | 429,745 | 113,306,567 | ||
| Quest Diagnostics, Inc. | 743,627 | 101,772,791 | ||
| Syneos Health, Inc. (a) | 760,250 | 61,542,238 | ||
| Universal Health Services, Inc. | 855,779 | 124,045,166 | ||
| $ 651,554,169 | ||||
| Issuer | Shares/Par | Value ($) | ||
| Common Stocks – continued | ||||
| Medical Equipment – 2.7% | ||||
| Dentsply Sirona, Inc. | 2,393,068 | $ 117,786,807 | ||
| Hologic, Inc. (a) | 965,822 | 74,194,446 | ||
| PerkinElmer, Inc. | 770,993 | 134,507,439 | ||
| Zimmer Biomet Holdings, Inc. | 907,470 | 116,065,413 | ||
| $ 442,554,105 | ||||
| Natural Gas - Distribution – 0.4% | ||||
| Atmos Energy Corp. | 525,416 | $ 62,781,958 | ||
| Natural Gas - Pipeline – 1.2% | ||||
| Plains GP Holdings LP | 6,642,342 | $ 76,719,050 | ||
| Targa Resources Corp. | 1,524,437 | 115,049,260 | ||
| $ 191,768,310 | ||||
| Network & Telecom – 0.9% | ||||
| Motorola Solutions, Inc. | 599,838 | $ 145,280,764 | ||
| Oil Services – 0.5% | ||||
| Halliburton Co. | 2,376,374 | $ 89,993,283 | ||
| Other Banks & Diversified Financials – 6.7% | ||||
| Discover Financial Services | 1,069,022 | $ 117,795,534 | ||
| East West Bancorp, Inc. | 1,057,055 | 83,528,486 | ||
| Element Fleet Management Corp. | 6,167,253 | 59,691,846 | ||
| Northern Trust Corp. | 1,029,204 | 119,850,806 | ||
| Prosperity Bancshares, Inc. | 1,142,674 | 79,278,722 | ||
| Signature Bank | 365,796 | 107,357,468 | ||
| SLM Corp. | 7,252,047 | 133,147,583 | ||
| SVB Financial Group (a) | 174,417 | 97,577,590 | ||
| Umpqua Holdings Corp. | 4,797,723 | 90,485,056 | ||
| Wintrust Financial Corp. | 844,830 | 78,510,052 | ||
| Zions Bancorp NA | 2,230,380 | 146,223,713 | ||
| $ 1,113,446,856 | ||||
| Pharmaceuticals – 0.5% | ||||
| Organon & Co. | 2,350,763 | $ 82,112,152 | ||
| Pollution Control – 1.1% | ||||
| GFL Environmental, Inc. | 1,634,865 | $ 53,198,507 | ||
| Republic Services, Inc. | 931,903 | 123,477,148 | ||
| $ 176,675,655 | ||||
| Real Estate – 5.7% | ||||
| Boston Properties, Inc., REIT | 435,309 | $ 56,067,799 | ||
| Brixmor Property Group, Inc., REIT | 4,456,206 | 115,014,677 | ||
| Host Hotels & Resorts, Inc., REIT | 4,917,338 | 95,543,877 | ||
| Issuer | Shares/Par | Value ($) | ||
| Common Stocks – continued | ||||
| Real Estate – continued | ||||
| Life Storage, Inc., REIT | 1,357,589 | $ 190,646,223 | ||
| Spirit Realty Capital, Inc., REIT | 1,275,128 | 58,681,391 | ||
| STAG Industrial, Inc., REIT | 1,259,756 | 52,090,911 | ||
| Sun Communities, Inc., REIT | 754,204 | 132,204,419 | ||
| VICI Properties, Inc., REIT | 4,790,319 | 136,332,479 | ||
| W.P. Carey, Inc., REIT | 1,258,887 | 101,768,425 | ||
| $ 938,350,201 | ||||
| Restaurants – 1.8% | ||||
| Aramark | 2,936,006 | $ 110,393,825 | ||
| Performance Food Group Co. (a) | 1,297,945 | 66,078,380 | ||
| Wendy's Co. | 5,361,408 | 117,790,134 | ||
| $ 294,262,339 | ||||
| Specialty Chemicals – 3.3% | ||||
| Ashland Global Holdings, Inc. | 1,069,726 | $ 105,271,736 | ||
| Axalta Coating Systems Ltd. (a) | 4,021,328 | 98,844,242 | ||
| Corteva, Inc. | 2,715,178 | 156,068,431 | ||
| DuPont de Nemours, Inc. | 1,983,611 | 145,954,097 | ||
| Univar Solutions, Inc. (a) | 1,408,805 | 45,278,993 | ||
| $ 551,417,499 | ||||
| Specialty Stores – 0.3% | ||||
| Urban Outfitters, Inc. (a) | 2,056,606 | $ 51,641,377 | ||
| Telecommunications - Wireless – 0.7% | ||||
| Liberty Broadband Corp. (a) | 792,464 | $ 107,236,228 | ||
| Telephone Services – 0.2% | ||||
| Altice USA, Inc., “A” (a) | 2,357,216 | $ 29,418,056 | ||
| Trucking – 0.9% | ||||
| Knight-Swift Transportation Holdings, Inc. | 1,519,170 | $ 76,657,318 | ||
| XPO Logistics, Inc. (a) | 1,020,477 | 74,290,726 | ||
| $ 150,948,044 | ||||
| Utilities - Electric Power – 6.8% | ||||
| Ameren Corp. | 1,136,397 | $ 106,548,583 | ||
| CenterPoint Energy, Inc. | 4,069,211 | 124,680,625 | ||
| CMS Energy Corp. | 1,937,687 | 135,521,829 | ||
| Edison International | 1,250,966 | 87,692,717 | ||
| Eversource Energy | 1,248,634 | 110,117,032 | ||
| PG&E Corp. (a) | 13,530,683 | 161,556,355 | ||
| Pinnacle West Capital Corp. | 1,478,891 | 115,501,387 | ||
| Public Service Enterprise Group, Inc. | 2,213,531 | 154,947,170 | ||
| Issuer | Shares/Par | Value ($) | ||
| Common Stocks – continued | ||||
| Utilities - Electric Power – continued | ||||
| Sempra Energy | 785,611 | $ 132,076,921 | ||
| $ 1,128,642,619 | ||||
| Total Common Stocks (Identified Cost, $11,352,474,535) | $15,953,840,221 | |||
| Preferred Stocks – 0.3% | ||||
| Consumer Products – 0.3% | ||||
| Henkel AG & Co. KGaA (Identified Cost, $77,791,803) | 875,034 | $ 58,602,810 | ||
| Investment Companies (h) – 2.6% | ||||
| Money Market Funds – 2.6% | ||||
| MFS Institutional Money Market Portfolio, 0.21% (v) (Identified Cost, $423,955,490) | 423,961,422 | $ 423,961,422 | ||
| Other Assets, Less Liabilities – 0.4% | 61,104,774 | |||
| Net Assets – 100.0% | $16,497,509,227 | |||
| (a) | Non-income producing security. | |||
| (h) | An affiliated issuer, which may be considered one in which the fund owns 5% or more of the outstanding voting securities, or a company which is under common control. At period end, the aggregate values of the fund's investments in affiliated issuers and in unaffiliated issuers were $423,961,422 and $16,012,443,031, respectively. | |||
| (v) | Affiliated issuer that is available only to investment companies managed by MFS. The rate quoted for the MFS Institutional Money Market Portfolio is the annualized seven-day yield of the fund at period end. |
| The following abbreviations are used in this report and are defined: | |
| REIT | Real Estate Investment Trust |
| Assets | |
| Investments in unaffiliated issuers, at value (identified cost, $11,430,266,338) | $16,012,443,031 |
| Investments in affiliated issuers, at value (identified cost, $423,955,490) | 423,961,422 |
| Receivables for | |
| Investments sold | 2,938,081 |
| Fund shares sold | 51,467,259 |
| Dividends | 20,631,525 |
| Other assets | 82,875 |
| Total assets | $16,511,524,193 |
| Liabilities | |
| Payable to custodian | $976 |
| Payables for | |
| Fund shares reacquired | 10,601,087 |
| Payable to affiliates | |
| Investment adviser | 543,942 |
| Administrative services fee | 3,196 |
| Shareholder servicing costs | 2,285,883 |
| Distribution and service fees | 43,781 |
| Program manager fees | 37 |
| Payable for independent Trustees' compensation | 17,776 |
| Accrued expenses and other liabilities | 518,288 |
| Total liabilities | $14,014,966 |
| Net assets | $16,497,509,227 |
| Net assets consist of | |
| Paid-in capital | $11,381,271,083 |
| Total distributable earnings (loss) | 5,116,238,144 |
| Net assets | $16,497,509,227 |
| Shares of beneficial interest outstanding | 525,753,090 |
| Net assets | Shares outstanding | Net asset value per share (a) | |
| Class A | $1,809,466,455 | 58,999,611 | $30.67 |
| Class B | 10,744,143 | 373,239 | 28.79 |
| Class C | 110,847,602 | 3,876,478 | 28.59 |
| Class I | 3,822,498,440 | 121,136,524 | 31.56 |
| Class R1 | 14,648,152 | 523,436 | 27.98 |
| Class R2 | 81,067,364 | 2,712,219 | 29.89 |
| Class R3 | 634,106,388 | 20,761,395 | 30.54 |
| Class R4 | 650,218,447 | 21,082,169 | 30.84 |
| Class R6 | 9,350,770,192 | 295,851,448 | 31.61 |
| Class 529A | 13,142,044 | 436,571 | 30.10 |
| (a) | Maximum offering price per share was equal to the net asset value per share for all share classes, except for Classes A and 529A, for which the maximum offering prices per share were $32.54 [100 / 94.25 x $30.67] and $31.94 [100 / 94.25 x $30.10], respectively. On sales of $50,000 or more, the maximum offering prices of Class A and Class 529A shares are reduced. A contingent deferred sales charge may be imposed on redemptions of Class A, Class B, and Class C shares. Redemption price per share was equal to the net asset value per share for Classes I, R1, R2, R3, R4, R6, and 529A. |
| Net investment income (loss) | |
| Income | |
| Dividends | $101,618,919 |
| Other | 278,467 |
| Dividends from affiliated issuers | 109,330 |
| Income on securities loaned | 3,409 |
| Foreign taxes withheld | (263,727) |
| Total investment income | $101,746,398 |
| Expenses | |
| Management fee | $48,421,548 |
| Distribution and service fees | 3,902,419 |
| Shareholder servicing costs | 4,338,543 |
| Program manager fees | 3,200 |
| Administrative services fee | 286,770 |
| Independent Trustees' compensation | 50,217 |
| Custodian fee | 84,338 |
| Shareholder communications | 327,482 |
| Audit and tax fees | 20,513 |
| Legal fees | 36,068 |
| Miscellaneous | 313,499 |
| Total expenses | $57,784,597 |
| Reduction of expenses by investment adviser and distributor | (1,109,691) |
| Net expenses | $56,674,906 |
| Net investment income (loss) | $45,071,492 |
| Realized and unrealized gain (loss) | |
| Realized gain (loss) (identified cost basis) | |
| Unaffiliated issuers | $652,458,767 |
| Foreign currency | 19,484 |
| Net realized gain (loss) | $652,478,251 |
| Change in unrealized appreciation or depreciation | |
| Unaffiliated issuers | $391,043,443 |
| Translation of assets and liabilities in foreign currencies | (5,208) |
| Net unrealized gain (loss) | $391,038,235 |
| Net realized and unrealized gain (loss) | $1,043,516,486 |
| Change in net assets from operations | $1,088,587,978 |
| Six months ended | Year ended | |
| 3/31/22 (unaudited) | 9/30/21 | |
| Change in net assets | ||
| From operations | ||
| Net investment income (loss) | $45,071,492 | $136,344,770 |
| Net realized gain (loss) | 652,478,251 | 744,741,468 |
| Net unrealized gain (loss) | 391,038,235 | 3,263,327,868 |
| Change in net assets from operations | $1,088,587,978 | $4,144,414,106 |
| Total distributions to shareholders | $(900,270,010) | $(120,000,131) |
| Change in net assets from fund share transactions | $1,533,573,091 | $884,549,817 |
| Total change in net assets | $1,721,891,059 | $4,908,963,792 |
| Net assets | ||
| At beginning of period | 14,775,618,168 | 9,866,654,376 |
| At end of period | $16,497,509,227 | $14,775,618,168 |
| Class A | Six months ended | Year ended | ||||
| 3/31/22 (unaudited) | 9/30/21 | 9/30/20 | 9/30/19 | 9/30/18 | 9/30/17 | |
| Net asset value, beginning of period | $30.27 | $21.56 | $23.63 | $24.10 | $22.99 | $20.49 |
| Income (loss) from investment operations | ||||||
| Net investment income (loss) (d) | $0.05 | $0.21 | $0.23 | $0.24 | $0.18 | $0.13(c) |
| Net realized and unrealized gain (loss) | 2.15 | 8.70 | (1.79) | 0.53 | 1.71 | 2.62 |
| Total from investment operations | $2.20 | $8.91 | $(1.56) | $0.77 | $1.89 | $2.75 |
| Less distributions declared to shareholders | ||||||
| From net investment income | $(0.29) | $(0.20) | $(0.23) | $(0.19) | $(0.10) | $(0.24) |
| From net realized gain | (1.51) | — | (0.28) | (1.05) | (0.68) | (0.01) |
| Total distributions declared to shareholders | $(1.80) | $(0.20) | $(0.51) | $(1.24) | $(0.78) | $(0.25) |
| Net asset value, end of period (x) | $30.67 | $30.27 | $21.56 | $23.63 | $24.10 | $22.99 |
| Total return (%) (r)(s)(t)(x) | 7.25(n) | 41.55 | (6.87) | 3.98 | 8.37 | 13.51(c) |
| Ratios (%) (to average net assets) and Supplemental data: | ||||||
| Expenses before expense reductions | 1.00(a) | 1.02 | 1.07 | 1.08 | 1.08 | 1.12(c) |
| Expenses after expense reductions | 0.98(a) | 1.01 | 1.06 | 1.06 | 1.07 | 1.10(c) |
| Net investment income (loss) | 0.30(a) | 0.75 | 1.04 | 1.05 | 0.78 | 0.60(c) |
| Portfolio turnover | 10(n) | 19 | 19 | 27 | 26 | 29 |
| Net assets at end of period (000 omitted) | $1,809,466 | $1,616,315 | $1,141,479 | $1,199,095 | $1,131,758 | $1,103,067 |
| Class B | Six months ended | Year ended | ||||
| 3/31/22 (unaudited) | 9/30/21 | 9/30/20 | 9/30/19 | 9/30/18 | 9/30/17 | |
| Net asset value, beginning of period | $28.40 | $20.22 | $22.18 | $22.67 | $21.73 | $19.38 |
| Income (loss) from investment operations | ||||||
| Net investment income (loss) (d) | $(0.07) | $(0.01) | $0.06 | $0.06 | $0.00(w) | $(0.03)(c) |
| Net realized and unrealized gain (loss) | 2.02 | 8.20 | (1.69) | 0.50 | 1.62 | 2.48 |
| Total from investment operations | $1.95 | $8.19 | $(1.63) | $0.56 | $1.62 | $2.45 |
| Less distributions declared to shareholders | ||||||
| From net investment income | $(0.05) | $(0.01) | $(0.05) | $(0.00)(w) | $— | $(0.09) |
| From net realized gain | (1.51) | — | (0.28) | (1.05) | (0.68) | (0.01) |
| Total distributions declared to shareholders | $(1.56) | $(0.01) | $(0.33) | $(1.05) | $(0.68) | $(0.10) |
| Net asset value, end of period (x) | $28.79 | $28.40 | $20.22 | $22.18 | $22.67 | $21.73 |
| Total return (%) (r)(s)(t)(x) | 6.84(n) | 40.52 | (7.55) | 3.17 | 7.59 | 12.69(c) |
| Ratios (%) (to average net assets) and Supplemental data: | ||||||
| Expenses before expense reductions | 1.75(a) | 1.77 | 1.81 | 1.83 | 1.83 | 1.87(c) |
| Expenses after expense reductions | 1.73(a) | 1.76 | 1.80 | 1.81 | 1.82 | 1.85(c) |
| Net investment income (loss) | (0.50)(a) | (0.04) | 0.28 | 0.30 | 0.02 | (0.15)(c) |
| Portfolio turnover | 10(n) | 19 | 19 | 27 | 26 | 29 |
| Net assets at end of period (000 omitted) | $10,744 | $11,291 | $10,677 | $16,670 | $19,816 | $22,267 |
| Class C | Six months ended | Year ended | ||||
| 3/31/22 (unaudited) | 9/30/21 | 9/30/20 | 9/30/19 | 9/30/18 | 9/30/17 | |
| Net asset value, beginning of period | $28.24 | $20.12 | $22.09 | $22.57 | $21.65 | $19.33 |
| Income (loss) from investment operations | ||||||
| Net investment income (loss) (d) | $(0.07) | $(0.00)(w) | $0.06 | $0.06 | $0.00(w) | $(0.03)(c) |
| Net realized and unrealized gain (loss) | 2.00 | 8.15 | (1.69) | 0.51 | 1.60 | 2.48 |
| Total from investment operations | $1.93 | $8.15 | $(1.63) | $0.57 | $1.60 | $2.45 |
| Less distributions declared to shareholders | ||||||
| From net investment income | $(0.07) | $(0.03) | $(0.06) | $— | $— | $(0.12) |
| From net realized gain | (1.51) | — | (0.28) | (1.05) | (0.68) | (0.01) |
| Total distributions declared to shareholders | $(1.58) | $(0.03) | $(0.34) | $(1.05) | $(0.68) | $(0.13) |
| Net asset value, end of period (x) | $28.59 | $28.24 | $20.12 | $22.09 | $22.57 | $21.65 |
| Total return (%) (r)(s)(t)(x) | 6.81(n) | 40.55 | (7.58) | 3.22 | 7.53 | 12.72(c) |
| Ratios (%) (to average net assets) and Supplemental data: | ||||||
| Expenses before expense reductions | 1.75(a) | 1.77 | 1.81 | 1.83 | 1.83 | 1.87(c) |
| Expenses after expense reductions | 1.73(a) | 1.76 | 1.80 | 1.82 | 1.82 | 1.85(c) |
| Net investment income (loss) | (0.48)(a) | (0.02) | 0.28 | 0.30 | 0.01 | (0.15)(c) |
| Portfolio turnover | 10(n) | 19 | 19 | 27 | 26 | 29 |
| Net assets at end of period (000 omitted) | $110,848 | $108,116 | $87,086 | $119,427 | $133,345 | $157,336 |
| Class I | Six months ended | Year ended | ||||
| 3/31/22 (unaudited) | 9/30/21 | 9/30/20 | 9/30/19 | 9/30/18 | 9/30/17 | |
| Net asset value, beginning of period | $31.13 | $22.16 | $24.27 | $24.72 | $23.56 | $20.99 |
| Income (loss) from investment operations | ||||||
| Net investment income (loss) (d) | $0.09 | $0.30 | $0.29 | $0.30 | $0.25 | $0.19(c) |
| Net realized and unrealized gain (loss) | 2.21 | 8.93 | (1.84) | 0.54 | 1.75 | 2.68 |
| Total from investment operations | $2.30 | $9.23 | $(1.55) | $0.84 | $2.00 | $2.87 |
| Less distributions declared to shareholders | ||||||
| From net investment income | $(0.37) | $(0.26) | $(0.28) | $(0.24) | $(0.16) | $(0.29) |
| From net realized gain | (1.51) | — | (0.28) | (1.05) | (0.68) | (0.01) |
| Total distributions declared to shareholders | $(1.87) | $(0.26) | $(0.56) | $(1.29) | $(0.84) | $(0.30) |
| Net asset value, end of period (x) | $31.56 | $31.13 | $22.16 | $24.27 | $24.72 | $23.56 |
| Total return (%) (r)(s)(t)(x) | 7.40(n) | 41.90 | (6.64) | 4.24 | 8.66 | 13.79(c) |
| Ratios (%) (to average net assets) and Supplemental data: | ||||||
| Expenses before expense reductions | 0.75(a) | 0.77 | 0.82 | 0.83 | 0.83 | 0.87(c) |
| Expenses after expense reductions | 0.73(a) | 0.76 | 0.81 | 0.82 | 0.82 | 0.85(c) |
| Net investment income (loss) | 0.58(a) | 1.03 | 1.28 | 1.31 | 1.04 | 0.85(c) |
| Portfolio turnover | 10(n) | 19 | 19 | 27 | 26 | 29 |
| Net assets at end of period (000 omitted) | $3,822,498 | $3,056,701 | $1,651,249 | $1,772,356 | $1,389,171 | $1,077,307 |
| Class R1 | Six months ended | Year ended | ||||
| 3/31/22 (unaudited) | 9/30/21 | 9/30/20 | 9/30/19 | 9/30/18 | 9/30/17 | |
| Net asset value, beginning of period | $27.68 | $19.74 | $21.69 | $22.22 | $21.31 | $19.04 |
| Income (loss) from investment operations | ||||||
| Net investment income (loss) (d) | $(0.07) | $(0.00)(w) | $0.06 | $0.06 | $0.01 | $(0.03)(c) |
| Net realized and unrealized gain (loss) | 1.97 | 7.98 | (1.66) | 0.49 | 1.58 | 2.42 |
| Total from investment operations | $1.90 | $7.98 | $(1.60) | $0.55 | $1.59 | $2.39 |
| Less distributions declared to shareholders | ||||||
| From net investment income | $(0.09) | $(0.04) | $(0.07) | $(0.03) | $— | $(0.11) |
| From net realized gain | (1.51) | — | (0.28) | (1.05) | (0.68) | (0.01) |
| Total distributions declared to shareholders | $(1.60) | $(0.04) | $(0.35) | $(1.08) | $(0.68) | $(0.12) |
| Net asset value, end of period (x) | $27.98 | $27.68 | $19.74 | $21.69 | $22.22 | $21.31 |
| Total return (%) (r)(s)(t)(x) | 6.83(n) | 40.46 | (7.56) | 3.20 | 7.60 | 12.64(c) |
| Ratios (%) (to average net assets) and Supplemental data: | ||||||
| Expenses before expense reductions | 1.75(a) | 1.77 | 1.82 | 1.83 | 1.83 | 1.87(c) |
| Expenses after expense reductions | 1.73(a) | 1.76 | 1.80 | 1.82 | 1.82 | 1.85(c) |
| Net investment income (loss) | (0.47)(a) | (0.00)(w) | 0.28 | 0.30 | 0.03 | (0.14)(c) |
| Portfolio turnover | 10(n) | 19 | 19 | 27 | 26 | 29 |
| Net assets at end of period (000 omitted) | $14,648 | $13,789 | $10,476 | $13,348 | $13,538 | $13,470 |
| Class R2 | Six months ended | Year ended | ||||
| 3/31/22 (unaudited) | 9/30/21 | 9/30/20 | 9/30/19 | 9/30/18 | 9/30/17 | |
| Net asset value, beginning of period | $29.51 | $21.01 | $23.04 | $23.49 | $22.42 | $20.00 |
| Income (loss) from investment operations | ||||||
| Net investment income (loss) (d) | $0.00(w) | $0.13 | $0.17 | $0.17 | $0.11 | $0.08(c) |
| Net realized and unrealized gain (loss) | 2.09 | 8.51 | (1.75) | 0.52 | 1.67 | 2.55 |
| Total from investment operations | $2.09 | $8.64 | $(1.58) | $0.69 | $1.78 | $2.63 |
| Less distributions declared to shareholders | ||||||
| From net investment income | $(0.21) | $(0.14) | $(0.17) | $(0.09) | $(0.03) | $(0.20) |
| From net realized gain | (1.51) | — | (0.28) | (1.05) | (0.68) | (0.01) |
| Total distributions declared to shareholders | $(1.71) | $(0.14) | $(0.45) | $(1.14) | $(0.71) | $(0.21) |
| Net asset value, end of period (x) | $29.89 | $29.51 | $21.01 | $23.04 | $23.49 | $22.42 |
| Total return (%) (r)(s)(t)(x) | 7.09(n) | 41.24 | (7.08) | 3.70 | 8.11 | 13.23(c) |
| Ratios (%) (to average net assets) and Supplemental data: | ||||||
| Expenses before expense reductions | 1.25(a) | 1.27 | 1.32 | 1.33 | 1.33 | 1.37(c) |
| Expenses after expense reductions | 1.23(a) | 1.26 | 1.30 | 1.31 | 1.32 | 1.35(c) |
| Net investment income (loss) | 0.01(a) | 0.48 | 0.78 | 0.80 | 0.50 | 0.36(c) |
| Portfolio turnover | 10(n) | 19 | 19 | 27 | 26 | 29 |
| Net assets at end of period (000 omitted) | $81,067 | $83,472 | $66,086 | $82,671 | $97,398 | $138,364 |
| Class R3 | Six months ended | Year ended | ||||
| 3/31/22 (unaudited) | 9/30/21 | 9/30/20 | 9/30/19 | 9/30/18 | 9/30/17 | |
| Net asset value, beginning of period | $30.15 | $21.48 | $23.54 | $24.01 | $22.91 | $20.42 |
| Income (loss) from investment operations | ||||||
| Net investment income (loss) (d) | $0.04 | $0.21 | $0.23 | $0.23 | $0.18 | $0.13(c) |
| Net realized and unrealized gain (loss) | 2.14 | 8.67 | (1.78) | 0.53 | 1.70 | 2.61 |
| Total from investment operations | $2.18 | $8.88 | $(1.55) | $0.76 | $1.88 | $2.74 |
| Less distributions declared to shareholders | ||||||
| From net investment income | $(0.29) | $(0.21) | $(0.23) | $(0.18) | $(0.10) | $(0.24) |
| From net realized gain | (1.51) | — | (0.28) | (1.05) | (0.68) | (0.01) |
| Total distributions declared to shareholders | $(1.79) | $(0.21) | $(0.51) | $(1.23) | $(0.78) | $(0.25) |
| Net asset value, end of period (x) | $30.54 | $30.15 | $21.48 | $23.54 | $24.01 | $22.91 |
| Total return (%) (r)(s)(t)(x) | 7.24(n) | 41.55 | (6.85) | 3.95 | 8.37 | 13.52(c) |
| Ratios (%) (to average net assets) and Supplemental data: | ||||||
| Expenses before expense reductions | 1.00(a) | 1.02 | 1.07 | 1.08 | 1.08 | 1.12(c) |
| Expenses after expense reductions | 0.98(a) | 1.01 | 1.06 | 1.07 | 1.07 | 1.10(c) |
| Net investment income (loss) | 0.28(a) | 0.75 | 1.04 | 1.05 | 0.77 | 0.61(c) |
| Portfolio turnover | 10(n) | 19 | 19 | 27 | 26 | 29 |
| Net assets at end of period (000 omitted) | $634,106 | $606,828 | $405,406 | $405,908 | $401,520 | $404,189 |
| Class R4 | Six months ended | Year ended | ||||
| 3/31/22 (unaudited) | 9/30/21 | 9/30/20 | 9/30/19 | 9/30/18 | 9/30/17 | |
| Net asset value, beginning of period | $30.47 | $21.69 | $23.77 | $24.24 | $23.11 | $20.59 |
| Income (loss) from investment operations | ||||||
| Net investment income (loss) (d) | $0.08 | $0.28 | $0.28 | $0.29 | $0.24 | $0.19(c) |
| Net realized and unrealized gain (loss) | 2.16 | 8.76 | (1.79) | 0.53 | 1.72 | 2.63 |
| Total from investment operations | $2.24 | $9.04 | $(1.51) | $0.82 | $1.96 | $2.82 |
| Less distributions declared to shareholders | ||||||
| From net investment income | $(0.36) | $(0.26) | $(0.29) | $(0.24) | $(0.15) | $(0.29) |
| From net realized gain | (1.51) | — | (0.28) | (1.05) | (0.68) | (0.01) |
| Total distributions declared to shareholders | $(1.87) | $(0.26) | $(0.57) | $(1.29) | $(0.83) | $(0.30) |
| Net asset value, end of period (x) | $30.84 | $30.47 | $21.69 | $23.77 | $24.24 | $23.11 |
| Total return (%) (r)(s)(t)(x) | 7.35(n) | 41.92 | (6.64) | 4.23 | 8.69 | 13.80(c) |
| Ratios (%) (to average net assets) and Supplemental data: | ||||||
| Expenses before expense reductions | 0.75(a) | 0.77 | 0.82 | 0.83 | 0.83 | 0.87(c) |
| Expenses after expense reductions | 0.73(a) | 0.76 | 0.81 | 0.82 | 0.82 | 0.85(c) |
| Net investment income (loss) | 0.53(a) | 1.00 | 1.29 | 1.29 | 1.02 | 0.85(c) |
| Portfolio turnover | 10(n) | 19 | 19 | 27 | 26 | 29 |
| Net assets at end of period (000 omitted) | $650,218 | $607,641 | $437,597 | $373,705 | $428,566 | $519,736 |
| Class R6 | Six months ended | Year ended | ||||
| 3/31/22 (unaudited) | 9/30/21 | 9/30/20 | 9/30/19 | 9/30/18 | 9/30/17 | |
| Net asset value, beginning of period | $31.20 | $22.20 | $24.31 | $24.76 | $23.60 | $21.02 |
| Income (loss) from investment operations | ||||||
| Net investment income (loss) (d) | $0.10 | $0.33 | $0.32 | $0.33 | $0.28 | $0.23(c) |
| Net realized and unrealized gain (loss) | 2.22 | 8.96 | (1.84) | 0.54 | 1.75 | 2.67 |
| Total from investment operations | $2.32 | $9.29 | $(1.52) | $0.87 | $2.03 | $2.90 |
| Less distributions declared to shareholders | ||||||
| From net investment income | $(0.40) | $(0.29) | $(0.31) | $(0.27) | $(0.19) | $(0.31) |
| From net realized gain | (1.51) | — | (0.28) | (1.05) | (0.68) | (0.01) |
| Total distributions declared to shareholders | $(1.91) | $(0.29) | $(0.59) | $(1.32) | $(0.87) | $(0.32) |
| Net asset value, end of period (x) | $31.61 | $31.20 | $22.20 | $24.31 | $24.76 | $23.60 |
| Total return (%) (r)(s)(t)(x) | 7.43(n) | 42.14 | (6.52) | 4.39 | 8.80 | 13.95(c) |
| Ratios (%) (to average net assets) and Supplemental data: | ||||||
| Expenses before expense reductions | 0.63(a) | 0.64 | 0.68 | 0.68 | 0.69 | 0.72(c) |
| Expenses after expense reductions | 0.61(a) | 0.63 | 0.66 | 0.68 | 0.68 | 0.70(c) |
| Net investment income (loss) | 0.65(a) | 1.13 | 1.44 | 1.45 | 1.18 | 1.01(c) |
| Portfolio turnover | 10(n) | 19 | 19 | 27 | 26 | 29 |
| Net assets at end of period (000 omitted) | $9,350,770 | $8,659,522 | $6,048,320 | $5,084,448 | $4,127,556 | $3,354,746 |
| Class 529A | Six months ended | Year ended | ||||
| 3/31/22 (unaudited) | 9/30/21 | 9/30/20 | 9/30/19 | 9/30/18 | 9/30/17 | |
| Net asset value, beginning of period | $29.74 | $21.18 | $23.22 | $23.70 | $22.63 | $20.17 |
| Income (loss) from investment operations | ||||||
| Net investment income (loss) (d) | $0.04 | $0.20 | $0.21 | $0.22 | $0.17 | $0.12(c) |
| Net realized and unrealized gain (loss) | 2.11 | 8.56 | (1.75) | 0.53 | 1.68 | 2.58 |
| Total from investment operations | $2.15 | $8.76 | $(1.54) | $0.75 | $1.85 | $2.70 |
| Less distributions declared to shareholders | ||||||
| From net investment income | $(0.28) | $(0.20) | $(0.22) | $(0.18) | $(0.10) | $(0.23) |
| From net realized gain | (1.51) | — | (0.28) | (1.05) | (0.68) | (0.01) |
| Total distributions declared to shareholders | $(1.79) | $(0.20) | $(0.50) | $(1.23) | $(0.78) | $(0.24) |
| Net asset value, end of period (x) | $30.10 | $29.74 | $21.18 | $23.22 | $23.70 | $22.63 |
| Total return (%) (r)(s)(t)(x) | 7.22(n) | 41.53 | (6.90) | 3.95 | 8.33 | 13.50(c) |
| Ratios (%) (to average net assets) and Supplemental data: | ||||||
| Expenses before expense reductions | 1.05(a) | 1.07 | 1.12 | 1.13 | 1.14 | 1.22(c) |
| Expenses after expense reductions | 1.02(a) | 1.05 | 1.10 | 1.10 | 1.11 | 1.14(c) |
| Net investment income (loss) | 0.27(a) | 0.72 | 1.00 | 1.01 | 0.74 | 0.57(c) |
| Portfolio turnover | 10(n) | 19 | 19 | 27 | 26 | 29 |
| Net assets at end of period (000 omitted) | $13,142 | $10,471 | $6,697 | $7,165 | $6,899 | $6,637 |
| (a) | Annualized. |
| (c) | Amount reflects a one-time reimbursement of expenses by the custodian (or former custodian) without which net investment income and performance would be lower and expenses would be higher. |
| (d) | Per share data is based on average shares outstanding. |
| (n) | Not annualized. |
| (r) | Certain expenses have been reduced without which performance would have been lower. |
| (s) | From time to time the fund may receive proceeds from litigation settlements, without which performance would be lower. |
| (t) | Total returns do not include any applicable sales charges. |
| (w) | Per share amount was less than $0.01 and total return or ratio was less than 0.01%, as applicable. |
| (x) | The net asset values and total returns have been calculated on net assets which include adjustments made in accordance with U.S. generally accepted accounting principles required at period end for financial reporting purposes. |
| Financial Instruments | Level 1 | Level 2 | Level 3 | Total |
| Equity Securities: | ||||
| United States | $15,650,926,369 | $— | $— | $15,650,926,369 |
| Canada | 112,890,353 | — | — | 112,890,353 |
| Ireland | 108,019,839 | — | — | 108,019,839 |
| United Kingdom | 82,003,660 | — | — | 82,003,660 |
| Germany | — | 58,602,810 | — | 58,602,810 |
| Mutual Funds | 423,961,422 | — | — | 423,961,422 |
| Total | $16,377,801,643 | $58,602,810 | $— | $16,436,404,453 |
| Year ended 9/30/21 | |
| Ordinary income (including any short-term capital gains) | $120,000,131 |
| As of 3/31/22 | |
| Cost of investments | $11,866,405,813 |
| Gross appreciation | 4,758,066,132 |
| Gross depreciation | (188,067,492) |
| Net unrealized appreciation (depreciation) | $ 4,569,998,640 |
| As of 9/30/21 | |
| Undistributed ordinary income | 262,523,449 |
| Undistributed long-term capital gain | 486,440,934 |
| Other temporary differences | 596 |
| Net unrealized appreciation (depreciation) | 4,178,955,197 |
| Six months ended 3/31/22 | Year ended 9/30/21 | ||
| Class A | $96,432,800 | $10,731,815 | |
| Class B | 598,337 | 5,792 | |
| Class C | 5,990,286 | 136,332 | |
| Class I | 186,285,313 | 20,674,364 | |
| Class R1 | 786,024 | 18,908 | |
| Class R2 | 4,613,017 | 409,800 | |
| Class R3 | 35,510,416 | 4,299,628 | |
| Class R4 | 36,974,321 | 5,174,740 | |
| Class R6 | 532,361,947 | 78,484,359 | |
| Class 529A | 634,419 | 60,407 | |
| Class 529B | 8,727 | 1,176 | |
| Class 529C | 74,403 | 2,810 | |
| Total | $900,270,010 | $120,000,131 |
| Up to $1 billion | 0.75% |
| In excess of $1 billion and up to $2.5 billion | 0.70% |
| In excess of $2.5 billion and up to $5 billion | 0.65% |
| In excess of $5 billion and up to $10 billion | 0.60% |
| In excess of $10 billion and up to $20 billion | 0.55% |
| In excess of $20 billion | 0.50% |
| Distribution Fee Rate (d) | Service Fee Rate (d) | Total Distribution Plan (d) | Annual Effective Rate (e) | Distribution and Service Fee | |
| Class A | — | 0.25% | 0.25% | 0.25% | $ 2,182,463 |
| Class B | 0.75% | 0.25% | 1.00% | 1.00% | 56,991 |
| Class C | 0.75% | 0.25% | 1.00% | 1.00% | 564,981 |
| Class R1 | 0.75% | 0.25% | 1.00% | 1.00% | 73,490 |
| Class R2 | 0.25% | 0.25% | 0.50% | 0.50% | 211,426 |
| Class R3 | — | 0.25% | 0.25% | 0.25% | 791,824 |
| Class 529A | — | 0.25% | 0.25% | 0.24% | 14,223 |
| Class 529B | 0.75% | 0.25% | 1.00% | 0.87% | 587 |
| Class 529C | 0.75% | 0.25% | 1.00% | 1.00% | 6,434 |
| Total Distribution and Service Fees | $3,902,419 |
| (d) | In accordance with the distribution plan for certain classes, the fund pays distribution and/or service fees equal to these annual percentage rates of each class’s average daily net assets. The distribution and service fee rates disclosed by class represent the current rates in effect at the end of the reporting period. Any rate changes, if applicable, are detailed below. |
| (e) | The annual effective rates represent actual fees incurred under the distribution plan for the six months ended March 31, 2022 based on each class's average daily net assets. MFD has voluntarily agreed to rebate a portion of each class's 0.25% service fee attributable to accounts for which there is no financial intermediary specified on the account except for accounts attributable to MFS or its affiliates' seed money. For the six months ended March 31, 2022, this rebate amounted to $83, $212, $11, $680, and $31 for Class A, Class C, Class R2, Class 529A, and Class 529C, respectively, and is included in the reduction of total expenses in the Statement of Operations. For the period from October 1, 2021 through October 31, 2021, the 0.75% distribution fee was not imposed for Class 529B shares due to the sales charge limitations contained in Financial Industry Regulatory Authority (“FINRA”) Rule 2341. Effective November 1, 2021, the 0.75% distribution fee was reinstated for Class 529B shares. |
| Amount | |
| Class A | $18,281 |
| Class B | 11,280 |
| Class C | 8,839 |
| Class 529B | — |
| Class 529C | 17 |
| Fee | |
| Class 529A | $2,844 |
| Class 529B | 34 |
| Class 529C | 322 |
| Total Program Manager Fees | $3,200 |
| Six months ended 3/31/22 | Year ended 9/30/21 | ||||
| Shares | Amount | Shares | Amount | ||
| Shares sold | |||||
| Class A | 6,768,809 | $209,950,080 | 12,812,889 | $361,843,167 | |
| Class B | 8,654 | 254,871 | 18,236 | 512,142 | |
| Class C | 421,651 | 12,246,131 | 910,143 | 23,690,682 | |
| Class I | 32,992,499 | 1,047,507,505 | 43,622,897 | 1,255,939,078 | |
| Class R1 | 84,004 | 2,370,914 | 137,608 | 3,599,147 | |
| Class R2 | 278,602 | 8,425,786 | 847,773 | 23,398,527 | |
| Class R3 | 2,646,398 | 82,118,289 | 9,294,689 | 243,086,841 | |
| Class R4 | 3,275,447 | 101,907,918 | 5,811,613 | 163,527,287 | |
| Class R6 | 35,861,709 | 1,148,088,064 | 60,669,022 | 1,756,653,187 | |
| Class 529A | 83,947 | 2,528,420 | 75,386 | 2,076,543 | |
| Class 529B | 548 | 15,502 | — | — | |
| Class 529C | 1,702 | 47,968 | 5,428 | 139,153 | |
| 82,423,970 | $2,615,461,448 | 134,205,684 | $3,834,465,754 | ||
| Six months ended 3/31/22 | Year ended 9/30/21 | ||||
| Shares | Amount | Shares | Amount | ||
| Shares issued to shareholders in reinvestment of distributions | |||||
| Class A | 2,880,701 | $88,437,532 | 373,341 | $9,355,919 | |
| Class B | 20,317 | 586,743 | 240 | 5,686 | |
| Class C | 196,258 | 5,630,643 | 5,431 | 127,734 | |
| Class I | 5,545,672 | 175,021,411 | 758,667 | 19,520,493 | |
| Class R1 | 27,992 | 786,024 | 820 | 18,908 | |
| Class R2 | 151,104 | 4,524,061 | 16,302 | 399,085 | |
| Class R3 | 1,161,599 | 35,510,092 | 172,191 | 4,299,614 | |
| Class R4 | 1,150,255 | 35,485,381 | 191,043 | 4,808,540 | |
| Class R6 | 15,220,378 | 480,963,955 | 2,725,450 | 70,180,340 | |
| Class 529A | 20,806 | 626,890 | 2,418 | 59,565 | |
| Class 529B | 314 | 8,727 | 52 | 1,176 | |
| Class 529C | 2,666 | 74,342 | 123 | 2,810 | |
| 26,378,062 | $827,655,801 | 4,246,078 | $108,779,870 | ||
| Shares reacquired | |||||
| Class A | (4,041,146) | $(125,721,136) | (12,743,480) | $(357,480,384) | |
| Class B | (53,349) | (1,553,226) | (148,930) | (3,866,035) | |
| Class C | (570,298) | (16,475,965) | (1,414,436) | (36,666,331) | |
| Class I | (15,580,889) | (496,425,732) | (20,723,098) | (594,758,697) | |
| Class R1 | (86,635) | (2,450,234) | (171,187) | (4,268,849) | |
| Class R2 | (546,524) | (16,565,118) | (1,180,445) | (31,809,912) | |
| Class R3 | (3,171,812) | (98,109,921) | (8,215,852) | (222,256,997) | |
| Class R4 | (3,287,707) | (102,882,771) | (6,235,789) | (173,971,830) | |
| Class R6 | (32,815,437) | (1,047,109,210) | (58,234,951) | (1,631,709,402) | |
| Class 529A | (20,222) | (620,933) | (41,900) | (1,110,786) | |
| Class 529B | (5,327) | (147,283) | (1,493) | (37,939) | |
| Class 529C | (53,470) | (1,482,629) | (31,181) | (758,645) | |
| (60,232,816) | $(1,909,544,158) | (109,142,742) | $(3,058,695,807) | ||
| Six months ended 3/31/22 | Year ended 9/30/21 | ||||
| Shares | Amount | Shares | Amount | ||
| Net change | |||||
| Class A | 5,608,364 | $172,666,476 | 442,750 | $13,718,702 | |
| Class B | (24,378) | (711,612) | (130,454) | (3,348,207) | |
| Class C | 47,611 | 1,400,809 | (498,862) | (12,847,915) | |
| Class I | 22,957,282 | 726,103,184 | 23,658,466 | 680,700,874 | |
| Class R1 | 25,361 | 706,704 | (32,759) | (650,794) | |
| Class R2 | (116,818) | (3,615,271) | (316,370) | (8,012,300) | |
| Class R3 | 636,185 | 19,518,460 | 1,251,028 | 25,129,458 | |
| Class R4 | 1,137,995 | 34,510,528 | (233,133) | (5,636,003) | |
| Class R6 | 18,266,650 | 581,942,809 | 5,159,521 | 195,124,125 | |
| Class 529A | 84,531 | 2,534,377 | 35,904 | 1,025,322 | |
| Class 529B | (4,465) | (123,054) | (1,441) | (36,763) | |
| Class 529C | (49,102) | (1,360,319) | (25,630) | (616,682) | |
| 48,569,216 | $1,533,573,091 | 29,309,020 | $884,549,817 | ||
| Affiliated Issuers | Beginning Value | Purchases | Sales Proceeds | Realized Gain (Loss) | Change in Unrealized Appreciation or Depreciation | Ending Value |
| MFS Institutional Money Market Portfolio | $234,363,157 | $1,284,918,368 | $1,095,320,103 | $— | $— | $423,961,422 |
| Affiliated Issuers | Dividend Income | Capital Gain Distributions |
| MFS Institutional Money Market Portfolio | $109,330 | $— |

1(b):
Not applicable.
| ITEM 2. | CODE OF ETHICS. |
During the period covered by this report, the Registrant has not amended any provision in its Code of Ethics (the “Code”) that relates to an element of the Code’s definitions enumerated in paragraph (b) of Item 2 of this Form N-CSR. During the period covered by this report, the Registrant did not grant a waiver, including an implicit waiver, from any provision of the Code.
| ITEM 3. | AUDIT COMMITTEE FINANCIAL EXPERT. |
Not applicable for semi-annual reports.
| ITEM 4. | PRINCIPAL ACCOUNTANT FEES AND SERVICES. |
Not applicable for semi-annual reports.
| ITEM 5. | AUDIT COMMITTEE OF LISTED REGISTRANTS. |
Not applicable to the Registrant.
| ITEM 6. | INVESTMENTS |
A schedule of investments for each series of the Registrant is included as part of the report to shareholders of such series under Item 1(a) of this Form N-CSR.
| ITEM 7. | DISCLOSURE OF PROXY VOTING POLICIES AND PROCEDURES FOR CLOSED-END MANAGEMENT INVESTMENT COMPANIES. |
Not applicable to the Registrant.
| ITEM 8. | PORTFOLIO MANAGERS OF CLOSED-END MANAGEMENT INVESTMENT COMPANIES. |
Not applicable to the Registrant.
| ITEM 9. | PURCHASES OF EQUITY SECURITIES BY CLOSED-END MANAGEMENT INVESTMENT COMPANY AND AFFILIATED PURCHASERS. |
Not applicable to the Registrant.
| ITEM 10. | SUBMISSION OF MATTERS TO A VOTE OF SECURITY HOLDERS. |
There were no material changes to the procedures by which shareholders may send recommendations to the Board for nominees to the Registrant’s Board since the Registrant last provided disclosure as to such procedures in response to the requirements of Item 407 (c)(2)(iv) of Regulation S-K or this Item.
| ITEM 11. | CONTROLS AND PROCEDURES. |
| (a) | Based upon their evaluation of the effectiveness of the registrant’s disclosure controls and procedures (as defined in Rule 30a-3(c) under the Investment Company Act of 1940 (the “Act”)) as conducted within 90 days of the filing date of this report on Form N-CSR, the registrant’s principal financial officer and principal executive officer have concluded that those disclosure controls and procedures provide reasonable assurance that the material information required to be disclosed by the registrant on this report is recorded, processed, summarized and reported within the time periods specified in the Securities and Exchange Commission’s rules and forms. |
| (b) | There were no changes in the registrant’s internal controls over financial reporting (as defined in Rule 30a-3(d) under the Act) that occurred during the period covered by the report that have materially affected, or are reasonably likely to materially affect, the registrant’s internal control over financial reporting. |
| ITEM 12. | DISCLOSURE OF SECURITIES LENDING ACTIVITIES FOR CLOSED-END MANAGEMENT INVESTMENT COMPANIES. |
Not applicable to the Registrant.
| ITEM 13. | EXHIBITS. |
| (a) | File the exhibits listed below as part of this form. Letter or number the exhibits in the sequence indicated. |
| (1) | Any code of ethics, or amendment thereto, that is the subject of the disclosure required by Item 2, to the extent that the registrant intends to satisfy the Item 2 requirements through filing of an exhibit. Not applicable. |
| (2) | A separate certification for each principal executive officer and principal financial officer of the registrant as required by Rule 30a-2(a) under the Act (17 CFR 270.30a-2): Attached hereto as EX-99.302CERT. |
| (3) | Any written solicitation to purchase securities under Rule 23c-1 under the Act (17 CFR 270.23c-1) sent or given during the period covered by the report by or on behalf of the registrant to 10 or more persons. Not applicable. |
(4) Change in the registrant’s independent public accountant. Not applicable.
| (b) | If the report is filed under Section 13(a) or 15(d) of the Exchange Act, provide the certifications required by Rule 30a-2(b) under the Act (17 CFR 270.30a-2(b)), Rule 13a-14(b) or Rule 15d-14(b) under the Exchange Act (17 CFR 240.13a-14(b) or 240.15d-14(b)) and Section 1350 of Chapter 63 of Title 18 of the United States Code (18 U.S.C. 1350) as an exhibit. A certification furnished pursuant to this paragraph will not be deemed “filed” for the purposes of Section 18 of the Exchange Act (15 U.S.C. 78r), or otherwise subject to the liability of that section. Such certification will not be deemed to be incorporated by reference into any filing under the Securities Act of 1933 or the Exchange Act, except to the extent that the registrant specifically incorporates it by reference: Attached hereto as EX-99.906CERT. |
Notice
A copy of the Amended and Restated Declaration of Trust, as amended, of the Registrant is on file with the Secretary of State of The Commonwealth of Massachusetts and notice is hereby given that this instrument is executed on behalf of the Registrant by an officer of the Registrant as an officer and not individually and the obligations of or arising out of this instrument are not binding upon any of the Trustees or shareholders individually, but are binding only upon the assets and property of the respective constituent series of the Registrant.
SIGNATURES
Pursuant to the requirements of the Securities Exchange Act of 1934 and the Investment Company Act of 1940, the registrant has duly caused this report to be signed on its behalf by the undersigned, thereunto duly authorized.
(Registrant) MFS SERIES TRUST XI
| By (Signature and Title)* | /S/ DAVID L. DILORENZO | |
| David L. DiLorenzo, President |
Date: May 13, 2022
Pursuant to the requirements of the Securities Exchange Act of 1934 and the Investment Company Act of 1940, this report has been signed below by the following persons on behalf of the registrant and in the capacities and on the dates indicated.
| By (Signature and Title)* | /S/ DAVID L. DILORENZO | |
| David L. DiLorenzo, President (Principal Executive Officer) |
Date: May 13, 2022
| By (Signature and Title)* | /S/ JAMES O. YOST | |
| James O. Yost, Treasurer (Principal Financial Officer and Accounting Officer) |
Date: May 13, 2022
| * | Print name and title of each signing officer under his or her signature. |