UNITED STATES
SECURITIES AND EXCHANGE COMMISSION
Washington, D.C. 20549
FORM N-CSR
CERTIFIED SHAREHOLDER REPORT OF REGISTERED
MANAGEMENT INVESTMENT COMPANIES
Investment Company Act file number | 811-7994 | |||||||
| ||||||||
Western Asset Global Partners Income Fund Inc. | ||||||||
(Exact name of registrant as specified in charter) | ||||||||
| ||||||||
620 Eighth Avenue, 49th Floor, New York, New York |
| 10018 | ||||||
(Address of principal executive offices) |
| (Zip code) | ||||||
| ||||||||
Robert I. Frenkel, Esq. | ||||||||
(Name and address of agent for service) | ||||||||
| ||||||||
Registrant’s telephone number, including area code: | (888) 777-0102 |
| ||||||
| ||||||||
Date of fiscal year end: | August 31 |
| ||||||
| ||||||||
Date of reporting period: | February 29, 2012 |
| ||||||
ITEM 1. REPORT TO STOCKHOLDERS.
The Semi-Annual Report to Stockholders is filed herewith.
February 29, 2012 |
|
|
Semi-Annual Report
Western Asset Global Partners Income Fund Inc.
(GDF)
|
|
| INVESTMENT PRODUCTS: NOT FDIC INSURED · NO BANK GUARANTEE · MAY LOSE VALUE |
|
|
|
| Western Asset Global Partners Income Fund Inc. |
|
|
Fund objectives
The Fund’s investment objective is to maintain a high level of current income. As a secondary objective, the Fund seeks capital appreciation.
What’s inside
Letter from the chairman | II |
|
|
Investment commentary | III |
|
|
Fund at a glance | 1 |
|
|
Spread duration | 2 |
|
|
Effective duration | 3 |
|
|
Schedule of investments | 4 |
|
|
Statement of assets and liabilities | 27 |
|
|
Statement of operations | 28 |
|
|
Statements of changes in net assets | 29 |
|
|
Statement of cash flows | 30 |
|
|
Financial highlights | 31 |
|
|
Notes to financial statements | 32 |
|
|
Board approval of management and subadvisory agreements | 50 |
|
|
Additional shareholder information | 57 |
|
|
Dividend reinvestment and cash purchase plan | 58 |
Letter from the chairman
|
|

Dear Shareholder,
We are pleased to provide the semi-annual report of Western Asset Global Partners Income Fund Inc. for the six-month reporting period ended February 29, 2012. Please read on for Fund performance information and a detailed look at prevailing economic and market conditions during the Fund’s reporting period.
As always, we remain committed to providing you with excellent service and a full spectrum of investment choices. We also remain committed to supplementing the support you receive from your financial advisor. One way we accomplish this is through our website, www.leggmason.com/cef. Here you can gain immediate access to market and investment information, including:
· Fund prices and performance,
· Market insights and commentaries from our portfolio managers, and
· A host of educational resources.
We look forward to helping you meet your financial goals.
Sincerely,

R. Jay Gerken, CFA
Chairman, President and Chief Executive Officer
March 30, 2012
|
| Western Asset Global Partners Income Fund Inc. |
|
Investment commentary
Economic review
Economic growth in the U.S. accelerated over the six months ended February 29, 2012. Looking back, U.S. gross domestic product (“GDP”)i growth, as reported by the U.S. Department of Commerce, was 0.4% and 1.3% in the first and second quarters of 2011, respectively. Third quarter GDP growth then rose to 1.8%. The economy then gathered further momentum late in 2011, as the Commerce Department reported that fourth quarter GDP growth was 3.0% — the fastest pace since the second quarter of 2010. This was attributed, in part, to higher consumer spending, which rose 2.1% in the fourth quarter, versus 1.7% and 0.7% gains in the third and second quarters, respectively.
Two factors constraining economic growth were the weak job market and continued strains in the housing market. While there was some improvement during the reporting period, unemployment remained elevated. When the reporting period began, unemployment, as reported by the U.S. Department of Labor, was 9.0%. Unemployment then generally declined over the next six months and was 8.3% in February 2012, the lowest rate since February 2009. The housing market showed some encouraging signs, although it still appears to be searching for a bottom. Looking back, existing-home sales moved somewhat higher in early 2011, according to the National Association of Realtors (“NAR”). Existing-home sales then fluctuated, but increased during three of the last five months of the period. While the inventory of unsold homes moved up slightly versus the previous month in February 2012, home prices edged higher. The NAR reported that the median existing-home price for all housing types was $156,600 in February 2012, up 0.3% from February 2011.
After experiencing a soft patch in the summer of 2011, the manufacturing sector expanded at a stronger pace during much of the reporting period. Based on the Institute for Supply Management’s PMI (“PMI”)ii, in August 2011, it had a reading of 50.6, its lowest reading in two years (a reading below 50 indicates a contraction, whereas a reading above 50 indicates an expansion). The manufacturing sector gathered momentum and ended January 2012 at 54.1, its highest reading since June 2011. In February, the PMI dipped to 52.4.
While the U.S. economy gained some traction during the reporting period, growth generally moderated overseas. In January 2012, the International Monetary Fund (“IMF”) lowered its growth projections for the global economy. This was due, in part, to the IMF’s expectation that the Eurozone would experience “a mild recession in 2012 as a result of the rise in sovereign yields, the effects of bank deleveraging on the real economy, and the impact of additional fiscal consolidation.” The IMF now anticipates 2012 growth will be -0.5% in the Eurozone and 1.7% in Japan. While growth in emerging market countries is expected to remain higher than in their developed country counterparts, the IMF reduced its 2012 projection for the former from 6.1% to 5.4%.
|
| Western Asset Global Partners Income Fund Inc. |
|
|
Investment commentary (cont’d)
Market review
Q. Did Treasury yields trend higher or lower during the six months ended February 29, 2012?
A. Both short- and long-term Treasury yields fluctuated during the reporting period. When the period began, two- and ten-year Treasury yields were 0.20% and 2.23%, respectively. During the height of the flight to quality in September 2011, two-year Treasuries hit their low for the reporting period of 0.16% and ten-year Treasuries reached their reporting period trough of 1.72%. Two-year Treasury yields subsequently rose as high as 0.32% in October and ten-year Treasuries peaked at 2.34% during the same month. While two-year Treasury yields only declined modestly during the remainder of the period, ten-year yields fell more sharply. When the reporting period ended on February 29, 2012, two-year Treasury yields were 0.30% and ten-year Treasury yields were 1.98%.
Q. How did the Federal Reserve Board (“Fed”)iii respond to the economic environment?
A. The Fed took a number of actions as it sought to meet its dual mandate of fostering maximum employment and price stability. As has been the case since December 2008, the Fed kept the federal funds rateiv at a historically low range between zero and 0.25%. In August 2011, the Fed declared its intention to keep the federal funds rate steady until mid-2013. Then, in September 2011, the Fed announced its intention to purchase $400 billion of longer-term Treasury securities and to sell an equal amount of shorter-term Treasury securities by June 2012 (often referred to as “Operation Twist”). In January 2012, the Fed extended the period it expects to keep rates on hold, saying “economic conditions — including low rates of resource utilization and a subdued outlook for inflation over the medium run — are likely to warrant exceptionally low levels for the federal funds rate at least through late 2014.” During its meeting in March (after the reporting period ended) the Fed said that it “expects moderate economic growth over coming quarters and consequently anticipates that the unemployment rate will decline gradually toward levels that the Committee judges to be consistent with its dual mandate.”
Q. What actions did international central banks take during the reporting period?
A. Given the economic challenges in the Eurozone, the European Central Bank (“ECB”) lowered interest rates from 1.50% to 1.25% in November 2011. In December, the ECB lowered interest rates to 1.00%, equaling its all-time low. In other developed countries, the Bank of England kept rates on hold at 0.50% during the reporting period, as did Japan at a range of zero to 0.10%, the lowest level since 2006. With growth rates declining, both China and India lowered their cash reserve ratio for banks toward the end of the reporting period. This could be a precursor to lowering interest rates if global growth stalls further.
Q. What factors impacted the spread sectors (non-Treasuries) during the reporting period?
A. The spread sectors experienced periods of heightened volatility during the period. Risk aversion was elevated during the first month of the period
|
| Western Asset Global Partners Income Fund Inc. |
|
given a host of disappointing economic data, a further escalation of the European sovereign debt crisis and the continued fallout from the downgrading of U.S. government securities by Standard & Poor’s. Risk appetite returned in October due to some better-than-expected economic data and signs of progress in Europe. While another flight to quality occurred in November due to renewed fears regarding the European sovereign debt crisis, risk appetite returned over the last three months of the period as the U.S. economy gained further traction. For the six months ended February 29, 2012, the Barclays Capital U.S. Aggregate Indexv returned 2.73%.
Q. How did the high-yield market perform over the six months ended February 29, 2012?
A. The U.S. high-yield bond market generated a strong gain during the reporting period. The asset class fell sharply during the first month of the period given concerns regarding the economy and the European sovereign debt crisis. With risk aversion elevated, the high-yield market, measured by the Barclays Capital U.S. High Yield — 2% Issuer Cap Indexvi, fell 3.29% in September. The market then rallied sharply in October, rising 6.00%, as risk appetite returned. The high-yield market again weakened in November due to the escalating European sovereign debt crisis. However, it rallied during the last three months of the period as risk appetite returned. All told, the high-yield market gained 8.62% for the six months ended February 29, 2012.
Q. How did the emerging market debt asset class perform over the reporting period?
A. Despite periods of volatility, the asset class generated a solid return for the six-month reporting period. In general, emerging market debt was supported by solid growth in developing countries and overall solid demand. These factors more than offset periods of weakness triggered by fears that China’s economy would experience a hard landing, geopolitical issues and decelerating growth in many developed countries. Overall, the JPMorgan Emerging Markets Bond Index Global (“EMBI Global”)vii returned 5.51% over the six months ended February 29, 2012.
Performance review
For the six months ended February 29, 2012, Western Asset Global Partners Income Fund Inc. returned 7.92% based on its net asset value (“NAV”)viii and 12.12% based on its New York Stock Exchange (“NYSE”) market price per share. The Fund’s unmanaged benchmarks, the Barclays Capital U.S. High Yield — 2% Issuer Cap Index and the EMBI Global, returned 8.62% and 5.51%, respectively, over the same time frame. The Lipper High Current Yield (Leveraged) Closed-End Funds Category Averageix returned 10.05% for the same period. Please note that Lipper performance returns are based on each fund’s NAV.
During this six-month period, the Fund made distributions to shareholders totaling $0.57 per share, which may have included a return of capital. The performance table shows the Fund’s six-month total return based on its
|
| Western Asset Global Partners Income Fund Inc. |
|
|
Investment commentary (cont’d)
NAV and market price as of February 29, 2012. Past performance is no guarantee of future results.
Performance Snapshot as of February 29, 2012 (unaudited)
Price Per Share |
| 6-Month Total Return* |
|
$11.89 (NAV) |
| 7.92 %† |
|
$13.02 (Market Price) |
| 12.12 %‡ |
|
All figures represent past performance and are not a guarantee of future results. Performance figures for periods shorter than one year represent cumulative figures and are not annualized.
* | Total returns are based on changes in NAV or market price, respectively. |
|
|
† | Total return assumes the reinvestment of all distributions, including returns of capital, if any, at NAV. |
|
|
‡ | Total return assumes the reinvestment of all distributions, including returns of capital, if any, in additional shares in accordance with the Fund’s Dividend Reinvestment Plan. |
Looking for additional information?
The Fund is traded under the symbol “GDF” and its closing market price is available in most newspapers under the NYSE listings. The daily NAV is available on-line under the symbol “XGDFX” on most financial websites. Barron’s and the Wall Street Journal’s Monday edition both carry closed-end fund tables that provide additional information. In addition, the Fund issues a quarterly press release that can be found on most major financial websites as well as www.leggmason.com/cef.
In a continuing effort to provide information concerning the Fund, shareholders may call 1-888-777-0102 (toll free), Monday through Friday from 8:00 a.m. to 5:30 p.m. Eastern Time, for the Fund’s current NAV, market price and other information.
As always, thank you for your confidence in our stewardship of your assets.
Sincerely,

R. Jay Gerken, CFA
Chairman, President and
Chief Executive Officer
March 30, 2012
RISKS: As interest rates rise, bond prices fall, reducing the value of the Fund’s fixed-income holdings. The Fund may invest in high-yield and foreign securities, including emerging markets, which involve risks beyond those inherent in higher-rated and domestic investments. High-yield bonds involve greater credit and liquidity risks than investment grade bonds. Investing in foreign securities is subject to certain risks not associated with domestic investing, such as currency fluctuations, and changes in political and economic conditions. These risks are magnified in emerging or developing markets. Derivatives, such as options and futures, can be illiquid and harder to value, especially in declining markets. A small investment in certain derivatives may have a potentially large impact on the Fund’s performance.
All investments are subject to risk including the possible loss of principal. Past performance is no guarantee of future results. All index performance reflects no deduction for fees, expenses or taxes. Please note that an investor cannot invest directly in an index.
The information provided is not intended to be a forecast of future events, a guarantee of future results or investment advice. Views expressed may differ from those of the firm as a whole. Forecasts and predictions are inherently limited and should not be relied upon as an indication of actual or future performance.
|
| Western Asset Global Partners Income Fund Inc. |
|
i Gross domestic product (“GDP”) is the market value of all final goods and services produced within a country in a given period of time.
ii The Institute for Supply Management’s PMI is based on a survey of purchasing executives who buy the raw materials for manufacturing at more than 350 companies. It offers an early reading on the health of the manufacturing sector.
iii The Federal Reserve Board (“Fed”) is responsible for the formulation of policies designed to promote economic growth, full employment, stable prices and a sustainable pattern of international trade and payments.
iv The federal funds rate is the rate charged by one depository institution on an overnight sale of immediately available funds (balances at the Federal Reserve) to another depository institution; the rate may vary from depository institution to depository institution and from day to day.
v The Barclays Capital U.S. Aggregate Index is a broad-based bond index comprised of government, corporate, mortgage- and asset-backed issues, rated investment grade or higher, and having at least one year to maturity.
vi The Barclays Capital U.S. High Yield — 2% Issuer Cap Index is an index of the 2% Issuer Cap component of the Barclays Capital U.S. Corporate High Yield Index, which covers the U.S. dollar-denominated, non-investment grade, fixed-rate, taxable corporate bond market.
vii The JPMorgan Emerging Markets Bond Index Global (“EMBI Global”) tracks total returns for U.S. dollar-denominated debt instruments issued by emerging market sovereign and quasi-sovereign entities: Brady bonds, loans, Eurobonds and local market instruments.
viii Net asset value (“NAV”) is calculated by subtracting total liabilities and outstanding preferred stock (if any) from the closing value of all securities held by the Fund (plus all other assets) and dividing the result (total net assets) by the total number of the common shares outstanding. The NAV fluctuates with changes in the market prices of securities in which the Fund has invested. However, the price at which an investor may buy or sell shares of the Fund is the Fund’s market price as determined by supply of and demand for the Fund’s shares.
ix Lipper, Inc., a wholly-owned subsidiary of Reuters, provides independent insight on global collective investments. Returns are based on the six-month period ended February 29, 2012, including the reinvestment of all distributions, including returns of capital, if any, calculated among the 41 funds in the Fund’s Lipper category.
|
| Western Asset Global Partners Income Fund Inc. 2012 Semi-Annual Report |
|
Fund at a glance† (unaudited)
Investment breakdown (%) as a percent of total investments
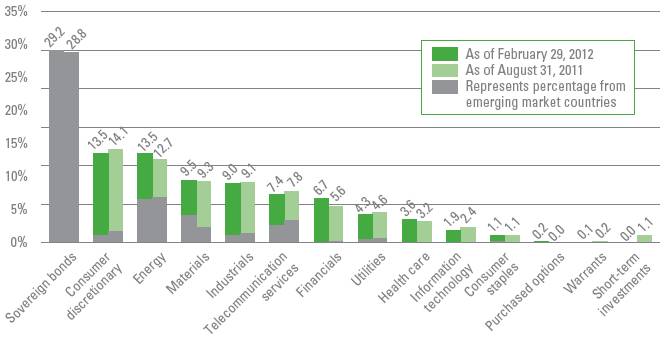
† The bar graph above represents the composition of the Fund’s investments as of February 29, 2012 and August 31, 2011 and does not include derivatives, such as futures contracts, swap contracts, written options and forward foreign currency contracts. The Fund is actively managed. As a result, the composition of the Fund’s investments is subject to change at any time.
|
| Western Asset Global Partners Income Fund Inc. 2012 Semi-Annual Report |
|
|
Spread duration (unaudited)
Economic Exposure — February 29, 2012
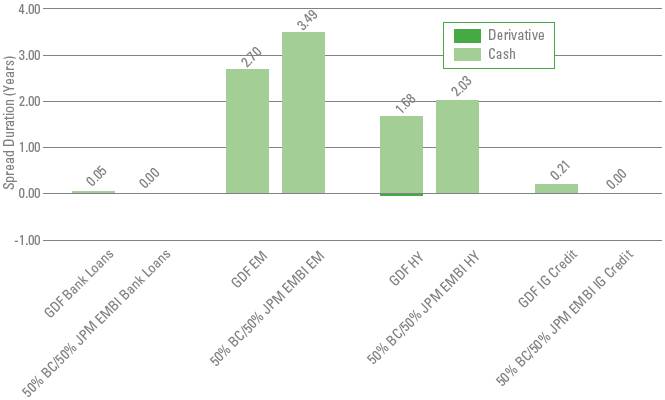
Spread duration measures the sensitivity to changes in spreads. The spread over Treasuries is the annual risk-premium demanded by investors to hold non-Treasury securities. Spread duration is quantified as the % change in price resulting from a 100 basis points change in spreads. For a security with positive spread duration, an increase in spreads would result in a price decline and a decline in spreads would result in a price increase. This chart highlights the market sector exposure of the Fund’s sectors relative to the selected benchmark sectors as of the end of the reporting period.
EM | — | Emerging Markets |
GDF | — | Western Asset Global Partners Income Fund Inc. |
HY | — | High Yield |
IG Credit | — | Investment Grade Credit |
50% BC/50% JPM EMBI | — | 50% Barclays Capital U.S. HY (2% constrained), 50% JPMorgan Emerging Markets Bond Index Global |
|
| Western Asset Global Partners Income Fund Inc. 2012 Semi-Annual Report |
|
Effective duration (unaudited)
Interest Rate Exposure — February 29, 2012
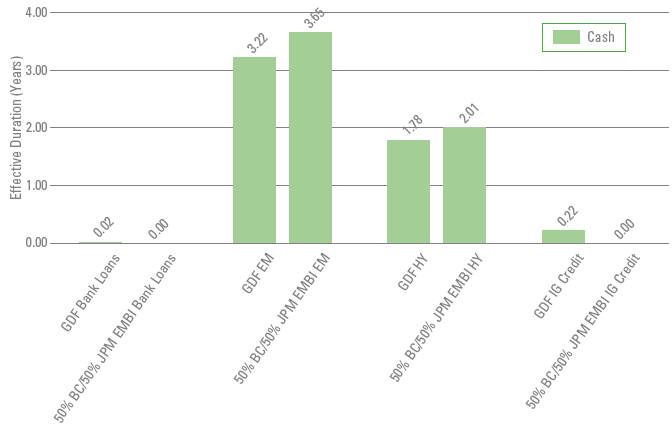
Effective duration measures the sensitivity to changes in relevant interest rates. Effective duration is quantified as the % change in price resulting from a 100 basis points change in interest rates. For a security with positive effective duration, an increase in interest rates would result in a price decline and a decline in interest rates would result in a price increase. This chart highlights the interest rate exposure of the Fund’s sectors relative to the selected benchmark sectors as of the end of the reporting period.
EM | — | Emerging Markets |
GDF | — | Western Asset Global Partners Income Fund Inc. |
HY | — | High Yield |
IG Credit | — | Investment Grade Credit |
50% BC/50% JPM EMBI | — | 50% Barclays Capital U.S. HY (2% constrained), 50% JPMorgan Emerging Markets Bond Index Global |
|
| Western Asset Global Partners Income Fund Inc. 2012 Semi-Annual Report |
|
|
Schedule of investments (unaudited)
February 29, 2012
Western Asset Global Partners Income Fund Inc.
Security |
| Rate |
| Maturity |
| Face |
| Value |
|
Corporate Bonds & Notes — 84.2% |
|
|
|
|
|
|
|
|
|
Consumer Discretionary — 15.5% |
|
|
|
|
|
|
|
|
|
Auto Components — 0.4% |
|
|
|
|
|
|
|
|
|
Allison Transmission Inc., Senior Notes |
| 11.000 | % | 11/1/15 |
| 42,000 |
| $ 44,467 | (a) |
Europcar Groupe SA, Senior Notes |
| 9.375 | % | 4/15/18 |
| 500,000 | EUR | 439,659 | (a) |
Goodyear Tire & Rubber Co., Senior Notes |
| 7.000 | % | 5/15/22 |
| 290,000 |
| 295,075 |
|
Total Auto Components |
|
|
|
|
|
|
| 779,201 |
|
Automobiles — 0.4% |
|
|
|
|
|
|
|
|
|
Chrysler Group LLC/CG Co.-Issuer Inc., Secured Notes |
| 8.250 | % | 6/15/21 |
| 460,000 |
| 466,900 |
|
Escrow GCB General Motors |
| — |
| — |
| 480,000 |
| 10,500 | *(b) |
Escrow GCB General Motors |
| — |
| — |
| 1,105,000 |
| 24,172 | *(b) |
Jaguar Holding Co. II/Jaguar Merger Sub Inc., Senior Notes |
| 9.500 | % | 12/1/19 |
| 120,000 |
| 131,850 | (a)(c) |
Total Automobiles |
|
|
|
|
|
|
| 633,422 |
|
Diversified Consumer Services — 0.6% |
|
|
|
|
|
|
|
|
|
Service Corp. International, Senior Notes |
| 7.500 | % | 4/1/27 |
| 310,000 |
| 311,550 |
|
ServiceMaster Co., Senior Subordinated Notes |
| 8.000 | % | 2/15/20 |
| 160,000 |
| 169,600 | (a) |
Sotheby’s, Senior Notes |
| 7.750 | % | 6/15/15 |
| 520,000 |
| 569,400 | (c) |
Stonemor Operating LLC/Cornerstone Family Services of WV/Osiris Holding, Senior Notes |
| 10.250 | % | 12/1/17 |
| 95,000 |
| 88,825 | (c) |
Total Diversified Consumer Services |
|
|
|
|
|
|
| 1,139,375 |
|
Hotels, Restaurants & Leisure — 5.0% |
|
|
|
|
|
|
|
|
|
Bossier Casino Venture Holdco Inc., Senior Secured Bonds |
| 14.000 | % | 2/9/18 |
| 270,000 |
| 231,611 | (a)(b)(d)(e) |
Boyd Gaming Corp., Senior Subordinated Notes |
| 7.125 | % | 2/1/16 |
| 100,000 |
| 96,500 | (c) |
Caesars Entertainment Operating Co. Inc., Senior Notes |
| 10.750 | % | 2/1/16 |
| 1,404,000 |
| 1,221,480 | (c) |
CityCenter Holdings LLC/CityCenter Finance Corp., Secured Notes |
| 11.500 | % | 1/15/17 |
| 569,301 |
| 610,130 | (d) |
Downstream Development Quapaw, Senior Secured Notes |
| 10.500 | % | 7/1/19 |
| 300,000 |
| 309,000 | (a) |
El Pollo Loco Inc., Secured Notes |
| 17.000 | % | 1/1/18 |
| 674,108 |
| 644,615 | (a) |
Enterprise Inns PLC, Senior Secured Bonds |
| 6.500 | % | 12/6/18 |
| 494,000 | GBP | 644,442 |
|
Fiesta Restaurant Group, Secured Notes |
| 8.875 | % | 8/15/16 |
| 160,000 |
| 167,000 | (a) |
Hoa Restaurant Group LLC/Hoa Finance Corp., Senior Secured Notes |
| 11.250 | % | 4/1/17 |
| 370,000 |
| 357,975 | (a) |
Inn of the Mountain Gods Resort & Casino, Senior Secured Notes |
| 8.750 | % | 11/30/20 |
| 237,000 |
| 232,852 | (a) |
Landry’s Acquisition Co., Secured Notes |
| 11.625 | % | 12/1/15 |
| 300,000 |
| 329,250 | (a) |
Landry’s Holdings Inc., Senior Secured Notes |
| 11.500 | % | 6/1/14 |
| 390,000 |
| 390,000 | (a) |
Landry’s Restaurants Inc., Senior Secured Notes |
| 11.625 | % | 12/1/15 |
| 30,000 |
| 32,925 | (c) |
See Notes to Financial Statements.
|
| Western Asset Global Partners Income Fund Inc. 2012 Semi-Annual Report |
|
|
Western Asset Global Partners Income Fund Inc.
Security |
| Rate |
| Maturity |
| Face |
| Value |
|
Hotels, Restaurants & Leisure — continued |
|
|
|
|
|
|
|
|
|
MGM Resorts International, Senior Notes |
| 5.875 | % | 2/27/14 |
| 360,000 |
| $ 368,100 |
|
MGM Resorts International, Senior Notes |
| 6.625 | % | 7/15/15 |
| 70,000 |
| 71,225 |
|
MGM Resorts International, Senior Secured Notes |
| 10.375 | % | 5/15/14 |
| 40,000 |
| 45,700 | (c) |
MGM Resorts International, Senior Secured Notes |
| 11.125 | % | 11/15/17 |
| 95,000 |
| 108,538 | (c) |
Mohegan Tribal Gaming Authority, Senior Subordinated Notes |
| 8.000 | % | 4/1/12 |
| 1,030,000 |
| 880,650 |
|
Mohegan Tribal Gaming Authority, Senior Subordinated Notes |
| 6.875 | % | 2/15/15 |
| 55,000 |
| 39,050 |
|
NCL Corp. Ltd., Senior Notes |
| 9.500 | % | 11/15/18 |
| 560,000 |
| 609,000 | (c) |
NCL Corp. Ltd., Senior Secured Notes |
| 11.750 | % | 11/15/16 |
| 480,000 |
| 559,200 | (c) |
Pinnacle Entertainment Inc., Senior Notes |
| 8.625 | % | 8/1/17 |
| 250,000 |
| 273,125 | (c) |
Seven Seas Cruises S de RL LLC, Senior Secured Notes |
| 9.125 | % | 5/15/19 |
| 390,000 |
| 403,650 | (a) |
Snoqualmie Entertainment Authority, Senior Secured Notes |
| 4.532 | % | 2/1/14 |
| 290,000 |
| 269,700 | (a)(f) |
Snoqualmie Entertainment Authority, Senior Secured Notes |
| 9.125 | % | 2/1/15 |
| 10,000 |
| 10,050 | (a) |
Station Casinos Inc., Senior Subordinated Notes |
| 6.500 | % | 2/1/14 |
| 475,000 |
| 0 | (b)(e)(g)(h) |
Station Casinos Inc., Senior Subordinated Notes |
| 6.625 | % | 3/15/18 |
| 50,000 |
| 0 | (b)(e)(g)(h) |
Sugarhouse HSP Gaming Prop Mezz LP/ Sugarhouse HSP Gaming Finance Corp., Secured Notes |
| 8.625 | % | 4/15/16 |
| 263,000 |
| 276,479 | (a)(c) |
Total Hotels, Restaurants & Leisure |
|
|
|
|
|
|
| 9,182,247 |
|
Internet & Catalog Retail — 0.2% |
|
|
|
|
|
|
|
|
|
Netflix Inc., Senior Notes |
| 8.500 | % | 11/15/17 |
| 360,000 |
| 398,700 | (c) |
Media — 5.9% |
|
|
|
|
|
|
|
|
|
CCH II LLC/CCH II Capital Corp., Senior Notes |
| 13.500 | % | 11/30/16 |
| 27,381 |
| 31,625 | (c) |
CCO Holdings LLC/CCO Holdings Capital Corp., Senior Notes |
| 6.625 | % | 1/31/22 |
| 1,700,000 |
| 1,823,250 |
|
Cengage Learning Acquisitions Inc., Senior Notes |
| 10.500 | % | 1/15/15 |
| 1,090,000 |
| 937,400 | (a) |
Clear Channel Worldwide Holdings Inc., Senior Subordianted Notes |
| 7.625 | % | 3/15/20 |
| 220,000 |
| 220,000 | (a) |
Clear Channel Worldwide Holdings Inc., Senior Subordinated Notes |
| 7.625 | % | 3/15/20 |
| 30,000 |
| 30,000 | (a) |
DISH DBS Corp., Senior Notes |
| 6.625 | % | 10/1/14 |
| 30,000 |
| 32,850 | (c) |
DISH DBS Corp., Senior Notes |
| 7.875 | % | 9/1/19 |
| 285,000 |
| 336,300 | (c) |
Entercom Radio LLC, Senior Notes |
| 10.500 | % | 12/1/19 |
| 310,000 |
| 332,475 |
|
See Notes to Financial Statements.
|
| Western Asset Global Partners Income Fund Inc. 2012 Semi-Annual Report |
|
|
Schedule of investments (unaudited) (cont’d)
February 29, 2012
Western Asset Global Partners Income Fund Inc.
Security |
| Rate |
| Maturity |
| Face |
| Value |
|
Media — continued |
|
|
|
|
|
|
|
|
|
Globo Communicacoes e Participacoes SA, Bonds |
| 7.250 | % | 4/26/22 |
| 100,000 |
| $ 106,000 | (a)(c) |
Good Sam Enterprises LLC, Secured Notes |
| 11.500 | % | 12/1/16 |
| 340,000 |
| 353,175 |
|
Grupo Televisa SA, Senior Bonds |
| 6.625 | % | 1/15/40 |
| 570,000 |
| 677,317 | (c) |
LBI Media Inc., Senior Secured Notes |
| 9.250 | % | 4/15/19 |
| 320,000 |
| 273,600 | (a) |
Musketeer GmbH, Senior Secured Notes |
| 9.500 | % | 3/15/21 |
| 300,000 | EUR | 435,662 | (a) |
Musketeer GmbH, Senior Secured Notes |
| 9.500 | % | 3/15/21 |
| 180,000 | EUR | 261,397 | (a) |
Nara Cable Funding Ltd., Senior Secured Notes |
| 8.875 | % | 12/1/18 |
| 500,000 | EUR | 641,169 |
|
NET Servicos de Comunicacao SA, Bonds |
| 7.500 | % | 1/27/20 |
| 610,000 |
| 719,800 | (c)(i) |
Nielsen Finance LLC/Nielsen Finance Co., Senior Notes |
| 11.500 | % | 5/1/16 |
| 40,000 |
| 46,500 | (c) |
Ono Finance II PLC, Senior Bonds |
| 11.125 | % | 7/15/19 |
| 400,000 | EUR | 486,289 | (a) |
Polish Television Holding BV, Senior Secured Bonds, step bond |
| 11.250 | % | 5/15/17 |
| 300,000 | EUR | 389,698 | (a) |
TVN Finance Corp. III AB, Senior Notes |
| 7.875 | % | 11/15/18 |
| 100,000 | EUR | 129,233 | (a) |
Univision Communications Inc., Senior Notes |
| 8.500 | % | 5/15/21 |
| 90,000 |
| 89,775 | (a) |
Univision Communications Inc., Senior Secured Notes |
| 6.875 | % | 5/15/19 |
| 370,000 |
| 379,250 | (a) |
Univision Communications Inc., Senior Secured Notes |
| 7.875 | % | 11/1/20 |
| 290,000 |
| 310,300 | (a) |
UPC Holding BV, Senior Notes |
| 9.875 | % | 4/15/18 |
| 180,000 |
| 200,700 | (a)(c) |
UPCB Finance II Ltd., Senior Notes |
| 6.375 | % | 7/1/20 |
| 500,000 | EUR | 666,150 | (a) |
Ziggo Bond Co. BV, Senior Notes |
| 8.000 | % | 5/15/18 |
| 650,000 | EUR | 920,119 | (a)(c) |
Total Media |
|
|
|
|
|
|
| 10,830,034 |
|
Multiline Retail — 0.2% |
|
|
|
|
|
|
|
|
|
Neiman Marcus Group Inc., Senior Secured Notes |
| 7.125 | % | 6/1/28 |
| 440,000 |
| 410,300 | (c) |
Specialty Retail — 1.7% |
|
|
|
|
|
|
|
|
|
American Greetings Corp., Senior Notes |
| 7.375 | % | 12/1/21 |
| 380,000 |
| 394,250 |
|
Edcon Proprietary Ltd., Senior Secured Notes |
| 9.500 | % | 3/1/18 |
| 825,000 | EUR | 1,008,467 | (a) |
Gymboree Corp., Senior Notes |
| 9.125 | % | 12/1/18 |
| 520,000 |
| 468,000 |
|
Michaels Stores Inc., Senior Subordinated Bonds |
| 11.375 | % | 11/1/16 |
| 350,000 |
| 372,715 | (c) |
Michaels Stores Inc., Senior Subordinated Notes |
| 13.000 | % | 11/1/16 |
| 650,000 |
| 693,037 | (c) |
Spencer Spirit Holdings Inc./Spencer Gifts LLC/Spirit Halloween Superstores, Senior Notes |
| 11.000 | % | 5/1/17 |
| 210,000 |
| 213,413 | (a) |
Total Specialty Retail |
|
|
|
|
|
|
| 3,149,882 |
|
See Notes to Financial Statements.
|
| Western Asset Global Partners Income Fund Inc. 2012 Semi-Annual Report |
|
|
Western Asset Global Partners Income Fund Inc.
Security |
| Rate |
| Maturity |
| Face |
| Value |
|
Textiles, Apparel & Luxury Goods — 1.1% |
|
|
|
|
|
|
|
|
|
Boardriders SA, Senior Notes |
| 8.875 | % | 12/15/17 |
| 700,000 | EUR | $ 937,272 | (a) |
Empire Today LLC/Empire Today Finance Corp., Senior Secured Notes |
| 11.375 | % | 2/1/17 |
| 290,000 |
| 281,300 | (a) |
Oxford Industries Inc., Senior Secured Notes |
| 11.375 | % | 7/15/15 |
| 725,000 |
| 792,969 | (c) |
Total Textiles, Apparel & Luxury Goods |
|
|
|
|
|
|
| 2,011,541 |
|
Total Consumer Discretionary |
|
|
|
|
|
|
| 28,534,702 |
|
Consumer Staples — 1.5% |
|
|
|
|
|
|
|
|
|
Food & Staples Retailing — 0.1% |
|
|
|
|
|
|
|
|
|
Post Holdings Inc., Senior Notes |
| 7.375 | % | 2/15/22 |
| 220,000 |
| 234,850 | (a) |
Food Products — 1.0% |
|
|
|
|
|
|
|
|
|
Boparan Holdings Ltd., Senior Notes |
| 9.875 | % | 4/30/18 |
| 400,000 | GBP | 628,406 | (a) |
Foodcorp Ltd., Senior Secured Notes |
| 8.750 | % | 3/1/18 |
| 230,000 | EUR | 300,300 | (a) |
Harmony Foods Corp., Senior Secured Notes |
| 10.000 | % | 5/1/16 |
| 140,000 |
| 144,550 | (a)(c) |
Simmons Foods Inc., Senior Secured Notes |
| 10.500 | % | 11/1/17 |
| 630,000 |
| 604,800 | (a)(c) |
Smithfield Foods Inc., Senior Secured Notes |
| 10.000 | % | 7/15/14 |
| 61,000 |
| 71,827 | (c) |
Total Food Products |
|
|
|
|
|
|
| 1,749,883 |
|
Personal Products — 0.3% |
|
|
|
|
|
|
|
|
|
Hypermarcas SA, Notes |
| 6.500 | % | 4/20/21 |
| 260,000 |
| 253,500 | (a) |
Prestige Brands International Inc., Senior Notes |
| 8.125 | % | 2/1/20 |
| 190,000 |
| 209,000 | (a) |
Total Personal Products |
|
|
|
|
|
|
| 462,500 |
|
Tobacco — 0.1% |
|
|
|
|
|
|
|
|
|
Alliance One International Inc., Senior Notes |
| 10.000 | % | 7/15/16 |
| 260,000 |
| 261,950 | (c) |
Total Consumer Staples |
|
|
|
|
|
|
| 2,709,183 |
|
Energy — 16.8% |
|
|
|
|
|
|
|
|
|
Energy Equipment & Services — 2.0% |
|
|
|
|
|
|
|
|
|
Atwood Oceanics Inc., Senior Notes |
| 6.500 | % | 2/1/20 |
| 360,000 |
| 380,700 |
|
Complete Production Services Inc., Senior Notes |
| 8.000 | % | 12/15/16 |
| 425,000 |
| 442,606 | (c) |
Hercules Offshore LLC, Senior Secured Notes |
| 10.500 | % | 10/15/17 |
| 575,000 |
| 596,562 | (a)(c) |
Parker Drilling Co., Senior Notes |
| 9.125 | % | 4/1/18 |
| 400,000 |
| 431,000 | (c) |
Petroleum Geo-Services ASA, Senior Notes |
| 7.375 | % | 12/15/18 |
| 200,000 |
| 211,000 | (a) |
Pioneer Drilling Co., Senior Notes |
| 9.875 | % | 3/15/18 |
| 200,000 |
| 215,000 | (a)(c) |
SESI LLC, Senior Notes |
| 7.125 | % | 12/15/21 |
| 330,000 |
| 365,475 | (a)(c) |
Vantage Drilling Co., Senior Secured Notes |
| 11.500 | % | 8/1/15 |
| 950,000 |
| 1,064,000 | (c) |
Total Energy Equipment & Services |
|
|
|
|
|
|
| 3,706,343 |
|
Oil, Gas & Consumable Fuels — 14.8% |
|
|
|
|
|
|
|
|
|
Berry Petroleum Co., Senior Notes |
| 10.250 | % | 6/1/14 |
| 320,000 |
| 369,600 | (c) |
Calumet Specialty Products Partners LP/ Calumet Finance Corp., Senior Notes |
| 9.375 | % | 5/1/19 |
| 240,000 |
| 251,400 |
|
Calumet Specialty Products Partners LP/ Calumet Finance Corp., Senior Notes |
| 9.375 | % | 5/1/19 |
| 90,000 |
| 94,275 |
|
See Notes to Financial Statements.
|
| Western Asset Global Partners Income Fund Inc. 2012 Semi-Annual Report |
|
|
Schedule of investments (unaudited) (cont’d)
February 29, 2012
Western Asset Global Partners Income Fund Inc.
Security |
| Rate |
| Maturity |
| Face |
| Value |
|
Oil, Gas & Consumable Fuels — continued |
|
|
|
|
|
|
|
|
|
Coffeyville Resources LLC/Coffeyville Finance Inc., Senior Secured Notes |
| 9.000 | % | 4/1/15 |
| 260,000 |
| $ 279,500 | (a)(c) |
Compagnie Generale de Geophysique-Veritas, Senior Notes |
| 7.750 | % | 5/15/17 |
| 420,000 |
| 439,425 | (c) |
CONSOL Energy Inc., Senior Notes |
| 8.250 | % | 4/1/20 |
| 480,000 |
| 525,600 | (c) |
Corral Petroleum Holdings AB, Senior Notes |
| 15.000 | % | 12/31/17 |
| 785,542 |
| 597,012 | (a)(d)(e) |
Crosstex Energy LP/Crosstex Energy Finance Corp., Senior Notes |
| 8.875 | % | 2/15/18 |
| 250,000 |
| 272,500 | (c) |
Denbury Resources Inc., Senior Subordinated Notes |
| 8.250 | % | 2/15/20 |
| 100,000 |
| 114,500 | (c) |
Dolphin Energy Ltd., Senior Secured Bonds |
| 5.888 | % | 6/15/19 |
| 598,459 |
| 645,288 | (c) |
Ecopetrol SA, Senior Notes |
| 7.625 | % | 7/23/19 |
| 1,000,000 |
| 1,262,500 | (c) |
Energy Transfer Equity LP, Senior Notes |
| 7.500 | % | 10/15/20 |
| 370,000 |
| 425,500 | (c) |
Enterprise Products Operating LLP, Junior Subordinated Notes |
| 8.375 | % | 8/1/66 |
| 250,000 |
| 270,877 | (c)(f) |
Enterprise Products Operating LLP, Subordinated Notes |
| 7.034 | % | 1/15/68 |
| 260,000 |
| 278,535 | (c)(f) |
EXCO Resources Inc., Senior Notes |
| 7.500 | % | 9/15/18 |
| 520,000 |
| 468,000 | (c) |
KazMunaiGaz Finance Sub BV, Senior Notes |
| 8.375 | % | 7/2/13 |
| 1,340,000 |
| 1,437,766 | (a)(c) |
Kodiak Oil & Gas Corp., Senior Notes |
| 8.125 | % | 12/1/19 |
| 230,000 |
| 246,388 | (a) |
Milagro Oil & Gas Inc., Secured Notes |
| 10.500 | % | 5/15/16 |
| 380,000 |
| 294,500 |
|
Novatek Finance Ltd., Notes |
| 6.604 | % | 2/3/21 |
| 460,000 |
| 500,250 | (a)(c) |
Overseas Shipholding Group Inc., Senior Notes |
| 8.125 | % | 3/30/18 |
| 705,000 |
| 452,962 | (c) |
Pacific Rubiales Energy Corp., Senior Notes |
| 7.250 | % | 12/12/21 |
| 170,000 |
| 186,150 |
|
Pan American Energy LLC, Senior Notes |
| 7.875 | % | 5/7/21 |
| 470,000 |
| 498,200 | (a)(c) |
Pan American Energy LLC, Senior Notes |
| 7.875 | % | 5/7/21 |
| 246,000 |
| 260,760 |
|
Peabody Energy Corp., Senior Notes |
| 7.875 | % | 11/1/26 |
| 330,000 |
| 355,163 | (c) |
Petrobras International Finance Co., Senior Notes |
| 5.375 | % | 1/27/21 |
| 450,000 |
| 486,053 |
|
Petrobras International Finance Co., Senior Notes |
| 6.875 | % | 1/20/40 |
| 870,000 |
| 1,033,943 | (c) |
Petrobras International Finance Co., Senior Notes |
| 6.750 | % | 1/27/41 |
| 390,000 |
| 455,025 | (c) |
Petroleos Mexicanos, Notes |
| 8.000 | % | 5/3/19 |
| 4,280,000 |
| 5,371,400 | (c) |
Petroleum Co. of Trinidad & Tobago Ltd., Senior Notes |
| 9.750 | % | 8/14/19 |
| 390,000 |
| 478,335 | (a)(c) |
Petronas Capital Ltd. |
| 5.250 | % | 8/12/19 |
| 1,555,000 |
| 1,763,759 | (a)(c)(i) |
Petroplus Finance Ltd., Senior Notes |
| 6.750 | % | 5/1/14 |
| 470,000 |
| 206,800 | (a)(g) |
Plains Exploration & Production Co., Senior Notes |
| 10.000 | % | 3/1/16 |
| 325,000 |
| 364,000 | (c) |
Plains Exploration & Production Co., Senior Notes |
| 8.625 | % | 10/15/19 |
| 330,000 |
| 374,550 | (c) |
See Notes to Financial Statements.
|
| Western Asset Global Partners Income Fund Inc. 2012 Semi-Annual Report |
|
|
Western Asset Global Partners Income Fund Inc.
Security |
| Rate |
| Maturity |
| Face |
| Value |
|
Oil, Gas & Consumable Fuels — continued |
|
|
|
|
|
|
|
|
|
PT Adaro Indonesia, Senior Notes |
| 7.625 | % | 10/22/19 |
| 110,000 |
| $ 123,200 | (a)(c) |
PT Pertamina Persero, Notes |
| 5.250 | % | 5/23/21 |
| 570,000 |
| 611,325 | (a)(c) |
Quicksilver Resources Inc., Senior Notes |
| 11.750 | % | 1/1/16 |
| 1,020,000 |
| 1,091,400 | (c) |
Range Resources Corp., Senior Subordinated Notes |
| 8.000 | % | 5/15/19 |
| 10,000 |
| 11,200 | (c) |
Ras Laffan Liquefied Natural Gas Co., Ltd. III, Senior Secured Bonds |
| 6.750 | % | 9/30/19 |
| 570,000 |
| 678,300 | (c) |
Reliance Holdings USA Inc., Senior Notes |
| 4.500 | % | 10/19/20 |
| 530,000 |
| 516,955 | (a) |
Samson Investment Co., Senior Notes |
| 9.750 | % | 2/15/20 |
| 460,000 |
| 484,725 | (a) |
SandRidge Energy Inc., Senior Notes |
| 7.500 | % | 3/15/21 |
| 110,000 |
| 111,650 |
|
Teekay Corp., Senior Notes |
| 8.500 | % | 1/15/20 |
| 615,000 |
| 634,987 | (c) |
TNK-BP Finance SA, Senior Notes |
| 7.875 | % | 3/13/18 |
| 1,160,000 |
| 1,345,600 | (a)(c) |
Westmoreland Coal Co./Westmoreland Partners, Senior Secured Notes |
| 10.750 | % | 2/1/18 |
| 340,000 |
| 328,100 | (a) |
Whiting Petroleum Corp., Senior Subordinated Notes |
| 6.500 | % | 10/1/18 |
| 80,000 |
| 86,500 | (c) |
Xinergy Ltd., Senior Secured Notes |
| 9.250 | % | 5/15/19 |
| 330,000 |
| 232,650 | (a) |
Total Oil, Gas & Consumable Fuels |
|
|
|
|
|
|
| 27,317,108 |
|
Total Energy |
|
|
|
|
|
|
| 31,023,451 |
|
Financials — 6.9% |
|
|
|
|
|
|
|
|
|
Capital Markets — 0.2% |
|
|
|
|
|
|
|
|
|
Goldman Sachs Group Inc., Subordinated Notes |
| 6.750 | % | 10/1/37 |
| 300,000 |
| 301,547 | (c) |
Commercial Banks — 1.7% |
|
|
|
|
|
|
|
|
|
BankAmerica Institutional Capital A, Junior Subordinated Bonds |
| 8.070 | % | 12/31/26 |
| 620,000 |
| 625,425 | (a)(c) |
Barclays Bank PLC, Subordinated Notes |
| 6.050 | % | 12/4/17 |
| 370,000 |
| 378,504 | (a) |
Barclays Bank PLC, Subordinated Notes |
| 10.179 | % | 6/12/21 |
| 160,000 |
| 187,787 | (a)(c) |
Credit Agricole SA, Subordinated Notes |
| 8.375 | % | 10/13/19 |
| 290,000 |
| 261,000 | (a)(c)(f)(j) |
Intesa Sanpaolo SpA, Senior Notes |
| 3.625 | % | 8/12/15 |
| 940,000 |
| 896,920 | (a) |
Royal Bank of Scotland Group PLC, Junior Subordinated Bonds |
| 7.648 | % | 9/30/31 |
| 200,000 |
| 166,500 | (f)(j) |
Royal Bank of Scotland Group PLC, Subordinated Notes |
| 5.000 | % | 10/1/14 |
| 610,000 |
| 598,807 |
|
Santander Issuances SAU, Subordinated Notes |
| 5.911 | % | 6/20/16 |
| 100,000 |
| 95,035 | (a) |
Total Commercial Banks |
|
|
|
|
|
|
| 3,209,978 |
|
Consumer Finance — 1.5% |
|
|
|
|
|
|
|
|
|
Ally Financial Inc., Senior Bonds |
| 0.000 | % | 12/1/12 |
| 400,000 |
| 388,000 | (c) |
Ally Financial Inc., Senior Notes |
| 8.000 | % | 3/15/20 |
| 1,560,000 |
| 1,770,600 | (c) |
GMAC International Finance BV, Senior Bonds |
| 7.500 | % | 4/21/15 |
| 410,000 | EUR | 565,361 |
|
Total Consumer Finance |
|
|
|
|
|
|
| 2,723,961 |
|
See Notes to Financial Statements.
|
| Western Asset Global Partners Income Fund Inc. 2012 Semi-Annual Report |
|
|
Schedule of investments (unaudited) (cont’d)
February 29, 2012
Western Asset Global Partners Income Fund Inc.
Security |
| Rate |
| Maturity |
| Face |
| Value |
|
Diversified Financial Services — 3.0% |
|
|
|
|
|
|
|
|
|
Bank of America Corp., Senior Notes |
| 6.500 | % | 8/1/16 |
| 100,000 |
| $ 108,197 | (c) |
Bankrate Inc., Senior Secured Notes |
| 11.750 | % | 7/15/15 |
| 290,000 |
| 336,762 | (c) |
Boats Investments (Netherlands) BV, Secured Notes |
| 8.887 | % | 12/15/15 |
| 656,473 | EUR | 498,533 | (d)(f) |
Capital One Capital V, Junior Subordinated Notes, Cumulative Trust Preferred Securities |
| 10.250 | % | 8/15/39 |
| 310,000 |
| 324,725 | (c) |
Countrywide Capital III, Junior Subordinated Notes |
| 8.050 | % | 6/15/27 |
| 130,000 |
| 131,788 |
|
International Lease Finance Corp., Medium-Term Notes |
| 6.375 | % | 3/25/13 |
| 296,000 |
| 304,140 | (c) |
International Lease Finance Corp., Medium-Term Notes, Senior Notes |
| 5.625 | % | 9/20/13 |
| 460,000 |
| 470,350 |
|
International Lease Finance Corp., Senior Notes |
| 8.625 | % | 9/15/15 |
| 70,000 |
| 77,963 | (c) |
International Lease Finance Corp., Senior Notes |
| 8.875 | % | 9/1/17 |
| 980,000 |
| 1,114,750 | (c) |
International Lease Finance Corp., Senior Notes |
| 8.250 | % | 12/15/20 |
| 90,000 |
| 100,576 | (c) |
ISS Financing PLC, Senior Secured Bonds |
| 11.000 | % | 6/15/14 |
| 300,000 | EUR | 427,173 |
|
Leucadia National Corp., Senior Notes |
| 7.125 | % | 3/15/17 |
| 140,000 |
| 145,075 | (c) |
MBNA Capital A, Junior Subordinated Notes |
| 8.278 | % | 12/1/26 |
| 250,000 |
| 254,087 | (c) |
Telenet Finance III Luxembourg S.C.A., Senior Secured Notes |
| 6.625 | % | 2/15/21 |
| 500,000 | EUR | 682,803 | (a) |
ZFS Finance USA Trust II, Bonds |
| 6.450 | % | 12/15/65 |
| 500,000 |
| 490,000 | (a)(f) |
Total Diversified Financial Services |
|
|
|
|
|
|
| 5,466,922 |
|
Insurance — 0.5% |
|
|
|
|
|
|
|
|
|
American International Group Inc., Junior Subordinated Notes |
| 8.175 | % | 5/15/68 |
| 100,000 |
| 106,375 | (f) |
American International Group Inc., Senior Notes |
| 8.250 | % | 8/15/18 |
| 450,000 |
| 540,379 | (c) |
ING Capital Funding Trust III, Junior Subordinated Bonds |
| 4.179 | % | 6/30/12 |
| 100,000 |
| 84,369 | (f)(j) |
MetLife Capital Trust IV, Junior Subordinated Notes |
| 7.875 | % | 12/15/37 |
| 250,000 |
| 276,250 | (a)(c) |
Total Insurance |
|
|
|
|
|
|
| 1,007,373 |
|
Total Financials |
|
|
|
|
|
|
| 12,709,781 |
|
See Notes to Financial Statements.
|
| Western Asset Global Partners Income Fund Inc. 2012 Semi-Annual Report |
|
|
Western Asset Global Partners Income Fund Inc.
Security |
| Rate |
| Maturity |
| Face |
| Value |
|
Health Care — 4.6% |
|
|
|
|
|
|
|
|
|
Health Care Equipment & Supplies — 0.4% |
|
|
|
|
|
|
|
|
|
Biomet Inc., Senior Notes |
| 10.000 | % | 10/15/17 |
| 20,000 |
| $ 21,825 | (c) |
Biomet Inc., Senior Toggle Notes |
| 10.375 | % | 10/15/17 |
| 202,000 |
| 220,938 | (c)(d) |
Ontex, Senior Notes |
| 9.000 | % | 4/15/19 |
| 300,000 | EUR | 307,761 | (a) |
Ontex IV, Senior Notes |
| 9.000 | % | 4/15/19 |
| 200,000 | EUR | 205,174 | (a) |
Total Health Care Equipment & Supplies |
|
|
|
|
|
|
| 755,698 |
|
Health Care Providers & Services — 3.7% |
|
|
|
|
|
|
|
|
|
Acadia Healthcare Co. Inc., Senior Notes |
| 12.875 | % | 11/1/18 |
| 470,000 |
| 491,150 |
|
American Renal Associates Holdings Inc., Senior Notes |
| 9.750 | % | 3/1/16 |
| 336,520 |
| 339,464 | (d) |
American Renal Holdings, Senior Secured Notes |
| 8.375 | % | 5/15/18 |
| 300,000 |
| 322,500 |
|
AMERIGROUP Corp., Senior Notes |
| 7.500 | % | 11/15/19 |
| 220,000 |
| 243,100 | (c) |
Community Health Systems Inc., Senior Notes |
| 8.000 | % | 11/15/19 |
| 420,000 |
| 447,300 | (a) |
CRC Health Corp., Senior Subordinated Notes |
| 10.750 | % | 2/1/16 |
| 1,080,000 |
| 1,015,200 | (c) |
Crown Newco 3 PLC, Senior Subordinated Notes |
| 8.875 | % | 2/15/19 |
| 125,000 | GBP | 184,942 | (a) |
ExamWorks Group Inc., Senior Notes |
| 9.000 | % | 7/15/19 |
| 210,000 |
| 205,800 | (a) |
Fresenius Medical Care U.S. Finance Inc., Senior Notes |
| 6.875 | % | 7/15/17 |
| 750,000 |
| 836,250 | (c) |
Fresenius U.S. Finance II Inc., Senior Notes |
| 9.000 | % | 7/15/15 |
| 160,000 |
| 185,600 | (a)(c) |
HCA Inc., Senior Secured Notes |
| 8.500 | % | 4/15/19 |
| 620,000 |
| 697,500 | (c) |
INC Research LLC, Senior Notes |
| 11.500 | % | 7/15/19 |
| 160,000 |
| 154,400 | (a) |
InVentiv Health Inc., Senior Notes |
| 10.000 | % | 8/15/18 |
| 330,000 |
| 301,950 | (a) |
Tenet Healthcare Corp., Senior Secured Notes |
| 10.000 | % | 5/1/18 |
| 491,000 |
| 574,470 | (c) |
Universal Hospital Services Inc., Senior Secured Notes |
| 8.500 | % | 6/1/15 |
| 635,000 |
| 657,225 | (c)(f) |
US Oncology Inc. Escrow |
| — |
| — |
| 255,000 |
| 5,100 | * |
Vanguard Health Holdings Co., II LLC, Senior Notes |
| 8.000 | % | 2/1/18 |
| 250,000 |
| 264,375 | (c) |
Total Health Care Providers & Services |
|
|
|
|
|
|
| 6,926,326 |
|
Pharmaceuticals — 0.5% |
|
|
|
|
|
|
|
|
|
ConvaTec Healthcare E SA, Senior Notes |
| 10.875 | % | 12/15/18 |
| 660,000 | EUR | 888,111 | (a) |
Total Health Care |
|
|
|
|
|
|
| 8,570,135 |
|
See Notes to Financial Statements.
|
| Western Asset Global Partners Income Fund Inc. 2012 Semi-Annual Report |
|
|
Schedule of investments (unaudited) (cont’d)
February 29, 2012
Western Asset Global Partners Income Fund Inc.
Security |
| Rate |
| Maturity |
| Face |
| Value |
|
Industrials — 10.2% |
|
|
|
|
|
|
|
|
|
Aerospace & Defense — 1.2% |
|
|
|
|
|
|
|
|
|
Ducommun Inc., Senior Notes |
| 9.750 | % | 7/15/18 |
| 220,000 |
| $ 234,300 |
|
FGI Operating Co. Inc., Senior Secured Notes |
| 10.250 | % | 8/1/15 |
| 477,000 |
| 514,266 | (c) |
Kratos Defense & Security Solutions Inc., Senior Secured Notes |
| 10.000 | % | 6/1/17 |
| 550,000 |
| 595,375 | (c) |
Triumph Group Inc., Senior Notes |
| 8.625 | % | 7/15/18 |
| 190,000 |
| 214,700 | (c) |
Wyle Services Corp., Senior Subordinated Notes |
| 10.500 | % | 4/1/18 |
| 560,000 |
| 593,600 | (a)(c) |
Total Aerospace & Defense |
|
|
|
|
|
|
| 2,152,241 |
|
Airlines — 1.5% |
|
|
|
|
|
|
|
|
|
American Airlines Pass-Through Trust, Secured Notes |
| 7.000 | % | 1/31/18 |
| 167,460 |
| 164,111 | (a) |
BAA SH PLC, Senior Secured Notes |
| 7.125 | % | 3/1/17 |
| 400,000 | GBP | 637,569 |
|
Continental Airlines Inc., Pass-Through Certificates |
| 7.373 | % | 12/15/15 |
| 21,939 |
| 21,665 |
|
Continental Airlines Inc., Pass-Through Certificates |
| 9.250 | % | 5/10/17 |
| 4,191 |
| 4,443 |
|
Continental Airlines Inc., Pass-Through Certificates, Subordinated Secured Notes |
| 7.339 | % | 4/19/14 |
| 65,645 |
| 66,629 | (c) |
Continental Airlines Inc., Senior Secured Notes |
| 6.750 | % | 9/15/15 |
| 260,000 |
| 263,900 | (a)(c) |
DAE Aviation Holdings Inc., Senior Notes |
| 11.250 | % | 8/1/15 |
| 950,000 |
| 992,750 | (a)(c) |
Delta Air Lines, Secured Notes |
| 6.375 | % | 1/2/16 |
| 190,000 |
| 177,650 |
|
Delta Air Lines Inc., Pass-Through Certificates, Subordinated Secured Notes |
| 9.750 | % | 12/17/16 |
| 99,616 |
| 105,593 | (c) |
Delta Air Lines Inc., Senior Secured Notes |
| 9.500 | % | 9/15/14 |
| 147,000 |
| 158,392 | (a)(c) |
United Air Lines Inc., Senior Secured Notes |
| 9.875 | % | 8/1/13 |
| 144,000 |
| 152,280 | (a)(c) |
Total Airlines |
|
|
|
|
|
|
| 2,744,982 |
|
Building Products — 0.5% |
|
|
|
|
|
|
|
|
|
Ashton Woods USA LLC/Ashton Woods Finance Co., Senior Subordinated Notes, step bond |
| 0.000 | % | 6/30/15 |
| 124,200 |
| 105,570 | (a)(b) |
Building Materials Corp. of America, Senior Notes |
| 6.750 | % | 5/1/21 |
| 370,000 |
| 403,300 | (a)(c) |
Rearden G Holdings EINS GmbH, Senior Notes |
| 7.875 | % | 3/30/20 |
| 200,000 |
| 211,000 | (a) |
Shea Homes LP, Senior Secured Notes |
| 8.625 | % | 5/15/19 |
| 220,000 |
| 222,750 | (a) |
Total Building Products |
|
|
|
|
|
|
| 942,620 |
|
Commercial Services & Supplies — 1.2% |
|
|
|
|
|
|
|
|
|
Altegrity Inc., Senior Subordinated Notes |
| 10.500 | % | 11/1/15 |
| 50,000 |
| 48,000 | (a) |
Altegrity Inc., Senior Subordinated Notes |
| 11.750 | % | 5/1/16 |
| 780,000 |
| 746,850 | (a)(c) |
American Reprographics Co., Senior Notes |
| 10.500 | % | 12/15/16 |
| 460,000 |
| 457,700 |
|
See Notes to Financial Statements.
|
| Western Asset Global Partners Income Fund Inc. 2012 Semi-Annual Report |
| s |
Western Asset Global Partners Income Fund Inc.
Security |
| Rate |
| Maturity |
| Face |
| Value |
|
Commercial Services & Supplies — continued |
|
|
|
|
|
|
|
|
|
Geo Group Inc., Senior Notes |
| 7.750 | % | 10/15/17 |
| 455,000 |
| $ 492,537 | (c) |
JM Huber Corp., Senior Notes |
| 9.875 | % | 11/1/19 |
| 200,000 |
| 209,000 | (a) |
RSC Equipment Rental Inc./RSC Holdings III LLC, Senior Notes |
| 8.250 | % | 2/1/21 |
| 180,000 |
| 191,700 |
|
Total Commercial Services & Supplies |
|
|
|
|
|
|
| 2,145,787 |
|
Construction & Engineering — 0.6% |
|
|
|
|
|
|
|
|
|
Abengoa Finance SAU, Senior Notes |
| 8.875 | % | 11/1/17 |
| 350,000 |
| 350,000 | (a) |
Odebrecht Finance Ltd., Senior Notes |
| 7.000 | % | 4/21/20 |
| 550,000 |
| 606,375 | (a)(c) |
Odebrecht Finance Ltd., Senior Notes |
| 6.000 | % | 4/5/23 |
| 220,000 |
| 226,050 | (a) |
Total Construction & Engineering |
|
|
|
|
|
|
| 1,182,425 |
|
Electrical Equipment — 0.2% |
|
|
|
|
|
|
|
|
|
NES Rentals Holdings Inc., Senior Secured Notes |
| 12.250 | % | 4/15/15 |
| 400,000 |
| 360,000 | (a)(c) |
Industrial Conglomerates — 0.3% |
|
|
|
|
|
|
|
|
|
Leucadia National Corp., Senior Notes |
| 8.125 | % | 9/15/15 |
| 240,000 |
| 268,200 | (c) |
Sinochem Overseas Capital Co., Ltd., Senior Notes |
| 4.500 | % | 11/12/20 |
| 370,000 |
| 363,326 | (a) |
Total Industrial Conglomerates |
|
|
|
|
|
|
| 631,526 |
|
Machinery — 0.4% |
|
|
|
|
|
|
|
|
|
Dematic SA, Senior Secured Notes |
| 8.750 | % | 5/1/16 |
| 510,000 |
| 530,400 | (a)(c) |
Lonking Holdings Ltd., Senior Notes |
| 8.500 | % | 6/3/16 |
| 230,000 |
| 215,050 | (a) |
Total Machinery |
|
|
|
|
|
|
| 745,450 |
|
Marine — 0.6% |
|
|
|
|
|
|
|
|
|
Horizon Lines LLC, Senior Secured Notes |
| 11.000 | % | 10/15/16 |
| 220,000 |
| 218,900 | (a)(b) |
Horizon Lines LLC, Senior Secured Notes |
| 13.000 | % | 10/15/16 |
| 290,000 |
| 271,150 | (a)(b)(d) |
Navios Maritime Acquisition Corp./Navios Acquisition Finance U.S. Inc., Senior Secured Notes |
| 8.625 | % | 11/1/17 |
| 670,000 |
| 561,125 | (c) |
Total Marine |
|
|
|
|
|
|
| 1,051,175 |
|
Road & Rail — 1.7% |
|
|
|
|
|
|
|
|
|
Florida East Coast Holdings Corp., Senior Notes |
| 10.500 | % | 8/1/17 |
| 874,178 |
| 703,713 | (d) |
Florida East Coast Railway Corp., Senior Secured Notes |
| 8.125 | % | 2/1/17 |
| 100,000 |
| 101,500 |
|
Jack Cooper Holdings Corp., Senior Secured Notes |
| 13.250 | % | 12/15/15 |
| 546,000 |
| 548,730 | (a)(c) |
Kansas City Southern de Mexico, Senior Notes |
| 12.500 | % | 4/1/16 |
| 740,000 |
| 865,800 | (c) |
Kansas City Southern de Mexico, Senior Notes |
| 8.000 | % | 2/1/18 |
| 85,000 |
| 94,988 | (c) |
See Notes to Financial Statements.
|
| Western Asset Global Partners Income Fund Inc. 2012 Semi-Annual Report |
|
|
Schedule of investments (unaudited) (cont’d)
February 29, 2012
Western Asset Global Partners Income Fund Inc.
Security |
| Rate |
| Maturity |
| Face |
| Value |
|
Road & Rail — continued |
|
|
|
|
|
|
|
|
|
Quality Distribution LLC/QD Capital Corp., Secured Notes |
| 9.875 | % | 11/1/18 |
| 460,000 |
| $ 505,425 | (c) |
RailAmerica Inc., Senior Secured Notes |
| 9.250 | % | 7/1/17 |
| 317,000 |
| 355,040 |
|
Total Road & Rail |
|
|
|
|
|
|
| 3,175,196 |
|
Trading Companies & Distributors — 0.9% |
|
|
|
|
|
|
|
|
|
H&E Equipment Services Inc., Senior Notes |
| 8.375 | % | 7/15/16 |
| 455,000 |
| 473,200 | (c) |
UR Financing Escrow Corp., Secured Notes |
| 5.750 | % | 7/15/18 |
| 212,000 |
| 218,360 | (a) |
UR Financing Escrow Corp., Senior Notes |
| 7.375 | % | 5/15/20 |
| 212,000 |
| 218,095 | (a) |
UR Financing Escrow Corp., Senior Notes |
| 7.625 | % | 4/15/22 |
| 636,000 |
| 659,850 | (a) |
Total Trading Companies & Distributors |
|
|
|
|
|
|
| 1,569,505 |
|
Transportation — 1.1% |
|
|
|
|
|
|
|
|
|
CMA CGM, Senior Notes |
| 8.500 | % | 4/15/17 |
| 240,000 |
| 136,800 | (a)(c) |
CMA CGM, Senior Notes |
| 8.875 | % | 4/15/19 |
| 700,000 | EUR | 536,250 | (a) |
Hapag-Lloyd AG, Senior Notes |
| 9.750 | % | 10/15/17 |
| 710,000 |
| 670,950 | (a)(c) |
Syncreon Global Ireland Ltd./Syncreon Global Finance US Inc., Senior Notes |
| 9.500 | % | 5/1/18 |
| 770,000 |
| 750,750 | (a)(c) |
Total Transportation |
|
|
|
|
|
|
| 2,094,750 |
|
Total Industrials |
|
|
|
|
|
|
| 18,795,657 |
|
Information Technology — 2.4% |
|
|
|
|
|
|
|
|
|
Communications Equipment — 0.4% |
|
|
|
|
|
|
|
|
|
Lucent Technologies Inc., Debentures |
| 6.450 | % | 3/15/29 |
| 880,000 |
| 682,000 | (c) |
Electronic Equipment, Instruments & Components — 0.5% |
|
|
|
|
|
|
| ||
NXP BV/NXP Funding LLC, Senior Secured Notes |
| 9.750 | % | 8/1/18 |
| 850,000 |
| 965,813 | (a)(c) |
IT Services — 0.7% |
|
|
|
|
|
|
|
|
|
First Data Corp., Senior Notes |
| 9.875 | % | 9/24/15 |
| 940,000 |
| 961,150 |
|
First Data Corp., Senior Notes |
| 10.550 | % | 9/24/15 |
| 220,000 |
| 227,700 |
|
Sterling Merger Inc., Senior Notes |
| 11.000 | % | 10/1/19 |
| 70,000 |
| 74,025 | (a) |
Total IT Services |
|
|
|
|
|
|
| 1,262,875 |
|
Semiconductors & Semiconductor Equipment — 0.7% |
|
|
|
|
|
|
|
|
|
CEVA Group PLC, Senior Secured Notes |
| 12.750 | % | 3/31/20 |
| 200,000 |
| 187,000 | (a)(e) |
Freescale Semiconductor Inc., Senior Secured Notes |
| 9.250 | % | 4/15/18 |
| 140,000 |
| 154,700 | (a)(c) |
Freescale Semiconductor Inc., Senior Subordinated Notes |
| 10.125 | % | 12/15/16 |
| 620,000 |
| 657,975 | (c) |
STATS ChipPAC Ltd., Senior Notes |
| 7.500 | % | 8/12/15 |
| 244,000 |
| 264,740 | (a)(c) |
Total Semiconductors & Semiconductor Equipment |
|
|
|
|
|
|
| 1,264,415 |
|
Software — 0.1% |
|
|
|
|
|
|
|
|
|
Sophia LP/Sophia Finance Inc., Senior Notes |
| 9.750 | % | 1/15/19 |
| 150,000 |
| 162,000 | (a) |
Total Information Technology |
|
|
|
|
|
|
| 4,337,103 |
|
See Notes to Financial Statements.
|
| Western Asset Global Partners Income Fund Inc. 2012 Semi-Annual Report |
|
|
Western Asset Global Partners Income Fund Inc.
Security |
| Rate |
| Maturity |
| Face |
| Value |
|
Materials — 12.0% |
|
|
|
|
|
|
|
|
|
Chemicals — 1.5% |
|
|
|
|
|
|
|
|
|
Braskem Finance Ltd., Senior Notes |
| 7.000 | % | 5/7/20 |
| 540,000 |
| $ 599,400 | (c) |
Georgia Gulf Corp., Senior Secured Notes |
| 9.000 | % | 1/15/17 |
| 340,000 |
| 381,650 | (a)(c) |
Ineos Finance PLC, Senior Secured Notes |
| 9.000 | % | 5/15/15 |
| 310,000 |
| 330,150 | (a) |
Kerling PLC, Senior Secured Notes |
| 10.625 | % | 1/28/17 |
| 268,000 | EUR | 348,130 | (a) |
Lyondell Chemical Co., Senior Secured Notes |
| 8.000 | % | 11/1/17 |
| 124,000 |
| 139,190 | (c) |
Solutia Inc., Senior Notes |
| 8.750 | % | 11/1/17 |
| 5,000 |
| 5,687 | (c) |
Solutia Inc., Senior Notes |
| 7.875 | % | 3/15/20 |
| 310,000 |
| 365,025 | (c) |
Styrolution GmbH, Senior Secured Notes |
| 7.625 | % | 5/15/16 |
| 500,000 | EUR | 574,554 | (a) |
Total Chemicals |
|
|
|
|
|
|
| 2,743,786 |
|
Containers & Packaging — 2.6% |
|
|
|
|
|
|
|
|
|
Ardagh Packaging Finance PLC, Senior Notes |
| 9.250 | % | 10/15/20 |
| 1,000,000 | EUR | 1,368,938 | (a) |
Longview Fibre Paper & Packaging Inc., Senior Secured Notes |
| 8.000 | % | 6/1/16 |
| 280,000 |
| 289,100 | (a) |
Pretium Packaging LLC/Pretium Finance Inc., Senior Secured Notes |
| 11.500 | % | 4/1/16 |
| 510,000 |
| 532,950 |
|
Reynolds Group Issuer Inc./Reynolds Group Issuer LLC, Senior Notes |
| 9.250 | % | 5/15/18 |
| 290,000 |
| 292,900 | (a) |
Reynolds Group Issuer Inc./Reynolds Group Issuer LLC, Senior Notes |
| 9.875 | % | 8/15/19 |
| 390,000 |
| 403,650 | (a) |
Reynolds Group Issuer Inc./Reynolds Group Issuer LLC, Senior Notes |
| 9.875 | % | 8/15/19 |
| 350,000 |
| 362,250 | (a) |
Reynolds Group Issuer Inc./Reynolds Group Issuer LLC, Senior Secured Notes |
| 6.875 | % | 2/15/21 |
| 300,000 |
| 319,500 | (a) |
Rock-Tenn Co., Senior Notes |
| 9.250 | % | 3/15/16 |
| 200,000 |
| 210,740 | (c) |
Suzano Trading Ltd., Senior Notes |
| 5.875 | % | 1/23/21 |
| 500,000 |
| 491,250 | (a) |
Viskase Cos. Inc., Senior Secured Notes |
| 9.875 | % | 1/15/18 |
| 610,000 |
| 643,550 | (a)(c) |
Total Containers & Packaging |
|
|
|
|
|
|
| 4,914,828 |
|
Metals & Mining — 6.6% |
|
|
|
|
|
|
|
|
|
China Oriental Group Co., Ltd. |
| 7.000 | % | 11/17/17 |
| 490,000 |
| 434,875 | (a) |
Corporacion Nacional del Cobre de Chile, Senior Notes |
| 3.875 | % | 11/3/21 |
| 490,000 |
| 507,669 | (a) |
CSN Resources SA, Senior Bonds |
| 6.500 | % | 7/21/20 |
| 270,000 |
| 297,675 | (c) |
CSN Resources SA, Senior Bonds |
| 6.500 | % | 7/21/20 |
| 250,000 |
| 275,625 | (a)(c) |
Evraz Group SA, Notes |
| 8.250 | % | 11/10/15 |
| 130,000 |
| 138,775 |
|
Evraz Group SA, Notes |
| 6.750 | % | 4/27/18 |
| 1,310,000 |
| 1,298,538 | (a)(c) |
Evraz Group SA, Senior Notes |
| 9.500 | % | 4/24/18 |
| 540,000 |
| 604,800 |
|
FMG Resources (August 2006) Pty Ltd., Senior Notes |
| 7.000 | % | 11/1/15 |
| 80,000 |
| 85,000 | (a) |
FMG Resources (August 2006) Pty Ltd., Senior Notes |
| 8.250 | % | 11/1/19 |
| 550,000 |
| 610,500 | (a)(c) |
See Notes to Financial Statements.
|
| Western Asset Global Partners Income Fund Inc. 2012 Semi-Annual Report |
|
|
Western Asset Global Partners Income Fund Inc.
Schedule of investments (unaudited) (cont’d)
February 29, 2012
Security |
| Rate |
| Maturity |
| Face |
| Value |
|
Metals & Mining — continued |
|
|
|
|
|
|
|
|
|
Midwest Vanadium Pty Ltd., Senior Secured Notes |
| 11.500 | % | 2/15/18 |
| 840,000 |
| $ 579,600 | (a)(c) |
Mirabela Nickel Ltd., Senior Notes |
| 8.750 | % | 4/15/18 |
| 300,000 |
| 261,000 | (a) |
New World Resources NV, Senior Bonds |
| 7.375 | % | 5/15/15 |
| 330,000 | EUR | 450,650 |
|
Novelis Inc., Senior Notes |
| 8.750 | % | 12/15/20 |
| 510,000 |
| 571,200 | (c) |
Optima Specialty Steel Inc., Senior Secured Notes |
| 12.500 | % | 12/15/16 |
| 260,000 |
| 273,650 | (a) |
Rio Tinto Finance USA Ltd., Senior Notes |
| 9.000 | % | 5/1/19 |
| 260,000 |
| 359,122 | (c) |
Ryerson Holding Corp., Senior Secured Notes |
| 0.000 | % | 2/1/15 |
| 810,000 |
| 332,100 | (c) |
Southern Copper Corp., Senior Notes |
| 5.375 | % | 4/16/20 |
| 200,000 |
| 222,971 | (c) |
Southern Copper Corp., Senior Notes |
| 6.750 | % | 4/16/40 |
| 575,000 |
| 632,134 | (c) |
Tempel Steel Co., Senior Secured Notes |
| 12.000 | % | 8/15/16 |
| 210,000 |
| 208,425 | (a)(c) |
Vale Overseas Ltd., Notes |
| 8.250 | % | 1/17/34 |
| 460,000 |
| 632,935 | (c) |
Vale Overseas Ltd., Notes |
| 6.875 | % | 11/21/36 |
| 1,757,000 |
| 2,163,362 | (c) |
Vedanta Resources PLC, Senior Notes |
| 8.750 | % | 1/15/14 |
| 627,000 |
| 655,215 | (a)(c) |
Vedanta Resources PLC, Senior Notes |
| 6.750 | % | 6/7/16 |
| 450,000 |
| 434,250 | (a) |
Vedanta Resources PLC, Senior Notes |
| 9.500 | % | 7/18/18 |
| 100,000 |
| 101,000 |
|
Total Metals & Mining |
|
|
|
|
|
|
| 12,131,071 |
|
Paper & Forest Products — 1.3% |
|
|
|
|
|
|
|
|
|
Appleton Papers Inc., Senior Secured Notes |
| 11.250 | % | 12/15/15 |
| 407,000 |
| 370,370 | (c) |
Celulosa Arauco y Constitucion SA, Senior Notes |
| 7.250 | % | 7/29/19 |
| 222,000 |
| 263,814 | (c) |
Celulosa Arauco y Constitucion SA, Senior Notes |
| 4.750 | % | 1/11/22 |
| 160,000 |
| 162,840 | (a) |
China Forestry Holdings Co., Ltd., Senior Secured Bonds |
| 10.250 | % | 11/17/15 |
| 366,000 |
| 219,600 | (a)(b) |
Empresas CMPC SA, Notes |
| 4.750 | % | 1/19/18 |
| 250,000 |
| 263,299 | (a) |
Fibria Overseas Finance Ltd., Senior Notes |
| 7.500 | % | 5/4/20 |
| 240,000 |
| 251,700 |
|
Fibria Overseas Finance Ltd., Senior Notes |
| 6.750 | % | 3/3/21 |
| 250,000 |
| 247,500 | (a)(c) |
PE Paper Escrow GmbH, Senior Secured Notes |
| 12.000 | % | 8/1/14 |
| 150,000 |
| 164,250 | (a)(c) |
Verso Paper Holdings LLC, Senior Secured Notes |
| 11.500 | % | 7/1/14 |
| 30,000 |
| 30,750 |
|
Verso Paper Holdings LLC, Senior Subordinated Notes |
| 11.375 | % | 8/1/16 |
| 420,000 |
| 189,000 |
|
Verso Paper Holdings LLC/Verso Paper Inc., Senior Secured Notes |
| 8.750 | % | 2/1/19 |
| 520,000 |
| 260,000 |
|
Total Paper & Forest Products |
|
|
|
|
|
|
| 2,423,123 |
|
Total Materials |
|
|
|
|
|
|
| 22,212,808 |
|
See Notes to Financial Statements.
|
| Western Asset Global Partners Income Fund Inc. 2012 Semi-Annual Report |
|
|
Western Asset Global Partners Income Fund Inc.
Security |
| Rate |
| Maturity |
| Face |
| Value |
|
Telecommunication Services — 8.8% |
|
|
|
|
|
|
|
|
|
Diversified Telecommunication Services — 5.5% |
|
|
|
|
|
|
|
|
|
Axtel SAB de CV, Senior Notes |
| 7.625 | % | 2/1/17 |
| 1,363,000 |
| $ 1,192,625 | (a)(c) |
Axtel SAB de CV, Senior Notes |
| 7.625 | % | 2/1/17 |
| 730,000 |
| 638,750 | (c) |
Axtel SAB de CV, Senior Notes |
| 9.000 | % | 9/22/19 |
| 356,000 |
| 311,500 |
|
Cincinnati Bell Telephone Co., Senior Debentures |
| 6.300 | % | 12/1/28 |
| 50,000 |
| 40,375 | (c) |
Cogent Communications Group Inc., Senior Secured Notes |
| 8.375 | % | 2/15/18 |
| 380,000 |
| 400,900 | (a)(c) |
Inmarsat Finance PLC, Senior Notes |
| 7.375 | % | 12/1/17 |
| 580,000 |
| 623,500 | (a)(c) |
Intelsat Jackson Holdings Ltd., Senior Notes |
| 11.250 | % | 6/15/16 |
| 150,000 |
| 159,000 | (c) |
Intelsat Jackson Holdings Ltd., Senior Notes |
| 8.500 | % | 11/1/19 |
| 150,000 |
| 165,000 | (c) |
Intelsat Jackson Holdings SA, Senior Notes |
| 7.250 | % | 10/15/20 |
| 450,000 |
| 474,750 |
|
Intelsat Luxembourg SA, Senior Notes |
| 11.250 | % | 2/4/17 |
| 200,000 |
| 206,750 |
|
Level 3 Financing Inc., Senior Notes |
| 8.625 | % | 7/15/20 |
| 600,000 |
| 642,000 | (a) |
Primus Telecommunications Holding Inc., Senior Notes |
| 10.000 | % | 4/15/17 |
| 55,946 |
| 55,107 | (a) |
Qtel International Finance Ltd., Senior Notes |
| 4.750 | % | 2/16/21 |
| 220,000 |
| 226,864 | (a) |
Satmex Escrow SA de CV, Secured Senior Notes |
| 9.500 | % | 5/15/17 |
| 250,000 |
| 261,250 |
|
Telemar Norte Leste SA, Senior Notes |
| 5.500 | % | 10/23/20 |
| 380,000 |
| 388,550 | (a) |
TW Telecom Holdings Inc., Senior Notes |
| 8.000 | % | 3/1/18 |
| 380,000 |
| 418,475 | (c) |
UBS Luxembourg SA for OJSC Vimpel Communications, Loan Participation Notes |
| 8.250 | % | 5/23/16 |
| 480,000 |
| 517,776 |
|
Vimpel Communications, Loan Participation Notes |
| 8.375 | % | 4/30/13 |
| 520,000 |
| 547,300 | (a)(c) |
Vimpel Communications, Notes |
| 6.493 | % | 2/2/16 |
| 250,000 |
| 258,125 | (a) |
VIP Finance Ireland Ltd. for OJSC Vimpel Communications, Loan Participation Notes, Secured Notes |
| 8.375 | % | 4/30/13 |
| 248,000 |
| 261,020 | (c) |
West Corp., Senior Notes |
| 8.625 | % | 10/1/18 |
| 370,000 |
| 407,925 | (c) |
West Corp., Senior Notes |
| 7.875 | % | 1/15/19 |
| 470,000 |
| 510,537 |
|
West Corp., Senior Subordinated Notes |
| 11.000 | % | 10/15/16 |
| 290,000 |
| 309,212 | (c) |
Wind Acquisition Finance SA, Senior Notes |
| 11.750 | % | 7/15/17 |
| 200,000 |
| 206,000 | (a)(c) |
Wind Acquisition Finance SA, Senior Secured Notes |
| 7.250 | % | 2/15/18 |
| 200,000 |
| 195,500 | (a) |
Wind Acquisition Holdings Finance SpA, Senior Notes |
| 12.250 | % | 7/15/17 |
| 589,615 |
| 508,136 | (a)(d) |
Windstream Corp., Senior Notes |
| 7.500 | % | 4/1/23 |
| 270,000 |
| 285,525 |
|
Total Diversified Telecommunication Services |
|
|
|
|
|
|
| 10,212,452 |
|
See Notes to Financial Statements.
|
| Western Asset Global Partners Income Fund Inc. 2012 Semi-Annual Report |
|
|
Schedule of investments (unaudited) (cont’d)
February 29, 2012
Western Asset Global Partners Income Fund Inc.
Security |
| Rate |
| Maturity |
| Face |
| Value |
|
Wireless Telecommunication Services — 3.3% |
|
|
|
|
|
|
|
|
|
America Movil SAB de CV, Senior Notes |
| 5.625 | % | 11/15/17 |
| 340,000 |
| $ 402,907 | (c) |
Indosat Palapa Co. BV, Senior Notes |
| 7.375 | % | 7/29/20 |
| 540,000 |
| 612,900 | (a)(c) |
MetroPCS Wireless Inc., Senior Notes |
| 7.875 | % | 9/1/18 |
| 290,000 |
| 312,475 |
|
MetroPCS Wireless Inc., Senior Notes |
| 6.625 | % | 11/15/20 |
| 450,000 |
| 464,625 |
|
Oi S.A., Senior Notes |
| 5.750 | % | 2/10/22 |
| 240,000 |
| 246,600 | (a) |
Phones4u Finance PLC, Senior Secured Notes |
| 9.500 | % | 4/1/18 |
| 490,000 | GBP | 687,945 | (a) |
Phones4u Finance PLC, Senior Secured Notes |
| 9.500 | % | 4/1/18 |
| 100,000 | GBP | 140,397 | (a) |
Sprint Capital Corp., Senior Notes |
| 6.875 | % | 11/15/28 |
| 250,000 |
| 196,250 |
|
Sprint Capital Corp., Senior Notes |
| 8.750 | % | 3/15/32 |
| 1,865,000 |
| 1,669,175 | (c) |
Sprint Nextel Corp., Senior Notes |
| 9.000 | % | 11/15/18 |
| 630,000 |
| 704,025 | (a)(c) |
Syniverse Holdings Inc., Senior Notes |
| 9.125 | % | 1/15/19 |
| 425,000 |
| 465,375 | (c) |
VimpelCom Holdings BV, Senior Notes |
| 7.504 | % | 3/1/22 |
| 200,000 |
| 197,100 | (a) |
Total Wireless Telecommunication Services |
|
|
|
|
|
|
| 6,099,774 |
|
Total Telecommunication Services |
|
|
|
|
|
|
| 16,312,226 |
|
Utilities — 5.5% |
|
|
|
|
|
|
|
|
|
Electric Utilities — 2.0% |
|
|
|
|
|
|
|
|
|
AES Red Oak LLC, Secured Notes |
| 9.200 | % | 11/30/29 |
| 660,000 |
| 679,800 | (c) |
Astoria Depositor Corp., Pass-Through Certificates |
| 8.144 | % | 5/1/21 |
| 420,000 |
| 357,000 | (a) |
Energy Future Intermediate Holding Co. LLC/EFIH Finance Inc., Secured Notes |
| 11.750 | % | 3/1/22 |
| 1,180,000 |
| 1,205,134 | (a) |
Majapahit Holding BV, Senior Notes |
| 7.750 | % | 1/20/20 |
| 280,000 |
| 343,700 | (c) |
Midwest Generation LLC, Pass-Through Certificates |
| 8.560 | % | 1/2/16 |
| 54,567 |
| 55,659 |
|
Reliant Energy Mid-Atlantic Power Holdings LLC, Senior Notes |
| 9.681 | % | 7/2/26 |
| 800,000 |
| 746,000 | (c) |
Texas Competitive Electric Holdings Co. LLC, Senior Notes |
| 10.250 | % | 11/1/15 |
| 270,000 |
| 74,250 |
|
Texas Competitive Electric Holdings Co. LLC/ TCEH Finance Inc., Senior Secured Notes |
| 11.500 | % | 10/1/20 |
| 400,000 |
| 272,000 | (a) |
Total Electric Utilities |
|
|
|
|
|
|
| 3,733,543 |
|
Gas Utilities — 0.3% |
|
|
|
|
|
|
|
|
|
Southern Natural Gas Co., Senior Notes |
| 8.000 | % | 3/1/32 |
| 70,000 |
| 88,124 | (c) |
Suburban Propane Partners LP/Suburban Energy Finance Corp., Senior Notes |
| 7.375 | % | 3/15/20 |
| 330,000 |
| 353,100 | (c) |
Total Gas Utilities |
|
|
|
|
|
|
| 441,224 |
|
Independent Power Producers & Energy Traders — 3.1% |
|
|
|
|
|
|
| ||
AES Corp., Senior Notes |
| 9.750 | % | 4/15/16 |
| 500,000 |
| 597,500 | (c) |
AES Gener SA, Notes |
| 5.250 | % | 8/15/21 |
| 250,000 |
| 262,500 | (a) |
Atlantic Power Corp., Senior Notes |
| 9.000 | % | 11/15/18 |
| 270,000 |
| 276,750 | (a) |
Calpine Corp., Senior Secured Notes |
| 7.875 | % | 7/31/20 |
| 200,000 |
| 222,000 | (a)(c) |
See Notes to Financial Statements.
|
| Western Asset Global Partners Income Fund Inc. 2012 Semi-Annual Report |
|
|
Western Asset Global Partners Income Fund Inc.
Security |
| Rate |
| Maturity |
| Face |
| Value |
|
Independent Power Producers & Energy Traders — continued |
|
|
|
|
|
|
| ||
Calpine Corp., Senior Secured Notes |
| 7.500 | % | 2/15/21 |
| 100,000 |
| $ 109,000 | (a)(c) |
Calpine Corp., Senior Secured Notes |
| 7.875 | % | 1/15/23 |
| 620,000 |
| 678,900 | (a)(c) |
Colbun SA, Senior Notes |
| 6.000 | % | 1/21/20 |
| 390,000 |
| 420,289 | (a)(c) |
Dynegy Inc., Bonds |
| 7.670 | % | 11/8/16 |
| 280,000 |
| 168,000 | (c)(g) |
Edison Mission Energy, Senior Notes |
| 7.625 | % | 5/15/27 |
| 200,000 |
| 123,000 | (c) |
Energy Future Intermediate Holding Co. LLC/EFIH Finance Inc., Senior Secured Notes |
| 10.000 | % | 12/1/20 |
| 210,000 |
| 229,162 | (c) |
First Wind Holdings Inc., Senior Secured Notes |
| 10.250 | % | 6/1/18 |
| 390,000 |
| 394,875 | (a) |
Foresight Energy LLC/Foresight Energy Corp., Senior Notes |
| 9.625 | % | 8/15/17 |
| 810,000 |
| 866,700 | (a)(c) |
Mirant Americas Generation LLC, Senior Notes |
| 9.125 | % | 5/1/31 |
| 1,430,000 |
| 1,301,300 | (c) |
Total Independent Power Producers & Energy Traders |
|
|
|
|
| 5,649,976 |
| ||
Multi-Utilities — 0.1% |
|
|
|
|
|
|
|
|
|
Empresas Publicas de Medellin ESP, Senior Notes |
| 7.625 | % | 7/29/19 |
| 200,000 |
| 239,500 | (a)(c) |
Total Utilities |
|
|
|
|
|
|
| 10,064,243 |
|
Total Corporate Bonds & Notes (Cost — $150,504,627) |
|
|
|
|
| 155,269,289 |
| ||
Collateralized Senior Loans — 2.6% |
|
|
|
|
|
|
|
|
|
Consumer Discretionary — 0.7% |
|
|
|
|
|
|
|
|
|
Diversified Consumer Services — 0.6% |
|
|
|
|
|
|
|
|
|
Realogy Corp., Term Loan |
| 13.500 | % | 10/15/17 |
| 1,000,000 |
| 1,035,000 | (k) |
Hotels, Restaurants & Leisure — 0.1% |
|
|
|
|
|
|
|
|
|
El Pollo Loco Inc., First Lien Term Loan |
| 9.250 | % | 7/14/17 |
| 298,500 |
| 297,007 | (k) |
Total Consumer Discretionary |
|
|
|
|
|
|
| 1,332,007 |
|
Industrials — 1.0% |
|
|
|
|
|
|
|
|
|
Marine — 0.1% |
|
|
|
|
|
|
|
|
|
Trico Shipping AS, Term Loan A |
| 10.000 | % | 5/13/14 |
| 55,440 |
| 55,440 | (b)(k) |
Trico Shipping AS, Term Loan B |
| — |
| 5/13/14 |
| 97,612 |
| 97,612 | (b)(k)(l) |
Total Marine |
|
|
|
|
|
|
| 153,052 |
|
Trading Companies & Distributors — 0.9% |
|
|
|
|
|
|
|
|
|
United Rentals Inc. |
| — |
| 4/13/12 |
| 806,599 |
| 806,599 | (b)(e)(k)(l) |
United Rentals Inc. |
| — |
| 1/17/13 |
| 850,352 |
| 850,352 | (b)(e)(k)(l) |
Total Trading Companies & Distributors |
|
|
|
|
|
|
| 1,656,951 |
|
Total Industrials |
|
|
|
|
|
|
| 1,810,003 |
|
Information Technology — 0.1% |
|
|
|
|
|
|
|
|
|
IT Services — 0.1% |
|
|
|
|
|
|
|
|
|
SRA International Inc., Term Loan B |
| 6.500 - 7.500 | % | 7/20/18 |
| 232,857 |
| 230,092 | (k) |
See Notes to Financial Statements.
|
| Western Asset Global Partners Income Fund Inc. 2012 Semi-Annual Report |
|
|
Schedule of investments (unaudited) (cont’d)
February 29, 2012
Western Asset Global Partners Income Fund Inc.
Security |
| Rate |
| Maturity |
| Face |
| Value |
|
Materials — 0.2% |
|
|
|
|
|
|
|
|
|
Chemicals — 0.2% |
|
|
|
|
|
|
|
|
|
Kerling PLC, Term Loan |
| 10.000 | % | 6/30/16 |
| 300,000 | EUR | $ 379,705 | (k) |
Telecommunication Services — 0.5% |
|
|
|
|
|
|
|
|
|
Wireless Telecommunication Services — 0.5% |
|
|
|
|
|
|
| ||
Vodafone Americas Finance 2 Inc., Term Loan A |
| 6.875 | % | 8/11/15 |
| 830,646 |
| 830,646 | (k) |
Utilities — 0.1% |
|
|
|
|
|
|
|
|
|
Electric Utilities — 0.1% |
|
|
|
|
|
|
|
|
|
Texas Competitive Electric Holdings Co. LLC, Term Loan |
| 4.757 - 4.776 | % | 10/10/17 |
| 323,528 |
| 181,311 | (k) |
Total Collateralized Senior Loans (Cost — $4,845,687) |
|
|
|
|
| 4,763,764 |
| ||
Convertible Bonds & Notes — 0.5% |
|
|
|
|
|
|
|
|
|
Consumer Discretionary — 0.3% |
|
|
|
|
|
|
|
|
|
Diversified Consumer Services — 0.3% |
|
|
|
|
|
|
|
|
|
Realogy Corp., Senior Subordinated Bonds |
| 11.000 | % | 4/15/18 |
| 770,000 |
| 592,900 | (a)(c) |
Industrials — 0.2% |
|
|
|
|
|
|
|
|
|
Marine — 0.2% |
|
|
|
|
|
|
|
|
|
Horizon Lines Inc., Secured Senior Notes |
| 6.000 | % | 4/15/17 |
| 370,909 |
| 250,364 | (b)(e) |
Horizon Lines Inc., Secured Senior Notes |
| 6.000 | % | 4/15/17 |
| 103,030 |
| 33,484 | (b)(e) |
Total Industrials |
|
|
|
|
|
|
| 283,848 |
|
Materials — 0.0% |
|
|
|
|
|
|
|
|
|
Chemicals — 0.0% |
|
|
|
|
|
|
|
|
|
Hercules Inc. |
| 6.500 | % | 6/30/29 |
| 100,000 |
| 81,375 |
|
Total Convertible Bonds & Notes (Cost — $1,074,481) |
|
|
|
|
| 958,123 |
| ||
Sovereign Bonds — 37.6% |
|
|
|
|
|
|
|
|
|
Argentina — 3.3% |
|
|
|
|
|
|
|
|
|
Republic of Argentina, Discount Notes |
| 8.280 | % | 12/31/33 |
| 1,400,500 |
| 1,113,398 | (i) |
Republic of Argentina, GDP Linked Securities, Senior Bonds |
| 4.383 | % | 12/15/35 |
| 5,670,000 |
| 785,295 | (f)(m) |
Republic of Argentina, Senior Bonds |
| 7.000 | % | 9/12/13 |
| 3,321,000 |
| 3,331,345 |
|
Republic of Argentina, Senior Bonds |
| 7.000 | % | 10/3/15 |
| 485,000 |
| 458,963 |
|
Republic of Argentina, Senior Notes |
| 8.750 | % | 6/2/17 |
| 450,000 |
| 451,125 |
|
Total Argentina |
|
|
|
|
|
|
| 6,140,126 |
|
Brazil — 5.1% |
|
|
|
|
|
|
|
|
|
Brazil Nota do Tesouro Nacional, Notes |
| 10.000 | % | 1/1/14 |
| 665,000 | BRL | 388,379 |
|
Brazil Nota do Tesouro Nacional, Notes |
| 10.000 | % | 1/1/17 |
| 8,035,000 | BRL | 4,534,416 |
|
Federative Republic of Brazil |
| 7.125 | % | 1/20/37 |
| 427,550 |
| 593,440 |
|
See Notes to Financial Statements.
|
| Western Asset Global Partners Income Fund Inc. 2012 Semi-Annual Report |
|
|
Western Asset Global Partners Income Fund Inc.
Security |
| Rate |
| Maturity |
| Face |
| Value |
|
Federative Republic of Brazil, Collective Action Securities |
| 8.000 | % | 1/15/18 |
| 2,418,667 |
| $2,907,237 | (i) |
Federative Republic of Brazil, Collective Action Securities |
| 8.750 | % | 2/4/25 |
| 685,000 |
| 1,046,338 |
|
Total Brazil |
|
|
|
|
|
|
| 9,469,810 |
|
Chile — 0.5% |
|
|
|
|
|
|
|
|
|
Banco del Estado de Chile, Senior Notes |
| 4.125 | % | 10/7/20 |
| 260,000 |
| 269,100 | (a) |
Corporacion Nacional del Cobre de Chile, Senior Notes |
| 3.750 | % | 11/4/20 |
| 250,000 |
| 257,250 | (a)(c) |
Republic of Chile, Senior Notes |
| 3.875 | % | 8/5/20 |
| 412,000 |
| 451,140 |
|
Total Chile |
|
|
|
|
|
|
| 977,490 |
|
Colombia — 2.0% |
|
|
|
|
|
|
|
|
|
Republic of Colombia |
| 7.375 | % | 9/18/37 |
| 2,150,000 |
| 3,029,350 | (c)(i) |
Republic of Colombia, Senior Bonds |
| 6.125 | % | 1/18/41 |
| 180,000 |
| 222,030 |
|
Republic of Colombia, Senior Notes |
| 7.375 | % | 3/18/19 |
| 255,000 |
| 328,440 |
|
Total Colombia |
|
|
|
|
|
|
| 3,579,820 |
|
India — 0.2% |
|
|
|
|
|
|
|
|
|
ICICI Bank Ltd., Junior Subordinated Bonds |
| 6.375 | % | 4/30/22 |
| 186,000 |
| 177,630 | (a)(f) |
ICICI Bank Ltd., Subordinated Bonds |
| 6.375 | % | 4/30/22 |
| 130,000 |
| 124,150 | (f) |
Total India |
|
|
|
|
|
|
| 301,780 |
|
Indonesia — 3.5% |
|
|
|
|
|
|
|
|
|
Republic of Indonesia, Notes |
| 5.250 | % | 1/17/42 |
| 1,510,000 |
| 1,617,588 | (a) |
Republic of Indonesia, Senior Bonds |
| 6.875 | % | 1/17/18 |
| 100,000 |
| 121,375 |
|
Republic of Indonesia, Senior Bonds |
| 10.250 | % | 7/15/22 |
| 7,931,000,000 | IDR | 1,180,820 |
|
Republic of Indonesia, Senior Bonds |
| 11.000 | % | 9/15/25 |
| 4,954,000,000 | IDR | 802,248 |
|
Republic of Indonesia, Senior Bonds |
| 10.250 | % | 7/15/27 |
| 5,058,000,000 | IDR | 782,200 |
|
Republic of Indonesia, Senior Bonds |
| 6.625 | % | 2/17/37 |
| 775,000 |
| 972,625 |
|
Republic of Indonesia, Senior Bonds |
| 9.750 | % | 5/15/37 |
| 5,998,000,000 | IDR | 934,586 |
|
Total Indonesia |
|
|
|
|
|
|
| 6,411,442 |
|
Malaysia — 1.0% |
|
|
|
|
|
|
|
|
|
Government of Malaysia, Senior Bonds |
| 3.835 | % | 8/12/15 |
| 5,360,000 | MYR | 1,832,692 |
|
Government of Malaysia, Senior Bonds |
| 4.262 | % | 9/15/16 |
| 130,000 | MYR | 45,334 |
|
Total Malaysia |
|
|
|
|
|
|
| 1,878,026 |
|
Mexico — 2.7% |
|
|
|
|
|
|
|
|
|
Mexican Bonos, Bonds |
| 8.000 | % | 6/11/20 |
| 39,289,500 | MXN | 3,462,486 |
|
Mexican Bonos, Bonds |
| 8.500 | % | 11/18/38 |
| 6,740,000 | MXN | 577,861 |
|
United Mexican States, Bonds |
| 10.000 | % | 12/5/24 |
| 4,800,000 | MXN | 488,058 |
|
United Mexican States, Medium-Term Notes |
| 5.625 | % | 1/15/17 |
| 160,000 |
| 185,200 |
|
United Mexican States, Senior Notes |
| 5.125 | % | 1/15/20 |
| 220,000 |
| 252,450 |
|
Total Mexico |
|
|
|
|
|
|
| 4,966,055 |
|
See Notes to Financial Statements.
|
| Western Asset Global Partners Income Fund Inc. 2012 Semi-Annual Report |
|
|
Schedule of investments (unaudited) (cont’d)
February 29, 2012
Western Asset Global Partners Income Fund Inc.
Security |
| Rate |
| Maturity |
| Face |
| Value |
|
Panama — 1.2% |
|
|
|
|
|
|
|
|
|
Republic of Panama |
| 6.700 | % | 1/26/36 |
| 1,738,000 |
| $ 2,273,304 |
|
Peru — 2.1% |
|
|
|
|
|
|
|
|
|
Republic of Peru |
| 8.750 | % | 11/21/33 |
| 490,000 |
| 756,315 |
|
Republic of Peru, Bonds |
| 7.840 | % | 8/12/20 |
| 3,093,000 | PEN | 1,342,343 |
|
Republic of Peru, Bonds |
| 6.550 | % | 3/14/37 |
| 151,000 |
| 192,148 |
|
Republic of Peru, Global Senior Bonds |
| 7.350 | % | 7/21/25 |
| 1,200,000 |
| 1,624,800 | (i) |
Total Peru |
|
|
|
|
|
|
| 3,915,606 |
|
Philippines — 0.3% |
|
|
|
|
|
|
|
|
|
Republic of Philippines, Senior Bonds |
| 5.500 | % | 3/30/26 |
| 400,000 |
| 461,500 |
|
Poland — 1.6% |
|
|
|
|
|
|
|
|
|
Republic of Poland, Senior Notes |
| 6.375 | % | 7/15/19 |
| 900,000 |
| 1,057,500 | (c) |
Republic of Poland, Senior Notes |
| 5.125 | % | 4/21/21 |
| 500,000 |
| 538,750 |
|
Republic of Poland, Senior Notes |
| 5.000 | % | 3/23/22 |
| 1,270,000 |
| 1,354,201 |
|
Total Poland |
|
|
|
|
|
|
| 2,950,451 |
|
Russia — 3.1% |
|
|
|
|
|
|
|
|
|
RSHB Capital, Loan Participation Notes, Senior Secured Bonds |
| 6.299 | % | 5/15/17 |
| 756,000 |
| 799,886 | (a)(c) |
Russian Foreign Bond-Eurobond |
| 12.750 | % | 6/24/28 |
| 42,000 |
| 75,075 |
|
Russian Foreign Bond-Eurobond, Senior Bonds |
| 7.500 | % | 3/31/30 |
| 3,972,513 |
| 4,747,152 | (i) |
Total Russia |
|
|
|
|
|
|
| 5,622,113 |
|
Sri Lanka — 0.2% |
|
|
|
|
|
|
|
|
|
Sri Lanka Government International Bond, Senior Notes |
| 6.250 | % | 7/27/21 |
| 390,000 |
| 379,887 | (a) |
Turkey — 4.9% |
|
|
|
|
|
|
|
|
|
Republic of Turkey, Notes |
| 6.750 | % | 5/30/40 |
| 1,545,000 |
| 1,668,600 |
|
Republic of Turkey, Senior Bonds |
| 11.875 | % | 1/15/30 |
| 575,000 |
| 970,313 | (i) |
Republic of Turkey, Senior Notes |
| 6.875 | % | 3/17/36 |
| 5,836,000 |
| 6,405,010 | (c)(i) |
Total Turkey |
|
|
|
|
|
|
| 9,043,923 |
|
Venezuela — 5.9% |
|
|
|
|
|
|
|
|
|
Bolivarian Republic of Venezuela |
| 5.750 | % | 2/26/16 |
| 5,296,000 |
| 4,800,824 | (a) |
Bolivarian Republic of Venezuela |
| 7.650 | % | 4/21/25 |
| 233,000 |
| 182,206 |
|
Bolivarian Republic of Venezuela, Collective Action Securities, Global Senior Bonds |
| 9.375 | % | 1/13/34 |
| 1,982,000 |
| 1,729,295 |
|
Bolivarian Republic of Venezuela, Collective Action Securities, Notes |
| 10.750 | % | 9/19/13 |
| 391,000 |
| 410,550 |
|
Bolivarian Republic of Venezuela, Global Senior Bonds |
| 8.500 | % | 10/8/14 |
| 3,733,000 |
| 3,775,930 |
|
Total Venezuela |
|
|
|
|
|
|
| 10,898,805 |
|
Total Sovereign Bonds (Cost — $63,824,453) |
|
|
|
|
|
|
| 69,270,138 |
|
See Notes to Financial Statements.
|
| Western Asset Global Partners Income Fund Inc. 2012 Semi-Annual Report |
|
|
Western Asset Global Partners Income Fund Inc.
Security |
|
|
|
|
| Shares |
| Value |
|
Common Stocks — 1.3% |
|
|
|
|
|
|
|
|
|
Consumer Discretionary — 0.7% |
|
|
|
|
|
|
|
|
|
Hotels, Restaurants & Leisure — 0.0% |
|
|
|
|
|
|
|
|
|
Bossier Casino Venture Holdco Inc. |
|
|
|
|
| 19,194 |
| $ 38,388 | *(b)(e) |
Media — 0.7% |
|
|
|
|
|
|
|
|
|
Charter Communications Inc., Class A Shares |
|
|
|
|
| 19,539 |
| 1,238,968 | * |
Total Consumer Discretionary |
|
|
|
|
|
|
| 1,277,356 |
|
Energy — 0.4% |
|
|
|
|
|
|
|
|
|
Energy Equipment & Services — 0.4% |
|
|
|
|
|
|
|
|
|
KCAD Holdings I Ltd. |
|
|
|
|
| 66,487,354 |
| 670,060 | *(b)(e) |
Industrials — 0.2% |
|
|
|
|
|
|
|
|
|
Marine — 0.2% |
|
|
|
|
|
|
|
|
|
DeepOcean Group Holding AS |
|
|
|
|
| 26,137 |
| 424,726 | *(e) |
Horizon Lines Inc., Class A Shares |
|
|
|
|
| 9,758 |
| 34,641 | * |
Total Industrials |
|
|
|
|
|
|
| 459,367 |
|
Total Common Stocks (Cost — $1,704,926) |
|
|
|
|
|
|
| 2,406,783 |
|
|
|
|
|
|
|
|
|
|
|
|
| Rate |
|
|
|
|
|
|
|
Convertible Preferred Stocks — 1.3% |
|
|
|
|
|
|
|
|
|
Financials — 1.3% |
|
|
|
|
|
|
|
|
|
Diversified Financial Services — 1.3% |
|
|
|
|
|
|
|
|
|
Citigroup Inc. (Cost — $2,804,405) |
| 7.500 | % |
|
| 24,800 |
| 2,456,440 |
|
Preferred Stocks — 0.6% |
|
|
|
|
|
|
|
|
|
Financials — 0.5% |
|
|
|
|
|
|
|
|
|
Consumer Finance — 0.5% |
|
|
|
|
|
|
|
|
|
GMAC Capital Trust I |
| 8.125 | % |
|
| 40,749 |
| 956,787 | (f) |
Thrifts & Mortgage Finance — 0.0% |
|
|
|
|
|
|
|
|
|
Federal National Mortgage Association (FNMA) |
| 8.250 | % |
|
| 4,925 |
| 7,387 | *(f) |
Total Financials |
|
|
|
|
|
|
| 964,174 |
|
Industrials — 0.1% |
|
|
|
|
|
|
|
|
|
Road & Rail — 0.1% |
|
|
|
|
|
|
|
|
|
Jack Cooper Holdings Corp. |
| 20.000 | % |
|
| 101,700 |
| 102,208 | (a)(e) |
Total Preferred Stocks (Cost — $1,213,025) |
|
|
|
|
|
|
| 1,066,382 |
|
|
|
|
|
|
|
|
|
|
|
|
|
|
| Expiration |
| Contracts/ |
|
|
|
Purchased Options — 0.3% |
|
|
|
|
|
|
|
|
|
Credit default swaption with BNP Paribas to buy protection on Markit CDX.NA.HY.17 Index, Put @ $92.00 |
|
|
| 3/21/12 |
| 7,624,400 |
| 9,283 |
|
Credit default swaption with BNP Paribas to buy protection on Markit CDX.NA.HY.17 Index, Put @ $97.00 |
|
|
| 6/20/12 |
| 15,239,000 |
| 503,423 |
|
Total Purchased Options (Cost — $606,816) |
|
|
|
|
|
|
| 512,706 |
|
See Notes to Financial Statements.
|
| Western Asset Global Partners Income Fund Inc. 2012 Semi-Annual Report |
|
|
Schedule of investments (unaudited) (cont’d)
February 29, 2012
Western Asset Global Partners Income Fund Inc.
Security |
|
|
| Expiration |
| Warrants |
| Value |
| |
Warrants — 0.2% |
|
|
|
|
|
|
|
|
| |
Bolivarian Republic of Venezuela, Oil-linked payment obligations |
|
|
| 4/15/20 |
| 9,125 |
| $ 286,297 | (f) | |
Buffets Restaurant Holdings |
|
|
| 4/28/14 |
| 498 |
| 5 | *(e) | |
Charter Communications Inc. |
|
|
| 11/30/14 |
| 641 |
| 12,044 | *(e) | |
Jack Cooper Holdings Corp. |
|
|
| 12/15/17 |
| 496 |
| 35,960 | *(e) | |
Jack Cooper Holdings Corp. |
|
|
| 5/6/28 |
| 228 |
| 16,530 | *(e) | |
Nortek Inc. |
|
|
| 12/7/14 |
| 1,175 |
| 2,644 | *(b)(e) | |
SemGroup Corp. |
|
|
| 11/30/14 |
| 2,968 |
| 21,370 | *(b) | |
Total Warrants (Cost — $28,729) |
|
|
|
|
|
|
| 374,850 |
| |
Total Investments — 128.6% (Cost — $226,607,149#) |
|
|
|
|
| 237,078,475 |
| |||
Liabilities in excess of other assets — (28.6)% |
|
|
|
|
|
|
| (52,740,530 | ) | |
Total Net Assets — 100.0% |
|
|
|
|
|
|
| $184,337,945 |
| |
† Face amount denominated in U.S. dollars, unless otherwise noted.
* Non-income producing security.
(a) Security is exempt from registration under Rule 144A of the Securities Act of 1933. This security may be resold in transactions that are exempt from registration, normally to qualified institutional buyers. This security has been deemed liquid pursuant to guidelines approved by the Board of Directors, unless otherwise noted.
(b) Illiquid security.
(c) All or a portion of this security is pledged as collateral pursuant to the loan agreement (See Note 5).
(d) Payment-in-kind security for which part of the income earned may be paid as additional principal.
(e) Security is valued in good faith in accordance with procedures approved by the Board of Directors (See Note 1).
(f) Variable rate security. Interest rate disclosed is as of the most recent information available.
(g) The coupon payment on these securities is currently in default as of February 29, 2012.
(h) Value is less than $1.
(i) All or a portion of this security is held by the counterparty as collateral for open reverse repurchase agreements.
(j) Security has no maturity date. The date shown represents the next call date.
(k) Interest rates disclosed represent the effective rates on collateralized senior loans. Ranges in interest rates are attributable to multiple contracts under the same loan.
(l) All or a portion of this loan is unfunded as of February 29, 2012. The interest rate for fully unfunded term loans is to be determined.
(m) The security’s interest income payments are contingent upon the performance of Argentina’s GDP. There are no principal payments over the life of the security or upon the expiration of the security.
# Aggregate cost for federal income tax purposes is substantially the same.
See Notes to Financial Statements.
|
| Western Asset Global Partners Income Fund Inc. 2012 Semi-Annual Report |
|
|
Western Asset Global Partners Income Fund Inc.
Abbreviations used in this schedule:
BRL |
| — Brazilian Real |
EUR |
| — Euro |
GBP |
| — British Pound |
GDP |
| — Gross Domestic Product |
IDR |
| — Indonesian Rupiah |
MXN |
| — Mexican Peso |
MYR |
| — Malaysian Ringgit |
OJSC |
| — Open Joint Stock Company |
PEN |
| — Peruvian Nuevo Sol |
Schedule of Written Options
Security |
| Expiration |
| Strike |
| Notional |
| Value |
|
Credit default swaption with BNP Paribas to sell protection on Markit CDX.NA.HY.17 Index, Put |
| 3/21/12 |
| $ 94.00 |
| 5,684,000 |
| $ 19,121 |
|
Credit default swaption with BNP Paribas to sell protection on Markit CDX.NA.HY.17 Index, Put |
| 6/20/12 |
| 92.00 |
| 30,478,000 |
| 444,727 |
|
Credit default swaption with BNP Paribas to sell protection on Markit CDX.NA.HY.17 Index, Put |
| 3/21/12 |
| 97.00 |
| 3,812,200 |
| 45,350 |
|
Total Written Options |
|
|
|
|
|
|
| $509,198 |
|
Summary of Investments by Country**
United States |
| 39.0 | % |
Brazil |
| 7.8 |
|
Mexico |
| 6.6 |
|
Venezuela |
| 4.7 |
|
Russia |
| 4.5 |
|
Turkey |
| 3.8 |
|
Indonesia |
| 3.4 |
|
United Kingdom |
| 3.0 |
|
Argentina |
| 2.9 |
|
Colombia |
| 2.1 |
|
Luxembourg |
| 2.1 |
|
Peru |
| 1.7 |
|
Netherlands |
| 1.6 |
|
Malaysia |
| 1.5 |
|
Poland |
| 1.2 |
|
Cayman Islands |
| 1.2 |
|
See Notes to Financial Statements.
|
| Western Asset Global Partners Income Fund Inc. 2012 Semi-Annual Report |
|
|
Schedule of investments (unaudited) (cont’d)
February 29, 2012
Western Asset Global Partners Income Fund Inc.
Summary of Investments by Country** (continued)
Chile |
| 1.2 | % |
Panama |
| 1.1 |
|
Ireland |
| 1.1 |
|
India |
| 0.9 |
|
Germany |
| 0.8 |
|
Australia |
| 0.8 |
|
France |
| 0.8 |
|
Bermuda |
| 0.7 |
|
Kazakhstan |
| 0.6 |
|
Italy |
| 0.6 |
|
South Africa |
| 0.6 |
|
Canada |
| 0.5 |
|
Qatar |
| 0.4 |
|
Norway |
| 0.3 |
|
Sweden |
| 0.3 |
|
United Arab Emirates |
| 0.3 |
|
Mongolia |
| 0.3 |
|
Marshall Islands |
| 0.2 |
|
Belgium |
| 0.2 |
|
Trinidad and Tobago |
| 0.2 |
|
Philippines |
| 0.2 |
|
Spain |
| 0.2 |
|
Sri Lanka |
| 0.2 |
|
China |
| 0.2 |
|
Singapore |
| 0.1 |
|
Austria |
| 0.1 |
|
|
| 100.0 | % |
** As a percentage of total investments. Please note that Fund holdings are as of February 29, 2012 and are subject to change.
See Notes to Financial Statements.
|
| Western Asset Global Partners Income Fund Inc. 2012 Semi-Annual Report |
|
|
Statement of assets and liabilities (unaudited)
February 29, 2012
Assets: |
|
|
|
Investments, at value (Cost — $226,607,149) |
| $237,078,475 |
|
Foreign currency, at value (Cost — $663,140) |
| 682,375 |
|
Cash |
| 3,274,483 |
|
Interest receivable |
| 4,571,676 |
|
Receivable for securities sold |
| 997,895 |
|
Swaps, at value (net premiums paid — $147,804) |
| 86,965 |
|
Unrealized appreciation on forward foreign currency contracts |
| 12,292 |
|
Prepaid expenses |
| 4,610 |
|
Total Assets |
| 246,708,771 |
|
|
|
|
|
Liabilities: |
|
|
|
Loan payable (Notes 1 and 4) |
| 39,000,000 |
|
Payable for open reverse repurchase agreement |
| 17,777,772 |
|
Payable for securities purchased |
| 4,281,340 |
|
Written options, at value (premiums received $712,035) |
| 509,198 |
|
Unrealized depreciation on forward foreign currency contracts |
| 299,760 |
|
Investment management fee payable |
| 150,516 |
|
Interest payable |
| 122,504 |
|
Accrued foreign capital gains tax |
| 87,519 |
|
Payable for open swap contracts |
| 49,470 |
|
Directors’ fees payable |
| 1,124 |
|
Accrued expenses |
| 91,623 |
|
Total Liabilities |
| 62,370,826 |
|
Total Net Assets |
| $184,337,945 |
|
|
|
|
|
Net Assets: |
|
|
|
Par value ($0.001 par value; 15,502,230 shares issued and outstanding; 100,000,000 shares authorized) |
| $ 15,502 |
|
Paid-in capital in excess of par value |
| 206,357,215 |
|
Undistributed net investment income |
| 1,532,679 |
|
Accumulated net realized loss on investments, futures contracts, written options, swap contracts and foreign currency transactions |
| (33,830,748) |
|
Net unrealized appreciation on investments, written options, swap contracts and foreign currencies |
| 10,263,297 |
|
Total Net Assets |
| $184,337,945 |
|
|
|
|
|
Shares Outstanding |
| 15,502,230 |
|
|
|
|
|
Net Asset Value |
| $11.89 |
|
See Notes to Financial Statements.
|
| Western Asset Global Partners Income Fund Inc. 2012 Semi-Annual Report |
|
|
Statement of operations (unaudited)
For the Six Months Ended February 29, 2012
Investment Income: |
|
|
|
Interest |
| $ 9,503,858 |
|
Dividends |
| 181,639 |
|
Less: Foreign taxes withheld |
| (27,372) |
|
Total Investment Income |
| 9,658,125 |
|
|
|
|
|
Expenses: |
|
|
|
Investment management fee (Note 2) |
| 910,257 |
|
Interest expense (Notes 3 and 5) |
| 266,011 |
|
Audit and tax |
| 38,465 |
|
Shareholder reports |
| 28,184 |
|
Transfer agent fees |
| 26,586 |
|
Custody fees |
| 23,529 |
|
Directors’ fees |
| 16,498 |
|
Legal fees |
| 13,999 |
|
Stock exchange listing fees |
| 9,538 |
|
Fund accounting fees |
| 8,669 |
|
Insurance |
| 2,759 |
|
Miscellaneous expenses |
| 3,582 |
|
Total Expenses |
| 1,348,077 |
|
Net Investment Income |
| 8,310,048 |
|
|
|
|
|
Realized and Unrealized Gain (Loss) on Investments, Futures Contracts, Written Options, Swap Contracts and Foreign Currency Transactions (Notes 1, 3 and 4): |
|
|
|
Net Realized Gain (Loss) From: |
|
|
|
Investment transactions |
| (1,908,897) |
|
Futures contracts |
| (39,253) |
|
Written options |
| 1,090,710 |
|
Swap contracts |
| 27,925 |
|
Foreign currency transactions |
| 1,131,811 |
|
Net Realized Gain |
| 302,296 |
|
Change in Net Unrealized Appreciation (Depreciation) From: |
|
|
|
Investments |
| 5,550,699 |
|
Futures contracts |
| 7,377 |
|
Written options |
| (717,021) |
|
Swap contracts |
| (62,716) |
|
Foreign currencies |
| 43,498 |
|
Change in Net Unrealized Appreciation (Depreciation) |
| 4,821,837 |
|
Net Gain on Investments, Futures Contracts, Written Options, Swap Contracts and Foreign Currency Transactions |
| 5,124,133 |
|
Increase in Net Assets From Operations |
| $13,434,181 |
|
See Notes to Financial Statements.
|
| Western Asset Global Partners Income Fund Inc. 2012 Semi-Annual Report |
|
|
Statements of changes in net assets
For the Six Months Ended February 29, 2012 (unaudited) |
| 2012 |
| 2011 |
| ||
|
|
|
|
|
| ||
Operations: |
|
|
|
|
| ||
Net investment income |
| $ | 8,310,048 |
| $ | 16,942,934 |
|
Net realized gain |
| 302,296 |
| 3,150,914 |
| ||
Change in net unrealized appreciation (depreciation) |
| 4,821,837 |
| (2,927,795) |
| ||
Increase in Net Assets From Operations |
| 13,434,181 |
| 17,166,053 |
| ||
|
|
|
|
|
| ||
Distributions To Shareholders From (Note 1): |
|
|
|
|
| ||
Net investment income |
| (8,824,533) |
| (17,586,264) |
| ||
Decrease in Net Assets From Distributions to Shareholders |
| (8,824,533) |
| (17,586,264) |
| ||
|
|
|
|
|
| ||
Fund Share Transactions: |
|
|
|
|
| ||
Proceeds for shares issued on reinvestment of distributions (36,528 and 72,184 shares issued, respectively) |
| 427,159 |
| 883,441 |
| ||
Increase in Net Assets From Fund Share Transactions |
| 427,159 |
| 883,441 |
| ||
Increase in Net Assets |
| 5,036,807 |
| 463,230 |
| ||
|
|
|
|
|
| ||
Net Assets: |
|
|
|
|
| ||
Beginning of period |
| 179,301,138 |
| 178,837,908 |
| ||
End of period* |
| $184,337,945 |
| $179,301,138 |
| ||
* Includes undistributed net investment income of: |
| $ 1,532,679 |
| $2,047,164 |
| ||
See Notes to Financial Statements.
|
| Western Asset Global Partners Income Fund Inc. 2012 Semi-Annual Report |
|
|
Statement of cash flows (unaudited)
For the Six Months Ended February 29, 2012
Increase (Decrease) in Cash: Cash Provided (Used) by Operating Activities: |
|
|
|
Net increase in net assets resulting from operations |
| $ 13,434,181 |
|
Adjustments to reconcile net increase in net assets resulting from operations to net cash provided (used) by operating activities: |
|
|
|
Purchases of portfolio securities |
| (45,022,300) |
|
Proceeds from sales of portfolio securities |
| 43,851,771 |
|
Cash paid for call options |
| (710,316) |
|
Net purchases, sales and maturities of short-term investments |
| 2,521,000 |
|
Net amortization (accretion) of discount and premium |
| (36,854) |
|
Increase in receivable for securities sold |
| (385,063) |
|
Decrease in interest receivable |
| 294,694 |
|
Decrease in prepaid expenses |
| 12,297 |
|
Increase in payable for open swap contracts |
| 49,470 |
|
Decrease in cash collateral with brokers |
| 60,000 |
|
Increase in payable for securities purchased |
| 3,070,738 |
|
Decrease in investment management fee payable |
| (11,695) |
|
Increase in Directors’ fee payable |
| 904 |
|
Increase in interest payable |
| 51,638 |
|
Decrease in accrued expenses |
| (40,529) |
|
Upfront premiums paid from swap contracts, net |
| (147,804) |
|
Premiums paid from written options, net |
| (294,495) |
|
Change in payable to broker — variation margin on open futures contracts |
| 8,367 |
|
Net realized loss on investments |
| 1,908,897 |
|
Change in unrealized appreciation of investments, futures, written options, forward foreign curency contracts and swap contracts |
| (4,821,837) |
|
Net Cash Provided by Operating Activities * |
| 13,793,064 |
|
|
|
|
|
Cash Flows from Financing Activities |
|
|
|
Distribution paid on common stock |
| (8,397,374) |
|
Due to custodian |
| (34,188) |
|
Proceeds from reverse repurchase agreements |
| (2,491,628) |
|
Net Cash Used in Financing Activities |
| (10,923,190) |
|
Net increase in cash |
| 2,869,874 |
|
Cash at beginning of year |
| 1,086,984 |
|
Cash at end of year |
| $ 3,956,858 |
|
|
|
|
|
Supplemental Disclosure of Cash Flow Information: |
|
|
|
Proceeds from reinvestment of distributions |
| $ 427,159 |
|
* Included in operating expenses is cash paid for interest on borrowings of $214,373.
See Notes to Financial Statements.
|
| Western Asset Global Partners Income Fund Inc. 2012 Semi-Annual Report |
|
|
Financial highlights
For a share of capital stock outstanding throughout each year ended August 31, unless otherwise noted:
|
| 20121 |
| 2011 |
| 2010 |
| 2009 |
| 2008 |
| 2007 |
|
|
|
|
|
|
|
|
|
|
|
|
|
|
|
Net asset value, beginning of period |
| $11.59 |
| $11.62 |
| $10.06 |
| $11.36 |
| $12.59 |
| $12.93 |
|
|
|
|
|
|
|
|
|
|
|
|
|
|
|
Income (loss) from operations: |
|
|
|
|
|
|
|
|
|
|
|
|
|
Net investment income |
| 0.54 |
| 1.10 |
| 1.21 |
| 1.17 |
| 1.14 |
| 0.93 |
|
Net realized and unrealized gain (loss) |
| 0.33 |
| 0.01 |
| 1.49 |
| (1.33) |
| (1.39) |
| (0.32) | 2 |
Total income (loss) from operations |
| 0.87 |
| 1.11 |
| 2.70 |
| (0.16) |
| (0.25) |
| 0.61 |
|
|
|
|
|
|
|
|
|
|
|
|
|
|
|
Less distributions from: |
|
|
|
|
|
|
|
|
|
|
|
|
|
Net investment income |
| (0.57) |
| (1.14) |
| (1.14) |
| (1.14) |
| (0.98) |
| (0.95) |
|
Total distributions |
| (0.57) |
| (1.14) |
| (1.14) |
| (1.14) |
| (0.98) |
| (0.95) |
|
|
|
|
|
|
|
|
|
|
|
|
|
|
|
Net asset value, end of period |
| $11.89 |
| $11.59 |
| $11.62 |
| $10.06 |
| $11.36 |
| $12.59 |
|
|
|
|
|
|
|
|
|
|
|
|
|
|
|
Market price, end of period |
| $13.02 |
| $12.19 |
| $12.55 |
| $10.23 |
| $10.30 |
| $11.27 |
|
Total return, based on NAV3,4 |
| 7.92 | % | 9.64 | % | 27.90 | % | 2.22 | % | (2.16) | % | 4.59 | %5 |
Total return, based on market price6 |
| 12.12 | % | 6.58 | % | 35.62 | % | 15.51 | % | 0.11 | % | 3.36 | % |
|
|
|
|
|
|
|
|
|
|
|
|
|
|
Net assets, end of period (000s) |
| $184,338 |
| $179,301 |
| $178,838 |
| $154,057 |
| $173,700 |
| $192,480 |
|
|
|
|
|
|
|
|
|
|
|
|
|
|
|
Ratios to average net assets: |
|
|
|
|
|
|
|
|
|
|
|
|
|
Gross expenses |
| 1.56 | %7 | 1.66 | % | 1.91 | % | 2.99 | % | 2.77 | % | 2.96 | % |
Net expenses8 |
| 1.56 | 7 | 1.66 |
| 1.91 |
| 2.99 |
| 2.77 |
| 2.96 | 9 |
Net investment income |
| 9.59 | 7 | 9.10 |
| 10.77 |
| 14.10 |
| 9.38 |
| 7.03 |
|
|
|
|
|
|
|
|
|
|
|
|
|
|
|
Portfolio turnover rate |
| 20 | % | 56 | % | 65 | % | 58 | % | 46 | % | 75 | % |
|
|
|
|
|
|
|
|
|
|
|
|
|
|
Supplemental data: |
|
|
|
|
|
|
|
|
|
|
|
|
|
Loans Outstanding, End of Period (000s) |
| $39,000 |
| $39,000 |
| $33,000 |
| $33,000 |
| $35,000 |
| $35,000 |
|
Asset Coverage (000s) |
| $223,337 |
| $218,301 |
| $211,838 |
| $187,057 |
| $208,700 |
| $227,480 |
|
Asset Coverage for Loan Outstanding |
| 573 | % | 560 | % | 642 | % | 567 | % | 596 | % | 650 | % |
Weighted Average Loan (000s) |
| $39,000 |
| $34,085 |
| $33,000 |
| $33,499 |
| $35,000 |
| $37,657 |
|
Weighted Average Interest Rate on Loans |
| 0.97 | % | 0.94 | % | 1.18 | % | 2.96 | % | 4.32 | % | 5.63 | % |
1 For the six months ended February 29, 2012 (unaudited).
2 The investment manager fully reimbursed the Fund for losses incurred resulting from an investment transaction error. Without this reimbursement, the total return would not have changed.
3 Performance figures may reflect compensating balance arrangements, fee waivers and/or expense reimbursements. In the absence of compensating balance arrangements, fee waivers and/or expense reimbursements, the total return would have been lower. Past performance is no guarantee of future results. Total returns for periods of less than one year are not annualized.
4 The total return calculation assumes that distributions are reinvested at NAV. Past performance is no guarantee of future results. Total returns for periods less than one year are not annualized.
5 The impact of the reimbursement of the Fund for the losses incurred, resulting from an investment transaction error, to Fund’s total return was less than 0.01%.
6 The total return calculation assumes that distributions are reinvested in accordance with the Fund’s dividend reinvestment plan. Past performance is no guarantee of future results. Total returns for periods of less than one year are not annualized.
7 Annualized.
8 The impact of compensating balance arrangements, if any, was less than 0.01%.
9 Reflects fee waivers and/or expense reimbursements.
See Notes to Financial Statements.
|
| Western Asset Global Partners Income Fund Inc. 2012 Semi-Annual Report |
|
|
Notes to financial statements (unaudited)
1. Organization and significant accounting policies
Western Asset Global Partners Income Fund Inc. (the “Fund”) was incorporated in Maryland on September 3, 1993 and is registered as a non-diversified, closed-end management investment company under the Investment Company Act of 1940, as amended (the “1940 Act”). The Fund seeks to maintain a high level of current income. As a secondary objective, the Fund seeks capital appreciation.
The following are significant accounting policies consistently followed by the Fund and are in conformity with U.S. generally accepted accounting principles (“GAAP”). Estimates and assumptions are required to be made regarding assets, liabilities and changes in net assets resulting from operations when financial statements are prepared. Changes in the economic environment, financial markets and any other parameters used in determining these estimates could cause actual results to differ. Subsequent events have been evaluated through the date the financial statements were issued.
(a) Investment valuation. The valuations for fixed income securities and certain derivative instruments are typically the prices supplied by independent third party pricing services, which may use market prices or broker/dealer quotations or a variety of fair valuation techniques and methodologies. Short-term fixed income securities that will mature in 60 days or less are valued at amortized cost, unless it is determined that using this method would not reflect an investment’s fair value. Futures contracts are valued daily at the settlement price established by the board of trade or exchange on which they are traded. Equity securities for which market quotations are available are valued at the last reported sales price or official closing price on the primary market or exchange on which they trade. If independent third party pricing services are unable to supply prices for a portfolio investment, or if the prices supplied are deemed by the manager to be unreliable, the market price may be determined by the manager using quotations from one or more broker/dealers. When the Fund holds securities or other assets that are denominated in a foreign currency, the Fund will normally use the currency exchange rates as of 4:00 p.m. (Eastern Time). When reliable prices are not readily available, such as when the value of a security has been significantly affected by events after the close of the exchange or market on which the security is principally traded, but before the Fund calculates its net asset value, the Fund values these securities as determined in accordance with procedures approved by the Fund’s Board of Directors.
The Fund has adopted Financial Accounting Standards Board Codification Topic 820 (“ASC Topic 820”). ASC Topic 820 establishes a single definition of fair value, creates a three-tier hierarchy as a framework for measuring fair value based on inputs used to value the Fund’s investments, and requires
|
| Western Asset Global Partners Income Fund Inc. 2012 Semi-Annual Report |
|
|
additional disclosure about fair value. The hierarchy of inputs is summarized below.
· Level 1 — quoted prices in active markets for identical investments
· Level 2 — other significant observable inputs (including quoted prices for similar investments, interest rates, prepayment speeds, credit risk, etc.)
· Level 3 — significant unobservable inputs (including the Fund’s own assumptions in determining the fair value of investments)
The inputs or methodology used for valuing securities are not necessarily an indication of the risk associated with investing in those securities.
The Fund uses valuation techniques to measure fair value that are consistent with the market approach and/or income approach, depending on the type of security and the particular circumstance. The market approach uses prices and other relevant information generated by market transactions involving identical or comparable securities. The income approach uses valuation techniques to discount estimated future cash flows to present value.
The following is a summary of the inputs used in valuing the Fund’s assets and liabilities carried at fair value:
ASSETS
Description |
| Quoted Prices |
| Other Significant |
| Significant |
| Total |
| ||||
Long-term investments†: |
|
|
|
|
|
|
|
|
|
| |||
Corporate bonds & notes |
| — |
|
| $154,253,666 |
|
| $1,015,623 |
|
| $155,269,289 |
|
|
Collateralized senior loans |
| — |
|
| 3,106,813 |
|
| 1,656,951 |
|
| 4,763,764 |
|
|
Convertible bonds & notes |
| — |
|
| 674,275 |
|
| 283,848 |
|
| 958,123 |
|
|
Sovereign bonds |
| — |
|
| 69,270,138 |
|
| — |
|
| 69,270,138 |
|
|
Common stocks: |
|
|
|
|
|
|
|
|
|
|
|
|
|
Consumer discretionary |
| $1,238,968 |
|
| — |
|
| 38,388 |
|
| 1,277,356 |
|
|
Energy |
| — |
|
| — |
|
| 670,060 |
|
| 670,060 |
|
|
Industrials |
| 34,641 |
|
| — |
|
| 424,726 |
|
| 459,367 |
|
|
Convertible preferred stocks |
| 2,456,440 |
|
| — |
|
| — |
|
| 2,456,440 |
|
|
Preferred stocks |
| 964,174 |
|
| — |
|
| 102,208 |
|
| 1,066,382 |
|
|
Purchased options |
| — |
|
| 512,706 |
|
| — |
|
| 512,706 |
|
|
Warrants |
| — |
|
| 307,667 |
|
| 67,183 |
|
| 374,850 |
|
|
Total investments |
| $4,694,223 |
|
| $228,125,265 |
|
| $4,258,987 |
|
| $237,078,475 |
|
|
Other financial instruments: |
|
|
|
|
|
|
|
|
|
|
|
|
|
Forward foreign currency contracts |
| — |
|
| 12,292 |
|
| — |
|
| 12,292 |
|
|
Credit default swaps on credit |
| — |
|
| 86,965 |
|
| — |
|
| 86,965 |
|
|
Total other financial instruments |
| — |
|
| $ 99,257 |
|
| — |
|
| $ 99,257 |
|
|
Total |
| $4,694,223 |
|
| $228,224,522 |
|
| $4,258,987 |
|
| $237,177,732 |
|
|
|
| Western Asset Global Partners Income Fund Inc. 2012 Semi-Annual Report |
|
|
Notes to financial statements (unaudited) (cont’d)
LIABILITIES
Description |
| Quoted Prices |
| Other Significant |
| Significant |
| Total |
|
Other financial instruments: |
|
|
|
|
|
|
|
|
|
Written options |
| — |
| $509,198 |
| — |
| $509,198 |
|
Forward foreign currency contracts |
| — |
| 299,760 |
| — |
| 299,760 |
|
Total |
| — |
| $808,958 |
| — |
| $808,958 |
|
† See Schedule of Investments for additional detailed categorizations.
‡ Values include any premiums paid or received with respect to swap contracts.
The following is a reconciliation of investments in which significant unobservable inputs (Level 3) were used in determining fair value:
|
|
|
|
|
|
|
| Common Stocks |
| Preferred |
|
|
|
|
| ||||
Investments In |
| Corporate |
| Collateralized |
| Convertible |
| Consumer |
| Energy |
| Industrials |
| Industrials |
| Warrants |
| Total |
|
Balance as of August 31, 2011 |
| $1,186,662 |
| — |
| — |
| — |
| $660,825 |
| $ 34,830 |
| — |
| $ 2,355 |
| $1,884,672 |
|
Accrued premiums/ discounts |
| 3,016 |
| — |
| $ 3,258 |
| — |
| — |
| — |
| — |
| — |
| 6,274 |
|
Realized gain (loss)1 |
| (4,195 | ) | — |
| — |
| — |
| 1,171 |
| 44,999 |
| — |
| — |
| 41,975 |
|
Change in unrealized appreciation (depreciation)2 |
| (144,100 | ) | — |
| (259,212 | ) | — |
| — |
| (34,830 | ) | $ 12,977 |
| 294 |
| (424,871 | ) |
Purchases |
| 695,909 |
| $1,656,951 |
| 598,381 |
| $38,388 |
| 8,064 |
| — |
| 89,231 |
| — |
| 3,086,924 |
|
Sales |
| (721,669 | ) | — |
| (58,579 | ) | — |
| — |
| (44,999 | ) | — |
| — |
| (825,247 | ) |
Transfers into Level 33 |
| — |
| — |
| — |
| — |
| — |
| 424,726 |
| — |
| 64,534 |
| 489,260 |
|
Transfers out of Level 3 |
| — |
| — |
| — |
| — |
| — |
| — |
| — |
| — |
| — |
|
Balance as of February 29, 2012 |
| $1,015,623 |
| $1,656,951 |
| $ 283,848 |
| $38,388 |
| $670,060 |
| $424,726 |
| $102,208 |
| $67,183 |
| $4,258,987 |
|
Net change in unrealized appreciation (depreciation) for investments in securities still held at February 29, 20122 |
| $ (144,100 | ) | — |
| $(259,212 | ) | — |
| $ 1,171 |
| — |
| $ 12,977 |
| $ 294 |
| $ (388,870 | ) |
The Fund’s policy is to recognize transfers between levels as of the end of the reporting period.
1 This amount is included in net realized gain (loss) from investment transactions in the accompanying Statement of Operations.
2 This amount is included in the change in net unrealized appreciation (depreciation) in the accompanying Statement of Operations. Change in unrealized appreciation (depreciation) includes net unrealized
|
| Western Asset Global Partners Income Fund Inc. 2012 Semi-Annual Report |
|
|
appreciation (depreciation) resulting from changes in investment values during the reporting period and the reversal of previously recorded unrealized appreciation (depreciation) when gains or losses are realized.
3 Transferred into Level 3 as a result of the unavailability of a quoted price in an active market for an identical investment or the unavailability of other significant observable inputs.
(b) Repurchase agreements. The Fund may enter into repurchase agreements with institutions that its investment adviser has determined are creditworthy. Each repurchase agreement is recorded at cost. Under the terms of a typical repurchase agreement, the Fund acquires a debt security subject to an obligation of the seller to repurchase, and of the Fund to resell, the security at an agreed-upon price and time, thereby determining the yield during the Fund’s holding period. When entering into repurchase agreements, it is the Fund’s policy that its custodian or a third party custodian, acting on the Fund’s behalf, take possession of the underlying collateral securities, the market value of which, at all times, at least equals the principal amount of the repurchase transaction, including accrued interest. To the extent that any repurchase transaction maturity exceeds one business day, the value of the collateral is marked-to-market and measured against the value of the agreement in an effort to ensure the adequacy of the collateral. If the counterparty defaults, the Fund generally has the right to use the collateral to satisfy the terms of the repurchase transaction. However, if the market value of the collateral declines during the period in which the Fund seeks to assert its rights or if bankruptcy proceedings are commenced with respect to the seller of the security, realization of the collateral by the Fund may be delayed or limited.
(c) Reverse repurchase agreements. The Fund may enter into reverse repurchase agreements. Under the terms of a typical reverse repurchase agreement, a fund sells a security subject to an obligation to repurchase the security from the buyer at an agreed-upon time and price. In the event the buyer of securities under a reverse repurchase agreement files for bankruptcy or becomes insolvent, the Fund’s use of the proceeds of the agreement may be restricted pending a determination by the counterparty, or its trustee or receiver, whether to enforce the Fund’s obligation to repurchase the securities. In entering into reverse repurchase agreements, the Fund will maintain cash, U.S. government securities or other liquid debt obligations at least equal in value to its obligations with respect to reverse repurchase agreements or will take other actions permitted by law to cover its obligations.
(d) Futures contracts. The Fund uses futures contracts generally to gain exposure to, or hedge against, changes in interest rates or gain exposure to, or hedge against, changes in certain asset classes. A futures contract represents a commitment for the future purchase or sale of an asset at a specified price on a specified date.
Upon entering into a futures contract, the Fund is required to deposit cash or cash equivalents with a broker in an amount equal to a certain percentage of the contract amount. This is known as the “initial margin” and subsequent payments (“variation margin”) are made or received by the Fund each day, depending on the daily fluctuation in the value of the contract. For certain
|
| Western Asset Global Partners Income Fund Inc. 2012 Semi-Annual Report |
|
|
Notes to financial statements (unaudited) (cont’d)
futures, including foreign denominated futures, variation margin is not settled daily, but is recorded as a net variation margin payable or receivable. Futures contracts are valued daily at the settlement price established by the board of trade or exchange on which they are traded. The daily changes in contract value are recorded as unrealized gains or losses in the Statement of Operations and the Fund recognizes a realized gain or loss when the contract is closed.
Futures contracts involve, to varying degrees, risk of loss in excess of the amounts reflected in the financial statements. In addition, there is the risk that the Fund may not be able to enter into a closing transaction because of an illiquid secondary market.
(e) Loan participations. The Fund may invest in loans arranged through private negotiation between one or more financial institutions. The Fund’s investment in any such loan may be in the form of a participation in or an assignment of the loan. In connection with purchasing participations, the Fund generally will have no right to enforce compliance by the borrower with the terms of the loan agreement related to the loan, or any rights of off-set against the borrower and the Fund may not benefit directly from any collateral supporting the loan in which it has purchased the participation.
The Fund assumes the credit risk of the borrower, the lender that is selling the participation and any other persons interpositioned between the Fund and the borrower. In the event of the insolvency of the lender selling the participation, the Fund may be treated as a general creditor of the lender and may not benefit from any off-set between the lender and the borrower.
(f) Swap agreements. The Fund invests in swaps for the purpose of managing its exposure to interest rate, credit or market risk, or for other purposes. The use of swaps involves risks that are different from those associated with other portfolio transactions.
Swap contracts are marked-to-market daily and changes in value are recorded as unrealized appreciation (depreciation). Gains or losses are realized upon termination of the swap agreement. Collateral, in the form of restricted cash or securities, may be required to be held in segregated accounts with the Fund’s custodian in compliance with the terms of the swap contracts. Securities posted as collateral for swap contracts are identified in the Schedule of Investments and restricted cash, if any, is identified on the Statement of Assets and Liabilities. Risks may exceed amounts recorded in the Statement of Assets and Liabilities. These risks include changes in the returns of the underlying instruments, failure of the counterparties to perform under the contracts’ terms, and the possible lack of liquidity with respect to the swap agreements.
Payments received or made at the beginning of the measurement period are reflected as a premium or deposit, respectively, on the Statement of Assets and Liabilities. These upfront payments are amortized over the life of the
|
| Western Asset Global Partners Income Fund Inc. 2012 Semi-Annual Report |
|
|
swap and are recognized as realized gain or loss in the Statement of Operations. Net periodic payments received or paid by the Fund are recognized as a realized gain or loss in the Statement of Operations.
For average notional amounts of swaps held during the six months ended February 29, 2012, see Note 4.
Credit default swaps
The Fund enters into credit default swap (“CDS”) contracts for investment purposes, to manage its credit risk or to add leverage. CDS agreements involve one party making a stream of payments to another party in exchange for the right to receive a specified return in the event of a default by a third party, typically corporate or sovereign issuers, on a specified obligation, or in the event of a write-down, principal shortfall, interest shortfall or default of all or part of the referenced entities comprising a credit index. The Fund may use a CDS to provide protection against defaults of the issuers (i.e., to reduce risk where the Fund has exposure to an issuer) or to take an active long or short position with respect to the likelihood of a particular issuer’s default. As a seller of protection, the Fund generally receives an upfront payment or a stream of payments throughout the term of the swap provided that there is no credit event. If the Fund is a seller of protection and a credit event occurs, as defined under the terms of that particular swap agreement, the maximum potential amount of future payments (undiscounted) that the Fund could be required to make under a credit default swap agreement would be an amount equal to the notional amount of the agreement. These amounts of potential payments will be partially offset by any recovery of values from the respective referenced obligations. As a seller of protection, the Fund effectively adds leverage to its portfolio because, in addition to its total net assets, the Fund is subject to investment exposure on the notional amount of the swap. As a buyer of protection, the Fund generally receives an amount up to the notional value of the swap if a credit event occurs.
Implied spreads are the theoretical prices a lender receives for credit default protection. When spreads rise, market perceived credit risk rises and when spreads fall, market perceived credit risk falls. The implied credit spread of a particular referenced entity reflects the cost of buying/selling protection and may include upfront payments required to enter into the agreement. Wider credit spreads and decreasing market values, when compared to the notional amount of the swap, represent a deterioration of the referenced entity’s credit soundness and a greater likelihood or risk of default or other credit event occurring as defined under the terms of the agreement. Credit spreads utilized in determining the period end market value of credit default swap agreements on corporate or sovereign issues are disclosed in the Notes to Financial Statements and serve as an indicator of the current status of the payment/performance risk and represent the likelihood or risk of default for credit derivatives. For credit default swap agreements on asset-backed securities and credit indices, the quoted market prices and resulting values,
|
| Western Asset Global Partners Income Fund Inc. 2012 Semi-Annual Report |
|
|
Notes to financial statements (unaudited) (cont’d)
particularly in relation to the notional amount of the contract as well as the annual payment rate, serve as an indication of the current status of the payment/performance risk.
The Fund’s maximum risk of loss from counterparty risk, as the protection buyer, is the fair value of the contract (this risk is mitigated by the posting of collateral by the counterparty to the Fund to cover the Fund’s exposure to the counterparty). As the protection seller, the Fund’s maximum risk is the notional amount of the contract. Credit default swaps are considered to have credit risk-related contingent features since they require payment by the protection seller to the protection buyer upon the occurrence of a defined credit event.
Entering into a CDS agreement involves, to varying degrees, elements of credit, market and documentation risk in excess of the related amounts recognized on the Statement of Assets and Liabilities. Such risks involve the possibility that there will be no liquid market for these agreements, that the counterparty to the agreement may default on its obligation to perform or disagree as to the meaning of the contractual terms in the agreement, and that there will be unfavorable changes in net interest rates.
Interest rate swaps
The Fund enters into interest rate swap contracts to manage its exposure to interest rate risk. Interest rate swaps are agreements between two parties to exchange cash flows based on a notional principal amount. The Fund may elect to pay a fixed rate and receive a floating rate, or, receive a fixed rate and pay a floating rate on a notional principal amount. Interest rate swaps are marked-to-market daily based upon quotations from market makers and the change, if any, is recorded as an unrealized gain or loss in the Statement of Operations. When a swap contract is terminated early, the Fund records a realized gain or loss equal to the difference between the original cost and the settlement amount of the closing transaction.
The risks of interest rate swaps include changes in market conditions that will affect the value of the contract or changes in the present value of the future cash flow streams and the possible inability of the counterparty to fulfill its obligations under the agreement. The Fund’s maximum risk of loss from counterparty credit risk is the discounted net value of the cash flows to be received from the counterparty over the contract’s remaining life, to the extent that that amount is positive. This risk is mitigated by the posting of collateral by the counterparty to the Fund to cover the Fund’s exposure to the counterparty.
(g) Written options. When the Fund writes an option, an amount equal to the premium received by the Fund is recorded as a liability, the value of which is marked-to-market daily to reflect the current market value of the option written. If the option expires, the premium received is recorded as a realized gain. When a written call option is exercised, the difference between the
|
| Western Asset Global Partners Income Fund Inc. 2012 Semi-Annual Report |
|
|
premium received plus the option exercise price and the Fund’s basis in the underlying security (in the case of a covered written call option), or the cost to purchase the underlying security (in the case of an uncovered written call option), including brokerage commission, is recognized as a realized gain or loss. When a written put option is exercised, the amount of the premium received is subtracted from the cost of the security purchased by the Fund from the exercise of the written put option to form the Fund’s basis in the underlying security purchased. The writer or buyer of an option traded on an exchange can liquidate the position before the exercise of the option by entering into a closing transaction. The cost of a closing transaction is deducted from the original premium received resulting in a realized gain or loss to the Fund.
The risk in writing a covered call option is that the Fund may forego the opportunity of profit if the market price of the underlying security increases and the option is exercised. The risk in writing a put option is that the Fund may incur a loss if the market price of the underlying security decreases and the option is exercised. The risk in writing an uncovered call option is that the Fund is exposed to the risk of loss if the market price of the underlying security increases. In addition, there is the risk that the Fund may not be able to enter into a closing transaction because of an illiquid secondary market.
(h) Swaptions. The Fund purchases and writes swaption contracts to manage exposure to an underlying instrument. The Fund may also purchase or write options to manage exposure to fluctuations in interest rates or to enhance yield. Swaption contracts written by the Fund represent an option that gives the purchaser the right, but not the obligation, to enter into a previously agreed upon swap contract at a future date. Swaption contracts purchased by the Fund represent an option that gives the Fund the right, but not the obligation, to enter into a previously agreed upon swap contract at a future date.
When the Fund writes a swaption, an amount equal to the premium received by the Fund is recorded as a liability, the value of which is marked-to-market daily to reflect the current market value of the swaption written. If the swaption expires, the Fund realizes a gain equal to the amount of the premium received.
When the Fund purchases a swaption, an amount equal to the premium paid by the Fund is recorded as an investment on the statement of assets and liabilities, the value of which is marked-to-market daily to reflect the current market value of the swaption purchased. If the swaption expires, the Fund realizes a loss equal to the amount of the premium paid.
Swaptions are marked-to-market daily based upon quotations from market makers. Changes in the value of the swaption are reported as unrealized gains or losses in the Statement of Operations.
|
| Western Asset Global Partners Income Fund Inc. 2012 Semi-Annual Report |
|
|
Notes to financial statements (unaudited) (cont’d)
(i) Forward foreign currency contracts. The Fund enters into a forward foreign currency contract to hedge against foreign currency exchange rate risk on its non-U.S. dollar denominated securities or to facilitate settlement of a foreign currency denominated portfolio transaction. A forward foreign currency contract is an agreement between two parties to buy and sell a currency at a set price with delivery and settlement at a future date. The contract is marked-to-market daily and the change in value is recorded by the Fund as an unrealized gain or loss. When a forward foreign currency contract is closed, through either delivery or offset by entering into another forward foreign currency contract, the Fund recognizes a realized gain or loss equal to the difference between the value of the contract at the time it was opened and the value of the contract at the time it is closed.
Forward foreign currency contracts involve elements of market risk in excess of the amounts reflected on the Statement of Assets and Liabilities. The Fund bears the risk of an unfavorable change in the foreign exchange rate underlying the forward foreign currency contract. Risks may also arise upon entering into these contracts from the potential inability of the counterparties to meet the terms of their contracts.
(j) Foreign currency translation. Investment securities and other assets and liabilities denominated in foreign currencies are translated into U.S. dollar amounts based upon prevailing exchange rates on the date of valuation. Purchases and sales of investment securities and income and expense items denominated in foreign currencies are translated into U.S. dollar amounts based upon prevailing exchange rates on the respective dates of such transactions.
The Fund does not isolate that portion of the results of operations resulting from fluctuations in foreign exchange rates on investments from the fluctuations arising from changes in market prices of securities held. Such fluctuations are included with the net realized and unrealized gain or loss on investments.
Net realized foreign exchange gains or losses arise from sales of foreign currencies, including gains and losses on forward foreign currency contracts, currency gains or losses realized between the trade and settlement dates on securities transactions, and the difference between the amounts of dividends, interest, and foreign withholding taxes recorded on the Fund’s books and the U.S. dollar equivalent of the amounts actually received or paid. Net unrealized foreign exchange gains and losses arise from changes in the values of assets and liabilities, other than investments in securities, on the date of valuation, resulting from changes in exchange rates.
Foreign security and currency transactions may involve certain considerations and risks not typically associated with those of U.S. dollar denominated transactions as a result of, among other factors, the possibility of lower levels of governmental supervision and regulation of foreign securities markets and the possibility of political or economic instability.
|
| Western Asset Global Partners Income Fund Inc. 2012 Semi-Annual Report |
|
|
(k) Cash flow information. The Fund invests in securities and distributes dividends from net investment income and net realized gains, which are paid in cash and may be reinvested at the discretion of shareholders. These activities are reported in the Statement of Changes in Net Assets and additional information on cash receipts and cash payments are presented in the Statement of Cash Flows.
(l) Credit and market risk. The Fund invests in high-yield and emerging market instruments that are subject to certain credit and market risks. The yields of high-yield and emerging market debt obligations reflect, among other things, perceived credit and market risks. The Fund’s investment in securities rated below investment grade typically involve risks not associated with higher rated securities including, among others, greater risk related to timely and ultimate payment of interest and principal, greater market price volatility and less liquid secondary market trading. The consequences of political, social, economic or diplomatic changes may have disruptive effects on the market prices of investments held by the Fund. The Fund’s investment in non-U.S. dollar denominated securities may also result in foreign currency losses caused by devaluations and exchange rate fluctuations.
(m) Foreign investment risks. The Fund’s investments in foreign securities may involve risks not present in domestic investments. Since securities may be denominated in foreign currencies, may require settlement in foreign currencies or pay interest or dividends in foreign currencies, changes in the relationship of these foreign currencies to the U.S. dollar can significantly affect the value of the investments and earnings of the Fund. Foreign investments may also subject the Fund to foreign government exchange restrictions, expropriation, taxation or other political, social or economic developments, all of which affect the market and/or credit risk of the investments.
(n) Counterparty risk and credit-risk-related contingent features of derivative instruments. The Fund may invest in certain securities or engage in other transactions, where the Fund is exposed to counterparty credit risk in addition to broader market risks. The Fund may invest in securities of issuers, which may also be considered counterparties as trading partners in other transactions. This may increase the risk of loss in the event of default or bankruptcy by the counterparty or if the counterparty otherwise fails to meet its contractual obligations. The Fund’s investment manager attempts to mitigate counterparty risk by (i) periodically assessing the creditworthiness of its trading partners, (ii) monitoring and/or limiting the amount of its net exposure to each individual counterparty based on its assessment and (iii) requiring collateral from the counterparty for certain transactions. Market events and changes in overall economic conditions may impact the assessment of such counterparty risk by the investment manager. In addition, declines in the values of underlying collateral received may expose the Fund to increased risk of loss.
|
| Western Asset Global Partners Income Fund Inc. 2012 Semi-Annual Report |
|
|
Notes to financial statements (unaudited) (cont’d)
The Fund has entered into master agreements with certain of its derivative counterparties that provide for general obligations, representations, agreements, collateral, events of default or termination and credit related contingent features. The credit related contingent features include, but are not limited to, a percentage decrease in the Fund’s net assets or NAV over a specified period of time. If these credit related contingent features were triggered, the derivatives counterparty could terminate the positions and demand payment or require additional collateral.
As of February 29, 2012, the Fund held written options and forward foreign currency contracts with credit related contingent features which had a liability position of $808,958. If a contingent feature in the master agreements would have been triggered, the Fund would have been required to pay this amount to its derivatives counterparties.
(o) Security transactions and investment income. Security transactions are accounted for on a trade date basis. Interest income, adjusted for amortization of premium and accretion of discount, is recorded on the accrual basis. Dividend income is recorded on the ex-dividend date. Foreign dividend income is recorded on the ex-dividend date or as soon as practicable after the Fund determines the existence of a dividend declaration after exercising reasonable due diligence. The cost of investments sold is determined by use of the specific identification method. To the extent any issuer defaults or a credit event occurs that impacts the issuer, the Fund may halt any additional interest income accruals and consider the realizability of interest accrued up to the date of default or credit event.
(p) Distributions to shareholders. Distributions from net investment income of the Fund, if any, are declared quarterly and paid on a monthly basis. Distributions of net realized gains, if any, are declared at least annually. Distributions to shareholders of the Fund are recorded on the ex-dividend date and are determined in accordance with income tax regulations, which may differ from GAAP.
(q) Compensating balance arrangements. The Fund has an arrangement with its custodian bank whereby a portion of the custodian’s fees is paid indirectly by credits earned on the Fund’s cash on deposit with the bank.
(r) Federal and other taxes. It is the Fund’s policy to comply with the federal income and excise tax requirements of the Internal Revenue Code of 1986 (the “Code”), as amended, applicable to regulated investment companies. Accordingly, the Fund intends to distribute its taxable income and net realized gains, if any, to shareholders in accordance with timing requirements imposed by the Code. Therefore, no federal or state income tax provision is required in the Fund’s financial statements.
Management has analyzed the Fund’s tax positions taken on income tax returns for all open tax years and has concluded that as of February 29, 2012, no provision for income tax is required in the Fund’s financial statements.
|
| Western Asset Global Partners Income Fund Inc. 2012 Semi-Annual Report |
|
|
The Fund’s federal and state income and federal excise tax returns for tax years for which the applicable statutes of limitations have not expired are subject to examination by Internal Revenue Service and state departments of revenue.
Under the applicable foreign tax laws, a withholding tax may be imposed on interest, dividends and capital gains at various rates. Realized gains upon disposition of Indonesian securities held by the Fund are subject to capital gains tax in that country. As of February 29, 2012, there were $87,519 of capital gains tax liabilities accrued on unrealized gains.
(s) Reclassification. GAAP requires that certain components of net assets be reclassified to reflect permanent differences between financial and tax reporting. These reclassifications have no effect on net assets or net asset value per share.
2. Investment management agreement and other transactions with affiliates
Legg Mason Partners Fund Advisor, LLC (“LMPFA”) is the Fund’s investment manager. Western Asset Management Company (“Western Asset”) is the Fund’s subadviser. Western Asset Management Company Pte. Ltd. (“Western Singapore”), Western Asset Management Company Ltd (“Western Japan”) and Western Asset Management Company Limited (“Western Asset Limited”) serve as additional subadvisers to the Fund, under additional subadvisory agreements with Western Asset. LMPFA, Western Asset, Western Singapore, Western Japan and Western Asset Limited are wholly-owned subsidiaries of Legg Mason, Inc. (“Legg Mason”).
LMPFA provides administrative and certain oversight services to the Fund. The Fund pays LMPFA an investment management fee, calculated daily and paid monthly, at an annual rate of 1.05% of the Fund’s average weekly net assets.
LMPFA delegates to Western Asset the day-to-day portfolio management of the Fund. Western Singapore, Western Japan and Western Asset Limited do not receive any compensation from the Fund and are paid by Western Asset for their services to the Fund. For its services, LMPFA pays Western Asset 70% of the net management fee it receives from the Fund. In turn, Western Asset pays Western Singapore, Western Japan and Western Asset Limited a subadvisory fee of 0.30% on the assets managed by each subadvisor.
All officers and one Director of the Fund are employees of Legg Mason or its affiliates and do not receive compensation from the Fund.
|
| Western Asset Global Partners Income Fund Inc. 2012 Semi-Annual Report |
|
|
Notes to financial statements (unaudited) (cont’d)
3. Investments
During the six months ended February 29, 2012, the aggregate cost of purchases and proceeds from sales of investments (excluding short-term investments) were as follows:
Purchases |
| $45,022,300 |
|
Sales |
| 43,851,771 |
|
At February 29, 2012, the aggregate gross unrealized appreciation and depreciation of investments for federal income tax purposes were substantially as follows:
Gross unrealized appreciation |
| $19,470,807 |
|
Gross unrealized depreciation |
| (8,999,481 | ) |
Net unrealized appreciation |
| $10,471,326 |
|
During the six months ended February 29, 2012, written option transactions for the Fund were as follows:
|
| Number of Contracts |
| Premiums |
| ||
Written options, outstanding as of August 31, 2011 |
| 66,660,000 |
|
| $ | 1,006,530 |
|
Options written |
| 46,874,200 |
|
| 796,215 |
| |
Options expired |
| (73,560,000 | ) |
| (1,090,710 | ) | |
Written options, outstanding as of February 29, 2012 |
| 39,974,200 |
|
| $ | 712,035 |
|
Transactions in reverse repurchase agreements for the Fund during the six months ended February 29, 2012 were as follows:
Average Daily |
| Weighted Average |
| Maximum Amount |
|
$18,103,883 |
| 0.77% |
| $20,269,400 |
|
* Averages based on the number of days that Fund had reverse repurchase agreements outstanding.
Interest rates on reverse repurchase agreements ranged from 0.10% to 0.85% during the six months ended February 29, 2012. Interest expense incurred on reverse repurchase agreements totaled $69,128.
|
| Western Asset Global Partners Income Fund Inc. 2012 Semi-Annual Report |
|
|
At February 29, 2012, the Fund had the following open reverse repurchase agreements:
Counterparty |
| Rate |
| Effective Date |
| Maturity Date |
| Face Amount of |
| |
Credit Suisse |
| 0.75% |
| 3/15/2011 |
| TBD* |
| $ 4,056,867 |
|
|
Credit Suisse |
| 0.85% |
| 3/15/2011 |
| TBD* |
| 1,257,960 |
|
|
Credit Suisse |
| 0.65% |
| 5/26/2011 |
| TBD* |
| 1,397,640 |
|
|
Credit Suisse |
| 0.85% |
| 6/10/2011 |
| TBD* |
| 2,124,600 |
|
|
Credit Suisse |
| 0.75% |
| 9/2/2011 |
| TBD* |
| 2,728,982 |
|
|
Credit Suisse |
| 0.75% |
| 9/29/2011 |
| TBD* |
| 4,341,661 |
|
|
Credit Suisse |
| 0.85% |
| 9/29/2011 |
| TBD* |
| 751,812 |
|
|
JPMorgan Chase Bank |
| 0.75% |
| 11/3/2011 |
| TBD* |
| 1,118,250 |
|
|
|
|
|
|
|
|
|
| $17,777,772 |
|
|
* TBD — To Be Determined; These reverse repurchase agreements have no maturity dates because they are renewed daily and can be terminated by either the Fund or the counterparty in accordance with the terms of the agreements.
On February 29, 2012, the total market value of underlying collateral (refer to the Schedule of Investments for positions held at the counterparty as collateral for reverse repurchase agreements) for open reverse repurchase agreements was $22,260,643.
At February 29, 2012, the Fund had the following open forward foreign currency contracts:
Foreign Currency |
| Counterparty |
| Local |
| Market |
| Settlement |
| Unrealized | |
Contracts to Buy: |
|
|
|
|
|
|
|
|
|
|
|
British Pound |
| Citibank N.A. |
| 700,000 |
| $1,113,023 |
| 5/16/12 |
| $ 12,032 |
|
British Pound |
| Citibank N.A. |
| 100,000 |
| 159,003 |
| 5/16/12 |
| 260 |
|
|
|
|
|
|
|
|
|
|
| 12,292 |
|
Contracts to Sell: |
|
|
|
|
|
|
|
|
|
|
|
Brazilian Real |
| Citibank N.A. |
| 4,260,000 |
| 2,473,131 |
| 3/15/12 |
| (14,966 | ) |
Brazilian Real |
| JPMorgan Chase Bank |
| 4,154,650 |
| 2,411,970 |
| 3/15/12 |
| (15,702 | ) |
British Pound |
| Citibank N.A. |
| 1,759,613 |
| 2,797,845 |
| 5/16/12 |
| (30,360 | ) |
British Pound |
| UBS AG |
| 596,646 |
| 948,688 |
| 5/16/12 |
| (5,331 | ) |
Euro |
| BNP Paribas SA |
| 1,607,030 |
| 2,141,785 |
| 5/16/12 |
| (29,617 | ) |
Euro |
| Citibank N.A. |
| 266,373 |
| 355,012 |
| 5/16/12 |
| (3,654 | ) |
Euro |
| Citibank N.A. |
| 2,005,654 |
| 2,673,056 |
| 5/16/12 |
| (56,579 | ) |
Euro |
| UBS AG |
| 2,770,000 |
| 3,691,745 |
| 5/16/12 |
| (18,087 | ) |
Euro |
| UBS AG |
| 6,663,049 |
| 8,880,243 |
| 5/16/12 |
| (125,464 | ) |
|
|
|
|
|
|
|
|
|
| (299,760 | ) |
Net unrealized loss on open forward foreign currency contracts |
|
|
| $(287,468 | ) | ||||||
|
| Western Asset Global Partners Income Fund Inc. 2012 Semi-Annual Report |
|
|
Notes to financial statements (unaudited) (cont’d)
At February 29, 2012, the Fund held the following credit default swap contracts:
CREDIT DEFAULT SWAPS ON CREDIT INDICES — BUY PROTECTION1
Swap Counterparty (Reference Entity) |
| Notional |
| Termination |
| Periodic |
| Market |
| Upfront |
| Unrealized |
|
BNP Paribas |
|
|
|
|
| 0.050% |
|
|
|
|
|
|
|
(MARKIT CDX.NA.HY.17 Index) |
| $ 679,000 |
| 12/20/16 |
| quarterly |
| $11,936 |
| $ 20,370 |
| $ (8,434) |
|
BNP Paribas (MARKIT CDX.NA.HY.17 Index) |
| 2,522,000 |
| 12/20/16 |
| 0.050% quarterly |
| 44,335 |
| 77,236 |
| (32,901) |
|
BNP Paribas (MARKIT CDX.NA.HY.17 Index) |
| 1,746,000 |
| 12/20/16 |
| 0.050% quarterly |
| 30,694 |
| 50,198 |
| (19,504) |
|
Total |
| $4,947,000 |
|
|
|
|
| $86,965 |
| $147,804 |
| $(60,839) |
|
1 If the Fund is a buyer of protection and a credit event occurs, as defined under the terms of that particular swap agreement, the Fund will either (i) receive from the seller of protection an amount equal to the notional amount of the swap and deliver the underlying securities comprising the referenced index or (ii) receive a net settlement amount in the form of cash or securities equal to the notional amount of the swap less the recovery value of the underlying securities comprising the referenced index.
2 The maximum potential amount the Fund could be required to pay as a seller of credit protection or receive as a buyer of credit protection if a credit event occurs as defined under the terms of that particular swap agreement.
3 The quoted market prices and resulting values for credit default swap agreements on asset-backed securities and credit indices serve as an indicator of the current status of the payment/performance risk and represent the likelihood of an expected liability (or profit) for the credit derivative should the notional amount of the swap agreement been closed/sold as of the period end. Decreasing market values (sell protection) or increasing market values (buy protection) when compared to the notional amount of the swap, represent a deterioration of the referenced entity’s credit soundness and a greater likelihood or risk of default or other credit event occurring as defined under the terms of the agreement.
‡ Percentage shown is an annual percentage rate.
|
| Western Asset Global Partners Income Fund Inc. 2012 Semi-Annual Report |
|
|
4. Derivative instruments and hedging activities
Financial Accounting Standards Board Codification Topic 815 requires enhanced disclosure about an entity’s derivative and hedging activities.
Below is a table, grouped by derivative type, that provides information about the fair value and the location of derivatives within the Statement of Assets and Liabilities at February 29, 2012.
ASSET DERIVATIVES1
|
| Foreign |
| Credit Risk |
| Total |
|
Purchased options2 |
| — |
| $512,706 |
| $512,706 |
|
Forward foreign currency contracts |
| $12,292 |
| — |
| 12,292 |
|
Swap contracts3 |
| — |
| 86,965 |
| 86,965 |
|
Total |
| $12,292 |
| $599,671 |
| $611,963 |
|
LIABILITY DERIVATIVES1
|
| Foreign |
| Credit Risk |
| Total |
|
Written options |
| — |
| $509,198 |
| $509,198 |
|
Forward foreign currency contracts |
| $299,760 |
| — |
| 299,760 |
|
Total |
| $299,760 |
| $509,198 |
| $808,958 |
|
1 Generally, the balance sheet location for asset derivatives is receivables/net unrealized appreciation (depreciation) and for liability derivatives is payables/net unrealized appreciation (depreciation).
2 Market value of purchased options is reported in Investments at value in the Statement of Assets and Liabilities.
3 Values include premiums paid (received) on swap contracts which are shown separately in the Statement of Assets and Liabilities.
The following tables provide information about the effect of derivatives and hedging activities on the Fund’s Statement of Operations for the six months ended February 29, 2012. The first table provides additional detail about the amounts and sources of gains (losses) realized on derivatives during the period. The second table provides additional information about the change in unrealized appreciation (depreciation) resulting from the Fund’s derivatives and hedging activities during the period.
AMOUNT OF REALIZED GAIN (LOSS) ON DERIVATIVES RECOGNIZED
|
| Interest |
| Foreign |
| Credit Risk |
| Total |
| ||
Purchased options |
| — |
|
| — |
| $ (496,890 | ) |
| $ (496,890 | ) |
Written options |
| — |
|
| — |
| 1,090,710 |
|
| 1,090,710 |
|
Futures contracts |
| $(39,253 | ) |
| — |
| — |
|
| (39,253 | ) |
Swap contracts |
| 3,524 |
|
| — |
| 24,401 |
|
| 27,925 |
|
Forward foreign currency contracts |
| — |
|
| $1,316,463 |
| — |
|
| 1,316,463 |
|
Total |
| $(35,729 | ) |
| $1,316,463 |
| $ 618,221 |
|
| $1,898,955 |
|
|
| Western Asset Global Partners Income Fund Inc. 2012 Semi-Annual Report |
|
|
Notes to financial statements (unaudited) (cont’d)
CHANGE IN UNREALIZED APPRECIATION (DEPRECIATION) ON DERIVATIVES RECOGNIZED
|
| Interest |
| Foreign |
| Credit Risk |
| Total |
| |
Purchased options |
| — |
| — |
| $ 288,041 |
|
| $ 288,041 |
|
Written options |
| — |
| — |
| (717,021 | ) |
| (717,021 | ) |
Futures contracts |
| $ 7,377 |
| — |
| — |
|
| 7,377 |
|
Swap contracts |
| (1,877) |
| — |
| (60,839 | ) |
| (62,716 | ) |
Forward foreign currency contracts |
| — |
| $ 21,608 |
| — |
|
| 21,608 |
|
Total |
| $ 5,500 |
| $ 21,608 |
| $ (489,819 | ) |
| $ (462,711 | ) |
During the six months ended February 29, 2012, the volume of derivative activity for the Fund was as follows:
|
| Average |
|
Purchased options |
| $ 148,939 |
|
Written options |
| 177,562 |
|
Futures contracts (to sell) † |
| 3,308,766 |
|
Forward foreign currency contracts (to buy) |
| 973,812 |
|
Forward foreign currency contracts (to sell) |
| 23,392,560 |
|
|
|
|
|
|
| Average |
|
Credit default swap contracts |
| $706,714 |
|
Interest rate swap contracts† |
| 651,713 |
|
† At February 29, 2012, there were no open positions held in this derivative.
5. Loan
The Fund has revolving credit agreements with a financial institution, which allows the Fund to borrow up to an aggregate amount of $55,000,000. The interest on the loan is calculated at variable rates based on the one month LIBOR plus any applicable margin. To the extent of the borrowing outstanding, the Fund is required to maintain collateral in a special custody account at the Fund’s custodian on behalf of the financial institution. Interest expense related to this loan for the six months ended February 29, 2012 was $188,795. For the six months ended February 29, 2012, the Fund incurred a commitment fee in the amount of $8,088.
For the six months ended February 29, 2012, the Fund had an average daily loan balance outstanding of $39,000,000 and the weighted average interest rate was 0.97%. At February 29, 2012, the Fund had $39,000,000 of borrowings outstanding per the current credit agreement.
|
| Western Asset Global Partners Income Fund Inc. 2012 Semi-Annual Report |
|
|
6. Distributions subsequent to February 29, 2012
On February 10, 2012, the Fund’s Board of Directors declared three distributions, each in the amount of $0.095 per share, payable on March 30, 2012, April 27, 2012 and May 25, 2012 to shareholders of record on March 23, 2012, April 20, 2012 and May 18, 2012, respectively.
7. Capital loss carryforward
As of August 31, 2011, the Fund had a net capital loss carryforward of approximately $33,677,985, of which $6,744,988 expires in 2017 and $26,932,997 expires in 2018. These amounts will be available to offset any future taxable capital gains.
Under the recently enacted Regulated Investment Company Modernization Act of 2010, the Fund will be permitted to carry forward capital losses incurred in taxable years beginning after December 22, 2010 for an unlimited period. However, any losses incurred during those future years will be required to be utilized prior to the losses incurred in pre-enactment taxable years. As a result of this ordering rule, pre-enactment capital loss carryforwards may be more likely to expire unused. Additionally, post-enactment capital losses that are carried forward will retain their character as either short-term or long-term capital losses rather than being considered all short-term as under previous law.
8. Recent accounting pronouncement
In May 2011, the Financial Accounting Standards Board issued Accounting Standard Update No. 2011-04, Fair Value Measurement (Topic 820) – Amendments to Achieve Common Fair Value Measurement and Disclosure Requirements in U.S. GAAP and IFRSs (“ASU No. 2011-04”). ASU No. 2011-04 establishes common requirements for measuring fair value and for disclosing information about fair value measurements. ASU No. 2011-04 is effective during interim and annual periods beginning after December 15, 2011. Management is currently evaluating the impact the adoption of ASU No. 2011-04 will have on the Fund’s financial statements and related disclosures.
|
| Western Asset Global Partners Income Fund Inc. |
|
|
Board approval of management and subadvisory agreements (unaudited)
Background
The Investment Company Act of 1940, as amended (the “1940 Act”), requires that the Board of Directors (the “Board”) of Western Asset Global Partners Income Fund, Inc. (the “Fund”), including a majority of its members that are not considered to be “interested persons” under the 1940 Act (the “Independent Directors”) voting separately, approve on an annual basis the continuation of the investment management contract (the “Management Agreement”) with the Fund’s manager, Legg Mason Partners Fund Advisor, LLC (the “Manager”), and the sub-advisory agreements (individually, a “Sub-Advisory Agreement,” and, collectively, the “Sub-Advisory Agreements”) with the Manager’s affiliates, Western Asset Management Company (“Western Asset”), Western Asset Management Company, Pte. Ltd. in Singapore (“Western Asset Singapore”) and Western Asset Management Company Limited in London (“Western Asset London”). Western Asset, Western Asset Singapore and Western Asset London collectively are hereinafter referred to as the “Sub-Advisers,” and Western Asset Singapore and Western Asset London together are hereinafter referred to as the “Non-U.S. Sub-Advisers.” At a meeting (the “Contract Renewal Meeting”) held in-person on November 9 and 10, 2011, the Board, including the Independent Directors, considered and approved the continuation of each of the Management Agreement and the Sub-Advisory Agreements for an additional one-year term. To assist in its consideration of the renewals of the Management Agreement and the Sub-Advisory Agreements, the Board received and considered a variety of information (together with the information provided at the Contract Renewal Meeting, the “Contract Renewal Information”) about the Manager and Sub-Advisers, as well as the management and sub-advisory arrangements for the Fund and the other closed-end funds in the same complex under the Board’s supervision (collectively, the “Legg Mason Closed-end Funds”), certain portions of which are discussed below. A presentation made by the Manager and Western Asset to the Board at the Contract Renewal Meeting in connection with its evaluations of the Management Agreement and the Sub-Advisory Agreements encompassed the Fund and other Legg Mason Closed-end Funds. In addition to the Contract Renewal Information, the Board received performance and other information throughout the year related to the respective services rendered by the Manager and the Sub-Advisers to the Fund. The Board’s evaluation took into account the information received throughout the year and also reflected the knowledge and familiarity gained as members of the Board of the Fund and other Legg Mason Closed-end Funds with respect to the services provided to the Fund by the Manager and the Sub-Advisers.
The Manager provides the Fund with investment advisory and administrative services pursuant to the Management Agreement and the Sub-Advisers provide, or in the case of the Non-U.S. Sub-Advisers help to provide, the Fund with certain investment sub-advisory services pursuant to the Sub-Advisory
|
| Western Asset Global Partners Income Fund Inc. |
|
Agreements. The discussion below covers both the advisory and administrative functions being rendered by the Manager, each such function being encompassed by the Management Agreement, and the investment sub-advisory functions being rendered by the Sub-Advisers.
Board approval of management agreement and sub-advisory agreements
In its deliberations regarding renewal of the Management Agreement and the Sub-Advisory Agreements, the Board, including the Independent Directors, considered the factors below.
Nature, extent and quality of the services under the management agreement and sub-advisory agreements
The Board received and considered Contract Renewal Information regarding the nature, extent and quality of services provided to the Fund by the Manager and the Sub-Advisers under the Management Agreement and the Sub-Advisory Agreements, respectively, during the past year. The Board also reviewed Contract Renewal Information regarding the Fund’s compliance policies and procedures established pursuant to the 1940 Act.
The Board reviewed the qualifications, backgrounds and responsibilities of the Fund’s senior personnel and the portfolio management team primarily responsible for the day-to-day portfolio management of the Fund. The Board also considered, based on its knowledge of the Manager and its affiliates, the Contract Renewal Information and the Board’s discussions with the Manager and Western Asset at the Contract Renewal Meeting, the general reputation and investment performance records of the Manager, Western Asset and their affiliates and the financial resources available to the corporate parent of the Manager and the Sub-Advisers, Legg Mason, Inc. (“Legg Mason”), to support their activities in respect of the Fund and the other Legg Mason Closed-end Funds.
The Board considered the responsibilities of the Manager and the Sub-Advisers under the Management Agreement and the Sub-Advisory Agreements, respectively, including the Manager’s coordination and oversight of the services provided to the Fund by the Sub-Advisers and others and Western Asset’s coordination and oversight of the services provided to the Fund by the Non-U.S. Sub-Advisers. The Management Agreement permits the Manager to delegate certain of its responsibilities, including its investment advisory duties thereunder, provided that the Manager, in each case, will supervise the activities of the delegee. Pursuant to this provision of the Management Agreement, the Manager does not provide day-to-day portfolio management services to the Fund. Rather, portfolio management services for the Fund are provided by Western Asset pursuant to the Sub-Advisory Agreement (the “Western Asset Sub-Advisory Agreement”) between the Manager and Western Asset. The Western Asset Sub-Advisory
|
| Western Asset Global Partners Income Fund Inc. |
|
|
Board approval of management and subadvisory agreements (unaudited) (cont’d)
Agreement permits Western Asset to delegate certain of its responsibilities, including its investment sub-advisory duties thereunder, provided that Western Asset, in each case, will supervise the activities of the delegee. Pursuant to this provision of the Western Asset Sub-Advisory Agreement, each Non-U.S. Sub-Adviser helps to provide certain investment sub-advisory services to the Fund pursuant to a separate Sub-Advisory Agreement with Western Asset.
In reaching its determinations regarding continuation of the Management Agreement and the Sub-Advisory Agreements, the Board took into account that Fund shareholders, in pursuing their investment goals and objectives, likely purchased their shares based upon the reputation and the investment style, philosophy and strategy of the Manager and Western Asset, as well as the resources available to the Manager and the Sub-Advisers.
The Board concluded that, overall, the nature, extent and quality of the management and other services provided to the Fund under the Management Agreement and the Sub-Advisory Agreements have been satisfactory under the circumstances.
Fund Performance
The Board received and considered performance information and analyses (the “Lipper Performance Information”) for the Fund, as well as for a group of funds (the “Performance Universe”) selected by Lipper, Inc. (“Lipper”), an independent provider of investment company data. The Board was provided with a description of the methodology Lipper used to determine the similarity of the Fund with the funds included in the Performance Universe. The Performance Universe included the Fund and all leveraged high current yield closed-end funds, as classified by Lipper, regardless of asset size. The Board noted that it had received and discussed with the Manager and Western Asset information throughout the year at periodic intervals comparing the Fund’s performance against its benchmarks and its peer funds as selected by Lipper.
The Lipper Performance Information comparing the Fund’s performance to that of the Performance Universe based on net asset value per share showed, among other things, that the Fund’s performance for the 1-year period ended June 30, 2011 was ranked in the third quintile of the funds in the Performance Universe for that period and was better than the median performance for the Performance Universe. The Lipper Performance Information further showed that the Fund’s performance for each of the 3-, 5- and 10-year periods ended June 30, 2011 was ranked in the first quintile of the funds in the Performance Universe for that period and was better than the Performance Universe median. In these rankings, the first quintile represents funds with the best performance among the funds in the Performance Universe and the fifth quintile represents funds with poorest performance
|
| Western Asset Global Partners Income Fund Inc. |
|
among funds in the Performance Universe. The Fund’s performance for the 10-year period was achieved, in part, by a predecessor portfolio management team. The Board also considered the Fund’s performance relative to its benchmarks and in absolute terms.
Based on its review of the Fund’s performance, which included consideration of all of the factors noted above, the Board concluded that, under the circumstances, the Fund’s performance supported continuation of the Management Agreement and the Sub-Advisory Agreements for an additional period not to exceed one year.
Management fees and expense ratios
The Board reviewed and considered the management fee (the “Management Fee”) payable by the Fund to the Manager under the Management Agreement and the sub-advisory fees (the “Sub-Advisory Fees”) payable to the Sub-Advisers under the Sub-Advisory Agreements in light of the nature, extent and overall quality of the management, investment advisory and other services provided by the Manager and the Sub-Advisers. The Board noted that the Sub-Advisory Fees payable to Western Asset under the Western Asset Sub-Advisory Agreement are paid by the Manager, not the Fund, and, accordingly, that the retention of Western Asset does not increase the fees or expenses otherwise incurred by the Fund’s shareholders. Similarly, the Board noted that the Sub-Advisory Fees payable to each of the Non-U.S. Sub-Advisers under its Sub-Advisory Agreement with Western Asset are paid by Western Asset, not the Fund, and, accordingly, that the retention of such Non-U.S. Sub-Adviser does not increase the fees or expenses otherwise incurred by the Fund’s shareholders.
Additionally, the Board received and considered information and analyses prepared by Lipper (the “Lipper Expense Information”) comparing the Management Fee and the Fund’s overall expenses with those of funds in an expense group (the “Expense Group”) selected and provided by Lipper. The comparison was based upon the constituent funds’ latest fiscal years. The Expense Group consisted of the Fund and eleven other leveraged high current yield closed-end funds, as classified by Lipper. The twelve funds in the Expense Group had average net common share assets ranging from $60.4 million to $477.9 million. Four of the Performance Universe funds were larger than the Fund and seven were smaller.
The Lipper Expense Information comparing the Management Fee as well as the Fund’s actual total expenses to the Fund’s Expense Group showed that the contractual Management Fee was ranked tenth among the funds in the Expense Group. The Lipper Expense Information also showed that, on the basis of common share assets only, the actual Management Fee (i.e., giving effect to any voluntary fee waivers implemented by the Manager with respect to the Fund and by the managers of the other Expense Group funds)
|
| Western Asset Global Partners Income Fund Inc. |
|
|
Board approval of management and subadvisory agreements (unaudited) (cont’d)
was ranked eighth among the funds in the Expense Group on the basis of common share assets only and was ranked seventh among the funds in the Expense Group on the basis of common share and leveraged assets. The Fund’s actual total expenses were ranked sixth among the funds in the Expense Group on the basis of common share assets only and were ranked seventh among the Expense Group funds on the basis of common share and leveraged assets. Each of the Fund’s expense components was worse (i.e., higher) than the median of the Expense Group for that expense component.
The Board also reviewed Contract Renewal Information regarding fees charged by the Manager to other U.S. clients investing primarily in an asset class similar to that of the Fund, including, where applicable, institutional and separate accounts. The Board was advised that the fees paid by such institutional, separate account and other clients generally are lower, and may be significantly lower, than the Management Fee. The Contract Renewal Information discussed the significant differences in scope of services provided to the Fund and to these other clients, noting that the Fund is provided with administrative services, office facilities, Fund officers (including the Fund’s chief executive, chief financial and chief compliance officers), and that the Manager coordinates and oversees the provision of services to the Fund by other fund service providers. The Contract Renewal Information included information regarding management fees paid by open-end mutual funds in the same complex (the “Legg Mason Open-end Funds”) and that such information indicated that the management fees paid by the Legg Mason Closed-end Funds generally were higher than those paid by the Legg Mason Open-end Funds. The Manager, in response to an inquiry by the Board as to the reasons for the fee differential, provided information as to differences between the services provided to the Fund and the other Legg Mason Closed-end Funds and services provided to the Legg Mason Open-end Funds. The Board considered the fee comparisons in light of the different services provided in managing these other types of clients and funds.
Taking all of the above into consideration, the Board determined that the Management Fee and the Sub-Advisory Fees were reasonable in light of the nature, extent and overall quality of the management, investment advisory and other services provided to the Fund under the Management Agreement and the Sub-Advisory Agreements.
Manager Profitability
The Board, as part of the Contract Renewal Information, received an analysis of the profitability to the Manager and its affiliates in providing services to the Fund for the Manager’s fiscal years ended March 31, 2011 and March 31, 2010. The Board also received profitability information with respect to the Legg Mason fund complex as a whole. In addition, the Board received Contract Renewal Information with respect to the Manager’s revenue and cost allocation methodologies used in preparing such profitability data. In
|
| Western Asset Global Partners Income Fund Inc. |
|
2007, the Board received a report from an outside consultant that had reviewed the Manager’s methodologies and the Board was assured by the Manager at the Contract Renewal Meeting that there had been no significant changes in those methodologies since the report was rendered. The profitability to each of the Sub-Advisers was not considered to be a material factor in the Board’s considerations since Western Asset’s Sub-Advisory Fees are paid by the Manager, not the Fund, and the Sub-Advisory Fees for the Non-U.S. Sub-Advisers, in each case, are paid by Western Asset, not the Fund. The profitability analysis presented to the Board as part of the Contract Renewal Information indicated that profitability to the Manager in providing services to the Fund had not changed over the period covered by the analysis. Under the circumstances, the Board concluded that the Manager’s profitability remained at a reasonable level in light of the nature, extent and overall quality of the investment advisory and other services provided to the Fund.
Economies of Scale
The Board received and discussed Contract Renewal Information concerning whether the Manager realizes economies of scale if the Fund’s assets grow. The Board noted that because the Fund is a closed-end fund with no current plans to seek additional assets beyond maintaining its dividend reinvestment plan, any significant growth in its assets generally will occur through appreciation in the value of the Fund’s investment portfolio, rather than sales of additional shares in the Fund. The Board determined that the Management Fee structure was appropriate under present circumstances.
Other benefits to the manager and the sub-advisers
The Board considered other benefits received by the Manager, the Sub-Advisers and their affiliates as a result of their relationship with the Fund and did not regard such benefits as excessive.
* * * * * *
In light of all of the foregoing and other relevant factors, the Board determined that, under the circumstances, continuation of the Management Agreement and the Sub-Advisory Agreements would be consistent with the interests of the Fund and its shareholders and unanimously voted to continue each Agreement for a period of one additional year.
No single factor reviewed by the Board was identified by the Board as the principal factor in determining whether to approve continuation of the Management Agreement and the Sub-Advisory Agreements, and each Board member attributed different weights to the various factors. The Independent Directors were advised by separate independent legal counsel throughout the process. Prior to the Contract Renewal Meeting, the Board received a memorandum prepared by the Manager discussing its responsibilities in
|
| Western Asset Global Partners Income Fund Inc. |
|
|
Board approval of management and subadvisory agreements (unaudited) (cont’d)
connection with the proposed continuation of the Management Agreement and the Sub-Advisory Agreements as part of the Contract Renewal Information and the Independent Directors separately received a memorandum discussing such responsibilities from their independent counsel. Prior to voting, the Independent Directors also discussed the proposed continuation of the Management Agreement and the Sub-Advisory Agreements in private sessions with their independent legal counsel at which no representatives of the Manager were present.
|
| Western Asset Global Partners Income Fund Inc. |
|
|
Additional shareholder information (unaudited)
Results of annual meeting of shareholders
The Annual Meeting of Shareholders of Western Asset Global Partners Income Fund Inc. was held on December 12, 2011, for the purpose of considering and voting upon the election of Directors. The following table provides information concerning the matter voted upon at the Meeting:
Election of directors
Nominees |
| Votes For |
| Votes Withheld |
|
Carol L. Colman |
| 12,998,057 |
| 669,985 |
|
Paolo M. Cucchi |
| 12,982,015 |
| 686,027 |
|
Leslie H. Gelb |
| 13,043,174 |
| 624,868 |
|
At February 29, 2012, in addition to Carol L. Colman, Paolo M. Cucchi and Leslie H. Gelb, the other Directors of the Fund were as follows:
Daniel P. Cronin
R. Jay Gerken
William R. Hutchinson
Riordan Roett
Jeswald W. Salacuse
|
| Western Asset Global Partners Income Fund Inc. |
|
|
Dividend reinvestment and cash purchase plan (unaudited)
1. Each shareholder initially purchasing shares of common stock (“Shares”) of Western Asset Global Partners Income Fund Inc. (“Fund”), on or after September 6, 1996 will be deemed to have elected to be a participant in the Amended and Restated Dividend Reinvestment and Cash Purchase Plan (“Plan”), unless the shareholder specifically elects in writing (addressed to the Agent at the address below or to any nominee who holds Shares for the shareholder in its name) to receive all distributions in cash, paid by check, mailed directly to the record holder by or under the direction of American Stock Transfer & Trust Company as the Fund’s dividend-paying agent (“Agent”). A shareholder whose Shares are held in the name of a broker or nominee who does not provide an automatic reinvestment service may be required to take such Shares out of “street name” and register such Shares in the shareholder’s name in order to participate, otherwise distributions will be paid in cash to such shareholder by the broker or nominee. Each participant in the Plan is referred to herein as a “Participant.” The Agent will act as agent for each Participant, and will open accounts for each Participant under the Plan in the same name as their Shares are registered.
2. Unless the Fund declares a distribution payable only in the form of cash, the Agent will apply all distributions in the manner set forth below.
3. If, on the determination date, the market price per Share equals or exceeds the net asset value per Share on that date (such condition, a “market premium”), the Agent will receive the distribution in newly issued Shares of the Fund on behalf of Participants. If, on the determination date, the net asset value per Share exceeds the market price per Share (such condition, a “market discount”), the Agent will purchase Shares in the open-market. The determination date will be the fourth New York Stock Exchange (“NYSE”) trading day (a NYSE trading day being referred to herein as a “Trading Day”) preceding the payment date for the distribution. For purposes herein, “market price” will mean the average of the highest and lowest prices at which the Shares sell on the NYSE on the particular date, or if there is no sale on that date, the average of the closing bid and asked quotations.
4. Purchases made by the Agent will be made as soon as practicable commencing on the Trading Day following the determination date and terminating no later than 30 days after the distribution payment date except where temporary curtailment or suspension of purchase is necessary to comply with applicable provisions of federal securities law; provided, however, that such purchases will, in any event, terminate on the Trading Day prior to the “ex-dividend” date next succeeding the distribution payment date.
5. If (i) the Agent has not invested the full distribution amount in open-market purchases by the date specified in paragraph 4 above as the date on which such purchases must terminate or (ii) a market discount shifts to a market premium during the purchase period, then the Agent will cease making
|
| Western Asset Global Partners Income Fund Inc. |
|
open-market purchases and will receive the uninvested portion of the distribution amount in newly issued Shares (x) in the case of (i) above, at the close of business on the date the Agent is required to terminate making open-market purchases as specified in paragraph 4 above or (y) in the case of (ii) above, at the close of business on the date such shift occurs; but in no event prior to the payment date for the distribution.
6. In the event that all or part of a distribution amount is to be paid in newly issued Shares, such Shares will be issued to Participants in accordance with the following formula: (i) if, on the valuation date, the net asset value per Share is less than or equal to the market price per Share, then the newly issued Shares will be valued at net asset value per Share on the valuation date; provided, however, that if the net asset value is less than 95% of the market price on the valuation date, then such Shares will be issued at 95% of the market price and (ii) if, on the valuation date, the net asset value per Share is greater than the market price per Share, then the newly issued Shares will be issued at the market price on the valuation date. The valuation date will be the distribution payment date, except that with respect to Shares issued pursuant to paragraph 5 above, the valuation date will be the date such Shares are issued. If a date that would otherwise be a valuation date is not a Trading Day, the valuation date will be the next preceding Trading Day.
7. Participants have the option of making additional cash payments to the Agent, monthly, in a minimum amount of $250, for investment in Shares. The Agent will use all such funds received from Participants to purchase Shares in the open market on or about the first business day of each month. To avoid unnecessary cash accumulations, and also to allow ample time for receipt and processing by the Agent, Participants should send in voluntary cash payments to be received by the Agent approximately 10 days before an applicable purchase date specified above. A Participant may withdraw a voluntary cash payment by written notice, if the notice is received by the Agent not less than 48 hours before such payment is to be invested.
8. Purchases by the Agent pursuant to paragraphs 4 and 7 above may be made on any securities exchange on which the Shares of the Fund are traded, in the over-the-counter market or in negotiated transactions, and may be on such terms as to price, delivery and otherwise as the Agent shall determine. Funds held by the Agent uninvested will not bear interest, and it is understood that, in any event, the Agent shall have no liability in connection with any inability to purchase Shares within the time periods herein provided, or with the timing of any purchases effected. The Agent shall have no responsibility as to the value of the Shares acquired for the Participant’s account. The Agent may commingle amounts of all Participants to be used for open-market purchases of Shares and the price per Share allocable to each Participant in connection with such purchases shall be the average price (including brokerage commissions) of all Shares purchased by the Agent.
|
| Western Asset Global Partners Income Fund Inc. |
|
|
Dividend reinvestment and cash purchase plan (unaudited) (cont’d)
9. The Agent will maintain all Participants’ accounts in the Plan and will furnish written confirmations of all transactions in each account, including information needed by Participants for personal and tax records. The Agent will hold Shares acquired pursuant to the Plan in noncertificated form in the Participant’s name or that of its nominee, and each Participant’s proxy will include those Shares purchased pursuant to the Plan. The Agent will forward to Participants any proxy solicitation material and will vote any Shares so held for Participants only in accordance with the proxy returned by Participants to the Fund. Upon written request, the Agent will deliver to Participants, without charge, a certificate or certificates for the full Shares.
10. The Agent will confirm to Participants each acquisition made for their respective accounts as soon as practicable but not later than 60 days after the date thereof. Although Participants may from time to time have an undivided fractional interest (computed to three decimal places) in a Share of the Fund, no certificates for fractional shares will be issued. Distributions on fractional shares will be credited to each Participant’s account. In the event of termination of a Participant’s account under the Plan, the Agent will adjust for any such undivided fractional interest in cash at the market value of the Fund’s Shares at the time of termination less the pro rata expense of any sale required to make such an adjustment.
11. Any share dividends or split shares distributed by the Fund on Shares held by the Agent for Participants will be credited to their respective accounts. In the event that the Fund makes available to Participants rights to purchase additional Shares or other securities, the Shares held for Participants under the Plan will be added to other Shares held by the Participants in calculating the number of rights to be issued to Participants.
12. The Agent’s service fee for handling distributions will be paid by the Fund. Participants will be charged a pro rata share of brokerage commissions on all open-market purchases.
13. Participants may terminate their accounts under the Plan by notifying the Agent in writing. Such termination will be effective immediately if notice is received by the Agent not less than 10 days prior to any distribution record date; otherwise such termination will be effective on the first Trading Day after the payment date for such distribution with respect to any subsequent distribution. The Plan may be amended or terminated by the Fund as applied to any voluntary cash payments made and any distribution paid subsequent to written notice of the change or termination sent to Participants at least 30 days prior to the record date for the distribution. The Plan may be amended or terminated by the Agent, with the Fund’s prior written consent, on at least 30 days’ written notice to Participants. Notwithstanding the preceding two sentences, the Agent or the Fund may amend or supplement the Plan at any time or times when necessary or appropriate to comply with applicable law or rules or policies of the Securities and Exchange Commission
|
| Western Asset Global Partners Income Fund Inc. |
|
or any other regulatory authority. Upon any termination, the Agent will cause a certificate or certificates for the full Shares held by each Participant under the Plan and cash adjustment for any fraction to be delivered to each Participant without charge.
14. Any amendment or supplement shall be deemed to be accepted by each Participant unless, prior to the effective date thereof, the Agent receives written notice of the termination of the Participant’s account under the Plan. Any such amendment may include an appointment by the Agent in its place and stead of a successor Agent under these terms and conditions, with full power and authority to perform all or any of the acts to be performed by the Agent under these terms and conditions. Upon any such appointment of an Agent for the purpose of receiving distributions, the Fund will be authorized to pay to such successor Agent, for each Participant’s account, all distributions payable on Shares of the Fund held in each Participant’s name or under the Plan for retention or application by such successor Agent as provided in these terms and conditions.
15. In the case of Participants, such as banks, broker-dealers or other nominees, which hold Shares for others who are beneficial owners (“Nominee Holders”), the Agent will administer the Plan on the basis of the number of Shares certified from time to time by each Nominee Holder as representing the total amount registered in the Nominee Holder’s name and held for the account of beneficial owners who are to participate in the Plan.
16. The Agent shall at all times act in good faith and use its best efforts within reasonable limits to insure the accuracy of all services performed under this Agreement and to comply with applicable law, but assumes no responsibility and shall not be liable for loss or damage due to errors unless such error is caused by its negligence, bad faith, or willful misconduct or that of its employees.
17. All correspondence concerning the Plan should be directed to the Agent at 59 Maiden Lane, New York, New York 10038.
Western Asset
Global Partners Income Fund Inc.
Directors |
| Western Asset Global Partners Income Fund Inc. |
| Independent registered public accounting firm |
Carol L. Colman |
| 620 Eighth Avenue |
| KPMG LLP |
Daniel P. Cronin |
| 49th Floor |
| 345 Park Avenue |
Paolo M. Cucchi |
| New York, NY 10018 |
| New York, NY 10154 |
Leslie H. Gelb |
|
|
|
|
R. Jay Gerken |
| Investment manager |
| Legal counsel |
Chairman |
| Legg Mason Partners Fund Advisor, LLC |
| Simpson Thacher & Bartlett LLP |
William R. Hutchinson |
|
|
| 425 Lexington Avenue |
Riordan Roett |
| Subadvisers |
| New York, NY 10017 |
Jeswald W. Salacuse |
| Western Asset Management Company |
|
|
|
| Western Asset Management Company Limited |
| New York Stock Exchange Symbol |
Officers |
| Western Asset Management Company Ltd |
| GDF |
R. Jay Gerken |
| Western Asset Management Company Pte. Ltd. |
|
|
President and Chief Executive Officer |
|
|
|
|
Richard F. Sennett |
| Custodian |
|
|
Principal Financial Officer |
| State Street Bank and Trust Company |
|
|
Ted P. Becker |
| 1 Lincoln Street |
|
|
Chief Compliance Officer |
| Boston, MA 02111 |
|
|
Vanessa A. Williams |
|
|
|
|
Identity Theft Prevention Officer |
| Transfer agent |
|
|
Robert I. Frenkel |
| American Stock Transfer & Trust Company |
|
|
Secretary and Chief Legal Officer |
| 59 Maiden Lane |
|
|
Thomas Mandia |
| New York, NY 10038 |
|
|
Assistant Secretary |
|
|
|
|
Steven Frank |
|
|
|
|
Treasurer |
|
|
|
|
Jeanne M. Kelly |
|
|
|
|
Senior Vice President |
|
|
|
|
|
|
|
|
|
Legg Mason Funds Privacy and Security Notice
Your Privacy and the Security of Your Personal Information is Very Important to the Legg Mason Funds
This Privacy and Security Notice (the “Privacy Notice”) addresses the Legg Mason Funds’ privacy and data protection practices with respect to nonpublic personal information the Funds receive. The Legg Mason Funds include any funds sold by the Funds’ distributor, Legg Mason Investor Services, LLC, as well as Legg Mason-sponsored closed-end funds and certain closed-end funds managed or sub-advised by Legg Mason or its affiliates. The provisions of this Privacy Notice apply to your information both while you are a shareholder and after you are no longer invested with the Funds.
The Type of Nonpublic Personal Information the Funds Collect About You
The Funds collect and maintain nonpublic personal information about you in connection with your shareholder account. Such information may include, but is not limited to:
· | Personal information included on applications or other forms; |
· | Account balances, transactions, and mutual fund holdings and positions; |
· | Online account access user IDs, passwords, security challenge question responses; and |
· | Information received from consumer reporting agencies regarding credit history and creditworthiness (such as the amount of an individual’s total debt, payment history, etc.). |
How the Funds Use Nonpublic Personal Information About You
The Funds do not sell or share your nonpublic personal information with third parties or with affiliates for their marketing purposes, or with other financial institutions or affiliates for joint marketing purposes, unless you have authorized the Funds to do so. The Funds do not disclose any nonpublic personal information about you except as may be required to perform transactions or services you have authorized or as permitted or required by law. The Funds may disclose information about you to:
· | Employees, agents, and affiliates on a “need to know” basis to enable the Funds to conduct ordinary business or comply with obligations to government regulators; |
· | Service providers, including the Funds’ affiliates, who assist the Funds as part of the ordinary course of business (such as printing, mailing services, or processing or servicing your account with us) or otherwise perform services on the Funds’ behalf, including companies that may perform marketing services solely for the Funds; |
· | The Funds’ representatives such as legal counsel, accountants and auditors; and |
· | Fiduciaries or representatives acting on your behalf, such as an IRA custodian or trustee of a grantor trust. |
|
|
|
|
|
|
| NOT PART OF THE SEMI-ANNUAL REPORT |
|
|
|
|
|
|
|
Legg Mason Funds Privacy and Security Notice (cont’d)
Except as otherwise permitted by applicable law, companies acting on the Funds’ behalf are contractually obligated to keep nonpublic personal information the Funds provide to them confidential and to use the information the Funds share only to provide the services the Funds ask them to perform.
The Funds may disclose nonpublic personal information about you when necessary to enforce their rights or protect against fraud, or as permitted or required by applicable law, such as in connection with a law enforcement or regulatory request, subpoena, or similar legal process. In the event of a corporate action or in the event a Fund service provider changes, the Funds may be required to disclose your nonpublic personal information to third parties. While it is the Funds’ practice to obtain protections for disclosed information in these types of transactions, the Funds cannot guarantee their privacy policy will remain unchanged.
Keeping You Informed of the Funds’ Privacy and Security Practices
The Funds will notify you annually of their privacy policy as required by federal law. While the Funds reserve the right to modify this policy at any time they will notify you promptly if this privacy policy changes.
The Funds’ Security Practices
The Funds maintain appropriate physical, electronic and procedural safeguards designed to guard your nonpublic personal information. The Funds’ internal data security policies restrict access to your nonpublic personal information to authorized employees, who may use your nonpublic personal information for Fund business purposes only.
Although the Funds strive to protect your nonpublic personal information, they cannot ensure or warrant the security of any information you provide or transmit to them, and you do so at your own risk. In the event of a breach of the confidentiality or security of your nonpublic personal information, the Funds will attempt to notify you as necessary so you can take appropriate protective steps. If you have consented to the Funds using electronic communications or electronic delivery of statements, they may notify you under such circumstances using the most current email address you have on record with them.
In order for the Funds to provide effective service to you, keeping your account information accurate is very important. If you believe that your account information is incomplete, not accurate or not current, or if you have questions about the Funds’ privacy practices, write the Funds using the contact information on your account statements, email the Funds by clicking on the Contact Us section of the Funds’ website at www.leggmason.com, or contact the Fund at 1-888-777-0102.
Revised April 2011
|
|
|
|
|
|
| NOT PART OF THE SEMI-ANNUAL REPORT |
|
|
|
|
|
|
|
Western Asset Global Partners Income Fund Inc.
Western Asset Global Partners Income Fund Inc.
620 Eighth Avenue
49th Floor
New York, NY 10018
Notice is hereby given in accordance with Section 23(c) of the Investment Company Act of 1940, as amended, that from time to time the Fund may purchase, at market prices, shares of its common stock in the open market.
The Fund files its complete schedule of portfolio holdings with the Securities and Exchange Commission (“SEC”) for the first and third quarters of each fiscal year on Form N-Q. The Fund’s Forms N-Q are available on the SEC’s website at www.sec.gov. The Fund’s Forms N-Q may be reviewed and copied at the SEC’s Public Reference Room in Washington, D.C., and information on the operation of the Public Reference Room may be obtained by calling 1-800-SEC-0330. To obtain information on Form N-Q from the Fund, shareholders can call 1-888-777-0102.
Information on how the Fund voted proxies relating to portfolio securities during the prior 12-month period ended June 30th of each year and a description of the policies and procedures that the Fund uses to determine how to vote proxies related to portfolio transactions are available (1) without charge, upon request, by calling 1-888-777-0102, (2) on the Fund’s website at www.leggmason.com/cef and (3) on the SEC’s website at www.sec.gov.
This report is transmitted to the shareholders of Western Asset Global Partners Income Fund Inc. for their information. This is not a prospectus, circular or representation intended for use in the purchase of shares of the Fund or any securities mentioned in this report.
American Stock
Transfer & Trust Company
59 Maiden Lane
New York, NY 10038
WAS04030 4/12 SR12-1636
ITEM 2. CODE OF ETHICS.
Not applicable.
ITEM 3. AUDIT COMMITTEE FINANCIAL EXPERT.
Not applicable.
ITEM 4. PRINCIPAL ACCOUNTANT FEES AND SERVICES.
Not applicable.
ITEM 5. AUDIT COMMITTEE OF LISTED REGISTRANTS.
Not applicable.
ITEM 6. SCHEDULE OF INVESTMENTS.
Included herein under Item 1.
ITEM 7. DISCLOSURE OF PROXY VOTING POLICIES AND PROCEDURES FOR CLOSED-END MANAGEMENT INVESTMENT COMPANIES.
Not applicable.
ITEM 8. PORTFOLIO MANAGERS OF CLOSED-END MANAGEMENT INVESTMENT COMPANIES.
Not applicable.
ITEM 9. PURCHASES OF INCOME SECURITIES BY CLOSED-END MANAGEMENT INVESTMENT COMPANY AND AFFILIATED PURCHASERS.
Not applicable.
ITEM 10. SUBMISSION OF MATTERS TO A VOTE OF SECURITY HOLDERS.
Not applicable.
ITEM 11. CONTROLS AND PROCEDURES.
(a) The registrant’s principal executive officer and principal financial officer have concluded that the registrant’s disclosure controls and procedures (as defined in Rule 30a- 3(c) under the Investment Company Act of 1940, as amended (the “1940 Act”)) are effective as of a date within 90 days of the filing date of this report that includes the disclosure required by this paragraph, based on their evaluation of the disclosure controls and procedures required by Rule 30a-3(b) under the 1940 Act and 15d-15(b) under the Securities Exchange Act of 1934.
(b) There were no changes in the registrant’s internal control over financial reporting (as defined in Rule 30a-3(d) under the 1940 Act) that occurred during the second fiscal quarter of the period covered by this report that have materially affected, or are likely to materially affect the registrant’s internal control over financial reporting.
ITEM 12. EXHIBITS.
(a) (1) Not applicable.
Exhibit 99.CODE ETH
(a) (2) Certifications pursuant to section 302 of the Sarbanes-Oxley Act of 2002 attached hereto.
Exhibit 99.CERT
(b) Certifications pursuant to Section 906 of the Sarbanes-Oxley Act of 2002 attached hereto.
Exhibit 99.906CERT
SIGNATURES
Pursuant to the requirements of the Securities Exchange Act of 1934 and the Investment Company Act of 1940, the registrant has duly caused this Report to be signed on its behalf by the undersigned, there unto duly authorized.
Western Asset Global Partners Income Fund Inc.
By: | /s/ R. Jay Gerken |
|
| (R. Jay Gerken) |
|
| Chief Executive Officer of |
|
| Western Asset Global Partners Income Fund Inc. |
|
|
|
|
Date: | April 26, 2012 |
|
Pursuant to the requirements of the Securities Exchange Act of 1934 and the Investment Company Act of 1940, this report has been signed below by the following persons on behalf of the registrant and in the capacities and on the dates indicated.
By: | /s/ R. Jay Gerken |
|
| (R. Jay Gerken) |
|
| Chief Executive Officer of |
|
| Western Asset Global Partners Income Fund Inc. |
|
|
|
|
Date: | April 26, 2012 |
|
|
|
|
By: | /s/ Richard F. Sennett |
|
| (Richard F. Sennett) |
|
| Principal Financial Officer of |
|
| Western Asset Global Partners Income Fund Inc. |
|
|
|
|
Date: | April 26, 2012 |
|