UNITED STATES
SECURITIES AND EXCHANGE COMMISSION
Washington, D.C. 20549
FORM N-CSR
CERTIFIED SHAREHOLDER REPORT OF REGISTERED
MANAGEMENT INVESTMENT COMPANIES
Investment Company Act file number 811-07994
Western Asset Global Partners Income Fund Inc.
(Exact name of registrant as specified in charter)
620 Eighth Avenue, 49th Floor, New York, NY 10018
(Address of principal executive offices) (Zip code)
Robert I. Frenkel, Esq.
Legg Mason & Co., LLC
100 First Stamford Place
Stamford, CT 06902
(Name and address of agent for service)
Registrant’s telephone number, including area code: (888) 777-0102
Date of fiscal year end: August 31
Date of reporting period: August 31, 2015
| ITEM 1. | REPORT TO STOCKHOLDERS. |
The Annual Report to Stockholders is filed herewith.

| | |
| Annual Report | | August 31, 2015 |
WESTERN ASSET
GLOBAL PARTNERS INCOME FUND INC. (GDF)

|
| INVESTMENT PRODUCTS: NOT FDIC INSURED • NO BANK GUARANTEE • MAY LOSE VALUE |
Fund objectives
The Fund seeks to maintain a high level of current income. As a secondary objective, the Fund seeks capital appreciation.
Under normal market conditions, the Fund will invest at least 33% of its total assets in securities of issuers that are, or are incorporated in or generate the majority of their revenue in, emerging market countries and at least 33% of its total assets in high-yield U.S. corporate debt securities. The Fund may also invest up to 33% of its total assets in a broad range of other U.S. and non-U.S. fixed-income securities, both investment grade and high-yield securities.
| | |
| II | | Western Asset Global Partners Income Fund Inc. |
Letter from the chairman

Dear Shareholder,
We are pleased to provide the annual report of Western Asset Global Partners Income Fund Inc. for the twelve-month reporting period ended August 31, 2015. Please read on for a detailed look at prevailing economic and market conditions during the Fund’s reporting period and to learn how those conditions have affected Fund performance.
I am pleased to introduce myself as the new Chairman, President and Chief Executive Officer of the Fund, succeeding Kenneth D. Fuller. I am honored to have been appointed to my new role. During my 27 year career with Legg Mason, I have seen the investment management industry evolve and expand. Throughout these changes, maintaining an unwavering focus on our shareholders and their needs has remained paramount.
As always, we remain committed to providing you with excellent service and a full spectrum of investment choices. We also remain committed to supplementing the support you receive from your financial advisor. One way we accomplish this is through our website, www.lmcef.com. Here you can gain immediate access to market and investment information, including:
| • | | Fund prices and performance, |
| • | | Market insights and commentaries from our portfolio managers, and |
| • | | A host of educational resources. |
We look forward to helping you meet your financial goals.
Sincerely,

Jane Trust, CFA
Chairman, President and Chief Executive Officer
September 25, 2015
| | |
| Western Asset Global Partners Income Fund Inc. | | III |
Investment commentary
Economic review
The pace of U.S. economic activity expanded moderately during the twelve months ended August 31, 2015 (the “reporting period”). Looking back, the U.S. Department of Commerce’s revised figures showed that third and fourth quarter 2014 U.S. gross domestic product (“GDP”)i growth was 4.3% and 2.1%, respectively. First quarter 2015 GDP growth then moderated to 0.6%. This was attributed to a number of factors, including a deceleration in personal consumption expenditures (“PCE”), along with negative contributions from exports, nonresidential fixed investment, and state and local government spending. However, economic activity then accelerated, as the U.S. Department of Commerce’s final reading for second quarter 2015 GDP growth — released after the reporting period ended — was 3.9%. The upturn was driven by increasing exports, accelerating PCE, declining imports, expanding state and local government spending, and rising nonresidential fixed investment.
The labor market was a tailwind for the economy during the reporting period. When the period began, unemployment was 5.9%, as reported by the U.S. Department of Labor. By August 2015, unemployment was 5.1%, its lowest level since April 2008.
Turning to the global economy, in its July 2015 World Economic Outlook Update, the International Monetary Fund (“IMF”) said “A setback to activity in the first quarter of 2015, mostly in North America, has resulted in a small downward revision to global growth for 2015 relative to the April 2015 World Economic Outlook Update. Nevertheless, the underlying drivers for a gradual acceleration in economic activity in advanced economies — easy financial conditions, more neutral fiscal policy in the euro area, lower fuel prices, and improving confidence and labor market conditions —remain intact.” From a regional perspective, the IMF projects that 2015 growth in the Eurozone will be 1.5%, versus 0.8% in 2014. Japan’s economy is expected to expand 0.8% in 2015, compared to a contraction of -0.1% in 2014. Elsewhere, the IMF said that overall growth in emerging market countries will decelerate in 2015, with growth of 4.2% versus 4.6% in 2014.
The Federal Reserve Board (“Fed”)ii took a number of actions as it sought to meet its dual mandate of fostering maximum employment and price stability. As it has since December 2008, the Fed maintained the federal funds rateiii at a historically low range between zero and 0.25% during the twelve months ended August 31, 2015. However, in October 2014 the Fed ended its asset purchase program that was announced in December 2012. In December 2014, the Fed said that “it can be patient in beginning to normalize the stance of monetary policy.” At its meeting that concluded on July 29, 2015, the Fed said “The Committee currently anticipates that, even after employment and inflation are near mandate-consistent levels, economic conditions may, for some time, warrant keeping the target federal funds rate below levels the Committee views as normal in the longer run.” Finally, at its meeting that ended on September 17, 2015, after the close of the reporting period, the Fed decided to maintain the target between zero and 0.25%.
Given the economic challenges in the Eurozone, the European Central Bank (“ECB”)iv took a number of actions to stimulate growth and ward off deflation.
| | |
| IV | | Western Asset Global Partners Income Fund Inc. |
The ECB reduced rates in June and September 2014. Then, in January 2015 the ECB announced that, beginning in March 2015, it would start a €60 billion-a-month bond buying program that is expected to run until September 2016. In other developed countries, the Bank of England kept rates on hold at 0.50% during the reporting period, as did Japan at a range of zero to 0.10%, its lowest level since 2006. At the end of October 2014, the Bank of Japan announced that it would increase its asset purchases between 10 trillion yen and 20 trillion yen ($90.7 billion to $181.3 billion) to approximately 80 trillion yen ($725 billion) annually, in an attempt to stimulate growth. Elsewhere, after holding rates steady at 6.0% since July 2012, the People’s Bank of China lowered rates five times from November 23, 2013 to August 25, 2015. Its latest reduction pushed rates down to 4.60%.
As always, thank you for your confidence in our stewardship of your assets.
Sincerely,
Jane Trust, CFA
Chairman, President and Chief Executive Officer
September 25, 2015
All investments are subject to risk including the possible loss of principal. Past performance is no guarantee of future results. Forecasts and predictions are inherently limited and should not be relied upon as an indication of actual or future performance.
| i | Gross domestic product (“GDP”) is the market value of all final goods and services produced within a country in a given period of time. |
| ii | The Federal Reserve Board (“Fed”) is responsible for the formulation of policies designed to promote economic growth, full employment, stable prices and a sustainable pattern of international trade and payments. |
| iii | The federal funds rate is the rate charged by one depository institution on an overnight sale of immediately available funds (balances at the Federal Reserve) to another depository institution; the rate may vary from depository institution to depository institution and from day to day. |
| iv | The European Central Bank (“ECB”) is responsible for the monetary system of the European Union and the euro currency. |
| | |
| Western Asset Global Partners Income Fund Inc. | | V |
Fund overview
Q. What is the Fund’s investment strategy?
A. The Fund seeks to maintain a high level of current income. As a secondary objective, the Fund seeks capital appreciation. Under normal market conditions, the Fund will invest at least 33% of its total assets in securities of issuers that are, or are incorporated in or generate the majority of their revenue in, emerging market countries and at least 33% of its total assets in high-yield U.S. corporate debt securities. The Fund may also invest up to 33% of its total assets in a broad range of other U.S. and non-U.S. fixed-income securities, both investment grade and high-yield securities, including, but not limited to, corporate bonds, loans, mortgage- and asset-backed securities, preferred stocks and sovereign debt, derivative instruments of the foregoing securities and dollar rolls.
The Fund’s investment process assimilates top-down macroeconomic views with bottom-up credit analysts’ fundamental and relative value views regarding industry and issuer opportunities. As a firm, Western Asset Management Company (“Western Asset”), the Fund’s subadviser, aims to add value by exploiting inefficiencies in the fixed-income markets. A fundamental approach is used to identify these inefficiencies.
The Fund diversifies its holdings across a range of securities, industries and maturity dates in an attempt to minimize the risk of any individual holding. We use various tools, both external and proprietary, to help identify, measure and manage portfolio risk. In particular, we look for companies that we believe have the ability to weather adverse economic conditions while providing moderate to high returns to bondholders, companies that are repositioning in the marketplace and that we believe are temporarily undervalued, and companies that demonstrate an ability to improve their financial condition where that improvement and positive trajectory have not yet been fully appreciated by rating agencies and the market. Often times, this strategy will result in a higher concentration of lower-rated securities in the portfolio versus the Barclays U.S. Corporate High Yield — 2% Issuer Cap Indexi. However, no assurance can be given that markets will perform as we predict, and a risk of loss exists.
At Western Asset, we utilize a fixed-income team approach, with decisions derived from interaction among various investment management sector specialists. The sector teams are comprised of Western Asset’s senior portfolio management personnel, research analysts and an in-house economist. Under this team approach, management of client fixed-income portfolios will reflect a consensus of interdisciplinary views within the Western Asset organization. The individuals responsible for development of investment strategy, day-to-day portfolio management, oversight and coordination of the Fund are S. Kenneth Leech, Michael C. Buchanan, Christopher F. Kilpatrick, Ryan K. Brist, and Chia-Liang (CL) Lian. On April 30, 2015, Mr. Lian became Head of the Emerging Markets Debt Team.
Q. What were the overall market conditions during the Fund’s reporting period?
A. The spread sectors (non-Treasuries) generated mixed results during the reporting period. The fixed income market was volatile at times given mixed global economic data, uncertainties regarding
| | |
| Western Asset Global Partners Income Fund Inc. 2015 Annual Report | | 1 |
Fund overview (cont’d)
future Federal Reserve Board (“Fed”)ii monetary policy and a number of geopolitical issues. Assuming greater risk was generally not rewarded during the reporting period.
Short-term Treasury yields moved higher, whereas long-term Treasury yields declined during the twelve months ended August 31, 2015. Two-year Treasury yields rose from 0.48% at the beginning of the period to 0.74% at the end of the period. Their peak of 0.75% occurred on June 10, 2015 and again on July 22, 2015, and they were as low as 0.34% on October 15, 2014. Ten-year Treasury yields were 2.35% at the beginning of the period and ended the period at 2.21%. Their peak of 2.63% occurred on September 18, 2014 and they reached a low of 1.68% at the end of January and early February 2015.
All told, the Barclays U.S. Aggregate Indexiii, returned 1.56% for the twelve months ended August 31, 2015. For comparison purposes, riskier fixed-income securities, including high yield bonds and emerging market debt, produced weaker results. Over the reporting period, the Barclays U.S. Corporate High Yield — 2% Issuer Cap Index and JPMorgan Emerging Markets Bond Index Global (“EMBI Global”)iv returned -2.93% and -2.98%, respectively.
Q. How did we respond to these changing market conditions?
A. Overall we maintained the Fund’s main theme of focusing on below investment grade global credit opportunities. As we experienced heightened volatility, weak commodity prices, global growth concerns, reduced liquidity and uncertainty surrounding Fed interest rate policy, we moved to increase the credit quality of the Fund. In particular, we added significantly to our allocation to BB-rated and investment grade rated issuers and reduced our allocation to CCC-rated issuers in an effort to improve the overall quality of the Fund.
Within the U.S. portion of the Fund, we increased our allocations to the Financials and Energy sectors. We remained positive on Financials during the reporting period and modestly increased the Fund’s overweight position. In particular, we favored large global money-center banks such as JPMorgan, Barclays and Citibank. Financials continued to post consistent fundamental results, along with increased capital ratios. In addition, they are still constrained by regulators from returning excessive amounts of capital to shareholders — a positive for fixed income investors. While we entered the third and fourth quarters of 2014 with what proved to be too much lower-quality Energy exposure, we did add more B-rated and BB-rated Energy securities. These additions appeared to be attractive entry points, as energy prices stabilized and then moved higher during the first half of 2015. However, the Energy sector weakened during the latter portion of the reporting period and remains challenged. Within Energy, we added both senior secured and unsecured positions, as these issuers’ management teams looked to improve their liquidity position and cut their capital expenditure budgets. With these purchases, we feel we added both income for shareholders and an opportunity for longer-term capital appreciation. We ended the period with roughly 7% in U.S. Energy issuers, which compares to roughly 13% in the Barclays U.S. Corporate High Yield — 2% Issuer Cap Index. Total Energy exposure, including Emerging Market and quasi
| | |
| 2 | | Western Asset Global Partners Income Fund Inc. 2015 Annual Report |
sovereign Energy exposure, was 15.9% at the end of the period.
Within the emerging market debt portion of the Fund, we increased both our sovereign and quasi-sovereign allocations. From a country allocation perspective, we increased the Fund’s weighting to China, Indonesia and India. Conversely, we reduced the Fund’s allocations to Brazil and Venezuela. In terms of sectors, we increased the Fund’s allocation to the emerging market Financials sector, while reducing its Industrials exposure.
We continued to emphasize credit risk over interest rate risk. However, we increased the durationv of the portfolio during the reporting period, as it became apparent that low developed market sovereign yields were making U.S. government bonds appear relatively attractive. In addition, we felt rates would continue to rally during periods of heightened volatility. The Fund ended the period with a gross effective durationvi of 4.7 years, an increase over the twelve months ended August 31, 2015 of approximately 0.7 years.
At various times during the reporting period, we employed U.S. Treasury futures to manage the duration of the Fund. These instruments had a small negative impact on performance. Currency forwards were used to hedge the Fund’s euro- and British pound-denominated bonds back to U.S. dollars. These currency hedges had a positive impact on performance. The U.S. dollar strengthened versus the euro during the reporting period and we anticipated that the European Central Bankvii would embark on an U.S.-inspired quantitative easing program. At various times, the emerging market team also used currency forwards and euro currency futures and options to manage currency risk. Overall, the use of derivative instruments was positive for performance.
Performance review
For the twelve months ended August 31, 2015, Western Asset Global Partners Income Fund Inc. returned -8.64% based on its net asset value (“NAV”)viii and -18.10% based on its New York Stock Exchange (“NYSE”) market price per share. The Fund’s unmanaged benchmarks, the Barclays U.S. Corporate High Yield — 2% Issuer Cap Index and the EMBI Global, returned -2.93% and -2.98%, respectively, for the same period. The Lipper High Yield (Leveraged) Closed-End Funds Category Averageix returned -5.11% over the same time frame. Please note that Lipper performance returns are based on each fund’s NAV.
During the twelve-month period, the Fund made distributions to shareholders totaling $0.87 per share*. The performance table shows the Fund’s twelve-month total return based on its NAV and market price as of August 31, 2015. Past performance is no guarantee of future results.
| | | | |
| Performance Snapshot as of August 31, 2015 | |
| Price Per Share | | 12-Month
Total Return** | |
| $10.06 (NAV) | | | -8.64 | %† |
| $8.29 (Market Price) | | | -18.10 | %‡ |
All figures represent past performance and are not a guarantee of future results.
** Total returns are based on changes in NAV or market price, respectively. Returns reflect the deduction of all Fund expenses, including management fees, operating expenses, and other Fund expenses. Returns do not reflect the deduction of brokerage
| * | For the tax character of distributions paid during the fiscal year ended August 31, 2015, please refer to page 55 of this report. |
| | |
| Western Asset Global Partners Income Fund Inc. 2015 Annual Report | | 3 |
Fund overview (cont’d)
commissions or taxes that investors may pay on distributions or the sale of shares.
† Total return assumes the reinvestment of all distributions at NAV.
‡ Total return assumes the reinvestment of all distributions in additional shares in accordance with the Fund’s Dividend Reinvestment Plan.
Q. What were the leading contributors to performance?
A. The Fund’s overall allocation to the Financials sector was the most beneficial to relative results during the reporting period. In general, these allocations were seen as relatively defensive and our positions posted consistent fundamental results. Additionally the Fund’s overweight allocations to the Transportation1 and Consumer-Non Cyclicals2 sectors outperformed the Barclays U.S. Corporate High Yield — 2% Issuer Cap Index during the reporting period.
A number of the Fund’s high-yield corporate bonds were also positive for results. Examples of holdings that contributed to performance were overweight positions in Physiotherapy Associates Holdings and Tenet Healthcare Corp. Physiotherapy Associates Holdings is a national provider of outpatient rehabilitation and orthotics and prosthetics services. The company experienced headwinds due to both billing and accounting issues and, in May 2013, restructured its balance sheet as bondholders led a reorganization of its credit. In doing so, we received equity in exchange for our original bond position and participated in the new financing of a secured loan. Health care valuations in general have improved since the workout took place and management continues to make operational improvements. We remain positive regarding the prospects for further recovery and believe the company is well positioned, as it includes more than 500 outpatient rehabilitation clinics in 34 states. We participated in a small mergers and acquisitions financing transaction for a U.S. hospital operator, Tenet Healthcare Corp. These bonds were seen as defensive and our overweight exposure was rewarded as the security outperformed during the period.
Within the emerging market debt portion of the Fund, the largest contributor to performance versus the EMBI Global was its exposure across a number of countries. In particular, overweights to Russia and Argentina were positive for the Fund’s performance. From a sector perspective, our overweight to Utilities was beneficial. Elsewhere, several individual securities contributed to the Fund’s performance. Examples of holdings that generated strong results were overweight positions in Russian telecommunication company VimpelCom Holdings, Russian metals and mining firm Evraz Group, and Indian telecommunication company Bharti Airtel.
Q. What were the leading detractors from performance?
A. Select positions within the Fund’s high-yield corporate bond exposure were negative for performance during the reporting period. Falling oil and commodity prices due to an increase in supply, coupled
| 1 | Transportation consists of the following industries: Airlines, Railroads and other transportation-related services. |
| 2 | Consumer Non-Cyclicals consists of the following industries: Consumer Products, Food/Beverage, Health Care, Pharmaceuticals, Supermarkets and Tobacco |
| | |
| 4 | | Western Asset Global Partners Income Fund Inc. 2015 Annual Report |
with fears of lower global demand and slowing global growth, sent several of our positions lower. In particular, holdings in Halcon Resources Corp., Murray Energy Corp. and Hercules Offshore, Inc. were negative for results. Bonds issued by lower rated non-conventional U.S. energy company, Halcon Resources, moved lower in conjunction with energy prices during the period. Coal company Murray Energy Corp. reported underwhelming fundamental results despite being the industry’s low-cost producer. We recently agreed to equitize our Hercules Offshore positions to improve the company’s balance sheet and liquidity position. We are currently working with management as they prepare the company to exit bankruptcy with a significantly stronger balance sheet and potential upside from industry consolidation.
In terms of the Fund’s emerging market exposure, the Fund’s allocation to emerging market corporate debt generally underperformed higher quality sovereign holdings in the EMBI Global due to the risk-off environment for emerging market assets. The Fund’s overweight to Brazil was the largest country detractor from relative performance during the reporting period. Brazilian assets remain under pressure given a political stalemate and ongoing fallout from a corporate bribery scandal involving state-owned energy company Petrobras. The Fund’s holdings in Oil, Gas & Consumable Fuels and Infrastructure were each a drag on results, with falling oil and metals prices impacting producers as well as related service providers. Furthermore, several individual holdings specifically detracted from performance, including overweight positions in Colombian oil and gas company Pacific Exploration & Production, Brazilian sugar/ethanol firm Virgolino de Oliveira, and Brazilian metals and mining company Vale. We believe that recently-widened spreads are compensating investors for holding Emerging Markets corporate bonds, but that volatility may continue as we approach a normalization of Fed interest rate policy.
The use of leverage was tactically managed during the reporting period. We ended the period with leverage at roughly 25% of the gross assets of the Fund, a modest increase from the beginning of the period. While leverage was a material benefit during the previous reporting period, it was a detractor from results for the reporting period ended August 31, 2015.
This has been a challenging environment for many investors and we recognize we posted performance that is not typical for the Western Asset Credit and Emerging Market teams. We believe the increased market volatility will ultimately be beneficial for long-term shareholders as we look to add income and capital appreciation opportunities to the Fund.
Looking for additional information?
The Fund is traded under the symbol “GDF” and its closing market price is available in most newspapers under the NYSE listings. The daily NAV is available on-line under the symbol “XGDFX” on most financial websites. Barron’s and the Wall Street Journal’s Monday edition both carry closed-end fund tables that provide additional information. In addition, the Fund issues a quarterly press release that can be found on most major financial websites as well as www.lmcef.com.
| | |
| Western Asset Global Partners Income Fund Inc. 2015 Annual Report | | 5 |
Fund overview (cont’d)
In a continuing effort to provide information concerning the Fund, shareholders may call 1-888-777-0102 (toll free), Monday through Friday from 8:00 a.m. to 5:30 p.m. Eastern Time, for the Fund’s current NAV, market price and other information.
Thank you for your investment in Western Asset Global Partners Income Fund Inc. As always, we appreciate that you have chosen us to manage your assets and we remain focused on achieving the Fund’s investment goals.
Sincerely,
Western Asset Management Company
September 15, 2015
RISKS: As interest rates rise, bond prices fall, reducing the value of the Fund’s fixed-income holdings. The Fund may invest in high-yield and foreign securities, including emerging markets, which involve risks beyond those inherent in higher-rated and domestic investments. High-yield bonds, commonly known as “junk bonds,” involve greater credit and liquidity risks than investment grade bonds. Investing in foreign securities is subject to certain risks not associated with domestic investing, such as currency fluctuations, and social, political and economic uncertainties, which could increase volatility. These risks are magnified in emerging or developing markets. Leverage may result in greater volatility of NAV and the market price of common shares and increases a shareholder’s risk of loss. Derivatives, such
as options and futures, can be illiquid and harder to value, especially in declining markets. A small investment in certain derivatives may have a potentially large impact on the Fund’s performance.
Portfolio holdings and breakdowns are as of August 31, 2015 and are subject to change and may not be representative of the portfolio managers’ current or future investments. Please refer to pages 11 through 33 for a list and percentage breakdown of the Fund’s holdings.
The mention of sector breakdowns is for informational purposes only and should not be construed as a recommendation to purchase or sell any securities. The information provided regarding such sectors is not a sufficient basis upon which to make an investment decision. Investors seeking financial advice regarding the appropriateness of investing in any securities or investment strategies discussed should consult their financial professional. The Fund’s top five sector holdings (as a percentage of net assets) as of August 31, 2015 were: Sovereign Bonds (32.9%), Energy (20.6%), Materials (13.8%), Financials (12.7%) and Consumer Discretionary (11.9%). The Fund’s portfolio composition is subject to change at any time.
All investments are subject to risk including the possible loss of principal. Past performance is no guarantee of future results. All index performance reflects no deduction for fees, expenses or taxes. Please note that an investor cannot invest directly in an index.
The information provided is not intended to be a forecast of future events, a guarantee of future results or investment advice. Views expressed may differ from those of the firm as a whole. Forecasts and predictions are inherently limited and should not be relied upon as an indication of actual or future performance.
| | |
| 6 | | Western Asset Global Partners Income Fund Inc. 2015 Annual Report |
| i | The Barclays U.S. Corporate High Yield — 2% Issuer Cap Index is an index of the 2% Issuer Cap component of the Barclays U.S. Corporate High Yield Index, which covers the U.S. dollar-denominated, non-investment grade, fixed-rate, taxable corporate bond market. |
| ii | The Federal Reserve Board (“Fed”) is responsible for the formulation of policies designed to promote economic growth, full employment, stable prices, and a sustainable pattern of international trade and payments. |
| iii | The Barclays U.S. Aggregate Index is a broad-based bond index comprised of government, corporate, mortgage- and asset-backed issues, rated investment grade or higher, and having at least one year to maturity. |
| iv | The JPMorgan Emerging Markets Bond Index Global (“EMBI Global”) tracks total returns for U.S. dollar-denominated debt instruments issued by emerging market sovereign and quasi-sovereign entities: Brady bonds, loans, Eurobonds and local market instruments. |
| v | Duration is the measure of the price sensitivity of a fixed-income security to an interest rate change of 100 basis points. Calculation is based on the weighted average of the present values for all cash flows. |
| vi | Effective duration measures the expected sensitivity of market price to changes in interest rates, taking into account the effects of structural complexities. (For example, some bonds can be prepaid by the issuer.) |
| vii | The European Central Bank (“ECB”) is responsible for the monetary system of the European Union and the euro currency. |
| viii | Net asset value (“NAV”) is calculated by subtracting total liabilities, including liabilities associated with financial leverage (if any), from the closing value of all securities held by the Fund (plus all other assets) and dividing the result (total net assets) by the total number of the common shares outstanding. The NAV fluctuates with changes in the market prices of securities in which the Fund has invested. However, the price at which an investor may buy or sell shares of the Fund is the Fund’s market price as determined by supply of and demand for the Fund’s shares. |
| ix | Lipper, Inc., a wholly-owned subsidiary of Reuters, provides independent insight on global collective investments. Returns are based on the twelve-month period ended August 31, 2015, including the reinvestment of all distributions, including returns of capital, if any, calculated among the 33 funds in the Fund’s Lipper category. |
| | |
| Western Asset Global Partners Income Fund Inc. 2015 Annual Report | | 7 |
Fund at a glance† (unaudited)
Investment breakdown (%) as a percent of total investments
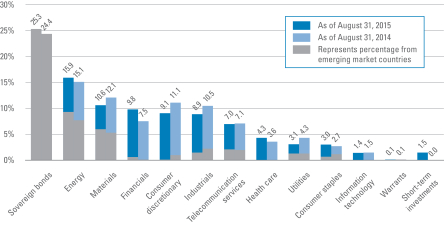
| † | The bar graph above represents the composition of the Fund’s investments as of August 31, 2015 and August 31, 2014 and does not include derivatives, such as futures contracts and forward foreign currency contracts. The Fund is actively managed. As a result, the composition of the Fund’s investments is subject to change at any time. |
| | |
| 8 | | Western Asset Global Partners Income Fund Inc. 2015 Annual Report |
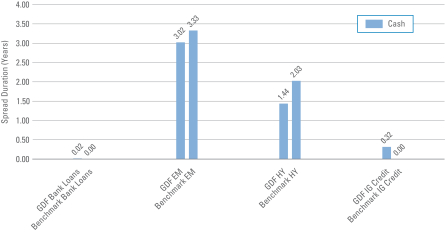
Spread duration (unaudited)
Economic exposure — August 31, 2015
| | |
Total Spread Duration |
| GDF | | — 4.80 years |
| Benchmark | | — 5.36 years |
Spread duration measures the sensitivity to changes in spreads. The spread over Treasuries is the annual risk-premium demanded by investors to hold non-Treasury securities. Spread duration is quantified as the % change in price resulting from a 100 basis points change in spreads. For a security with positive spread duration, an increase in spreads would result in a price decline and a decline in spreads would result in a price increase. This chart highlights the market sector exposure of the Fund’s sectors relative to the selected benchmark sectors as of the end of the reporting period.
| | |
| Benchmark | | — 50% Barclays U.S. Corporate High Yield — 2% Issuer Cap Index, 50% JPMorgan Emerging Markets Bond Index Global |
| EM | | — Emerging Markets |
| GDF | | — Western Asset Global Partners Income Fund Inc. |
| HY | | — High Yield |
| IG Credit | | — Investment Grade Credit |
| | |
| Western Asset Global Partners Income Fund Inc. 2015 Annual Report | | 9 |
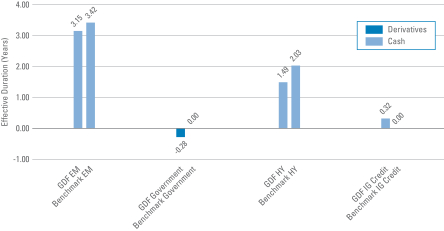
Effective duration (unaudited)
Interest rate exposure — August 31, 2015
| | |
Total Effective Duration |
| GDF | | — 4.68 years |
| Benchmark | | — 5.45 years |
Effective duration measures the sensitivity to changes in relevant interest rates. Effective duration is quantified as the % change in price resulting from a 100 basis points change in interest rates. For a security with positive effective duration, an increase in interest rates would result in a price decline and a decline in interest rates would result in a price increase. This chart highlights the interest rate exposure of the Fund’s sectors relative to the selected benchmark sectors as of the end of the reporting period.
| | |
| Benchmark | | — 50% Barclays U.S. Corporate High Yield — 2% Issuer Cap Index, 50% JPMorgan Emerging Markets Bond Index Global |
| EM | | — Emerging Markets |
| GDF | | — Western Asset Global Partners Income Fund Inc. |
| HY | | — High Yield |
| IG Credit | | — Investment Grade Credit |
| | |
| 10 | | Western Asset Global Partners Income Fund Inc. 2015 Annual Report |
Schedule of investments
August 31, 2015
Western Asset Global Partners Income Fund Inc.
| | | | | | | | | | | | | | | | |
| Security | | Rate | | | Maturity
Date | | | Face
Amount† | | | Value | |
| Corporate Bonds & Notes — 89.5% | | | | | | | | | | | | | | | | |
| Consumer Discretionary — 11.2% | | | | | | | | | | | | | | | | |
Auto Components — 0.1% | | | | | | | | | | | | | | | | |
Europcar Groupe SA, Secured Notes | | | 5.750 | % | | | 6/15/22 | | | | 200,000 | EUR | | $ | 231,444 | (a) |
Automobiles — 0.2% | | | | | | | | | | | | | | | | |
Chrysler Group LLC/CG Co.-Issuer Inc., Secured Notes | | | 8.250 | % | | | 6/15/21 | | | | 260,000 | | | | 279,552 | (b) |
Diversified Consumer Services — 0.5% | | | | | | | | | | | | | | | | |
Co-operative Group Holdings 2011 Ltd., Senior Notes | | | 7.500 | % | | | 7/8/26 | | | | 160,000 | GBP | | | 266,018 | |
Service Corp. International, Senior Notes | | | 7.500 | % | | | 4/1/27 | | | | 290,000 | | | | 336,261 | (b) |
StoneMor Partners LP/Cornerstone Family Services of WV, Senior Bonds | | | 7.875 | % | | | 6/1/21 | | | | 210,000 | | | | 217,350 | |
Total Diversified Consumer Services | | | | | | | | | | | | | | | 819,629 | |
Hotels, Restaurants & Leisure — 2.4% | | | | | | | | | | | | | | | | |
Bossier Casino Venture Holdco Inc., Senior Secured Bonds | | | 14.000 | % | | | 2/9/18 | | | | 270,000 | | | | 254,205 | (a)(c)(d)(e) |
Carrols Restaurant Group Inc., Secured Notes | | | 8.000 | % | | | 5/1/22 | | | | 210,000 | | | | 222,075 | |
CCM Merger Inc., Senior Notes | | | 9.125 | % | | | 5/1/19 | | | | 390,000 | | | | 417,300 | (a) |
CEC Entertainment Inc., Senior Notes | | | 8.000 | % | | | 2/15/22 | | | | 440,000 | | | | 442,200 | |
Downstream Development Authority of the Quapaw Tribe of Oklahoma, Senior Secured Notes | | | 10.500 | % | | | 7/1/19 | | | | 300,000 | | | | 309,750 | (a)(b) |
Enterprise Inns PLC, Senior Secured Bonds | | | 6.500 | % | | | 12/6/18 | | | | 494,000 | GBP | | | 801,631 | |
Greektown Holdings LLC/Greektown Mothership Corp., Senior Secured Notes | | | 8.875 | % | | | 3/15/19 | | | | 250,000 | | | | 262,500 | (a) |
Landry’s Holdings II Inc., Senior Notes | | | 10.250 | % | | | 1/1/18 | | | | 180,000 | | | | 186,750 | (a) |
Landry’s Inc., Senior Notes | | | 9.375 | % | | | 5/1/20 | | | | 800,000 | | | | 859,000 | (a)(b) |
Total Hotels, Restaurants & Leisure | | | | | | | | | | | | | | | 3,755,411 | |
Household Durables — 1.2% | | | | | | | | | | | | | | | | |
Century Intermediate Holding Co. 2, Senior Notes | | | 9.750 | % | | | 2/15/19 | | | | 410,000 | | | | 426,912 | (a)(c) |
Shea Homes LP/Shea Homes Funding Corp., Senior Notes | | | 6.125 | % | | | 4/1/25 | | | | 350,000 | | | | 359,625 | (a) |
William Lyon Homes Inc., Senior Notes | | | 8.500 | % | | | 11/15/20 | | | | 350,000 | | | | 379,750 | |
William Lyon Homes Inc., Senior Notes | | | 7.000 | % | | | 8/15/22 | | | | 250,000 | | | | 259,375 | |
Woodside Homes Co., LLC/Woodside Homes Finance Inc., Senior Notes | | | 6.750 | % | | | 12/15/21 | | | | 430,000 | | | | 399,900 | (a) |
Total Household Durables | | | | | | | | | | | | | | | 1,825,562 | |
Media — 5.4% | | | | | | | | | | | | | | | | |
CCO Holdings LLC/CCO Holdings Capital Corp., Senior Notes | | | 6.625 | % | | | 1/31/22 | | | | 960,000 | | | | 1,012,800 | (b) |
CCO Safari II LLC, Senior Secured Notes | | | 4.908 | % | | | 7/23/25 | | | | 390,000 | | | | 386,892 | (a) |
CCO Safari II LLC, Senior Secured Notes | | | 6.484 | % | | | 10/23/45 | | | | 170,000 | | | | 173,390 | (a) |
Clear Channel Worldwide Holdings Inc., Senior Subordinated Notes | | | 7.625 | % | | | 3/15/20 | | | | 30,000 | | | | 30,862 | |
CSC Holdings LLC, Senior Notes | | | 6.750 | % | | | 11/15/21 | | | | 120,000 | | | | 126,150 | |
See Notes to Financial Statements.
| | |
| Western Asset Global Partners Income Fund Inc. 2015 Annual Report | | 11 |
Schedule of investments (cont’d)
August 31, 2015
Western Asset Global Partners Income Fund Inc.
| | | | | | | | | | | | | | | | |
| Security | | Rate | | | Maturity
Date | | | Face
Amount† | | | Value | |
Media — continued | | | | | | | | | | | | | | | | |
DISH DBS Corp., Senior Notes | | | 7.875 | % | | | 9/1/19 | | | | 285,000 | | | $ | 309,624 | (b) |
DISH DBS Corp., Senior Notes | | | 6.750 | % | | | 6/1/21 | | | | 390,000 | | | | 392,496 | (b) |
DISH DBS Corp., Senior Notes | | | 5.875 | % | | | 7/15/22 | | | | 220,000 | | | | 208,589 | |
DISH DBS Corp., Senior Notes | | | 5.000 | % | | | 3/15/23 | | | | 350,000 | | | | 309,970 | |
DISH DBS Corp., Senior Notes | | | 5.875 | % | | | 11/15/24 | | | | 880,000 | | | | 804,100 | |
Gibson Brands Inc., Senior Secured Notes | | | 8.875 | % | | | 8/1/18 | | | | 290,000 | | | | 276,950 | (a) |
iHeartCommunications Inc., Senior Notes | | | 10.000 | % | | | 1/15/18 | | | | 240,000 | | | | 175,200 | |
Myriad International Holdings BV, Senior Notes | | | 6.000 | % | | | 7/18/20 | | | | 200,000 | | | | 216,097 | (a)(b) |
New Cotai LLC/New Cotai Capital Corp., Senior Secured Notes | | | 10.625 | % | | | 5/1/19 | | | | 585,810 | | | | 503,797 | (a)(c) |
Numericable-SFR SAS, Senior Secured Bonds | | | 6.000 | % | | | 5/15/22 | | | | 290,000 | | | | 290,725 | (a) |
Numericable-SFR SAS, Senior Secured Bonds | | | 6.250 | % | | | 5/15/24 | | | | 840,000 | | | | 841,840 | (a) |
Time Warner Cable Inc., Senior Notes | | | 8.750 | % | | | 2/14/19 | | | | 385,000 | | | | 455,300 | (b) |
Time Warner Cable Inc., Senior Notes | | | 8.250 | % | | | 4/1/19 | | | | 139,000 | | | | 162,693 | (b) |
TVN Finance Corp. III AB, Senior Notes | | | 7.875 | % | | | 11/15/18 | | | | 67,000 | EUR | | | 77,740 | (a) |
Univision Communications Inc., Senior Notes | | | 8.500 | % | | | 5/15/21 | | | | 290,000 | | | | 303,810 | (a)(b) |
Univision Communications Inc., Senior Secured Notes | | | 6.750 | % | | | 9/15/22 | | | | 172,000 | | | | 182,535 | (a)(b) |
UPC Holding BV, Junior Secured Subordinated Notes | | | 6.375 | % | | | 9/15/22 | | | | 100,000 | EUR | | | 121,549 | (a) |
Virgin Media Finance PLC, Senior Notes | | | 6.375 | % | | | 4/15/23 | | | | 560,000 | | | | 584,147 | (a) |
Virgin Media Finance PLC, Senior Notes | | | 6.000 | % | | | 10/15/24 | | | | 340,000 | | | | 350,200 | (a) |
Virgin Media Finance PLC, Senior Notes | | | 5.750 | % | | | 1/15/25 | | | | 200,000 | | | | 201,375 | (a) |
Total Media | | | | | | | | | | | | | | | 8,498,831 | |
Multiline Retail — 0.4% | | | | | | | | | | | | | | | | |
Neiman Marcus Group LLC, Senior Secured Notes | | | 7.125 | % | | | 6/1/28 | | | | 80,000 | | | | 80,000 | (b) |
Neiman Marcus Group Ltd. LLC, Senior Notes | | | 8.750 | % | | | 10/15/21 | | | | 550,000 | | | | 591,250 | (a)(c) |
Total Multiline Retail | | | | | | | | | | | | | | | 671,250 | |
Specialty Retail — 0.8% | | | | | | | | | | | | | | | | |
American Greetings Corp., Senior Notes | | | 7.375 | % | | | 12/1/21 | | | | 290,000 | | | | 306,313 | (b) |
Guitar Center Inc., Senior Secured Bonds | | | 6.500 | % | | | 4/15/19 | | | | 750,000 | | | | 707,250 | (a) |
Hot Topic Inc., Senior Secured Notes | | | 9.250 | % | | | 6/15/21 | | | | 180,000 | | | | 182,700 | (a) |
Total Specialty Retail | | | | | | | | | | | | | | | 1,196,263 | |
Textiles, Apparel & Luxury Goods — 0.2% | | | | | | | | | | | | | | | | |
Empire Today LLC/Empire Today Finance Corp., Senior Secured Notes | | | 11.375 | % | | | 2/1/17 | | | | 290,000 | | | | 258,100 | (a)(b) |
Total Consumer Discretionary | | | | | | | | | | | | | | | 17,536,042 | |
| Consumer Staples — 3.8% | | | | | | | | | | | | | | | | |
Beverages — 0.5% | | | | | | | | | | | | | | | | |
Carolina Beverage Group LLC/Carolina Beverage Group Finance Inc., Secured Notes | | | 10.625 | % | | | 8/1/18 | | | | 280,000 | | | | 277,200 | (a) |
See Notes to Financial Statements.
| | |
| 12 | | Western Asset Global Partners Income Fund Inc. 2015 Annual Report |
Western Asset Global Partners Income Fund Inc.
| | | | | | | | | | | | | | | | |
| Security | | Rate | | | Maturity
Date | | | Face
Amount† | | | Value | |
Beverages — continued | | | | | | | | | | | | | | | | |
Cott Beverages Inc., Senior Notes | | | 6.750 | % | | | 1/1/20 | | | | 240,000 | | | $ | 249,600 | |
DS Services of America Inc., Secured Notes | | | 10.000 | % | | | 9/1/21 | | | | 260,000 | | | | 303,225 | (a) |
Total Beverages | | | | | | | | | | | | | | | 830,025 | |
Food & Staples Retailing — 0.4% | | | | | | | | | | | | | | | | |
Beverages & More Inc., Senior Secured Notes | | | 10.000 | % | | | 11/15/18 | | | | 400,000 | | | | 393,500 | (a) |
Dollar Tree Inc., Senior Notes | | | 5.750 | % | | | 3/1/23 | | | | 240,000 | | | | 252,600 | (a) |
Total Food & Staples Retailing | | | | | | | | | | | | | | | 646,100 | |
Food Products — 1.6% | | | | | | | | | | | | | | | | |
BRF SA, Senior Notes | | | 4.750 | % | | | 5/22/24 | | | | 422,000 | | | | 414,657 | (a)(b) |
Dole Food Co. Inc., Senior Secured Notes | | | 7.250 | % | | | 5/1/19 | | | | 300,000 | | | | 303,750 | (a) |
JBS Investment GmbH, Senior Notes | | | 7.250 | % | | | 4/3/24 | | | | 260,000 | | | | 262,600 | (a) |
JBS USA LLC/JBS USA Finance Inc., Senior Notes | | | 5.750 | % | | | 6/15/25 | | | | 210,000 | | | | 204,225 | (a) |
Minerva Luxembourg SA, Senior Notes | | | 7.750 | % | | | 1/31/23 | | | | 480,000 | | | | 470,400 | (f) |
Pilgrim’s Pride Corp., Senior Notes | | | 5.750 | % | | | 3/15/25 | | | | 340,000 | | | | 348,500 | (a) |
Simmons Foods Inc., Secured Notes | | | 7.875 | % | | | 10/1/21 | | | | 560,000 | | | | 523,600 | (a) |
Total Food Products | | | | | | | | | | | | | | | 2,527,732 | |
Household Products — 1.0% | | | | | | | | | | | | | | | | |
Kronos Acquisition Holdings Inc., Senior Notes | | | 9.000 | % | | | 8/15/23 | | | | 80,000 | | | | 72,800 | (a) |
Spectrum Brands Inc., Senior Notes | | | 6.125 | % | | | 12/15/24 | | | | 180,000 | | | | 188,100 | (a) |
Spectrum Brands Inc., Senior Notes | | | 5.750 | % | | | 7/15/25 | | | | 370,000 | | | | 382,950 | (a) |
Sun Products Corp., Senior Notes | | | 7.750 | % | | | 3/15/21 | | | | 1,060,000 | | | | 959,300 | (a) |
Total Household Products | | | | | | | | | | | | | | | 1,603,150 | |
Tobacco — 0.3% | | | | | | | | | | | | | | | | |
Alliance One International Inc., Secured Notes | | | 9.875 | % | | | 7/15/21 | | | | 500,000 | | | | 423,750 | |
Total Consumer Staples | | | | | | | | | | | | | | | 6,030,757 | |
| Energy — 20.0% | | | | | | | | | | | | | | | | |
Energy Equipment & Services — 1.1% | | | | | | | | | | | | | | | | |
Atwood Oceanics Inc., Senior Notes | | | 6.500 | % | | | 2/1/20 | | | | 210,000 | | | | 180,600 | (b) |
CGG, Senior Notes | | | 7.750 | % | | | 5/15/17 | | | | 142,000 | | | | 113,245 | (b) |
CGG, Senior Notes | | | 6.875 | % | | | 1/15/22 | | | | 200,000 | | | | 116,000 | |
FTS International Inc., Senior Secured Bonds | | | 6.250 | % | | | 5/1/22 | | | | 240,000 | | | | 91,200 | |
Gulfmark Offshore Inc., Senior Notes | | | 6.375 | % | | | 3/15/22 | | | | 130,000 | | | | 83,850 | |
Hercules Offshore Inc., Senior Notes | | | 7.500 | % | | | 10/1/21 | | | | 230,000 | | | | 52,900 | (a) |
Hercules Offshore Inc., Senior Notes | | | 6.750 | % | | | 4/1/22 | | | | 510,000 | | | | 117,300 | (a) |
Key Energy Services Inc., Senior Notes | | | 6.750 | % | | | 3/1/21 | | | | 110,000 | | | | 46,750 | |
McDermott International Inc., Secured Notes | | | 8.000 | % | | | 5/1/21 | | | | 120,000 | | | | 101,749 | (a) |
Parker Drilling Co., Senior Notes | | | 7.500 | % | | | 8/1/20 | | | | 360,000 | | | | 302,400 | |
SESI LLC, Senior Notes | | | 7.125 | % | | | 12/15/21 | | | | 330,000 | | | | 330,878 | (b) |
See Notes to Financial Statements.
| | |
| Western Asset Global Partners Income Fund Inc. 2015 Annual Report | | 13 |
Schedule of investments (cont’d)
August 31, 2015
Western Asset Global Partners Income Fund Inc.
| | | | | | | | | | | | | | | | |
| Security | | Rate | | | Maturity
Date | | | Face
Amount† | | | Value | |
Energy Equipment & Services — continued | | | | | | | | | | | | | | | | |
Sierra Hamilton LLC/Sierra Hamilton Finance Inc., Senior Secured Notes | | | 12.250 | % | | | 12/15/18 | | | | 300,000 | | | $ | 207,000 | (a) |
Total Energy Equipment & Services | | | | | | | | | | | | | | | 1,743,872 | |
Oil, Gas & Consumable Fuels — 18.9% | | | | | | | | | | | | | | | | |
American Energy-Permian Basin LLC/AEPB Finance Corp., Secured Notes | | | 8.000 | % | | | 6/15/20 | | | | 220,000 | | | | 200,200 | (a) |
Approach Resources Inc., Senior Notes | | | 7.000 | % | | | 6/15/21 | | | | 150,000 | | | | 101,250 | |
Arch Coal Inc., Senior Notes | | | 7.250 | % | | | 6/15/21 | | | | 420,000 | | | | 59,850 | |
Berry Petroleum Co., Senior Notes | | | 6.375 | % | | | 9/15/22 | | | | 170,000 | | | | 87,550 | |
California Resources Corp., Senior Notes | | | 5.500 | % | | | 9/15/21 | | | | 1,340,000 | | | | 1,045,709 | |
Calumet Specialty Products Partners LP/Calumet Finance Corp., Senior Notes | | | 7.625 | % | | | 1/15/22 | | | | 200,000 | | | | 196,000 | |
Carrizo Oil & Gas Inc., Senior Notes | | | 7.500 | % | | | 9/15/20 | | | | 280,000 | | | | 266,000 | |
Chesapeake Energy Corp., Senior Notes | | | 6.875 | % | | | 11/15/20 | | | | 160,000 | | | | 129,200 | (b) |
Chesapeake Energy Corp., Senior Notes | | | 6.125 | % | | | 2/15/21 | | | | 640,000 | | | | 498,803 | |
Comstock Resources Inc., Senior Notes | | | 9.500 | % | | | 6/15/20 | | | | 560,000 | | | | 185,164 | (b) |
Dolphin Energy Ltd., Senior Secured Bonds | | | 5.888 | % | | | 6/15/19 | | | | 372,963 | | | | 402,502 | (b)(f) |
Ecopetrol SA, Senior Notes | | | 7.625 | % | | | 7/23/19 | | | | 490,000 | | | | 560,413 | (b) |
Ecopetrol SA, Senior Notes | | | 5.875 | % | | | 9/18/23 | | | | 75,000 | | | | 75,844 | (b) |
Ecopetrol SA, Senior Notes | | | 5.875 | % | | | 5/28/45 | | | | 60,000 | | | | 48,600 | (b) |
EDC Finance Ltd., Senior Notes | | | 4.875 | % | | | 4/17/20 | | | | 300,000 | | | | 252,975 | (a) |
Endeavor Energy Resources LP/EER Finance Inc., Senior Notes | | | 8.125 | % | | | 9/15/23 | | | | 130,000 | | | | 126,750 | (a) |
Energy Transfer Equity LP, Senior Notes | | | 7.500 | % | | | 10/15/20 | | | | 130,000 | | | | 139,915 | |
Enterprise Products Operating LLC, Junior Subordinated Notes | | | 8.375 | % | | | 8/1/66 | | | | 100,000 | | | | 98,250 | (b)(g) |
EP Energy LLC/Everest Acquisition Finance Inc., Senior Notes | | | 9.375 | % | | | 5/1/20 | | | | 300,000 | | | | 292,050 | |
Gazprom OAO Via Gaz Capital SA, Loan Participation Notes, Senior Notes | | | 6.510 | % | | | 3/7/22 | | | | 830,000 | | | | 815,226 | (a) |
Genesis Energy LP/Genesis Energy Finance Corp., Senior Notes | | | 6.750 | % | | | 8/1/22 | | | | 180,000 | | | | 175,500 | |
GeoPark Latin America Ltd. Agencia en Chile, Senior Secured Notes | | | 7.500 | % | | | 2/11/20 | | | | 260,000 | | | | 182,000 | (a) |
Globe Luxembourg SCA, Senior Secured Notes | | | 9.625 | % | | | 5/1/18 | | | | 1,360,000 | | | | 1,128,800 | (a) |
GNL Quintero SA, Senior Notes | | | 4.634 | % | | | 7/31/29 | | | | 288,000 | | | | 281,896 | (a)(b) |
Halcon Resources Corp., Secured Notes | | | 8.625 | % | | | 2/1/20 | | | | 270,000 | | | | 237,937 | (a) |
Halcon Resources Corp., Senior Notes | | | 9.750 | % | | | 7/15/20 | | | | 770,000 | | | | 284,900 | |
Halcon Resources Corp., Senior Notes | | | 8.875 | % | | | 5/15/21 | | | | 590,000 | | | | 197,650 | |
Hiland Partners LP/Hiland Partners Finance Corp., Senior Notes | | | 7.250 | % | | | 10/1/20 | | | | 130,000 | | | | 138,125 | (a)(b) |
Kinder Morgan Inc., Medium-Term Notes | | | 7.800 | % | | | 8/1/31 | | | | 130,000 | | | | 141,645 | |
Lonestar Resources America Inc., Senior Notes | | | 8.750 | % | | | 4/15/19 | | | | 120,000 | | | | 84,600 | (a) |
LUKOIL International Finance BV, Senior Notes | | | 4.563 | % | | | 4/24/23 | | | | 940,000 | | | | 824,286 | (a) |
See Notes to Financial Statements.
| | |
| 14 | | Western Asset Global Partners Income Fund Inc. 2015 Annual Report |
Western Asset Global Partners Income Fund Inc.
| | | | | | | | | | | | | | | | |
| Security | | Rate | | | Maturity
Date | | | Face
Amount† | | | Value | |
Oil, Gas & Consumable Fuels — continued | | | | | | | | | | | | | | | | |
Magnum Hunter Resources Corp., Senior Notes | | | 9.750 | % | | | 5/15/20 | | | | 790,000 | | | $ | 547,075 | |
MEG Energy Corp., Senior Notes | | | 6.375 | % | | | 1/30/23 | | | | 560,000 | | | | 453,600 | (a) |
MEG Energy Corp., Senior Notes | | | 7.000 | % | | | 3/31/24 | | | | 100,000 | | | | 81,750 | (a) |
Milagro Oil & Gas Inc., Secured Notes | | | 10.500 | % | | | 5/15/16 | | | | 380,000 | | | | 119,700 | *(d)(h) |
Murray Energy Corp., Senior Secured Notes | | | 11.250 | % | | | 4/15/21 | | | | 990,000 | | | | 462,825 | (a) |
Natural Resource Partners LP/Natural Resource Partners Finance Corp., Senior Notes | | | 9.125 | % | | | 10/1/18 | | | | 330,000 | | | | 245,025 | |
New Gulf Resources LLC/NGR Finance Corp., Senior Secured Notes | | | 12.250 | % | | | 5/15/19 | | | | 70,000 | | | | 21,350 | |
Oasis Petroleum Inc., Senior Notes | | | 6.500 | % | | | 11/1/21 | | | | 110,000 | | | | 89,100 | |
Oasis Petroleum Inc., Senior Notes | | | 6.875 | % | | | 3/15/22 | | | | 220,000 | | | | 183,700 | |
Oleoducto Central SA, Senior Notes | | | 4.000 | % | | | 5/7/21 | | | | 200,000 | | | | 194,000 | (a)(b) |
ONGC Videsh Ltd., Senior Notes | | | 4.625 | % | | | 7/15/24 | | | | 210,000 | | | | 215,568 | (f) |
Pacific Exploration and Production Corp., Senior Notes | | | 5.375 | % | | | 1/26/19 | | | | 1,200,000 | | | | 660,000 | (f) |
Pacific Exploration and Production Corp., Senior Notes | | | 5.375 | % | | | 1/26/19 | | | | 300,000 | | | | 165,000 | (a)(b) |
Pacific Exploration and Production Corp., Senior Notes | | | 5.125 | % | | | 3/28/23 | | | | 550,000 | | | | 277,750 | (a)(b) |
Pan American Energy LLC, Senior Notes | | | 7.875 | % | | | 5/7/21 | | | | 120,000 | | | | 122,100 | (a)(b) |
Petrobras Global Finance BV, Senior Notes | | | 3.250 | % | | | 3/17/17 | | | | 460,000 | | | | 441,876 | |
Petrobras Global Finance BV, Senior Notes | | | 4.375 | % | | | 5/20/23 | | | | 470,000 | | | | 370,454 | |
Petrobras Global Finance BV, Senior Notes | | | 7.250 | % | | | 3/17/44 | | | | 900,000 | | | | 729,000 | |
Petrobras Global Finance BV, Senior Notes | | | 6.850 | % | | | 6/5/2115 | | | | 280,000 | | | | 211,372 | |
Petroleos de Venezuela SA, Senior Bonds | | | 6.000 | % | | | 5/16/24 | | | | 4,920,000 | | | | 1,697,400 | (f) |
Petroleos Mexicanos, Senior Notes | | | 8.000 | % | | | 5/3/19 | | | | 3,980,000 | | | | 4,587,547 | |
Petroleos Mexicanos, Senior Notes | | | 5.500 | % | | | 6/27/44 | | | | 750,000 | | | | 652,687 | (b) |
Petroleos Mexicanos, Senior Notes | | | 5.625 | % | | | 1/23/46 | | | | 270,000 | | | | 241,312 | (a) |
Petroleum Co. of Trinidad & Tobago Ltd., Senior Notes | | | 9.750 | % | | | 8/14/19 | | | | 390,000 | | | | 438,750 | (a) |
Petronas Capital Ltd., Senior Notes | | | 5.250 | % | | | 8/12/19 | | | | 925,000 | | | | 1,006,711 | (a)(b) |
PT Pertamina Persero, Senior Notes | | | 5.250 | % | | | 5/23/21 | | | | 570,000 | | | | 575,700 | (a) |
PT Pertamina Persero, Senior Notes | | | 4.300 | % | | | 5/20/23 | | | | 380,000 | | | | 351,994 | (a) |
Puma International Financing SA, Senior Bonds | | | 6.750 | % | | | 2/1/21 | | | | 660,000 | | | | 667,280 | (a) |
Quicksilver Resources Inc., Senior Notes | | | 11.000 | % | | | 7/1/21 | | | | 310,000 | | | | 20,925 | *(h) |
Reliance Holdings USA Inc., Senior Notes | | | 4.500 | % | | | 10/19/20 | | | | 530,000 | | | | 560,588 | (a)(b) |
Rosneft Finance SA, Senior Notes | | | 7.875 | % | | | 3/13/18 | | | | 420,000 | | | | 440,273 | (a)(b) |
RSP Permian Inc., Senior Notes | | | 6.625 | % | | | 10/1/22 | | | | 580,000 | | | | 571,300 | (a) |
Samson Investment Co., Senior Notes | | | 9.750 | % | | | 2/15/20 | | | | 310,000 | | | | 1,163 | *(h) |
Sanchez Energy Corp., Senior Notes | | | 7.750 | % | | | 6/15/21 | | | | 1,130,000 | | | | 960,500 | |
Shelf Drilling Holdings Ltd., Senior Secured Notes | | | 8.625 | % | | | 11/1/18 | | | | 210,000 | | | | 162,750 | (a)(b) |
Sinopec Group Overseas Development Ltd., Senior Notes | | | 4.375 | % | | | 4/10/24 | | | | 850,000 | | | | 888,707 | (a) |
See Notes to Financial Statements.
| | |
| Western Asset Global Partners Income Fund Inc. 2015 Annual Report | | 15 |
Schedule of investments (cont’d)
August 31, 2015
Western Asset Global Partners Income Fund Inc.
| | | | | | | | | | | | | | | | |
| Security | | Rate | | | Maturity
Date | | | Face
Amount† | | | Value | |
Oil, Gas & Consumable Fuels — continued | | | | | | | | | | | | | | | | |
Transportadora de Gas del Peru SA, Senior Notes | | | 4.250 | % | | | 4/30/28 | | | | 440,000 | | | $ | 419,100 | (b)(f) |
Whiting Canadian Holding Co. ULC, Senior Notes | | | 8.125 | % | | | 12/1/19 | | | | 320,000 | | | | 308,800 | (b) |
WPX Energy Inc., Senior Notes | | | 8.250 | % | | | 8/1/23 | | | | 170,000 | | | | 164,050 | |
Total Oil, Gas & Consumable Fuels | | | | | | | | | | | | | | | 29,568,372 | |
Total Energy | | | | | | | | | | | | | | | 31,312,244 | |
| Financials — 10.1% | | | | | | | | | | | | | | | | |
Banks — 5.7% | | | | | | | | | | | | | | | | |
Banco Bilbao Vizcaya Argentaria Colombia SA, Subordinated Notes | | | 4.875 | % | | | 4/21/25 | | | | 210,000 | | | | 204,015 | (a) |
Bank of America Corp., Junior Subordinated Notes | | | 6.500 | % | | | 10/23/24 | | | | 280,000 | | | | 288,750 | (g)(i) |
Barclays Bank PLC, Subordinated Notes | | | 10.179 | % | | | 6/12/21 | | | | 470,000 | | | | 621,972 | (a)(b) |
Barclays Bank PLC, Subordinated Notes | | | 7.625 | % | | | 11/21/22 | | | | 1,000,000 | | | | 1,141,875 | (b) |
Barclays PLC, Junior Subordinated Bonds | | | 8.250 | % | | | 12/15/18 | | | | 200,000 | | | | 212,549 | (g)(i) |
BBVA Banco Continental SA, Subordinated Notes | | | 5.250 | % | | | 9/22/29 | | | | 80,000 | | | | 79,900 | (a)(b)(g) |
BNP Paribas SA, Junior Subordinated Notes | | | 7.375 | % | | | 8/19/25 | | | | 200,000 | | | | 205,050 | (a)(g)(i) |
Citigroup Inc., Junior Subordinated Bonds | | | 5.950 | % | | | 5/15/25 | | | | 660,000 | | | | 631,950 | (g)(i) |
Credit Agricole SA, Junior Subordinated Notes | | | 8.375 | % | | | 10/13/19 | | | | 390,000 | | | | 448,012 | (a)(b)(g)(i) |
Credit Agricole SA, Junior Subordinated Notes | | | 7.875 | % | | | 1/23/24 | | | | 200,000 | | | | 204,231 | (a)(g)(i) |
HSBC Holdings PLC, Junior Subordinated Bonds | | | 6.375 | % | | | 9/17/24 | | | | 360,000 | | | | 356,400 | (g)(i) |
HSBC Holdings PLC, Junior Subordinated Bonds | | | 6.375 | % | | | 3/30/25 | | | | 220,000 | | | | 219,175 | (g)(i) |
Industrial & Commercial Bank of China Ltd., Senior Notes | | | 3.231 | % | | | 11/13/19 | | | | 260,000 | | | | 264,087 | (b) |
Itau Unibanco Holding SA, Senior Notes | | | 2.850 | % | | | 5/26/18 | | | | 450,000 | | | | 438,075 | (a) |
JPMorgan Chase & Co., Junior Subordinated Bonds | | | 6.000 | % | | | 8/1/23 | | | | 140,000 | | | | 138,950 | (b)(g)(i) |
JPMorgan Chase & Co., Junior Subordinated Notes | | | 6.100 | % | | | 10/1/24 | | | | 270,000 | | | | 269,914 | (b)(g)(i) |
M&T Bank Corp., Junior Subordinated Bonds | | | 6.875 | % | | | 6/15/16 | | | | 330,000 | | | | 334,125 | (b)(i) |
Novo Banco SA, Senior Notes | | | 5.875 | % | | | 11/9/15 | | | | 100,000 | EUR | | | 112,324 | (f) |
Royal Bank of Scotland Group PLC, Junior Subordinated Bonds | | | 7.648 | % | | | 9/30/31 | | | | 200,000 | | | | 251,000 | (g)(i) |
Royal Bank of Scotland Group PLC, Subordinated Notes | | | 6.100 | % | | | 6/10/23 | | | | 370,000 | | | | 397,880 | (b) |
Royal Bank of Scotland Group PLC, Subordinated Notes | | | 5.125 | % | | | 5/28/24 | | | | 760,000 | | | | 768,449 | (b) |
Royal Bank of Scotland NV, Subordinated Bonds | | | 7.750 | % | | | 5/15/23 | | | | 150,000 | | | | 174,253 | (b) |
Royal Bank of Scotland PLC, Subordinated Notes | | | 13.125 | % | | | 3/19/22 | | | | 530,000 | AUD | | | 422,943 | (b)(f)(g) |
Santander Issuances SAU, Notes | | | 5.911 | % | | | 6/20/16 | | | | 200,000 | | | | 205,414 | (a)(b) |
Sberbank of Russia Via SB Capital SA, Subordinated Notes | | | 5.500 | % | | | 2/26/24 | | | | 400,000 | | | | 324,660 | (f)(g) |
Wells Fargo & Co., Junior Subordinated Bonds | | | 5.875 | % | | | 6/15/25 | | | | 210,000 | | | | 215,250 | (g)(i) |
Total Banks | | | | | | | | | | | | | | | 8,931,203 | |
See Notes to Financial Statements.
| | |
| 16 | | Western Asset Global Partners Income Fund Inc. 2015 Annual Report |
Western Asset Global Partners Income Fund Inc.
| | | | | | | | | | | | | | | | |
| Security | | Rate | | | Maturity
Date | | | Face
Amount† | | | Value | |
Capital Markets — 0.4% | | | | | | | | | | | | | | | | |
Goldman Sachs Group Inc., Subordinated Notes | | | 6.750 | % | | | 10/1/37 | | | | 300,000 | | | $ | 359,018 | (b) |
Goldman Sachs Group Inc., Subordinated Notes | | | 5.150 | % | | | 5/22/45 | | | | 270,000 | | | | 267,919 | |
Total Capital Markets | | | | | | | | | | | | | | | 626,937 | |
Consumer Finance — 0.5% | | | | | | | | | | | | | | | | |
Ally Financial Inc., Senior Notes | | | 8.000 | % | | | 3/15/20 | | | | 129,000 | | | | 151,252 | |
Navient Corp., Medium-Term Notes, Senior Notes | | | 8.450 | % | | | 6/15/18 | | | | 250,000 | | | | 265,625 | (b) |
Navient Corp., Medium-Term Notes, Senior Notes | | | 8.000 | % | | | 3/25/20 | | | | 240,000 | | | | 243,600 | |
TMX Finance LLC/TitleMax Finance Corp., Senior Secured Notes | | | 8.500 | % | | | 9/15/18 | | | | 150,000 | | | | 122,438 | (a) |
Total Consumer Finance | | | | | | | | | | | | | | | 782,915 | |
Diversified Financial Services — 1.5% | | | | | | | | | | | | | | | | |
Argos Merger Sub Inc., Senior Notes | | | 7.125 | % | | | 3/15/23 | | | | 530,000 | | | | 556,500 | (a) |
International Lease Finance Corp., Senior Notes | | | 8.625 | % | | | 9/15/15 | | | | 70,000 | | | | 70,133 | (b) |
International Lease Finance Corp., Senior Notes | | | 8.875 | % | | | 9/1/17 | | | | 980,000 | | | | 1,081,675 | (b) |
International Lease Finance Corp., Senior Notes | | | 8.250 | % | | | 12/15/20 | | | | 90,000 | | | | 106,875 | (b) |
ZFS Finance USA Trust II, Bonds | | | 6.450 | % | | | 12/15/65 | | | | 500,000 | | | | 510,000 | (a)(b)(g) |
Total Diversified Financial Services | | | | | | | | | | | | | | | 2,325,183 | |
Insurance — 0.9% | | | | | | | | | | | | | | | | |
CNO Financial Group Inc., Senior Notes | | | 4.500 | % | | | 5/30/20 | | | | 40,000 | | | | 41,300 | |
CNO Financial Group Inc., Senior Notes | | | 5.250 | % | | | 5/30/25 | | | | 360,000 | | | | 372,600 | |
Fidelity & Guaranty Life Holdings Inc., Senior Notes | | | 6.375 | % | | | 4/1/21 | | | | 190,000 | | | | 198,550 | (a) |
Genworth Holdings Inc., Senior Notes | | | 4.900 | % | | | 8/15/23 | | | | 200,000 | | | | 164,500 | |
Liberty Mutual Group Inc., Junior Subordinated Bonds | | | 7.800 | % | | | 3/15/37 | | | | 200,000 | | | | 233,500 | (a)(b) |
MetLife Capital Trust IV, Junior Subordinated Notes | | | 7.875 | % | | | 12/15/37 | | | | 250,000 | | | | 312,500 | (a)(b) |
Total Insurance | | | | | | | | | | | | | | | 1,322,950 | |
Real Estate Management & Development — 1.1% | | | | | | | | | | | | | | | | |
Communications Sales & Leasing Inc., Senior Notes | | | 8.250 | % | | | 10/15/23 | | | | 180,000 | | | | 164,250 | (a) |
Greystar Real Estate Partners LLC, Senior Secured Notes | | | 8.250 | % | | | 12/1/22 | | | | 340,000 | | | | 356,150 | (a) |
Howard Hughes Corp., Senior Notes | | | 6.875 | % | | | 10/1/21 | | | | 460,000 | | | | 481,850 | (a) |
Paris Las Vegas Holding LLC/Harrah’s Las Vegas LLC/Flamingo Las Vegas Holding LLC, Secured Notes | | | 11.000 | % | | | 10/1/21 | | | | 210,000 | | | | 196,087 | |
Paris Las Vegas Holding LLC/Harrah’s Las Vegas LLC/Flamingo Las Vegas Holding LLC, Senior Secured Notes | | | 8.000 | % | | | 10/1/20 | | | | 580,000 | | | | 575,650 | |
Total Real Estate Management & Development | | | | | | | | | | | | | | | 1,773,987 | |
Total Financials | | | | | | | | | | | | | | | 15,763,175 | |
| Health Care — 5.0% | | | | | | | | | | | | | | | | |
Biotechnology — 0.1% | | | | | | | | | | | | | | | | |
AMAG Pharmaceuticals Inc., Senior Notes | | | 7.875 | % | | | 9/1/23 | | | | 170,000 | | | | 174,888 | (a) |
See Notes to Financial Statements.
| | |
| Western Asset Global Partners Income Fund Inc. 2015 Annual Report | | 17 |
Schedule of investments (cont’d)
August 31, 2015
Western Asset Global Partners Income Fund Inc.
| | | | | | | | | | | | | | | | |
| Security | | Rate | | | Maturity
Date | | | Face
Amount† | | | Value | |
Health Care Equipment & Supplies — 1.0% | | | | | | | | | | | | | | | | |
ConvaTec Finance International SA, Senior Notes | | | 8.250 | % | | | 1/15/19 | | | | 220,000 | | | $ | 217,525 | (a)(c) |
ConvaTec Healthcare E SA, Senior Notes | | | 10.875 | % | | | 12/15/18 | | | | 660,000 | EUR | | | 780,983 | (a)(b) |
DJO Finance LLC/DJO Finance Corp., Secured Notes | | | 10.750 | % | | | 4/15/20 | | | | 70,000 | | | | 71,400 | (a) |
DJO Finco Inc./DJO Finance LLC/DJO Finance Corp., Secured Notes | | | 8.125 | % | | | 6/15/21 | | | | 550,000 | | | | 570,350 | (a) |
Total Health Care Equipment & Supplies | | | | | | | | | | | | | | | 1,640,258 | |
Health Care Providers & Services — 3.1% | | | | | | | | | | | | | | | | |
Acadia Healthcare Co. Inc., Senior Notes | | | 12.875 | % | | | 11/1/18 | | | | 305,000 | | | | 329,400 | (b) |
Acadia Healthcare Co. Inc., Senior Notes | | | 6.125 | % | | | 3/15/21 | | | | 50,000 | | | | 51,875 | |
BioScrip Inc., Senior Notes | | | 8.875 | % | | | 2/15/21 | | | | 160,000 | | | | 120,400 | |
CHS/Community Health Systems Inc., Senior Notes | | | 8.000 | % | | | 11/15/19 | | | | 540,000 | | | | 565,650 | (b) |
IASIS Healthcare LLC/IASIS Capital Corp., Senior Notes | | | 8.375 | % | | | 5/15/19 | | | | 550,000 | | | | 571,389 | |
Priory Group No. 3 PLC, Senior Subordinated Notes | | | 8.875 | % | | | 2/15/19 | | | | 380,000 | GBP | | | 604,831 | (f) |
Tenet Healthcare Corp., Senior Notes | | | 8.125 | % | | | 4/1/22 | | | | 570,000 | | | | 632,700 | |
Tenet Healthcare Corp., Senior Notes | | | 6.750 | % | | | 6/15/23 | | | | 570,000 | | | | 589,950 | |
Universal Hospital Services Inc., Secured Notes | | | 7.625 | % | | | 8/15/20 | | | | 1,450,000 | | | | 1,405,594 | |
Total Health Care Providers & Services | | | | | | | | | | | | | | | 4,871,789 | |
Pharmaceuticals — 0.8% | | | | | | | | | | | | | | | | |
DPx Holdings BV, Senior Notes | | | 7.500 | % | | | 2/1/22 | | | | 200,000 | | | | 209,250 | (a) |
Endo Finance LLC/Endo Ltd./Endo Finco Inc., Senior Notes | | | 6.000 | % | | | 7/15/23 | | | | 420,000 | | | | 437,850 | (a) |
JLL/Delta Dutch Pledgeco BV, Senior Notes | | | 8.750 | % | | | 5/1/20 | | | | 560,000 | | | | 575,400 | (a)(c) |
Total Pharmaceuticals | | | | | | | | | | | | | | | 1,222,500 | |
Total Health Care | | | | | | | | | | | | | | | 7,909,435 | |
| Industrials — 11.1% | | | | | | | | | | | | | | | | |
Aerospace & Defense — 0.4% | | | | | | | | | | | | | | | | |
Aerojet Rocketdyne Holdings Inc., Secured Notes | | | 7.125 | % | | | 3/15/21 | | | | 170,000 | | | | 179,775 | |
CBC Ammo LLC/CBC FinCo Inc., Senior Notes | | | 7.250 | % | | | 11/15/21 | | | | 490,000 | | | | 461,825 | (a)(b) |
Total Aerospace & Defense | | | | | | | | | | | | | | | 641,600 | |
Air Freight & Logistics — 0.6% | | | | | | | | | | | | | | | | |
Air Medical Merger Sub Corp., Senior Notes | | | 6.375 | % | | | 5/15/23 | | | | 210,000 | | | | 196,350 | (a) |
XPO Logistics Inc., Senior Notes | | | 7.875 | % | | | 9/1/19 | | | | 400,000 | | | | 425,500 | (a) |
XPO Logistics Inc., Senior Notes | | | 6.500 | % | | | 6/15/22 | | | | 300,000 | | | | 296,250 | (a) |
Total Air Freight & Logistics | | | | | | | | | | | | | | | 918,100 | |
Airlines — 0.8% | | | | | | | | | | | | | | | | |
Air Canada, Pass-Through Trust, Secured Notes | | | 6.625 | % | | | 5/15/18 | | | | 130,000 | | | | 135,512 | (a) |
American Airlines, Pass-Through Trust, Secured Notes | | | 7.000 | % | | | 1/31/18 | | | | 120,831 | | | | 128,533 | (a) |
Continental Airlines Inc., Pass-Through Certificates, Secured Bonds | | | 7.373 | % | | | 12/15/15 | | | | 21,939 | | | | 22,186 | |
See Notes to Financial Statements.
| | |
| 18 | | Western Asset Global Partners Income Fund Inc. 2015 Annual Report |
Western Asset Global Partners Income Fund Inc.
| | | | | | | | | | | | | | | | |
| Security | | Rate | | | Maturity
Date | | | Face
Amount† | | | Value | |
Airlines — continued | | | | | | | | | | | | | | | | |
Continental Airlines Inc., Pass-Through Certificates, Secured Notes | | | 9.250 | % | | | 5/10/17 | | | | 2,166 | | | $ | 2,363 | |
Continental Airlines Inc., Pass-Through Certificates, Secured Notes | | | 5.500 | % | | | 10/29/20 | | | | 180,782 | | | | 187,335 | (b) |
Delta Air Lines Inc., Pass-Through Certificates, Subordinated Secured Notes | | | 9.750 | % | | | 12/17/16 | | | | 74,769 | | | | 80,283 | (b) |
Heathrow Finance PLC, Senior Secured Notes | | | 7.125 | % | | | 3/1/17 | | | | 400,000 | GBP | | | 646,872 | (b)(f) |
Total Airlines | | | | | | | | | | | | | | | 1,203,084 | |
Building Products — 0.3% | | | | | | | | | | | | | | | | |
Ashton Woods USA LLC/Ashton Woods Finance Co., Senior Notes | | | 6.875 | % | | | 2/15/21 | | | | 310,000 | | | | 291,400 | (a) |
GTL Trade Finance Inc., Senior Notes | | | 7.250 | % | | | 4/16/44 | | | | 250,000 | | | | 205,425 | (a)(b) |
Total Building Products | | | | | | | | | | | | | | | 496,825 | |
Commercial Services & Supplies — 1.6% | | | | | | | | | | | | | | | | |
Garda World Security Corp., Senior Notes | | | 7.250 | % | | | 11/15/21 | | | | 170,000 | | | | 159,800 | (a) |
JM Huber Corp., Senior Notes | | | 9.875 | % | | | 11/1/19 | | | | 200,000 | | | | 212,500 | (a)(b) |
Monitronics International Inc., Senior Notes | | | 9.125 | % | | | 4/1/20 | | | | 710,000 | | | | 667,400 | |
United Rentals North America Inc., Senior Notes | | | 8.250 | % | | | 2/1/21 | | | | 83,000 | | | | 88,188 | (b) |
United Rentals North America Inc., Senior Notes | | | 7.625 | % | | | 4/15/22 | | | | 418,000 | | | | 452,485 | (b) |
United Rentals North America Inc., Senior Notes | | | 5.750 | % | | | 11/15/24 | | | | 200,000 | | | | 198,000 | |
West Corp., Senior Notes | | | 5.375 | % | | | 7/15/22 | | | | 730,000 | | | | 688,937 | (a) |
Total Commercial Services & Supplies | | | | | | | | | | | | | | | 2,467,310 | |
Construction & Engineering — 2.0% | | | | | | | | | | | | | | | | |
Astaldi SpA, Senior Notes | | | 7.125 | % | | | 12/1/20 | | | | 260,000 | EUR | | | 308,141 | (a) |
Astaldi SpA, Senior Notes | | | 7.125 | % | | | 12/1/20 | | | | 100,000 | EUR | | | 118,516 | (f) |
Ausdrill Finance Pty Ltd., Senior Notes | | | 6.875 | % | | | 11/1/19 | | | | 400,000 | | | | 299,000 | (a)(b) |
Brundage-Bone Concrete Pumping Inc., Senior Secured Notes | | | 10.375 | % | | | 9/1/21 | | | | 270,000 | | | | 280,800 | (a) |
Empresas ICA SAB de CV, Senior Notes | | | 8.875 | % | | | 5/29/24 | | | | 616,000 | | | | 278,740 | (a)(b) |
Michael Baker Holdings LLC/Michael Baker Finance Corp., Senior Notes | | | 8.875 | % | | | 4/15/19 | | | | 340,000 | | | | 295,800 | (a)(c) |
Michael Baker International LLC/CDL Acquisition Co. Inc., Senior Secured Notes | | | 8.250 | % | | | 10/15/18 | | | | 400,000 | | | | 392,000 | (a)(b) |
Modular Space Corp., Secured Notes | | | 10.250 | % | | | 1/31/19 | | | | 330,000 | | | | 242,550 | (a) |
Odebrecht Finance Ltd., Senior Notes | | | 4.375 | % | | | 4/25/25 | | | | 630,000 | | | | 415,800 | (a)(b) |
Odebrecht Finance Ltd., Senior Notes | | | 5.250 | % | | | 6/27/29 | | | | 762,000 | | | | 483,870 | (a)(b) |
Odebrecht Offshore Drilling Finance Ltd., Senior Secured Notes | | | 6.625 | % | | | 10/1/22 | | | | 189,580 | | | | 105,217 | (a)(b) |
Total Construction & Engineering | | | | | | | | | | | | | | | 3,220,434 | |
Electrical Equipment — 0.3% | | | | | | | | | | | | | | | | |
International Wire Group Holdings Inc., Senior Secured Notes | | | 8.500 | % | | | 10/15/17 | | | | 230,000 | | | | 237,475 | (a) |
See Notes to Financial Statements.
| | |
| Western Asset Global Partners Income Fund Inc. 2015 Annual Report | | 19 |
Schedule of investments (cont’d)
August 31, 2015
Western Asset Global Partners Income Fund Inc.
| | | | | | | | | | | | | | | | |
| Security | | Rate | | | Maturity
Date | | | Face
Amount† | | | Value | |
Electrical Equipment — continued | | | | | | | | | | | | | | | | |
NES Rentals Holdings Inc., Senior Secured Notes | | | 7.875 | % | | | 5/1/18 | | | | 200,000 | | | $ | 199,500 | (a) |
Trionista TopCo GmbH, Senior Subordinated Notes | | | 6.875 | % | | | 4/30/21 | | | | 100,000 | EUR | | | 118,621 | (a) |
Total Electrical Equipment | | | | | | | | | | | | | | | 555,596 | |
Industrial Conglomerates — 0.4% | | | | | | | | | | | | | | | | |
Alfa SAB de CV, Senior Notes | | | 6.875 | % | | | 3/25/44 | | | | 200,000 | | | | 198,500 | (a)(b) |
Leucadia National Corp., Senior Notes | | | 8.125 | % | | | 9/15/15 | | | | 40,000 | | | | 40,100 | (b) |
Sinochem Overseas Capital Co., Ltd., Senior Notes | | | 4.500 | % | | | 11/12/20 | | | | 370,000 | | | | 389,460 | (a)(b) |
Total Industrial Conglomerates | | | | | | | | | | | | | | | 628,060 | |
Machinery — 1.7% | | | | | | | | | | | | | | | | |
CTP Transportation Products LLC/CTP Finance Inc., Senior Secured Notes | | | 8.250 | % | | | 12/15/19 | | | | 130,000 | | | | 138,775 | (a) |
DH Services Luxembourg Sarl, Senior Notes | | | 7.750 | % | | | 12/15/20 | | | | 620,000 | | | | 635,500 | (a) |
Global Brass and Copper Inc., Senior Secured Notes | | | 9.500 | % | | | 6/1/19 | | | | 280,000 | | | | 302,050 | |
KION Finance SA, Senior Secured Notes | | | 6.750 | % | | | 2/15/20 | | | | 729,000 | EUR | | | 863,613 | (a) |
KraussMaffei Group GmbH, Senior Secured Notes | | | 8.750 | % | | | 12/15/20 | | | | 136,000 | EUR | | | 163,526 | (a) |
KraussMaffei Group GmbH, Senior Secured Notes | | | 8.750 | % | | | 12/15/20 | | | | 120,000 | EUR | | | 144,287 | (f) |
SIG Combibloc Holdings SCA, Senior Bonds | | | 7.750 | % | | | 2/15/23 | | | | 190,000 | EUR | | | 220,586 | (a) |
SPL Logistics Escrow LLC/SPL Logistics Finance Corp., Senior Secured Notes | | | 8.875 | % | | | 8/1/20 | | | | 200,000 | | | | 214,000 | (a)(b) |
Total Machinery | | | | | | | | | | | | | | | 2,682,337 | |
Marine — 0.4% | | | | | | | | | | | | | | | | |
Navios Maritime Acquisition Corp./Navios Acquisition Finance U.S. Inc., Senior Secured Notes | | | 8.125 | % | | | 11/15/21 | | | | 460,000 | | | | 441,025 | (a) |
Ultrapetrol Bahamas Ltd., Senior Secured Notes | | | 8.875 | % | | | 6/15/21 | | | | 240,000 | | | | 188,400 | |
Total Marine | | | | | | | | | | | | | | | 629,425 | |
Road & Rail — 1.3% | | | | | | | | | | | | | | | | |
Flexi-Van Leasing Inc., Senior Notes | | | 7.875 | % | | | 8/15/18 | | | | 270,000 | | | | 274,725 | (a)(b) |
Florida East Coast Holdings Corp., Senior Notes | | | 9.750 | % | | | 5/1/20 | | | | 60,000 | | | | 54,300 | (a) |
Florida East Coast Holdings Corp., Senior Secured Notes | | | 6.750 | % | | | 5/1/19 | | | | 570,000 | | | | 575,700 | (a) |
Gategroup Finance Luxembourg SA, Senior Notes | | | 6.750 | % | | | 3/1/19 | | | | 69,655 | EUR | | | 81,643 | (a) |
Jack Cooper Holdings Corp., Senior Secured Notes | | | 10.250 | % | | | 6/1/20 | | | | 510,000 | | | | 466,650 | (a) |
Jurassic Holdings III Inc., Secured Notes | | | 6.875 | % | | | 2/15/21 | | | | 280,000 | | | | 198,100 | (a) |
Quality Distribution LLC/QD Capital Corp., Secured Notes | | | 9.875 | % | | | 11/1/18 | | | | 348,000 | | | | 361,424 | (b) |
Total Road & Rail | | | | | | | | | | | | | | | 2,012,542 | |
Trading Companies & Distributors — 0.3% | | | | | | | | | | | | | | | | |
H&E Equipment Services Inc., Senior Notes | | | 7.000 | % | | | 9/1/22 | | | | 410,000 | | | | 410,000 | (b) |
Transportation — 0.6% | | | | | | | | | | | | | | | | |
Hapag-Lloyd AG, Senior Notes | | | 9.750 | % | | | 10/15/17 | | | | 410,000 | | | | 424,350 | (a)(b) |
See Notes to Financial Statements.
| | |
| 20 | | Western Asset Global Partners Income Fund Inc. 2015 Annual Report |
Western Asset Global Partners Income Fund Inc.
| | | | | | | | | | | | | | | | |
| Security | | Rate | | | Maturity
Date | | | Face
Amount† | | | Value | |
Transportation — continued | | | | | | | | | | | | | | | | |
Neovia Logistics Intermediate Holdings LLC/Logistics Intermediate Finance Corp., Senior Notes | | | 10.000 | % | | | 2/15/18 | | | | 450,000 | | | $ | 452,250 | (a)(c) |
Total Transportation | | | | | | | | | | | | | | | 876,600 | |
Transportation Infrastructure — 0.4% | | | | | | | | | | | | | | | | |
Mersin Uluslararasi Liman Isletmeciligi AS, Notes | | | 5.875 | % | | | 8/12/20 | | | | 260,000 | | | | 272,329 | (a)(b) |
PT Pelabuhan Indonesia II, Senior Bonds | | | 4.250 | % | | | 5/5/25 | | | | 490,000 | | | | 436,100 | (a) |
Total Transportation Infrastructure | | | | | | | | | | | | | | | 708,429 | |
Total Industrials | | | | | | | | | | | | | | | 17,450,342 | |
| Information Technology — 1.8% | | | | | | | | | | | | | | | | |
Electronic Equipment, Instruments & Components — 0.2% | | | | | | | | | | | | | | | | |
Interface Security Systems Holdings Inc./Interface Security Systems LLC, Senior Secured Notes | | | 9.250 | % | | | 1/15/18 | | | | 290,000 | | | | 295,800 | |
Internet Software & Services — 0.3% | | | | | | | | | | | | | | | | |
Ancestry.com Holdings LLC, Senior Notes | | | 9.625 | % | | | 10/15/18 | | | | 130,000 | | | | 131,788 | (a)(c) |
Ancestry.com Inc., Senior Notes | | | 11.000 | % | | | 12/15/20 | | | | 250,000 | | | | 279,062 | |
Total Internet Software & Services | | | | | | | | | | | | | | | 410,850 | |
IT Services — 0.9% | | | | | | | | | | | | | | | | |
Compiler Finance Subordinated Inc., Senior Notes | | | 7.000 | % | | | 5/1/21 | | | | 400,000 | | | | 274,000 | (a) |
First Data Corp., Secured Notes | | | 8.250 | % | | | 1/15/21 | | | | 160,000 | | | | 168,800 | (a) |
First Data Corp., Senior Notes | | | 12.625 | % | | | 1/15/21 | | | | 610,000 | | | | 702,263 | |
First Data Corp., Senior Subordinated Notes | | | 11.750 | % | | | 8/15/21 | | | | 246,000 | | | | 277,734 | |
Total IT Services | | | | | | | | | | | | | | | 1,422,797 | |
Software — 0.4% | | | | | | | | | | | | | | | | |
Audatex North America Inc., Senior Notes | | | 6.000 | % | | | 6/15/21 | | | | 230,000 | | | | 225,448 | (a)(b) |
Oberthur Technologies Holding SAS, Senior Secured Notes | | | 9.250 | % | | | 4/30/20 | | | | 400,000 | EUR | | | 485,485 | (a) |
Total Software | | | | | | | | | | | | | | | 710,933 | |
Total Information Technology | | | | | | | | | | | | | | | 2,840,380 | |
| Materials — 13.4% | | | | | | | | | | | | | | | | |
Chemicals — 1.3% | | | | | | | | | | | | | | | | |
Alpek SAB de CV, Senior Notes | | | 4.500 | % | | | 11/20/22 | | | | 235,000 | | | | 236,175 | (a)(b) |
Eco Services Operations LLC/Eco Finance Corp., Senior Notes | | | 8.500 | % | | | 11/1/22 | | | | 100,000 | | | | 96,000 | (a) |
Hexion Inc., Senior Secured Notes | | | 8.875 | % | | | 2/1/18 | | | | 250,000 | | | | 218,750 | |
HIG BBC Intermediate Holdings LLC/HIG BBC Holdings Corp., Senior Notes | | | 10.500 | % | | | 9/15/18 | | | | 160,000 | | | | 156,800 | (a)(c) |
Kerling PLC, Senior Secured Notes | | | 10.625 | % | | | 2/1/17 | | | | 118,000 | EUR | | | 135,417 | (a)(b) |
Mexichem SAB de CV, Senior Notes | | | 4.875 | % | | | 9/19/22 | | | | 260,000 | | | | 267,670 | (a)(b) |
OCP SA, Senior Notes | | | 5.625 | % | | | 4/25/24 | | | | 450,000 | | | | 463,027 | (a)(b) |
OCP SA, Senior Notes | | | 4.500 | % | | | 10/22/25 | | | | 430,000 | | | | 406,995 | (a) |
Total Chemicals | | | | | | | | | | | | | | | 1,980,834 | |
See Notes to Financial Statements.
| | |
| Western Asset Global Partners Income Fund Inc. 2015 Annual Report | | 21 |
Schedule of investments (cont’d)
August 31, 2015
Western Asset Global Partners Income Fund Inc.
| | | | | | | | | | | | | | | | |
| Security | | Rate | | | Maturity
Date | | | Face
Amount† | | | Value | |
Construction Materials — 1.7% | | | | | | | | | | | | | | | | |
Cementos Pacasmayo SAA, Senior Notes | | | 4.500 | % | | | 2/8/23 | | | | 220,000 | | | $ | 205,150 | (a)(b) |
Cementos Pacasmayo SAA, Senior Notes | | | 4.500 | % | | | 2/8/23 | | | | 100,000 | | | | 93,250 | (b)(f) |
Cemex Finance LLC, Senior Secured Notes | | | 9.375 | % | | | 10/12/22 | | | | 560,000 | | | | 628,600 | (a)(b) |
Cemex Finance LLC, Senior Secured Notes | | | 9.375 | % | | | 10/12/22 | | | | 400,000 | | | | 449,000 | (b)(f) |
Cemex SAB de CV, Senior Secured Notes | | | 5.700 | % | | | 1/11/25 | | | | 540,000 | | | | 507,600 | (a) |
Cemex SAB de CV, Senior Secured Notes | | | 6.125 | % | | | 5/5/25 | | | | 220,000 | | | | 210,650 | (a) |
Cimpor Financial Operations BV, Senior Notes | | | 5.750 | % | | | 7/17/24 | | | | 350,000 | | | | 263,375 | (a) |
Hardwoods Acquisition Inc., Senior Secured Notes | | | 7.500 | % | | | 8/1/21 | | | | 270,000 | | | | 257,850 | (a) |
NWH Escrow Corp., Senior Secured Notes | | | 7.500 | % | | | 8/1/21 | | | | 100,000 | | | | 93,000 | (a) |
Total Construction Materials | | | | | | | | | | | | | | | 2,708,475 | |
Containers & Packaging — 2.2% | | | | | | | | | | | | | | | | |
Ardagh Finance Holdings SA, Senior Notes | | | 8.625 | % | | | 6/15/19 | | | | 283,103 | | | | 300,089 | (a)(c) |
Ardagh Packaging Finance PLC, Senior Notes | | | 9.250 | % | | | 10/15/20 | | | | 1,000,000 | EUR | | | 1,175,790 | (a)(b) |
BWAY Holding Co., Senior Notes | | | 9.125 | % | | | 8/15/21 | | | | 460,000 | | | | 469,200 | (a) |
Coveris Holdings SA, Senior Notes | | | 7.875 | % | | | 11/1/19 | | | | 400,000 | | | | 390,000 | (a) |
Pactiv LLC, Senior Bonds | | | 8.375 | % | | | 4/15/27 | | | | 360,000 | | | | 352,800 | |
Pactiv LLC, Senior Notes | | | 7.950 | % | | | 12/15/25 | | | | 330,000 | | | | 320,100 | |
PaperWorks Industries Inc., Senior Secured Notes | | | 9.500 | % | | | 8/15/19 | | | | 220,000 | | | | 216,480 | (a) |
Suzano Trading Ltd., Senior Notes | | | 5.875 | % | | | 1/23/21 | | | | 240,000 | | | | 248,400 | (a)(b) |
Total Containers & Packaging | | | | | | | | | | | | | | | 3,472,859 | |
Metals & Mining — 7.1% | | | | | | | | | | | | | | | | |
ArcelorMittal, Senior Notes | | | 7.000 | % | | | 2/25/22 | | | | 10,000 | | | | 10,025 | |
ArcelorMittal, Senior Notes | | | 7.750 | % | | | 10/15/39 | | | | 260,000 | | | | 242,450 | |
Barminco Finance Pty Ltd., Senior Notes | | | 9.000 | % | | | 6/1/18 | | | | 270,000 | | | | 211,950 | (a) |
Coeur Mining Inc., Senior Notes | | | 7.875 | % | | | 2/1/21 | | | | 620,000 | | | | 398,350 | (b) |
Corporacion Nacional del Cobre de Chile, Senior Notes | | | 3.750 | % | | | 11/4/20 | | | | 250,000 | | | | 254,775 | (a)(b) |
Corporacion Nacional del Cobre de Chile, Senior Notes | | | 3.875 | % | | | 11/3/21 | | | | 490,000 | | | | 494,412 | (a)(b) |
Corporacion Nacional del Cobre de Chile, Senior Notes | | | 3.000 | % | | | 7/17/22 | | | | 300,000 | | | | 280,072 | (b)(f) |
Corporacion Nacional del Cobre de Chile, Senior Notes | | | 3.000 | % | | | 7/17/22 | | | | 200,000 | | | | 186,715 | (a)(b) |
Evraz Group SA, Senior Notes | | | 9.500 | % | | | 4/24/18 | | | | 540,000 | | | | 553,500 | (b)(f) |
Evraz Group SA, Senior Notes | | | 6.750 | % | | | 4/27/18 | | | | 360,000 | | | | 342,900 | (a)(b) |
FMG Resources (August 2006) Pty Ltd., Senior Secured Notes | | | 9.750 | % | | | 3/1/22 | | | | 580,000 | | | | 531,425 | (a) |
Gerdau Trade Inc., Senior Notes | | | 4.750 | % | | | 4/15/23 | | | | 270,000 | | | | 228,487 | (a)(b) |
Midwest Vanadium Pty Ltd., Senior Secured Notes | | | 11.500 | % | | | 2/15/18 | | | | 330,000 | | | | 16,500 | *(a)(d)(h) |
Mirabela Nickel Ltd., Subordinated Notes | | | 1.000 | % | | | 9/10/44 | | | | 4,051 | | | | 0 | (a)(d)(e)(j) |
Prince Mineral Holding Corp., Senior Secured Notes | | | 11.500 | % | | | 12/15/19 | | | | 50,000 | | | | 43,500 | (a)(b) |
Rain CII Carbon LLC/CII Carbon Corp., Senior Secured Notes | | | 8.250 | % | | | 1/15/21 | | | | 420,000 | | | | 399,000 | (a)(b) |
Rio Tinto Finance USA Ltd., Senior Notes | | | 9.000 | % | | | 5/1/19 | | | | 260,000 | | | | 319,131 | (b) |
See Notes to Financial Statements.
| | |
| 22 | | Western Asset Global Partners Income Fund Inc. 2015 Annual Report |
Western Asset Global Partners Income Fund Inc.
| | | | | | | | | | | | | | | | |
| Security | | Rate | | | Maturity
Date | | | Face
Amount† | | | Value | |
Metals & Mining — continued | | | | | | | | | | | | | | | | |
Ryerson Inc./Joseph T. Ryerson & Son Inc., Senior Secured Notes | | | 9.000 | % | | | 10/15/17 | | | | 420,000 | | | $ | 384,300 | |
Schaeffler Holding Finance BV, Senior Secured Bonds | | | 6.875 | % | | | 8/15/18 | | | | 200,000 | | | | 206,900 | (a)(c) |
Schaeffler Holding Finance BV, Senior Secured Notes | | | 6.875 | % | | | 8/15/18 | | | | 290,000 | EUR | | | 337,375 | (a)(c) |
Schaeffler Holding Finance BV, Senior Secured Notes | | | 6.750 | % | | | 11/15/22 | | | | 380,000 | | | | 407,550 | (a)(c) |
Severstal OAO Via Steel Capital SA, Senior Notes | | | 4.450 | % | | | 3/19/18 | | | | 300,000 | | | | 291,000 | (a)(b) |
Southern Copper Corp., Senior Notes | | | 3.875 | % | | | 4/23/25 | | | | 240,000 | | | | 229,433 | |
Southern Copper Corp., Senior Notes | | | 6.750 | % | | | 4/16/40 | | | | 730,000 | | | | 704,428 | (b) |
Southern Copper Corp., Senior Notes | | | 5.250 | % | | | 11/8/42 | | | | 180,000 | | | | 147,258 | (b) |
Steel Dynamics Inc., Senior Notes | | | 6.125 | % | | | 8/15/19 | | | | 150,000 | | | | 156,188 | (b) |
Thompson Creek Metals Co. Inc., Senior Notes | | | 12.500 | % | | | 5/1/19 | | | | 230,000 | | | | 141,094 | |
Tupy Overseas SA, Senior Bonds | | | 6.625 | % | | | 7/17/24 | | | | 250,000 | | | | 237,812 | (a) |
Vale Overseas Ltd., Senior Notes | | | 4.375 | % | | | 1/11/22 | | | | 200,000 | | | | 185,960 | (b) |
Vale Overseas Ltd., Senior Notes | | | 6.875 | % | | | 11/21/36 | | | | 2,277,000 | | | | 1,949,112 | (k) |
Vedanta Resources PLC, Senior Notes | | | 6.750 | % | | | 6/7/16 | | | | 450,000 | | | | 443,250 | (a) |
Vedanta Resources PLC, Senior Notes | | | 9.500 | % | | | 7/18/18 | | | | 100,000 | | | | 98,000 | (b)(f) |
Vedanta Resources PLC, Senior Notes | | | 6.000 | % | | | 1/31/19 | | | | 850,000 | | | | 741,625 | (a) |
Total Metals & Mining | | | | | | | | | | | | | | | 11,174,477 | |
Paper & Forest Products — 1.1% | | | | | | | | | | | | | | | | |
Appvion Inc., Secured Notes | | | 9.000 | % | | | 6/1/20 | | | | 630,000 | | | | 359,100 | (a) |
Celulosa Arauco y Constitucion SA, Senior Notes | | | 7.250 | % | | | 7/29/19 | | | | 62,000 | | | | 70,903 | (b) |
Celulosa Arauco y Constitucion SA, Senior Notes | | | 4.750 | % | | | 1/11/22 | | | | 160,000 | | | | 163,965 | (b) |
Fibria Overseas Finance Ltd., Senior Notes | | | 5.250 | % | | | 5/12/24 | | | | 200,000 | | | | 198,000 | (b) |
Inversiones CMPC SA, Notes | | | 4.375 | % | | | 5/15/23 | | | | 200,000 | | | | 197,598 | (a)(b) |
Inversiones CMPC SA, Senior Notes | | | 4.750 | % | | | 1/19/18 | | | | 250,000 | | | | 259,913 | (a)(b) |
Inversiones CMPC SA, Senior Notes | | | 4.500 | % | | | 4/25/22 | | | | 190,000 | | | | 190,999 | (a)(b) |
Resolute Forest Products Inc., Senior Notes | | | 5.875 | % | | | 5/15/23 | | | | 230,000 | | | | 189,750 | |
Verso Paper Holdings LLC/Verso Paper Inc., Senior Secured Bonds | | | 11.750 | % | | | 1/15/19 | | | | 90,000 | | | | 21,375 | |
Verso Paper Holdings LLC/Verso Paper Inc., Senior Secured Notes | | | 11.750 | % | | | 1/15/19 | | | | 30,000 | | | | 8,550 | |
Total Paper & Forest Products | | | | | | | | | | | | | | | 1,660,153 | |
Total Materials | | | | | | | | | | | | | | | 20,996,798 | |
| Telecommunication Services — 9.1% | | | | | | | | | | | | | | | | |
Diversified Telecommunication Services — 4.9% | | | | | | | | | | | | | | | | |
Axtel SAB de CV, Senior Secured Notes | | | 9.000 | % | | | 1/31/20 | | | | 944,000 | | | | 901,520 | (a) |
Bharti Airtel International Netherlands BV, Senior Bonds | | | 5.350 | % | | | 5/20/24 | | | | 280,000 | | | | 300,098 | (a)(b) |
CenturyLink Inc., Senior Notes | | | 6.750 | % | | | 12/1/23 | | | | 250,000 | | | | 244,062 | (b) |
Cincinnati Bell Telephone Co., LLC, Senior Debentures | | | 6.300 | % | | | 12/1/28 | | | | 50,000 | | | | 46,750 | (b) |
See Notes to Financial Statements.
| | |
| Western Asset Global Partners Income Fund Inc. 2015 Annual Report | | 23 |
Schedule of investments (cont’d)
August 31, 2015
Western Asset Global Partners Income Fund Inc.
| | | | | | | | | | | | | | | | |
| Security | | Rate | | | Maturity
Date | | | Face
Amount† | | | Value | |
Diversified Telecommunication Services — continued | | | | | | | | | | | | | | | | |
Empresa Nacional de Telecomunicaciones SA, Senior Notes | | | 4.875 | % | | | 10/30/24 | | | | 200,000 | | | $ | 198,658 | (a)(b) |
Intelsat Jackson Holdings SA, Senior Notes | | | 7.250 | % | | | 10/15/20 | | | | 760,000 | | | | 733,400 | (b) |
Intelsat Jackson Holdings SA, Senior Notes | | | 7.500 | % | | | 4/1/21 | | | | 1,120,000 | | | | 1,089,200 | |
Intelsat Luxembourg SA, Senior Bonds | | | 7.750 | % | | | 6/1/21 | | | | 290,000 | | | | 218,370 | |
Level 3 Financing Inc., Senior Notes | | | 8.625 | % | | | 7/15/20 | | | | 600,000 | | | | 637,200 | (b) |
Level 3 Financing Inc., Senior Notes | | | 6.125 | % | | | 1/15/21 | | | | 90,000 | | | | 94,500 | |
Oi SA, Senior Notes | | | 5.750 | % | | | 2/10/22 | | | | 500,000 | | | | 362,500 | (a) |
Ooredoo International Finance Ltd., Senior Notes | | | 4.750 | % | | | 2/16/21 | | | | 220,000 | | | | 241,072 | (a)(b) |
Turk Telekomunikasyon AS, Senior Bonds | | | 3.750 | % | | | 6/19/19 | | | | 330,000 | | | | 326,304 | (a)(b) |
Turk Telekomunikasyon AS, Senior Notes | | | 4.875 | % | | | 6/19/24 | | | | 220,000 | | | | 210,298 | (a)(b) |
Verizon Communications Inc., Senior Notes | | | 5.150 | % | | | 9/15/23 | | | | 390,000 | | | | 428,270 | (b) |
Windstream Services LLC, Senior Notes | | | 7.750 | % | | | 10/1/21 | | | | 220,000 | | | | 180,402 | |
Windstream Services LLC, Senior Notes | | | 7.500 | % | | | 6/1/22 | | | | 1,660,000 | | | | 1,317,642 | |
Windstream Services LLC, Senior Notes | | | 7.500 | % | | | 4/1/23 | | | | 140,000 | | | | 110,251 | |
Total Diversified Telecommunication Services | | | | | | | | | | | | | | | 7,640,497 | |
Wireless Telecommunication Services — 4.2% | | | | | | | | | | | | | | | | |
Altice Financing SA, Senior Secured Notes | | | 5.250 | % | | | 2/15/23 | | | | 100,000 | EUR | | | 113,876 | (a) |
Altice Financing SA, Senior Secured Notes | | | 6.625 | % | | | 2/15/23 | | | | 610,000 | | | | 608,475 | (a) |
America Movil SAB de CV, Senior Notes | | | 5.625 | % | | | 11/15/17 | | | | 340,000 | | | | 368,941 | (b) |
Bharti Airtel Ltd., Senior Notes | | | 4.375 | % | | | 6/10/25 | | | | 350,000 | | | | 349,238 | (a) |
Sprint Capital Corp., Senior Notes | | | 8.750 | % | | | 3/15/32 | | | | 3,265,000 | | | | 3,097,669 | (b) |
Sprint Communications Inc., Senior Notes | | | 9.000 | % | | | 11/15/18 | | | | 630,000 | | | | 703,237 | (a)(b) |
Sprint Corp., Senior Notes | | | 7.625 | % | | | 2/15/25 | | | | 440,000 | | | | 411,675 | |
T-Mobile USA Inc., Senior Notes | | | 6.542 | % | | | 4/28/20 | | | | 120,000 | | | | 125,400 | |
T-Mobile USA Inc., Senior Notes | | | 6.633 | % | | | 4/28/21 | | | | 20,000 | | | | 20,950 | |
VimpelCom Holdings BV, Senior Notes | | | 7.504 | % | | | 3/1/22 | | | | 590,000 | | | | 572,076 | (f) |
VimpelCom Holdings BV, Senior Notes | | | 7.504 | % | | | 3/1/22 | | | | 200,000 | | | | 193,924 | (a)(b) |
Total Wireless Telecommunication Services | | | | | | | | | | | | | | | 6,565,461 | |
Total Telecommunication Services | | | | | | | | | | | | | | | 14,205,958 | |
| Utilities — 4.0% | | | | | | | | | | | | | | | | |
Electric Utilities — 1.7% | | | | | | | | | | | | | | | | |
Comision Federal de Electricidad, Senior Notes | | | 4.875 | % | | | 1/15/24 | | | | 200,000 | | | | 205,250 | (a)(b) |
Comision Federal de Electricidad, Senior Notes | | | 6.125 | % | | | 6/16/45 | | | | 250,000 | | | | 250,000 | (a) |
FirstEnergy Corp., Notes | | | 7.375 | % | | | 11/15/31 | | | | 330,000 | | | | 395,978 | (b) |
Majapahit Holding BV, Senior Notes | | | 7.750 | % | | | 1/20/20 | | | | 280,000 | | | | 314,650 | (b)(f) |
Midwest Generation LLC, Pass-Through Certificates, Secured Bonds | | | 8.560 | % | | | 1/2/16 | | | | 24,494 | | | | 24,494 | |
NRG REMA LLC, Pass-Through Certificates, Senior Secured Bonds | | | 9.237 | % | | | 7/2/17 | | | | 40,816 | | | | 42,653 | |
See Notes to Financial Statements.
| | |
| 24 | | Western Asset Global Partners Income Fund Inc. 2015 Annual Report |
Western Asset Global Partners Income Fund Inc.
| | | | | | | | | | | | | | | | |
| Security | | Rate | | | Maturity
Date | | | Face
Amount† | | | Value | |
Electric Utilities — continued | | | | | | | | | | | | | | | | |
NRG REMA LLC, Pass-Through Certificates, Senior Secured Bonds | | | 9.681 | % | | | 7/2/26 | | | | 450,000 | | | $ | 459,000 | (b) |
Red Oak Power LLC, Secured Notes | | | 9.200 | % | | | 11/30/29 | | | | 660,000 | | | | 742,500 | |
State Grid Overseas Investment 2013 Ltd., Senior Bonds | | | 3.125 | % | | | 5/22/23 | | | | 200,000 | | | | 197,149 | (a)(b) |
Total Electric Utilities | | | | | | | | | | | | | | | 2,631,674 | |
Gas Utilities — 0.5% | | | | | | | | | | | | | | | | |
Gas Natural de Lima y Callao SA, Senior Notes | | | 4.375 | % | | | 4/1/23 | | | | 200,000 | | | | 198,000 | (a)(b) |
Southern Natural Gas Co., LLC, Senior Notes | | | 8.000 | % | | | 3/1/32 | | | | 70,000 | | | | 82,537 | (b) |
Transportadora de Gas Internacional SA ESP, Senior Notes | | | 5.700 | % | | | 3/20/22 | | | | 470,000 | | | | 481,045 | (a)(b) |
Total Gas Utilities | | | | | | | | | | | | | | | 761,582 | |
Independent Power and Renewable Electricity Producers — 1.8% | | | | | | | | | |
AES Gener SA, Notes | | | 5.250 | % | | | 8/15/21 | | | | 250,000 | | | | 262,647 | (a)(b) |
Calpine Corp., Senior Secured Notes | | | 7.875 | % | | | 1/15/23 | | | | 378,000 | | | | 406,350 | (a)(b) |
Foresight Energy LLC/Foresight Energy Finance Corp., Senior Notes | | | 7.875 | % | | | 8/15/21 | | | | 240,000 | | | | 187,200 | (a) |
Korea East-West Power Co., Ltd., Senior Notes | | | 2.500 | % | | | 6/2/20 | | | | 400,000 | | | | 400,533 | (a) |
Mirant Mid Atlantic LLC, Pass-Through Certificates, Secured Bonds | | | 10.060 | % | | | 12/30/28 | | | | 1,071,724 | | | | 1,105,885 | (b) |
Three Gorges Finance Ltd., Senior Notes | | | 3.700 | % | | | 6/10/25 | | | | 440,000 | | | | 446,282 | (a) |
Total Independent Power and Renewable Electricity Producers | | | | | | | | 2,808,897 | |
Total Utilities | | | | | | | | | | | | | | | 6,202,153 | |
Total Corporate Bonds & Notes (Cost — $147,094,780) | | | | | | | | | | | | 140,247,284 | |
| Convertible Bonds & Notes — 0.3% | | | | | | | | | | | | | | | | |
| Materials — 0.2% | | | | | | | | | | | | | | | | |
Chemicals — 0.1% | | | | | | | | | | | | | | | | |
Hercules Inc., Junior Subordinated Bonds | | | 6.500 | % | | | 6/30/29 | | | | 90,000 | | | | 79,931 | |
Metals & Mining — 0.1% | | | | | | | | | | | | | | | | |
Mirabela Nickel Ltd., Senior Secured Bonds | | | 9.500 | % | | | 6/24/19 | | | | 320,399 | | | | 224,280 | (a)(c)(d) |
Total Materials | | | | | | | | | | | | | | | 304,211 | |
| Telecommunication Services — 0.1% | | | | | | | | | | | | | | | | |
Diversified Telecommunication Services — 0.1% | | | | | | | | | | | | | | | | |
Axtel SAB de CV, Senior Secured Notes | | | 9.000 | % | | | 1/31/20 | | | | 1,395,900 | MXN | | | 165,007 | (a) |
Total Convertible Bonds & Notes (Cost — $591,713) | | | | | | | | | | | | | | | 469,218 | |
| Senior Loans — 1.5% | | | | | | | | | | | | | | | | |
| Consumer Discretionary — 0.5% | | | | | | | | | | | | | | | | |
Hotels, Restaurants & Leisure — 0.2% | | | | | | | | | | | | | | | | |
Equinox Holdings Inc., Second Lien Term Loan | | | 9.750 | % | | | 7/31/20 | | | | 300,000 | | | | 305,500 | (l)(m) |
Specialty Retail — 0.2% | | | | | | | | | | | | | | | | |
Spencer Gifts LLC, Second Lien Term Loan | | | 9.250 | % | | | 11/12/21 | | | | 230,000 | | | | 233,450 | (l)(m) |
See Notes to Financial Statements.
| | |
| Western Asset Global Partners Income Fund Inc. 2015 Annual Report | | 25 |
Schedule of investments (cont’d)
August 31, 2015
Western Asset Global Partners Income Fund Inc.
| | | | | | | | | | | | | | | | |
| Security | | Rate | | | Maturity
Date | | | Face
Amount† | | | Value | |
Textiles, Apparel & Luxury Goods — 0.1% | | | | | | | | | | | | | | | | |
TOMS Shoes LLC, Term Loan B | | | 6.500 | % | | | 10/28/20 | | | | 179,550 | | | $ | 167,991 | (l)(m) |
Total Consumer Discretionary | | | | | | | | | | | | | | | 706,941 | |
| Consumer Staples — 0.1% | | | | | | | | | | | | | | | | |
Food Products — 0.1% | | | | | | | | | | | | | | | | |
AdvancePierre Foods Inc., Second Lien Term Loan | | | 9.500 | % | | | 10/10/17 | | | | 130,000 | | | | 131,056 | (l)(m) |
| Energy — 0.1% | | | | | | | | | | | | | | | | |
Oil, Gas & Consumable Fuels — 0.1% | | | | | | | | | | | | | | | | |
Westmoreland Coal Co., Term Loan B | | | 7.500 | % | | | 12/16/20 | | | | 177,947 | | | | 160,153 | (l)(m) |
| Health Care — 0.3% | | | | | | | | | | | | | | | | |
Health Care Equipment & Supplies — 0.1% | | | | | | | | | | | | | | | | |
Lantheus Medical Imaging Inc., Term Loan | | | 7.000 | % | | | 6/30/22 | | | | 220,000 | | | | 216,975 | (l)(m) |
Health Care Providers & Services — 0.2% | | | | | | | | | | | | | | | | |
Radnet Management Inc., Second Lien Term Loan | | | 8.000 | % | | | 3/25/21 | | | | 290,000 | | | | 286,556 | (l)(m) |
Total Health Care | | | | | | | | | | | | | | | 503,531 | |
| Industrials — 0.1% | | | | | | | | | | | | | | | | |
Commercial Services & Supplies — 0.1% | | | | | | | | | | | | | | | | |
Kronos Inc., Second Lien Term Loan | | | 9.750 | % | | | 4/30/20 | | | | 229,820 | | | | 236,523 | (l)(m) |
| Materials — 0.2% | | | | | | | | | | | | | | | | |
Chemicals — 0.2% | | | | | | | | | | | | | | | | |
Kerling PLC, EUR Term Loan | | | 10.000 | % | | | 6/30/16 | | | | 300,000 | EUR | | | 341,695 | (l)(m) |
Metals & Mining — 0.0% | | | | | | | | | | | | | | | | |
FMG Resources (August 2006) Pty Ltd., New Term Loan B | | | 3.750 | % | | | 6/30/19 | | | | 20,000 | | | | 16,241 | (l)(m) |
Total Materials | | | | | | | | | | | | | | | 357,936 | |
| Utilities — 0.2% | | | | | | | | | | | | | | | | |
Electric Utilities — 0.2% | | | | | | | | | | | | | | | | |
Panda Temple Power LLC, 2015 Term Loan B | | | 7.250 | % | | | 3/4/22 | | | | 259,350 | | | | 250,273 | (l)(m) |
Total Senior Loans (Cost — $2,419,136) | | | | | | | | | | | | | | | 2,346,413 | |
| Sovereign Bonds — 32.9% | | | | | | | | | | | | | | | | |
Argentina — 0.6% | | | | | | | | | | | | | | | | |
Republic of Argentina, Senior Bonds | | | 7.000 | % | | | 10/3/15 | | | | 608,000 | | | | 608,681 | |
Republic of Argentina, Senior Bonds | | | 7.000 | % | | | 4/17/17 | | | | 410,000 | | | | 390,848 | |
Total Argentina | | | | | | | | | | | | | | | 999,529 | |
Brazil — 2.5% | | | | | | | | | | | | | | | | |
Banco Nacional de Desenvolvimento Economico e Social, Senior Notes | | | 5.750 | % | | | 9/26/23 | | | | 220,000 | | | | 207,900 | (a)(b) |
Federative Republic of Brazil, Notes | | | 10.000 | % | | | 1/1/25 | | | | 1,357,000 | BRL | | | 297,407 | |
Federative Republic of Brazil, Senior Notes | | | 10.000 | % | | | 1/1/17 | | | | 9,099,000 | BRL | | | 2,397,628 | |
Federative Republic of Brazil, Senior Notes | | | 8.000 | % | | | 1/15/18 | | | | 1,007,778 | | | | 1,085,881 | (k) |
Total Brazil | | | | | | | | | | | | | | | 3,988,816 | |
See Notes to Financial Statements.
| | |
| 26 | | Western Asset Global Partners Income Fund Inc. 2015 Annual Report |
Western Asset Global Partners Income Fund Inc.
| | | | | | | | | | | | | | | | |
| Security | | Rate | | | Maturity
Date | | | Face
Amount† | | | Value | |
Chile — 0.3% | | | | | | | | | | | | | | | | |
Republic of Chile, Senior Notes | | | 3.875 | % | | | 8/5/20 | | | | 412,000 | | | $ | 445,990 | (b) |
Colombia — 1.9% | | | | | | | | | | | | | | | | |
Republic of Colombia, Senior Bonds | | | 7.375 | % | | | 9/18/37 | | | | 2,150,000 | | | | 2,547,750 | (k) |
Republic of Colombia, Senior Bonds | | | 6.125 | % | | | 1/18/41 | | | | 180,000 | | | | 188,100 | |
Republic of Colombia, Senior Notes | | | 7.375 | % | | | 3/18/19 | | | | 255,000 | | | | 292,612 | |
Total Colombia | | | | | | | | | | | | | | | 3,028,462 | |
Costa Rica — 0.3% | | | | | | | | | | | | | | | | |
Republic of Costa Rica, Notes | | | 7.000 | % | | | 4/4/44 | | | | 590,000 | | | | 554,600 | (a) |
Croatia — 0.7% | | | | | | | | | | | | | | | | |
Republic of Croatia, Senior Notes | | | 6.625 | % | | | 7/14/20 | | | | 260,000 | | | | 284,076 | (a) |
Republic of Croatia, Senior Notes | | | 5.500 | % | | | 4/4/23 | | | | 550,000 | | | | 568,562 | (a) |
Republic of Croatia, Senior Notes | | | 5.500 | % | | | 4/4/23 | | | | 210,000 | | | | 217,088 | (f) |
Total Croatia | | | | | | | | | | | | | | | 1,069,726 | |
Dominican Republic — 1.3% | | | | | | | | | | | | | | | | |
Dominican Republic, Senior Notes | | | 5.500 | % | | | 1/27/25 | | | | 970,000 | | | | 965,150 | (a) |
Dominican Republic, Senior Notes | | | 6.850 | % | | | 1/27/45 | | | | 1,140,000 | | | | 1,137,150 | (a) |
Total Dominican Republic | | | | | | | | | | | | | | | 2,102,300 | |
Ecuador — 0.5% | | | | | | | | | | | | | | | | |
Republic of Ecuador, Senior Bonds | | | 10.500 | % | | | 3/24/20 | | | | 940,000 | | | | 742,600 | (a) |
Egypt — 0.2% | | | | | | | | | | | | | | | | |
Arab Republic of Egypt, Senior Notes | | | 5.875 | % | | | 6/11/25 | | | | 330,000 | | | | 319,737 | (a) |
El Salvador — 0.1% | | | | | | | | | | | | | | | | |
Republic of El Salvador, Notes | | | 6.375 | % | | | 1/18/27 | | | | 190,000 | | | | 180,500 | (a) |
Gabon — 0.3% | | | | | | | | | | | | | | | | |
Gabonese Republic, Bonds | | | 6.375 | % | | | 12/12/24 | | | | 250,000 | | | | 219,728 | (a) |
Gabonese Republic, Senior Bonds | | | 6.950 | % | | | 6/16/25 | | | | 200,000 | | | | 180,630 | (a) |
Total Gabon | | | | | | | | | | | | | | | 400,358 | |
Honduras — 0.3% | | | | | | | | | | | | | | | | |
Republic of Honduras, Senior Notes | | | 7.500 | % | | | 3/15/24 | | | | 400,000 | | | | 424,000 | (f) |
Hungary — 1.3% | | | | | | | | | | | | | | | | |
Republic of Hungary, Senior Notes | | | 5.750 | % | | | 11/22/23 | | | | 1,528,000 | | | | 1,711,360 | |
Republic of Hungary, Senior Notes | | | 5.375 | % | | | 3/25/24 | | | | 300,000 | | | | 328,711 | |
Total Hungary | | | | | | | | | | | | | | | 2,040,071 | |
Indonesia — 2.9% | | | | | | | | | | | | | | | | |
Republic of Indonesia, Senior Bonds | | | 6.875 | % | | | 1/17/18 | | | | 100,000 | | | | 110,250 | (f) |
Republic of Indonesia, Senior Bonds | | | 6.625 | % | | | 2/17/37 | | | | 1,735,000 | | | | 1,873,800 | (f) |
Republic of Indonesia, Senior Notes | | | 5.875 | % | | | 1/15/24 | | | | 1,727,000 | | | | 1,860,842 | (a) |
Republic of Indonesia, Senior Notes | | | 5.250 | % | | | 1/17/42 | | | | 680,000 | | | | 634,100 | (a) |
Total Indonesia | | | | | | | | | | | | | | | 4,478,992 | |
See Notes to Financial Statements.
| | |
| Western Asset Global Partners Income Fund Inc. 2015 Annual Report | | 27 |
Schedule of investments (cont’d)
August 31, 2015
Western Asset Global Partners Income Fund Inc.
| | | | | | | | | | | | | | | | |
| Security | | Rate | | | Maturity
Date | | | Face
Amount† | | | Value | |
Ivory Coast — 0.7% | | | | | | | | | | | | | | | | |
Republic of Cote D’Ivoire, Senior Bonds | | | 5.750 | % | | | 12/31/32 | | | | 950,000 | | | $ | 864,652 | (f) |
Republic of Cote D’Ivoire, Senior Notes | | | 6.375 | % | | | 3/3/28 | | | | 240,000 | | | | 224,112 | (a) |
Total Ivory Coast | | | | | | | | | | | | | | | 1,088,764 | |
Jamaica — 0.4% | | | | | | | | | | | | | | | | |
Government of Jamaica, Senior Notes | | | 7.625 | % | | | 7/9/25 | | | | 250,000 | | | | 273,750 | |
Government of Jamaica, Senior Notes | | | 6.750 | % | | | 4/28/28 | | | | 320,000 | | | | 320,000 | |
Total Jamaica | | | | | | | | | | | | | | | 593,750 | |
Kenya — 0.4% | | | | | | | | | | | | | | | | |
Republic of Kenya, Senior Notes | | | 6.875 | % | | | 6/24/24 | | | | 600,000 | | | | 583,320 | (a) |
Lithuania — 0.6% | | | | | | | | | | | | | | | | |
Republic of Lithuania, Senior Notes | | | 6.125 | % | | | 3/9/21 | | | | 860,000 | | | | 1,000,163 | (a) |
Mexico — 2.3% | | | | | | | | | | | | | | | | |
United Mexican States, Senior Bonds | | | 8.000 | % | | | 6/11/20 | | | | 14,918,500 | MXN | | | 997,048 | (b) |
United Mexican States, Senior Bonds | | | 6.500 | % | | | 6/9/22 | | | | 1,780,200 | MXN | | | 110,926 | |
United Mexican States, Senior Bonds | | | 10.000 | % | | | 12/5/24 | | | | 4,800,000 | MXN | | | 367,688 | |
United Mexican States, Senior Notes | | | 5.125 | % | | | 1/15/20 | | | | 220,000 | | | | 241,450 | (b) |
United Mexican States, Senior Notes | | | 3.625 | % | | | 3/15/22 | | | | 520,000 | | | | 522,600 | (b) |
United Mexican States, Senior Notes | | | 4.000 | % | | | 10/2/23 | | | | 160,000 | | | | 162,800 | |
United Mexican States, Senior Notes | | | 4.750 | % | | | 3/8/44 | | | | 1,230,000 | | | | 1,153,125 | (b) |
Total Mexico | | | | | | | | | | | | | | | 3,555,637 | |
Pakistan — 0.2% | | | | | | | | | | | | | | | | |
Republic of Pakistan, Senior Bonds | | | 7.250 | % | | | 4/15/19 | | | | 330,000 | | | | 341,311 | (a) |
Panama — 0.4% | | | | | | | | | | | | | | | | |
Republic of Panama, Senior Bonds | | | 6.700 | % | | | 1/26/36 | | | | 459,000 | | | | 561,128 | |
Paraguay — 0.2% | | | | | | | | | | | | | | | | |
Republic of Paraguay, Senior Notes | | | 6.100 | % | | | 8/11/44 | | | | 360,000 | | | | 363,600 | (a) |
Peru — 1.9% | | | | | | | | | | | | | | | | |
Republic of Peru, Senior Bonds | | | 7.350 | % | | | 7/21/25 | | | | 1,200,000 | | | | 1,527,000 | (k) |
Republic of Peru, Senior Bonds | | | 8.750 | % | | | 11/21/33 | | | | 690,000 | | | | 1,009,125 | |
Republic of Peru, Senior Bonds | | | 6.550 | % | | | 3/14/37 | | | | 321,000 | | | | 383,595 | |
Republic of Peru, Senior Bonds | | | 5.625 | % | | | 11/18/50 | | | | 79,000 | | | | 85,320 | |
Total Peru | | | | | | | | | | | | | | | 3,005,040 | |
Philippines — 0.9% | | | | | | | | | | | | | | | | |
Republic of Philippines, Senior Bonds | | | 5.500 | % | | | 3/30/26 | | | | 660,000 | | | | 788,700 | |
Republic of Philippines, Senior Bonds | | | 3.950 | % | | | 1/20/40 | | | | 600,000 | | | | 613,500 | |
Total Philippines | | | | | | | | | | | | | | | 1,402,200 | |
Poland — 1.6% | | | | | | | | | | | | | | | | |
Republic of Poland, Senior Notes | | | 6.375 | % | | | 7/15/19 | | | | 400,000 | | | | 462,868 | |
See Notes to Financial Statements.
| | |
| 28 | | Western Asset Global Partners Income Fund Inc. 2015 Annual Report |
Western Asset Global Partners Income Fund Inc.
| | | | | | | | | | | | | | | | |
| Security | | Rate | | | Maturity
Date | | | Face
Amount† | | | Value | |
Poland — continued | | | | | | | | | | | | | | | | |
Republic of Poland, Senior Notes | | | 5.125 | % | | | 4/21/21 | | | | 500,000 | | | $ | 561,495 | |
Republic of Poland, Senior Notes | | | 5.000 | % | | | 3/23/22 | | | | 1,270,000 | | | | 1,420,419 | (k) |
Total Poland | | | | | | | | | | | | | | | 2,444,782 | |
Russia — 3.6% | | | | | | | | | | | | | | | | |
Russian Foreign Bond — Eurobond, Senior Bonds | | | 4.875 | % | | | 9/16/23 | | | | 400,000 | | | | 384,052 | (a)(b) |
Russian Foreign Bond — Eurobond, Senior Bonds | | | 12.750 | % | | | 6/24/28 | | | | 42,000 | | | | 64,604 | (b)(f) |
Russian Foreign Bond — Eurobond, Senior Bonds | | | 7.500 | % | | | 3/31/30 | | | | 2,467,188 | | | | 2,892,950 | (f)(k) |
Russian Foreign Bond — Eurobond, Senior Bonds | | | 5.875 | % | | | 9/16/43 | | | | 2,400,000 | | | | 2,243,880 | (a) |
Total Russia | | | | | | | | | | | | | | | 5,585,486 | |
Senegal — 0.1% | | | | | | | | | | | | | | | | |
Republic of Senegal, Bonds | | | 6.250 | % | | | 7/30/24 | | | | 200,000 | | | | 185,892 | (f) |
South Africa — 0.2% | | | | | | | | | | | | | | | | |
Republic of South Africa, Senior Notes | | | 5.875 | % | | | 9/16/25 | | | | 260,000 | | | | 281,522 | |
Tunisia — 0.1% | | | | | | | | | | | | | | | | |
Banque Centrale de Tunisie SA, Senior Bonds | | | 5.750 | % | | | 1/30/25 | | | | 200,000 | | | | 192,804 | (a) |
Turkey — 4.9% | | | | | | | | | | | | | | | | |
Republic of Turkey, Senior Bonds | | | 5.750 | % | | | 3/22/24 | | | | 260,000 | | | | 276,450 | |
Republic of Turkey, Senior Bonds | | | 4.250 | % | | | 4/14/26 | | | | 520,000 | | | | 487,879 | |
Republic of Turkey, Senior Bonds | | | 11.875 | % | | | 1/15/30 | | | | 575,000 | | | | 945,231 | |
Republic of Turkey, Senior Notes | | | 6.875 | % | | | 3/17/36 | | | | 5,296,000 | | | | 5,959,748 | (k) |
Republic of Turkey, Senior Notes | | | 6.750 | % | | | 5/30/40 | | | | 25,000 | | | | 27,853 | |
Total Turkey | | | | | | | | | | | | | | | 7,697,161 | |
Uruguay — 0.5% | | | | | | | | | | | | | | | | |
Republic of Uruguay, Senior Bonds | | | 5.100 | % | | | 6/18/50 | | | | 200,000 | | | | 183,750 | |
Republic of Uruguay, Senior Notes | | | 4.500 | % | | | 8/14/24 | | | | 570,000 | | | | 589,237 | |
Total Uruguay | | | | | | | | | | | | | | | 772,987 | |
Venezuela — 0.4% | | | | | | | | | | | | | | | | |
Bolivarian Republic of Venezuela, Senior Notes | | | 7.750 | % | | | 10/13/19 | | | | 1,617,000 | | | | 577,269 | (f) |
Vietnam — 0.2% | | | | | | | | | | | | | | | | |
Republic of Vietnam, Senior Bonds | | | 4.800 | % | | | 11/19/24 | | | | 300,000 | | | | 289,500 | (a) |
Zambia — 0.1% | | | | | | | | | | | | | | | | |
Republic of Zambia, Senior Notes | | | 8.970 | % | | | 7/30/27 | | | | 250,000 | | | | 230,625 | (a) |
Total Sovereign Bonds (Cost — $51,918,428) | | | | | | | | | | | | | | | 51,528,622 | |
See Notes to Financial Statements.
| | |
| Western Asset Global Partners Income Fund Inc. 2015 Annual Report | | 29 |
Schedule of investments (cont’d)
August 31, 2015
Western Asset Global Partners Income Fund Inc.
| | | | | | | | | | | | | | |
| Security | | | | | | | Shares | | | Value | |
| Common Stocks — 3.0% | | | | | | | | | | | | | | |
| Consumer Discretionary — 0.2% | | | | | | | | | | | | | | |
Automobiles — 0.2% | | | | | | | | | | | | | | |
Ford Motor Co. | | | | | | | | | 18,914 | | | $ | 262,337 | |
Hotels, Restaurants & Leisure — 0.0% | | | | | | | | | | | | | | |
Bossier Casino Venture Holdco Inc. | | | | | | | | | 19,194 | | | | 0 | *(d)(e)(j) |
Total Consumer Discretionary | | | | | | | | | | | | | 262,337 | |
| Energy — 0.4% | | | | | | | | | | | | | | |
Energy Equipment & Services — 0.4% | | | | | | | | | | | | | | |
KCAD Holdings I Ltd. | | | | | | | | | 77,972,021 | | | | 706,037 | *(d)(e) |
| Financials — 1.9% | | | | | | | | | | | | | | |
Banks — 1.9% | | | | | | | | | | | | | | |
Citigroup Inc. | | | | | | | | | 50,751 | | | | 2,714,164 | |
JPMorgan Chase & Co. | | | | | | | | | 5,293 | | | | 339,281 | |
Total Financials | | | | | | | | | | | | | 3,053,445 | |
| Health Care — 0.2% | | | | | | | | | | | | | | |
Health Care Providers & Services — 0.2% | | | | | | | | | | | | | | |
Physiotherapy Associates Holdings Inc. | | | | | | | | | 3,500 | | | | 290,500 | *(d)(e) |
| Industrials — 0.3% | | | | | | | | | | | | | | |
Marine — 0.1% | | | | | | | | | | | | | | |
DeepOcean Group Holding AS | | | | | | | | | 26,137 | | | | 168,479 | *(d)(e) |
Trading Companies & Distributors — 0.2% | | | | | | | | | | | | | | |
H&E Equipment Services Inc. | | | | | | | | | 12,513 | | | | 259,144 | |
Total Industrials | | | | | | | | | | | | | 427,623 | |
| Materials — 0.0% | | | | | | | | | | | | | | |
Metals & Mining — 0.0% | | | | | | | | | | | | | | |
Mirabela Nickel Ltd. | | | | | | | | | 837,929 | | | | 49,437 | *(d)(e) |
Total Common Stocks (Cost — $4,489,318) | | | | | | | | | | | | | 4,789,379 | |
| | | | |
| | | Rate | | | | | | | | | |
| Convertible Preferred Stocks — 0.1% | | | | | | | | | | | | | | |
| Energy — 0.1% | | | | | | | | | | | | | | |
Oil, Gas & Consumable Fuels — 0.1% | | | | | | | | | | | | | | |
Rex Energy Corp. (Cost — $250,225) | | | 6.000 | % | | | | | 3,500 | | | | 136,062 | |
| Preferred Stocks — 0.7% | | | | | | | | | | | | | | |
| Financials — 0.7% | | | | | | | | | | | | | | |
Consumer Finance — 0.7% | | | | | | | | | | | | | | |
GMAC Capital Trust I (Cost — $1,085,701) | | | 8.125 | % | | | | | 43,913 | | | | 1,121,099 | (g) |
See Notes to Financial Statements.
| | |
| 30 | | Western Asset Global Partners Income Fund Inc. 2015 Annual Report |
Western Asset Global Partners Income Fund Inc.
| | | | | | | | | | | | | | | | |
| Security | | Rate | | | Expiration
Date | | | Warrants | | | Value | |
| Warrants — 0.1% | | | | | | | | | | | | | | | | |
Bolivarian Republic of Venezuela, Oil-linked payment obligations | | | | | | | 4/15/20 | | | | 9,125 | | | $ | 91,250 | |
Jack Cooper Holdings Corp. | | | | | | | 12/15/17 | | | | 496 | | | | 69,440 | *(a) |
Jack Cooper Holdings Corp. | | | | | | | 5/6/18 | | | | 228 | | | | 31,920 | *(a) |
Total Warrants (Cost — $12,465) | | | | | | | | | | | | | | | 192,610 | |
Total Investments before Short-Term Investments (Cost — $207,861,766) | | | | 200,830,687 | |
| | | | |
| | | | | | Maturity
Date | | | Face
Amount† | | | | |
| Short-Term Investments — 1.9% | | | | | | | | | | | | | | | | |
Repurchase Agreements — 1.9% | | | | | | | | | | | | | | | | |
Barclays Capital Inc. repurchase agreement
dated 8/31/15; Proceeds at maturity — $3,000,008; (Fully collateralized by U.S. government obligations, 1.625% due 7/31/19; Market value — $3,060,000)
(Cost — $3,000,000) | | | 0.100 | % | | | 9/1/15 | | | | 3,000,000 | | | | 3,000,000 | |
Total Investments — 130.0% (Cost — $210,861,766#) | | | | | | | | | | | | 203,830,687 | |
Liabilities in Excess of Other Assets — (30.0)% | | | | | | | | | | | | | | | (47,084,823 | ) |
Total Net Assets — 100.0% | | | | | | | | | | | | | | $ | 156,745,864 | |
| * | Non-income producing security. |
| † | Face amount denominated in U.S. dollars, unless otherwise noted. |
| (a) | Security is exempt from registration under Rule 144A of the Securities Act of 1933. This security may be resold in transactions that are exempt from registration, normally to qualified institutional buyers. This security has been deemed liquid pursuant to guidelines approved by the Board of Directors, unless otherwise noted. |
| (b) | All or a portion of this security is pledged as collateral pursuant to the loan agreement (See Note 5). |
| (c) | Payment-in-kind security for which the issuer has the option at each interest payment date of making interest payments in cash or additional debt securities. |
| (d) | Illiquid security (unaudited). |
| (e) | Security is valued in good faith in accordance with procedures approved by the Board of Directors (See Note 1). |
| (f) | Security is exempt from registration under Regulation S of the Securities Act of 1933. Regulation S applies to securities offerings that are made outside of the United States and do not involve direct selling efforts in the United States. This security has been deemed liquid pursuant to guidelines approved by the Board of Directors, unless otherwise noted. |
| (g) | Variable rate security. Interest rate disclosed is as of the most recent information available. |
| (h) | The coupon payment on these securities is currently in default as of August 31, 2015. |
| (i) | Security has no maturity date. The date shown represents the next call date. |
| (j) | Value is less than $1. |
| (k) | All or a portion of this security is held by the counterparty as collateral for open reverse repurchase agreements. |
| (l) | Interest rates disclosed represent the effective rates on senior loans. Ranges in interest rates are attributable to multiple contracts under the same loan. |
| (m) | Senior loans may be considered restricted in that the Fund ordinarily is contractually obligated to receive approval from the agent bank and/or borrower prior to the disposition of a senior loan. |
| # | Aggregate cost for federal income tax purposes is $212,060,547. |
See Notes to Financial Statements.
| | |
| Western Asset Global Partners Income Fund Inc. 2015 Annual Report | | 31 |
Schedule of investments (cont’d)
August 31, 2015
Western Asset Global Partners Income Fund Inc.
| | |
Abbreviations used in this schedule: |
| AUD | | — Australian Dollar |
| BRL | | — Brazilian Real |
| EUR | | — Euro |
| GBP | | — British Pound |
| MXN | | — Mexican Peso |
| | | | |
| Summary of Investments by Country** (unaudited) | | | |
| United States | | | 37.1 | % |
| Mexico | | | 6.7 | |
| Brazil | | | 6.3 | |
| United Kingdom | | | 5.1 | |
| Russia | | | 5.0 | |
| Turkey | | | 4.2 | |
| Indonesia | | | 3.0 | |
| Colombia | | | 2.8 | |
| Luxembourg | | | 2.7 | |
| Peru | | | 2.5 | |
| Chile | | | 1.7 | |
| France | | | 1.4 | |
| India | | | 1.3 | |
| Germany | | | 1.3 | |
| Poland | | | 1.2 | |
| Venezuela | | | 1.2 | |
| China | | | 1.1 | |
| Dominican Republic | | | 1.0 | |
| Hungary | | | 1.0 | |
| Philippines | | | 0.7 | |
| Australia | | | 0.7 | |
| Ireland | | | 0.6 | |
| Canada | | | 0.6 | |
| Argentina | | | 0.6 | |
| Ivory Coast | | | 0.5 | |
| Croatia | | | 0.5 | |
| Malaysia | | | 0.5 | |
| Lithuania | | | 0.5 | |
| Netherlands | | | 0.4 | |
| Morocco | | | 0.4 | |
| Uruguay | | | 0.4 | |
| Ecuador | | | 0.4 | |
| Singapore | | | 0.3 | |
See Notes to Financial Statements.
| | |
| 32 | | Western Asset Global Partners Income Fund Inc. 2015 Annual Report |
Western Asset Global Partners Income Fund Inc.
| | | | |
| Summary of Investments by Country** (unaudited) (cont’d) | | | |
| Jamaica | | | 0.3 | % |
| Switzerland | | | 0.3 | |
| Kenya | | | 0.3 | |
| United Arab Emirates | | | 0.3 | |
| Panama | | | 0.3 | |
| Costa Rica | | | 0.3 | |
| Hong Kong | | | 0.2 | |
| South Africa | | | 0.2 | |
| Trinidad and Tobago | | | 0.2 | |
| Italy | | | 0.2 | |
| Honduras | | | 0.2 | |
| South Korea | | | 0.2 | |
| Gabon | | | 0.2 | |
| Paraguay | | | 0.2 | |
| Pakistan | | | 0.2 | |
| Egypt | | | 0.2 | |
| Vietnam | | | 0.1 | |
| Qatar | | | 0.1 | |
| Zambia | | | 0.1 | |
| Spain | | | 0.1 | |
| Tunisia | | | 0.1 | |
| Bahamas | | | 0.1 | |
| Senegal | | | 0.1 | |
| El Salvador | | | 0.1 | |
| Norway | | | 0.1 | |
| Portugal | | | 0.1 | |
| Short-Term Investments | | | 1.5 | |
| | | | 100.0 | % |
| ** | As a percentage of total investments. Please note that the Fund holdings are as of August 31, 2015 and are subject to change. |
See Notes to Financial Statements.
| | |
| Western Asset Global Partners Income Fund Inc. 2015 Annual Report | | 33 |
Statement of assets and liabilities
August 31, 2015
| | | | |
| |
| Assets: | | | | |
Investments, at value (Cost — $210,861,766) | | $ | 203,830,687 | |
Foreign currency, at value (Cost — $611,549) | | | 593,462 | |
Cash | | | 5,997,192 | |
Interest and dividends receivable | | | 4,138,764 | |
Deposits with brokers for open reverse repurchase agreements | | | 899,000 | |
Receivable for securities sold | | | 604,397 | |
Unrealized appreciation on forward foreign currency contracts | | | 396,565 | |
Deposits with brokers for open futures contracts | | | 353,032 | |
Receivable from broker — variation margin on open futures contracts | | | 29,900 | |
Deposits with brokers for centrally cleared swap contracts | | | 1,392 | |
Prepaid expenses | | | 13,894 | |
Total Assets | | | 216,858,285 | |
| |
| Liabilities: | | | | |
Loan payable (Note 5) | | | 40,000,000 | |
Payable for open reverse repurchase agreements (Note 3) | | | 14,605,654 | |
Payable for securities purchased | | | 4,657,317 | |
Unrealized depreciation on forward foreign currency contracts | | | 334,019 | |
Deposits from brokers for open reverse repurchase agreements | | | 181,000 | |
Investment management fee payable | | | 142,749 | |
Interest payable | | | 64,019 | |
Directors’ fees payable | | | 2,183 | |
Accrued expenses | | | 125,480 | |
Total Liabilities | | | 60,112,421 | |
| Total Net Assets | | $ | 156,745,864 | |
| |
| Net Assets: | | | | |
Par value ($0.001 par value, 15,586,783 shares issued and outstanding; 100,000,000 shares authorized) | | $ | 15,587 | |
Paid-in capital in excess of par value | | | 205,752,281 | |
Undistributed net investment income | | | 1,286,044 | |
Accumulated net realized loss on investments, futures contracts, written options and foreign currency transactions | | | (43,369,536) | |
Net unrealized depreciation on investments, futures contracts and foreign currencies | | | (6,938,512) | |
| Total Net Assets | | $ | 156,745,864 | |
| |
| Shares Outstanding | | | 15,586,783 | |
| |
| Net Asset Value | | | $10.06 | |
See Notes to Financial Statements.
| | |
| 34 | | Western Asset Global Partners Income Fund Inc. 2015 Annual Report |
Statement of operations
For the Year Ended August 31, 2015
| | | | |
| |
| Investment Income: | | | | |
Interest | | $ | 15,617,438 | |
Dividends | | | 195,394 | |
Total Investment Income | | | 15,812,832 | |
| |
| Expenses: | | | | |
Investment management fee (Note 2) | | | 1,794,624 | |
Interest expense (Notes 3 and 5) | | | 505,234 | |
Legal fees | | | 219,343 | |
Audit and tax fees | | | 79,680 | |
Transfer agent fees | | | 67,735 | |
Shareholder reports | | | 31,294 | |
Directors’ fees | | | 29,647 | |
Stock exchange listing fees | | | 21,269 | |
Fund accounting fees | | | 17,368 | |
Commitment fees (Note 5) | | | 12,848 | |
Custody fees | | | 11,116 | |
Insurance | | | 4,312 | |
Miscellaneous expenses | | | 11,092 | |
Total Expenses | | | 2,805,562 | |
| Net Investment Income | | | 13,007,270 | |
| |
Realized and Unrealized Gain (Loss) on Investments, Futures Contracts,
Written Options and Foreign Currency Transactions (Notes 1, 3 and 4): | | | | |
Net Realized Gain (Loss) From: | | | | |
Investment transactions | | | (10,946,450) | |
Futures contracts | | | (874,138) | |
Written options | | | 90,644 | |
Foreign currency transactions | | | 3,309,071 | |
Net Realized Loss | | | (8,420,873) | |
Change in Net Unrealized Appreciation (Depreciation) From: | | | | |
Investments | | | (20,107,955) | |
Futures contracts | | | 110,375 | |
Foreign currencies | | | (231,632) | |
Change in Net Unrealized Appreciation (Depreciation) | | | (20,229,212) | |
| Net Loss on Investments, Futures Contracts, Written Options and Foreign Currency Transactions | | | (28,650,085) | |
| Decrease in Net Assets from Operations | | $ | (15,642,815) | |
See Notes to Financial Statements.
| | |
| Western Asset Global Partners Income Fund Inc. 2015 Annual Report | | 35 |
Statements of changes in net assets
| | | | | | | | |
| For the Years Ended August 31, | | 2015 | | | 2014 | |
| | |
| Operations: | | | | | | | | |
Net investment income | | $ | 13,007,270 | | | $ | 13,998,614 | |
Net realized loss | | | (8,420,873) | | | | (1,160,559) | |
Change in net unrealized appreciation (depreciation) | | | (20,229,212) | | | | 10,691,611 | |
Increase (Decrease) in Net Assets from Operations | | | (15,642,815) | | | | 23,529,666 | |
| | |
| Distributions to Shareholders From (Note 1): | | | | | | | | |
Net investment income | | | (13,560,502) | | | | (13,551,345) | |
Return of capital | | | — | | | | (1,411,969) | |
Decrease in Net Assets from Distributions to Shareholders | | | (13,560,502) | | | | (14,963,314) | |
Increase (Decrease) in Net Assets | | | (29,203,317) | | | | 8,566,352 | |
| | |
| Net Assets: | | | | | | | | |
Beginning of year | | | 185,949,181 | | | | 177,382,829 | |
End of year* | | $ | 156,745,864 | | | $ | 185,949,181 | |
*Includesundistributed (overdistributed) net investment income, respectively, of: | | | $1,286,044 | | | | $(454,764) | |
See Notes to Financial Statements.
| | |
| 36 | | Western Asset Global Partners Income Fund Inc. 2015 Annual Report |
Statement of cash flows
For the Year Ended August 31, 2015
| | | | |
| |
| Increase (Decrease) in Cash: | | | | |
| Cash Provided (Used) by Operating Activities: | | | | |
Net decrease in net assets resulting from operations | | $ | (15,642,815) | |
Adjustments to reconcile net decrease in net assets resulting from operations to net cash provided (used) by operating activities: | | | | |
Purchases of portfolio securities | | | (99,200,266) | |
Sales of portfolio securities | | | 101,355,934 | |
Net purchases, sales and maturities of short-term investments | | | (3,000,000) | |
Payment-in-kind | | | (234,496) | |
Net amortization of premium (accretion of discount) | | | 538,034 | |
Increase in receivable for securities sold | | | (604,397) | |
Decrease in interest and dividends receivable | | | 166,214 | |
Increase in receivable from broker — variation margin on open futures contracts | | | (21,775) | |
Decrease in prepaid expenses | | | 1,005 | |
Increase in deposits with brokers for open futures contracts | | | (46,017) | |
Increase in deposits with brokers for open reverse repurchase agreements | | | (899,000) | |
Increase in deposits with brokers for centrally cleared swap contracts | | | (1,392) | |
Increase in payable for securities purchased | | | 4,556,417 | |
Decrease in investment management fee payable | | | (21,907) | |
Increase in Directors’ fees payable | | | 555 | |
Increase in interest payable | | | 33,034 | |
Increase in deposits from brokers for open reverse repurchase agreements | | | 181,000 | |
Decrease in accrued expenses | | | (6,348) | |
Net realized loss on investments | | | 10,946,450 | |
Change in unrealized depreciation of investments and forward foreign currency transactions | | | 20,334,903 | |
Net Cash Provided by Operating Activities* | | | 18,435,133 | |
| |
| Cash Flows from Financing Activities: | | | | |
Distributions paid on common stock | | | (13,560,502) | |
Increase in loan payable | | | 1,000,000 | |
Decrease in payable for reverse repurchase agreements | | | (8,956) | |
Net Cash Used in Financing Activities | | | (12,569,458) | |
| Net Increase in Cash | | | 5,865,675 | |
Cash at Beginning of Year | | | 724,979 | |
Cash at End of Year | | $ | 6,590,654 | |
| * | Included in operating expenses is cash of $479,131 paid for interest and commitment fees on borrowings. |
See Notes to Financial Statements.
| | |
| Western Asset Global Partners Income Fund Inc. 2015 Annual Report | | 37 |
Financial highlights
| | | | | | | | | | | | | | | | | | | | |
| For a share of capital stock outstanding throughout each year ended August 31: | |
| | | 20151 | | | 20141 | | | 20131 | | | 2012 | | | 2011 | |
| | | | | |
| Net asset value, beginning of year | | | $11.93 | | | | $11.38 | | | | $12.11 | | | | $11.59 | | | | $11.62 | |
| | | | | |
| Income (loss) from operations: | | | | | | | | | | | | | | | | | | | | |
Net investment income | | | 0.83 | | | | 0.90 | | | | 0.98 | | | | 1.07 | | | | 1.10 | |
Net realized and unrealized gain (loss) | | | (1.83) | | | | 0.61 | | | | (0.60) | | | | 0.59 | | | | 0.01 | |
Total income (loss) from operations | | | (1.00) | | | | 1.51 | | | | 0.38 | | | | 1.66 | | | | 1.11 | |
| | | | | |
| Less distributions from: | | | | | | | | | | | | | | | | | | | | |
Net investment income | | | (0.87) | | | | (0.87) | | | | (1.11) | | | | (1.14) | | | | (1.14) | |
Return of capital | | | — | | | | (0.09) | | | | — | | | | — | | | | — | |
Total distributions | | | (0.87) | | | | (0.96) | | | | (1.11) | | | | (1.14) | | | | (1.14) | |
| | | | | |
| Net asset value, end of year | | | $10.06 | | | | $11.93 | | | | $11.38 | | | | $12.11 | | | | $11.59 | |
| | | | | |
| Market price, end of year | | | $8.29 | | | | $11.08 | | | | $10.61 | | | | $13.63 | | | | $12.19 | |
Total return, based on NAV2,3 | | | (8.64) | % | | | 13.73 | % | | | 2.87 | % | | | 15.33 | % | | | 9.64 | % |
Total return, based on Market Price4 | | | (18.10) | % | | | 13.82 | % | | | (14.79) | % | | | 23.03 | % | | | 6.58 | % |
| | | | | |
| Net assets, end of year (000s) | | | $156,746 | | | | $185,949 | | | | $177,383 | | | | $188,080 | | | | $179,301 | |
| | | | | |
| Ratios to average net assets: | | | | | | | | | | | | | | | | | | | | |
Gross expenses | | | 1.65 | % | | | 1.50 | % | | | 1.48 | % | | | 1.53 | % | | | 1.66 | % |
Net expenses | | | 1.65 | | | | 1.50 | | | | 1.48 | | | | 1.53 | | | | 1.66 | |
Net investment income | | | 7.63 | | | | 7.63 | | | | 7.97 | | | | 9.32 | | | | 9.10 | |
| | | | | |
| Portfolio turnover rate | | | 45 | % | | | 33 | % | | | 39 | % | | | 37 | % | | | 56 | % |
| | | | | |
| Supplemental data: | | | | | | | | | | | | | | | | | | | | |
Loan Outstanding, End of Year (000s) | | | $40,000 | | | | $39,000 | | | | $39,000 | | | | $39,000 | | | | $39,000 | |
Asset Coverage Ratio for Loan Outstanding5 | | | 492 | % | | | 577 | % | | | 555 | % | | | 582 | % | | | 560 | % |
Asset Coverage, per $1,000 Principal Amount of Loan Outstanding5 | | | $4,919 | | | | $5,768 | 6 | | | $5,548 | 6 | | | $5,823 | 6 | | | $5,597 | 6 |
Weighted Average Loan (000s) | | | $42,329 | | | | $39,000 | | | | $39,000 | | | | $39,000 | | | | $34,085 | |
Weighted Average Interest Rate on Loans | | | 0.95 | % | | | 0.87 | % | | | 0.90 | % | | | 0.95 | % | | | 0.94 | % |
| 1 | Per share amounts have been calculated using the average shares method. |
| 2 | Performance figures may reflect compensating balance arrangements, fee waivers and/or expense reimbursements. In the absence of compensating balance arrangements, fee waivers and/or expense reimbursements, the total return would have been lower. Past performance is no guarantee of future results. |
| 3 | The total return calculation assumes that distributions are reinvested at NAV. Past performance is no guarantee of future results. |
| 4 | The total return calculation assumes that distributions are reinvested in accordance with the Fund’s dividend reinvestment plan. Past performance is no guarantee of future results. |
| 5 | Represents value of net assets plus the loan outstanding at the end of the year divided by the loan outstanding at the end of the year. |
| 6 | Added to conform to current period presentation. |
See Notes to Financial Statements.
| | |
| 38 | | Western Asset Global Partners Income Fund Inc. 2015 Annual Report |
Notes to financial statements
1. Organization and significant accounting policies
Western Asset Global Partners Income Fund Inc. (the “Fund”) was incorporated in Maryland on September 3, 1993 and is registered as a non-diversified, closed-end management investment company under the Investment Company Act of 1940, as amended (the “1940 Act”). The Fund seeks to maintain a high level of current income. As a secondary objective, the Fund seeks capital appreciation. Under normal market conditions, the Fund will invest at least 33% of its total assets in securities of issuers that are, or are incorporated in or generate the majority of their revenue in, emerging market countries and at least 33% of its total assets in high-yield U.S. corporate debt securities. The Fund may also invest up to 33% of its total assets in a broad range of other U.S. and non-U.S. fixed-income securities, both investment grade and high-yield securities.
The following are significant accounting policies consistently followed by the Fund and are in conformity with U.S. generally accepted accounting principles (“GAAP”). Estimates and assumptions are required to be made regarding assets, liabilities and changes in net assets resulting from operations when financial statements are prepared. Changes in the economic environment, financial markets and any other parameters used in determining these estimates could cause actual results to differ. Subsequent events have been evaluated through the date the financial statements were issued.
(a) Investment valuation. The valuations for fixed income securities (which may include, but are not limited to, corporate, government, municipal, mortgage-backed, collateralized mortgage obligations and asset-backed securities) and certain derivative instruments are typically the prices supplied by independent third party pricing services, which may use market prices or broker/dealer quotations or a variety of valuation techniques and methodologies. The independent third party pricing services use inputs that are observable such as issuer details, interest rates, yield curves, prepayment speeds, credit risks/spreads, default rates and quoted prices for similar securities. Short-term fixed income securities that will mature in 60 days or less are valued at amortized cost, unless it is determined that using this method would not reflect an investment’s fair value. Futures contracts are valued daily at the settlement price established by the board of trade or exchange on which they are traded. Equity securities for which market quotations are available are valued at the last reported sales price or official closing price on the primary market or exchange on which they trade. When the Fund holds securities or other assets that are denominated in a foreign currency, the Fund will normally use the currency exchange rates as of 4:00 p.m. (Eastern Time). If independent third party pricing services are unable to supply prices for a portfolio investment, or if the prices supplied are deemed by the manager to be unreliable, the market price may be determined by the manager using quotations from one or more broker/dealers or at the transaction price if the security has recently been purchased and no value has yet been obtained from a pricing service or pricing broker. When reliable prices are not readily available, such as when the value of a security has been significantly affected by events after the close of the exchange or market on which the security is principally traded, but before the Fund calculates its net asset value, the Fund values these securities as determined in accordance with procedures approved by the Fund’s Board of Directors.
| | |
| Western Asset Global Partners Income Fund Inc. 2015 Annual Report | | 39 |
Notes to financial statements (cont’d)
The Board of Directors is responsible for the valuation process and has delegated the supervision of the daily valuation process to the Legg Mason North Atlantic Fund Valuation Committee (formerly, Legg Mason North American Fund Valuation Committee) (the “Valuation Committee”). The Valuation Committee, pursuant to the policies adopted by the Board of Directors, is responsible for making fair value determinations, evaluating the effectiveness of the Fund’s pricing policies, and reporting to the Board of Directors. When determining the reliability of third party pricing information for investments owned by the Fund, the Valuation Committee, among other things, conducts due diligence reviews of pricing vendors, monitors the daily change in prices and reviews transactions among market participants.
The Valuation Committee will consider pricing methodologies it deems relevant and appropriate when making fair value determinations. Examples of possible methodologies include, but are not limited to, multiple of earnings; discount from market of a similar freely traded security; discounted cash-flow analysis; book value or a multiple thereof; risk premium/yield analysis; yield to maturity; and/or fundamental investment analysis. The Valuation Committee will also consider factors it deems relevant and appropriate in light of the facts and circumstances. Examples of possible factors include, but are not limited to, the type of security; the issuer’s financial statements; the purchase price of the security; the discount from market value of unrestricted securities of the same class at the time of purchase; analysts’ research and observations from financial institutions; information regarding any transactions or offers with respect to the security; the existence of merger proposals or tender offers affecting the security; the price and extent of public trading in similar securities of the issuer or comparable companies; and the existence of a shelf registration for restricted securities.
For each portfolio security that has been fair valued pursuant to the policies adopted by the Board of Directors, the fair value price is compared against the last available and next available market quotations. The Valuation Committee reviews the results of such back testing monthly and fair valuation occurrences are reported to the Board of Directors quarterly.
The Fund uses valuation techniques to measure fair value that are consistent with the market approach and/or income approach, depending on the type of security and the particular circumstance. The market approach uses prices and other relevant information generated by market transactions involving identical or comparable securities. The income approach uses valuation techniques to discount estimated future cash flows to present value.
GAAP establishes a disclosure hierarchy that categorizes the inputs to valuation techniques used to value assets and liabilities at measurement date. These inputs are summarized in the three broad levels listed below:
| • | | Level 1 — quoted prices in active markets for identical investments |
| • | | Level 2 — other significant observable inputs (including quoted prices for similar investments, interest rates, prepayment speeds, credit risk, etc.) |
| | |
| 40 | | Western Asset Global Partners Income Fund Inc. 2015 Annual Report |
| • | | Level 3 — significant unobservable inputs (including the Fund’s own assumptions in determining the fair value of investments) |
The inputs or methodologies used to value securities are not necessarily an indication of the risk associated with investing in those securities.
The following is a summary of the inputs used in valuing the Fund’s assets and liabilities carried at fair value:
| | | | | | | | | | | | | | | | |
| ASSETS | |
| Description | | Quoted Prices
(Level 1) | | | Other Significant
Observable Inputs (Level 2) | | | Significant
Unobservable
Inputs
(Level 3) | | | Total | |
| Long-term investments†: | | | | | | | | | | | | | | | | |
Corporate bonds & notes: | | | | | | | | | | | | | | | | |
Consumer discretionary | | | — | | | $ | 17,281,837 | | | $ | 254,205 | | | $ | 17,536,042 | |
Materials | | | — | | | | 20,996,798 | | | | 0 | * | | | 20,996,798 | |
Utilities | | | — | | | | 5,718,659 | | | | 483,494 | | | | 6,202,153 | |
Other corporate bonds & notes | | | — | | | | 95,512,291 | | | | — | | | | 95,512,291 | |
Convertible bonds & notes | | | — | | | | 469,218 | | | | — | | | | 469,218 | |
Senior loans: | | | | | | | | | | | | | | | | |
Consumer discretionary | | | — | | | | 473,491 | | | | 233,450 | | | | 706,941 | |
Energy | | | — | | | | — | | | | 160,153 | | | | 160,153 | |
Materials | | | — | | | | 16,241 | | | | 341,695 | | | | 357,936 | |
Utilities | | | — | | | | — | | | | 250,273 | | | | 250,273 | |
Other senior loans | | | — | | | | 871,110 | | | | — | | | | 871,110 | |
Sovereign bonds | | | — | | | | 51,528,622 | | | | — | | | | 51,528,622 | |
Common stocks: | | | | | | | | | | | | | | | | |
Consumer discretionary | | $ | 262,337 | | | | — | | | | 0 | * | | | 262,337 | |
Energy | | | — | | | | — | | | | 706,037 | | | | 706,037 | |
Financials | | | 3,053,445 | | | | — | | | | — | | | | 3,053,445 | |
Health care | | | — | | | | — | | | | 290,500 | | | | 290,500 | |
Industrials | | | 259,144 | | | | — | | | | 168,479 | | | | 427,623 | |
Materials | | | — | | | | — | | | | 49,437 | | | | 49,437 | |
Convertible preferred stocks | | | — | | | | 136,062 | | | | — | | | | 136,062 | |
Preferred stocks | | | 1,121,099 | | | | — | | | | — | | | | 1,121,099 | |
Warrants | | | — | | | | 91,250 | | | | 101,360 | | | | 192,610 | |
| Total long-term investments | | $ | 4,696,025 | | | $ | 193,095,579 | | | $ | 3,039,083 | | | $ | 200,830,687 | |
| Short-term investments† | | | — | | | | 3,000,000 | | | | — | | | | 3,000,000 | |
| Total investments | | $ | 4,696,025 | | | $ | 196,095,579 | | | $ | 3,039,083 | | | $ | 203,830,687 | |
| Other financial instruments: | | | | | | | | | | | | | | | | |
Futures contracts | | $ | 53,773 | | | | — | | | | — | | | $ | 53,773 | |
Forward foreign currency contracts | | | — | | | $ | 396,565 | | | | — | | | | 396,565 | |
| Total other financial instruments | | $ | 53,773 | | | $ | 396,565 | | | | — | | | $ | 450,338 | |
| Total | | $ | 4,749,798 | | | $ | 196,492,144 | | | $ | 3,039,083 | | | $ | 204,281,025 | |
| | |
| Western Asset Global Partners Income Fund Inc. 2015 Annual Report | | 41 |
Notes to financial statements (cont’d)
| | | | | | | | | | | | | | | | |
| LIABILITIES | |
| Description | | Quoted Prices
(Level 1) | | | Other Significant
Observable Inputs (Level 2) | | | Significant
Unobservable
Inputs (Level 3) | | | Total | |
| Other financial instruments: | | | | | | | | | | | | | | | | |
Forward foreign currency contracts | | | — | | | $ | 334,019 | | | | — | | | $ | 334,019 | |
| † | See Schedule of Investments for additional detailed categorizations. |
| * | Amount represents less than $1. |
The Fund’s policy is to recognize transfers between levels as of the end of reporting period. At August 31, 2015, securities valued at $136,062 were transferred from Level 1 to Level 2 within the fair value hierarchy because of the unavailability of a quoted price in an active market for an identical investment.
The following is a reconciliation of investments in which significant unobservable inputs (Level 3) were used in determining fair value:
| | | | | | | | | | | | |
| | | Corporate Bond & Notes | |
| Investments in Securities | | Consumer
Discretionary | | | Materials | | | Utilities | |
| Balance as of August 31, 2014 | | $ | 427,333 | | | | — | | | $ | 0 | * |
| Accrued premiums/discounts | | | 6,200 | | | | — | | | | — | |
| Realized gain (loss)1 | | | 4 | | | | — | | | | (154,270) | |
| Change in unrealized appreciation (depreciation)2 | | | (8,236) | | | | — | | | | 155,880 | |
| Purchases | | | 55,919 | | | $ | 0 | * | | | — | |
| Sales | | | (227,015) | | | | — | | | | (1,610) | |
| Transfers into Level 33 | | | — | | | | — | | | | 483,494 | |
| Transfers out of Level 3 | | | — | | | | — | | | | — | |
| Balance as of August 31, 2015 | | $ | 254,205 | | | $ | 0 | * | | $ | 483,494 | |
| Net change in unrealized appreciation (depreciation) for investments in securities still held at August 31, 20152 | | $ | (10,187) | | | | — | | | | — | |
| | | | |
| | | Convertible
Bonds & Notes | |
| Investments in Securities (cont’d) | | Materials | |
| Balance as of August 31, 2014 | | $ | 292,000 | |
| Accrued premiums/discounts | | | — | |
| Realized gain (loss) | | | — | |
| Change in unrealized appreciation (depreciation)2 | | | (96,119) | |
| Purchases | | | 28,399 | |
| Sales | | | — | |
| Transfers into Level 3 | | | — | |
| Transfers out of Level 34 | | | (224,280) | |
| Balance as of August 31, 2015 | | | — | |
Net change in unrealized appreciation (depreciation) for investments in
securities still held at August 31, 20152 | | | — | |
| | |
| 42 | | Western Asset Global Partners Income Fund Inc. 2015 Annual Report |
| | | | | | | | | | | | | | | | |
| | | Senior Loans | |
| Investments in Securities (cont’d) | | Consumer
Discretionary | | | Energy | | | Materials | | | Utilities | |
| Balance as of August 31, 2014 | | | — | | | | — | | | | — | | | | — | |
| Accrued premiums/discounts | | $ | 24 | | | $ | 505 | | | | — | | | $ | 242 | |
| Realized gain (loss)1 | | | — | | | | 1,194 | | | | — | | | | 13 | |
| Change in unrealized appreciation (depreciation)2 | | | 4,576 | | | | (13,743) | | | | — | | | | (4,132) | |
| Purchases | | | 228,850 | | | | 224,250 | | | | — | | | | 254,800 | |
| Sales | | | — | | | | (52,053) | | | | — | | | | (650) | |
| Transfers into Level 33 | | | — | | | | — | | | $ | 341,695 | | | | — | |
| Transfers out of Level 3 | | | — | | | | — | | | | — | | | | — | |
| Balance as of August 31, 2015 | | $ | 233,450 | | | $ | 160,153 | | | $ | 341,695 | | | $ | 250,273 | |
| Net change in unrealized appreciation (depreciation) for investments in securities still held at August 31, 20152 | | $ | 4,576 | | | $ | (13,743) | | | | — | | | $ | (4,132) | |
| | | | | | | | | | | | | | | | | | | | | | | | | | | | |
| | | Common Stocks | | | Warrants | | | | |
| Investments in Securities (cont’d) | | Consumer
Discretionary | | | Energy | | | Health Care | | | Industrials | | | Materials | | | | | | Total | |
| Balance as of August 31, 2014 | | $ | 38,388 | | | $ | 717,109 | | | $ | 168,000 | | | $ | 740,932 | | | | — | | | | — | | | $ | 2,383,762 | |
| Accrued premiums/discounts | | | — | | | | | | | | — | | | | — | | | | — | | | | — | | | | 6,971 | |
| Realized gain (loss) | | | — | | | | — | | | | — | | | | — | | | | — | | | | — | | | | (153,059) | |
| Change in unrealized appreciation (depreciation)2 | | | (38,388) | | | | (11,072) | | | | 122,500 | | | | (572,453) | | | | — | | | | — | | | | (461,187) | |
| Purchases | | | — | | | | — | | | | — | | | | — | | | | — | | | | — | | | | 792,218 | |
| Sales | | | — | | | | — | | | | — | | | | — | | | | — | | | | — | | | | (281,328) | |
| Transfers into Level 33 | | | — | | | | — | | | | — | | | | — | | | $ | 49,437 | | | $ | 101,360 | | | | 975,986 | |
| Transfers out of Level 3 | | | — | | | | — | | | | — | | | | — | | | | — | | | | — | | | | (224,280) | |
| Balance as of August 31, 2015 | | $ | 0 | * | | $ | 706,037 | | | $ | 290,500 | | | $ | 168,479 | | | $ | 49,437 | | | $ | 101,360 | | | $ | 3,039,083 | |
| Net change in unrealized appreciation (depreciation) for investments in securities still held at August 31, 20152 | | $ | (38,388) | | | $ | (11,072) | | | $ | 122,500 | | | $ | (572,453) | | | | — | | | | — | | | $ | (522,899) | |
The Fund’s policy is to recognize transfers between levels as of the end of the reporting period.
| * | Amount represents less than $1. |
| 1 | This amount is included in net realized gain (loss) from investment transactions in the accompanying Statement of Operations. |
| 2 | This amount is included in the change in net unrealized appreciation (depreciation) in the accompanying Statement of Operations. Change in unrealized appreciation (depreciation) includes net unrealized appreciation (depreciation) resulting from changes in investment values during the reporting period and the reversal of previously recorded unrealized appreciation (depreciation) when gains or losses are realized. |
| 3 | Transferred into Level 3 as a result of the unavailability of a quoted price in an active market for an identical investment or the unavailability of other significant observable inputs. |
| 4 | Transferred out of Level 3 as a result of the availability of a quoted price in an active market for an identical investment or the availability of other significant observable inputs. |
(b) Repurchase agreements. The Fund may enter into repurchase agreements with institutions that its subadviser has determined are creditworthy. Each repurchase agreement is recorded at cost. Under the terms of a typical repurchase agreement, the Fund acquires a debt security subject to an obligation of the seller to repurchase, and of the Fund
| | |
| Western Asset Global Partners Income Fund Inc. 2015 Annual Report | | 43 |
Notes to financial statements (cont’d)
to resell, the security at an agreed-upon price and time, thereby determining the yield during the Fund’s holding period. When entering into repurchase agreements, it is the Fund’s policy that its custodian or a third party custodian, acting on the Fund’s behalf, take possession of the underlying collateral securities, the market value of which, at all times, at least equals the principal amount of the repurchase transaction, including accrued interest. To the extent that any repurchase transaction maturity exceeds one business day, the value of the collateral is marked-to-market and measured against the value of the agreement in an effort to ensure the adequacy of the collateral. If the counterparty defaults, the Fund generally has the right to use the collateral to satisfy the terms of the repurchase transaction. However, if the market value of the collateral declines during the period in which the Fund seeks to assert its rights or if bankruptcy proceedings are commenced with respect to the seller of the security, realization of the collateral by the Fund may be delayed or limited.
(c) Reverse repurchase agreements. The Fund may enter into reverse repurchase agreements. Under the terms of a typical reverse repurchase agreement, a fund sells a security subject to an obligation to repurchase the security from the buyer at an agreed-upon time and price. In the event the buyer of securities under a reverse repurchase agreement files for bankruptcy or becomes insolvent, the Fund’s use of the proceeds of the agreement may be restricted pending a determination by the counterparty, or its trustee or receiver, whether to enforce the Fund’s obligation to repurchase the securities. In entering into reverse repurchase agreements, the Fund will maintain cash, U.S. government securities or other liquid debt obligations at least equal in value to its obligations with respect to reverse repurchase agreements or will take other actions permitted by law to cover its obligations. If the market value of the collateral declines during the period, the Fund may be required to post additional collateral to cover its obligation. Cash collateral that has been pledged to cover obligations of the Fund under reverse repurchase agreements, if any, will be reported separately in the Statement of Assets and Liabilities. Securities pledged as collateral are noted in the Schedule of Investments. Interest payments made on reverse repurchase agreements are recognized as a component of “Interest expense” on the Statement of Operations. In periods of increased demand for the security, the Fund may receive a fee for use of the security by the counterparty, which may result in interest income to the Fund.
(d) Futures contracts. The Fund uses futures contracts generally to gain exposure to, or hedge against, changes in interest rates or gain exposure to, or hedge against, changes in certain asset classes. A futures contract represents a commitment for the future purchase or sale of an asset at a specified price on a specified date.
Upon entering into a futures contract, the Fund is required to deposit cash or cash equivalents with a broker in an amount equal to a certain percentage of the contract amount. This is known as the ‘‘initial margin’’ and subsequent payments (‘‘variation margin’’) are made or received by the Fund each day, depending on the daily fluctuation in the value of the contract. For certain futures, including foreign denominated futures,
| | |
| 44 | | Western Asset Global Partners Income Fund Inc. 2015 Annual Report |
variation margin is not settled daily, but is recorded as a net variation margin payable or receivable. The daily changes in contract value are recorded as unrealized gains or losses in the Statement of Operations and the Fund recognizes a realized gain or loss when the contract is closed.
Futures contracts involve, to varying degrees, risk of loss in excess of the amounts reflected in the financial statements. In addition, there is the risk that the Fund may not be able to enter into a closing transaction because of an illiquid secondary market.
(e) Written options. When the Fund writes an option, an amount equal to the premium received by the Fund is recorded as a liability, the value of which is marked-to-market daily to reflect the current market value of the option written. If the option expires, the premium received is recorded as a realized gain. When a written call option is exercised, the difference between the premium received plus the option exercise price and the Fund’s basis in the underlying security (in the case of a covered written call option), or the cost to purchase the underlying security (in the case of an uncovered written call option), including brokerage commission, is recognized as a realized gain or loss. When a written put option is exercised, the amount of the premium received is subtracted from the cost of the security purchased by the Fund from the exercise of the written put option to form the Fund’s basis in the underlying security purchased. The writer or buyer of an option traded on an exchange can liquidate the position before the exercise of the option by entering into a closing transaction. The cost of a closing transaction is deducted from the original premium received resulting in a realized gain or loss to the Fund.
The risk in writing a covered call option is that the Fund may forego the opportunity of profit if the market price of the underlying security increases and the option is exercised. The risk in writing a put option is that the Fund may incur a loss if the market price of the underlying security decreases and the option is exercised. The risk in writing an uncovered call option is that the Fund is exposed to the risk of loss if the market price of the underlying security increases. In addition, there is the risk that the Fund may not be able to enter into a closing transaction because of an illiquid secondary market.
(f) Loan participations. The Fund may invest in loans arranged through private negotiation between one or more financial institutions. The Fund’s investment in any such loan may be in the form of a participation in or an assignment of the loan. In connection with purchasing participations, the Fund generally will have no right to enforce compliance by the borrower with the terms of the loan agreement related to the loan, or any rights of off-set against the borrower and the Fund may not benefit directly from any collateral supporting the loan in which it has purchased the participation.
The Fund assumes the credit risk of the borrower, the lender that is selling the participation and any other persons interpositioned between the Fund and the borrower. In the event of the insolvency of the lender selling the participation, the Fund may be treated as a general creditor of the lender and may not benefit from any off-set between the lender and the borrower.
| | |
| Western Asset Global Partners Income Fund Inc. 2015 Annual Report | | 45 |
Notes to financial statements (cont’d)
(g) Forward foreign currency contracts. The Fund enters into a forward foreign currency contract to hedge against foreign currency exchange rate risk on its non-U.S. dollar denominated securities or to facilitate settlement of a foreign currency denominated portfolio transaction. A forward foreign currency contract is an agreement between two parties to buy and sell a currency at a set price with delivery and settlement at a future date. The contract is marked-to-market daily and the change in value is recorded by the Fund as an unrealized gain or loss. When a forward foreign currency contract is closed, through either delivery or offset by entering into another forward foreign currency contract, the Fund recognizes a realized gain or loss equal to the difference between the value of the contract at the time it was opened and the value of the contract at the time it is closed.
Forward foreign currency contracts involve elements of market risk in excess of the amounts reflected on the Statement of Assets and Liabilities. The Fund bears the risk of an unfavorable change in the foreign exchange rate underlying the forward foreign currency contract. Risks may also arise upon entering into these contracts from the potential inability of the counterparties to meet the terms of their contracts.
(h) Foreign currency translation. Investment securities and other assets and liabilities denominated in foreign currencies are translated into U.S. dollar amounts based upon prevailing exchange rates on the date of valuation. Purchases and sales of investment securities and income and expense items denominated in foreign currencies are translated into U.S. dollar amounts based upon prevailing exchange rates on the respective dates of such transactions.
The Fund does not isolate that portion of the results of operations resulting from fluctuations in foreign exchange rates on investments from the fluctuations arising from changes in market prices of securities held. Such fluctuations are included with the net realized and unrealized gain or loss on investments.
Net realized foreign exchange gains or losses arise from sales of foreign currencies, including gains and losses on forward foreign currency contracts, currency gains or losses realized between the trade and settlement dates on securities transactions, and the difference between the amounts of dividends, interest, and foreign withholding taxes recorded on the Fund’s books and the U.S. dollar equivalent of the amounts actually received or paid. Net unrealized foreign exchange gains and losses arise from changes in the values of assets and liabilities, other than investments in securities, on the date of valuation, resulting from changes in exchange rates.
Foreign security and currency transactions may involve certain considerations and risks not typically associated with those of U.S. dollar denominated transactions as a result of, among other factors, the possibility of lower levels of governmental supervision and regulation of foreign securities markets and the possibility of political or economic instability.
(i) Cash flow information. The Fund invests in securities and distributes dividends from net investment income and net realized gains, which are paid in cash and may be reinvested
| | |
| 46 | | Western Asset Global Partners Income Fund Inc. 2015 Annual Report |
at the discretion of shareholders. These activities are reported in the Statement of Changes in Net Assets and additional information on cash receipts and cash payments are presented in the Statement of Cash Flows.
(j) Credit and market risk. The Fund invests in high-yield and emerging market instruments that are subject to certain credit and market risks. The yields of high-yield and emerging market debt obligations reflect, among other things, perceived credit and market risks. The Fund’s investments in securities rated below investment grade typically involve risks not associated with higher rated securities including, among others, greater risk related to timely and ultimate payment of interest and principal, greater market price volatility and less liquid secondary market trading. The consequences of political, social, economic or diplomatic changes may have disruptive effects on the market prices of investments held by the Fund. The Fund’s investments in non-U.S. dollar denominated securities may also result in foreign currency losses caused by devaluations and exchange rate fluctuations.
(k) Foreign investment risks. The Fund’s investments in foreign securities may involve risks not present in domestic investments. Since securities may be denominated in foreign currencies, may require settlement in foreign currencies or pay interest or dividends in foreign currencies, changes in the relationship of these foreign currencies to the U.S. dollar can significantly affect the value of the investments and earnings of the Fund. Foreign investments may also subject the Fund to foreign government exchange restrictions, expropriation, taxation or other political, social or economic developments, all of which affect the market and/or credit risk of the investments.
(l) Counterparty risk and credit-risk-related contingent features of derivative instruments. The Fund may invest in certain securities or engage in other transactions, where the Fund is exposed to counterparty credit risk in addition to broader market risks. The Fund may invest in securities of issuers, which may also be considered counterparties as trading partners in other transactions. This may increase the risk of loss in the event of default or bankruptcy by the counterparty or if the counterparty otherwise fails to meet its contractual obligations. The Fund’s investment manager attempts to mitigate counterparty risk by (i) periodically assessing the creditworthiness of its trading partners, (ii) monitoring and/or limiting the amount of its net exposure to each individual counterparty based on its assessment and (iii) requiring collateral from the counterparty for certain transactions. Market events and changes in overall economic conditions may impact the assessment of such counterparty risk by the investment manager. In addition, declines in the values of underlying collateral received may expose the Fund to increased risk of loss.
The Fund has entered into master agreements with certain of its derivative counterparties that provide for general obligations, representations, agreements, collateral, events of default or termination and credit related contingent features. The credit related contingent features include, but are not limited to, a percentage decrease in the Fund’s net assets or NAV over a specified period of time. If these credit related contingent features were triggered, the derivatives counterparty could terminate the positions and demand payment or require additional collateral.
| | |
| Western Asset Global Partners Income Fund Inc. 2015 Annual Report | | 47 |
Notes to financial statements (cont’d)
Collateral requirements differ by type of derivative. Collateral or margin requirements are set by the broker or exchange clearinghouse for exchange traded derivatives while collateral terms are contract specific for over-the-counter traded derivatives. Cash collateral that has been pledged to cover obligations of the Fund under derivative contracts, if any, will be reported separately in the Statement of Assets and Liabilities. Securities pledged as collateral, if any, for the same purpose are noted in the Schedule of Investments.
Absent an event of default by the counterparty or a termination of the agreement, the terms of the master agreements do not result in an offset of reported amounts of financial assets and financial liabilities in the Statement of Assets and Liabilities across transactions between the Fund and the applicable counterparty. The enforceability of the right to offset may vary by jurisdiction.
As of August 31, 2015, the Fund held forward foreign currency contracts with credit related contingent features which had a liability position of $334,019. If a contingent feature in the master agreements would have been triggered, the Fund would have been required to pay this amount to its derivatives counterparties.
(m) Security transactions and investment income. Security transactions are accounted for on a trade date basis. Interest income, adjusted for amortization of premium and accretion of discount, is recorded on the accrual basis. Dividend income is recorded on the ex-dividend date. Foreign dividend income is recorded on the ex-dividend date or as soon as practicable after the Fund determines the existence of a dividend declaration after exercising reasonable due diligence. The cost of investments sold is determined by use of the specific identification method. To the extent any issuer defaults or a credit event occurs that impacts the issuer, the Fund may halt any additional interest income accruals and consider the realizability of interest accrued up to the date of default or credit event.
(n) Distributions to shareholders. Distributions from net investment income of the Fund, if any, are declared quarterly and paid on a monthly basis. Distributions of net realized gains, if any, are declared at least annually. Distributions to shareholders of the Fund are recorded on the ex-dividend date and are determined in accordance with income tax regulations, which may differ from GAAP.
(o) Compensating balance arrangements. The Fund has an arrangement with its custodian bank whereby a portion of the custodian’s fees is paid indirectly by credits earned on the Fund’s cash on deposit with the bank.
(p) Federal and other taxes. It is the Fund’s policy to comply with the federal income and excise tax requirements of the Internal Revenue Code of 1986 (the “Code”), as amended, applicable to regulated investment companies. Accordingly, the Fund intends to distribute its taxable income and net realized gains, if any, to shareholders in accordance with timing requirements imposed by the Code. Therefore, no federal or state income tax provision is required in the Fund’s financial statements.
| | |
| 48 | | Western Asset Global Partners Income Fund Inc. 2015 Annual Report |
Management has analyzed the Fund’s tax positions taken on income tax returns for all open tax years and has concluded that as of August 31, 2015, no provision for income tax is required in the Fund’s financial statements. The Fund’s federal and state income and federal excise tax returns for tax years for which the applicable statutes of limitations have not expired are subject to examination by the Internal Revenue Service and state departments of revenue.
Under the applicable foreign tax laws, a withholding tax may be imposed on interest, dividends and capital gains at various rates.
(q) Reclassification. GAAP requires that certain components of net assets be reclassified to reflect permanent differences between financial and tax reporting. These reclassifications have no effect on net assets or net asset value per share. During the current year, the following reclassifications have been made:
| | | | | | | | |
| | | Undistributed Net
Investment Income | | | Accumulated Net
Realized Loss | |
| (a) | | $ | 2,294,040 | | | $ | (2,294,040) | |
| (a) | Reclassifications are due to foreign currency transactions treated as ordinary income for tax purposes and differences between book and tax amortization of premium on fixed income securities. |
2. Investment management agreement and other transactions with affiliates
Legg Mason Partners Fund Advisor, LLC (“LMPFA”) is the Fund’s investment manager. Western Asset Management Company (“Western Asset”) is the Fund’s subadviser. Western Asset Management Company Pte. Ltd. (“Western Singapore”), Western Asset Management Company Ltd (“Western Japan”) and Western Asset Management Company Limited (“Western Asset Limited”) serve as additional subadvisers to the Fund, under additional subadvisory agreements with Western Asset. LMPFA, Western Asset, Western Singapore, Western Japan and Western Asset Limited are wholly-owned subsidiaries of Legg Mason, Inc. (“Legg Mason”).
LMPFA provides administrative and certain oversight services to the Fund. The Fund pays LMPFA an investment management fee, calculated daily and paid monthly, at an annual rate of 1.05% of the Fund’s average weekly net assets.
LMPFA delegates to Western Asset the day-to-day portfolio management of the Fund. Western Singapore, Western Japan and Western Asset Limited provide certain subadvisory services to the Fund relating to currency transactions and investments in non-U.S. dollar denominated debt securities. Western Singapore, Western Japan and Western Asset Limited do not receive any compensation from the Fund and are paid by Western Asset for their services to the Fund. For its services, LMPFA pays Western Asset 70% of the net management fee it receives from the Fund. In turn, Western asset pays Western Singapore, Western Japan and Western Asset Limited a subadvisory fee of 0.30% on the assets managed by each subadviser.
All officers and one Director of the Fund are employees of Legg Mason or its affiliates and do not receive compensation from the Fund.
| | |
| Western Asset Global Partners Income Fund Inc. 2015 Annual Report | | 49 |
Notes to financial statements (cont’d)
3. Investments
During the year ended August 31, 2015, the aggregate cost of purchases and proceeds from sales of investments (excluding short-term investments) were as follows:
| | | | |
| Purchases | | $ | 99,200,266 | |
| Sales | | | 101,355,934 | |
At August 31, 2015, the aggregate gross unrealized appreciation and depreciation of investments for federal income tax purposes were as follows:
| | | | |
| Gross unrealized appreciation | | $ | 8,499,874 | |
| Gross unrealized depreciation | | | (16,729,734) | |
| Net unrealized depreciation | | $ | (8,229,860) | |
At August 31, 2015, the Fund had the following open futures contracts:
| | | | | | | | | | | | | | | | | | | | |
| | | Number of
Contracts | | | Expiration
Date | | | Basis Value | | | Market Value | | | Unrealized
Appreciation | |
| Contracts to Buy: | | | | | | | | | | | | | | | | | | | | |
| Euro | | | 23 | | | | 9/15 | | | $ | 3,215,050 | | | $ | 3,231,213 | | | $ | 16,163 | |
| Contracts to Sell: | | | | | | | | | | | | | | | | | | | | |
| U.S. Treasury 5-Year Notes | | | 115 | | | | 12/15 | | | | 13,772,923 | | | | 13,735,313 | | | | 37,610 | |
| Net unrealized appreciation on open futures contracts | | | $ | 53,773 | |
During the year ended August 31, 2015, written option transactions for the Fund were as follows:
| | | | | | | | |
| | | Number of
Contracts | | | Premiums | |
| Written options, outstanding as of August 31, 2014 | | | — | | | | — | |
| Options written | | | 49 | | | $ | 91,716 | |
| Options closed | | | (49) | | | | (91,716) | |
| Options exercised | | | — | | | | — | |
| Options expired | | | — | | | | — | |
| Written options, outstanding as of August 31, 2015 | | | — | | | | — | |
| | |
| 50 | | Western Asset Global Partners Income Fund Inc. 2015 Annual Report |
At August 31, 2015, the Fund had the following open forward foreign currency contracts:
| | | | | | | | | | | | | | | | | | | | |
Currency
Purchased | | | Currency Sold | | | Counterparty | | Settlement
Date | | | Unrealized
Appreciation
(Depreciation) | |
| USD | | | 2,621,768 | | | BRL | | | 8,397,000 | | | Citibank N.A. | | | 9/15/15 | | | $ | 317,567 | |
| EUR | | | 180,000 | | | USD | | | 197,552 | | | Bank of America N.A. | | | 10/16/15 | | | | 4,570 | |
| EUR | | | 110,000 | | | USD | | | 122,431 | | | Bank of America N.A. | | | 10/16/15 | | | | 1,088 | |
| USD | | | 7,816,455 | | | EUR | | | 7,079,000 | | | Bank of America N.A. | | | 10/16/15 | | | | (132,540) | |
| USD | | | 1,569,001 | | | EUR | | | 1,427,030 | | | BNP Paribas SA | | | 11/13/15 | | | | (34,168) | |
| USD | | | 1,809,239 | | | MXN | | | 29,871,215 | | | Barclays Bank PLC | | | 11/13/15 | | | | 30,990 | |
| EUR | | | 487,729 | | | USD | | | 529,966 | | | Citibank N.A. | | | 11/13/15 | | | | 17,963 | |
| USD | | | 738,017 | | | GBP | | | 474,057 | | | Citibank N.A. | | | 11/13/15 | | | | 10,860 | |
| EUR | | | 120,000 | | | USD | | | 134,087 | | | UBS AG | | | 11/13/15 | | | | 725 | |
| USD | | | 4,097,970 | | | EUR | | | 3,767,500 | | | UBS AG | | | 11/13/15 | | | | (134,554) | |
| USD | | | 858,544 | | | GBP | | | 551,367 | | | UBS AG | | | 11/13/15 | | | | 12,802 | |
| INR | | | 105,283,315 | | | SGD | | | 2,258,242 | | | Bank of America N.A. | | | 11/16/15 | | | | (32,757) | |
| Total | | | | | | | | | | | | | | | $ | 62,546 | |
| | |
Abbreviations used in this table: |
| BRL | | — Brazilian Real |
| EUR | | — Euro |
| GBP | | — British Pound |
| INR | | — Indian Rupee |
| MXN | | — Mexican Peso |
| SGD | | — Singapore Dollar |
| USD | | — United States Dollar |
Transactions in reverse repurchase agreements for the Fund during the year ended August 31, 2015 were as follows:
| | | | |
Average Daily
Balance* | | Weighted Average
Interest Rate* | | Maximum Amount
Outstanding |
| $14,380,558 | | 0.60% | | $14,614,610 |
| * | Averages based on the number of days that Fund had reverse repurchase agreements outstanding. |
Interest rates on reverse repurchase agreements ranged from (2.00)% to 0.85% during the year ended August 31, 2015. Interest expense incurred on reverse repurchase agreements totaled $103,628. Interest income earned on reverse repurchase agreements totaled $17,509.
| | |
| Western Asset Global Partners Income Fund Inc. 2015 Annual Report | | 51 |
Notes to financial statements (cont’d)
At August 31, 2015, the Fund had the following open reverse repurchase agreements:
| | | | | | | | | | | | | | | | | | | | |
| Counterparty | | Rate | | | Effective
Date | | | Maturity
Date | | Face Amount
of Reverse
Repurchase
Agreements | | | Asset Class of Collateral* | | Collateral
Value | |
| Credit Suisse | | | (2.00)% | | | | 5/4/2015 | | | TBD** | | $ | 2,740,542 | | | Sovereign bonds | | $ | 2,891,117 | |
| | | | | | Cash | | | 178,848 | |
| Credit Suisse | | | 0.50% | | | | 6/25/2015 | | | TBD** | | | 1,005,750 | | | Sovereign bonds | | | 1,118,440 | |
| | | | | | Cash | | | 65,635 | |
| Credit Suisse | | | 0.75% | | | | 6/11/2015 | | | TBD** | | | 4,923,162 | | | Sovereign bonds | | | 5,959,748 | |
| | | | | | Cash | | | 321,286 | |
| Credit Suisse | | | 0.75% | | | | 7/17/2014 | | | TBD** | | | 1,342,200 | | | Sovereign bonds | | | 1,085,881 | |
| | | | | | Cash | | | 87,592 | |
| Credit Suisse | | | 0.85% | | | | 6/10/2014 | | | TBD** | | | 3,764,000 | | | Sovereign bonds | | | 3,897,000 | |
| | | | | | Cash | | | 245,639 | |
| JPMorgan Chase & Co. | | | 0.25% | | | | 4/8/2015 | | | TBD** | | | 830,000 | | | Corporate bonds & notes | | | 1,095,680 | |
| | | | | | | | | | | | | $ | 14,605,654 | | | | | $ | 16,946,866 | |
| * | Refer to the Schedule of Investments for positions held at the counterparty as collateral for reverse repurchase agreements. |
| ** | TBD — To Be Determined; These reverse repurchase agreements have no maturity dates because they are renewed daily and can be terminated by either the Fund or the counterparty in accordance with the terms of the agreements. |
4. Derivative instruments and hedging activities
Below is a table, grouped by derivative type, that provides information about the fair value and the location of derivatives within the Statement of Assets and Liabilities at August 31, 2015.
| | | | | | | | | | | | |
| ASSET DERIVATIVES1 | |
| | | Interest
Rate Risk | | | Foreign
Exchange Risk | | | Total | |
| Futures contracts2 | | $ | 37,610 | | | $ | 16,163 | | | $ | 53,773 | |
| Forward foreign currency contracts | | | — | | | | 396,565 | | | | 396,565 | |
| Total | | $ | 37,610 | | | $ | 412,728 | | | $ | 450,338 | |
| | | | |
| LIABILITY DERIVATIVES1 | |
| | | Foreign
Exchange Risk | |
| Forward foreign currency contracts | | $ | 334,019 | |
| 1 | Generally, the balance sheet location for asset derivatives is receivables/net unrealized appreciation (depreciation) and for liability derivatives is payables/net unrealized appreciation (depreciation). |
| 2 | Includes cumulative appreciation (depreciation) of futures contracts as reported in the footnotes. Only variation margin is reported within the receivables and/or payables on the Statement of Assets and Liabilities. |
The following tables provide information about the effect of derivatives and hedging activities on the Fund’s Statement of Operations for the year ended August 31, 2015. The first table provides additional detail about the amounts and sources of gains (losses) realized on derivatives during the period. The second table provides additional information about the change in unrealized appreciation (depreciation) resulting from the Fund’s derivatives and hedging activities during the period.
| | |
| 52 | | Western Asset Global Partners Income Fund Inc. 2015 Annual Report |
| | | | | | | | | | | | |
| AMOUNT OF REALIZED GAIN (LOSS) ON DERIVATIVES RECOGNIZED | |
| | | Interest
Rate Risk | | | Foreign
Exchange Risk | | | Total | |
| Written options | | | — | | | $ | 90,644 | | | $ | 90,644 | |
| Futures contracts | | $ | (874,138) | | | | — | | | | (874,138) | |
| Forward foreign currency contracts1 | | | — | | | | 3,639,933 | | | | 3,639,933 | |
| Total | | $ | (874,138) | | | $ | 3,730,577 | | | $ | 2,856,439 | |
| 1 | Net realized gain (loss) from forward foreign currency contracts is reported in net realized gain (loss) from foreign currency transactions in the Statement of Operations. |
| | | | | | | | | | | | |
| CHANGE IN UNREALIZED APPRECIATION (DEPRECIATION) ON DERIVATIVES RECOGNIZED | |
| | | Interest
Rate Risk | | | Foreign
Exchange Risk | | | Total | |
| Futures contracts | | $ | 94,212 | | | $ | 16,163 | | | $ | 110,375 | |
| Forward foreign currency contracts1 | | | — | | | | (226,948) | | | | (226,948) | |
| Total | | $ | 94,212 | | | $ | (210,785) | | | $ | (116,573) | |
| 1 | The change in unrealized appreciation (depreciation) from forward foreign currency contracts is reported in the change in net unrealized appreciation (depreciation) from foreign currencies in the Statement of Operations. |
During the year ended August 31, 2015, the volume of derivative activity for the Fund was as follows:
| | | | |
| | | Average Market
Value | |
| Written options† | | $ | 3,581 | |
| Futures contracts (to buy) | | | 248,555 | |
| Futures contracts (to sell) | | | 23,752,814 | |
| Forward foreign currency contracts (to buy) | | | 1,892,332 | |
| Forward foreign currency contracts (to sell) | | | 18,025,213 | |
| † | At August 31, 2015, there were no open positions held in this derivative. |
The following table presents by financial instrument, the Fund’s derivative assets net of the related collateral received by the Fund at August 31, 2015:
| | | | | | | | | | | | |
| | | Gross Amount of Derivative
Assets in the Statement of
Assets and Liabilities1 | | | Collateral
Received | | | Net
Amount | |
| Futures contracts2 | | $ | 29,900 | | | | — | | | $ | 29,900 | |
| Forward foreign currency contracts | | | 396,565 | | | | — | | | | 396,565 | |
| Total | | $ | 426,465 | | | | — | | | $ | 426,465 | |
The following table presents by financial instrument, the Fund’s derivative liabilities net of the related collateral pledged by the Fund at August 31, 2015:
| | | | | | | | | | | | |
| | | Gross Amount of Derivative
Liabilities in the Statement of
Assets and Liabilities1 | | | Collateral
Pledged | | | Net Amount | |
| Forward foreign currency contracts | | $ | 334,019 | | | | — | | | $ | 334,019 | |
| 1 | Absent an event of default or early termination, derivative assets and liabilities are presented gross and not offset in the Statement of Assets and Liabilities. |
| 2 | Amount represents the current day’s variation margin as reported in the Statement of Assets and Liabilities. It differs from the cumulative appreciation (depreciation) presented in the previous table. |
| | |
| Western Asset Global Partners Income Fund Inc. 2015 Annual Report | | 53 |
Notes to financial statements (cont’d)
5. Loan
Effective November 25, 2014, the Fund has a revolving credit agreement (“Credit Agreement”) with State Street Bank and Trust Company that allows the Fund to borrow up to an aggregate amount of $55,000,000. This Credit Agreement is effective until November 24, 2015 and thereafter, renews daily for a 270-day term unless notice to the contrary is given to the Fund. The Fund pays a commitment fee at an annual rate of 0.10% on the unutilized portion of the loan commitment amount. The interest on the loan is calculated at a variable rate based on the LIBOR plus any applicable margin. To the extent of the borrowing outstanding, the Fund is required to maintain collateral in a special custody account at the Fund’s custodian on behalf of State Street Bank and Trust Company. The Fund’s Credit Agreement contains customary covenants that, among other things, may limit the Fund’s ability to pay distributions in certain circumstances, incur additional debt, change its fundamental investment policies and engage in certain transactions, including mergers and consolidations, and require asset coverage ratios in addition to those required by the 1940 Act. In addition, the Credit Agreement may be subject to early termination under certain conditions and may contain other provisions that could limit the Fund’s ability to utilize borrowing under the agreement. Interest expense related to the Credit Agreement for the period ended August 31, 2015 was $318,803. For the period November 25, 2014 through August 31, 2015, the Fund incurred a commitment fee in the amount of $9,557. At August 31, 2015, the Fund had $40,000,000 of borrowings outstanding per the Credit Agreement. For the period ended August 31, 2015, based on the number of days during the reporting period that the Fund had an outstanding balance under this Credit Agreement, the average daily loan balance was $42,714,286 and the weighted average interest rate was 0.97%.
Prior to November 25, 2014, the Fund had a revolving credit agreement (“Prior Credit Agreement”) with Bank of America N.A. that allowed the Fund to borrow up to an aggregate amount of $55,000,000. The Prior Credit Agreement was terminated by the Fund effective November 25, 2014. Under the Prior Credit Agreement, the Fund paid a commitment fee at an annual rate of 0.10% on the unutilized portion of the loan commitment amount and the interest on the loan was calculated at a variable rate based on the LIBOR plus any applicable margin. To the extent of the borrowing outstanding, the Fund was required to maintain collateral in a special custody account at the Fund’s custodian on behalf of Bank of America N.A. Interest expense related to the Prior Credit Agreement for the period September 1, 2014 through November 24, 2014 was $82,803. For the period September 1, 2014 through November 24, 2014, the Fund incurred a commitment fee in the amount of $3,291. For the period ended November 24, 2014, based on the number of days during the reporting period that the Fund had an outstanding balance under the Prior Credit Agreement, the average daily loan balance was $41,058,824 and the weighted average interest rate was 0.87%.
| | |
| 54 | | Western Asset Global Partners Income Fund Inc. 2015 Annual Report |
6. Distributions subsequent to August 31, 2015
The following distributions have been declared by the Fund’s Board of Directors and are payable subsequent to the period end of this report:
| | | | | | | | |
| Record Date | | Payable Date | | | Amount | |
| 9/18/15 | | | 9/25/15 | | | $ | 0.0725 | |
| 10/23/15 | | | 10/30/15 | | | $ | 0.0725 | |
| 11/20/15 | | | 11/27/15 | | | $ | 0.0725 | |
7. Income tax information and distributions to shareholders
The tax character of distributions paid during the fiscal years ended August 31, was as follows:
| | | | | | | | |
| | | 2015 | | | 2014 | |
| Distributions paid from: | | | | | | | | |
| Ordinary income | | $ | 13,560,502 | | | $ | 13,551,345 | |
| Tax return of capital | | | — | | | | 1,411,969 | |
| Total distributions paid | | $ | 13,560,502 | | | $ | 14,963,314 | |
As of August 31, 2015, the components of accumulated earnings (losses) on a tax basis were as follows:
| | | | |
| Undistributed ordinary income — net | | $ | 1,525,699 | |
| Deferred capital losses* | | | (10,876,695) | |
| Capital loss carryforward** | | | (31,240,287) | |
| Other book/tax temporary differences(a) | | | (293,428) | |
| Unrealized appreciation (depreciation)(b) | | | (8,137,293) | |
| Total accumulated earnings (losses) — net | | $ | (49,022,004) | |
| * | These capital losses have been deferred in the current year as either short-term or long-term losses. The losses will be deemed to occur on the first day of the next taxable year in the same character as they were originally deferred and will be available to offset future taxable capital gains. These losses must be utilized before any of the Fund’s capital loss carryforward may be utilized. |
| ** | As of August 31, 2015, the Fund had the following net capital loss carryforward remaining: |
| | | | |
| Year of Expiration | | Amount | |
| 8/31/2017 | | $ | (4,307,290 | ) |
| 8/31/2018 | | | (26,932,997 | ) |
| | | $ | (31,240,287 | ) |
These amounts will be available to offset any future taxable capital gains.
| (a) | Other book/tax temporary differences are attributable to the tax deferral of losses on straddles, the realization for tax purposes of unrealized gains (losses) on certain futures and foreign currency contracts, book/tax difference in the accrual of interest income on securities in default and book/tax differences in the timing of the deductibility of various expenses. |
| (b) | The difference between book-basis and tax-basis unrealized appreciation (depreciation) is attributable to the tax deferral of losses on wash sales and the difference between book and tax amortization methods for premiums on fixed income securities. |
| | |
| Western Asset Global Partners Income Fund Inc. 2015 Annual Report | | 55 |
Notes to financial statements (cont’d)
8. Recent accounting pronouncement
The Fund has adopted the disclosure provisions of Financial Accounting Standards Board Accounting Standards Update No. 2014-11 (“ASU No. 2014-11”), Transfers and Servicing (Topic 860) Repurchase-to-Maturity Transactions, Repurchase Financings and Disclosures. ASU No. 2014-11 is intended to provide increased transparency about the types of collateral pledged in repurchase agreements and similar transactions that are accounted for as secured borrowings.
| | |
| 56 | | Western Asset Global Partners Income Fund Inc. 2015 Annual Report |
Report of independent registered public accounting firm
The Board of Directors and Shareholders
Western Asset Global Partners Income Fund Inc.:
We have audited the accompanying statement of assets and liabilities of Western Asset Global Partners Income Fund Inc. (the “Fund”), including the schedule of investments, as of August 31, 2015, and the related statement of operations and cash flows for the year then ended, the statements of changes in net assets for each of the years in the two-year period then ended and the financial highlights for each of the years in the five-year period then ended. These financial statements and financial highlights are the responsibility of the Fund’s management. Our responsibility is to express an opinion on these financial statements and financial highlights based on our audits.
We conducted our audits in accordance with the standards of the Public Company Accounting Oversight Board (United States). Those standards require that we plan and perform the audit to obtain reasonable assurance about whether the financial statements and financial highlights are free of material misstatement. An audit includes examining, on a test basis, evidence supporting the amounts and disclosures in the financial statements. Our procedures included confirmation of securities owned as of August 31, 2015, by correspondence with the custodian and brokers or by other appropriate auditing procedures. An audit also includes assessing the accounting principles used and significant estimates made by management, as well as evaluating the overall financial statement presentation. We believe that our audits provide a reasonable basis for our opinion.
In our opinion, the financial statements and financial highlights referred to above present fairly, in all material respects, the financial position of Western Asset Global Partners Income Fund Inc. as of August 31, 2015, the results of its operations and its cash flows for the year then ended, the changes in its net assets for each of the years in the two-year period then ended, and the financial highlights for each of the years in the five-year period then ended, in conformity with U.S. generally accepted accounting principles.

New York, New York
October 19, 2015
| | |
| Western Asset Global Partners Income Fund Inc. 2015 Annual Report | | 57 |
Additional information (unaudited)
Information about Directors and Officers
The business and affairs of Western Asset Global Partners Income Fund Inc. (the “Fund”) are conducted by management under the supervision and subject to the direction of its Board of Directors. The business address of each Director is c/o Jane Trust, Legg Mason, 100 International Drive, 11th Floor, Baltimore, Maryland 21202. Information pertaining to the Directors and officers of the Fund is set forth below.
| | |
| Independent Directors†: |
|
| Robert D. Agdern1 |
| Year of birth | | 1950 |
| Position(s) held with Fund2 | | Director and Member of the Nominating and Audit Committees, Class III |
| Term of office2 and length of time served | | Since 2015 |
| Principal occupation(s) during past five years | | Member of the Advisory Committee of the Dispute Resolution Research Center at the Kellogg Graduate School of Business, Northwestern University since 2002; Deputy General Counsel responsible for western hemisphere matters for BP PLC from 1999 to 2001; Associate General Counsel at Amoco Corporation responsible for corporate, chemical, and refining and marketing matters and special assignments from 1993 to 1998 (Amoco merged with British Petroleum in 1998 forming BP PLC). |
| Number of portfolios in fund complex overseen by Director (including the Fund) | | 31 |
| Other board memberships held by Director during past five years | | None |
|
| Carol L. Colman |
| Year of birth | | 1946 |
| Position(s) held with Fund2 | | Director and Member of the Nominating and Audit Committees, Class II |
| Term of office2 and length of time served | | Since 2003 |
| Principal occupation(s) during past five years | | President, Colman Consulting Company (consulting) |
| Number of portfolios in fund complex overseen by Director (including the Fund) | | 31 |
| Other board memberships held by Director during past five years | | None |
|
| Daniel P. Cronin |
| Year of birth | | 1946 |
| Position(s) held with Fund2 | | Director and Member of the Nominating and Audit Committees, Class I |
| Term of office2 and length of time served | | Since 2003 |
| Principal occupation(s) during past five years | | Retired; formerly, Associate General Counsel, Pfizer Inc. (prior to and including 2004) |
| Number of portfolios in fund complex overseen by Director (including the Fund) | | 31 |
| Other board memberships held by Director during past five years | | None |
| | |
| 58 | | Western Asset Global Partners Income Fund Inc. |
| | |
| Independent Directors cont’d |
|
| Paolo M. Cucchi |
| Year of birth | | 1941 |
| Position(s) held with Fund2 | | Director and Member of the Nominating and Audit Committees, Class II |
| Term of office2 and length of time served | | Since 2007 |
| Principal occupation(s) during past five years | | Emeritus Professor of French and Italian (since 2014) and formerly, Professor of French and Italian (2009 to 2014) at Drew University, formerly, Vice President and Dean of College of Liberal Arts at Drew University (1984 to 2009) |
| Number of portfolios in fund complex overseen by Director (including the Fund) | | 31 |
| Other board memberships held by Director during past five years | | None |
|
| Leslie H. Gelb |
| Year of birth | | 1937 |
| Position(s) held with Fund2 | | Director and Member of the Nominating and Audit Committees, Class II |
| Term of office2 and length of time served | | Since 1994 |
| Principal occupation(s) during past five years | | President Emeritus and Senior Board Fellow (since 2003), The Council on Foreign Relations; formerly, President, (prior to 2003), the Council on Foreign Relations; formerly, Columnist, Deputy Editorial Page Editor and Editor, Op-Ed Page, The New York Times |
| Number of portfolios in fund complex overseen by Director (including the Fund) | | 31 |
| Other board memberships held by Director during past five years | | Director of two registered investment companies advised by Aberdeen Asset Management Asia Limited (since 1994); Director, Encyclopedia Brittanica; Director, Centre Partners IV and V, LP and Affiliates |
|
| William R. Hutchinson |
| Year of birth | | 1942 |
| Position(s) held with Fund2 | | Director and Member of the Nominating and Audit Committees, Class III |
| Term of office2 and length of time served | | Since 2003 |
| Principal occupation(s) during past five years | | President, W.R. Hutchinson & Associates Inc. (Consulting) (since 2001) |
| Number of portfolios in fund complex overseen by Director (including the Fund) | | 31 |
| Other board memberships held by Director during past five years | | Director (Non-Executive Chairman of the Board (since December 1, 2009)), Associated Banc Corp. (banking) (since 1994) |
| | |
| Western Asset Global Partners Income Fund Inc. | | 59 |
Additional information (unaudited) (cont’d)
Information about Directors and Officers
| | |
| Independent Directors cont’d |
|
| Eileen A. Kamerick |
| Year of birth | | 1958 |
| Position(s) held with Fund2 | | Director and Member of Nominating and Audit Committees, Class I |
| Term of office2 and length of time served | | Since 2013 |
| Principal occupation(s) during past five years | | Senior Vice President and Chief Financial Officer, ConnectWise, Inc. (software and services company) (since 2015) and Adjunct Professor, Washington University in St.· Louis and University of Iowa law schools (since 2014); formerly, CFO, Press Ganey Associates (health care informatics company) (since 2012); formerly Managing Director and CFO, Houlihan Lokey (international investment bank) (2010 to 2012) |
| Number of portfolios in fund complex overseen by Director (including the Fund) | | 31 |
| Other board memberships held by Director during past five years | | Director of Associated Banc-Corp (financial services company) (since 2007); Westell Technologies, Inc. (technology company) (since 2003) |
|
| Riordan Roett |
| Year of birth | | 1938 |
| Position(s) held with Fund2 | | Director and Member of the Nominating and Audit Committees, Class I |
| Term of office2 and length of time served | | Since 1995 |
| Principal occupation(s) during past five years | | The Sarita and Don Johnston Professor of Political Science and Director of Western Hemisphere Studies, Paul H. Nitze School of Advanced International Studies, The Johns Hopkins University (since 1973) |
| Number of portfolios in fund complex overseen by Director (including the Fund) | | 31 |
| Other board memberships held by Director during past five years | | None |
| | |
| 60 | | Western Asset Global Partners Income Fund Inc. |
| | |
| Interested Director and Officer: |
|
| Jane Trust, CFA3 |
| Year of birth | | 1962 |
| Position(s) held with Fund2 | | Director, Chairman, President and Chief Executive Officer, Class III |
| Term of office2 and length of time served | | Since 2015 |
| Principal occupation(s) during past five years | | Managing Director of Legg Mason & Co., LLC (“Legg Mason & Co.”) (since 2015); Officer and/or Trustee/Director of 156 funds associated with LMPFA or its affiliates (since 2015); President and Chief Executive Officer of LMPFA (since 2015); formerly, Senior Vice President of LMPFA (2015); formerly, Director of ClearBridge, LLC (formerly, Legg Mason Capital Management, LLC) (2007 to 2014); formerly, Managing Director of Legg Mason Investment Counsel & Trust Co. (2000 to 2007). |
| Number of portfolios in fund complex overseen by Director (including the Fund) | | 147 |
| Other board memberships held by Director during past five years | | None |
|
| Additional Officers: | | |
|
Ted P. Becker Legg Mason 620 Eighth Avenue, 49th Floor, New York, NY 10018 |
| Year of birth | | 1951 |
| Position(s) held with Fund2 | | Chief Compliance Officer |
| Term of office2 and length of time served | | Since 2006 |
| Principal occupation(s) during past five years | | Director of Global Compliance at Legg Mason (since 2006); Chief Compliance Officer of LMPFA (since 2006); Managing Director of Compliance of Legg Mason & Co. (since 2005); Chief Compliance Officer of certain mutual funds associated with Legg Mason & Co. or its affiliates (since 2006) and Legg Mason & Co. predecessors (prior to 2006) |
|
Vanessa A. Williams Legg Mason 100 First Stamford Place, 6th Floor, Stamford, CT 06902 |
| Year of birth | | 1979 |
| Position(s) with Fund2 | | Identity Theft Prevention Officer |
| Term of office2 and length of time served | | Since 2011 |
| Principal occupation(s) during past five years | | Vice President of Legg Mason & Co. (since 2012); Identity Theft Prevention Officer of certain mutual funds associated with Legg Mason & Co. or its affiliates (since 2011); formerly, Chief Anti-Money Laundering Compliance Officer of certain mutual funds associated with Legg Mason & Co or its affiliates (2011 to 2013); formerly, Senior Compliance Officer of Legg Mason & Co. (2008 to 2011); formerly, Compliance Analyst of Legg Mason & Co. (2006 to 2008) and Legg Mason & Co. predecessors (prior to 2006) |
| | |
| Western Asset Global Partners Income Fund Inc. | | 61 |
Additional information (unaudited) (cont’d)
Information about Directors and Officers
| | |
| Additional Officers cont’d |
|
Robert I. Frenkel Legg Mason 100 First Stamford Place, 6th Floor, Stamford, CT 06902 |
| Year of birth | | 1954 |
| Position(s) held with Fund2 | | Secretary and Chief Legal Officer |
| Term of office2 and length of time served | | Since 2003 |
| Principal occupation(s) during past five years | | Vice President and Deputy General Counsel of Legg Mason (since 2006); Managing Director and General Counsel of Global Mutual Funds for Legg Mason & Co. (since 2006) and Legg Mason & Co. predecessors (since 1994); Secretary and Chief Legal Officer of certain mutual funds associated with Legg Mason & Co. or its affiliates (since 2006) and Legg Mason & Co. predecessors (prior to 2006) |
|
Thomas C. Mandia Legg Mason 100 First Stamford Place, 6th Floor, Stamford, CT 06902 |
| Year of birth | | 1962 |
| Position(s) held with Fund2 | | Assistant Secretary |
| Term of office2 and length of time served | | Since 2006 |
| Principal occupation(s) during past five years | | Managing Director and Deputy General Counsel of Legg Mason & Co. (since 2005) and Legg Mason & Co. predecessors (prior to 2005); Secretary of LMPFA (since 2006); Assistant Secretary of certain mutual funds associated with Legg Mason & Co. or its affiliates (since 2006) and Legg Mason & Co. predecessors (prior to 2006); Secretary of LM Asset Services, LLC (“LMAS”) (since 2002) and Legg Mason Fund Asset Management, Inc. (“LMFAM”) (since 2013) (formerly registered investment advisers). |
|
Richard F. Sennett Legg Mason 100 International Drive, 7th Floor, Baltimore, MD 21202 |
| Year of birth | | 1970 |
| Position(s) held with Fund2 | | Principal Financial Officer |
| Term of office2 and length of time served | | Since 2011 |
| Principal occupation(s) during past five years | | Principal Financial Officer and Treasurer of certain mutual funds associated with Legg Mason & Co. or its affiliates (since 2011 and since 2013); Managing Director of Legg Mason & Co. and Senior Manager of the Treasury Policy group for Legg Mason & Co.’s Global Fiduciary Platform (since 2011); formerly, Chief Accountant within the SEC’s Division of Investment Management (2007 to 2011); formerly, Assistant Chief Accountant within the SEC’s Division of Investment Management (2002 to 2007) |
| | |
| 62 | | Western Asset Global Partners Income Fund Inc. |
| | |
| Additional Officers cont’d |
|
Steven Frank Legg Mason 620 Eighth Avenue, 49th Floor, New York, NY 10018 |
| Year of birth | | 1967 |
| Position(s) held with Fund2 | | Treasurer |
| Term of office2 and length of time served | | Since 2010 |
| Principal occupation(s) during past five years | | Vice President of Legg Mason & Co. and Legg Mason & Co. predecessors (since 2002); Treasurer of certain mutual funds associated with Legg Mason & Co. or its affiliates (since 2010); formerly, Controller of certain mutual funds associated with Legg Mason & Co. or its affiliates (prior to 2010) |
|
Jeanne M. Kelly Legg Mason 620 Eighth Avenue, 49th Floor, New York, NY 10018 |
| Year of birth | | 1951 |
| Position(s) with Fund2 | | Senior Vice President |
| Term of office2 and length of time served | | Since 2007 |
| Principal occupation(s) during past five years | | Senior Vice President of certain mutual funds associated with Legg Mason & Co. or its affiliates (since 2007); Senior Vice President of LMPFA (since 2006); President and Chief Executive Officer of LMAS and LMFAM (since 2015); Managing Director of Legg Mason & Co. (since 2005) and Legg Mason & Co. predecessors (prior to 2005); formerly, Senior Vice President of LMFAM (2013 to 2015) |
| † | Directors who are not “interested persons” of the Fund within the meaning of Section 2(a)(19) of the 1940 Act. |
| 1 | Effective January 1, 2015, Mr. Agdern became a Director. |
| 2 | The Fund’s Board of Directors is divided into three classes: Class I, Class II and Class III. The terms of office of the Class I, II and III Directors expire at the Annual Meetings of Stockholders in the year 2016, year 2017 and year 2015, respectively, or thereafter in each case when their respective successors are duly elected and qualified. The Fund’s executive officers are chosen each year to hold office until their successors are duly elected and qualified. |
| 3 | Effective August 1, 2015, Ms. Trust became a Director. In addition, Ms. Trust is an “interested person” of the Fund as defined in the 1940 Act because Ms. Trust is an officer of LMPFA and certain of its affiliates. |
| | |
| Western Asset Global Partners Income Fund Inc. | | 63 |
Annual chief executive officer and principal financial officer certifications (unaudited)
The Fund’s Chief Executive Officer (“CEO”) has submitted to the NYSE the required annual certification and the Fund also has included the Certifications of the Fund’s CEO and Principal Financial Officer required by Section 302 of the Sarbanes-Oxley Act in the Fund’s Form N-CSR filed with the SEC for the period of this report.
| | |
| 64 | | Western Asset Global Partners Income Fund Inc. |
Other shareholder communications regarding accounting matters (unaudited)
The Fund’s Audit Committee has established guidelines and procedures regarding the receipt, retention and treatment of complaints regarding accounting, internal accounting controls or auditing matters (collectively, “Accounting Matters”). Persons with complaints or concerns regarding Accounting Matters may submit their complaints to the Chief Compliance Officer (“CCO”). Persons who are uncomfortable submitting complaints to the CCO, including complaints involving the CCO, may submit complaints directly to the Fund’s Audit Committee Chair. Complaints may be submitted on an anonymous basis.
The CCO may be contacted at:
Legg Mason & Co., LLC
Compliance Department
620 Eighth Avenue, 49th Floor
New York, New York 10018
Complaints may also be submitted by telephone at 1-800-742-5274. Complaints submitted through this number will be received by the CCO.
| | |
| Western Asset Global Partners Income Fund Inc. | | 65 |
Dividend reinvestment and cash purchase plan (unaudited)
1. Each shareholder initially purchasing shares of common stock (“Shares”) of Western Asset Global Partners Income Fund Inc. (“Fund”), on or after September 6, 1996 will be deemed to have elected to be a participant in the Amended and Restated Dividend Reinvestment and Cash Purchase Plan (“Plan”), unless the shareholder specifically elects in writing (addressed to the Agent at the address below or to any nominee who holds Shares for the shareholder in its name) to receive all distributions in cash, paid by check, mailed directly to the record holder by or under the direction of American Stock Transfer & Trust Company as the Fund’s dividend-paying agent (“Agent”). A shareholder whose Shares are held in the name of a broker or nominee who does not provide an automatic reinvestment service may be required to take such Shares out of “street name” and register such Shares in the shareholder’s name in order to participate, otherwise distributions will be paid in cash to such shareholder by the broker or nominee. Each participant in the Plan is referred to herein as a “Participant.” The Agent will act as agent for each Participant, and will open accounts for each Participant under the Plan in the same name as their Shares are registered.
2. Unless the Fund declares a distribution payable only in the form of cash, the Agent will apply all distributions in the manner set forth below.
3. If, on the determination date, the market price per Share equals or exceeds the net asset value per Share on that date (such condition, a “market premium”), the Agent will receive the distribution in newly issued Shares of the Fund on behalf of Participants. If, on the determination date, the net asset value per Share exceeds the market price per Share (such condition, a “market discount”), the Agent will purchase Shares in the open-market. The determination date will be the fourth New York Stock Exchange (“NYSE”) trading day (a NYSE trading day being referred to herein as a “Trading Day”) preceding the payment date for the distribution. For purposes herein, “market price” will mean the average of the highest and lowest prices at which the Shares sell on the NYSE on the particular date, or if there is no sale on that date, the average of the closing bid and asked quotations.
4. Purchases made by the Agent will be made as soon as practicable commencing on the Trading Day following the determination date and terminating no later than 30 days after the distribution payment date except where temporary curtailment or suspension of purchase is necessary to comply with applicable provisions of federal securities law; provided, however, that such purchases will, in any event, terminate on the Trading Day prior to the “ex-dividend” date next succeeding the distribution payment date.
5. If (i) the Agent has not invested the full distribution amount in open-market purchases by the date specified in paragraph 4 above as the date on which such purchases must terminate or (ii) a market discount shifts to a market premium during the purchase period, then the Agent will cease making open-market purchases and will receive the uninvested portion of the distribution amount in newly issued Shares (x) in the case of (i) above, at the close of business on the date the Agent is required to terminate making open-market purchases as specified in paragraph 4 above or (y) in the case of (ii) above, at the close of business on the date such shift occurs; but in no event prior to the payment date for the distribution.
| | |
| 66 | | Western Asset Global Partners Income Fund Inc. |
6. In the event that all or part of a distribution amount is to be paid in newly issued Shares, such Shares will be issued to Participants in accordance with the following formula: (i) if, on the valuation date, the net asset value per Share is less than or equal to the market price per Share, then the newly issued Shares will be valued at net asset value per Share on the valuation date; provided, however, that if the net asset value is less than 95% of the market price on the valuation date, then such Shares will be issued at 95% of the market price and (ii) if, on the valuation date, the net asset value per Share is greater than the market price per Share, then the newly issued Shares will be issued at the market price on the valuation date. The valuation date will be the distribution payment date, except that with respect to Shares issued pursuant to paragraph 5 above, the valuation date will be the date such Shares are issued. If a date that would otherwise be a valuation date is not a Trading Day, the valuation date will be the next preceding Trading Day.
7. Participants have the option of making additional cash payments to the Agent, monthly, in a minimum amount of $250, for investment in Shares. The Agent will use all such funds received from Participants to purchase Shares in the open market on or about the first business day of each month. To avoid unnecessary cash accumulations, and also to allow ample time for receipt and processing by the Agent, Participants should send in voluntary cash payments to be received by the Agent approximately 10 days before an applicable purchase date specified above. A Participant may withdraw a voluntary cash payment by written notice, if the notice is received by the Agent not less than 48 hours before such payment is to be invested.
8. Purchases by the Agent pursuant to paragraphs 4 and 7 above may be made on any securities exchange on which the Shares of the Fund are traded, in the over-the-counter market or in negotiated transactions, and may be on such terms as to price, delivery and otherwise as the Agent shall determine. Funds held by the Agent uninvested will not bear interest, and it is understood that, in any event, the Agent shall have no liability in connection with any inability to purchase Shares within the time periods herein provided, or with the timing of any purchases effected. The Agent shall have no responsibility as to the value of the Shares acquired for the Participant’s account. The Agent may commingle amounts of all Participants to be used for open-market purchases of Shares and the price per Share allocable to each Participant in connection with such purchases shall be the average price (including brokerage commissions) of all Shares purchased by the Agent.
9. The Agent will maintain all Participants’ accounts in the Plan and will furnish written confirmations of all transactions in each account, including information needed by Participants for personal and tax records. The Agent will hold Shares acquired pursuant to the Plan in noncertificated form in the Participant’s name or that of its nominee, and each Participant’s proxy will include those Shares purchased pursuant to the Plan. The Agent will forward to Participants any proxy solicitation material and will vote any Shares so held for Participants only in accordance with the proxy returned by Participants to the Fund. Upon written request, the Agent will deliver to Participants, without charge, a certificate or certificates for the full Shares.
| | |
| Western Asset Global Partners Income Fund Inc. | | 67 |
Dividend reinvestment and cash purchase plan (unaudited) (cont’d)
10. The Agent will confirm to Participants each acquisition made for their respective accounts as soon as practicable but not later than 60 days after the date thereof. Although Participants may from time to time have an undivided fractional interest (computed to three decimal places) in a Share of the Fund, no certificates for fractional shares will be issued. Distributions on fractional shares will be credited to each Participant’s account. In the event of termination of a Participant’s account under the Plan, the Agent will adjust for any such undivided fractional interest in cash at the market value of the Fund’s Shares at the time of termination less the pro rata expense of any sale required to make such an adjustment.
11. Any share dividends or split shares distributed by the Fund on Shares held by the Agent for Participants will be credited to their respective accounts. In the event that the Fund makes available to Participants rights to purchase additional Shares or other securities, the Shares held for Participants under the Plan will be added to other Shares held by the Participants in calculating the number of rights to be issued to Participants.
12. The Agent’s service fee for handling distributions will be paid by the Fund. Participants will be charged a pro rata share of brokerage commissions on all open-market purchases.
13. Participants may terminate their accounts under the Plan by notifying the Agent in writing. Such termination will be effective immediately if notice is received by the Agent not less than 10 days prior to any distribution record date; otherwise such termination will be effective on the first Trading Day after the payment date for such distribution with respect to any subsequent distribution. The Plan may be amended or terminated by the Fund as applied to any voluntary cash payments made and any distribution paid subsequent to written notice of the change or termination sent to Participants at least 30 days prior to the record date for the distribution. The Plan may be amended or terminated by the Agent, with the Fund’s prior written consent, on at least 30 days’ written notice to Participants. Notwithstanding the preceding two sentences, the Agent or the Fund may amend or supplement the Plan at any time or times when necessary or appropriate to comply with applicable law or rules or policies of the Securities and Exchange Commission or any other regulatory authority. Upon any termination, the Agent will cause a certificate or certificates for the full Shares held by each Participant under the Plan and cash adjustment for any fraction to be delivered to each Participant without charge.
14. Any amendment or supplement shall be deemed to be accepted by each Participant unless, prior to the effective date thereof, the Agent receives written notice of the termination of the Participant’s account under the Plan. Any such amendment may include an appointment by the Agent in its place and stead of a successor Agent under these terms and conditions, with full power and authority to perform all or any of the acts to be performed by the Agent under these terms and conditions. Upon any such appointment of an Agent for the purpose of receiving distributions, the Fund will be authorized to pay to such successor Agent, for each Participant’s account, all distributions payable on Shares of the Fund held in each Participant’s name or under the Plan for retention or application by such successor Agent as provided in these terms and conditions.
| | |
| 68 | | Western Asset Global Partners Income Fund Inc. |
15. In the case of Participants, such as banks, broker-dealers or other nominees, which hold Shares for others who are beneficial owners (“Nominee Holders”), the Agent will administer the Plan on the basis of the number of Shares certified from time to time by each Nominee Holder as representing the total amount registered in the Nominee Holder’s name and held for the account of beneficial owners who are to participate in the Plan.
16. The Agent shall at all times act in good faith and use its best efforts within reasonable limits to insure the accuracy of all services performed under this Agreement and to comply with applicable law, but assumes no responsibility and shall not be liable for loss or damage due to errors unless such error is caused by its negligence, bad faith, or willful misconduct or that of its employees.
17. All correspondence concerning the Plan should be directed to the Agent at 6201 15th Avenue, Brooklyn, New York 11219.
| | |
| Western Asset Global Partners Income Fund Inc. | | 69 |
Important tax information (unaudited)
The following information is provided with respect to the distributions paid during the taxable year ended August 31, 2015:
| | | | |
| Record Date: | | Monthly | | Monthly |
| Payable Date: | | September 2014
through
December 2014 | | January 2015
through
August 2015 |
| Ordinary Income: | | | | |
Qualified dividend income for individuals | | 0.70% | | 1.00% |
Dividends qualifying for the dividends | | | | |
received deduction for corporations | | 0.52% | | 1.08% |
Please retain this information for your records.
| | |
| 70 | | Western Asset Global Partners Income Fund Inc. |
Western Asset
Global Partners Income Fund Inc.
Directors
Robert D. Agdern
Carol L. Colman
Daniel P. Cronin
Paolo M. Cucchi
Leslie H. Gelb
William R. Hutchinson
Eileen A. Kamerick
Riordan Roett
Jane Trust*
Chairman
Officers
Jane Trust*
President and Chief Executive Officer
Richard F. Sennett
Principal Financial Officer
Ted P. Becker
Chief Compliance Officer
Vanessa A. Williams
Identity Theft Prevention Officer
Robert I. Frenkel
Secretary and Chief Legal Officer
Thomas Mandia
Assistant Secretary
Steven Frank
Treasurer
Jeanne M. Kelly
Senior Vice President
| * | Effective August 1, 2015, Ms. Trust became Chairman, President and Chief Executive Officer. |
Western Asset Global Partners Income Fund Inc.
620 Eighth Avenue
49th Floor
New York, NY 10018
Investment manager
Legg Mason Partners Fund Advisor, LLC
Subadvisers
Western Asset Management Company
Western Asset Management Company Limited
Western Asset Management Company Ltd
Western Asset Management Company Pte. Ltd.
Custodian
State Street Bank and Trust Company
1 Lincoln Street
Boston, MA 02111
Transfer agent
American Stock Transfer & Trust Company
6201 15th Avenue
Brooklyn, NY 11219
Independent registered public accounting firm
KPMG LLP
345 Park Avenue
New York, NY 10154
Legal counsel
Simpson Thacher & Bartlett LLP
425 Lexington Avenue
New York, NY 10017
New York Stock Exchange Symbol
GDF
Legg Mason Funds Privacy and Security Notice
Your Privacy and the Security of Your Personal Information is Very Important to the Legg Mason Funds
This Privacy and Security Notice (the “Privacy Notice”) addresses the Legg Mason Funds’ privacy and data protection practices with respect to nonpublic personal information the Funds receive. The Legg Mason Funds include any funds sold by the Funds’ distributor, Legg Mason Investor Services, LLC, as well as Legg Mason-sponsored closed-end funds and certain closed-end funds managed or sub-advised by Legg Mason or its affiliates. The provisions of this Privacy Notice apply to your information both while you are a shareholder and after you are no longer invested with the Funds.
The Type of Nonpublic Personal Information the Funds Collect About You
The Funds collect and maintain nonpublic personal information about you in connection with your shareholder account. Such information may include, but is not limited to:
| • | | Personal information included on applications or other forms; |
| • | | Account balances, transactions, and mutual fund holdings and positions; |
| • | | Online account access user IDs, passwords, security challenge question responses; and |
| • | | Information received from consumer reporting agencies regarding credit history and creditworthiness (such as the amount of an individual’s total debt, payment history, etc.). |
How the Funds Use Nonpublic Personal Information About You
The Funds do not sell or share your nonpublic personal information with third parties or with affiliates for their marketing purposes, or with other financial institutions or affiliates for joint marketing purposes, unless you have authorized the Funds to do so. The Funds do not disclose any nonpublic personal information about you except as may be required to perform transactions or services you have authorized or as permitted or required by law. The Funds may disclose information about you to:
| • | | Employees, agents, and affiliates on a “need to know” basis to enable the Funds to conduct ordinary business or comply with obligations to government regulators; |
| • | | Service providers, including the Funds’ affiliates, who assist the Funds as part of the ordinary course of business (such as printing, mailing services, or processing or servicing your account with us) or otherwise perform services on the Funds’ behalf, including companies that may perform marketing services solely for the Funds; |
| • | | The Funds’ representatives such as legal counsel, accountants and auditors; and |
| • | | Fiduciaries or representatives acting on your behalf, such as an IRA custodian or trustee of a grantor trust. |
|
| NOT PART OF THE ANNUAL REPORT |
Legg Mason Funds Privacy and Security Notice (cont’d)
Except as otherwise permitted by applicable law, companies acting on the Funds’ behalf are contractually obligated to keep nonpublic personal information the Funds provide to them confidential and to use the information the Funds share only to provide the services the Funds ask them to perform.
The Funds may disclose nonpublic personal information about you when necessary to enforce their rights or protect against fraud, or as permitted or required by applicable law, such as in connection with a law enforcement or regulatory request, subpoena, or similar legal process. In the event of a corporate action or in the event a Fund service provider changes, the Funds may be required to disclose your nonpublic personal information to third parties. While it is the Funds’ practice to obtain protections for disclosed information in these types of transactions, the Funds cannot guarantee their privacy policy will remain unchanged.
Keeping You Informed of the Funds’ Privacy and Security Practices
The Funds will notify you annually of their privacy policy as required by federal law. While the Funds reserve the right to modify this policy at any time they will notify you promptly if this privacy policy changes.
The Funds’ Security Practices
The Funds maintain appropriate physical, electronic and procedural safeguards designed to guard your nonpublic personal information. The Funds’ internal data security policies restrict access to your nonpublic personal information to authorized employees, who may use your nonpublic personal information for Fund business purposes only.
Although the Funds strive to protect your nonpublic personal information, they cannot ensure or warrant the security of any information you provide or transmit to them, and you do so at your own risk. In the event of a breach of the confidentiality or security of your nonpublic personal information, the Funds will attempt to notify you as necessary so you can take appropriate protective steps. If you have consented to the Funds using electronic communications or electronic delivery of statements, they may notify you under such circumstances using the most current email address you have on record with them.
In order for the Funds to provide effective service to you, keeping your account information accurate is very important. If you believe that your account information is incomplete, not accurate or not current, or if you have questions about the Funds’ privacy practices, write the Funds using the contact information on your account statements, email the Funds by clicking on the Contact Us section of the Funds’ website at www.leggmason.com, or contact the Fund at 1-888-777-0102.
|
| NOT PART OF THE ANNUAL REPORT |
Western Asset Global Partners Income Fund Inc.
Western Asset Global Partners Income Fund Inc.
620 Eighth Avenue
49th Floor
New York, NY 10018
Notice is hereby given in accordance with Section 23(c) of the Investment Company Act of 1940, as amended, that from time to time the Fund may purchase, at market prices, shares of its Common Stock in the open market.
The Fund files its complete schedule of portfolio holdings with the Securities and Exchange Commission (“SEC”) for the first and third quarters of each fiscal year on Form N-Q. The Fund’s Forms N-Q are available on the SEC’s website at www.sec.gov. The Fund’s Forms N-Q may be reviewed and copied at the SEC’s Public Reference Room in Washington, D.C., and information on the operation of the Public Reference Room may be obtained by calling 1-800-SEC-0330. To obtain information on Form N-Q from the Fund, shareholders can call 1-888-777-0102.
Information on how the Fund voted proxies relating to portfolio securities during the prior 12-month period ended June 30th of each year and a description of the policies and procedures that the Fund uses to determine how to vote proxies relating to portfolio transactions are available (1) without charge, upon request, by calling 1-888-777-0102, (2) on the Fund’s website at www.lmcef.com and (3) on the SEC’s website at www.sec.gov.
This report is transmitted to the shareholders of Western Asset Global Partners Income Fund Inc. for their information. This is not a prospectus, circular or representation intended for use in the purchase or sale of shares of the Fund or any securities mentioned in the report.
American Stock Transfer & Trust Company
6201 15th Avenue
Brooklyn, NY 11219
WASX010340 10/15 SR15-2603
The registrant has adopted a code of ethics that applies to the registrant’s principal executive officer, principal financial officer, principal accounting officer or controller.
| ITEM 3. | AUDIT COMMITTEE FINANCIAL EXPERT. |
The Board of Directors of the registrant has determine that Eileen A. Kamerick, a member of the Board’s Audit Committee, possesses the technical attributes identified in Instruction 2(b) of Item 3 to Form N-CSR to qualify as an “audit committee financial expert and that she is independent for purposes of this item.
| ITEM 4. | PRINCIPAL ACCOUNTANT FEES AND SERVICES. |
a) Audit Fees. The aggregate fees billed in the last two fiscal years ending August 31, 2014 and August 31, 2015 (the “Reporting Periods”) for professional services rendered by the Registrant’s principal accountant (the “Auditor”) for the audit of the Registrant’s annual financial statements, or services that are normally provided by the Auditor in connection with the statutory and regulatory filings or engagements for the Reporting Periods, were $74,100 in 2014 and $74,800 in 2015.
b) Audit-Related Fees. The aggregate fees billed in the Reporting Period for assurance and related services by the Auditor that are reasonably related to the performance of the Registrant’s financial statements were $0 in 2014 and $0 in 2015.
(c) Tax Fees. The aggregate fees billed in the Reporting Periods for professional services rendered by the Auditor for tax compliance, tax advice and tax planning (“Tax Services”) were $4,100 in 2014 and $4,140 in 2015. These services consisted of (i) review or preparation of U.S. federal, state, local and excise tax returns; (ii) U.S. federal, state and local tax planning, advice and assistance regarding statutory, regulatory or administrative developments, and (iii) tax advice regarding tax qualification matters and/or treatment of various financial instruments held or proposed to be acquired or held.
There were no fees billed for tax services by the Auditors to service affiliates during the Reporting Periods that required pre-approval by the Audit Committee.
d) All Other Fees. There were no other fees billed in the Reporting Periods for products and services provided by the Auditor, other than the services reported in paragraphs (a) through (c) of this Item for the Western Asset Global Partners Income Fund Inc.
All Other Fees. There were no other non-audit services rendered by the Auditor to Legg Mason Partners Fund Advisor, LLC (“LMPFA”) and any entity controlling, controlled by or under common control with LMPFA that provided ongoing services to Western Asset Global Partners Income Fund Inc. requiring pre-approval by the Audit Committee in the Reporting Period.
(e) Audit Committee’s pre-approval policies and procedures described in paragraph (c) (7) of Rule 2-01 of Regulation S-X.
(1) The Charter for the Audit Committee (the “Committee”) of the Board of each registered investment company (the “Fund”) advised by LMPFA or one of their affiliates (each, an “Adviser”) requires that the Committee shall approve (a) all audit and permissible non-audit services to be provided to the Fund and (b) all permissible non-audit services to be provided by the Fund’s independent auditors to the Adviser and any Covered Service Providers if the engagement relates directly to the operations and financial reporting of the Fund. The Committee may implement policies and procedures by which such services are approved other than by the full Committee.
The Committee shall not approve non-audit services that the Committee believes may impair the independence of the auditors. As of the date of the approval of this Audit Committee Charter, permissible non-audit services include any professional services (including tax services), that are not prohibited services as described below, provided to the Fund by the independent auditors, other than those provided to the Fund in connection with an audit or a review of the financial statements of the Fund. Permissible non-audit services may not include: (i) bookkeeping or other services related to the accounting records or financial statements of the Fund; (ii) financial information systems design and implementation; (iii) appraisal or valuation services, fairness opinions or contribution-in-kind reports; (iv) actuarial services; (v) internal audit outsourcing services; (vi) management functions or human resources; (vii) broker or dealer, investment adviser or investment banking services; (viii) legal services and expert services unrelated to the audit; and (ix) any other service the Public Company Accounting Oversight Board determines, by regulation, is impermissible.
Pre-approval by the Committee of any permissible non-audit services is not required so long as: (i) the aggregate amount of all such permissible non-audit services provided to the Fund, the Adviser and any service providers controlling, controlled by or under common control with the Adviser that provide ongoing services to the Fund (“Covered Service Providers”) constitutes not more than 5% of the total amount of revenues paid to the independent auditors during the fiscal year in which the permissible non-audit services are provided to (a) the Fund, (b) the Adviser and (c) any entity controlling, controlled by or under common control with the Adviser that provides ongoing services to the Fund during the fiscal year in which the services are provided that would have to be approved by the Committee; (ii) the permissible non-audit services were not recognized by the Fund at the time of the engagement to be non-audit services; and (iii) such services are promptly brought to the attention of the Committee and approved by the Committee (or its delegate(s)) prior to the completion of the audit.
(2) For the Western Asset Global Partners Income Fund Inc., the percentage of fees that were approved by the audit committee, with respect to: Audit-Related Fees were 100% and 100% for 2014 and 2015; Tax Fees were 100% and 100% for 2014 and 2015; and Other Fees were 100% and 100% for 2014 and 2015.
(f) N/A
(g) Non-audit fees billed by the Auditor for services rendered to Western Asset Global Partners Income Fund Inc., LMPFA and any entity controlling, controlled by, or under common control with LMPFA that provides ongoing services to Western Asset Global Partners Income Fund Inc. during the reporting period were $0 in 2015.
(h) Yes. Western Asset Global Partners Income Fund Inc.’s Audit Committee has considered whether the provision of non-audit services that were rendered to Service Affiliates, which were not pre-approved (not requiring pre-approval), is compatible with maintaining the Accountant’s independence. All services provided by the Auditor to the Western Asset Global Partners Income Fund Inc. or to Service Affiliates, which were required to be pre-approved, were pre-approved as required.
| ITEM 5. | AUDIT COMMITTEE OF LISTED REGISTRANTS. |
a) Registrant has a separately-designated standing Audit Committee established in accordance with Section 3(a)58(A) of the Exchange Act. The Audit Committee consists of the following Board members:
Robert D. Agdern (Effective January 1, 2015, Mr. Agdern became a member of the Audit Committee and the Board of Directors.)
William R. Hutchinson
Paolo M. Cucchi
Daniel P. Cronin
Carol L. Colman
Leslie H. Gelb
Eileen A. Kamerick
Dr. Riordan Roett
b) Not applicable
| ITEM 6. | SCHEDULE OF INVESTMENTS. |
Included herein under Item 1.
| ITEM 7. | PROXY VOTING – LMPFA & Western Asset Management Company (and affiliates) |
Proxy Voting Guidelines and Procedures
Legg Mason Partners Fund Advisor, LLC (“LMPFA”) delegates the responsibility for voting proxies for the fund to the subadviser through its contracts with the subadviser. The subadviser will use its own proxy voting policies and procedures to vote proxies. Accordingly, LMPFA does not expect to have proxy-voting responsibility for the fund. Should LMPFA become responsible for voting proxies for any reason, such as the inability of the subadviser to provide investment advisory services, LMPFA shall utilize the proxy voting guidelines established by the most recent subadviser to vote proxies until a new subadviser is retained.
The subadviser’s Proxy Voting Policies and Procedures govern in determining how proxies relating to the fund’s portfolio securities are voted and are provided below. Information regarding how each fund voted proxies (if any) relating to portfolio securities during the most recent 12-month period ended June 30 is available without charge (1) by calling 888-777-0102, (2) on the fund’s website at http://www.lmcef.com and (3) on the SEC’s website at http://www.sec.gov.
Background
Western Asset Management Company (“WA”), Western Asset Management Company Limited (“WAML”), Western Asset Management Company Ltd (“WAMCL”) and Western Asset Management Company Pte. Ltd. (“WAMC”) (together “Western Asset”) have adopted and implemented policies and procedures that we believe are reasonably designed to ensure that proxies are voted in the best interest of clients, in accordance with our fiduciary duties and SEC Rule 206(4)-6 under the Investment Advisers Act of 1940 (“Advisers Act”). Our authority to vote the proxies of our clients is established through investment management agreements or comparable documents, and our proxy voting guidelines have been tailored to reflect these specific contractual obligations. In addition to SEC requirements governing advisers, our proxy voting policies reflect the long-standing fiduciary standards and responsibilities for ERISA accounts. Unless a manager of ERISA assets has been expressly precluded from voting proxies, the Department of Labor has determined that the responsibility for these votes lies with the Investment Manager.
In exercising its voting authority, Western Asset will not consult or enter into agreements with officers, directors or employees of Legg Mason Inc. or any of its affiliates (except that WA, WAML, WAMCL and WAMC may so consult and agree with each other) regarding the voting of any securities owned by its clients.
Policy
Western Asset’s proxy voting procedures are designed and implemented in a way that is reasonably expected to ensure that proxy matters are handled in the best interest of our clients. While the guidelines included in the procedures are intended to provide a benchmark for voting standards, each vote is ultimately cast on a case-by-case basis, taking into consideration Western Asset’s contractual obligations to our clients and all other relevant facts and circumstances at the time of the vote (such that these guidelines may be overridden to the extent Western Asset deems appropriate).
Procedures
Responsibility and Oversight
The Western Asset Legal and Compliance Department (“Legal and Compliance Department”) is responsible for administering and overseeing the proxy voting process. The gathering of proxies is coordinated through the Corporate Actions area of Investment Support (“Corporate Actions”). Research analysts and portfolio managers are responsible for determining appropriate voting positions on each proxy utilizing any applicable guidelines contained in these procedures.
Client Authority
The Investment Management Agreement for each client is reviewed at account start-up for proxy voting instructions. If an agreement is silent on proxy voting, but contains an overall delegation of discretionary authority or if the account represents assets of an ERISA plan, Western Asset will assume responsibility for proxy voting. The Legal and Compliance Department maintains a matrix of proxy voting authority.
Proxy Gathering
Registered owners of record, client custodians, client banks and trustees (“Proxy Recipients”) that receive proxy materials on behalf of clients should forward them to Corporate Actions. Proxy Recipients for new clients (or, if Western Asset becomes aware that the applicable Proxy Recipient for an existing client has changed, the Proxy Recipient for the existing client) are notified at start-up of appropriate routing to Corporate Actions of proxy materials received and reminded of their responsibility to forward all proxy materials on a timely basis. If Western Asset personnel other than Corporate Actions receive proxy materials, they should promptly forward the materials to Corporate Actions.
Proxy Voting
Once proxy materials are received by Corporate Actions, they are forwarded to the Legal and Compliance Department for coordination and the following actions:
| | a. | Proxies are reviewed to determine accounts impacted. |
| | b. | Impacted accounts are checked to confirm Western Asset voting authority. |
| | c. | Legal and Compliance Department staff reviews proxy issues to determine any material conflicts of interest. (See conflicts of interest section of these procedures for further information on determining material conflicts of interest.) |
| | d. | If a material conflict of interest exists, (i) to the extent reasonably practicable and permitted by applicable law, the client is promptly notified, the conflict is disclosed and Western Asset obtains the client’s proxy voting instructions, and (ii) to the extent that it is not reasonably |
| | practicable or permitted by applicable law to notify the client and obtain such instructions (e.g., the client is a mutual fund or other commingled vehicle or is an ERISA plan client), Western Asset seeks voting instructions from an independent third party. |
| | e. | Legal and Compliance Department staff provides proxy material to the appropriate research analyst or portfolio manager to obtain their recommended vote. Research analysts and portfolio managers determine votes on a case-by-case basis taking into account the voting guidelines contained in these procedures. For avoidance of doubt, depending on the best interest of each individual client, Western Asset may vote the same proxy differently for different clients. The analyst’s or portfolio manager’s basis for their decision is documented and maintained by the Legal and Compliance Department. |
| | f. | Legal and Compliance Department staff votes the proxy pursuant to the instructions received in (d) or (e) and returns the voted proxy as indicated in the proxy materials. |
Timing
Western Asset personnel act in such a manner to ensure that, absent special circumstances, the proxy gathering and proxy voting steps noted above can be completed before the applicable deadline for returning proxy votes.
Recordkeeping
Western Asset maintains records of proxies voted pursuant to Section 204-2 of the Advisers Act and ERISA DOL Bulletin 94-2. These records include:
| | a. | A copy of Western Asset’s policies and procedures. |
| | b. | Copies of proxy statements received regarding client securities. |
| | c. | A copy of any document created by Western Asset that was material to making a decision how to vote proxies. |
| | d. | Each written client request for proxy voting records and Western Asset’s written response to both verbal and written client requests. |
| | 2. | Exchange ticker symbol of the issuer’s shares to be voted; |
| | 3. | Committee on Uniform Securities Identification Procedures (“CUSIP”) number for the shares to be voted; |
| | 4. | A brief identification of the matter voted on; |
| | 5. | Whether the matter was proposed by the issuer or by a shareholder of the issuer; |
| | 6. | Whether a vote was cast on the matter; |
| | 7. | A record of how the vote was cast; and |
| | 8. | Whether the vote was cast for or against the recommendation of the issuer’s management team. |
Records are maintained in an easily accessible place for five years, the first two in Western Asset’s offices.
Disclosure
Part II of the WA Form ADV, the WAML Form ADV, the WAMCL Form ADV and the WAMC Form ADV, each, contain a description of Western Asset’s proxy policies. Clients will be provided a copy of these policies and procedures upon request. In addition, upon request, clients may receive reports on how their proxies have been voted.
Conflicts of Interest
All proxies are reviewed by the Legal and Compliance Department for material conflicts of interest. Issues to be reviewed include, but are not limited to:
| | 1. | Whether Western Asset (or, to the extent required to be considered by applicable law, its affiliates) manages assets for the company or an employee group of the company or otherwise has an interest in the company; |
| | 2. | Whether Western Asset or an officer or director of Western Asset or the applicable portfolio manager or analyst responsible for recommending the proxy vote (together, “Voting Persons”) is a close relative of or has a personal or business relationship with an executive, director or person who is a candidate for director of the company or is a participant in a proxy contest; and |
| | 3. | Whether there is any other business or personal relationship where a Voting Person has a personal interest in the outcome of the matter before shareholders. |
Voting Guidelines
Western Asset’s substantive voting decisions turn on the particular facts and circumstances of each proxy vote and are evaluated by the designated research analyst or portfolio manager. The examples outlined below are meant as guidelines to aid in the decision making process.
Guidelines are grouped according to the types of proposals generally presented to shareholders. Part I deals with proposals which have been approved and are recommended by a company’s board of directors; Part II deals with proposals submitted by shareholders for inclusion in proxy statements; Part III addresses issues relating to voting shares of investment companies; and Part IV addresses unique considerations pertaining to foreign issuers.
I. Board Approved Proposals
The vast majority of matters presented to shareholders for a vote involve proposals made by a company itself that have been approved and recommended by its board of directors. In view of the enhanced corporate governance practices currently being implemented in public companies, Western Asset generally votes in support of decisions reached by independent boards of directors. More specific guidelines related to certain board-approved proposals are as follows:
1. Matters relating to the Board of Directors
Western Asset votes proxies for the election of the company’s nominees for directors and for board-approved proposals on other matters relating to the board of directors with the following exceptions:
| | a. | Votes are withheld for the entire board of directors if the board does not have a majority of independent directors or the board does not have nominating, audit and compensation committees composed solely of independent directors. |
| | b. | Votes are withheld for any nominee for director who is considered an independent director by the company and who has received compensation from the company other than for service as a director. |
| | c. | Votes are withheld for any nominee for director who attends less than 75% of board and committee meetings without valid reasons for absences. |
| | d. | Votes are cast on a case-by-case basis in contested elections of directors. |
2. Matters relating to Executive Compensation
Western Asset generally favors compensation programs that relate executive compensation to a company’s long-term performance. Votes are cast on a case-by-case basis on board-approved proposals relating to executive compensation, except as follows:
| | a. | Except where the firm is otherwise withholding votes for the entire board of directors, Western Asset votes for stock option plans that will result in a minimal annual dilution. |
| | b. | Western Asset votes against stock option plans or proposals that permit replacing or repricing of underwater options. |
| | c. | Western Asset votes against stock option plans that permit issuance of options with an exercise price below the stock’s current market price. |
| | d. | Except where the firm is otherwise withholding votes for the entire board of directors, Western Asset votes for employee stock purchase plans that limit the discount for shares purchased under the plan to no more than 15% of their market value, have an offering period of 27 months or less and result in dilution of 10% or less. |
3. Matters relating to Capitalization
The management of a company’s capital structure involves a number of important issues, including cash flows, financing needs and market conditions that are unique to the circumstances of each company. As a result, Western Asset votes on a case-by-case basis on board-approved proposals involving changes to a company’s capitalization except where Western Asset is otherwise withholding votes for the entire board of directors.
| | a. | Western Asset votes for proposals relating to the authorization of additional common stock. |
| | b. | Western Asset votes for proposals to effect stock splits (excluding reverse stock splits). |
| | c. | Western Asset votes for proposals authorizing share repurchase programs. |
4. Matters relating to Acquisitions, Mergers, Reorganizations and Other Transactions
Western Asset votes these issues on a case-by-case basis on board-approved transactions.
5. Matters relating to Anti-Takeover Measures
Western Asset votes against board-approved proposals to adopt anti-takeover measures except as follows:
| | a. | Western Asset votes on a case-by-case basis on proposals to ratify or approve shareholder rights plans. |
| | b. | Western Asset votes on a case-by-case basis on proposals to adopt fair price provisions. |
6. Other Business Matters
Western Asset votes for board-approved proposals approving such routine business matters such as changing the company’s name, ratifying the appointment of auditors and procedural matters relating to the shareholder meeting.
| | a. | Western Asset votes on a case-by-case basis on proposals to amend a company’s charter or bylaws. |
| | b. | Western Asset votes against authorization to transact other unidentified, substantive business at the meeting. |
II. Shareholder Proposals
SEC regulations permit shareholders to submit proposals for inclusion in a company’s proxy statement. These proposals generally seek to change some aspect of a company’s corporate governance structure or to change some aspect of its business operations. Western Asset votes in accordance with the recommendation of the company’s board of directors on all shareholder proposals, except as follows:
1. Western Asset votes for shareholder proposals to require shareholder approval of shareholder rights plans.
2. Western Asset votes for shareholder proposals that are consistent with Western Asset’s proxy voting guidelines for board-approved proposals.
3. Western Asset votes on a case-by-case basis on other shareholder proposals where the firm is otherwise withholding votes for the entire board of directors.
III. Voting Shares of Investment Companies
Western Asset may utilize shares of open or closed-end investment companies to implement its investment strategies. Shareholder votes for investment companies that fall within the categories listed in Parts I and II above are voted in accordance with those guidelines.
1. Western Asset votes on a case-by-case basis on proposals relating to changes in the investment objectives of an investment company taking into account the original intent of the fund and the role the fund plays in the clients’ portfolios.
2. Western Asset votes on a case-by-case basis all proposals that would result in increases in expenses (e.g., proposals to adopt 12b-1 plans, alter investment advisory arrangements or approve fund mergers) taking into account comparable expenses for similar funds and the services to be provided.
IV. Voting Shares of Foreign Issuers
In the event Western Asset is required to vote on securities held in non-U.S. issuers – i.e. issuers that are incorporated under the laws of a foreign jurisdiction and that are not listed on a U.S. securities exchange or the NASDAQ stock market, the following guidelines are used, which are premised on the existence of a sound corporate governance and disclosure framework. These guidelines, however, may not be appropriate under some circumstances for foreign issuers and therefore apply only where applicable.
1. Western Asset votes for shareholder proposals calling for a majority of the directors to be independent of management.
2. Western Asset votes for shareholder proposals seeking to increase the independence of board nominating, audit and compensation committees.
3. Western Asset votes for shareholder proposals that implement corporate governance standards similar to those established under U.S. federal law and the listing requirements of U.S. stock exchanges, and that do not otherwise violate the laws of the jurisdiction under which the company is incorporated.
4. Western Asset votes on a case-by-case basis on proposals relating to (1) the issuance of common stock in excess of 20% of a company’s outstanding common stock where shareholders do not have preemptive rights, or (2) the issuance of common stock in excess of 100% of a company’s outstanding common stock where shareholders have preemptive rights.
Retirement Accounts
For accounts subject to ERISA, as well as other Retirement Accounts, Western Asset is presumed to have the responsibility to vote proxies for the client. The Department of Labor (“DOL”) has issued a bulletin that states that investment managers have the responsibility to vote proxies on behalf of Retirement Accounts unless the authority to vote proxies has been specifically reserved to another named fiduciary. Furthermore, unless Western Asset is expressly precluded from voting the proxies, the DOL has determined that the responsibility remains with the investment manager.
In order to comply with the DOL’s position, Western Asset will be presumed to have the obligation to vote proxies for its Retirement Accounts unless Western Asset has obtained a specific written instruction indicating that: (a) the right to vote proxies has been reserved to a named fiduciary of the client, and (b) Western Asset is precluded from voting proxies on behalf of the client. If Western Asset does not receive such an instruction, Western Asset will be responsible for voting proxies in the best interests of the Retirement Account client and in accordance with any proxy voting guidelines provided by the client.
| ITEM 8. | INVESTMENT PROFESSIONALS OF CLOSED-END MANAGEMENT INVESTMENT COMPANIES. |
(a)(1):
| | | | |
NAME AND
ADDRESS | | LENGTH OF
TIME SERVED | | PRINCIPAL OCCUPATION(S) DURING PAST 5 YEARS |
S. Kenneth Leech Western Asset 385 East Colorado Blvd. Pasadena, CA 91101 | | Since 2006 | | Responsible for the day-to-day management with other members of the Fund’s portfolio management team; Chief Investment Officer of Western Asset from 1998 to 2008 and since 2014; Senior Advisor/Chief Investment Officer Emeritus of Western Asset from 2008-2013; Co- Chief Investment Officer of Western Asset from 2013-2014. |
| | |
Michael C. Buchanan Western Asset 385 East Colorado Blvd. Pasadena, CA 91101 | | Since 2006 | | Responsible for the day-to-day management with other members of the Fund’s portfolio management team; Managing Director and head of U.S. Credit Products from 2003-2005 at Credit Suisse Asset Management |
| | | | |
Ryan K. Brist Western Asset 385 East Colorado Blvd. Pasadena, CA 91101 | | Since 2010 | | Responsible for the day-to-day management with other members of the Fund’s portfolio management team; Head of U.S. Investment Grade Credit of Western Asset since 2009; Chief Investment Officer and Portfolio Manager at Logan Circle Partners, L.P. from 2007-2009; Co-Chief Investment Officer and Senior Portfolio Manager at Delaware Investment Advisors from 2000-2007 |
| | |
Christopher F. Kilpatrick Western Asset 385 East Colorado Blvd. Pasadena, CA 91101 | | Since 2012 | | Responsible for the day-to-day management with other members of the Fund’s portfolio management team; employed by Western Asset Management as an investment professional for at least the past five years. |
| | |
Chia-Liang Lian Western Asset 385 East Colorado Blvd. Pasadena, CA 91101 | | Since 2014 | | Responsible for the day-to-day management with other members of the Fund’s portfolio management team; employed by Western Asset Management as an investment professional since 2011; Prior to joining Western Asset, Mr. Lian spent approximately six years with the Pacific Investment Management Company (PIMCO), where he served as Head of Emerging Asia Portfolio Management. |
(a)(2): DATA TO BE PROVIDED BY FINANCIAL CONTROL
The following tables set forth certain additional information with respect to the fund’s investment professionals for the fund. Unless noted otherwise, all information is provided as of August 31, 2015.
Other Accounts Managed by Investment professionals
The table below identifies the number of accounts (other than the fund) for which the fund’s investment professionals have day-to-day management responsibilities and the total assets in such accounts, within each of the following categories: registered investment companies, other pooled investment vehicles, and other accounts. For each category, the number of accounts and total assets in the accounts where fees are based on performance is also indicated.
| | | | | | | | | | |
Name of PM | | Type of Account | | Number of Accounts
Managed | | Total Assets Managed | | Number of Accounts
Managed for which
Advisory Fee is
Performance-Based | | Assets Managed for
which Advisory Fee is
Performance-Based |
| S. Kenneth Leech‡ | | Other Registered Investment Companies | | 109 | | $189.3 billion | | None | | None |
| | Other Pooled Vehicles | | 271 | | $86.1 billion | | 9 | | $1.7 billion |
| | Other Accounts | | 632 | | $172.0 billion | | 57 | | $17.1 billion |
| | | | | |
| Michael C. Buchanan‡ | | Other Registered Investment Companies | | 43 | | $40.2 billion | | None | | None |
| | Other Pooled Vehicles | | 75 | | $34.9 billion | | 4 | | $1.2 billion |
| | Other Accounts | | 188 | | $51.5 billion | | 21 | | $7.7 billion |
| | | | | |
| Chia-Liang Lian‡ | | Other Registered Investment Companies | | 27 | | $31.6 billion | | None | | None |
| | Other Pooled Vehicles | | 40 | | $13.7 billion | | 1 | | $118 million |
| | Other Accounts | | 153 | | $32.5 billion | | 28 | | $8.9 billion |
| | | | | |
| Christopher Kilpatrick‡ | | Other Registered Investment Companies | | 9 | | $3.7 billion | | None | | None |
| | Other Pooled Vehicles | | None | | None | | None | | None |
| | Other Accounts | | None | | None | | None | | None |
| | | | | |
| Ryan Brist‡ | | Other Registered Investment Companies | | 8 | | $2.0 billion | | None | | None |
| | Other Pooled Vehicles | | 21 | | $13.0 billion | | None | | None |
| | Other Accounts | | 50 | | $19.3 billion | | 3 | | $641 million |
| ‡ | The numbers above reflect the overall number of portfolios managed by employees of Western Asset Management Company (“Western Asset”). Mr. Leech is involved in the management of all the Firm’s portfolios, but they are not solely responsible for particular portfolios. Western Asset’s investment discipline emphasizes a team approach that combines the efforts of groups of specialists working in different market sectors. They are responsible for overseeing implementation of Western Asset’s overall investment ideas and coordinating the work of the various sector teams. This structure ensures that client portfolios benefit from a consensus that draws on the expertise of all team members. |
(a)(3): Investment Professional Compensation
With respect to the compensation of the investment professionals, Western Asset’s compensation system assigns each employee a total compensation range, which is derived from annual market surveys that benchmark each role with its job function and peer universe. This method is designed to reward employees with total compensation reflective of the external market value of their skills, experience, and ability to produce desired results. Standard compensation includes competitive base salaries, generous employee benefits, and a retirement plan.
In addition, the subadviser’s employees are eligible for bonuses. These are structured to closely align the interests of employees with those of the subadviser, and are determined by the professional’s job function and pre-tax performance as measured by a formal review process. All bonuses are completely discretionary. The principal factor considered is an investment professional’s investment performance versus appropriate peer groups and benchmarks (e.g., a securities index and with respect to a fund, the benchmark set forth in the fund’s Prospectus to which the fund’s average annual total returns are compared or, if none, the benchmark set forth in the fund’s annual report). Performance is reviewed on a 1, 3 and 5 year basis for compensation—with 3 years having the most emphasis. The subadviser may also measure an investment professional’s pre-tax investment performance against other benchmarks, as it determines appropriate. Because investment professionals are generally responsible for multiple accounts (including the funds) with similar investment strategies, they are generally compensated on the performance of the aggregate group of similar accounts, rather than a specific account. Other factors that may be considered when making bonus decisions include client service, business development, length of service to the subadviser, management or supervisory responsibilities, contributions to developing business strategy and overall contributions to the subadviser’s business.
Finally, in order to attract and retain top talent, all professionals are eligible for additional incentives in recognition of outstanding performance. These are determined based upon the factors described above and include Legg Mason stock options and long-term incentives that vest over a set period of time past the award date.
Potential Conflicts of Interest
Conflicts of Interest
The manager, the subadviser and investment professionals have interests which conflict with the interests of the fund. There is no guarantee that the policies and procedures adopted by the manager, the subadviser and the fund will be able to identify or mitigate these conflicts of interest.
Some examples of material conflicts of interest include:
Allocation of Limited Time and Attention. An investment professional who is responsible for managing multiple funds and/or accounts may devote unequal time and attention to the management of those funds and/or accounts. An investment professional may not be able to formulate as complete a strategy or identify
equally attractive investment opportunities for each of those funds and accounts as might be the case if he or she were to devote substantially more attention to the management of a single fund. Such an investment professional may make general determinations across multiple funds, rather than tailoring a unique approach for each fund. The effects of this conflict may be more pronounced where funds and/or accounts overseen by a particular investment professional have different investment strategies.
Allocation of Limited Investment Opportunities; Aggregation of Orders. If an investment professional identifies a limited investment opportunity that may be suitable for multiple funds and/or accounts, the opportunity may be allocated among these several funds or accounts, which may limit the fund’s ability to take full advantage of the investment opportunity. Additionally, the subadviser may aggregate transaction orders for multiple accounts for purpose of execution. Such aggregation may cause the price or brokerage costs to be less favorable to a particular client than if similar transactions were not being executed concurrently for other accounts. In addition, the subadviser’s trade allocation policies may result in the fund’s orders not being fully executed or being delayed in execution.
Pursuit of Differing Strategies. At times, an investment professional may determine that an investment opportunity may be appropriate for only some of the funds and/or accounts for which he or she exercises investment responsibility, or may decide that certain of the funds and/or accounts should take differing positions with respect to a particular security. In these cases, the investment professional may place separate transactions for one or more funds or accounts which may affect the market price of the security or the execution of the transaction, or both, to the detriment or benefit of one or more other funds and/or accounts. For example, an investment professional may determine that it would be in the interest of another account to sell a security that the fund holds long, potentially resulting in a decrease in the market value of the security held by the fund.
Cross Trades. Investment professionals may manage funds that engage in cross trades, where one of the manager’s funds or accounts sells a particular security to another fund or account managed by the same manager. Cross trades may pose conflicts of interest because of, for example, the possibility that one account sells a security to another account at a higher price than an independent third party would pay or otherwise enters into a transaction that it would not enter into with an independent party, such as the sale of a difficult-to-obtain security.
Selection of Broker/Dealers. Investment professionals may select or influence the selection of the brokers and dealers that are used to execute securities transactions for the funds and/or accounts that they supervise. In addition to executing trades, some brokers and dealers provide the subadviser with brokerage and research services, These services may be taken into account in the selection of brokers and dealers whether a broker is being selected to effect a trade on an agency basis for a commission or (as is normally the case for the funds) whether a dealer is being selected to effect a trade on a principal basis. This may result in the payment of higher brokerage fees and/or execution at a less favorable price than might have otherwise been available. The services obtained may ultimately be more beneficial to certain of the manager’s funds or accounts than to others (but not necessarily to the funds that pay the increased commission or incur the less favorable execution). A decision as to the selection of brokers and dealers could therefore yield disproportionate costs and benefits among the funds and/or accounts managed.
Variation in Financial and Other Benefits. A conflict of interest arises where the financial or other benefits available to an investment professional differ among the funds and/or accounts that he or she manages. If the amount or structure of the investment manager’s management fee and/or an investment professional’s compensation differs among funds and/or accounts (such as where certain funds or accounts pay higher management fees or performance-based management fees), the investment professional might be motivated to help certain funds and/or accounts over others. Similarly, the desire to maintain assets under management or to enhance the investment professional’s performance record or to derive other rewards, financial or otherwise, could influence the investment professional in affording preferential treatment to those funds and/or accounts that could most significantly benefit the investment professional. An investment professional may, for example, have an incentive to allocate favorable or limited opportunity investments or structure the timing of investments to favor such funds and/or accounts. Also, an investment professional’s or the manager’s or the subadviser’s desire to increase assets under management could influence the
investment professional to keep a fund open for new investors without regard to potential benefits of closing the fund to new investors. Additionally, the investment professional might be motivated to favor funds and/or accounts in which he or she has an ownership interest or in which the investment manager and/or its affiliates have ownership interests. Conversely, if an investment professional does not personally hold an investment in the fund, the investment professional’s conflicts of interest with respect to the fund may be more acute.
Related Business Opportunities. The investment manager or its affiliates may provide more services (such as distribution or recordkeeping) for some types of funds or accounts than for others. In such cases, an investment professional may benefit, either directly or indirectly, by devoting disproportionate attention to the management of funds and/or accounts that provide greater overall returns to the investment manager and its affiliates.
(a)(4): Investment Professional Securities Ownership
The table below identifies the dollar range of securities beneficially owned by each investment professional as of August 31, 2015.
| | |
Investment professional(s) | | Dollar Range of
Portfolio
Securities
Beneficially
Owned |
S. Kenneth Leech | | A |
Michael C. Buchanan Ryan K. Brist Christopher F. Kilpatrick Chia-Liang Lian | | A
A A A |
Dollar Range ownership is as follows:
A: none
B: $1 - $10,000
C: 10,001 - $50,000
D: $50,001 - $100,000
E: $100,001 - $500,000
F: $500,001 - $1 million
G: over $1 million
| ITEM 9. | PURCHASES OF EQUITY SECURITIES BY CLOSED-END MANAGEMENT INVESTMENT COMPANY AND AFFILIATED PURCHASERS. |
NONE.
| ITEM 10. | SUBMISSION OF MATTERS TO A VOTE OF SECURITY HOLDERS. |
NONE.
| ITEM 11. | CONTROLS AND PROCEDURES. |
| | (a) | The registrant’s principal executive officer and principal financial officer have concluded that the registrant’s disclosure controls and procedures (as defined in Rule 30a- 3(c) under the Investment Company Act of 1940, as amended (the “1940 Act”)) are effective as of a date within 90 days of the filing date of this report that includes the disclosure required by this paragraph, based on their evaluation of the disclosure controls and procedures required by Rule 30a-3(b) under the 1940 Act and 15d-15(b) under the Securities Exchange Act of 1934. |
| | (b) | There were no changes in the registrant’s internal control over financial reporting (as defined in Rule 30a-3(d) under the 1940 Act) that occurred during the second fiscal quarter of the period covered by this report that have materially affected, or are likely to materially affect the registrant’s internal control over financial reporting and |
(a) (1) Code of Ethics attached hereto.
Exhibit 99.CODE ETH
(a) (2) Certifications pursuant to section 302 of the Sarbanes-Oxley Act of 2002 attached hereto.
Exhibit 99.CERT
(b) Certifications pursuant to Section 906 of the Sarbanes-Oxley Act of 2002 attached hereto.
Exhibit 99.906CERT
SIGNATURES
Pursuant to the requirements of the Securities Exchange Act of 1934 and the Investment Company Act of 1940, the registrant has duly caused this Report to be signed on its behalf by the undersigned, there unto duly authorized.
Western Asset Global Partners Income Fund Inc.
| | |
| By: | | /s/ Jane Trust |
| | Jane Trust |
| | Chief Executive Officer |
| |
| Date: | | October 21, 2015 |
Pursuant to the requirements of the Securities Exchange Act of 1934 and the Investment Company Act of 1940, this report has been signed below by the following persons on behalf of the registrant and in the capacities and on the dates indicated.
| | |
| By: | | /s/ Jane Trust |
| | Jane Trust |
| | Chief Executive Officer |
| |
| Date: | | October 21, 2015 |
| |
| By: | | /s/ Richard F. Sennett |
| | Richard F. Sennett |
| | Principal Financial Officer |
| |
| Date: | | October 21, 2015 |