Table of Contents
UNITED STATES
SECURITIES AND EXCHANGE COMMISSION
Washington, D.C. 20549
FORM N-CSR
CERTIFIED SHAREHOLDER REPORT OF REGISTERED
MANAGEMENT INVESTMENT COMPANIES
Investment Company Act file number 811-07994
Western Asset Global Partners Income Fund Inc.
(Exact name of registrant as specified in charter)
620 Eighth Avenue, 49th Floor, New York, NY 10018
(Address of principal executive offices) (Zip code)
Robert I. Frenkel, Esq.
Legg Mason & Co., LLC
100 First Stamford Place
Stamford, CT 06902
(Name and address of agent for service)
Registrant’s telephone number, including area code: 1-877-721-1926
Date of fiscal year end: August 31
Date of reporting period: February 29, 2016
Table of Contents
ITEM 1. REPORT TO STOCKHOLDERS.
The Semi-Annual Report to Stockholders is filed herewith.
Table of Contents

| Semi-Annual Report | February 29, 2016 |
WESTERN ASSET
GLOBAL PARTNERS INCOME FUND INC. (GDF)

| INVESTMENT PRODUCTS: NOT FDIC INSURED • NO BANK GUARANTEE • MAY LOSE VALUE |
Table of Contents
Fund objectives
The Fund seeks to maintain a high level of current income. As a secondary objective, the Fund seeks capital appreciation.
Under normal market conditions, the Fund will invest at least 33% of its total assets in securities of issuers that are, or are incorporated in or generate the majority of their revenue in, emerging market countries and at least 33% of its total assets in high-yield U.S. corporate debt securities. The Fund may also invest up to 33% of its total assets in a broad range of other U.S. and non-U.S. fixed-income securities, both investment grade and high-yield securities.

Dear Shareholder,
We are pleased to provide the semi-annual report of Western Asset Global Partners Income Fund Inc. for the six-month reporting period ended February 29, 2016. Please read on for Fund performance information and a detailed look at prevailing economic and market conditions during the Fund’s reporting period.
Special shareholder notice:
On November 16, 2015, Western Asset Global Partners Income Fund Inc. and Western Asset Global High Income Fund Inc. announced approval by each Fund’s Board of Directors of a proposal to merge Western Asset Global Partners Income Fund Inc. with and into Western Asset Global High Income Fund Inc., subject to approval by the stockholders of each Fund. If approved, the merger is anticipated to occur during the second quarter of 2016.
Western Asset Global Partners Income Fund Inc. and Western Asset Global High Income Fund Inc. have similar investment objectives. Western Asset Global Partners Income Fund Inc.’s primary investment objective is to maintain a high level of current income and its secondary objective is to seek capital appreciation. Western Asset Global High Income Fund Inc.’s primary investment objective is high current income and its secondary investment objective is total return.
If the proposed merger is approved by the stockholders of both Funds, stockholders of Western Asset Global Partners Income Fund Inc. would receive common stock of Western Asset Global High Income Fund Inc., based on each Fund’s respective net asset value per share.
In recommending the merger to each Board of Directors, the Funds’ investment adviser and subadviser, Legg Mason Partners Fund Advisor, LLC and Western Asset Management Company, respectively, among other things, noted the similar investment objectives and similar investment policies and strategies of the Funds, and that Western Asset Global
| II | Western Asset Global Partners Income Fund Inc. |
Table of Contents
Partners Income Fund Inc. is smaller than Western Asset Global High Income Fund Inc. and has higher operating expenses as a percentage of net assets. Management and each Board of Directors believe it is in the best interests of stockholders to merge Western Asset Global Partners Income Fund Inc. with and into Western Asset Global High Income Fund Inc. in part because the combined Fund may benefit from economies of scale, as one set of fixed expenses would be spread over a larger asset base, as well as from enhanced market liquidity. Furthermore, stockholders of Western Asset Global Partners Income Fund Inc. would likely benefit from greater asset diversification, lower overall expenses and enhanced market liquidity as part of a larger Fund. Stockholders of Western Asset Global High Income Fund Inc. may benefit from greater asset diversification in addition to a more streamlined high yield product offering, allowing for more focused marketing and shareholder servicing efforts.
In connection with the proposal to merge the Funds, both Funds intend to file a combined proxy statement and prospectus with the Securities and Exchange Commission (“SEC”). Investors and stockholders are advised to read the proxy statement and prospectus when it becomes available because it will contain important information. When filed with the SEC, the proxy statement and prospectus and other documents filed by the Funds will be available free of charge at the SEC’s website, http://www.sec.gov. Stockholders can also obtain copies of these documents, when available, for free by calling the Funds at 1-888-777-0102. This is neither an offer to purchase nor a solicitation of an offer to sell shares of the Funds.
Western Asset Global Partners Income Fund Inc., Western Asset Global High Income Fund Inc., their directors and executive officers and investment adviser, members of their management and employees may be deemed to be participants in the solicitation of proxies from the Funds’ stockholders in connection with the proposed merger. Information concerning the interests of the participants in the solicitation will be set forth in the proxy statement and prospectus and stockholder reports of both Funds on Form N-CSR, to be filed with the SEC.
As always, we remain committed to providing you with excellent service and a full spectrum of investment choices. We also remain committed to supplementing the support you receive from your financial advisor. One way we accomplish this is through our website, www.lmcef.com. Here you can gain immediate access to market and investment information, including:
| • | Fund prices and performance, |
| • | Market insights and commentaries from our portfolio managers, and |
| • | A host of educational resources. |
We look forward to helping you meet your financial goals.
Sincerely,

Jane Trust, CFA
Chairman, President and Chief Executive Officer
March 31, 2016
| Western Asset Global Partners Income Fund Inc. | III |
Table of Contents
Economic review
The pace of U.S. economic activity was mixed during the six months ended February 29, 2016 (the “reporting period”). Looking back, the U.S. Department of Commerce reported that second quarter 2015 U.S. gross domestic product (“GDP”)i growth was 3.9%. Relatively solid growth was driven by increasing exports, accelerating personal consumption expenditures (“PCE”), declining imports, expanding state and local government spending, and rising nonresidential fixed investment. Third quarter 2015 GDP growth then moderated to 2.0%. Decelerating growth was primarily due to a downturn in private inventory investment and decelerations in exports, PCE, nonresidential fixed investment, state and local government spending, and residential fixed investment. Finally, the U.S. Department of Commerce’s final reading for fourth quarter 2015 GDP growth — released after the reporting period ended — was 1.4%. Slower growth was attributed to downturns in nonresidential fixed investment and state and local government spending, along with a deceleration in PCE and less export activity.
The U.S. labor market was a tailwind for the economy during the reporting period. When the period began, unemployment was 5.1%, as reported by the U.S. Department of Labor. By February 2016, unemployment was 4.9%, equaling its lowest level since February 2008.
Turning to the global economy, in its January 2016 World Economic Outlook Update, the International Monetary Fund (“IMF”) said “In advanced economies, a modest and uneven recovery is expected to continue, with a gradual further narrowing of output gaps. The picture for emerging market and developing economies is diverse but in many cases challenging.” From a regional perspective, the IMF currently estimates 2015 growth in the Eurozone at 1.5%, and is projecting 1.7% growth in 2016. Japan’s economy is expected to expand 0.6% in 2015 and 1.0% in 2016. Elsewhere, the IMF said that overall growth in emerging market countries decelerated in 2015, with growth of 4.0% versus 4.6% in 2014. However, the IMF believes emerging market growth will accelerate to 4.3% in 2016.
| IV | Western Asset Global Partners Income Fund Inc. |
Table of Contents
Market review
Q. How did the Federal Reserve Board (“Fed”)ii respond to the economic environment?
A. After an extended period of maintaining the federal funds rateiii at a historically low range between zero and 0.25%, the Fed increased the rate at its meeting on December 16, 2015. This marked the first rate hike since 2006. In particular, the U.S. central bank raised the federal funds rate to a range between 0.25% and 0.50%. In its official statement after the December 2015 meeting, the Fed said, “The stance of monetary policy remains accommodative after this increase, thereby supporting further improvement in labor market conditions and a return to 2 percent inflation….The Committee expects that economic conditions will evolve in a manner that will warrant only gradual increases in the federal funds rate; the federal funds rate is likely to remain, for some time, below levels that are expected to prevail in the longer run.” At its meetings that concluded on January 27, 2016 and March 16, 2016, after the reporting period ended, the Fed kept rates on hold.
Q. What actions did international central banks take during the reporting period?
A. Given the economic challenges in the Eurozone, the European Central Bank (“ECB”)iv took a number of actions to stimulate growth and ward off deflation. In January 2015, before the beginning of the reporting period, the ECB announced that, beginning in March 2015, it would start a €60 billion-a-month bond buying program that is expected to run until September 2016. In December 2015, the ECB extended its monthly bond buying program until at least March 2017. Finally, in March 2016, after the reporting period ended, the ECB announced that it would increase its bond purchasing program to €80 billion a month. It also cut its deposit rate to -0.4% and its main interest rate to 0%. In other developed countries, the Bank of England kept rates on hold at 0.50% during the reporting period, its lowest level since 2006. After holding rates steady at 0.10% for more than five years, in January 2016 the Bank of Japan announced that it cut the rate on current accounts that commercial banks hold with it to -0.10%. Elsewhere, after keeping rates steady at 6.0% since July 2012, the People’s Bank of China lowered rates six times from November 23, 2013 through October 23, 2015, with the last cut pushing rates down to 4.35%.
Q. Did Treasury yields trend higher or lower during the six months ended February 29, 2016?
A. Short-term Treasury yields edged higher, whereas long-term Treasury yields declined during the reporting period. When the period began, the yield on the two-year Treasury note was 0.74%. Its low for the period was 0.57% on October 14, 2015, and it peaked at 1.09% on December 29, 2015. The yield on the two-year Treasury note ended the period at 0.78%. The yield on the ten-year Treasury note began the period at 2.21%. Its peak of 2.36% occurred on November 9, 2015, and its low of 1.63% occurred on February 11, 2016. The yield on the ten-year Treasury note ended the period at 1.74%.
Q. What factors impacted the spread sectors (non-Treasuries) during the reporting period?
A. The spread sectors posted mixed results during the reporting period. High-yield corporate bonds were the weakest performers
| Western Asset Global Partners Income Fund Inc. | V |
Table of Contents
Investment commentary (cont’d)
over the six months ended February 29, 2016. In contrast, sectors that are generally less sensitive to rising interest rates largely posted positive results. Performance fluctuated with investor sentiment given the uncertainties regarding future Fed monetary policy, along with concerns over global growth and geopolitical issues. The broad U.S. bond market, as measured by the Barclays U.S. Aggregate Indexv, returned 2.20% during the six months ended February 29, 2016.
Q. How did the high-yield bond market perform over the six months ended February 29, 2016?
A. The U.S. high-yield bond market, as measured by the Barclays U.S. Corporate High Yield — 2% Issuer Cap Indexvi, returned -5.57% for the six months ended February 29, 2016. High yield bonds were volatile during the reporting period. While the overall high-yield default rate remained below its long-term average, the asset class declined during four of the six months of the reporting period. In particular, the Energy sector fell sharply as oil prices moved lower given weakening demand.
Q. How did the emerging market debt asset class perform over the reporting period?
A. The JPMorgan Emerging Markets Bond Index Global (“EMBI Global”)vii gained 1.97% during the six months ended February 29, 2016. The asset class declined during the first month of the reporting period due to concerns over economic growth in China, falling commodity prices and expectations for future Fed rate hikes. The asset class recouped its prior month loss in October 2015 as investor risk appetite improved. After declining over the next three months, the asset class rallied sharply in February 2016.
Performance review
For the six months ended February 29, 2016, Western Asset Global Partners Income Fund Inc. returned -7.64% based on its net asset value (“NAV”)viii and -4.20% based on its New York Stock Exchange (“NYSE”) market price per share. The Fund’s unmanaged benchmarks, the Barclays U.S. Corporate High Yield — 2% Issuer Cap Index and the EMBI Global, returned -5.57% and 1.97%, respectively, over the same time frame. The Lipper High Yield (Leveraged) Closed-End Funds Category Averageix returned -8.51% for the same period. Please note that Lipper performance returns are based on each fund’s NAV.
During this six-month period, the Fund made distributions to shareholders totaling $0.44 per share. As of February 29, 2016, the Fund estimates that all of the distributions were sourced from net investment income.* The performance table shows the Fund’s six-month total return based on its NAV and market price as of February 29, 2016. Past performance is no guarantee of future results.
| * | These estimates are not for tax purposes. The Fund will issue a Form 1099 with final composition of the distributions for tax purposes after year-end. A return of capital is not taxable and results in a reduction in the tax basis of a shareholder’s investment. For more information about a distribution’s composition, please refer to the Fund’s distribution press release or, if applicable, the Section 19 notice located in the press release section of our website, www.lmcef.com. |
| VI | Western Asset Global Partners Income Fund Inc. |
Table of Contents
| Performance Snapshot as of February 29, 2016 (unaudited) | ||||
| Price Per Share | 6-Month Total Return** | |||
| $8.87 (NAV) | -7.64 | %† | ||
| $7.52 (Market Price) | -4.20 | %‡ | ||
All figures represent past performance and are not a guarantee of future results. Performance figures for periods shorter than one year represent cumulative figures and are not annualized.
** Total returns are based on changes in NAV or market price, respectively. Returns reflect the deduction of all Fund expenses, including management fees, operating expenses, and other Fund expenses. Returns do not reflect the deduction of brokerage commissions or taxes that investors may pay on distributions or the sale of shares.
† Total return assumes the reinvestment of all distributions, including returns of capital, if any, at NAV.
‡ Total return assumes the reinvestment of all distributions, including returns of capital, if any, in additional shares in accordance with the Fund’s Dividend Reinvestment Plan.
Looking for additional information?
The Fund is traded under the symbol “GDF” and its closing market price is available in most newspapers under the NYSE listings. The daily NAV is available on-line under the symbol “XGDFX” on most financial websites. Barron’s and the Wall Street Journal’s Monday edition both carry closed-end fund tables that provide additional information. In addition, the Fund issues a quarterly press release that can be found on most major financial websites as well as www.lmcef.com.
In a continuing effort to provide information concerning the Fund, shareholders may call 1-888-777-0102 (toll free), Monday through Friday from 8:00 a.m. to 5:30 p.m. Eastern Time, for the Fund’s current NAV, market price and other information.
As always, thank you for your confidence in our stewardship of your assets.
Sincerely,
Jane Trust, CFA
Chairman, President and Chief Executive Officer
March 31, 2016
RISKS: The Fund’s investments are subject to credit risk, inflation risk, and interest rate risk. As interest rates rise, bond prices fall, reducing the value of the Fund’s fixed-income holdings. The Fund may invest in high-yield and foreign securities, including emerging markets, which involve risks beyond those inherent in higher-rated and domestic investments. High-yield bonds, commonly known as “junk bonds,” involve greater credit and liquidity risks than investment grade bonds. Investing in foreign securities is subject to certain risks not associated with domestic investing, such as currency fluctuations, and social, political and economic uncertainties, which could increase volatility. These risks are magnified in emerging or developing markets. Leverage may result in greater volatility of NAV and the market price of common shares and increases a shareholder’s risk of loss. Derivatives, such as options and futures, can be illiquid and harder to value, especially in declining markets. A small investment in certain derivatives may have a potentially large impact on the Fund’s performance.
| Western Asset Global Partners Income Fund Inc. | VII |
Table of Contents
Investment commentary (cont’d)
All investments are subject to risk including the possible loss of principal. Past performance is no guarantee of future results. All index performance reflects no deduction for fees, expenses or taxes. Please note that an investor cannot invest directly in an index.
The information provided is not intended to be a forecast of future events, a guarantee of future results or investment advice. Views expressed may differ from those of the firm as a whole. Forecasts and predictions are inherently limited and should not be relied upon as an indication of actual or future performance.
| i | Gross domestic product (“GDP”) is the market value of all final goods and services produced within a country in a given period of time. |
| ii | The Federal Reserve Board (“Fed”) is responsible for the formulation of U.S. policies designed to promote economic growth, full employment, stable prices and a sustainable pattern of international trade and payments. |
| iii | The federal funds rate is the rate charged by one depository institution on an overnight sale of immediately available funds (balances at the Federal Reserve) to another depository institution; the rate may vary from depository institution to depository institution and from day to day. |
| iv | The European Central Bank (“ECB”) is responsible for the monetary system of the European Union and the euro currency. |
| v | The Barclays U.S. Aggregate Index is a broad-based bond index comprised of government, corporate, mortgage- and asset-backed issues, rated investment grade or higher, and having at least one year to maturity. |
| vi | The Barclays U.S. Corporate High Yield — 2% Issuer Cap Index is an index of the 2% Issuer Cap component of the Barclays U.S. Corporate High Yield Index, which covers the U.S. dollar-denominated, non-investment grade, fixed-rate, taxable corporate bond market. |
| vii | The JPMorgan Emerging Markets Bond Index Global (“EMBI Global”) tracks total returns for U.S. dollar-denominated debt instruments issued by emerging market sovereign and quasi-sovereign entities: Brady bonds, loans, Eurobonds and local market instruments. |
| viii | Net asset value (“NAV”) is calculated by subtracting total liabilities, including liabilities associated with financial leverage (if any), from the closing value of all securities held by the Fund (plus all other assets) and dividing the result (total net assets) by the total number of the common shares outstanding. The NAV fluctuates with changes in the market prices of securities in which the Fund has invested. However, the price at which an investor may buy or sell shares of the Fund is the Fund’s market price as determined by supply of and demand for the Fund’s shares. |
| ix | Lipper, Inc., a wholly-owned subsidiary of Reuters, provides independent insight on global collective investments. Returns are based on the six-month period ended February 29, 2016, including the reinvestment of all distributions, including returns of capital, if any, calculated among the 33 funds in the Fund’s Lipper category. |
| VIII | Western Asset Global Partners Income Fund Inc. |
Table of Contents
Investment breakdown (%) as a percent of total investments
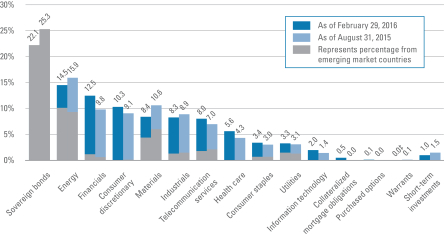
| † | The bar graph above represents the composition of the Fund’s investments as of February 29, 2016 and August 31, 2015 and does not include derivatives, such as futures contracts and forward foreign currency contracts. The Fund is actively managed. As a result, the composition of the Fund’s investments is subject to change at any time. |
| ‡ | Represents less than 0.01%. |
| Western Asset Global Partners Income Fund Inc. 2016 Semi-Annual Report | 1 |
Table of Contents
Economic exposure — February 29, 2016
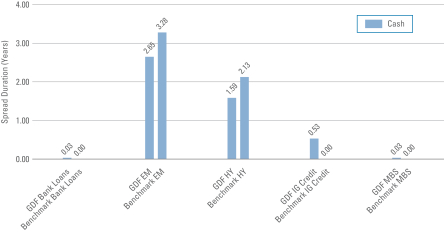
Total Spread Duration | ||
| GDF | — 4.83 years | |
| Benchmark | — 5.41 years | |
Spread duration measures the sensitivity to changes in spreads. The spread over Treasuries is the annual risk-premium demanded by investors to hold non-Treasury securities. Spread duration is quantified as the % change in price resulting from a 100 basis points change in spreads. For a security with positive spread duration, an increase in spreads would result in a price decline and a decline in spreads would result in a price increase. This chart highlights the market sector exposure of the Fund’s sectors relative to the selected benchmark sectors as of the end of the reporting period.
| Benchmark | — 50% Barclays U.S. Corporate High Yield — 2% Issuer Cap Index, 50% JPMorgan Emerging Markets Bond Index Global | |
| EM | — Emerging Markets | |
| GDF | — Western Asset Global Partners Income Fund Inc. | |
| HY | — High Yield | |
| IG Credit | — Investment Grade Credit | |
| MBS | — Mortgage-Backed Securities |
| 2 | Western Asset Global Partners Income Fund Inc. 2016 Semi-Annual Report |
Table of Contents
Effective duration (unaudited)
Interest rate exposure — February 29, 2016
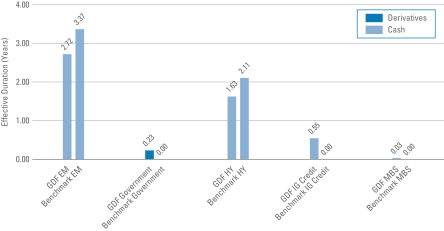
Total Effective Duration | ||
| GDF | — 5.16 years | |
| Benchmark | — 5.48 years | |
Effective duration measures the sensitivity to changes in relevant interest rates. Effective duration is quantified as the % change in price resulting from a 100 basis points change in interest rates. For a security with positive effective duration, an increase in interest rates would result in a price decline and a decline in interest rates would result in a price increase. This chart highlights the interest rate exposure of the Fund’s sectors relative to the selected benchmark sectors as of the end of the reporting period.
| Benchmark | — 50% Barclays U.S. Corporate High Yield — 2% Issuer Cap Index, 50% JPMorgan Emerging Markets Bond Index Global | |
| EM | — Emerging Markets | |
| GDF | — Western Asset Global Partners Income Fund Inc. | |
| HY | — High Yield | |
| IG Credit | — Investment Grade Credit | |
| MBS | — Mortgage-Backed Securities |
| Western Asset Global Partners Income Fund Inc. 2016 Semi-Annual Report | 3 |
Table of Contents
Schedule of investments (unaudited)
February 29, 2016
Western Asset Global Partners Income Fund Inc.
| Security | Rate | Maturity Date | Face Amount† | Value | ||||||||||||
| Corporate Bonds & Notes — 94.7% | ||||||||||||||||
| Consumer Discretionary — 13.0% | ||||||||||||||||
Auto Components — 0.5% | ||||||||||||||||
Europcar Groupe SA, Secured Notes | 5.750 | % | 6/15/22 | 200,000 | EUR | $ | 218,386 | (a) | ||||||||
ZF North America Capital Inc., Senior Notes | 4.750 | % | 4/29/25 | 480,000 | 460,200 | (a) | ||||||||||
Total Auto Components | 678,586 | |||||||||||||||
Automobiles — 0.3% | ||||||||||||||||
General Motors Co., Senior Notes | 6.600 | % | 4/1/36 | 390,000 | 405,089 | (b) | ||||||||||
Diversified Consumer Services — 0.6% | ||||||||||||||||
Co-operative Group Holdings 2011 Ltd., Senior Notes | 7.500 | % | 7/8/26 | 160,000 | GBP | 233,146 | ||||||||||
Service Corp. International, Senior Notes | 7.500 | % | 4/1/27 | 290,000 | 334,225 | (b) | ||||||||||
StoneMor Partners LP/Cornerstone Family Services of WV, Senior Bonds | 7.875 | % | 6/1/21 | 210,000 | 214,200 | |||||||||||
Total Diversified Consumer Services | 781,571 | |||||||||||||||
Hotels, Restaurants & Leisure — 3.0% | ||||||||||||||||
Bossier Casino Venture Holdco Inc., Senior Secured Bonds | 14.000 | % | 2/9/18 | 289,664 | 263,189 | (a)(c)(d)(e) | ||||||||||
Carrols Restaurant Group Inc., Secured Notes | 8.000 | % | 5/1/22 | 210,000 | 223,125 | |||||||||||
CCM Merger Inc., Senior Notes | 9.125 | % | 5/1/19 | 390,000 | 398,775 | (a) | ||||||||||
CEC Entertainment Inc., Senior Notes | 8.000 | % | 2/15/22 | 440,000 | 377,300 | |||||||||||
Downstream Development Authority of the Quapaw Tribe of Oklahoma, Senior Secured Notes | 10.500 | % | 7/1/19 | 300,000 | 285,750 | (a)(b) | ||||||||||
Enterprise Inns PLC, Senior Secured Bonds | 6.500 | % | 12/6/18 | 494,000 | GBP | 713,427 | ||||||||||
Greektown Holdings LLC/Greektown Mothership Corp., Senior Secured Notes | 8.875 | % | 3/15/19 | 200,000 | 196,000 | (a) | ||||||||||
Landry’s Holdings II Inc., Senior Notes | 10.250 | % | 1/1/18 | 180,000 | 175,050 | (a) | ||||||||||
Landry’s Inc., Senior Notes | 9.375 | % | 5/1/20 | 800,000 | 842,000 | (a)(b) | ||||||||||
Viking Cruises Ltd., Senior Notes | 8.500 | % | 10/15/22 | 730,000 | 680,725 | (a) | ||||||||||
Total Hotels, Restaurants & Leisure | 4,155,341 | |||||||||||||||
Household Durables — 1.1% | ||||||||||||||||
Century Intermediate Holding Co. 2, Senior Notes | 9.750 | % | 2/15/19 | 410,000 | 418,712 | (a)(b)(c) | ||||||||||
Shea Homes LP/Shea Homes Funding Corp., Senior Notes | 6.125 | % | 4/1/25 | 350,000 | 344,750 | (a) | ||||||||||
William Lyon Homes Inc., Senior Notes | 8.500 | % | 11/15/20 | 350,000 | 350,000 | |||||||||||
William Lyon Homes Inc., Senior Notes | 7.000 | % | 8/15/22 | 60,000 | 55,200 | |||||||||||
Woodside Homes Co., LLC/Woodside Homes Finance Inc., Senior Notes | 6.750 | % | 12/15/21 | 430,000 | 367,650 | (a) | ||||||||||
Total Household Durables | 1,536,312 | |||||||||||||||
Media — 5.7% | ||||||||||||||||
CCO Holdings LLC/CCO Holdings Capital Corp., Senior Notes | 6.625 | % | 1/31/22 | 960,000 | 1,010,400 | (b) | ||||||||||
CCO Safari II LLC, Senior Secured Notes | 4.908 | % | 7/23/25 | 390,000 | 400,689 | (a) | ||||||||||
CCO Safari II LLC, Senior Secured Notes | 6.484 | % | 10/23/45 | 170,000 | 179,733 | (a) | ||||||||||
See Notes to Financial Statements.
| 4 | Western Asset Global Partners Income Fund Inc. 2016 Semi-Annual Report |
Table of Contents
Western Asset Global Partners Income Fund Inc.
| Security | Rate | Maturity Date | Face Amount† | Value | ||||||||||||
Media — continued | ||||||||||||||||
Clear Channel Worldwide Holdings Inc., Senior Subordinated Notes | 7.625 | % | 3/15/20 | 30,000 | $ | 24,525 | ||||||||||
DISH DBS Corp., Senior Notes | 7.875 | % | 9/1/19 | 285,000 | 309,792 | (b) | ||||||||||
DISH DBS Corp., Senior Notes | 6.750 | % | 6/1/21 | 390,000 | 398,288 | (b) | ||||||||||
DISH DBS Corp., Senior Notes | 5.875 | % | 7/15/22 | 1,350,000 | 1,296,000 | (b) | ||||||||||
DISH DBS Corp., Senior Notes | 5.875 | % | 11/15/24 | 220,000 | 198,506 | |||||||||||
Gibson Brands Inc., Senior Secured Notes | 8.875 | % | 8/1/18 | 290,000 | 172,550 | (a) | ||||||||||
iHeartCommunications Inc., Senior Notes | 14.000 | % | 2/1/21 | 282,800 | 69,286 | (c) | ||||||||||
New Cotai LLC/New Cotai Capital Corp., Senior Secured Notes | 10.625 | % | 5/1/19 | 616,931 | 414,886 | (a)(c) | ||||||||||
Numericable-SFR SAS, Senior Secured Bonds | 6.250 | % | 5/15/24 | 1,130,000 | 1,107,400 | (a) | ||||||||||
Time Warner Cable Inc., Senior Notes | 8.750 | % | 2/14/19 | 385,000 | 444,053 | (b) | ||||||||||
Time Warner Cable Inc., Senior Notes | 8.250 | % | 4/1/19 | 139,000 | 159,024 | (b) | ||||||||||
Univision Communications Inc., Senior Secured Notes | 6.750 | % | 9/15/22 | 172,000 | 183,386 | (a)(b) | ||||||||||
Univision Communications Inc., Senior Secured Notes | 5.125 | % | 2/15/25 | 270,000 | 264,938 | (a) | ||||||||||
UPC Holding BV, Junior Secured Subordinated Notes | 6.375 | % | 9/15/22 | 100,000 | EUR | 115,045 | (a) | |||||||||
Virgin Media Finance PLC, Senior Notes | 6.375 | % | 4/15/23 | 560,000 | 585,900 | (a) | ||||||||||
Virgin Media Finance PLC, Senior Notes | 6.000 | % | 10/15/24 | 340,000 | 342,125 | (a) | ||||||||||
Virgin Media Finance PLC, Senior Notes | 5.750 | % | 1/15/25 | 200,000 | 199,500 | (a) | ||||||||||
Total Media | 7,876,026 | |||||||||||||||
Multiline Retail — 0.3% | ||||||||||||||||
Neiman Marcus Group LLC, Senior Secured Notes | 7.125 | % | 6/1/28 | 80,000 | 67,200 | (b) | ||||||||||
Neiman Marcus Group Ltd. LLC, Senior Notes | 8.750 | % | 10/15/21 | 550,000 | 334,125 | (a)(c) | ||||||||||
Total Multiline Retail | 401,325 | |||||||||||||||
Specialty Retail — 1.4% | ||||||||||||||||
American Greetings Corp., Senior Notes | 7.375 | % | 12/1/21 | 290,000 | 296,887 | (b) | ||||||||||
Guitar Center Inc., Senior Secured Bonds | 6.500 | % | 4/15/19 | 750,000 | 645,000 | (a) | ||||||||||
Hot Topic Inc., Senior Secured Notes | 9.250 | % | 6/15/21 | 180,000 | 166,500 | (a) | ||||||||||
L Brands Inc., Senior Notes | 6.875 | % | 11/1/35 | 440,000 | 469,150 | (a) | ||||||||||
Sally Holdings LLC/Sally Capital Inc., Senior Notes | 5.625 | % | 12/1/25 | 400,000 | 418,000 | (b) | ||||||||||
Total Specialty Retail | 1,995,537 | |||||||||||||||
Textiles, Apparel & Luxury Goods — 0.1% | ||||||||||||||||
Empire Today LLC/Empire Today Finance Corp., Senior Secured Notes | 11.375 | % | 2/1/17 | 130,000 | 130,000 | (a)(b) | ||||||||||
Total Consumer Discretionary | 17,959,787 | |||||||||||||||
| Consumer Staples — 4.4% | ||||||||||||||||
Beverages — 0.6% | ||||||||||||||||
Carolina Beverage Group LLC/Carolina Beverage Group Finance Inc., Secured Notes | 10.625 | % | 8/1/18 | 280,000 | 268,800 | (a) | ||||||||||
See Notes to Financial Statements.
| Western Asset Global Partners Income Fund Inc. 2016 Semi-Annual Report | 5 |
Table of Contents
Schedule of investments (unaudited) (cont’d)
February 29, 2016
Western Asset Global Partners Income Fund Inc.
| Security | Rate | Maturity Date | Face Amount† | Value | ||||||||||||
Beverages — continued | ||||||||||||||||
Cott Beverages Inc., Senior Notes | 6.750 | % | 1/1/20 | 240,000 | $ | 253,200 | ||||||||||
DS Services of America Inc., Secured Notes | 10.000 | % | 9/1/21 | 260,000 | 293,475 | (a) | ||||||||||
Total Beverages | 815,475 | |||||||||||||||
Food & Staples Retailing — 0.4% | ||||||||||||||||
Beverages & More Inc., Senior Secured Notes | 10.000 | % | 11/15/18 | 400,000 | 357,500 | (a) | ||||||||||
Dollar Tree Inc., Senior Notes | 5.750 | % | 3/1/23 | 240,000 | 256,500 | (a)(b) | ||||||||||
Total Food & Staples Retailing | 614,000 | |||||||||||||||
Food Products — 1.7% | ||||||||||||||||
BRF SA, Senior Notes | 4.750 | % | 5/22/24 | 422,000 | 385,075 | (a)(b) | ||||||||||
Dole Food Co. Inc., Senior Secured Notes | 7.250 | % | 5/1/19 | 300,000 | 294,750 | (a)(b) | ||||||||||
JBS Investment GmbH, Senior Notes | 7.250 | % | 4/3/24 | 260,000 | 228,800 | (a) | ||||||||||
JBS USA LLC/JBS USA Finance Inc., Senior Notes | 5.750 | % | 6/15/25 | 210,000 | 181,650 | (a) | ||||||||||
Minerva Luxembourg SA, Senior Notes | 7.750 | % | 1/31/23 | 480,000 | 456,240 | (f) | ||||||||||
Pilgrim’s Pride Corp., Senior Notes | 5.750 | % | 3/15/25 | 340,000 | 331,925 | (a) | ||||||||||
Simmons Foods Inc., Secured Notes | 7.875 | % | 10/1/21 | 560,000 | 476,000 | (a) | ||||||||||
Total Food Products | 2,354,440 | |||||||||||||||
Household Products — 1.4% | ||||||||||||||||
Central Garden & Pet Co., Senior Notes | 6.125 | % | 11/15/23 | 160,000 | 164,000 | |||||||||||
Kronos Acquisition Holdings Inc., Senior Notes | 9.000 | % | 8/15/23 | 80,000 | 70,000 | (a) | ||||||||||
Spectrum Brands Inc., Senior Notes | 6.125 | % | 12/15/24 | 180,000 | 191,250 | |||||||||||
Spectrum Brands Inc., Senior Notes | 5.750 | % | 7/15/25 | 370,000 | 391,737 | |||||||||||
Sun Products Corp., Senior Notes | 7.750 | % | 3/15/21 | 1,230,000 | 1,088,550 | (a)(b) | ||||||||||
Total Household Products | 1,905,537 | |||||||||||||||
Tobacco — 0.3% | ||||||||||||||||
Alliance One International Inc., Secured Notes | 9.875 | % | 7/15/21 | 500,000 | 378,750 | |||||||||||
Total Consumer Staples | 6,068,202 | |||||||||||||||
| Energy — 18.1% | ||||||||||||||||
Energy Equipment & Services — 0.5% | ||||||||||||||||
Atwood Oceanics Inc., Senior Notes | 6.500 | % | 2/1/20 | 210,000 | 89,250 | (b) | ||||||||||
CGG, Senior Notes | 6.875 | % | 1/15/22 | 200,000 | 70,000 | |||||||||||
KCA Deutag UK Finance PLC, Senior Secured Notes | 7.250 | % | 5/15/21 | 200,000 | 92,000 | (a) | ||||||||||
Parker Drilling Co., Senior Notes | 7.500 | % | 8/1/20 | 110,000 | 77,550 | |||||||||||
SESI LLC, Senior Notes | 7.125 | % | 12/15/21 | 330,000 | 203,363 | (b) | ||||||||||
Sierra Hamilton LLC/Sierra Hamilton Finance Inc., Senior Secured Notes | 12.250 | % | 12/15/18 | 300,000 | 147,000 | (a) | ||||||||||
Total Energy Equipment & Services | 679,163 | |||||||||||||||
Oil, Gas & Consumable Fuels — 17.6% | ||||||||||||||||
Berry Petroleum Co., Senior Notes | 6.750 | % | 11/1/20 | 170,000 | 19,550 | |||||||||||
See Notes to Financial Statements.
| 6 | Western Asset Global Partners Income Fund Inc. 2016 Semi-Annual Report |
Table of Contents
Western Asset Global Partners Income Fund Inc.
| Security | Rate | Maturity Date | Face Amount† | Value | ||||||||||||
Oil, Gas & Consumable Fuels — continued | ||||||||||||||||
Berry Petroleum Co., Senior Notes | 6.375 | % | 9/15/22 | 80,000 | $ | 9,000 | ||||||||||
California Resources Corp., Senior Notes | 5.500 | % | 9/15/21 | 1,340,000 | 187,600 | |||||||||||
Calumet Specialty Products Partners LP/Calumet Finance Corp., Senior Notes | 7.625 | % | 1/15/22 | 200,000 | 120,250 | |||||||||||
Carrizo Oil & Gas Inc., Senior Notes | 7.500 | % | 9/15/20 | 280,000 | 218,400 | |||||||||||
Chesapeake Energy Corp., Senior Notes | 6.875 | % | 11/15/20 | 880,000 | 193,600 | |||||||||||
Chesapeake Energy Corp., Senior Notes | 5.375 | % | 6/15/21 | 110,000 | 23,650 | |||||||||||
Dolphin Energy Ltd., Senior Secured Bonds | 5.888 | % | 6/15/19 | 338,812 | 361,809 | (b)(f) | ||||||||||
Ecopetrol SA, Senior Notes | 7.625 | % | 7/23/19 | 490,000 | 514,500 | (b) | ||||||||||
Ecopetrol SA, Senior Notes | 5.875 | % | 9/18/23 | 75,000 | 66,727 | (b) | ||||||||||
Ecopetrol SA, Senior Notes | 5.875 | % | 5/28/45 | 60,000 | 42,150 | (b) | ||||||||||
Endeavor Energy Resources LP/EER Finance Inc., Senior Notes | 7.000 | % | 8/15/21 | 130,000 | 111,150 | (a) | ||||||||||
Energy Transfer Equity LP, Senior Notes | 7.500 | % | 10/15/20 | 130,000 | 119,600 | |||||||||||
Enterprise Products Operating LLC, Junior Subordinated Notes | 8.375 | % | 8/1/66 | 100,000 | 75,250 | (b)(g) | ||||||||||
EP Energy LLC/Everest Acquisition Finance Inc., Senior Notes | 9.375 | % | 5/1/20 | 300,000 | 89,250 | |||||||||||
EV Energy Partners LP/EV Energy Finance Corp., Senior Notes | 8.000 | % | 4/15/19 | 80,000 | 18,000 | |||||||||||
Gazprom OAO Via Gaz Capital SA, Loan Participation Notes, Senior Notes | 6.510 | % | 3/7/22 | 830,000 | 846,641 | (a) | ||||||||||
Genesis Energy LP/Genesis Energy Finance Corp., Senior Notes | 6.750 | % | 8/1/22 | 180,000 | 151,200 | |||||||||||
Globe Luxembourg SCA, Senior Secured Notes | 9.625 | % | 5/1/18 | 1,160,000 | 620,600 | (a)(b) | ||||||||||
GNL Quintero SA, Senior Notes | 4.634 | % | 7/31/29 | 288,000 | 273,494 | (a)(b) | ||||||||||
Hiland Partners LP/Hiland Partners Finance Corp., Senior Notes | 7.250 | % | 10/1/20 | 130,000 | 130,745 | (a)(b) | ||||||||||
Kinder Morgan Inc., Medium-Term Notes | 7.750 | % | 1/15/32 | 130,000 | 125,001 | |||||||||||
Lonestar Resources America Inc., Senior Notes | 8.750 | % | 4/15/19 | 120,000 | 70,800 | (a) | ||||||||||
LUKOIL International Finance BV, Senior Notes | 4.563 | % | 4/24/23 | 940,000 | 859,226 | (a) | ||||||||||
Magnum Hunter Resources Corp., Senior Notes | 9.750 | % | 5/15/20 | 1,000,000 | 235,000 | *(e)(h) | ||||||||||
MEG Energy Corp., Senior Notes | 6.500 | % | 3/15/21 | 590,000 | 287,625 | (a) | ||||||||||
MEG Energy Corp., Senior Notes | 6.375 | % | 1/30/23 | 70,000 | 33,425 | (a) | ||||||||||
Milagro Oil & Gas Inc., Secured Notes | 10.500 | % | 5/15/16 | 380,000 | 108,300 | *(e)(h) | ||||||||||
Murray Energy Corp., Senior Secured Notes | 11.250 | % | 4/15/21 | 990,000 | 118,800 | (a) | ||||||||||
Natural Resource Partners LP/Natural Resource Partners Finance Corp., Senior Notes | 9.125 | % | 10/1/18 | 330,000 | 155,100 | |||||||||||
Oasis Petroleum Inc., Senior Notes | 7.250 | % | 2/1/19 | 300,000 | 184,500 | |||||||||||
Oasis Petroleum Inc., Senior Notes | 6.500 | % | 11/1/21 | 420,000 | 257,250 | |||||||||||
Oasis Petroleum Inc., Senior Notes | 6.875 | % | 1/15/23 | 200,000 | 116,500 | |||||||||||
ONGC Videsh Ltd., Senior Notes | 4.625 | % | 7/15/24 | 210,000 | 212,160 | (f) | ||||||||||
Pacific Exploration and Production Corp., Senior Notes | 5.375 | % | 1/26/19 | 1,200,000 | 144,000 | (f) | ||||||||||
Pacific Exploration and Production Corp., Senior Notes | 7.250 | % | 12/12/21 | 850,000 | 102,000 | (a) | ||||||||||
See Notes to Financial Statements.
| Western Asset Global Partners Income Fund Inc. 2016 Semi-Annual Report | 7 |
Table of Contents
Schedule of investments (unaudited) (cont’d)
February 29, 2016
Western Asset Global Partners Income Fund Inc.
| Security | Rate | Maturity Date | Face Amount† | Value | ||||||||||||
Oil, Gas & Consumable Fuels — continued | ||||||||||||||||
Petrobras Global Finance BV, Senior Notes | 3.250 | % | 3/17/17 | 460,000 | $ | 446,890 | ||||||||||
Petrobras Global Finance BV, Senior Notes | 3.000 | % | 1/15/19 | 390,000 | 310,050 | |||||||||||
Petrobras Global Finance BV, Senior Notes | 4.875 | % | 3/17/20 | 440,000 | 337,744 | |||||||||||
Petrobras Global Finance BV, Senior Notes | 6.875 | % | 1/20/40 | 900,000 | 569,250 | |||||||||||
Petrobras Global Finance BV, Senior Notes | 6.750 | % | 1/27/41 | 260,000 | 163,800 | |||||||||||
Petrobras Global Finance BV, Senior Notes | 7.250 | % | 3/17/44 | 900,000 | 590,850 | |||||||||||
Petroleos de Venezuela SA, Senior Bonds | 6.000 | % | 5/16/24 | 6,720,000 | 2,112,768 | (f) | ||||||||||
Petroleos Mexicanos, Senior Notes | 8.000 | % | 5/3/19 | 3,490,000 | 3,821,550 | |||||||||||
Petroleos Mexicanos, Senior Notes | 6.875 | % | 8/4/26 | 1,105,000 | 1,146,990 | (a) | ||||||||||
Petroleos Mexicanos, Senior Notes | 5.625 | % | 1/23/46 | 270,000 | 210,600 | (a) | ||||||||||
Petroleum Co. of Trinidad & Tobago Ltd., Senior Notes | 9.750 | % | 8/14/19 | 390,000 | 395,850 | (a) | ||||||||||
Petronas Capital Ltd., Senior Notes | 5.250 | % | 8/12/19 | 925,000 | 1,004,469 | (a)(b) | ||||||||||
PT Pertamina Persero, Senior Notes | 5.250 | % | 5/23/21 | 570,000 | 578,689 | (a) | ||||||||||
PT Pertamina Persero, Senior Notes | 4.300 | % | 5/20/23 | 380,000 | 358,390 | (a) | ||||||||||
Puma International Financing SA, Senior Bonds | 6.750 | % | 2/1/21 | 660,000 | 608,197 | (a) | ||||||||||
Quicksilver Resources Inc., Senior Notes | 11.000 | % | 7/1/21 | 310,000 | 6,200 | *(h) | ||||||||||
Reliance Holdings USA Inc., Senior Notes | 4.500 | % | 10/19/20 | 530,000 | 562,826 | (a)(b) | ||||||||||
Rosneft Finance SA, Senior Notes | 7.875 | % | 3/13/18 | 420,000 | 444,035 | (a)(b) | ||||||||||
RSP Permian Inc., Senior Notes | 6.625 | % | 10/1/22 | 460,000 | 414,000 | (b) | ||||||||||
RSP Permian Inc., Senior Notes | 6.625 | % | 10/1/22 | 120,000 | 108,000 | (a) | ||||||||||
Samson Investment Co., Senior Notes | 9.750 | % | 2/15/20 | 310,000 | 852 | *(h) | ||||||||||
Sanchez Energy Corp., Senior Notes | 6.125 | % | 1/15/23 | 1,130,000 | 406,800 | |||||||||||
Shelf Drilling Holdings Ltd., Senior Secured Notes | 8.625 | % | 11/1/18 | 210,000 | 135,450 | (a)(b) | ||||||||||
Sinopec Group Overseas Development Ltd., Senior Notes | 4.375 | % | 4/10/24 | 850,000 | 901,902 | (a) | ||||||||||
Transportadora de Gas del Peru SA, Senior Notes | 4.250 | % | 4/30/28 | 440,000 | 410,300 | (b)(f) | ||||||||||
Whiting Petroleum Corp., Senior Notes | 5.000 | % | 3/15/19 | 430,000 | 215,000 | |||||||||||
Whiting Petroleum Corp., Senior Notes | 6.250 | % | 4/1/23 | 190,000 | 87,875 | |||||||||||
Williams Cos. Inc., Debentures | 7.500 | % | 1/15/31 | 170,000 | 131,750 | |||||||||||
Williams Cos. Inc., Senior Notes | 4.550 | % | 6/24/24 | 270,000 | 203,850 | |||||||||||
WPX Energy Inc., Senior Notes | 7.500 | % | 8/1/20 | 110,000 | 69,850 | |||||||||||
WPX Energy Inc., Senior Notes | 8.250 | % | 8/1/23 | 60,000 | 37,350 | |||||||||||
YPF SA, Senior Notes | 8.750 | % | 4/4/24 | 380,000 | 375,288 | (a) | ||||||||||
Total Oil, Gas & Consumable Fuels | 24,370,268 | |||||||||||||||
Total Energy | 25,049,431 | |||||||||||||||
| Financials — 14.3% | ||||||||||||||||
Banks — 8.4% | ||||||||||||||||
Banco Bilbao Vizcaya Argentaria Colombia SA, Subordinated Notes | 4.875 | % | 4/21/25 | 210,000 | 191,625 | (a) | ||||||||||
See Notes to Financial Statements.
| 8 | Western Asset Global Partners Income Fund Inc. 2016 Semi-Annual Report |
Table of Contents
Western Asset Global Partners Income Fund Inc.
| Security | Rate | Maturity Date | Face Amount† | Value | ||||||||||||
Banks — continued | ||||||||||||||||
Bank of America Corp., Junior Subordinated Notes | 6.500 | % | 10/23/24 | 580,000 | $ | 592,325 | (g)(i) | |||||||||
Barclays Bank PLC, Subordinated Notes | 10.179 | % | 6/12/21 | 470,000 | 606,828 | (a)(b) | ||||||||||
Barclays Bank PLC, Subordinated Notes | 7.625 | % | 11/21/22 | 1,000,000 | 1,013,125 | (b) | ||||||||||
Barclays PLC, Junior Subordinated Bonds | 8.250 | % | 12/15/18 | 200,000 | 190,768 | (g)(i) | ||||||||||
BBVA Banco Continental SA, Subordinated Notes | 5.250 | % | 9/22/29 | 80,000 | 76,120 | (a)(b)(g) | ||||||||||
BNP Paribas SA, Junior Subordinated Notes | 7.375 | % | 8/19/25 | 200,000 | 187,250 | (a)(g)(i) | ||||||||||
CIT Group Inc., Senior Notes | 5.000 | % | 8/15/22 | 170,000 | 171,063 | |||||||||||
CIT Group Inc., Senior Notes | 5.000 | % | 8/1/23 | 790,000 | 791,975 | (b) | ||||||||||
Citigroup Inc., Junior Subordinated Bonds | 6.300 | % | 5/15/24 | 660,000 | 617,925 | (g)(i) | ||||||||||
Cooperatieve Rabobank U.A., Subordinated Notes | 5.250 | % | 8/4/45 | 270,000 | 276,708 | |||||||||||
Credit Agricole SA, Junior Subordinated Notes | 8.375 | % | 10/13/19 | 390,000 | 424,125 | (a)(b)(g)(i) | ||||||||||
Credit Agricole SA, Junior Subordinated Notes | 8.125 | % | 12/23/25 | 500,000 | 467,541 | (a)(b)(g)(i) | ||||||||||
Export-Import Bank of China, Senior Notes | 2.850 | % | 9/16/20 | 380,000 | 386,478 | (a) | ||||||||||
HSBC Holdings PLC, Junior Subordinated Bonds | 6.375 | % | 9/17/24 | 360,000 | 331,110 | (g)(i) | ||||||||||
HSBC Holdings PLC, Junior Subordinated Bonds | 6.375 | % | 3/30/25 | 220,000 | 202,331 | (g)(i) | ||||||||||
HSBC Holdings PLC, Subordinated Notes | 5.250 | % | 3/14/44 | 940,000 | 902,350 | (b) | ||||||||||
Industrial & Commercial Bank of China Ltd., Senior Notes | 3.231 | % | 11/13/19 | 260,000 | 267,565 | (b) | ||||||||||
Itau Unibanco Holding SA, Senior Notes | 2.850 | % | 5/26/18 | 450,000 | 437,062 | (a) | ||||||||||
JPMorgan Chase & Co., Junior Subordinated Bonds | 6.000 | % | 8/1/23 | 140,000 | 138,950 | (b)(g)(i) | ||||||||||
JPMorgan Chase & Co., Junior Subordinated Notes | 6.100 | % | 10/1/24 | 270,000 | 268,987 | (b)(g)(i) | ||||||||||
M&T Bank Corp., Junior Subordinated Bonds | 6.875 | % | 6/15/16 | 330,000 | 331,452 | (b)(i) | ||||||||||
Royal Bank of Scotland Group PLC, Junior Subordinated Bonds | 7.648 | % | 9/30/31 | 200,000 | 229,000 | (g)(i) | ||||||||||
Royal Bank of Scotland Group PLC, Subordinated Notes | 6.100 | % | 6/10/23 | 370,000 | 375,114 | (b) | ||||||||||
Royal Bank of Scotland Group PLC, Subordinated Notes | 5.125 | % | 5/28/24 | 760,000 | 730,099 | (b) | ||||||||||
Royal Bank of Scotland NV, Subordinated Bonds | 7.750 | % | 5/15/23 | 150,000 | 159,356 | (b) | ||||||||||
Royal Bank of Scotland PLC, Subordinated Notes | 13.125 | % | 3/19/22 | 530,000 | AUD | 405,115 | (b)(f)(g) | |||||||||
Santander Issuances SAU, Notes | 5.911 | % | 6/20/16 | 200,000 | 202,075 | (a)(b) | ||||||||||
Sberbank of Russia Via SB Capital SA, Subordinated Notes | 5.500 | % | 2/26/24 | 400,000 | 353,769 | (f)(g) | ||||||||||
Wells Fargo & Co., Junior Subordinated Bonds | 5.875 | % | 6/15/25 | 210,000 | 222,611 | (g)(i) | ||||||||||
Total Banks | 11,550,802 | |||||||||||||||
Capital Markets — 0.6% | ||||||||||||||||
Credit Suisse Group Funding Guernsey Ltd., Senior Notes | 4.875 | % | 5/15/45 | 260,000 | 237,754 | |||||||||||
Goldman Sachs Group Inc., Subordinated Notes | 6.750 | % | 10/1/37 | 300,000 | 343,907 | (b) | ||||||||||
Goldman Sachs Group Inc., Subordinated Notes | 5.150 | % | 5/22/45 | 270,000 | 258,363 | |||||||||||
Total Capital Markets | 840,024 | |||||||||||||||
Consumer Finance — 0.7% | ||||||||||||||||
Ally Financial Inc., Senior Notes | 8.000 | % | 3/15/20 | 129,000 | 143,835 | |||||||||||
See Notes to Financial Statements.
| Western Asset Global Partners Income Fund Inc. 2016 Semi-Annual Report | 9 |
Table of Contents
Schedule of investments (unaudited) (cont’d)
February 29, 2016
Western Asset Global Partners Income Fund Inc.
| Security | Rate | Maturity Date | Face Amount† | Value | ||||||||||||
Consumer Finance — continued | ||||||||||||||||
Navient Corp., Medium-Term Notes, Senior Notes | 8.450 | % | 6/15/18 | 250,000 | $ | 267,033 | (b) | |||||||||
Navient Corp., Medium-Term Notes, Senior Notes | 8.000 | % | 3/25/20 | 240,000 | 237,600 | |||||||||||
Navient Corp., Senior Notes | 6.125 | % | 3/25/24 | 40,000 | 33,626 | |||||||||||
TMX Finance LLC/TitleMax Finance Corp., Senior Secured Notes | 8.500 | % | 9/15/18 | 360,000 | 297,000 | (a) | ||||||||||
Total Consumer Finance | 979,094 | |||||||||||||||
Diversified Financial Services — 2.5% | ||||||||||||||||
AerCap Ireland Capital Ltd./AerCap Global Aviation Trust, Senior Bonds | 4.250 | % | 7/1/20 | 580,000 | 583,625 | |||||||||||
AerCap Ireland Capital Ltd./AerCap Global Aviation Trust, Senior Bonds | 4.625 | % | 7/1/22 | 180,000 | 180,900 | |||||||||||
AerCap Ireland Capital Ltd./AerCap Global Aviation Trust, Senior Notes | 4.625 | % | 10/30/20 | 180,000 | 183,600 | |||||||||||
Argos Merger Sub Inc., Senior Notes | 7.125 | % | 3/15/23 | 530,000 | 543,250 | (a)(b) | ||||||||||
Banco Nacional de Comercio Exterior SNC, Senior Notes | 4.375 | % | 10/14/25 | 540,000 | 535,950 | (a)(b) | ||||||||||
International Lease Finance Corp., Senior Notes | 8.875 | % | 9/1/17 | 980,000 | 1,054,725 | (b) | ||||||||||
International Lease Finance Corp., Senior Notes | 6.250 | % | 5/15/19 | 70,000 | 75,250 | |||||||||||
International Lease Finance Corp., Senior Notes | 8.250 | % | 12/15/20 | 90,000 | 104,400 | (b) | ||||||||||
International Lease Finance Corp., Senior Notes | 5.875 | % | 8/15/22 | 180,000 | 192,150 | |||||||||||
Total Diversified Financial Services | 3,453,850 | |||||||||||||||
Insurance — 0.7% | ||||||||||||||||
Fidelity & Guaranty Life Holdings Inc., Senior Notes | 6.375 | % | 4/1/21 | 190,000 | 193,800 | (a) | ||||||||||
Galaxy Bidco Ltd., Senior Secured Notes | 6.375 | % | 11/15/20 | 130,000 | GBP | 175,467 | (f) | |||||||||
Genworth Holdings Inc., Senior Notes | 4.900 | % | 8/15/23 | 200,000 | 118,000 | |||||||||||
Liberty Mutual Group Inc., Junior Subordinated Bonds | 7.800 | % | 3/15/37 | 200,000 | 219,250 | (a)(b) | ||||||||||
MetLife Capital Trust IV, Junior Subordinated Notes | 7.875 | % | 12/15/37 | 250,000 | 286,250 | (a)(b) | ||||||||||
Total Insurance | 992,767 | |||||||||||||||
Real Estate Investment Trusts (REITs) — 0.3% | ||||||||||||||||
Communications Sales & Leasing Inc., Senior Secured Notes | 6.000 | % | 4/15/23 | 180,000 | 174,112 | (a) | ||||||||||
MPT Operating Partnership LP/MPT Finance Corp., Senior Notes | 6.375 | % | 3/1/24 | 240,000 | 247,200 | |||||||||||
Total Real Estate Investment Trusts (REITs) | 421,312 | |||||||||||||||
Real Estate Management & Development — 1.1% | ||||||||||||||||
Caesars Entertainment Resort Properties LLC, Secured Notes | 11.000 | % | 10/1/21 | 210,000 | 182,175 | |||||||||||
Caesars Entertainment Resort Properties LLC, Senior Secured Notes | 8.000 | % | 10/1/20 | 580,000 | 569,850 | (b) | ||||||||||
Greystar Real Estate Partners LLC, Senior Secured Notes | 8.250 | % | 12/1/22 | 340,000 | 352,750 | (a) | ||||||||||
Howard Hughes Corp., Senior Notes | 6.875 | % | 10/1/21 | 460,000 | 454,825 | (a) | ||||||||||
Total Real Estate Management & Development | 1,559,600 | |||||||||||||||
Total Financials | 19,797,449 | |||||||||||||||
See Notes to Financial Statements.
| 10 | Western Asset Global Partners Income Fund Inc. 2016 Semi-Annual Report |
Table of Contents
Western Asset Global Partners Income Fund Inc.
| Security | Rate | Maturity Date | Face Amount† | Value | ||||||||||||
| Health Care — 6.7% | ||||||||||||||||
Biotechnology — 0.1% | ||||||||||||||||
AMAG Pharmaceuticals Inc., Senior Notes | 7.875 | % | 9/1/23 | 170,000 | $ | 148,750 | (a) | |||||||||
Health Care Equipment & Supplies — 1.6% | ||||||||||||||||
ConvaTec Finance International SA, Senior Notes | 8.250 | % | 1/15/19 | 220,000 | 194,975 | (a)(c) | ||||||||||
ConvaTec Healthcare E SA, Senior Notes | 10.875 | % | 12/15/18 | 660,000 | EUR | 740,662 | (a)(b) | |||||||||
DJO Finance LLC/DJO Finance Corp., Secured Notes | 10.750 | % | 4/15/20 | 380,000 | 307,800 | (a) | ||||||||||
DJO Finco Inc./DJO Finance LLC/DJO Finance Corp., Secured Notes | 8.125 | % | 6/15/21 | 240,000 | 202,200 | (a) | ||||||||||
Greatbatch Ltd., Senior Notes | 9.125 | % | 11/1/23 | 320,000 | 312,000 | (a) | ||||||||||
Immucor Inc., Senior Notes | 11.125 | % | 8/15/19 | 600,000 | 453,000 | |||||||||||
Total Health Care Equipment & Supplies | 2,210,637 | |||||||||||||||
Health Care Providers & Services — 3.0% | ||||||||||||||||
BioScrip Inc., Senior Notes | 8.875 | % | 2/15/21 | 280,000 | 219,800 | |||||||||||
Centene Escrow Corp., Senior Notes | 5.625 | % | 2/15/21 | 300,000 | 314,250 | (a) | ||||||||||
Centene Escrow Corp., Senior Notes | 6.125 | % | 2/15/24 | 200,000 | 212,750 | (a) | ||||||||||
IASIS Healthcare LLC/IASIS Capital Corp., Senior Notes | 8.375 | % | 5/15/19 | 550,000 | 525,250 | |||||||||||
Select Medical Corp., Senior Notes | 6.375 | % | 6/1/21 | 460,000 | 416,300 | |||||||||||
Tenet Healthcare Corp., Senior Notes | 8.125 | % | 4/1/22 | 1,140,000 | 1,126,457 | |||||||||||
Universal Hospital Services Inc., Secured Notes | 7.625 | % | 8/15/20 | 1,450,000 | 1,265,125 | |||||||||||
Total Health Care Providers & Services | 4,079,932 | |||||||||||||||
Pharmaceuticals — 2.0% | ||||||||||||||||
DPx Holdings BV, Senior Notes | 7.500 | % | 2/1/22 | 200,000 | 191,750 | (a) | ||||||||||
JLL/Delta Dutch Pledgeco BV, Senior Notes | 8.750 | % | 5/1/20 | 560,000 | 499,800 | (a)(c) | ||||||||||
Mallinckrodt International Finance SA, Senior Notes | 5.750 | % | 8/1/22 | 530,000 | 526,025 | (a)(b) | ||||||||||
Valeant Pharmaceuticals International Inc., Senior Notes | 5.375 | % | 3/15/20 | 150,000 | 136,500 | (a) | ||||||||||
Valeant Pharmaceuticals International Inc., Senior Notes | 6.375 | % | 10/15/20 | 200,000 | 184,500 | (a) | ||||||||||
Valeant Pharmaceuticals International Inc., Senior Notes | 7.500 | % | 7/15/21 | 520,000 | 492,700 | (a) | ||||||||||
Valeant Pharmaceuticals International Inc., Senior Notes | 5.625 | % | 12/1/21 | 390,000 | 335,642 | (a) | ||||||||||
Valeant Pharmaceuticals International Inc., Senior Notes | 7.250 | % | 7/15/22 | 450,000 | 414,000 | (a) | ||||||||||
Total Pharmaceuticals | 2,780,917 | |||||||||||||||
Total Health Care | 9,220,236 | |||||||||||||||
| Industrials — 10.6% | ||||||||||||||||
Aerospace & Defense — 0.6% | ||||||||||||||||
Aerojet Rocketdyne Holdings Inc., Secured Notes | 7.125 | % | 3/15/21 | 170,000 | 172,975 | |||||||||||
CBC Ammo LLC/CBC FinCo Inc., Senior Notes | 7.250 | % | 11/15/21 | 490,000 | 387,100 | (a)(b) | ||||||||||
LMI Aerospace Inc., Secured Notes | 7.375 | % | 7/15/19 | 360,000 | 337,500 | |||||||||||
Total Aerospace & Defense | 897,575 | |||||||||||||||
See Notes to Financial Statements.
| Western Asset Global Partners Income Fund Inc. 2016 Semi-Annual Report | 11 |
Table of Contents
Schedule of investments (unaudited) (cont’d)
February 29, 2016
Western Asset Global Partners Income Fund Inc.
| Security | Rate | Maturity Date | Face Amount† | Value | ||||||||||||
Air Freight & Logistics — 0.4% | ||||||||||||||||
XPO Logistics Inc., Senior Notes | 7.875 | % | 9/1/19 | 260,000 | $ | 269,425 | (a) | |||||||||
XPO Logistics Inc., Senior Notes | 6.500 | % | 6/15/22 | 230,000 | 218,500 | (a) | ||||||||||
Total Air Freight & Logistics | 487,925 | |||||||||||||||
Airlines — 0.7% | ||||||||||||||||
American Airlines, Pass-Through Trust, Secured Notes | 7.000 | % | 1/31/18 | 114,249 | 118,961 | (a) | ||||||||||
Continental Airlines Inc., Pass-Through Certificates, Secured Notes | 9.250 | % | 5/10/17 | 1,871 | 1,985 | |||||||||||
Continental Airlines Inc., Pass-Through Certificates, Secured Notes | 5.500 | % | 10/29/20 | 171,308 | 173,664 | (b) | ||||||||||
Delta Air Lines Inc., Pass-Through Certificates, Subordinated Secured Notes | 9.750 | % | 12/17/16 | 70,688 | 74,665 | (b) | ||||||||||
Heathrow Finance PLC, Senior Secured Notes | 7.125 | % | 3/1/17 | 400,000 | GBP | 575,874 | (b)(f) | |||||||||
Total Airlines | 945,149 | |||||||||||||||
Building Products — 0.7% | ||||||||||||||||
Ashton Woods USA LLC/Ashton Woods Finance Co., Senior Notes | 6.875 | % | 2/15/21 | 310,000 | 252,650 | (a) | ||||||||||
GTL Trade Finance Inc., Senior Notes | 7.250 | % | 4/16/44 | 250,000 | 152,500 | (a)(b) | ||||||||||
Standard Industries Inc., Senior Notes | 5.125 | % | 2/15/21 | 210,000 | 215,250 | (a) | ||||||||||
Standard Industries Inc., Senior Notes | 5.500 | % | 2/15/23 | 300,000 | 305,250 | (a) | ||||||||||
Total Building Products | 925,650 | |||||||||||||||
Commercial Services & Supplies — 2.0% | ||||||||||||||||
Garda World Security Corp., Senior Notes | 7.250 | % | 11/15/21 | 170,000 | 119,850 | (a) | ||||||||||
GFL Escrow Corp., Senior Notes | 9.875 | % | 2/1/21 | 460,000 | 469,200 | (a) | ||||||||||
Monitronics International Inc., Senior Notes | 9.125 | % | 4/1/20 | 710,000 | 605,275 | |||||||||||
United Rentals North America Inc., Senior Notes | 8.250 | % | 2/1/21 | 83,000 | 87,565 | (b) | ||||||||||
United Rentals North America Inc., Senior Notes | 7.625 | % | 4/15/22 | 418,000 | 446,474 | (b) | ||||||||||
United Rentals North America Inc., Senior Notes | 5.750 | % | 11/15/24 | 200,000 | 195,960 | |||||||||||
West Corp., Senior Notes | 5.375 | % | 7/15/22 | 950,000 | 853,813 | (a) | ||||||||||
Total Commercial Services & Supplies | 2,778,137 | |||||||||||||||
Construction & Engineering — 1.6% | ||||||||||||||||
Astaldi SpA, Senior Notes | 7.125 | % | 12/1/20 | 260,000 | EUR | 276,717 | (a) | |||||||||
Astaldi SpA, Senior Notes | 7.125 | % | 12/1/20 | 100,000 | EUR | 106,430 | (f) | |||||||||
Ausdrill Finance Pty Ltd., Senior Notes | 6.875 | % | 11/1/19 | 400,000 | 286,000 | (a)(b) | ||||||||||
Brundage-Bone Concrete Pumping Inc., Senior Secured Notes | 10.375 | % | 9/1/21 | 270,000 | 261,900 | (a) | ||||||||||
Michael Baker Holdings LLC/Michael Baker Finance Corp., Senior Notes | 8.875 | % | 4/15/19 | 356,362 | 253,017 | (a)(c) | ||||||||||
Michael Baker International LLC/CDL Acquisition Co. Inc., Senior Secured Notes | 8.250 | % | 10/15/18 | 400,000 | 342,000 | (a)(b) | ||||||||||
Modular Space Corp., Secured Notes | 10.250 | % | 1/31/19 | 330,000 | 92,400 | (a) | ||||||||||
Odebrecht Finance Ltd., Senior Notes | 5.250 | % | 6/27/29 | 1,182,000 | 525,990 | (a)(b) | ||||||||||
See Notes to Financial Statements.
| 12 | Western Asset Global Partners Income Fund Inc. 2016 Semi-Annual Report |
Table of Contents
Western Asset Global Partners Income Fund Inc.
| Security | Rate | Maturity Date | Face Amount† | Value | ||||||||||||
Construction & Engineering — continued | ||||||||||||||||
Odebrecht Offshore Drilling Finance Ltd., Senior Secured Notes | 6.625 | % | 10/1/22 | 183,780 | $ | 38,594 | (a)(b) | |||||||||
Total Construction & Engineering | 2,183,048 | |||||||||||||||
Electrical Equipment — 0.4% | ||||||||||||||||
International Wire Group Holdings Inc., Senior Secured Notes | 8.500 | % | 10/15/17 | 230,000 | 228,562 | (a) | ||||||||||
NES Rentals Holdings Inc., Senior Secured Notes | 7.875 | % | 5/1/18 | 200,000 | 159,000 | (a) | ||||||||||
Trionista TopCo GmbH, Senior Subordinated Notes | 6.875 | % | 4/30/21 | 100,000 | EUR | 114,170 | (a) | |||||||||
Total Electrical Equipment | 501,732 | |||||||||||||||
Industrial Conglomerates — 0.4% | ||||||||||||||||
Alfa SAB de CV, Senior Notes | 6.875 | % | 3/25/44 | 200,000 | 185,000 | (a)(b) | ||||||||||
Sinochem Overseas Capital Co., Ltd., Senior Notes | 4.500 | % | 11/12/20 | 370,000 | 390,098 | (a)(b) | ||||||||||
Total Industrial Conglomerates | 575,098 | |||||||||||||||
Machinery — 1.2% | ||||||||||||||||
CTP Transportation Products LLC/CTP Finance Inc., Senior Secured Notes | 8.250 | % | 12/15/19 | 130,000 | 130,293 | (a) | ||||||||||
DH Services Luxembourg Sarl, Senior Notes | 7.750 | % | 12/15/20 | 620,000 | 616,900 | (a) | ||||||||||
Global Brass and Copper Inc., Senior Secured Notes | 9.500 | % | 6/1/19 | 280,000 | 296,100 | |||||||||||
KraussMaffei Group GmbH, Senior Secured Notes | 8.750 | % | 12/15/20 | 136,000 | EUR | 157,564 | (a) | |||||||||
KraussMaffei Group GmbH, Senior Secured Notes | 8.750 | % | 12/15/20 | 120,000 | EUR | 139,027 | (f) | |||||||||
SIG Combibloc Holdings SCA, Senior Bonds | 7.750 | % | 2/15/23 | 190,000 | EUR | 213,711 | (a) | |||||||||
SPL Logistics Escrow LLC/SPL Logistics Finance Corp., Senior Secured Notes | 8.875 | % | 8/1/20 | 200,000 | 171,000 | (a)(b) | ||||||||||
Total Machinery | 1,724,595 | |||||||||||||||
Marine — 0.3% | ||||||||||||||||
Navios Maritime Acquisition Corp./Navios Acquisition Finance U.S. Inc., Senior Secured Notes | 8.125 | % | 11/15/21 | 460,000 | 325,450 | (a) | ||||||||||
Ultrapetrol Bahamas Ltd., Senior Secured Notes | 8.875 | % | 6/15/21 | 240,000 | 46,800 | *(e)(h) | ||||||||||
Total Marine | 372,250 | |||||||||||||||
Road & Rail — 1.0% | ||||||||||||||||
Flexi-Van Leasing Inc., Senior Notes | 7.875 | % | 8/15/18 | 500,000 | 485,000 | (a)(b) | ||||||||||
Florida East Coast Holdings Corp., Senior Notes | 9.750 | % | 5/1/20 | 60,000 | 38,700 | (a) | ||||||||||
Florida East Coast Holdings Corp., Senior Secured Notes | 6.750 | % | 5/1/19 | 570,000 | 573,562 | (a) | ||||||||||
Jack Cooper Holdings Corp., Senior Secured Notes | 10.250 | % | 6/1/20 | 440,000 | 332,200 | (a) | ||||||||||
Total Road & Rail | 1,429,462 | |||||||||||||||
Trading Companies & Distributors — 0.4% | ||||||||||||||||
H&E Equipment Services Inc., Senior Notes | 7.000 | % | 9/1/22 | 620,000 | 593,650 | (b) | ||||||||||
Transportation — 0.4% | ||||||||||||||||
Hapag-Lloyd AG, Senior Notes | 9.750 | % | 10/15/17 | 203,000 | 205,030 | (a)(b) | ||||||||||
Neovia Logistics Intermediate Holdings LLC/Logistics Intermediate Finance Corp., Senior Notes | 10.000 | % | 2/15/18 | 450,000 | 317,250 | (a)(c) | ||||||||||
Total Transportation | 522,280 | |||||||||||||||
See Notes to Financial Statements.
| Western Asset Global Partners Income Fund Inc. 2016 Semi-Annual Report | 13 |
Table of Contents
Schedule of investments (unaudited) (cont’d)
February 29, 2016
Western Asset Global Partners Income Fund Inc.
| Security | Rate | Maturity Date | Face Amount† | Value | ||||||||||||
Transportation Infrastructure — 0.5% | ||||||||||||||||
Mersin Uluslararasi Liman Isletmeciligi AS, Notes | 5.875 | % | 8/12/20 | 260,000 | $ | 268,775 | (a)(b) | |||||||||
PT Pelabuhan Indonesia II, Senior Bonds | 4.250 | % | 5/5/25 | 490,000 | 452,638 | (a) | ||||||||||
Total Transportation Infrastructure | 721,413 | |||||||||||||||
Total Industrials | 14,657,964 | |||||||||||||||
| Information Technology — 2.6% | ||||||||||||||||
Electronic Equipment, Instruments & Components — 0.2% | ||||||||||||||||
Interface Security Systems Holdings Inc./Interface Security Systems LLC, Senior Secured Notes | 9.250 | % | 1/15/18 | 290,000 | 273,688 | |||||||||||
Internet Software & Services — 0.3% | ||||||||||||||||
Ancestry.com Holdings LLC, Senior Notes | 9.625 | % | 10/15/18 | 130,000 | 124,637 | (a)(c) | ||||||||||
Ancestry.com Inc., Senior Notes | 11.000 | % | 12/15/20 | 250,000 | 264,375 | |||||||||||
Total Internet Software & Services | 389,012 | |||||||||||||||
IT Services — 1.7% | ||||||||||||||||
Compiler Finance Subordinated Inc., Senior Notes | 7.000 | % | 5/1/21 | 400,000 | 157,000 | (a)(e) | ||||||||||
First Data Corp., Secured Notes | 5.750 | % | 1/15/24 | 140,000 | 141,225 | (a) | ||||||||||
First Data Corp., Senior Notes | 7.000 | % | 12/1/23 | 20,000 | 20,050 | (a) | ||||||||||
First Data Corp., Senior Secured Notes | 5.000 | % | 1/15/24 | 1,910,000 | 1,944,628 | (a)(b) | ||||||||||
Total IT Services | 2,262,903 | |||||||||||||||
Semiconductors & Semiconductor Equipment — 0.1% |
| |||||||||||||||
QUALCOMM Inc., Senior Subordinated Notes | 4.800 | % | 5/20/45 | 180,000 | 166,255 | |||||||||||
Software — 0.3% | ||||||||||||||||
Oberthur Technologies Holding SAS, Senior Secured Notes | 9.250 | % | 4/30/20 | 400,000 | EUR | 452,546 | (a) | |||||||||
Total Information Technology | 3,544,404 | |||||||||||||||
| Materials — 10.7% | ||||||||||||||||
Chemicals — 1.5% | ||||||||||||||||
Alpek SAB de CV, Senior Notes | 4.500 | % | 11/20/22 | 235,000 | 227,098 | (a)(b) | ||||||||||
Eco Services Operations LLC/Eco Finance Corp., Senior Notes | 8.500 | % | 11/1/22 | 100,000 | 90,000 | (a) | ||||||||||
Hexion Inc., Senior Secured Notes | 8.875 | % | 2/1/18 | 150,000 | 100,125 | |||||||||||
HIG BBC Intermediate Holdings LLC/HIG BBC Holdings Corp., Senior Notes | 10.500 | % | 9/15/18 | 160,000 | 104,800 | (a)(c) | ||||||||||
Kerling PLC, Senior Secured Notes | 10.625 | % | 2/1/17 | 118,000 | EUR | 128,206 | (a)(b) | |||||||||
Mexichem SAB de CV, Senior Notes | 4.875 | % | 9/19/22 | 260,000 | 264,550 | (a)(b) | ||||||||||
OCP SA, Senior Notes | 5.625 | % | 4/25/24 | 450,000 | 459,562 | (a)(b) | ||||||||||
OCP SA, Senior Notes | 4.500 | % | 10/22/25 | 430,000 | 401,934 | (a)(b) | ||||||||||
Rain CII Carbon LLC/CII Carbon Corp., Senior Secured Notes | 8.000 | % | 12/1/18 | 420,000 | 343,350 | (a) | ||||||||||
Total Chemicals | 2,119,625 | |||||||||||||||
Construction Materials — 0.7% | ||||||||||||||||
Cementos Pacasmayo SAA, Senior Notes | 4.500 | % | 2/8/23 | 220,000 | 205,700 | (a)(b) | ||||||||||
See Notes to Financial Statements.
| 14 | Western Asset Global Partners Income Fund Inc. 2016 Semi-Annual Report |
Table of Contents
Western Asset Global Partners Income Fund Inc.
| Security | Rate | Maturity Date | Face Amount† | Value | ||||||||||||
Construction Materials — continued | ||||||||||||||||
Cementos Pacasmayo SAA, Senior Notes | 4.500 | % | 2/8/23 | 100,000 | $ | 93,500 | (b)(f) | |||||||||
Cemex Finance LLC, Senior Secured Notes | 9.375 | % | 10/12/22 | 320,000 | 337,600 | (a)(b) | ||||||||||
Cimpor Financial Operations BV, Senior Notes | 5.750 | % | 7/17/24 | 350,000 | 224,000 | (a) | ||||||||||
Hardwoods Acquisition Inc., Senior Secured Notes | 7.500 | % | 8/1/21 | 270,000 | 128,250 | (a) | ||||||||||
NWH Escrow Corp., Senior Secured Notes | 7.500 | % | 8/1/21 | 100,000 | 45,000 | (a) | ||||||||||
Total Construction Materials | 1,034,050 | |||||||||||||||
Containers & Packaging — 2.3% | ||||||||||||||||
Ardagh Finance Holdings SA, Senior Notes | 8.625 | % | 6/15/19 | 295,311 | 276,854 | (a)(c) | ||||||||||
Ardagh Packaging Finance PLC, Senior Notes | 9.250 | % | 10/15/20 | 1,000,000 | EUR | 1,131,365 | (a)(b) | |||||||||
BWAY Holding Co., Senior Notes | 9.125 | % | 8/15/21 | 460,000 | 384,100 | (a) | ||||||||||
Coveris Holdings SA, Senior Notes | 7.875 | % | 11/1/19 | 400,000 | 320,000 | (a)(b) | ||||||||||
Pactiv LLC, Senior Bonds | 8.375 | % | 4/15/27 | 360,000 | 311,400 | |||||||||||
Pactiv LLC, Senior Notes | 7.950 | % | 12/15/25 | 330,000 | 285,450 | |||||||||||
PaperWorks Industries Inc., Senior Secured Notes | 9.500 | % | 8/15/19 | 220,000 | 186,450 | (a) | ||||||||||
Suzano Trading Ltd., Senior Notes | 5.875 | % | 1/23/21 | 240,000 | 240,720 | (a)(b) | ||||||||||
Total Containers & Packaging | 3,136,339 | |||||||||||||||
Metals & Mining — 5.3% | ||||||||||||||||
ArcelorMittal, Senior Notes | 8.000 | % | 10/15/39 | 270,000 | 213,705 | |||||||||||
Barminco Finance Pty Ltd., Senior Notes | 9.000 | % | 6/1/18 | 240,000 | 183,900 | (a) | ||||||||||
Coeur Mining Inc., Senior Notes | 7.875 | % | 2/1/21 | 620,000 | 443,300 | (b) | ||||||||||
Corporacion Nacional del Cobre de Chile, Senior Notes | 3.750 | % | 11/4/20 | 250,000 | 254,935 | (a)(b) | ||||||||||
Corporacion Nacional del Cobre de Chile, Senior Notes | 3.875 | % | 11/3/21 | 490,000 | 493,743 | (a)(b) | ||||||||||
Corporacion Nacional del Cobre de Chile, Senior Notes | 3.000 | % | 7/17/22 | 300,000 | 281,414 | (b)(f) | ||||||||||
Corporacion Nacional del Cobre de Chile, Senior Notes | 3.000 | % | 7/17/22 | 200,000 | 187,610 | (a)(b) | ||||||||||
FMG Resources (August 2006) Pty Ltd., Senior Secured Notes | 9.750 | % | 3/1/22 | 580,000 | 548,100 | (a)(b) | ||||||||||
Freeport-McMoRan Inc., Senior Notes | 4.000 | % | 11/14/21 | 250,000 | 171,250 | |||||||||||
Freeport-McMoRan Inc., Senior Notes | 3.550 | % | 3/1/22 | 180,000 | 119,700 | |||||||||||
Gerdau Trade Inc., Senior Notes | 4.750 | % | 4/15/23 | 270,000 | 170,438 | (a)(b) | ||||||||||
Midwest Vanadium Pty Ltd., Senior Secured Notes | 11.500 | % | 2/15/18 | 330,000 | 20,625 | *(a)(e)(h) | ||||||||||
Mirabela Nickel Ltd., Subordinated Notes | 1.000 | % | 9/10/44 | 4,091 | 0 | (a)(c)(d)(e)(j) | ||||||||||
Rio Tinto Finance USA Ltd., Senior Notes | 9.000 | % | 5/1/19 | 260,000 | 301,673 | (b) | ||||||||||
Schaeffler Holding Finance BV, Senior Secured Bonds | 6.875 | % | 8/15/18 | 200,000 | 205,500 | (a)(c) | ||||||||||
Schaeffler Holding Finance BV, Senior Secured Notes | 6.875 | % | 8/15/18 | 290,000 | EUR | 325,390 | (a)(c) | |||||||||
Schaeffler Holding Finance BV, Senior Secured Notes | 6.750 | % | 11/15/22 | 380,000 | 404,700 | (a)(c) | ||||||||||
Severstal OAO Via Steel Capital SA, Senior Notes | 4.450 | % | 3/19/18 | 300,000 | 300,750 | (a)(b) | ||||||||||
Southern Copper Corp., Senior Notes | 6.750 | % | 4/16/40 | 730,000 | 645,808 | (b) | ||||||||||
Southern Copper Corp., Senior Notes | 5.250 | % | 11/8/42 | 180,000 | 135,334 | (b) | ||||||||||
See Notes to Financial Statements.
| Western Asset Global Partners Income Fund Inc. 2016 Semi-Annual Report | 15 |
Table of Contents
Schedule of investments (unaudited) (cont’d)
February 29, 2016
Western Asset Global Partners Income Fund Inc.
| Security | Rate | Maturity Date | Face Amount† | Value | ||||||||||||
Metals & Mining — continued | ||||||||||||||||
Steel Dynamics Inc., Senior Notes | 6.125 | % | 8/15/19 | 150,000 | $ | 154,125 | (b) | |||||||||
Vale Overseas Ltd., Senior Notes | 4.375 | % | 1/11/22 | 2,277,000 | 1,764,675 | |||||||||||
Total Metals & Mining | 7,326,675 | |||||||||||||||
Paper & Forest Products — 0.9% | ||||||||||||||||
Celulosa Arauco y Constitucion SA, Senior Notes | 7.250 | % | 7/29/19 | 62,000 | 69,706 | (b) | ||||||||||
Celulosa Arauco y Constitucion SA, Senior Notes | 4.750 | % | 1/11/22 | 160,000 | 164,565 | (b) | ||||||||||
Fibria Overseas Finance Ltd., Senior Notes | 5.250 | % | 5/12/24 | 200,000 | 190,120 | (b) | ||||||||||
Inversiones CMPC SA, Notes | 4.375 | % | 5/15/23 | 200,000 | 196,997 | (a)(b) | ||||||||||
Inversiones CMPC SA, Senior Notes | 4.750 | % | 1/19/18 | 250,000 | 257,284 | (a)(b) | ||||||||||
Inversiones CMPC SA, Senior Notes | 4.500 | % | 4/25/22 | 190,000 | 191,147 | (a)(b) | ||||||||||
Resolute Forest Products Inc., Senior Notes | 5.875 | % | 5/15/23 | 230,000 | 121,900 | |||||||||||
Total Paper & Forest Products | 1,191,719 | |||||||||||||||
Total Materials | 14,808,408 | |||||||||||||||
| Telecommunication Services — 10.2% | ||||||||||||||||
Diversified Telecommunication Services — 5.0% | ||||||||||||||||
Bharti Airtel International Netherlands BV, Senior Bonds | 5.350 | % | 5/20/24 | 280,000 | 297,359 | (a)(b) | ||||||||||
Bharti Airtel Ltd., Senior Notes | 4.375 | % | 6/10/25 | 350,000 | 347,929 | (a) | ||||||||||
CenturyLink Inc., Senior Notes | 6.750 | % | 12/1/23 | 250,000 | 245,313 | (b) | ||||||||||
Cincinnati Bell Telephone Co., LLC, Senior Debentures | 6.300 | % | 12/1/28 | 50,000 | 44,500 | (b) | ||||||||||
Empresa Nacional de Telecomunicaciones SA, Senior Notes | 4.875 | % | 10/30/24 | 200,000 | 185,139 | (a)(b) | ||||||||||
Frontier Communications Corp., Senior Notes | 11.000 | % | 9/15/25 | 840,000 | 844,200 | (a)(b) | ||||||||||
Intelsat Jackson Holdings SA, Senior Notes | 7.500 | % | 4/1/21 | 1,880,000 | 1,316,000 | (b) | ||||||||||
Intelsat Luxembourg SA, Senior Bonds | 7.750 | % | 6/1/21 | 130,000 | 39,650 | |||||||||||
Level 3 Financing Inc., Senior Notes | 6.125 | % | 1/15/21 | 90,000 | 94,275 | |||||||||||
Oi Brasil Holdings Cooperatief U.A., Senior Notes | 5.750 | % | 2/10/22 | 1,000,000 | 250,000 | (a) | ||||||||||
Ooredoo International Finance Ltd., Senior Notes | 4.750 | % | 2/16/21 | 220,000 | 242,247 | (a)(b) | ||||||||||
Telecom Italia Capital SA, Senior Notes | 7.200 | % | 7/18/36 | 780,000 | 729,300 | |||||||||||
Turk Telekomunikasyon AS, Senior Bonds | 3.750 | % | 6/19/19 | 330,000 | 328,238 | (a)(b) | ||||||||||
Turk Telekomunikasyon AS, Senior Notes | 4.875 | % | 6/19/24 | 220,000 | 208,505 | (a)(b) | ||||||||||
Verizon Communications Inc., Senior Notes | 5.150 | % | 9/15/23 | 390,000 | 442,218 | (b) | ||||||||||
Windstream Services LLC, Senior Notes | 7.750 | % | 10/15/20 | 90,000 | 74,786 | |||||||||||
Windstream Services LLC, Senior Notes | 7.750 | % | 10/1/21 | 1,540,000 | 1,250,287 | |||||||||||
Windstream Services LLC, Senior Notes | 6.375 | % | 8/1/23 | 10,000 | 7,300 | |||||||||||
Total Diversified Telecommunication Services | 6,947,246 | |||||||||||||||
Wireless Telecommunication Services — 5.2% | ||||||||||||||||
Altice Financing SA, Senior Secured Notes | 5.250 | % | 2/15/23 | 100,000 | EUR | 104,706 | (a) | |||||||||
Altice Financing SA, Senior Secured Notes | 6.625 | % | 2/15/23 | 610,000 | 603,900 | (a) | ||||||||||
America Movil SAB de CV, Senior Notes | 5.625 | % | 11/15/17 | 340,000 | 360,939 | (b) | ||||||||||
See Notes to Financial Statements.
| 16 | Western Asset Global Partners Income Fund Inc. 2016 Semi-Annual Report |
Table of Contents
Western Asset Global Partners Income Fund Inc.
| Security | Rate | Maturity Date | Face Amount† | Value | ||||||||||||
Wireless Telecommunication Services — continued | ||||||||||||||||
Neptune Finco Corp., Senior Notes | 6.625 | % | 10/15/25 | 400,000 | $ | 423,000 | (a)(b) | |||||||||
Neptune Finco Corp., Senior Notes | 10.875 | % | 10/15/25 | 470,000 | 508,775 | (a) | ||||||||||
Sprint Capital Corp., Senior Notes | 8.750 | % | 3/15/32 | 1,390,000 | 1,077,250 | (b) | ||||||||||
Sprint Communications Inc., Senior Notes | 9.000 | % | 11/15/18 | 630,000 | 657,153 | (a)(b) | ||||||||||
Sprint Communications Inc., Senior Notes | 7.000 | % | 8/15/20 | 450,000 | 355,500 | |||||||||||
Sprint Communications Inc., Senior Notes | 11.500 | % | 11/15/21 | 385,000 | 328,213 | (b) | ||||||||||
Sprint Corp., Senior Notes | 7.250 | % | 9/15/21 | 1,440,000 | 1,090,800 | |||||||||||
Sprint Corp., Senior Notes | 7.875 | % | 9/15/23 | 190,000 | 141,550 | |||||||||||
T-Mobile USA Inc., Senior Notes | 6.542 | % | 4/28/20 | 120,000 | 124,800 | |||||||||||
T-Mobile USA Inc., Senior Notes | 6.633 | % | 4/28/21 | 20,000 | 21,000 | |||||||||||
T-Mobile USA Inc., Senior Notes | 6.500 | % | 1/15/26 | 490,000 | 499,001 | |||||||||||
VimpelCom Holdings BV, Senior Notes | 7.504 | % | 3/1/22 | 590,000 | 607,080 | (f) | ||||||||||
VimpelCom Holdings BV, Senior Notes | 7.504 | % | 3/1/22 | 200,000 | 205,790 | (a)(b) | ||||||||||
Total Wireless Telecommunication Services | 7,109,457 | |||||||||||||||
Total Telecommunication Services | 14,056,703 | |||||||||||||||
| Utilities — 4.1% | ||||||||||||||||
Electric Utilities — 1.8% | ||||||||||||||||
Comision Federal de Electricidad, Senior Notes | 4.875 | % | 1/15/24 | 200,000 | 201,250 | (a)(b) | ||||||||||
Comision Federal de Electricidad, Senior Notes | 6.125 | % | 6/16/45 | 250,000 | 240,625 | (a) | ||||||||||
FirstEnergy Corp., Notes | 7.375 | % | 11/15/31 | 330,000 | 411,050 | (b) | ||||||||||
Majapahit Holding BV, Senior Notes | 7.750 | % | 1/20/20 | 280,000 | 319,306 | (b)(f) | ||||||||||
NRG REMA LLC, Pass-Through Certificates, Senior Secured Bonds | 9.681 | % | 7/2/26 | 450,000 | 437,062 | (b) | ||||||||||
Red Oak Power LLC, Secured Notes | 9.200 | % | 11/30/29 | 660,000 | 679,800 | |||||||||||
State Grid Overseas Investment 2013 Ltd., Senior Bonds | 3.125 | % | 5/22/23 | 200,000 | 204,335 | (a)(b) | ||||||||||
Total Electric Utilities | 2,493,428 | |||||||||||||||
Gas Utilities — 0.5% | ||||||||||||||||
Gas Natural de Lima y Callao SA, Senior Notes | 4.375 | % | 4/1/23 | 200,000 | 192,000 | (a)(b) | ||||||||||
Southern Natural Gas Co., LLC, Senior Notes | 8.000 | % | 3/1/32 | 70,000 | 65,926 | (b) | ||||||||||
Transportadora de Gas Internacional SA ESP, Senior Notes | 5.700 | % | 3/20/22 | 470,000 | 462,363 | (a)(b) | ||||||||||
Total Gas Utilities | 720,289 | |||||||||||||||
Independent Power and Renewable Electricity Producers — 1.8% |
| |||||||||||||||
AES Gener SA, Notes | 5.250 | % | 8/15/21 | 250,000 | 251,778 | (a)(b) | ||||||||||
Calpine Corp., Senior Secured Notes | 7.875 | % | 1/15/23 | 312,000 | 331,500 | (a)(b) | ||||||||||
Korea East-West Power Co., Ltd., Senior Notes | 2.500 | % | 6/2/20 | 400,000 | 406,855 | (a) | ||||||||||
Mirant Mid Atlantic LLC, Pass-Through Certificates, Secured Bonds | 10.060 | % | 12/30/28 | 1,071,724 | 1,046,271 | (b) | ||||||||||
See Notes to Financial Statements.
| Western Asset Global Partners Income Fund Inc. 2016 Semi-Annual Report | 17 |
Table of Contents
Schedule of investments (unaudited) (cont’d)
February 29, 2016
Western Asset Global Partners Income Fund Inc.
| Security | Rate | Maturity Date | Face Amount† | Value | ||||||||||||
Independent Power and Renewable Electricity Producers — continued |
| |||||||||||||||
Three Gorges Finance Ltd., Senior Notes | 3.700 | % | 6/10/25 | 440,000 | $ | 462,385 | (a)(b) | |||||||||
Total Independent Power and Renewable Electricity Producers |
| 2,498,789 | ||||||||||||||
Total Utilities | 5,712,506 | |||||||||||||||
Total Corporate Bonds & Notes (Cost — $144,289,506) |
| 130,875,090 | ||||||||||||||
| Collateralized Mortgage Obligations — 0.6% | ||||||||||||||||
Commercial Mortgage Trust, 2015-LC21 E | 3.250 | % | 7/10/48 | 500,000 | 291,930 | (a) | ||||||||||
JPMBB Commercial Mortgage Securities Trust, 2015-C31 E | 4.619 | % | 8/15/48 | 400,000 | 293,174 | (a)(g) | ||||||||||
Wells Fargo Commercial Mortgage Trust, 2015-C28 E | 3.000 | % | 5/15/48 | 400,000 | 228,279 | (a) | ||||||||||
Total Collateralized Mortgage Obligations (Cost — $852,771) |
| 813,383 | ||||||||||||||
| Convertible Bonds & Notes — 0.2% | ||||||||||||||||
| Materials — 0.2% | ||||||||||||||||
Chemicals — 0.1% | ||||||||||||||||
Hercules Inc., Junior Subordinated Bonds | 6.500 | % | 6/30/29 | 90,000 | 77,391 | |||||||||||
Metals & Mining — 0.1% | ||||||||||||||||
Mirabela Nickel Ltd., Senior Secured Bonds | 9.500 | % | 6/24/19 | 335,618 | 142,638 | (a)(c)(e) | ||||||||||
Total Convertible Bonds & Notes (Cost — $418,660) |
| 220,029 | ||||||||||||||
| Senior Loans — 1.6% | ||||||||||||||||
| Consumer Discretionary — 0.5% | ||||||||||||||||
Hotels, Restaurants & Leisure — 0.2% | ||||||||||||||||
Equinox Holdings Inc., Second Lien Term Loan | 9.750 | % | 7/31/20 | 300,000 | 300,750 | (k)(l) | ||||||||||
Specialty Retail — 0.2% | ||||||||||||||||
Spencer Gifts LLC, Second Lien Term Loan | 9.250 | % | 6/29/22 | 230,000 | 231,150 | (k)(l) | ||||||||||
Textiles, Apparel & Luxury Goods — 0.1% | ||||||||||||||||
TOMS Shoes LLC, Term Loan B | 6.500 | % | 10/28/20 | 178,650 | 112,549 | (k)(l) | ||||||||||
Total Consumer Discretionary | 644,449 | |||||||||||||||
| Consumer Staples — 0.1% | ||||||||||||||||
Food Products — 0.1% | ||||||||||||||||
AdvancePierre Foods Inc., Second Lien Term Loan | 9.500 | % | 10/10/17 | 130,000 | 128,538 | (k)(l) | ||||||||||
| Energy — 0.6% | ||||||||||||||||
Energy Equipment & Services — 0.3% | ||||||||||||||||
Hercules Offshore LLC, Exit Term Loan | 10.500 | % | 5/6/20 | 690,000 | 432,975 | (k)(l) | ||||||||||
Oil, Gas & Consumable Fuels — 0.3% | ||||||||||||||||
Magnum Hunter Resources Inc., DIP Term Loan | 9.000 | % | 9/15/16 | 245,000 | 245,000 | (e)(k)(l) | ||||||||||
Westmoreland Coal Co., Term Loan B | 7.500 | % | 12/16/20 | 177,058 | 108,890 | (k)(l) | ||||||||||
Total Oil, Gas & Consumable Fuels | 353,890 | |||||||||||||||
Total Energy | 786,865 | |||||||||||||||
See Notes to Financial Statements.
| 18 | Western Asset Global Partners Income Fund Inc. 2016 Semi-Annual Report |
Table of Contents
Western Asset Global Partners Income Fund Inc.
| Security | Rate | Maturity Date | Face Amount† | Value | ||||||||||||
| Health Care — 0.3% | ||||||||||||||||
Health Care Equipment & Supplies — 0.1% | ||||||||||||||||
Lantheus Medical Imaging Inc., Term Loan | 7.000 | % | 6/30/22 | 218,900 | $ | 190,443 | (k)(l) | |||||||||
Health Care Providers & Services — 0.2% | ||||||||||||||||
Radnet Management Inc., Second Lien Term Loan | 8.000 | % | 3/25/21 | 290,000 | 266,438 | (k)(l) | ||||||||||
Total Health Care | 456,881 | |||||||||||||||
| Utilities — 0.1% | ||||||||||||||||
Electric Utilities — 0.1% | ||||||||||||||||
Panda Temple Power LLC, 2015 Term Loan B | 7.250 | % | 3/4/22 | 258,050 | 212,891 | (k)(l) | ||||||||||
Total Senior Loans (Cost — $2,658,339) | 2,229,624 | |||||||||||||||
| Sovereign Bonds — 28.7% | ||||||||||||||||
Argentina — 2.4% | ||||||||||||||||
Republic of Argentina, Senior Bonds | 7.000 | % | 4/17/17 | 1,490,000 | 1,506,469 | (b) | ||||||||||
Republic of Argentina, Senior Notes | 8.280 | % | 12/31/33 | 1,514,201 | 1,786,000 | |||||||||||
Total Argentina | 3,292,469 | |||||||||||||||
Armenia — 0.3% | ||||||||||||||||
Republic of Armenia, Senior Notes | 6.000 | % | 9/30/20 | 360,000 | 350,100 | (f) | ||||||||||
Brazil — 0.6% | ||||||||||||||||
Federative Republic of Brazil, Senior Notes | 8.000 | % | 1/15/18 | 806,223 | 852,580 | (m) | ||||||||||
Chile — 0.3% | ||||||||||||||||
Republic of Chile, Senior Notes | 3.875 | % | 8/5/20 | 412,000 | 445,990 | (b) | ||||||||||
Colombia — 2.0% | ||||||||||||||||
Republic of Colombia, Senior Bonds | 7.375 | % | 9/18/37 | 2,150,000 | 2,338,125 | (m) | ||||||||||
Republic of Colombia, Senior Bonds | 6.125 | % | 1/18/41 | 180,000 | 172,350 | |||||||||||
Republic of Colombia, Senior Notes | 7.375 | % | 3/18/19 | 255,000 | 285,600 | |||||||||||
Total Colombia | 2,796,075 | |||||||||||||||
Costa Rica — 0.4% | ||||||||||||||||
Republic of Costa Rica, Notes | 7.000 | % | 4/4/44 | 590,000 | 499,287 | (a) | ||||||||||
Croatia — 0.5% | ||||||||||||||||
Republic of Croatia, Senior Notes | 6.625 | % | 7/14/20 | 260,000 | 283,031 | (a) | ||||||||||
Republic of Croatia, Senior Notes | 5.500 | % | 4/4/23 | 210,000 | 219,354 | (f) | ||||||||||
Republic of Croatia, Senior Notes | 5.500 | % | 4/4/23 | 200,000 | 208,908 | (a) | ||||||||||
Total Croatia | 711,293 | |||||||||||||||
Dominican Republic — 0.9% | ||||||||||||||||
Dominican Republic, Senior Notes | 5.500 | % | 1/27/25 | 120,000 | 116,100 | (a) | ||||||||||
Dominican Republic, Senior Notes | 6.850 | % | 1/27/45 | 1,140,000 | 1,068,750 | (a)(b) | ||||||||||
Total Dominican Republic | 1,184,850 | |||||||||||||||
Ecuador — 0.5% | ||||||||||||||||
Republic of Ecuador, Senior Bonds | 10.500 | % | 3/24/20 | 940,000 | 740,250 | (a) | ||||||||||
See Notes to Financial Statements.
| Western Asset Global Partners Income Fund Inc. 2016 Semi-Annual Report | 19 |
Table of Contents
Schedule of investments (unaudited) (cont’d)
February 29, 2016
Western Asset Global Partners Income Fund Inc.
| Security | Rate | Maturity Date | Face Amount† | Value | ||||||||||||
Egypt — 0.2% | ||||||||||||||||
Arab Republic of Egypt, Senior Notes | 5.875 | % | 6/11/25 | 330,000 | $ | 284,213 | (a) | |||||||||
El Salvador — 0.1% | ||||||||||||||||
Republic of El Salvador, Notes | 6.375 | % | 1/18/27 | 190,000 | 161,975 | (a) | ||||||||||
Gabon — 0.3% | ||||||||||||||||
Gabonese Republic, Bonds | 6.375 | % | 12/12/24 | 250,000 | 203,258 | (a) | ||||||||||
Gabonese Republic, Senior Bonds | 6.950 | % | 6/16/25 | 200,000 | 162,500 | (a) | ||||||||||
Total Gabon | 365,758 | |||||||||||||||
Ghana — 0.2% | ||||||||||||||||
Republic of Ghana, Bonds | 10.750 | % | 10/14/30 | 290,000 | 266,823 | (a) | ||||||||||
Honduras — 0.3% | ||||||||||||||||
Republic of Honduras, Senior Notes | 7.500 | % | 3/15/24 | 400,000 | 420,470 | (f) | ||||||||||
Hungary — 1.5% | ||||||||||||||||
Republic of Hungary, Senior Notes | 5.750 | % | 11/22/23 | 1,528,000 | 1,733,226 | |||||||||||
Republic of Hungary, Senior Notes | 5.375 | % | 3/25/24 | 300,000 | 334,012 | |||||||||||
Total Hungary | 2,067,238 | |||||||||||||||
Indonesia — 3.3% | ||||||||||||||||
Republic of Indonesia, Senior Bonds | 6.875 | % | 1/17/18 | 100,000 | 108,929 | (f) | ||||||||||
Republic of Indonesia, Senior Bonds | 6.625 | % | 2/17/37 | 1,735,000 | 1,890,777 | (b)(f) | ||||||||||
Republic of Indonesia, Senior Notes | 5.875 | % | 1/15/24 | 1,727,000 | 1,913,514 | (a) | ||||||||||
Republic of Indonesia, Senior Notes | 5.250 | % | 1/17/42 | 680,000 | 650,526 | (a) | ||||||||||
Total Indonesia | 4,563,746 | |||||||||||||||
Ivory Coast — 0.6% | ||||||||||||||||
Republic of Cote D’Ivoire, Senior Bonds | 5.750 | % | 12/31/32 | 950,000 | 842,446 | (f) | ||||||||||
Jamaica — 0.2% | ||||||||||||||||
Government of Jamaica, Senior Notes | 6.750 | % | 4/28/28 | 320,000 | 324,800 | |||||||||||
Kenya — 0.1% | ||||||||||||||||
Republic of Kenya, Senior Notes | 6.875 | % | 6/24/24 | 200,000 | 184,500 | (a) | ||||||||||
Lithuania — 0.7% | ||||||||||||||||
Republic of Lithuania, Senior Notes | 6.125 | % | 3/9/21 | 860,000 | 997,772 | (a) | ||||||||||
Mexico — 1.5% | ||||||||||||||||
United Mexican States, Senior Notes | 5.125 | % | 1/15/20 | 220,000 | 241,670 | (b) | ||||||||||
United Mexican States, Senior Notes | 3.625 | % | 3/15/22 | 520,000 | 532,740 | (b) | ||||||||||
United Mexican States, Senior Notes | 4.000 | % | 10/2/23 | 160,000 | 164,960 | |||||||||||
United Mexican States, Senior Notes | 4.750 | % | 3/8/44 | 1,230,000 | 1,159,275 | (b) | ||||||||||
Total Mexico | 2,098,645 | |||||||||||||||
Namibia — 0.2% | ||||||||||||||||
Republic of Namibia, Senior Notes | 5.250 | % | 10/29/25 | 260,000 | 247,304 | (a)(b) | ||||||||||
See Notes to Financial Statements.
| 20 | Western Asset Global Partners Income Fund Inc. 2016 Semi-Annual Report |
Table of Contents
Western Asset Global Partners Income Fund Inc.
| Security | Rate | Maturity Date | Face Amount† | Value | ||||||||||||
Pakistan — 0.2% | ||||||||||||||||
Republic of Pakistan, Senior Bonds | 7.250 | % | 4/15/19 | 330,000 | $ | 339,025 | (a) | |||||||||
Panama — 0.4% | ||||||||||||||||
Republic of Panama, Senior Bonds | 6.700 | % | 1/26/36 | 459,000 | 576,045 | |||||||||||
Peru — 2.2% | ||||||||||||||||
Republic of Peru, Senior Bonds | 7.350 | % | 7/21/25 | 1,200,000 | 1,536,000 | (m) | ||||||||||
Republic of Peru, Senior Bonds | 8.750 | % | 11/21/33 | 690,000 | 986,700 | |||||||||||
Republic of Peru, Senior Bonds | 6.550 | % | 3/14/37 | 321,000 | 387,607 | |||||||||||
Republic of Peru, Senior Bonds | 5.625 | % | 11/18/50 | 79,000 | 84,728 | |||||||||||
Total Peru | 2,995,035 | |||||||||||||||
Philippines — 1.1% | ||||||||||||||||
Republic of Philippines, Senior Bonds | 5.500 | % | 3/30/26 | 660,000 | 806,463 | |||||||||||
Republic of Philippines, Senior Bonds | 3.950 | % | 1/20/40 | 600,000 | 644,156 | |||||||||||
Total Philippines | 1,450,619 | |||||||||||||||
Poland — 1.8% | ||||||||||||||||
Republic of Poland, Senior Notes | 6.375 | % | 7/15/19 | 400,000 | 456,824 | |||||||||||
Republic of Poland, Senior Notes | 5.125 | % | 4/21/21 | 500,000 | 562,574 | |||||||||||
Republic of Poland, Senior Notes | 5.000 | % | 3/23/22 | 1,270,000 | 1,431,188 | (m) | ||||||||||
Total Poland | 2,450,586 | |||||||||||||||
Russia — 3.1% | ||||||||||||||||
Russian Foreign Bond — Eurobond, Senior Bonds | 4.875 | % | 9/16/23 | 400,000 | 413,670 | (a)(b) | ||||||||||
Russian Foreign Bond — Eurobond, Senior Bonds | 12.750 | % | 6/24/28 | 42,000 | 67,944 | (b)(f) | ||||||||||
Russian Foreign Bond — Eurobond, Senior Bonds | 7.500 | % | 3/31/30 | 2,348,763 | 2,871,804 | (f)(m) | ||||||||||
Russian Foreign Bond — Eurobond, Senior Bonds | 5.875 | % | 9/16/43 | 1,000,000 | 995,501 | (a) | ||||||||||
Total Russia | 4,348,919 | |||||||||||||||
Senegal — 0.1% | ||||||||||||||||
Republic of Senegal, Bonds | 6.250 | % | 7/30/24 | 200,000 | 182,270 | (f) | ||||||||||
South Africa — 0.2% | ||||||||||||||||
Republic of South Africa, Senior Notes | 5.875 | % | 9/16/25 | 260,000 | 273,022 | |||||||||||
Tunisia — 0.1% | ||||||||||||||||
Banque Centrale de Tunisie SA, Senior Bonds | 5.750 | % | 1/30/25 | 200,000 | 173,646 | (a) | ||||||||||
Turkey — 1.6% | ||||||||||||||||
Republic of Turkey, Senior Bonds | 5.750 | % | 3/22/24 | 260,000 | 276,646 | |||||||||||
Republic of Turkey, Senior Bonds | 4.250 | % | 4/14/26 | 520,000 | 493,880 | |||||||||||
Republic of Turkey, Senior Bonds | 11.875 | % | 1/15/30 | 575,000 | 952,574 | |||||||||||
Republic of Turkey, Senior Notes | 6.875 | % | 3/17/36 | 346,000 | 390,188 | |||||||||||
Republic of Turkey, Senior Notes | 6.750 | % | 5/30/40 | 25,000 | 27,969 | |||||||||||
Total Turkey | 2,141,257 | |||||||||||||||
See Notes to Financial Statements.
| Western Asset Global Partners Income Fund Inc. 2016 Semi-Annual Report | 21 |
Table of Contents
Schedule of investments (unaudited) (cont’d)
February 29, 2016
Western Asset Global Partners Income Fund Inc.
| Security | Rate | Maturity Date | Face Amount† | Value | ||||||||||||
Uruguay — 0.6% | ||||||||||||||||
Republic of Uruguay, Senior Bonds | 5.100 | % | 6/18/50 | 450,000 | $ | 405,000 | ||||||||||
Republic of Uruguay, Senior Notes | 4.375 | % | 10/27/27 | 379,735 | 383,532 | |||||||||||
Total Uruguay | 788,532 | |||||||||||||||
Vietnam — 0.2% | ||||||||||||||||
Republic of Vietnam, Senior Bonds | 4.800 | % | 11/19/24 | 300,000 | 294,791 | (a) | ||||||||||
Total Sovereign Bonds (Cost — $38,140,460) | 39,712,331 | |||||||||||||||
| Shares | ||||||||||||||||
| Common Stocks — 2.1% | ||||||||||||||||
| Consumer Discretionary — 0.0% | ||||||||||||||||
Hotels, Restaurants & Leisure — 0.0% | ||||||||||||||||
Bossier Casino Venture Holdco Inc. | 19,194 | 0 | *(d)(e)(j) | |||||||||||||
| Energy — 0.2% | ||||||||||||||||
Energy Equipment & Services — 0.2% | ||||||||||||||||
Hercules Offshore Inc. | 11,723 | 15,123 | * | |||||||||||||
KCAD Holdings I Ltd. | 77,972,021 | 273,760 | *(d)(e) | |||||||||||||
Total Energy | 288,883 | |||||||||||||||
| Financials — 1.2% | ||||||||||||||||
Banks — 1.2% | ||||||||||||||||
Citigroup Inc. | 34,751 | 1,350,076 | ||||||||||||||
JPMorgan Chase & Co. | 5,293 | 297,996 | ||||||||||||||
Total Financials | 1,648,072 | |||||||||||||||
| Health Care — 0.3% | ||||||||||||||||
Health Care Providers & Services — 0.3% | ||||||||||||||||
Physiotherapy Associates Holdings Inc. | 3,500 | 384,790 | *(d)(e) | |||||||||||||
| Industrials — 0.2% | ||||||||||||||||
Marine — 0.1% | ||||||||||||||||
DeepOcean Group Holding AS | 26,137 | 121,563 | *(d)(e) | |||||||||||||
Road & Rail — 0.0% | ||||||||||||||||
Jack Cooper Enterprises Inc. | 724 | 7 | *(a)(d)(e) | |||||||||||||
Trading Companies & Distributors — 0.1% | ||||||||||||||||
H&E Equipment Services Inc. | 14,851 | 195,588 | ||||||||||||||
Total Industrials | 317,158 | |||||||||||||||
| Materials — 0.0% | ||||||||||||||||
Metals & Mining — 0.0% | ||||||||||||||||
Mirabela Nickel Ltd. | 837,929 | 49,640 | *(d)(e) | |||||||||||||
See Notes to Financial Statements.
| 22 | Western Asset Global Partners Income Fund Inc. 2016 Semi-Annual Report |
Table of Contents
Western Asset Global Partners Income Fund Inc.
| Shares | Value | |||||||||||||||
| Telecommunication Services — 0.2% | ||||||||||||||||
Diversified Telecommunication Services — 0.2% | ||||||||||||||||
Axtel SAB de CV, ADR | 80,545 | $ | 237,841 | *(a) | ||||||||||||
Total Common Stocks (Cost — $4,204,340) | 2,926,384 | |||||||||||||||
| Rate | ||||||||||||||||
| Convertible Preferred Stocks — 0.0% | ||||||||||||||||
| Energy — 0.0% | ||||||||||||||||
Oil, Gas & Consumable Fuels — 0.0% | ||||||||||||||||
Rex Energy Corp. (Cost — $250,225) | 6.000 | % | 3,500 | 13,125 | ||||||||||||
| Preferred Stocks — 0.8% | ||||||||||||||||
| Financials — 0.8% | ||||||||||||||||
Consumer Finance — 0.8% | ||||||||||||||||
GMAC Capital Trust I (Cost — $1,085,701) | 6.402 | % | 43,913 | 1,065,329 | (g) | |||||||||||
| Expiration Date | Contracts | |||||||||||||||
| Purchased Options — 0.1% | ||||||||||||||||
U.S. Dollar/Saudi Arabian Riyal, Call @ 3.84 SAR (Cost — $186,525) | 1/17/17 | 8,569,000 | 88,201 | |||||||||||||
| Warrants | ||||||||||||||||
| Warrants — 0.0% | ||||||||||||||||
Bolivarian Republic of Venezuela, Oil-linked payment obligations (Cost — $0) | 4/15/20 | 9,125 | 41,062 | |||||||||||||
Total Investments before Short-Term Investments (Cost — $192,086,527) |
| 177,984,558 | ||||||||||||||
| Shares | ||||||||||||||||
| Short-Term Investments — 1.3% | ||||||||||||||||
State Street Institutional U.S. Government Money Market Fund, Premier Class (Cost — $1,753,228) | 0.276 | % | 1,753,228 | 1,753,228 | ||||||||||||
Total Investments — 130.1% (Cost — $193,839,755#) |
| 179,737,786 | ||||||||||||||
Liabilities in Excess of Other Assets — (30.1)% | (41,546,204 | ) | ||||||||||||||
Total Net Assets — 100.0% | $ | 138,191,582 | ||||||||||||||
| * | Non-income producing security. |
| † | Face amount denominated in U.S. dollars, unless otherwise noted. |
| (a) | Security is exempt from registration under Rule 144A of the Securities Act of 1933. This security may be resold in transactions that are exempt from registration, normally to qualified institutional buyers. This security has been deemed liquid pursuant to guidelines approved by the Board of Directors, unless otherwise noted. |
| (b) | All or a portion of this security is pledged as collateral pursuant to the loan agreement (See Note 5). |
| (c) | Payment-in-kind security for which the issuer has the option at each interest payment date of making interest payments in cash or additional debt securities. |
See Notes to Financial Statements.
| Western Asset Global Partners Income Fund Inc. 2016 Semi-Annual Report | 23 |
Table of Contents
Schedule of investments (unaudited) (cont’d)
February 29, 2016
Western Asset Global Partners Income Fund Inc.
| (d) | Security is valued in good faith in accordance with procedures approved by the Board of Directors (See Note 1). |
| (e) | Illiquid security. |
| (f) | Security is exempt from registration under Regulation S of the Securities Act of 1933. Regulation S applies to securities offerings that are made outside of the United States and do not involve direct selling efforts in the United States. This security has been deemed liquid pursuant to guidelines approved by the Board of Directors, unless otherwise noted. |
| (g) | Variable rate security. Interest rate disclosed is as of the most recent information available. |
| (h) | The coupon payment on these securities is currently in default as of February 29, 2016. |
| (i) | Security has no maturity date. The date shown represents the next call date. |
| (j) | Value is less than $1. |
| (k) | Senior loans may be considered restricted in that the Fund ordinarily is contractually obligated to receive approval from the agent bank and/or borrower prior to the disposition of a senior loan. |
| (l) | Interest rates disclosed represent the effective rates on senior loans. Ranges in interest rates are attributable to multiple contracts under the same loan. |
| (m) | All or a portion of this security is held by the counterparty as collateral for open reverse repurchase agreements. |
| # | Aggregate cost for federal income tax purposes is substantially the same. |
Abbreviations used in this schedule: | ||
| ADR | — American Depositary Receipts | |
| AUD | — Australian Dollar | |
| DIP | — Debtor-in-Possession | |
| EUR | — Euro | |
| GBP | — British Pound | |
| GDP | — Gross Domestic Product | |
| SAR | — Saudi Arabian Riyal | |
| Summary of Investments by Country** (unaudited) | ||||
| United States | 40.9 | % | ||
| Mexico | 5.5 | |||
| United Kingdom | 5.1 | |||
| Brazil | 5.0 | |||
| Russia | 4.4 | |||
| Indonesia | 3.5 | |||
| Peru | 2.6 | |||
| Luxembourg | 2.6 | |||
| Colombia | 2.4 | |||
| Argentina | 2.0 | |||
| Chile | 1.8 | |||
| Turkey | 1.6 | |||
| France | 1.6 | |||
| China | 1.5 | |||
| Poland | 1.4 | |||
See Notes to Financial Statements.
| 24 | Western Asset Global Partners Income Fund Inc. 2016 Semi-Annual Report |
Table of Contents
Western Asset Global Partners Income Fund Inc.
| Summary of Investments by Country** (unaudited) (cont’d) | ||||
| Venezuela | 1.2 | % | ||
| Hungary | 1.2 | |||
| Germany | 1.1 | |||
| Netherlands | 1.1 | |||
| Philippines | 0.8 | |||
| India | 0.8 | |||
| Canada | 0.7 | |||
| Australia | 0.7 | |||
| Dominican Republic | 0.7 | |||
| Ireland | 0.6 | |||
| Italy | 0.6 | |||
| Malaysia | 0.6 | |||
| Lithuania | 0.6 | |||
| Morocco | 0.5 | |||
| Ivory Coast | 0.5 | |||
| Uruguay | 0.4 | |||
| Ecuador | 0.4 | |||
| Croatia | 0.4 | |||
| Singapore | 0.3 | |||
| Panama | 0.3 | |||
| Costa Rica | 0.3 | |||
| United Arab Emirates | 0.3 | |||
| Honduras | 0.2 | |||
| South Korea | 0.2 | |||
| Trinidad and Tobago | 0.2 | |||
| Gabon | 0.2 | |||
| Armenia | 0.2 | |||
| Pakistan | 0.2 | |||
| Jamaica | 0.2 | |||
| Vietnam | 0.2 | |||
| Egypt | 0.2 | |||
| South Africa | 0.2 | |||
| Ghana | 0.1 | |||
| Namibia | 0.1 | |||
| Qatar | 0.1 | |||
| Switzerland | 0.1 | |||
| Spain | 0.1 | |||
| Kenya | 0.1 | |||
| Senegal | 0.1 | |||
See Notes to Financial Statements.
| Western Asset Global Partners Income Fund Inc. 2016 Semi-Annual Report | 25 |
Table of Contents
Schedule of investments (unaudited) (cont’d)
February 29, 2016
Western Asset Global Partners Income Fund Inc.
| Summary of Investments by Country** (unaudited) (cont’d) | ||||
| Tunisia | 0.1 | % | ||
| El Salvador | 0.1 | |||
| Norway | 0.1 | |||
| Bahamas | 0.0 | ‡ | ||
| Short-Term Investments | 1.0 | |||
| 100.0 | % | |||
| ** | As a percentage of total investments. Please note that the Fund holdings are as of February 29, 2016 and are subject to change. |
| ‡ | Represents less than 0.1%. |
See Notes to Financial Statements.
| 26 | Western Asset Global Partners Income Fund Inc. 2016 Semi-Annual Report |
Table of Contents
Statement of assets and liabilities (unaudited)
February 29, 2016
| Assets: | ||||
Investments, at value (Cost — $193,839,755) | $ | 179,737,786 | ||
Foreign currency, at value (Cost — $976,482) | 956,738 | |||
Cash | 575,468 | |||
Interest and dividends receivable | 3,715,378 | |||
Receivable for securities sold | 1,110,699 | |||
Deposits with brokers for open futures contracts | 189,030 | |||
Unrealized appreciation on forward foreign currency contracts | 182,060 | |||
Deposits with brokers for centrally cleared swap contracts | 1,392 | |||
Prepaid expenses | 1,672 | |||
Total Assets | 186,470,223 | |||
| Liabilities: | ||||
Loan payable (Note 5) | 40,000,000 | |||
Payable for open reverse repurchase agreements (Note 3) | 7,310,156 | |||
Payable for securities purchased | 601,187 | |||
Investment management fee payable | 114,373 | |||
Unrealized depreciation on forward foreign currency contracts | 102,194 | |||
Payable to broker — variation margin on open futures contracts | 7,681 | |||
Interest payable | 4,266 | |||
Directors’ fees payable | 49 | |||
Accrued expenses | 138,735 | |||
Total Liabilities | 48,278,641 | |||
| Total Net Assets | $ | 138,191,582 | ||
| Net Assets: | ||||
Par value ($0.001 par value, 15,586,783 shares issued and outstanding; 100,000,000 shares authorized) | $ | 15,587 | ||
Paid-in capital in excess of par value | 205,752,281 | |||
Undistributed net investment income | 813,783 | |||
Accumulated net realized loss on investments, futures contracts and foreign currency transactions | (54,338,955) | |||
Net unrealized depreciation on investments, futures contracts and foreign currencies | (14,051,114) | |||
| Total Net Assets | $ | 138,191,582 | ||
| Shares Outstanding | 15,586,783 | |||
| Net Asset Value | $8.87 | |||
See Notes to Financial Statements.
| Western Asset Global Partners Income Fund Inc. 2016 Semi-Annual Report | 27 |
Table of Contents
Statement of operations (unaudited)
For the Six Months Ended February 29, 2016
| Investment Income: | ||||
Interest | $ | 7,395,220 | ||
Dividends | 172,756 | |||
Less: Foreign taxes withheld | (937) | |||
Total Investment Income | 7,567,039 | |||
| Expenses: | ||||
Investment management fee (Note 2) | 772,746 | |||
Interest expense (Notes 3 and 5) | 250,591 | |||
Reorganization fees (Note 9) | 47,992 | |||
Audit and tax fees | 39,975 | |||
Legal fees | 36,606 | |||
Transfer agent fees | 36,307 | |||
Shareholder reports | 18,906 | |||
Directors’ fees | 17,650 | |||
Stock exchange listing fees | 10,567 | |||
Fund accounting fees | 8,041 | |||
Commitment fees (Note 5) | 7,584 | |||
Custody fees | 5,129 | |||
Insurance | 1,654 | |||
Miscellaneous expenses | 5,301 | |||
Total Expenses | 1,259,049 | |||
| Net Investment Income | 6,307,990 | |||
| Realized and Unrealized Gain (Loss) on Investments, Futures Contracts and Foreign Currency Transactions (Notes 1, 3 and 4): | ||||
Net Realized Gain (Loss) From: | ||||
Investment transactions | (11,481,383) | |||
Futures contracts | 16,517 | |||
Foreign currency transactions | 495,447 | |||
Net Realized Loss | (10,969,419) | |||
Change in Net Unrealized Appreciation (Depreciation) From: | ||||
Investments | (7,070,890) | |||
Futures contracts | (59,253) | |||
Foreign currencies | 17,541 | |||
Change in Net Unrealized Appreciation (Depreciation) | (7,112,602) | |||
| Net Loss on Investments, Futures Contracts and Foreign Currency Transactions | (18,082,021) | |||
| Decrease in Net Assets From Operations | $ | (11,774,031) | ||
See Notes to Financial Statements.
| 28 | Western Asset Global Partners Income Fund Inc. 2016 Semi-Annual Report |
Table of Contents
Statements of changes in net assets
| For the Six Months Ended February 29, 2016 (unaudited) and the Year Ended August 31, 2015 | 2016 | 2015 | ||||||
| Operations: | ||||||||
Net investment income | $ | 6,307,990 | $ | 13,007,270 | ||||
Net realized loss | (10,969,419) | (8,420,873) | ||||||
Change in net unrealized appreciation (depreciation) | (7,112,602) | (20,229,212) | ||||||
Decrease in Net Assets From Operations | (11,774,031) | (15,642,815) | ||||||
| Distributions to Shareholders From (Note 1): | ||||||||
Net investment income | (6,780,251) | (13,560,502) | ||||||
Decrease in Net Assets From Distributions to Shareholders | (6,780,251) | (13,560,502) | ||||||
Decrease in Net Assets | (18,554,282) | (29,203,317) | ||||||
| Net Assets: | ||||||||
Beginning of period | 156,745,864 | 185,949,181 | ||||||
End of period* | $ | 138,191,582 | $ | 156,745,864 | ||||
*Includes undistributed net investment income of: | $813,783 | $1,286,044 | ||||||
See Notes to Financial Statements.
| Western Asset Global Partners Income Fund Inc. 2016 Semi-Annual Report | 29 |
Table of Contents
Statement of cash flows (unaudited)
For the Six Months Ended February 29, 2016
| Increase (Decrease) in Cash: | ||||
| Cash Provided (Used) by Operating Activities: | ||||
Net decrease in net assets resulting from operations | $ | (11,774,031) | ||
Adjustments to reconcile net decrease in net assets resulting from operations to | ||||
Purchases of portfolio securities | (61,052,086) | |||
Sales of portfolio securities | 66,299,968 | |||
Net purchases, sales and maturities of short-term investments | 1,017,897 | |||
Cash paid for purchased options | (186,525) | |||
Payment-in-kind | (97,415) | |||
Net amortization of premium (accretion of discount) | (441,211) | |||
Increase in receivable for securities sold | (506,302) | |||
Decrease in interest and dividends receivable | 423,386 | |||
Decrease in receivable from broker — variation margin on open futures contracts | 29,900 | |||
Decrease in prepaid expenses | 12,222 | |||
Decrease in deposits with brokers for open futures contracts | 164,002 | |||
Decrease in deposits with brokers for open reverse repurchase agreements | 899,000 | |||
Decrease in payable for securities purchased | (4,056,130) | |||
Decrease in investment management fee payable | (28,376) | |||
Decrease in Directors’ fees payable | (2,134) | |||
Decrease in interest payable | (59,753) | |||
Decrease in deposits from brokers for open reverse repurchase agreements | (181,000) | |||
Increase in accrued expenses | 13,255 | |||
Increase in payable to broker — variation margin on open futures contracts | 7,681 | |||
Net realized loss on investments | 11,481,383 | |||
Change in net unrealized appreciation (depreciation) of investments and forward foreign currency transactions | 7,053,570 | |||
Net Cash Provided by Operating Activities* | 9,017,301 | |||
| Cash Flows From Financing Activities: | ||||
Distributions paid on common stock | (6,780,251) | |||
Decrease in payable for open reverse repurchase agreements | (7,295,498) | |||
Net Cash Used in Financing Activities | (14,075,749) | |||
| Net Decrease in Cash | (5,058,448) | |||
Cash at Beginning of Period | 6,590,654 | |||
Cash at End of Period | $ | 1,532,206 | ||
| * | Included in operating expenses is cash of $321,346 paid for interest and commitment fees on borrowings. |
See Notes to Financial Statements.
| 30 | Western Asset Global Partners Income Fund Inc. 2016 Semi-Annual Report |
Table of Contents
| For a share of capital stock outstanding throughout each year ended August 31, unless otherwise noted: | ||||||||||||||||||||||||
| 20161,2 | 20152 | 20142 | 20132 | 2012 | 2011 | |||||||||||||||||||
| Net asset value, beginning of period | $10.06 | $11.93 | $11.38 | $12.11 | $11.59 | $11.62 | ||||||||||||||||||
| Income (loss) from operations: | ||||||||||||||||||||||||
Net investment income | 0.40 | 0.83 | 0.90 | 0.98 | 1.07 | 1.10 | ||||||||||||||||||
Net realized and unrealized gain (loss) | (1.15) | (1.83) | 0.61 | (0.60) | 0.59 | 0.01 | ||||||||||||||||||
Total income (loss) from operations | (0.75) | (1.00) | 1.51 | 0.38 | 1.66 | 1.11 | ||||||||||||||||||
| Less distributions from: | ||||||||||||||||||||||||
Net investment income | (0.44) | 3 | (0.87) | (0.87) | (1.11) | (1.14) | (1.14) | |||||||||||||||||
Return of capital | — | — | (0.09) | — | — | — | ||||||||||||||||||
Total distributions | (0.44) | (0.87) | (0.96) | (1.11) | (1.14) | (1.14) | ||||||||||||||||||
| Net asset value, end of period | $8.87 | $10.06 | $11.93 | $11.38 | $12.11 | $11.59 | ||||||||||||||||||
| Market price, end of period | $7.52 | $8.29 | $11.08 | $10.61 | $13.63 | $12.19 | ||||||||||||||||||
Total return, based on NAV4,5 | (7.64) | % | (8.64) | % | 13.73 | % | 2.87 | % | 15.33 | % | 9.64 | % | ||||||||||||
Total return, based on Market Price6 | (4.20) | % | (18.10) | % | 13.82 | % | (14.79) | % | 23.03 | % | 6.58 | % | ||||||||||||
| Net assets, end of period (000s) | $138,192 | $156,746 | $185,949 | $177,383 | $188,080 | $179,301 | ||||||||||||||||||
| Ratios to average net assets: | ||||||||||||||||||||||||
Gross expenses | 1.72 | %7,8 | 1.65 | % | 1.50 | % | 1.48 | % | 1.53 | % | 1.66 | % | ||||||||||||
Net expenses | 1.72 | 7,8 | 1.65 | 1.50 | 1.48 | 1.53 | 1.66 | |||||||||||||||||
Net investment income | 8.61 | 7 | 7.63 | 7.63 | 7.97 | 9.32 | 9.10 | |||||||||||||||||
| Portfolio turnover rate | 32 | % | 45 | % | 33 | % | 39 | % | 37 | % | 56 | % | ||||||||||||
| Supplemental data: | ||||||||||||||||||||||||
Loan Outstanding, End of Period (000s) | $40,000 | $40,000 | $39,000 | $39,000 | $39,000 | $39,000 | ||||||||||||||||||
Asset Coverage Ratio for Loan Outstanding9 | 445 | % | 492 | % | 577 | % | 555 | % | 582 | % | 560 | % | ||||||||||||
Asset Coverage, per $1,000 Principal Amount of Loan Outstanding9 | $4,455 | $4,919 | $5,768 | 10 | $5,548 | 10 | $5,823 | 10 | $5,597 | 10 | ||||||||||||||
Weighted Average Loan (000s) | $40,000 | $42,329 | $39,000 | $39,000 | $39,000 | $34,085 | ||||||||||||||||||
Weighted Average Interest Rate on Loans | 1.09 | % | 0.95 | % | 0.87 | % | 0.90 | % | 0.95 | % | 0.94 | % | ||||||||||||
| 1 | For the six months ended February 29, 2016 (unaudited). |
| 2 | Per share amounts have been calculated using the average shares method. |
| 3 | The actual source of the Fund’s current fiscal year distributions may be from net investment income, return of capital or a combination of both. Shareholders will be informed of the tax characteristics of the distributions after the close of the fiscal year. |
| 4 | Performance figures may reflect compensating balance arrangements, fee waivers and/or expense reimbursements. In the absence of compensating balance arrangements, fee waivers and/or expense reimbursements, the total return would have been lower. Past performance is no guarantee of future results. Total returns for periods of less than one year are not annualized. |
| 5 | The total return calculation assumes that distributions are reinvested at NAV. Past performance is no guarantee of future results. Total returns for periods of less than one year are not annualized. |
| 6 | The total return calculation assumes that distributions are reinvested in accordance with the Fund’s dividend reinvestment plan. Past performance is no guarantee of future results. Total returns for periods of less than one year are not annualized. |
| 7 | Annualized. |
| 8 | Included in the expense ratios are certain non-recurring reorganization fees that were incurred by the Fund during the period. Without these fees, the gross and net expense ratios would both have been 1.65%. |
| 9 | Represents value of net assets plus the loan outstanding at the end of the period divided by the loan outstanding at the end of the period. |
| 10 | Added to conform to current period presentation. |
See Notes to Financial Statements.
| Western Asset Global Partners Income Fund Inc. 2016 Semi-Annual Report | 31 |
Table of Contents
Notes to financial statements (unaudited)
1. Organization and significant accounting policies
Western Asset Global Partners Income Fund Inc. (the “Fund”) was incorporated in Maryland on September 3, 1993 and is registered as a non-diversified, closed-end management investment company under the Investment Company Act of 1940, as amended (the “1940 Act”). The Fund seeks to maintain a high level of current income. As a secondary objective, the Fund seeks capital appreciation. Under normal market conditions, the Fund will invest at least 33% of its total assets in securities of issuers that are, or are incorporated in or generate the majority of their revenue in, emerging market countries and at least 33% of its total assets in high-yield U.S. corporate debt securities. The Fund may also invest up to 33% of its total assets in a broad range of other U.S. and non-U.S. fixed-income securities, both investment grade and high-yield securities.
The following are significant accounting policies consistently followed by the Fund and are in conformity with U.S. generally accepted accounting principles (“GAAP”). Estimates and assumptions are required to be made regarding assets, liabilities and changes in net assets resulting from operations when financial statements are prepared. Changes in the economic environment, financial markets and any other parameters used in determining these estimates could cause actual results to differ. Subsequent events have been evaluated through the date the financial statements were issued.
(a) Investment valuation. The valuations for fixed income securities (which may include, but are not limited to, corporate, government, municipal, mortgage-backed, collateralized mortgage obligations and asset-backed securities) and certain derivative instruments are typically the prices supplied by independent third party pricing services, which may use market prices or broker/dealer quotations or a variety of valuation techniques and methodologies. The independent third party pricing services use inputs that are observable such as issuer details, interest rates, yield curves, prepayment speeds, credit risks/spreads, default rates and quoted prices for similar securities. Short-term fixed income securities that will mature in 60 days or less are valued at amortized cost, unless it is determined that using this method would not reflect an investment’s fair value. Investments in open-end funds are valued at the closing net asset value per share of each fund on the day of valuation. Futures contracts are valued daily at the settlement price established by the board of trade or exchange on which they are traded. Equity securities for which market quotations are available are valued at the last reported sales price or official closing price on the primary market or exchange on which they trade. When the Fund holds securities or other assets that are denominated in a foreign currency, the Fund will normally use the currency exchange rates as of 4:00 p.m. (Eastern Time). If independent third party pricing services are unable to supply prices for a portfolio investment, or if the prices supplied are deemed by the manager to be unreliable, the market price may be determined by the manager using quotations from one or more broker/dealers or at the transaction price if the security has recently been purchased and no value has yet been obtained from a pricing service or pricing broker. When reliable prices are not readily available, such as when the value of a security has been significantly affected by events after the close of the exchange or market on which the
| 32 | Western Asset Global Partners Income Fund Inc. 2016 Semi-Annual Report |
Table of Contents
security is principally traded, but before the Fund calculates its net asset value, the Fund values these securities as determined in accordance with procedures approved by the Fund’s Board of Directors.
The Board of Directors is responsible for the valuation process and has delegated the supervision of the daily valuation process to the Legg Mason North Atlantic Fund Valuation Committee (the “Valuation Committee”). The Valuation Committee, pursuant to the policies adopted by the Board of Directors, is responsible for making fair value determinations, evaluating the effectiveness of the Fund’s pricing policies, and reporting to the Board of Directors. When determining the reliability of third party pricing information for investments owned by the Fund, the Valuation Committee, among other things, conducts due diligence reviews of pricing vendors, monitors the daily change in prices and reviews transactions among market participants.
The Valuation Committee will consider pricing methodologies it deems relevant and appropriate when making fair value determinations. Examples of possible methodologies include, but are not limited to, multiple of earnings; discount from market of a similar freely traded security; discounted cash-flow analysis; book value or a multiple thereof; risk premium/yield analysis; yield to maturity; and/or fundamental investment analysis. The Valuation Committee will also consider factors it deems relevant and appropriate in light of the facts and circumstances. Examples of possible factors include, but are not limited to, the type of security; the issuer’s financial statements; the purchase price of the security; the discount from market value of unrestricted securities of the same class at the time of purchase; analysts’ research and observations from financial institutions; information regarding any transactions or offers with respect to the security; the existence of merger proposals or tender offers affecting the security; the price and extent of public trading in similar securities of the issuer or comparable companies; and the existence of a shelf registration for restricted securities.
For each portfolio security that has been fair valued pursuant to the policies adopted by the Board of Directors, the fair value price is compared against the last available and next available market quotations. The Valuation Committee reviews the results of such back testing monthly and fair valuation occurrences are reported to the Board of Directors quarterly.
The Fund uses valuation techniques to measure fair value that are consistent with the market approach and/or income approach, depending on the type of security and the particular circumstance. The market approach uses prices and other relevant information generated by market transactions involving identical or comparable securities. The income approach uses valuation techniques to discount estimated future cash flows to present value.
| Western Asset Global Partners Income Fund Inc. 2016 Semi-Annual Report | 33 |
Table of Contents
Notes to financial statements (unaudited) (cont’d)
GAAP establishes a disclosure hierarchy that categorizes the inputs to valuation techniques used to value assets and liabilities at measurement date. These inputs are summarized in the three broad levels listed below:
| • | Level 1 — quoted prices in active markets for identical investments |
| • | Level 2 — other significant observable inputs (including quoted prices for similar investments, interest rates, prepayment speeds, credit risk, etc.) |
| • | Level 3 — significant unobservable inputs (including the Fund’s own assumptions in determining the fair value of investments) |
The inputs or methodologies used to value securities are not necessarily an indication of the risk associated with investing in those securities.
The following is a summary of the inputs used in valuing the Fund’s assets and liabilities carried at fair value:
| ASSETS | ||||||||||||||||
| Description | Quoted Prices (Level 1) | Other Significant Observable Inputs (Level 2) | Significant Unobservable Inputs (Level 3) | Total | ||||||||||||
| Long-term investments†: | ||||||||||||||||
Corporate bonds & notes: | ||||||||||||||||
Consumer discretionary | — | $ | 17,696,598 | $ | 263,189 | $ | 17,959,787 | |||||||||
Materials | — | 14,808,408 | 0 | * | 14,808,408 | |||||||||||
Other corporate bonds & notes | — | 98,106,895 | — | 98,106,895 | ||||||||||||
Collateralized mortgage obligations | — | 813,383 | — | 813,383 | ||||||||||||
Convertible bonds & notes | — | 220,029 | — | 220,029 | ||||||||||||
Senior loans: | ||||||||||||||||
Consumer discretionary | — | 644,449 | — | 644,449 | ||||||||||||
Consumer staples | — | — | 128,538 | 128,538 | ||||||||||||
Energy | — | 432,975 | 353,890 | 786,865 | ||||||||||||
Health care | — | 266,438 | 190,443 | 456,881 | ||||||||||||
Utilities | — | — | 212,891 | 212,891 | ||||||||||||
Sovereign bonds | — | 39,712,331 | — | 39,712,331 | ||||||||||||
Common stocks: | ||||||||||||||||
Consumer discretionary | — | — | 0 | * | 0 | * | ||||||||||
Energy | $ | 15,123 | — | 273,760 | 288,883 | |||||||||||
Financials | 1,648,072 | — | — | 1,648,072 | ||||||||||||
Health care | — | — | 384,790 | 384,790 | ||||||||||||
Industrials | 195,588 | — | 121,570 | 317,158 | ||||||||||||
Materials | — | — | 49,640 | 49,640 | ||||||||||||
Telecommunication services | — | 237,841 | — | 237,841 | ||||||||||||
Convertible preferred stocks | 13,125 | — | — | 13,125 | ||||||||||||
Preferred stocks | 1,065,329 | — | — | 1,065,329 | ||||||||||||
Purchased options | — | 88,201 | — | 88,201 | ||||||||||||
Warrants | — | 41,062 | — | 41,062 | ||||||||||||
| Total long-term investments | $ | 2,937,237 | $ | 173,068,610 | $ | 1,978,711 | $ | 177,984,558 | ||||||||
| 34 | Western Asset Global Partners Income Fund Inc. 2016 Semi-Annual Report |
Table of Contents
| ASSETS (cont’d) | ||||||||||||||||
| Description | Quoted Prices (Level 1) | Other Significant Observable Inputs (Level 2) | Significant Unobservable Inputs (Level 3) | Total | ||||||||||||
| Short-term investments† | $ | 1,753,228 | — | — | $ | 1,753,228 | ||||||||||
| Total investments | $ | 4,690,465 | $ | 173,068,610 | $ | 1,978,711 | $ | 179,737,786 | ||||||||
| Other financial instruments: | ||||||||||||||||
Futures contracts | $ | 3,519 | — | — | $ | 3,519 | ||||||||||
Forward foreign currency contracts | — | $ | 182,060 | — | 182,060 | |||||||||||
| Total other financial instruments | $ | 3,519 | $ | 182,060 | — | $ | 185,579 | |||||||||
| Total | $ | 4,693,984 | $ | 173,250,670 | $ | 1,978,711 | $ | 179,923,365 | ||||||||
| LIABILITIES | ||||||||||||||||
| Description | Quoted Prices (Level 1) | Other Significant Observable Inputs (Level 2) | Significant Unobservable Inputs (Level 3) | Total | ||||||||||||
| Other financial instruments: | ||||||||||||||||
Futures contracts | $ | 8,999 | — | — | $ | 8,999 | ||||||||||
Forward foreign currency contracts | — | $ | 102,194 | — | 102,194 | |||||||||||
| Total | $ | 8,999 | $ | 102,194 | — | $ | 111,193 | |||||||||
| † | See Schedule of Investments for additional detailed categorizations. |
| * | Amount represents less than $1. |
The Fund’s policy is to recognize transfers between levels as of the end of the reporting period. At February 29, 2016, securities valued at $13,125 were transferred from Level 2 to Level 1 within the fair value hierarchy because of the availability of a quoted price in an active market for an identical investment.
The following is a reconciliation of investments in which significant unobservable inputs (Level 3) were used in determining fair value:
| Corporate Bonds & Notes | ||||||||||||
| Investments in Securities | Consumer Discretionary | Materials | Utilities | |||||||||
| Balance as of August 31, 2015 | $ | 254,205 | $ | 0 | * | $ | 483,494 | |||||
| Accrued premiums/discounts | 3,487 | — | 321 | |||||||||
| Realized gain (loss)1 | — | — | — | |||||||||
| Change in unrealized appreciation (depreciation)2 | (14,167) | (41) | (22,259) | |||||||||
| Purchases | 19,664 | 41 | — | |||||||||
| Sales | — | — | (24,494) | |||||||||
| Transfers into Level 33 | — | — | — | |||||||||
| Transfers out of Level 34 | — | — | (437,062) | |||||||||
| Balance as of February 29, 2016 | $ | 263,189 | $ | 0 | * | — | ||||||
| Net change in unrealized appreciation (depreciation) for investments in securities still held at February 29, 20162 | $ | (14,167) | $ | (41) | — | |||||||
| Western Asset Global Partners Income Fund Inc. 2016 Semi-Annual Report | 35 |
Table of Contents
Notes to financial statements (unaudited) (cont’d)
| Senior Loans | ||||||||||||||||||||||||
| Investments in Securities (cont’d) | Consumer Discretionary | Consumer Staples | Energy | Health Care | Materials | Utilities | ||||||||||||||||||
| Balance as of August 31, 2015 | $ | 233,450 | — | $ | 160,153 | — | $ | 341,695 | $ | 250,273 | ||||||||||||||
| Accrued premiums/discounts | 58 | — | 1,640 | — | (210) | 299 | ||||||||||||||||||
| Realized gain (loss)1 | — | — | 19 | — | (97,661) | 24 | ||||||||||||||||||
| Change in unrealized appreciation (depreciation)2 | (2,358) | — | (45,032) | — | 82,321 | (36,405) | ||||||||||||||||||
| Purchases | — | — | 238,000 | — | — | — | ||||||||||||||||||
| Sales | — | — | (890) | — | (326,145) | (1,300) | ||||||||||||||||||
| Transfers into Level 33 | — | $ | 128,538 | — | $ | 190,443 | — | — | ||||||||||||||||
| Transfers out of Level 34 | (231,150) | — | — | — | — | — | ||||||||||||||||||
| Balance as of February 29, 2016 | — | $ | 128,538 | $ | 353,890 | $ | 190,443 | — | $ | 212,891 | ||||||||||||||
| Net change in unrealized appreciation (depreciation) for investments in securities still held at February 29, 20162 | — | — | $ | (45,032) | — | — | $ | (36,405) | ||||||||||||||||
| Common Stocks | Warrants | |||||||||||||||||||||||||||
| Investments in Securities (cont’d) | Consumer Discretionary | Energy | Health Care | Industrials | Materials | Total | ||||||||||||||||||||||
| Balance as of August 31, 2015 | $ | 0 | * | $ | 706,037 | $ | 290,500 | $ | 168,479 | $ | 49,437 | $ | 101,360 | $ | 3,039,083 | |||||||||||||
| Accrued premiums/discounts | — | — | — | — | — | — | 5,595 | |||||||||||||||||||||
| Realized gain (loss)1 | — | — | — | — | — | — | (97,618) | |||||||||||||||||||||
| Change in unrealized appreciation (depreciation)2 | — | (432,277) | 94,290 | (59,382) | 203 | (88,894) | (524,001) | |||||||||||||||||||||
| Purchases | — | — | — | 12,473 | — | 7 | 270,185 | |||||||||||||||||||||
| Sales | — | — | — | — | — | (12,473) | (365,302) | |||||||||||||||||||||
| Transfers into Level 33 | — | — | — | — | — | — | 318,981 | |||||||||||||||||||||
| Transfers out of Level 34 | — | — | — | — | — | — | (668,212) | |||||||||||||||||||||
| Balance as of February 29, 2016 | $ | 0 | * | $ | 273,760 | $ | 384,790 | $ | 121,570 | $ | 49,640 | — | $ | 1,978,711 | ||||||||||||||
| Net change in unrealized appreciation (depreciation) for investments in securities still held at February 29, 20162 | — | $ | (432,277) | $ | 94,290 | $ | (59,382) | $ | 203 | — | $ | (492,811) | ||||||||||||||||
The Fund’s policy is to recognize transfers between levels as of the end of the reporting period.
| * | Amount represents less than $1. |
| 1 | This amount is included in net realized gain (loss) from investment transactions in the accompanying Statement of Operations. |
| 2 | This amount is included in the change in net unrealized appreciation (depreciation) in the accompanying Statement of Operations. Change in unrealized appreciation (depreciation) includes net unrealized appreciation (depreciation) resulting from changes in investment values during the reporting period and the reversal of previously recorded unrealized appreciation (depreciation) when gains or losses are realized. |
| 3 | Transferred into Level 3 as a result of the unavailability of a quoted price in an active market for an identical investment or the unavailability of other significant observable inputs. |
| 4 | Transferred out of Level 3 as a result of the availability of a quoted price in an active market for an identical investment or the availability of other significant observable inputs. |
(b) Repurchase agreements. The Fund may enter into repurchase agreements with institutions that its subadviser has determined are creditworthy. Each repurchase agreement
| 36 | Western Asset Global Partners Income Fund Inc. 2016 Semi-Annual Report |
Table of Contents
is recorded at cost. Under the terms of a typical repurchase agreement, the Fund acquires a debt security subject to an obligation of the seller to repurchase, and of the Fund to resell, the security at an agreed-upon price and time, thereby determining the yield during the Fund’s holding period. When entering into repurchase agreements, it is the Fund’s policy that its custodian or a third party custodian, acting on the Fund’s behalf, take possession of the underlying collateral securities, the market value of which, at all times, at least equals the principal amount of the repurchase transaction, including accrued interest. To the extent that any repurchase transaction maturity exceeds one business day, the value of the collateral is marked-to-market and measured against the value of the agreement in an effort to ensure the adequacy of the collateral. If the counterparty defaults, the Fund generally has the right to use the collateral to satisfy the terms of the repurchase transaction. However, if the market value of the collateral declines during the period in which the Fund seeks to assert its rights or if bankruptcy proceedings are commenced with respect to the seller of the security, realization of the collateral by the Fund may be delayed or limited.
(c) Reverse repurchase agreements. The Fund may enter into reverse repurchase agreements. Under the terms of a typical reverse repurchase agreement, a fund sells a security subject to an obligation to repurchase the security from the buyer at an agreed-upon time and price. In the event the buyer of securities under a reverse repurchase agreement files for bankruptcy or becomes insolvent, the Fund’s use of the proceeds of the agreement may be restricted pending a determination by the counterparty, or its trustee or receiver, whether to enforce the Fund’s obligation to repurchase the securities. In entering into reverse repurchase agreements, the Fund will maintain cash, U.S. government securities or other liquid debt obligations at least equal in value to its obligations with respect to reverse repurchase agreements or will take other actions permitted by law to cover its obligations. If the market value of the collateral declines during the period, the Fund may be required to post additional collateral to cover its obligation. Cash collateral that has been pledged to cover obligations of the Fund under reverse repurchase agreements, if any, will be reported separately in the Statement of Assets and Liabilities. Securities pledged as collateral are noted in the Schedule of Investments. Interest payments made on reverse repurchase agreements are recognized as a component of “Interest expense” on the Statement of Operations. In periods of increased demand for the security, the Fund may receive a fee for use of the security by the counterparty, which may result in interest income to the Fund.
(d) Futures contracts. The Fund uses futures contracts generally to gain exposure to, or hedge against, changes in interest rates or gain exposure to, or hedge against, changes in certain asset classes. A futures contract represents a commitment for the future purchase or sale of an asset at a specified price on a specified date.
Upon entering into a futures contract, the Fund is required to deposit cash or cash equivalents with a broker in an amount equal to a certain percentage of the contract amount. This is known as the ‘‘initial margin’’ and subsequent payments (‘‘variation margin’’) are made or received by the Fund each day, depending on the daily fluctuation in the value of
| Western Asset Global Partners Income Fund Inc. 2016 Semi-Annual Report | 37 |
Table of Contents
Notes to financial statements (unaudited) (cont’d)
the contract. For certain futures, including foreign denominated futures, variation margin is not settled daily, but is recorded as a net variation margin payable or receivable. The daily changes in contract value are recorded as unrealized gains or losses in the Statement of Operations and the Fund recognizes a realized gain or loss when the contract is closed.
Futures contracts involve, to varying degrees, risk of loss in excess of the amounts reflected in the financial statements. In addition, there is the risk that the Fund may not be able to enter into a closing transaction because of an illiquid secondary market.
(e) Purchased options. When the Fund purchases an option, an amount equal to the premium paid by the Fund is recorded as an investment on the Statement of Assets and Liabilities, the value of which is marked-to-market to reflect the current market value of the option purchased. If the purchased option expires, the Fund realizes a loss equal to the amount of premium paid. When an instrument is purchased or sold through the exercise of an option, the related premium paid is added to the basis of the instrument acquired or deducted from the proceeds of the instrument sold. The risk associated with purchasing put and call options is limited to the premium paid.
(f) Loan participations. The Fund may invest in loans arranged through private negotiation between one or more financial institutions. The Fund’s investment in any such loan may be in the form of a participation in or an assignment of the loan. In connection with purchasing participations, the Fund generally will have no right to enforce compliance by the borrower with the terms of the loan agreement related to the loan, or any rights of off-set against the borrower and the Fund may not benefit directly from any collateral supporting the loan in which it has purchased the participation.
The Fund assumes the credit risk of the borrower, the lender that is selling the participation and any other persons interpositioned between the Fund and the borrower. In the event of the insolvency of the lender selling the participation, the Fund may be treated as a general creditor of the lender and may not benefit from any off-set between the lender and the borrower.
(g) Forward foreign currency contracts. The Fund enters into a forward foreign currency contract to hedge against foreign currency exchange rate risk on its non-U.S. dollar denominated securities or to facilitate settlement of a foreign currency denominated portfolio transaction. A forward foreign currency contract is an agreement between two parties to buy and sell a currency at a set price with delivery and settlement at a future date. The contract is marked-to-market daily and the change in value is recorded by the Fund as an unrealized gain or loss. When a forward foreign currency contract is closed, through either delivery or offset by entering into another forward foreign currency contract, the Fund recognizes a realized gain or loss equal to the difference between the value of the contract at the time it was opened and the value of the contract at the time it is closed.
Forward foreign currency contracts involve elements of market risk in excess of the amounts reflected on the Statement of Assets and Liabilities. The Fund bears the risk of an unfavorable change in the foreign exchange rate underlying the forward foreign currency
| 38 | Western Asset Global Partners Income Fund Inc. 2016 Semi-Annual Report |
Table of Contents
contract. Risks may also arise upon entering into these contracts from the potential inability of the counterparties to meet the terms of their contracts.
(h) Foreign currency translation. Investment securities and other assets and liabilities denominated in foreign currencies are translated into U.S. dollar amounts based upon prevailing exchange rates on the date of valuation. Purchases and sales of investment securities and income and expense items denominated in foreign currencies are translated into U.S. dollar amounts based upon prevailing exchange rates on the respective dates of such transactions.
The Fund does not isolate that portion of the results of operations resulting from fluctuations in foreign exchange rates on investments from the fluctuations arising from changes in market prices of securities held. Such fluctuations are included with the net realized and unrealized gain or loss on investments.
Net realized foreign exchange gains or losses arise from sales of foreign currencies, including gains and losses on forward foreign currency contracts, currency gains or losses realized between the trade and settlement dates on securities transactions, and the difference between the amounts of dividends, interest, and foreign withholding taxes recorded on the Fund’s books and the U.S. dollar equivalent of the amounts actually received or paid. Net unrealized foreign exchange gains and losses arise from changes in the values of assets and liabilities, other than investments in securities, on the date of valuation, resulting from changes in exchange rates.
Foreign security and currency transactions may involve certain considerations and risks not typically associated with those of U.S. dollar denominated transactions as a result of, among other factors, the possibility of lower levels of governmental supervision and regulation of foreign securities markets and the possibility of political or economic instability.
(i) Cash flow information. The Fund invests in securities and distributes dividends from net investment income and net realized gains, which are paid in cash and may be reinvested at the discretion of shareholders. These activities are reported in the Statement of Changes in Net Assets and additional information on cash receipts and cash payments are presented in the Statement of Cash Flows.
(j) Credit and market risk. The Fund invests in high-yield and emerging market instruments that are subject to certain credit and market risks. The yields of high-yield and emerging market debt obligations reflect, among other things, perceived credit and market risks. The Fund’s investments in securities rated below investment grade typically involve risks not associated with higher rated securities including, among others, greater risk related to timely and ultimate payment of interest and principal, greater market price volatility and less liquid secondary market trading. The consequences of political, social, economic or diplomatic changes may have disruptive effects on the market prices of investments held by the Fund. The Fund’s investments in non-U.S. dollar denominated securities may also result in foreign currency losses caused by devaluations and exchange rate fluctuations.
| Western Asset Global Partners Income Fund Inc. 2016 Semi-Annual Report | 39 |
Table of Contents
Notes to financial statements (unaudited) (cont’d)
Investments in securities that are collateralized by real estate mortgages are subject to certain credit and liquidity risks. When market conditions result in an increase in default rates of the underlying mortgages and the foreclosure values of underlying real estate properties are materially below the outstanding amount of these underlying mortgages, collection of the full amount of accrued interest and principal on these investments may be doubtful. Such market conditions may significantly impair the value and liquidity of these investments and may result in a lack of correlation between their credit ratings and values.
(k) Foreign investment risks. The Fund’s investments in foreign securities may involve risks not present in domestic investments. Since securities may be denominated in foreign currencies, may require settlement in foreign currencies or pay interest or dividends in foreign currencies, changes in the relationship of these foreign currencies to the U.S. dollar can significantly affect the value of the investments and earnings of the Fund. Foreign investments may also subject the Fund to foreign government exchange restrictions, expropriation, taxation or other political, social or economic developments, all of which affect the market and/or credit risk of the investments.
(l) Counterparty risk and credit-risk-related contingent features of derivative instruments. The Fund may invest in certain securities or engage in other transactions, where the Fund is exposed to counterparty credit risk in addition to broader market risks. The Fund may invest in securities of issuers, which may also be considered counterparties as trading partners in other transactions. This may increase the risk of loss in the event of default or bankruptcy by the counterparty or if the counterparty otherwise fails to meet its contractual obligations. The Fund’s subadviser attempts to mitigate counterparty risk by (i) periodically assessing the creditworthiness of its trading partners, (ii) monitoring and/or limiting the amount of its net exposure to each individual counterparty based on its assessment and (iii) requiring collateral from the counterparty for certain transactions. Market events and changes in overall economic conditions may impact the assessment of such counterparty risk by the subadviser. In addition, declines in the values of underlying collateral received may expose the Fund to increased risk of loss.
The Fund has entered into master agreements with certain of its derivative counterparties that provide for general obligations, representations, agreements, collateral, events of default or termination and credit related contingent features. The credit related contingent features include, but are not limited to, a percentage decrease in the Fund’s net assets or NAV over a specified period of time. If these credit related contingent features were triggered, the derivatives counterparty could terminate the positions and demand payment or require additional collateral.
Collateral requirements differ by type of derivative. Collateral or margin requirements are set by the broker or exchange clearinghouse for exchange traded derivatives while collateral terms are contract specific for over-the-counter traded derivatives. Cash collateral that has been pledged to cover obligations of the Fund under derivative contracts, if any, will be reported separately in the Statement of Assets and Liabilities. Securities pledged as collateral, if any, for the same purpose are noted in the Schedule of Investments.
| 40 | Western Asset Global Partners Income Fund Inc. 2016 Semi-Annual Report |
Table of Contents
Absent an event of default by the counterparty or a termination of the agreement, the terms of the master agreements do not result in an offset of reported amounts of financial assets and financial liabilities in the Statement of Assets and Liabilities across transactions between the Fund and the applicable counterparty. The enforceability of the right to offset may vary by jurisdiction.
As of February 29, 2016, the Fund held forward foreign currency contracts with credit related contingent features which had a liability position of $102,194. If a contingent feature in the master agreements would have been triggered, the Fund would have been required to pay this amount to its derivatives counterparties.
(m) Security transactions and investment income. Security transactions are accounted for on a trade date basis. Interest income, adjusted for amortization of premium and accretion of discount, is recorded on the accrual basis. Paydown gains and losses on mortgage- and asset-backed securities are recorded as adjustments to interest income. Dividend income is recorded on the ex-dividend date. Foreign dividend income is recorded on the ex-dividend date or as soon as practicable after the Fund determines the existence of a dividend declaration after exercising reasonable due diligence. The cost of investments sold is determined by use of the specific identification method. To the extent any issuer defaults or a credit event occurs that impacts the issuer, the Fund may halt any additional interest income accruals and consider the realizability of interest accrued up to the date of default or credit event.
(n) Distributions to shareholders. Distributions from net investment income of the Fund, if any, are declared quarterly and paid on a monthly basis. The actual source of the Fund’s monthly distributions may be from net investment income, return of capital or a combination of both. Shareholders will be informed of the tax characteristics of the distributions after the close of the fiscal year. Distributions of net realized gains, if any, are declared at least annually. Distributions to shareholders of the Fund are recorded on the ex-dividend date and are determined in accordance with income tax regulations, which may differ from GAAP.
(o) Compensating balance arrangements. The Fund has an arrangement with its custodian bank whereby a portion of the custodian’s fees is paid indirectly by credits earned on the Fund’s cash on deposit with the bank.
(p) Federal and other taxes. It is the Fund’s policy to comply with the federal income and excise tax requirements of the Internal Revenue Code of 1986 (the “Code”), as amended, applicable to regulated investment companies. Accordingly, the Fund intends to distribute its taxable income and net realized gains, if any, to shareholders in accordance with timing requirements imposed by the Code. Therefore, no federal or state income tax provision is required in the Fund’s financial statements.
Management has analyzed the Fund’s tax positions taken on income tax returns for all open tax years and has concluded that as of February 29, 2016, no provision for income tax is required in the Fund’s financial statements. The Fund’s federal and state income and
| Western Asset Global Partners Income Fund Inc. 2016 Semi-Annual Report | 41 |
Table of Contents
Notes to financial statements (unaudited) (cont’d)
federal excise tax returns for tax years for which the applicable statutes of limitations have not expired are subject to examination by the Internal Revenue Service and state departments of revenue.
Under the applicable foreign tax laws, a withholding tax may be imposed on interest, dividends and capital gains at various rates.
(q) Reclassification. GAAP requires that certain components of net assets be reclassified to reflect permanent differences between financial and tax reporting. These reclassifications have no effect on net assets or net asset value per share.
2. Investment management agreement and other transactions with affiliates
Legg Mason Partners Fund Advisor, LLC (“LMPFA”) is the Fund’s investment manager. Western Asset Management Company (“Western Asset”) is the Fund’s subadviser. Western Asset Management Company Pte. Ltd. (“Western Singapore”), Western Asset Management Company Ltd (“Western Japan”) and Western Asset Management Company Limited (“Western Asset Limited”) serve as additional subadvisers to the Fund, under additional subadvisory agreements with Western Asset. LMPFA, Western Asset, Western Singapore, Western Japan and Western Asset Limited are wholly-owned subsidiaries of Legg Mason, Inc. (“Legg Mason”).
LMPFA provides administrative and certain oversight services to the Fund. The Fund pays LMPFA an investment management fee, calculated daily and paid monthly, at an annual rate of 1.05% of the Fund’s average weekly net assets.
LMPFA delegates to Western Asset the day-to-day portfolio management of the Fund. Western Singapore, Western Japan and Western Asset Limited provide certain subadvisory services to the Fund relating to currency transactions and investments in non-U.S. dollar denominated debt securities. Western Singapore, Western Japan and Western Asset Limited do not receive any compensation from the Fund and are paid by Western Asset for their services to the Fund. For its services, LMPFA pays Western Asset 70% of the net management fee it receives from the Fund. In turn, Western Asset pays Western Singapore, Western Japan and Western Asset Limited a subadvisory fee of 0.30% on the assets managed by each subadviser.
All officers and one Director of the Fund are employees of Legg Mason or its affiliates and do not receive compensation from the Fund.
3. Investments
During the six months ended February 29, 2016, the aggregate cost of purchases and proceeds from sales of investments (excluding short-term investments) were as follows:
| Purchases | $ | 61,052,086 | ||
| Sales | 66,299,968 |
| 42 | Western Asset Global Partners Income Fund Inc. 2016 Semi-Annual Report |
Table of Contents
At February 29, 2016, the aggregate gross unrealized appreciation and depreciation of investments for federal income tax purposes were substantially as follows:
| Gross unrealized appreciation | $ | 6,334,864 | ||
| Gross unrealized depreciation | (20,436,833) | |||
| Net unrealized depreciation | $ | (14,101,969) |
At February 29, 2016, the Fund had the following open futures contracts:
| Number of Contracts | Expiration Date | Basis Value | Market Value | Unrealized Appreciation (Depreciation) | ||||||||||||||||
| Contracts to Buy: | ||||||||||||||||||||
| Euro | 23 | 3/16 | $ | 3,125,919 | $ | 3,129,438 | $ | 3,519 | ||||||||||||
| U.S. Treasury Ultra Long-Term Bonds | 14 | 6/16 | 2,433,187 | 2,424,188 | (8,999) | |||||||||||||||
| Net unrealized depreciation on open futures contracts | $ | (5,480) | ||||||||||||||||||
At February 29, 2016, the Fund had the following open forward foreign currency contracts:
| Currency Purchased | Currency Sold | Counterparty | Settlement Date | Unrealized Appreciation (Depreciation) | ||||||||||||||||
| USD | 7,309,456 | EUR | 6,709,000 | Bank of America N.A. | 4/12/16 | $ | 2,116 | |||||||||||||
| EUR | 800,000 | USD | 892,561 | BNP Paribas SA | 5/13/16 | (20,338) | ||||||||||||||
| USD | 1,590,178 | EUR | 1,427,030 | BNP Paribas SA | 5/13/16 | 34,318 | ||||||||||||||
| INR | 105,283,315 | USD | 1,535,302 | Bank of America N.A. | 5/13/16 | (18,373) | ||||||||||||||
| USD | 1,610,690 | MXN | 29,871,215 | Barclays Bank PLC | 5/13/16 | (27,270) | ||||||||||||||
| EUR | 487,729 | USD | 551,119 | Citibank N.A. | 5/13/16 | (19,359) | ||||||||||||||
| USD | 628,184 | GBP | 435,252 | Citibank N.A. | 5/13/16 | 22,223 | ||||||||||||||
| USD | 1,563,281 | SGD | 2,225,800 | Citibank N.A. | 5/13/16 | (16,854) | ||||||||||||||
| USD | 3,340,189 | EUR | 2,977,500 | UBS AG | 5/13/16 | 93,886 | ||||||||||||||
| USD | 797,133 | GBP | 551,367 | UBS AG | 5/13/16 | 29,517 | ||||||||||||||
| Total | $ | 79,866 | ||||||||||||||||||
Abbreviations used in this table: | ||
| EUR | — Euro | |
| GBP | — British Pound | |
| INR | — Indian Rupee | |
| MXN | — Mexican Peso | |
| SGD | — Singapore Dollar | |
| USD | — United States Dollar | |
Transactions in reverse repurchase agreements for the Fund during the six months ended February 29, 2016 were as follows:
| Average Daily Balance* | Weighted Average Interest Rate* | Maximum Amount Outstanding | ||
| $11,584,650 | 0.27% | $14,605,654 |
| * | Averages based on the number of days that Fund had reverse repurchase agreements outstanding. |
| Western Asset Global Partners Income Fund Inc. 2016 Semi-Annual Report | 43 |
Table of Contents
Notes to financial statements (unaudited) (cont’d)
Interest rates on reverse repurchase agreements ranged from (2.00)% to 0.85% during the six months ended February 29, 2016. Interest expense incurred on reverse repurchase agreements totaled $34,174. Interest income earned on reverse repurchase agreements totaled $18,663.
At February 29, 2016, the Fund had the following open reverse repurchase agreements:
| Counterparty | Rate | Effective Date | Maturity Date | Face Amount of Reverse Repurchase Agreements | Asset Class of Collateral* | Collateral Value | ||||||||||||||
| Credit Suisse | (1.00) | % | 2/3/16 | TBD** | $ | 2,444,898 | Sovereign Bonds | $ | 2,869,985 | |||||||||||
| Credit Suisse | 0.50 | % | 2/3/16 | TBD** | 1,010,700 | Sovereign Bonds | 1,126,920 | |||||||||||||
| Credit Suisse | 0.75 | % | 2/3/16 | TBD** | 720,158 | Sovereign Bonds | 852,580 | |||||||||||||
| Credit Suisse | 0.85 | % | 2/3/16 | TBD** | 3,134,400 | Sovereign Bonds | 3,711,000 | |||||||||||||
| $ | 7,310,156 | $ | 8,560,485 | |||||||||||||||||
| * | Refer to the Schedule of Investments for positions held at the counterparty as collateral for reverse repurchase agreements. |
| ** | TBD — To Be Determined; These reverse repurchase agreements have no maturity dates because they are renewed daily and can be terminated by either the Fund or the counterparty in accordance with the terms of the agreements. |
4. Derivative instruments and hedging activities
Below is a table, grouped by derivative type, that provides information about the fair value and the location of derivatives within the Statement of Assets and Liabilities at February 29, 2016.
| ASSET DERIVATIVES1 | ||||
| Foreign Exchange Risk | ||||
| Purchased options2 | $ | 88,201 | ||
| Futures contracts3 | 3,519 | |||
| Forward foreign currency contracts | 182,060 | |||
| Total | $ | 273,780 | ||
| LIABILITY DERIVATIVES1 | ||||||||||||
| Interest Rate Risk | Foreign Exchange Risk | Total | ||||||||||
| Futures contracts3 | $ | 8,999 | — | $ | 8,999 | |||||||
| Forward foreign currency contracts | — | $ | 102,194 | 102,194 | ||||||||
| Total | $ | 8,999 | $ | 102,194 | $ | 111,193 | ||||||
| 1 | Generally, the balance sheet location for asset derivatives is receivables/net unrealized appreciation (depreciation) and for liability derivatives is payables/net unrealized appreciation (depreciation). |
| 2 | Market value of purchased options is reported in Investments at value in the Statement of Assets and Liabilities. |
| 3 | Includes cumulative appreciation (depreciation) of futures contracts as reported in the footnotes. Only variation margin is reported within the receivables and/or payables on the Statement of Assets and Liabilities. |
The following tables provide information about the effect of derivatives and hedging activities on the Fund’s Statement of Operations for the six months ended February 29, 2016. The first table provides additional detail about the amounts and sources of gains (losses)
| 44 | Western Asset Global Partners Income Fund Inc. 2016 Semi-Annual Report |
Table of Contents
realized on derivatives during the period. The second table provides additional information about the change in unrealized appreciation (depreciation) resulting from the Fund’s derivatives and hedging activities during the period.
| AMOUNT OF REALIZED GAIN (LOSS) ON DERIVATIVES RECOGNIZED | ||||||||||||
| Interest Rate Risk | Foreign Exchange Risk | Total | ||||||||||
| Futures contracts | $ | 118,310 | $ | (101,793) | $ | 16,517 | ||||||
| Forward foreign currency contracts1 | — | 542,251 | 542,251 | |||||||||
| Total | $ | 118,310 | $ | 440,458 | $ | 558,768 | ||||||
| 1 | Net realized gain (loss) from forward foreign currency contracts is reported in net realized gain (loss) from foreign currency transactions in the Statement of Operations. |
| CHANGE IN UNREALIZED APPRECIATION (DEPRECIATION) ON DERIVATIVES RECOGNIZED | ||||||||||||
| Interest Rate Risk | Foreign Exchange Risk | Total | ||||||||||
| Purchased options1 | — | $ | (98,324) | $ | (98,324) | |||||||
| Futures contracts | $ | (46,609) | (12,644) | (59,253) | ||||||||
| Forward foreign currency contracts2 | — | 17,320 | 17,320 | |||||||||
| Total | $ | (46,609) | $ | (93,648) | $ | (140,257) | ||||||
| 1 | The change in unrealized appreciation (depreciation) from purchased options is reported in the change in net unrealized from investments in the Statement of Operations. |
| 2 | The change in unrealized appreciation (depreciation) from forward foreign currency contracts is reported in the change in net unrealized appreciation (depreciation) from foreign currencies in the Statement of Operations. |
During the six months ended February 29, 2016, the volume of derivative activity for the Fund was as follows:
| Average Market Value | ||||
| Purchased options | $ | 33,623 | ||
| Futures contracts (to buy) | 6,053,585 | |||
| Futures contracts (to sell)† | 16,031,590 | |||
| Forward foreign currency contracts (to buy) | 3,558,729 | |||
| Forward foreign currency contracts (to sell) | 20,105,847 | |||
| † | At February 29, 2016, there were no open positions held in this derivative. |
The following table presents by financial instrument, the Fund’s derivative assets net of the related collateral received by the Fund at February 29, 2016:
| Gross Amount of Derivative Assets in the Statement of Assets and Liabilities1 | Collateral Received | Net Amount | ||||||||||
| Purchased options2 | $ | 88,201 | — | $ | 88,201 | |||||||
| Forward foreign currency contracts | 182,060 | — | 182,060 | |||||||||
| Total | $ | 270,261 | — | $ | 270,261 | |||||||
| Western Asset Global Partners Income Fund Inc. 2016 Semi-Annual Report | 45 |
Table of Contents
Notes to financial statements (unaudited) (cont’d)
The following table presents by financial instrument, the Fund’s derivative liabilities net of the related collateral pledged by the Fund at February 29, 2016:
| Gross Amount of Derivative Liabilities in the Statement of Assets and Liabilities1 | Collateral Pledged3,4 | Net Amount | ||||||||||
| Futures contracts5 | $ | 7,681 | $ | (7,681) | — | |||||||
| Forward foreign currency contracts | 102,194 | — | $ | 102,194 | ||||||||
| Total | $ | 109,875 | $ | (7,681) | $ | 102,194 | ||||||
| 1 | Absent an event of default or early termination, derivative assets and liabilities are presented gross and not offset in the Statement of Assets and Liabilities. |
| 2 | Market value of purchased options is shown in Investments at value in the Statement of Assets and Liabilities. |
| 3 | Gross amounts are not offset in the Statement of Assets and Liabilities. |
| 4 | In some instances, the actual collateral received and/or pledged may be more than the amount shown here due to overcollateralization. |
| 5 | Amount represents the current day’s variation margin as reported in the Statement of Assets and Liabilities. It differs from the cumulative appreciation (depreciation) presented in the previous table. |
5. Loan
The Fund has a revolving credit agreement with State Street Bank and Trust Company that allows the Fund to borrow up to an aggregate amount of $55,000,000 and renews daily for a 270-day term unless notice to the contrary is given to the Fund. The Fund pays a commitment fee at an annual rate of 0.10% on the unutilized portion of the loan commitment amount. The interest on the loan is calculated at a variable rate based on the LIBOR plus any applicable margin. To the extent of the borrowing outstanding, the Fund is required to maintain collateral in a special custody account at the Fund’s custodian on behalf of State Street Bank and Trust Company. The Fund’s credit agreement contains customary covenants that, among other things, may limit the Fund’s ability to pay distributions in certain circumstances, incur additional debt, change its fundamental investment policies and engage in certain transactions, including mergers and consolidations, and require asset coverage ratios in addition to those required by the 1940 Act. In addition, the credit agreement may be subject to early termination under certain conditions and may contain other provisions that could limit the Fund’s ability to utilize borrowing under the agreement. Interest expense related to the loan for the period ended February 29, 2016 was $216,417. For the period ended February 29, 2016, the Fund incurred a commitment fee in the amount of $7,584. At February 29, 2016, the Fund had $40,000,000 of borrowings outstanding per the credit agreement. For the period ended February 29, 2016, the average daily loan balance was $40,000,000 and the weighted average interest rate was 1.09%.
| 46 | Western Asset Global Partners Income Fund Inc. 2016 Semi-Annual Report |
Table of Contents
6. Distributions subsequent to February 29, 2016
The following distributions have been declared by the Fund’s Board of Directors and are payable subsequent to the period end of this report:
| Record Date | Payable Date | Amount | ||||||
| 3/18/16 | 3/24/16 | $ | 0.0725 | |||||
| 4/22/16 | 4/29/16 | $ | 0.0725 | |||||
| 5/20/16 | 5/27/16 | $ | 0.0725 | |||||
7. Stock repurchase program
On November 16, 2015, the Fund announced that the Fund’s Board of Directors (the “Board”) had authorized the Fund to repurchase in the open market up to approximately 10% of the Fund’s outstanding common stock when the Fund’s shares are trading at a discount to net asset value. The Board has directed management of the Fund to repurchase shares of common stock at such times and in such amounts as management reasonably believes may enhance stockholder value. The Fund is under no obligation to purchase shares at any specific discount levels or in any specific amounts. During the period ended February 29, 2016, the Fund did not repurchase any shares.
8. Capital loss carryforward
As of August 31, 2015, the Fund had the following net capital loss carryforward remaining:
| Year of Expiration | Amount | |||
| 8/31/2017 | $ | (4,307,290) | ||
| 8/31/2018 | (26,932,997) | |||
| $ | (31,240,287) | |||
These amounts will be available to offset any future taxable capital gains, except that under applicable tax rules, deferred capital losses of $10,876,695, which have no expiration date, must be used first to offset any such gains.
9. Reorganization
On November 16, 2015, the Fund and Western Asset Global High Income Fund Inc. announced approval by each Fund’s Board of Directors of a proposal to merge the Fund with and into Western Asset Global High Income Fund Inc., subject to approval by the stockholders of each Fund. If approved, the merger is anticipated to occur during the second quarter of 2016.
The Fund and Western Asset Global High Income Fund Inc. have similar investment objectives. The Fund’s primary investment objective is to maintain a high level of current income and its secondary objective is to seek capital appreciation. Western Asset Global High Income Fund Inc.’s primary investment objective is high current income and its secondary investment objective is total return.
If the proposed merger is approved by the stockholders of both Funds, stockholders of the Fund would receive common stock of Western Asset Global High Income Fund Inc., based on each Fund’s respective net asset value per share.
| Western Asset Global Partners Income Fund Inc. 2016 Semi-Annual Report | 47 |
Table of Contents
Board approval of management and subadvisory agreements (unaudited)
Background
The Investment Company Act of 1940, as amended (the “1940 Act”), requires that the Board of Directors (the “Board”) of Western Asset Global Partners Income Fund Inc. (the “Fund”), including a majority of its members who are not considered to be “interested persons” under the 1940 Act (the “Independent Directors”) voting separately, approve on an annual basis the continuation of the investment management contract (the “Management Agreement”) with the Fund’s manager, Legg Mason Partners Fund Advisor, LLC (the “Manager”), and the sub-advisory agreements (individually, a “Sub-Advisory Agreement,” and collectively, the “Sub-Advisory Agreements”) with the Manager’s affiliates, Western Asset Management Company (“Western Asset”), Western Asset Management Company Pte. Ltd. in Singapore (“Western Asset Singapore”), Western Asset Management Company Ltd in Japan (“Western Asset Japan”) and Western Asset Management Company Limited in London (“Western Asset London”). Western Asset, Western Asset Singapore, Western Asset Japan and Western Asset London collectively are hereinafter referred to as the “Sub-Advisers,” and Western Asset Singapore, Western Asset Japan and Western Asset London collectively are hereinafter referred to as the “Non-U.S. Sub-Advisers.” At a meeting (the “Contract Renewal Meeting”) held in-person on November 11 and 12, 2015, the Board, including the Independent Directors, considered and approved the continuation of each of the Management Agreement and the Sub-Advisory Agreements for an additional one-year term. To assist in its consideration of the renewals of the Management Agreement and the Sub-Advisory Agreements, the Board received and considered a variety of information (together with the information provided at the Contract Renewal Meeting, the “Contract Renewal Information”) about the Manager and the Sub-Advisers, as well as the management and sub-advisory arrangements for the Fund and the other closed-end funds in the same complex under the Board’s supervision (collectively, the “Legg Mason Closed-end Funds”), certain portions of which are discussed below. A presentation made by the Manager and Western Asset to the Board at the Contract Renewal Meeting in connection with its evaluations of the Management Agreement and the Sub-Advisory Agreements encompassed the Fund and other Legg Mason Closed-end Funds. In addition to the Contract Renewal Information, the Board received performance and other information throughout the year related to the respective services rendered by the Manager and the Sub-Advisers to the Fund. The Board’s evaluation took into account the information received throughout the year and also reflected the knowledge and familiarity gained as members of the Boards of the Fund and other Legg Mason Closed-end Funds with respect to the services provided to the Fund by the Manager and the Sub-Advisers.
The Manager provides the Fund with investment advisory and administrative services pursuant to the Management Agreement and the Sub-Advisers provide, or in the case of the Non-U.S. Sub-Advisers help to provide, the Fund with certain investment sub-advisory services pursuant to the Sub-Advisory Agreements. The discussion below covers both the advisory and administrative functions being rendered by the Manager, each such function being encompassed by the Management Agreement, and the investment sub-advisory functions being rendered by the Sub-Advisers.
| 48 | Western Asset Global Partners Income Fund Inc. |
Table of Contents
Board approval of management agreement and sub-advisory agreements
In its deliberations regarding renewal of the Management Agreement and the Sub-Advisory Agreements, the Board, including the Independent Directors, considered the factors below.
Nature, extent and quality of the services under the management agreement and sub-advisory agreements
The Board received and considered Contract Renewal Information regarding the nature, extent, and quality of services provided to the Fund by the Manager and the Sub-Advisers under the Management Agreement and the Sub-Advisory Agreements, respectively, during the past year. The Board also reviewed Contract Renewal Information regarding the Fund’s compliance policies and procedures established pursuant to the 1940 Act.
The Board reviewed the qualifications, backgrounds and responsibilities of the Fund’s senior personnel and the portfolio management team primarily responsible for the day-to-day portfolio management of the Fund. The Board also considered, based on its knowledge of the Manager and its affiliates, the Contract Renewal Information and the Board’s discussions with the Manager and Western Asset at the Contract Renewal Meeting, the general reputation and investment performance records of the Manager, Western Asset and their affiliates and the financial resources available to the corporate parent of the Manager and the Sub-Advisers, Legg Mason, Inc. (“Legg Mason”), to support their activities in respect of the Fund and the other Legg Mason Closed-end Funds.
The Board reviewed the responsibilities of the Manager and the Sub-Advisers under the Management Agreement and the Sub-Advisory Agreements, respectively, including the Manager’s coordination and oversight of the services provided to the Fund by the Sub-Advisers and others and Western Asset’s coordination and oversight of the services provided to the Fund by the Non-U.S. Sub-Advisers. The Management Agreement permits the Manager to delegate certain of its responsibilities, including its investment advisory duties thereunder, provided that the Manager, in each case, will supervise the activities of the delegee. Pursuant to this provision of the Management Agreement, the Manager does not provide day-to-day portfolio management services to the Fund. Rather, portfolio management services for the Fund are provided by Western Asset pursuant to the Sub-Advisory Agreement (the “Western Asset Sub-Advisory Agreement”) between the Manager and Western Asset. The Western Asset Sub-Advisory Agreement permits Western Asset to delegate certain of its responsibilities, including its investment sub-advisory duties thereunder, provided that Western Asset, in each case, will supervise the activities of the delegee. Pursuant to this provision of the Western Asset Sub-Advisory Agreement, each Non-U.S. Sub-Adviser helps to provide certain investment sub-advisory services to the Fund pursuant to a separate Sub-Advisory Agreement with Western Asset.
In reaching its determinations regarding continuation of the Management Agreement and the Sub-Advisory Agreements, the Board took into account that Fund shareholders, in pursuing their investment goals and objectives, likely purchased their shares based upon
| Western Asset Global Partners Income Fund Inc. | 49 |
Table of Contents
Board approval of management and subadvisory agreements (unaudited) (cont’d)
the reputation and the investment style, philosophy and strategy of the Manager and Western Asset, as well as the resources available to the Manager and the Sub-Advisers.
The Board concluded that, overall, the nature, extent, and quality of the management and other services provided to the Fund under the Management Agreement and the Sub-Advisory Agreements have been satisfactory under the circumstances.
Fund performance
The Board received and considered performance information and analyses (the “Lipper Performance Information”) for the Fund, as well as for a group of funds (the “Performance Universe”) selected by Lipper, Inc. (“Lipper”), an independent provider of investment company data. The Board was provided with a description of the methodology Lipper used to determine the similarity of the Fund with the funds included in the Performance Universe. The Performance Universe included the Fund and all leveraged high yield closed-end funds, as classified by Lipper, regardless of asset size. The number of funds in the Performance Universe ranged from a low of twenty-one funds, including the Fund, for the 10-year period ended June 30, 2015, to a high of thirty-two funds, including the Fund, for the 1-year period ended June 30, 2015. The Board noted that it had received and discussed with the Manager and Western Asset information throughout the year at periodic intervals comparing the Fund’s performance against its benchmark and its peer funds as selected by Lipper.
The Lipper Performance Information comparing the Fund’s performance to that of the Performance Universe based on net asset value per share showed, among other things, that the Fund’s performance for the 1-, 3- and 5-year periods ended June 30, 2015 in each case was ranked in the fifth quintile of the funds in the Performance Universe for that period and was worse than the Performance Universe median performance for that performance measurement period. The Lipper Performance Information further showed that the Fund’s performance was ranked in the third quintile of the funds in the Performance Universe for the 10-year period ended June 30, 2015 and was slightly below the Performance Universe median for that period. In these rankings, the first quintile represents funds with the best performance among the funds in the Performance Universe and the fifth quintile represents funds with poorest performance among the funds in the Performance Universe. The Board noted that the Fund’s performance for the 10-year period was achieved, in part, by a predecessor portfolio management team. In assessing the Fund’s performance, the Board considered the Manager’s explanation of the Fund’s underperformance relative to the Performance Universe for the 1-, 3- and 5-year periods. In addition to the Fund’s performance relative to the Performance Universe, the Board considered the Fund’s performance in absolute terms and the Fund’s performance relative to its benchmark for each of the 1-, 3-, and 5-year periods ended June 30, 2015. On a net asset value basis, the Fund underperformed its benchmark for the 1-year period ended June 30, 2015 but outperformed its benchmark for each of the 3- and 5-year periods ended such date.
Based on the reviews and discussions of Fund performance and considering other relevant factors, including those noted above, the Board concluded, under the circumstances, that
| 50 | Western Asset Global Partners Income Fund Inc. |
Table of Contents
continuation of the Management Agreement and the Sub-Advisory Agreements for an additional one-year period would be consistent with the interests of the Fund and its shareholders.
Management fees and expense ratios
The Board reviewed and considered the management fee (the “Management Fee”) payable by the Fund to the Manager under the Management Agreement and the sub-advisory fees (the “Sub-Advisory Fees”) payable to the Sub-Advisers under the Sub-Advisory Agreements in light of the nature, extent and overall quality of the management, investment advisory and other services provided by the Manager and the Sub-Advisers. The Board noted that the Sub-Advisory Fee payable to Western Asset under the Western Asset Sub-Advisory Agreement is paid by the Manager, not the Fund, and, accordingly, that the retention of Western Asset does not increase the fees or expenses otherwise incurred by the Fund’s shareholders. Similarly, the Board noted that the Sub-Advisory Fee payable to each of the Non-U.S. Sub-Advisers under its Sub-Advisory Agreement with Western Asset is paid by Western Asset, not the Fund, and, accordingly, that the retention of such Non-U.S. Sub-Adviser does not increase the fees or expenses otherwise incurred by the Fund’s shareholders.
Additionally, the Board received and considered information and analyses prepared by Lipper (the “Lipper Expense Information”) comparing the Management Fee and the Fund’s overall expenses with those of funds in an expense group (the “Expense Group”) selected and provided by Lipper. The comparison was based upon the constituent funds’ latest fiscal years. The Expense Group consisted of the Fund and fourteen other leveraged high yield closed-end funds, as classified by Lipper. The fifteen funds in the Expense Group had average net common share assets ranging from $112.7 million to $330.8 million. Eight of the other Performance Universe funds were larger than the Fund and six were smaller.
The Lipper Expense Information, comparing the Management Fee as well as the Fund’s actual total expenses to the Fund’s Expense Group, showed, among other things, that the Fund’s Management Fee on a contractual basis was ranked fourteenth among the funds in the Expense Group (first being lowest and, therefore, best in these expense component rankings). The Fund’s actual Management Fee (i.e., giving effect to any voluntary fee waivers implemented by the Manager with respect to the Fund and by the managers of the other Expense Group funds) was ranked seventh among the funds in the Expense Group compared on the basis of common share assets only and was ranked ninth among the funds in the Expense Group on the basis of common share and leveraged assets. The Fund’s actual total expenses ranked third among the funds in the Expense Group compared on the basis of common share assets only and ranked fifth among the Expense Group funds compared on the basis of common share and leveraged assets. The Fund’s contractual Management Fee was worse (i.e., higher) than the Expense Universe median for that expense component. The Fund’s actual Management Fee was better than the Expense Group median for that expense component when compared on the basis of common share assets only but was worse than the Expense Group median when compared on the basis of common share and leveraged
| Western Asset Global Partners Income Fund Inc. | 51 |
Table of Contents
Board approval of management and subadvisory agreements (unaudited) (cont’d)
assets. The Lipper Expense Information further showed that the Fund’s actual total expenses were better than the Expense Group median whether compared on the basis of common share assets only or on the basis of common share and leveraged assets. The Manager noted, among other things, that the Fund’s total expenses were lower than the Expense Group average for that expense component based on common share and leveraged assets and that the Fund’s actual Management Fee was lower than the Expense Group average for that expense component compared on the basis of common share assets only.
The Board also reviewed Contract Renewal Information regarding fees charged by the Manager to other U.S. clients investing primarily in an asset class similar to that of the Fund, including, where applicable, institutional and separate accounts. The Board was advised that the fees paid by such institutional, separate account and other clients (collectively, “institutional clients”) generally are lower, and may be significantly lower, than the Management Fee. The Contract Renewal Information discussed the significant differences in scope of services provided to the Fund and to institutional clients. Among other things, institutional clients have fewer compliance, administration and other needs than the Fund and the Fund is subject not only to heightened regulatory requirements relative to institutional clients but also to requirements for listing on the New York Stock Exchange. The Contract Renewal Information noted further that the Fund is provided with administrative services, office facilities, Fund officers (including the Fund’s chief executive, chief financial and chief compliance officers), and that the Manager coordinates and oversees the provision of services to the Fund by other fund service providers. The Contract Renewal Information included information regarding management fees paid by open-end mutual funds in the same complex (the “Legg Mason Open-end Funds”) and such information indicated that the management fees paid by the Legg Mason Closed-end Funds generally were higher than those paid by the Legg Mason Open-end Funds. The Manager, in response to an inquiry from the Board as to the reasons for the fee differential, provided information as to differences between the services provided to the Fund and the other Legg Mason Closed-end Funds and the services provided to the Legg Mason Open-end Funds. The Board considered the fee comparisons in light of the different services provided in managing these other types of clients and funds.
Taking all of the above into consideration, the Board determined that the Management Fee and the Sub-Advisory Fees were reasonable in light of the nature, extent and overall quality of the management, investment advisory and other services provided to the Fund under the Management Agreement and the Sub-Advisory Agreements.
Manager profitability
The Board, as part of the Contract Renewal Information, received an analysis of the profitability to the Manager and its affiliates in providing services to the Fund for the Manager’s fiscal years ended March 31, 2015 and March 31, 2014. The Board also received profitability information with respect to the Legg Mason fund complex as a whole. In addition, the Board received Contract Renewal Information with respect to the Manager’s revenue
| 52 | Western Asset Global Partners Income Fund Inc. |
Table of Contents
and cost allocation methodologies used in preparing such profitability data. The profitability to each of the Sub-Advisers was not considered to be a material factor in the Board’s considerations since Western Asset’s Sub-Advisory Fee is paid by the Manager, not the Fund, and the Sub-Advisory Fees for the Non-U.S. Sub-Advisers are paid by Western Asset, not the Fund. The profitability analysis presented to the Board as part of the Contract Renewal Information indicated that profitability to the Manager had not changed during the period covered by the analysis and remained at a level that the Board did not consider to be excessive in light of judicial guidance and the nature, extent and overall quality of the investment advisory and other services provided to the Fund.
Economies of scale
The Board received and discussed Contract Renewal Information concerning whether the Manager realizes economies of scale if the Fund’s assets grow. The Board noted that because the Fund is a closed-end fund with no current plans to seek additional assets beyond maintaining its dividend reinvestment plan, any significant growth in its assets generally will occur through appreciation in the value of the Fund’s investment portfolio, rather than sales of additional shares in the Fund. The Board determined that the Management Fee structure, which incorporates no breakpoints reducing the Management Fee at specified increased asset levels, was appropriate under present circumstances.
Other benefits to the manager and the sub-advisers
The Board considered other benefits received by the Manager, the Sub-Advisers and their affiliates as a result of their relationship with the Fund and did not regard such benefits as excessive.
* * * * * *
In light of all of the foregoing and other relevant factors, the Board determined, under the circumstances, that continuation of the Management Agreement and the Sub-Advisory Agreements would be consistent with the interests of the Fund and its shareholders and unanimously voted to continue each Agreement for a period of one additional year. No single factor reviewed by the Board was identified by the Board as the principal factor in determining whether to approve continuation of the Management Agreement and the Sub-Advisory Agreements, and each Board member may have attributed different weights to the various factors. The Independent Directors were advised by separate independent legal counsel throughout the process. Prior to the Contract Renewal Meeting, the Board received a memorandum prepared by the Manager discussing its responsibilities in connection with the proposed continuation of the Management Agreement and the Sub-Advisory Agreements as part of the Contract Renewal Information and the Independent Directors separately received a memorandum discussing such responsibilities from their independent counsel. Prior to voting, the Independent Directors also discussed the proposed continuation of the Management Agreement and the Sub-Advisory Agreements in private sessions with their independent legal counsel at which no representatives of the Manager or any Sub-Adviser were present.
| Western Asset Global Partners Income Fund Inc. | 53 |
Table of Contents
Additional shareholder information (unaudited)
Results of annual meeting of shareholders
The Annual Meeting of Shareholders of Western Asset Global Partners Income Fund Inc. was held on December 14, 2015, for the purpose of considering and voting upon the election of Directors. The following table provides information concerning the matter voted upon at the Meeting:
Election of directors
| Nominees | Votes For | Votes Withheld | ||||||
| Robert D. Agdern | 12,281,784 | 781,742 | ||||||
| William R. Hutchinson | 12,274,890 | 788,636 | ||||||
| Jane Trust* | 12,287,983 | 775,543 | ||||||
At February 29, 2016, in addition to Robert D. Agdern, William R. Hutchinson and Jane Trust, the other Directors of the Fund were as follows:
Carol L. Colman
Daniel P. Cronin
Paolo M. Cucchi
Leslie H. Gelb
Eileen A. Kamerick
Riordan Roett
| * | Effective August 1, 2015, Jane Trust was appointed by the Board to the position of Chairman, President and Chief Executive of the Fund. |
| 54 | Western Asset Global Partners Income Fund Inc. |
Table of Contents
Dividend reinvestment and cash purchase plan (unaudited)
1. Each shareholder initially purchasing shares of common stock (“Shares”) of Western Asset Global Partners Income Fund Inc. (“Fund”), on or after September 6, 1996 will be deemed to have elected to be a participant in the Amended and Restated Dividend Reinvestment and Cash Purchase Plan (“Plan”), unless the shareholder specifically elects in writing (addressed to the Agent at the address below or to any nominee who holds Shares for the shareholder in its name) to receive all distributions in cash, paid by check, mailed directly to the record holder by or under the direction of Computershare as the Fund’s dividend-paying agent (“Agent”). A shareholder whose Shares are held in the name of a broker or nominee who does not provide an automatic reinvestment service may be required to take such Shares out of “street name” and register such Shares in the shareholder’s name in order to participate, otherwise distributions will be paid in cash to such shareholder by the broker or nominee. Each participant in the Plan is referred to herein as a “Participant.” The Agent will act as agent for each Participant, and will open accounts for each Participant under the Plan in the same name as their Shares are registered.
2. Unless the Fund declares a distribution payable only in the form of cash, the Agent will apply all distributions in the manner set forth below.
3. If, on the determination date, the market price per Share equals or exceeds the net asset value per Share on that date (such condition, a “market premium”), the Agent will receive the distribution in newly issued Shares of the Fund on behalf of Participants. If, on the determination date, the net asset value per Share exceeds the market price per Share (such condition, a “market discount”), the Agent will purchase Shares in the open-market. The determination date will be the fourth New York Stock Exchange (“NYSE”) trading day (a NYSE trading day being referred to herein as a “Trading Day”) preceding the payment date for the distribution. For purposes herein, “market price” will mean the average of the highest and lowest prices at which the Shares sell on the NYSE on the particular date, or if there is no sale on that date, the average of the closing bid and asked quotations.
4. Purchases made by the Agent will be made as soon as practicable commencing on the Trading Day following the determination date and terminating no later than 30 days after the distribution payment date except where temporary curtailment or suspension of purchase is necessary to comply with applicable provisions of federal securities law; provided, however, that such purchases will, in any event, terminate on the Trading Day prior to the “ex-dividend” date next succeeding the distribution payment date.
5. If (i) the Agent has not invested the full distribution amount in open-market purchases by the date specified in paragraph 4 above as the date on which such purchases must terminate or (ii) a market discount shifts to a market premium during the purchase period, then the Agent will cease making open-market purchases and will receive the uninvested portion of the distribution amount in newly issued Shares (x) in the case of (i) above, at the close of business on the date the Agent is required to terminate making open-market purchases as specified in paragraph 4 above or (y) in the case of (ii) above, at the close of business on the date such shift occurs; but in no event prior to the payment date for the distribution.
| Western Asset Global Partners Income Fund Inc. | 55 |
Table of Contents
Dividend reinvestment and cash purchase plan (unaudited) (cont’d)
6. In the event that all or part of a distribution amount is to be paid in newly issued Shares, such Shares will be issued to Participants in accordance with the following formula: (i) if, on the valuation date, the net asset value per Share is less than or equal to the market price per Share, then the newly issued Shares will be valued at net asset value per Share on the valuation date; provided, however, that if the net asset value is less than 95% of the market price on the valuation date, then such Shares will be issued at 95% of the market price and (ii) if, on the valuation date, the net asset value per Share is greater than the market price per Share, then the newly issued Shares will be issued at the market price on the valuation date. The valuation date will be the distribution payment date, except that with respect to Shares issued pursuant to paragraph 5 above, the valuation date will be the date such Shares are issued. If a date that would otherwise be a valuation date is not a Trading Day, the valuation date will be the next preceding Trading Day.
7. Participants have the option of making additional cash payments to the Agent, monthly, in a minimum amount of $250, for investment in Shares. The Agent will use all such funds received from Participants to purchase Shares in the open market on or about the first business day of each month. To avoid unnecessary cash accumulations, and also to allow ample time for receipt and processing by the Agent, Participants should send in voluntary cash payments to be received by the Agent approximately 10 days before an applicable purchase date specified above. A Participant may withdraw a voluntary cash payment by written notice, if the notice is received by the Agent not less than 48 hours before such payment is to be invested.
8. Purchases by the Agent pursuant to paragraphs 4 and 7 above may be made on any securities exchange on which the Shares of the Fund are traded, in the over-the-counter market or in negotiated transactions, and may be on such terms as to price, delivery and otherwise as the Agent shall determine. Funds held by the Agent uninvested will not bear interest, and it is understood that, in any event, the Agent shall have no liability in connection with any inability to purchase Shares within the time periods herein provided, or with the timing of any purchases effected. The Agent shall have no responsibility as to the value of the Shares acquired for the Participant’s account. The Agent may commingle amounts of all Participants to be used for open-market purchases of Shares and the price per Share allocable to each Participant in connection with such purchases shall be the average price (including brokerage commissions) of all Shares purchased by the Agent.
9. The Agent will maintain all Participants’ accounts in the Plan and will furnish written confirmations of all transactions in each account, including information needed by Participants for personal and tax records. The Agent will hold Shares acquired pursuant to the Plan in noncertificated form in the Participant’s name or that of its nominee, and each Participant’s proxy will include those Shares purchased pursuant to the Plan. The Agent will forward to Participants any proxy solicitation material and will vote any Shares so held for Participants only in accordance with the proxy returned by Participants to the Fund. Upon written request, the Agent will deliver to Participants, without charge, a certificate or certificates for the full Shares.
| 56 | Western Asset Global Partners Income Fund Inc. |
Table of Contents
10. The Agent will confirm to Participants each acquisition made for their respective accounts as soon as practicable but not later than 60 days after the date thereof. Although Participants may from time to time have an undivided fractional interest (computed to three decimal places) in a Share of the Fund, no certificates for fractional shares will be issued. Distributions on fractional shares will be credited to each Participant’s account. In the event of termination of a Participant’s account under the Plan, the Agent will adjust for any such undivided fractional interest in cash at the market value of the Fund’s Shares at the time of termination less the pro rata expense of any sale required to make such an adjustment.
11. Any share dividends or split shares distributed by the Fund on Shares held by the Agent for Participants will be credited to their respective accounts. In the event that the Fund makes available to Participants rights to purchase additional Shares or other securities, the Shares held for Participants under the Plan will be added to other Shares held by the Participants in calculating the number of rights to be issued to Participants.
12. The Agent’s service fee for handling distributions will be paid by the Fund. Participants will be charged a pro rata share of brokerage commissions on all open-market purchases.
13. Participants may terminate their accounts under the Plan by notifying the Agent in writing. Such termination will be effective immediately if notice is received by the Agent not less than 10 days prior to any distribution record date; otherwise such termination will be effective on the first Trading Day after the payment date for such distribution with respect to any subsequent distribution. The Plan may be amended or terminated by the Fund as applied to any voluntary cash payments made and any distribution paid subsequent to written notice of the change or termination sent to Participants at least 30 days prior to the record date for the distribution. The Plan may be amended or terminated by the Agent, with the Fund’s prior written consent, on at least 30 days’ written notice to Participants. Notwithstanding the preceding two sentences, the Agent or the Fund may amend or supplement the Plan at any time or times when necessary or appropriate to comply with applicable law or rules or policies of the Securities and Exchange Commission or any other regulatory authority. Upon any termination, the Agent will cause a certificate or certificates for the full Shares held by each Participant under the Plan and cash adjustment for any fraction to be delivered to each Participant without charge.
14. Any amendment or supplement shall be deemed to be accepted by each Participant unless, prior to the effective date thereof, the Agent receives written notice of the termination of the Participant’s account under the Plan. Any such amendment may include an appointment by the Agent in its place and stead of a successor Agent under these terms and conditions, with full power and authority to perform all or any of the acts to be performed by the Agent under these terms and conditions. Upon any such appointment of an Agent for the purpose of receiving distributions, the Fund will be authorized to pay to such successor Agent, for each Participant’s account, all distributions payable on Shares of the Fund held in each Participant’s name or under the Plan for retention or application by such successor Agent as provided in these terms and conditions.
| Western Asset Global Partners Income Fund Inc. | 57 |
Table of Contents
Dividend reinvestment and cash purchase plan (unaudited) (cont’d)
15. In the case of Participants, such as banks, broker-dealers or other nominees, which hold Shares for others who are beneficial owners (“Nominee Holders”), the Agent will administer the Plan on the basis of the number of Shares certified from time to time by each Nominee Holder as representing the total amount registered in the Nominee Holder’s name and held for the account of beneficial owners who are to participate in the Plan.
16. The Agent shall at all times act in good faith and use its best efforts within reasonable limits to insure the accuracy of all services performed under this Agreement and to comply with applicable law, but assumes no responsibility and shall not be liable for loss or damage due to errors unless such error is caused by its negligence, bad faith, or willful misconduct or that of its employees.
17. All correspondence concerning the Plan should be directed to Computershare, 211 Quality Circle, Suite 210, College Station, TX 77845-4470 or by telephone at 1-888-888-0151.
| 58 | Western Asset Global Partners Income Fund Inc. |
Table of Contents
Western Asset
Global Partners Income Fund Inc.
Directors
Robert D. Agdern
Carol L. Colman
Daniel P. Cronin
Paolo M. Cucchi
Leslie H. Gelb
William R. Hutchinson
Eileen A. Kamerick
Riordan Roett
Jane Trust*
Chairman
Officers
Jane Trust*
President and Chief Executive Officer
Richard F. Sennett
Principal Financial Officer
Ted P. Becker
Chief Compliance Officer
Jenna Bailey
Identity Theft Prevention Officer
Robert I. Frenkel
Secretary and Chief Legal Officer
Thomas Mandia
Assistant Secretary
Steven Frank
Treasurer
Jeanne M. Kelly
Senior Vice President
| * | Effective August 1, 2015, Ms. Trust became Chairman, President and Chief Executive Officer. |
| ** | Effective March 14, 2016, Computershare Inc. serves as the Fund’s transfer agent. |
Western Asset Global Partners Income Fund Inc.
620 Eighth Avenue
49th Floor
New York, NY 10018
Investment manager
Legg Mason Partners Fund Advisor, LLC
Subadvisers
Western Asset Management Company
Western Asset Management Company Limited
Western Asset Management Company Ltd
Western Asset Management Company Pte. Ltd.
Custodian
State Street Bank and Trust Company
1 Lincoln Street
Boston, MA 02111
Transfer agent
Computershare Inc.**
211 Quality Circle, Suite 210
College Station, TX 77845-4470
Independent registered public accounting firm
KPMG LLP
345 Park Avenue
New York, NY 10154
Legal counsel
Simpson Thacher & Bartlett LLP
425 Lexington Avenue
New York, NY 10017
New York Stock Exchange Symbol
GDF
Table of Contents
Legg Mason Funds Privacy and Security Notice
Your Privacy and the Security of Your Personal Information is Very Important to the Legg Mason Funds
This Privacy and Security Notice (the “Privacy Notice”) addresses the Legg Mason Funds’ privacy and data protection practices with respect to nonpublic personal information the Funds receive. The Legg Mason Funds include any funds sold by the Funds’ distributor, Legg Mason Investor Services, LLC, as well as Legg Mason-sponsored closed-end funds and certain closed-end funds managed or sub-advised by Legg Mason or its affiliates. The provisions of this Privacy Notice apply to your information both while you are a shareholder and after you are no longer invested with the Funds.
The Type of Nonpublic Personal Information the Funds Collect About You
The Funds collect and maintain nonpublic personal information about you in connection with your shareholder account. Such information may include, but is not limited to:
| • | Personal information included on applications or other forms; |
| • | Account balances, transactions, and mutual fund holdings and positions; |
| • | Online account access user IDs, passwords, security challenge question responses; and |
| • | Information received from consumer reporting agencies regarding credit history and creditworthiness (such as the amount of an individual’s total debt, payment history, etc.). |
How the Funds Use Nonpublic Personal Information About You
The Funds do not sell or share your nonpublic personal information with third parties or with affiliates for their marketing purposes, or with other financial institutions or affiliates for joint marketing purposes, unless you have authorized the Funds to do so. The Funds do not disclose any nonpublic personal information about you except as may be required to perform transactions or services you have authorized or as permitted or required by law. The Funds may disclose information about you to:
| • | Employees, agents, and affiliates on a “need to know” basis to enable the Funds to conduct ordinary business or comply with obligations to government regulators; |
| • | Service providers, including the Funds’ affiliates, who assist the Funds as part of the ordinary course of business (such as printing, mailing services, or processing or servicing your account with us) or otherwise perform services on the Funds’ behalf, including companies that may perform marketing services solely for the Funds; |
| • | The Funds’ representatives such as legal counsel, accountants and auditors; and |
| • | Fiduciaries or representatives acting on your behalf, such as an IRA custodian or trustee of a grantor trust. |
| NOT PART OF THE SEMI-ANNUAL REPORT |
Table of Contents
Legg Mason Funds Privacy and Security Notice (cont’d)
Except as otherwise permitted by applicable law, companies acting on the Funds’ behalf are contractually obligated to keep nonpublic personal information the Funds provide to them confidential and to use the information the Funds share only to provide the services the Funds ask them to perform.
The Funds may disclose nonpublic personal information about you when necessary to enforce their rights or protect against fraud, or as permitted or required by applicable law, such as in connection with a law enforcement or regulatory request, subpoena, or similar legal process. In the event of a corporate action or in the event a Fund service provider changes, the Funds may be required to disclose your nonpublic personal information to third parties. While it is the Funds’ practice to obtain protections for disclosed information in these types of transactions, the Funds cannot guarantee their privacy policy will remain unchanged.
Keeping You Informed of the Funds’ Privacy and Security Practices
The Funds will notify you annually of their privacy policy as required by federal law. While the Funds reserve the right to modify this policy at any time they will notify you promptly if this privacy policy changes.
The Funds’ Security Practices
The Funds maintain appropriate physical, electronic and procedural safeguards designed to guard your nonpublic personal information. The Funds’ internal data security policies restrict access to your nonpublic personal information to authorized employees, who may use your nonpublic personal information for Fund business purposes only.
Although the Funds strive to protect your nonpublic personal information, they cannot ensure or warrant the security of any information you provide or transmit to them, and you do so at your own risk. In the event of a breach of the confidentiality or security of your nonpublic personal information, the Funds will attempt to notify you as necessary so you can take appropriate protective steps. If you have consented to the Funds using electronic communications or electronic delivery of statements, they may notify you under such circumstances using the most current email address you have on record with them.
In order for the Funds to provide effective service to you, keeping your account information accurate is very important. If you believe that your account information is incomplete, not accurate or not current, or if you have questions about the Funds’ privacy practices, write the Funds using the contact information on your account statements, email the Funds by clicking on the Contact Us section of the Funds’ website at www.leggmason.com, or contact the Fund at 1-888-777-0102.
| NOT PART OF THE SEMI-ANNUAL REPORT |
Table of Contents
Western Asset Global Partners Income Fund Inc.
Western Asset Global Partners Income Fund Inc.
620 Eighth Avenue
49th Floor
New York, NY 10018
Notice is hereby given in accordance with Section 23(c) of the Investment Company Act of 1940, as amended, that from time to time the Fund may purchase, at market prices, shares of its stock.
The Fund files its complete schedule of portfolio holdings with the Securities and Exchange Commission (“SEC”) for the first and third quarters of each fiscal year on Form N-Q. The Fund’s Forms N-Q are available on the SEC’s website at www.sec.gov. The Fund’s Forms N-Q may be reviewed and copied at the SEC’s Public Reference Room in Washington, D.C., and information on the operation of the Public Reference Room may be obtained by calling 1-800-SEC-0330. To obtain information on Form N-Q from the Fund, shareholders can call 1-888-777-0102.
Information on how the Fund voted proxies relating to portfolio securities during the prior 12-month period ended June 30th of each year and a description of the policies and procedures that the Fund uses to determine how to vote proxies relating to portfolio transactions are available (1) without charge, upon request, by calling 1-888-777-0102, (2) on the Fund’s website at www.lmcef.com and (3) on the SEC’s website at www.sec.gov.
This report is transmitted to the shareholders of Western Asset Global Partners Income Fund Inc. for their information. This is not a prospectus, circular or representation intended for use in the purchase or sale of shares of the Fund or any securities mentioned in the report.
Computershare
P.O. Box 30170
College Station, TX 77842-3170
WAS04030 4/16 SR16-2745
Table of Contents
ITEM 2. CODE OF ETHICS.
Not applicable.
ITEM 3. AUDIT COMMITTEE FINANCIAL EXPERT.
Not applicable.
ITEM 4. PRINCIPAL ACCOUNTANT FEES AND SERVICES.
Not applicable.
ITEM 5. AUDIT COMMITTEE OF LISTED REGISTRANTS.
Not applicable.
ITEM 6. SCHEDULE OF INVESTMENTS.
Included herein under Item 1.
ITEM 7. DISCLOSURE OF PROXY VOTING POLICIES AND PROCEDURES FOR CLOSED-END MANAGEMENT INVESTMENT COMPANIES.
Not applicable.
ITEM 8. PORTFOLIO MANAGERS OF CLOSED-END MANAGEMENT INVESTMENT COMPANIES.
Not applicable.
ITEM 9. PURCHASES OF EQUITY SECURITIES BY CLOSED-END MANAGEMENT INVESTMENT COMPANY AND AFFILIATED PURCHASERS.
Not applicable.
ITEM 10. SUBMISSION OF MATTERS TO A VOTE OF SECURITY HOLDERS.
Not applicable.
ITEM 11. CONTROLS AND PROCEDURES.
| (a) | The registrant’s principal executive officer and principal financial officer have concluded that the registrant’s disclosure controls and procedures (as defined in Rule 30a- 3(c) under the Investment Company Act of 1940, as amended (the “1940 Act”)) are effective as of a date within 90 days of the filing date of this report that includes the disclosure required by this paragraph, based on their evaluation of the disclosure controls and procedures required by Rule 30a-3(b) under the 1940 Act and 15d-15(b) under the Securities Exchange Act of 1934. |
| (b) | There were no changes in the registrant’s internal control over financial reporting (as defined in Rule 30a-3(d) under the 1940 Act) that occurred during the second fiscal quarter of the period covered by this report that have materially affected, or are likely to materially affect the registrant’s internal control over financial reporting. |
Table of Contents
ITEM 12. EXHIBITS.
(a) (1) Not applicable.
Exhibit 99.CODE ETH
(a) (2) Certifications pursuant to section 302 of the Sarbanes-Oxley Act of 2002 attached hereto.
Exhibit 99.CERT
(b) Certifications pursuant to Section 906 of the Sarbanes-Oxley Act of 2002 attached hereto.
Exhibit 99.906CERT
Table of Contents
SIGNATURES
Pursuant to the requirements of the Securities Exchange Act of 1934 and the Investment Company Act of 1940, the registrant has duly caused this Report to be signed on its behalf by the undersigned, there unto duly authorized.
| Western Asset Global Partners Income Fund Inc. | ||
| By: | /s/ Jane Trust | |
| Jane Trust | ||
| Chief Executive Officer | ||
| Date: | April 22, 2016 | |
Pursuant to the requirements of the Securities Exchange Act of 1934 and the Investment Company Act of 1940, this report has been signed below by the following persons on behalf of the registrant and in the capacities and on the dates indicated.
| By: | /s/ Jane Trust | |
| Jane Trust | ||
| Chief Executive Officer | ||
| Date: | April 22, 2016 | |
| By: | /s/ Richard F. Sennett | |
| Richard F. Sennett | ||
| Principal Financial Officer | ||
| Date: | April 22, 2016 | |