UNITED STATES
SECURITIES AND EXCHANGE COMMISSION
Washington, D.C. 20549
FORM 10-K
(Mark One)
| x | ANNUAL REPORT PURSUANT TO SECTION 13 OR 15(d) OF THE SECURITIES EXCHANGE ACT OF 1934 |
For the Fiscal Year Ended December 31, 2012
| o | TRANSITION REPORT PURSUANT TO SECTION 13 OR 15(d) OF THE SECURITIES EXCHANGE ACT OF 1934 |
For the Transition Period From ____________ to ____________
Commission File No. 000-22400
STRATEGIC DIAGNOSTICS INC.
(Exact name of Registrant as specified in its charter)
| Delaware | 56-1581761 |
| (State or other jurisdiction of | (I.R.S. Employer |
| incorporation or organization) | identification no.) |
| | |
| 111 Pencader Drive | |
| Newark, Delaware | 19702 |
| (Address of principal executive offices) | (Zip Code) |
Registrant’s telephone number, including area code: (302) 456-6789
Securities registered pursuant to Section 12(b) of the Act:
| | | Title of Each Class | | | | Name of Each Exchange on Which Registered | |
| | Common Stock, $0.01 par value | | | The NASDAQ Stock Market LLC | |
Securities registered pursuant to Section 12(g) of the Act:
None
Indicate by check mark if the Registrant is a well-known seasoned issuer, as defined in Rule 405 of the Securities Act. Yes o No x
Indicate by check mark if the Registrant is not required to file reports pursuant to Section 13 or Section 15(d) of the Exchange Act. Yes o No x
Indicate by check mark whether the Registrant: (1) has filed all reports required to be filed by Section 13 or 15(d) of the Securities Exchange Act of 1934 during the preceding 12 months (or for such shorter period that the registrant was required to file such reports), and (2) has been subject to such filing requirements for the past 90 days. Yes x No o
Indicate by check mark whether the registrant has submitted electronically and posted on its corporate Web site, if any, every Interactive Data File required to be submitted and posted pursuant to Rule 405 of Regulation S-T (§ 232.405 of this chapter) during the preceding 12 months (or for such shorter period that the registrant was required to submit and post such files). Yes x No o
Indicate by check mark if disclosure of delinquent filers pursuant to Item 405 of Regulation S-K is not contained herein, and will not be contained, to the best of Registrant’s knowledge, in definitive proxy or information statements incorporated by reference in Part III of this Form 10-K or any amendment to this Form 10-K. o
Indicate by check mark whether the Registrant is a large accelerated filer, an accelerated filer, a non-accelerated filer or a smaller reporting company. See the definitions of “large accelerated filer,” “accelerated filer” and “smaller reporting company” in Rule 12b-2 of the Exchange Act. (Check one):
| | | | |
Large Accelerated Filer o | Accelerated Filer o | Non-Accelerated Filer o | Smaller Reporting Company x |
| | | (Do not check if a smaller reporting company) | |
Indicate by check mark whether the Registrant is a shell company (as defined in Rule 12b-2 of the Exchange Act). Yes o No x
The aggregate market value of the common stock held by non-affiliates of the Registrant was $14,019,960, calculated by using the number of shares outstanding and the closing price of the common stock on June 30, 2012 (the last business day of the Registrant’s most recently completed second fiscal quarter).
As of March 26, 2013 there were 21,164,836 shares outstanding of the Registrant’s common stock, par value $0.01 per share.
DOCUMENTS INCORPORATED BY REFERENCE
Portions of the definitive proxy statement (the “Definitive Proxy Statement”) to be filed no later than April 30, 2013 with the Securities and Exchange Commission relative to the Company’s 2013 Annual Meeting of Stockholders are incorporated by reference into Part III of this Report.
| PART I | | | |
| | ITEM 1. | BUSINESS | 3 |
| | | Introductory Note | 3 |
| | | Overview | 3 |
| | | Life Sciences Research Antibodies & Assay Development | 4 |
| | | Invitro-diagnostic Antibody Reagents | 5 |
| | | Sales and Marketing Strategy | 6 |
| | | Competition | 6 |
| | | Geographic and Customer Information | 6 |
| | | Regulatory Approvals | 7 |
| | | Manufacturing | 7 |
| | | Research and Development | 8 |
| | | Proprietary Technology and Patents | 8 |
| | | Employees | 9 |
| | | Organizational History | 9 |
| | ITEM 1A. | RISK FACTORS | 9 |
| | ITEM 1B. | UNRESOLVED STAFF COMMENTS | 14 |
| | ITEM 2. | PROPERTIES | 14 |
| | ITEM 3. | LEGAL PROCEEDINGS | 14 |
| | ITEM 4. | MINE SAFETY DISCLOSURES | 14 |
| | | | |
| PART II | | | |
| | ITEM 5. | MARKET FOR REGISTRANT’S COMMON EQUITY, RELATED STOCKHOLDER MATTERS AND ISSUER PURCHASES OF EQUITY SECURITIES | 15 |
| | | Stock Performance Graph | 16 |
| | ITEM 6. | SELECTED FINANCIAL DATA | 17 |
| | ITEM 7. | MANAGEMENT’S DISCUSSION AND ANALYSIS OF FINANCIAL CONDITION AND RESULTS OF OPERATIONS | 18 |
| | | Forward Looking Statements | 18 |
| | | Introductory Note | 18 |
| | | Overview | 18 |
| | | Results of Operations | 19 |
| | | Year ended December 31, 2012 versus year ended December 31, 2011 | 19 |
| | | Year ended December 31, 2011 versus year ended December 31, 2010 | 20 |
| | | Liquidity and Capital Resources | 21 |
| | | Off-Balance Sheet Arrangements | 22 |
| | | Contractual Obligations | 23 |
| | | Critical Accounting Policies | 23 |
| | | New Accounting Standards and Disclosures | 25 |
| | ITEM 7A. | QUANTITATIVE AND QUALITATIVE DISCLOSURES ABOUT MARKET RISK | 25 |
| | ITEM 8. | FINANCIAL STATEMENTS AND SUPPLEMENTARY DATA | 25 |
| | ITEM 9. | CHANGES IN AND DISAGREEMENTS WITH ACCOUNTANTS ON ACCOUNTING AND FINANCIAL DISCLOSURE | 25 |
| | ITEM 9A. | CONTROLS AND PROCEDURES | 26 |
| | ITEM 9B. | OTHER INFORMATION | 26 |
| | | | |
| PART III | | 27 |
| | ITEM 10. | DIRECTORS, EXECUTIVE OFFICERS AND CORPORATE GOVERNANCE | 27 |
| | ITEM 11. | EXECUTIVE COMPENSATION | 27 |
| | ITEM 12. | SECURITY OWNERSHIP OF CERTAIN BENEFICIAL OWNERS AND MANAGEMENT AND RELATED STOCKHOLDER MATTERS | 27 |
| | ITEM 13. | CERTAIN RELATIONSHIPS AND RELATED TRANSACTIONS, AND DIRECTOR INDEPENDENCE | 28 |
| | ITEM 14. | PRINCIPAL ACCOUNTING FEES AND SERVICES | 28 |
| | | | |
| PART IV | | 29 |
| | ITEM 15. | EXHIBITS AND FINANCIAL STATEMENT SCHEDULES | 29 |
Item 1. Business
Introductory Note
On April 5, 2013, Strategic Diagnostics Inc., a Delaware corporation (“SDIX,” the “Company,” “we,” “our” or “us”), SDIX, LLC, a Delaware limited liability company (the “Purchaser”) and OriGene Technologies, Inc., a Delaware corporation and the ultimate parent of the Purchaser (“Parent” or “OriGene”) entered into an Asset Purchase Agreement (the “Asset Purchase Agreement”).
Pursuant to the terms and conditions of the Asset Purchase Agreement, the Purchaser will acquire all of the Company’s right, title, and interest in substantially all of the assets, equipment, inventory, and intellectual property (the “Purchased Assets”) related exclusively to the Company’s life sciences business, the product portfolio in respect of which includes a full suite of integrated capabilities, including antibody and assay design, development and production and the Advanced Technologies Business (the “Asset Sale”). The Purchaser will also assume and agree to discharge the Assumed Liabilities, as defined in the Asset Purchase Agreement. Parent unconditionally guarantees Purchaser’s obligations in the Asset Purchase Agreement. The purchase price for the Purchased Assets is $16,000,000, which is subject to a post-closing working capital adjustment. The Company will retain the cash from the purchase price, less the escrow amount (described below) until such amount, if any, is released from escrow.
The Company and Purchaser each made customary representations, warranties and covenants in the Asset Purchase Agreement. At closing, $1,300,000 of the purchase price will be placed in escrow to be governed by the terms of a separate escrow agreement. The Asset Purchase Agreement contains indemnification provisions pursuant to which the Company and the Purchaser have agreed to indemnify the other for certain losses, including with respect to environmental, litigation, tax and other matters.
Customary covenants govern the time between the date of the Asset Purchase Agreement and the closing regarding conduct of the Business, access to information pertaining to the Business, confidentiality, publicity, and notification of certain events. The Asset Purchase Agreement also contains restrictive covenants, including, that the Company not (i) engage in a competing business for a period of five years after the closing date, (ii) directly or indirectly solicit Purchaser’s employees for a period of two years after the closing date, (iii) directly or indirectly solicit the Purchaser’s customers for a period of five years after the closing date and (iv) disparage the Purchaser at any time.
The closing will occur by August 31, 2013, unless otherwise agreed by the Company and Purchaser. The Asset Purchase Agreement may be terminated (i) by mutual written consent of the Company and the Purchaser, (ii) if closing does not occur on or before August 31, 2013, (iii) if stockholder approval is not obtained by the Company, (iv) if the Company receives a Superior Proposal, as defined in the Agreement, (v) by Purchaser if there has been a Material Adverse Effect, as defined in the Asset Purchase Agreement, and in other circumstances. The Company has agreed to pay the Purchaser a termination fee of $480,000 if, among other things, (i) stockholder approval is not obtained by the Company, (ii) the Company changes its recommendation to the stockholders or (iii) the Company accepts an Acquisition Proposal, as defined in the Asset Purchase Agreement, and a transaction is consummated within 12 months of termination of the Asset Purchase Agreement.
Except as otherwise indicated, the disclosure set forth in this Form 10-K does not give effect to the closing of the Asset Sale, which is subject to conditions as described above. Should the Asset Sale be consummated, the Company will no longer own its historical operating assets, and its past business operations will be discontinued.
Overview
SDIX (“SDIX,” the “Company,” “we,” “our” or “us”), is a biotechnology company with a core mission of developing, commercializing and marketing innovative, effective products and solutions, many of which are proprietary, that preserve and enhance the quality of human health and wellness. The Company serves the pharmaceutical, biotechnology and diagnostics markets.
SDIX is a customer-centric organization. Our goals are to consistently deliver increased value to our customers through products and services that facilitate business results and reduce costs. SDIX sales professionals focus among other things on delivering a scientifically relevant solution to our customers, based on a clear understanding of their technical needs while striving to deliver products and services that reduce time and total costs for the customer.
The Company is focused on leveraging its expertise in antibodies and immuno-technologies to successfully develop proprietary products and services that enhance the competitive advantage of our customers and drive profitable growth.
The Company believes that our competitive position has been enhanced through the combination of talent, technology, and resources resulting from the business development activities we have pursued since our inception. The Company believes it has achieved meaningful economies of scale for the discovery, development, and production of antibodies and assays through the utilization of its facilities in Newark, Delaware and Windham, Maine.
SDIX has been developing antibodies and assays which have advanced our customers’ immuno-based work for 20 years. By applying its core competencies of creating and producing proprietary, high-quality antibodies and assay development solutions, the Company has produced reagents and assay systems that are responsive to our customers’ analytical information needs.
SDIX is a leading provider of a wide range of life sciences products and services, including custom antibodies, in-vitro diagnostic-grade antibodies, proprietary critical reagent products, associated bio-processing services, and custom assay design and development services. The Company’s products and services are sold to, and often incorporated in the production process for other commercial products used by a wide range of customers including pharmaceutical, biotechnology and diagnostic companies, and major biomedical research centers both domestically and internationally. The Company is fully integrated to deliver a wide range of services encompassing its customers’ antibody and assay needs from antigen design and antibody development through large scale production and post-production bio-processing and immunoassay design and development. Customer service, innovation, and technical expertise are the foundation of the Company’s competitive advantage. The Company’s ISO9001:2008 accredited facilities employ sophisticated production processes that are reliable and deliver high quality to its customers, and its Newark, Delaware and Windham, Maine facilities are certified and accredited by the Association for the Assessment and Accreditation of Laboratory Animal Care (“AAALAC”), the highest standard in laboratory animal care. The Company is licensed by the U.S. Department of Agriculture for research and its work with laboratory animals.
The Company has dedicated substantial resources towards the development of its proprietary Genomic Antibody Technology® (“GAT”) program, with the intent of making this program a key element of the Company’s Life Sciences strategy for establishing and maintaining sustainable differentiation in key markets. The study of gene and protein functionality has created a growing demand for antibody reagents. GAT was developed to address this growing need for high quality reagents. Advanced versions of the technology along with a novel approach to sorting and cloning antibody producing B cells has recently been the focus of development resources. This work has been undertaken to address the growing demand for high quality, novel antibodies to some of the most difficult and therapeutically relevant cellular targets, such as highly conversed proteins, ion channels ad transmembrane proteins.
Immunoassay Technology. An immunoassay is an analytical test that uses antibodies to detect the presence of a target in a complex biological sample with a high degree of sensitivity, precision and accuracy. Immunoassays play a central role in the detection and quantitation of proteins associated with disease diagnosis, prognosis and progression, and therapeutic toxicity, efficacy and outcome. Antibody quality and fit for a particular assay application are key to success. The Company’s scientific expertise with multiple immunoassay formats, coupled with a thorough understanding of the needs of markets and specific customer applications, has allowed the Company to collaborate with customers to develop a diverse array of immunoassay products and the critical antibody reagents necessary for assay performance.
The Company’s business is focused in two areas, Life Sciences Research Antibodies and Assay Development and In vitro Diagnostic antibody reagents, which are described below in Life Sciences.
In 2011 and 2012, the Company disposed of several of its former lines of business, leaving it focused solely on its Life Sciences business. Specifically, the Company sold its Water Quality and Environmental products assets in 2011 and its Food Pathogen and AG-GMO products assets in 2012. Financial information of the Water Quality and Food/AG-GMO product groups has been separately reclassified within the consolidated financial statements as a discontinued operation. See Note 3 of the Notes to the Consolidated Financial Statements for further information.
Life Sciences Research Antibodies & Assay Development
The overall Life Sciences market is experiencing growth due to the expansion of research in the genomic era directed toward understanding the role of proteins in biology and medicine. Based on market research data from Kalorama and Fredonia, the global market for antibody-based reagents and tools in 2012 was approximately $2.8 billion with estimated annual growth in the range of 6-9%. Custom reagent development and production accounted for approximately $490 million with an estimated 6% annual growth rate and premade reagent products comprised approximately $2.3 billion with an estimated annual growth rate of 6-8%. We believe that customers in these markets regard the Company as a leading provider in the design, development and production of antibodies used to target, differentiate, quantify and profile the vast number of proteins related to human health. The Company links its historical expertise in antibodies and immunoassays with its proprietary GAT™ platform. Post-genomics drug development is a rapidly emerging sector for proteomic immunotools. Within this market, investment has largely shifted from discovery activities into more information-rich integrated development activities. Within the past two years, the Company has supplied 6 of the top 10 pharmaceutical and biopharmaceutical companies with proteomic immunotools to further their drug development programs as well as potential clinical candidates for monoclonal antibody therapeutics. The Company produces antibodies to targets and biomarkers of interest allowing customers to quickly assess the feasibility, efficacy and safety of compounds in their developmental pipelines.
Expanded market interest in protein biomarkers as predictive, prognostic, diagnostic, and reporters of activity throughout the drug discovery and development workflow has created increased needs for protein identification and quantitation tools. The Company sees rapid advances in the use of antibodies as tools to measure biomarkers. Research published in January 2012 in “Biomarkers Market (Discovery Technologies, Applications & Indications) – Global Trends, Opportunities & Forecasts” by marketsandmarkets.com has valued the 2011 biomarker market at over $13 billion and projects it to grow to nearly $26 billion in 2016 based on a 14.4% compound annual growth rate. Currently, high-quality biomarker assays exist for a fraction (1-2%) of the total number of proteins encoded by the genomes of key species (e.g., human and rodent). We believe that customers in these markets view the Company as a key provider of critical antibody reagents and immunoassay design and development.
We believe that the Company’s experience in antigen design, antibody generation and immunoassay development, together with its proprietary GAT™ platform, position it to address these needs. In total, SDIX has been selected three consecutive times through an open Request for Proposal by Science Applications International Corporation (“SAIC”) in cooperation with the National Cancer Institute to generate a library of monoclonal reagents against cancer biomarkers. These antibodies are being incorporated into a reference set of validated tools for researchers. Over the course of this partnership, many new customers have benefitted from these oncology-focused research reagents. In some situations, a singular product has been selected by a client to become a critical testing reagent in subsequent follow-on projects. These antibodies are now a resource for the Company to assess application in novel platforms, assays and multiplex applications. The Company also has a portfolio of catalog antibodies made using its GAT platform available for sale online through a distribution agreement with a leading catalog antibody supplier.
Research and development investments over the last two years have resulted in the Company building off its GAT platform to create advanced technologies designed to create antibodies to difficult trans membrane targets, including G protein-coupled receptors, or GPCR’s, that are often therapeutic targets for biopharma companies. The Company introduced the advanced technologies to the marketplace during the fourth quarter of 2012. Business development efforts are underway and initial collaboration projects have been established with two pharmaceutical companies.
In vitro diagnostic antibody reagents
The Company offers its services to the in-vitro diagnostic (“IVD”) market where its collection of critical diagnostic antibodies, its large-scale production capabilities and expertise in immunoassay development enable it to address IVD clients’ clinical assay needs. Products and services include: analyte specific reagents, custom manufacturing of antibodies (monoclonal and polyclonal) and calibrators, and consultation for immunoassay design.
The Company’s products are suitable for use in a variety of immunoassay formats, including lateral flow devices (LFD) and agglutination assays. The Company’s experience in polyclonal production management and reagent processing ensures lot-to-lot consistency in reagent supply. SDIX facilities (monoclonal as well as polyclonal) are also equipped to meet the large volume needs of the diagnostic industry.
The Company maintains regulatory compliance, industrial scale efficiencies, and necessary quality systems to assure a reliable supply of critical reagents to its partners. The Company offers long-term contracts, in-house quality control and vendor management options in order to address global IVD companies’ immunoassay reagent needs. The Company is supplying diagnostic quality reagents to major global IVD companies, and focuses on high value service areas such as antibody development for new assay targets.
IVD reagent (raw material) manufacturing continues to provide growth opportunities for the Company. The Company’s offerings for this market are focused on two major areas: ready-made antibodies for immunoassays, and custom contract manufacturing of monoclonal and polyclonal antibodies. The overall revenue growth for the Company’s IVD sales in 2012, as compared to 2011, was up 5%. The growth in 2012 was mainly due to the revenue of $1.25 million from an agreement with Becton Dickinson (BD) Diagnostics. SDIX customers include the top 5 global IVD companies, based on an industry report issued in March 2011. Considering the consolidated nature of the immunoassay market, having these leading IVD companies as customers provides SDIX with future growth opportunities.
In contrast to the clinical immunoassay market, the antibody supplier market is characterized by many players with narrow focus. Some suppliers are focused on catalog antibodies and others are focused on monoclonal or polyclonal manufacturing services. Very few suppliers provide the complete range of products and services needed by IVD clients. As a result, IVD companies are often forced to deal with many suppliers. Our goal for this segment is to become an integrated supplier for all, or a large portion of, our clients’ immunoassay reagent development and manufacturing needs.
SDIX’s monoclonal and polyclonal manufacturing is equipped to process large volume production runs consistent with the needs of the IVD market. We are focused on adding more products to our catalog based on market demand for reagents in widely used assays. In 2012, SDIX launched four new polyclonal antibodies - Apo A1, IgA, HPT and C3 - aimed at the immunoassay market. The Company’s plan for 2013 is to launch five additional polyclonal antibodies IgM, LP (a), C4, IgG(Fc) and CER.
We believe that highly sensitive and specific assays that can detect diseases early and accurately have the potential to be growth drivers for the immunoassay market. The Company’s innovative GAT technology is geared towards delivering highly sensitive diagnostic antibodies, a further proof that the Company is focused on innovation that benefits clinical diagnostics. In addition to the mainstream diagnostics market, SDIX believes that it is in a good position to offer its products and services to newer markets such as companion diagnostics, thereby potentially achieving greater growth than if the Company focused its efforts on IVD alone.
Sales and Marketing Strategy
The Company markets and sells products in the life sciences and in vitro diagnostics product categories through a U.S. direct sales force, Internet presence and through the Company’s corporate partners. The Company also has an International sales operation located near London, England. The Company evaluates various sales and service models that can contribute to the profitable growth of business. Identifying the most effective channels to market will allow the Company to better allocate resources to both new and existing growth opportunities.
In the United States, the primary sales channel is through a direct sales force comprised of geographically based field sales professionals. The sales force is augmented by customer service and project management organizations, and applied technical marketing specialists which assure that all elements of the customer’s buying experience meet and exceed their performance expectations.
The Company has invested in its sales channel through the addition of new sales representatives and focused sales and technical training. The Company continually measures sales performance and maintains discipline in the balance between the addition of new sales resources and ongoing efforts to continually improve sales efficiency and effectiveness of existing resources. In 2006, the Company added its first distributor for its custom antibody offering. The Company is working to add additional channel partners for both its custom and catalog offerings nationally and internationally.
Competition
Many of the Company’s potential competitors are large companies with substantially greater financial and other resources than the Company. To the extent that any such companies enter into one or more of the Company’s markets, the Company’s operations could be materially adversely affected. The Company anticipates increased competition as potential competitors perceive that the Company’s products have become commercially proven, or if the Company cannot maintain competitive differentiation.
In the antibody product category, the competitive landscape is rapidly changing as the Company continues to shift its emphasis to earlier activities in drug and biomarker discovery. The Company will increasingly compete with technology companies that offer products and services for the discovery and advancement of novel antibodies. The Company believes that its proprietary GAT platform coupled with its expertise in assay development provides differentiated access to the high value application markets it is targeting.
The Company also competes in its traditional antibody markets with the internal capabilities of some of the Company’s large pharmaceutical, research and diagnostics customers. These customers often have significantly greater revenues than the Company. Generally these customers produce some products internally and purchase similar products from the Company.
Competitors in the market as third party providers of custom, large scale antibody reagent production include Covance (public), Harlan (private), Lampire (private), HyTest (private) and Scantibodies (private). Additionally, there are a number of smaller companies that offer competing products. In the custom research reagent market, the Company has identified approximately 50 companies offering some form of traditional antibody production from customer-provided antigens. The Company believes that its innovation, expertise, and fully integrated suite of solutions plus the scale of its operations are significant competitive advantages against both large and small competitors. In the catalog antibody space, there are over 130 companies competing in this market.
Geographic and Customer Information
The following table sets forth sales by geographic region:
| | | | | | | Year | | | | |
| | | | Ended December 31, | |
| | | | 2012 | | | 2011 | | | 2010 | |
| | | | | | | | | | | |
| | United States | | $ | 12,882 | | | $ | 14,450 | | | $ | 12,472 | |
| | Rest of the world | | | 2,189 | | | | 2,070 | | | | 2,964 | |
| | Total | | $ | 15,071 | | | $ | 16,520 | | | $ | 15,436 | |
The Company’s basis for identifying sales by country is the ship-to location. There were no individual countries outside of the United States that represented more than 10% of the total revenues of the Company.
Revenue from the Company’s two largest customers was 9.6% and 9.5% of total revenue in 2012, 13.2% and 10.7% of total revenue in 2011 and 14.3% and 11.3% of total revenue in 2010.
Regulatory Approvals
The Company is engaged in the development of antibody and immunoassay products for use in the medical and human healthcare fields. Its current products in this market are intended for “research use only” or as raw material for further processing.
The Company maintains quality systems consistent with 21 CFR 820, Quality System Regulations, and has earned the International Organization for Standardization (“ISO”) 9001:2008 certification for all three of its facilities from an ANSI-ASQ National Accreditation Board (“ANAB”), an Accredited International Registrar for ISO 9001 standards. Recognized and respected worldwide, the ISO 9001:2008 standards are put forth by the ISO organization. This certification demonstrates the Company’s commitment to excellence in product and service quality, and a continued focus on improving the customer experience.
The Company has maintained AAALAC accreditation at its Delaware facility since 1993 and at its Maine facility since 2000. The Company volunteers to participate in the AAALAC program in addition to complying with the local, state and federal laws that regulate animal research. In order to maintain these accreditations, the Company undergoes regular inspections and reviews. The Company also holds licenses and approvals from the Untied States Depart of Agriculture (“USDA”) and the National Institute of Health (“NIH”), (OLAW - Office of Laboratory Animal Welfare), further validating the stewardship of the Company in proper laboratory animal care.
Manufacturing
The Company produces and manufactures monoclonal and polyclonal antibodies that are used by academia, biotechnology, pharmaceutical and IVD companies. These antibodies are developed to meet specifications and desired end use as requested by customers. The company utilizes standard in vivo and in vitro methods of antibody production in addition to novel methods the company has developed. One of the methods is the Company’s GAT. This technology is based on innovative antigen design strategy and generates antibodies directly from gene sequences that are selected by a proprietary bioinformatics algorithm. The antigen is expressed in vivo and generates antibodies that recognize conformational epitopes on native protein. GAT antibodies can be used in high value immunoassays where recognition of native protein is essential.
The key critical reagent manufacturing technologies are conjugation chemistries, antibody formulations, calibrator preparation, microbiological and immunoassay processes. Reagent production processes include filling and dispensing liquids, subcomponent and finished goods assembly, in-process testing, quality control, packaging and shipping. The critical reagents and production groups produce and package products in the Newark, Delaware laboratories. Biological materials are primarily developed and produced in-house; however, some reagents are licensed from third parties or purchased from commercial sources. In general, raw materials used by the Company in its products are obtainable from multiple sources. The Company purchases instruments and ancillary equipment from outside vendors. The Company believes that the raw materials, instruments and equipment used in the manufacture of its products are sufficiently available for the Company’s current and foreseeable manufacturing needs.
The Company has implemented data-driven problem solving, measurement and statistical process controls to troubleshoot and continuously improve quality and output performance. Capital investment and equipment automation have reduced key parameter variation, improved production efficiencies and lowered manufacturing costs. The Company utilizes planning tools to control all elements of the supply chain and manufacturing processes, including raw material procurement, inventory management, capacity planning and production scheduling, work-in-process tracking, order processing and fulfillment, shipping and customer invoicing.
The Company also supplies a wide array of custom antibody products and services to the in-vitro diagnostic, academic, pharmaceutical and medical research industries. Antibodies are developed and produced using animals or cell culture methods. Laboratories are maintained to prepare immunogens, perform chemical conjugations, purify antibodies, and perform a range of quality control procedures. The cell culture laboratories support the development of hybridomas and manufacture of monoclonal antibodies. The cell culture laboratories also provide services to enhance the productivity of cell lines, establish Master Cell Banks, and store cell lines in secure fail-safe cryogenic systems. In 2010, the Company added antigen strategy and design capabilities along with assay screening capabilities to support antibody and assay development programs for biopharma. Animal facilities house specific-pathogen-free animals that are tested routinely to assure they are maintained under the highest health standards. Capacity utilization in antibody production was approximately 50% during 2012, and there is additional land and zoning clearance on the 88-acre site in Windham, Maine that could be used to potentially double operations. Facility upgrades initiated during 2012 to meet changing demands of the Life Science marketplace and to establish Good Manufacturing Practices (“GMP”) level production are nearing completion and will be ready for use in early 2013. For certain of our Life Sciences and IVD customers, data collection, analysis, processing and recording is a critical aspect of our services. For these customers we have developed and implemented controlled processes and systems to deliver the data management results critical to their success.
Research and Development
The Company engages in substantial research and development activities (R&D) involving development of products, services and technology platforms. In the years ended December 31, 2012, 2011 and 2010, the Company incurred approximately $3.5 million, $3.3 million and $2.6 million, respectively, in research and development expenditures.
The Company’s primary laboratory facilities located in Newark, Delaware were designed and built specifically for conducting research and development relating to antibody and immunoassay technology. These facilities include state-of-the art antibody development and large-scale production facilities. The Company has assembled a scientific staff with extensive experience in the development, production, and purification of monoclonal and polyclonal antibodies. The Company also has extensive expertise in the development and production of reagents from the antibodies it produces, as well as commercial immunoassays employing those reagents.
In 2011 and 2012, the Company continued development of its proprietary genomic immunization technology, focusing on advanced methods for development of antibodies to high value targets for use by pharmaceutical and biotechnology companies. Specifically, the Company carried out an extensive research program to characterize the value of GAT produced antibodies as compared to conventionally produced antibodies using peptides for immunization. The resulting data demonstrate a clear advantage of GAT over conventional approaches that is increasingly pronounced in more difficult and demanding applications. The results of this study were published last year in the online scientific journal, PloS ONE ( http://www.plosone.org/article/info%3Adoi%2F10.1371%2Fjournal.pone.0028718). The Company has also successfully developed a methodology to generate large and diverse panels of high-performance monoclonal antibodies against pharmaceutically important targets, namely membrane proteins, using a more sophisticated version of its GAT platform. In addition, the Company is working on a microfluidics based technology to screen for antibody producing B cells. This combination of technologies positions the Company as a competitive technology platform provider to the pharmaceutical and biotechnology industry which have a clear unmet need in the area in which the Company believes it can now offer a compelling solution. The Company is currently considering how to structure its ongoing development of, and investment in the GAT and B cell cloning programs.
In 2010, the Company filed one US patent application in the life science area, where it also filed one in 2011. The Company’s research and development personnel are experts in many advanced research disciplines in life sciences including immunology, immunochemistry, molecular biology, protein chemistry, biochemistry, microbiology and synthetic organic chemistry. In addition to the technical expertise resident within the research and development organization, the Company’s technical manufacturing organization is expert in large-scale -production, bioprocessing, purification and quality control of antibodies and reagents. The Company’s core expertise is in antibody and immunoassay development and it is a major developer and producer of monoclonal antibodies.
Research and development activities are focused on developing proprietary technology and products to differentiate the Company’s market position in Life Science and IVD markets. The Company is a recognized leader in the field of contract antibody and assay development services primarily for large pharmaceutical, biotech, diagnostic and chemical companies. The Company’s research and development organization consists of 7 individuals, most of whom hold advanced academic degrees.
Proprietary Technology and Patents
The Company’s products and services are based on the use of proprietary reagents, technology and test systems developed by Company scientists or acquired externally. Accordingly, the Company has implemented a number of procedures to safeguard the proprietary nature of its technology. The Company requires its employees and consultants to execute confidentiality agreements upon the commencement of an employment or consulting relationship with the Company and all employees are required to assign to the Company all rights to any inventions made during their employment relating to the Company’s activities. Additionally, the Company seeks to protect its technology and processes through the patent process. As of December 31, 2012, the Company holds rights in four issued U.S. patents. The Company assigned 2 patents in connection with the sale of the Company’s Food Pathogens and AG-GMO products assets during the fourth quarter of 2012. In addition, the Company has several patent applications in various stages of the patent prosecution process. There can be no assurance that the Company’s patent applications will result in the issuance of any other patent or that any patents issued to the Company would provide protection that is sufficiently broad to protect the Company’s technology and products. In addition, the Company cannot be certain that it was the first creator of inventions covered by patents or pending patent applications or that it was the first to file patent applications for such inventions. In addition to seeking patent protection for the Company’s proprietary information, the Company also relies upon trade secrets, know-how and continuing technical innovation to maintain competitiveness for its products and services. The Company has developed a number of proprietary technologies which it has chosen not to patent, including immunization protocols, DNA and plasmid constructs, stabilization systems for reagents, chemical syntheses, and strategies relating to antibody development.
| U.S. Patent | | Title |
| | | |
| 6,096,563 | | Dual particle immunoassay method & kit |
| 6,376,195 | | Indirect label assay device for detecting small molecules and method of use thereof |
| 6,663,833 | | Integrated Assay Device and Methods of Production and Use |
| 7,241,626 | | Isolation and confirmation of analytes from test devices |
Employees
As of December 31, 2012, the Company employed 110 full time and five part time employees. The workforce was supplemented by six agency-provided contractors. All of the Company’s employees have executed agreements with the Company agreeing not to disclose the Company’s proprietary information and assigning to the Company all rights to inventions made during their employment. Key personnel have signed agreements prohibiting them from competing with the Company. None of the Company’s employees are covered by collective bargaining agreements. The Company believes that its relations with its employees are good.
Organizational History
Strategic Diagnostics Inc. is a Delaware corporation formed in 1990.
Item 1A. Risk Factors
Risks Related to the Asset Sale
The failure to complete the Asset Sale may result in a decrease in the market value of our common stock and limit our ability to grow and implement our lead generation business strategies.
OriGene’s obligation to close the Asset Sale is subject to a number of contingencies, including approval by our stockholders, and other closing conditions set forth in the Asset Purchase Agreement. We cannot control some of these conditions and we cannot assure you that they will be satisfied or that OriGene will waive any that are not satisfied. If the Asset Sale is not completed, we may be subject to a number of risks, including the following:
| | ● | there may not be another party interested in and able to purchase our business or Company; |
| | | if an alternate purchaser and transaction is identified, such alternate transaction may not result in an equivalent price to what is proposed in the Asset Sale; |
| | | the trading price of our common stock may decline to the extent that the current market price reflects a market assumption that the Asset Sale will be completed; |
| | | our relationships with our customers, suppliers and employees may be damaged and our business may be harmed; and |
| | | we may be required to pay OriGene a termination fee of $480,000. |
The occurrence of any of these events individually or in combination could have a material adverse effect on our business, financial condition and results of operations and the market value of our common stock may decline.
Following completion of the Asset Sale, we will continue to retain certain liabilities.
The Asset Purchase Agreement provides that we will retain certain of our liabilities following closing of the Asset Sale, including certain indemnification obligations to OriGene. Should we incur any actual losses with respect to any such liabilities, there could be a material adverse effect on our business, financial condition and results of operations and the market value of our common stock may decline.
While the Asset Sale is pending, it creates uncertainty about our future which could have a material adverse effect on our business, financial condition and results of operations.
While the Asset Sale is pending, it creates uncertainty about our future. As a result of this uncertainty, our current or potential business partners may decide to delay, defer or cancel entering into new business arrangements with us pending completion or termination of the Asset Sale . In addition, while the Asset Sale is pending, we are subject to a number of risks, including:
| | | the diversion of management and employee attention from our day-to-day business; |
| | | the potential disruption to business partners and other service providers; |
| | | the loss of employees who may depart due to their concern about losing their jobs following the Asset Sale; and |
| | | we may be unable to respond effectively to competitive pressures, industry developments and future opportunities. |
The occurrence of any of these events individually or in combination could have a material adverse effect on our business, financial condition and results of operations. Additionally, we have incurred substantial transaction costs and diversion of management resources in connection with the Asset Sale, and we will continue to do so until the closing.
The asset purchase agreement limits our ability to pursue alternatives to the Asset Sale.
The Asset Purchase Agreement contains provisions that make it more difficult for us to sell our business or Company to a party other than OriGene. These provisions include a nonsolicitation provision (including certain matching rights), a provision requiring that we submit the Asset Sale to our stockholders for approval unless the Asset Purchase Agreement has been terminated in accordance with its terms, and provisions obligating us to pay OriGene a termination fee of $480,000 under certain circumstances. These provisions could discourage a third party that might have an interest in acquiring all of or a significant part of our business or Company from considering or proposing such an acquisition, even if that party were prepared to pay consideration with a higher value than the consideration to be paid by OriGene.
Risks Related to Our Business
Our results of operations may fluctuate or may not be profitable which could cause volatility in our stock price.
Our results of operations may fluctuate significantly in the future as a result of a number of factors, many of which are outside of our control. These factors include, but are not limited to:
● unanticipated events associated with regulatory changes;
● general economic conditions;
● acceptance of our products;
● the success of products competitive with ours;
● expenses associated with development and protection of intellectual property matters;
● establishing or maintaining commercial scale manufacturing capabilities;
● the timing of expenses related to commercialization of new products;
● seasonality; and
● the timing and success in building our distribution channels.
In addition, the operations that we retained after the divesture our water quality and food safety businesses in 2011 and 2012, respectively, have not historically been profitable, while the divested operations did achieve profits in the past. The results of our operations may fluctuate significantly from quarter to quarter and may not meet expectations of securities analysts and investors. This may cause our stock price to be volatile.
Our research and development activities may not produce desired and expected results, and we may alter our plans or programs at any time for this or any other reason.
We have undertaken various research and development programs designed to allow us to offer products and services that will be attractive to new and prospective customers. These programs may not achieve desired or expected results, or we may determine for other reasons to no longer pursue certain programs. In such a case, our business model may change, and we may not realize any benefits of our past expenditures on the discontinued programs.
If we use hazardous materials in a manner that causes injury or violates laws, we may be liable for damages.
Our research and development activities involve the controlled use of potentially harmful biological materials as well as hazardous materials, chemicals and various radioactive compounds. We use radioactivity in conducting biological assays and we use solvents that could be flammable in conducting our research and development activities. We cannot completely eliminate the risk of accidental contamination or injury from the use, storage, handling or disposal of these materials. We do not maintain a separate insurance policy for these types of risks. In the event of contamination or injury, we could be held liable for damages that result, and any liability could exceed our resources. We are subject to federal, state and local laws and regulations governing the use, storage, handling and disposal of these materials and specified waste products. The cost of compliance with these laws and regulations could be significant.
Our antibody production process utilizes various species of animals that could contract disease or die, interrupting business operations.
Our antibody production process utilizes animals to produce antibodies. We cannot completely eliminate the risks of animals contracting disease or a disaster that could cause death to valuable production animals, and from time to time we experience instances of animal disease in our vivarium facilities. We cannot make any assurance that we will be able to contain or reverse any such instance of disease. Disease or death on a broad scale could interrupt business operations as animals are a key part of the antibody production operation, which could have a serious adverse effect on our business operations.
If we do not obtain and maintain adequate protection for our intellectual property, the value of our technology and products may be adversely affected.
Our business and competitive positions are dependent in part upon our ability to protect our proprietary technology. To protect our proprietary rights, we rely on a combination of trademark, copyright, patent, trade secret and other intellectual property strategies and laws, employment, confidentiality and invention assignment agreements with our employees and contractors, and confidentiality agreements and protective contractual provisions with other third parties. We attempt to protect our intellectual property position by filing trademark applications and U.S., foreign and international patent applications related to our proprietary technology, inventions and improvements that are important to the development of our business.
As of December 31, 2012, we had rights in four issued U.S. patents, and three pending U.S. and foreign patent applications relating to various aspects of our business. We also had a number of trademark registrations in the United States for a variety of word marks and slogans. We do not believe that any single patent, trademark or other intellectual property right of ours, or combination of our intellectual property rights, is likely to prevent others from competing with us using a similar business model. There are many issued patents and patent applications held by others in our industry. Our competitors may independently develop technologies that are substantially similar or superior to our technologies, or design around our patents or other intellectual property to avoid infringement. In addition, we may not apply for a patent relating to products or processes that are patentable, we may fail to receive any patent for which we apply or have applied, and any patent owned by us or issued to us could be circumvented, challenged, invalidated, or held to be unenforceable, or rights granted thereunder may not adequately protect our technology or provide a competitive advantage to us. If a third-party challenges the validity of any patents or proprietary rights of ours, we may become involved in intellectual property disputes and litigation that would be costly and time-consuming.
Although third parties may infringe on our patents and other intellectual property rights, we may not be aware of any such infringement, or we may be aware of potential infringement but elect not to seek to prevent such infringement or pursue any claim of infringement, and the third party may continue its potentially infringing activities. Any decision whether or not to take further action in response to potential infringement of our patent or other intellectual property rights may be based on any one or more of a variety of factors, such as the potential costs and benefits of taking such action, and business and legal issues and circumstances. Litigation of claims of infringement of a patent or other intellectual property rights may be costly and time-consuming and divert the attention of key company personnel, and may not be successful or result in any significant recovery of compensation for any infringement or enjoining of any infringing activity. Litigation or licensing discussions may also involve or lead to counterclaims that could be brought by a potential infringer to challenge the validity or enforceability of our patents and other intellectual property.
To protect our trade secrets and other proprietary information, we generally require our employees, consultants, contractors and outside collaborators to enter into written nondisclosure agreements. These agreements, however, may not provide adequate protection to prevent any unauthorized use, misappropriation or disclosure of our trade secrets, know-how or other proprietary information. These agreements may be breached, and we may not become aware of, or have adequate remedies in the event of, any such breach. Also, others may independently develop the same or substantially equivalent proprietary information and techniques or otherwise gain access to our trade secrets.
Our ability to market our services may be impaired by the intellectual property rights of third parties.
Our success is dependent in part upon our ability to avoid infringing the patents or proprietary rights of others. Our industry is characterized by a large number of patents, patent filings and litigation based on allegations of patent infringement. Competitors may have filed applications for or have been issued patents and may obtain additional patents and proprietary rights related to products, services or processes that we compete with or are similar to ours. We may not be aware of all of the patents or patent applications potentially adverse to our interests that may have been or may later be issued to or filed by others.
U.S. patent applications may be kept confidential while pending in the Patent and Trademark Office. If other companies have or obtain patents relating to our products or services, we may be required to obtain licenses to those patents or to develop or obtain alternative technology. We may not be able to obtain any such licenses on acceptable terms, or at all. Any failure to obtain such licenses could impair or foreclose our ability to make, use, market or sell our products and services.
Based on the litigious nature of our industry and the fact that we may pose a competitive threat to some companies who own or control various patents, it is always possible that one or more third parties may assert a patent infringement claim seeking damages and to enjoin the manufacture, use, sale and marketing of our products and services. If a third- party asserts that we have infringed on its patent or proprietary rights, we may become involved in intellectual property disputes and litigation that would be costly and time-consuming and could impair or foreclose our ability to make, use, market or sell our products and services.
Lawsuits may have already been filed against us without our knowledge. Additionally, we may receive notices from other third parties suggesting or asserting that we are infringing their patents and inviting us to license such patents. We do not believe that we are infringing on any other party’s patents or that a license to any such patents is necessary. Should litigation over such patents arise, we intend to vigorously defend against any allegation of infringement.
If we are found to infringe on the patent or intellectual property rights of others, we may be required to pay damages, stop the infringing activity or obtain licenses or rights to the patents or other intellectual property in order to use, manufacture, market or sell our products and services. Any required license may not be available to us on acceptable terms or at all. If we succeed in obtaining such licenses, payments under such licenses would reduce any earnings from our products. In addition, licenses may be non-exclusive and, accordingly, our competitors may have access to the same technology as that which may be licensed to us. If we fail to obtain a required license or are unable to alter the design of our product candidates to make a license unnecessary, we may be unable to manufacture, use, market or sell our products and services, which could significantly affect our ability to achieve, sustain or grow our commercial business.
Moreover, regardless of the outcome, patent litigation against or by us could significantly disrupt our business, divert our management’s attention and consume our financial resources. We cannot predict if or when any third party will file suit for patent or other intellectual property infringement.
The difficulties of operating in international markets may harm sales of our products.
Customers outside of the United States accounted for 15% and 13% of our revenues for the years ended December 31, 2012 and 2011, respectively.
The international nature of our business subjects us and our representatives, agents and distributors to the laws and regulations of the jurisdictions in which they operate, and in which our products are sold. The types of risks that we face in international operations include, but are not limited to:
● the imposition of governmental controls;
● logistical difficulties in managing international operations; and
● fluctuations in foreign currency exchange rates.
Our international sales and operations may be limited or disrupted if we cannot successfully meet the challenges of operating internationally.
Future acquisitions and business combinations that we consummate may be difficult to integrate, disrupt our business, dilute stockholder value or divert management attention.
From time to time, we have considered and may in the future consider expanding our operations and market presence by making acquisitions and entering into business combinations, investments, joint ventures or other strategic alliances with other companies. We may have to issue debt or equity securities to pay for future acquisitions, which could be dilutive to our then current stockholders. We cannot assure you that we will consummate any transactions in the future. However, these transactions create risks, such as:
| | ● | difficulty assimilating the operations, technology and personnel of the combined companies; |
| | ● | disrupting our ongoing business; |
| | ● | problems retaining key technical and managerial personnel; |
| | ● | additional operating losses and expenses of acquired businesses; and |
| | ● | impairment of relationships with existing employees, customers and business partners. |
Any of the events described in the foregoing paragraph could have an adverse effect on our business, financial condition and results of operations and could cause our stock price to decline.
If we do not produce future taxable income, our ability to realize the benefits of our net operating loss carryforwards could be significantly reduced.
As of December 31, 2012, the Company had U.S. federal net operating loss carryforwards, including those acquired in the Company’s past acquisitions, of approximately $11.0 million, which, if not utilized, begin to expire as follows:
| | | | |
| | | Net Operating | |
| | | Loss | |
| Year | | (in thousands) | |
| | | | |
| 2022 | | $ | 1,222 | |
| 2024 | | | 1,876 | |
| 2025 | | | 3 | |
| 2026 | | | 1 | |
| 2027 | | | 1 | |
| 2028 | | | 3,492 | |
| 2029 | | | 2,501 | |
| 2030 | | | 1,281 | |
| 2031 | | | 601 | |
| | | | | |
| Total | | $ | 10,978 | |
The Tax Reform Act of 1986 (the “Act”) limits the annual use of net operating loss and income tax credit carryforwards (after certain ownership changes, as defined by the Act). The application of these limits could significantly restrict our ability to utilize carryforwards. Certain of our total net operating loss carryforwards from 2001 and prior years are subject to limitations on their annual use since a cumulative change in ownership of more than 50% has occurred within a three-year period with respect to those net operating loss carryforwards. The Company is currently evaluating recent changes in ownership and has determined that no limitations on net operating loss carryforwards exist for the years expiring 2028 through 2031 (tax years 2008 through 2011). If it is determined that an ownership change of more than 50% within a three-year period did occur for prior years, as determined pursuant to the Internal Revenue Code and Regulations, substantially all of the net operating loss carryforwards and income tax credit carryforwards expiring through 2027 could be subject to annual limitations on usage. Because U.S. tax laws limit the time period during which these carryforwards may be applied against future taxable income, we may not be able to take full advantage of these attributes for federal and state income tax purposes due to the annual limitation usage.
Based on the best information available to us today, we may not have sufficient future taxable income to utilize the net operating loss carryforwards and income tax credit carryforwards prior to their expiration, and we have established a full valuation allowance against these net operating loss and income tax credit carryforwards for financial reporting purposes.
Certain of our shareholders are able to significantly influence proposals for a change in control or other matters requiring a shareholder vote.
Directly, or through entities that they control, members of our Board of Directors as of December 31, 2012 controlled approximately 20.2% of our common stock. Through entities that he controls, Steven R. Becker, who joined our Board effective March 12, 2009, controlled approximately 17% of our outstanding common stock as of December 31, 2012. Due to this concentration of ownership, members of our Board, acting together or, in some cases, individually, can substantially influence all matters requiring a stockholder vote, including, without limitation:
| | ● | the election of directors |
| | ● | the amendment of our organizational documents; or |
| | ● | the approval of a merger, sale of assets, or other major corporate transaction. |
Provisions in our organizational documents could prevent or frustrate attempts by stockholders to replace our current management.
Our certificate of incorporation and our bylaws contain provisions that could make it more difficult for a third party to acquire us without the consent of our Board. Our certificate of incorporation provides for a staggered board and removal of directors only for cause. Accordingly, stockholders may elect only a portion of our board at any annual meeting, which may have the effect of delaying or preventing changes in management. In addition, under our certificate of incorporation, our Board of Directors may issue additional shares of preferred stock could make it more difficult for a third party to acquire a majority of our outstanding voting stock and thereby effect a change in the composition of our Board of Directors. Our bylaws require advance notice of stockholder proposals and director nominations and permit only our President or a majority of the Board of Directors to call a special stockholder meeting. These provisions may have the effect of preventing or hindering attempts by our stockholders to replace our current management. In addition, our certificate of incorporation contains provisions that limit our ability to engage in a business combination with any holder of 15% or more of our capital stock unless, among other possibilities, the Board of Directors approves the transaction. These provisions may have the effect of preventing or hindering a change of control of our company.
Our stock has generally had low trading volume, and its public trading price has been volatile.
During the year ended December 31, 2012, the price of our common stock fluctuated between $0.87 and $2.13 per share, with an average daily trading volume for the year of approximately 27,991 shares. The market may experience significant price and volume fluctuations that are often unrelated to the operating performance of individual companies.
Our common stock may be delisted from the NASDAQ Global Market, which could negatively impact the price of our common stock and our ability to access capital markets.
Our common stock is listed on the NASDAQ Global Market. Should we fail to satisfy the continued listing requirements of the NASDAQ Global Market, our common stock could be delisted. The delisting of our common stock would significantly affect the ability of investors to trade our securities and would significantly negatively affect the value and liquidity of our common stock. In addition, the delisting of our common stock could materially adversely affect our ability to raise capital on terms acceptable to us or at all. Delisting from the NASDAQ Global Market could also have other negative results, including the potential loss of confidence by our suppliers, customers and employees, the loss of institutional investor interest, and fewer business development opportunities.
Item 1B. Unresolved Staff Comments
None.
Item 2. Properties
The Company is headquartered in Newark, Delaware, and occupies approximately 28,000 square feet of space under an operating lease expiring in December 2015. The Company also leases approximately 25,000 square feet of manufacturing and research space in Newark, Delaware, under an operating lease expiring in December 2014. Approximately 15,000 square feet in this facility is subleased to the acquirer of the Company’s Food Pathogen and AG-GMO products through December 31, 2013, with an option to extend the sublease through 2014. The leases for both facilities contain options extending the lease term through December 2016. The Company owns and occupies approximately 75,000 square feet of manufacturing, research and animal facility space and approximately 88 acres of farmland in Windham, Maine.
The Company made capital expenditures in 2012 for certain renovations and modifications to its facilities in Newark, Delaware. These renovations were designed to provide for larger and expanded research and development laboratory space to accommodate the GAT development and also to modernize the animal facility and insure that biosecurity measures are aligned with current industry practices to minimize and ameloriate the effect of animal diseases. The Company will engage in 2013 in certain renovations and modifications to relocate and upgrade its monoclonal antibody production facilities due to the sublease of space to the acquirer of the Food Pathogen and Ag-GMO product assets. As of the date of this report, the Company believes that its equipment and facilities are adequate for its present purposes. The Company’s inactive subsidiary, AZUR Environmental Limited, is the lessee for a real property lease located in the United Kingdom. In 2001, the landlord of the property gave AZUR Environmental Limited its consent to allow AZUR to assign the lease and its related obligations to a third party. As inducement to the landlord to grant the assignment, AZUR was required to guarantee performance under the original lease terms if the third party fails to perform. The lease term expires in November 2016 and provides for annual principal rent payments of approximately $150,000. The Company believes that based on its assessment of the current financial strength of the third party, no liability is required to be recorded with regard to the guarantee or lease obligation.
Item 3. Legal Proceedings
The Company is not a party to any material legal proceedings.
Item 4. Mine Safety Disclosures
Not applicable.
PART II
Item 5. Market for Registrant’s Common Equity, Related Stockholder Matters and Issuer Purchases of Equity Securities
The Company’s common stock is traded on The NASDAQ Global Market under the symbol “SDIX.” Set forth below are the quarterly high and low bid prices for the shares of common stock of the Company as reported by The NASDAQ Global Market without retail mark-up, mark-down or commission and may not necessarily represent actual transactions:
| | | | Common Stock | |
| | | | Price Range | |
| | Fiscal Year Ended | | High | | | Low | |
| | December 31, 2012: | | | | | | |
| | Fourth Quarter | | $ | 1.50 | | | $ | 0.87 | |
| | Third Quarter | | | 1.39 | | | | 1.19 | |
| | Second Quarter | | | 1.98 | | | | 0.95 | |
| | First Quarter | | | 2.13 | | | | 1.76 | |
| | | | | | | | | | |
| | December 31, 2011: | | | | | | | | |
| | Fourth Quarter | | $ | 2.11 | | | $ | 1.51 | |
| | Third Quarter | | | 2.44 | | | | 1.60 | |
| | Second Quarter | | | 2.78 | | | | 1.92 | |
| | First Quarter | | | 3.13 | | | | 1.70 | |
On March 26, 2013, there were approximately 3,400 holders (313 holders of record) of the common stock of the Company. The Company has never paid any cash dividends on its common stock.
Stock Performance Graph
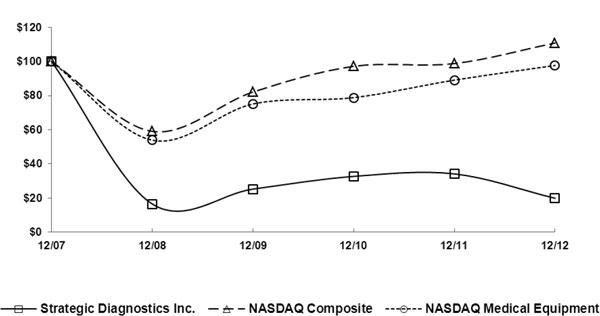
The following line graph compares for the fiscal years ended December 31, 2007 through 2012 (i) the yearly cumulative total shareholder return on the common stock with (ii) the cumulative total return of the NASDAQ Composite Index and with (iii) a Peer Group Index consisting of NASDAQ Medical Equipment Stocks.
COMPARISON OF 5 YEAR CUMULATIVE TOTAL RETURN*
Among Strategic Diagnostics Inc., the NASDAQ Composite Index,
and the NASDAQ Medical Equipment Index
| | *$100 invested on 12/31/07 in stock or index, including reinvestment of dividends. |
| | Fiscal year ending December 31. |
COMPARISON OF CUMULATIVE TOTAL RETURN
Strategic Diagnostics Inc., NASDAQ Composite Index and NASDAQ Medical Equipment Peer Group Index
| | | 12/07 | | 12/08 | | 12/09 | | 12/10 | | 12/11 | | 12/12 | |
| | | | | | | | | | | | | | |
| Strategic Diagnostics Inc. | | 100.00 | | 16.54 | | 25.28 | | 32.71 | | 34.20 | | 19.89 | |
| NASDAQ Composite | | 100.00 | | 59.10 | | 82.19 | | 97.23 | | 98.85 | | 110.91 | |
| NASDAQ Medical Equipment | | 100.00 | | 53.91 | | 75.19 | | 78.88 | | 89.14 | | 97.76 | |
Item 6. Selected Financial Data
| | | | | | | | | | | | | | | | |
| | | Year Ended December 31, |
| | | 2012 | | | 2011 | | | 2010 | | | 2009 | | | 2008 | |
| | | (in thousands, except share and per share data) | |
| Revenues | | $ | 15,071 | | | $ | 16,520 | | | $ | 15,436 | | | $ | 14,416 | | | $ | 14,024 | |
| Cost of sales | | | 7,533 | | | | 7,885 | | | | 7,066 | | | | 6,933 | | | | 6,890 | |
| Gross profit | | | 7,538 | | | | 8,635 | | | | 8,370 | | | | 7,483 | | | | 7,134 | |
| Operating expenses: | | | | | | | | | | | | | | | | | | | | |
| Research and development | | | 3,509 | | | | 3,271 | | | | 2,620 | | | | 2,062 | | | | 2,961 | |
| Selling, general and administrative | | | 11,197 | | | | 12,060 | | | | 12,079 | | | | 11,386 | | | | 12,019 | |
| Goodwill impairment | | | - | | | | - | | | | - | | | | - | | | | 3,548 | |
| Total operating expenses | | | 14,706 | | | | 15,331 | | | | 14,699 | | | | 13,448 | | | | 18,528 | |
| Operating loss | | | (7,168 | ) | | | (6,696 | ) | | | (6,329 | ) | | | (5,965 | ) | | | (11,394 | ) |
| Interest income (expense), net | | | (25 | ) | | | (33 | ) | | | (42 | ) | | | (15 | ) | | | 157 | |
| Loss from continuing operations before taxes | | | (7,193 | ) | | | (6,729 | ) | | | (6,371 | ) | | | (5,980 | ) | | | (11,237 | ) |
| Income tax expense (benefit) | | | 3 | | | | 29 | | | | (8 | ) | | | (112 | ) | | | 8,386 | |
| Loss from continuing operations | | | (7,196 | ) | | | (6,758 | ) | | | (6,363 | ) | | | (5,868 | ) | | | (19,623 | ) |
| Discontinued operations: | | | | | | | | | | | | | | | | | | | | |
| Income from discontinued operations, net of taxes | | | 1,656 | | | | 3,427 | | | | 5,400 | | | | 4,217 | | | | 3,828 | |
| Gain on sale of assets, net of taxes | | | 9,882 | | | | 3,033 | | | | - | | | | - | | | | - | |
| Income from discontinued operations, net of taxes | | | 11,538 | | | | 6,460 | | | | 5,400 | | | | 4,217 | | | | 3,828 | |
| | | | | | | | | | | | | | | | | | | | | |
| Net income (loss) | | $ | 4,342 | | | $ | (298 | ) | | $ | (963 | ) | | $ | (1,651 | ) | | $ | (15,795 | ) |
| Basic loss per share from continuing operations | | | (0.35 | ) | | | (0.33 | ) | | | (0.32 | ) | | | (0.29 | ) | | | (0.97 | ) |
| Basic income per share from discontinued operations | | | 0.56 | | | | 0.32 | | | | 0.27 | | | | 0.21 | | | | 0.19 | |
| Basic net income (loss) per share | | $ | 0.21 | | | $ | (0.01 | ) | | $ | (0.05 | ) | | $ | (0.08 | ) | | $ | (0.78 | ) |
| | | | | | | | | | | | | | | | | | | | | |
Shares used in computing basic net income (loss) per share | | | 20,534,047 | | | | 20,435,935 | | | | 20,251,534 | | | | 20,113,659 | | | | 20,312,707 | |
| | | | | | | | | | | | | | | | | | | | | |
| Diluted loss per share from continuing operations | | | (0.35 | ) | | | (0.33 | ) | | | (0.32 | ) | | | (0.29 | ) | | | (0.97 | ) |
| Diluted income per share from discontinued operations | | | 0.56 | | | | 0.32 | | | | 0.27 | | | | 0.21 | | | | 0.19 | |
| Diluted net income (loss) per share | | $ | 0.21 | | | $ | (0.01 | ) | | $ | (0.05 | ) | | $ | (0.08 | ) | | $ | (0.78 | ) |
| | | | | | | | | | | | | | | | | | | | | |
Shares used in computing diluted net income (loss) per share | | | 20,534,047 | | | | 20,435,935 | | | | 20,251,534 | | | | 20,113,659 | | | | 20,312,707 | |
| | | | | | | | | | | | | | | | | | | | | |
| | | December 31, | |
| | | 2012 | | | 2011 | | | 2010 | | | 2009 | | | 2008 | |
| | | | | | | | | | | | | | | | | | | | | |
| BALANCE SHEET DATA: | | | | | | | | | | | | | | | | | | | | |
| Cash and cash equivalents | | $ | 18,145 | | | $ | 10,665 | | | $ | 8,056 | | | $ | 7,937 | | | $ | 9,980 | |
| | | | | | | | | | | | | | | | | | | | | |
| Working capital | | | 20,599 | | | | 14,858 | | | | 14,514 | | | | 14,671 | | | | 14,233 | |
| | | | | | | | | | | | | | | | | | | | | |
| Total assets | | | 27,570 | | | | 22,622 | | | | 22,516 | | | | 23,225 | | | | 25,521 | |
| | | | | | | | | | | | | | | | | | | | | |
| Current portion of long-term debt | | | 47 | | | | 300 | | | | 400 | | | | 400 | | | | 1,658 | |
| Long-term debt | | | 191 | | | | - | | | | 300 | | | | 700 | | | | - | |
Stockholders’ equity | | | 25,110 | | | | 19,997 | | | | 19,704 | | | | 20,093 | | | | 21,248 | |
Item 7. Management’s Discussion and Analysis of Financial Condition and Results of Operations
Forward Looking Statements
This annual report contains certain forward-looking statements reflecting the current expectations of Strategic Diagnostics Inc. and its subsidiaries (the “Company” or “SDIX”). In addition, when used in this annual report, the words “anticipate,” “enable,” “estimate,” “intend,” “expect,” “believe,” “potential,” “may,” “will,” “should,” “project” and similar expressions as they relate to the Company are intended to identify said forward-looking statements. Investors are cautioned that all forward-looking statements involve risks and uncertainties, which may cause actual results to differ from those anticipated at this time. Such risks and uncertainties include, without limitation, changes in demand for products, delays in product development, delays in market acceptance of new products, retention of customers, attraction and retention of management and key employees, adequate supply of raw materials, inability to obtain or delays in obtaining third party approvals or required government approvals, the ability to meet increased market demand, competition, protection of intellectual property, non-infringement of intellectual property, seasonality, the ability to obtain financing and other factors more fully described in the Company’s public filings with the U.S. Securities and Exchange Commission.
Introductory Note
On April 5, 2013, SDIX, the Purchaser and OriGene entered into the Asset Purchase Agreement.
Pursuant to the terms and conditions of the Asset Purchase Agreement, the Purchaser will acquire all of the Company’s right, title, and interest in the Purchased Assets related exclusively to the Company’s life sciences business, the product portfolio in respect of which includes a full suite of integrated capabilities, including antibody and assay design, development and production and the Advanced Technologies Business. The Purchaser will also assume and agree to discharge the Assumed Liabilities, as defined in the Asset Purchase Agreement. Parent unconditionally guarantees Purchaser’s obligations in the Asset Purchase Agreement. The purchase price for the Purchased Assets is $16,000,000, which is subject to a post-closing working capital adjustment. The Company will retain the cash from the purchase price, less the escrow amount (described below) until such amount, if any, is released from escrow.
The Company and Purchaser each made customary representations, warranties and covenants in the Asset Purchase Agreement. At closing, $1,300,000 of the purchase price will be placed in escrow to be governed by the terms of a separate escrow agreement. The Asset Purchase Agreement contains indemnification provisions pursuant to which the Company and the Purchaser have agreed to indemnify the other for certain losses, including with respect to environmental, litigation, tax and other matters.
Customary covenants govern the time between the date of the Asset Purchase Agreement and the closing regarding conduct of the Business, access to information pertaining to the Business, confidentiality, publicity, and notification of certain events. The Asset Purchase Agreement also contains restrictive covenants, including, that the Company not (i) engage in a competing business for a period of five years after the closing date, (ii) directly or indirectly solicit Purchaser’s employees for a period of two years after the closing date, (iii) directly or indirectly solicit the Purchaser’s customers for a period of five years after the closing date and (iv) disparage the Purchaser at any time.
The closing will occur by August 31, 2013, unless otherwise agreed by the Company and Purchaser. The Asset Purchase Agreement may be terminated (i) by mutual written consent of the Company and the Purchaser, (ii) if closing does not occur on or before August 31, 2013, (iii) if stockholder approval is not obtained by the Company, (iv) if the Company receives a Superior Proposal, as defined in the Agreement, (v) by Purchaser if there has been a Material Adverse Effect, as defined in the Asset Purchase Agreement, and in other circumstances. The Company has agreed to pay the Purchaser a termination fee of $480,000 if, among other things, (i) stockholder approval is not obtained by the Company, (ii) the Company changes its recommendation to the stockholders or (iii) the Company accepts an Acquisition Proposal, as defined in the Asset Purchase Agreement, and a transaction is consummated within 12 months of termination of the Asset Purchase Agreement.
Except as otherwise indicated, the disclosure set forth in this Form 10-K does not give effect to the closing of the Asset Sale, which is subject to conditions as described above. Should the Asset Sale be consummated, the Company will no longer own its historical operating assets, and its past business operations will be discontinued.
Overview
SDIX is a biotechnology company with a core mission of developing, commercializing and marketing innovative and proprietary products, services and solutions that preserve and enhance the quality of human health and wellness.
The Company believes that its competitive position has been enhanced through the combination of talent, technology and resources resulting from the business development activities it has pursued since its inception. The Company has achieved meaningful economies of scale for the products it offers through the utilization of its consolidated facilities in Newark, Delaware and Windham, Maine for the manufacture of antibodies.
The Company believes that by applying its core competency of creating custom antibodies to assay development, it produces sophisticated diagnostic testing and reagent systems that are responsive to customer diagnostic and information needs. Customers benefit from a quantifiable “return on investment” by reducing time, labor and/or material costs associated with applications for which the Company’s products are used. In addition, the Company believes its tests provide high levels of accuracy, reliability and actionability of essential test results as compared to alternative products. The Company is focused on sustaining this competitive advantage by leveraging its expertise in immunology, proteomics, and other bio-reactive technologies to continue its successful customer-focused research and development efforts. The Company believes that an established product base, quality manufacturing expertise, experienced sales and marketing organization, established network of distributors, corporate partner relationships and proven research and development expertise will be critical elements of its potential future success.
The Company’s product portfolio includes a full suite of integrated capabilities including antibody and assay design, development and production. These capabilities, combined with our proprietary Genomic Antibody Technology™ (“GAT™”), are being used today to help discover the mechanisms of disease, facilitate the development of new drugs, and provide the means for rapid diagnosis. In 2011, the Company continued the transition from a fragmented product offering and marketing strategy to becoming a focused organization, with proven, proprietary technologies tied directly to its customers’ needs. The Company sold its Water Quality and Environmental products assets in 2011 and its Food Pathogen and AG-GMO products assets in 2012, as part of its overall strategy to focus on its core Life Science operations. Financial information of the Water Quality and Food/AG-GMO product groups has been separately reclassified within the consolidated financial statements as a discontinued operation. See Note 3 of the Notes to the Consolidated Financial Statements for further information.
The Company continued to develop multiple channels to market worldwide through an approach that includes direct sales, inside sales, distributors and agents.
Results of Operations
Year ended December 31, 2012 versus year ended December 31, 2011
Revenues
Revenues for the year ended December 31, 2012 decreased 9% to $15.1 million compared to $16.5 million for the year ended December 31, 2011. The decrease in revenues was primarily the result of a 32% decrease in sales to content/reseller customers as described below.
Sales to the Company’s content/reseller customers decreased 32% to $2.3 million. This decrease was primarily related to a change in the business strategy of the Company’s largest content customer that has reduced its use of the Company’s polyclonal services. Sales to the Company’s biopharma customers decreased 22% to $2.2 million. This decrease was primarily attributable to recent consolidation within the biopharma industry. Sales to the Company’s academic/government customers decreased 22% to $541,000. These decreases were offset by an increase in sales to the Company’s IVD customers of 5% to $10.1 million. Included in in-vitro diagnostics sales is $1.25 million related to the Becton Dickinson (BD) Diagnostics multiple-element arrangement as described in Note 2 to the accompanying financial statements, Revenue Recognition.
Gross profit
Gross profit decreased to $7.5 million for the year ended December 31, 2012 from $8.6 million for the year ended December 31, 2011. Gross margins decreased to 50% in 2012 compared to 52% in 2011. The decrease in margin was primarily attributable to the decreased level of sales in 2012.
Research and development
Research and development expenses were $3.5 million for the year ended December 31, 2012, compared to $3.3 million for the year ended December 31, 2011. This increase was primarily due to increased spending and third party collaboration efforts related to the Company’s proprietary GAT technology. Research and development expenses were 23% of revenues for the year ended December 31, 2012 versus 20% of revenues for the year ended December 31, 2011.
Selling, general and administrative
Selling, general and administrative expenses were $11.2 million for the year ended December 31, 2012, compared to $12.1 million for the year ended December 31, 2011. This decrease was primarily the result of reduced levels of personnel and related costs in the selling and marketing groups.
Interest expense, net
The Company recorded $25,000 in net interest expense for the year ended December 31, 2012 compared to $33,000 for the year ended December 31, 2011, due to lower levels of debt in 2012.
Income taxes
The Company recorded an income tax expense of $3,000 for the year ended December 31, 2012 compared to an income tax expense of $29,000 for the year ended December 31, 2011. The Company continues to have a full valuation allowance placed against all of its deferred tax assets.
Loss from continuing operations
Loss from continuing operations for the year ended December 31, 2012 was $7.2 million, or $0.35 per diluted share, compared to a loss from continuing operations of $6.8 million, or $0.33 per diluted share, for the year ended December 31, 2011. Diluted shares utilized in these computations were 20.5 million and 20.4 million for the 2012 and 2011 periods, respectively.
Income from discontinued operations
Income from the Company’s discontinued operations of its water and environmental, food pathogen and Ag-GMO products assets were $11.5 million for the year ended December 31, 2012, and included a $9.9 million gain on the sale of the food pathogen and Ag-GMO assets, compared to $6.5 million for the year ended December 31, 2011, which included a $3.0 million gain on the sale of the water and environmental products assets.. Income per share from discontinued operations was $0.56 per diluted share in the year ended December 31, 2012 compared to $0.32 per diluted share in the year ended December 31, 2011. Diluted shares utilized in these computations were 20.5 million and 20.4 million for the 2012 and 2011 periods, respectively.
Net Income (loss)
Net income was $4.3 million for the year ended December 31, 2012, or $0.21 per diluted share, compared to a net loss of $298,000, or $0.01 per diluted share, for the year ended December 31, 2011. Diluted shares utilized in these computations were 20.5 million and 20.4 million for 2012 and 2011, respectively.
Year ended December 31, 2011 versus year ended December 31, 2010
Revenues
Revenues for the year ended December 31, 2011 increased 7% to $16.5 million compared to $15.4 million for the year ended December 31, 2010. The increase in revenue was the result of a 13% increase in sales to IVD customers as described below.
Sales to the Company’s IVD customers increased 13% to $9.5 million for the year ended December 31, 2011. This increase was primarily due to one large customer purchasing in quantity to build a safety supply of material. Sales to the Company’s content/resellers customers increased 7% to $3.4 million, and sales to the Company’s biopharma customers increased 3% to $2.9 million. These increases were partially offset by a 26% decrease in sales to academic/government customers to $697,000. These changes continue to reflect the refocusing of the Company’s sales efforts on in-vitro diagnostics and biopharma customers and away from academic and government related customers.
Gross profit
Gross profit increased to $8.6 million for the year ended December 31, 2011 from $8.4 million for the year ended December 31, 2010. Gross margins decreased to 52% in 2011 compared to 54% in 2010. The decrease in margin was primarily attributable to higher levels of both personnel and materials cost.
Research and development
Research and development expenses were $3.3 million, or 20% of revenues, for the year ended December 31, 2011, compared to $2.6 million, or 17% of revenues, for the year ended December 31, 2010. This increase was primarily due to increased spending and third party collaboration efforts related to the Company’s proprietary GAT technology.
Selling, general and administrative
Selling, general and administrative expenses were $12.1 million for both years ended December 31, 2011 and 2010.
Interest expense, net
The Company recorded $33,000 in net interest expense for the year ended December 31, 2011 compared to net interest expense of $42,000 for the year ended December 31, 2010. This decrease is due primarily to lower levels of debt in the 2012 period.
Income taxes
The Company recorded an income tax expense of $29,000 for the year ended December 31, 2011 compared to an income tax benefit of $8,000 for the year ended December 31, 2010. The Company continues to have a full valuation allowance placed against all of its deferred tax assets.
Loss from continuing operations
Loss from continuing operations for the year ended December 31, 2011 was $6.8 million, or $0.33 per diluted share, compared to a loss from continuing operations of $6.4 million, or $0.32 per diluted share, for the year ended December 31, 2010. Diluted shares utilized in these computations were 20.4 million and 20.3 million for the 2011 and 2010 periods, respectively.
Income from discontinued operations
Income from the Company’s discontinued operations of its water and environmental, food pathogen and Ag-GMO product assets were $6.5 million for the year ended December 31, 2011, including a $3.0 million gain on sale of the water and environmental product assets, compared to $5.4 million for the year ended December 31, 2010. Income per share from discontinued operations was $0.32 per diluted share in the year ended December 31, 2011 compared to $0.27 per diluted share in the year ended December 31, 2010. Diluted shares utilized in these computations were 20.4 million and 20.3 million for 2011 and 2010, respectively.
Net loss
Net loss was $298,000 for the year ended December 31, 2011, or $0.01 per diluted share, compared to a net loss of $963,000, or $0.05 per diluted share, for the year ended December 31, 2010. Diluted shares utilized in these computations were 20.4 million and 20.3 million for 2011 and 2010, respectively.
Liquidity and Capital Resources
Liquidity is our ability to generate sufficient cash flows from operating activities to meet the Company’s obligations and commitments, or obtain appropriate financing. Currently our liquidity needs arise primarily from debt service on indebtedness, working capital requirements and capital expenditures.
| | | | | | Year Ended | | | | |
| | | | | | December 31, | | | | |
| | | 2012 | | | 2011 | | | 2010 | |
| | | | | | (in thousands) | | | | |
| Net cash provided by (used in) operating activities | | $ | (2,980 | ) | | $ | (692 | ) | | $ | 425 | |
| Net cash provided by (used in) investing activities | | | 10,447 | | | | 3,226 | | | | (522 | ) |
| Net cash provided by (used in) financing activities | | | (20 | ) | | | 80 | | | | 236 | |
| Effect of exchange rate changes on cash | | | 33 | | | | (5 | ) | | | (20 | ) |
| Net increase in cash and cash equivalents | | $ | 7,480 | | | $ | 2,609 | | | $ | 119 | |
Net cash used in operating activities in 2012 was primarily the result of the net loss for the year (exclusive of the gain on sale of the Food/Ag-GMO products asset sale), partially offset by non cash charges for depreciation, amortization and stock based compensation. For 2011, net cash used in operating activities primarily related to the net loss for the year, partially offset by non cash charges for depreciation, amortization and stock based compensation. For 2010, net cash provided by operating activities primarily related to non cash charges for depreciation, amortization and stock based compensation charges, which more than offset the net loss incurred for the year.
Net cash provided by investing activities for 2012 was $10.5 million compared to net cash provided by investing activities of $3.2 million for 2011 and net cash used in investing activities of $522,000 in 2010. The 2012 cash inflows were primarily the result of the sale of the Food/AG-GMO products assets to Romer Labs, the net proceeds of which were $12.1 million, partially offset by $1.6 million in cash outflows for capital expenditures. The 2011 cash inflows were primarily the result of the sale of the Water and Environmental products assets to Modern Water PLC, the net proceeds of which were $4.2 million, partially offset by $991,000 in cash outflows for capital expenditures. The cash outflows for investing in 2010 was primarily the result of capital asset purchases which were $532,000. The capital expenditures in 2012 and 2011 were primarily related to leasehold improvements made to the Company’s Delaware facilities and for the purchases of laboratory and manufacturing equipment. The capital expenditures in 2010 were primarily related to the purchase of computer and lab equipment.
Net cash used in financing activities was $20,000 in 2012, primarily related to the repayment of Company debt, partially offset by a reduction in the Company’s restricted cash requirement. Net cash provided by financing activities was $80,000 in 2011, primarily related to the exercise of stock options during the year. Net cash provided by financing activities was $236,000 for 2010, primarily related to a $550,000 reduction in the restricted cash requirement from the Company’s lender, partially offset by $400,000 in debt repayments.
The Company’s working capital (current assets less current liabilities) increased to $20.6 million at December 31, 2012, from $14.9 million at December 31, 2011. The increase was primarily due to increased cash and cash equivalents, primarily as the result of the sale of the Company’s Food/AG-GMO products assets. Outstanding debt decreased to $238,000 at December 31, 2012 from $300,000 at December 31, 2011, due to scheduled debt payments and the use of an equipment lease facility under which the Company financed $271,000 during the year. Outstanding debt decreased to $300,000 at December 31, 2011 from $700,000 at December 31, 2010 due to scheduled debt payments.
On March 26, 2012, the Company entered into a Master Equipment Lease agreement with a commercial bank (as amended November 14, 2012). The agreement is for a $500,000 revolving line of credit to lease equipment. The equipment leased has a distinct lease schedule under the agreement and provides for specific terms of payment related to that particular equipment lease. For accounting purposes, the leases are considered capital leases and accordingly are recorded as debt and amortized with an imputed interest rate according to the terms of the applicable equipment lease. All leases carry a one dollar buyout at lease end.
To date, the Company has borrowed $271,000 against this Master Lease agreement, which includes three separate leases, of which $238,000 is outstanding as of December 31, 2012. Each of the leases contains a 60 month term with an imputed interest rate of approximately 4.3%.
The Company has certain financial covenants to meet related to this Master Equipment Lease, including tangible net worth of not less than $15 million, minimum liquidity of $2 million and a requirement to maintain its primary banking accounts with the commercial bank. As of December 31, 2012, the Company was in compliance with all applicable loan covenants.
For the year ended December 31, 2012, the Company satisfied all of its cash requirements from cash and cash equivalents on-hand. At December 31, 2012, the Company had $238,000 in debt and stockholders’ equity of $25.1 million.
Based upon its cash and cash equivalents on hand, current product sales and the anticipated sales of new products, the Company believes it has, or has access to, sufficient resources to meet its operating requirements at least through the next 12 months. However, the Company believes that it would ultimately need to become profitable on an operating basis in order to continue to have such sufficient resources.
The Company’s ability to meet its long-term capital needs will depend on a number of factors, including compliance with existing and new loan covenants, the success of its current and future products, the focus and direction of its research and development program, competitive and technological advances, future relationships with corporate partners, government regulation, the Company’s marketing and distribution strategy, its successful sale of additional common stock and/or the Company successfully locating and obtaining other financing, and the success of the Company’s plan to make future acquisitions. Accordingly, no assurance can be given that the Company will be able to meet the long-term liquidity requirements that may arise from these inherent and similar uncertainties.
Off-Balance Sheet Arrangements
As of December 31, 2012, the Company did not have any off-balance sheet arrangements as defined in Item 304(a) (4) (ii) of Regulation S-K.
Contractual Obligations
The Company is committed to making cash payments in the future on two types of contracts: its long-term indebtedness and leases. The Company has no off-balance sheet debt or other such unrecorded obligations. Below is a schedule of the future payments that the Company was obligated to make based on agreements in place as of December 31, 2012.
| | | | | | | Payments Due by Year | | | | | | | | | |
| | | | | | | | | | | | | 2018 and | | | | |
| | | 2013 | | 2014 | | 2015 | | 2016 | | 2017 | | Beyond | | Total | |
| | | (in thousands) | | | | | | | | | |
| Long-term debt (1) | | $ | 47 | | | 53 | | | 56 | | | 58 | | | 24 | | | - | | | 238 | |
| Operating leases (2) | | $ | 859 | | | 879 | | | 590 | | | 177 | | | - | | | - | | | 2,505 | |
| Total contractual | | | | | | | | | | | | | | | | | | | | | | |
| cash obligations | | $ | 906 | | | 932 | | | 646 | | | 235 | | | 24 | | | - | | | 2,743 | |
| | (1) See Note 7 to the Consolidated Financial Statements for a discussion of long-term debt |
| | (2) See Note 10 to the Consolidated Financial Statements for a discussion of operating leases |
Critical Accounting Policies
The Company’s accounting policies are described in Note 2 of the Notes to the Consolidated Financial Statements. The Consolidated Financial Statements are prepared in conformity with U.S. generally accepted accounting principles (“GAAP”), which require the Company to make estimates and assumptions that affect the reported amounts of assets and liabilities and disclosures of contingent assets and liabilities at the date of the financial statements and the reported amounts of revenues and expenses during the year. On an on-going basis, the Company evaluates its estimates, including those related to bad debts, inventories, deferred taxes, long-lived assets and stock-based compensation. The Company bases its estimates on historical experience and on various other assumptions that the Company believes are reasonable under the circumstances. The results form the basis for making judgments about the carrying values of assets and liabilities that are not readily apparent from other sources. Actual results could differ from those estimates. The Company considers the following policies to be most critical in understanding the judgments that are involved in preparing the Consolidated Financial Statements and the uncertainties that could impact the consolidated results of operations, financial condition and cash flows.
Valuation of Accounts Receivable – Accounts receivable as of December 31, 2012 and December 31, 2011, were net of an allowance for doubtful accounts of $63,000 and $141,000, respectively. The recorded allowance is continually evaluated based on current market conditions, an analysis of customer-specific facts and circumstances, and the size and composition of the overall portfolio. The current state of the economy could cause longer sales cycles resulting in increased risk that outstanding balances could become uncollectible. If receivables are in dispute with the customer or otherwise deemed uncollectible, the corresponding amounts are written off and are charged against the allowance.
Valuation of Inventories – Inventories are valued at the lower of cost or market.
For inventories that consist primarily of lab supplies, bulk antibody serum and antibody products, cost is determined using the first in, first out method. Realization of inventories is dependent upon the successful marketing of our products. Judgments are made regarding the carrying value of inventory based on current market conditions. Market conditions may change depending upon competitive product introductions and customer demand. If market conditions change or if the introduction of new products by the Company impacts the market for previously released products, the Company may be required to write-down the cost of its inventory.
For inventories that consist of costs associated with the production of custom antibodies, cost is determined using the specific identification method. Realization of such inventories is dependent upon the successful completion of a project in accordance with customer specifications. Losses on projects in progress are recorded in the period such losses become probable and estimable.
Deferred Taxes – In assessing the realizability of deferred tax assets, management considers whether it is more likely than not that some portion or all of the deferred tax assets will not be realized. The ultimate realization of deferred tax assets is dependent upon the generation of future taxable income during the period in which those temporary differences become deductible. In making their assessment, management considers positive evidence, negative evidence, and possible tax planning strategies that could be implemented. Management also considers the future reversal of existing taxable temporary differences, recent earnings history, history of or potential for tax attributes such as net operating losses to expire and the ability to project future taxable income. The Company’s history of cumulative pre-tax losses from continuing operations over the most recent three-year period, including 2012, is significant negative evidence that is difficult to overcome. In light of this negative evidence, coupled with the current economic conditions, management has concluded that it is more likely than not that the Company will not realize the benefits of these tax deductible differences and has continued to provide a full valuation allowance offsetting its U.S. federal and state net deferred tax assets at December 31, 2012.
At December 31, 2012, the Company had approximately $4.7 million of net operating loss carryforwards for tax purposes, which have no expiration and which correspond to a $934,000 deferred tax asset, related to operations in the United Kingdom (“UK”). Management considered positive and negative indicators in concluding that a substantial valuation allowance of approximately $897,000 was necessary for the foreign deferred tax assets of $934,000. The positive indicators include the contribution to income before taxes by the foreign operations in the UK for 2012, 2011 and 2010, and the expected income before taxes in the UK for 2013 and 2014. The negative indicators include a history of substantial net operating losses in the UK, the lack of income before taxes until 2004 and limitations with regard to estimating income in the UK beyond 2014 resulting from a year-to-year evaluation of the future need for a UK subsidiary.
As of December 31, 2012, the Company had U.S. federal net operating loss carryforwards, including those of acquired companies, of approximately $11.0 million which begin to expire as follows:
| | | | Net Operating | |
| | | | Loss | |
| | Year | | (in thousands) | |
| | | | | |
| | 2022 | | $ | 1,222 | |
| | 2024 | | | 1,876 | |
| | 2025 | | | 3 | |
| | 2026 | | | 1 | |
| | 2027 | | | 1 | |
| | 2028 | | | 3,492 | |
| | 2029 | | | 2,501 | |
| | 2030 | | | 1,281 | |
| | 2031 | | | 601 | |
| | Total | | $ | 10,978 | |
Revenue Recognition — Revenues composed of sales of certain antibodies and immunochemical reagents are recognized upon the shipment of the product and transfer of title or when related services are provided. Revenues associated with such products or services are recognized when persuasive evidence of an order exists, shipment of product has occurred or services have been provided, the price is fixed or determinable, and collectability is reasonably assured. Management is required to make judgments based on actual experience about whether or not collectability is reasonably assured.
The Company enters into contracts related to the production of custom antibodies, which provide for the performance of defined tasks for a fixed price, with delivery of the product upon completion of production. The standard time to complete a project is typically longer than 30 days but less than 12 months and effort is expended over the life of the project. Revenues related to sales of custom antibody projects are recognized when a project’s specifications have been met and/or the related materials have been shipped.
Fees associated with products and services added on to a custom antibody project subsequent to delivery of the initial project are billed monthly and recognized as revenue as the services and other deliverables are provided.
The Company follows Accounting Standards Codification, (ASC) 605-25 “Revenue Recognition – Multiple-Element Arrangements” to determine the recognition of revenue under collaboration agreements that include multiple elements. The deliverables under these agreements are evaluated to determine if they have stand-alone value and revenue is allocated to the elements based upon their relative selling prices. Since the adoption of this standard, the Company has entered into one agreement with multiple-elements. During the year ended December 31, 2012, the Company recognized approximately $1.25 million in revenue related to this agreement, comprised of $816,000 for technology access fees, $385,000 for materials shipped and $49,000 for consulting services provided.
Valuation of Long-Lived Assets — Long-lived assets, such as property and equipment, and purchased intangibles subject to amortization, are reviewed for impairment whenever events or changes in circumstances indicate that the carrying amount of an asset may not be recoverable. Recoverability of assets to be held and used is measured by a comparison of the carrying amount of an asset to its estimated discounted future cash flows expected to be generated by the asset. If the carrying amount of an asset exceeds its estimated future cash flows, an impairment charge is recognized by the amount by which the carrying amount of the asset exceeds the fair value of the asset.
Share–Based Compensation — The Company accounts for share-based compensation in accordance with the fair value method of accounting, which requires the Company to measure all employee share–based compensation awards at the date of grant and recognize such expense in our consolidated financial statements.
The grant date fair value of the awards is recognized as compensation expense over the vesting period of the awards and is included in selling, general and administrative expenses. Management is required to make estimates and assumptions to determine the grant date fair value of stock options, including the expected term of stock options and the volatility of our stock price in the future. In addition, assumptions related to expected future forfeitures and performance-based vesting features all impact expense recognition. These assumptions have an impact on the valuation assigned to equity awards and the associated recognition of expense.
New Accounting Standards and Disclosures
In June 2011, the Financial Accounting Standards Board, (FASB) issued Accounting Standards Update (ASU) 2011-05 Comprehensive Income (Topic 220), Presentation of Comprehensive Income, which amends current comprehensive income guidance. This ASU increases the prominence of other comprehensive income in financial statements. Under this ASU, the Company has chosen to present the components of net income (loss) and comprehensive income (loss) in consecutive financial statements. The Company adopted the provisions of this guidance January 1, 2012, which resulted in adding the Consolidated Statements of Comprehensive Income (Loss) to our Consolidated Financial Statements.
Item 7A. Quantitative and Qualitative Disclosures About Market Risk
The Company has limited exposure to changing interest rates, and is currently not engaged in hedging activities. Interest on $238,000 of debt is at a fixed annual rate of interest of 4.3%.
The Company conducts operations in the United Kingdom. Changes in exchange rates between foreign countries and the U.S. dollar will affect the translation of financial results of foreign subsidiaries into U.S. dollars for purposes of recording the Company’s consolidated financial results. Historically, the effects of translation have not been material to the consolidated financial results.
Item 8. Financial Statements and Supplementary Data
The following consolidated financial statements and supplemental quarterly financial data of the Company and its subsidiaries are included as part of this Form 10-K:
| | |
| | Page |
| Management’s Report on Internal Control over Financial Reporting | 32 |
| Report of Independent Registered Public Accounting Firm | 33 |
| Consolidated Balance Sheets as of December 31, 2012 and 2011 | 34 |
| Consolidated Statements of Operations for each of the years in the three-year period ended December 31, 2012 | 35 |
| Consolidated Statements of Comprehensive Income (loss) for each of the years in the three-year period ended ended December 31, 2012 | 36 |
| Consolidated Statements of Stockholders’ Equity for each of the years in the three-year period ended December 31, 2012 | 37 |
| Consolidated Statements of Cash Flows for each of the years in the three-year period ended December 31, 2012 | 38 |
| Notes to Consolidated Financial Statements | 39 |
Item 9. Changes in and Disagreements with Accountants on Accounting and Financial Disclosure
None.
Item 9A. Controls and Procedures
(a) Evaluation of Disclosure Controls and Procedures
Our management, with the participation of our Chief Executive Officer and Chief Financial Officer, evaluated the effectiveness of our disclosure controls and procedures, as defined in Rule 13a-15(e) under the Securities Exchange Act of 1934, as amended, as of the end of the period covered by this report. Based upon that evaluation, the Chief Executive Officer and Chief Financial Officer concluded that our disclosure controls and procedures as of December 31, 2012, were effective to provide reasonable assurance that the information required to be disclosed by us in reports filed or submitted under the Securities Exchange Act of 1934, as amended, is (i) recorded, processed, summarized and reported within the time periods specified in the SEC’s rules and forms, and (ii) accumulated and communicated to our management, including our principal executive and financial officers, or persons performing similar functions, as appropriate to allow timely decisions regarding required disclosure.
(b) Change in Internal Control over Financial Reporting
No change in our internal control over financial reporting occurred during the quarter ended December 31, 2012 that has materially affected, or is reasonably likely to materially affect, our internal control over financial reporting.
Management’s Report on Internal Control over Financial Reporting
The report of management on our internal control over financial reporting is set forth on page 35 of this report and is incorporated herein by reference.
Item 9B. Other Information
None.
PART III
Item 10. Directors, Executive Officers and Corporate Governance
The applicable information set forth in the Company’s Definitive Proxy Statement is incorporated herein by reference.
Identification of Executive Officers and Certain Significant Employees
The executive officers of the Company, their positions with the Company, their ages and a brief biography for each are as follows:
| | | | | | | | |
| Name | | | Age | | | Position | |
| | | | | |
| Francis M. DiNuzzo | | 57 | | President and Chief Executive Officer |
| Kevin J. Bratton | | 64 | | VP – Finance, Chief Financial Officer and Corporate Secretary |
Francis M. DiNuzzo has served as President and Chief Executive Officer since October 13, 2008. Mr. DiNuzzo joined the Company in February 2008 as Executive Vice President – Marketing and Chief Commercial Officer, and on June 6, 2008, he was appointed interim President and Chief Executive Officer. Prior to joining SDIX, Mr. DiNuzzo spent 26 years at Agilent Technologies / Hewlett Packard. He began his career in research and development in 1981 and advanced through a series of functional management roles over the next 18 years. In 1999, Mr. DiNuzzo became General Manager of Agilent’s Chemical Solutions Business Unit where he had global responsibility for analytical equipment, consumables and service products serving the chemical, environmental, food and forensics markets. In 2001, Mr. DiNuzzo became General Manager of the Consumable and Services Business Unit, with global responsibility for all consumables and services across all Life Science and Chemical Analysis markets. In 2004, Mr. DiNuzzo became Vice President and General Manager of the Integrated Biology Solutions unit, a role where he formed a biotechnology business focused on Genomics, Proteomics and BioInformatics. Mr. DiNuzzo holds B.S and M.S. degrees in Engineering with a minor in Business Administration from the University of New Hampshire.
Kevin J. Bratton joined SDIX in June 2009 as Vice President – Finance and Chief Financial Officer. Mr. Bratton was Senior Vice President Business Operations for EUSA Pharma (USA), Inc. in Langhorne, Pennsylvania from May 2008 until May 2009. Mr. Bratton had been Senior Vice President and Chief Financial Officer of Cytogen Corporation in Princeton, New Jersey from November 2006 until its acquisition by EUSA Pharma, Inc. in May 2008. Mr. Bratton has over 35 years of experience in all phases of multinational financial operations across the healthcare, biotechnology and technology industries, including developing strategic plans and annual budgets as well as financing negotiations and merger & acquisition transactions. Prior to joining Cytogen, Mr. Bratton was Chief Financial Officer at Metrologic Instruments, Inc., a global technology company, from July 2002 until November 2006, where he directed the company’s finance operations during a period of significant growth in sales, net income, cash flow from operations, and working capital. Previously, Mr. Bratton began his career with the public accounting firm Touche Ross & Co. (now Deloitte & Touche LLP). He has a bachelor of science in business and accounting from Northeastern University.
Item 11. Executive Compensation
The applicable information set forth in the Company’s Definitive Proxy Statement is incorporated herein by reference.
Item 12. Security Ownership of Certain Beneficial Owners and Management and Related Stockholder Matters
The applicable information set forth in the Company’s Definitive Proxy Statement is incorporated herein by reference.
Equity Compensation
The table below presents certain information as of December 31, 2012 concerning securities issuable in connection with equity compensation plans that have been approved by the Company’s stockholders and that have not been approved by the Company’s stockholders.
| | | | | | | | | | | |
| Plan Category | | Number of securities to be issued upon exercise of outstanding options, warrants and rights (a) | | Weighted-average exercise price of outstanding options, warrants and rights (b) | | Number of securities remaining available for issuance under equity compensation plans (excluding securities reflected in column (a)) (c) | |
| Equity compensation plan approved by security holders | | | 2,533,793 | | $ | 2.10 | | | 2,710,538 | |
| | | | | | | | | | | |
| Equity compensation not approved by security holders | | | 81,250 | | $ | 1.49 | | | - | |
| | | | | | | | | | | |
| Total | | | 2,615,043 | | $ | 2.08 | | | 2,710,538 | |
The 81,25000 shares underlying options and unvested restricted shares granted under equity compensation not approved by security holders were granted in connection with the Company’s hiring, on June 1, 2009, of its Chief Financial Officer, Kevin Bratton. The grants to Mr. Bratton are 75,000 shares in a ten year non-qualified stock option grant at an exercise price of $1.50 per share, and 6,250 remaining restricted stock shares from an original grant of 25,000 shares with a price at issue of $1.39 per share.
The total securities to be issued, relate to 2,170,043 of stock options with a weighted average exercise price of $2.18 per share and 445,000 unvested restricted shares with a weighted average issue price of $1.60 per share.
Item 13. Certain Relationships and Related Transactions, and Director Independence
The applicable information set forth in the Company’s Definitive Proxy Statement is incorporated herein by reference.
Item 14. Principal Accounting Fees and Services
The applicable information set forth in the Company’s Definitive Proxy Statement is incorporated herein by reference.
PART IV
Item 15. Exhibits and Financial Statement Schedules
1. Financial Statements
(a) See the Consolidated Financial Statements which begin on page 33 of this report.
2. Financial Statement Schedules
Financial statement schedules are omitted because they are either not required or not applicable or the required information is reflected in the financial statements or notes thereto.
3. Exhibits
| | | | | |
| Exhibit | | | | |
| Number | | Description | | Reference |
| 2.1 | | Agreement and Plan of Merger among the Company, AZUR Acquisition Corp. and AZUR Environmental dated May 4, 2001 | | (1) |
| | | | | |
| 2.2 | | Asset Purchase Agreement, dated as of November 10, 2011, by and among Strategic Diagnostics Inc., a Delaware corporation, Modern Water Inc., a Delaware corporation, and MW Monitoring IP Limited, a limited liability company incorporated under the laws of England and Wales.@ | | (24) |
| | | | | |
| 2.3 | | Amendment No. 1 to Asset Purchase Agreement, dated as of December 8, 2011, by and among Strategic Diagnostics Inc., a Delaware corporation, Modern Water Inc., a Delaware corporation, and MW Monitoring IP Limited, a limited liability company incorporated under the laws of England and Wales.@. | | (25) |
| | | | | |
| 2.4 | | Asset Purchase Agreement, dated as of September 28, 2012 by and between Strategic Diagnostics Inc., a Delaware corporation and Romer Labs Technology, Inc., a Delaware corporation. | | (26) |
| | | | | |
| 3.1 | | Fourth Amended and Restated Certificate of Incorporation of the Company | | (2) |
| | | | | |
| 3.2 | | Amended and Restated Bylaws of the Company | | (2) |
| | | | | |
| 4.1 | | Forms of Warrants to Purchase Common Stock of the Company | | (2) |
| | | | | |
| 10.1 | | Stock Purchase Agreement among the Company and its outside directors and certain of their affiliates dated August 16, 2002 | | (12) |
| | | | | |
| 10.2 | | Demand Registration Rights Agreement among the Company and its outside directors and certain of their affiliates dated August 16, 2002 | | (12) |
| | | | | |
| 10.3 | | EnSys Environmental Products, Inc. 1993 Stock Incentive Plan* | | (3) |
| | | | | |
| 10.4 | | Amended and Restated EnSys Environmental Products, Inc. 1995 Stock Incentive Plan* | | (4) |
| | | | | |
| 10.5 | | EnSys Environmental Products, Inc. 401(k) Plan Adoption Agreement | | (3) |
| | | | | |
| 10.11 | | Agreement and Plan of Merger by and between EnSys and Strategic Diagnostics Inc. dated as of October 11, 1996 | | (2) |
| | | | | |
| 10.18 | | Industrial Lease dated October 26, 1993, by and between Tober & Agnew Properties, Inc. and Strategic Diagnostics Inc. | | |
| | | | | |
| 10.21 | | Lease agreement dated October 29, 1997 by and between Pencader Courtyard, L.P. and Strategic Diagnostics Inc. | | (7) |
| | | | | |
| 10.22 | | 1998 Employee Stock Purchase Plan | | (11) |
| | | | | |
| 10.23 | | 2000 Stock Incentive Plan* | | (17) |
| | Employment Agreement dated January 1, 1997 by and between James W. Stave and the Company* | | (14) |
| |
| 10.34 | | Amended and Restated Distribution Agreement, dated as of August 31, 2009, by and between the Registrant and the DuPont Qualicon division of E.I. du Pont de Nemours and Company+ | | (15) |
| | | | | |
| 10.35 | | Strategic Diagnostics Inc. Change of Control Severance Agreement* | | (16) |
| | | | | |
| 10.36 | | Agreement, dated as of March 12, 2008, by and among the Company and Steven R. Becker, BC Advisors, LLC, SRB Management, L.P. and Richard van den Broek | | (18) |
| | | | | |
| 10.38 | | Employment Agreement, dated as of October 13, 2008, between Strategic Diagnostics Inc. and Francis M. DiNuzzo* | | (20) |
| | | | | |
| 10.41 | | Separation Agreement, dated as of September 25, 2012, between Strategic Diagnostics Inc. and Klaus Lindpaintner.* | | (27) |
| 10.42 | | Form of Nonqualified Stock Option Agreement | | (23) |
| | | | | |
| 10.43 | | Form of Restricted Stock Grant Agreement | | (23) |
| | | | | |
| 21.1 | | Subsidiaries of the Company | | |
| | | | | |
| 23.1 | | Consent of KPMG LLP, Independent Registered Public Accounting Firm | | |
| | | | | |
| 31.1 | | Certifications of the Chief Executive Officer of Strategic Diagnostics Inc. required by Rule 13a-14(a) under the Securities Exchange Act of 1934 | | |
| | | | | |
| 31.2 | | Certifications of the Chief Financial Officer of Strategic Diagnostics Inc. required by Rule 13a-14(a) under the Securities Exchange Act of 1934 | | |
| | | | | |
| 32.1 | | Certification of Francis M. DiNuzzo pursuant to 18 U.S.C. Section 1350, as adopted pursuant to Section 906 of Sarbanes-Oxley Act of 2002 | | |
| | | | | |
| 32.2 | | Certification of Kevin J. Bratton pursuant to 18 U.S.C. Section 1350, as adopted pursuant to Section 906 of Sarbanes-Oxley Act of 2002 | | |
| (1) | Incorporated by reference to the designated exhibit of the Company’s 10-Q for the fiscal quarter ended September 30, 2001. |
| (2) | Incorporated by reference to the designated exhibit of the EnSys Registration Statement on Form S-4 (No. 333-17505) filed on December 9, 1996. |
| (3) | Incorporated by reference to the designated exhibit of the EnSys Registration Statement on Form S-1 (No. 33-68440) filed on September 3, 1993. |
| (4) | Incorporated by reference to Appendix F to the Joint Proxy Statement/Prospectus contained in the EnSys Registration Statement on Form S-4 (No. 333-17505) filed on December 9, 1996. |
| (5) | Incorporated by reference to the designated exhibit of the EnSys Form 10-K for the fiscal year ended December 31, 1994. |
| (6) | Incorporated by reference to the designated exhibit of the EnSys Form 10-Q for the fiscal quarter ended March 31, 1996. |
| (7) | Incorporated by reference to the designated exhibit of the Company’s Form 10-K for the fiscal year ended December 31, 1996. |
| (8) | Incorporated by reference to the designated exhibit of the Company’s Form 10-K for the fiscal year ended December 31, 1997. |
| (9) | Incorporated by reference to the identically numbered exhibit contained in the Company’s Form 8-K filed on May 26, 1999. |
| (10) | Incorporated by reference to the designated exhibit of the Company’s 10-Q for the fiscal quarter ended June 30, 2000. |
| (11) | Incorporated by reference to the designated exhibit of the Company’s Registration Statement on Form S-8 (No. 333- 68107) filed on November 30, 1998. |
| (12) | Incorporated by reference to the designated exhibit of the Company’s 10-Q for the fiscal quarter ended September 30, 2002. |
| (13) | Incorporated by reference to the designated exhibit of the Company’s Form 10-Q for the fiscal quarter ended September 30, 2003. |
| (14) | Incorporated by reference to the designated exhibit of the Company’s Form 10-K for the fiscal year ended December 31, 2004. |
| (15) | Incorporated by reference to the designated exhibit of the Company’s Form 10-Q for the fiscal quarter ended September 30, 2009, as amended. |
| Incorporated by reference to the designated exhibit of the Company’s Form 10-Q for the fiscal quarter ended September 30, 2005. |
| (17) | Incorporated by reference to Appendix A of the Company’s Definitive Proxy Statement filed with the Securities and Exchange Commission on March 24, 2004. |
| (18) | Incorporated by reference to Exhibit 99.1 of the Company’s Form 8-K filed March 18, 2008. |
| (19) | Incorporated by reference to Exhibit 99.1 of the Company’s Form 8-K filed June 6, 2008. |
| (20) | Incorporated by reference to Exhibit 99.1 of the Company’s Form 8-K filed October 16, 2008. |
| (21) | Incorporated by reference to Exhibit 99.1 of the Company’s Form 8-K filed December 9, 2008. |
| (22) | Incorporated by reference to Exhibit 10.1 of the Company’s Form 10-Q for the fiscal quarter ended March 31, 2009. |
| (23) | Incorporated by reference to the designated exhibit of the Company’s Form 10-k for the fiscal year ended December 31, 2009. |
| (24) | Incorporated by reference to Exhibit 99.1 of the Company’s Form 8-K filed November 16, 2011. |
| (25) | Incorporated by reference to Exhibit 99.1 of the Company’s Form 8-K filed December 13, 2011. |
| (26) | Incorporated by reference to Exhibit 2.1 of the Company’s Form 8-K filed October 22, 2012. |
| (27) | Incorporated by reference to Exhibit 99.1 of the Company’s Form 8-K filed October 1, 2012. |
| * | Management contract or compensatory plan. |
| + | Confidential treatment has been granted as to certain portions of this exhibit pursuant to Rule 24b-2 under the Securities Exchange Act of 1934, as amended. |
| @ | Schedules and similar attachments have been omitted pursuant to Item 601(b)(2) of Regulation S-K. The Company undertakes to furnish supplementally copies of any of the omitted schedules and exhibits upon request by the U.S. Securities and Exchange Commission. |
MANAGEMENT’S REPORT ON INTERNAL CONTROL OVER FINANCIAL REPORTING
Our management is responsible for establishing and maintaining adequate internal control over financial reporting for the Company. Internal control over financial reporting is a process designed to provide reasonable assurance regarding the reliability of financial reporting and the preparation of financial statements for external purposes in accordance with generally accepted accounting principles. Our system of internal control over financial reporting includes those policies and procedures that (i) pertain to the maintenance of records that, in reasonable detail, accurately and fairly reflect the transactions and dispositions of the assets of the Company; (ii) provide reasonable assurance that transactions are recorded as necessary to permit preparation of financial statements in accordance with generally accepted accounting principles, and that receipts and expenditures of the Company are being made only in accordance with authorizations of management and directors of the Company; and (iii) provide reasonable assurance regarding prevention or timely detection of unauthorized acquisition, use or disposition of the Company’s assets that could have a material effect on the financial statements.
Management performed an assessment of the effectiveness of our internal control over financial reporting as of December 31, 2012 based upon criteria in Internal Control — Integrated Framework issued by the Committee of Sponsoring Organizations of the Treadway Commission (“COSO”). Based on this assessment, management determined that the Company’s internal control over financial reporting was effective as of December 31, 2012, based on the criteria in Internal Control-Integrated Framework issued by COSO.
This annual report does not include an attestation report of the Company’s registered public accounting firm regarding internal control over financial reporting pursuant to the rules of the Securities and Exchange Commission that permit the Company to provide only management’s report in this annual report.
This report shall not be deemed “filed” for purposes of Section 18 of the Securities Exchange Act of 1934, as amended, or otherwise subject to the liability of that section. Further, this report shall not be deemed to be incorporated by reference into any filing under the Securities Act of 1933, as amended, or the Securities Exchange Act of 1934, as amended.
| /s/ Francis M. DiNuzzo | | /s/ Kevin J. Bratton |
| Francis M. DiNuzzo | | Kevin J. Bratton |
| President and Chief Executive Officer | Vice President – Finance and Chief |
| | | Financial Officer |
Dated: April 15, 2013
REPORT OF INDEPENDENT REGISTERED PUBLIC ACCOUNTING FIRM
Board of Directors and Stockholders
Strategic Diagnostics Inc.:
We have audited the accompanying consolidated balance sheets of Strategic Diagnostics Inc. and subsidiaries as of December 31, 2012 and 2011, and the related consolidated statements of operations, comprehensive income (loss), stockholders’ equity and cash flows for each of the years in the three-year period ended December 31, 2012. These consolidated financial statements are the responsibility of the Company’s management. Our responsibility is to express an opinion on these consolidated financial statements based on our audits.
We conducted our audits in accordance with the standards of the Public Company Accounting Oversight Board (United States). Those standards require that we plan and perform the audit to obtain reasonable assurance about whether the financial statements are free of material misstatement. An audit includes examining, on a test basis, evidence supporting the amounts and disclosures in the financial statements. An audit also includes assessing the accounting principles used and significant estimates made by management, as well as evaluating the overall financial statement presentation. We believe that our audits provide a reasonable basis for our opinion.
In our opinion, the consolidated financial statements referred to above present fairly, in all material respects, the financial position of Strategic Diagnostics Inc. and subsidiaries as of December 31, 2012 and 2011, and the results of their operations and their cash flows for each of the years in the three-year period ended December 31, 2012 in conformity with U.S. generally accepted accounting principles.
/s/ KPMG LLP
Baltimore, Maryland
April 15, 2013
STRATEGIC DIAGNOSTICS INC. AND SUBSIDIARIES
CONSOLIDATED BALANCE SHEETS
(in thousands, except share and per share data)
| | | | | | | |
| | | December 31, | | | December 31, | |
| | | 2012 | | | 2011 | |
| ASSETS | | | | | | |
| Current Assets : | | | | | | |
| Cash and cash equivalents | | $ | 18,145 | | | $ | 10,665 | |
| Restricted cash | | | - | | | | 300 | |
| Receivables, net | | | 2,276 | | | | 3,758 | |
| Inventories | | | 1,990 | | | | 2,142 | |
| Other current assets | | | 457 | | | | 618 | |
| Total current assets | | | 22,868 | | | | 17,483 | |
| | | | | | | | | |
| Property and equipment, net | | | 4,637 | | | | 3,890 | |
| Other assets | | | 28 | | | | 6 | |
| Deferred tax asset | | | 37 | | | | 36 | |
| Intangible assets, net | | | - | | | | 1,207 | |
| Total assets | | $ | 27,570 | | | $ | 22,622 | |
| | | | | | | | | |
LIABILITIES AND STOCKHOLDERS’ EQUITY | | | | | | | | |
| Current Liabilities : | | | | | | | | |
| Current portion of long-term debt | | $ | 47 | | | $ | 300 | |
| Accounts payable | | | 419 | | | | 556 | |
| Accrued expenses | | | 1,771 | | | | 1,769 | |
| Deferred revenue | | | 32 | | | | - | |
| Total current liabilities | | | 2,269 | | | | 2,625 | |
| | | | | | | | | |
| Long-term debt | | | 191 | | | | - | |
| | | | | | | | | |
| COMMITMENTS AND CONTINGENCIES (NOTE 9) | | | | | | | | |
| | | | | | | | | |
Stockholders’ Equity: | | | | | | | | |
| Preferred stock, $.01 par value, 20,920,648 shares authorized, no shares issued or outstanding | | | - | | | | - | |
Common stock, $.01 par value, 50,000,000 shares authorized, 21,467,700 and 21,000,960 issued at December 31, 2012 and December 31, 2011, respectively | | | 215 | | | | 210 | |
| Additional paid-in capital | | | 42,879 | | | | 42,146 | |
| Treasury stock, 406,627 common shares at cost at December 31, 2012 and December 31, 2011 | | | (555 | ) | | | (555 | ) |
| Accumulated deficit | | | (17,195 | ) | | | (21,537 | ) |
| Cumulative translation adjustments | | | (234 | ) | | | (267 | ) |
| Total stockholders’ equity | | | 25,110 | | | | 19,997 | |
| Total liabilities and stockholders’ equity | | $ | 27,570 | | | $ | 22,622 | |
The accompanying notes are an integral part of these statements.
STRATEGIC DIAGNOSTICS INC. AND SUBSIDIARIES
CONSOLIDATED STATEMENTS OF OPERATIONS
(in thousands, except share and per share data)
| | | Year Ended December 31, | |
| | | 2012 | | | 2011 | | | 2010 | |
| | | | | | | | | | |
| Revenues | | $ | 15,071 | | | $ | 16,520 | | | $ | 15,436 | |
| Cost of sales | | | 7,533 | | | | 7,885 | | | | 7,066 | |
| Gross profit | | | 7,538 | | | | 8,635 | | | | 8,370 | |
| | | | | | | | | | | | | |
| Operating expenses: | | | | | | | | | | | | |
| Research and development | | | 3,509 | | | | 3,271 | | | | 2,620 | |
| Selling, general and administrative | | | 11,197 | | | | 12,060 | | | | 12,079 | |
| Total operating expenses | | | 14,706 | | | | 15,331 | | | | 14,699 | |
| | | | | | | | | | | | | |
| Operating loss | | | (7,168 | ) | | | (6,696 | ) | | | (6,329 | ) |
| Interest income (expense), net | | | (25 | ) | | | (33 | ) | | | (42 | ) |
| Loss from continuing operations before taxes | | | (7,193 | ) | | | (6,729 | ) | | | (6,371 | ) |
| Income tax expense (benefit) | | | 3 | | | | 29 | | | | (8 | ) |
| Loss from continuing operations, net of taxes | | | (7,196 | ) | | | (6,758 | ) | | | (6,363 | ) |
| | | | | | | | | | | | | |
| Discontinued operations: | | | | | | | | | | | | |
| Income from discontinued operations | | | 1,656 | | | | 3,427 | | | | 5,400 | |
| Gain on sale of assets | | | 9,882 | | | | 3,033 | | | | - | |
| Income from discontinued operations | | | 11,538 | | | | 6,460 | | | | 5,400 | |
| Net income (loss) | | $ | 4,342 | | | $ | (298 | ) | | $ | (963 | ) |
| Basic loss per share from continuing operations | | $ | (0.35 | ) | | $ | (0.33 | ) | | $ | (0.32 | ) |
| Basic income per share from discontinued operations | | | 0.56 | | | | 0.32 | | | | 0.27 | |
| Basic net income (loss) per share | | $ | 0.21 | | | $ | (0.01 | ) | | $ | (0.05 | ) |
| Shares used in computing basic net income (loss) per share | | | 20,534,047 | | | | 20,435,935 | | | | 20,251,534 | |
| Diluted loss per share from continuing operations | | $ | (0.35 | ) | | $ | (0.33 | ) | | $ | (0.32 | ) |
| Diluted income per share from discontinued operation | | | 0.56 | | | | 0.32 | | | | 0.27 | |
| Diluted net income (loss) per share | | $ | 0.21 | | | $ | (0.01 | ) | | $ | (0.05 | ) |
| Shares used in computing diluted net income (loss) per share | | | 20,534,047 | | | | 20,435,935 | | | | 20,251,534 | |
The accompanying notes are an integral part of these statements.
STRATEGIC DIAGNOSTICS INC. AND SUBSIDIARIES
CONSOLIDATED STATEMENTS OF COMPREHENSVE INCOME (LOSS)
(in thousands)
| | | Year Ended December 31, | |
| | | 2012 | | | 2011 | | | 2010 | |
| | | | | | | | | | |
| Net income (loss) | | $ | 4,342 | | | $ | (298 | ) | | $ | (963 | ) |
| | | | | | | | | | | | | |
| Foreign currency translation adjustment | | | 33 | | | | (5 | ) | | | (20 | ) |
| | | | | | | | | | | | | |
| Comprehensive income (loss) | | $ | 4,375 | | | $ | (303 | ) | | $ | (983 | ) |
The accompanying notes are an integral part of these statements.
STRATEGIC DIAGNOSTICS INC. AND SUBSIDIARIES
CONSOLIDATED STATEMENTS OF STOCKHOLDERS’ EQUITY
| | | | | | | | | Additional | | | | | | | | | Cumulative | | | | |
| | | Preferred | | | Common | | | Paid-In | | | Treasury | | | Accumulated | | | Translation | | | | |
| | | Stock | | | Stock | | | Capital | | | Stock | | | Deficit | | | Adjustments | | | Total | |
| | | | | | | | | | | | | | | | | | | | | | |
| Balance January 1, 2010 | | $ | - | | | $ | 208 | | | $ | 40,958 | | | $ | (555 | ) | | $ | (20,276 | ) | | $ | (242 | ) | | $ | 20,093 | |
| | | | | | | | | | | | | | | | | | | | | | | | | | | | | |
| Net loss | | | - | | | | - | | | | - | | | | - | | | | (963 | ) | | | - | | | | (963 | ) |
| Currency translation adjustment | | | - | | | | - | | | | - | | | | - | | | | - | | | | (20 | ) | | | (20 | ) |
| Employee stock purchase plan | | | - | | | | - | | | | 32 | | | | - | | | | - | | | | - | | | | 32 | |
| Stock option exercises | | | - | | | | 1 | | | | 63 | | | | - | | | | - | | | | - | | | | 64 | |
| Stock-based compensation | | | - | | | | - | | | | 498 | | | | - | | | | - | | | | - | | | | 498 | |
| | | | | | | | | | | | | | | | | | | | | | | | | | | | | |
| Balance December 31, 2010 | | | - | | | | 209 | | | | 41,551 | | | | (555 | ) | | | (21,239 | ) | | | (262 | ) | | | 19,704 | |
| | | | | | | | | | | | | | | | | | | | | | | | | | | | | |
| Net loss | | | - | | | | - | | | | - | | | | - | | | | (298 | ) | | | - | | | | (298 | ) |
| Currency translation adjustment | | | - | | | | - | | | | - | | | | - | | | | - | | | | (5 | ) | | | (5 | ) |
| Employee stock purchase plan | | | - | | | | 1 | | | | 17 | | | | - | | | | - | | | | - | | | | 18 | |
| Stock option exercises | | | - | | | | - | | | | 64 | | | | - | | | | - | | | | - | | | | 64 | |
| Stock-based compensation | | | - | | | | - | | | | 514 | | | | - | | | | - | | | | - | | | | 514 | |
| | | | | | | | | | | | | | | | | | | | | | | | | | | | | |
| Balance December 31, 2011 | | | - | | | | 210 | | | | 42,146 | | | | (555 | ) | | | (21,537 | ) | | | (267 | ) | | | 19,997 | |
| | | | | | | | | | | | | | | | | | | | | | | | | | | | | |
| Net income | | | - | | | | - | | | | - | | | | - | | | | 4,342 | | | | - | | | | 4,342 | |
| Currency translation adjustment | | | - | | | | - | | | | - | | | | - | | | | - | | | | 33 | | | | 33 | |
| Employee stock purchase plan | | | - | | | | - | | | | 15 | | | | - | | | | - | | | | - | | | | 15 | |
| Stock-based compensation | | | - | | | | 5 | | | | 718 | | | | - | | | | - | | | | - | | | | 723 | |
| | | | | | | | | | | | | | | | | | | | | | | | | | | | | |
| Balance December 31, 2012 | | $ | - | | | $ | 215 | | | $ | 42,879 | | | $ | (555 | ) | | $ | (17,195 | ) | | $ | (234 | ) | | $ | 25,110 | |
The accompanying notes are an integral part of these statements.
STRATEGIC DIAGNOSTICS INC. AND SUBSIDIARIES
CONSOLIDATED STATEMENTS OF CASH FLOWS
(in thousands)
| | | Year Ended December 31, | |
| | | 2012 | | | 2011 | | | 2010 | |
| | | | | | | | | | |
| Cash Flows from Operating Activities : | | | | | | | | | |
| Net income (loss) | | $ | 4,342 | | | $ | (298 | ) | | $ | (963 | ) |
| Add: Income from discontinued operations, net of taxes | | | 11,538 | | | | 6,460 | | | | 5,400 | |
| Loss from continuing operations | | | (7,196 | ) | | | (6,758 | ) | | | (6,363 | ) |
| Adjustments to reconcile loss from continuing operations to net cash cash provided by (used in) operating activities : | | | | | | | | | | | | |
| Depreciation and amortization | | | 1,114 | | | | 1,221 | | | | 1,183 | |
| Stock-based compensation expense | | | 725 | | | | 517 | | | | 506 | |
| Deferred income taxes | | | (1 | ) | | | 1 | | | | 15 | |
| Gain on disposal of fixed assets | | | - | | | | - | | | | (8 | ) |
| (Increase) decrease in : | | | | | | | | | | | | |
| Receivables | | | 1,482 | | | | 618 | | | | (726 | ) |
| Inventories | | | (1,660 | ) | | | (771 | ) | | | 381 | |
| Other current assets | | | 161 | | | | (57 | ) | | | (10 | ) |
| Other assets | | | (22 | ) | | | 38 | | | | (33 | ) |
| Increase (decrease) in : | | | | | | | | | | | | |
| Accounts payable | | | (137 | ) | | | 65 | | | | (80 | ) |
| Accrued expenses | | | 2 | | | | 172 | | | | 211 | |
| Deferred revenue | | | 32 | | | | (24 | ) | | | (51 | ) |
| Net operating activities from discontinued operations | | | (9,018 | ) | | | (2,174 | ) | | | - | |
| Net cash provided by (used in) operating activities | | | (2,980 | ) | | | (692 | ) | | | 425 | |
| | | | | | | | | | | | | |
| Cash Flows from Investing Activities : | | | | | | | | | | | | |
| Purchase of property and equipment | | | (1,628 | ) | | | (991 | ) | | | (532 | ) |
| Proceeds from sale of assets | | | - | | | | - | | | | 10 | |
| Net proceeds from sale of discontinued operations | | | 12,075 | | | | 4,217 | | | | - | |
| Net cash provided by (used in) investing activities | | | 10,447 | | | | 3,226 | | | | (522 | ) |
| | | | | | | | | | | | | |
| Cash Flows from Financing Activities : | | | | | | | | | | | | |
| Proceeds from exercise of stock options | | | - | | | | 64 | | | | 64 | |
| Proceeds from employee stock purchase plan | | | 13 | | | | 16 | | | | 22 | |
| Restricted cash requirement | | | 300 | | | | 400 | | | | 550 | |
| Repayments on financing obligations | | | (333 | ) | | | (400 | ) | | | (400 | ) |
| Net cash provided by (used in) financing activities | | | (20 | ) | | | 80 | | | | 236 | |
| | | | | | | | | | | | | |
| Effect of exchange rate changes on cash | | | 33 | | | | (5 | ) | | | (20 | ) |
| | | | | | | | | | | | | |
| Net increase in cash and cash equivalents | | | 7,480 | | | | 2,609 | | | | 119 | |
| | | | | | | | | | | | | |
| Cash and Cash Equivalents, Beginning of Year | | | 10,665 | | | | 8,056 | | | | 7,937 | |
| | | | | | | | | | | | | |
| Cash and Cash Equivalents, End of Year | | $ | 18,145 | | | $ | 10,665 | | | $ | 8,056 | |
| | | | | | | | | | | | | |
| Supplemental Cash Flow Disclosure : | | | | | | | | | | | | |
| | | | | | | | | | | | | |
| Capital lease obligations | | $ | 271 | | | $ | - | | | $ | - | |
| | | | | | | | | | | | | |
| Cash paid (received) for taxes and tax refunds | | | 35 | | | | 14 | | | | (105 | ) |
| | | | | | | | | | | | | |
| Cash paid for interest | | | 30 | | | | 46 | | | | 69 | |
The accompanying notes are an integral part of these statements
STRATEGIC DIAGNOSTICS INC. AND SUBSIDIARIES
NOTES TO CONSOLIDATED FINANCIAL STATEMENTS
DECEMBER 31, 2012
(in thousands, except share and per share data)
1. SUBSEQUENT EVENTS
On April 5, 2013, the Company entered into an agreement to sell the assets of its Life Sciences business to OriGene Technologies, Inc. for $16.0 million. OriGene will acquire substantially all of the non-cash assets of SDIX and had agreed to offer employment to a substantial majority of the Company’s employees. The transaction is expected to be completed during the quarter ending June 30, 2013, subject to the approval of the Company’s shareholders and other customary closing conditions.
2. SUMMARY OF SIGNIFICANT ACCOUNTING POLICIES AND CERTAIN BALANCE SHEET INFORMATION
Business
Strategic Diagnostics Inc. and its subsidiaries (“SDIX” or the “Company”) is a biotechnology company with a core mission of developing, commercializing and marketing innovative and proprietary products, services and solutions that preserve and enhance the quality of human health and wellness.
The Company supplies products, custom services and critical reagents used across the life science research and development markets. The Company’s Genomic Antibody Technology® (“GAT”) is being used in proteomic research, disease understanding and drug/biomarker discovery among academic, biotech, in-vitro diagnostic and large pharmaceutical customers.
By applying its core competencies of creating proprietary antibodies and assay development, the Company has produced sophisticated testing and reagent systems that are responsive to each customer’s analytical information needs.
SDIX is a customer-centric organization. The Company’s goals are to consistently deliver increased value to its customers that facilitate their business results, reduce costs and help in the management of risk. SDIX sales professionals focus on delivering a quantifiable “return on investment” to their customers by reducing time and total costs associated with applications for which the Company’s products are used. In addition, the Company believes its tests provide high levels of accuracy and reliability, which deliver more actionable test results to the customer as compared to alternative products. The Company is focused on sustaining profitable growth by leveraging its expertise in antibodies and immuno-technologies to successfully develop proprietary products and services that enhance the competitive advantage of its customers.
The Company believes that its competitive position has been enhanced through the combination of talent, technology and resources resulting from the business development activities it has pursued since its inception. The Company has achieved meaningful economies of scale for the products it offers through the utilization of its facilities in Newark, Delaware and its facility in Windham, Maine for the manufacture of antibody products and services.
The continued economic downturn, including disruptions in the capital and credit markets, may continue indefinitely and intensify, and could adversely affect our results of operations, cash flows and financial condition or those of our customers and suppliers. These circumstances could adversely affect our access to liquidity needed to conduct or expand our business or conduct acquisitions or make other discretionary investments. These circumstances may also adversely impact the capital needs of our customers and suppliers, which, in turn, could adversely affect their ability to purchase our products or supply us with necessary equipment and raw materials. This could adversely affect our results of operations, cash flows and financial condition. A weakening business climate could cause longer sales cycles and slower growth, and could expose us to increased business or credit risk in dealing with customers or suppliers adversely affected by economic conditions. Our ability to collect accounts receivable may be delayed or precluded if our customers are unable to pay their obligations.
Basis of Presentation
The historical financial statements presented herein include the consolidated financial statements of Strategic Diagnostics Inc. and its subsidiaries. All significant intercompany balances and transactions have been eliminated in consolidation. The Company consummated the sale of its Water Quality and Environmental products assets in December 2011 and the sale of its Food Pathogens and AG-GMO products assets in October 2012. The financial information of the Water Quality and Environmental products as well as the Food Pathogens and AG-GMO products, have been separately reclassified within the consolidated financial statements as discontinued operations. See Note 3 for further information.
STRATEGIC DIAGNOSTICS INC. AND SUBSIDIARIES
NOTES TO CONSOLIDATED FINANCIAL STATEMENTS
DECEMBER 31, 2012
(in thousands, except share and per share data)
Foreign Currency Translation
The functional currency for the Company’s United Kingdom branch operation is the British pound. Assets and liabilities related to this foreign operation are translated at the current exchange rates at the end of each period. The resulting translation adjustments are accumulated as a separate component of stockholders’ equity. Revenues and expenses are translated at average exchange rates in effect during the period with foreign currency transaction gains and losses, if any, included in results of operations.
Use of Estimates
The preparation of the consolidated financial statements requires the management of the Company to make a number of estimates and assumptions relating to the reported amount of assets and liabilities and disclosure of contingent assets and liabilities at the date of the consolidated financial statements and the reported amounts of revenues and expenses during the period. These estimates include those made in connection with assessing the valuation of accounts receivable, inventories, deferred tax assets and long lived assets. Actual results could differ from those estimates.
Accounts Receivable
As of December 31, 2012 and 2011, the allowance for doubtful accounts was $63 and $141, respectively. If receivables are in dispute with the customer or otherwise deemed uncollectible, the Company’s policy is to charge these write-offs against the allowance. The Company continually reviews the realizability of its receivables and charges current period earnings for the amount deemed unrealizable. At December 31, 2012 and 2011, net accounts receivable were $2,276 and $3,758, respectively.
A summary of the activity in the allowance for doubtful accounts for the years ended December 31, 2012 and 2011 is as follows:
| | | 2012 | | | 2011 | |
| Balance, January 1 | | $ | 141 | | | $ | 78 | |
| | | | | | | | | |
| Adjustments to allowance for doubtful | | | | | | | | |
| accounts charged to costs and expenses | | | (3 | ) | | | 74 | |
| | | | | | | | | |
| Deductions-written off as uncollectible | | | (75 | ) | | | (11 | ) |
| | | | | | | | | |
| Balance, December 31 | | $ | 63 | | | $ | 141 | |
STRATEGIC DIAGNOSTICS INC. AND SUBSIDIARIES
NOTES TO CONSOLIDATED FINANCIAL STATEMENTS
DECEMBER 31, 2012
(in thousands, except share and per share data)
Inventories
The Company’s inventories are valued at the lower of cost or market. For inventories that consist primarily of lab supplies, bulk antibody serum and antibody products, cost is determined using the first in, first out method.
For inventories that consist of costs associated with the production of custom antibodies, cost is determined using the specific identification method. Realization of such inventories is dependent upon the successful completion of a project in accordance with customer specifications. Losses on projects in progress are recorded in the period such losses become probable.
At December 31, inventories consisted of the following:
| | | December 31,
2012 | | | December 31,
2011 | |
| | | | | | | |
| Raw materials | | $ | 692 | | | $ | 706 | |
| Work in progress | | | 1,023 | | | | 717 | |
| Finished goods | | | 275 | | | | 719 | |
| Inventories | | $ | 1,990 | | | $ | 2,142 | |
Property and Equipment
Property and equipment are stated at cost. Depreciation and amortization are computed using the straight-line method over the estimated useful lives (generally three to five years) of the assets. Leasehold improvements are depreciated over the shorter of the lease term or the estimated useful life.
Long-Lived Assets
Long-lived assets, such as property and equipment, and purchased intangibles subject to amortization, are reviewed for impairment whenever events or changes in circumstances indicate that the carrying amount of an asset may not be recoverable. Recoverability of assets to be held and used is measured by a comparison of the carrying amount of an asset to estimated undiscounted future cash flows expected to be generated by the asset. If the carrying amount of an asset exceeds its estimated future cash flows, an impairment charge is recognized in the amount by which the carrying amount of the asset exceeds the fair value of the asset.
Revenue Recognition
Revenues composed of sales of certain antibodies and immunochemical reagents are recognized upon the shipment of the product and transfer of title, or when related services are provided. Revenues associated with such products or services are recognized when persuasive evidence of an order exists, shipment of product has occurred or services have been provided, the price is fixed or determinable and, collectability is reasonably assured. Management is required to make judgments based on actual experience about whether or not collectability is reasonably assured.
The Company enters into contracts related to the production of custom antibodies, which provide for the performance of defined tasks for a fixed price, with delivery of the product upon completion of production. The standard time to complete a project is typically longer than 30 days but less than 12 months and effort is expended over the life of the project. Revenues related to sales of custom antibody projects are recognized when a project’s specifications have been met and/or the related materials have been shipped.
Fees associated with products and services added on to a custom antibody project subsequent to delivery of the initial project are billed monthly and recognized as revenue as the services and other deliverables are provided.
The Company follows Accounting Standards Codification, (ASC) 605-25 Revenue Recognition – Multiple-Element Arrangements to determine the recognition of revenue under collaboration agreements that include multiple elements. The deliverables under these agreements are evaluated to determine if they have stand-alone value and revenue is allocated to the elements based upon their relative selling prices. Since the adoption of this standard, the Company has entered into one agreement with multiple-elements. During the year ended December 31, 2012, the Company recognized approximately $1,250 in revenue related to this agreement, comprised of $816 for technology access fees, $385 for materials shipped and $49 for consulting services provided.
STRATEGIC DIAGNOSTICS INC. AND SUBSIDIARIES
NOTES TO CONSOLIDATED FINANCIAL STATEMENTS
DECEMBER 31, 2012
(in thousands, except share and per share data)
Stock-Based Compensation
The Company accounts for stock-based compensation using the fair value method, which requires that compensation costs related to employee share-based payment transactions are measured in the financial statements at fair value on the date of grant and are recognized over the vesting period of the award.
Research and Development
Research and development costs are charged to expense as incurred.
Accounting for Income Taxes
Deferred income tax assets and liabilities are determined based on the differences between the financial statement and tax basis of assets and liabilities and are measured using the enacted tax rates and laws that will be in effect when the differences are expected to reverse. The measurement of deferred tax assets is reduced, if necessary, by a valuation allowance for any tax benefits which are not expected to be realized. The effect on deferred income tax assets and liabilities of a change in tax rates is recognized in the period that such changes are enacted.
The Company utilizes a recognition threshold and measurement attribute for the financial statement recognition and measurement of a tax position taken or expected to be taken in a tax return. As a result of the implementation of authoritative guidance related to the accounting for uncertainty in income taxes, the Company recognizes in its financial statements the impact of a tax position if that position is more likely than not of being sustained on audit, based on the technical merits of the position. The authoritative guidance also provides guidance on derecognition, classification, interest and penalties, accounting in interim periods and disclosure. The Company includes interest and penalties related to unrecognized tax benefits as a component of income tax expense. See Note 12 for further information.
Basic and Diluted Loss per Share
Basic loss per share (EPS) is computed by dividing net income or loss available for common stockholders by the weighted-average number of common shares outstanding during the period. Diluted EPS is similar to basic EPS, except that the dilutive effect of converting or exercising all potentially dilutive securities is also included in the denominator. The Company’s calculation of diluted EPS includes the dilutive effect of exercising stock options into common shares and the inclusion of unvested restricted stock awards. Basic loss per share excludes potentially dilutive securities. For the years 2012, 2011 and 2010, conversion of stock options and unvested restricted shares totaling 445,280, 329,740 and 231,045, respectively, into common share equivalents were excluded from this calculation because they were anti-dilutive, due to the net losses recorded in the periods.
STRATEGIC DIAGNOSTICS INC. AND SUBSIDIARIES
NOTES TO CONSOLIDATED FINANCIAL STATEMENTS
DECEMBER 31, 2012
(in thousands, except share and per share data)
Listed below are the basic and diluted share calculations for the years ended December 31, 2012, 2011 and 2010:
| | | 2012 | | | 2011 | | | 2010 | |
| | | | | | | | | | |
| Weighted average common shares outstanding | | | 20,534,047 | | | | 20,435,935 | | | | 20,251,534 | |
| | | | | | | | | | | | | |
Shares used in computing basic net loss per share | | | 20,534,047 | | | | 20,435,935 | | | | 20,251,534 | |
| | | | | | | | | | | | | |
Dilutive effect of stock options and unvested restricted stock awards | | | - | | | | - | | | | - | |
| | | | | | | | | | | | | |
Shares used in computing diluted net loss per share | | | 20,534,047 | | | | 20,435,935 | | | | 20,251,534 | |
Treasury Stock
Shares of common stock repurchased by the Company are recorded at cost as treasury stock in the stockholders’ equity section of the consolidated balance sheet, and as a use of cash in the financing activities section of the consolidated statement of cash flows.
Comprehensive Income (Loss)
Comprehensive income (loss) is comprised of net income (loss) and currency translation adjustments and is presented in the consolidated statements of comprehensive income (loss).
Statements of Cash Flows
The Company considers all highly liquid instruments purchased with an original maturity of three months or less to be cash equivalents.
New Accounting Pronouncements
In June 2011, the Financial Accounting Standards Board, (FASB) issued Accounting Standards Update (ASU) 2011-05 Comprehensive Income (Topic 220), Presentation of Comprehensive Income, which amends current comprehensive income guidance. This ASU increases the prominence of other comprehensive income in financial statements. Under this ASU, the Company has chosen to present the components of net income (loss) and comprehensive income (loss) in consecutive financial statements. The Company adopted the provisions of this guidance January 1, 2012, which resulted in adding the Consolidated Statements of Comprehensive Income (Loss) to our Consolidated Financial Statements.
3. DISCONTINUED OPERATIONS
On October 16, 2012, the Company completed the sale of its Food Pathogens and AG-GMO products assets to Romer Labs for approximately $12,075, net of transaction fees. These assets included intellectual property, inventory, commercial contracts and equipment. The Company recognized a gain on the sale of these assets, after transaction fees, of $9,882.
The Company may receive additional consideration of up to $600 if it is able to meet certain conditions by April 30, 2013 as provided for in the Asset Purchase Agreement. Any such additional consideration will be recorded as a gain on sale of assets as it is received.
STRATEGIC DIAGNOSTICS INC. AND SUBSIDIARIES
NOTES TO CONSOLIDATED FINANCIAL STATEMENTS
DECEMBER 31, 2012
(in thousands, except share and per share data)
On December 8, 2011, the Company completed the sale of its water and environmental products assets to Modern Water PLC for approximately $4,217, net of transaction fees. These assets included intellectual property, inventory, commercial contracts and equipment. The Company recognized a gain on the sale of these assets, after transaction fees, of $3,033.
In accordance with ASC 360, the results of operations and cash flow activity of the water and environmental products and the food pathogens and AG-GMO products were reclassified separately as discontinued operations within the consolidated financial statements for all periods presented. The following table presents key information associated with the operating results of the discontinued operation for the reporting periods included in the Company’s 2012, 2011 and 2010 consolidated statements of operations:
| Results of Operations of Discontinued Operations | | | | | | | | | |
| | | | | | | | | | |
| | | Year Ended December 31, |
| | | 2012 | | | 2011 | | | 2010 | |
| | | | | | | | | | |
| Revenues | | $ | 5,616 | | | $ | 11,040 | | | $ | 12,913 | |
| | | | | | | | | | | | | |
| Cost of sales | | | 2,049 | | | | 4,226 | | | | 4,715 | |
| Gross profit | | | 3,567 | | | | 6,814 | | | | 8,198 | |
| | | | | | | | | | | | | |
| Operating expenses: | | | | | | | | | | | | |
| Research and development | | | 324 | | | | 463 | | | | 457 | |
| Selling, general and administrative | | | 1,587 | | | | 2,924 | | | | 2,349 | |
| Gain on sale of assets | | | (9,882 | ) | | | (3,033 | ) | | | (8 | ) |
| Total operating expenses (income) | | | (7,971 | ) | | | 354 | | | | 2,798 | |
| | | | | | | | | | | | | |
| Operating income | | | 11,538 | | | | 6,460 | | | | 5,400 | |
| | | | | | | | | | | | | |
| Income tax expense (benefit) | | | - | | | | - | | | | - | |
| Income from discontinued operations | | $ | 11,538 | | | $ | 6,460 | | | $ | 5,400 | |
For comparative purposes, items from discontinued operations in the Company’s 2011 Consolidated Balance Sheet include approximately $1,305 of accounts receivable, $1,021 of inventory, $41 of net property, plant and equipment and $1,207 for the Food Pathogens and AG-GMO products intangible assets.
STRATEGIC DIAGNOSTICS INC. AND SUBSIDIARIES
NOTES TO CONSOLIDATED FINANCIAL STATEMENTS
DECEMBER 31, 2012
(in thousands, except share and per share data)
4. PROPERTY AND EQUIPMENT
As of December 31, property and equipment consisted of the following:
| | | 2012 | | | 2011 | |
| Equipment | | $ | 8,281 | | | $ | 7,217 | |
| Building improvements | | | 4,175 | | | | 4,117 | |
| Furniture and fixtures | | | 233 | | | | 206 | |
| Land | | | 1,452 | | | | 1,452 | |
| Leasehold improvements | | | 1,983 | | | | 1,408 | |
| Total property and equipment | | | 16,124 | | | | 14,400 | |
| | | | | | | | | |
| Less - accumulated depreciation and amortization | | | (11,487 | ) | | | (10,510 | ) |
| Net property and equipment | | $ | 4,637 | | | $ | 3,890 | |
Depreciation expense was $1,029, $1,107 and $1,069 in 2012, 2011 and 2010, respectively.
5. INTANGIBLE ASSETS
As of December 31, intangible assets consisted of the following:
| | | 2012 | | | 2011 | | | Lives | |
| Intangible assets | | $ | - | | | $ | 2,614 | | | 2-20 | |
| Less - accumulated amortization | | | - | | | | (1,407 | ) | | | | |
| Net intangible assets | | $ | - | | | $ | 1,207 | | | | | |
The Company’s intangible assets, primarily the technology acquired from Molecular Circuitry Inc.(“MCI”) related to proprietary growth media used in the Company’s food pathogens test kits, was sold as part of the sale of the Food Pathogens and AG-GMO products to Romer Labs in October 2012.
A former director and shareholder of the Company was a majority shareholder of MCI. MCI was to receive royalties from the Company until July 2012 however in the third quarter of 2010 the Company settled all future obligations with MCI for a one-time payment of $220. Royalties paid to MCI in 2010 were $110.
Amortization of those intangible assets was on a straight line basis over their useful lives and was $85, $114 and $114 in 2012, 2011 and 2010, respectively.
STRATEGIC DIAGNOSTICS INC. AND SUBSIDIARIES
NOTES TO CONSOLIDATED FINANCIAL STATEMENTS
DECEMBER 31, 2012
(in thousands, except share and per share data)
6. ACCRUED EXPENSES
As of December 31, accrued expenses consisted of the following:
| | | 2012 | | | 2011 | |
| | | | | | | |
| Royalties | | $ | 36 | | | $ | 54 | |
| Compensation | | | 1,153 | | | | 1,283 | |
| Professional fees | | | 287 | | | | 168 | |
| Purchases | | | 295 | | | | 264 | |
| Total accrued expenses | | $ | 1,771 | | | $ | 1,769 | |
7. LONG-TERM DEBT
On March 26, 2012, the Company entered into a Master Equipment Lease agreement with a commercial bank (as amended November 14, 2012). The agreement is for a $500 revolving line of credit to lease equipment. The equipment leased has a distinct lease schedule under the agreement and provides for specific terms of payment related to that particular equipment lease. For accounting purposes, the leases are considered capital leases and accordingly are recorded as debt and amortized with an imputed interest rate according to the terms of the applicable equipment lease. All leases carry a one dollar buyout at lease end.
To date, the Company has borrowed $271 against this Master Lease agreement, which includes three separate leases, of which $238 is outstanding as of December 31, 2012. Each of the leases contains a 60 month term with an imputed interest rate of approximately 4.3%.
The Company has certain financial covenants to meet related to this Master Equipment Lease, including tangible net worth of not less than $15,000, minimum liquidity of $2,000 and a requirement to maintain its primary banking accounts with the commercial bank. As of December 31, 2012, the Company was in compliance with all applicable loan covenants.
The following table is a schedule of the principal payments required under the Company’s long-term indebtedness:
| 2013 | | $ | 47 | |
| 2014 | | | 53 | |
| 2015 | | | 56 | |
| 2016 | | | 58 | |
| 2017 | | | 24 | |
| | | | | |
| Total debt | | $ | 238 | |
Future expected interest payments in addition to principle payments are expected to be $23. Interest expense was $29, $44 and $67 in 2012, 2011 and 2010, respectively.
STRATEGIC DIAGNOSTICS INC. AND SUBSIDIARIES
NOTES TO CONSOLIDATED FINANCIAL STATEMENTS
DECEMBER 31, 2012
(in thousands, except share and per share data)
8. SHARE-BASED COMPENSATION
Under various plans, executives, key employees and outside directors receive awards of options to purchase common stock. The Company has a stock option plan (the “2000 Plan”) which authorizes the granting of incentive and nonqualified stock options and restricted stock awards. Incentive stock options are granted at not less than 100% of fair market value at the date of grant (110% for stockholders owning more than 10% of the Company’s common stock). Nonqualified stock options are granted at not less than 85% of fair market value at the date of grant. A maximum of 8,000,000 shares of common stock are issuable under the 2000 Plan. Certain additional options have been granted outside the 2000 Plan. These options generally follow the provisions of the 2000 Plan. The Company issues new shares to satisfy option exercises and the vesting of restricted stock awards.
The Company also has an Employee Stock Purchase Plan (the “ESPP”). The ESPP allows eligible full-time employees to purchase shares of common stock at 90 percent of the lower of the fair market value of a share of common stock on the first or last day of the quarter. Eligible employees are provided the opportunity to acquire Company common stock during each quarter. No more than 661,157 shares of common stock may be issued under the ESPP. Such stock may be unissued shares or treasury shares of the Company or may be outstanding shares purchased in the open market or otherwise on behalf of the ESPP. For financial reporting purposes, the Company’s ESPP is compensatory. Therefore, the Company is required to recognize compensation expense related to the discount from market value of shares sold under the ESPP.
Share-based compensation expense recorded in 2012, 2011 and 2010 is summarized as follows:
| | | 2012 | | | 2011 | | | 2010 | |
| | | | | | | | | | | | | |
| Stock options | | $ | 386 | | | $ | 396 | | | $ | 320 | |
| Employee stock purchase plan | | | 2 | | | | 3 | | | | 8 | |
| Restricted stock awards and restricted stock units | | | 337 | | | | 118 | | | | 178 | |
| | | | | | | | | | | | | |
| Total share-based compensation expense | | $ | 725 | | | $ | 517 | | | $ | 506 | |
The deferred income tax benefit related to share-based compensation expense for the years ended December 31, 2012, 2011 and 2010 was $0 due to the full valuation allowance recorded against deferred tax assets (see Note 11). Share-based compensation expense is a component of selling, general and administrative expense, and is recorded as a non-cash expense in the operating activities section of the consolidated statement of cash flows.
STRATEGIC DIAGNOSTICS INC. AND SUBSIDIARIES
NOTES TO CONSOLIDATED FINANCIAL STATEMENTS
DECEMBER 31, 2012
(in thousands, except share and per share data)
Information with respect to the stock options granted under the 2000 Plan and options granted separately from the 2000 Plan is summarized as follows:
| | | Number
of Shares | | | Price Range | | Weighted Average Remaining
Contractual term | | Aggregate
Instrinsic
Value | |
| | | | | | | | | | | | | | | | | | | |
| Balance, Jauary 1, 2010 | | | 1,701,800 | | | $ | 1.10 | | - | | | $ | 6.94 | | | | | |
| Granted | | | 674,852 | | | $ | 1.10 | | - | | | $ | 1.50 | | | | | |
| Exercised | | | (42,500 | ) | | $ | 1.50 | | - | | | $ | 1.50 | | | | | |
| Cancelled / forfeited | | | (175,246 | ) | | $ | 1.10 | | - | | | $ | 6.94 | | | | | |
| | | | | | | | | | | | | | | | | | | |
| Balance, December 31, 2010 | | | 2,158,906 | | | $ | 1.10 | | - | | | $ | 5.17 | | | | | |
| Granted | | | 795,400 | | | $ | 1.85 | | - | | | $ | 2.25 | | | | | |
| Exercised | | | (40,000 | ) | | $ | 1.50 | | - | | | $ | 2.09 | | | | | |
| Cancelled / forfeited | | | (488,512 | ) | | $ | 1.10 | | - | | | $ | 5.17 | | | | | |
| | | | | | | | | | | | | | | | | | | |
| Balance, December 31, 2011 | | | 2,425,794 | | | $ | 1.49 | | - | | | $ | 4.65 | | | | | |
| Granted | | | 739,500 | | | $ | 1.60 | | - | | | $ | 2.10 | | | | | |
| Cancelled / forfeited | | | (995,251 | ) | | $ | 1.50 | | - | | | $ | 4.56 | | | | | |
| | | | | | | | | | | | | | | | | | | |
| Balance, December 31, 2012 | | | 2,170,043 | | | $ | 1.49 | | - | | | $ | 4.65 | | 6.7 years | | $ | - | |
| Vested and exercisable at | | | | | | | | | | | | | | | | | | | |
| December 31, 2012 | | | 1,216,743 | | | $ | 1.49 | | - | | | $ | 4.65 | | 5.6 years | | $ | - | |
| Expected to vest as of | | | | | | | | | | | | | | | | | | | |
| December 31, 2012 | | | 2,089,213 | | | $ | 1.49 | | - | | | $ | 4.65 | | 6.7 years | | $ | - | |
As of December 31, 2012, options covering 1,216,743 shares were exercisable with a weighted average exercise price of $2.34 per share, and 2,710,538 shares were available for future grant under the 2000 Plan.
As of December 31, 2012, there was $570 of unrecognized compensation expense related to non-vested stock options that is expected to be recognized over a weighted average period of 2.4 years.
The total aggregate intrinsic value of options exercised during the years ended December 31, 2012, 2011 and 2010 was $0, $40 and $6, respectively. Cash received from the exercises during the years ended December 31, 2012, 2011 and 2010 was $0, $64 and $64, respectively and are included within the financing activity section of the consolidated statements of cash flows.
The weighted average fair value at the date of grant for options granted during 2012, 2011 and 2010 was estimated at $0.80, $1.07 and $0.83 per share, respectively, using the Black-Scholes pricing model. The weighted-average assumptions used in the Black-Scholes model were as follows: dividend yield of 0%, expected volatility of 48% in 2012, 50% in 2011 and 51% in 2010, risk-free interest rate of 1.13% in 2012, 2.32% in 2011 and 2.51% in 2010 and expected option life of 6 years in each of the years ended December 31, 2012, 2011 and 2010. The expected option life was computed using the sum of the average vesting period and the contractual life of the option and dividing by 2, for all periods presented.
STRATEGIC DIAGNOSTICS INC. AND SUBSIDIARIES
NOTES TO CONSOLIDATED FINANCIAL STATEMENTS
DECEMBER 31, 2012
(in thousands, except share and per share data)
The following table provides additional information about the Company’s stock options outstanding at December 31, 2012:
| | | | | | | | Options Outstanding | | | Options Exercisable | |
| | | | | | | | | | | Weighted Average | | | | | | | Wtd. Average | |
| Range of | | | Number of | | | Remaining | | Exercise | | | Number of | | | | Exercise | |
| Exercise Prices | | | Shares | | | Contractual Life | | Price | | | Shares | | | | Price | |
| | | | | | | | | | | | | | | | | | | | | | | | |
| $ | 1.49 | | - | | $ | 2.51 | | | | 1,840,902 | | | 7.3 | | Years | | | $ | 1.85 | | | | 887,602 | | | | $ | 1.73 | |
| $ | 3.05 | | - | | $ | 3.57 | | | | 81,300 | | | 1.6 | | Years | | | $ | 3.51 | | | | 81,300 | | | | $ | 3.51 | |
| $ | 3.69 | | - | | $ | 4.65 | | | | 247,841 | | | 4.2 | | Years | | | $ | 4.17 | | | | 247,841 | | | | $ | 4.17 | |
| $ | 1.49 | | - | | $ | 4.65 | | | | 2,170,043 | | | 6.7 | | Years | | | $ | 2.18 | | | | 1,216,743 | | | | $ | 2.34 | |
The Company grants restricted stock awards (RSA) which is the right to receive shares. The fair value of RSAs is based on the market price for the stock at the date of grant. RSAs generally vest over periods of two to five years.
The following table summarizes the changes in non-vested restricted stock units for the three year period ending December 31, 2012:
| | | | | | Weighted Average | | | | | |
| | | | | | Grant Date | | | Aggregate | | |
| | | Shares | | | Fair Value | | | Intrinsic Value | | |
| | | | | | | | | | | |
| Non-vested RSAs at January 1, 2010 | | | 206,026 | | | $ | 1.77 | | | | | |
| Granted | | | 87,500 | | | $ | 1.59 | | | | | |
| Vested | | | (139,476 | ) | | $ | 1.52 | | | | | |
| Cancelled / forfeited | | | (18,300 | ) | | $ | 1.46 | | | | | |
| | | | | | | | | | | | | |
| Non-vested RSAs at December 31, 2010 | | | 135,750 | | | $ | 1.95 | | | | | |
| Granted | | | 42,500 | | | $ | 2.17 | | | | | |
| Vested | | | (54,500 | ) | | $ | 2.54 | | | | | |
| Cancelled / forfeited | | | (7,500 | ) | | $ | 1.49 | | | | | |
| | | | | | | | | | | | | |
| Non-vested RSAs at December 31, 2011 | | | 116,250 | | | $ | 1.78 | | | | | |
| Granted | | | 752,500 | | | $ | 1.99 | | | | | |
| Vested | | | (127,500 | ) | | $ | 2.54 | | | | | |
| Cancelled / forfeited | | | (296,250 | ) | | $ | 1.75 | | | | | |
| | | | | | | | | | | | | |
| Non-vested RSAs at December 31, 2012 | | | 445,000 | | | $ | 1.60 | | | $476 | | |
| | | | | | | | | | | | | |
| Expected to vest at December 31, 2012 | | | 403,125 | | | $ | 1.60 | | | $431 | | |
STRATEGIC DIAGNOSTICS INC. AND SUBSIDIARIES
NOTES TO CONSOLIDATED FINANCIAL STATEMENTS
DECEMBER 31, 2012
(in thousands, except share and per share data)
The Company recorded compensation expense of $337, $118 and $178, respectively for the years ended December 31, 2012, 2011 and 2010, for RSAs. This expense is a component of selling, general and administrative expenses, and is recorded as a non-cash expense in the operating activities section of the consolidated statement of cash flows. As of December 31, 2012, 403,125 of the above non-vested RSAs are expected to vest and there is approximately $578 of unrecognized compensation expense related to non-vested RSAs that are expected to vest over a weighted average of 2.5 years.
The Company also issued 410,000 performance-based Restricted Stock Units (“RSUs”) during the year ended December 31, 2012, of which 200,000 have been forfeited. The fair value of an RSU is equal to the market value of a share of stock on the date of grant. The performance-based RSUs vest based upon the achievement of certain goals related to the Company’s senior management team, for periods ranging from June 30, 2012 through December 31, 2015. Unless forfeited, the performance-based RSUs will be paid out in the form of stock, if the Company meets the performance targets. If the designated performance targets are not met, no payout will be made. As of December 31, 2012, performance related to 85,000 RSUs has been met, and these shares are included in the Restricted Stock summary above. No expense has been recognized for the remaining awards as the probability of achieving the targets is currently assessed as not probable.
The Company also issued 315,000 performance-based Restricted Stock Units (“RSUs”) during the year ended December 31, 2011, of which 50,000 have been forfeited. The performance-based RSUs vest based upon the achievement of certain revenue targets. 50% of the RSUs vest upon the achievement of certain revenue growth targets during any 12-month period prior to December 31, 2012, and any remaining unvested RSUs vest upon the achievement of certain revenue growth targets during any 12-month period prior to December 31, 2014. No expense has been recognized for these awards as the probability of achieving the targets is currently assessed as not probable.
9. GEOGRAPHIC AND CUSTOMER INFORMATION
The Company develops and manufactures antibodies and provides services related to custom antibody production. These antibodies and related services are sold to medical diagnostic and pharmaceutical companies and research institutions.
Geographic:
The following table sets forth revenues by geographic region:
| | | Year Ended December 31, | |
| | | 2012 | | | 2011 | | | 2010 | |
| | | | | | | | | | |
| United States | | $ | 12,882 | | | $ | 14,450 | | | $ | 12,472 | |
| Rest of the world | | | 2,189 | | | | 2,070 | | | | 2,964 | |
| Total | | $ | 15,071 | | | $ | 16,520 | | | $ | 15,436 | |
The Company’s basis for identifying sales by country is the ship-to location. There were no individual countries outside of the United States that represented more than 10% of the total revenues of the Company. There are no significant long-lived assets located outside the United States.
Revenue from the Company’s two largest customers was 9.6% and 9.5% of total revenue in 2012, 13.2% and 10.7% of total revenue in 2011 and 14.3% and 11.3% of total revenue in 2010.
STRATEGIC DIAGNOSTICS INC. AND SUBSIDIARIES
NOTES TO CONSOLIDATED FINANCIAL STATEMENTS
DECEMBER 31, 2012
(in thousands, except share and per share data)
10. COMMITMENTS AND CONTINGENCIES
The Company leases its office and manufacturing facilities and other equipment under operating leases. Rent expense for the years ended December 31, 2012, 2011 and 2010, was $895, $949 and $968, respectively. Future commitments under non-cancelable leases at December 31, 2012 are as follows:
| 2013 | | $ | 859 | |
| 2014 | | | 879 | |
| 2015 | | | 590 | |
| 2016 | | | 177 | |
| 2017 and thereafter | | | - | |
| | | $ | 2,505 | |
The Company’s subsidiary, AZUR Environmental Limited, is the lessee for a real property lease located in the United Kingdom. In 2001, the landlord of the property gave AZUR Environmental Limited its consent to allow AZUR to assign the lease and its related obligations to a third party. As inducement to the landlord to grant the assignment, AZUR was required to guarantee performance under the original lease terms if the third party fails to perform. The lease term expires in November 2016 and provides for annual principal rent payments of approximately $150 per year in the aggregate and these amounts have been included in the table above.
The Company is subject to various claims arising in the ordinary course of business. Although the ultimate outcome of these matters is presently not determinable, management does not believe that the outcome of these matters will have a material adverse effect on the Company’s financial position or results of operations.
11. RETIREMENT SAVINGS PLAN
The Company maintains a retirement savings plan qualified under Section 401(k) of the Internal Revenue Code. The plan allows for eligible employees to contribute a portion of their gross wages to the plan. The Company matches employees’ contributions on a 100% basis up to 1% of gross wages and on a 50% basis up to the next 5% of gross wages. In 2012, 2011 and 2010, the Company recognized expense of $252, $285 and $254, respectively, associated with this plan.
STRATEGIC DIAGNOSTICS INC. AND SUBSIDIARIES
NOTES TO CONSOLIDATED FINANCIAL STATEMENTS
DECEMBER 31, 2012
(in thousands, except share and per share data)
12. INCOME TAXES
The components of income (loss) from continuing operations before tax expense as of December 31 are as follows:
| | | 2012 | | | 2011 | | | 2010 | |
| | | | | | | | | | |
| United States | | $ | (7,258 | ) | | $ | (6,269 | ) | | $ | (5,892 | ) |
| Rest of the world | | | 65 | | | | (460 | ) | | | (479 | ) |
| Total | | $ | (7,193 | ) | | $ | (6,729 | ) | | $ | (6,371 | ) |
The income tax expense (benefit) from continuing operations consists of the following:
| | | | | 2012 | | | 2011 | | | 2010 | |
| | | | | | | | | | | | |
| Federal | current | | | $ | - | | | $ | 27 | | | $ | (23 | ) |
| | deferred | | | | - | | | | - | | | | - | |
| | | | | | - | | | | 27 | | | | (23 | ) |
| State | current | | | | - | | | | - | | | | - | |
| | deferred | | | | - | | | | - | | | | - | |
| | | | | | - | | | | - | | | | - | |
| Foreign | current | | | | 3 | | | | - | | | | - | |
| | deferred | | | | - | | | | 2 | | | | 15 | |
| | | | | | 3 | | | | 2 | | | | 15 | |
| Total | | | | $ | 3 | | | $ | 29 | | | $ | (8 | ) |
The following table summarizes the significant differences between the U.S. Federal statutory rate and the Company’s effective tax rate for financial statement purposes on income from continuing operations:
| | | 2012 | | | 2011 | | | 2010 | |
| | | | | | | | | | |
| Statutory tax rate | | | 34.0 | % | | | 34.0 | % | | | 34.0 | % |
| Expiring federal net operating losses | | | - | | | | (8.7 | ) | | | (53.8 | ) |
| Valuation allowance, federal | | | 20.2 | | | | 6.8 | | | | 44.7 | |
| Valuation allowance related to discontinued operations | | | (54.5 | ) | | | (32.1 | ) | | | (23.8 | ) |
| Stock compensation expense | | | (0.8 | ) | | | (2.5 | ) | | | (2.8 | ) |
| Research and development credits | | | 1.7 | | | | 2.8 | | | | 3.3 | |
| Other, net | | | (0.6 | ) | | | (1.0 | ) | | | (1.4 | ) |
| | | | | | | | | | | | | |
| Total | | | 0.0 | % | | | (0.7 | %) | | | 0.2 | % |
STRATEGIC DIAGNOSTICS INC. AND SUBSIDIARIES
NOTES TO CONSOLIDATED FINANCIAL STATEMENTS
DECEMBER 31, 2012
(in thousands, except share and per share data)
Significant components of the Company’s deferred tax assets as of December 31 are as follows:
| | | 2012 | | | 2011 | |
| | | | | | | |
| | | | | | | |
| Net operating loss carryforwards | | $ | 4,930 | | | $ | 6,636 | |
| Credit carryforwards | | | 1,299 | | | | 1,187 | |
| Amortization and depreciation | | | 2,615 | | | | 2,883 | |
| Deferred compensation | | | 442 | | | | 253 | |
| Non-deductible reserves | | | 342 | | | | 255 | |
| Inventory costs not currently deductible | | | 334 | | | | 367 | |
| | | | | | | | | |
| Total deferred tax assets | | | 9,962 | | | | 11,581 | |
| Valuation allowance | | | (9,925 | ) | | | (11,545 | ) |
| | | | | | | | | |
| Net deferred tax assets | | $ | 37 | | | $ | 36 | |
For the year ended December 31, 2012, the Company recorded income tax expense of $3. Foreign tax expense of $3 represents tax on interest income earned in the UK.
Overall, the valuation allowance for deferred tax assets decreased during 2012 by $1,620. The valuation allowance was decreased by $3,920 related to net operating losses utilized by income from discontinued operations, which was offset by an increase in the valuation allowance of $2,300 related to the net operating loss generated by continuing operations during 2012.
FASB ASC 740, Accounting for Income Taxes (“FASB ASC 740”), requires a company to evaluate its deferred tax assets on a regular basis to determine if a valuation allowance against the net deferred tax assets is required. Pursuant to FASB ASC 740, a cumulative pre-tax loss in recent years is significant negative evidence that is difficult to overcome in considering whether deferred tax assets are more likely than not realizable. The Company has evaluated the possibility of potential tax planning strategies and determined that none currently exist that the Company would conclude are prudent and feasible. The Company has concluded, based upon the evaluation of all available evidence, that it is more likely than not that the U.S. federal and state net deferred tax assets will not be realized and has recorded a full valuation allowance on its U.S. federal and state net deferred tax assets, as of December 31, 2012.
At December 31, 2012, the Company had approximately $4,700 of net operating loss carryforwards for tax purposes which have no expiration related to operations in the United Kingdom (“UK”). Management considered positive and negative indicators, as well as potential tax planning strategies, and has concluded that a substantial valuation allowance of approximately $897 was necessary for the foreign deferred tax assets of approximately $934. The positive indicators include the contribution to income before taxes by the foreign operations in the UK for 2012, 2011 and 2010, and the forecasted income before taxes in the UK for 2013 and 2014. The negative indicators include a history of substantial net operating losses in the UK, the lack of income before taxes prior to 2004, limited income before taxes in the recent years and limitations with regard to estimating income in the UK beyond 2014 resulting from a year-to-year evaluation of the future need for a UK subsidiary.
STRATEGIC DIAGNOSTICS INC. AND SUBSIDIARIES
NOTES TO CONSOLIDATED FINANCIAL STATEMENTS
DECEMBER 31, 2012
(in thousands, except share and per share data)
At December 31, 2012, the Company had U.S. federal net operating loss carryforwards of approximately $10,978 including those of acquired companies, which will expire as follows:
| | | Net Operating | |
| | | Loss | |
| Year | | (in thousands) | |
| | | | |
| 2022 | | $ | 1,222 | |
| 2024 | | | 1,876 | |
| 2025 | | | 3 | |
| 2026 | | | 1 | |
| 2027 | | | 1 | |
| 2028 | | | 3,492 | |
| 2029 | | | 2,501 | |
| 2030 | | | 1,281 | |
| 2031 | | | 601 | |
| Total | | $ | 10,978 | |
The above includes net operating losses of $662 which, if realized, would be accounted for as additional paid in capital and excludes $1,190 related to unrecognized tax benefits.
The Tax Reform Act of 1986 (the “Act”) limits the annual use of net operating loss and income tax credit carryforwards (after certain ownership changes, as defined by the Act). The application of these limits could significantly restrict the Company’s ability to utilize these carryforwards. Certain of the Company’s total net operating loss carryforwards from 2001 and prior years are subject to limitations on their annual use since a cumulative change in ownership of more than 50% has occurred within a three-year period with respect to those net operating loss carryforwards. The Company is currently evaluating recent changes in ownership and has determined that no limitations on net operating carryforwards exist for the years expiring 2028 through 2031 (tax years 2008 through 2011). If it is determined that an ownership change of more than 50% within a three-year period did occur for prior years, as determined pursuant to the Internal Revenue Code and Regulations, substantially all the net operating loss carryforwards and income tax credit carryforwards expiring through 2027 could be subject to annual limitations on usage. Because U.S. tax laws limit the time period during which these carryforwards may be applied against future taxable income, the Company may not be able to take full advantage of these attributes for federal and state income tax purposes due to the annual limitation usage.
The Company has federal research and experimentation credit carryforwards of $1,074, net of $119 related to unrecognized tax benefits, as of December 31, 2012, which are set to expire in years 2021 through 2032. The Company also has federal alternative minimum tax credit carryforwards of $6 which have indefinite lives.
STRATEGIC DIAGNOSTICS INC. AND SUBSIDIARIES
NOTES TO CONSOLIDATED FINANCIAL STATEMENTS
DECEMBER 31, 2012
(in thousands, except share and per share data)
For the year ended December 31, 2012, the Company increased its unrecognized tax benefits by $36.
The following table is a reconciliation of the gross unrecognized tax benefits during the years ended December 31:
| | | 2012 | | | 2011 | | | 2010 | |
| | | | | | | | | | |
| Gross unrecognized tax benefits as of January 1 | | $ | 554 | | | $ | 540 | | | $ | 510 | |
| | | | | | | | | | | | | |
| Increases from positions taken in prior periods | | | - | | | | 1 | | | | - | |
| Decreases from positions taken in prior periods | | | - | | | | (26 | ) | | | (6 | ) |
| Increases from positions taken in current period | | | 36 | | | | 39 | | | | 36 | |
| | | | | | | | | | | | | |
| Gross unrecognized tax benefits as of December 31 | | $ | 590 | | | $ | 554 | | | $ | 540 | |
The unrecognized tax benefits at December 31, 2012 of $590, if recognized in a period where there was not a full valuation allowance, would affect the effective tax rate.
The Company is subject to U.S. federal and UK income tax, as well as income taxes of multiple state jurisdictions.
The Company recognizes accrued interest expense and penalties related to uncertain tax benefits that have resulted in a refund or reduction of income taxes paid. Unrecognized tax benefits aggregating $584 would reduce already existing net operating loss and tax credit carryforwards and therefore require no accrual for interest or penalty in any of the years 2012, 2011 or 2010. The remaining unrecognized tax benefit of $6 include diminimus interest and penalty where required.
For federal purposes, post-1992 tax years remain open to examination as a result of net operating loss carryforwards. For state purposes, the statute of limitations remains open in a similar manner for states that have generated net operating losses. The Company does not expect that the total amount of unrecognized tax benefits related to positions taken in prior periods will change significantly during the next twelve months.
��
STRATEGIC DIAGNOSTICS INC. AND SUBSIDIARIES
NOTES TO CONSOLIDATED FINANCIAL STATEMENTS
DECEMBER 31, 2012
(in thousands, except share and per share data)
13. QUARTERLY FINANCIAL DATA (unaudited)
| | | | | | Three Months Ended, | | | | |
| | | March 31 | | | June 30 | | | September 30 | | | December 31 | |
| | | (In thousands except per share data) |
| 2012 | | | | | | | | | | | | |
| Revenues | | $ | 3,980 | | | $ | 3,635 | | | $ | 3,995 | | | $ | 3,461 | |
| Gross profit | | | 2,283 | | | | 1,753 | | | | 1,910 | | | | 1,592 | |
| | | | | | | | | | | | | | | | | |
| Loss from continuing operations | | | (1,506 | ) | | | (2,115 | ) | | | (1,720 | ) | | | (1,855 | ) |
| Income from discontinued operations | | | 309 | | | | 659 | | | | 690 | | | | 9,880 | |
| Net income (loss) | | | (1,197 | ) | | | (1,456 | ) | | | (1,030 | ) | | | 8,025 | |
| | | | | | | | | | | | | | | | | |
| Basic loss per share from continuing operations | | | (0.07 | ) | | | (0.10 | ) | | | (0.09 | ) | | | (0.09 | ) |
| Basic income per share from discontinued operations | | | 0.01 | | | | 0.03 | | | | 0.03 | | | | 0.49 | |
| Basic net income (loss) per share | | | (0.06 | ) | | | (0.07 | ) | | | (0.06 | ) | | | 0.40 | |
| | | | | | | | | | | | | | | | | |
| Diluted loss per share from continuing operations | | | (0.07 | ) | | | (0.10 | ) | | | (0.09 | ) | | | (0.09 | ) |
| Diluted income per share from discontinued operations | | | 0.01 | | | | 0.03 | | | | 0.03 | | | | 0.49 | |
| Diluted net income (loss) per share | | | (0.06 | ) | | | (0.07 | ) | | | (0.06 | ) | | | 0.40 | |
| | | | | | | | | | | | | | | | | |
| 2011 | | | | | | | | | | | | | | | | |
| Revenues | | $ | 4,497 | | | $ | 4,154 | | | $ | 4,084 | | | $ | 3,785 | |
| Gross profit | | | 2,343 | | | | 2,317 | | | | 2,292 | | | | 1,683 | |
| | | | | | | | | | | | | | | | | |
| Loss from continuing operations | | | (1,577 | ) | | | (1,597 | ) | | | (1,558 | ) | | | (2,026 | ) |
| Income from discontinued operations | | | 919 | | | | 940 | | | | 864 | | | | 3,737 | |
| Net income (loss) | | | (658 | ) | | | (657 | ) | | | (694 | ) | | | 1,711 | |
| | | | | | | | | | | | | | | | | |
| Basic loss per share from continuing operations | | | (0.08 | ) | | | (0.08 | ) | | | (0.07 | ) | | | (0.10 | ) |
| Basic income per share from discontinued operations | | | 0.05 | | | | 0.05 | | | | 0.04 | | | | 0.18 | |
| Basic net income (loss) per share | | | (0.03 | ) | | | (0.03 | ) | | | (0.03 | ) | | | 0.08 | |
| | | | | | | | | | | | | | | | | |
| Diluted loss per share from continuing operations | | | (0.08 | ) | | | (0.08 | ) | | | (0.07 | ) | | | (0.10 | ) |
| Diluted income per share from discontinued operations | | | 0.05 | | | | 0.05 | | | | 0.04 | | | | 0.18 | |
| Diluted net income (loss) per share | | | (0.03 | ) | | | (0.03 | ) | | | (0.03 | ) | | | 0.08 | |
SIGNATURES
Pursuant to the requirements of Section 13 or 15(d) of the Securities Exchange Act of 1934, the Registrant has duly caused this report to be signed on its behalf by the undersigned, thereunto duly authorized.
| | | STRATEGIC DIAGNOSTICS INC. |
| | | |
| Date: | April 15, 2013 | /s/ Francis M. DiNuzzo |
| | | Francis M. DiNuzzo |
| | | President, Chief Executive Officer and Director |
Pursuant to the requirements of the Securities Exchange Act of 1934, this report has been signed below by the following persons on behalf of the Registrant and in the capacities and on the dates indicated.
| | | |
| Date: | April 15, 2013 | /s/ Steven Becker |
| | | Steven Becker |
| | | Chairman of the Board of Directors |
| | | |
| Date: | April 15, 2013 | /s/ Francis M. DiNuzzo |
| | | Francis M. DiNuzzo |
| | | President, Chief Executive Officer and Director (Principal Executive Officer) |
| | | |
| Date: | April 15, 2013 | /s/ Kevin J. Bratton |
| | | Kevin J. Bratton |
| | | Vice President – Finance and Chief Financial Officer (Principal Financial and Accounting Officer) |
| | | |
| Date: | April 15, 2013 | /s/ Thomas A. Bologna |
| | | |
| | | Director |
| | | |
| Date: | April 15, 2013 | /s/ Geoffrey Davis |
| | | Geoffrey Davis |
| | | Director |
| | | |
| Date: | April 15, 2013 | /s/ Richard van den Broek |
| | | Richard van den Broek |
| | | Director |
| | | |
| Date: | April 15, 2013 | /s/ Stephen L. Waechter |
| | | Stephen L. Waechter |
| | | Director |
| | | |
| Date: | April 15, 2013 | /s/ David M. Wurzer |
| | | David M. Wurzer |
| | | Director |
| | | |
| Date: | April 15, 2013 | /s/ Wayne P. Yetter |
| | | Wayne P. Yetter |
| | | Director |
57