UNITED STATES SECURITIES AND EXCHANGE COMMISSION
Washington, DC 20549
____________
FORM 10-K
(Mark One)
☑ | ANNUAL REPORT PURSUANT TO SECTION 13 OR 15(d) OF THE SECURITIESEXCHANGE ACT OF 1934 |
For the fiscal year ended March 31, 2013
or
☐ | TRANSITION REPORT PURSUANT TO SECTION 13 OR 15(d) OF THE SECURITIESEXCHANGE ACT OF 1934 |
Commission File Number 0-22982
NAVARRE CORPORATION
(Exact name of registrant as specified in its charter)
Minnesota | 41-1704319 |
(State or other jurisdiction of | (IRS Employer |
incorporation or organization) | Identification No.) |
7400 49th Avenue North, Minneapolis, MN 55428
(Address of principal executive offices)
(763) 535-8333
(Registrant’s telephone number, including area code)
Securities registered pursuant to Section 12(b) of the Act:
Title of each class | | Name of each exchange on which registered |
Common Stock, No par value | | The NASDAQ Global Market |
Securities registered pursuant to Section 12(g) of the Act:
None
Indicate by check mark if the registrant is a well-known seasoned issuer, as defined in Rule 405 of the Securities Act. Yes ☐ No ☑
Indicate by check mark if the registrant is not required to file reports pursuant to Section 13 or Section 15(d) of the Act. Yes ☐ No ☑
Indicate by check mark whether the registrant (1) has filed all reports required to be filed by Section 13 or 15(d) of the Securities Exchange Act of 1934 during the preceding 12 months (or for such shorter period that the registrant was required to file such reports), and (2) has been subject to such filing requirements for the past 90 days. Yes ☑ No ☐
Indicate by check mark whether the registrant has submitted electronically and posted on its corporate Web site, if any, every Interactive Data File required to be submitted and posted pursuant to Rule 405 of Regulation S-T (§ 229.405 of this chapter) during the preceding 12 months (or for such shorter period that the registrant was required to submit and post such files). Yes ☑ No ☐
Indicate by check mark if disclosure of delinquent filers pursuant to Item 405 of Regulation S-K is not contained herein, and will not be contained, to the best of registrant’s knowledge, in definitive proxy or information statements incorporated by reference in Part III of this Form 10-K or any amendment to this Form 10-K. ☑
Indicate by check mark whether the registrant is a large accelerated filer, an accelerated filer, a non-accelerated filer, or a smaller reporting company. See the definitions of “large accelerated filer,” “accelerated filer” and “smaller reporting company” in Rule 12b-2 of the Exchange Act. (Check one):
Large accelerated filer ☐ | Accelerated filer ☑ | Non-accelerated filer ☐ | Smaller reporting company ☐ |
| | | (Do not check if a smaller reporting company) | |
Indicate by check mark whether the registrant is a shell company (as defined in Rule 12b-2 of the Act). Yes ☐ No ☑
The aggregate market value of the registrant’s Common Stock, no par value per share, held by non-affiliates of the registrant as of September 30, 2012 was approximately $57,399,000 (based on the closing price of such stock as quoted on The NASDAQ Global Market of $1.57 on such date).
The number of shares outstanding of the registrant’s Common Stock, no par value per share, was 56,242,162 as of May 22, 2013.
DOCUMENTS INCORPORATED BY REFERENCE
None.
NAVARRE CORPORATION
FORM 10-K
TABLE OF CONTENTS
| | Page |
| PART I | 3 |
Item 1. | Business | 3 |
Item 1A. | Risk Factors | 7 |
Item 1B. | Unresolved Staff Comments | 19 |
Item 2. | Properties | 19 |
Item 3. | Legal Proceedings | 19 |
Item 4. | Mine Safety Disclosures | 19 |
| PART II | |
Item 5. | Market for Registrant’s Common Equity, Related Shareholder Matters and Issuer Purchases of Equity Securities.. | 20 |
Item 6. | Selected Financial Data | 23 |
Item 7. | Management’s Discussion and Analysis of Financial Condition and Results of Operations | 24 |
Item 7A. | Quantitative and Qualitative Disclosures About Market Risk | 41 |
Item 8. | Financial Statements and Supplementary Data | 42 |
Item 9. | Changes in and Disagreements with Accountants on Accounting and Financial Disclosure | 42 |
Item 9A. | Controls and Procedures | 42 |
Item 9B. | Other Information | 43 |
| PART III | |
Item 10. | Directors, Executive Officers, and Corporate Governance | 43 |
Item 11. | Executive Compensation | 47 |
Item 12. | Security Ownership of Certain Beneficial Owners and Management and Related Shareholder Matters | 63 |
Item 13. | Certain Relationships and Related Transactions, and Director Independence | 64 |
Item 14. | Principal Accounting Fees and Services | 65 |
| PART IV | |
Item 15. | Exhibits and Financial Statement Schedules | 66 |
| Signatures | 74 |
PART I
Item 1 — Business
Overview
Navarre Corporation (the “Company” or “Navarre”) offers a vertically integrated, multi-channel platform of e-commerce services and distribution solutions to retailers and manufacturers. We uniquely offer retail distribution programs, website development and hosting, customer care, e-commerce fulfillment, and third party logistics services.
Since our founding in 1983, we have established distribution relationships with major retailers including Best Buy, Wal-Mart/Sam’s Club, Apple, Amazon, Costco Wholesale Corporation, Staples, Office Depot, OfficeMax and Target. We distribute to nearly 31,000 retail and distribution center locations throughout the United States and Canada. In November 2012 we acquired SpeedFC, Inc. (“SpeedFC”), a leading provider of end-to-end e-commerce services. This acquisition allows us to provide a broad array of e-commerce services that includes website development and integration, web hosting, cross-channel order management and reporting, and fulfillment and customer care to online retailers and manufacturers. We believe our established relationships throughout the supply chain permit us to offer products to our internet-based and retail customers and to provide our vendors access to broad retail channels. We are expanding the business services we offer in order to participate in the growing revenue streams resulting from e-commerce and fulfillment services.
Information About Our Segments
Beginning in the quarter ended December 31, 2012, we changed our reporting segments in connection with the acquisition of SpeedFC, Inc. We previously reported segment information under two reporting segments including distribution and publishing. Effective the quarter ended December 31, 2012, our business operates through two business segments: Distribution and E-Commerce and Fulfillment Services.
Distribution.Through our distribution business, we distribute computer software, consumer electronics and accessories, video games and sell proprietary software products for the PC and Mac platforms. The distribution business focuses on providing a range of value-added services, including vendor-managed inventory, electronic and internet-based ordering and gift card fulfillment. Our vendors include Symantec Corporation, Kaspersky Lab, Inc., Corel Corporation, Webroot Software, Inc., Nuance Communications, Inc., and McAfee, Inc. Our proprietary software business (“Encore”) packages, brands, markets and sells directly to consumers, retailers, third party distributors and our distribution business. These proprietary software products fall mainly into the print, personal productivity, education, family entertainment, and home and landscape architectural design software categories. Titles includeThe Print Shop, Print Master, Advantage, Mavis Beacon Teaches Typing,Punch Home Design, BicycleandHoyle PC Gaming.
On May 17, 2010, we completed the acquisition of substantially all of the assets of Punch!, a leading provider of home and landscape architectural design software in the United States. The acquisition of Punch! expanded our content ownership and our strategy to enhance gross margins.
We sold FUNimation Productions, Ltd. (“FUNimation”), a leadinganimecontent provider, on March 31, 2011. All results of operations, assets and liabilities of FUNimation are classified as discontinued operations for all periods presented, and the consolidated financial statements, including the notes, have been reclassified to reflect such segregation for all periods presented (see further disclosure in Note 5 to our consolidated financial statements).
E-commerce and Fulfillment services.Through our e-commerce and fulfillment services business, we provide web platform development and hosting, fulfillment, order management, logistics and call center capabilities which provide customers with easy to implement, cost-effective, transaction-based services and information management tools.
On November 20, 2012, Navarre acquired all of the equity interests of SpeedFC. SpeedFC is a leading provider of end-to-end e-commerce services to retailers and manufacturers and is part of the Company’s e-commerce and fulfillment segment.
Certain financial information with respect to our segments is set forth in Note 24 to our financial statements set forth elsewhere in this Annual Report.
Distribution Markets
Computer Software
During fiscal 2013, we distributed approximately $320.3million of software product. Consistent with the declines in the software industry due to a mature market, we experienced a sales decrease during this time period due to decreased retail demand for the software products we currently distribute.
We presently have relationships with computer software publishers such as Symantec Corporation, Kaspersky Lab, Inc. and Nuance Communications, Inc. These relationships are important to our distribution business and during the fiscal year ended March 31, 2013, each of these publishers accounted for more than $30.0 million of software revenues. In the case of Symantec, net sales accounted for approximately $87.8 million, $92.8 million and $85.8 million in the fiscal years ended March 31, 2013, 2012 and 2011, respectively.
We have agreements in place with each of the vendors whose products we distribute, but, in most instances, such agreements are short-term in nature and may be cancelled without cause and upon short notice, typically 30 days. The agreements typically cover the right to distribute in the United States and Canada, but do not restrict the vendors from distributing their products through other distributors or directly to retailers and do not guarantee product availability to us for distribution. These agreements allow us to purchase the vendors’ products at a wholesale price and to provide various distribution and fulfillment services in connection with the vendors’ products.
Consumer Electronics and Accessories
During fiscal 2013, we distributed approximately $102.7 millionof consumer electronics and accessories product. Our sales increase in the consumer electronics and accessories category during fiscal 2013, primarily in the fashion and technology lines, represents our focus on products involved in serving the growing mobile electronics and tablet computing markets.
Our relationships with consumer electronics and accessories vendors such as Voyetra Turtle Beach, Inc, Disruptive Limited and Withings, Inc. are important to this category of our distribution business. We are rapidly expanding our vendor base in this product area as well as the number of customers.
E-commerce and Fulfillment Services
During fiscal 2013, our e-commerce and fulfillment services segment generated $54.7 million in net sales. Our sales increase in the e-commerce and fulfillment category during fiscal 2013 is primarily due to the acquisition of SpeedFC in November 2012. The acquisition of SpeedFC rounds out our end-to-end retail distribution and e-commerce services platform and provides us with a broader base of e-commerce clients.
The U.S Commerce Department reported an increase in e-commerce retail sales of 15.6% in calendar 2012 to $224.6 billion as compared to the prior year. E-commerce retail sales rose to 5.2% of total retail sales in calendar year 2012 compared to 4.7% of total retail sales in calendar year 2011. We believe the increase in e-commerce retail sales will continue to rise as our customers increase their on-line presence and as end consumers become more comfortable with the process of buying products online.
Our relationships with freight carriers such as FedEx and UPS are important to this business. We are rapidly expanding our customer base and our physical warehouse capabilities.
Customers
Since our founding in 1983, we have established relationships with retailers across mass merchant, specialty and wholesale club channels, including Best Buy, Wal-Mart/Sam’s Club, Apple, Amazon, Costco Wholesale Corporation, Staples, Office Depot, OfficeMax and Target. We sell and distribute products to nearly 31,000 retail and distribution center locations throughout the United States and Canada. While a significant portion of our revenue is generated from these major retailers, we also supply products directly to smaller independent retailers and through our B2B site located atwww.navarre.com. See further disclosure below in Part I, Item 1. –Business–Navarre’s DistributionBusiness Model: E-Commerce. Through these sales channels, we seek to ensure a broad reach of product throughout North America in a cost-efficient manner. References to our website are not intended to and do not incorporate information on the website into this Annual Report.
In each of the past several years, we have had a small number of customers that each accounted for 10% or more of our net sales. During the fiscal years ended March 31, 2013, 2012 and 2011, sales to two customers, Best Buy and Wal-Mart/Sam’s Club, accounted for approximately 27%, 28%, 34% and 12%, 17%, 16%, respectively, of our total net sales. In addition, during the fiscal year ended March 31, 2013, sales to Staples and Apple accounted for approximately 12% and 10%, respectively, of our total net sales. Net sales to Staples and Apple did not exceed 10% or more of our net sales for the fiscal years ended March 31, 2012 and 2011. Substantially all of the products we distribute to these customers are supplied on a non-exclusive basis under arrangements that may be cancelled without cause and upon short notice. These arrangements do not include such material terms as the quantity and purchase price of the goods purchased but rather principally address operational requirements of the transactions. None of our retail customers are required to make minimum purchases, including our largest customers. Generally, our customers have full right of return of our products.
Navarre’s Distribution Business Model
Vendor Relationships
We view our vendors as customers and work to manage retail relationships to make their business easier and more productive. By doing so, we believe our reputation as a service-oriented organization has helped us expand and retain our vendor relationships with such companies as: Symantec Corporation, Kaspersky Lab, Inc., Nuance Communications, Inc., Webroot Software, Inc., and Corel Corporation.
Furthermore, our dedication to smaller, second-tier vendors has helped to complement our vendor roster. We provide these vendors the opportunity to access shelf space and assist in the solicitation, logistics, promotion and management of products that they otherwise may be unable to obtain. We also conduct one-on-one meetings with smaller vendors to give them the opportunity to establish crucial business relationships with our retail customers.
Retail Services
Along with the value-added sales functions we provide to vendors, we also have the ability to customize shipments to individual customers. For certain customers, we provide products on a consignment basis, which allows the vendors of these products to receive placement at retail channels while minimizing inventory costs to our customers, and in some cases to Navarre. In the case of the warehouse club channel, we may “pre-sticker” products, based on the vendor/customer preference. We assemble creative marketing programs, which include pallet programs, product bundles and specialized packaging. Our marketing and creative services department designs and produces a variety of advertising vehicles including in-store flyers, direct mail pieces and magazine/newspaper ads, as well as free standing displayers for retail locations.
We are committed to offering first-rate information flow for all vendors. We understand the importance of sharing sell-through, inventory, sales forecasts, promotional forecasts, inventory item status and other data. We provide the aforementioned information via a secure online portal for vendors. We also accommodate specialized reporting requests for our vendors to assist in the management of their business.
E-Commerce
We continue to expand our focus on e-commerce by providing fee-based logistical and distribution services for the internet-based retail channel. We currently own and operate storefront technologies in addition to a call center. Additionally, we have a B2B website, located withinwww.navarre.com, which offers another means of fulfilling our customers’ orders. References to our website are not intended to and do not incorporate information on the website into this Annual Report.
Warehouse Systems
A primary focus of our distribution business is logistics and supply chain management. As customer demands become more sophisticated, we have continued to update our technology. With our returns processing system, we process returns and issue both credit and vendor deductions efficiently and timely. We believe our inventory system offers adequate in-stock levels of product, on-time arrivals of product to the customer, inventory management and acceptable return processing rates, thereby strengthening our customer relationships.
Navarre’s E-commerce and Fulfillment Services Business Model
On November 20, 2012, Navarre acquired all of the equity interests of SpeedFC. SpeedFC is a leading provider of end-to-end e-commerce services to retailers and manufacturers and is part of the Company’s e-commerce and fulfillment segment.
Competition
All aspects of our business are highly competitive. Our competitors include other national and regional businesses, as well as some suppliers that sell directly to retailers. Certain of these competitors have substantially greater financial and other resources than we do. Our ability to effectively compete in the future depends upon a number of factors, including our ability to: obtain national distribution contracts; obtain publishing rights with various rights holders and brand owners; maintain our margins and volume; expand our sales through a varied range of products and personalized services; anticipate changes in the marketplace including technological developments and consumer interest in our products; and maintain operating expenses at an appropriate level.
We face competition from a number of distributors including Ingram Micro, Inc., Ingram Entertainment, Tech Data Corporation, D&H Distribution, Dr. Bott, LLC, Synnex Corporation, Topics Entertainment, Nova/Avanquest, Valusoft, Phanton EFX and Activision, as well as from manufacturers and publishers that sell directly to retailers.
Many companies offer, on an individual basis, one or more of the same services offered by our e-commerce and fulfillment services business. We face competition from many different sources, depending upon the type and range of services requested by a potential client. Our competitors include vertical outsourcers, which are companies that offer a single function, such as call centers, public warehouses or credit card processors. We compete against transportation logistics providers who offer product management functions as an ancillary service to their primary transportation services. We also compete against other business process outsourcing providers, who perform many similar services as we do. Some of our competitors in this segment are GSI Commerce Inc., PFSWeb, Inc., Innotrac Corporation, and Demandware, Inc. Many of these companies have greater capabilities than we do for the single or multiple functions the competitors provide. In many instances, our competition is the in-house operations of our potential clients themselves. The in-house operations of potential clients often believe that they can perform the same services we do, while others are reluctant to outsource business functions that involve direct customer contact. We cannot be certain that we will be able to compete successfully against these or other competitors in the future.
We believe competition in all of our businesses will remain intense and that the keys to our growth and profitability include: (i) superior customer service, (ii) continued focus on improvements and operating efficiencies, (iii) the ability to rapidly advance our technology offerings to customers, and (iv) the ability to attract new customers.
Backlog
Because a substantial portion of our products are shipped in response to orders, we do not maintain any significant backlog.
Environmental Matters
We do not anticipate any material effect on our capital expenditures, earnings or competitive position due to compliance with government regulations involving environmental matters.
Employees
As of March 31, 2013, we had 819 employees. These employees are not subject to collective bargaining agreements and are not represented by unions. We believe we have good relations with our employees.
Capital Resources — Financing
See further disclosure in Part II, Item 7.Management’s Discussion andAnalysis of Financial Condition and Results of Operations — Liquidity andCapital Resources.
Available Information
We also make available, free of charge, in the “Investors — SEC Filings” section of our website,www.navarre.com, annual, quarterly and current reports (and amendments thereto) that we may file or furnish to the SEC pursuant to Sections 13(a) or 15(d) of Securities Act of 1934 as soon as reasonably practicable after our electronic filing. In addition, the SEC maintains a website containing these reports that can be located athttp://www.sec.gov. These reports may also be read and copied at the SEC’s Public Reference Room at 100 Fifth Street, NE, Washington, D.C. 20549. Information on the operation of the Public Reference Room may be obtained by calling the SEC at 1-800-SEC-0300. References to our website are not intended to and do not incorporate information on the website into this Annual Report.
Executive Officers of the Company
The following table sets forth our executive officers as of May 24, 2013:
Name | Age | Position |
Richard S Willis | 52 | President, Chief Executive Officer |
Diane D. Lapp | 48 | Chief Financial Officer |
Jeffrey B. Zisk | 56 | President SpeedFC |
Ward Thomas | 41 | President of Distribution |
Richard S Willis has been a member of Navarre’s Board of Directors since February 2011 and was appointed President and Chief Executive Officer of the Company in September 2011.Previously, he was the executive chairman of Charlotte Russe, a mall-based specialty retailer of value-priced women’s apparel and accessories (2011). He previously also served as president of Shoes for Crews (2009 to 2011), a seller of slip resistant footwear; chairman, president and chief executive officer of Baker & Taylor Corporation (2003 to 2007), the world's largest distributor of books, as well as a global distributor of DVDs and music; chairman, president and chief executive officer of Troll Communications; president and chief executive officer of Bell Sports; and chief financial officer of several magazine companies, including Petersen Publishing, which he helped take public in 1997. While at Baker & Taylor he served for two years as the chairman of the National Association of Recording Merchants. Mr. Willis also serves as a regent at Baylor University.
Diane D. Lapp joined Navarre in 2003 and has served as Chief Financial Officer since May 2012. She had previously served as Navarre’s Chief Financial Officer since October 2011 and prior to that, Vice President of Finance since May 2005. Prior to joining Navarre, Ms. Lapp was the Corporate Controller for Crystal Farms, a division of Michael Foods, from 1999 to 2003. Ms. Lapp also has 12 years of public accounting experience where she provided audit, tax, and consulting services to a diversified list of clients.
Jeffrey B. Zisk founded SpeedFC, Inc. in May 2000 and has been President, Chairman and CEO and director of SpeedFC since that time. Mr Zisk has been a Director of the Company since November 2012. He has over 30 years of experience in the fulfillment, technology and retail industries. Mr. Zisk began his entrepreneurial career by partnering with Ross Perot in the successful start up of AMWC (d.b.a. American Wholesale Club), a warehouse retailer/wholesaler of grocery, hard-line and soft-line products. Following the successful sale of AMWC to a large competitor, Mr. Zisk served as CEO, President and Founder of Entertainment Foods, Inc., a manufacturer, distributor and retailer of high quality fresh prepared foods. Prior to founding SpeedFC, he also served as President and COO of Designers Collection, Inc., a Dallas-based manufacturer and distributor of home textile products and Vice President of TurboChef Inc., a cooking technology company. Mr. Zisk graduated from Vanderbilt University in 1979 with a Bachelor's of Engineering degree.
Ward Thomasis currently the President of Distribution. He previously served as the President of Business Services and Development since August 2010. From 2007 to 2010, he served as Senior Director of North America Consumer Sales at Trend Micro Incorporated, a Tokyo-based leader in network antivirus and internet content security software and services. From 2005 to 2007, Mr. Thomas was Senior Vice President of Sales and Operations at FUNimation Entertainment. Previous to that time, he spent eight years as an executive in Navarre's distribution business.
Item 1A — Risk Factors
FORWARD-LOOKING STATEMENTS / RISK FACTORS
We make written and oral statements from time to time regarding our business and prospects, such as projections of future performance, statements of management’s plans and objectives, forecasts of market trends, and other matters that are forward-looking statements within the meaning of Section 27A of the Securities Act of 1933 and Section 21E of the Securities Exchange Act of 1934. Statements containing the words or phrases “will likely result,” “are expected to,” “will continue,” “is anticipated,” “estimates,” “projects,” “believes,” “expects,” “anticipates,” “intends,” “target,” “goal,” “plans,” “objective,” “should” or similar expressions identify forward-looking statements, which may appear in documents, reports, filings with the SEC, including this Annual Report, news releases, written or oral presentations made by officers or other representatives made by us to analysts, shareholders, investors, news organizations and others and discussions with management and other representatives of us. For such statements, we claim the protection of the safe harbor for forward-looking statements contained in the Private Securities Litigation Reform Act of 1995.
Our future results, including results related to forward-looking statements, involve a number of risks and uncertainties. No assurance can be given that the results reflected in any forward-looking statements will be achieved. Any forward-looking statement made by or on behalf of us speaks only as of the date on which such statement is made. Our forward-looking statements are based on assumptions that are sometimes based upon estimates, data, communications and other information from suppliers, government agencies and other sources that may be subject to revision. Except as required by law, we do not undertake any obligation to update or keep current either (i) any forward-looking statement to reflect events or circumstances arising after the date of such statement, or (ii) the important factors that could cause our future results to differ materially from historical results or trends, results anticipated or planned by us, or which are reflected from time to time in any forward-looking statement which may be made by or on behalf of us.
In addition to other matters identified or described by us from time to time in filings with the SEC, there are several important factors that could cause our future results to differ materially from historical results or trends, results anticipated or planned by us, or results that are reflected from time to time in any forward-looking statement that may be made by or on behalf of us. Some of these important factors, but not necessarily all important factors, include the following:
Risks Relating to Our Business and Industry
We derive a substantial portion of our total net sales from four customers. Areduction in sales to any of these customers, or another significantcustomer, could have a material adverse effect on our net sales andprofitability.
For the fiscal year ended March 31, 2013, net sales to Best Buy and Wal-Mart/Sam’s Club, Staples and Apple represented approximately 27%, 12%, 12% and 10%, respectively, of our total net sales, and, in the aggregate, approximately 60% of our total net sales. For the fiscal year ended March 31, 2012, net sales to Best Buy and Wal-Mart/Sam’s Club, represented approximately 28% and 16%, respectively, of our total net sales, and, in the aggregate, approximately 44% of our total net sales. For the fiscal year ended March 31, 2011, net sales to Best Buy and Wal-Mart/Sam’s Club accounted for approximately 33% and 17%, respectively, of our total net sales, and, in the aggregate, approximately 50% of our total net sales. Substantially all of the products we distribute to these customers are supplied on a non-exclusive basis under arrangements that may be cancelled without cause and upon short notice. These arrangements do not include such material terms as the price of the goods purchased but rather principally address operational requirements of the transactions. None of our retail customers are required to make minimum purchases, including our largest customers. If we are unable to continue to sell our products to either of these customers, are unable to maintain our sales to these customers at current levels and cannot find other customers to replace these sales, or we receive a significant amount of returns from these customers, there would be an adverse impact on our net sales and profitability. We believe sales to these customers will continue to represent a significant percentage of our total net sales but there can be no assurance that we will continue to receive a significant amount of revenue from sales to any specific customer.
The loss of a significant vendor or manufacturer or a decline in the popularityof its products could negatively affect our product offerings and reduce ournet sales and profitability.
A significant portion of net sales in recent years has been due to sales of computer software provided by software publishers such as Symantec Corporation and Kaspersky Lab, Inc. Symantec products accounted for approximately $87.8million, $92.8 million and $85.8 million in net sales in the fiscal years ended March 31, 2013, 2012 and 2011, respectively. We have agreements in place with each of the vendors whose products we distribute, but, in most instances, such agreements are short-term in nature and may be cancelled without cause and upon short notice, typically 30 days. The agreements typically cover the right to distribute in the United States and Canada, but do not restrict the vendors from distributing their products through other distributors or directly to retailers and do not guarantee product availability to us for distribution. These agreements allow us to purchase the vendors’ products at a wholesale price and to provide various distribution and fulfillment services in connection with the vendors’ products. We believe these arrangements are standard for such vendors and are essentially operational requirements. If we were to lose our right to distribute products of any of the above computer software publishers or the popularity of such product were to decrease, our net sales and profitability would be adversely impacted.
Our future growth and success depends partly upon our ability to procure and renew popular product distribution agreements and to sell the underlying products. There can be no assurance that we will enter into new distribution agreements or that we will be able to sell products under existing distribution agreements. Further, our current distribution agreements may be terminated on short notice. The loss of a significant vendor could negatively affect our product offerings and, accordingly, our net sales. Similarly, a decrease in customer demand for such products could negatively affect our net sales.
Technology developments, particularly software as a service application, electronic transfer and downloading, couldadversely affect our net sales, margins and results of operations.
The majority of our products are marketed and delivered on a physical delivery basis. If delivery of these products through software as a service applications (SaaS), on-demand offerings or technology transfers, such as electronic downloading through the internet or otherwise becomes more prevalent, then our retail and wholesale distribution business could be negatively impacted. As electronic transfer, on-demand and manufacturer software service applications grow, competition will continue to intensify and could negatively impact our net sales and margins. Furthermore, we may be required to spend significant capital to enter or participate in these delivery channels, or it may not be feasible for us to participate in these delivery channels if they are developed without the utilization of traditional distribution and retail structures. If we are unable to develop necessary vendor and customer relationships to facilitate entry into these markets or delivery methods or if the terms of these arrangements are not as favorable as those related to our physical product sales, our business may be materially harmed.
Our market is subject to rapid technological change and to compete we must continually enhance our systems to comply with evolving standards.
To remain competitive, we must continue to enhance and improve the responsiveness, functionality and features of our services and the underlying infrastructure. If we are unable to adapt to changing market conditions, client requirements or emerging industry standards, our business could be adversely affected. The internet and e-commerce environments are characterized by rapid technological change, changes in user requirements and preferences, frequent new product and service introductions embodying new technologies and the emergence of new industry standards and practices that could render our technology and systems obsolete. Our success will depend, in part, on our ability to both internally develop and license leading technologies to enhance our existing services and to develop new services. We must continue to address the increasingly sophisticated and varied needs of our clients and respond to technological advances and emerging industry standards and practices on a cost-effective and timely basis. The development of proprietary technology involves significant technical and business risks. We may fail to develop new technologies effectively or to adapt our proprietary technology and systems to client requirements or emerging industry standards.
Our revenues are dependent on consumer preferences and demand, which can changeat any time.
Our business and operating results depend upon the appeal of product concepts and programming to consumers, including the trends in the toy, game, computer software and entertainment businesses. A decline in the popularity of existing products or the failure of product concepts to achieve and sustain market acceptance could result in reduced overall revenues, which could have a material adverse effect on our financial condition and results of operations. Consumer preferences with respect to entertainment are continuously changing, are difficult to predict and can vary over time. There can be no assurance that:
| | • | any of the current product concepts will continue to be popular for any significant period of time; |
| | • | any new product concepts will achieve commercial acceptance or be made available to us; or |
| | • | any product’s life cycle will be sufficient to permit adequate profitability to recover license advances, guarantees, royalties, development, marketing and other costs. |
Our failure to successfully anticipate, identify and react to consumer preferences could have a material adverse effect on revenues, profitability and results of operations. In addition, changes in consumer preferences may cause our revenues and results of operations to vary significantly between comparable periods.
We recently restructured our operations, which may result in additional or unanticipated restructuring charges, and we may not be able to achieve the cost savings expected from these restructuring efforts.
To improve our profitability, we implemented a series of restructuring initiatives during fiscal 2012. These changes were made principally to transition away from facilities, business processes and other assets that were in place to support now divested and non-core businesses. These changes were also designed to support high-growth opportunities in the distribution of consumer electronics and accessories, to enhance our e-commerce fulfillment business and to increase our market expansion in Canada.
However, we may not be able to achieve the level of benefits that we expect to realize from these or any future restructuring activities, within expected timeframes, or at all. Changes in the amount, timing and character of charges related to our current or future restructurings and the failure to complete, or a substantial delay in completing, our current and any future restructuring plan could have a material adverse effect on our results of operations.
A continued deterioration in the businesses or markets of significant customers, could harm our business.
During weak economic times there is an increased risk that certain of our customers will, among other things, reduce orders, delay payment for product purchased, or increase product returns. Our revenues could negatively be affected by a number of factors, including the following:
| | • | the credit available to our customers; |
| | • | the opening and closing of retail stores; |
| | • | product marketing and promotional activities; and |
| | • | general economic changes affecting the buying pattern of consumers, particularly those changes affecting consumer demand for our products. |
In addition, if a customer files for bankruptcy, we may be required to forego collection of pre-petition amounts owed and to repay amounts remitted to us during the 90-day preference period preceding the filing. The bankruptcy laws, as well as specific circumstances of each bankruptcy, may limit our ability to collect pre-petition amounts. Although we believe that we have sufficient reserves to cover our exposure resulting from anticipated customer difficulties, bankruptcies or defaults, we can provide no assurance that such reserves will be adequate. If they are not adequate, our business, operating results and financial condition could be adversely affected.
Our business is seasonal and variable in nature and, as a result, the level ofsales and profitability during our peak season could adversely affect ourresults of operations and liquidity.
Traditionally, our third quarter (October 1-December 31) has accounted for our largest quarterly revenue figures and a substantial portion of our earnings. Our third quarter accounted for 36.7%, 31.9% and 30.0% of our net sales for the fiscal years ended March 31, 2013, 2012 and 2011, respectively. As a distributor of products ultimately sold to consumers and a service provider of end-to-end e-commerce and fulfillment solutions, our business is affected by the pattern of seasonality common to other suppliers of retailers, particularly during the holiday season. Because of this seasonality, if we or our customers experience a weak holiday season or poor weather conditions, or if we provide price protection for sales during the holiday season or decide to increase our inventory levels to meet anticipated customer demand, our financial results and liquidity could be negatively affected. Our borrowing levels and inventory levels typically increase substantially during the holiday season.
Growth of our non-U.S. sales and operations could subject us to additional risks that could harm our business.
Recently, we have generated increasing amounts of sales outside of the Unites States, mainly in connection with our Canadian operations. Although increasing in number, we have a limited number of customers in Canada. The majority of the sales and purchasing activity related to these customers results in receivables and accounts payables denominated in Canadian dollars. These transactions expose us to foreign currency exchange risks because gain or loss on these activities is a function of the foreign exchange rate, over which we have no control. Our foreign currency losses have increased from $129,000 in fiscal year 2011 to $810,000 in fiscal year 2013. In addition, our non-U.S. operations are subject to a variety of risks, which could cause fluctuations in our results. These additional risks include, but are not limited to:
| • | compliance with foreign regulatory and market requirements; |
| | |
| | • | variability of foreign economic, political and labor conditions; |
| | • | changing restrictions imposed by regulatory requirements, tariffs or other trade barriers or by U.S. import and export laws; |
| | • | potentially adverse tax consequences; |
| | • | difficulties in protecting intellectual property; |
| | • | burdens of complying with foreign laws; and |
| | • | as we generate cash flow in non-U.S. jurisdictions, we may experience difficulty transferring such funds to the U.S. in a tax efficient manner. |
Any one or more of these factors could have an adverse effect on our business, financial condition and operating results.
We rely on insurance to mitigate some risks facing our business, and to the extent our insurance does not mitigate or our insurers are unable to meet their obligations, our operating results may be negatively impacted.
We contract for insurance to cover certain potential risks and liabilities. It is possible that we may not be able to purchase enough insurance to meet our needs, may have to pay very high prices for the coverage we do obtain, have very high deductibles or may not be able to, or may choose not to, acquire any insurance for certain types of business risk. This could leave us exposed to potential claims. If we were found liable for a significant, underinsured or uninsured claim in the future, our operating results could be negatively impacted. Also, to the extent the cost of maintaining insurance increases, our operating results could be negatively affected. Additionally, we are subject to the risk that one or more of our insurers may become insolvent and would be unable to pay a claim that may be made in the future. There can be no assurance that our insurance will be adequate to protect us from pending and future claims. In addition, we are required to maintain insurance coverage under some of our agreements with our clients. If we are not able to or do not maintain the required insurance coverage, we could breach those agreements.
Increased counterfeiting or piracy may negatively affect the demand for ourhome entertainment products.
Certain product categories that we sell can be adversely affected by counterfeiting, piracy and parallel imports, and also by websites and technologies that allow consumers to illegally download and access this content. Increased proliferation of these alternative access methods to these products could impair our ability to generate net sales and could cause our business to suffer.
We may not be able to successfully protect our intellectual property rights.
We rely on a combination of copyright, trademark and other proprietary rights laws to protect the intellectual property we license. Third parties may try to challenge the ownership of such intellectual property by us or our licensors. In addition, our business is subject to the risk of third parties infringing on our intellectual property rights or those of our licensors and producing counterfeit products. If we need to resort to litigation in the future to protect our intellectual property rights or those of our licensors, such litigation could result in substantial costs and diversion of resources and could have a material adverse effect on our business and competitive position.
As a result of current economic conditions, intellectual property we license may be subject to heightened non-litigation risks, as well, including the risk that our licensors or their parents, subsidiaries or affiliates may seek protection under bankruptcy laws. Although we believe that we would continue to retain our rights to license intellectual property in such circumstances, there can be no assurance that our rights or our licensors obligations (including any obligation to provide, among other things, updates to licensed intellectual property or software updates) would not be modified, reduced or eliminated in a bankruptcy proceeding. Such a result could significantly harm our business and financial results.
Our failure to diversify our business could harm us.
We are continuing our efforts to diversify our business. This has placed, and will continue to place, demands on our personnel, as well as on our operational and financial infrastructure. To effectively manage our diversification efforts, we will need to continue to expand, improve and adapt our personnel, operations, infrastructure and our financial and information management systems and continue to implement adequate controls. These enhancements and improvements are likely to be complex and could require significant operating expenses, capital expenditures and allocation of valuable management resources. We may also have to expand our management team by recruiting and employing additional experienced executives and employees. If we are unable to adapt our systems and business, put adequate controls in place and adapt our management team in a timely manner to accommodate our diversification, our business may be adversely affected.
The loss of key personnel could affect the depth, quality and effectiveness ofour management team. In addition, if we fail to attract and retain qualifiedpersonnel, the depth, quality and effectiveness of our management team andemployees could be negatively affected.
We depend on the services of our key personnel because of their experience in the distribution and e-commerce and fulfillment areas. The loss of the services of one or several of our key employees could result in the loss of customers or vendor relationships, or otherwise inhibit our ability to operate and diversify our business successfully.
Our ability to enhance and develop markets for our current products and to introduce new products to the marketplace also depends on our ability to attract and retain qualified management personnel. We compete for such personnel with other companies and organizations, many of which have substantially greater capital resources and name recognition than we do. If we are not successful in recruiting or retaining such personnel, it could have a material adverse effect on our business.
If we fail to meet our significant working capital requirements or if ourworking capital requirements increase substantially, our business and prospectscould be adversely affected.
We purchase and license products directly from manufacturers and content developers for resale to retailers. As a result, we have significant working capital requirements, principally to acquire inventory, procure licenses and finance accounts receivable. Our working capital needs will increase as our inventory, licensing activities and accounts receivable increase in response to growth and/or seasonality. In addition, license advances, prepayments to enhance margins, investments and inventory increases to meet customer requirements could increase our working capital needs. The failure to obtain additional financing or maintain working capital credit facilities on reasonable terms in the future could adversely affect our business. In addition, if the cost of financing is too expensive or not available, it could require a reduction in our distribution or e-commerce and fulfillment activities.
We rely upon bank borrowings and vendor credit and payment terms to fund our general working capital and other needs and it may be necessary for us to secure additional financing in the future. If we were unable to borrow under our credit facility, obtain acceptable vendor terms or were otherwise unable to secure sufficient financing on acceptable terms or at all, our ability to grow or profit could be adversely affected.
Product returns or inventory obsolescence could reduce our sales andprofitability or negatively impact our liquidity.
We maintain a significant investment in product inventory. Like other companies operating in our industry, product returns from our retail customers are significant when expressed as a percentage of revenues. Adverse financial or other developments with respect to a particular supplier or product could cause a significant decline in the value and marketability of our products, possibly making it difficult for us to return products to a supplier or recover our initial product acquisition costs. Under such circumstances, our sales and profitability, including our liquidity, could be adversely affected. We maintain a sales return reserve based on historical product line experience rates. There can be no assurance that our reserves will be adequate to cover potential returns.
We are subject to the risk that our inventory values may decline due to, amongother things, changes in demand and that protective terms under our supplieragreements may not adequately cover the decline in values, which could resultin lower gross margins or inventory write-downs.
The demand for products that we sell and distribute is subject to rapid technological change, new and enhanced product specification requirements, consumer preferences and evolving industry standards. These changes may cause our inventory to decline substantially in value or to become obsolete which may occur in a short period of time. We offer no assurance that price protection or inventory returnability terms may not change or be eliminated in the future, that unforeseen new product developments will not materially adversely affect our revenues or profitability or that we will successfully manage our existing and future inventories.
In our distribution business, we generally are entitled to receive a credit from certain suppliers for products returned to us based upon the terms and conditions with those suppliers. If major suppliers decrease or eliminate the availability of price protection or inventory returnability to us, such a change in policy could lower our gross margins or cause us to record inventory write-downs. We are also exposed to inventory risk to the extent that supplier protections are not available on all products or quantities and are subject to time restrictions. In addition, suppliers may become insolvent and unable to fulfill their protection obligations to us. As a result, these policies do not protect us in all cases from declines in inventory value or product demand.
Impairment in the carrying value of our assets could negatively affectour consolidated results of operations and net worth.
We recorded significant impairment charges to goodwill and other assets during the fiscal year ended March 31, 2012. We evaluate assets on the balance sheet whenever events or a change in circumstance indicates that their carrying value may not be recoverable. Materially different assumptions regarding the future performance of our businesses could result in additional asset impairment charges which could negatively affect our operating results and potentially result in future operating losses.
Significant credit exposure and negative product demand trends or otherfactors could cause us significant credit loss.
We provide credit to our customers for a significant portion of our net sales. We are subject to the risk that our customers will not pay for the products they have purchased. This risk may be increased with respect to goods provided under our consignment programs due to our lack of physical control over the inventory. This risk may increase if our customers experience decreases in demand for their products and services or become less financially stable due to adverse economic conditions or otherwise. If there is a substantial deterioration in the collectability of our receivables, our earnings and cash flows could be adversely affected.
In addition, from time to time, we may make royalty advances, or invest in, other businesses. These business or investment opportunities may not be successful, which could result in the loss of our invested capital.
We may not be able to adequately adjust our cost structure in a timely fashionin response to a decrease in net sales, which may cause our profitability tosuffer.
A significant portion of our selling, general and administrative expense is comprised of personnel, facilities and costs of invested capital. If we were to experience additional declines in our net sales, we may not be able to exit facilities, reduce personnel, improve business processes, reduce inventory or make other significant changes to our cost structure without significant disruption to our operations or without significant termination and exit costs. Additionally, if management is not able to implement such actions in a timely manner, or at all, to offset a shortfall in net sales and gross profit, our profitability could suffer.
Our distribution and e-commerce and fulfillment businesses operate in highly competitiveindustries and compete with large national firms. Further competition, amongother things, could reduce our sales volume and margins.
The distribution business is highly competitive. Our competitors in the distribution business include other national and regional distributors as well as suppliers that sell directly to retailers. These competitors include the distribution affiliates of Ingram Micro, Inc., Ingram Entertainment, Tech Data Corporation, D&H Distribution, Dr. Bott LLC, Synnex Corporation and Activision.
Competition in the home entertainment and multimedia products industries is intense and is often based on price. Distributors generally experience low gross profit margins and operating margins. Consequently, our distribution profitability is highly dependent upon achieving effective cost and management controls and maintaining sales volumes. A material decrease in our gross profit margins or sales volumes would harm our financial results.
Many companies offer, on an individual basis, one or more of the same services offered by our e-commerce and fulfillment business. We face competition from many different sources, depending upon the type and range of services requested by a potential client. Our e-commerce and fulfillment services competitors include vertical outsourcers, which are companies that offer a single function, such as call centers, public warehouses or credit card processors. We compete against transportation logistics providers who offer product management functions as an ancillary service to their primary transportation services. We also compete against other business process outsourcing providers, who perform many similar services. Some of our competitors are GSI Commerce Inc., PFSWeb, Inc., Innotrac Corporation, and Demandware, Inc. Many of these companies have greater capabilities than we do for the single or multiple functions the competitors provide. In many instances, our competition is the in-house operations of our potential clients. The in-house operations of potential clients often believe that they can perform the same services we do, while others are reluctant to outsource business functions that involve direct customer contact. We cannot be certain that we will be able to compete successfully against these or other competitors in the future.
E-commerce and fulfillment service fee revenue and gross margin is dependent upon our clients’ business and transaction volumes and our costs; certain of our client service agreements are terminable by the client at will; we may incur financial penalties if we fail to meet contractual service levels under certain client service agreements.
Our e-commerce and fulfillment service fee revenue is primarily transaction based and fluctuates with the volume of transactions or level of sales of the products by the clients for whom we provide transaction management services. If we are unable to retain existing clients or attract new clients or if we dedicate significant resources to clients whose business does not generate sufficient revenue or whose products do not generate substantial customer sales, our e-commerce and fulfillment business may be materially adversely affected. Moreover, our ability to estimate service fee revenue for future periods is substantially dependent upon our clients’ projections, the accuracy of which has been, and will continue to be, unpredictable. Therefore, our planning for client activity and targeted goals for service fee revenue and gross margin may be materially adversely affected by incomplete, delayed or inaccurate projections. In addition, certain of our service agreements with clients are terminable by the client at will. Therefore, we cannot make assurances that any of our clients will continue to use our services for any period of time. The loss of a significant amount of service fee revenue due to client terminations could have a material adverse effect on our ability to cover our costs and thus on our profitability. Certain of our client service agreements contain minimum service level requirements and impose financial penalties if we fail to meet such requirements. The imposition of a substantial amount of such penalties could have a material adverse effect on our e-commerce and fulfillment business and operations.
Our e-commerce and fulfillment revenue and margins may be materially impacted by client transaction volumes that differ from client projections and business assumptions.
Our e-commerce and fulfillment pricing for client transaction services, such as call center and fulfillment, is often based upon volume projections and business assumptions provided by the client and our anticipated costs to perform such work. In the event the actual level of activity or cost is substantially different from the projections or assumptions, we may have insufficient or excess staffing, incremental costs or other assets dedicated for such client that may negatively impact our margins and business relationship with such client. In the event we are unable to meet the service levels expected by the client, our relationship with the client will suffer and may result in financial penalties and/or the termination of the client contract.
We depend on third party shipping and fulfillment companies for the delivery ofour products.
We rely almost entirely on arrangements with third party shipping and fulfillment companies, principally UPS and FedEx, for the delivery of our products. The termination of our arrangements with one or more of these third party shipping companies, or the failure or inability of one or more of these third party shipping companies to deliver products on a timely or cost efficient basis from suppliers to us, or products from us to our reseller customers or their end-user customers, would significantly disrupt our business and harm our reputation and net sales. Furthermore, an increase in amounts charged or the implementation of surcharges by these shipping companies could negatively affect our gross margins and earnings.
We subcontract a portion of our client services to third parties, and we are subject to various risks and liabilities if such subcontractors do not provide the subcontracted services or provide them in a manner that does not meet required service levels.
We currently, and may in the future, subcontract certain business services to one or more third parties. Under the terms of our contracts with our business service clients we are obligated to provide such subcontracted services and may be liable for the actions and omissions of such subcontractors. In the event our subcontractor fails to provide the subcontracted services in compliance with required services levels, or otherwise breaches its obligations, or discontinues its business, whether as the result of bankruptcy, insolvency or otherwise, we may be required to provide such services at a higher cost to us and may otherwise be liable for various costs and expenses related to such event. In addition, any such failure may damage our reputation and otherwise result in a material adverse effect upon our business and financial condition.
We depend on a variety of systems for our operations, and a failure of thesesystems could disrupt our business and harm our reputation and net sales andnegatively impact our results of operations.
We depend on a variety of systems for our operations. These systems support our operating functions, including inventory management, order processing, shipping, receiving and accounting. Certain of these systems are operated by third parties and their performance may be outside of our control. Any failures or significant downtime in our systems could prevent us from taking customer orders, printing product pick-lists, and/or shipping product. It could also prevent customers from accessing our price and product availability information.
From time to time we may acquire other businesses having information systems and records, which may be converted and integrated into our information systems. This can be a lengthy and expensive process that results in a material diversion of resources from other operations. As our needs for technology evolve, we may experience difficulty or significant cost in upgrading or significantly replacing our systems.
We also rely on the internet for a portion of our orders and information exchanges with our customers. The internet and individual websites can experience disruptions and slowdowns. In addition, some websites have experienced security breakdowns. Our website could experience material breakdowns, disruptions or breaches in security. If we were to experience a security breakdown, disruption or breach that compromised sensitive information, this could harm our relationship with our customers or suppliers or result in claims. Disruption of our website or the internet in general could impair our order processing or more generally prevent our customers and suppliers from accessing information, which could cause us to lose business.
We believe customer information systems and product ordering and delivery systems, including internet-based systems, are becoming increasingly important in the distribution of our products and services. Although we seek to enhance our customer information systems by adding new features, we offer no assurance that competitors will not develop superior customer information systems or that we will be able to meet evolving market requirements by upgrading our current systems at a reasonable cost, or at all. Our inability to develop and maintain competitive customer information systems could cause our business and market share to suffer.
The expansion of our E-commerce and Fulfillment services business has inherent cybersecurity risks that may disrupt our business.
Our strategic plans to grow the e-commerce and fulfillment services segment may increase our exposure to cybersecurity risks. A compromise of our security systems could result in a service disruption, or customers' personal information or our proprietary information being obtained by unauthorized users. Although we have implemented processes to mitigate the risk of security breaches and cyber incidents, there can be no assurance that such an attack will not occur. Any breach of our security could result in violation of privacy laws, potential litigation, and a loss of confidence in our security measures, all of which could have a negative impact on our financial results and reputation.
Recent and future acquisitions and investments could result in operating difficulties and other harmful consequences that may adversely impact our business and results of operations.
Acquisitions have been an important element of our overall corporate strategy and we expect this to continue. These transactions have been and could continue to be material to our financial condition and results of operations. The process of integrating an acquired companies, businesses, or technology has created, and will continue to create, unforeseen operating difficulties and expenditures. The areas where we face risks include:
| | ● | Diversion of management time and focus from operating our business to acquisition integration challenges. |
| | ● | Implementation or remediation of controls, procedures, and policies at the acquired company. |
| | ● | Integration of the acquired company’s accounting, human resource, and other administrative systems, and coordination of operations, sales and marketing functions. |
| | ● | Transition of our operations and infrastructure as we seek to integrate existing operations with those of the acquired business. |
| | ● | The acquired company may not produce revenue, earnings or business synergies as anticipated. |
| | ● | Particularly in the case of acquisitions with foreign operations, the need to integrate operations across different cultures and languages and to address the particular economic, currency, political, and regulatory risks associated with specific countries. |
| | ● | Cultural challenges associated with integrating employees from the acquired company into our organization, and retention of employees from the businesses we acquire. |
| | ● | Potential loss of customers and vendors. |
| | ● | Liability for activities of the acquired company before the acquisition, including patent and trademark infringement claims, violations of laws, commercial disputes, tax liabilities, and other known and unknown liabilities. |
| | ● | Litigation or other claims in connection with the acquired company, including claims from terminated employees, customers, former stockholders, or other third parties. |
Our failure to address these risks or other problems encountered in connection with our past or future acquisitions and investments could cause us to fail to realize the anticipated benefits of such acquisitions or investments, incur unanticipated liabilities, and harm our business generally.
If we make acquisitions or divestitures, a significant amount of management’s time and financial resources may be required to complete the acquisition or divestiture and integrate the acquired business into our existing operations or divest a business from our operations. Even with this investment of management time and financial resources, an acquisition may not produce the revenue, earnings or business synergies anticipated. Acquisitions involve numerous other risks, including assumption of unanticipated operating problems or legal liabilities, problems integrating the purchased operations, technologies or products, diversion of management’s attention from our core businesses, adverse effects on existing business relationships with suppliers and customers, incorrect estimates made in the accounting for acquisitions and amortization of acquired intangible assets that would reduce future reported earnings (goodwill impairments), ensuring acquired companies’ compliance with the legal requirements and potential loss of customers or key employees of acquired businesses. We cannot assure you that if we make any future acquisitions, investments, strategic alliances, joint ventures or divest a component of our business, that such transactions will be completed in a timely manner or achieve anticipated results, that they will be structured or financed in a way that will enhance our business or creditworthiness or that they will meet our strategic objectives or otherwise be successful. In addition, we may not be able to secure the financing necessary to consummate future acquisitions, and future acquisitions and investments could involve the issuance of additional equity securities or the incurrence of additional debt, which could harm our financial condition or creditworthiness or result in dilution. Moreover, we may be unable to locate a suitable candidate with whom to accomplish an acquisition or divestiture, or may be unable to do so on terms favorable to us, which failure could negatively impact our profitability.
Interruption of our business or catastrophic loss at any of our facilitiescould lead to a curtailment or shutdown of our business.
We receive, manage, distribute and process returns of our inventory from a centralized warehouse and distribution facility that is located adjacent to our corporate headquarters and a warehouse and distribution facilities in Dallas, Texas, Columbus, Ohio and Ontario, Canada. An interruption in the operation of or in the service capabilities at these facilities as a result of equipment failure or other reasons could result in our inability to distribute products, which would reduce our net sales and earnings for the affected period. In the event of a stoppage at such facilities, even if only temporary, or if we experience delays as a result of events that are beyond our control, delivery times to our customers and consumers and our relationship with such customers could be severely affected. Any significant delay in deliveries to our customers could lead to increased returns or cancellations and cause us to lose future sales. Our facilities are also subject to the risk of catastrophic loss due to unanticipated events such as fires, explosions, violent weather conditions or other natural disasters. We may experience a shutdown of our facilities or periods of reduced production as a result of equipment failure, delays in deliveries or catastrophic loss, which could have a material adverse effect on our business, results of operations or financial condition.
Future terrorist or military actions could result in disruption to ouroperations or loss of assets.
Future terrorist or military actions, in the U.S. or abroad, could result in destruction or seizure of assets or suspension or disruption of our operations. Additionally, such actions could affect the operations of our suppliers or customers, resulting in loss of access to products, potential losses on supplier programs, loss of business, higher losses on receivables or inventory, or other disruptions in our business, which could negatively affect our operating results. We do not carry insurance covering such terrorist or military actions, and even if we were to seek such coverage and such coverage was available, the cost likely would not be commercially reasonable.
If one or more jurisdictions successfully assert that we should collect or should have collected sales or other taxes on the sale of our merchandise over the internet, our business could be harmed.
The application of sales tax or other similar taxes to interstate and international sales over the internet is complex and evolving. One or more local, state or foreign jurisdictions may seek to impose past and future sales tax obligations on us or other out-of-state companies that engage in e-commerce. If one or more states or any foreign country successfully asserts that we should collect sales or other taxes on the sale of merchandise for which we are not currently collecting taxes, it could result in potentially material tax liability for past sales, decrease future sales and otherwise harm our business.
Our ability to use net operating loss carryforwards to reduce future tax payments may be limited.
As of March 31, 2013, we had estimatedavailable federal net operating loss carry-forwards (“NOLs”) of $82.8 million for federal income tax purposes that begin to expire in 2029. Our ability to use these NOLs will be dependent on our ability to generate future taxable income and may expire before we generate sufficient taxable income.
Section 382 of the Internal Revenue Code (“Section 382”) imposes limitations on a corporation’s ability to utilize NOLs if it experiences an “ownership change.” In general terms, an ownership change may result from transactions increasing the ownership of certain shareholders in the stock of a corporation by more than 50 percentage points over a three-year period. In the event of an ownership change, utilization of our NOLs would be subject to an annual limitation under Section 382. Any unused NOLs in excess of the annual limitation may be carried over to later years.
We may be unable to refinance our debtfacility.
We have the ability, subject to borrowing base requirements, to borrow up to $50.0 million under our revolving credit facility. We may need to refinance all or a portion of our indebtedness on or before the maturity date of our revolving credit facility (November 2017). Our ability to refinance our indebtedness or obtain additional financing will depend on, among other things:
| | • | our financial condition at the time; |
| | • | the amount of financing outstanding and lender requirements at the time; |
| | • | restrictions in our credit agreement or other outstanding indebtedness; and |
| | • | other factors, including the condition of the financial markets or the distribution and e-commerce and fulfillment markets. |
As a result, we may not be able to refinance any of our indebtedness on commercially reasonable terms, or at all. If we do not generate sufficient cash flow from operations, and additional borrowings or refinancings or proceeds of asset sales are not available to us, we may not have sufficient cash to enable us to meet all of our obligations.
Our credit agreement contains significant restrictions that limit our operatingand financial flexibility.
Our credit agreement requires us to maintain specified financial ratios and includes other covenants. We may be unable to meet such ratios and covenants. Any of these restrictions may limit our ability to execute our business strategy. Moreover, if operating results fall below current levels, we may be unable to comply with these covenants. If that occurs, our lenders could accelerate our indebtedness, in which case we may not be able to repay all of our indebtedness.
We may be able to incur additional indebtedness, which could further exacerbatethe risks associated with our current indebtedness level.
The level of our indebtedness could have important consequences. We and our subsidiaries may be able to incur substantial additional indebtedness in the future. If we or our subsidiaries incur additional indebtedness or other obligations, the related risks that we face could be magnified.
Changes to financial accounting standards may affect our reported results of operations.
Our financial statements conform to United States generally accepted accounting principles (“GAAP”). GAAP is subject to interpretation by the Financial Accounting Standards Board, the Securities and Exchange Commission and various bodies formed to interpret and create appropriate accounting policies. A change in those policies or interpretations could have a significant effect on our reported results and could even affect our reporting of transactions that were completed before a change is announced. Financial reporting and accounting rules affect many aspects of our business, including rules relating to accounting for revenue recognition and operating leases, which are currently under review. Changes to those rules or interpretations of those rules, may have a material adverse effect on our financial results.
The expected benefits of the SpeedFC acquisition may not be realized.
To realize the expected benefits of the acquisition of SpeedFC, we will need to successfully integrate the operations of SpeedFC into Navarre. Integration is expected to take approximately twelve months and will require substantial management attention and could detract attention from the day-to-day business of Navarre. We could encounter difficulties in the integration process, such as difficulties offering products and services across the increased facility portfolio, the need to revisit assumptions about reserves, revenues, capital expenditures and operating costs, including synergies, the loss of key employees or customers or the need to address unanticipated liabilities. If we cannot integrate our business and SpeedFC’s business successfully, we may fail to realize the expected benefits of the SpeedFC acquisition. In addition, we cannot be assured that all of the goals and anticipated benefits of the SpeedFC acquisition will be achievable, particularly as the achievement of the benefits are in many important respects subject to factors that we do not control. These factors would include such things as the reactions of third parties with whom we enter into contracts and do business and the reactions of investors and analysts.
The escrow and contingent cash consideration in the SpeedFC transaction may not be sufficient to cover all of the indemnification obligations owed to Navarre Corporation under the Merger Agreement.
Under the SpeedFC Merger Agreement, and untilgenerally 18 months from the date of closing, the stock andoption holders of the former SpeedFC, Inc. entity ("SFC Equityholders") the SFC Equityholders are required to indemnify us for certain liabilities, costs and expenses, including liabilities, costs and expenses related to certain tax and litigation matters and a breach of the representations and warranties set forth in the Merger Agreement. In certain circumstances, the SFC Equityholders are not required to indemnify us for losses or expenses until such losses or expenses are in excess of $250,000 in the aggregate and, subject to certain adjustments, are not obligated to indemnify us for any losses or expenses in excess of $10,000,000 in the aggregate (or $20,000,000 for losses resulting from breaches of the non-intellectual property and intellectual property representations). The indemnification obligations may not provide adequate protection for any losses or expenses related to these matters. In addition, there may be unknown liabilities that are not covered by the indemnification provisions of the Merger Agreement for which we would not be entitled to indemnification. Finally, the indemnification obligations of the SFC Equityholders are largely expected to be funded out of $4,000,000 escrow and contingent cash consideration which amount would be reduced for any working capital deficiencies at closing and may not be sufficient to cover all losses and expenses related to these indemnified matters.
Risks Relating to Our Common Stock
Fluctuations in our stock price couldimpair our ability to raise capital and make an investment in our securitiesundesirable.
During fiscal 2013, the last reported price of our common stock as quoted on The NASDAQ Global Market ranged from a low of $1.17 to a high of $2.27. We believe factors such as the market’s acceptance of our business and products, the performance of our business relative to market expectations, as well as general volatility in the securities markets, could cause the market price of our common stock to fluctuate substantially. In addition, the stock markets have experienced price and volume fluctuations, resulting in changes in the market prices of the stock of many companies, which may not have been directly related to the operating performance of those companies. Fluctuations in our stock price could impair our ability to raise capital and could make an investment in our securities undesirable.
The exercise of outstanding options may adversely affect our stockprice.
As of March 31, 2013, options to purchase 2,904,061 shares of our common stock were outstanding, of which 1,020,336 options were exercisable as of that date. Our outstanding options are likely to be exercised at a time when the market price for our common stock is higher than the exercise prices of the options. If holders of these outstanding options sell the common stock received upon exercise, it may have a negative effect on the market price of our common stock.
Our anti-takeover provisions, our ability to issue preferred stock and ourstaggered board may discourage takeover attempts that could be beneficial forour shareholders.
We are subject to Sections 302A.671 (Control Share Acquisitions) and 302A.673 (Business Combinations) of the Minnesota Business Corporation Act, which may have the effect of limiting third parties from acquiring significant amounts of our common stock without our approval. These laws, among others, may have the effect of delaying, deferring or preventing a third party from acquiring us or may serve as a barrier to shareholders seeking to amend our articles of incorporation or bylaws. Our articles of incorporation also permit us to issue preferred stock, which could allow us to delay or block a third party from acquiring us. The holders of preferred stock could also have voting and conversion rights that could adversely affect the voting power of the holders of the common stock. Finally, our articles of incorporation and bylaws divide our board of directors into three classes that serve staggered, three-year terms. Each of these factors could make it difficult for a third party to effect a change in control of us. As a result, our shareholders may lose opportunities to dispose of their shares at the higher prices typically available in takeover attempts or that may be available under a merger or other proposal.
In addition, these measures may have the effect of permitting our current directors to retain their positions and place them in a better position to resist changes that our shareholders may wish to make if they are dissatisfied with the conduct of our business.
We currently do not intend to pay dividends on our common stock and,consequently, there will be no opportunity for our shareholders to achieve areturn on their investment through dividend payments.
We currently do not plan to declare dividends on shares of our common stock in the foreseeable future. Further, the payment of dividends by us is restricted by our credit facility and loan agreements. Consequently, shareholders should not expect an opportunity to achieve a return on their investment through dividend payments.
Our directors may not be held personally liable for certain actions, whichcould discourage shareholder suits against them.
Minnesota law and our articles of incorporation and bylaws provide that our directors shall not be personally liable to us or our shareholders for monetary damages for breach of fiduciary duty as a director, with certain exceptions. These provisions may discourage shareholders from bringing suit against a director for breach of fiduciary duty and may reduce the likelihood of derivative litigation brought by shareholders on behalf of us against a director. In addition, our bylaws provide for mandatory indemnification of directors and officers to the fullest extent permitted by Minnesota law.
Other Risks
Our business operates in a continually changing environment that involves numerous risks and uncertainties. It is not reasonable for us to itemize all of the factors that could affect us and/or the products and services or the distribution industry or the e-commerce and fulfillment industry as a whole. Future events that may not have been anticipated or discussed here could adversely affect our business, financial condition, results of operations or cash flows.
Thus, the foregoing is not a complete description of all risks relevant to our future performance, and the foregoing risk factors should be read and understood together with and in the context of similar discussions which may be contained in the documents that we file with the SEC in the future.
Item 1B. Unresolved Staff Comments
None.
Item 2. Properties
Located in the Minneapolis suburb of New Hope, Minnesota, our corporate headquarters consists of approximately 202,000 square feet of combined office and warehouse space situated on two contiguous properties. The leases for these properties expire on June 30, 2019. These leased properties include approximately 44,000 square feet of office space and approximately 158,000 square feet of space devoted to warehousing, product picking and shipping.
In March 2010, we began operations for a satellite distribution center in Toronto, Ontario which occupies 30,000 square feet of leased warehouse space. The lease for this space expires on February 28, 2015. Additionally, we operate a satellite sales office in Bentonville, Arkansas which occupies 2,000 square feet of leased office space. The lease for this space is on a month to month basis.
We also operate a call center in Cedar Rapids, Iowa which occupies 3,000 square feet of leased office space. The lease for this space expires on March 31, 2014.
Our Dallas, Texas facility consists of approximately 540,000 square feet of combined office and warehouse space for general office, fulfillment, call center, and web development. The lease expires on August 1, 2017.
In the Columbus, Ohio suburb of Palaskala, we operate a fulfillment and call center in an approximately 230,000 square foot facility. The lease expires on September 1, 2013. We have entered into a lease for a facility in Etna, Ohio of approximately 770,000 square feet beginning October 1, 2013 and running through October 31, 2024.
The present aggregate base monthly rent for all of our distribution and office facilities is approximately $301,000.
We believe our facilities are adequate for our present operations as well as for the incorporation of growth. We continually explore alternatives to certain of these facilities that could expand our capacities and enhance efficiencies, and we believe we can renew or obtain replacement or additional space, if required, on commercially reasonable terms.
Item 3. Legal Proceedings
See Note 14 to the consolidated financial statements.
Item 4. Mine Safety Disclosures
Not applicable.
PART II
Item 5. Market for Registrant’s Common Equity, Related Shareholder Matters andIssuer Purchases of Equity Securities
Common Stock
Our common stock, no par value, is traded on The NASDAQ Global Market under the symbol “NAVR”. The following table presents the range of high and low closing sale prices for our stock for each period indicated as reported on The NASDAQ Global Market. Such prices reflect inter-dealer prices, do not include adjustments for retail mark-ups, markdowns or commissions and may not necessarily represent actual transactions.
| | Quarter | | High | | | Low | |
Fiscal 2013 | Fourth | | $ | 2.27 | | | $ | 1.79 | |
| | Third | | | 1.85 | | | | 1.59 | |
| | Second | | | 1.58 | | | | 1.17 | |
| | First | | | 1.87 | | | | 1.45 | |
| | | | | | | | | | |
Fiscal 2012 | Fourth | | | 1.85 | | | | 1.40 | |
| | Third | | | 1.82 | | | | 1.42 | |
| | Second | | | 2.05 | | | | 1.65 | |
| | First | | | 2.02 | | | | 1.68 | |
Holders
At May 22, 2013, we had 598common shareholders of record and an estimated 5,400beneficial owners whose shares were held by nominees or broker dealers.
Dividend Policy
We have never declared or paid cash dividends on our common stock. We currently intend to retain all earnings for use in our business and do not intend to pay any dividends on our common stock in the foreseeable future.
Comparative Stock Performance
The following Performance Graph compares performance of our common stock on The NASDAQ Global Market of The NASDAQ Stock Market LLC (US companies), the NASDAQ Composite Indices and the Peer Group Index described below. The graph compares the cumulative total return from March 31, 2008 to March 31, 2013 on $100 invested on March 31, 2008, assumes reinvestment of all dividends, and has been adjusted to reflect stock splits.
The New Peer Group Index below includes the stock performance of the following companies: Scholastic, Bluelinx Holdings, Beacon Roofing Supply, Take Two Interactive Software Inc., THQ, Inc., SED International, Ascent Capital Group Inc., Leapfrog Enterprises and Rosetta Stone. The stock performance of GTSI Corp is no longer included in the New Peer Group Index because it is no longer publicly traded.The Old Peer Group Index below includes the stock performance of the following companies: Scholastic, Bluelinx Holdings, Beacon Roofing Supply, Take Two Interactive Software Inc., THQ, Inc., GTSI Corp, SED International, Ascent Capital Group Inc., Leapfrog Enterprises and Rosetta Stone.
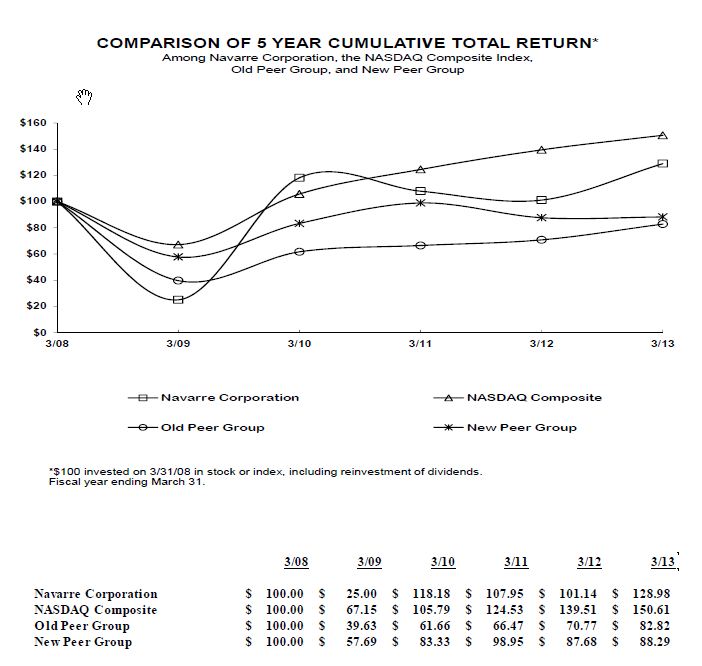
Source: Research Data Group, Inc.
Purchases of Equity Securities
We did not purchase any shares of our common stock during the fourth quarter of fiscal 2013.
Equity Compensation Plan Information
During fiscal 2013 we granted 1,223,080 options and awarded 328,585 restricted shares.
The following table below presents certain information regarding our Equity Compensation Plans as of March 31, 2013:
Plan Category | | Number of securities to be issued upon exercise of outstanding options, warrants and rights (a) | | | Weighted-average exercise price of outstanding options, warrants and rights (b) | | | Number of securities remaining available for future issuance under equity compensation plans (excluding securities reflected in column (a)) (c) | |
Equity compensation plans approved by security holders | | | 3,478,926 | | | $ | 1.61 | | | | 2,480,794 | |
Equity compensation plans not approved by security holders | | | — | | | | — | | | | — | |
Total | | | 3,478,926 | | | $ | 1.61 | | | | 2,480,794 | |
Unregistered Securities
During fiscal 2013, 18,865,283 unregistered common shares were issued in connection with the acquisition of SpeedFC, Inc. On November 20, 2012, along with approximately $25.0 million in cash consideration, the Company issued 17,095,186 shares of its unregistered common stock to all of the stock and option holders of the former SpeedFC, Inc. entity (the "SFC Equityholders") in exchange for all of their ownership in that entity, pursuant to the closing of the SpeedFC acquisition transaction. In February 2013 and in connection with the achievement of a portion of the first earn-out tranche payable to the SFC Equityholders, the Company issued an additional 1,770,097 shares along with approximately $998,788 in cash consideration to the SFC Equityholders.
The share consideration issued to the SFC Equityholders was issued in reliance upon an exemption from registration under federal securities laws provided by Section 4(2) of the Securities Act of 1933 promulgated thereunder for transactions by an issuer not involving a public offering and exemption from registration under applicable state securities laws. The shares issued contain a legend restricting their transferability absent registration or applicable exemption. the shares are subject to the terms and conditions of the Registration Rights Agreement dated November 20, 2012, the form of which was filed as Exhibit 10.1 to the Company's Current Report on Form 8-K Septemeber 28, 2012.
No sales of unregistered securities occurred during fiscal years 2012 or 2011.
Item 6. Selected Financial Data
The following selected financial data should be read in conjunction with Item 8,Financial Statements and Supplementary Dataand related notes and Item 7,Management’s Discussion and Analysis of Financial Condition and Results ofOperations, and other financial information appearing elsewhere in this Annual Report on Form 10-K. We derived the following historical financial information from our consolidated financial statements for the fiscal years ended March 31, 2013, 2012, 2011, 2010 and 2009 which have been audited by Grant Thornton LLP (in thousands, except per share data):
| | | Fiscal Years ended March 31, | |
| | | 2013 | | | 2012 | | | 2011 | | | 2010 | | | 2009 | |
Statement of operations data (1) (2): | | | | | | | | | | | | | | | | | | | | |
Net sales | | | | | | | | | | | | | | | | | | | | |
Distribution | | $ | 430,624 | | | $ | 473,048 | | | $ | 489,838 | | | $ | 495,770 | | | $ | 599,059 | |
E-commerce and fulfillment services | | | 54,671 | | | | 7,776 | | | | 1,059 | | | | — | | | | — | |
Gross profit | | | | | | | | | | | | | | | | | | | | |
Distribution | | | 42,416 | | | | 43,369 | | | | 64,893 | | | | 68,044 | | | | 49,601 | |
E-commerce and fulfillment services | | | 8,760 | | | | 589 | | | | 275 | | | | — | | | | — | |
Income (loss) from operations | | | 1,979 | | | | (22,303 | ) | | | 5,954 | | | | 11,538 | | | | (28,024 | ) |
Interest (expense) income, net | | | (1,020 | ) | | | (968 | ) | | | (1,754 | ) | | | (2,240 | ) | | | (3,222 | ) |
Other income (expense) | | | (922 | ) | | | (457 | ) | | | (153 | ) | | | 788 | | | | (1,194 | ) |
Income (loss) from continuing operations | | | 37 | | | | (23,728 | ) | | | 4,047 | | | | 10,086 | | | | (32,440 | ) |
Income tax benefit (expense) | | | (11,834 | ) | | | (10,572 | ) | | | 8,446 | | | | 8,602 | | | | (10,943 | ) |
Net income (loss) from continuing operations | | | (11,797 | ) | | | (34,300 | ) | | | 12,493 | | | | 18,688 | | | | (43,383 | ) |
(Loss) gain on sale of discontinued operations, net | | | - | | | | - | | | | (5,198 | ) | | | — | | | | — | |
Income (loss) from discontinued operations, net | | | - | | | | - | | | | 3,888 | | | | 4,184 | | | | (45,051 | ) |
Net income (loss) | | $ | (11,797 | ) | | $ | (34,300 | ) | | $ | 11,183 | | | $ | 22,872 | | | $ | (88,434 | ) |
Basic earnings (loss) per common share: | | | | | | | | | | | | | | | | | | | | |
Continuing operations | | $ | (0.27 | ) | | $ | (0.93 | ) | | $ | 0.34 | | | $ | 0.51 | | | $ | (1.20 | ) |
Discontinued operations | | | - | | | | - | | | | (0.03 | ) | | | 0.12 | | | | (1.24 | ) |
Net income (loss) | | $ | (0.27 | ) | | $ | (0.93 | ) | | $ | 0.31 | | | $ | 0.63 | | | $ | (2.44 | ) |
Diluted earnings (loss) per common share: | | | | | | | | | | | | | | | | | | | | |
Continuing operations | | $ | (0.27 | ) | | $ | (0.93 | ) | | $ | 0.34 | | | $ | 0.51 | | | $ | (1.20 | ) |
Discontinued operations | | | - | | | | - | | | | (0.04 | ) | | | 0.11 | | | | (1.24 | ) |
Net income (loss) | | $ | (0.27 | ) | | $ | (0.93 | ) | | $ | 0.30 | | | $ | 0.62 | | | $ | (2.44 | ) |
Weighted average shares outstanding: | | | | | | | | | | | | | | | | | | | | |
Basic | | | 43,529 | | | | 36,877 | | | | 36,446 | | | | 36,285 | | | | 36,207 | |
Diluted | | | 43,529 | | | | 36,877 | | | | 36,952 | | | | 36,643 | | | | 36,207 | |
Balance sheet data: | | | | | | | | | | | | | | | | | | | | |
Total assets | | $ | 196,291 | | | $ | 121,376 | | | $ | 173,866 | | | $ | 171,278 | | | $ | 183,122 | |
Short-term debt | | | 23,884 | | | | — | | | | 1,002 | | | | 6,634 | | | | 24,133 | |
Long-term debt | | | 1,901 | | | | — | | | | — | | | | — | | | | — | |
Shareholders’ equity | | | 53,683 | | | | 39,816 | | | | 73,081 | | | | 60,761 | | | | 37,007 | |
___________
(1) | Fiscal years 2012, 2011, 2010 and 2009 have been restated for the change in segment reporting effective December 31, 2012. |
(2) | Fiscal years 2010 and 2009 have been restated for discontinued operations related to the sale of FUNimation. |
Item 7. Management’s Discussion and Analysis of Financial Condition and Resultsof Operations
Overview
We offer a vertically integrated, multi-channel platform of e-commerce services and distribution solutions to retailers and manufacturers. We offer retail distribution programs, website development and hosting, customer care, e-commerce fulfillment, and third party logistics services.
Since our founding in 1983, we have established retail distribution relationships with major retailers including Best Buy, Wal-Mart/Sam’s Club, Apple, Amazon, Costco Wholesale Corporation, Staples, Target, Office Depot and OfficeMax, and we distribute to nearly 31,000 retail and distribution center locations throughout the United States and Canada. In November 2012 we acquired SpeedFC, Inc., a leading provider of end-to-end e-commerce services. This acquisition allows us to provide a broad array of e-commerce services that includes website development and integration, web hosting, cross-channel order management and reporting, and fulfillment and customer care to online retailers and manufacturers.
Beginning in the quarter ended December 31, 2012, we changed our reporting segments in connection with the acquisition of SpeedFC, Inc. We previously reported segment information under two reporting segments including Distribution and Publishing. Our business currently operates through two business segments: Distribution and E-Commerce and Fulfillment Services.
Distribution.Through our distribution business, we distribute computer software, consumer electronics and accessories, and video games and sell proprietary software products for the PC and Mac platforms. The distribution business focuses on providing a range of value-added services, including vendor-managed inventory, electronic and internet-based ordering and gift card fulfillment. Our vendors include Symantec Corporation, Kaspersky Lab, Inc., Corel Corporation, Webroot Software, Inc., Nuance Communications, Inc., and McAfee, Inc. Our proprietary software business (“Encore”) packages, brands, markets and sells directly to consumers, retailers, third party distributors and our distribution business. These proprietary software products fall mainly into the print, personal productivity, education, family entertainment, and home and landscape architectural design software categories. Titles includeThe Print Shop, Print Master, Advantage, Mavis Beacon Teaches Typing,Punch Home Design, BicycleandHoyle PC Gaming.
On May 17, 2010, Encore completed the acquisition of substantially all of the assets of Punch!, a leading provider of home and landscape architectural design software in the United States. The acquisition of Punch! expanded our content ownership and our strategy to enhance gross margins.
We sold FUNimation Productions, Ltd. (“FUNimation”), a leadinganimecontent provider, on March 31, 2011. All results of operations, assets and liabilities of FUNimation are classified as discontinued operations for all periods presented, and the consolidated financial statements, including the notes, have been reclassified to reflect such segregation for all periods presented (see further disclosure in Note 5 to our consolidated financial statements).
E-commerce and Fulfillment Services.Through our e-commerce and fulfillment services business, we provide web platform development and hosting, fulfillment, order management, logistics and call center capabilities which provide customers with easy to implement, cost-effective, transaction-based services and information management tools.
Historical and Recent Events
During October 2011, we implemented a series of initiatives, including a reduction in workforce and simplification of business structures and processes across the Company’s operations. Substantially all restructuring activities were complete by March 31, 2012. These actions are intended to increase operating efficiencies and provide additional resources to invest in product lines and service categories in order to execute our long-term growth strategy. In conjunction with the initiatives described above, the Company reviewed its portfolio of businesses to identify poor performing activities and areas where continued business investments would not meet its requirements for financial returns (collectively, “Restructuring Plan”). We recognized pre-tax impairment and restructuring charges of approximately $25.6 million during fiscal 2012.
On November 20, 2012, Navarre acquired all of the equity interests from all of the stock and option holders (the “SFC Equityholders”) of SpeedFC, Inc. (a Delaware corporation), through a merger of that entity with and into a Navarre wholly-owned subsidiary, now named SpeedFC, Inc., a Minnesota corporation (“SpeedFC”)(the transaction, the “Acquisition”) pursuant to the terms of that certain Agreement and Plan of Merger dated September 27, 2012, as amended on October 29, 2012 (the “Merger Agreement”). SpeedFC is a leading provider of end-to-end e-commerce services to retailers and manufacturers and is part of the Company’s e-commerce and fulfillment segment.
The aggregate Acquisition consideration consisted of initial consideration of $50.0 million in cash and shares of Navarre common stock, with additional contingent payments in cash and common stock available as described below, both payable to the SFC Equityholders proportionate to their prior ownership in SpeedFC, as adjusted pursuant to the Merger Agreement. The initial consideration paid at closing was comprised of: (i) $25.0 million in cash (less certain escrow and holdback amounts, and subject to certain net working capital and post-closing adjustments); and (ii) $25.0 million worth of shares of Navarre common stock, or 17,095,186 shares.
The contingent consideration payable to the SFC Equityholders is subject to the achievement of certain financial performance metrics by SpeedFC in the 2012 calendar year related to an adjusted EBITDA target, which, if met, would require: (i) the payment of up to a maximum of $5.0 million in cash consideration, with up to a maximum of $1.25 million payable in early 2013 and up to a maximum of $3.75 million (before interest of five percent per annum) payable in equal, quarterly installments beginning in late fiscal 2013 and ending on February 29, 2016 (the “Contingent Cash Payment”) and (ii) the issuance of up to 6,287,368 shares of Navarre common stock to the SFC Equityholders, with up to 2,215,526 (“First Equity Amount”) shares payable in early 2013, up to 738,509 shares (“Second Equity Amount”) payable in late 2013, and 3,333,333 shares payable at the same time as the Second Equity Amount (all equity amounts together, the “Contingent Equity Payment”). The Contingent Cash Payment and Contingent Equity Payment amounts are subject to certain escrow conditions and adjustments in connection with the measurement periods for evaluation of the achievement of financial performance metrics. If all contingent equity amounts are fully earned, a total of 23,382,554 shares of Navarre common stock could be issued in connection with the Acquisition. During fiscal 2013, we paid contingent cash consideration of approximately $1.0 million and issued 1,770,097 shares to the SFC Equityholders. The determination of the remaining contingent cash and share payments will be finalized in fiscal 2014.
Overall Summary of Fiscal 2013 Financial Results
Continuing Operations
Consolidated net sales from continuing operations increased 0.9% during fiscal 2013 to $485.3 million compared to $480.8 million in fiscal 2012. This $4.5 million increase in net sales was primarily due to an increase of net sales in our e-commerce and fulfillment segment of $46.9 million offset by a decrease of net sales in our distribution segment of $42.4 million. The increase in the e-commerce and fulfillment segment was principally due to our recent acquisition of SpeedFC, which generated $29.5 million in net sales during fiscal 2013 in addition to organic growth in logistics solutions service revenues of $17.4 million due to expanded services to existing and new customers. The decrease in our distribution segment revenues was due to a decrease in net sales in our software category of $26.5 million due to reduced demand for software products, a decrease in net sales in the video game category of $18.2 million, due to reduced demand for video game products, and a decrease in net sales in the home video category of $22.6 million as compared to the prior year due to our transition out of the home video product category. This increase was offset by an increase in net sales in our consumer electronics and accessories category of $24.9 million as compared to the prior year due to additional distribution of new products to existing and new customers.
While we have experienced declining net sales in our distribution segment over the past four fiscal years primarily due to the mature software and video game markets in the United States and our transition out of the home video product line, we are rapidly expanding distribution of consumer electronics and accessories products as well as expanding the distribution of our products to international markets. In addition, we have enhanced our logistics solutions to include a unique offering of multi-channel sales solutions with retail distribution programs, e-commerce fulfillment and third-party logistics services.
Our gross profit from continuing operations increased to $51.2 million or 10.5% of net sales for fiscal 2013 compared to $44.0 million or 9.1% of net sales for fiscal 2012. Both the $7.2 million increase in gross profit and 16.4% increase in gross profit margin were due to a higher volume of consumer electronics and accessories products in fiscal 2013 and the contribution of gross profit of $5.6 million from SpeedFC in fiscal 2013 in addition to the fiscal 2012 results included the impact of Restructuring Plan charges. This increase was offset by the decrease in video game and home video sales volumes. The fiscal 2012 gross profit margin includes the impact of $10.4 million, or 2.2% of net sales, of inventory, prepaid royalties and software development write-downs recognized as a result of the Restructuring Plan.
Total operating expenses from continuing operations for fiscal 2013 were $49.2 million or 10.1% of net sales, compared with $66.3 million or 13.8% of net sales for fiscal 2012. The decrease in operating expenses of $17.1 million during fiscal 2013 was principally due to the goodwill and intangible impairment charge of $6.0 million and other restructuring charges of $9.1 million reflected in our fiscal 2012 operating results. This decrease was offset by transaction and transition costs related to the acquisition of SpeedFC of $3.5 million and operating efficiencies resulting from the Restructuring Plan completed in fiscal 2012.
Net lossfrom continuing operations for fiscal 2013 was $11.8 million or $0.27per diluted share compared to net loss from continuing operations of $34.3 million or $0.93 per diluted share last year.
Impairments and Other Charges
During October 2011, we implemented the Restructuring Plan in order to transition away from facilities, business processes and other assets that were in place to support now divested non-core businesses. These changes are designed to support high-growth opportunities in the distribution of consumer electronics and accessories, to enhance our e-commerce fulfillment business and to increase our market expansion in Canada.
Substantially all restructuring activities were complete by March 31, 2012. The Restructuring Plan included:
| ● | The elimination of approximately 90 positions across all areas, |
| | ● | Abandoning inventory and other investments that we determined would not meet our requirements for financial returns, |
| | ● | The relocation of Encore operations from Los Angeles, California to the corporate headquarters in Minneapolis, Minnesota, and |
| | ● | Vacating a leased property in Minneapolis, Minnesota, that was utilized for warehouse and manufacturing assembly space. |
Net assets impacted included inventory, prepaid royalties, goodwill and software development costs.
Inventory. The total inventory charges were $2.6 million during fiscal 2012, which is included in cost of sales within theConsolidated Statements of Operations. The total inventory charges related to the distribution were $2.6 million during fiscal 2012. We determined the estimated realizable value by evaluating the nature and quantity of inventory on hand as compared to expected future sales volumes in addition to corroboration of estimated sales values with market participants.
Prepaid Royalties.Based on our review of business activities and the identification of investments that would not meet requirements for financial returns, we recorded an impairment charge related to the distribution segment for amounts that will not be recouped of $6.1 million during fiscal 2012, which is included in cost of sales within theConsolidated Statements of Operations.
Software Development.Based on the expected cash flows related to the distribution segment software development, we recorded an impairment charge of $1.2 million during fiscal 2012, which is included in cost of sales within theConsolidated Statements of Operations.
Customer Credits.Based on our review of business activities and the identification of investments that would not meet requirements for financial returns, we provided customer credits related to the distribution segment for amounts that will not be collected of $470,000 during fiscal 2012. These amounts are included in net sales within theConsolidated Statements of Operations.
Severance and other related costs. We completed a Company-wide reduction in force related to the Restructuring Plan whereby approximately 90 positions were eliminated. In addition, we incurred expenses related to the CEO transition which commenced during the first quarter of fiscal 2012. For fiscal 2012, the total severance and related costs were $6.2 million.
Facility related costs. We vacated a leased property that was utilized for warehouse and manufacturing space in addition to relocating Encore operations to our corporate headquarters. For fiscal 2012, the total facility related costs were $3.0 million.
Goodwill and intangibles.We performed goodwill and intangible impairment assessments due to the Restructuring Plan and the underperformance of the Punch! product lines relative to historical or projected future operating results. We determined fair value using widely accepted valuation techniques, including discounted cash flow and market multiple analysis. We recognized a goodwill impairment charge of $5.7 million during fiscal 2012.
The fair value of the indefinite lived intangible assets is determined for the impairment test using the relief from royalty valuation technique, which is a variation of the income approach. We determined that the Punch! trademark was impaired as of December 31, 2011 and intangible impairment charge of $306,000 in fiscal 2012.
The following tables summarize the impairment and other charges included in our Consolidated Statement of Operations for fiscal 2012 (in thousands):
| | |
Inventory | | | Software development costs | | |
Prepaid royalties | | |
Customer credits | | |
Severance and other | | |
Goodwill & intangible | | |
Facility related | | |
Total | |
| | | | | | | | | | | | | | | | | | | | | | | | | | | | | | | | | |
Net sales | | $ | — | | | $ | — | | | $ | — | | | $ | 470 | | | $ | — | | | $ | — | | | $ | — | | | $ | 470 | |
Cost of sales | | | 2,619 | | | | 1,238 | | | | 6,057 | | | | — | | | | 2 | | | | — | | | | — | | | | 9,916 | |
Selling and marketing | | | — | | | | — | | | | — | | | | — | | | | 542 | | | | — | | | | — | | | | 542 | |
Distribution and warehousing | | | — | | | | — | | | | — | | | | — | | | | 851 | | | | — | | | | 2,822 | | | | 3,673 | |
General and administrative | | | — | | | | — | | | | — | | | | — | | | | 4,820 | | | | — | | | | 19 | | | | 4,839 | |
Goodwill and intangible impairment | | | — | | | | — | | | | — | | | | — | | | | — | | | | 5,996 | | | | — | | | | 5,996 | |
Other expense | | | — | | | | — | | | | — | | | | — | | | | — | | | | — | | | | 122 | | | | 122 | |
Total | | $ | 2,619 | | | $ | 1,238 | | | $ | 6,057 | | | $ | 470 | | | $ | 6,215 | | | $ | 5,996 | | | $ | 2,963 | | | $ | 25,558 | |
Discontinued Operations
On March 31, 2011, we sold our wholly-owned subsidiary, FUNimation. Accordingly, all results of operations, assets and liabilities of FUNimation for all periods presented are classified as discontinued operations, and our consolidated financial statements, including the notes, have been reclassified to reflect such segregation for all periods presented.
There were no net sales from discontinued operations for fiscal 2012. Net sales from discontinued operations for fiscal 2011 were $35.4 million. FUNimation benefitted from increased sales of theDragonball titles as well as additional media streaming revenue during fiscal 2011.
We recorded a loss on the sale of discontinued operations, net of tax, for fiscal 2011 of $5.2 million and net income from discontinued operations for fiscal 2011 of $3.9 million, net of tax, for a combined loss from discontinued operations of $1.3 million, or $0.04 per diluted share.
Working Capital and Debt
Our business is working capital intensive and requires significant levels of working capital primarily to finance accounts receivable and inventories. We finance our operations through cash and cash equivalents, funds generated through operations, accounts payable and our revolving credit facility. The timing of cash collections and payments to vendors may require usage of our revolving credit facility in order to fund our working capital needs. “Checks written in excess of cash balances” may occur from time to time, including period ends, and represent payments made to vendors that have not yet been presented by the vendor to our bank, and therefore a corresponding advance on our revolving line of credit has not yet occurred. On a terms basis, we extend varying levels of credit to our customers and receive varying levels of credit from our vendors. During the last twelve months, we have not had any significant changes in the terms extended to customers or provided by vendors which would have a material impact to the reported financial statements.
On November 12, 2009, we entered into a three year, $65.0 million revolving credit facility (the “Credit Facility”) with Wells Fargo Foothill, LLC as agent and lender, and a participating lender. On December 29, 2011, the Credit Facility was amended to eliminate the participating lender, reduce the revolving credit facility limit to $50.0 million, provide for an additional $20.0 million under the Credit Facility under certain circumstances and extend the maturity date to December 29, 2016. On November 20, 2012, the Credit Facility was amended to provide for the acquisition of SpeedFC, eliminate the additional $20.0 million available under the Credit Facility and extend the maturity date to November 20, 2017.
The Credit Facility is secured by a first priority security interest in all of our assets, as well as the capital stock of our companies. Additionally, the Credit Facility, as amended, calls for monthly interest payments at the bank’s base rate (as defined in the Credit Facility) plus 1.75%, or LIBOR plus 2.75%, at our discretion.
At March 31, 2013 and 2012 we had $23.9 million and zero outstanding on the Credit Facility, respectively. Amounts available under the Credit Facility are subject to a borrowing base formula. Changes in the assets within the borrowing base formula can impact the amount of availability. Based on the facility’s borrowing base and other requirements at such dates, we had excess availability of $19.9 million and $30.4 million at March 31, 2013 and 2012, respectively. At December 31, 2012, we were in compliance with all covenants under the Credit Facility and we currently believe that we will be in compliance with all covenants during the next twelve months.
In association with, and per the terms of the Credit Facility, we also pay and have paid certain facility and agent fees. Weighted-average interest on the Credit Facility was 4.38% and 4.25% at March 31, 2013 and 2012, respectively. Such interest amounts have been, and continue to be, payable monthly.
Critical Accounting Policies and Estimates
The discussion and analysis of our financial condition and results of operations are based upon our consolidated financial statements, which have been prepared in conformity with accounting principles generally accepted in the United States of America. The preparation of these consolidated financial statements requires us to make estimates and assumptions that affect the reported amounts of assets, liabilities, revenues and expenses, and related disclosure of contingent assets and liabilities. On an on-going basis, we review and evaluate our estimates, including those related to customer programs and incentives, product returns, bad debt, inventories, long-lived assets including intangible assets, goodwill, share-based compensation, income taxes, contingencies and litigation. We base our estimates on historical experience and various other assumptions that are believed to be reasonable under the circumstances, the results of which form the basis for making judgments about the carrying values of assets and liabilities that are not readily apparent from other sources. Actual results could differ from these estimates under different assumptions or conditions.
We believe the following critical accounting policies are affected by our judgment, estimates and/or assumptions used in the preparation of our consolidated financial statements.
Revenue Recognition
We recognize revenue on products shipped when title and risk of loss transfers, delivery has occurred, the price to the buyer is determinable and collectability is reasonably assured. We recognize service revenues upon delivery of the services. We have relationships with certain of our customers and vendors whereby we provide fee-based services, which are recognized on a net basis within sales. Under specific conditions, we permit our customers to return or destroy products at customer locations. We record a reserve for sales returns, product destructions and allowances against amounts due to reduce the net recognized receivables to the amounts we reasonably believe will be collected. These reserves are based on the application of our historical gross profit percent against average sales returns and product destructions. Our actual sales return and product destruction in field rates have averaged between 10% and 12% over the past three years. Although our past experience has been a good indicator of future reserve levels, there can be no assurance that our current reserve levels will be adequate in the future.
Our distribution customers at times qualify for certain price protection and promotional monies from our vendors. We serve as an intermediary to settle these amounts between vendors and customers. We account for these amounts as reductions of revenues with corresponding reductions in cost of sales. Our distribution business at times provides certain price protection, promotional monies, volume rebates and other incentives to customers. We record these amounts as reductions in revenue.
A portion of the e-commerce and fulfillment services business revenue arrangements include multiple service elements, such as web implementation and migration, web site support, e-commerce services and additional services. These deliverables are regarded as one unit of accounting and the revenue recognition pattern is determined for the combined unit. The contracted value of the revenue and related costs for elements not quoted on a monthly basis, such as web site implementation and migration, are deferred and recognized ratably over the term of the arrangement, approximately three years, beginning when delivery has occurred. The revenues from the remaining service elements are recorded on a monthly basis as the services are provided. Costs associated with the web site implementation and migration are deferred and recognized ratably over the term of the arrangement consistent with the recognition of revenues.
Allowance for Doubtful Accounts
We make estimates of the uncollectability of our accounts receivable. In determining the adequacy of our allowances, we analyze customer financial statements, historical collection experience, aging of receivables, substantial down-grading of credit scores, bankruptcy filings and other economic and industry factors. We write off accounts receivable when they become uncollectible, and payments subsequently received on such receivables are credited to the allowance for doubtful accounts. Although risk management practices and methodologies are utilized to determine the adequacy of the allowance, it is possible that the accuracy of the estimation process could be materially impacted by different judgments as to the collectability based on the information considered and further deterioration of accounts. Our largest collection risks exist for customers that are in bankruptcy, or at risk of bankruptcy. If customer circumstances change (i.e., higher than expected defaults or an unexpected material adverse change in a major customer’s ability to meet its financial obligations to us), our estimates of the recoverability of amounts due could be reduced by a material amount.
Software development costs
Capitalization of software development costs begins upon the establishment of technological feasibility. In the development of our products and our enhancements to existing products, technological feasibility is not established until substantially all product development is complete, including the development of a working model. The establishment of technological feasibility and the ongoing assessment of recoverability of capitalized software development costs require considerable judgment by management with respect to certain external factors, including, but not limited to, technological feasibility, anticipated future gross revenues, estimated economic life, and changes in software and hardware technologies. Such costs are amortized using the straight-line method beginning when the product or enhancement is available for general release over the estimated economic life of the product or enhancement, generally three years.
Acquisition
Initial consideration is recognized at fair value as of the acquisition date. Any contingent consideration is recognized as a liability at fair value as of the acquisition date with subsequent fair value adjustments recorded in operations. Acquisition costs are expensed as incurred.
We allocate the purchase price of acquired entities to the underlying tangible and identifiable intangible assets acquired and liabilities based on their estimated fair values, with any excess recorded as goodwill. Determining the fair value of assets acquired and liabilities assumed requires management’s judgment and often involves the use of significant estimates and assumptions, including assumptions with respect to future cash inflows and outflows, discount rates, asset lives and market multiples, among other items. We determine the fair values of such assets, principally intangible assets, generally in consultation with third-party valuation advisors.
Restructuring charges
We monitor and regularly evaluate our organizational structure and associated operating expenses. Depending on events and circumstances, we may decide to take additional actions to reduce future operating costs. In determining restructuring charges, we analyze our future operating requirements, including the required headcount by business functions and facility space requirements. Our restructuring costs and any resulting accruals involve significant estimates made by management using the best information available at the time the estimates are made. In recording employee separation accruals, we record a liability when all of the following conditions have been met: employees’ rights to receive compensation for future absences is attributable to employees’ services already rendered; the obligation relates to rights that vest or accumulate; payment of the compensation is probable; and the amount can be reasonably estimated. In recording facilities lease loss accruals, we make various assumptions, including the time period over which the facilities are expected to be vacant, expected sublease terms, expected sublease rates, expected future operating costs, and expected future use of the facilities. Our estimates involve a number of risks and uncertainties, some of which are beyond our control, including future real estate market conditions and our ability to successfully enter into subleases or lease termination agreements with terms as favorable as those assumed when arriving at our estimates. We regularly evaluate a number of factors to determine the appropriateness and reasonableness of our restructuring reserves, including the various assumptions noted above. If actual results differ significantly from our estimates, we may be required to adjust our restructuring reserves in the future.
Goodwill and Intangible Assets
We review goodwill and indefinite lived intangible assets for potential impairment annually for each reporting unit, or when events or changes in circumstances indicate the carrying value of the goodwill might exceed its current fair value. We also assess potential impairment of goodwill and intangible assets when there is evidence that recent events or changes in circumstances have made recovery of an asset’s carrying value unlikely. The amount of impairment loss would be recognized as the excess of the asset’s carrying value over its fair value. Factors which may cause impairment include negative industry or economic trends and significant underperformance relative to historical or projected future operating results.
We determine fair value using widely accepted valuation techniques, including discounted cash flow and market multiple analysis. These types of analyses require us to make certain assumptions and estimates regarding industry economic factors and the profitability of future business strategies. We conduct impairment testing at least once annually based on our most current business strategy in light of present industry and economic conditions, as well as future expectations. If the operating results for one of our businesses deteriorate considerably and are not consistent with our assumptions and estimates, we may be exposed to a goodwill impairment charge that could be material. During the fiscal year ended March 31, 2012, we determined that the fair value of the business was less than its recorded value, and accordingly, an impairment of goodwill and other intangibles was recorded of $6.0 million. In determining the amount of impairment, we analyzed the fair values of the assets and liabilitiesof the reporting units as if the reporting units had been acquired in a current business combination. Our distribution business had a goodwill balance of zero as of both March 31, 2013 and 2012, respectively. Our e-commerce and fulfillment business had a goodwill balance of $31.5 million and zero as of March 31, 2013 and 2012, respectively.
Impairment of Long-Lived Assets
Long-lived assets, such as property and equipment and amortizable intangible assets, are evaluated for impairment whenever events or changes in circumstances indicate the carrying value of an asset may not be recoverable. An impairment loss is recognized when estimated undiscounted cash flows expected to result from the use of the asset plus net proceeds expected from disposition of the asset (if any) are less than the carrying value of the asset. When an impairment loss is recognized, the carrying amount of the asset is reduced to its estimated fair value. If our results from operations deteriorate considerably and are not consistent with our assumptions, we may be exposed to a material impairment charge. During the fiscal year ended 2012, we determined that the fair value of various long-lived assets was less than their carrying values, and accordingly, an impairment of other assets was recorded of $7.3 million. In determining the amount of impairment, we analyzed the fair values of the assets and liabilities of the reporting units as if the reporting units had been acquired in a current business combination.
Inventory Valuation
Our inventories are recorded at the lower of cost or market. We use certain estimates and judgments to value inventory. We monitor our inventory to ensure that we properly identify inventory items that are slow-moving, obsolete or non-returnable, on a timely basis. A significant risk in our distribution business is product that has been purchased from vendors that cannot be sold at full distribution prices and is not returnable to the vendors. A significant risk in our business is that certain products may run out of shelf life and be returned by our customers. Generally, these products can be sold in bulk to a variety of liquidators at a significantly reduced value. We establish reserves for the difference between carrying value and estimated realizable value in the periods when we first identify the lower of cost or market issue. If future demand or market conditions are less favorable than current analyses, additional inventory write-downs or reserves may be required and would be reflected in cost of sales in the period the determination is made.
Share-Based Compensation
We have granted stock options, restricted stock units and restricted stock to certain employees and non-employee directors. We recognize share-based compensation net of an estimated forfeiture rate and only recognize compensation cost for those shares expected to vest on a straight-line basis over the requisite service period of the award (normally the vesting period) or when the performance condition has been met.
Determining the appropriate fair value model and calculating the fair value of share-based payment awards require the input of highly subjective assumptions, including the expected life of the share-based payment awards and stock price volatility. We use the Black-Scholes model to value our stock option awards and the opening stock price on the date of grant to value restricted stock unit awards. We believe future volatility will not materially differ from the historical volatility. Thus, the fair value of the share-based payment awards represents our best estimates, but these estimates involve inherent uncertainties and the application of management judgment. As a result, if factors change and we use different assumptions, share-based compensation expense could be materially different in the future. In addition, we are required to estimate the expected forfeiture rate and only recognize expense for those shares expected to vest. If the actual forfeiture rate is materially different from the estimate, share-based compensation expense could be significantly different from what has been recorded in the current period.
Income Taxes
Income taxes are recorded under the liability method, whereby deferred income taxes provide for temporary differences between the financial reporting and tax basis of assets and liabilities. In the preparation of our consolidated financial statements, management is required to estimate income taxes in each of the jurisdictions in which we operate. This process involves estimating actual current tax exposures together with assessing temporary differences resulting from differing treatment of items for tax and accounting purposes. These differences result in deferred tax assets and liabilities, which are included in ourConsolidated Balance Sheets. Management reviews our deferred tax assets for recoverability on a quarterly basis and assesses the need for valuation allowances. The recoverability of these deferred tax assets are evaluated by considering historical levels of income, estimates of future taxable income streams and the impact of tax planning strategies. A valuation allowance is recorded to reduce deferred tax assets when it is determined that it is more likely than not that we would not be able to realize all or part of our deferred tax assets. At March 31, 2011, we evaluated the need for a valuation allowance and based on the history of pretax earnings, future taxable income projections and future reversals of existing taxable temporary differences, concluded we would more likely than not be able to realize the entire $30.7 million of deferred tax assets recorded at March 31, 2011. Therefore, we released the remaining $9.7 million of valuation allowance at that time, reducing the valuation allowance balance to zero at March 31, 2011.
As a result of the current market conditions and their impact on our future outlook, management has reviewed its deferred tax assets and concluded that the uncertainties related to the realization of some of its assets, have become unfavorable. A valuation allowance of $18.9 million was recorded as of March 31, 2012, which is included in income tax expense for fiscal 2012. As of March 31, 2013, the Company had a net deferred tax asset position before valuation allowance of $29.0 million which is composed of temporary differences, primarily related to net operating loss carryforwards, which will begin to expire in fiscal 2029. The Company also has foreign tax credit carryforwards at March 31, 2013 which will begin to expire in 2016. The Company has considered the positive and negative evidence for the potential utilization of the net deferred tax asset and has concluded that it is more likely than not that the Company will not realize the full amount of net deferred tax assets. Accordingly, a valuation allowance of $30.3 million is recorded against net deferred tax assets with determinable lives as of March 31, 2012, of which $11.4 million is included in income tax expense for fiscal 2013.
Contingencies and Litigation
There are various claims, lawsuits and pending actions against us. If a loss arising from these actions is probable and can be reasonably estimated, we record the amount of the estimated loss. If the loss is estimated using a range within which no point is more probable than another, the minimum estimated liability is recorded. Based on current available information, we believe the ultimate resolution of existing actions will not have a material adverse effect on our consolidated financial statements. As additional information becomes available, we assess any potential liability related to existing actions and may need to revise our estimates. Future revisions of our estimates could materially impact our consolidated results of operations, cash flows or financial position.
Results of Operations
The following table sets forth for the periods indicated, the percentage of net sales represented by certain items included in ourConsolidatedStatements of Operations.
| | | Fiscal Years Ended March 31, | |
| | | 2013 | | | 2012 | | | 2011 | |
Net sales: | | | | | | | | | | | | |
Distribution | | | 88.7 | % | | | 98.4 | % | | | 99.8 | % |
E-commerce and fulfillment services | | | 11.3 | | | | 1.6 | | | | 0.2 | |
Total net sales | | | 100.0 | | | | 100.0 | | | | 100.0 | |
Cost of sales: | | | | | | | | | | | | |
Distribution, exclusive of depreciation | | | 80.0 | | | | 89.3 | | | | 86.6 | |
E-commerce and fulfillment services | | | 9.5 | | | | 1.6 | | | | 0.1 | |
Total cost of sales | | | 89.5 | | | | 90.9 | | | | 86.7 | |
Gross profit | | | | | | | | | | | | |
Distribution, exclusive of depreciation | | | 8.7 | | | | 9.0 | | | | 13.2 | |
E-commerce and fulfillment services | | | 1.8 | | | | 0.1 | | | | 0.1 | |
Total gross profit: | | | 10.5 | | | | 9.1 | | | | 13.3 | |
Operating Expenses | | | | | | | | | | | | |
Selling and marketing | | | 3.7 | | | | 4.5 | | | | 4.3 | |
Distribution and warehousing | | | 1.5 | | | | 2.7 | | | | 2.2 | |
General and administrative | | | 3.2 | | | | 3.6 | | | | 4.5 | |
Information technology | | | 1.1 | | | | 1.1 | | | | 0.3 | |
Depreciation and amortization | | | 0.6 | | | | 0.6 | | | | 0.8 | |
Goodwill and intangible impairment | | | — | | | | 1.2 | | | | — | |
Total operating expenses | | | 10.1 | | | | 13.7 | | | | 12.1 | |
Income (loss) from operations | | | 0.4 | | | | (4.6 | ) | | | 1.2 | |
Interest income (expense), net | | | (0.2 | ) | | | (0.2 | ) | | | (0.4 | ) |
Other income (expense), net | | | (0.2 | ) | | | (0.1 | ) | | | — | |
Income (loss) from continuing operations — before taxes | | | - | | | | (4.9 | ) | | | 0.8 | |
Income tax benefit (expense) | | | (2.4 | ) | | | (2.2 | ) | | | 1.7 | |
Net income (loss) from continuing operations | | | (2.4 | ) | | | (7.1 | ) | | | 2.5 | |
Discontinued operations, net of tax | | | | | | | | | | | | |
Loss on sale of discontinued operations | | | — | | | | — | | | | (1.1 | ) |
Income (loss) from discontinued operations | | | — | | | | — | | | | 0.8 | |
Net income (loss) | | | (2.4 | )% | | | (7.1 | )% | | | 2.2 | % |
Segment Results
Certain information in this section contains forward-looking statements. Our actual results could differ materially from the statements contained in the forward-looking statements as a result of a number of factors, including but not limited to risks and uncertainties inherent in our business, dependency upon significant customers and vendors, the seasonality of our business, dependency upon software developers and manufacturers, effect of technology developments, effect of free product downloads, dependency upon key employees, risks of returns and inventory obsolescence, erosions in our gross profit margins, change in retailers methods of distribution, dependency upon financing, obtaining additional financing when required and the possible volatility of our stock price. See alsoBusiness — Forward-LookingStatements/Risk Factorsin Item 1A of this Form 10-K.
Distribution Segment
The distribution segment distributes computer software, consumer electronics and accessories and video games.
Fiscal 2013 Results from Continuing Operations Compared With Fiscal 2012
Net Sales
Net sales for the distribution segment were $430.6 million for fiscal 2013 compared to $473.0 million for fiscal 2012, a decrease of $42.4 million or 9.0%. Consumer electronics and accessories net sales increased $24.9 million to $102.7 million during fiscal 2013 from $77.8 million for fiscal 2012, due to the distribution of new products to existing and new customers. Net sales decreased $26.5 million in the software product group to $320.3 million for fiscal 2013 compared to $346.8 million for fiscal 2012, primarily due to reduced demand for our software products. Video games net sales decreased $18.2 million to $7.7 million in fiscal 2013 from $25.8 million in fiscal 2012, due to fewer video game releases distributed by us during fiscal 2013. Home video net sales decreased $22.6 million to zero for fiscal 2013 from $22.6 million in fiscal 2012, due to our transition out of home video exclusive content. We believe future net sales will be dependent upon our ability to continue to add new, appealing content and upon the strength of the retail environment and overall economic conditions.
Gross Profit
Gross profit for the distribution segment was $42.4 million or 9.8% of net sales for fiscal 2013 compared to $43.4 million or 9.2% of net sales for fiscal 2012. Fiscal 2012 includes restructure and impairment charges of $10.4 million, or 2.2% of net sales, primarily related to inventory, prepaid royalties and software development write-downs, and customer credits. Excluding the restructure and impairment charges, the $11.4 million decrease in gross profit was primarily due to an increase in sales of lower margin software products and the decline in volume of video games. We expect gross profit rates to fluctuate depending principally upon the make-up of products sold; however, we anticipate experiencing similar margin blends going forward.
Operating Expenses
Total operating expenses for the distribution segment were $44.9 million, or 10.4% of net sales, for fiscal 2013 compared to $64.2 million, or 13.6% of net sales, for fiscal 2012. Fiscal 2012 includes $21.8 million of restructure and impairment charges. Excluding restructure and impairment charges, the $2.5 million decrease is the result of the reduction in personnel and related costs resulting from the Restructuring Plan completed in fiscal 2012 partially offset by the $3.2 million of transaction and transition costs related to the acquisition of SpeedFC.
Selling and marketing expenses for the distribution segment decreased $3.6 million to $16.5 million, or 3.8% of net sales, for fiscal 2013 compared to $20.1 million, or 4.2% of net sales, for fiscal 2012. This decrease was primarily due a reduction in freight costs of approximately $1.5 million and personnel related costs of approximately $1.7 million. The reduction in freight costs is primarily a result in the decreased volume of net sales in the distribution segment. The reduction in personnel and advertising costs is a result of the Restructuring Plan completed in 2012.
Distribution and warehousing expenses for the distribution segment were $7.4 million, or 1.7% of net sales, for fiscal 2013 compared to $13.2 million, or 2.8% of net sales, for fiscal 2012. The $5.8 million decrease was primarily due to $3.6 million of Restructuring Plan related costs incurred in fiscal 2012 in addition to cost savings in fiscal 2013 as a result of the Restructuring Plan.
General and administrative expenses for the distribution segment consist principally of executive, accounting and administrative personnel and related expenses, including professional fees. General and administrative expenses for the distribution segment were $13.8 million, or 3.2% of net sales, for fiscal 2012 compared to $16.7 million, or 3.5% of net sales, for fiscal 2012. The $2.9 million decrease was primarily due to $4.8 million of Restructuring Plan related costs incurred in fiscal 2012 and reduced personnel and reduced professional fees of $1.3 million and $935,000, respectively, resulting from the Restructuring Plan. The decrease was offset by $2.9 million of transaction and transition costs related to the acquisition of SpeedFC incurred in fiscal 2013.
Information technology expenses for the distribution segment were $4.2 million, or 1.0% of net sales, for fiscal 2013 compared to $5.2 million, or 1.1% of net sales, for fiscal 2012. The decrease is primarily a due to a reduction in personnel and related costs resulting from the Restructuring Plan completed in fiscal 2012.
Depreciation and amortization for the distribution segment was $3.0 million for fiscal 2013 compared to $3.1 million for fiscal 2012.
Goodwill and intangible impairment for the distribution segment was zero for fiscal 2013 compared to $6.0 million for fiscal 2012. During the third quarter of fiscal 2012, we concluded that indicators of potential impairment were present due to the Restructuring Plan announced in October 2011 which included a review of the portfolio of businesses for where continued business investments would not meet our requirements for financial returns. We conducted impairment tests during the third quarter of fiscal 2012 based on present facts and circumstances and our business strategy in light of existing industry and economic conditions, as well as taking into consideration future expectations. Accordingly, goodwill impairment of $5.7 million and intangible impairment of $306,000 was recorded during fiscal 2012.
Operating Income
Net operating loss for the distribution segment was $2.5 million for fiscal 2013 compared to net operating income of $20.8 million for fiscal 2012.
Fiscal 2012 Results from Continuing Operations Compared With Fiscal 2011
Net Sales
Net sales for the distribution segment were $473.0 million for fiscal 2012 compared to $489.8 million for fiscal 2011, a decrease of $16.8 million or 3.4%. Consumer electronics and accessories net sales increased $46.7 million to $77.8 million during fiscal 2012 from $31.1 million for fiscal 2011, due to the distribution of new products to existing and new customers. Net sales decreased $42.4 million in the software product group to $346.8 million for fiscal 2012 compared to $389.2 million for fiscal 2011, primarily due to reduced demand for our software products. Video games net sales decreased $1.7 million to $25.8 million in fiscal 2012 from $27.5 million in fiscal 2011, due to fewer video game releases during fiscal 2012. Home video net sales decreased $19.3 million to $22.6 million for fiscal 2012 from $41.9 million in fiscal 2011, due primarily to two large customers no longer selling our home video products and our transition out of this product line.Accordingly, we expect sales in this category to continue to decline.
Gross Profit
Gross profit for the distribution segment was $43.4 million or 9.2% of net sales for fiscal 2012 compared to $64.9 million or 13.2% of net sales for fiscal 2011. The $21.5 million decrease in gross profit was primarily due to a higher mix of lower gross profit margin security and utility software products. In addition, inventory, prepaid royalties and software development write-downs as a result of the Restructuring Plan of $10.4 million, or 2.2% of net sales negatively affected gross profit in fiscal 2012.
Operating Expenses
Total operating expenses for the distribution segment were $64.2 million, or 13.6% of net sales, for fiscal 2013 compared to $58.8 million, or 12.0% of net sales, for fiscal 2012. Overall expenses increased by $21.8 million due to Restructuring Plan related costs, or 4.6% of net sales, which were offset by reduced personnel costs and reduced professional fees of $4.9 million and $1.9 million, respectively. The reduction in personnel costs during fiscal 2012 includes a benefit of $345,000 related to a change in our vacation accrual policy. During fiscal 2012, we established a vacation policy whereby vacations are scheduled for qualified employees based on the needs of the business which resulted in the reversal of an accrued vacation amount related to those individuals.
Selling and marketing expenses for the distribution segment decreased $940,000 to $20.1 million, or 4.2% of net sales, for fiscal 2012 compared to $21.0 million, or 4.3% of net sales, for fiscal 2011. This decrease was primarily due to a reduction of personnel related costs of $1.0 million offset by $417,000 of Restructuring Plan related costs. The reduction in personnel costs during fiscal 2012 includes a benefit of $114,000 related to the change in our vacation accrual policy.
Distribution and warehousing expenses for the distribution segment were $13.2 million, or 2.8% of net sales, for fiscal 2012 compared to $10.7 million, or 2.2% of net sales, for fiscal 2011. The $2.5 million increase was primarily due to $3.7 million of Restructuring Plan related costs offset by reduced personnel and related costs of $1.3 million resulting from the Restructuring Plan.
General and administrative expenses for the distribution segment consist principally of executive, accounting and administrative personnel and related expenses, including professional fees. General and administrative expenses for the distribution segment were $16.7 million, or 3.5% of net sales, for fiscal 2012 compared to $21.9 million, or 4.5% of net sales, for fiscal 2011. The $5.2 million decrease was primarily due reduced personnel and reduced professional fees of $2.7 million and $2.0 million, respectively. This reduction was offset by $4.8 million of Restructuring Plan related costs incurred in fiscal 2012. The reduction in personnel costs during fiscal 2012 includes a benefit of $209,000 related to the change in our vacation accrual policy.
Information technology expenses for the distribution segment were $5.2 million, or 1.1% of net sales, for fiscal 2012 compared to $1.4 million, or 0.3% of net sales, for fiscal 2011. The decrease is primarily due to a reduction in personnel and related costs resulting from the Restructuring Plan completed in fiscal 2012.
Depreciation and amortization for the distribution segment was $3.1 million for fiscal 2012 compared to $3.8 million for fiscal 2011. The $700,000 decrease was primarily due to certain assets becoming fully depreciated.
Goodwill and intangible impairment for the distribution segment was $6.0 million for fiscal 2012 compared to zero for fiscal 2011. During the third quarter of fiscal 2012, we concluded that indicators of potential impairment were present due to the Restructuring Plan announced in October 2011 which included a review of the portfolio of businesses for indications that continued business investments would not meet our requirements for financial returns. We conducted impairment tests during the third quarter of fiscal 2012 based on present facts and circumstances and our business strategy in light of existing industry and economic conditions, as well as taking into consideration future expectations. Accordingly, goodwill impairment of $5.7 million and intangible impairment of $306,000 was recorded during fiscal 2012.
Operating Income
Net operating loss for the distribution segment was $20.8 million for fiscal 2012 compared to net operating income of $6.1 million for fiscal 2011.
E-commerce and Fulfillment Services Segment
The e-commerce and fulfillment business provides web site development and hosting, customer care, e-commerce fulfillment and third party logistics services.
Fiscal 2013 Results from Continuing Operations Compared With Fiscal 2012
Net Sales
Net sales for the e-commerce and fulfillment services segment were $54.7 million for fiscal 2013 compared to $7.8 million for fiscal 2012. The $46.9 million, or 603.1% increase in net sales, was primarily due to organic growth of the existing e-commerce and fulfillment services business of $17.4 million and the acquisition of SpeedFC effective November 20, 2012, which generated net sales of $29.5 million during fiscal 2013. We believe sales results in the future will be dependent upon our ability to continue to win new client relationships and generate new opportunities in our client pipeline.
Gross Profit
Gross profit for the e-commerce and fulfillment services segment was $8.8 million, or 16.0% of net sales, for fiscal 2013 compared to $589,000, or 7.6% of net sales, for fiscal 2012. The increase in gross profit is a result of growth of service revenue volume and the contribution of SpeedFC for fiscal 2013 of $5.5 million. We expect gross profit rates to fluctuate depending principally upon the make-up of service revenue mix.
Operating Expenses
Total operating expenses for the e-commerce and fulfillment services segment increased to $4.3 million, or 7.9% of net sales, for fiscal 2013, compared to $2.1 million, or 27.0% of net sales, for fiscal 2012, all primarily related to the addition of SpeedFC in fiscal 2013.
Selling and marketing expenses for the e-commerce and fulfillment services segment increased to $1.6 million, or 2.9% of net sales, for fiscal 2013, compared to $1.1 million, or 13.6% of net sales, for fiscal 2012. The increase is primarily related to the addition of SpeedFC selling and marketing expenses of $560,000 for fiscal 2013.
General and administrative expenses for the e-commerce and fulfillment services segment consist principally of executive, accounting and administrative personnel and related expenses, including professional fees. General and administrative expenses for the e-commerce and fulfillment services segment were $1.7 million, or 3.1% of net sales, for fiscal 2013, compared to $1.0 million, or 13.3% of net sales, for fiscal 2012.
Information technology expenses for the e-commerce and fulfillment services segment were $1.1 million, or 1.9% of net sales, for fiscal 2013 compared to zero for fiscal 2012.
Operating Income
The e-commerce and fulfillment services segment had a net operating income of $4.5 million for fiscal 2013 compared to net operating loss of $1.5 million for fiscal 2012.
Fiscal 2012 Results from Continuing Operations Compared With Fiscal 2011
Net Sales
Net sales for the e-commerce and fulfillment services segment were $7.8 million for fiscal 2012 compared to $1.1 million for fiscal 2011. The $6.7 million, or 634.3% increase in net sales, was primarily due to organic growth of the existing e-commerce and fulfillment services business.
Gross Profit
Gross profit for the e-commerce and fulfillment services segment was $589,000, or 7.6% of net sales, for fiscal 2012 compared to $275,000, or 26.0% of net sales, for fiscal 2011. The increase in gross profit is a result of growth of service revenue volume in fiscal 2012.
Operating Expenses
Total operating expenses for the e-commerce and fulfillment services segment increased to $2.1 million, or 27.0% of net sales, for fiscal 2012, compared to $419,000, or 39.6% of net sales, for fiscal 2011, due to the addition of personnel and resources.
Selling and marketing expenses for the e-commerce and fulfillment services increased to $1.1 million, or 13.6% of net sales, for fiscal 2012, compared to $106,000, or 10.0% of net sales, for fiscal 2011, due to the addition of personnel and resources.
General and administrative expenses for the e-commerce and fulfillment services segment consist principally of executive, accounting and administrative personnel and related expenses, including professional fees. General and administrative expenses for the e-commerce and fulfillment services segment were $1.0 million, or 13.3% of net sales, for fiscal 2012, compared to $310,000, or 29.3% of net sales, for fiscal 2011.
Operating Income
The e-commerce and fulfillment services segment had a net operating loss of $1.5 million for fiscal 2012 compared to net operating loss of $144,000 for fiscal 2011.
Consolidated Other Income and Expense for All Periods
Interest income (expense), net was an expense of $1.0 million for fiscal 2013 compared to expense of $968,000 for fiscal 2012. The increase in interest expense for fiscal 2013 was a result of an increase in debt borrowings from fiscal 2012.
Other income (expense), net for fiscal 2013 and fiscal 2012 was net expense of $922,000 and $457,000, respectively, which consisted primarily of foreign exchange loss.
Interest income (expense), net was expense of $968,000 for fiscal 2012 compared to expense of $1.8 million for fiscal 2011. The decrease in interest expense for fiscal 2012 was a result of a reduction in debt borrowings from fiscal 2011.
Other income (expense), net for fiscal 2012 was net expense of $457,000, which consisted primarily of foreign exchange loss. Other income (expense), net for fiscal 2011 was net expense of $153,000, which consisted primarily of foreign exchange loss.
Consolidated Income Tax Expense or Benefit from Continuing Operations for AllPeriods
We recorded income tax expense from continuing operations of $11.8 million for fiscal 2013, or an effective rate of 31,983.7%, $10.6 million for fiscal 2012, or an effective rate of negative 44.6%, and income tax benefit from continuing operations of $8.4 million for fiscal 2011, or an effective rate of negative 208.7%. The change in our effective tax rate from year to year is principally attributable to the fact that we released $9.7 million of the valuation allowance against our deferred tax assets during fiscal 2011, recorded a valuation allowance of $18.9 million during fiscal 2012 and recorded an additional valuation allowance of $11.4 million during fiscal 2013.
For the year ended March 31, 2011 we recorded income tax expense from discontinued operations of $2.2 million and income tax benefit from the sale of discontinued operations of $2.9 million. The effective tax rate applied to discontinued operations for the year ended March 31, 2011 was 36.4% and the rate applied to the sale of discontinued operations was 36.1%.
Deferred tax assets are evaluated by considering historical levels of income, estimates of future taxable income streams and the impact of tax planning strategies. A valuation allowance is recorded to reduce deferred tax assets when it is determined that it is more likely than not, based on the weight of available evidence, we would not be able to realize all or part of our deferred tax assets. An assessment is required of all available evidence, both positive and negative, to determine the amount of any required valuation allowance. During fiscal 2011, we evaluated the need for a valuation allowance and based on our history of pretax earnings, future taxable income projections and future reversals of existing taxable temporary differences concluded that we are more likely than not able to realize the entire $30.7 million of deferred tax assets recorded at March 31, 2011. Therefore, we released the $9.7 million of valuation allowance at that time.
As a result of the current market conditions and their impact on our future outlook, management has reviewed its deferred tax assets and concluded that the uncertainties related to the realization of some of its assets, have become unfavorable. A valuation allowance of $18.9 million was recorded as of March 31, 2012, which is included in income tax expense for fiscal 2012. As of March 31, 2013, the Company had a net deferred tax asset position before valuation allowance of $29.0 million which is composed of temporary differences, primarily related to net operating loss carryforwards, which will begin to expire in fiscal 2029. The Company also has foreign tax credit carryforwards at March 31, 2013 which will begin to expire in 2016. The Company has considered the positive and negative evidence for the potential utilization of the net deferred tax asset and has concluded that it is more likely than not that the Company will not realize the full amount of net deferred tax assets. Accordingly, a valuation allowance of $30.3 million is recorded against net deferred tax assets with determinable lives as of March 31, 2012, of which $11.4 million is included in income tax expense for fiscal 2013.
We recognize interest accrued related to unrecognized income tax benefits (“UTB’s”) in the provision for income taxes. As of March 31, 2012, interest accrued was $190,000 and total UTB’s, net of deferred federal and state income tax benefits that would impact the effective tax rate, if recognized, were $518,000. During fiscal 2013, $252,000 of UTB’s were reversed. As of March 31, 2013, interest accrued was $152,000 and total UTB’s, net of deferred federal and state income tax benefits that would impact the effective tax rate, if recognized, were $499,000.
Consolidated Net Income (Loss) from Continuing Operations
We recorded net loss from continuing operations of $11.8 million for fiscal 2013, net loss from continuing operations of $34.3 million for fiscal 2012 and net income from continuing operations of $12.5 million for fiscal 2011.
Discontinued Operations
On March 31, 2011, we sold our wholly-owned subsidiary, FUNimation. Accordingly, all results of operations, assets and liabilities of FUNimation for all periods presented are classified as discontinued operations, and our consolidated financial statements, including the notes, have been reclassified to reflect such segregation for all periods presented.
We recorded net income from discontinued operations of $3.9 million, net of tax for fiscal 2011. This amount was driven by a strong title release in fiscal 2011 and a zero performance based compensation expense recorded during fiscal 2011. Additionally, we recorded a loss on the sale of discontinued operations, net of tax for fiscal 2011 of $5.2 million associated with the sale of FUNimation on March 31, 2011.
Consolidated Net (Loss) Income
Net loss for fiscal 2013 was $11.8 million, net loss for fiscal 2012 was $34.3 million and net income for fiscal 2011 was $11.2 million.
Market Risk
Our exposure to market risk was primarily due to the fluctuating interest rates associated with variable rate indebtedness. We had no long-term debt amounts outstanding at March 31, 2013. See Item 7A —Quantitativeand Qualitative Disclosure About Market Risk.
Seasonality and Inflation
Quarterly operating results are affected by the seasonality of our business. Specifically, our third quarter (October 1-December 31) typically accounts for our largest quarterly revenue figures and a substantial portion of our earnings. Our third quarter accounted for 36.7%, 31.9% and 30.0% of our net sales for the fiscal years ended March 31, 2013, 2012 and 2011, respectively. As a supplier of products ultimately sold to consumers, our business is affected by the pattern of seasonality common to other suppliers of retailers, particularly during the holiday selling season. Poor economic or weather conditions during this period could negatively affect our operating results. Inflation is not expected to have a significant impact on our business, financial condition or results of operations since we can generally offset the impact of inflation through a combination of productivity gains and price increases.
Liquidity and Capital Resources
Cash Flow Analysis
Operating Activities
Cash used in operating activities for fiscal 2013 totaled $2.1million, compared to cash used in operating activities of $5.5 million for fiscal 2012 and cash provided by operating activities of $8.7 million for fiscal 2011.
The net cash used in operating activities for fiscal 2013 mainly reflected our net loss, combined with various non-cash charges, depreciation and amortization of $4.9 million, amortization of debt acquisition costs of $199,000, amortization of software development costs of $971,000, share-based compensation of $983,000, a decrease in deferred income taxes of $11.5 million, offsetby our working capital demands. The following are changes in the operating assets and liabilities during the 2013 fiscal year: accounts receivable increased $23.8 million, resulting from the timing of sales and the addition of receivables due to the acquisition of SpeedFC, net of increased sales during the fourth quarter; inventories increased $5.2 million, primarily reflecting additional inventory related to our growing consumer electronics and accessories product line;prepaid expenses and other assets decreased $131,000, primarily resulting from the write-down of prepaid expenses and recoupments of prepaid royalties; income taxes receivable increased $13,000, primarily due to the timing of required tax payments and tax refunds; accounts payable increased $24.6 million, primarily as a result of timing of payments and purchases; income taxes payable increased $853,000 primarily due to the timing of required tax payments and tax refunds; and accrued expenses decreased $4.2 million, net of various accrual payments and a decrease in accrued wages due to timing of pay periods.
The net cash used in operating activities for fiscal 2012 mainly reflected our net loss, combined with various non-cash charges, the reversal of the Punch! contingent payment accrual of $948,000 which was unearned, depreciation and amortization of $3.6 million, amortization of debt acquisition costs of $482,000, amortization of software development costs of $2.1 million, share-based compensation of $1.2 million, goodwill and intangibles impairment of $6.0 million, a decrease in deferred income taxes of $10.7 million, offset by our working capital demands. The following are changes in the operating assets and liabilities during the 2012 fiscal year: accounts receivable decreased $9.8 million, resulting from the timing of sales, net of decreased sales during the quarter; inventories increased $4.1 million, primarily reflecting additional inventory related to our growing consumer electronics and accessories product line; prepaid expenses decreased $6.6 million, primarily resulting from the write-down of prepaid expenses and recoupments of prepaid royalties; income taxes receivable increased $13,000, primarily due to the timing of required tax payments and tax refunds; accounts payable decreased $5.7 million, primarily as a result of timing of payments and purchases; income taxes payable decreased $37,000 primarily due to the timing of required tax payments and tax refunds; and accrued expenses decreased $1.2 million, net of various accrual payments and a decrease in accrued wages due to timing of pay periods.
The net cash provided by operating activities for fiscal 2011 mainly reflected our net income, combined with various non-cash charges, including loss on sale of discontinued operations of $5.2 million, depreciation and amortization of $3.8 million, amortization of software development costs of $499,000, amortization of debt-acquisition costs of $596,000, share-based compensation of $1.1 million and an increase in deferred income taxes of $8.6 million, offset by our working capital demands. The following are changes in the operating assets and liabilities during the 2011 fiscal year: accounts receivable decreased $4.2 million as a result of decreased sales; inventories increased $2.8 million, primarily reflecting additional inventory related to the opening of our Canadian distribution facility and new consumer electronics and accessories inventory purchases; income taxes receivable decreased $131,000, primarily due to the timing of required tax payments and tax refunds; accounts payable increased $912,000 primarily as a result of timing of payments and purchases; and accrued expenses decreased $4.0 million primarily due to the payment of the fiscal 2010 performance-based cash compensation accrual.
Investing Activities
Cash flows used in investing activities totaled $29.5 million in fiscal 2013, compared to cash flows provided by (used in) investing activities of $19.9 million and ($9.9 million) in fiscal 2012 and 2011, respectively.
The Company used $25.5 million in cash for the acquisition of SpeedFC in fiscal 2013.
The acquisition of property and equipment totaled $3.8 million, $759,000 and $816,000 in fiscal 2013, 2012 and 2011, respectively. Purchases of assets in fiscal 2013 consisted primarily of computer equipment in order to grow the e-commerce and fulfillment segment.
Proceeds from the sale of discontinued operations and repayment of note receivable related to acquisitions totaled $22.5 million and $1.0 million during fiscal 2012. The acquisition of Punch! totaled $8.1 million in fiscal 2011. The investment in software development totaled $161,000, $877,000 and $978,000 for fiscal 2013, 2012 and 2011, respectively.
Financing Activities
Cash flows provided by financing activities were $26.0 million in fiscal 2013, compared to cash flows used in financing activities of $8.8 million in fiscal 2012 and $4.0 million in fiscal 2011.
We had proceeds of $173.6 million and repayments of $149.7 million for the revolving line of credit, increase in checks written in excess of cash balances of $2.9 million and payment of debt acquisition costs of $762,000 in fiscal 2013.
We had proceeds of $39.5 million and repayments of $39.5 million for the revolving line of credit, decrease in checks written in excess of cash balances of $8.7 million and payment of debt acquisition costs of $185,000 in fiscal 2012.
We had $6.6 million of net repayments on the revolving line of credit (proceeds of $205.6 million and repayments of $212.2 million), increase in checks written in excess of cash balances of $4.0 million and payment of deferred compensation of $1.3 million in fiscal 2011.
Discontinued Operations
Net cash flows provided by discontinued operations were $5.2 million for fiscal 2011 and consisted of $5.6 million of cash flows provided by operating activities, $435,000 of cash flows used in investing activities and $9,000 of cash flows used in financing activities.
Capital Resources
On November 12, 2009, we entered into a three year, $65.0 million revolving credit facility (the “Credit Facility”) with Wells Fargo Foothill, LLC as agent and lender, and a participating lender. On December 29, 2011, the Credit Facility was amended to eliminate the participating lender, reduce the revolving credit facility limit to $50.0 million, provide for an additional $20.0 million under the Credit Facility under certain circumstances and extend the maturity date to December 29, 2016. On November 20, 2012, the Credit Facility was amended to provide for the acquisition of SpeedFC, eliminate the additional $20.0 million available under the Credit Facility and extend the maturity date to November 20, 2017.
The Credit Facility is secured by a first priority security interest in all of our assets, as well as the capital stock of our companies. Additionally, the Credit Facility, as amended, calls for monthly interest payments at the bank’s base rate (as defined in the Credit Facility) plus 1.75%, or LIBOR plus 2.75%, at our discretion.
Amounts available under the Credit Facility are subject to a borrowing base formula. Changes in the assets within the borrowing base formula can impact the amount of availability. At March 31, 2013, we had $23.9 million outstanding on the Credit Facility and based on the facility’s borrowing base and other requirements, we had excess availability of $19.9 million.
In association with, and per the terms of the Credit Facility, we also pay and have paid certain facility and agent fees. Weighted-average interest on the Credit Facility was 4.38% and 4.25% at March 31, 2013 and March 31, 2012, respectively. Such interest amounts have been and continue to be payable monthly.
Under the Credit Facility we are required to meet certain financial and non-financial covenants. The financial covenants include a variety of financial metrics that are used to determine our overall financial stability and include limitations on our capital expenditures, a minimum ratio of adjusted EBITDA to fixed charges and a minimum borrowing base availability requirement. At March 31, 2013, we were in compliance with all covenants under the Credit Facility. We currently believe we will be in compliance with the Credit Facility covenants over the next twelve months.
Liquidity
We finance our operations through cash and cash equivalents, funds generated through operations, accounts payable and our revolving credit facility. The timing of cash collections and payments to vendors can require the usage of our revolving credit facility in order to fund our working capital needs. “Checks written in excess of cash balances” may occur from time to time, including period ends, and represent payments made to vendors that have not yet been presented by the vendor to our bank, and therefore a corresponding advance on our revolving line of credit has not yet occurred. On a terms basis, we extend varying levels of credit to our customers and receive varying levels of credit from our vendors. During the last twelve months, we have not had any significant changes in the terms extended to customers or provided by vendors which would have a material impact on the reported financial statements.
We continually monitor our actual and forecasted cash flows, our liquidity and our capital resources. We plan for potential fluctuations in accounts receivable, inventory and payment of obligations to creditors and unbudgeted business activities that may arise during the year as a result of changing business conditions or new opportunities. In addition to working capital needs for the general and administrative costs of our ongoing operations, we have cash requirements for among other things: (1) investments in inventory related to consumer electronics and accessories and other growth product lines; (2) investments to license content and develop software for established products; (3) legal disputes and contingencies (4) payments related to restructuring activities (5) investments to sign exclusive distribution agreements; (6) equipment needs for our operations; and (7) asset or company acquisitions.
Net cash flows provided by discontinued operations was $5.2 million for fiscal 2011.
At March 31, 2013, we had $23.9 million outstanding on our $50.0 million Credit Facility. Our Credit Facility is available for working capital and general corporate needs and amounts available are subject to a borrowing base formula. Changes in the assets within the borrowing base formula can impact the amount of availability. At March 31, 2013, based on the facility’s borrowing base and other requirements at such dates, we had excess availability of $19.9 million. At March 31, 2013, we were in compliance with all covenants under the Credit Facility and currently believe we will be in compliance with all covenants throughout the next twelve months.
We currently believe cash and cash equivalents, funds generated from the expected results of operations, funds available under our Credit Facility and vendor terms will be sufficient to satisfy our working capital requirements, other cash needs, costs of restructuring and to finance expansion plans and strategic initiatives for at least the next twelve months. Additionally, with respect to long-term liquidity, we filed a Registration Statement on Form S-3 on October 22, 2012 to renew our shelf registration statement covering the offer and sale of up to $20.0 million of common and/or preferred shares, which registration statement was declared effective on February 4, 2013. Any further growth through acquisitions would likely require the use of additional equity or debt capital, some combination thereof, or other financing.
Contractual Obligations
The following table presents information regarding contractual obligations that exist as of March 31, 2013 by fiscal year (in thousands):
| | |
Total | | | Less than 1 Year | | | 1-3 Years | | | 3-5 Years | | | More than 5 Years | |
Operating leases | | $ | 47,867 | | | $ | 3,694 | | | $ | 10,437 | | | $ | 11,142 | | | $ | 22,594 | |
Capital leases | | | 112 | | | | 45 | | | | 62 | | | | 5 | | | | — | |
License and distribution agreements | | | 974 | | | | 614 | | | | 360 | | | | — | | | | — | |
Total | | $ | 48,953 | | | $ | 4,353 | | | $ | 10,859 | | | $ | 11,147 | | | $ | 22,594 | |
____________
We have excluded liabilities resulting from uncertain tax positions of $1.1 million from the table above because we are unable to make a reasonably reliable estimate of the period of cash settlement with the respective taxing authorities. Additionally, interest payments related to the Credit Facility have been excluded as future interest rates are uncertain.
Off-Balance Sheet Arrangements
We do not have any off-balance sheet arrangements (as such term is defined in Item 303 of Regulation S-K) that are reasonably likely to have a current or future effect on our financial condition or changes in financial condition, operating results, or liquidity.
Item 7A. — Quantitative and Qualitative Disclosures About Market Risk
Market Risk.Market risk refers to the risk that a change in the level of one or more market prices, interest rates, indices, volatilities, correlations or other market factors such as liquidity will result in losses for a certain financial instrument or group of financial instruments. We do not hold or issue financial instruments for trading purposes, and do not enter into forward financial instruments to manage and reduce the impact of changes in foreign currency rates because we have few foreign relationships. Based on the controls in place and the relative size of the financial instruments entered into, we believe the risks associated with not using these instruments will not have a material adverse effect on our consolidated financial position or results of operations.
Interest Rate Risk.Our exposure to changes in interest rates results primarily from our Credit Facility borrowings. As of March 31, 2013 we had $23.9 million outstanding indebtedness subject to interest rate fluctuations. Based on these borrowings subject to interest rate fluctuations outstanding on March 31, 2013, an increase of 100-basis points in the current LIBOR rate would have a $239,000 negative impact on our annual interest expense. The level of outstanding indebtedness fluctuates from period to period and therefore could have a future impact on our interest expense.
Foreign Currency Risk. Although increasing in number, we have a limited number of customers in Canada. The majority of the sales and purchasing activity related to these customers results in receivables and accounts payables denominated in Canadian dollars. When these transactions are translated into U.S. dollars at the exchange rate in effect at the time of each transaction, gain or loss is recognized. These gains and/or losses are reported as a separate component within other income and expense. Additionally, our balance sheet pertaining to these foreign operations are translated into U.S. dollars at the exchange rate in effect at each month end. The net unrealized balance sheet translation gains and/or losses are reported as accumulated other comprehensive income or loss.
During the years ended March 31, 2013, 2012 and 2011, we had foreign exchange loss of $810,000, $330,000 and $129,000, respectively. Gain or loss on these activities is a function of the change in the foreign exchange rate between the sale or purchase date and the collection or payment of cash. Though the change in the exchange rate is out of our control, we periodically monitor our activities in Canada and Mexico and can reduce exposure from the exchange rate fluctuations by limiting these activities or taking other actions, such as exchange rate hedging.During the years ended March 31, 2013, 2012 and 2011, the Company did not have any hedging activities.
Item 8. Financial Statements and Supplementary Data
The information called for by this item is set forth in the Consolidated Financial Statements and Schedule covered by the Reports of Independent Registered Public Accounting Firms at the end of this report commencing at the pages indicated below:
Reports of Independent Registered Public Accounting Firm
Consolidated Balance Sheets at March 31, 2013 and 2012 | 77 |
| | |
Consolidated Statements of Operations and Comprehensive Income (Loss) for the years ended March 31, 2013, 2012 and 2011. | 78 |
| | |
Consolidated Statements of Shareholders’ Equity for the years ended March 31, 2011, 2012 and 2013 | 79 |
| | |
Consolidated Statements of Cash Flows for the years ended March 31, 2013, 2012 and 2011 | 80 |
| | |
Notes to Consolidated Financial Statements | 81 |
| | |
Schedule II — Valuation and Qualifying Accounts and Reserves for the years ended March 31, 2013, 2012 and 2011 | 110 |
All of the foregoing Consolidated Financial Statements and Schedule are hereby incorporated in this Item 8 by reference.
Item 9. Changes in and Disagreements with Accountants on Accounting andFinancial Disclosure
None.
Item 9A. Controls and Procedures
Evaluation of Disclosure Controls and Procedures
We maintain disclosure controls and procedures (“Disclosure Controls”), as such term is defined in Rules 13a-15(e) and 15d-15(e) under the Exchange Act, that are designed to ensure that information required to be disclosed in our Exchange Act reports, including our Annual Report on Form 10-K, was recorded, processed, summarized and reported within the time periods specified in the SEC’s rules and forms, and that such information was accumulated and communicated to our management, including our Chief Executive Officer and Chief Financial Officer, as appropriate, to allow timely decisions regarding required disclosure.
As required by Rule 13a-15(b) and 15d-15(b) promulgated under the Exchange Act, we carried out an evaluation, under the supervision and with the participation of our management, including our Chief Executive Officer and Chief Financial Officer, of the effectiveness of the design and operation of our disclosure controls and procedures as of the end of the period covered by this report. Based on that evaluation, the Chief Executive Officer and Chief Financial Officer concluded that our disclosure controls and procedures were effective as of the date of such evaluation.
Management’s Report on Internal Control over Financial Reporting
Our management is responsible for establishing and maintaining adequate internal control over financial reporting, as defined in Rule 13a-15(f) promulgated under the Exchange Act. Internal control over financial reporting is a process designed by, or under the supervision of, our Chief Executive Officer and Chief Financial Officer and effected by our Board of Directors, management and other personnel, to provide reasonable assurance regarding the reliability of financial reporting and the preparation of an issuer’s financial statements for external purposes in accordance with accounting principles generally accepted in the United States of America (“GAAP”). Internal control over financial reporting includes policies and procedures that:
(i) pertain to the maintenance of records that, in reasonable detail, accurately and fairly reflect the transactions and dispositions of an issuer’s assets;
(ii) provide reasonable assurance that transactions are recorded as necessary to permit preparation of financial statements in accordance with GAAP, and that an issuer’s receipts and expenditures are being made only in accordance with authorizations of its management and directors; and
(iii) provide reasonable assurance regarding prevention or timely detection of unauthorized acquisition, use or disposition of an issuer’s assets that could have a material effect on the consolidated financial statements.
An internal control material weakness is a significant deficiency, or combination of significant deficiencies, in internal control over financial reporting, such that there is a reasonable possibilities that a material misstatement of the annual or interim financial statements will not be prevented or detected on a timely basis. Because of its inherent limitations, internal control over financial reporting may not prevent or detect misstatements. Also, the application of any evaluation of effectiveness to future periods is subject to the risk that controls may become inadequate because of changes in conditions, or that compliance with the policies or procedures may deteriorate.
As required by Rule 13a-15(c) promulgated under the Exchange Act, our management, with the participation of our Chief Executive Officer and Chief Financial Officer, evaluated the effectiveness of our internal control over financial reporting as of March 31, 2013. Management’s assessment was based on criteria set forth by the Committee of Sponsoring Organizations of the Treadway Commission inInternal Control — Integrated Framework(“COSO”). Based on Management’s assessment, management believes that, as of March 31, 2013, our internal control over financial reporting is effective based on those criteria.
Grant Thornton LLP, our independent registered public accounting firm, has issued an attestation report, included herein, on our internal control over financial reporting.
Changes in Internal Control over Financial Reporting
There were no changes in our internal control over financial reporting that occurred during our last fiscal quarter that have materially affected, or are reasonably likely to materially affect, our internal control over financial reporting, as defined in Rule 13a-15(f) under the Exchange Act.
Item 9B. Other Information
None.
PART III
Item 10. Directors, Executive Officers and CorporateGovernance
The following chart provides the Class, Term and current Committee membership, if any, of the Company’s Directors.
Name/Title | Class | Year of Annual Meeting Term Expiration | Committee Membership |
Timothy R. Gentz Chairman of the Board | II | 2013 | Governance and Nominating (Chair) |
| | | | |
Richard S Willis President and CEO, Director | I | 2015 | -- |
| | | | |
Jeffrey B. Zisk President of SpeedFC, Director | I | 2013 (2015 if re-elected) | -- |
| | | | |
Keith Benson Director | II | 2013 | Audit (Chair) Governance and Nominating |
| | | | |
Monroe David Bryant Director | I | 2013(2015 if re-elected) | Audit |
| | | | |
Frederick C. Green IV Director | III | 2014 | Compensation (Chair) Strategic Transactions |
| | | | |
Kathleen P. Iverson Director | III | 2014 | Strategic Transactions (Chair) Audit |
| | | | |
Bradley J. Shisler Director | I | 2015 | Compensation Governance and Nominating Strategic Transactions |
| | | | |
Tom F. Weyl Director | II | 2013 | Compensation |
Identification of Directors:
Class I Directors — Terms to Expire at Annual Meeting of Shareholders in 2013
Under the terms of the Agreement and Plan of Merger related to the acquisition of SpeedFC, Inc., the Company increased the size of the Company’s board of directors from seven to nine directors, appointed Mr. Zisk and Mr. Bryant to fill the newly created vacancies until the next annual meeting of shareholders in 2013, and agreed to nominate Mr. Zisk and Mr. Bryant for re-election at the annual meeting of shareholders in 2013 for a term to expire at the annual meeting of shareholders in 2015 (three years from initial appointment as directors).
MONROE DAVID BRYANT, JR., age 61, served as a director of SpeedFC, Inc. since its founding in May 2000 until the its acquisition by the Company in November 2012, at which time he was appointed a director of the Company and a member of the Audit Committee. Mr. Bryant is a shareholder in Cox Smith Matthews, Incorporated, the largest law firm based in San Antonio, Texas. Mr. Bryant started the Dallas office of the firm in 2005 and practices litigation across several areas of law including financial fraud and bankruptcy-related litigation, technology and real estate litigation, securities and corporate governance matters and across all areas of business dispute practice. Since 2003, Mr. Bryant has also been a director of The Landrum Company and/or its principal subsidiary, The Landmark Bank, N.A., based in Columbia, Missouri. Previously, Mr. Bryant served as Vice President and General Counsel for Perot Systems Corporation, then a privately held technology services company, and as Senior Vice President and General Counsel of Amtech Corporation (NASDAQ:AMTC), a manufacturer and service provider with respect to radio frequency identification equipment. Mr. Bryant earned a J.D. degree from Harvard Law School, magna cum laude, in 1975. He is a member of the State Bars of Texas and California and also serves as a Senior Trustee of Austin College, a private liberal arts college in Sherman, Texas. Mr. Bryant’s director qualifications include his extensive legal experience and deep understanding of business litigation, banking and technology services and, as a director of SpeedFC since its inception, his knowledge of e-commerce and third party logistics services.
JEFFREY B. ZISK, age 56, founded SpeedFC, Inc. in May 2000 and served as its President, Chairman and CEO and a director since that time until its acquisition by the Company in November 2012, at which time he was appointed a director of the Company and President of SpeedFC. He has over 30 years of experience in the fulfillment, technology and retail industries. Mr. Zisk began his entrepreneurial career by partnering with Ross Perot in the successful start-up of AMWC (d.b.a. American Wholesale Club), a warehouse retailer/wholesaler of grocery, hardline and soft-line products. Following the successful sale of AMWC to a large competitor, Mr. Zisk served as CEO, President and Founder of Entertainment Foods, Inc., a manufacturer, distributor and retailer of high quality fresh prepared foods. Prior to founding SpeedFC, he also served as President and COO of Designers Collection, Inc., a Dallas-based manufacturer and distributor of home textile products and Vice President of TurboChef Inc., a cooking technology company. Mr. Zisk graduated from Vanderbilt University in 1979 with a Bachelor's of Engineering degree. He grew up in Dallas, Texas, and attended St. Marks School of Texas, a private preparatory school where he previously served as a Trustee for many years. Mr. Zisk’s director qualifications include his extensive experience as the founder and CEO of SpeedFC in end-to-end e-commerce and third party logistics services and his diverse experience in the fulfillment, technology and retail industries.
Class I Directors — Terms to Expire at Annual Meeting of Shareholders in 2015
On February 11, 2011, the Company entered into an agreement (the “Agreement”), subsequently amended on October 31, 2011, with Steven R. Becker, Matthew A. Drapkin, Becker Drapkin Management, L.P., Becker Drapkin Partners (Q.P.), L.P., Becker Drapkin Partners, L.P., BD Partners II, L.P. and BC Advisors, LLC (collectively, the “Becker Drapkin Group”). Under the Agreement, the Company agreed to increase the size of the Board from nine to ten directors and to appoint Mr. Shisler and Mr. Willis as Class I members of the Board effective within five business days of February 11, 2011. Pursuant to the Company’s Amended and Restated Articles of Incorporation, Mr. Willis and Mr. Shisler were elected by the Company’s shareholders as directors at the Annual Meeting of Shareholders held September 15, 2011 for terms expiring at the Company’s 2012 annual meeting of shareholders (the “2012 Annual Meeting”). The Board also nominated Mr. Willis and Mr. Shisler, as required by the Agreement, for re-election at the 2012 Annual Meeting and they were re-elected by the Company’s shareholders for terms expiring at the Company’s 2015 annual meeting of shareholders. The Agreement also provides that (i) the Becker Drapkin Group vote its shares at the Annual Meetings of Shareholders held in 2011, 2012 and 2013 in favor of all directors nominated by the Board provided that the nominees are either current members of the Board or otherwise reasonably acceptable to the Becker Drapkin Group.
BRADLEY J. SHISLER, age 42, has served as a director of the Company since February 2011 and is a member of the Compensation, Governance and Nominating, and Strategic Transactions Committees. Mr. Shisler currently serves on the board of directors of Pixelworks, Inc. (NASDAQ: PXLW), which creates, develops and markets video display processing technology for digital video applications that demand the very highest quality images, and on the board of directors of RealManage Holdings, Inc., a community association management company. Mr. Shisler is a Managing Director of Condire Investors, LLC and is an employee of CPMG, Inc., both of which are Dallas-based investment management companies. From September 2007 until December 2008, Mr. Shisler served as a partner at Blue River Partners, L.L.C., a start-up private equity firm formed to make control investments in lower middle-market companies. Previously, from 1996 to 2007, Mr. Shisler was a principal of Willis Stein & Partners, a private equity fund with nearly $3 billion of equity capital under management. While at Willis Stein, Mr. Shisler served on the boards of directors of Baker & Taylor Corporation, a leading national distributor of books, DVDs and music; CompuPay, Inc., a provider of outsourced payroll processing, tax filing and other related services; National Veterinary Associates, Inc., an owner and operator of 96 companion animal veterinary hospitals throughout the U.S.; and Ziff Davis Media Inc., an integrated media company focused on the technology and video game markets. Mr. Shisler has a M.B.A., with distinction, from the Kellogg School of Management at Northwestern University, as well as both a B.S. degree in chemical engineering and a B.A. degree in political science from Rice University. Mr. Shisler’s director qualifications include his deep experience with the development of corporate strategy and the oversight of its implementation that results from the active involvement in the direction of numerous companies in a variety of industries, including service on five other corporate boards and four other audit committees. Mr. Shisler has extensive private equity experience where he has evaluated hundreds of businesses for potential investment.
RICHARD S WILLIS, age 52, has served as a director of the Company since February 2011 and was a member of the Compensation Committee until his appointment as President and Chief Executive Officer of the Company in September 2011. Previously, he was the executive chairman of Charlotte Russe, a mall-based specialty retailer of value-priced women’s apparel and accessories (in 2011). From 2009 to 2011, he served as President of Shoes for Crews, a seller of slip resistant footwear. From 2003 to 2007, he was President and CEO of Baker & Taylor Corporation, the world's largest distributor of books, as well as a global distributor of DVDs and music. While at Baker & Taylor he served for two years as the Chairman of the National Association of Recording Merchandisers. Previously, Mr. Willis served as Chairman, President and CEO of Troll Communications; President and CEO of Bell Sports; and CFO of several magazine companies, including Petersen Publishing, which he helped take public in 1997. Mr. Willis has a bachelor's degree in business administration and a master's of business administration from Baylor University, where he also serves as a Regent. Mr. Willis’ director qualifications include his considerable executive leadership experience across multiple industries, including with distribution businesses that serve retailers and their suppliers. Mr. Willis’ has significant expertise in operating businesses and directing transformative changes to their strategic plans.
Class II Directors — Terms to Expire at Annual Meeting of Shareholders in 2013
KEITH A. BENSON, age 69, has served as a director of the Company since September 2003, is Chair of the Audit Committee and is a member of the Governance and Nominating Committee. Since August 2008, Mr. Benson has served in various financial support positions including CFO and Financial Advisor with Trustwater, USA, Inc., a manufacturer of water disinfectant. Until his retirement in 2002, Mr. Benson was employed in the retailing industry, including over 20 years at The Musicland Group, Inc. During his tenure at Musicland he held several key leadership positions including Executive VP of Finance, VP and Controller, President of Mall Stores Division as well as serving as Vice Chairman and CFO. He also served as a director of Musicland’s parent company, Musicland Stores Corporation (NYSE), from 1992 until its acquisition by Best Buy Co., Inc. in February 2001. Previously, Mr. Benson held a variety of financial positions with The May Company and Dayton-Hudson Corporation (now Target Corporation). Mr. Benson’s director qualifications include his extensive corporate finance and business experience in the retail industry, as well as his experience as a director of other public company boards. Mr. Benson has been designated the Audit Committee’s financial expert due to his experience in risk management, financial reporting, accounting and controls.
TIMOTHY R. GENTZ, age 63, has served as a director of the Company since May 2004 and as Chairman of the Board since September 2011 and is Chair of the Governance and Nominating Committee. From January 2005 to June 2012, Mr. Gentz was a self-employed consultant to multiple medical products and services companies and also was engaged in such activity from January to December 2003. During 2004, Mr. Gentz served as the COO of The Palm Tree Group, a Houston-based international distributor of medical products and supplies. From October 2000 to December 2002, he was the COO and CFO for Gulf South Medical Supply, Inc., a wholly-owned subsidiary of PSS World Medical (NASDAQ), Inc. Previously, Mr. Gentz was a private investor in an Internet entertainment start-up company, a CD package company, a Houston-based investment banking firm and other private companies. In May 2011, Mr. Gentz was elected as a director of TOBI, Inc. (TOAK.OB), an inactive bank holding company formerly known as Treaty Oak Bancorp, Inc. Mr. Gentz’s director qualifications include his extensive financial expertise, his diverse business experience with other public companies, and his significant distribution industry experience. His leadership skills and qualifications have been demonstrated as a CEO, COO and CFO in private and public companies.
TOM F. WEYL, age 70, has served as a director of the Company since February 2003 and is a member of the Compensation Committee. Mr. Weyl is retired from Martin/Williams Advertising, a national advertising agency. Prior to his retirement, Mr. Weyl served as President and Chief Creative Officer from 1973 to October 2000. He served as a director/organizer of the Royal Palm Bank of Naples, Florida from 2001 until December 2006. Mr. Weyl also served as a director of Musicland Stores Corporation (NYSE) from 1992 until its acquisition by Best Buy Co., Inc. in February 2001. Mr. Weyl’s director qualifications include his extensive experience in sales, advertising, branding, marketing, and communications, as well as his familiarity with public company governance and compensation structures.
Class III Director — Term to Expire at Annual Meeting of Shareholders in 2014
FREDERICK C. GREEN IV, age 56, has served as a director of the Company since September 2009 and is Chair of the Compensation Committee and a member of the Strategic Transactions Committee. Mr. Green is the Chief Development Officer of Range Systems, Inc. and Sealed Mindset, LLC, companies providing live fire shooting products and services for the military, law enforcement and consumer communities. Previously, Mr. Green was the President of Jonaco Machine, a contract manufacturer to the aerospace and medical equipment industries. From 2005 to 2010, Mr. Green was the Managing Director of Denali Partners, LLC, a private equity firm that he co-founded in 2004. Jonaco Machine was previously a portfolio company of Denali Partners and was sold by Denali in late 2010. Previously, from 2002 to 2004, he founded and was the Managing Director of Marathon Partners LLC, a management firm for the portfolio companies of private equity firms. From 1999 to 2002, he served as the Chief Operating Officer of Bracknell Corporation, a $1.4 billion facilities infrastructure company with 33 locations in North America, and previously he was the President and CEO of Nationwide Electric, Inc., a national electrical installation and services company that was acquired by Bracknell. From 1996 to 1998, he was the President and CEO of Product Safety Resources, Inc., a company focused on electronic product safety information, and from 1988 to 1996, Mr. Green held various operations and leadership positions with Emerson Electric Co. (NYSE:EMR), a multinational manufacturer of a broad range of electrical, electromechanical and electronic products and systems, including: Vice President, General Manager, Process Flow; Vice President Marketing and Sales; and Vice President of Strategic Planning and Technology. Prior to joining Emerson Electric Mr. Green was a management consultant with McKinsey & Company. Mr. Green’s director qualifications include his extensive and diverse business experience, his significant experience in merger, acquisition and divestiture transactions, his understanding of capital markets, and his extensive background in strategic planning.
KATHLEEN P. IVERSON, age 57, has served as a director of the Company since September 2008 and is Chair of the Strategic Transactions Committee and a member of the Audit Committee. Ms. Iverson has been a director of CyberOptics Corporation (NASDAQ:CYBE), a manufacturer of optical process control sensors and measurement and inspection systems used in the electronics assembly equipment market and in the semiconductor industry, since May 1998 and Chairman of the Board since August 2009, and has served as its President and CEO since January 2003. She joined CyberOptics Corporation in January 2002 as its President and COO. Previously, she was employed by Rosemount, Inc., a multinational manufacturer of high-performance instrumentation for the processing industries and a subsidiary of Emerson Electric Co. (NYSE:EMR), from 1979 through December 2001, and held various finance and leadership positions, including Vice President/General Manager, Complete Point Solutions, and Vice President/General Manager, Worldwide Temperature. Ms. Iverson’s director qualifications include her extensive experience in governance and leadership roles with other public companies, as well as her high level of financial literacy and significant corporate finance experience.
Section 16(a) Beneficial Ownership Reporting Compliance
Section 16(a) of the Exchange Act requires that the Company’s directors and executive officers, and persons who own more than 10 percent of a registered class of the Company’s equity securities, file with the SEC initial reports of ownership and reports of changes in ownership of our Common Stock. These insiders are required by SEC rules to furnish the Company with copies of all Section 16(a) forms they file, including Forms 3, 4 and 5. Based solely upon our review of Forms 3, 4 and 5 filed by the Company’s insiders, and written representations from our directors and executive officers, we believe all Section 16(a) filing requirements were met for the fiscal year ending March 31, 2013.
Audit Committee
Our Board of Directors has established a standing Audit Committee that meets regularly. The Audit Committee oversees the accounting and financial reporting processes and audits of our consolidated financial statements. The Audit Committee assists the Board in fulfilling its oversight responsibilities for the quality and integrity of our financial reports, our compliance with legal and regulatory requirements and the independent auditors’ qualifications and independence, as well as accounting and reporting processes. The Audit Committee reviews the Company’s significant controls, policies and procedures in connection with the assessment and management of enterprise risk, and coordinates with the Company’s internal auditing department to ensure that effective programs are in place to monitor compliance with applicable policies and procedures. The Audit Committee also reviews the internal and external financial reporting of the Company and reviews the scope of the independent audit. The current members of the Audit Committee are Keith A. Benson (Chair), Monroe David Bryant, Jr. and Kathleen P. Iverson. Our Board of Directors has determined that all members of the Audit Committee are financially literate and are “independent,” as that term is defined in Rule 5605(a)(2) of NASDAQ’S Marketplace Rules and SEC Rule 10A-3. The Board has determined that Keith A. Benson is qualified as an “audit committee financial expert,” as that term is defined in Item 407(d)(5)(ii) of Regulation S-K.
Code of Business Conduct and Ethics
On March 29, 2004, the Board of Directors adopted a Code of Business Conduct and Ethics (the “Code of Conduct”), that applies to all of our directors, officers and employees.Our Code of Conduct is available on our website,www.navarre.com. A copy of our Code of Conduct may also be obtained, without charge, upon written request to: Navarre Corporation, Investor Relations, 7400 49th Avenue North, Minneapolis, MN 56428. The Audit Committee is responsible for overseeing compliance with the Code of Conduct and reviewing and updating the Code of Conduct. The Audit Committee reviewed the Code of Conduct in fiscal year 2013 and determined that no amendments were warranted. In accordance with the NASDAQ Marketplace Rules, any waivers of the Code of Conduct for directors and executive officers must be approved by our Board of Directors. No waivers were granted during fiscal year 2013.
Item 11. Executive Compensation
COMPENSATION DISCUSSION AND ANALYSIS
The Compensation Discussion and Analysis discusses the Company’s compensation philosophy, policies, practices and decisions that were applicable in fiscal year 2013 with respect to: (i) our Chief Executive Officer (“CEO”) (our principal executive officer); (ii) our Chief Financial Officer (“CFO”) (our principal financial officer); (iii) the two remaining executive officers that were serving as such at March 31, 2013; and (iv) one former executive officer who was not serving as an executive officer at March 31, 2013 but whose total compensation in fiscal year 2013 would have been among the three other most highly compensated executive officers (collectively, the “Named Executive Officers” or “NEO’s”), as follows:
Name | Position |
| | |
Richard S Willis | President and CEO |
Diane D. Lapp | CFO |
Ward O. Thomas | President of Distribution |
Jeffrey B. Zisk | President of SpeedFC |
Joyce A. Fleck | Former President of Business and Logistics Services |
This discussion should be read in conjunction with the “Executive Compensation Tables” and accompanying narrative disclosure. The tables and narrative provide more detailed information regarding the total compensation and benefits awarded to, earned by, or paid to the Named Executive Officers during fiscal year 2013, and, depending on tenure, during fiscal years 2012 and 2011.
Executive Summary
General Overview
It is the overall goal of our executive compensation program to provide compensation that is reasonable and fair to both the Company and to the Named Executive Officer in light of the performance of the Company, the contribution of each executive officer to that performance and the competition the Company faces to attract and retain highly qualified executive officers. The Named Executive Officers are compensated with a combination of base salary, annual cash incentive opportunity and long-term incentives in the form of equity awards under the Company’s shareholder-approved equity plan. Base salary provides the Named Executive Officers with a fixed level of cash compensation in line with their individual experience and responsibilities and market factors. The annual cash incentive provides the Named Executive Officers an opportunity for short-term returns linked to specified Company performance measures. Annual equity awards focus the Named Executive Officers on the long term future performance of the Company and building shareholder value. The Named Executive Officers also participate in benefit and retirement plans generally available to the Company’s other employees.
Executive Compensation Philosophy
We recognize that the success of our Company depends on the talent of our workforce and our relationships with customers and suppliers. The first tenet of our executive compensation philosophy is to develop and retain a high quality professional management team that is able to develop and strengthen relationships with customers and suppliers over the long term and to profitably grow our business. The executive compensation program must be competitive with the practices of other organizations in similar industries and of similar sizes in order to facilitate the recruitment of strong leaders as we expand our product and service offerings. We consider compensation to be appropriately competitive if it is within a range of between -15% and +15% of the median of comparative total compensation market data.
The second tenet of our executive compensation philosophy is to reward our executives fairly and provide proper and balanced incentives in support of long-term value creation for our shareholders. When executives contribute to the attainment of Company financial performance which exceeds a designated threshold amount, they are rewarded with attractive, but capped, annual cash incentive awards. In years when performance is below expectations, the executives receive little or no annual cash incentive. In terms of long-term incentives, we believe that the performance of our stock is the best measure of our performance. The opportunity for our executives to participate in the performance of our stock through equity grants is the most direct link between both performance and pay and between our executives and our shareholders. We reward our executives with equity incentives to more closely align their interests with those of our shareholders, and we maintain ownership guidelines to reinforce that link.
These tenets guide the Compensation Committee in seeking to design effective pay programs and assessing the proper allocation between base salary, annual incentive compensation, and long-term compensation. In addition, in fiscal year 2011 and fiscal year 2012, the Compensation Committee retained Pearl Meyer & Partners (“PM&P”) as an independent consultant to advise the Committee on executive compensation matters, including program design, best practices and market trends, and to provide competitive market data regarding executive compensation levels and components of compensation. PM&P was not retained by the Compensation Committee in fiscal year 2013.
Summary of Key Fiscal Year 2013Compensation Elements and Actions
Annual
Compensation
Component | Key Features | Purpose | Fiscal Year 2013 Design/Actions |
Base Salary | Fixed annual cash amount.
Base pay increases considered on an annual basis to reward performance and align within the median range of our comparator group. | Provide a fixed amount of cash compensation upon which the Named Executive Officers can rely which is critical to attract and retain qualified individuals.
Adjustments in base salary used to reward individual performance and reflect increased responsibilities. | No increases were made to the base salaries of the Named Executive Officers except for Ms. Fleck as described below. Mr. Willis took a voluntary $100,000 reduction to his base salary for the 2013 fiscal year. |
Annual
Incentive
Plan
(Cash
Incentive
Award) | Named executive officers participate in the same Annual Incentive Plan as other management employees.
Compensation Committee established short-term financial goals based on adjusted EBITDA and Net Sales targets to reflect focus on revenue growth and profitability with no bonus accrual below a designated threshold adjusted EBITDA amount.
Individual Named Executive Officers performance evaluated against consolidated financial goals and those of their respective business units. | Motivate and reward achieving or exceeding Company, business unit and individual performance goals, reinforcing pay-for-performance.
Focus our entire organization on key business objectives and motivate our Named Executive Officers to lead their organizations to achieve short-term financial goals. | Annual Incentive Plan design remained the same as previous year.
Since the Company’s consolidated adjusted EBITDA did not reach the threshold amount, the Named Executive Officers did not earn an annual incentive award for fiscal year 2013 under the Plan, however, discretionary bonuses were awarded by the Compensation Committee to certain Plan participants. |
Long-Term
Incentive
Compensation (Awarded value delivered through grants of stock options and restricted stock units). | Stock options: generally vest in one-third increments over three-year service period.
Restricted Stock Units: generally vest in one-third increments over three-year service period; Award settled in shares of Company stock. | Equity awards support our growth strategy, provide a link between the Named Executive Officers and our shareholders, and due to vesting over time serve as a retention tool. Restricted stock units provide added retention value as, unlike underwater stock options, they maintain value in times of stock volatility. | The aggregate grant date fair value of all employee equity awards granted in fiscal year 2013, as a percent of aggregate base salaries, was greater than the Company’s historical norm for the past several years but less than the competitive median determined by PM&P in fiscal year 2012. In fiscal year 2013, the Named Executive Officers realized $46,374 on the exercise of vested stock options (departing NEO, Ms. Fleck) and they realized an aggregate of $154,099 on the vesting of restricted stock units. |
Pay for Performance
The annual cash incentive and long-term incentive components of our compensation program reflect our pay-for-performance philosophy, since annual cash incentives are paid upon the achievement of a set of measurable Company financial performance metrics, and equity award values depend on the value of the Company’s stock, thus encouraging achievement of long-term value creation that benefits all shareholders. To avoid excessive windfall payments, annual cash incentives are capped at 150% of target values, and the Compensation Committee retains discretion, including negative discretion, in modifying awards.
Good Governance
| | ● | Compensation Decision Independence: The Compensation Committee is comprised solely of independent directors, and the Compensation Committee periodically uses an independent and conflict-free compensation consultant that does not provide any other services to the Company. We will continue to monitor Committee and consultant independence and comply with exchange listing standards promulgated in accordance with the SEC rule adopted under the Dodd-Frank Act. |
| | ● | Ownership Guidelines: The Named Executive Officers are subject to stock ownership guidelines with an expectation that they reach a certain level of stock ownership within five years of assuming their current position through stock purchases and retention of shares acquired through equity grants. The Compensation Committee regularly reviews achievement of the guidelines and may consider failure to meet the goals as a negative factor when making compensation decisions. |
| | ● | Hedging Prohibited: The Named Executive Officers are prohibited from engaging in any speculative transactions in our Common Stock and from hedging the economic risk of ownership of our Common Stock. |
| | ● | Clawbacks: When the SEC adopts final rules regarding “clawback” of incentive compensation, the Board intends to adopt a “clawback” policy in accordance with those rules providing for recovery of incentive compensation, if any, in excess of what would have been paid to officers of the Company in the event that the Company is required to restate financial results. |
| | ● | Risk Assessment: When creating compensation incentives, the Compensation Committee discusses and considers any enterprise risks that the Named Executive Officers may be incentivized to take in order to achieve the compensation goals. The Compensation Committee believes that the Company’s compensation policies and programs do not create any risks that are reasonably likely to have material adverse effect on the Company. |
| | ● | No Excise Tax Gross-Ups: The Company has not entered into any agreements with the Named Executive Officers that provide for IRC Section 280G excise tax gross-ups with respect to payments contingent upon a change in control. |
| | ● | No Supplemental Retirement Plans: The Named Executive Officers do not participate in any executive retirement plans other than the 401(k) plan available to all employees. |
| | ● | No Option Repricings: Even though a significant portion of the Company’s outstanding stock options have been underwater for the past several years, the Company has not repriced or replaced any underwater stock options. |
Say-on-Pay Voting Results
The Compensation Committee considers the prior year shareholder advisory vote on the compensation of the Named Executive Officers as appropriate in making compensation decisions. At the annual meeting of shareholders held in November 2012, more than seventy-eight percent of the shareholders present and voting on the matter approved, on an advisory basis, the compensation disclosed in the Company’s proxy statement for the meeting. As a result, the Compensation Committee concluded that the Company's shareholders were generally supportive of the Company's executive compensation philosophy, policies and programs. The Compensation Committee determined to continue such philosophy, policies and programs, with such updates and modifications as appropriate for changing circumstances.
Compensation Setting Process
Role of the Compensation Committee
The Compensation Committee is responsible for our executive compensation philosophy, the design of our executive compensation programs and the administration of our compensation and benefit plans. The Compensation Committee, which is composed entirely of independent, non-employee directors, determines the compensation paid to the CEO and reviews and approves the compensation paid to other executive officers (further detail as to the Committee’s roles and responsibilities can be found in our charter available for viewing and downloading on the Company’s website atwww.navarre.com and may be found by selecting the “Investors�� tab and then clicking on the “Corporate Governance” link). Compensation Committee members for fiscal year 2013 were: Mr. Green (Chair); Mr. Shisler; and Mr. Weyl.
In setting compensation for the Named Executive Officers, the Compensation Committee:
| | ● | Reviews external market data; |
| | ● | Confirms the reasonableness of total compensation and of each component of compensation when compared to competitive market data; |
| | ● | Evaluates overall Company performance in relation to financial and strategic objectives, competition and industry circumstances; |
| | ● | In conjunction with the other independent directors on the Board, reviews and approves the annual goals and objectives for the CEO and evaluates the CEO’s performance in light of the established goals and objectives and strategic and operational accomplishments; |
| | ● | For other Named Executive Officers, reviews annual goals and objectives and assesses individual performance and any changes in duties and responsibilities; |
| | ● | Adjusts base salaries, as appropriate, based on job performance, leadership, tenure, experience, and other factors, including competitive market data; |
| | ● | Approves the design of the annual cash incentive plan, establishes the annual financial objectives for the plan and assesses Company performance in light of the pre-established goals; and |
| | ● | Grants awards under our long-term incentive plan, as appropriate, based on competitive market data and an evaluation of the current performance and future potential of each Named Executive Officer. |
.
The Compensation Committee regularly holds executive sessions that are not attended by any members of management or non-independent directors. The Compensation Committee has the ultimate authority to make decisions with respect to the compensation of our Named Executive Officers, but may, if it chooses, delegate any of its responsibilities as allowed under applicable law. The Compensation Committee has delegated to any two of the following — CEO, CFO, and General Counsel — the authority to grant long-term incentive awards to non-executive officers under limited circumstances and pursuant to specific guidelines established by the Compensation Committee. The Compensation Committee has not delegated any of its authority with respect to the compensation of executive officers. The Compensation Committee normally discusses compensation decisions with respect to the CEO in executive sessions without the CEO or other management present, and makes determinations regarding the CEO in consultation with the independent directors on the Governance and Nominating Committee.
Role of Management
Most Compensation Committee meetings, except for the executive portions thereof, are attended by the CEO and a representative of Human Resources. Depending on the topics to be discussed, the CFO and/or General Counsel may also attend. The CEO’s role in the Compensation Committee process is oversight of all of management’s recommendations and reports to the Compensation Committee and/or Board of Directors. The CEO provides direct input to the Compensation Committee on such matters as the affordability and efficacy of various plan designs. The CEO may also make recommendations with respect to scheduling meetings and agenda topics and occasionally meets with Compensation Committee members outside of scheduled meetings. The Compensation Committee considers the CEO’s input, but ultimately makes all of its decisions independently. The CEO sets objectives each year for the other Named Executive Officers which are tailored to the duties and responsibilities of the particular officer and the challenges that his or her business or functional unit faces. The Compensation Committee reviews and approves the objectives. Following the end of the fiscal year, the CEO, also with the oversight of the Compensation Committee, evaluates the performance of the other Named Executive Officers against their individual objectives for the year.
Management makes recommendations to the Compensation Committee on the base salary, annual incentive plan targets and equity compensation for the executive team and other employees. The Compensation Committee considers, but is not bound to and does not always accept, management’s recommendations with respect to executive compensation.
Role of Independent Compensation Consultants
The Compensation Committee has from time to time engaged independent compensation consultants to advise on executive compensation levels and practices, plan designs and competitive market data. In fiscal year 2011 and fiscal year 2012, the Compensation Committee engaged Pearl Meyer & Partners (“PM&P”), a consultant that specializes in providing compensation services to boards of directors and that has never provided any compensation or other services to our management. PM&P was selected for its experience and independence and lack of conflict. It has been a leading compensation consultant to boards of directors for over two decades and it has never provided any compensation or employee benefits services to the Company’s management. The Compensation Committee did not engage PM&P to provide a competitive market review during fiscal year 2013.
Compensation Mix
Our executive compensation is comprised primarily of the following elements: fixed cash compensation, in the form of base salary; and variable compensation, in the form of short-term annual incentive pay and long-term incentive compensation. Long-term incentive compensation consists of equity grants, while short-term incentive compensation is paid in cash. Although, the Compensation Committee has not set specific targets for the relative percentages of these elements, it strives for a balance that rewards executives for the achievement of short-term (annual) goals while also focusing on the long-term revenue and profitability of the Company. Because the Compensation Committee believes that the CEO has a greater impact on the achievement of long-term targets, it determined that variable compensation should constitute a greater percentage of his compensation when compared to the other Named Executive Officers ("NEO"). For fiscal year 2013, the relative percentages of these elements were as follows:
Relative Percentages of Compensation Elements for NEO’s serving as of March 31, 2013
NEO | | Base Salary | | | Percent of Total | | | Target Annual Incentive | | | Percent of Total | | | Long Term Incentive Grant Date Fair Value | | | Percent of Total | |
| | | | | | | | | | | | | | | | | | | | | | | | | |
Richard S Willis | | $ | 450,000 | (1) | | | 32 | % | | $ | 360,000 | | | | 25 | % | | $ | 617,540 | | | | 43 | % |
Diane D. Lapp | | $ | 255,000 | | | | 47 | % | | $ | 127,500 | | | | 24 | % | | $ | 154,784 | | | | 29 | % |
Ward O. Thomas | | $ | 270,000 | | | | 51 | % | | $ | 135,000 | | | | 26 | % | | $ | 120,887 | | | | 23 | % |
Jeffrey B. Zisk | | $ | 325,000 | | | | 67 | % | | $ | 162,500 | | | | 33 | % | | $ | 0 | | | | 0 | % |
(1) | Mr. Willis voluntarily reduced his Base Salary to $350,000 for the duration of fiscal year 2013, therefore his actual relative percentages were 26%, 27% and47% for Base Salary, Target Annual Incentive and Long Term Incentive, respectively. |
Base Salary Compensation
Base salary is used to provide competitive levels of compensation to executives based upon their experience, duties and areas of responsibility. We pay base salaries because it provides a fixed level of compensation that we feel is necessary to recruit and retain executives. An important aspect of base salary is the Compensation Committee’s ability to use annual base salary adjustments, when the financial performance of the Company permits, to reflect an individual’s performance or changed responsibilities. The Compensation Committee monitors the performance of the executive officers on individual performance objectives established for the fiscal year and annually reviews their base salaries.
The Compensation Committee’s goal is to set base salaries for each executive, including the CEO, at a level that reflects each individual’s performance and organizational impact and at a competitive level nationally. Differences in the amount of base salary between the Named Executive Officers reflect the Compensation Committee’s assessment of the differences in the scope of each executive’s responsibilities and contributions in light of competitive pay levels for similar positions in other similarly situated organizations.
Fiscal Year 2013 Base Salary Actions:
In connection with a restructuring of leadership responsibilities in April 2012, and for internal pay equity considerations, the Committee approved a 4.9% increase in the base salary of Ms. Fleck from $257,500 to $270,000. The Committee did not approve any other base salary increases for NEO’s in fiscal year 2013. Mr. Willis voluntarily reduced his base salary to $350,000 for the duration of fiscal year 2013.
Upon the acquisition of SpeedFC in November 2012, Mr. Zisk’s base salary was set at $325,000.
Annual Incentive Compensation
Annual incentive compensation is used to reward executives for their contributions toward the achievement of the Company’s short-term goals for the current year. Executive officers and other management employees selected by the Compensation Committee participate in the Company’s Annual Incentive Plan. The fiscal year 2013 target amounts approved by the Compensation Committee under the Annual Incentive Plan were intended to provide annual cash compensation (i.e., base salary plus annual incentive) within the competitive range of market data as determined in prior years, provided that the Company’s goals were met.
Annual Incentive Opportunity and Results for NEO’s serving as of March 31, 2013
| | | Target | | | Target Percent | | | Maximum | | | Maximum Percent | | | Actual | |
NEO | | Award | | | of Base Salary | | | Award | | | of Base Salary | | | Award | |
| | | | | | | | | | | | | | | | | | | | | |
Richard S Willis | | $ | 360,000 | | | | 80 | % | | $ | 540,000 | | | | 120 | % | | $ | 100,000 | |
Diane D. Lapp | | $ | 127,500 | | | | 50 | % | | $ | 191,250 | | | | 75 | % | | | 0 | |
Ward O. Thomas | | $ | 135,000 | | | | 50 | % | | $ | 202,500 | | | | 75 | % | | $ | 74,000 | |
Jeffrey B. Zisk | | $ | 162,500 | | | | 50 | % | | $ | 243,750 | | | | 75 | % | | | 0 | |
For fiscal year 2013, the Annual Incentive Plan performance measures for the Named Executive Officers were based on earnings before interest, depreciation and amortization and excluding stock based compensation expense and after the bonus pool accrual (“Adjusted EBITDA”), weighted at 75%, and net sales, weighted at 25%. The Compensation Committee selected the following financial objectives for fiscal year 2013: target consolidated Adjusted EBITDA of $11 million and target consolidated net sales of $478 million. The Compensation Committee chose earnings and sales performance criteria for fiscal year 2013 because it believed these are critical drivers of our strategy to achieve profitable and sustainable growth, and thereby create long-term value for our shareholders. The annual plan design contains a performance threshold. Other than possible discretionary awards as discussed below, annual incentives would not be earned if funding any portion of the annual incentive pool caused the Company to fail to achieve at least 80% of the consolidated Adjusted EBITDA target. The plan design also provided an opportunity for participants to earn an enhanced annual incentive based on Adjusted EBITDA growth. If consolidated Adjusted EBITDA (inclusive of the annual incentive pool accrual) exceeds the target, then the annual incentive pool is increased by 25% of the excess amount. Participants share in the enhanced annual incentive pool on a pro rata basis taking into consideration the achievement of the financial and individual objectives applicable to each participant. However, annual incentive payments under the Plan, including the growth enhancement, are capped at 150% of a participant’s target annual incentive. For fiscal year 2013, the Compensation Committee included in the plan design a potential discretionary pool of up to $500,000, which may or may not be awarded in whole or in part. The Compensation Committee may determine, in its discretion, to reward participants with exemplary performance during the fiscal year out of the discretionary pool whether or not the Company’s financial objectives are achieved. The Compensation Committee also reserved the right to change, suspend, or discontinue the Annual Incentive Plan at any time without prior notice to participants.
At the time the annual financial objectives were determined, the Compensation Committee believed the Adjusted EBITDA and net sales targets to be appropriately challenging but realistic under the current economic conditions. Since the consolidated Adjusted EBITDA threshold was not met, no annual incentive was earned under the annual incentive plan pool for fiscal year 2013 regardless of actual results on the other objectives. After careful consideration, the Compensation Committee approved the award of discretionary bonus payments under the Plan to certain participants in an aggregate amount of $500,000. Of the NEO’s, Mr. Willis received an award of $100,000, Mr. Thomas received an award of $74,000, and the remainder of the awards were granted to 21 other Plan participants. These discretionary awards were made based on a number of factors including: (i) to recognize the significant progress made during fiscal year 2013 towards executing the Company’s strategic plan; (ii) to bolster the morale of key personnel; and (iii) to retain and ensure the engagement of key personnel during the ongoing integration of SpeedFC and the associated structural changes in the Company.
Long-Term Incentive Compensation
Long-term incentive compensation is used to reward executives for their contributions toward the achievement of the Company’s long-term goals. Changes in Company stock price have a direct effect on the amount of compensation the Named Executive Officers realize from long-term incentive compensation. This encourages long-term value creation that benefits all shareholders. In addition, multi-year vesting of long-term incentive compensation encourages the retention of our Named Executive Officers.
PM&P’s analysis prepared in fiscal year 2012 indicated that the Company’s long-term incentive compensation, as measured by the value of the prior year grants, was generally below the competitive range of the comparative market data. This also lowers the total direct compensation of the Named Executive Officers. When determining the size of individual long term incentive awards and the total number of long term incentive awards for all management employees for the fiscal year, the Compensation Committee considers:
| | ● | the projected impact on our Company’s earnings for the anticipated fiscal year grants and outstanding grants from prior years; |
| | ● | the value of the equity awards in the competitive range of the comparative market data; |
| | ● | the reasonableness of the proportion of our total shares outstanding (our “run rate”) used for annual equity grants; and |
| | ● | the reasonableness of the potential voting power dilution to our shareowners (our “overhang”). |
Fiscal Year 2013 Long-Term Incentive Actions:
Of the long term incentive awards granted in fiscal year 2013 (excluding grants to Non-employee Directors), 78% were time vested nonqualified stock options and 22% were time vested restricted stock units. The Compensation Committee determined that the restricted stock units will continue to provide an enhanced retention incentive to employees. In addition, the grant of restricted stock units consumes fewer shares under the Company’s shareholder authorized stock plan and has been determined by the Compensation Committee to be consistent with the compensation trends as previously reported by PM&P. The non-qualified stock option awards vest over three years and expire ten years from the grant date provided that the participant is still employed by the Company. The restricted stock units also generally vest over three years. Upon vesting, participants, who are still employed by the Company, will receive one unrestricted share of Common Stock for each vested restricted stock unit.
The Named Executive Officers received long-term incentive awards in fiscal year 2013 covering a total of 773,056 shares, which was less than the shares granted to the same individuals in fiscal year 2012 by 236,944 shares as a result of a grant to Mr. Willis which was smaller than his new hire grant in the prior year and the departure of Ms. Fleck who did not receive a grant in fiscal year 2013. All other employees received long-term incentive awards in fiscal year 2013 covering a total of 632,162 shares compared to 394,500 shares in fiscal year 2012. The individual NEO’s received equity grants as follows:
Mr. Willis was granted 110,000 restricted stock units and a stock option covering 400,000 shares. Ms. Lapp was granted 27,663 restricted stock units and a stock option covering 100,107 shares. Mr. Thomas was granted 29,290 restricted stock units and a stock option covering 105,996 shares.
Equity Grant Process
Equity-based incentives are granted under our shareholder-approved Amended and Restated 2004 Stock Plan. The Compensation Committee has granted equity awards at its scheduled meetings or by written action without a meeting. These actions are taken on the same day as, or prior to, the grant date. Annual grants are normally discussed and granted in scheduled meetings taking place in September and/or October and become effective and are priced as of the beginning of the first day of the open trading window after public disclosure of the Company’s second quarter financial results. Under authority delegated by the Compensation Committee, management may grant equity awards to employees (other than executive officers) as part of a new hire offer, promotion or reward/incentive for significant achievement, up to 10,000 shares per individual. Grants made outside of the annual grant are effective as of the date of approval or at a predetermined future date (for example, new hire grants are effective as of the later of the date of approval or the newly hired employee’s start date). All stock option grants have a per share exercise price no less than the fair market value of our Common Stock on the grant date, defined as the opening price for our Common Stock on the NASDAQ Global Market during a regular trading session or, if the grant date is not a trading day, then the last reported sales price listed on the NASDAQ Global Market prior to the grant date. The Compensation Committee does not grant equity compensation awards to executives in anticipation of the release of material nonpublic information that is likely to result in changes to the price of our Common Stock. Similarly, the Company does not time the release of material nonpublic information based on equity award grant dates.
Benefits and Executive Perquisites
The main objectives of our benefits program is to enhance health and productivity and give our employees access to quality healthcare, insurance protection from unforeseen events and assistance in achieving retirement financial goals.
In fiscal year 2013, the Named Executive Officers were eligible to receive the following benefits that are generally available to all our employees: (i) group medical and dental insurance; (ii) group long-term and short-term disability insurance; (iii) group life and accidental death and dismemberment insurance; (iv) medical and dependent care flexible spending accounts; (v) wellness programs; (vi) educational assistance; (vii) employee assistance; and (viii) paid time-off policies, including vacation, sick time, and holidays. In addition, we maintain a tax-qualified 401(k) Plan, which provides for broad-based employee participation. Under the 401(k) Plan, all participating employees are eligible to receive, at the discretion of the Company determined on an annual basis, a matching contribution of 50% of the participant’s contribution up to 4% of base pay. If granted, the matching contribution vests over three years and is generally calculated and paid in April or May for all employee contributions made during the preceding calendar year by participants employed on the last day of the calendar year. The 401(k) Plan match and the incremental value of benefits provided to the Named Executive Officers under the Company’s benefits program are included in the “All Other Compensation” column of the “Summary Compensation Table”. We do not provide defined benefit pension plans or defined contribution retirement plans to executives or other employees other than the 401(k) Plan.
In general, we do not offer executive perquisites to our officers. However, in some cases, specific perquisites are negotiated at the time of an executive’s initial recruitment or promotion to a new position. In FY2013, these included for Mr. Willis reimbursement for out-of-pocket family medical expenses up to $12,000 per plan year; and, in lieu of relocation benefits, reimbursement on a tax neutral basis for reasonable commuting expenses between Texas and Minnesota, including airfare, lodging and local transportation. The dollar values for all perquisites are included in the “All Other Compensation” column of the “Summary Compensation Table.”
Executive Employment Agreements
We have entered into agreements regarding employment and/or severance with each of the Named Executive Officers, the terms of which are described under “Executive Severance and Change in Control Agreements.” The Compensation Committee believes that such employment agreements promote the stability of the Company by (i) lessening the personal uncertainties and potential distraction of the executives created by Company actions resulting in a termination of their employment for reasons other than cause and (ii) establishing the rights and obligations of both the Company and the executive after the employment relationship ends. In addition, reasonable severance arrangements offer a competitive benefit and aid in retention of the services of valuable executives.
The Compensation Committee believes that the amount of severance offered to the Named Executive Officers is not excessive and that the trigger for severance payments, which in all cases is involuntarily termination by the Company without cause or constructive termination due to adverse Company actions, is appropriate and in the best interests of the shareholders. Further, the Compensation Committee believes that the differences in the amount of severance offered among the Named Executive Officers are justified by the scope of each executive’s responsibilities and contributions. As described under “Executive Severance and Change in Control Agreements,” the Company negotiated and entered into an employment and severance agreement with Mr. Zisk in connection with the acquisition of SpeedFC in November 2012. Otherwise, no changes were made to the employment and severance agreements in fiscal year 2013.
Accounting and Tax Considerations
We aim to keep the expense related to our compensation programs as a whole within affordability levels. If we increase benefits under one program resulting in higher compensation expense, we may seek to decrease costs under another program in order to avoid a compensation expense that is above our affordability level.
In addition, we have not provided any executive officer or director with a gross-up or other reimbursement for tax amounts the executive might pay pursuant to Section 280G or Section 409A of the Internal Revenue Code (the “IRC”). IRC Section 280G and related IRC sections provide that executive officers, directors who hold significant shareholder interests and certain other service providers could be subject to significant additional taxes if they receive payments or benefits in connection with a change in control of the Company that exceeds certain limits, and that the Company or its successor could lose a deduction on the amounts subject to the additional tax. IRC Section 409A also imposes additional significant individual taxes in the event that an executive officer, director or service provider receives “deferred compensation” that does not meet the requirements of IRC Section 409A. To assist in the avoidance of additional tax under IRC Section 409A, we structure equity awards and executive employment agreements in a manner intended to comply with the applicable IRC Section 409A requirements.
IRC Section 162(m) prohibits the Company from deducting as compensation expense amounts exceeding $1,000,000 a year for the CEO and the other Named Executive Officers (excluding the CFO) relating to the period during which the compensation is earned, unless the payment of such compensation is based on pre-established, objective performance goals approved by the shareholders. We anticipate that all compensation expense related to realized stock option gains will qualify for deduction under Section 162(m). A portion of executive compensation, however, will continue to be based on significant subjective measures that may cause certain compensation not to be deductible. We intend to consider the impact of IRC Section 162(m) when making future compensation decisions but believe it is important to continue to evaluate the performance of executive officers, in part, on subjective performance measures.
COMPENSATION COMMITTEE REPORT
The information contained in this report shall not be deemed to be “solicitingmaterial” or “filed” with the SEC or subject to the liabilities of Section 18 ofthe Securities Exchange Act of 1934 (the “Exchange Act”), except to the extent thatNavarre specifically incorporates it by reference into a document filed under theSecurities Act of 1933 (the “Securities Act”) or the Exchange Act.
The Compensation Committee has reviewed and discussed with management the Compensation Discussion and Analysis for fiscal year 2013. Based on the review and discussions, the Compensation Committee recommended to the Board, and the Board has approved, that the Compensation Discussion and Analysis be included in this Form 10-K for fiscal year 2013.
This report is submitted by the Compensation Committee:
Frederick C. Green IV (Chair)
Bradley J. Shisler
Tom F. Weyl
RISK ASSESSMENT OF OUR COMPENSATION POLICIES AND PRACTICES
The Compensation Committee, with the assistance of management, reviews periodically and at least on an annual basis the Company’s compensation policies and programs for all employees for the purpose of assessing the risks associated with compensation. The Compensation Committee has reviewed the compensation program details, participant information, plan administrative oversight and design features with respect to (i) base salary determination as applicable to our executive officers; (ii) short term incentive pay for director-level employees and above under the annual incentive plan; (iii) short term incentive pay in the form of a quarterly or monthly sales bonus program for a small number of sales employees; and (iv) long term incentive in the form of equity grants to director-level employees and above. The Committee reviewed the strategies that are tied to these compensation practices and identified both the risks inherent in these programs and the following factors that mitigate any such risks to acceptable levels:
| | ● | Appropriate mix between short-term cash compensation and long-term equity grants. |
| | ● | Participation in the same annual incentive and long-term equity plans by all director-level and above employees. |
| | ● | Maximum payout levels for annual incentive capped at 150% percent of target. |
| | ● | Negative discretion over annual incentive program payouts and sales bonus programs may be exercised. |
| | ● | Ranges for annual incentive metrics established to avoid payouts on an “all or nothing” basis. |
| | ● | Multi-year and overlapping vesting schedules for long-term equity grants. |
As a result of the foregoing review, the Compensation Committee determined that the Company’s compensation policies and programs do not create risks that are reasonably likely to have a material adverse effect on the Company.
COMPENSATION COMMITTEE INTERLOCKS AND INSIDER PARTICIPATION
No member of the Compensation Committee is a current or former officer or employee of the Company or any of its subsidiaries. In addition, no member of the Compensation Committee is an executive officer of another entity where any of the Company’s executives serve on the other entity’s compensation committee.
EXECUTIVE COMPENSATION TABLES
Summary Compensation Table
Name and Principal Position | |
Year | |
Salary ($) | | |
Stock Awards ($)(1) | | |
Option Awards ($)(2) | | | Non-Equity Incentive Plan Compensation ($)(3) | | |
All Other Compensation ($)(4) | | |
Total ($) | |
Richard S Willis, (5) | | 2013 | | | 350,000 | | | | 192,500 | | | | 425,040 | | | | 100,000 | | | | 97,251 | | | | 1,164,791 | |
President and CEO | | 2012 | | | 237,115 | | | | 378,000 | | | | 519,555 | | | | 0 | | | | 68,068 | | | | 1,202,738 | |
| | | | | | | | | | | | | | | | | | | | | | | | | | �� | |
Diane D. Lapp, (6) | | 2013 | | | 255,000 | | | | 48,410 | | | | 106,374 | | | | 0 | | | | 4,430 | | | | 414,214 | |
Chief Financial Officer | | 2012 | | | 232,654 | | | | 86,200 | | | | 53,292 | | | | 0 | | | | 4,105 | | | | 376,251 | |
| | | | | | | | | | | | | | | | | | | | | | | | | | | |
Ward O. Thomas, | | 2013 | | | 270,000 | | | | 51,258 | | | | 69,629 | | | | 74,000 | | | | 4,900 | | | | 469,787 | |
President of Distribution | | 2012 | | | 270,000 | | | | 39,500 | | | | 66,615 | | | | 0 | | | | 1,745 | | | | 377,860 | |
| | | 2011 | | | 159,923 | | | | 41,998 | | | | 75,375 | | | | 0 | | | | 0 | | | | 277,296 | |
| | | | | | | | | | | | | | | | | | | | | | | | | | | |
Joyce A. Fleck, (7) | | 2013 | | | 144,106 | | | | 0 | | | | 0 | | | | 0 | | | | 341,900 | | | | 486,006 | |
Former President of Business and | | 2012 | | | 257,500 | | | | 39,500 | | | | 66,615 | | | | 0 | | | | 4,900 | | | | 368,515 | |
Logistics Services | | 2011 | | | 253,173 | | | | 42,400 | | | | 74,760 | | | | 0 | | | | 4,900 | | | | 375,233 | |
| | | | | | | | | | | | | | | | | | | | | | | | | | | |
Jeffrey B. Zisk, (8) | | 2013 | | | 106,694 | | | | 0 | | | | 0 | | | | 0 | | | | 0 | | | | 106,694 | |
President of SpeedFC | | | | | | | | | | | | | | | | | | | | | | | | | | |
(1) | The amounts in this column represent the grant date fair value of all restricted stock units awarded in the applicable fiscal year as determined using the opening sale price of our Common Stock on such date. This amount was computed in accordance with Financial Accounting Standards Board Accounting Standards Codification (ASC) Topic 718. We recognize the expense for financial reporting purposes over the applicable vesting period. |
| | |
(2) | The amounts in this column represent the grant date fair value of all stock options awarded in the applicable fiscal year as determined using the Black-Scholes pricing model. This amount was computed in accordance with Financial Accounting Standards Board Accounting Standards Codification (ASC) Topic 718. The assumptions used to arrive at the Black-Scholes value are discussed in Note ___ to our consolidated financial statements included in our Annual Report on Form 10-K for the fiscal year ended March 31, 2013. We recognize the expense for financial reporting purposes over the applicable vesting period. |
| | |
(3) | The amounts in this column represent the annual incentive paid under our Annual Incentive Plan as discussed in “Compensation Discussion and Analysis.” The amounts listed for fiscal year 2013 were earned for fiscal year 2013 although paid after the end of the 2013 fiscal year. No awards were earned for fiscal year 2011 or fiscal year 2012 under the Annual Management Incentive Plan. |
| | |
(4) | The table below shows the components of this column for fiscal year 2013, which include amounts paid or accrued by the Company in fiscal year 2013 for perquisites, severance, tax gross-ups and Company matching contributions to our 401(k) defined contribution plan. |
Name | | 401(k) Plan
Match | | | Employment Termination
Payments | | | COBRA or Medical
Expense
Reimbursement | | | Commuting
Expense
Reimbursement | | | Tax Gross-Up on
Commuting Expense
Reimbursement | |
Willis | | $ | 1,731 | | | $ | — | | | $ | 6,846 | | | $ | 55,800 | | | $ | 32,874 | |
Lapp | | $ | 4,430 | | | $ | — | | | $ | — | | | $ | — | | | $ | — | |
Thomas | | $ | 4,900 | | | $ | — | | | $ | — | | | $ | — | | | $ | — | |
Fleck | | $ | 4,900 | | | $ | 337,000 | | | $ | — | | | $ | — | | | $ | — | |
Zisk | | $ | 0 | | | $ | — | | | $ | — | | | $ | — | | | $ | — | |
(5) | Mr. Willis was hired as an executive officer of the Company and appointed President and CEO on September 15, 2011. He continues to serve as a director of the Company but, as of his date of employment, no longer received any additional compensation for his services as a director. |
| | |
(6) | Ms. Lapp was appointed as an executive officer of the Company and Interim Chief Financial Officer on October 28, 2011. Ms. Lapp was subsequently promoted to Chief Financial Officer on May 25, 2012. |
| | |
(7) | The employment of Ms. Fleck was terminated on November 5, 2012. |
| | |
(8) | Mr. Zisk became an executive officer and director of the Company on November 20, 2012 in connection with the Company’s acquisition of SpeedFC, Inc. Mr. Zisk receives no additional compensation for his services as a director. |
Grants of Plan-Based Awards in Fiscal Year 2013
| | | | | | | | | | | | | | | | | | | All | | | All | | | | | | | | | | | | | |
| | | | | | | | | | | | | | | | | | | Other | | | Other | | | | | | | | | | | | | |
| | | | | | | | | | | | | | | | | | | Stock | | | Option | | | | | | | | | | | | | |
| | | | | | | | | | | | | | | | | | | Awards: | | | Awards: | | | Exercise | | | Closing | | | Grant Date | |
| | | | | | | | | | | | | | | | | | | Number of | | | Number of | | | or Base | | | Market | | | Fair Value of | |
| | | | | | | Estimated Future Payouts Under | | | Shares of | | | Securities | | | Price of | | | Price on | | | Stock and | |
| | | | | | | Non-Equity Incentive Plan Awards(2) | | | Stock or | | | Underlying | | | Option | | | Date of | | | Option | |
| | | Grant | | Approval | | Threshold | | | Units | | | Awards | | | Awards | | | Grant | | | Awards | | | Grant | | | Awards | |
Name | | Date(1) | | Date(1) | | ($) | | | ($) | | | ($) | | | (#) | | | (#) | | | ($/Sh)(3) | | | ($/Sh) | | | ($) | |
Richard S Willis | | 11/26/2012 | | 10/23/2012 | | | | | | | | | | | | | | | 110,000 | (4) | | | | | | | | | | | | | | | 192,500 | |
| | | 11/26/2012 | | 10/23/2012 | | | | | | | | | | | | | | | | | | | 400,000 | (5) | | | 1.75 | | | | 1.77 | | | | 425,040 | |
| | | | | | | | 0 | | | | 360,000 | | | | 540,000 | | | | | | | | | | | | | | | | | | | | | |
| | | | | | | | | | | | | | | | | | | | 27,663 | (4) | | | | | | | | | | | | | | | 48,410 | |
Diane D. Lapp | | 11/26/2012 | | 10/23/2012 | | | | | | | | | | | | | | | | | | | 100,107 | (5) | | | 1.75 | | | | 1.77 | | | | 106,374 | |
| | | 11/26/2012 | | 10/23/2012 | | | 0 | | | | 127,500 | | | | 191,250 | | | | | | | | | | | | | | | | | | | | | |
| | | | | | | | | | | | | | | | | | | | 29290 | (4) | | | | | | | | | | | | | | | 51,258 | |
Ward O. Thomas | | 11/26/2012 | | 10/23/2012 | | | | | | | | | | | | | | | | | | | 105,996 | (5) | | | 1.75 | | | | 1.77 | | | | 69,629 | |
| | | 11/26/2012 | | 10/23/2012 | | | 0 | | | | 135,000 | | | | 202,500 | | | | | | | | | | | | | | | | | | | | | |
| | | | | | | | | | | | | | | | | | | | | | | | | | | | | | | | | | | | | |
Joyce A. Fleck | | | | | | | | | | | | | | | | | | | | | | | | | | | | | | | | | | | | |
| | | | | | | | 0 | | | | 128,750 | | | | 193,125 | | | | | | | | | | | | | | | | | | | | | |
| | | | | | | | | | | | | | | | | | | | | | | | | | | | | | | | | | | | | |
Jeffrey B. Zisk | | | | | | | | | | | | | | | | | | | | | | | | | | | | | | | | | | | | |
| | | | | | | | 0 | | | | 162,500 | | | | 243,750 | | | | | | | | | | | | | | | | | | | | | |
(1) | The date of grant for each award is established by the Compensation Committee during a meeting or by written action without a meeting on or prior to the date of the grant. Pursuant to guidelines adopted by the Compensation Committee, annual grants are normally discussed and approved in scheduled meetings taking place in the fall to become effective as of the first day of the open trading window after public disclosure of second quarter financial information. |
| | |
(2) | Our Annual Incentive Plan is considered a “non-equity incentive plan.” This column represents the range of awards under the plan possible for fiscal year 2013. The amounts that were actually earned by the Named Executive Officers in fiscal year 2013 are set forth in the “Non-Equity Incentive Plan Compensation” column of the “Summary Compensation Table” above. For fiscal year 2013, each Named Executive’s Officer’s target award was established as a percentage of base salary. The target award percentages, objectives and other details are set forth in the discussion of “Annual Incentive Compensation” in our “Compensation Discussion and Analysis.” |
| | |
(3) | Under the terms of the Amended and Restated 2004 Stock Plan (the “2004 Stock Plan”), as approved by our shareholders, the exercise price is no less than the grant date fair market value defined as the opening price for our Common Stock on the NASDAQ Global Market during a regular trading session or, if the grant date is not a trading day, then the last reported sales price listed on the NASDAQ Global Market prior to the grant date. |
| | |
(4) | Restricted stock units were granted in fiscal year 2013 under the 2004 Stock Plan as discussed in “Long-Term Incentive Compensation” in our “Compensation Discussion and Analysis.” |
| | |
(5) | Stock option grants to the Named Executive Officers in fiscal year 2013 under the 2004 Stock Plan as discussed in “Long-Term Incentive Compensation” in our “Compensation Discussion and Analysis.” |
Outstanding Equity Awards at Fiscal Year 2013 Fiscal Year-End
| | | Option Awards | | | StockAwards | |
| | | | | | | | | | | | | | | | | | | | | | | Market | |
| | | | | | | | | | | | | | | | | | | Number of | | | Value of | |
| | | | | | | | | | | | | | | | | | | Shares or | | | Shares | |
| | | Number of | | | Number of | | | | | | | | | | | Units of | | | or Units | |
| | | Securities | | | Securities | | | | | | | | | | | Stock | | | of Stock | |
| | | Underlying | | | Underlying | | | | | | | | | | | That | | | That | |
| | | Unexercised | | | Unexercised | | | Option | | | Option | | | Have | | | Have | |
| | | Options(#) | | | Options(#) | | | Exercise | | | Expiration | | | Not | | | Not | |
Name | | Exercisable(1) | | | Unexercisable | | | Price ($) | | | Date | | | Vested (#) | | | Vested ($) | |
Richard S Willis | | | 33,333 | | | | 16,667 | (2) | | | 1.95 | | | 2/10/2021 | | | | — | | | | — | |
| | | | 4,000 | | | | 8,000 | (3) | | | 1.90 | | | 3/31/2021 | | | | — | | | | — | |
| | | | 100,000 | | | | 375,000 | (4) | | | 1.75 | | | 9/14/2021 | | | | — | | | | — | |
| | | | — | | | | 400,000 | (5) | | | 1.75 | | | 11/25/2022 | | | | | | | | | |
| | | | — | | | | — | | | | — | | | | — | | | | 175,000 | (9) | | | 397,250 | |
| | | | — | | | | — | | | | — | | | | — | | | | 110,000 | (10) | | | 249,700 | |
| | | | | | | | | | | | | | | | | | | | | | | | | |
| | | | | | | | | | | | | | | | | | | | | | | | | |
Diane D. Lapp | | | 10,000 | | | | 0 | | | | 7.78 | | | 6/13/2015 | | | | — | | | | — | |
| | | | 7,000 | | | | 0 | | | | 4.59 | | | 10/25/2015 | | | | | | | | | |
| | | | 8,000 | | | | 0 | | | | 4.95 | | | 11/01/2016 | | | | — | | | | — | |
| | | | 6,000 | | | | 0 | | | | 2.41 | | | 11/11/2017 | | | | | | | | | |
| | | | 10,000 | | | | 0 | | | | 0.69 | | | 11/12/2018 | | | | — | | | | — | |
| | | | 10,000 | | | | 0 | | | | 2.08 | | | 11/2/2019 | | | | | | | | | |
| | | | 23,333 | | | | 11,667 | (6) | | | 2.12 | | | 11/3/2020 | | | | — | | | | — | |
| | | | 20,000 | | | | 40,000 | (7) | | | 1.58 | | | 11/02/2021 | | | | — | | | | — | |
| | | | — | | | | 100,107 | (5) | | | 1.75 | | | 11/25/2022 | | | | | | | | | |
| | | | — | | | | — | | | | — | | | | — | | | | 4,000 | (11) | | | 9,120 | |
| | | | — | | | | — | | | | — | | | | — | | | | 13,333 | (12) | | | 30,266 | |
| | | | — | | | | — | | | | — | | | | — | | | | 27,663 | (10) | | | 62,795 | |
| | | | | | | | | | | | | | | | | | | | | | | | | |
| | | | | | | | | | | | | | | | | | | | 0 | | | | 0 | |
| | | | | | | | | | | | | | | | | | | | | | | | | |
Ward O. Thomas | | | 33,333 | | | | 16,667 | (8) | | | 2.52 | | | 9/14/2020 | | | | — | | | | — | |
| | | | 25,000 | | | | 50,000 | (7) | | | 1.58 | | | 11/02/2021 | | | | — | | | | — | |
| | | | — | | | | 105,996 | (5) | | | 1.75 | | | 11/25/2022 | | | | | | | | | |
| | | | — | | | | — | | | | — | | | | — | | | | 8,333 | (13) | | | 18,920 | |
| | | | — | | | | — | | | | — | | | | — | | | | 16,666 | (12) | | | 37,832 | |
| | | | — | | | | — | | | | — | | | | — | | | | 29,290 | (10) | | | 66,488 | |
| | | | | | | | | | | | | | | | | | | | | | | | | |
Joyce A. Fleck | | | 0 | | | | 0 | | | | — | | | | — | | | | 0 | | | | — | |
| | | | | | | | | | | | | | | | | | | | | | | | | |
Jeffrey B. Zisk | | | 0 | | | | 0 | | | | — | | | | — | | | | 0 | | | | — | |
(1) | On March 20, 2006, the vesting of all outstanding stock options with exercise prices equal to or greater than $4.50 per share were accelerated and became exercisable. However, as a condition to the acceleration, the Board required each Named Executive Officer to enter into a lock-up agreement which prohibits the sale, transfer or other disposition of the shares acquired upon any exercise of the accelerated stock options (other than sales to fund the exercise price or to satisfy minimum statutory withholding) until the date on which the exercise would have been permitted under the stock option’s pre-acceleration vesting terms or, if earlier, the officer’s last day of employment with the Company. |
| | |
(2) | Non-employee Director initial stock option granted on February 11, 2011 with vesting in three equal annual installments on February 11, 2012, February 11, 2013 and February 11, 2014, conditioned on continued service as a director through those dates. |
(3) | Non-employee Director annual stock option granted on April 1, 2011 with vesting in three equal annual installments on April 1, 2012, April 1, 2013 and April 1, 2014, conditioned on continued service as a director through those dates. |
| |
(4) | Stock option granted September 15, 2011 with vesting in three annual installments of 100,000 shares on September 15, 2012, 175,000 shares on September 15, 2013 and 200,000 shares on September 15, 2014, conditioned on continued employment through those dates. |
| |
(5) | Stock options granted November 26, 2012 with vesting in three equal annual installments on November 26, 2013, November 26, 2014 and November 26, 2015, conditioned on continued employment through those dates. |
| |
(6) | Stock option granted November 4, 2010 with vesting in three equal annual installments on November 4, 2011, November 4, 2012 and November 4, 2013, conditioned on continued employment through those dates. |
| |
(7) | Stock options granted November 3, 2011 with vesting in three equal annual installments on November 3, 2012, November 3, 2013 and November 3, 2014, conditioned on continued employment through those dates. |
| |
(8) | Stock option granted September 15, 2010 with vesting in three equal annual installments on September 15, 2011, September 15, 2012 and September 15, 2013, conditioned on continued employment through those dates. |
| |
(9) | Restricted stock unit award granted October 3, 2011 with vesting in three annual installments of 50,000 units on September 15, 2012, 75,000 units on September 15, 2013 and 100,000 units on September 15, 2014, conditioned on continued employment through those dates. One share of Common Stock will be issued for every restricted stock unit which vests. |
| | |
(10) | Restricted stock unit awards granted November 26, 2012 with vesting in three equal annual installments on November 26, 2013, November 26, 2014 and November 26, 2015, conditioned on continued employment through those dates. One share of Common Stock will be issued for every restricted stock unit which vests. |
| | |
(11) | Restricted stock unit awards granted November 4, 2010 with vesting in three equal annual installments on November 4, 2011, November 4, 2012 and November 4, 2013, conditioned on continued employment through those dates. One share of Common Stock will be issued for every restricted stock unit which vests. |
| | |
(12) | Restricted stock unit awards granted November 3, 2011 with vesting in three equal annual installments on November 3, 2012, November 3, 2013 and November 3, 2014, conditioned on continued employment through those dates. One share of Common Stock will be issued for every restricted stock unit which vests. |
| | |
(13) | Restricted stock unit award granted September 15, 2010 with vesting in three equal annual installments on September 15, 2011, September 15, 2012 and September 15, 2013, conditioned on continued employment through those dates. One share of Common Stock will be issued for every restricted stock unit which vests. |
Option Exercises and Stock Vested in Fiscal Year 2013
| | | Option Awards | | | Stock Awards | |
Name | | Number of Shares Acquired on Exercise (#) | | | Value Realized on Exercise ($) | | | Number of Shares Acquired on Vesting (#) | | | Value Realized on Vesting ($)(1) | |
Richard S Willis | | | — | | | | — | | | | 50,000 | | | | 76,000 | |
Diane D. Lapp | | | — | | | | — | | | | 12,334 | | | | 20,474 | |
Ward O. Thomas | | | — | | | | — | | | | 16,667 | | | | 26,500 | |
Joyce A. Fleck | | | 62,500 | | | | 46,374 | | | | 18,750 | | | | 31,125 | |
Jeffrey B. Zisk | | | — | | | | — | | | | — | | | | — | |
(1) | Amount determined using the closing price of our Common Stock on the vesting date. |
EXECUTIVE SEVERANCE AND CHANGE IN CONTROL AGREEMENTS
We have entered into employment and other agreements with certain executive officers to attract and retain talented executives. With respect to these agreements, a termination for “Cause” generally means a felony conviction, willful neglect, malfeasance or misconduct, or violation of a Company policy, which could result in material harm to the Company, fraud or dishonesty with respect to the Company’s business, breach of duty of loyalty or a material breach of the executive’s covenants in the agreement. A termination “Without Cause” is an involuntary termination for which the Company did not have Cause. A termination by an executive for “Good Reason” generally means a reduction in the executive’s compensation, rights or benefits, a material reduction in duties, responsibilities or authority, relocation to other than the Company’s principal headquarters, an adverse material change in working conditions or a material breach of the Company’s covenants in the agreement. A “Change in Control Transaction” generally includes the occurrence of any of the following: (i) the acquisition by any person or entity of 50% or more of the voting power of the Company’s outstanding shares; (ii) a sale, merger, other business combination, liquidation or dissolution of the Company, unless following such transaction the Company’s shareholders before the transaction have the same proportionate ownership of stock of the surviving entity; (iii) the board of directors prior to any transaction does not constitute a majority of the board thereafter; and (iv) any other transaction required to be reported as a change of control under Regulation 14A of the Securities and Exchange Commission.
Richard S Willis Employment Agreement with Restrictive Covenants
On October 3, 2011, we entered into an Employment Agreement with Restrictive Covenants with Mr. Willis which was consistent with and superseded the terms of the letter agreement between the Company and Mr. Willis dated September 15, 2011. The agreement commenced on September 15, 2011 and expires on September 14, 2014, subject to automatic extension for successive one-year periods unless either party provides 60 days' advance written notice of such party's desire not to renew. During the term of the agreement, Mr. Willis will serve as a director of the Company and have the authority, responsibilities and duties customarily performed by a president and chief executive officer of similar businesses. The agreement provides for a minimum annual base salary of $450,000 and a target bonus opportunity of up to 80% of this amount for each fiscal year of service. Pursuant to the agreement, Mr. Willis was granted a non-qualified stock option covering 475,000 shares of our Common Stock, vesting over three years, and an award of 225,000 restricted stock units, vesting over three years. Mr. Willis is also entitled to reimbursement for reasonable business expenses, paid vacation and participation in benefit plans on the same basis as other key executive officers of the Company. In addition, Mr. Willis will receive reimbursement for out-of-pocket family medical expenses up to $12,000 per plan year, a one time reimbursement of up to $5,000 for attorney’s fees, and reimbursement, on a tax neutral basis, for reasonable commuting expenses between Texas and Minnesota, including airfare, lodging and local transportation. On February 22, 2012, the Employment Agreement was amended to reflect the desire of Mr. Willis to voluntarily reduce his base salary by $100,000 for the Company’s fiscal year beginning April 1, 2012. Consequently, Mr. Willis’ base salary for the current fiscal year is $350,000, however, the voluntary reduction does not affect the calculation of any earned annual incentive bonus or the calculation of any severance payments calculated using a Base Salary of $450,000 during the period of the voluntary reduction.
Either the Company or Mr. Willis may terminate the Employment Agreement for any reason at any time. In the event Mr. Willis’ employment is terminated by the Company due to (i) death, (ii) disability lasting longer than 180 days, (iii) Cause or (iv) non-renewal of the Employment Agreement, Mr. Willis will only be entitled to all earned and unpaid base salary and vacation time as of the termination date. If Mr. Willis is otherwise involuntarily terminated or terminates his employment due to Good Reason, including termination without Cause or for Good Reason within 12 months of a Change in Control Transaction, he will be entitled to severance payments equal to two times his then current base salary and two times the average amount of bonus paid to him during the immediately preceding three years. Severance payments, which require a written release of all claims, will be paid in 24 equal monthly installments beginning on the first day of the seventh month after the termination date.
The agreement requires that Mr. Willis honor confidentiality obligations during and after his employment and provides that for 18 months following the termination of his employment, Mr. Willis will not compete with any material portion of the Company’s business activities, nor solicit the Company's employees, consultants or customers.
Executive Severance Agreements for Diane D. Lapp, Ward O. Thomas, and Joyce A. Fleck
In March 2008, the Company entered into executive severance agreements with Ms. Lapp and Ms. Fleck that replaced and superseded prior change in control severance agreements entered into in 2001. The Company entered into a similar executive severance agreement with Mr. Thomas in August 2010. The agreements provide for severance payments in the event that the executive’s employment is terminated Without Cause or by the executive for Good Reason, whether or not a Change in Control Transaction has occurred. Severance payments would equal one times base salary and one times the average amount of bonus earned and paid with respect to the preceding three years. Severance payments would be paid in a lump sum within 30 days after the date of termination. If applicable, severance payments will be offset by any income protection benefits payable during the first 12 months of a qualifying disability under the Company’s group short-term and long-term disability insurance plans. Severance payments require a written release of all claims and agreements by the executive with respect to non-solicitation, confidentiality obligations and assignment of intellectual property rights.
The dollar values for the termination payments paid or payable to Ms. Fleck under her agreement are included in the “All Other Compensation” column of the “Summary Compensation Table.”
The expiration date of the other agreements, which is currently December 31, 2014; is subject to automatic extension for successive one year periods unless notice of termination is provided by one party to the other at least six months prior to the expiration of the then-current term.
Jeffrey B. Zisk Employment Agreement
On November 20, 2012, in connection with the closing of the acquisition of SpeedFC, the Company entered into an executive employment agreement with restrictive covenants with Jeffrey B. Zisk. The agreement provides for a base salary of $325,000 and a target bonus opportunity of up to 50% of this amount for each fiscal year of service. The agreement also grants Mr. Zisk the same eligibility to participate in the Company’s Amended and Restated 2004 Stock Plan as similarly situated executive officers of the Company in future years, but did not provide for any equity grants in fiscal year 2013. Mr. Zisk is also entitled to reimbursement for reasonable business expenses, paid vacation and participation in benefit plans on the same basis as similarly situated executive officers of the Company. The initial term of the agreement is for five years from November 20, 2012 and will be renewed at-will, unless notice of termination is provided by either party to the other at least 30 days prior to the expiration of the initial term. Thereafter, employment may be terminated by either party upon written notice.
The agreement provides for severance payments in the event that Mr. Zisk’s employment is terminated Without Cause or by him for Good Reason during the initial term, whether or not a Change in Control Transaction has occurred. Severance payments would equal one times base salary and one times the average amount of bonus earned and paid with respect to the preceding three years. Severance payments would be paid in twelve monthly installments beginning on the first day of the seventh month following termination. Severance payments require a written release of all claims unrelated to the Merger Agreement. In addition, the agreement requires that Mr. Zisk honor confidentiality obligations during and after his employment and agree to non-competition, non-recruitment, and non-solicitation provisions during his employment and for up to 24 months following termination of his employment.
POTENTIAL PAYMENTS UPON TERMINATION
The following table assumes that the respective currently serving Named Executive Officer was terminated on March 31, 2013 Without Cause or terminated for Good Reason and illustrates the payments that each Named Executive Officer would be entitled to under the employment and severance agreements described above. The numbers in the following table do not change if a Change in Control Transaction occurred within the 12 month period prior to March 31, 2013.
Name | |
Salary Continuation ($) | | |
Benefit Premiums ($) | | | Substitute Incentive Plan Payments ($) | | |
Total ($) | |
Richard S Willis | | $ | 900,000 | | | | — | | | $ | 33,333 | (1) | | $ | 933,333 | |
| | | | | | | | | | | | | | | | | |
Diane D. Lapp | | $ | 255,000 | | | | — | | | | — | | | $ | 255,000 | |
| | | | | | | | | | | | | | | | | |
Ward O. Thomas | | $ | 270,000 | | | | — | | | $ | 24,666 | (2) | | $ | 294,666 | |
| | | | | | | | | | | | | | | | | |
Jeffrey B. Zisk | | $ | 325,000 | | | | — | | | | — | | | $ | 325,000 | |
(1) | Represents Mr. Willis’s substitute incentive plan payment calculated as the average of the amounts earned by Mr. Willis for the last three years under the Annual Management Incentive Plan ($100,000, $0, $0). |
(2) | Represents Mr. Thomas’ substitute incentive plan payment calculated as the average of the amounts earned by Ms. Thomas for the last three years under the Annual Management Incentive Plan ($74,000, $0, $0). |
COMPENSATION OF DIRECTORS
Retainer and Meeting Fees
Directors who are Company employees do not receive compensation for their services as directors. During fiscal year 2013, Directors who were not employees of the Company (“Non-employee Directors) each received a base annual retainer of $36,000, paid in monthly installments. No additional compensation was paid for meeting attendance. The chairpersons of the Audit Committee, the Compensation Committee and the Governance and Nominating Committee each received an additional annual fee of $5,000 and the Chairman of the Board received an additional annual fee of $15,000. In addition, Directors are reimbursed for travel and other reasonable out-of-pocket expenses related to attendance at board and committee meetings.
Equity Compensation
Non-employee Directors also receive equity compensation consisting of an initial stock option grant and annual stock option grants under the terms of the Stock Plan, which has been approved by the shareholders. Each newly elected or appointed Non-employee Director receives an initial non-qualified stock option grant covering 50,000 shares of Common Stock. Each Non-employee Director also receives an annual grant on April 1 of each year, of a non-qualified stock option to purchase 12,000 shares of our Common Stock. All stock option grants to Non-employee Directors are exercisable at the fair market value on the date of the grant and vest one-third per year beginning one year from the grant date and expire on the earlier of (i) ten years from the grant date and (ii) one year after the director ceases to serve. Vesting is accelerated upon the occurrence of a “Change of Control Transaction,” as defined in the Stock Plan. As an exception to the foregoing, the Stock Plan provides that any Non-employee Director who is ineligible to stand for re-election after reaching the Board’s mandatory retirement age of 70 will receive an award of 3,000 shares of restricted stock per year during each of the last two years of such director’s last term in lieu of annual stock option grants for such years. In fiscal year 2013, this provision was applicable to Mr. Weyl.
In fiscal year 2013, pursuant to the foregoing, Directors Benson, Dalvey, Gentz, Green, Iverson, and Shisler each received an annual stock option grant covering 12,000 shares of Common Stock on April 1, 2012 at an exercise price of $1.80 per share. Mr. Weyl received a grant of 3,000 shares of restricted stock on April 1, 2012. In connection with the Company’s acquisition of SpeedFC, Mr. Bryant was appointed a director and received an initial stock option grant covering 50,000 shares of Common Stock on November 20, 2012 at an exercise price of $1.67.
The following table shows compensation information for our Non-employee Directors for fiscal year 2013.
Director Compensation Table for Fiscal Year 2013
Name(1) | | Fees Earned or Paid in Cash | | |
Stock Awards(2) | | |
Option Awards(3) | | | All Other Compensation | | |
Total | |
Keith A. Benson | | $ | 41,000 | | | | — | | | $ | 12,262 | | | | — | | | $ | 53,262 | |
Monroe David Bryant, Jr.(4) | | $ | 12,000 | | | | — | | | $ | 51,090 | | | | — | | | $ | 63,090 | |
David F. Dalvey (5) | | $ | 24,000 | | | | — | | | $ | 12,262 | | | | — | | | $ | 36,262 | |
Timothy R. Gentz | | $ | 56,000 | | | | — | | | $ | 12,262 | | | | — | | | $ | 68,262 | |
Frederick C. Green IV | | $ | 41,000 | | | | — | | | $ | 12,262 | | | | — | | | $ | 53,262 | |
Kathleen P. Iverson | | $ | 36,000 | | | | — | | | $ | 12,262 | | | | — | | | $ | 48,262 | |
Bradley J. Shisler (6) | | $ | 36,000 | | | | — | | | $ | 12,262 | | | $ | 25,000 | | | $ | 73,262 | |
Tom F. Weyl | | $ | 36,000 | | | $ | 5,340 | | | | — | | | | — | | | $ | 41,340 | |
(1) | Mr. Willis and Mr. Zisk are not included in this table because they are employees of the Company and received no compensation for services as a director. |
| | |
(2) | The amount in this column represents the grant date fair value of restricted stock awarded in fiscal year 2013 as determined using the opening sale price of our Common Stock on such date. This amount was computed in accordance with Financial Accounting Standards Board Accounting Standards Codification (ASC) Topic 718. |
(3) | The amounts in this column represent the grant date fair value of all stock options awarded in fiscal year 2013 as determined using the Black-Scholes pricing model. The assumptions used to arrive at the Black-Scholes value are discussed in Note 19 to our consolidated financial statements included in our Annual Report on Form 10-K for the fiscal year ended March 31, 2013. We recognize the expense for financial reporting purposes over the applicable vesting period. |
| | |
| As of March 31, 2013, each of the Non-employee Directors then serving had outstanding stock options and restricted stock awards covering the following total amount of shares of our Common Stock: Mr. Benson, 84,000 shares; Mr. Bryant, 50,000 shares; Mr. Gentz, 90,000 shares; Mr. Green, 86,000 shares; Ms. Iverson, 92,000 shares; Mr. Shisler, 74,000 shares; and Mr. Weyl, 81,000 shares. |
| | |
(4) | Mr. Bryant was appointed to the Board on November 20, 2012 in connection with the acquisition of SpeedFC. |
| | |
(5) | Mr. Dalvey resigned from the Board at the end of his term on November 20, 2012. |
| | |
(6) | All Other Compensation for Mr. Shisler consists of consulting payments paid pursuant to the consulting agreement described in “Certain Relationships and Related Transactions, and Director Independence.” |
| | |
Item 12. Security Ownership of Certain Beneficial Owners and Management andRelated Shareholder Matters
The following table sets forth certain information regarding the beneficial ownership of our Common Stock as of May 22, 2013 (except as otherwise noted), by (i) each of our directors, (ii) each of the executive officers named in the Summary Compensation Table, (iii) all of the executive officers and directors as a group, and (iv) each person known to us who beneficially owns more than 5% of the outstanding shares of our Common Stock. The address of each director, nominee and executive officer is 7400 49th Avenue North, Minneapolis, Minnesota 55428. Percentage computations are based on 56,242,162 shares of our Common Stock outstanding as of May 22, 2013.
Beneficial ownership is determined in accordance with the rules of the Securities and Exchange Commission and generally includes voting or investment power with respect to securities. We believe that all persons named in the table have sole voting and sole investment power with respect to all shares beneficially owned by them, unless otherwise indicated. All figures include shares of Common Stock which are not currently outstanding but are deemed beneficially owned because of the right to acquire shares pursuant to options exercisable and other convertible securities (including restricted stock units) vesting within 60 days of May 22, 2013 and, which are deemed to be outstanding and to be beneficially owned by the person holding such rights for the purpose of computing the percentage ownership of that person, but are not deemed to be outstanding for the purpose of computing the percentage ownership of any other person.
| | | Beneficial Ownership | |
Directors, and Executive Officers | | Shares | | | Percent | |
Keith A. Benson | | | 103,800 | (1) | | | * | |
Monroe David Bryant, Jr. | | | 3,776,480 | | | | 6.71 | % |
Timothy R. Gentz | | | 121,646 | (1) | | | * | |
Frederick C. Green IV | | | 90,500 | (1) | | | * | |
Kathleen P. Iverson | | | 87,000 | (1) | | | * | |
Bradley J. Shisler | | | 79,384 | (1) | | | * | |
Tom F. Weyl | | | 119,000 | (1) | | | * | |
Richard S Willis | | | 529,300 | (1) | | | * | |
Diane D. Lapp | | | 132,116 | (1) | | | * | |
Ward O. Thomas | | | 74,817 | (1) | | | * | |
Jeffrey B. Zisk | | | 11,249,373 | (2) | | | 20.00 | % |
All directors and executive officers as a group (11 persons at May 22, 2013) | | | 16,363,416 | (1)(2) | | | 28.73 | % |
Joyce A. Fleck | | | 93,501 | (3) | | | * | |
| | | | | | | | |
5% Shareholders | | | | | | | | |
Becker Drapkin Management, L.P. | | | 5,020,601 | (4) | | | 8.93 | % |
300 Crescent Court, Suite 1111 | | | | | | | | |
Dallas, TX 75201 | | | | | | | | |
* | Indicates ownership of less than one percent. |
| (1) | Includes shares of Common Stock issuable upon exercise of outstanding options exercisable and restricted stock units vesting within sixty days of May 22, 2013 in the following amounts: Keith A. Benson — 72,000 shares; Timothy R. Gentz — 78,000 shares; Frederick C. Green IV — 74,000 shares; Kathleen P. Iverson — 80,000 shares; Bradley J. Shisler— 45,333 shares; Tom F. Weyl — 77,000 shares; Richard S Willis — 137,000; Diane D. Lapp — 94,333; Ward O. Thomas — 58,333; and all directors and executive officers as a group — 715,999 shares. |
| (2) | Includes 1,412,891 and 353,267 shares owned by the Jennifer Kate Partnership LP and the Zisk Family Partnerhip LP, respectively, of which Mr. Zisk has sole voting and dispositive power. |
| (3) | Ms. Fleck’s share ownership includes 21,000 and 10,000 shares of Common Stock owned by Ms. Fleck and her spouse, respectively, as of her last date of employment on November 5, 2012 and 62,500 shares of Common Stock subsequently acquired upon the exercise of outstanding stock options. |
| (4) | Based on information provided in Schedule 13D, Amendment 7, dated October 31, 2011, and Form 4, dated October 31, 2012, filed with the Securities and Exchange Commission by Becker Drapkin Management, L.P. (“BD Management”), Becker Drapkin Partners (QP), L.P. (“QP”), Becker Drapkin Partners, L.P. (“LP”), BD Partners II, L.P. (“Partners”), BC Advisors, LLC (“Advisors”), Steven R. Becker and Matthew A. Drapkin, reporting the following ownership: QP directly owns 1,929,537 shares of Common Stock; LP directly owns 309,610 shares of Common Stock; Partners directly owns 719,404 shares of Common Stock, and a managed account directly owns and has sole voting and dispositive power of 2,062,050 shares of Common Stock. BD Management is the general partner of each of QP, LP and Partners and as such shares voting and dispositive power of 2,958,551 shares of Common Stock. BD Management provides investment advisory services for the managed account and may have a pecuniary interest in its 2,062,050 shares of Common Stock as a result of performance related fees. Advisors is the general partner of Management and may be deemed to beneficially own and have shared voting and dispositive power of the shares beneficially owned by Management. Mr. Becker and Mr. Drapkin are the co-managing members of Advisors and each may be deemed to beneficially own and have shared voting and dispositive power of the shares beneficially owned by Advisors. |
Item 13. Certain Relationships and Related Transactions, and DirectorIndependence
Our Board does not have a separate written policy regarding the review and approval of related party transactions. However our Audit Committee Charter and Code of Conduct require that the Audit Committee review and approve all transactions with related persons as may be required by the rules of the Securities and Exchange Commission or NASDAQ’s Marketplace Rules. Under such rules a “related person” includes any of the directors or executive officers of the Company, certain large shareholders, and their immediate families. The transactions to be reviewed include those where the Company is a participant, a related person will have a direct or indirect material interest, and the amount involved exceeds $120,000. The Audit Committee would determine if any such transactions (i) are fair and reasonable, (ii) are on terms no less favorable to the Company than could be obtained in a comparable arm’s length transaction with an unrelated third party, and (iii) do not constitute an objectionable “conflict of interest” for a director, officer or employee of the Company. Directors and executive officers are required to disclose any such transactions under our Code of Conduct and are specifically asked to disclose such transactions in our annual Directors and Officers Questionnaire.
During fiscal year 2013, no transactions were disclosed to the Audit Committee which required review as related party transactions, and the Audit Committee was not otherwise aware of any such transactions. However, on December 23, 2011, the Company, with the approval of the Board of Directors, entered into a consulting agreement (the “Agreement”) with Golden Rule Advisors, L.L.C. (the “Consultant”). Mr. Shisler is the sole member of the Consultant. Under the Agreement, the Consultant agreed to provide, on a non-exclusive basis, strategic planning and other advisory services to the Company. The fee for such services is the hourly rate of $200 per hour for all hours worked on a day in which less than a total of five hours is worked, and a flat rate of $1,000 per day for each day in which more than five hours is worked. The Company also agreed to reimburse the Consultant for reasonable expenses incurred in connection with the Agreement, with prior approval required in certain circumstances. The Agreement provides that in no event will fees and expenses exceed $120,000 during any 12-month period. The initial term of the Agreement was three months, with automatic renewals for successive one month periods after the initial term. Any party could terminate the Agreement on written notice at any time and pursuant to this provision, the Company terminated the Agreement effective March 29, 2013. In fiscal year 2013, the Consultant earned a total of $25,000 in consulting fees under the Agreement.
Our Board of Directors has determined that each of the following current Directors: Benson, Bryant, Gentz, Green, Iverson, Shisler, and Weyl, are “independent,” as that term is defined in Rule 5605(a)(2) of the Marketplace Rules of the NASDAQ Global Market. Accordingly, each of our directors is independent other than our President and CEO, Mr. Willis, and Mr. Zisk, the President of SpeedFC, and we meet the requirements of the NASDAQ Marketplace Rule that requires a majority of independent directors. The independent directors meet regularly, generally before or after each regularly scheduled Board meeting without the presence of the CEO. Mr. Willis was similarly determined to be independent prior to his appointment as the Company’s President and CEO.
Item 14. Principal Accounting Fees and Services
AUDIT AND NON-AUDIT FEES
The following table summarizes the fees we were billed for audit and non-audit services rendered for fiscal year 2013 and fiscal year 2012 by Grant Thornton LLP, our independent registered public accounting firm for both years.
| | | Fiscal Year 2013 | | | Fiscal Year 2012 | |
Audit Fees(1) | | $ | 437,683 | | | $ | 274,526 | |
Audit-Related Fees(2) | | | — | | | | — | |
Tax Fees(3) | | | — | | | | — | |
All Other Fees(4) | | | — | | | | — | |
Total Fees Billed | | $ | 437,683 | | | $ | 274,526 | |
(1) | “Audit Fees” consists of fees billed for professional services rendered in connection with the audit of our consolidated financial statements for the fiscal years ended March 31, 2013 and 2012, the reviews of the consolidated financial statements included in each of our quarterly reports on Form 10-Q during those fiscal years, and services provided in connection with various registration statements, comfort letters, and the review and attestation of internal control over financial reporting pursuant to Section 404 of the Sarbanes-Oxley Act of 2002. This category also includes advice on audit and accounting matters that arose during, or as a result of, the audit or the review of interim consolidated financial statements. |
| | |
(2) | “Audit-Related Fees” consists of fees billed for assurance and related services in the fiscal years ended March 31, 2013 and 2012 that are reasonably related to the performance of the audit or review of the Company’s consolidated financial statements. There were no fees for this category in fiscal year 2013 and fiscal year 2012. |
| | |
(3) | “Tax Fees” consists of fees billed for services rendered in connection with tax compliance, tax advice and tax planning. There were no fees for this category in fiscal year 2013 and fiscal year 2012. |
| | |
(4) | “All Other Fees” consists of fees billed for products and services that do not meet the above category descriptions. There were no fees for this category in fiscal year 2013 and fiscal year 2012. |
POLICY ON AUDIT COMMITTEE PRE-APPROVAL OF AUDIT AND
NON-AUDIT SERVICES OF INDEPENDENT AUDITORS
The Audit Committee’s policy is to pre-approve all audit and permissible non-audit services provided by the independent auditors. Pre-approval is generally provided for up to one year and is detailed as to the particular service or category of services and is subject to a specific budget. Management is required to seek pre-approval of services that will exceed the budget or for services that are not detailed in an existing pre-approval request. The Chair of the Audit Committee is delegated the authority to pre-approve certain services between regularly scheduled meetings. Management is required to report quarterly to the Audit Committee regarding the extent of services provided by the independent auditors in accordance with this pre-approval, and the fees for the services performed to date. During fiscal year 2013, all services were pre-approved by the Audit Committee in accordance with this policy.
PART IV
Item 15. Exhibits and Financial Statement Schedules
(a) Documents filed as part of this report –
(1) | Financial Statements. Our following consolidated financial statements and the Reports of Independent Registered Public Accounting Firm thereon are set forth at the end of this document: |
| |
| | (i) | Reports of Independent Registered Public Accounting Firm. |
| | |
| | (ii) | Consolidated Balance Sheets as of March 31, 2013 and 2012. |
| | |
| | (iii) | Consolidated Statements of Operations and Comprehensive Income (Loss) for the years ended March 31, 2013, 2012 and 2011 |
| | |
| | (iv) | Consolidated Statements of Shareholders’ Equity for the years ended March 31, 2011, 2012 and 2013 |
| | |
| | (v) | Consolidated Statements of Cash Flows for the years ended March 31, 2013, 2012 and 2011 |
| | |
| | (vi) | Notes to Consolidated Financial Statements |
| | |
(2) | Financial Statement Schedules |
| |
| | (i) | Schedule II — Valuation and Qualifying Accounts and Reserves Schedules other than those listed above have been omitted because they are inapplicable or the required information is either immaterial or shown in the Consolidated Financial Statements or the notes thereto. |
| | | | | Filed | | Incorporated by reference |
Exhibit number | | Exhibit description | | here with | | Form | | Period ending | | Exhibit | | Filing date |
2.1 | | Partnership Interest Purchase Agreement by and among Navarre CP, LLC, Navarre CS, LLC, and Navarre CLP, LLC, and FUNimation GP, LLC, Anime LP Holdings, LLC and FUNimation LP, LLC dated March 31, 2011 | | | | 8-K | | | | 2.1 | | 04/05/11 |
| | | | | | | | | | | | |
3.1 | | Navarre Corporation Amended and Restated Articles of Incorporation | | | | S-1 | | | | 3.1 | | 04/13/06 |
| | | | | | | | | | | | |
3.2 | | Navarre Corporation Second Amended and Restated Bylaws | | | | 8-K | | | | 3.1 | | 03/12/12 |
| | | | | | | | | | | | |
4.1 | | Form of Specimen Certificate for Common Stock | | | | S-1 | | | | 4.1 | | 04/13/06 |
| | | | | | | | | | | | |
10.1* | | Navarre Corporation Amended and Restated 1992 Stock Option Plan | | | | 10-K | | 03/31/02 | | 10.3 | | 07/01/02 |
| | | | | | | | | | | | |
10.2* | | 2003 Amendment to 1992 Stock Option Plan | | | | S-8 | | | | 99.1 | | 09/23/03 |
| | | | | | | | | | | | |
10.3* | | Form of Individual Stock Option Agreement under 1992 Stock Option Plan | | | | S-1 | | | | 10.4 | | 09/03/93 |
| | | | | | | | | | | | |
10.4* | | Navarre Corporation Amended and Restated 2004 Stock Plan, as amended September 13, 2007 (but only as to the addition of 1,500,000 shares available for issuance) | | | | S-8 | | | | 4 | | 02/22/06 |
| | | | | | | | | | | | |
10.5* | | Amendment No. 2 to Amended and Restated 2004 Stock Plan | | | | DEF14A | | | | A | | 07/28/09 |
| | | | | | | | | | | | |
10.6* | | Form of Employee Stock Option Agreement under 2004 Stock Plan | | | | 10-K | | 03/31/05 | | 10.58 | | 06/14/05 |
| | | | | | | | | | | | |
10.7* | | Form of Non-Employee Director Stock Option Agreement under 2004 Stock Plan | | | | 10-K | | 03/31/05 | | 10.59 | | 06/14/05 |
10.8* | | Form of Employee Restricted Stock Agreement under 2004 Stock Plan | | | | 8-K | | | | 10.2 | | 04/04/06 |
| | | | | | | | | | | | |
10.9* | | Form of Director Restricted Stock Agreement under 2004 Stock Plan | | | | 8-K | | | | 10.3 | | 04/04/06 |
| | | | | | | | | | | | |
10.10* | | Form of Employee Nonqualified Stock Option Agreement under 2004 Stock Plan | | | | 8-K | | | | 10.2 | | 09/19/11 |
| | | | | | | | | | | | |
10.11* | | Form of TSR Stock Unit Agreement under 2004 Stock Plan | | | | 8-K | | | | 10.4 | | 04/04/06 |
| | | | | | | | | | | | |
10.12* | | Form of Performance Stock Unit Agreement under 2004 Stock Plan | | | | 8-K | | | | 10.5 | | 04/04/06 |
| | | | | | | | | | | | |
10.13* | | Form of Restricted Stock Unit Agreement under 2004 Stock Plan | | | | 10-Q | | 09/31/07 | | 10.1 | | 11/08/07 |
| | | | | | | | | | | | |
10.14* | | Form of Restricted Stock Unit Agreement under 2004 Stock Plan – J. Reid Porter | | | | 8-K | | | | 10.2 | | 08/26/11 |
| | | | | | | | | | | | |
10.15* | | Amended and Restated Employment Agreement dated December 28, 2006 between the Company and Cary L. Deacon | | | | 8-K | | | | 99.1 | | 12/29/06 |
| | | | | | | | | | | | |
10.16* | | Amendment dated January 29, 2007 to Amended and Restated Employment Agreement between the Company and Cary L. Deacon | | | | 8-K | | | | 10.1 | | 01/30/07 |
| | | | | | | | | | | | |
10.17* | | Amendment dated March 20, 2008 to Amended and Restated Employment Agreement between the Company and Cary L. Deacon | | | | 8-K | | | | 10.1 | | 03/21/08 |
| | | | | | | | | | | | |
10.18* | | Amended and Restated Executive Severance Agreement dated March 20, 2008 between the Company and J. Reid Porter | | | | 8-K | | | | 10.2 | | 03/21/08 |
| | | | | | | | | | | | |
10.19* | | First Amendment to Amended and Restated Executive Severance Agreement dated August 10, 2010 between the Company and J. Reid Porter | | | | 8-K | | | | 10.1 | | 09/16/10 |
| | | | | | | | | | | | |
10.20* | | Second Amendment to Amended and Restated Executive Severance Agreement dated August 23, 2011 between the Company and J. Reid Porter | | | | 8-K | | | | 10.1 | | 08/26/11 |
| | | | | | | | | | | | |
10.21* | | Executive Severance Agreement dated March 20, 2008 between the Company and Joyce Fleck | | | | 10-K | | 03/31/09 | | 10.22 | | 06/09/09 |
| | | | | | | | | | | | |
10.22* | | Executive Severance Agreement dated March 20, 2008 between the Company and Calvin Morrell | | | | 10-K | | 03/31/09 | | 10.23 | | 06/09/09 |
| | | | | | | | | | | | |
10.23* | | Executive Severance Agreement dated March 31, 2008 between the Company and Diane D. Lapp | | | | 8-K | | | | 10.1 | | 10/28/11 |
| | | | | | | | | | | | |
10.24* | | Executive Employment Agreement with Restrictive Covenants dated October 3, 2011 between the Company and Richard S Willis | | | | 8-K/A | | | | 10.1 | | 10/6/11 |
| | | | | | | | | | | | |
10.25* | | Amendment to Executive Employment Agreement with Restrictive Covenants dated February 22, 2012 between the Company and Richard S Willis | | | | 8-K/A | | | | 10.1 | | 02/23/12 |
| | | | | | | | | | | | |
10.26* | | Fiscal Year 2010 Annual Management Incentive Plan | | | | 8-K | | | | 10.1 | | 04/21/09 |
| | | | | | | | | | | | |
10.27* | | Fiscal Year 2011 Annual Management Incentive Plan | | | | 8-K | | | | 10.1 | | 05/14/10 |
| | | | | | | | | | | | |
10.28* | | Fiscal Year 2012 Annual Management Incentive Plan | | | | 10-K | | 03/31/11 | | 10.59 | | 06/09/11 |
| | | | | | | | | | | | |
10.29* | | Fiscal Year 2013 Annual Management Incentive Plan | | | | 8-K | | | | 10.1 | | 04/04/12 |
10.30 | | Office/Warehouse Lease dated April 1, 1998 between the Company and Cambridge Apartments, Inc. | | | | 10-K | | 03/31/99 | | 10.6 | | 06/29/99 |
| | | | | | | | | | | | |
10.31 | | Amendment dated September 27, 2001 to Office/Warehouse Lease between the Company and Cambridge Apartments, Inc. | | | | 10-Q | | 06/30/03 | | 10.9.1 | | 08/14/03 |
| | | | | | | | | | | | |
10.32 | | Agreement of Reciprocal Easements, Covenants, Conditions and Restrictions dated June 16, 2003 | | | | 10-Q | | 06/30/03 | | 10.9.3 | | 08/14/03 |
| | | | | | | | | | | | |
10.33 | | Amendment dated July 14, 2003 to Office/Warehouse Lease between the Company and Cambridge Apartments, Inc. | | | | 10-Q | | 06/30/03 | | 10.9.2 | | 08/14/03 |
| | | | | | | | | | | | |
10.34 | | Form of Amendment dated February 23, 2004 to Office/Warehouse Lease between the Company and Cambridge Apartments, Inc. | | | | 10-K | | 03/31/04 | | 10.48 | | 06/29/04 |
| | | | | | | | | | | | |
10.35 | | Form of Amendment dated June 2004 to Office/Warehouse Lease between the Company and Cambridge Apartments, Inc. | | | | 10-K | | 03/31/04 | | 10.49 | | 06/29/04 |
| | | | | | | | | | | | |
10.36 | | Addendum dated May 27, 2004 to Office/Warehouse Lease between the Company and Cambridge Apartments, Inc. | | | | 10-K | | 03/31/04 | | 10.51 | | 06/29/04 |
| | | | | | | | | | | | |
10.37 | | Addendum dated November 12, 2009 to Office/Warehouse Lease between the Company and Cambridge Apartments, Inc. | | | | 10-K | | 03/31/10 | | 10.39 | | 06/11/10 |
| | | | | | | | | | | | |
10.38 | | Amendment dated March 21, 2004 to Office/Warehouse Lease between the Company and Airport One Limited Partnership | | | | 10-K | | 03/31/04 | | 10.50 | | 06/29/04 |
| | | | | | | | | | | | |
10.39 | | Amendment dated November 23, 2004 to Office/Warehouse Lease between the Company and Airport One Limited Partnership | | | | 10-Q | | 12/31/04 | | 10.1 | | 02/14/05 |
| | | | | | | | | | | | |
10.40 | | Amendment dated February 2, 2006 to Office/Warehouse Lease between the Company and Airport One Limited Partnership | | | | 10-Q | | 12/31/05 | | 10.1 | | 02/09/06 |
| | | | | | | | | | | | |
10.41 | | Form of Office/Warehouse Lease dated May 27, 2004 between the Company and NL Ventures IV New Hope, L.P. | | | | 10-K | | 03/31/04 | | 10.47 | | 06/29/04 |
| | | | | | | | | | | | |
10.42 | | Office Lease dated October 8, 2004 between Encore Software, Inc. and Kilroy Realty, L.P. | | | | 10-Q | | 09/30/04 | | 10.57 | | 11/15/04 |
| | | | | | | | | | | | |
10.43 | | Amendment dated December 29, 2004 to Office Lease between Encore Software, Inc. and Kilroy Realty, L.P. | | | | 10-Q | | 12/31/04 | | 10.3 | | 02/14/05 |
| | | | | | | | | | | | |
10.44 | | Addendum dated April 29, 2010 to Office Lease between Encore Software, Inc. and Kilroy Realty, L.P. | | | | 10-K | | 03/31/10 | | 10.46 | | 06/11/10 |
| | | | | | | | | | | | |
10.45 | | Office/Warehouse Lease dated November 19, 2009 between the Company and Orlando Corporation | | | | 10-K | | 03/31/10 | | 10.47 | | 06/11/10 |
| | | | | | | | | | | | |
10.46 | | Consent to Assignment dated March 1, 2010 of Office/Warehouse Lease between the Company, Navarre Distribution Services ULC and Orlando Corporation | | | | 10-K | | 03/31/10 | | 10.48 | | 06/11/10 |
| | | | | | | | | | | | |
10.47 | | Office Lease dated May 29, 2007 between FUNimation Productions, Ltd. and FMBP Industrial I LP | | | | 10-K | | 03/31/07 | | 10.117 | | 06/14/07 |
| | | | | | | | | | | | |
10.48 | | Form of Credit Agreement dated November 12, 2009 among the Company, Wells Fargo Capital Finance, LLC, as Agent, and Lenders | | | | 8-K | | | | 10.1 | | 11/13/09 |
10.49 | | Consent and Amendment No. 1 to Credit Agreement dated April 29, 2010 among the Company, Wells Fargo Capital Finance, LLC, as Agent, and Lenders | | | | 10-K | | 03/31/10 | | 10.69 | | 06/11/10 |
| | | | | | | | | | | | |
10.50 | | Consent and Amendment No. 2 to Credit Agreement dated May 17, 2010 among the Company, Wells Fargo Capital Finance, LLC, as Agent, and Lenders | | | | 8-K | | | | 10.2 | | 05/17/10 |
| | | | | | | | | | | | |
10.51 | | Form of Amendment No 5. to Credit Agreement dated December 29, 2011 between the Company and Wells Fargo Capital Finance, LLC | | | | 8-K | | | | 10.1 | | 01/05/12 |
| | | | | | | | | | | | |
10.52 | | Form of Amendment No. 6 to Credit Agreement dated February 3, 2012 between the Company and Wells Fargo Capital Finance, LLC | | | | 8-K | | | | 10.1 | | 02/03/12 |
| | | | | | | | | | | | |
10.53 | | Consent and Amendment No. 7 to Credit Agreement dated May 17, 2010 among the Company and Wells Fargo Capital Finance, LLC | | | | 8-K | | | | 10.1 | | 11/21/12 |
| | | | | | | | | | | | |
10.54 | | Asset Purchase Agreement dated May 17, 2010 by and among Encore Software, Inc., Navarre Corporation and Punch Software, LLC | | | | 8-K | | | | 10.1 | | 05/17/10 |
| | | | | | | | | | | | |
10.55 | | Settlement Agreement, dated February 11, 2011, by and among Navarre Corporation, Steven R. Becker, Matthew A. Drapkin, Becker Drapkin Management, L.P., Becker Drapkin Partners (Q.P.), L.P., Becker Drapkin Partners, L.P., BD Partners II, L.P. and BC Advisors, LLC | | | | 8-K | | | | 10.1 | | 02/14/11 |
| | | | | | | | | | | | |
10.56 | | Amendment Agreement, dated October 31, 2011, by and among Navarre Corporation, Steven R. Becker, Matthew A. Drapkin, Becker Drapkin Management, L.P., Becker Drapkin Partners (Q.P.), L.P., Becker Drapkin Partners, L.P., BD Partners II, L.P. and BC Advisors, LLC | | | | 8-K | | | | 10.1 | | 11/01/11 |
| | | | | | | | | | | | |
10.57 | | Consulting Agreement dated December 23, 2011 between the Company and Golden Rule Advisors LLC | | | | 8-K | | | | 10.1 | | 12/27/11 |
| | | | | | | | | | | | |
10.58 | | Agreement and Plan of Merger dated September 27, 2012 between the Company and SpeedFC Equityholders | | | | 8-K | | | | 2.1 | | 9/28/12 |
| | | | | | | | | | | | |
10.59 | | Amendment No.1 to the Agreement and Plan of Merger dated October 29, 2012 between the Company and SpeedFC Equityholders | | | | 8-K | | | | 2.1 | | 10/29/12 |
| | | | | | | | | | | | |
| 10.60 | | Form of Registration Rights Agreement by and among Navarre Corporation and the SFC Equityholders | | | | 8-K | | | | 10.1 | | 9/28/12 |
| | | | | | | | | | | | |
| 10.61* | | Form of Employment Agreement by and between Navarre Corporation and Jeffrey B. Zisk | | | | 8-K | | | | 10.2 | | 9/28/12 |
14.1 | | Navarre Corporation Code of Business Conduct and Ethics | | | | 10-K | | 03/31/04 | | 14.1 | | 06/29/04 |
| | | | | | | | | | | | |
21.1 | | Subsidiaries of the Registrant | | X | | | | | | | | |
| | | | | | | | | | | | |
23.1 | | Consent of Independent Registered Public Accounting Firm — Grant Thornton LLP | | X | | | | | | | | |
| | | | | | | | | | | | |
24.1 | | Power of Attorney, contained on signature page | | X | | | | | | | | |
| | | | | | | | | | | | |
31.1 | | Certification of the Chief Executive Officer pursuant to Section 302 of the Sarbanes-Oxley Act of 2002 (Rules 13a-14 and 15d-14 of the Exchange Act) | | X | | | | | | | | |
| | | | | | | | | | | | |
31.2 | | Certification of the Chief Financial Officer pursuant to Section 302 of the Sarbanes-Oxley Act of 2002 (Rules 13a-14 and 15d-14 of the Exchange Act) | | X | | | | | | | | |
| | | | | | | | | | | | |
32.1 | | Certification of the Chief Executive Officer pursuant to Section 906 of the Sarbanes-Oxley Act of 2002 (18 U.S.C. Section 1350) | | X | | | | | | | | |
| | | | | | | | | | | | |
32.2 | | Certification of the Chief Financial Officer pursuant to Section 906 of the Sarbanes-Oxley Act of 2002 (18 U.S.C. Section 1350) | | X | | | | | | | | |
| | | | | | | | | | | | |
99.1 | | Unaudited pro forma condensed consolidated balance sheets of Navarre Corporation as of December 31, 2010, and the unaudited pro forma condensed consolidated statements of operations of Navarre Corporation for the nine months ended December 31, 2010, and the fiscal years ended March 31, 2010, 2009 and 2008 | | | | 8-K/A | | | | 99.2 | | 04/06/11 |
| 99.2 | | Financial Statements of Business Acquired: Report of Independent Registered Public Accounting Firm; Consolidated balance sheets as of December 31, 2011 and 2010, and related consolidated statements of operations, changes in stockholders' equity and cash flows | | | | 8-K/A | | | | 99.1 | | 1/25/13 |
| | | | | | | | | | | | |
| 99.3 | | Financial Statements of Business Acquired: Consolidated balance sheet as of September 30, 2012, and related consolidated statement of operation for the three and nine months ended September 30, 2012 and September 30, 2011 and cash flows for the nine months ended September 30, 2012 and September 30, 2011 | | | | 8-K/A | | | | 99.2 | | 1/25/13 |
| | | | | | | | | | | | |
| 99.4 | | Pro Forma Financial Information: Unaudited pro forma condensed combined consolidated balance sheet as of September 30, 2012, and statements of operations for the six months ended September 30, 2012 and the year ended March 31, 2012 | | | | 8-K/A | | | | 99.3 | | 1/25/13 |
| | | | | | | | | | | | |
101.INS** | | XBRL Instance Document | | X | | | | | | | | |
| | | | | | | | | | | | |
101.SCH** | | XBRL Taxonomy Extension Schema | | X | | | | | | | | |
| | | | | | | | | | | | |
101.CAL** | | XBRL Taxonomy Extension Calculation | | X | | | | | | | | |
| | | | | | | | | | | | |
101.DEF** | | XBRL Taxonomy Extension Definition | | X | | | | | | | | |
| | | | | | | | | | | | |
101.LAB** | | XBRL Taxonomy Extension Labels | | X | | | | | | | | |
| | | | | | | | | | | | |
101.PRE** | | XBRL Taxonomy Extension Presentation | | X | | | | | | | | |
* Indicates a management contract or compensatory plan or arrangement required to be filed as an exhibit to this Form 10-K.
** The XBRL related information in Exhibit 101 to this Annual Report on Form 10-K shall not be deemed “filed” for purposes of Section 18 of the Securities Exchange Act of 1934, as amended, or otherwise subject to liability of that section and shall not be incorporated by reference into any filing or other document pursuant to the Securities Act of 1933, as amended, except as shall be expressly set forth by specific reference in such filing or document.
SIGNATURES
Pursuant to the requirements of the Section 13 or 15(d) of the Securities Exchange Act of 1934, the registrant has duly caused this report to be signed on its behalf by the undersigned, thereunto duly authorized.
| Navarre Corporation |
| (Registrant) | |
May 29, 2013 | /s/ Richard S Willis | |
| Richard S Willis | |
| President and Chief Executive Officer | |
| | (Principal Executive Officer) | |
May 29, 2013 | /s/ Diane D. Lapp | |
| Diane D. Lapp | |
| Chief Financial Officer | |
| | (Principal Financial and Accounting Officer) | |
Pursuant to the requirements of the Securities Exchange Act of 1934, this report has been signed below by the following persons on behalf of the registrant and in the capacities and on the dates indicated.
POWER OF ATTORNEY
KNOW ALL PERSONS BY THESE PRESENTS, that each person whose signature appears below constitutes and appoints Richard S Willis and Diane D. Lapp, or either of them, as his/her true and lawful attorney-in-fact and agent, each with the power of substitution and resubstitution, for him/her and in his/her name, place and stead, in any and all capacities, to sign any amendments to this Annual Report on Form 10-K, and to file the same, with exhibits thereto and other documents in connection therewith, with the Securities and Exchange Commission, granting unto said attorney-in-fact and agent, full power and authority to do and perform each and every act and thing requisite and necessary to be done in and about the premises, as fully to all intents and purposes as he or she might or could do in person, hereby ratifying and confirming all said attorney-in-fact and agent, or his substitute or substitutes, may lawfully do or cause to be done by virtue thereof.
Signature | | Title | | Date |
| | | | |
/s/ Richard S Willis | | President and Chief Executive Officer and Director | | May 29, 2013 |
Richard S Willis | | (principal executive officer) | | |
| | | | |
/s/ Diane D. Lapp | | Chief Financial Officer (principal financial and accounting officer) | | May 29, 2013 |
Diane D. Lapp | | | | |
| | | | | |
/s/ Timothy R. Gentz | | Chairman of the Board | | May 29, 2013 |
Timothy R. Gentz | | | | |
| | | | | |
/s/ Keith A. Benson | | Director | | May 29, 2013 |
Keith A. Benson | | | | |
| | | | | |
/s/ Monroe David Bryant, Jr. | | Director | | May 29, 2013 |
Monroe David Bryant, Jr. | | | | |
| | | | | |
/s/ Frederick C. Green IV | | Director | | May 29, 2013 |
Frederick C. Green IV | | | | |
| | | | | |
/s/ Kathleen P. Iverson | | Director | | May 29, 2013 |
Kathleen P. Iverson | | | | |
| | | | | |
/s/ Bradley J. Shisler | | Director | | May 29, 2013 |
Bradley J. Shisler | | | | |
| | | | | |
/s/ Tom F. Weyl | | Director | | May 29, 2013 |
Tom F. Weyl | | | | |
| | | | |
/s/ Jeffrey B. Zisk | | Director | | May 29, 2013 |
Jeffrey B. Zisk | | | | |
REPORT OF INDEPENDENT REGISTERED PUBLIC ACCOUNTING FIRM
Board of Directors and Shareholders
Navarre Corporation
We have audited the accompanying consolidated balance sheets of Navarre Corporation (a Minnesota corporation) and subsidiaries (the “Company”) as of March 31, 2013 and 2012, and the related consolidated statements of operations and comprehensive income (loss), shareholders’ equity, and cash flows for each of the three years in the period ended March 31, 2013. Our audits of the basic consolidated financial statements included the financial statement schedule listed in the index appearing under Item 15(a)(2). These financial statements and financial statement schedule are the responsibility of the Company’s management. Our responsibility is to express an opinion on these financial statements and financial statement schedule based on our audits.
We conducted our audits in accordance with the standards of the Public Company Accounting Oversight Board (United States). Those standards require that we plan and perform the audit to obtain reasonable assurance about whether the financial statements are free of material misstatement. An audit includes examining, on a test basis, evidence supporting the amounts and disclosures in the financial statements. An audit also includes assessing the accounting principles used and significant estimates made by management, as well as evaluating the overall financial statement presentation. We believe that our audits provide a reasonable basis for our opinion.
In our opinion, the consolidated financial statements referred to above present fairly, in all material respects, the financial position of Navarre Corporation and subsidiaries as of March 31, 2013 and 2012, and the results of their operations and their cash flows for each of the three years in the period ended March 31, 2013, in conformity with accounting principles generally accepted in the United States of America. Also in our opinion, the related financial statement schedule, when considered in relation to the basic consolidated financial statements taken as a whole, presents fairly, in all material respects, the information set forth therein.
We also have audited, in accordance with the standards of the Public Company Accounting Oversight Board (United States), the Company’s internal control over financial reporting as of March 31, 2013, based on criteria established inInternal Control—Integrated Framework issued by the Committee of Sponsoring Organizations of the Treadway Commission (COSO) and our report dated May 29, 2013 expressed an unqualified opinion.
/s/ Grant Thornton LLP
Minneapolis, Minnesota
May 29, 2013
REPORT OF INDEPENDENT REGISTERED PUBLIC ACCOUNTING FIRM
Board of Directors and Shareholders
Navarre Corporation
We have audited the internal control over financial reporting of Navarre Corporation (a Minnesota corporation) and subsidiaries (the “Company”) as of March 31, 2013, based on criteria established inInternal Control—Integrated Framework issued by the Committee of Sponsoring Organizations of the Treadway Commission (COSO). The Company’s management is responsible for maintaining effective internal control over financial reporting and for its assessment of the effectiveness of internal control over financial reporting, included in the accompanying Management’s Report on Internal Control over Financial Reporting. Our responsibility is to express an opinion on the Company’s internal control over financial reporting based on our audit.
We conducted our audit in accordance with the standards of the Public Company Accounting Oversight Board (United States). Those standards require that we plan and perform the audit to obtain reasonable assurance about whether effective internal control over financial reporting was maintained in all material respects. Our audit included obtaining an understanding of internal control over financial reporting, assessing the risk that a material weakness exists, testing and evaluating the design and operating effectiveness of internal control based on the assessed risk, and performing such other procedures as we considered necessary in the circumstances. We believe that our audit provides a reasonable basis for our opinion.
A company’s internal control over financial reporting is a process designed to provide reasonable assurance regarding the reliability of financial reporting and the preparation of financial statements for external purposes in accordance with generally accepted accounting principles. A company’s internal control over financial reporting includes those policies and procedures that (1) pertain to the maintenance of records that, in reasonable detail, accurately and fairly reflect the transactions and dispositions of the assets of the company; (2) provide reasonable assurance that transactions are recorded as necessary to permit preparation of financial statements in accordance with generally accepted accounting principles, and that receipts and expenditures of the company are being made only in accordance with authorizations of management and directors of the company; and (3) provide reasonable assurance regarding prevention or timely detection of unauthorized acquisition, use, or disposition of the company’s assets that could have a material effect on the financial statements.
Because of its inherent limitations, internal control over financial reporting may not prevent or detect misstatements. Also, projections of any evaluation of effectiveness to future periods are subject to the risk that controls may become inadequate because of changes in conditions, or that the degree of compliance with the policies or procedures may deteriorate.
In our opinion, the Company maintained, in all material respects, effective internal control over financial reporting as of March 31, 2013, based on criteria established inInternal Control—Integrated Framework issued by COSO.
We also have audited, in accordance with the standards of the Public Company Accounting Oversight Board (United States), the consolidated financial statements of the Company as of and for the year ended March 31, 2013, and our report dated May 29, 2013 expressed an unqualified opinion on those financial statements.
/s/ Grant Thornton LLP
Minneapolis, Minnesota
May 29, 2013
NAVARRE CORPORATION
CONSOLIDATED BALANCE SHEETS
(in thousands, except share amounts)
| | | March 31, 2013 | | | March 31, 2012 | |
Assets: | | | | | | | | |
Current assets: | | | | | | | | |
Cash and cash equivalents | | $ | 91 | | | $ | 5,600 | |
Accounts receivable, net | | | 83,496 | | | | 47,935 | |
Inventories | | | 34,197 | | | | 28,850 | |
Prepaid expenses | | | 2,779 | | | | 2,198 | |
Deferred tax assets — current, net | | | - | | | | 1,580 | |
Other assets — current | | | 483 | | | | 13 | |
Total current assets | | | 121,046 | | | | 86,176 | |
Property and equipment, net | | | 14,085 | | | | 6,868 | |
Software development costs, net | | | 12 | | | | 944 | |
Other assets: | | | | | | | | |
Intangible assets, net | | | 22,717 | | | | 1,547 | |
Goodwill | | | 31,484 | | | | - | |
Deferred tax assets — non-current, net | | | - | | | | 18,450 | |
Non-current prepaid royalties | | | 3,966 | | | | 4,871 | |
Other assets | | | 2,981 | | | | 2,520 | |
Total assets | | $ | 196,291 | | | $ | 121,376 | |
Liabilities and shareholders’ equity: | | | | | | | | |
Current liabilities: | | | | | | | | |
Revolving line of credit | | $ | 23,884 | | | $ | - | |
Accounts payable | | | 103,953 | | | | 73,421 | |
Checks written in excess of cash balances | | | 3,478 | | | | - | |
Accrued expenses | | | 4,370 | | | | 6,576 | |
Contingent payment obligation short-term - acquisition | | | 1,082 | | | | - | |
Contingent share obligation - acquisition | | | 388 | | | | - | |
Other liabilities — short-term | | | 1,364 | | | | 66 | |
Total current liabilities | | | 138,519 | | | | 80,063 | |
Long-term liabilities: | | | | | | | | |
Contingent payment obligation long-term - acquisition | | | 1,901 | | | | - | |
Deferred tax liabilities - long term | | | 1,279 | | | | - | |
Other liabilities — long-term | | | 909 | | | | 1,497 | |
Total liabilities | | | 142,608 | | | | 81,560 | |
Commitments and contingencies (Note 14) | | | | | | | | |
Shareholders’ equity: | | | | | | | | |
Common stock, no par value:Authorized shares — 100,000,000; issued and outstanding shares — 56,238,236 at March 31, 2013 and 37,112,343 at March 31, 2012 | | | 189,515 | | | | 164,196 | |
Accumulated deficit | | | (136,168 | ) | | | (124,371 | ) |
Accumulated other comprehensive income (loss) | | | 336 | | | | (9 | ) |
Total shareholders’ equity | | | 53,683 | | | | 39,816 | |
Total liabilities and shareholders’ equity | | $ | 196,291 | | | $ | 121,376 | |
See accompanying notes to consolidated financial statements.
NAVARRE CORPORATION
CONSOLIDATED STATEMENTS OF OPERATIONS AND COMPREHENSIVE INCOME (LOSS)
(in thousands, except per share amounts)
| | | Years ended March 31, | |
| | | 2013 | | | 2012 | | | 2011 | |
Net sales | | | | | | | | | | | | |
Distribution | | $ | 430,624 | | | $ | 473,048 | | | $ | 489,838 | |
E-commerce and fulfillment services | | | 54,671 | | | | 7,776 | | | | 1,059 | |
Total net sales | | | 485,295 | | | | 480,824 | | | | 490,897 | |
Cost of sales | | | | | | | | | | | | |
Distribution | | | 388,208 | | | | 429,679 | | | | 424,945 | |
E-commerce and fulfillment services | | | 45,911 | | | | 7,187 | | | | 784 | |
Total cost of sales | | | 434,119 | | | | 436,866 | | | | 425,729 | |
Gross profit | | | | | | | | | | | | |
Distribution | | | 42,416 | | | | 43,369 | | | | 64,893 | |
E-commerce and fulfillment services | | | 8,760 | | | | 589 | | | | 275 | |
Total gross profit | | | 51,176 | | | | 43,958 | | | | 65,168 | |
Operating expenses: | | | | | | | | | | | | |
Selling and marketing | | | 18,014 | | | | 21,112 | | | | 21,099 | |
Distribution and warehousing | | | 7,412 | | | | 13,170 | | | | 10,694 | |
General and administrative | | | 15,502 | | | | 17,738 | | | | 22,173 | |
Information technology | | | 5,223 | | | | 5,169 | | | | 1,400 | |
Depreciation and amortization | | | 3,046 | | | | 3,076 | | | | 3,848 | |
Goodwill and intangible impairment | | | - | | | | 5,996 | | | | - | |
Total operating expenses | | | 49,197 | | | | 66,261 | | | | 59,214 | |
Income (loss) from operations | | | 1,979 | | | | (22,303 | ) | | | 5,954 | |
Other income (expense): | | | | | | | | | | | | |
Interest income (expense), net | | | (1,020 | ) | | | (968 | ) | | | (1,754 | ) |
Other income (expense), net | | | (922 | ) | | | (457 | ) | | | (153 | ) |
Income (loss) from continuing operations, before income tax | | | 37 | | | | (23,728 | ) | | | 4,047 | |
Income tax benefit (expense) | | | (11,834 | ) | | | (10,572 | ) | | | 8,446 | |
Net income (loss) from continuing operations | | | (11,797 | ) | | | (34,300 | ) | | | 12,493 | |
Discontinued operations: | | | | | | | | | | | | |
Loss on sale of discontinued operations | | | - | | | | - | | | | (5,198 | ) |
Income from discontinued operations, net of tax | | | - | | | | - | | | | 3,888 | |
Net income (loss) | | $ | (11,797 | ) | | $ | (34,300 | ) | | $ | 11,183 | |
| | | | | | | | | | | | | |
Basic earnings (loss) per common share: | | | | | | | | | | | | |
Continuing operations | | $ | (0.27 | ) | | $ | (0.93 | ) | | $ | 0.34 | |
Discontinued operations | | | - | | | | - | | | | (0.03 | ) |
Net income (loss) | | $ | (0.27 | ) | | $ | (0.93 | ) | | $ | 0.31 | |
| | | | | | | | | | | | | |
Diluted earnings (loss) per common share: | | | | | | | | | | | | |
Continuing operations | | $ | (0.27 | ) | | $ | (0.93 | ) | | $ | 0.34 | |
Discontinued operations | | | - | | | | - | | | | (0.04 | ) |
Net income (loss) | | $ | (0.27 | ) | | $ | (0.93 | ) | | $ | 0.30 | |
| | | | | | | | | | | | | |
Weighted average shares outstanding: | | | | | | | | | | | | |
Basic | | | 43,529 | | | | 36,877 | | | | 36,446 | |
Diluted | | | 43,529 | | | | 36,877 | | | | 36,952 | |
| | | | | | | | | | | | | |
Other comprehensive income (loss): | | | | | | | | | | | | |
Net unrealized gain (loss) on foreign exchange rate translation, net of tax | | | 345 | | | | (164 | ) | | | 155 | |
Comprehensive income (loss) | | $ | (11,452 | ) | | $ | (34,464 | ) | | $ | 11,338 | |
See accompanying notes to consolidated financial statements.
NAVARRE CORPORATION
CONSOLIDATED STATEMENTS OF SHAREHOLDERS’ EQUITY
(in thousands, except share amounts)
| | | Common Stock | | | Accumulated | | | Accumulated Other Comprehensive | | | Total Shareholders' | |
| | | Shares | | | Amount | | | Deficit | | | Income (Loss) | | | Equity | |
Balance at March 31, 2010 | | | 36,366,668 | | | $ | 162,015 | | | $ | (101,254 | ) | | $ | - | | | $ | 60,761 | |
Shares issued upon exercise of stock options and for restricted stock | | | 284,739 | | | | 56 | | | | - | | | | - | | | | 56 | |
Share based compensation | | | - | | | | 1,096 | | | | - | | | | - | | | | 1,096 | |
Redemptions of common stock to cover tax withholdings | | | (73,802 | ) | | | (170 | ) | | | - | | | | - | | | | (170 | ) |
Net income | | | - | | | | - | | | | 11,183 | | | | - | | | | 11,183 | |
Unrealized gain on foreign exchange rate translation | | | - | | | | - | | | | - | | | | 155 | | | | 155 | |
Balance at March 31, 2011 | | | 36,577,605 | | | | 162,997 | | | | (90,071 | ) | | | 155 | | | | 73,081 | |
Shares issued upon exercise of stock options and for restricted stock | | | 633,253 | | | | 227 | | | | - | | | | - | | | | 227 | |
Share based compensation | | | - | | | | 1,171 | | | | - | | | | - | | | | 1,171 | |
Redemptions of common stock to cover tax withholdings | | | (98,515 | ) | | | (199 | ) | | | - | | | | - | | | | (199 | ) |
Net loss | | | - | | | | - | | | | (34,300 | ) | | | - | | | | (34,300 | ) |
Unrealized loss on foreign exchange rate translation | | | - | | | | - | | | | - | | | | (164 | ) | | | (164 | ) |
Balance at March 31, 2012 | | | 37,112,343 | | | | 164,196 | | | | (124,371 | ) | | | (9 | ) | | | 39,816 | |
Shares issued upon exercise of stock options and for restricted stock | | | 306,270 | | | | 134 | | | | - | | | | - | | | | 134 | |
Share based compensation | | | - | | | | 983 | | | | - | | | | - | | | | 983 | |
Redemptions of common stock to cover tax withholdings | | | (45,660 | ) | | | (44 | ) | | | - | | | | - | | | | (44 | ) |
Common stock issued - SpeedFC Acquisition | | | 18,865,283 | | | | 24,246 | | | | | | | | | | | | 24,246 | |
Net loss | | | - | | | | - | | | | (11,797 | ) | | | - | | | | (11,797 | ) |
Unrealized loss on foreign exchange rate translation (Note 2) | | | - | | | | - | | | | - | | | | 345 | | | | 345 | |
Balance at March 31, 2013 | | | 56,238,236 | | | $ | 189,515 | | | $ | (136,168 | ) | | $ | 336 | | | $ | 53,683 | |
See accompanying notes to consolidated financial statements.
NAVARRE CORPORATION
CONSOLIDATED STATEMENTS OF CASH FLOWS
(in thousands)
| | | Years ended March 31, | |
| | | 2013 | | | 2012 | | | 2011 | |
Operating activities: | | | | | | | | | | | | |
Net income (loss) | | $ | (11,797 | ) | | $ | (34,300 | ) | | $ | 11,183 | |
Adjustments to reconcile net income (loss) to net cash used in operating activities: | | | | | | | | | | | | |
Income from discontinued operations | | | - | | | | - | | | | (3,888 | ) |
Loss on sale of discontinued operations | | | - | | | | - | | | | 5,198 | |
Contingent payment obligation — unearned | | | - | | | | (948 | ) | | | - | |
Depreciation and amortization | | | 4,877 | | | | 3,624 | | | | 3,848 | |
Amortization of debt acquisition costs | | | 199 | | | | 482 | | | | 596 | |
Amortization of software development costs | | | 971 | | | | 2,135 | | | | 499 | |
Share-based compensation expense | | | 983 | | | | 1,171 | | | | 1,096 | |
Goodwill and intangible impairment | | | - | | | | 5,996 | | | | - | |
Deferred income taxes | | | 11,457 | | | | 10,726 | | | | (8,626 | ) |
Other | | | 519 | | | | 217 | | | | 303 | |
Changes in operating assets and liabilities, net of acquisition: | | | | | | | | | | | | |
Accounts receivable | | | (23,819 | ) | | | 9,799 | | | | 4,225 | |
Inventories | | | (5,206 | ) | | | (4,060 | ) | | | (2,796 | ) |
Prepaid expenses | | | 665 | | | | 6,555 | | | | (16 | ) |
Income taxes receivable | | | 13 | | | | (13 | ) | | | 131 | |
Other assets | | | (534 | ) | | | 170 | | | | 29 | |
Accounts payable | | | 24,612 | | | | (5,747 | ) | | | 912 | |
Income taxes payable | | | (853 | ) | | | (37 | ) | | | - | |
Accrued expenses | | | (4,157 | ) | | | (1,223 | ) | | | (4,000 | ) |
Net cash provided by (used in) operating activities | | | (2,070 | ) | | | (5,453 | ) | | | 8,694 | |
Investing activities: | | | | | | | | | | | | |
Proceeds from sale of discontinued operations | | | - | | | | 22,537 | | | | - | |
Repayment of note payable — acquisition | | | - | | | | (1,009 | ) | | | - | |
Cash paid for acquisition | | | (25,491 | ) | | | - | | | | (8,090 | ) |
Purchases of property and equipment, net | | | (3,811 | ) | | | (759 | ) | | | (816 | ) |
Investment in software development | | | (161 | ) | | | (877 | ) | | | (978 | ) |
Net cash provided by (used in) investing activities | | | (29,463 | ) | | | 19,892 | | | | (9,884 | ) |
Financing activities: | | | | | | | | | | | | |
Proceeds from revolving line of credit | | | 173,555 | | | | 39,471 | | | | 205,560 | |
Payments on revolving line of credit | | | (149,671 | ) | | | (39,471 | ) | | | (212,194 | ) |
Payment of deferred compensation | | | - | | | | - | | | | (1,333 | ) |
Checks written in excess of cash balances, net of acquisition | | | 2,897 | | | | (8,790 | ) | | | 3,974 | |
Debt acquisition costs | | | (762 | ) | | | (185 | ) | | | - | |
Other | | | 5 | | | | 136 | | | | 4 | |
Net (decrease) omcrease in cash and cash equivalents provided by (used in) financing activities | | | 26,024 | | | | (8,839 | ) | | | (3,989 | ) |
Net cash provided by (used in) continuing operations | | | (5,509 | ) | | | 5,600 | | | | (5,179 | ) |
Discontinued operations: | | | | | | | | | | | | |
Net cash provided by operating activities | | | - | | | | - | | | | 5,623 | |
Net cash used in investing activities | | | - | | | | - | | | | (435 | ) |
Net cash used in financing activities | | | - | | | | - | | | | (9 | ) |
Net increase (decrease) in cash | | | (5,509 | ) | | | 5,600 | | | | - | |
Cash and cash equivalents at beginning of period | | | 5,600 | | | | - | | | | - | |
Cash and cash equivalents at end of period | | $ | 91 | | | $ | 5,600 | | | $ | - | |
NAVARRE CORPORATION
CONSOLIDATED STATEMENTS OF CASH FLOWS - CONTINUED
(in thousands)
| | | Years ended March 31, | |
| | | 2013 | | | 2012 | | | 2011 | |
Supplemental cash flow information: | | | | | | | | | | | | |
Cash and cash equivalents paid for (received from): | | | | | | | | | | | | |
Interest | | $ | 710 | | | $ | 566 | | | $ | 1,675 | |
Income taxes, net of refunds | | | 202 | | | | 2 | | | | 14 | |
| | | | | | | | | | | | | |
Supplemental schedule of non-cash investing and financing activities: | | | | | | | | | | | | |
Contingent payment and share obligation related to the SpeedFC purchase price allocation | | $ | 7,364 | | | $ | - | | | $ | - | |
Shares issued related to SpeedFC Acquisition | | | 24,246 | | | | - | | | | - | |
Contingent payment obligation — unearned | | | - | | | | 948 | | | | - | |
Note payable and contingent payment obligation related to the Punch! purchase price allocation | | | - | | | | - | | | | 1,950 | |
Shares received for payment of tax withholding obligations | | | 44 | | | | 199 | | | | 170 | |
Other comprehensive income (loss) related to gain (loss) on foreign exchange translation | | | 345 | | | | (164 | ) | | | 155 | |
See accompanying notes to consolidated financial statements.
NAVARRE CORPORATION
NOTES TO CONSOLIDATED FINANCIAL STATEMENTS
March 31, 2013
Note 1 Business Description
Navarre Corporation (the “Company” or “Navarre”), a Minnesota corporation formed in 1983, is a distributor and provider of complete logistics solutions for traditional and e-commerce retail channels. The Company operates through two business segments — distribution and e-commerce and fulfillment services.
Through the distribution business, the Company distributes computer software, consumer electronics and accessories and video games. The distribution business focuses on providing a range of value-added services, including vendor-managed inventory, electronic and internet-based ordering and gift card fulfillment.
Through the e-commerce and fulfillment business, the Company provides web site development and hosting, customer care, e-commerce fulfillment and third party logistics services.
On November 20, 2012, Navarre acquired all of the equity interests of SpeedFC, Inc. (a Delaware corporation), through a merger of that entity with and into a Navarre wholly-owned subsidiary, now named SpeedFC, Inc., a Minnesota corporation (“SpeedFC”)(the transaction, the “Acquisition”) pursuant to the terms of that certain Agreement and Plan of Merger dated September 27, 2012, as amended on October 29, 2012 (the “Merger Agreement”). SpeedFC is a leading provider of end-to-end e-commerce services to retailers and manufacturers. The Company completed the acquisition of SpeedFC on November 20, 2012 (see further disclosure in Note 3). The results of SpeedFC from the date of the acquisition are reflected in the e-commerce and fulfillment segment.
During October 2011, the Company implemented a series of initiatives, including a reduction in workforce and simplification of business structures and processes across the Company’s operations. In conjunction with the initiatives, the Company reviewed its portfolio of businesses to identify poor performing activities and areas where continued business investments would not meet its requirements for financial returns (collectively, “Restructuring Plan”). This assessment resulted in the Company abandoning inventory and other investments that were determined to not meet its requirements for financial returns. These actions were intended to increase operating efficiencies and provide additional resources to invest in product lines and service categories in order to execute the Company’s long-term growth strategy plan. The Company’s restructuring activities were substantially complete by March 31, 2012.
The Company also formerly published and soldanime content through FUNimation Productions, Ltd. (“FUNimation”). The Company sold FUNimation on March 31, 2011 and accordingly, the results of operations of FUNimation for all periods presented are classified as discontinued operations (see further disclosure in Note 5).
Note 2 Summary of Significant Accounting Policies
Basis of Consolidation
The consolidated financial statements include the accounts of Navarre Corporation and its wholly-owned subsidiaries (collectively referred to herein as the “Company”). All significant inter-company accounts and transactions have been eliminated in consolidation. The results of operations, assets and liabilities of FUNimation for all periods are classified as discontinued operations.
Upon the sale of FUNimation, the Company assessed the terms of its investment interests to determine if any of the investments met the definition of a variable interest entity (“VIE”) in accordance with accounting standards effective through that date. Based on the Company’s evaluation it was determined that FUNimation was a VIE. Consolidating any VIEs within the Company’s financial results is required if the Company is found to be the primary beneficiary. The Company determined that it was not the primary beneficiary because it does not have the power to direct the activities of the VIE that most significantly impacted their economic performance, and the Company does not have the obligation to absorb the significant losses or the right to receive significant benefits from the VIE. Therefore, the results of FUNimation have not been consolidated into the Company’s financial results (see further disclosure in Note 21).
Segment Reporting
The Company’s current presentation of segment data consists of two operating and reportable segments — distribution and e-commerce and fulfillment services.
Fiscal Year
References in these footnotes to fiscal 2013, 2012 and 2011 represent the twelve months ended March 31, 2013, March 31, 2012 and March 31, 2011, respectively.
Use of Estimates
The preparation of consolidated financial statements in conformity with accounting principles generally accepted in the United States of America requires management to make estimates and assumptions that affect the amounts of assets and liabilities and disclosure of contingent assets and liabilities at the date of the consolidated financial statements and the reported amounts of revenues and expenses during the reporting period. Significant estimates include the realizability of accounts receivable, vendor advances, inventories, goodwill, intangible assets, prepaid royalties, deferred tax assets and the adequacy of certain accrued liabilities and reserves. Actual results could differ from these estimates.
Reclassifications
Certain net sales, cost of sales and operating expense classifications included in the consolidated financial statements have been reclassified from the prior years’ presentations to conform to the current year presentation. The reclassifications are primarily due to the change in segment reporting effective the quarter ended December 31, 2012.
Fair Value
Fair value is determined utilizing a hierarchy of valuation techniques. The three levels of the fair value hierarchy are as follows:
● | Level 1: Observable inputs such as quoted prices (unadjusted) in active markets for identical assets or liabilities |
● | Level 2: Inputs, other than quoted prices, that are observable for the asset or liability, either directly or indirectly; these include quoted prices for similar assets or liabilities in active markets and quoted prices for identical or similar assets or liabilities in markets that are not active |
● | Level 3: Unobservable inputs that reflect the reporting entity’s own assumptions |
Fair Value of Financial Instruments
The carrying value of the Company’s financial assets and liabilities approximates fair value at March 31, 2013 and March 31, 2012. The fair value of assets and liabilities whose carrying value approximates fair value is determined using Level 2 inputs, with the exception of cash (Level 1), contingent payment obligation (Level 3, Note 3) and contingent common stock obligation (Level 3, Note 3).
The following table provides a reconciliation of the beginning and ending balances for the contingent obligation liabilities measured at fair value using significant unobservable inputs (Level 3)
| | | Due to Seller | |
Balance at March 31, 2012 | | $ | - | |
Increase related to acquisition (Note 3) | | | 7,364 | |
Payment of contingent obligation | | | (3,993 | ) |
Change in fair value | | | - | |
Balance at March 31, 2013 | | $ | 3,371 | |
Nonrecurring Fair Value Measurements
The purchase price of business acquisitions is primarily allocated to the tangible and identifiable intangible assets acquired and liabilities assumed based on their estimated fair values on the acquisition dates, with the excess recorded as goodwill. The Company utilizes Level 3 inputs in the determination of the initial fair value. Non-financial assets such as goodwill, intangible assets, software development costs and property and equipment are subsequently measured at fair value when there is an indicator of impairment and recorded at fair value only when an impairment is recognized. The Company assesses the impairment of intangible assets annually or whenever events or changes in circumstances indicate that the carrying amount of an intangible asset may not be recoverable (Note 6). The fair value of our goodwill and intangible assets is not estimated if there is no change in events or circumstances that indicate the carrying amount of an intangible asset may not be recoverable (Note 6).
Cash and Cash Equivalents
The Company considers short-term investments with an original maturity of three months or less when purchased to be cash equivalents. From time to time, the Company reports “checks written in excess of cash balances.” This amount represents payments made to vendors that have not yet been presented by the vendor to the Company’s bank and drawn against the Company’s revolving line of credit. The balances in cash accounts, at times, may exceed federally insured limits. The Company has not experienced any losses in such accounts and believes it is not exposed to any significant credit risk on cash and cash equivalents.
Inventories
Inventories are stated at the lower of cost or market with cost determined on the first-in, first-out (FIFO) method. The Company monitors its inventory to ensure that it properly identifies, on a timely basis, inventory items that are slow-moving and non-returnable. Certain products may run out of shelf life and be returned. Generally, these products can be sold in bulk to a variety of liquidators. A significant risk is product that cannot be sold at carrying value and is not returnable to the vendor or manufacturer. The Company adjusts the carrying value to the estimated realizable value in the periods when the Company first identifies the existence of a lower of cost or market issue. Consigned inventory includes product that has been delivered to customers for which revenue recognition criteria have not been met.
Advertising
Advertising costs are expensed as incurred. Advertising expense was $1.5 million, $1.8 million and $1.7 million for the years ended March 31, 2013, 2012 and 2011, respectively.
Property and Equipment
Property and equipment are recorded at cost. Depreciation is recorded, using the straight-line method, over estimated useful lives, ranging from one to ten years. Depreciation is computed using the straight-line method for leasehold improvements over the shorter of the lease term or the estimated useful life. Estimated useful lives by major asset categories are generally as follows:
Asset | | Life in Years |
Furniture and fixtures | | | 7 | |
Office equipment | | | 5 | |
Computer equipment | | 3 | - | 5 |
Warehouse equipment | | | 5 | |
Leasehold improvements | | 1 | - | 10 |
Enterprise resource planning (ERP) system | | | 7 | |
Maintenance, repairs and minor renewals are charged to expense as incurred. Additions, major renewals and property and equipment improvements are capitalized.
Impairment of Long-Lived Assets
Long-lived assets, such as property and equipment, are evaluated for impairment whenever events or changes in circumstances indicate the carrying value of an asset may not be recoverable. An impairment loss is recognized when estimated undiscounted cash flows expected to result from the use of the asset plus net proceeds expected from disposition of the asset, if any, are less than the carrying value of the asset. When an impairment loss is recognized, the carrying amount of the asset is reduced to its estimated fair value (see further disclosure in Notes 4 and 6). Fair value is generally determined using a discounted cash flow analysis.
Software development costs
The Company accounts for its software development costs in accordance with Accounting Standards Codification (“ASC”) 985,Costs of Computer Software to Be Sold, Leased or Marketed. Capitalization of software development costs begins upon the establishment of technological feasibility. In the development of our products and our enhancements to existing products, technological feasibility is not established until substantially all product development is complete, including the development of a working model. The establishment of technological feasibility and the ongoing assessment of recoverability of capitalized software development costs requires considerable judgment by management with respect to certain external factors, including, but not limited to, technological feasibility, anticipated future gross revenues, estimated economic life, and changes in software and hardware technologies. Such costs are amortized using the straight-line method beginning when the product or enhancement is available for general release over the estimated economic life of the product or enhancement, generally three years.
Goodwill
Goodwill represents the excess of the purchase price over the fair value of identifiable net assets acquired in business combinations accounted for under the purchase method. The Company reviews goodwill for potential impairment annually for each reporting unit or when events or changes in circumstances indicate the carrying value of the goodwill might exceed its current fair value. Factors which may cause impairment include negative industry or economic trends and significant underperformance relative to historical or projected future operating results. The Company determines fair value using widely accepted valuation techniques, including discounted cash flow and market multiple analyses. The amount of impairment loss is recognized as the excess of the asset’s carrying value over its fair value (see further disclosure in Notes 3 and 6).
Intangible Assets
Intangible assets include trademarks, developed technology, customer relationships, a customer list and a domain name. Intangible assets (except for trademarks) are amortized on a straight-line basis with estimated useful lives ranging from three to eight years. The straight-line method of amortization of these assets reflects an appropriate allocation of the costs of the intangible assets to its useful life. Intangible assets are tested for impairment whenever events or circumstances indicate that a carrying amount of an asset may not be recoverable. An impairment loss is generally recognized when the carrying amount of an asset exceeds the estimated fair value of the asset. Fair value is generally determined using a discounted cash flow analysis (see further disclosure in Note 6).
Trademarks are deemed to have indefinite lives and are evaluated for impairment annually.
Debt Issuance Costs
Debt issuance costs are included in “Other Assets” and are amortized over the life of the related debt. Amortization expense is included in interest expense in the accompanyingConsolidated Statements of Operations.
Operating Leases
The Company conducts substantially all operations in leased facilities. Leasehold allowances, rent holidays and escalating rent provisions are accounted for on a straight-line basis over the term of the lease. The portion of deferred rent due in twelve months or less is considered short-term and is included in accrued expenses in the accompanyingConsolidated Balance Sheets.The long-term portion is included in other liabilities — long-term.
Revenue Recognition
Revenue on products shipped, including consigned products owned by the Company, is recognized when title and risk of loss transfers, delivery has occurred, the price to the buyer is determinable and collectability is reasonably assured. The Company provides fee-based services to certain of its customers and vendors, which are recognized on a net basis within sales. Under certain conditions, the Company permits its customers to return or destroy products. The Company records a reserve for sales returns, product destructions and allowances against amounts due to reduce the net recognized receivables to the amounts the Company reasonably believes will be collected. These reserves are based on the application of the Company’s historical or anticipated gross profit percent against average sales returns and product destructions, sales discounts percent against average gross sales and specific reserves for marketing programs.
The Company’s distribution customers, at times, qualify for certain price protection benefits from the Company’s vendors. The Company serves as an intermediary to settle these amounts between vendors and customers. The Company accounts for these amounts as reductions of revenue with corresponding reductions in cost of sales. The Company’s distribution business, at times, provides certain price protection, promotional monies, volume rebates and other incentives to customers related to proprietary software. The Company records these amounts as reductions in revenue.
Service revenues are recognized upon delivery of the services. The Company records amounts received from customers for out-of-pocket expenses, primarily freight and supplies, as revenue and the associated expense as a cost of sales. All customer revenues are recorded net of discounts and allowances provided to customers.
A portion of the Company’s service revenue arrangements include multiple service elements, such as web implementation and migration, web site support, e-commerce services and additional services. The Company has adopted the provisions of FASB ASC 605, “Revenue Recognition,” and the amendment to the Revenue Recognition – Multiple-Element Arrangements Subtopic of the FASB Accounting Standards Codification, as presented in ASU 200-13,Multiple-Deliverable Arrangements.Under the provisions of FASB ASC 605, these deliverables are regarded as one unit of accounting and the revenue recognition pattern is determined for the combined unit. The contracted value of the revenue and related costs for elements not quoted on a monthly basis, such as web site implementation and migration, are deferred and recognized ratably over the term of the arrangement, approximately three years, beginning when delivery has occurred. The revenues from the remaining service elements are recorded on a monthly basis as the services are provided. Costs associated with the web site implementation and migration are deferred and recognized ratably over the term of the arrangement consistent with the recognition of revenues.
Vendor Allowances
In the distribution business, the Company receives allowances from certain vendors as a result of purchasing their products. Vendor allowances are initially deferred. The deferred amounts are then recorded as a reduction of cost of sales when the related product is sold.
Marketing Development Funds
The Company has classified marketing development funds, such as price protection and promotions, as a reduction to revenues in the distribution business.
Accounts Receivable and Allowance for Doubtful Accounts
Credit is extended based on evaluation of a customer’s financial condition and, generally, collateral is not required. Accounts receivable are generally due within 30-90 days and are stated at amounts due from customers, net of an allowance for doubtful accounts. Accounts receivable outstanding longer than the contractual payment terms are considered past due. The Company does not accrue interest on past due accounts receivable. The Company performs periodic credit evaluations of its customers’ financial condition. The Company makes estimates of the uncollectability of its accounts receivable. In determining the adequacy of its allowances, the Company analyzes customer financial statements, historical collection experience, aging of receivables, substantial down-grading of credit scores, bankruptcy filings and other economic and industry factors. The Company writes off accounts receivable when they become uncollectible, and payments subsequently received on such receivables are credited to the allowance for doubtful accounts. Although risk management practices and methodologies are utilized to determine the adequacy of the allowance, it is possible that the accuracy of the estimation process could be materially impacted by different judgments as to collectability based on the information considered and further deterioration of accounts. The Company’s largest collection risks exist for customers that are in bankruptcy, or at risk of bankruptcy. The occurrence of these events is infrequent, but can be material when they occur.
Shipping Costs and Revenue
Costs incurred by the distribution segment related to the shipment of product to its customers are classified in selling expenses. These costs were $7.4 million, $8.9 million and $8.8 million for the years ended March 31, 2013, 2012 and 2011, respectively.
Shipping costs incurred by the e-commerce and fulfillments services segment related to providing logistical services are classified in cost of sales. These costs were $24.5 million, $3.5 million and $362,000 for the years ended March 31, 2013, 2012 and 2011, respectively.
Consolidated shipping revenue is included in net sales and was $29.1 million, $6.5 million and $2.4 million for the years ended March 31, 2013, 2012 and 2011, respectively.
Foreign Currency Transactions
Transaction gains and losses that arise from exchange rate fluctuations on transactions denominated in a currency other than the functional currency are included in the results of operations when settled, or at the most recent balance sheet date if the transaction has not settled. Foreign currency losses were a loss of $810,000, $330,000 and $129,000 for the years ended March 31, 2013, 2012 and 2011, respectively.
Income Taxes
Income taxes are recorded under the asset and liability method. Deferred tax assets and liabilities are recognized for the future tax consequences attributable to differences between the financial statement carrying amounts of existing assets and liabilities and their respective tax bases. Deferred tax assets and liabilities are measured using enacted tax rates expected to apply to taxable income in the years in which those temporary differences are expected to be recovered or settled. The effect on deferred tax assets and liabilities of a change in tax rates is recognized in income in the period that includes the enactment date. Management assesses the likelihood that deferred tax assets will be recovered from future taxable income and establishes a valuation allowance when management believes recovery is not likely.
The Company records estimated penalties and interest related to income tax matters, including uncertain tax positions as a component of income tax expense. The Company recognizes the financial statement benefit of a tax position only after determining that the relevant tax authority would more likely than not sustain the position following an audit. For tax positions meeting the more-likely-than-not threshold, the amount recognized in the financial statements is the largest benefit that has a greater than fifty percent likelihood of being realized upon ultimate settlement with the relevant tax authority.
Stock-Based Compensation
The Company has a stock option plan for officers, non-employee directors and key employees. The Company measures the cost of employee services received in exchange for the award of equity instruments based on the fair value of the award at the date of grant. The cost is to be recognized over the period during which an employee is required to provide services in exchange for the award. The Company’s common stock is purchased by the optionee upon the exercise of stock options, and restricted stock awards are settled in shares of the Company’s common stock.
Earnings (Loss) Per Share
Basic earnings (loss) per share is computed by dividing net income (loss) by the weighted average number of common shares outstanding during the year. Diluted earnings (loss) per share is computed by dividing net income (loss) by the sum of the weighted average number of common shares outstanding during the year plus all additional common shares that would have been outstanding if potentially dilutive common shares related to stock options, restricted stock and warrants had been issued. The following table sets forth the computation of basic and diluted earnings (loss) per share (in thousands, except for per share data):
| | | Years ended March 31, | |
| | | 2013 | | | 2012 | | | 2011 | |
Numerator: | | | | | | | | | | | | |
Net income (loss) from continuing operations | | $ | (11,797 | ) | | $ | (34,300 | ) | | $ | 12,493 | |
Loss from discontinued operations, net | | | - | | | | - | | | | (1,310 | ) |
Net income (loss) | | $ | (11,797 | ) | | $ | (34,300 | ) | | $ | 11,183 | |
Denominator: | | | | | | | | | | | | |
Denominator for basic earnings (loss) per share — weighted average shares | | | 43,529 | | | | 36,877 | | | | 36,446 | |
Dilutive securities: Employee stock options, restricted stock and warrants | | | - | | | | - | | | | 506 | |
Denominator for diluted earnings per share — adjusted weighted-average shares | | | 43,529 | | | | 36,877 | | | | 36,952 | |
Basic earnings (loss) per common share | | | | | | | | | | | | |
Continuing operations | | $ | (0.27 | ) | | $ | (0.93 | ) | | $ | 0.34 | |
Discontinued operations | | | - | | | | - | | | | (0.03 | ) |
Net income (loss) | | $ | (0.27 | ) | | $ | (0.93 | ) | | $ | 0.31 | |
Diluted earnings (loss) per common share | | | | | | | | | | | | |
Continuing operations | | $ | (0.27 | ) | | $ | (0.93 | ) | | $ | 0.34 | |
Discontinued operations | | | - | | | | - | | | | (0.04 | ) |
Net income (loss) | | $ | (0.27 | ) | | $ | (0.93 | ) | | $ | 0.30 | |
Due to the Company’s net loss for the years ended March 31, 2013 and 2012, diluted loss per share from continuing operations excludes 2.6 million and 2.8 million, respectively, stock options and restricted stock awards because their inclusion would have been anti-dilutive.
Approximately 2.7 million of the Company’s stock options were excluded from the calculation of diluted earnings (loss) per share in fiscal 2011, because the exercise prices of the stock options and the grant date fair value of the restricted stock were greater than the average price of the Company’s common stock and therefore their inclusion would have been anti-dilutive.
Approximately 1.6 million warrants to purchase shares outstanding were also excluded for the year ended March 31, 2011, because the exercise prices of the warrants was greater than the average price of the Company's common stock and therefore their inclusion would have been anti-dilutive. These warrants expired September 21, 2011, so they were also not included in year ended March 31, 2012 amounts.
Note 3 Acquisition
SpeedFC, Inc.
On November 20, 2012, the Company completed the acquisition of SpeedFC, a leading provider of end-to-end e-commerce services. Total consideration included: $24.5 million in cash at closing, which is net of a preliminary working capital adjustment, 17.1 million shares of the Company’s common stock plus performance payments (contingent consideration) up to an additional $5.0 million in cash (undiscounted) and 6.3 million shares of the Company’s common stock contingent upon SpeedFC’s achieving certain financial metrics for the 12 months ending December 31, 2012. The contingent cash payment is comprised of up to a maximum of $1.25 million to be paid in early calendar 2013 and up to a maximum of $3.75 million (before interest of five percent per annum) to be paid in equal, quarterly installments beginning in late calendar 2013 and ending on February 29, 2016. The contingent share payment of up to a maximum of 2,215,526 shares was to be issued in early calendar 2013 and up to a maximum of 4,071,842 shares will be issued in late calendar 2013. During fiscal 2013, the Company paid contingent cash consideration of $1.0 million and issued 1,770,097 shares. The determination of the remaining contingent cash and share payments will be finalized in fiscal 2014. The working capital adjustment will be finalized in fiscal 2014 in accordance with the Merger Agreement.
The combined fair value of the contingent consideration was estimated to be $7.4 million based upon Level 3 fair value valuation techniques (unobservable inputs that reflect the Company’s own assumptions). A financial model was applied to estimate the value of the contingent consideration that utilized the income approach and option pricing theory to compute expected values and probabilities of reaching the various thresholds in the agreement. Key assumptions included (1) a discount rate of 14%, (2) EBITDA operating results of between $6.0 and $10.0 million and (3) specific to the option pricing -interest rate of 0.15%, expected term of 0.11 years, dividend yield of 0.0% and volatility of 0%. The estimated fair value of the contingent consideration could change if different assumptions are used.
The goodwill of $31.5 million arising from the acquisition consists largely of the synergies and economies of scale expected from combining the operations of the Company and SpeedFC. All goodwill was assigned to the Company’s SpeedFC reporting unit which is included in the e-commerce and fulfillment segment and is not deductible for tax purposes. This transaction qualified as an acquisition of a significant business pursuant to Regulation S-X and financial statements for the acquired business were filed with the SEC. Operating results from the date of acquisition are included within the e-commerce and fulfillment segment.
The purchase price was allocated based on of the fair value of assets acquired and liabilities assumed as follows (in thousands):
Consideration: | | | | |
Cash | | $ | 24,493 | |
Common stock | | | 21,250 | |
Contingent payment obligation | | | 3,981 | |
Contingent common stock obligation | | | 3,383 | |
Fair value of total consideration transferred | | $ | 53,107 | |
| | | | |
The SpeedFC purchase price was allocated as follows: | | | | |
Accounts receivable | | $ | 11,732 | |
Prepaid expenses and other assets | | | 624 | |
Property and equipment | | | 7,075 | |
Purchased intangibles | | | 22,250 | |
Goodwill | | | 31,483 | |
Accounts payable | | | (6,106 | ) |
Accrued expenses and other liabilities | | | (4,056 | ) |
Deferred tax liability | | | (9,895 | ) |
| | | $ | 53,107 | |
Net sales of SpeedFC, included in theConsolidated Statements of Operations and Comprehensive Income (Loss) for the year ended March 31, 2013 were $29.5 million. SpeedFC provided operating income of $1.9 million to the consolidated Company’s operating income for the year ended March 31, 2013.
Acquisition-related costs (included in general and administrative expenses in theConsolidated Statements of Operations and Comprehensive Income (Loss)) for the year ended March 31, 2013 were $3.5 million.
The following summary, prepared on a condensed pro forma basis presents the Company’s unaudited consolidated results from operations as if the acquisition of SpeedFC had been completed as of the beginning of fiscal 2012. The unaudited pro forma presentation below does not include any impact of transaction costs or synergies.
| | | Years ended March 31, | |
| | | 2013 | | | 2012 | |
Net sales | | $ | 528,403 | | | $ | 533,841 | |
Cost of sales | | | 468,865 | | | | 480,577 | |
Gross profit | | | 59,538 | | | | 53,264 | |
Operating expenses | | | 51,572 | | | | 73,886 | |
Income from operations | | $ | 7,966 | | | $ | (20,622 | ) |
Punch! Software, LLC
On May 17, 2010, the Company completed the acquisition of substantially all of the assets of Punch! Software, LLC, (“Punch!”) a leading provider of home and landscape architectural design software in the United States. Total consideration included: $8.1 million in cash at closing, a $1.1 million note payable on the first anniversary of the closing with interest at a rate of 0.67% per annum, plus up to two performance payments (contingent consideration) of up to $1.25 million each (undiscounted), based on the Company achieving certain minimum annual net sales. The combined fair value of the contingent consideration of $948,000 was estimated by applying the income approach. That measure is based on significant inputs that are not observable in the market. Key assumptions included (1) a discount rate range of 20%-25% and (2) a probability adjusted level of revenues between $7.7 million and $9.4 million. The Company did not achieve the minimum annual sales target of $8.0 million for the first year anniversary payment. At March 31, 2012, the Company determined that the achievement of the minimum annual sales target for the second anniversary was remote. Therefore the contingent payment of $948,000 was reversed during fiscal 2012.
The goodwill of $5.7 million arising from the acquisition consists largely of the synergies and economies of scale expected from combining the operations of the Company and Punch!. All goodwill was assigned to the Company’s publishing reporting unit within the distribution business. All of the goodwill recognized is expected to be deductible for income tax purposes over a 15 year tax period. This transaction did not qualify as an acquisition of a significant business pursuant to Regulation S-X and financial statements for the acquired business were not filed. Operating results from the date of acquisition are included within the distribution business.
As discussed in Note 4, the goodwill arising from this acquisition was fully impaired during fiscal 2012. In addition, the Company determined that the Punch! trademark was impaired and recognized an impairment charge of $306,000 during fiscal 2012.
The final purchase price was allocated based on estimates of the fair value of assets acquired and liabilities assumed as follows (in thousands):
Consideration: | | | | |
Cash | | $ | 8,090 | |
Note payable | | | 1,002 | |
Contingent payment obligation—short-term | | | 422 | |
Contingent payment obligation—unearned and unpaid | | | 526 | |
Fair value of total consideration transferred | | $ | 10,040 | |
| | | | |
The Punch! purchase price was allocated as follows: | | | | |
Accounts receivable | | $ | 1,114 | |
Inventory | | | 815 | |
Prepaid expenses | | | 94 | |
Property and equipment | | | 18 | |
Purchased intangibles | | | 2,787 | |
Goodwill | | | 5,690 | |
Accounts payable | | | (469 | ) |
Accrued expenses | | | (9 | ) |
| | | $ | 10,040 | |
Net sales of Punch!, included in theConsolidated Statements of Operations for fiscal 2012 were $5.7 million and for the ten months period in fiscal 2011 owned by the Company, were $6.3 million. Although the Company has made reasonable efforts to calculate the precise impact that the Punch! acquisition had on the Company’s net income (loss) for these periods, the Company has deemed it impracticable to determine such amounts.
Acquisition-related costs (included in selling, general, and administrative expenses in theConsolidated Statements of Operations) for fiscal 2011 were $185,000.
Note 4 — Impairments and Other Charges
There were no impairment charges recorded during fiscal 2013.
During October 2011, the Company implemented a series of initiatives, including a reduction in workforce and simplification of business structures and processes across the Company’s operations. In conjunction with the series of initiatives, the Company reviewed its portfolio of businesses to identify poor performing activities and areas where continued business investments would not meet its requirements for financial returns (collectively, “Restructuring Plan”). This assessment resulted in the Company abandoning inventory and other investments that were determined to not meet its requirements for financial returns. These actions are intended to increase operating efficiencies and provide additional resources to invest in product lines and service categories in order to execute the Company’s long-term growth strategy plan. The Company’s restructuring activities were substantially complete by March 31, 2012. The Restructuring Plan included:
| ● | The elimination of approximately 90 positions across all areas of the Company, |
| | ● | The relocation of Encore operations from Los Angeles, California to the corporate headquarters in Minneapolis, Minnesota, and |
| ● | Vacating a leased property in Minneapolis, Minnesota that was utilized for warehouse and manufacturing assembly space. |
During fiscal 2012, net assets impacted included inventories, prepaid royalties, goodwill, intangibles and software development costs. No impairments and other charges were incurred related to continuing operations during fiscal 2011 or fiscal 2010.
Inventory. The total distribution segment inventory charges were $2.6 million during fiscal 2012. The Company records inventory at the lower of cost or market. When it is determined that the market value is lower than the cost, the Company establishes a reserve for the difference between carrying value and estimated realizable value. The Company determines the estimated realizable value by evaluating the nature and quantity of inventory on hand as compared to expected future sales volumes in addition to corroboration of estimated sales values with market participants.
Prepaid Royalties.The Company makes prepayments to licensors for the licensing of content. The prepayment is reduced by royalties earned by the licensor after the sale of the product. The Company evaluates its prepaid royalties for impairment when changes in events and circumstances indicate that the carrying value might exceed the current fair value. The Company determines fair value utilizing current market values and future market trends. Based on the Company’s review of its business activities and the identification of investments that would not meet requirements for financial returns, the Company recorded an impairment charge related to the distribution segment for prepaid royalty amounts that will not be recouped of $6.1 million during fiscal 2012, which is included in cost of sales within theConsolidated Statements of Operations.
Software Development.The Company incurs software development costs for software to be sold, leased or marketed in the distribution business. Software development costs include third-party contractor fees and overhead costs. The Company tests for possible impairment whenever events or changes in circumstances, such as a reduction in expected cash flows, indicate that the carrying amount of the asset may not be recoverable. Based on the expected cash flows related to the distribution segment software development, the Company recorded an impairment charge of $1.2 million during fiscal 2012, which is included in cost of sales within theConsolidated Statements of Operations.
Customer Credits.Based on the Company’s review of business activities and the identification of investments that would not meet requirements for financial returns, customer credits of $470,000 were provided related to the distribution segment for amounts that will not be collected during fiscal 2012. These amounts are included in net sales within theConsolidated Statements of Operations.
Severance and other related costs. The Company completed a Company-wide reduction in force during fiscal 2012. In addition, the Company incurred expenses related to the CEO transition which commenced during the first quarter of fiscal 2012. For fiscal 2012, the total severance and related costs were $6.2 million which were associated with the distribution business. The Company records one-time termination benefit arrangement costs at the date of communication to employees as long as the plan establishes the benefits that employees will receive upon termination in sufficient detail to enable employees to determine the type and amount of benefits the employee would receive if involuntarily terminated. The Company records severance costs when the payment of the benefits is probable and reasonably estimable. Other related costs are recorded when the expense is incurred.
Facility related costs. In fiscal 2012 the Company vacated a leased property that was utilized for warehouse and manufacturing space in addition to relocating Encore operations to corporate headquarters. For fiscal 2012, the total facility related costs were $3.0 million.
Goodwill and intangibles.During fiscal 2012, the Company concluded that indicators of potential impairment were present due to the Restructuring Plan announced in October 2011, which included a review of its portfolio of businesses for where continued business investments would not meet its requirements for financial returns. The Company conducted goodwill and intangible impairment tests during the three months ended December 31, 2011 based on the facts and circumstances known at that time and its business strategy in light of the Restructuring Plan, and existing industry and economic conditions as well as taking into consideration future expectations.
The Company recognizes the excess cost of an acquired entity over the net amount assigned to the fair value of the assets acquired and liabilities assumed as goodwill. The Company reviews goodwill for potential impairment annually for each reporting unit, or when events or changes in circumstances indicate that the carrying value of the goodwill might exceed its current fair value. Factors which may cause impairment include negative industry or economic trends and significant underperformance relative to historical or projected future operating results. The Company determines fair value using widely accepted valuation techniques, including discounted cash flow and market multiple analysis. The goodwill impairment charge for the publishing reporting unit within the distribution segment was $5.7 million during fiscal 2012.
The fair value of the indefinite lived intangible assets is determined for the impairment test using the relief from royalty valuation technique, which is a variation of the income approach. The Company determined that the Punch! trademark was impaired as of December 31, 2011. The intangible impairment charge for the distribution segment was $306,000 during fiscal 2012.
The following table summarizes the impairment and other charges included in the Company’s Consolidated Statement of Operations for fiscal 2012 (in thousands):
| | |
Inventory | | | Software development costs | | |
Prepaid royalties | | |
Customer credits | | |
Severance and other | | |
Goodwill & intangible | | |
Facility related | | |
Total | |
| | | | | | | | | | | | | | | | | | | | | | | | | | | | | | | | | |
Net sales | | $ | — | | | $ | — | | | $ | — | | | $ | 470 | | | $ | — | | | $ | — | | | $ | — | | | $ | 470 | |
Cost of Sales | | | 2,619 | | | | 1,238 | | | | 6,057 | | | | — | | | | 2 | | | | — | | | | — | | | | 9,916 | |
Selling and marketing | | | — | | | | — | | | | — | | | | — | | | | 542 | | | | — | | | | — | | | | 542 | |
Distribution and warehousing | | | — | | | | — | | | | — | | | | — | | | | 851 | | | | — | | | | 2,822 | | | | 3,673 | |
General and administrative | | | — | | | | — | | | | — | | | | — | | | | 4,820 | | | | — | | | | 19 | | | | 4,839 | |
Goodwill and intangible impairment | | | — | | | | — | | | | — | | | | — | | | | — | | | | 5,996 | | | | — | | | | 5,996 | |
Other expense | | | — | | | | — | | | | — | | | | — | | | | — | | | | — | | | | 122 | | | | 122 | |
Total | | $ | 2,619 | | | $ | 1,238 | | | $ | 6,057 | | | $ | 470 | | | $ | 6,215 | | | $ | 5,996 | | | $ | 2,963 | | | $ | 25,558 | |
Note 5 Discontinued Operations
Sale Transaction
On March 31, 2011, the Company sold its wholly-owned subsidiary, FUNimation, for $24.0 million, which was received in full during fiscal 2012 and therefore recorded as a receivable on the Company’sConsolidated Balance Sheets at March 31, 2011. In connection with the sale, the Company entered into an agreement to act as FUNimation’s exclusive distributor and logistics and fulfillment services provider in the United States on a continuing basis (see further disclosure in Note 24).
The Company has presented all results of operations of FUNimation as discontinued operations, and the consolidated financial statements, including the notes, have been reclassified to reflect such segregation for all periods presented. The Company has elected to allocate a portion of the consolidated interest expense related to the revolving line of credit, based on a percentage of its assets, to discontinued operations. The Company used the proceeds received upon the sale of FUNimation to reduce the Company’s borrowings and for general working capital needs. During fiscal 2011, the Company adjusted the carrying value of the assets and liabilities of discontinued operations by $2.1 million, to reflect fair value measurements. The loss was recorded as an impairment charge and is included in “Income (loss) from discontinued operations” in theConsolidated Statements of Operations.
As part of the sale transaction, the Company recorded the following loss which is included in “Loss on sale of discontinued operations” in theConsolidated Statements of Operations in fiscal 2011:
Cash proceeds | | $ | 24,000 | |
Transaction costs | | | (1,463 | ) |
Net cash proceeds | | | 22,537 | |
| | | | | |
Net assets sold: | | | | |
Accounts receivable, net | | | 7,187 | |
Inventories, net | | | 4,301 | |
Prepaid expenses | | | 144 | |
Property and equipment, net | | | 1,195 | |
License fees, net | | | 15,643 | |
Production costs, net | | | 10,643 | |
Accounts payable and accrued liabilities | | | (8,438 | ) |
Net assets sold | | | 30,675 | |
| | | | | |
Loss on sale of discontinued operations, before income tax | | | (8,138 | ) |
Income tax benefit | | | 2,940 | |
Loss on sale of discontinued operations, net of tax | | $ | (5,198 | ) |
The Company’s consolidated financial statements have been reclassified to segregate the operating results of discontinued operations. The summary of operating results for the year ended March 31, 2011 from discontinued operations is as follows (in thousands):
Net sales | | $ | 35,398 | |
Interest expense | | | 425 | |
Income from discontinued operations, before income tax | | | 6,109 | |
Income tax expense | | | (2,221 | ) |
Income from discontinued operations, net of tax | | $ | 3,888 | |
| | | | | |
Loss on sale of discontinued operations, before income tax | | | (8,138 | ) |
Income tax benefit | | | 2,940 | |
Loss on sale of discontinued operations, net of tax | | $ | (5,198 | ) |
Note 6 Goodwill and Intangible Assets
Goodwill
The Companyperforms an impairment test ofgoodwill annually, or whenevents or a change incircumstances indicatethat thecarrying value mightexceedthecurrent fair value.Thegoodwill as ofMarch 31,2013 was created intheSpeedFC acquisitionandthe annualimpairmenttest will occurasofOctober31 eachyear.Certain factorsmayresultintheneedto performan impairmenttestotherthan annually, including significantunderperformance ofthe Company's business relative toexpectedoperatingresults, significant adverseeconomic andindustry trends, and a decisionto divest an individual business withinareporting unit.
The Company’s reporting units are composed of either a discrete business or an aggregation of businesses with similar economic characteristics. For the purpose of performing the required goodwill impairment tests, the Company applies a present value (discounted cash flow) method to determine the fair value of the goodwill. The SpeedFC reporting unit within the e-commerce and fulfillment business had a goodwill balance of $31.5 million at March 31, 2013. There is no goodwill associated with the distribution business.
If the fair value of the reporting unit is determined, based on qualitative factors, to be more likely than not less than the carrying amount of the reporting unit, then the Company is required to perform the goodwill impairment test. Goodwill impairment is determined using a two-step process.
| | • | | The first step is to identify if a potential impairment exists by comparing the fair value of the business with its carrying amount, including goodwill. If the fair value of a reporting unit exceeds its carrying amount, goodwill of the reporting unit is not considered to have a potential impairment and the second step of the process is not necessary. However, if the carrying amount of a reporting unit exceeds its fair value, the second step is performed to determine if goodwill is impaired and to measure the amount of impairment loss to recognize, if any. |
| | | | |
| | • | | The second step, if necessary, compares the implied fair value of goodwill with the carrying amount of goodwill. If the implied fair value of goodwill exceeds the carrying amount, then goodwill is not considered impaired. However, if the carrying amount of goodwill exceeds the implied fair value, an impairment loss is recognized in an amount equal to that excess. |
The Company estimates the fair value using various valuation techniques, with the primary technique being a discounted cash flow analysis. A discounted cash flow analysis requires the Company to make various assumptions about sales, operating margins, growth rates and discount rates. Assumptions about discount rates are based on a weighted-average cost of capital derived from observable market inputs and comparable company data. Assumptions about sales, operating margins, and growth rates are based on management’s forecasts, business plans, economic projections, anticipated future cash flows and marketplace data. Assumptions are also made for varying perpetual growth rates for periods beyond the long-term business plan period.
During fiscal 2012, the Company concluded that indicators of potential impairment were present due to the Restructuring Plan announced in October 2011, which included a review of its portfolio of businesses for where continued business investments would not meet its requirements for financial returns. The Company conducted impairment tests during fiscal 2012 based on present facts and circumstances known and its publishing reporting unit business strategy in light of the Restructuring Plan, and existing industry and economic conditions, as well as taking into consideration future expectations. Accordingly, during fiscal 2012, the Company recorded pre-tax, non-cash goodwill impairment charges of $5.7 million, which is included in goodwill and intangible impairment in theConsolidated Statements of Operations. These pre-tax, non-cash charges had no impact on the Company’s compliance with financial covenants in its credit agreement.
In the fiscal 2012 evaluation of the fair value of the Company’s publishing reporting unit, the Company projected declines in revenue in for the periods evaluated. In fiscal 2012, the Company also assumed a discount rate of 20.0% and a perpetual growth rate of negative 3.0%.
After recording the above impairment, the Company’s distribution segment had a goodwill balance of zero at March 31, 2012 and the annual impairment test was not necessary.
Indefinite Lived Intangible Assets
Indefinite lived intangible assets include the Punch! trademark and the SpeedFC trademark, which are not amortized. The Company makes annual assessments (on December 31 each year for Punch! related intangible assets and October 31 each year for SpeedFC related intangible assets), or as events or circumstances indicate that the asset might be impaired, to evaluate realizability of carrying values. The fair value of the indefinite lived intangible assets is determined for the impairment test using the relief from royalty valuation technique, which is a variation of the income approach. Prior to fiscal 2012, the annual impairment assessment was performed on March 31 of each fiscal year. The fiscal 2013 and 2012 annual impairment assessments for the Punch! related intangible assets were performed as of December 31, 2012 and 2011, respectively. Due to SpeedFC being acquired on November 20, 2012, the first annual impairment assessment will take place October 31, 2013.
As discussed in Note 4, the Company recorded pre-tax, non-cash impairment charges of $306,000 during fiscal 2012 which is included in goodwill and intangible impairment in theConsolidated Statements of Operations. In fiscal 2012, a discount rate of 25.0% was used in this analysis. There were no impairment charges recorded during fiscal 2013 or 2011.
Definite Lived Intangible Assets
The Company evaluates its definite lived intangible amortizing assets for impairment when changes in events and circumstances indicate that the carrying value might exceed the current fair value. The Company determines fair value utilizing current market values and future market trends. There were no impairment charges recorded during fiscal 2013, 2012 or 2011.
Intangible Asset Summary
Identifiable intangible assets, with zero residual value, are being amortized (except for the trademarks which have an indefinite life) over useful lives of five years for developed technology, eight to fourteen years for customer relationships, three years for customer list and seven years for the domain name and are valued as follows (in thousands):
| | | As of March 31, 2013 | | | As of March 31, 2012 | |
| | | Gross carrying amount | | | Accumulated amortization | | |
Net | | | Gross carrying amount | | | Accumulated amortization | | |
Net | |
Developed technology | | $ | 6,110 | | | $ | 1,639 | | | $ | 4,471 | | | $ | 1,940 | | | $ | 813 | | | $ | 1,127 | |
Customer relationships | | | 14,570 | | | | 344 | | | | 14,226 | | | | 80 | | | | 23 | | | | 57 | |
Customer list | | | 167 | | | | 167 | | | | 0 | | | | 167 | | | | 110 | | | | 57 | |
Domain name | | | 205 | | | | 69 | | | | 136 | | | | 70 | | | | 58 | | | | 12 | |
Trademarks (not amortized) | | | 3,884 | | | | — | | | | 3,884 | | | | 294 | | | | — | | | | 294 | |
| | | $ | 24,936 | | | $ | 2,219 | | | $ | 22,717 | | | $ | 2,551 | | | $ | 1,004 | | | $ | 1,547 | |
Aggregate amortization expense for the years ended March 31, 2013, 2012 and 2011 was $1.2 million, $523,000 and $444,000, respectively. The following is a schedule of estimated future amortization expense (in thousands):
2014 | | $ | 2,693 | |
2015 | | | 3,688 | |
2016 | | | 3,876 | |
2017 | | | 3,119 | |
2018 | | | 2,153 | |
Thereafter | | | 3,304 | |
Total | | $ | 18,833 | |
Debt issuance costs
Debt issuance costs are included in “Other Assets” and are amortized over the life of the related debt. Debt issuance costs consisted of the following (in thousands):
| | | March 31, 2013 | | | March 31, 2012 | |
Debt issuance costs | | $ | 2,736 | | | $ | 1,975 | |
Less: accumulated amortization | | | 1,525 | | | | 1,327 | |
Debt issuance costs, net | | $ | 1,211 | | | $ | 648 | |
Amortization expense was $199,000, $482,000 and $596,000 for the years ended March 31, 2013, 2012 and 2011, respectively and was included in interest expense. During fiscal 2013 and 2012, the Company incurred $762,000 and $185,000, respectively of debt issuance costs related to amendments to the Company’s Credit Facility (see further disclosure in Note 16).
Note 7 Accounts Receivable
Accounts receivable consisted of the following (in thousands):
| | | March 31, 2013 | | | March 31, 2012 | |
Trade receivables | | $ | 81,237 | | | $ | 50,690 | |
Vendor receivables | | | 5,891 | | | | 2,829 | |
| | | | 87,128 | | | | 53,519 | |
Less: allowance for doubtful accounts and sales discounts | | | 1,744 | | | | 3,397 | |
Less: allowance for sales returns, net margin impact | | | 1,888 | | | | 2,187 | |
Total | | $ | 83,496 | | | $ | 47,935 | |
Note 8 Inventories
Inventories, net of reserves, consisted of the following (in thousands):
| | | March 31, 2013 | | | March 31, 2012 | |
Finished products | | $ | 32,149 | | | $ | 27,398 | |
Consigned inventory | | | 1,510 | | | | 1,501 | |
Raw materials | | | 1,851 | | | | 1,646 | |
| | | | 35,510 | | | | 30,545 | |
Less: inventory reserve | | | 1,313 | | | | 1,695 | |
Total | | $ | 34,197 | | | $ | 28,850 | |
Note 9 Prepaid Expenses
Prepaid expenses consisted of the following (in thousands):
| | | March 31, 2013 | | | March 31, 2012 | |
Prepaid royalties | | $ | 1,750 | | | $ | 1,242 | |
Other prepaid expenses | | | 1,029 | | | | 956 | |
Current prepaid expenses | | | 2,779 | | | | 2,198 | |
Non-current prepaid royalties | | | 3,966 | | | | 4,871 | |
Total prepaid expenses | | $ | 6,745 | | | $ | 7,069 | |
Note 10 Property and Equipment
Property and equipment consisted of the following (in thousands):
| | | March 31, 2013 | | | March 31, 2012 | |
Furniture and fixtures | | $ | 1,162 | | | $ | 1,159 | |
Computer and office equipment | | | 21,685 | | | | 17,986 | |
Warehouse equipment | | | 12,704 | | | | 8,130 | |
Leasehold improvements | | | 2,460 | | | | 2,211 | |
Construction in progress | | | 2,277 | | | | 404 | |
Total | | | 40,288 | | | | 29,890 | |
Less: accumulated depreciation and amortization | | | 26,203 | | | | 23,022 | |
Net property and equipment | | $ | 14,085 | | | $ | 6,868 | |
Depreciation and amortization expense was $3.7 million, $3.1 million and $3.4 million for the years ended March 31, 2013, 2012 and 2011, respectively.
Note 11 Capitalized Software Development Costs
The Company incurs software development costs for software to be sold, leased or marketed in the distribution business. Software development costs include third-party contractor fees and overhead costs. The Company capitalizes these costs once technological feasibility is achieved. Capitalization ceases and amortization of costs begins when the software product is available for general release to customers. The Company amortizes capitalized software development costs by the greater of the ratio of gross revenues of a product to the total current and anticipated future gross revenues of that product or the straight-line method over the remaining estimated economic life of the product. The Company tests for possible impairment whenever events or changes in circumstances, such as a reduction in expected cash flows, indicate that the carrying amount of the asset may not be recoverable. If indicators exist, the Company compares the undiscounted cash flows related to the asset to the carrying value of the asset. As discussed in Note 4, the Company recorded an impairment charge of $1.2 million during the fiscal 2012 based on the expected future cash flows, which is included in cost of sales within theConsolidated Statements of Operations. There were no impairment charges recorded during fiscal 2013 or fiscal 2011.
Software development costs consisted of the following (in thousands):
| | | March 31, 2013 | | | March 31, 2012 | |
Software development costs | | $ | 3,674 | | | $ | 3,635 | |
Less: accumulated amortization | | | 3,662 | | | | 2,691 | |
Software development costs, net | | $ | 12 | | | $ | 944 | |
Amortization expense was $971,000, $2.1 million (including an impairment charge of $1.2 million) and $499,000 for the years ended March 31, 2013, 2012 and 2011, respectively and is included in cost of sales in theConsolidated Statements of Operations.
Note 12 Accrued Expenses
Accrued expenses consisted of the following (in thousands):
| | | March 31, 2013 | | | March 31, 2012 | |
Compensation and benefits | | $ | 1,847 | | | $ | 1,233 | |
Legal disputes | | | - | | | | 250 | |
Severance | | | - | | | | 1,232 | |
Royalties | | | 256 | | | | 917 | |
Rebates | | | 1,096 | | | | 1,364 | |
Interest | | | 99 | | | | 21 | |
Other | | | 1,072 | | | | 1,559 | |
Total | | $ | 4,370 | | | $ | 6,576 | |
Note 13 401(k) Plan
The Company has a defined contribution 401(k) profit-sharing plan for eligible employees, which is qualified under Sections 401(a) and 401(k) of the Internal Revenue Code of 1986, as amended. The plan covers substantially all full-time and part-time employees. Employees are entitled to make tax deferred contributions of up to 100% of their eligible compensation, subject to annual IRS limitations. The Company may contribute a discretionary amount on an annual basis. The Company’s discretionary contributions charged to expense were zero, $123,000 and $317,000 for the years ended March 31, 2013, 2012 and 2011, respectively. The Company’s matching contributions vest over three years.
Note 14 Commitments and Contingencies
Contingent payments —SpeedFC acquisition (see Note 3)
At March 31, 2013, the Company accrued a $3.0 million note payable related to contingent payments owed to SFC Equityholders, plus interest at a rate of 5.0% per annum. In addition the Company has a contingent share obligation of $388,000 accrued as of March 31, 2013.
Contingent payment — Punch! acquisition
At March 31, 2011, the Company accrued a $1.0 million note payable related to a deferred payment due on the first anniversary of the Punch! acquisition closing, plus interest at a rate of 0.67% per annum. The obligation was paid in full during the first quarter of fiscal 2012. Additionally, at March 31, 2011, the Company accrued $948,000 for two potential contingent performance payments of up to $1.25 million each (undiscounted), based on the Company achieving certain minimum annual net sales. The two contingent payments were payable on the first and second anniversary of the closing date. The combined fair value of the contingent consideration of $948,000 was estimated by applying the income approach. That measure is based on significant inputs that are not observable in the market. Key assumptions include (1) a discount rate range of 20%-25% and (2) a probability adjusted level of revenues between $7.7 million and $9.4 million (see further disclosure in Note 3). The Company did not achieve the minimum annual sales target required for the first anniversary contingent payment. At March 31, 2012, the Company determined that the achievement of the minimum annual sales target for the second anniversary contingent payment was remote. Therefore the contingent payment of $948,000 was reversed during fiscal 2012.
Changes in the carrying value of the contingent payment obligation are as follows (in thousands):
Balance, March 31, 2011 | | $ | 948 | |
Reversal of unearned contingent payment | | | (948 | ) |
Balance, March 31, 2012 | | $ | - | |
Leases
The Company leases its facilities and a portion of its office and warehouse equipment. The terms of the lease agreements generally range from 3 to 15 years, with certain leases containing options to extend the leases up to an additional 10 years. The Company does not believe that exercise of the renewal options are reasonably assured at the inception of the lease agreements and, therefore, considers the initial base term to be the lease term. The leases require payment of real estate taxes and operating costs in addition to base rent. Total base rent expense was $2.8 million, $2.5 million and $2.5 million for the years ended March 31, 2013, 2012 and 2011, respectively. Lease terms vary, but generally provide for fixed and escalating rentals which range from an additional $0.06 per square foot to a 3% annual increase over the life of the lease.
The following is a schedule of future minimum rental payments required under noncancelable operating leases as of March 31, 2013 (in thousands):
2014 | | $ | 3,694 | |
2015 | | | 4,379 | |
2016 | | | 6,058 | |
2017 | | | 6,051 | |
2018 | | | 6,059 | |
Thereafter | | | 22,594 | |
| Total | | $ | 48,835 | |
Guarantee
On May 29, 2007, FUNimation entered into an office lease in Flower Mound, Texas. In order to obtain the lease, the Company, as the parent of the FUNimation subsidiary at that time, guaranteed the full and prompt payment of the lease obligations and as of March 31, 2011, the Company continued to be the guarantor. On April 14, 2011, the Company entered into an agreement to be released from the office lease guarantee by providing a five-year, standby letter of credit for $1.5 million, which is reduced by $300,000 each subsequent year. The standby letter of credit can be drawn down, to the extent in default, if the full and prompt payment of the lease is not completed by FUNimation. There was no indication that FUNimation would not be able to pay the required future lease payments totaling $2.9 million and $3.5 million at March 31, 2013 and 2012, respectively. Therefore, at March 31, 2013 and 2012, the Company did not believe a future draw on the standby letter of credit was probable and an accrual related to any future obligation was not considered necessary at such times.
Litigation and Proceedings
In the normal course of business, the Company is involved in a number of litigation/arbitration and administrative/regulatory matters that are incidental to the operation of the Company’s business. These proceedings generally include, among other things, various matters with regard to products distributed by the Company and the collection of accounts receivable owed to the Company.
On October 16, 2012, a purported class action lawsuit on behalf of Navarre shareholders relating to the transactions contemplated by the SpeedFC Merger Agreement was filed in the United States District Court for the District of Minnesota against the Company, the Board of Directors, the Company’s acquisition subsidiary and SpeedFC, Inc. entitledHelene Gottliebv.Richard S. Willis, et al. On November 7, 2012, the court denied the Gottlieb’s motion for a preliminary injuction.
On October 29, 2012, a second purported class action entitledDavin Pokoik v. Richard S Willis, et al.was filed in the United States District Court for the District of Minnesota against the Company, the Board of Directors, the Company’s acquisition subsidiary and SpeedFC, Inc. This suit asserted substantially similar claims and requested substantially similar relief as theGottlieb matter. By Court Order dated November 13, 2012, the Gottlieb and Pokoik matters were consolidated and plaintiffs were required to file an amended Complaint by December 20, 2012. Plaintiff Gottlieb submitted a notice of voluntary dismissal removing herself from the consolidated action and on May 24, 2013 the consolidated actions were dismissed based upon a stipulation for Dismissal filed by the parties.
The Company does not currently believe that the resolution of any pending matters will have a material adverse effect on the Company’s financial position or liquidity, but an adverse decision in more than one could be material to the Company’s consolidated results of operations. No amounts were accrued with respect to proceedings as of March 31, 2012 and 2013, respectively as not probable or estimable.
Note 15 Capital Leases
The Company leases certain equipment under noncancelable capital leases. At March 31, 2013 and 2012, leased capital assets included in property and equipment were as follows (in thousands):
| | | March 31, 2013 | | | March 31, 2012 | |
Computer and office equipment | | $ | 193 | | | $ | 381 | |
Less: accumulated amortization | | | 101 | | | | 311 | |
Net property and equipment | | $ | 92 | | | $ | 70 | |
Amortization expense for the years ended March 31, 2013, 2012 and 2011 was $82,000, $87,000 and $52,000, respectively. Future minimum lease payments, excluding additional costs such as insurance and maintenance expense payable by the Company under these agreements, by year and in the aggregate are as follows (in thousands):
| | | Minimum Lease Commitments | |
Year ending March 31: | | | | |
2014 | | $ | 45 | |
2015 | | | 32 | |
2016 | | | 30 | |
2017 | | | 5 | |
Total minimum lease payments | | $ | 112 | |
Less: amounts representing interest at rates ranging from 7.0% to 9.563% | | | 14 | |
Present value of minimum capital lease payments, reflected in the balance sheet as current and noncurrent capital lease obligations of $38 and $60, respectively. | | $ | 98 | |
Note 16 Bank Financing and Debt
On November 12, 2009, the Company entered into a three year, $65.0 million revolving credit facility (the “Credit Facility”) with Wells Fargo Foothill, LLC as agent and lender, and a participating lender. On December 29, 2011, the Credit Facility was amended to eliminate the participating lender, reduce the revolving credit facility limit to $50.0 million, provide for an additional $20.0 million under the Credit Facility under certain circumstances and extend the maturity date to December 29, 2016. On November 20, 2012, the Credit Facility was amended to provide for the acquisition of SpeedFC, eliminate the additional $20.0 million available under the Credit Facility and extend the maturity date to November 20, 2017.
The Credit Facility is secured by a first priority security interest in all of the Company’s assets, as well as the capital stock of its subsidiary companies. Additionally, the Credit Facility, as amended, calls for monthly interest payments at the bank’s base rate (as defined in the Credit Facility) plus 1.75%, or LIBOR plus 2.75%, at the Company’s discretion.
At March 31, 2013 and 2012 the Company had $23.9 million and zero, respectively, outstanding on the Credit Facility. Amounts available under the Credit Facility are subject to a borrowing base formula. Changes in the assets within the borrowing base formula can impact the amount of availability. Based on the Credit Facility’s borrowing base and other requirements at such dates, the Company had excess availability of $19.9 million and $30.4 million at March 31, 2013 and 2012, respectively.
In association with, and per the terms of the Credit Facility, the Company also pays and has paid certain facility and agent fees. Weighted-average interest on the Credit Facility was 4.38% and 4.25% at March 31, 2013 and 2012, respectively. Such interest amounts have been, and continue to be, payable monthly.
Under the Credit Facility, the Company is required to meet certain financial and non-financial covenants. The financial covenants include a variety of financial metrics that are used to determine the Company’s overall financial stability as well as limitations on capital expenditures, a minimum ratio of EBITDA to fixed charges and a minimum borrowing base availability requirement. At March 31, 2013, the Company was in compliance with all covenants under the Credit Facility. The Company currently believes it will be in compliance with all covenants in the Credit Facility during the next twelve months.
Letters of Credit
On April 14, 2011, the Company was released from the FUNimation office lease guaranty by providing a five-year, standby letter of credit for $1.5 million, which is reduced by $300,000 each subsequent year. The standby letter of credit can be drawn down, to the extent in default, if the full and prompt payment of the lease is not completed by FUNimation. No claims have been made against this financial instrument. There was no indication that FUNimation would not be able to pay the required future lease payments totaling $2.9 million and $3.5 million at March 31, 2013 and 2012, respectively. Therefore, at March 31, 2013 and 2012, the Company did not believe a future draw on the standby letter of credit was probable and an accrual related to any future obligation was not considered necessary at such times.
Note 17 Income Taxes
The income tax provision (benefit) from continuing operations is comprised of the following (in thousands):
| | | Years ended March 31, | |
| | | 2013 | | | 2012 | | | 2011 | |
Current | | | | | | | | | | | | |
Federal | | $ | (112 | ) | | $ | (133 | ) | | $ | (134 | ) |
Foreign | | | 35 | | | | (93 | ) | | | 233 | |
State | | | 133 | | | | 72 | | | | 81 | |
Deferred | | | 334 | | | | (8,138 | ) | | | 1,100 | |
Valuation allowance | | | 11,444 | | | | 18,864 | | | | (9,726 | ) |
Tax expense (benefit) | | $ | 11,834 | | | $ | 10,572 | | | $ | (8,446 | ) |
A reconciliation of income tax expense (benefit) from continuing operations to the statutory federal rate is as follows (in thousands):
| | | Years ended March 31, | |
| | | 2013 | | | 2012 | | | 2011 | |
Expected federal income tax at statutory rate | | $ | 13 | | | $ | (8,077 | ) | | $ | 1,376 | |
State income taxes, net of federal tax effect | | | 1 | | | | (531 | ) | | | 133 | |
Valuation allowance | | | 11,444 | | | | 18,864 | | | | (9,726 | ) |
Return to provision | | | (374 | ) | | | - | | | | - | |
Uncertain tax liability | | | (48 | ) | | | (106 | ) | | | 72 | |
Permanent differences | | | 489 | | | | (302 | ) | | | (104 | ) |
Rate change | | | 48 | | | | - | | | | - | |
Other | | | 261 | | | | 724 | | | | (197 | ) |
Tax expense (benefit) | | $ | 11,834 | | | $ | 10,572 | | | $ | (8,446 | ) |
| | | Years ended March 31, | |
| | | 2013 | | | 2012 | | | 2011 | |
Expected federal income tax at statutory rate | | | 34.0 | % | | | 34.0 | % | | | 34.0 | % |
State income taxes, net of federal tax effect | | | 3.2 | | | | 2.2 | | | | 3.3 | |
Valuation allowance | | | 30,929.2 | | | | (79.5 | ) | | | (240.3 | ) |
Permanent differences | | | 1,322.4 | | | | — | | | | — | |
Return to provision | | | (1,011.0 | ) | | | (1.5 | ) | | | (5.0 | ) |
Rate change | | | 129.1 | | | | — | | | | — | |
Other | | | 576.8 | | | | 0.2 | | | | (0.7 | ) |
Effective tax rate (continuing operations) | | | 31,983.7 | % | | | (44.6 | )% | | | (208.7 | )% |
The change in the effective tax rate from fiscal 2012 to fiscal 2013 is principally attributable to the fact that the Company had $37,000 of income before taxes in fiscal 2013 compared to a loss before taxes of $23.7 million in fiscal 2012. In addition, the Company recorded a valuation allowance against its deferred tax assets, described below, of $11.4 million in fiscal 2013. The change in the effective tax rate from fiscal 2011 to fiscal 2012 is principally attributable to the fact that the Company recorded a valuation allowance against its deferred tax assets, described below, of $18.9 million.
For the year ended March 31, 2011 the Company recorded income tax expense from discontinued operations of $2.2 million and income tax benefit from the sale of discontinued operations of $2.9 million. The effective tax rate applied to discontinued operations for the year ended March 31, 2011 was 36.4% and the rate applied to the sale of discontinued operations was 36.1%.
Deferred income taxes reflect the available tax carryforwards and the net tax effects of temporary differences between the carrying amounts of assets and liabilities for financial reporting purposes and the amounts used for income tax purposes. Significant components of the Company’s deferred tax assets as of March 31, 2013 and 2012 are as follows (in thousands):
| | | March 31, | |
| | | 2013 | | | 2012 | |
Deferred tax assets | | | | | | | | |
Collectability reserves | | $ | 1,389 | | | $ | 1,604 | |
Reserve for inventory write-off | | | 474 | | | | 616 | |
Reserve for sales discounts | | | 116 | | | | 370 | |
Accrued vacations | | | 39 | | | | 114 | |
Inventory — uniform capitalization | | | 132 | | | | 133 | |
Net operating loss carryforward | | | 30,663 | | | | 30,999 | |
Stock based compensation | | | 626 | | | | 493 | |
Book/tax intangibles amortization | | | - | | | | 1,920 | |
Other | | | 3,624 | | | | 3,792 | |
Total deferred tax assets | | | 37,063 | | | | 40,041 | |
| | | | | | | | | |
Deferred tax liabilities | | | | | | | | |
Book/tax depreciation | | | (2,899 | ) | | | (1,147 | ) |
Book/tax intangibles amortization | | | (5,135 | ) | | | - | |
Net deferred tax assets (liabilities) | | | 29,029 | | | | 38,894 | |
Valuation allowance | | | (30,308 | ) | | | (18,864 | ) |
Total deferred tax asset (liability), net | | $ | (1,279 | ) | | $ | 20,030 | |
At March 31, 2013 and 2012, the Company had federal net operating loss carryforwards of $82.8 million and $84.7 million, respectively, which will begin to expire in 2029. The Company had foreign tax credit carryforwards of $413,000 at both March 31, 2013 and 2012, which will begin to expire in 2016. For the years ended March 31, 2012 and 2013, the Company has taken a deduction for the tax benefit related to share based compensation of $1.4 million and zero, respectively. The tax benefit from these share based compensation deductions will be recorded as an increase to additional paid-in capital upon utilization of the net operating loss carryforwards.
Deferred tax assets are evaluated by considering historical levels of income, estimates of future taxable income streams and the impact of tax planning strategies. A valuation allowance is recorded to reduce deferred tax assets when it is determined that it is more likely than not, based on the weight of available evidence, the Company would not be able to realize all or part of its deferred tax assets. An assessment is required of all available evidence, both positive and negative, to determine the amount of any required valuation allowance.
At March 31, 2011, the Company evaluated the need for a valuation allowance and based on the history of pretax earnings, future taxable income projections and future reversals of existing taxable temporary differences, concluded it would more likely than not be able to realize the entire $30.7 million of deferred tax assets recorded at March 31, 2011. Therefore, the Company released the $9.7 million of valuation allowance at that time. The deferred tax assets at March 31, 2011 are composed of temporary differences primarily related to the book write-off of certain intangibles and net operating loss carryforwards.
As a result of the current market conditions and their impact on the Company’s future outlook, management has reviewed its deferred tax assets and concluded that the uncertainties related to the realization of some of its assets, have become unfavorable. A valuation allowance of $18.9 million was recorded as of March 31, 2012, which is included in income tax expense for fiscal 2012. As of March 31, 2013, the Company had a net deferred tax asset position before valuation allowance of $29.0 million which is composed of temporary differences, primarily related to net operating loss carryforwards, which will begin to expire in fiscal 2029. The Company also has foreign tax credit carryforwards at March 31, 2013 which will begin to expire in 2016. The Company has considered the positive and negative evidence for the potential utilization of the net deferred tax asset and has concluded that it is more likely than not that the Company will not realize the full amount of net deferred tax assets. Accordingly, a valuation allowance of $30.3 million is recorded against net deferred tax assets with determinable lives as of March 31, 2012, of which $11.4 million is included in income tax expense for fiscal 2013.
The Company recognizes interest accrued related to unrecognized income tax benefits (“UTB’s”) in the provision for income taxes. As of March 31, 2012, interest accrued was $190,000 and total UTB’s, net of deferred federal and state income tax benefits that would impact the effective tax rate, if recognized, were $518,000. During fiscal 2013, $252,000 of UTB’s were reversed. As of March 31, 2013, interest accrued was $152,000 and total UTB’s, net of deferred federal and state income tax benefits that would impact the effective tax rate, if recognized, were $499,000.
The following table summarizes the activity related to the Company’s unrecognized tax benefits (in thousands):
| | | Years ended March 31, | |
| | | 2013 | | | 2012 | |
Income taxes payable, beginning of period | | $ | 1,061 | | | $ | 1,018 | |
Gross increases related to prior year tax positions | | | 123 | | | | 141 | |
Gross increases related to current year tax positions | | | 41 | | | | 57 | |
Decrease related to statute of limitations lapses | | | (140 | ) | | | (155 | ) |
Income taxes payable, end of period | | $ | 1,085 | | | $ | 1,061 | |
Subsequent to March 31, 2013, the Internal Revenue Service completed an examination of the Company’s federal income tax return for the tax year ended 2011. The examination resulted in a reduction of the Company’s net operating loss carryforward of $2.2 million. The Company’s federal income tax return for tax year ending in 2012 remains subject to examination by tax authorities. The Company files in numerous state jurisdictions with varying statutes of limitations. The Company does not anticipate that the total unrecognized tax benefits will significantly change prior to March 31, 2014.
Note 18 Shareholders’ Equity
The Company’s Articles of Incorporation authorize 10,000,000 shares of preferred stock, no par value. No preferred shares are issued or outstanding.
The Company did not repurchase any shares during the years ended March 31, 2013, 2012 or 2011.
Note 19 Share-Based Compensation
The Company has an equity compensation plan: the Navarre Corporation 1992 Stock Option Plan and the Navarre Corporation 2004 Stock Plan (collectively, “the Plans”). The 2004 Plan provides for equity awards, including stock options, restricted stock and restricted stock units. Eligible participants under the 2004 Plan are all employees (including officers and directors), non-employee directors, consultants and independent contractors. The 1992 Plan expired on July 1, 2006, and no further grants are allowed under this Plan, however, there are 28,500 outstanding options under this Plan as of March 31, 2013.
Equity Compensation Plans
The Company currently grants stock options, restricted stock and restricted stock units under equity compensation plans. The Company adopted the 2004 Stock Plan to attract and retain eligible persons to perform services for the Company. Eligible recipients include all employees, without limitation, officers and directors who are also employees as well as non-employee directors, consultants and independent contractors or employees of any of the Company’s subsidiaries. A maximum number of 7.5 million shares of common stock have been authorized and reserved for issuance under the 2004 Stock Plan. The number of shares authorized may also be increased from time to time by approval of the Board of Directors and the shareholders. The 2004 Stock Plan terminates in September 2014. There were approximately 2.5 million shares available for future grant under the 2004 Stock Plan at March 31, 2013.
The Company is authorized to grant, among other equity instruments, stock options and restricted stock under the 2004 Stock Plan. Stock options have a maximum term fixed by the Compensation Committee of the Board of Directors, not to exceed 10 years from the date of grant. Stock options become exercisable during their terms in the manner determined by the Compensation Committee of the Board of Directors. Vesting for performance-based stock awards is subject to the performance criteria being achieved.
Restricted stock awards are non-vested stock awards that may include grants of restricted stock or restricted stock units. Restricted stock awards are independent of option grants and are generally subject to forfeiture if employment terminates prior to the release of the restrictions. Such awards vest as determined by the Compensation Committee of the Board of Directors, depending on the grant. Prior to vesting, ownership of the shares cannot be transferred. The Company expenses the cost of the restricted stock awards, which is the grant date fair value, ratably over the period during which the restrictions lapse. The grant date fair value is based on the Company’s opening stock price on the date of grant.
In fiscal 2013, 2012 and 2011, each director who is not an employee of the Company was granted an option to purchase 12,000, 12,000 and 6,000, respectively, shares of common stock under the 2004 Stock Plan on April 1 of the applicable fiscal year, with an exercise price equal to fair market value. These options are designated as non-qualified stock options. Each option granted prior to September 15, 2005, vests in five annual increments of 20% of the original option grant beginning one year from the date of grant and expires on the earlier of (i) six years from the date of the grant, and (ii) one year after the person ceases to serve as a director. Each option granted on or after September 15, 2005, vests in three annual increments of 33 1/3% of the original option grant beginning one year from the date of grant, expires on the earlier of (i) ten years from the date of grant, and (ii) one year after the person ceases to serve as a director, and provides for the acceleration of vesting if the person ceases to serve as a director as a result of the Company’s mandatory director retirement policy.
The Company is entitled to (a) withhold and deduct from future wages of the participant (or from other amounts that may be due and owing to the participant from the Company), or (b) make other arrangements for the collection of all legally required amounts necessary to satisfy any and all federal, state and local withholding and employment-related tax requirements (i) attributable to the grant or exercise of an option or a restricted stock award or to a disqualifying disposition of stock received upon exercise of an incentive stock option, or (ii) otherwise incurred with respect to an option or a restricted stock award, or (iii) require the participant promptly to remit the amount of such withholding to the Company before taking any action with respect to an option or a restricted stock award.
Stock Options
A summary of the Company’s stock option activity as of March 31, 2013, 2012 and 2011 and for those years ended is summarized as follows:
| | | Year ended March 31, 2013 | | | Year ended March 31, 2012 | | | Year ended March 31, 2011 | |
| | |
Number of options | | | Weighted average exercise price | | |
Number of options | | | Weighted average exercise price | | |
Number of options | | | Weighted average exercise price | |
Options outstanding, beginning of period | | | 2,289,334 | | | $ | 2.12 | | | | 3,789,834 | | | $ | 3.24 | | | | 3,547,299 | | | $ | 4.77 | |
Granted | | | 1,223,080 | | | | 1.75 | | | | 1,061,500 | | | | 1.69 | | | | 910,000 | | | | 2.11 | |
Exercised | | | (117,764 | ) | | | 1.19 | | | | (332,501 | ) | | | 0.68 | | | | (52,336 | ) | | | 1.08 | |
Canceled | | | (490,589 | ) | | | 2.51 | | | | (2,229,499 | ) | | | 4.04 | | | | (615,129 | ) | | | 10.59 | |
Options outstanding, end of period | | | 2,904,061 | | | $ | 1.93 | | | | 2,289,334 | | | $ | 2.12 | | | | 3,789,834 | | | $ | 3.24 | |
Options exercisable, end of period | | | 1,020,336 | | | $ | 2.25 | | | | 940,002 | | | $ | 2.59 | | | | 2,255,677 | | | $ | 4.16 | |
Shares available for future grant, end of period | | | 2,480,794 | | | | | | | | 3,506,657 | | | | | | | | 2,588,490 | | | | | |
The weighted average fair value of options granted during the year ended March 31, 2013 was $1.3 million and the total fair value of options exercisable was $1.4 million at March 31, 2013. The weighted average remaining contractual term for options outstanding was 8.1 years and for options exercisable was 6.5 years at March 31, 2013.
The aggregate intrinsic value represents the total pretax intrinsic value, based on the Company’s closing stock price of $2.27 as of March 31, 2013, which theoretically could have been received by the option holders had all option holders exercised their options as of that date. The total intrinsic value of stock options exercised during the years ended March 31, 2013 was $82,000. The aggregate intrinsic value for options outstanding was $1.4 million and for options exercisable was $399,000 at March 31, 2013.
As of March 31, 2013, total compensation cost related to non-vested stock options not yet recognized was $1.5 million, which is expected to be recognized over the next 1.3 years on a weighted-average basis.
During the years ended March 31, 2013, 2012 and 2011, the Company received cash from the exercise of stock options totaling $90,000, $27,000 and $56,000, respectively. There was no excess tax benefit recorded for the tax deductions related to stock options during either the years ended March 31, 2013, 2012 or 2011.
Restricted Stock
Restricted stock granted to employees typically has a vesting period of three years and expense is recognized on a straight-line basis over the vesting period, or when the performance criteria have been met. The value of the restricted stock is established based on the market price on the date of the grant or if based on performance criteria, on the date it is determined the performance criteria will be met. Restricted stock awards vesting is based on service criteria or achievement of performance targets. All restricted stock awards are settled in shares of common stock.
A summary of the Company’s restricted stock activity as of March 31, 2013, 2012 and 2011 and changes during those years ended is summarized as follows:
| | | Year ended March 31, 2013 | | | Year ended March 31, 2012 | | | Year ended March 31, 2011 | |
| | |
Shares | | | Weighted average grant date fair value | | |
Shares | | | Weighted average grant date fair value | | |
Shares | | | Weighted average grant date fair value | |
Unvested, beginning of period | | | 432,415 | | | $ | 1.74 | | | | 584,335 | | | $ | 1.96 | | | | 508,486 | | | $ | 1.47 | |
Granted | | | 328,585 | | | | 1.75 | | | | 526,000 | | | | 1.67 | | | | 383,500 | | | | 2.26 | |
Vested | | | (132,422 | ) | | | 1.81 | | | | (360,752 | ) | | | 1.99 | | | | (232,403 | ) | | | 1.45 | |
Forfeited | | | (53,713 | ) | | | 1.72 | | | | (317,168 | ) | | | 1.75 | | | | (75,248 | ) | | | 1.80 | |
Unvested, end of period | | | 574,865 | | | $ | 1.73 | | | | 432,415 | | | $ | 1.74 | | | | 584,335 | | | $ | 1.96 | |
The weighted average fair value of restricted stock awards granted during the year ended March 31, 2013 was $575,000.
The total fair value of restricted stock awards vested during the years ended March 31, 2013, 2012 and 2011 was approximately $240,000, $719,000 and $337,000, respectively. The weighted average remaining vesting period for restricted stock awards outstanding at March 31, 2013 was 1.3 years.
As of March 31, 2013, total compensation cost related to non-vested restricted stock awards not yet recognized was $742,000 which is expected to be recognized over the next 1.3 years on a weighted-average basis. There was no excess tax benefit recorded for the tax deductions related to restricted stock during the years ended March 31, 2013, 2012 or 2011.
Share-Based Compensation Valuation and Expense Information
The Company uses the Black-Scholes option pricing model to calculate the grant-date fair value of an option award. The fair value of options granted during the years ended March 31, 2013, 2012 and 2011 were calculated using the following assumptions:
| | | Year Ended March 31, 2013 | | Year Ended March 31, 2012 | | Year Ended March 31, 2011 |
Expected life (in years) | | 5.0 | - | 6.5 | | 5.0 | - | 6.5 | | | 5.0 | |
Expected volatility | | 64.3 | - | 70.1% | | | 68% | | | | 72% | |
Risk-free interest rate | | 0.62 | — | 1.25% | | 0.80 | — | 2.24% | | 1.04 | — | 2.60% |
Expected dividend yield | | | 0.0% | | | | 0.0% | | | | 0.0% | |
Expected life uses historical employee exercise and option expiration data to estimate the expected life assumption for the Black-Scholes grant-date valuation. The Company believes that this historical data is currently the best estimate of the expected term of a new option. The Company uses a weighted-average expected life for all awards and has identified one employee population. Expected volatility uses the Company’s stock historical weighted-average volatility for the same period of time as the expected life. The Company has no reason to believe that its future volatility will differ from the past. The risk-free interest rate is based on the U.S. Treasury rate in effect at the time of the grant for the same period of time as the expected life. Expected dividend yield is zero, as the Company historically has not paid dividends. The Company used a forfeiture rate of 4.63% during each of the years ended March 31, 2013, 2012 and 2011.
Share-based compensation expense related to employee stock options, restricted stock and restricted stock units, net of estimated forfeitures for the years ended March 31, 2013, 2012 and 2011 was $983,000, $1.2 million and $1.1 million, respectively. These amounts are included in general and administrative expenses in theConsolidated Statements of Operations. No amount of share-based compensation was capitalized.
Note 20 Related Party Transactions
Employment/Severance Agreements
On April 6, 2011, the Board of Directors of the Company terminated the employment of the President and Chief Executive Officer, Cary L. Deacon. The Company recognized approximately $1.4 million in expense during fiscal 2012, which was paid in fiscal 2012, related to severance costs arising out of the termination of Mr. Deacon’s employment.
Employment Agreement — FUNimation
On May 27, 2010, the Company entered into a one-year executive employment agreement with a key FUNimation employee in connection with his continued employment as President and Chief Executive Officer of FUNimation (“the FUNimation CEO”). The agreement replaced a prior agreement entered into upon the acquisition of FUNimation and provided for a continuation of the executive employee’s base salary and an annual bonus payment consistent with the Company’s Annual Management Incentive Plan. The FUNimation CEO was also granted a restricted stock unit award of 22,500 shares of the Company’s Common Stock at the time of the agreement, which was to vest in three equal installments on November 3, 2010, 2011 and 2012. Under the agreement, the FUNimation CEO was also eligible for customary benefits provided to similarly-situated executives. Among other items, the agreement required the FUNimation CEO to cooperate and participate in the Company’s efforts to market FUNimation for potential sale. In the event that a transaction to sell FUNimation occurred during the term of the agreement, the FUNimation CEO was to receive, in addition to any other compensation payable to him, a transaction success fee in an amount equal to the greater of (i) $250,000 or (ii) 5% of certain transaction proceeds. On March 31, 2011, the Company recorded the $250,000 expense associated with this agreement as a direct cost related to sale of FUNimation. Additionally, the 15,000 remaining unvested restricted stock unit awards granted in conjunction with this agreement were forfeited on March 31, 2011 when the FUNimation CEO’s employment with Navarre was terminated in connection with the Company’s sale of FUNimation.
Note 21 Variable Interest Entity
On March 31, 2011, the Company sold its wholly-owned subsidiary, FUNimation. Upon the sale, the Company assessed the variable interest in FUNimation including the terms of the exclusive distribution and logistics and fulfillment services agreements, employment matter indemnification (maximum exposure of $250,000 included as an accrued expense), and the standby letter of credit guarantee (refer to Note 16) to determine if FUNimation met the definition of a variable interest entity (“VIE”). Based on the Company’s evaluation it was determined that FUNimation was a VIE. Consolidating any VIEs within the Company’s financial results is required if the Company is found to be the primary beneficiary. The Company determined that the Company was not the primary beneficiary because it does not have the power to direct the activities of the VIE that most significantly impacted their economic performance, and the Company does have the obligation to absorb the significant losses or the right to receive significant benefits from the VIE. Therefore, the results of FUNimation are not consolidated into the Company’s financial results.
Note 22 Major Customers and Vendors
The Company has two major customers (both of which are within the distribution segment) who accounted for 40% of consolidated net sales from continuing operations for fiscal 2013. These customers accounted for 44% and 50% of consolidated net sales from continuing operations for fiscal 2012 and fiscal 2011, respectively. Accounts receivable from these two customers totaled $9.7 million and $11.8 million at March 31, 2013 and 2012, respectively.
The Company has one major vendor who accounted for approximately $87.8 million, $92.8 million and $85.8 million in net sales in the fiscal years ended March 31, 2013, 2012 and 2011, respectively.
Note 23 Business Segments
The Company identifies its segments based on its organizational structure, which is primarily by business activity. Operating profit represents earnings before interest expense, interest income, income taxes and allocations of corporate costs to the respective divisions. Inter-company sales are made at market prices. The Company maintains a majority of the cash and revolving line of credit under its cash management policy.
Navarre operates two business segments: distribution and e-commerce and fulfillment services. Beginning the quarter ended December 31, 2012, the Company changed its reporting segments in connection with the acquisition of SpeedFC. The Company previously reported segment information under two reporting segments including Distribution and Publishing.
Through the distribution business, the Company distributes computer software, consumer electronics and accessories and video games.
Through the e-commerce and fulfillment business, the Company provides website development and hosting, customer care, e-commerce fulfillment and third party logistics services.
The Company also formerly published and soldanime content through FUNimation Productions, Ltd. (“FUNimation”). The Company sold FUNimation on March 31, 2011 and accordingly, the results of operations, assets and liabilities of FUNimation for all periods presented are classified as discontinued operations (see further disclosure in Note 5).
Financial information for fiscal 2012 and 2011 below has been recast to conform with the presentation change effective the quarter ended December 31, 2012 as discussed above. Financial information by reportable segment is included in the following summary for the years ended March 31, 2013, 2012 and 2011 (in thousands):
| | | Distribution | | | E-Commerce & Fulfillment Services | | | Consolidated | |
Fiscal year 2013 | | | | | | | | | | | | |
Net sales | | $ | 430,624 | | | $ | 54,671 | | | $ | 485,295 | |
Income (loss) from operations | | | (2,485 | ) | | | 4,464 | | | | 1,979 | |
Income (loss) from operations, before income tax | | | (3,698 | ) | | | 3,735 | | | | 37 | |
Depreciation and amortization expense | | | 3,046 | | | | 1,831 | | | | 4,877 | |
Capital expenditures | | | 2,620 | | | | 1,336 | | | | 3,956 | |
Total assets | | | 114,583 | | | | 81,708 | | | | 196,291 | |
| | | Distribution | | | E-Commerce & Fulfillment Services | | | Consolidated | |
Fiscal year 2012 | | | | | | | | | | | | |
Net sales | | $ | 473,048 | | | $ | 7,776 | | | $ | 480,824 | |
Income (loss) from operations | | | (20,793 | ) | | | (1,510 | ) | | | (22,303 | ) |
Income (loss) from operations, before income tax | | | (21,909 | ) | | | (1,819 | ) | | | (23,728 | ) |
Depreciation and amortization expense | | | 3,076 | | | | 548 | | | | 3,624 | |
Capital expenditures | | | 765 | | | | 124 | | | | 889 | |
Total assets | | | 108,819 | | | | 12,557 | | | | 121,376 | |
| | | Distribution | | | E-Commerce & Fulfillment Services | | | Consolidated | |
Fiscal year 2011 | | | | | | | | | | | | |
Net sales | | $ | 489,838 | | | $ | 1,059 | | | $ | 490,897 | |
Income (loss) from operations | | | 6,098 | | | | (144 | ) | | | 5,954 | |
Income (loss) from operations, before income tax | | | 4,521 | | | | (474 | ) | | | 4,047 | |
Depreciation and amortization expense | | | 3,848 | | | | - | | | | 3,848 | |
Capital expenditures | | | 732 | | | | 84 | | | | 816 | |
Total assets | | | 144,442 | | | | 29,424 | | | | 173,866 | |
Product Line Data
The following table provides net sales by product line for the distribution segment for the years ended March 31, 2013, 2012 and 2011 (in thousands):
| | | 2013 | | | 2012 | | | 2011 | |
Software | | $ | 320,274 | | | $ | 346,806 | | | $ | 389,246 | |
Consumer electronics and accessories | | | 102,685 | | | | 77,807 | | | | 31,131 | |
Video games | | | 7,656 | | | | 25,834 | | | | 27,513 | |
Home video | | | 9 | | | | 22,601 | | | | 41,948 | |
Consolidated | | $ | 430,624 | | | $ | 473,048 | | | $ | 489,838 | |
Geographic Data
The following table provides net sales by geographic region for the years ended March 31, 2013, 2012 and 2011 and property, plant and equipment, net of accumulated depreciation by geographic region at March 31, 2013 and 2012 (in thousands):
| | | Years ended March 31, | |
| | 2013 | | | 2012 | | | 2011 | |
Net Sales | | | | | | | | | | | | |
United States | | $ | 403,667 | | | $ | 424,617 | | | $ | 449,296 | |
International | | | 81,628 | | | | 56,207 | | | | 41,601 | |
Total net sales | | $ | 485,295 | | | $ | 480,824 | | | $ | 490,897 | |
| | | March 31, | |
| | 2013 | | | 2012 | |
Property, Plant and Equipment, Net | | | | | | | | |
United States | | $ | 13,877 | | | $ | 6,613 | |
International | | | 208 | | | | 255 | |
Total property, plant and equipment, net | | $ | 14,085 | | | $ | 6,868 | |
Sales Channel Data
The following table provides net sales by sales channel for the years ended March 31, 2013, 2012 and 2011 (in thousands):
| | | Years ended March 31, | |
| | | 2013 | | | 2012 | | | 2011 | |
Retail | | $ | 367,014 | | | $ | 405,681 | | | $ | 441,154 | |
E-commerce | | | 118,281 | | | | 75,143 | | | | 49,743 | |
Total net sales | | $ | 485,295 | | | $ | 480,824 | | | $ | 490,897 | |
Note 24 Quarterly Data — Seasonality (Unaudited)
The Company’s quarterly operating results fluctuate significantly and will likely do so in the future as a result of seasonal variations of products ultimately sold at retail. The Company’s business is affected by the pattern of seasonality common to other suppliers of retailers, particularly the holiday selling season. Traditionally, the Company’s third quarter (October 1-December 31) has accounted for its largest quarterly revenue figures and a substantial portion of its earnings. The Company’s third quarter accounted for 36.7%, 31.9% and 30.0% of its net sales for the years ended March 31, 2013, 2012 and 2011, respectively.
The following table sets forth certain unaudited quarterly historical financial data of the Company’s operations on a consolidated basis for each of the four quarters in the years ended March 31, 2013 and 2012 (in thousands, except per share amounts):
| | | Quarter Ended | |
Fiscal Year 2013 | | June 30 | | | September 30 | | | December 31 | | | March 31 | |
Net sales | | $ | 91,272 | | | $ | 104,132 | | | $ | 178,284 | | | $ | 111,607 | |
Gross profit | | | 9,976 | | | | 12,047 | | | | 17,001 | | | | 12,152 | |
(Loss) income from operations | | | (494 | ) | | | 786 | | | | 2,458 | | | | (771 | ) |
Net (loss) income from operations | | | (571 | ) | | | 488 | | | | 10 | | | | (11,724 | ) |
| | | | | | | | | | | | | | | | | |
Basic loss per common share | | $ | (0.02 | ) | | $ | (0.01 | ) | | $ | (0.00 | ) | | $ | (0.21 | ) |
Diluted loss per common shareuipment, Neted balances due under this arrangment March 31, 2010.ompany, were $6.3 million. | | $ | (0.02 | ) | | $ | (0.01 | ) | | $ | (0.00 | ) | | $ | (0.21 | ) |
| | | Quarter Ended | |
Fiscal Year 2012 | | June 30 | | | September 30 | | | December 31 | | | March 31 | |
Net sales | | $ | 104,016 | | | $ | 106,568 | | | $ | 153,497 | | | $ | 116,743 | |
Gross profit | | | 13,577 | | | | 12,418 | | | | 7,528 | | | | 10,435 | |
Loss from operations | | | (595 | ) | | | (1,585 | ) | | | (14,157 | ) | | | (5,966 | ) |
Net loss from operations | | | (627 | ) | | | (1,249 | ) | | | (29,077 | ) | | | (3,347 | ) |
| | | | | | | | | | | | | | | | | |
Basic loss per common share | | $ | (0.02 | ) | | $ | (0.03 | ) | | $ | (0.79 | ) | | $ | (0.09 | ) |
Diluted loss per common shareuipment, Neted balances due under this arrangment March 31, 2010.ompany, were $6.3 million. | | $ | (0.02 | ) | | $ | (0.03 | ) | | $ | (0.79 | ) | | $ | (0.09 | ) |
Note 25 Subsequent Event
In April 2013, the Company announced the relocation of the New Hope, Minnesota operations to the Company's Dallas facility. The relocation is anticipated to be completed by December 31, 2013 and an estimated cost of the relocation is impractical to determine at the time of the filing of this Form 10-K.
Navarre Corporation
Schedule II — Valuation and Qualifying Accounts and Reserves
(in thousands)
Description | |
Balance at Beginning of Period | | |
Charged to Costs and Expenses | | |
Additions/ (Deductions) | | |
Balance at End of Period | |
Year ended March 31, 2013: | | | | | | | | | | | | | | | | |
Deducted from asset accounts: | | | | | | | | | | | | | | | | |
Allowance for doubtful accounts | | $ | 1,469 | | | $ | (696 | ) | | $ | (115 | ) | | $ | 659 | |
Allowance for sales returns | | | 2,187 | | | | 3,850 | | | | (4,149 | ) | | | 1,888 | |
Allowance for MDF and sales discounts | | | 1,928 | | | | 6,577 | | | | (7,419 | ) | | | 1,086 | |
Total | | $ | 5,584 | | | $ | 9,731 | | | $ | (11,683 | ) | | $ | 3,633 | |
Year ended March 31, 2012: | | | | | | | | | | | | | | | | |
Deducted from asset accounts: | | | | | | | | | | | | | | | | |
Allowance for doubtful accounts | | $ | 848 | | | $ | 813 | | | $ | (192 | ) | | $ | 1,469 | |
Allowance for sales returns | | | 2,027 | | | | 4,312 | | | | (4,152 | ) | | | 2,187 | |
Allowance for MDF and sales discounts | | | 1,826 | | | | 7,379 | | | | (7,277 | ) | | | 1,928 | |
Total | | $ | 4,701 | | | $ | 12,504 | | | $ | (11,621 | ) | | $ | 5,584 | |
Year ended March 31, 2011: | | | | | | | | | | | | | | | | |
Deducted from asset accounts: | | | | | | | | | | | | | | | | |
Allowance for doubtful accounts | | $ | 1,093 | | | $ | 220 | | | $ | (465 | ) | | $ | 848 | |
Allowance for sales returns | | | 2,173 | | | | 4,140 | | | | (4,286 | ) | | | 2,027 | |
Allowance for MDF and sales discounts | | | 2,525 | | | | 3,436 | | | | (4,135 | ) | | | 1,826 | |
Total | | $ | 5,791 | | | $ | 7,796 | | | $ | (8,886 | ) | | $ | 4,701 | |
110