| | | | |
 | | | | |
Forward Looking Statement In addition to historical information, this presentation contains forward-looking statements (as defined in Section 21E of the Securities Exchange Act of 1934, as amended) that involve risks and uncertainties. Forward-looking statements in this presentation include, in particular, statements regarding: the financing and recapitalization transactions proposed by Teekay Offshore Partners L.P. (the “Partnership”), the timing of completion of such transactions, and the expected effects of the completion of such transactions on the financial condition, access to capital, cost of capital, operating results, operational capabilities, and prospects of the Partnership and Teekay Corporation; the post-closing structure and management of the Partnership; pro forma capitalization and projected financial results; required capital expenditures for existing projects; future growth prospects, business strategy and other plans and objectives for future operations; future debt maturity profile and liquidity; cash settlement amounts for interest rate swaps; shuttle tanker market fundamentals, projections and trends, including the balance of supply and demand in the shuttle tanker market and changes in rates; and reimbursement of cost of Volatile Organic Compound plant by Norwegian government. Forward-looking statements are necessary estimates reflecting the judgment of senior management, involve known and unknown risks and are based upon a number of assumptions and estimates that are inherently subject to significant uncertainties and contingencies, many of which are beyond our control. Actual results may differ materially from those expressed or implied by such forward-looking statements. Important factors that could cause actual results to differ materially include, but are not limited to, failure to satisfy conditions to closing of the transactions; failure to finalize negotiations relating to certain refinancings; failure to realize expected benefits of the transactions; lower than expected revenues or higher than expected costs and expenses; customer and market receptivity to changes relating to the transactions; and those factors discussed in the Partnership's filings from time to time with the U.S. Securities and Exchange Commission, including its Annual Report on Form 20-F for the fiscal year ended December 31, 2016. The Partnership expressly disclaims any obligation or undertaking to release publicly any updates or revisions to any forward-looking statements contained herein to reflect any change in the Partnership's expectations with respect thereto or any change in events, conditions or circumstances on which any such statement is based.
Strategic Partnership Brookfield attracted to TOO’s high quality contracted cash flows and market leading positions in the offshore production and logistics space $640 million equity investment significantly strengthens TOO’s balance sheet and improves liquidity Fully finances TOO’s existing growth projects, which will provide significant near-term cash flow growth Positions Teekay Offshore to better service its customers and take advantage of future growth opportunities Brookfield offers strong strategic alignment and complementary capabilities Operational and capital allocation expertise Geographical footprint Partnering model Track record of investing in the energy value chain Teekay operational platform + Brookfield’s global business platform and access to capital creates one of the world’s strongest offshore infrastructure companies
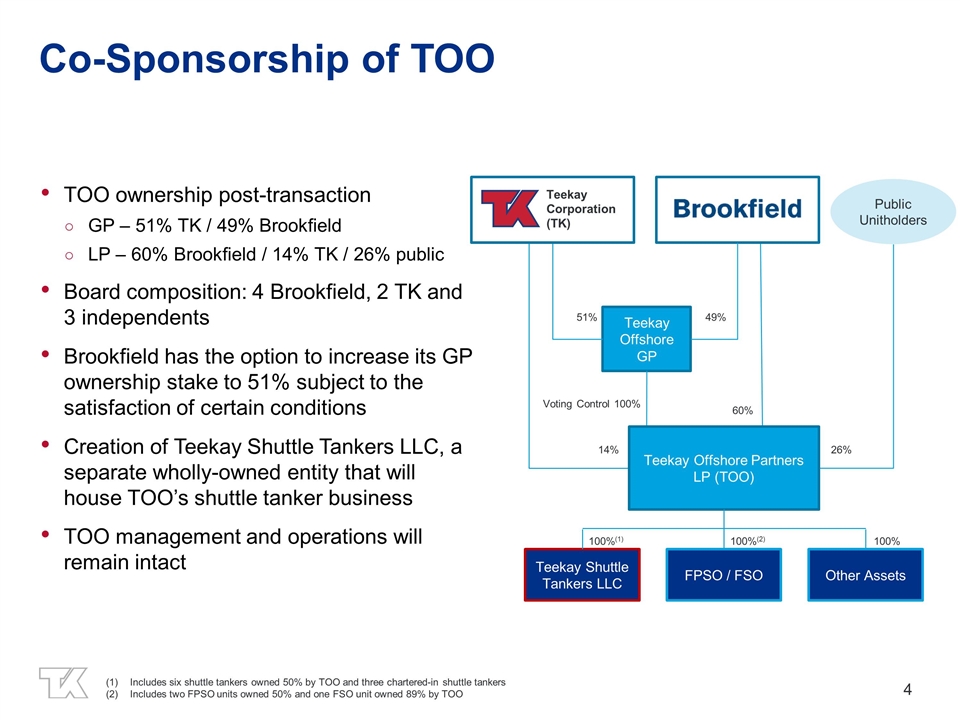
Co-Sponsorship of TOO TOO ownership post-transaction GP – 51% TK / 49% Brookfield LP – 60% Brookfield / 14% TK / 26% public Board composition: 4 Brookfield, 2 TK and 3 independents Brookfield has the option to increase its GP ownership stake to 51% subject to the satisfaction of certain conditions Creation of Teekay Shuttle Tankers LLC, a separate wholly-owned entity that will house TOO’s shuttle tanker business TOO management and operations will remain intact Public Unitholders 14% 26% 60% Teekay Corporation (TK) Teekay Offshore GP 51% 49% Voting Control 100% Teekay Offshore Partners LP (TOO) Teekay Shuttle Tankers LLC FPSO / FSO Other Assets 100%(1) 100%(2) 100% Includes six shuttle tankers owned 50% by TOO and three chartered-in shuttle tankers Includes two FPSO units owned 50% and one FSO unit owned 89% by TOO
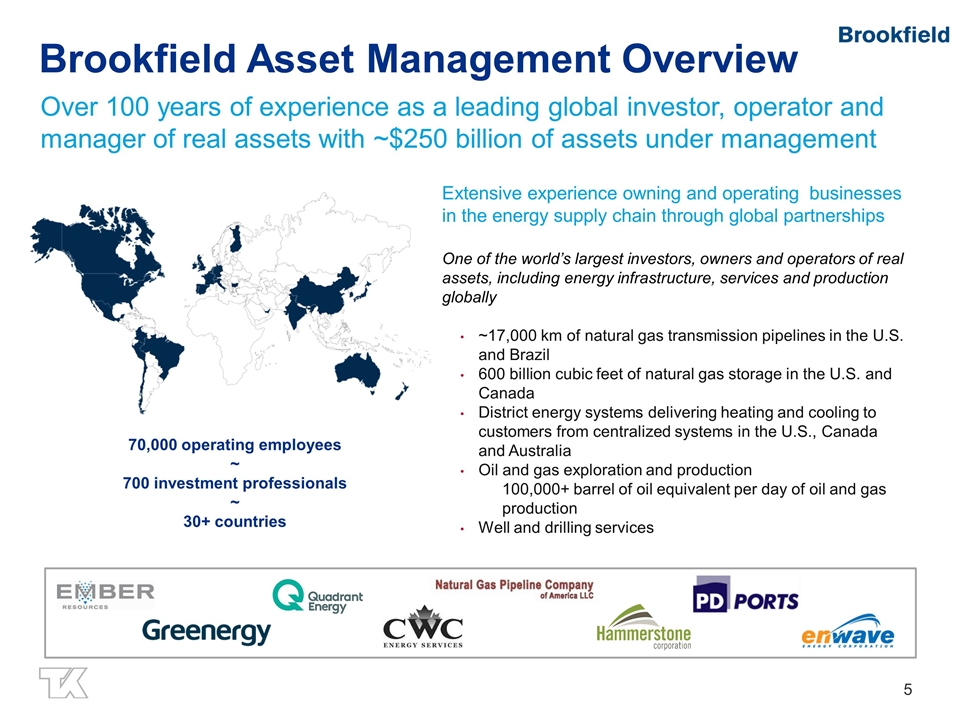
Brookfield Asset Management Overview Over 100 years of experience as a leading global investor, operator and manager of real assets with ~$250 billion of assets under management Extensive experience owning and operating businesses in the energy supply chain through global partnerships One of the world’s largest investors, owners and operators of real assets, including energy infrastructure, services and production globally ~17,000 km of natural gas transmission pipelines in the U.S. and Brazil 600 billion cubic feet of natural gas storage in the U.S. and Canada District energy systems delivering heating and cooling to customers from centralized systems in the U.S., Canada and Australia Oil and gas exploration and production 100,000+ barrel of oil equivalent per day of oil and gas production Well and drilling services 70,000 operating employees ~ 700 investment professionals ~ 30+ countries
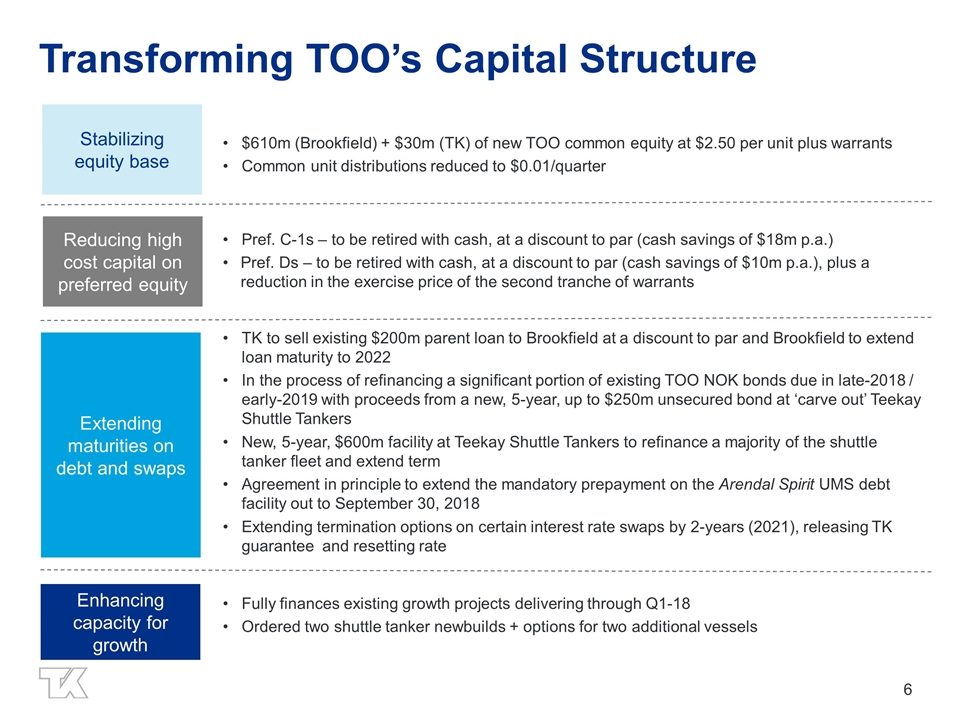
Transforming TOO’s Capital Structure Enhancing capacity for growth Extending maturities on debt and swaps TK to sell existing $200m parent loan to Brookfield at a discount to par and Brookfield to extend loan maturity to 2022 In the process of refinancing a significant portion of existing TOO NOK bonds due in late-2018 / early-2019 with proceeds from a new, 5-year, up to $250m unsecured bond at ‘carve out’ Teekay Shuttle Tankers New, 5-year, $600m facility at Teekay Shuttle Tankers to refinance a majority of the shuttle tanker fleet and extend term Agreement in principle to extend the mandatory prepayment on the Arendal Spirit UMS debt facility out to September 30, 2018 Extending termination options on certain interest rate swaps by 2-years (2021), releasing TK guarantee and resetting rate Reducing high cost capital on preferred equity Pref. C-1s – to be retired with cash, at a discount to par (cash savings of $18m p.a.) Pref. Ds – to be retired with cash, at a discount to par (cash savings of $10m p.a.), plus a reduction in the exercise price of the second tranche of warrants Stabilizing equity base $610m (Brookfield) + $30m (TK) of new TOO common equity at $2.50 per unit plus warrants Common unit distributions reduced to $0.01/quarter Fully finances existing growth projects delivering through Q1-18 Ordered two shuttle tanker newbuilds + options for two additional vessels
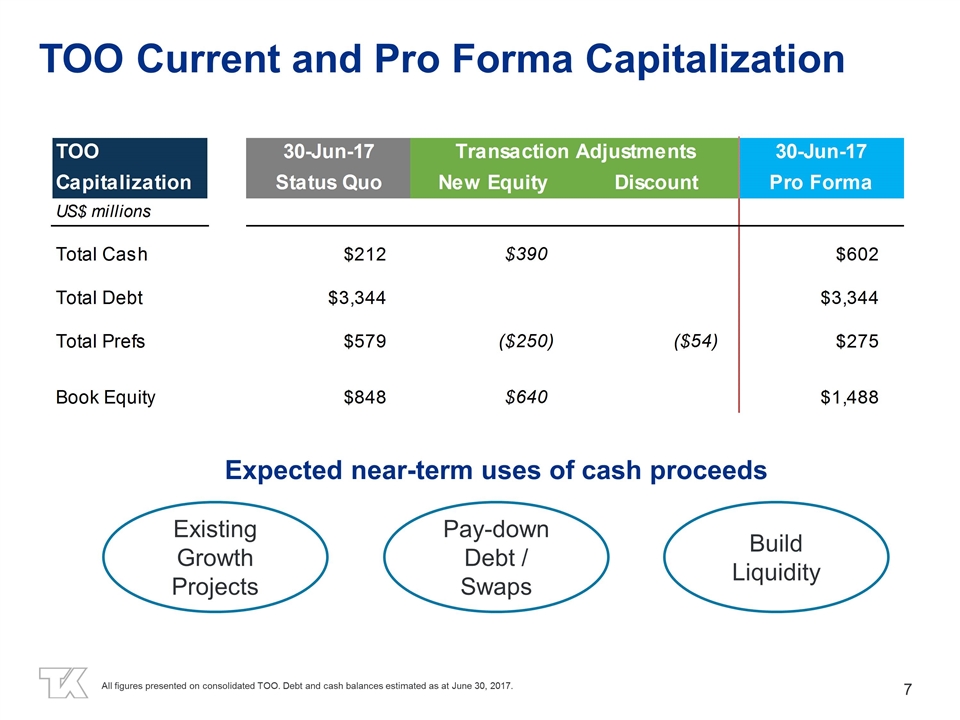
TOO Current and Pro Forma Capitalization Expected near-term uses of cash proceeds Existing Growth Projects Pay-down Debt / Swaps Build Liquidity All figures presented on consolidated TOO. Debt and cash balances estimated as at June 30, 2017.
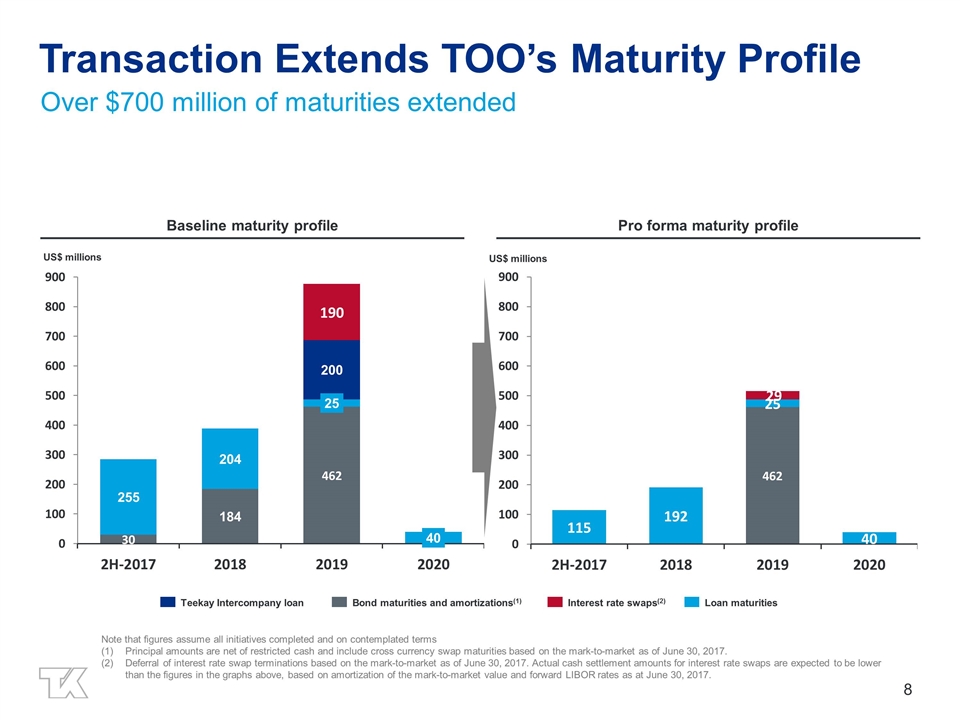
Baseline maturity profile US$ millions (2) (1) Teekay Intercompany loan Pro forma maturity profile Note that figures assume all initiatives completed and on contemplated terms Principal amounts are net of restricted cash and include cross currency swap maturities based on the mark-to-market as of June 30, 2017. Deferral of interest rate swap terminations based on the mark-to-market as of June 30, 2017. Actual cash settlement amounts for interest rate swaps are expected to be lower than the figures in the graphs above, based on amortization of the mark-to-market value and forward LIBOR rates as at June 30, 2017. Transaction Extends TOO’s Maturity Profile Over $700 million of maturities extended US$ millions
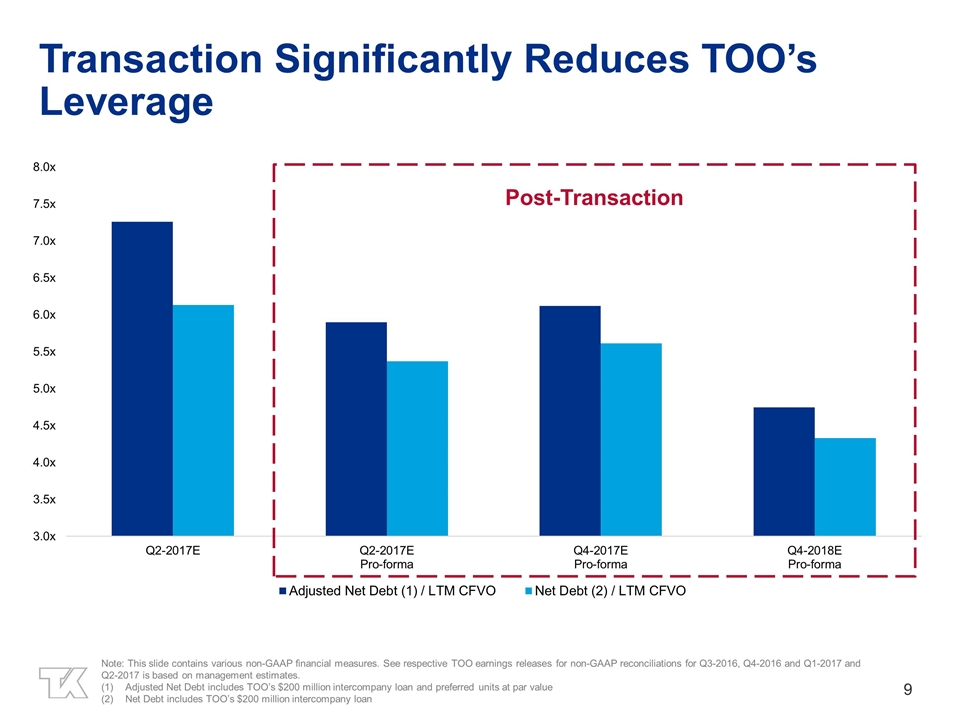
Transaction Significantly Reduces TOO’s Leverage Note: This slide contains various non-GAAP financial measures. See respective TOO earnings releases for non-GAAP reconciliations for Q3-2016, Q4-2016 and Q1-2017 and Q2-2017 is based on management estimates. Adjusted Net Debt includes TOO’s $200 million intercompany loan and preferred units at par value Net Debt includes TOO’s $200 million intercompany loan Post-Transaction Post-Transaction
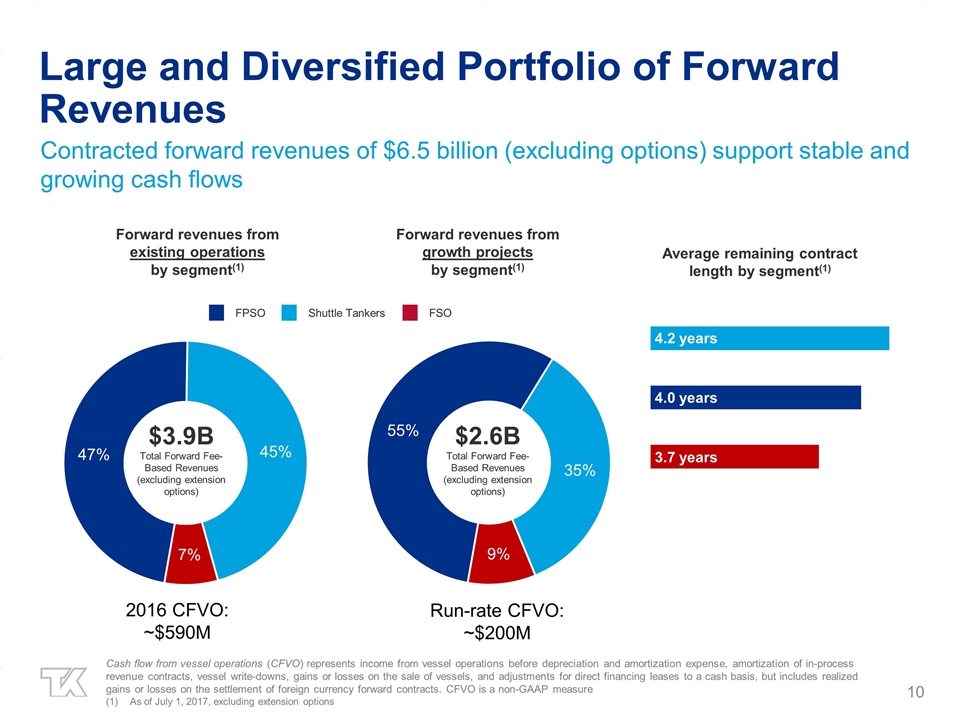
Contracted forward revenues of $6.5 billion (excluding options) support stable and growing cash flows Large and Diversified Portfolio of Forward Revenues 2016 CFVO: ~$590M Run-rate CFVO: ~$200M Forward revenues from existing operations by segment(1) Forward revenues from growth projects by segment(1) Average remaining contract length by segment(1) $3.9B Total Forward Fee-Based Revenues (excluding extension options) FPSO 4.3 years 4.1 years 4.2 years FSO Shuttle Tankers Cash flow from vessel operations (CFVO) represents income from vessel operations before depreciation and amortization expense, amortization of in-process revenue contracts, vessel write-downs, gains or losses on the sale of vessels, and adjustments for direct financing leases to a cash basis, but includes realized gains or losses on the settlement of foreign currency forward contracts. CFVO is a non-GAAP measure As of July 1, 2017, excluding extension options 4.2 years 4.0 years 3.7 years $2.6B Total Forward Fee-Based Revenues (excluding extension options)
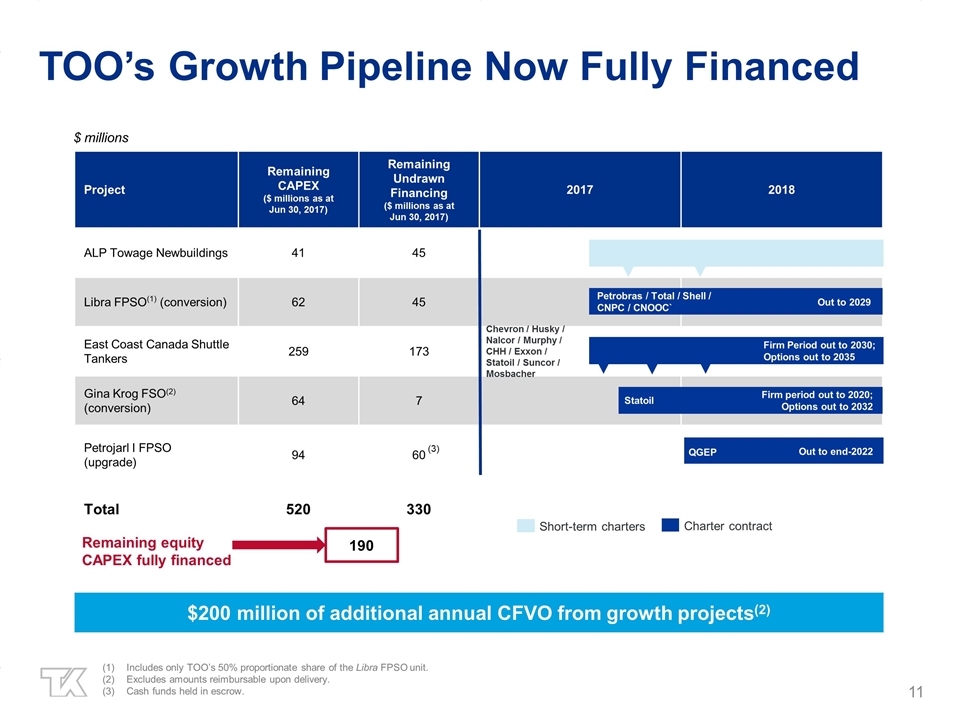
TOO’s Growth Pipeline Now Fully Financed $200 million of additional annual CFVO from growth projects(2) Includes only TOO’s 50% proportionate share of the Libra FPSO unit. Excludes amounts reimbursable upon delivery. Cash funds held in escrow. Project Remaining CAPEX ($ millions as at Jun 30, 2017) Remaining Undrawn Financing ($ millions as at Jun 30, 2017) 2017 2018 ALP Towage Newbuildings 41 45 Libra FPSO(1) (conversion) 62 45 East Coast Canada Shuttle Tankers 259 173 Gina Krog FSO(2) (conversion) 64 7 Petrojarl I FPSO (upgrade) 94 60 Total 520 330 Charter contract Chevron / Husky / Nalcor / Murphy / CHH / Exxon / Statoil / Suncor / Mosbacher Short-term charters Petrobras / Total / Shell / CNPC / CNOOC` Out to 2029 Statoil Firm period out to 2020; Options out to 2032 Firm Period out to 2030; Options out to 2035 QGEP Out to end-2022 (3) 190 Remaining equity CAPEX fully financed $ millions
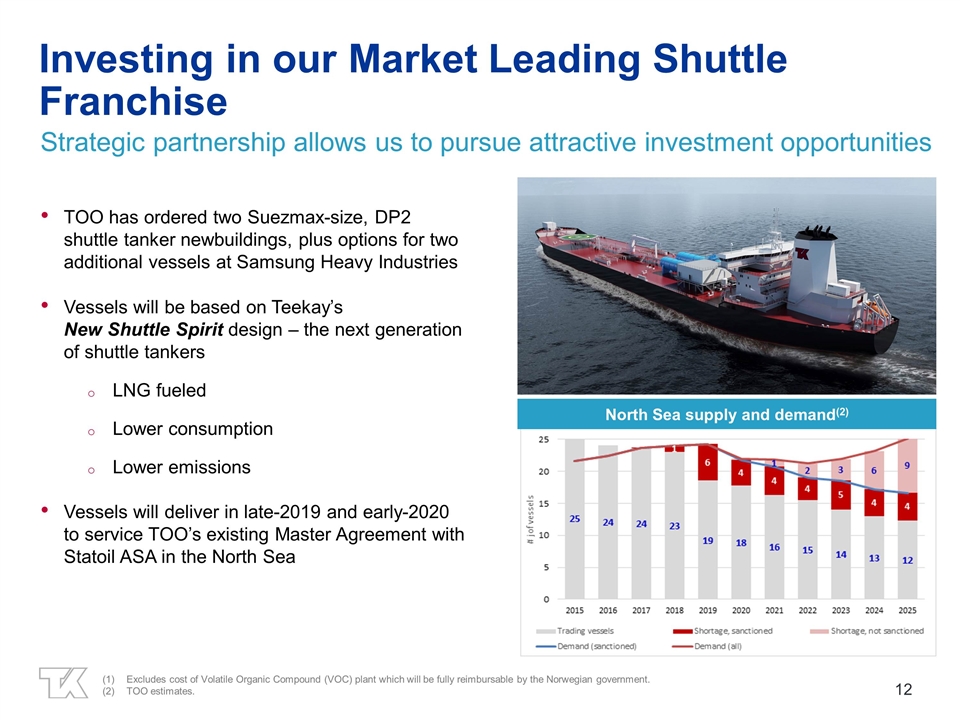
Investing in our Market Leading Shuttle Franchise Strategic partnership allows us to pursue attractive investment opportunities TOO has ordered two Suezmax-size, DP2 shuttle tanker newbuildings, plus options for two additional vessels at Samsung Heavy Industries Vessels will be based on Teekay’s New Shuttle Spirit design – the next generation of shuttle tankers LNG fueled Lower consumption Lower emissions Vessels will deliver in late-2019 and early-2020 to service TOO’s existing Master Agreement with Statoil ASA in the North Sea Excludes cost of Volatile Organic Compound (VOC) plant which will be fully reimbursable by the Norwegian government. TOO estimates. North Sea supply and demand(2)
Key Takeaways Capital to pursue future growth Co-sponsors focused on maximizing shareholder value Stable and growing cash flows Attractive Markets Market leading positions
